QuickLinks -- Click here to rapidly navigate through this document
PUBLIC ACCOUNTS 1999-2000 | |
Published in accordance with section 86 of the Financial Administration Act (S.Q., 2000, c. 15) | |
Volume 1 | |
CONSOLIDATED FINANCIAL STATEMENTS OF THE GOUVERNEMENT DU QUÉBEC | |
Fiscal year ended March 31, 2000 | |
| Ministère des Finances |
ISSN 0706-2869
ISBN 2-550-36752-9
Legal deposit — 4th quarter 2000
Bibliothèque nationale du Québec
To the Honourable Lise Thibault
Lieutenant-Governor
Parliament Building
Québec
Dear Madam,
The undersigned has the honour of presenting to Your Excellency the Public Accounts of the Gouvernement du Québec for the fiscal year ended March 31, 2000.
Bernard Landry
Deputy Prime Minister and Minister of
State for the Economy and Finance
Québec, December 2000
III
(This page has been left blank intentionally.)
IV
To the Deputy Prime Minister and Minister
of State for the Economy and Finance
Mr. Bernard Landry
Parliament Building
Québec
Dear Sir,
In accordance with the commission entrusted to me, I have the honour of presenting the Public Accounts of the Gouvernement du Québec for the fiscal year ended March 31, 2000. These accounts have been prepared under section 86 of the Financial Administration Act (S.Q., 2000, c. 15).
Respectfully yours,
Nathalie Tremblay, CA
Comptroller of Finance
Québec, December 2000
V
(This page has been left blank intentionally.)
VI
| | | | | ||
|---|---|---|---|---|---|
| INTRODUCTION | IX | ||||
SUMMARY OF CONSOLIDATED FINANCIAL TRANSACTIONS | |||||
Consolidated summary of operations | XIII | ||||
| Consolidated revenue | XV | ||||
| Consolidated expenditure | XVI | ||||
| Consolidated financial position | XVIII | ||||
| Reconciliation of revenue, expenditure and surplus | XIX | ||||
| Financial statistics | XX | ||||
CONSOLIDATED FINANCIAL STATEMENTS | |||||
Statement of responsibility | 3 | ||||
| Auditor General's report | 4 | ||||
| Consolidated statement of operations | 7 | ||||
| Consolidated statement of changes in net debt | 8 | ||||
| Consolidated statement of financial position | 9 | ||||
| Consolidated statement of financial surplus and financing | 10 | ||||
| Consolidated statement of fixed assets | 12 | ||||
| Notes to financial statements | 13 | ||||
Appendices | |||||
1 | Government departments and agencies whose financial transactions were conducted within the Consolidated Revenue Fund and included in the Government's reporting entity | 27 | |||
| 2 | Agencies and special funds whose own reporting entity is included in the Government's reporting entity | 29 | |||
| 3 | Enterprises included in the Government's reporting entity | 31 | |||
| 4 | Agencies and funds which conduct transactions of a fiduciary nature that are not included in the Government's reporting entity | 32 | |||
| 5 | Breakdown of revenue | 33 | |||
| 6 | Breakdown of expenditure | 34 | |||
| 7 | Bank overdraft | 35 | |||
| 8 | Accounts payable and accrued expenses | 36 | |||
| 9 | Borrowings | 38 | |||
VII
| | | | | ||
|---|---|---|---|---|---|
| 10 | Borrowings to finance the health and social services and education networks and Government enterprises | 41 | |||
| 11 | Borrowings to finance the work of municipal bodies | 42 | |||
| 12 | Short-term investments | 43 | |||
| 13 | Accounts receivable | 44 | |||
| 14 | Investment in Government enterprises | 45 | |||
| 15 | Long-term investments | 49 | |||
| 16 | Other accounts | 50 | |||
| 17 | Commitments and contingencies | 51 | |||
| 18 | Summary of transactions of a fiduciary nature conducted by Government agencies and funds | 57 |
VIII
Each year the Ministère des Finances publishes documents on the financial position of the Gouvernement du Québec and the results of its financial transactions.
The Quarterly Presentation of Financial Transactions was published at the close of the second and third quarters of 1999 to account for changes in the financial transactions and facilitate comparison with the projections contained in the 1999-2000 Budget Speech of March 9, 1999.
The 1999-2000 Public Accounts complete the information relating to the actual results for fiscal 1999-2000, whose main data formed part of the first Quarterly Presentation for 2000-2001.
The Public Accounts for the fiscal year ended March 31, 2000 have been prepared by the Comptroller of Finance for the Minister of Finance in accordance with the accounting policies established by the Conseil du trésor and pursuant to the provisions of section 86 of the Financial Administration Act (S.Q., 2000, c. 15). They are published in two volumes entitled: "Consolidated Financial Statements of the Gouvernement du Québec" and "Revenue, Appropriations and Expenditure of the Consolidated Revenue Fund and Financial Information on the Special Funds of the Gouvernement du Québec"
VOLUME 1 — CONSOLIDATED FINANCIAL STATEMENTS OF THE GOUVERNEMENT DU QUÉBEC
Volume 1 presents summary data on the consolidated financial transactions and the consolidated financial statements of the Gouvernement du Québec for the fiscal year ended March 31, 2000, accompanied by the Auditor General's report.
VOLUME 2 — REVENUE, APPROPRIATIONS AND EXPENDITURE OF THE CONSOLIDATED REVENUE FUND AND FINANCIAL INFORMATION ON THE SPECIAL FUNDS OF THE GOUVERNEMENT DU QUÉBEC
Volume 2 is divided into four sections. The first three sections report on the operations of entities whose revenue is paid into the Consolidated Revenue Fund or the Health Services Fund and entities whose operating activities are paid for out of these funds using appropriations allotted by Parliament. Such entities include Government departments, budgetary agencies, the National Assembly and persons designated by it, and other portfolios. The fourth section presents summary financial information on the special funds.
IX
(This page has been left blank intentionally.)
X
SUMMARY
OF CONSOLIDATED
FINANCIAL TRANSACTIONS
XI
(This page has been left blank intentionally.)
XII
CONSOLIDATED SUMMARY OF OPERATIONS
FISCAL YEAR ENDED MARCH 31, 2000
(in millions of dollars)
| | 2000 | 1999(1) | ||||
|---|---|---|---|---|---|---|
| | Budget* | Actual results | Actual results | |||
| Own-source revenue | 38 284 | 40 927 | 38 482 | |||
| Government of Canada transfers | 6 908 | 6 352 | 8 090 | |||
| Total revenue | 45 192 | 47 279 | 46 572 | |||
| Expenditure (excluding debt service) | 37 593 | 39 877 | 39 259 | |||
| Debt service | 7 599 | 7 372 | 7 187 | |||
| Total expenditure | 45 192 | 47 249 | 46 446 | |||
| Surplus | — | 30 | 126 | |||
- *
- These data were established on the basis of the revenue and expenditure forecasts announced in the 1999-2000 Budget Speech of March 9, 1999.
- (1)
- Certain 1999 figures were reclassified for consistency with the presentation adopted in 2000.
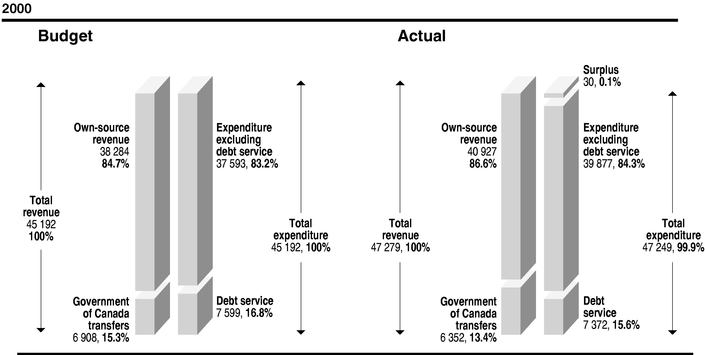
Revenue for fiscal 1999-2000 is $2 087 million higher than forecast in the Budget Speech. The $2 643-million increase in own-source revenue results from the better-than-anticipated performance of the economy in 1999, the growth in revenue from Government enterprises and consolidated agencies and the recurrence of additional revenue recorded in late 1998-1999 for revenue from income tax and other taxes.
XIII
CONSOLIDATED SUMMARY OF OPERATIONS (cont'd)
With regard to federal transfers, the $556-million downward adjustment may be attributed to a reduction in revenue from the Canada Health and Social Transfer (CHST).
Expenditure for fiscal 1999-2000, excluding debt service, is $2 284 million higher than anticipated in the Budget Speech. This increase reflects the impact of the additional resources announced, particularly for health and social services and for young people and education.
Debt service is $227 million lower than projected in the Budget. This decrease is due mainly to the fact that interest rates were lower than initially forecast while the Canadian dollar was stronger than expected in relation to other currencies.
XIV
CONSOLIDATED REVENUE
FISCAL YEAR ENDED MARCH 31, 2000
(in millions of dollars)
- (1)
- Certain 1999 figures were reclassified for consistency with the presentation adopted in 2000.
XV
CONSOLIDATED EXPENDITURE
FISCAL YEAR ENDED MARCH 31, 2000
(in millions of dollars)
- (1)
- Certain 1999 figures were reclassified for consistency with the presentation adopted in 2000.
XVI
- (1)
- Certain 1999 figures were reclassified for consistency with the presentation adopted in 2000.
- (2)
- Including $709 million in 1999-2000 ($664 million in 1998-1999) for the depreciation of fixed assets.
XVII
CONSOLIDATED FINANCIAL POSITION
AS AT MARCH 31, 2000
(in millions of dollars)
- (1)
- Certain 1999 figures were adjusted following the accounting changes disclosed in Note 2 of the consolidated financial statements.
XVIII
RECONCILIATION OF REVENUE, EXPENDITURE AND SURPLUS
FISCAL YEAR ENDED MARCH 31, 2000
(in millions of dollars)
| | 2000 | 1999 | |||
|---|---|---|---|---|---|
| REVENUE | |||||
| Consolidated Revenue Fund excluding Government enterprises | 41 216 | 41 502 | |||
| Government enterprises | 3 943 | 3 131 | |||
| Government agencies and special funds | 11 450 | 10 228 | |||
| 56 609 | 54 861 | ||||
EXPENDITURE | |||||
| Consolidated Revenue Fund | 45 337 | 44 464 | |||
| Government agencies and special funds | 11 242 | 10 271 | |||
| 56 579 | 54 735 | ||||
ELIMINATION OF INTER-ENTITY TRANSACTIONS | |||||
| Revenue | (9 330 | ) | (8 289 | ) | |
| Expenditure | (9 330 | ) | (8 289 | ) | |
| — | — | ||||
| SURPLUS | 30 | 126 | |||
XIX
FINANCIAL STATISTICS
FISCAL YEAR ENDED MARCH 31, 2000
(in millions of dollars)
| Fiscal year | Revenue* | Expenditure* | (Deficit) or surplus | Net debt(1) | | |||||
|---|---|---|---|---|---|---|---|---|---|---|
| 1999-2000 | 47 279 | 47 249 | 30 | 88 886 | (19) | |||||
| 1998-1999 | 46 572 | 46 446 | 126 | 88 583 | (18) | |||||
| 1997-1998 | 41 689 | 43 846 | (2 157 | ) | 88 377 | (17) | ||||
| 1996-1997 | 37 820 | 41 032 | (3 212 | ) | 64 833 | (16) | ||||
| 1995-1996 | 38 714 | 42 661 | (3 947 | ) | 61 624 | |||||
| 1994-1995 | 36 893 | 42 714 | (5 821 | ) | 57 677 | (15) | ||||
| 1993-1994 | 36 519 | 41 442 | (4 923 | ) | 51 837 | |||||
| 1992-1993 | 35 874 | 40 904 | (5 030 | ) | 46 914 | (14) | ||||
| 1991-1992 | 34 945 | 39 246 | (4 301 | ) | 41 885 | (13) | ||||
| 1990-1991 | 33 482 | 36 457 | (2 975 | ) | 37 558 | |||||
| 1989-1990 | 31 419 | 33 183 | (1 764 | ) | 34 583 | |||||
| 1988-1989 | 30 050 | 31 754 | (1 704 | ) | 32 819 | |||||
| 1987-1988 | 28 379 | 30 775 | (2 396 | ) | 31 115 | (4-10) | ||||
| 1986-1987 | 25 635 | 28 607 | (2 972 | ) | 28 716 | (4,11,12) | ||||
| 1985-1986 | 24 220 | 27 693 | (3 473 | ) | 25 735 | (4,9,10) | ||||
| 1984-1985 | 22 345 | 26 218 | (3 873 | ) | 21 455 | (4,8,9) | ||||
| 1983-1984 | 21 897 | 24 061 | (2 164 | ) | 17 298 | (4,7) | ||||
| 1982-1983 | 19 821 | 22 284 | (2 463 | ) | 15 038 | (4) | ||||
| 1981-1982 | 17 909 | 20 530 | (2 621 | ) | 12 569 | (4,6) | ||||
| 1980-1981 | 14 635 | 18 116 | (3 481 | ) | 14 326 | (4) | ||||
| 1979-1980 | 13 199 | 15 599 | (2 400 | ) | 10 836 | (4) | ||||
| 1978-1979 | 11 778 | 13 276 | (1 498 | ) | 8 460 | (4,5) | ||||
| 1977-1978 | 11 076 | 11 780 | (704 | ) | 7 058 | (4) | ||||
| 1976-1977 | 9 633 | 10 809 | (1 176 | ) | 6 353 | (3) | ||||
| 1975-1976 | 8 317 | 9 268 | (951 | ) | 5 044 | |||||
| 1974-1975 | 7 224 | 7 666 | (442 | ) | 4 093 | |||||
| 1973-1974 | 5 737 | 6 396 | (659 | ) | 3 651 | |||||
| 1972-1973 | 5 005 | 5 352 | (347 | ) | 2 992 | |||||
| 1971-1972 | 4 477 | 4 832 | (355 | ) | 2 645 | |||||
| 1970-1971 | 3 842 | 3 987 | (145 | ) | 2 290 | (2,2a) | ||||
| 1965-1966 | 1 736 | 1 999 | (263 | ) | 1 398 | |||||
| 1960-1961 | 751 | 855 | (104 | ) | 374 | |||||
| 1955-1956 | 462 | 442 | 20 | 275 |
- *
- Certain 1998-1999 figures were reclassified for consistency with the presentation adopted in 1999-2000.
(see notes on next page)
XX
FINANCIAL STATISTICS (cont'd)
FISCAL YEAR ENDED MARCH 31, 2000
(in millions of dollars)
($M = millions of dollars)
- (1)
- Net debt represents total liabilities minus financial assets, recorded in the statement of financial position.
- (2)
- Following the retroactive application of the recording of the allowance for losses on guaranteed financial initiatives, the net debt was increased by $8 M owing to the effect the application has on the surpluses or deficits of fiscal years prior to 1970-1971.
- (2a)
- Following the retroactive application of the recording of sick leave and vacations, the net debt was increased by $65 M owing to the effect the application has on the surpluses or deficits of fiscal years prior to 1970-1971.
- (3)
- At April 1, 1976, the net debt was increased by $133 M, including $31 M to take into account the recording of equity investments in Government agencies and enterprises according to the modified equity method and by $102 M for the recording of borrowings in foreign currencies at their Canadian equivalent.
- (4)
- Including adjustments by Government agencies and enterprises to their financial statements of $1 M in 1977-1978, $1 M in 1978-1979, - -$24 M in 1979-1980, $9 M in 1980-1981, -$4 M in 1981-1982, $6 M in 1982-1983, $37 M in 1983-1984, $398 M in 1984-1985, $168 M in 1985-1986, $4 M in 1986-1987 and $4 M in 1987-1988.
- (5)
- At April 1, 1978, the net debt was reduced by $97 M to cancel the effect of changes to the net debt, for purposes of comparison, from 1945-1946 to 1977-1978, following the adoption of a new method for recording pension plans.
- (6)
- Including a decrease of $4 374 M to take into account the assignment, to the Minister of Finance, of Hydro-Québec shares paid for from retained earnings of this Government enterprise up to December 31, 1980.
- (7)
- At April 1, 1983, the net debt was increased by $59 M following the cancellation of receivables (advances, accounts and accrued interest) from the Société d'aménagement de l'Outaouais.
- (8)
- During fiscal 1984-1985, the net debt was reduced by $528 M following the transfer, to the Minister of Finance, of Société immobilière du Québec shares for $80 M and through registering advances of $448 M as compensation for assets transferred to that Société.
- (9)
- Including an increase of $1 078 M in the net debt, through unamortized fluctuations in exchange rates on foreign currency borrowings of $414 M in 1984-1985 and $664 M in 1985-1986.
- (10)
- Including a decrease of $25 M in 1985-1986 and of $1 M in 1987-1988 following the transfer, to the Minister of Finance, of Société des établissements de plein air du Québec shares as compensation for assets transferred to that Société.
- (11)
- At April 1, 1986, the net debt was increased by $14 M following the write-off of equity investments in the Raffinerie de sucre du Québec.
- (12)
- During fiscal 1986-1987, the net debt was reduced by $9 M following the decrease in accounts payable under capital leases at March 31, 1986.
- (13)
- Including an increase of $26 M to take into account the adjustment made to borrowings in order to bring sinking fund accounting into conformity with the accounting policies in effect.
- (14)
- In 1992-1993, the net debt was reduced by $1 M following the transfer, to the Minister of Finance, of Société des établissements de plein air du Québec shares as compensation for assets transferred to that Société.
- (15)
- In 1994-1995, the net debt was increased by $19 M to take into account the write-off of equity investments in the Société générale des industries culturelles.
- (16)
- The net debt was reduced by $3 M in 1996-1997 to take into account the portion of unrealized gain on the sale of SOQUIP's interest in Noverco inc. (shares held by the Caisse de dépôt et placement du Québec).
- (17)
- The net debt was increased by $21 387 M, including $13 173 M for recording unrecorded pension plan obligations, $6 693 M for consolidating Government enterprises, agencies and special funds, $731 M for changing the method used to record borrowings, $461 M for recording public sector restructuring measures, $353 M for recording fixed assets and -$24 M for the excess of the municipal assessment for fixed assets of the Corporation d'hébergement du Québec over their cost on the date of acquisition.
- (18)
- The net debt was increased by $332 M, including $217 M for recording fixed assets, $25 M for recording accounts payable and accrued expenses, $97 M for adjustments to other accounts and -$7 M for the excess of the municipal assessment for fixed assets of the Corporation d'hébergement du Québec over their cost on the date of acquisition.
- (19)
- The net debt was increased by $333 M, including $359 M for recording fixed assets and -$26 M for the excess of the municipal assessment for fixed assets of the Corporation d'hébergement du Québec over their cost on the date of acquisition.
XXI
CONSOLIDATED FINANCIAL
STATEMENTS
(This page has been left blank intentionally.)
2
STATEMENT OF RESPONSIBILITY
The Government is responsible for the integrity and objectivity of the consolidated financial statements prepared by the Comptroller of Finance for the Minister of Finance in accordance with the Financial Administration Act (S.Q., 2000, c.15, s. 86). These statements are prepared in accordance with the accounting policies disclosed in Note 1 of the financial statements.
To fulfil its accounting and financial reporting responsibilities, the Government maintains systems of financial management and internal control designed to provide reasonable assurance that transactions are duly authorized by Parliament and properly executed and recorded.
The Comptroller of Finance keeps the accounts of the Gouvernement du Québec by maintaining a centralized record of financial transactions, and obtains all the information needed to meet its accounting and financial reporting requirements from Government departments, agencies, enterprises and funds.
The Government submits its consolidated financial statements for audit purposes to the Auditor General who, in his report to the National Assembly, states the nature and scope of his audit as well as his opinion.
The financial statements are part of the Public Accounts tabled annually in the National Assembly by the Minister of Finance.
On behalf of the Gouvernement du Québec,
| Nathalie Tremblay, CA Comptroller of Finance | Gilles Godbout Deputy Minister of Finance |
| Québec, December 7, 2000 |
3
To the National Assembly,
I have audited the following consolidated financial statements of the Gouvernement du Québec for the year ended March 31, 2000:
- •
- operations;
- •
- changes in net debt;
- •
- financial position;
- •
- financial surplus and financing;
- •
- fixed assets.
The Minister of Finance is responsible for preparing these financial statements. My responsibility is to express an opinion on these financial statements based on my audit.
I conducted my audit in accordance with generally accepted auditing standards. Those standards require that I plan and perform an audit to obtain reasonable assurance whether the financial statements are free of material misstatement. An audit includes examining, on a test basis, evidence supporting the amounts and disclosures in the financial statements. An audit also includes assessing the accounting policies used and significant estimates made by the management of government departments and agencies included in the government financial reporting entity, as well as evaluating the overall financial statement presentation.
TRANSFER EXPENDITURES
Transfer expenditures of $300 million for the health and social services network were included in the operations of the year ended March 31, 1999 even though the facts giving rise to the transfers had not materialized at that date. In my opinion, the criterion permitting their recognition was not met as the expenditures funded by this transfer had not yet been made on March 31, 1999. This practice is contrary to the government's accounting policies and the recommendations of the Public Sector Accounting Board of the Canadian Institute of Chartered Accountants concerning this type of transfer. Because the facts giving rise to the transfer materialized in the course of the present fiscal year, transfer expenditures of $300 million should have been recorded in the fiscal year ended March 31, 2000 instead in the fiscal year ended March 31, 1999.
PROVISION FOR LOSSES ON GUARANTEED FINANCIAL INITIATIVES
Investissement-Québec sets the provision for losses on its financial initiatives guaranteed by the government according to the credit risks and the initiatives in progress. The government records a different provision for these same initiatives according to its own assessment of the credit risks and on the basis of the authorized initiatives rather than of those in progress. In my opinion, the provision established by Investissement-Québec is appropriate because it is evaluated on the basis of the accrual accounting method and a meticulous analysis of the credit risks. Hence, the government should have recorded in its books the provision calculated by Investissement-Québec. The effect of not having entered an appropriate provision is to overstate the surplus of the year ended March 31, 2000 by $24.6 million (understate the surplus of the year ended March 31, 1999 by $101 million) and to overstate the provision for losses on guaranteed financial initiatives and the net debt by $88.4 million at that date (March 31, 1999: $113 million — adjusted amount).
4
AUDITOR GENERAL'S REPORT (cont'd)
COMMITMENTS FOR THE RÉGIME DE RETRAITE DES EMPLOYÉS DU GOUVERNEMENT ET DES ORGANISMES PUBLICS (RREGOP) AND THE RÉGIME DE RETRAITE DES AGENTS DE LA PAIX EN SERVICES CORRECTIONNELS (RRAPSC)
The liabilities recorded under "Retirement plans" as at March 31, 2000 for the regular service of the RREGOP, excluding that of the senior administration, total $18 177 million and the liabilities recorded for the RRAPSC total $524 million (March 31, 1999: $16 751 and $480 million). These two plans are of the shared-cost type, namely their respective cost, i.e. the ensuing annual contribution, is shared in predetermined proportions between the employer and the participants. This sharing of the annual contribution creates a commitment for the government with respect to the financing of these plans, a commitment whose value corresponds to the fund that the government would have accumulated, had it paid its contributions on the same bases as those which were used to determine the participants' fund. In the case of the RREGOP, the value of this fund was estimated at $33 060 million as at December 31, 1999 (December 31, 1998: $29 391 million). As for the RRAPSC, for which the employees' contributions were paid into the Consolidated Revenue Fund, the value of the fund that the employees and the government would have accumulated was evaluated at $624 million (December 31, 1998: $560 million) at that same date.
In note 5 of its financial statements, the government does not clearly recognize that it has contracted commitments for the financing of these plans. Indeed, it does not indicate that the commitments to which reference is made ensue from the sharing of the annual contribution established according to the legislative provisions of these plans and the collective agreements that the government has negotiated since the creation of the plans. With respect to commitments of $33 060 million and $624 million (December 31, 1998: $29 391 and $560 million) for the RREGOP and the RRAPSC respectively, $18 177 million and $524 million (March 31, 1999: $16 751 and $480 million) are already recorded under liabilities as at March 31, 2000.
Although these commitments had no effect on the liabilities, the net debt and the surplus of the year ended March 31, 2000, this information must be disclosed appropriately to enable readers of the financial statements to better evaluate the government's financial condition.
In my opinion, except for the effects of the inappropriate recording of the expenditures mentioned in the foregoing paragraphs and the inappropriate disclosure by the government of the commitments concerning the financing of the RREGOP and the RRAPSC, these consolidated financial statements present fairly, in all material respects, the financial position of the Gouvernement du Québec as at March 31, 2000, and the results of its operations and the changes in its financial position for the year then ended in accordance with the accounting policies described in Note 1. As required by the Auditor General Act (R.S.Q., chapter V-5.01), I report that, in my opinion, these accounting policies have been applied, after giving retroactive effect to the changes in accounting policies explained in Note 2, on a basis consistent with that of the preceding year.
Auditor General of Québec,
Guy Breton, FCA
Québec City, December 7, 2000
5
(This page has been left blank intentionally.)
6
CONSOLIDATED STATEMENT OF OPERATIONS
FISCAL YEAR ENDED MARCH 31, 2000
(in millions of dollars)
| | | 2000 | 1999 | |||||
|---|---|---|---|---|---|---|---|---|
| Appendix | | Budget* | Actual results | Actual results | ||||
| | | | | (Note 13) | ||||
| 5 | REVENUE (Note 3) | |||||||
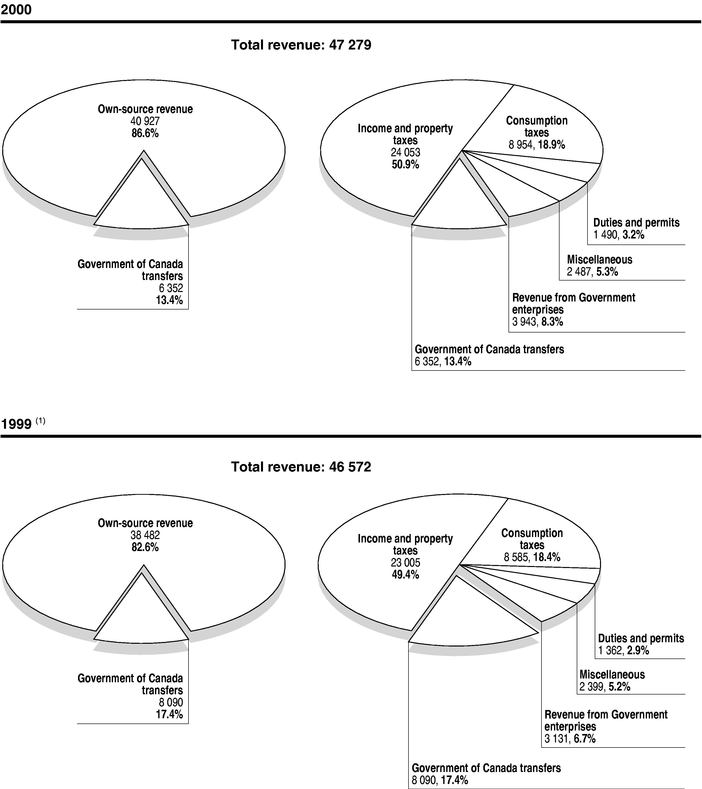
| Income and property taxes | 23 022 | 24 053 | 23 005 | |||||
| Consumption taxes | 8 556 | 8 954 | 8 585 | |||||
| Duties and permits | 1 402 | 1 490 | 1 362 | |||||
| Miscellaneous | 2 367 | 2 487 | 2 399 | |||||
| Revenue from Government enterprises | 2 937 | 3 943 | 3 131 | |||||
| Own-source revenue | 38 284 | 40 927 | 38 482 | |||||
| Government of Canada transfers | 6 908 | 6 352 | 8 090 | |||||
| Total revenue | 45 192 | 47 279 | 46 572 | |||||
6 | EXPENDITURE | |||||||
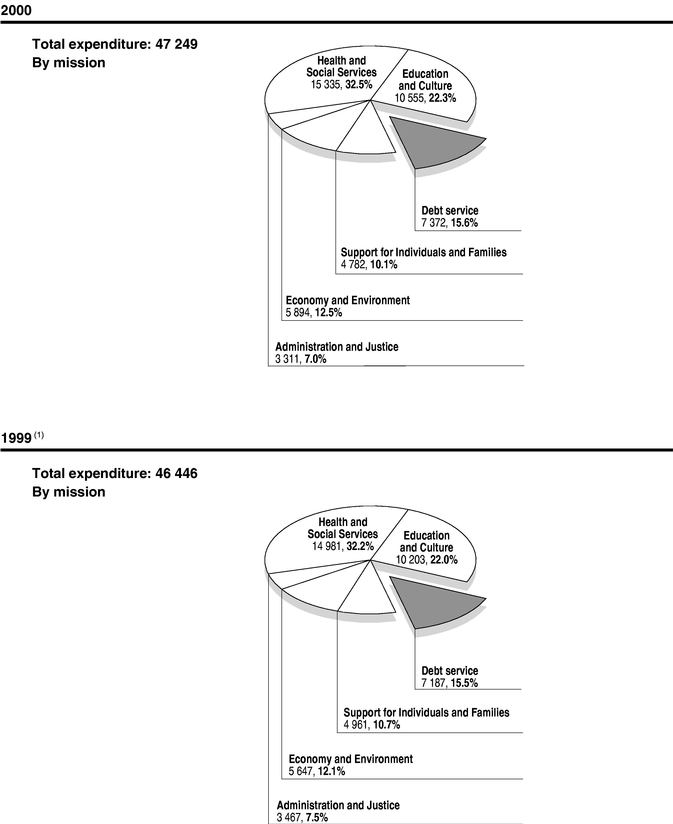
| Health and Social Services | 14 067 | 15 335 | 14 981 | |||||
| Education and Culture | 10 077 | 10 555 | 10 203 | |||||
| Support for Individuals and Families | 4 778 | 4 782 | 4 961 | |||||
| Economy and Environment | 5 366 | 5 894 | 5 647 | |||||
| Administration and Justice | 3 305 | 3 311 | 3 467 | |||||
| Sub-total | 37 593 | 39 877 | 39 259 | |||||
| Debt service | 7 599 | 7 372 | 7 187 | |||||
| Total expenditure | 45 192 | 47 249 | 46 446 | |||||
| Surplus | — | 30 | 126 | |||||
- *
- These data were established on the basis of the revenue and expenditure forecasts announced in the 1999-2000 Budget Speech of March 9, 1999.
7
CONSOLIDATED STATEMENT OF CHANGES IN NET DEBT
FISCAL YEAR ENDED MARCH 31, 2000
(in millions of dollars)
| | 2000 | 1999 | ||||
|---|---|---|---|---|---|---|
| PREVIOUSLY ESTABLISHED OPENING BALANCE | 88 461 | 88 377 | ||||
| Adjustment: | ||||||
| Accounts payable and accrued expenses (Note 2a) | 25 | 25 | ||||
| Other accounts (Note 2b) | 97 | 97 | ||||
| Adjusted opening balance | 88 583 | 88 499 | ||||
| Surplus | (30 | ) | (126 | ) | ||
| Increase in the net book value of fixed assets (Note 2 c) | 359 | 217 | ||||
| 329 | 91 | |||||
| Excess of the municipal assessment for fixed assets of the Corporation d'hébergement du Québec over their cost on the date of acquisition | (26 | ) | (7 | ) | ||
| Annual change in net debt | 303 | 84 | ||||
| CLOSING BALANCE | 88 886 | 88 583 | ||||
8
CONSOLIDATED STATEMENT OF FINANCIAL POSITION
AS AT MARCH 31, 2000
(in millions of dollars)
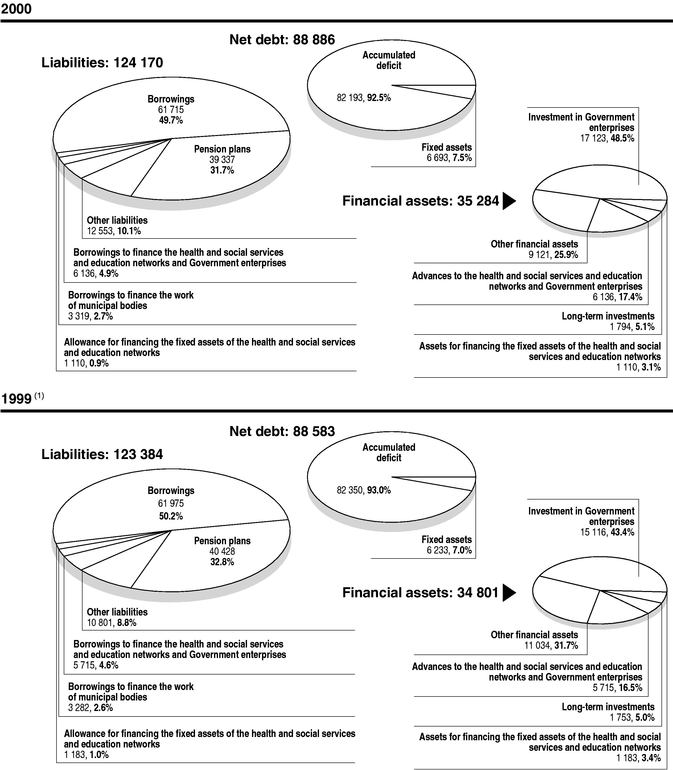
| Appendix | | 2000 | 1999 | |||
|---|---|---|---|---|---|---|
| | | | (Note 2) | |||
| LIABILITIES | ||||||
| 7 | Bank overdraft | 2 282 | 1 617 | |||
| 8 | Accounts payable and accrued expenses | 9 258 | 9 012 | |||
| Deferred revenue | 1 013 | 172 | ||||
| Pension plans (Note 5) | 39 337 | 40 428 | ||||
| 9 | Borrowings (Note 6) | 61 715 | 61 975 | |||
| 10 | Borrowings to finance the health and social services and education networks and Government enterprises (Note 8) | 6 136 | 5 715 | |||
| 11 | Borrowings to finance the work of municipal bodies (Note 9) | 3 319 | 3 282 | |||
| Allowance for financing the fixed assets of the health and social services and education networks (Note 10) | 1 110 | 1 183 | ||||
| TOTAL LIABILITIES | 124 170 | 123 384 | ||||
| FINANCIAL ASSETS | ||||||
| 12 | Short-term investments | 703 | 2 930 | |||
| 13 | Accounts receivable | 6 904 | 6 103 | |||
| 14 | Investment in Government enterprises | 17 123 | 15 116 | |||
| 15 | Long-term investments | 1 794 | 1 753 | |||
| 16 | Other accounts | 1 514 | 2 001 | |||
| Advances to the health and social services and education networks and Government enterprises (Note 8) | 6 136 | 5 715 | ||||
| Assets for financing the fixed assets of the health and social services and education networks (Note 10) | 1 110 | 1 183 | ||||
| TOTAL FINANCIAL ASSETS | 35 284 | 34 801 | ||||
| NET DEBT | 88 886 | 88 583 | ||||
| Net debt represented by: | ||||||
| Fixed assets (see consolidated statement of fixed assets) | 6 693 | 6 233 | ||||
| Accumulated deficit | 82 193 | 82 350 | ||||
| 88 886 | 88 583 | |||||
- •
- Commitments and contingencies (Note 11)
- •
- Transactions of a fiduciary nature conducted by Government agencies and funds (Appendix 18)
| Nathalie Tremblay, CA | Gilles Godbout |
| Comptroller of Finance | Deputy Minister of Finance |
Québec, December 7, 2000 |
9
CONSOLIDATED STATEMENT OF FINANCIAL SURPLUS AND FINANCING
FISCAL YEAR ENDED MARCH 31, 2000
(in millions of dollars)
| | 2000 | 1999 | ||||||||
|---|---|---|---|---|---|---|---|---|---|---|
| OPERATING ACTIVITIES | ||||||||||
| Surplus | 30 | 126 | ||||||||
| Items not affecting liquid assets: | ||||||||||
| Government's share in the results of enterprises entered as revenue less declared dividends | (1 798 | ) | (1 282 | ) | ||||||
| Doubtful accounts | 443 | 594 | ||||||||
| Sick leave and vacations | 66 | 60 | ||||||||
| Allowance for losses on guaranteed financial initiatives | 18 | 154 | ||||||||
| Pension costs (Note 5) | 1 077 | 930 | ||||||||
| Interest charges relating to pension plans (Note 5) | 2 851 | 2 500 | ||||||||
| Depreciation of fixed assets | 709 | 664 | ||||||||
| Amortization of deferred expenses | 2 | 111 | ||||||||
| Amortization of unrealized foreign exchange loss | 200 | 293 | ||||||||
| Amortization of discounts and premiums | 116 | 3 684 | 120 | 4 144 | ||||||
| 3 714 | 4 270 | |||||||||
| Pensions plans: | ||||||||||
| Benefits and other payments | (2 336 | ) | (2 624 | ) | ||||||
| Employee and independent employer contributions | 148 | (2 188 | ) | 214 | (2 410 | ) | ||||
| Specific purpose accounts (Appendix 8) | ||||||||||
| Payments and other debits | (339 | ) | (301 | ) | ||||||
| Receipts and other credits | 331 | (8 | ) | 328 | 27 | |||||
| Changes in liabilities and financial assets related to operations | 580 | (235 | ) | |||||||
| Liquid assets provided for operating activities | 2 098 | 1 652 | ||||||||
INVESTMENT ACTIVITIES | ||||||||||
| Changes in investment in Government enterprises | ||||||||||
| Investments made | (212 | ) | (184 | ) | ||||||
| Investments realized | 29 | 86 | ||||||||
| (183 | ) | (98 | ) | |||||||
| Changes in long-term investments | ||||||||||
| Investments made | (284 | ) | (333 | ) | ||||||
| Investments realized | 154 | 183 | ||||||||
| (130 | ) | (150 | ) | |||||||
| Fixed assets | ||||||||||
| Acquisition | (1 106 | ) | (976 | ) | ||||||
| Disposal | 38 | 95 | ||||||||
| (1 068 | ) | (881 | ) | |||||||
| Liquid assets used for investment activities | (1 381 | ) | (1 129 | ) | ||||||
| NET FINANCIAL SURPLUS | 717 | 523 | ||||||||
10
CONSOLIDATED STATEMENT OF FINANCIAL SURPLUS AND FINANCING (cont'd)
FISCAL YEAR ENDED MARCH 31, 2000
(in millions of dollars)
| | 2000 | 1999 | ||||||||
|---|---|---|---|---|---|---|---|---|---|---|
| FINANCING ACTIVITIES | ||||||||||
| Changes in borrowings | ||||||||||
| Borrowings made | 6 080 | 9 651 | ||||||||
| Borrowings repaid | (6 212 | ) | (7 161 | ) | ||||||
| (132 | ) | 2 490 | ||||||||
Changes in the Retirement Plans Sinking Fund: | ||||||||||
| Payments | (2 612 | ) | (944 | ) | ||||||
| Reinvestment of Fund investment income | (219 | ) | (86 | ) | ||||||
| Changes in liquid assets(1) | 2 246 | (1 983 | ) | |||||||
| NET FINANCING | (717 | ) | (523 | ) | ||||||
- (1)
- Liquid assets include short-term investments less bank overdraft, excluding outstanding cheques as well as cash and notes on hand and outstanding deposits.
11
CONSOLIDATED STATEMENT OF FIXED ASSETS
FISCAL YEAR ENDED MARCH 31, 2000
(in millions of dollars)
| | Land | Buildings | Facilities | Complex networks | Equip- ment | Development of data processing systems | 2000 Total | 1999 Total | |||||||||
|---|---|---|---|---|---|---|---|---|---|---|---|---|---|---|---|---|---|
| Cost of fixed assets — adjusted opening balance | 302 | 3 260 | 156 | 10 533 | 1 296 | 503 | 16 050 | 15 755 | |||||||||
| Acquisition | 22 | 133 | 11 | 538 | 253 | 149 | 1 106 | 976 | |||||||||
| Disposal | (63 | ) | (6 | ) | (1 | ) | (23 | ) | (3 | ) | (96 | ) | (147 | ) | |||
| Cost of fixed assets — closing balance | 324 | 3 330 | 161 | 11 070 | 1 526 | 649 | 17 060 | 16 584 | |||||||||
| Accumulated depreciation — adjusted opening balance | 1 606 | 86 | 7 267 | 595 | 162 | 9 716 | 9 739 | ||||||||||
| Depreciation expenses | 96 | 10 | 362 | 157 | 84 | 709 | 664 | ||||||||||
| Impact of disposal | (42 | ) | (5 | ) | (10 | ) | (1 | ) | (58 | ) | (52 | ) | |||||
| Accumulated depreciation — closing balance | 1 660 | 91 | 7 629 | 742 | 245 | 10 367 | 10 351 | ||||||||||
| Fixed assets (Note 4) | 324 | 1 670 | 70 | 3 441 | 784 | 404 | 6 693 | (1) | 6 233 | (1) | |||||||
- (1)
- Including fixed assets rented under a $225-million capital lease in 1999-2000 ($249-million capital lease in 1998-1999).
12
1. SIGNIFICANT ACCOUNTING POLICIES
The Gouvernement du Québec accounts for its financial transactions in accordance with the accounting policies disclosed below. When necessary, the information included in the consolidated financial statements is based on best estimates and judgments.
REPORTING ENTITY
The Government's reporting entity encompasses departments, agencies, enterprises and special funds which must account for the management of their financial transactions and resources to a Minister or directly to the National Assembly and which are part of the Government or under its control. They are listed in an appendix to the financial statements.
Transactions of a fiduciary nature conducted by certain agencies and funds are not included in the Government's reporting entity. These agencies and funds are listed in an appendix to the financial statements.
CONSOLIDATION METHOD
The accounts of the Consolidated Revenue Fund and the other entities included in the Government's reporting entity, with the exception of Government enterprises, have been standardized and combined line by line in accordance with the accounting policies disclosed below. Inter-entity transactions and balances have been eliminated.
Government enterprises are accounted for using the modified equity method. Therefore, investment in these enterprises is recorded at cost, which is adjusted annually by the Government's share in the results of these enterprises with an offsetting entry to revenue, and reduced by the portion of dividends that are paid or reported by an enterprise and that accrue to the Government. A Government enterprise has all of the following characteristics:
- a)
- it is a separate legal entity that has the authority to enter into contracts in its own name and to go before a court;
- b)
- it is vested with the financial and administrative power to carry out commercial activities;
- c)
- its main activity is the sale of goods or the delivery of services to individuals or to organizations not included in the Government's reporting entity;
- d)
- it may, during the normal course of its operations, pursue its activities and settle its debts using revenue from sources not included in the Government's reporting entity.
REVENUE
Revenue from income and property taxes, consumption taxes, duties, permits, fines and forfeitures is recorded in the fiscal year during which it is received, after deducting reimbursements and other amounts deductible under the applicable legislation. Assessments and amounts billed before the end of the fiscal year are entered as revenue.
Revenue from Government of Canada transfers is recorded in the fiscal year during which it is received. However, claims issued and estimates of revenue from transfers related to shared-cost programs without fiscal compensation are recorded in the fiscal year during which the related expenditures are made.
Other revenue is recorded on the accrual basis. Interest income ceases to be recorded when there is no reasonable assurance that the principal or interest will be recovered.
13
EXPENDITURE
Expenditure includes the cost of goods and services acquired during the fiscal year, with the exception of fixed assets for which an annual depreciation is recorded.
Transfers are recorded in the fiscal year during which the events that give rise to them occur, insofar as the transfers have been authorized and once beneficiaries have met the eligibility criteria.
LIABILITIES
Accounts Payable and Accrued Expenses
Specific purpose accounts
The Financial Administration Act (S.Q., 2000, c. 15) provides for the creation of specific purpose accounts in which amounts received in respect of a contract or an agreement calling for the allocation of funds to a specific purpose may be deposited. Consequently, certain amounts receivable or payable under shared-cost programs without fiscal compensation or as a result of third-party compensation are recorded in specific purpose accounts.
Sick leave and vacations
Obligations relating to sick leave and vacations owed to Government employees are recorded as liabilities. The annual change in this account is posted to expenditure.
Allowance for losses on guaranteed financial initiatives
Obligations resulting from borrowings and other guaranteed financial initiatives are recorded as liabilities when a loss is probable. The annual change in this allowance is posted to expenditure.
The allowance for probable losses is evaluated using a rate based on past experience regarding losses on each of the guarantee programs. Special guarantees are grouped according to risk level.
Pension Plans
Government pension plans are defined benefit pension plans. Within the context of preparing the Government's financial statements, obligations relating to vested benefits are evaluated using the actuarial projected benefit method prorated on service, according to the most probable assumptions set by the Government with regard, notably, to inflation, interest and employee remuneration. This method has been adjusted, however, to reflect the way in which benefits are earned by employees.
Total cost of plans
The annual cost of vested benefits for all pension plans, including the cost of changes to the plans, and the amortization of adjustments to estimates based on actuarial gains or losses are charged to expenditure, with an offsetting entry in the retirement plans account, i.e. pension plan liability. Changes to actuarial assumptions are included in the adjustments to estimates based on actuarial gains or losses.
In the case of the Government and Public Employees Retirement Plan (RREGOP), the Civil Service Superannuation Plan (CSSP), the Teachers Pension Plan (TPP), the Pension Plan of Certain Teachers (PPCT) and transfers from the TPP and the CSSP to RREGOP, adjustments to estimates based on actuarial gains or losses are amortized using the straight-line method over a period corresponding to the estimated average remaining years of service of participants
14
in these plans as a whole. However, adjustments to estimates based on actuarial gains or losses for the other pension plans are amortized over a period corresponding to the estimated average remaining years of service of participants in each plan.
The total cost of the pension plans also includes interest charges on obligations relating to vested benefits, with an offsetting entry to liabilities in the retirement plans account. The investment revenue of the Retirement Plans Sinking Fund, created to pay for benefits under these plans, is taken into account in computing interest charges on obligations relating to vested benefits.
Borrowings
Borrowings are recorded at the amount received at the time of issue, adjusted by the premium or discount amortization to obtain the amount of principal repayable at maturity. Issue expenses are recorded as deferred expenses and amortized over the term of each borrowing.
The value of borrowings in foreign currency is adjusted using the rates in effect on the balance sheet date, and the changes are recorded as unrealized foreign exchange gains or losses and amortized over the term of each borrowing.
Gains or losses on financial instruments are deferred and amortized over the remaining term of each agreement. However, foreign exchange gains or losses on short-term agreements aimed at covering the long-term debt are amortized over the remaining term of the borrowing portfolio in the currency concerned.
The amortization is calculated using the straight-line method, except in the case of discounts and premiums, which are amortized according to the effective rate of return on each borrowing.
FINANCIAL ASSETS
Short-term investments are recorded at cost and accounts receivable and loans and advances are recorded initially at cost and then brought down to their net recoverable value through valuation allowances.
Investment in Government enterprises is recorded using the modified equity method.
Other long-term investments are entered at cost and reduced by any durable loss in value. The loss in value is charged to operations for the fiscal year during which it is known.
FIXED ASSETS
Fixed assets consist of acquired, built, developed or improved non-financial assets, whose useful life extends beyond the fiscal year and which are intended to be used on an ongoing basis for producing goods or delivering services.
They include land, buildings, facilities such as parks and outdoor recreational areas, complex networks such as dams, canals, roads and bridges, equipment such as vehicles and furniture, and the development of data processing systems.
Fixed assets are recorded at cost and depreciated using a logical, systematic method over a period corresponding to their useful life. They are a component of net debt. Their cost includes financing charges capitalized during their construction, improvement or development.
15
The cost of fixed assets held under capital leases is equal to the present value of payments due. Works of art and historic property are not recorded as fixed assets but are mentioned in a note to the financial statements, and their cost is charged to expenditure for the fiscal year during which they are acquired.
Fixed assets acquired through donation or for a nominal fee are recorded at their fair value at the time of acquisition with an offsetting entry to deferred revenue liabilities, which are gradually transferred to operating results using the same term and method of amortization as for the fixed assets concerned. However, land is recorded at its nominal value.
Sums received from agencies not included in the Government's reporting entity for the purchase of fixed assets are recorded as deferred revenue liabilities and gradually transferred to operating results using the same term and method of amortization as for the fixed assets concerned. However, contributions received for the purchase of land are deducted from the latter's cost.
2. ACCOUNTING CHANGES
- a)
- Accounts payable and accrued expenses
The transfer expenditure relating to the payment of interest included in financial assistance for producers for farm and forestry financing purposes has been recorded on the accrual basis. Previously, it was recorded on the cash basis.
Since April 1, 1996, the Government has recorded obligations stemming from sick leave and vacations owed to employees as a liability in the account for sick leave and vacations. However, in the case of certain organizations, these obligations were recorded during the fiscal year. The organizations concerned used to record such benefits when they were used.
The retroactive application of these accounting adjustments increased the following items:
| | 2000 | 1999 | ||
|---|---|---|---|---|
| | (in millions of dollars) | |||
| Accounts payable and accrued expenses | 25 | 25 | ||
| Net debt | 25 | 25 | ||
- b)
- Other accounts
In determining the net book value of fixed assets as at March 31, 1998, unrealized foreign exchange losses were recorded under "Other accounts", whereas they should have been posted to net debt.
The retroactive application of this accounting change increased or decreased the following items:
| | 2000 | 1999 | |||
|---|---|---|---|---|---|
| | (in millions of dollars) | ||||
| Other accounts | (97 | ) | (97 | ) | |
| Net debt | 97 | 97 | |||
16
- c)
- Fixed assets
The following adjustments were made to the net book value of fixed assets as at April 1, 1999.
Certain assets that were previously recorded under the "Buildings" and "Facilities" categories and depreciated at the rates applicable to those categories have been restated under the "Land" category. Losses in value have been recognized for other assets.
The retroactive application of these accounting changes, without adjustments to the financial statements for previous years, increased or decreased the following items:
| | 2000 | ||
|---|---|---|---|
| | (in millions of dollars) | ||
| Surplus | 6 | ||
| Net debt — fixed assets | 101 | ||
| Net debt — accumulated deficit | (101 | ) |
3. REVENUE
ACCORDING TO APPLICABLE LEGISLATION, REVENUE IS SHOWN AFTER DEDUCTION OF THE FOLLOWING ITEMS:
| | 2000 | 1999 | ||||
|---|---|---|---|---|---|---|
| | (in millions of dollars) | |||||
| | | (adjusted) | ||||
| Personal income tax: | ||||||
| Refundable tax credits: | ||||||
| Sales tax | 466 | 367 | ||||
| Day care expenses | 246 | 200 | ||||
| Other | 37 | 40 | ||||
| Property tax refunds | 257 | 187 | ||||
| Family assistance allowances | 79 | 76 | ||||
| 1 085 | 870 | |||||
| Corporate taxes: | ||||||
| Refundable tax credits: | ||||||
| Tax credit for large corporations | 179 | 189 | ||||
| Scientific research and experimental development | 169 | 143 | ||||
| Cinematrographic productions | 88 | 104 | ||||
| Losses other than capital losses | 42 | 49 | ||||
| Other | 102 | 25 | ||||
| 580 | 510 | |||||
| Duties and permits: | ||||||
| Silvicultural work and other forest management activities | 196 | 207 | ||||
| Highway carrier monitoring | 34 | 34 | ||||
| Refundable mining duties credits for losses pertaining to exploration and capital expenditures and other | 7 | 14 | ||||
| 237 | 255 | |||||
| 1 902 | 1 635 | |||||
17
4. FIXED ASSETS
Fixed assets are recorded at cost and shown in net debt. They are depreciated over their useful life using the following methods:
| Category | Depreciation method | Useful life | ||
|---|---|---|---|---|
| Buildings | Straight-line and annuity | 10 to 50 years | ||
| Facilities | Straight-line and annuity | 5 to 10 years | ||
| Complex networks | Straight-line | 10 to 40 years | ||
| Equipment | Straight-line | 3 to 20 years | ||
| Development of data processing systems | Straight-line | 5 to 10 years |
Works of art and historic property consist mainly of paintings, sculptures, drawings, prints, photographs, installations, films and videos and their cost is charged to expenditures for the fiscal year in which they are acquired.
5. PENSION PLANS
The Gouvernement du Québec contributes to several pension plans for its employees. Employees of the public and parapublic sectors, the Members of the National Assembly and the judges of the Court of Québec participate in these plans.
PENSION PLANS
| | Estimated number of participants as at December 31, 1999 | Number of beneficiaries as at December 31, 1999 | ||
|---|---|---|---|---|
| Government and Public Employees Retirement Plan (RREGOP) | 460 000 | 95 994 | ||
| Pension Plan of Management (PPMP) | 20 900 | 9 590 | ||
| Teachers Pension Plan and Pension Plan of Certain Teachers (TPP and PPCT) | 14 925 | * | 41 608 | |
| Civil Service Superannuation Plan (CSSP) | 4 950 | * | 25 922 | |
| Superannuation Plan for the Members of the Sûreté du Québec (SPMSQ) | 4 000 | 3 268 | ||
| Pension Plan of Peace Officers in Correctional Services (PPPOCS) | 2 900 | 806 | ||
| Pension Plan for Federal Employees Transferred to Employement with the Gouvernement du Québec (PPFETQ) | 302 | 58 | ||
| Pension Plan of the Judges of the Court of Québec (PPJCQ) | 280 | 271 | ||
| Pension Plan of the Members of the National Assembly (PPMNA) | 125 | 267 | ||
| 508 382 | 177 784 | |||
* These plans have not admitted any new participants since July 1, 1973.
These plans are "defined benefit" pension plans, which means that they guarantee participants a set income upon retirement, calculated on the basis of participants' average income for the five best paid years and their number of years of service. The portion of benefits accrued prior to July 1, 1982 is usually indexed to the cost of living, while those accrued after that date are partially indexed.
18
| There are two types of pension plans: | › cost-sharing pension plans; | |
| › cost-balance pension plans. |
Cost-sharing pension plans
In the case of RREGOP, the Government covers costs at a rate of 50% for years of service since July 1, 1982 and 58.33% (7/12) for years of service prior to July 1, 1982. The contributions of participants and independent employers to RREGOP are paid into the Caisse de dépôt et placement du Québec.
In the case of the PPPOCS, the Government covers 46% of costs, while employees cover 54%. Employee contributions are paid into the Consolidated Revenue Fund.
Cost-balance pension plans
Cost-balance pension plans are plans for which employers cover the difference between the cost of plans and the contributions paid by participants. All Government plans except RREGOP and the PPPOCS fall into this category. The contributions of participants and independent employers to these cost-balance plans are paid into the Consolidated Revenue Fund. The Government thus covers the difference between the cost of each plan and the contributions paid by participants and independent employers.
Value of actuarial obligations relating to vested benefits for the pension plans as a whole
The value of actuarial obligations relating to vested benefits for the pension plans as a whole for service rendered as at a given date is determined by actuaries of the Commission administrative des régimes de retraite et d'assurances (CARRA). For this purpose, they use the actuarial projected benefit method prorated on service and take into account among other things, the most probable long-term economic assumptions.
| Long-term economic assumptions: | ||
| Yield, net of inflation | 4.70% | |
| Inflation rate | 3.00% | |
| Salary escalation rate, net of inflation | 1.25% |
Government's liability with regard to the pension plans
The Government's liability with regard to the pension plans is recorded in conformity with the recommendations of the Canadian Institute of Chartered Accountants for public sector pension plans.
The liability recorded with respect to the pension plans is established on the basis of the value of actuarial obligations relating to vested benefits for the pension plans as a whole, taking into account certain adjustments stemming from actuarial gains or losses noted during the actuarial valuations prepared every three years. These gains or losses are amortized using the accounting policy established for this purpose. The Government's liability with regard to the pension plans also includes interest charges calculated on the basis of the value of the actuarial obligations relating to vested benefits as at a given date for the pension plans as a whole.
As shown in the following table, which presents a breakdown of the retirement plans account for the main pension plans, the liability recorded in the Government's retirement plans account is estimated at $44 377 million as at March 31, 2000 for the plans as a whole, including $21 063 million for RREGOP, the plan with the most participants.
19
PENSION PLANS LIABILITY
| | Actuarial obligations relating to vested benefits | Adjustments | Pension plans liability as at March 31, 2000 | Pension plans liability as at March 31, 1999 | ||||||
|---|---|---|---|---|---|---|---|---|---|---|
| | (in millions of dollars) | |||||||||
| RREGOP | ||||||||||
| — regular service | 19 197 | (648 | ) | 18 549 | 17 069 | |||||
| — transferred service | 2 663 | (149 | ) | 2 514 | 2 492 | |||||
| TPP and PPCT | 15 203 | (456 | ) | 14 747 | 14 629 | |||||
| CSSP | 5 499 | (130 | ) | 5 369 | 5 381 | |||||
| Other | 3 161 | 37 | 3 198 | 3 066 | ||||||
| 45 723 | (1 346 | ) | 44 377 | 42 637 | ||||||
| Sinking fund(1) | (5 040 | ) | (5 040 | ) | (2 209 | ) | ||||
| 40 683 | (1 346 | ) | 39 337 | 40 428 | ||||||
- (1)
- Under the Financial Administration Act (S.Q., 2000, c. 15, s. 8), the Minister of Finance may make long-term investments, by way of a deposit with the Caisse de dépôt et placement du Québec, using a part of the Consolidated Revenue Fund up to an amount equal to the sums recorded in the retirement plans account in order to create a sinking fund to provide for the payment of all or part of the benefits awarded under these plans. The sinking fund's assets are recorded at a value based on their market value. During fiscal 1999-2000, the Minister made investments of $2 612 million in the Retirement Plans Sinking Fund. At March 31, 2000, $219 million in revenue ($86 million in 1999) was reinvested in the sinking fund, and was taken into account in calculating the interest charges relating to pension plans.
Actuarial valuations and subsequent estimates
The most recent estimates, which were filed and issued in 2000, were determined on the basis of actuarial valuations as at December 31, 1997 for the PPPOCS, as at December 31, 1996 for RREGOP, the TPP, the CSSP, the PPCT, the SPMSQ, the PPMNA and the PPJCQ, and as at December 31, 1994 for the PPFETQ.
TOTAL COST OF PENSION PLANS
| | 2000 | 1999 | |||
|---|---|---|---|---|---|
| | (in millions of dollars) | ||||
| | | (Note 13) | |||
| Pension costs | |||||
| Cost of vested benefits excluding interest charges | 1 042 | 1 054 | |||
| Employee contributions | (124 | ) | (206 | ) | |
| Independent employer contributions | (24 | ) | (8 | ) | |
| 894 | 840 | ||||
| Cost of changes(1) | 44 | — | |||
| Amortization of adjustments to estimates based on actuarial gains or losses | 139 | 90 | |||
| 1 077 | 930 | ||||
| Interest charges relating to the pension plans | 2 632 | (2) | 2 414 | (2) | |
| Total | 3 709 | 3 344 | |||
- (1)
- In accordance with the Act to amend the pension plans of the public and parapublic sectors (S.Q. 2000, c. 32), the Government improved the retirement eligibility criteria for the PPMP by granting participants, for service acquired as at December 31, 1999, a retirement pension calculated on the basis of their average income for the three best paid years and a new permanent retirement eligibility criterion with no actuarial reduction, i.e. 88 factor with a minimum age of 55.
- (2)
- Including $219 million in 1999-2000 ($86 million in 1998-1999) in sinking fund investment income.
20
FUNDING OF PENSION PLANS
Actuarial valuations for funding purposes for regular service under "cost-sharing" pension plans (RREGOP and PPPOCS)
By law, actuaries of the Commission administrative des régimes de retraite et d'assurances (CARRA) are required to prepare, every three years, an actuarial valuation for funding purposes for each of the pension plans in order to determine the rates of contribution for these plans. To that end, the actuaries take legislative provisions and collective agreements into account using the valuation method agreed upon by the parties concerned and economic assumptions that are more conservative than those used to prepare valuations for accounting purposes.
According to these valuations, Government commitments for funding purposes are calculated as the fund that the Government would have amassed had it been required to pay contributions since 1973 on the same bases as those used to determine the rate of contribution of participants. In the case of RREGOP, this fund was estimated at $33 060 million as at December 31, 1999 ($29 931 million in 1998). In the case of the PPPOCS, for which employee contributions were paid into the Consolidated Revenue Fund, the value of the fund that would have been amassed by employees and the Government was $624 million on that date ($560 million in 1998). The difference between these amounts and the liability recorded for these two plans represents a non-payable amount that does not have to be recorded as a liability of the Government. The difference may be attributed to the use of different economic assumptions and methods.
According to the valuations made for funding purposes using data as at December 31, 1993, the Government's rate of contribution for regular service under RREGOP as at December 31, 1999 was equal to 4.80% of eligible earnings for participants who may be unionized (4.10% for non-unionizable participants). In October 1998, CARRA actuaries tabled an actuarial valuation that was based on data as at December 31, 1996 and that updated the previous valuation. In addition, following the conclusion of an agreement between the Government and employee representatives in December 1999, changes were made to RREGOP starting January 1, 2000 on the basis of the 1998 valuation. Since then, the Government's rate of contribution for regular service has been equal to 3.12% of income for participants who may be unionized (0.40% for non-unionizable participants).
6. BORROWINGS
Borrowings translated into Canadian dollars are shown below by currency and year of maturity. Monetary units by currency take currency swap contracts into account:
| | 2000 | 1999 | |||||||||||
|---|---|---|---|---|---|---|---|---|---|---|---|---|---|
| Currency(1) | In millions of monetary units | Total in Canadian equivalent | Weighted average interest rate % | In millions of monetary units | Total in Canadian equivalent | Weighted average interest rate % | |||||||
| | | (in millions of dollars) | | | (in millions of dollars) | (adjusted) | |||||||
| In Canadian dollars | 42 106 | 42 106 | (2) | 7.69 | 43 900 | 43 900 | 7.83 | ||||||
| In U.S. dollars | 8 788 | 12 774 | 7.36 | 5 728 | 8 647 | 7.44 | |||||||
| In Japanese yen | 465 527 | 6 592 | 4.30 | 511 457 | 6 521 | 4.17 | |||||||
| In Swiss francs | 1 583 | 1 384 | 4.13 | 2 522 | 2 578 | 4.13 | |||||||
| In Deutsche marks | 140 | 100 | 5.85 | 1 386 | 1 156 | 5.15 | |||||||
| In French francs | 1 918 | 407 | 6.55 | 2 898 | 720 | 6.85 | |||||||
| In pounds sterling | 198 | 483 | 9.73 | ||||||||||
| In Euro | 132 | 184 | 5.25 | (117 | ) | (190 | ) | 4.69 | |||||
| 63 547 | 6.92 | % | 63 815 | 6.96 | % | ||||||||
| Less: | |||||||||||||
| Sinking funds | 1 832 | 1 840 | |||||||||||
| Total | 61 715 | 61 975 | |||||||||||
- (1)
- Foreign monetary units are translated into their Canadian equivalent at the rates in effect on March 31.
- (2)
- The Government held $65 million worth of its securities as at March 31, 2000 ($365 million as at March 31, 1999).
Note: A summary by type of currency and borrowing is presented in Appendix 9.
21
| Maturing in | In Canadian dollars | In U.S. dollars | In Japanese yen | In Swiss francs | Other | Total 2000 | ||||||
|---|---|---|---|---|---|---|---|---|---|---|---|---|
| | | | | | | (in millions of dollars) | ||||||
| 2001 | 6 288 | 1 675 | 708 | 8 671 | ||||||||
| 2002 | 4 591 | 449 | 12 | 1 | 5 053 | |||||||
| 2003 | 3 201 | 242 | 72 | 3 515 | ||||||||
| 2004 | 3 656 | 156 | 3 812 | |||||||||
| 2005 | 4 013 | 145 | 298 | 1 | 4 457 | |||||||
| 21 749 | 2 511 | 708 | 538 | 2 | 25 508 | |||||||
| 2006-2010 | 10 199 | 2 704 | 1 801 | 846 | 588 | 16 138 | ||||||
| 2011-2015 | 1 669 | 145 | 2 195 | 4 009 | ||||||||
| 2016-2020 | 533 | 872 | 1 605 | 101 | 3 111 | |||||||
| 2021-2025 | 1 956 | 2 250 | 283 | 4 489 | ||||||||
| 2026-2030 | 4 084 | 3 638 | 7 722 | |||||||||
| 2030 and thereafter | 505 | 233 | 738 | |||||||||
| Total | 40 695 | 12 353 | 6 592 | 1 384 | 691 | 61 715 | ||||||
| Note: | This schedule takes into account $2 094 million in 2001 for treasury bills and was drawn up considering projected reimbursements of $522 million in 2001, $416 million in 2002, $333 million in 2003, $269 million in 2004, $203 million in 2005 and $738 million in 2006-2010 for bonds redeemable on demand. Moreover, the amounts in Canadian and U.S. currency take the sinking funds into account. |
7. FINANCIAL INSTRUMENTS
To meet the financial requirements arising from its operations for refunding maturing loans and for maintaining the desired level of liquid assets, the Government has provided itself with an annual financing and active debt-management program targeting Canadian and international financial markets.
Participation in these markets involves various types of risk. Therefore, the Government devises risk-management strategies by using the different derivative instruments at its disposal.
Foreign exchange risk
Foreign exchange risk is the risk that the cash flows needed to repay the interest and principal on loans in foreign currency will vary according to market fluctuations. To manage this risk, the Government uses derivative instruments such as currency swap contracts and foreign exchange forward contracts. The purpose of these contracts is to exchange cash flows from one currency to another.
The value of these contracts in currency, as indicated in the statement of financial position, is shown by type of currency in Appendices 9 to 11. These contracts mature at various dates until 2008.
Interest rate risk
Interest rate risk is the risk that debt service will vary unfavourably according to interest rate fluctuations. To reduce its exposure to interest-rate risk, the Government uses interest rate swap contracts. These contracts make it possible to exchange payments of interest at fixed rates for payments of interest at variable rates or vice versa on the basis of a reference par value. The Government manages debt by using short-term derivative instruments in an effort to control risk.
22
Credit risk
Credit risk is the risk that a counterparty will default on his contractual obligations, an event that could entail financial losses for the Government. To protect itself from such a risk within the scope of derivative instrument transactions, the Government has adopted a credit risk management policy that limits potential losses for each counterparty.
A credit limit is granted to each counterparty based mainly on their credit rating. When this limit is exceeded, a process is implemented to ensure that the amounts owed by the counterparty concerned fall within the limits set.
The Government deals with major financial institutions whose credit rating is equal to or higher than its own.
Liquidity risk
Liquidity risk is the risk that the Government will not be able to meet its financial commitments over the short term. To offset this risk, the Government has obtained lines of credit totalling C$1 165 million from various Canadian banking institutions.
In addition, the Government has concluded credit agreements for U.S.$3 500 million with a banking syndicate.
As at March 31, 2000, none of these credit lines or agreements had been used.
8. BORROWINGS TO FINANCE THE HEALTH AND SOCIAL SERVICES AND EDUCATION NETWORKS AND GOVERNMENT ENTERPRISES
Borrowings contracted by the Government for organizations in the health and social services and education networks and for Government enterprises are shown separately as liabilities. To offset these borrowings, advances to the health and social services and education networks and Government enterprises are granted on the same conditions as the borrowings and are recorded as financial assets.
Borrowings translated into Canadian dollars are shown below by currency and year of maturity. Monetary units by currency take currency swap contracts into account:
| | 2000 | 1999 | |||||||||||
|---|---|---|---|---|---|---|---|---|---|---|---|---|---|
| Currency(1) | In millions of monetary units | Total in Canadian equivalent | Weighted average interest rate % | In millions of monetary units | Total in Canadian equivalent | Weighted average interest rate % | |||||||
| | | (in millions of dollars) | | | (in millions of dollars) | (adjusted) | |||||||
| In Canadian dollars | 6 155 | 6 155 | 6.74% | 5 727 | 5 727 | 6.80% | |||||||
| Less: | |||||||||||||
| Sinking funds | 19 | 12 | |||||||||||
| Total | 6 136 | 5 715 | |||||||||||
- (1)
- Foreign monetary units are translated into their Canadian equivalent at the rates in effect on March 31.
Note: A summary by type of currency and borrowing is presented in Appendix 10.
23
| | 2000 | |
|---|---|---|
| Maturing in | In Canadian dollars | |
| | (in millions of dollars) | |
| 2001 | 1 131 | |
| 2002 | 137 | |
| 2003 | 1 152 | |
| 2004 | 891 | |
| 2005 | 86 | |
| 3 397 | ||
| 2006-2010 | 2 168 | |
| 2011-2015 | 187 | |
| 2016-2020 | 21 | |
| 2021-2025 | 363 | |
| Total | 6 136 | |
Note: This schedule takes into account an amount of $624 million, for treasury bills, maturing in 2001.
9. BORROWINGS TO FINANCE THE WORK OF MUNICIPAL BODIES
Under the water treatment program, the Government is committed, in accordance with an agreement with the municipalities and the Société québécoise d'assainissement des eaux (SQAE), to contributing to the financing of work costs by reimbursing, based on their date of maturity, the principal and interest on borrowings contracted by the SQAE.
Borrowings translated into Canadian dollars are shown below by currency and year of maturity. Monetary units by currency take currency swap contracts into account:
| | 2000 | 1999 | ||||||||||
|---|---|---|---|---|---|---|---|---|---|---|---|---|
| Currency(1) | In millions of monetary units | Total in Canadian equivalent | Weighted average interest rate % | In millions of monetary units | Total in Canadian equivalent | Weighted average interest rate % | ||||||
| | | (in millions of dollars) | | | (in millions of dollars) | | ||||||
| In Canadian dollars | 3 319 | 3 319 | 8.66% | 3 282 | 3 282 | 8.93% | ||||||
- (1)
- Foreign monetary units are translated into their Canadian equivalent at the rates in effect on March 31.
Note: A summary by type of currency and borrowing is presented in Appendix 11.
| | 2000 | |
|---|---|---|
| Maturing in | In Canadian dollars | |
| | (in millions of dollars) | |
| 2001 | 910 | |
| 2002 | 279 | |
| 2003 | 399 | |
| 2004 | 593 | |
| 2005 | 270 | |
| 2 451 | ||
| 2006-2010 | 818 | |
| 2011-2015 | 50 | |
| Total | 3 319 | |
Note: This schedule takes into account an amount of $246 million, for treasury bills, maturing in 2001.
24
10. ALLOWANCE FOR FINANCING THE FIXED ASSETS OF THE HEALTH AND SOCIAL SERVICES AND EDUCATION NETWORKS
Under the General and Vocational Colleges Act (R.S.Q., c. C-29), the Education Act (R.S.Q., c. I-13.3), the University Investments Act (R.S.Q., c. I-17), the Act respecting health services and social services (R.S.Q., c. S-4-2) and the Act respecting health services and social services for Cree Native persons (R.S.Q., c. S-5), the Government has created sinking funds for the purpose of repaying, out of the sums deposited by the Minister responsible, borrowings (principal and interest) contracted to finance the fixed assets of organizations in the health and social services and education networks.
The net assets of these sinking funds are as follows:
| | 2000 | 1999 | |||
|---|---|---|---|---|---|
| | (in millions of dollars) | ||||
| Sinking funds relating to borrowings by: | |||||
| General and vocational colleges in Québec | 214 | 197 | |||
| Québec school boards | 338 | 408 | |||
| Québec university establishments | 254 | 247 | |||
| Québec health and social services organizations | 304 | 331 | |||
| 1 110 | 1 183 | ||||
11. COMMITMENTS AND CONTINGENCIES
- A)
- Commitments for transfers to school boards and educational institutions, health and social services institutions, municipalities and municipal bodies, and other beneficiaries for reimbursement of the principal on borrowings contracted for capital expenditures and for other capital expenditures, as well as certain other commitments, are shown in summary form in Appendix 17. As at March 31, 2000, these commitments totalled $19 103 million ($18 460 million as at March 31, 1999: adjusted amount).
- B)
- Net guaranteed financial initiatives as at March 31, 2000 totalled $45 365 million ($45 687 million as at March 31, 1999) including $38 165 million as at March 31, 2000 ($39 128 million as at March 31, 1999) related to Hydro-Québec loan guarantees. These net guaranteed financial initiatives are shown in summary form in Appendix 17.
- C)
- The Government is faced with claims and lawsuits, pending or potential. Some pertain to land claims by Native groups and benefit claims by social aid recipients under 30 years of age, while others, involving $605 million ($642 million in 1999: adjusted amount), derive from breach of contract, personal injury or property damage and other similar causes. Since the outcome of these contingencies is uncertain, it is impossible to determine the potential loss the Government might incur.
25
12. MAJOR TRANSACTIONS BETWEEN GOVERNMENT ENTERPRISES AND ENTITIES INCLUDED IN THE GOVERNMENT'S REPORTING ENTITY
The most important transactions between the Government and its enterprises break down as follows:
| | 2000 | 1999 | |||
|---|---|---|---|---|---|
| | (in millions of dollars) | ||||
| | | (adjusted) | |||
| Revenue: | |||||
| Income and property taxes | 320 | 334 | |||
| Sales of goods and services | 373 | 380 | |||
| 693 | 714 | ||||
| Expenditure: | |||||
| Health and Social Services | 354 | 343 | |||
| Economy and Environment | 51 | 84 | |||
| Administration and Justice | 36 | 34 | |||
| 441 | 461 | ||||
13. COMPARATIVE FIGURES
Certain comparative figures for 1999 were reclassified for consistency with the presentation adopted in 2000.
26
GOVERNMENT DEPARTMENTS AND AGENCIES WHOSE FINANCIAL TRANSACTIONS
WERE CONDUCTED WITHIN THE CONSOLIDATED REVENUE FUND AND INCLUDED
IN THE GOVERNMENT'S REPORTING ENTITY
Affaires municipales et Métropole
Commission municipale du Québec
Conseil des aînés
Régie du logement
Agriculture, Pêcheries et Alimentation
Commission de protection du territoire agricole du Québec
Régie des assurances agricoles du Québec
Régie des marchés agricoles et alimentaires du Québec
Assemblée nationale
Conseil du trésor, Administration et Fonction publique
Commission de la fonction publique
Conseil exécutif
Conseil permanent de la jeunesse
Culture et Communications
Commission des biens culturels du Québec
Régie du cinéma
Éducation
Commission consultative de l'enseignement privé
Commission d'évaluation de l'enseignement collégial
Conseil supérieur de l'éducation
Emploi et Solidarité sociale
Environnement
Bureau d'audiences publiques sur l'environnement
Famille et Enfance
Conseil de la famille et de l'enfance
Faune et Parcs
Société de la faune et des parcs du Québec
Finances
Inspecteur général des institutions financières
Régie de l'assurance-dépôts du Québec
Industrie et Commerce
Justice
Comité de la rémunération des juges de la Cour du Québec et des cours municipales
Conseil de la justice administrative
Conseil de la magistrature
Conseil du statut de la femme
Tribunal des droits de la personne
27
APPENDIX 1 (cont'd)
GOVERNMENT DEPARTMENTS AND AGENCIES WHOSE FINANCIAL TRANSACTIONS
WERE CONDUCTED WITHIN THE CONSOLIDATED REVENUE FUND AND INCLUDED
IN THE GOVERNMENT'S REPORTING ENTITY
Personnes désignées par l'Assemblée nationale
Directeur général des élections — Commission de la représentation
Protecteur du citoyen
Vérificateur général
Recherche, Science et Technologie
Conseil de la science et de la technologie
Régions
Relations avec les citoyens et Immigration
Commission d'accès à l'information
Commission des droits de la personne et des droits de la jeunesse
Conseil des relations interculturelles
Office de la protection du consommateur
Relations internationales
Commission de protection de la langue française
Commission de toponymie
Conseil de la langue française
Office de la langue française
Ressources naturelles
Revenu
Santé et Services sociaux
Commissaire aux plaintes en matière de santé et de services sociaux
Conseil de la santé et du bien-être
Conseil médical du Québec
Office des personnes handicapées du Québec
Sécurité publique
Bureau du coroner
Comité de déontologie policière
Commissaire à la déontologie policière
Commission québécoise des libérations conditionnelles
Régie des alcools, des courses et des jeux
Tourisme
Transports
Commission des transports du Québec
Travail
Commission de l'équité salariale
Conseil consultatif du travail et de la main-d'oeuvre
Conseil des services essentiels
Régie du bâtiment du Québec
28
AGENCIES AND SPECIAL FUNDS WHOSE OWN REPORTING ENTITY
IS INCLUDED IN THE GOVERNMENT'S REPORTING ENTITY
AGENCIES
Agence de l'efficacité énergétique
Agence métropolitaine de transport(1)
Bibliothèque nationale du Québec
Bureau d'accréditation des pêcheurs et des aides-pêcheurs du Québec
Bureau des services financiers(1)
Comité consultatif de l'environnement Kativik
Commissaire de l'industrie de la construction
Commission de la capitale nationale du Québec
Commission de la qualité de l'environnement Kativik
Commission de reconnaissance des associations d'artistes et des associations de producteurs
Commission des lésions professionnelles
Commission des normes du travail
Commission des services juridiques
Commission des valeurs mobilières du Québec
Conseil des arts et des lettres du Québec
Corporation d'urgences-santé de la région de Montréal métropolitain
Fondation de la faune du Québec
Fonds d'aide aux recours collectifs
Fonds d'assurance-prêts agricoles et forestiers
Fonds de la recherche en santé du Québec
Fonds pour la formation de chercheurs et l'aide à la recherche(1)
Grande bibliothèque du Québec
Héma-Québec
Institut de la statistique du Québec
Institut de police du Québec(1)
Institut de tourisme et d'hôtellerie du Québec(1)
Institut national de santé publique du Québec
Investissement-Québec
Musée d'art contemporain de Montréal
Musée de la civilisation
Musée du Québec
Office de la sécurité du revenu des chasseurs et piégeurs cris
Office des professions du Québec
Parc technologique du Québec métropolitain
Régie de l'assurance maladie du Québec
Régie de l'énergie
Régie des installations olympiques
Sidbec
Société de développement des entreprises culturelles
Société de développement de la zone de commerce international de Montréal à Mirabel
Société de financement agricole
Société de la Place des Arts de Montréal(1)
Société de télédiffusion du Québec (Télé-Québec)
Société des traversiers du Québec
Société d'habitation du Québec(1)
Société d'investissement Jeunesse
Société du Centre des congrès de Québec
Société du Grand Théâtre de Québec
Société du Palais des congrès de Montréal
- (1)
- Entities whose year-end date does not correspond to March 31, 2000 and for which no data were available on that date.
29
APPENDIX 2 (cont'd)
AGENCIES AND SPECIAL FUNDS WHOSE OWN REPORTING ENTITY
IS INCLUDED IN THE GOVERNMENT'S REPORTING ENTITY
AGENCIES (cont'd)
Société du parc industriel et portuaire de Bécancour
Société du parc industriel et portuaire Québec-Sud
Société immobilière du Québec
Société nationale de l'amiante
Société québécoise d'assainissement des eaux
Société québécoise de récupération et de recyclage
Société québécoise d'information juridique
Tribunal administratif du Québec
SPECIAL FUNDS
Assistance Fund for Independent Community Action
Assistance Fund for Victims of Crime
Civil Status Fund
Collection Fund
Financial Assistance Fund for Certain Disaster Areas
Financing Fund
Fonds du Centre financier de Montréal
Forestry Fund
Fund to Combat Poverty through Reintegration into the Labour Market
Fund for the Contributions of Motorists to Public Transit
Fund for the Management of Québec Immovables on Foreign Soil
Fund for the Sale of Goods and Services of the Ministère des Ressources naturelles
Government Information Fund
Government Services Fund
Health Services Fund
Horse-Racing Industry Fund
Ice Storm Fund
Information Technology Fund of the Conseil du trésor
Information Technology Fund of the Ministère de la Solidarité sociale
Information Technology Fund of the Ministère des Finances
Information Technology Fund of the Ministère du Revenu
Labour Market Development Fund
Land and Geographic Information Fund
Police Services Fund
Prescription Drug Insurance Fund
Québec Cadastre Reform Fund
Québec Youth Fund
Regional Development Fund
Register Fund of the Ministère de la Justice
Road Network Preservation and Improvement Fund
Rolling Stock Management Fund
Sinking Fund relating to Borrowings by General and Vocational Colleges in Québec
Sinking Fund relating to Borrowings by Québec School Boards
Sinking Fund relating to Borrowings by Québec University Establishments
Sinking Fund relating to Borrowings by Québec Health and Social Services Agencies
Special Local Activities Financing Fund
Special Olympic Fund
Support Payments Fund *
Tourism Partnership Fund
- *
- This fund also conducts transactions of a fiduciary nature that are not included in the Government's reporting entity.
30
ENTERPRISES INCLUDED IN THE GOVERNMENT'S REPORTING ENTITY
Centre de recherche industrielle du Québec
Commission de la santé et de la sécurité du travail
Corporation d'hébergement du Québec
Financement-Québec
Fonds d'indemnisation du courtage immobilier
Hydro-Québec *
Immobilière SHQ
Loto-Québec
Régie de l'assurance-dépôts du Québec
Société de développement de la Baie James
Société de l'assurance automobile du Québec
Société des alcools du Québec
Société des établissements de plein air du Québec
Société générale de financement du Québec
Société Innovatech du Grand Montréal
Société Innovatech du Sud du Québec
Société Innovatech Québec et Chaudière-Appalaches
Société Innovatech Régions ressources
- *
- This enterprise also conducts transactions of a fiduciary nature that are not included in the Government's reporting entity.
31
AGENCIES AND FUNDS WHICH CONDUCT TRANSACTIONS OF A FIDUCIARY NATURE THAT ARE
NOT INCLUDED IN THE GOVERNMENT'S REPORTING ENTITY
Caisse de dépôt et placement du Québec
Comité Centraide — public sector
Commission administrative des régimes de retraite et d'assurances
Commission de la construction du Québec
Curateur public (Le)
Fonds central pour le bénéfice des personnes incarcérées
Fonds d'assurance-récolte
Fonds d'assurance-stabilisation des revenus agricoles
Fonds de contrats à terme
Fonds d'indemnisation des services financiers
Fonds du régime tripartite d'assurance revenu brut à l'égard des récoltes
Fonds national de formation de la main-d'oeuvre
Guarantee Insurance Fund administered by the Régie des marchés agricoles et alimentaires du Québec
Hydro-Québec — Pension Plan
Régie des rentes du Québec
Support Payments Fund (fiduciary section)
Travel Agents' Security Funds
Trust Funds
32
BREAKDOWN OF REVENUE
FISCAL YEAR ENDED MARCH 31, 2000
(in millions of dollars)
| | 2000 | 1999 | |||
|---|---|---|---|---|---|
| | | (Notes 13) | |||
| Income and property taxes | |||||
| Personal income tax | 15 944 | 15 281 | |||
| Contributions to the Health Services Fund | 4 429 | 4 260 | |||
| Corporate taxes | 3 680 | 3 464 | |||
| 24 053 | 23 005 | ||||
Consumption taxes | |||||
| Sales | 6 780 | 6 444 | |||
| Fuel | 1 605 | 1 604 | |||
| Tobacco | 555 | 523 | |||
| Pari-mutuel | 14 | 14 | |||
| 8 954 | 8 585 | ||||
Duties and permits | |||||
| Motor vehicles | 729 | 724 | |||
| Alcoholic beverages | 139 | 135 | |||
| Natural resources | 369 | 257 | |||
| Other | 253 | 246 | |||
| 1 490 | 1 362 | ||||
Miscellaneous | |||||
| Sales of goods and services | 1 734 | 1 644 | |||
| Interest | 426 | 411 | |||
| Fines, forfeitures and recoveries | 327 | 344 | |||
| 2 487 | 2 399 | ||||
Revenue from Government enterprises | |||||
| Commission de la santé et de la sécurité du travail | 787 | 631 | |||
| Société des alcools du Québec | 442 | 408 | |||
| Loto-Québec | 1 289 | 1 167 | |||
| Hydro-Québec | 1 090 | 754 | |||
| Other | 335 | 171 | |||
| 3 943 | 3 131 | ||||
| Total own-source revenue | 40 927 | 38 482 | |||
Government of Canada transfers | |||||
| Equalization | 4 387 | 5 385 | |||
| Canada Health and Social Transfer | 1 120 | 1 697 | |||
| Other programs | 845 | 1 008 | |||
| Total Government of Canada transfers | 6 352 | 8 090 | |||
| Total revenue | 47 279 | 46 572 | |||
33
BREAKDOWN OF EXPENDITURE
FISCAL YEAR ENDED MARCH 31, 2000
(in millions of dollars)
| | 2000 | 1999 | |||
|---|---|---|---|---|---|
| | | (Note 13) | |||
| BY SUPERCATEGORY AND CATEGORY | |||||
| Transfer | |||||
| Remuneration | 17 279 | 16 879 | |||
| Operating | 3 171 | 2 984 | |||
| Capital | 1 416 | 1 045 | |||
| Interest | 1 497 | 1 453 | |||
| Support | 9 925 | 10 304 | |||
| 33 288 | 32 665 | ||||
Remuneration | 3 443 | 3 293 | |||
Operating(1) | 2 685 | 2 674 | |||
Doubtful accounts and other allowances | 461 | 627 | |||
| Sub-total | 39 877 | 39 259 | |||
Debt service | 7 372 | 7 187 | |||
| Total expenditure | 47 249 | 46 446 | |||
- (1)
- Including $709 million in 1999-2000 ($664 million in 1998-1999) for the depreciation of fixed assets.
34
BANK OVERDRAFT
AS AT MARCH 31, 2000
(in millions of dollars)
| | | 2000 | 1999 | |||
|---|---|---|---|---|---|---|
| Outstanding cheques | 1 080 | 608 | ||||
Short-term borrowings(1) | 1 533 | 1 541 | ||||
| 2 613 | 2 149 | |||||
| Cash in bank | 177 | 204 | ||||
Cash and notes on hand and outstanding deposits | 154 | 328 | ||||
| 331 | 532 | |||||
| 2 282 | 1 617 | |||||
| (1) | Breakdown of short-term borrowings. | |||||
| | | 2000 | 1999 | |||
| Banker's acceptances and borrowings | 163 | 184 | ||||
U.S. commercial paper | 1 318 | 1 242 | ||||
Notes at par | 45 | 110 | ||||
Line of credit | 7 | 5 | ||||
| 1 533 | 1 541 | |||||
| Short-term borrowings mature at various dates until 2001 and bear interest at rates of 5.11% to 6.10%. | ||||||
35
ACCOUNTS PAYABLE AND ACCRUED EXPENSES
AS AT MARCH 31, 2000
(in millions of dollars)
| | | 2000 | | 1999 | |||||
|---|---|---|---|---|---|---|---|---|---|
| | | | | (Note 2) | |||||
| Remuneration | 576 | 302 | |||||||
Suppliers | 1 061 | 1 414 | |||||||
Advances from trust funds | 359 | 249 | |||||||
Clearing account for collected taxes: | |||||||||
| Municipal taxation | 374 | 382 | |||||||
| Other | 89 | 463 | 114 | 496 | |||||
| Specific purpose accounts(1) | 24 | 32 | |||||||
| Transfers to: | |||||||||
| School boards and educational institutions | 1 359 | 924 | |||||||
| Health and social services institutions | 669 | 431 | |||||||
| Municipalities and municipal bodies | 124 | 134 | |||||||
| Other | 967 | 3 119 | 1 435 | 2 924 | |||||
| Accrued interest on borrowings | 1 629 | 1 573 | |||||||
Sick leave and vacations(2) | 884 | 825 | |||||||
Allowance for losses on guaranteed financial initiatives(2) | 814 | 883 | |||||||
Survivor's pension plan(2) | 329 | 314 | |||||||
| 9 258 | 9 012 | ||||||||
- (1)
- Summary of specific purpose accounts (see table on next page).
- (2)
- Includes mainly amounts payable over the long-term.
36
APPENDIX 8
ACCOUNTS PAYABLE AND ACCRUED EXPENSES
AS AT MARCH 31, 2000
(in millions of dollars)
- (1)
- Summary of specific purpose accounts:
| | Receipts and other credits | |||||||||||
|---|---|---|---|---|---|---|---|---|---|---|---|---|
| | Balance as at March 31, 1999 | Payments and other debits | Government of Canada transfers — Other programs | Sales of goods and services | Surplus for the year | Balance as at March 31, 2000 | ||||||
| SALES OF GOODS AND SERVICES | ||||||||||||
| Account for administering the Goods and Services Tax | 102 | 102 | ||||||||||
| Account for financing the horse-racing industry recovery plan | 4 | 13 | 11 | (2 | ) | 2 | ||||||
| Other | 9 | 24 | 23 | (1 | ) | 8 | ||||||
GOVERNMENT OF CANADA TRANSFERS | ||||||||||||
| Account for financing the Waskaganish Cree community access road | 16 | 12 | 1 | (11 | ) | 5 | ||||||
| Account for the Canada-Québec strategic road improvement | 16 | 16 | �� | |||||||||
| Account for infrastructure work | 15 | 15 | ||||||||||
| Account for financing millennium scholarships | 64 | 64 | ||||||||||
| Account for the welcoming and settlement of Kosovo refugees | 12 | 12 | ||||||||||
| Ice storm account | 60 | 60 | ||||||||||
| Other | 3 | 21 | 27 | 6 | 9 | |||||||
| 195 | 136 | |||||||||||
| 32 | 339 | 331 | (8 | ) | 24 | |||||||
37
BORROWINGS
AS AT MARCH 31, 2000
(in millions of dollars)
| | 2000 | 1999 | |||||||||||||||
|---|---|---|---|---|---|---|---|---|---|---|---|---|---|---|---|---|---|
| Summary by type of currency and borrowing | In millions of monetary units | | Total in Canadian equivalent | Weighted average interest rate % | In millions of monetary units | | Total in Canadian equivalent | Weighted average interest rate % | |||||||||
| | | | | | | | | (adjusted) | |||||||||
| IN CANADIAN DOLLARS | |||||||||||||||||
| Treasury bills | 2 094 | 2 094 | 1 972 | 1 972 | |||||||||||||
| Savings products | 2 591 | 2 591 | 2 500 | 2 500 | |||||||||||||
| Bonds and notes | 23 600 | 23 600 | 21 869 | 21 869 | |||||||||||||
| Medium-term notes on the Canadian market | 2 213 | 2 213 | 2 263 | 2 263 | |||||||||||||
| Medium-term notes on the U.S. market | 65 | 65 | 65 | 65 | |||||||||||||
| Medium-term notes on the European market | 30 | 30 | 30 | 30 | |||||||||||||
| Commitments under capital leases | 225 | 225 | 246 | 246 | |||||||||||||
| Currency swap contracts | 11 288 | 11 288 | 14 955 | 14 955 | |||||||||||||
| 42 106 | C$ | 42 106 | 7.69% | 43 900 | C$ | 43 900 | 7.83% | ||||||||||
| IN U.S. DOLLARS | |||||||||||||||||
| Bonds and notes | 9 458 | 13 747 | 8 861 | 13 373 | |||||||||||||
| Medium-term notes on the Canadian market | 13 | 19 | 13 | 20 | |||||||||||||
| Medium-term notes on the U.S. market | 943 | 1 373 | 1 008 | 1 522 | |||||||||||||
| Medium-term notes on the European market | 1 077 | 1 565 | 1 311 | 1 980 | |||||||||||||
| Currency swap contracts | (2 703 | ) | (3 930 | ) | (5 465 | ) | (8 248 | ) | |||||||||
| 8 788 | U.S.$ | 12 774 | 7.36% | 5 728 | U.S.$ | 8 647 | 7.44% | ||||||||||
| IN JAPANESE YEN | |||||||||||||||||
| Bonds and notes | 278 337 | 3 941 | 279 179 | 3 560 | |||||||||||||
| Medium-term notes on the U.S. market | 3 391 | 48 | 3 391 | 43 | |||||||||||||
| Medium-term notes on the European market | 360 706 | 5 107 | 419 420 | 5 347 | |||||||||||||
| Currency swap contracts | (176 907 | ) | (2 504 | ) | (190 533 | ) | (2 429 | ) | |||||||||
| 465 527 | ¥ | 6 592 | 4.30% | 511 457 | ¥ | 6 521 | 4.17% | ||||||||||
| IN SWISS FRANCS | |||||||||||||||||
| Bonds and notes | 713 | 623 | 714 | 730 | |||||||||||||
| Currency swap contracts | 870 | 761 | 1 808 | 1 848 | |||||||||||||
| 1 583 | Sfr | 1 384 | 4.13% | 2 522 | Sfr | 2 578 | 4.13% | ||||||||||
| IN DEUTSCHE MARKS | �� | ||||||||||||||||
| Bonds and notes | 1 635 | 1 163 | 3 882 | 3 238 | |||||||||||||
| Medium-term notes on the European market | 477 | 340 | 477 | 398 | |||||||||||||
| Currency swap contracts | (1 972 | ) | (1 403 | ) | (2 973 | ) | (2 480 | ) | |||||||||
| 140 | DM | 100 | 5.85% | 1 386 | DM | 1 156 | 5.15% | ||||||||||
| AMOUNTS CARRIED FORWARD | 62 956 | 62 802 | |||||||||||||||
38
APPENDIX 9
BORROWINGS (cont'd)
AS AT MARCH 31, 2000
(in millions of dollars)
| | 2000 | 1999 | |||||||||||||||
|---|---|---|---|---|---|---|---|---|---|---|---|---|---|---|---|---|---|
| Summary by type of currency and borrowing | In millions of monetary units | | Total in Canadian equivalent | Weighted average interest rate % | In millions of monetary units | | Total in Canadian equivalent | Weighted average interest rate % | |||||||||
| | | | | | | | | (adjusted) | |||||||||
| AMOUNTS BROUGHT FORWARD | 62 956 | 62 802 | |||||||||||||||
| IN FRENCH FRANCS | |||||||||||||||||
| Bonds and notes | 5 807 | 1 232 | 7 806 | 1 941 | |||||||||||||
| Medium-term notes on the European market | 2 812 | 596 | 4 794 | 1 192 | |||||||||||||
| Currency swap contracts | (6 701 | ) | (1 421 | ) | (9 702 | ) | (2 413 | ) | |||||||||
| 1 918 | Ffr | 407 | 6.55% | 2 898 | Ffr | 720 | 6.85% | ||||||||||
| IN POUNDS STERLING | |||||||||||||||||
| Bonds and notes | 198 | 459 | 198 | 483 | |||||||||||||
| Currency swap contracts | (198 | ) | (459 | ) | |||||||||||||
| — | £ | — | 198 | £ | 483 | 9.73% | |||||||||||
| IN DUTCH GUILDERS | |||||||||||||||||
| Bonds and notes | 350 | 221 | 350 | 259 | |||||||||||||
| Currency swap contracts | (350 | ) | (221 | ) | (350 | ) | (259 | ) | |||||||||
| — | DFl | — | — | DFl | — | ||||||||||||
| IN AUSTRALIAN DOLLARS | |||||||||||||||||
| Bonds and notes | 236 | 208 | 286 | 274 | |||||||||||||
| Currency swap contracts | (236 | ) | (208 | ) | (286 | ) | (274 | ) | |||||||||
| — | A$ | — | — | A$ | — | ||||||||||||
| IN LUXEMBOURG FRANCS | |||||||||||||||||
| Bonds and notes | 2 040 | 70 | 2 048 | 83 | |||||||||||||
| Currency swap contracts | (2 040 | ) | (70 | ) | (2 048 | ) | (83 | ) | |||||||||
| — | Lfr | — | — | Lfr | — | ||||||||||||
| IN SWEDISH KRONOR | |||||||||||||||||
| Bonds and notes | 507 | 85 | 509 | 94 | |||||||||||||
| Currency swap contracts | (507 | ) | (85 | ) | (509 | ) | (94 | ) | |||||||||
| — | Skr | — | — | Skr | — | ||||||||||||
| IN EURO | |||||||||||||||||
| Bonds and notes | 840 | 1 168 | 51 | 83 | |||||||||||||
| Medium-term notes on the European market | 324 | 451 | 22 | 36 | |||||||||||||
| Currency swap contracts | (1 032 | ) | (1 435 | ) | (190 | ) | (309 | ) | |||||||||
| 132 | € | 184 | 5.25% | (117 | )€ | (190 | ) | 4.69% | |||||||||
| IN SPANISH PESETAS | |||||||||||||||||
| Bonds and notes | 10 042 | 84 | 10 059 | 99 | |||||||||||||
| Currency swap contracts | (10 042 | ) | (84 | ) | (10 059 | ) | (99 | ) | |||||||||
| — | SPP | — | — | SPP | — | ||||||||||||
| 63 547 | 6.92% | 63 815 | 6.96% | ||||||||||||||
| Less: | |||||||||||||||||
| Sinking fund | 1 832 | 1 840 | |||||||||||||||
| 61 715 | 61 975 | ||||||||||||||||
39
APPENDIX 9
BORROWINGS (cont'd)
AS AT MARCH 31, 2000
(in millions of dollars)
SINKING FUND
CHANGES IN FUND BALANCE
AS AT MARCH 31, 2000
| | 2000 | 1999 | |||||
|---|---|---|---|---|---|---|---|
| Opening balance | 1 852 | 1 712 | |||||
| Plus: | |||||||
| Payment from the Consolidated Revenue Fund | 135 | 113 | |||||
| Net revenue | 15 | 110 | |||||
| Gains (losses) on interest rate swap contracts | (7 | ) | 7 | ||||
| 1 995 | 1 942 | ||||||
| Less: | |||||||
| Funds used to repay specific borrowings | 144 | 90 | |||||
| Closing balance | 1 851 | (1) | 1 852 | (1) | |||
- (1)
- Includes $19 million ($12 million in 1999) from the Sinking Fund Relating to Government Borrowings contracted to finance the health and social services and education networks and Government enterprises.
SINKING FUND
STATEMENT OF FINANCIAL POSITION
AS AT MARCH 31, 2000
| | 2000 | 1999 | ||||
|---|---|---|---|---|---|---|
| | | (Note 13) | ||||
| Investments | ||||||
| Treasury bills | 68 | 68 | ||||
| Deposit certificates | 141 | |||||
| Bonds and notes | 1 759 | 1 660 | ||||
| Borrowings by the Gouvernement du Québec | 29 | |||||
| 1 827 | 1 898 | |||||
| Other assets | ||||||
| Cash on hand | 4 | 9 | ||||
| Accounts receivable and accrued interest | 26 | 39 | ||||
| Deferred losses on forward exchange contracts | 8 | 6 | ||||
| 38 | 54 | |||||
| Liabilities | ||||||
| Accounts payable | 7 | |||||
| Unrealized foreign exchange gain | 8 | |||||
| Amounts on deposit — Securities loans | 7 | 92 | ||||
| 14 | 100 | |||||
| Fund balance | 1 851 | (1) | 1 852 | (1) | ||
- (1)
- Includes $19 million ($12 million in 1999) from the Sinking Fund Relating to Government Borrowings contracted to finance the health and social services and education networks and Government enterprises.
40
BORROWINGS TO FINANCE THE HEALTH AND SOCIAL SERVICES AND
EDUCATION NETWORKS AND GOVERNMENT ENTERPRISES(1)
AS AT MARCH 31, 2000
(in millions of dollars)
| | 2000 | 1999 | |||||||||||||
|---|---|---|---|---|---|---|---|---|---|---|---|---|---|---|---|
| Summary by type of currency and borrowing | In millions of monetary units | | Total in Canadian equivalent | Weighted average interest rate % | In millions of monetary units | | Total in Canadian equivalent | Weighted average interest rate % | |||||||
| | | | | | | | | (adjusted) | |||||||
| IN CANADIAN DOLLARS | |||||||||||||||
| Treasury bills | 624 | 624 | 883 | 883 | |||||||||||
| Bonds and notes | 4 915 | 4 915 | 3 973 | 3 973 | |||||||||||
| Medium-term notes on the Canadian market | 98 | 98 | 104 | 104 | |||||||||||
| Medium-term notes on the U.S. market | 17 | 17 | 17 | 17 | |||||||||||
| Currency swap contracts | 501 | 501 | 750 | 750 | |||||||||||
| 6 155 | C$ | 6 155 | 6.74% | 5 727 | C$ | 5 727 | 6.80% | ||||||||
| IN U.S. DOLLARS | |||||||||||||||
| Bonds and notes | 3 | 4 | 3 | 4 | |||||||||||
| Medium-term notes on the U.S. market | 217 | 315 | 255 | 385 | |||||||||||
| Medium-term notes on the European market | 79 | 115 | 79 | 119 | |||||||||||
| Currency swap contracts | (299 | ) | (434 | ) | (337 | ) | (508 | ) | |||||||
| — | U.S.$ | — | — | U.S.$ | — | ||||||||||
| IN JAPANESE YEN | |||||||||||||||
| Bonds and notes | 5 000 | 71 | 5 000 | 64 | |||||||||||
| Medium-term notes on the European market | 3 514 | 50 | 3 518 | 45 | |||||||||||
| Currency swap contracts | (8 514 | ) | (121 | ) | (8 518 | ) | (109 | ) | |||||||
| — | ¥ | — | — | ¥ | — | ||||||||||
| 6 155 | 6.74% | 5 727 | 6.80% | ||||||||||||
| Less: | |||||||||||||||
| Sinking fund | 19 | 12 | |||||||||||||
| 6 136 | 5 715 | ||||||||||||||
- (1)
- Advances to the health and social services and education networks and Government enterprises are granted on the same conditions as these borrowings.
41
BORROWINGS TO FINANCE THE WORK OF MUNICIPAL BODIES
AS AT MARCH 31, 2000
(in millions of dollars)
| | 2000 | 1999 | |||||||||||||||
|---|---|---|---|---|---|---|---|---|---|---|---|---|---|---|---|---|---|
| Summary by type of currency and borrowing | In millions of monetary units | | Total in Canadian equivalent | Weighted average interest rate % | In millions of monetary units | | Total in Canadian equivalent | Weighted average interest rate % | |||||||||
| IN CANADIAN DOLLARS | |||||||||||||||||
| Treasury bills | 246 | 246 | 114 | 114 | |||||||||||||
| Bonds and notes | 1 887 | 1 887 | 1 982 | 1 982 | |||||||||||||
| Currency swap contracts | 1 186 | 1 186 | 1 186 | 1 186 | |||||||||||||
| 3 319 | C$ | 3 319 | 8.66% | 3 282 | C$ | 3 282 | 8.93% | ||||||||||
| IN U.S. DOLLARS | |||||||||||||||||
| Bonds and notes | 122 | 177 | 122 | 183 | |||||||||||||
| Medium-term notes on the U.S. market | 100 | 145 | 100 | 151 | |||||||||||||
| Currency swap contracts | (222 | ) | (322 | ) | (222 | ) | (334 | ) | |||||||||
| — | U.S.$ | — | — | U.S.$ | — | ||||||||||||
| IN JAPANESE YEN | |||||||||||||||||
| Bonds and notes | 12 000 | 170 | 12 000 | 153 | |||||||||||||
| Currency swap contracts | (12 000 | ) | (170 | ) | (12 000 | ) | (153 | ) | |||||||||
| — | ¥ | — | — | ¥ | — | ||||||||||||
| IN SWISS FRANCS | |||||||||||||||||
| Bonds and notes | 125 | 109 | 125 | 128 | |||||||||||||
| Currency swap contracts | (125 | ) | (109 | ) | (125 | ) | (128 | ) | |||||||||
| — | Sfr | — | — | Sfr | — | ||||||||||||
| IN DEUTSCHE MARKS | |||||||||||||||||
| Bonds and notes | 411 | 293 | 411 | 343 | |||||||||||||
| Medium-term notes on the European market | 99 | 71 | 99 | 83 | |||||||||||||
| Currency swap contracts | (510 | ) | (364 | ) | (510 | ) | (426 | ) | |||||||||
| — | DM | — | — | DM | — | ||||||||||||
| IN LUXEMBOURG FRANCS | |||||||||||||||||
| Bonds and notes | 4 000 | 138 | 4 000 | 162 | |||||||||||||
| Currency swap contracts | (4 000 | ) | (138 | ) | (4 000 | ) | (162 | ) | |||||||||
| — | Lfr | — | — | Lfr | — | ||||||||||||
| 3 319 | 8.66% | 3 282 | 8.93% | ||||||||||||||
42
SHORT-TERM INVESTMENTS
AS AT MARCH 31, 2000
(in millions of dollars)
| | 2000 | 1999 | ||
|---|---|---|---|---|
| Treasury bills | 102 | 532 | ||
| Deposit certificates | 532 | 493 | ||
| Banker's acceptances | 46 | 1 276 | ||
| Notes | 16 | 601 | ||
| Other | 7 | 28 | ||
| 703 | 2 930 | |||
The return on short-term investments ranges from 5.14% to 5.85% and such investments mature at various dates until 2001.
43
ACCOUNTS RECEIVABLE
AS AT MARCH 31, 2000
(in millions of dollars)
| | 2000 | 1999 | ||||
|---|---|---|---|---|---|---|
| Accounts receivable | ||||||
| Income and property taxes(1) | 2 535 | 2 334 | ||||
| Consumption taxes(1) | 1 519 | 1 483 | ||||
| Duties and permits(1) | 157 | 116 | ||||
| Miscellaneous revenue | 1 274 | 1 244 | ||||
| Revenue from Government enterprises | 545 | 613 | ||||
| Government of Canada transfers | 1 241 | 840 | ||||
| Specific purpose accounts: | ||||||
| Sales of goods and services | 18 | 18 | ||||
| Government of Canada transfers | 59 | 64 | ||||
| Expenditure and other | 578 | 453 | ||||
| 7 926 | 7 165 | |||||
| Less: Allowance for doubtful accounts | 1 029 | 1 079 | ||||
| Plus: Accrued interest on investments | 7 | 17 | ||||
| 6 904 | 6 103 | |||||
- (1)
- Including, for agents and assignees, $900 million for income and property taxes ($671 million in 1999), $1 045 million for consumption taxes ($1 032 million in 1999) and $101 million for duties and permits ($94 million in 1999).
44
INVESTMENT IN GOVERNMENT ENTERPRISES
AS AT MARCH 31, 2000
(in millions of dollars)
INVESTMENT IN GOVERNMENT ENTERPRISES
| | | | 2000 | 1999 | |||||
|---|---|---|---|---|---|---|---|---|---|
| | Loans and advances | Equity value | Investment in Government enterprises | Investment in Government enterprises | |||||
| Centre de recherche industrielle du Québec | 5 | 23 | 28 | 25 | |||||
| Commission de la santé et de la sécurité du travail(2) | (414 | ) | (414 | ) | (1 201 | ) | |||
| Corporation d'hébergement du Québec | 408 | 408 | 336 | ||||||
| Financement-Québec | 14 | 14 | 10 | ||||||
| Fonds d'indemnisation du courtage immobilier(3) | 3 | 3 | 3 | ||||||
| Hydro-Québec(2) | 7 | 14 256 | 14 263 | 13 626 | |||||
| Immobilière SHQ(3) | 14 | 14 | 14 | ||||||
| Loto-Québec | 133 | 133 | 94 | ||||||
| Régie de l'assurance-dépôts du Québec(3) | 181 | 181 | 162 | ||||||
| Société de développement de la Baie James(2) | 3 | 3 | 3 | ||||||
| Société de l'assurance automobile du Québec(2) | 572 | 572 | 441 | ||||||
| Société des alcools du Québec | 47 | 47 | 46 | ||||||
| Société des établissements de plein air du Québec | 17 | 17 | 38 | ||||||
| Société générale de financement du Québec(2) | 1 532 | 1 532 | 1 265 | ||||||
| Société Innovatech du Grand Montréal | 241 | 241 | 199 | ||||||
| Société Innovatech du Sud du Québec | 15 | 15 | 13 | ||||||
| Société Innovatech Québec et Chaudière-Appalaches | 58 | 58 | 42 | ||||||
| Société Innovatech Régions ressources | 8 | 8 | |||||||
| Total | 12 | 17 111 | 17 123 | 15 116 | |||||
- (1)
- These enterprises are wholly-owned by the Gouvernement du Québec.
- (2)
- Equity value was determined on the basis of audited financial statements as at December 31, 1999, and adjusted according to unaudited interim results as at March 31, 2000.
- (3)
- Equity value was determined on the basis of audited financial statements as at December 31, 1999.
MATURITY OF LOANS AND ADVANCES
Loans and advances to the Centre recherche industrielle du Québec mature in 2000-2001, and those of Hydro-Québec have no fixed maturity date.
45
APPENDIX 14
INVESTMENT IN GOVERNMENT ENTERPRISES (cont'd)
AS AT MARCH 31, 2000
(in millions of dollars)
SUMMARY OF THE FINANCIAL STATEMENTS OF GOVERNMENT ENTERPRISES
2000 | 1999 | ||||||||||||||
|---|---|---|---|---|---|---|---|---|---|---|---|---|---|---|---|
| | Revenue | Expenditure | Net income or (net loss) | Liabilities | Assets | Net equity | Net equity | ||||||||
| Centre de recherche industrielle du Québec | 25 | 34 | (9 | ) | 17 | 40 | 23 | 25 | |||||||
| Commission de la santé et de la sécurité du travail(1) | 2 575 | 1 840 | 735 | 8 252 | 7 810 | (442 | ) | (1 177 | ) | ||||||
| Corporation d'hébergement du Québec | 221 | 221 | 3 950 | 4 358 | 408 | 336 | |||||||||
| Financement-Québec | 4 | 4 | 3 834 | 3 848 | 14 | 10 | |||||||||
| Fonds d'indemnisation du courtage immobilier(1) | 3 | 3 | 3 | ||||||||||||
| Hydro-Québec(2) | 9 808 | 8 726 | 1 082 | 43 825 | 58 241 | 14 416 | 13 787 | ||||||||
| Immobilière SHQ(1) | 236 | 236 | 2 476 | 2 490 | 14 | 14 | |||||||||
| Loto-Québec | 3 444 | 2 118 | 1 326 | 510 | 643 | 133 | 94 | ||||||||
| Régie de l'assurance-dépôts du Québec(1) | 20 | 1 | 19 | 1 | 182 | 181 | 162 | ||||||||
| Société de développement de la Baie James(2) | 18 | 18 | 6 | 9 | 3 | 3 | |||||||||
| Société de l'assurance automobile du Québec(2) | 1 337 | 1 206 | 131 | 5 452 | 6 024 | 572 | 441 | ||||||||
| Société des alcools du Québec | 1 412 | 970 | 442 | 325 | 372 | 47 | 46 | ||||||||
| Société des établissements de plein air du Québec | 68 | 57 | 11 | 56 | 65 | 9 | (3 | ) | |||||||
| Société générale de financement du Québec(2) | 958 | 819 | 139 | 406 | 1 938 | 1 532 | 1 251 | ||||||||
| Société Innovatech du Sud du Québec | 1 | 3 | (2 | ) | 15 | 15 | 13 | ||||||||
| Amounts carried forward | 20 127 | 16 249 | 3 878 | 69 110 | 86 038 | 16 928 | 15 005 | ||||||||
46
APPENDIX 14
INVESTMENT IN GOVERNMENT ENTERPRISES (cont'd)
AS AT MARCH 31, 2000
(in millions of dollars)
SUMMARY OF THE FINANCIAL STATEMENTS OF GOVERNMENT ENTERPRISES
2000 | 1999 | ||||||||||||||
|---|---|---|---|---|---|---|---|---|---|---|---|---|---|---|---|
| | Revenue | Expenditure | Net income or (net loss) | Liabilities | Assets | Net equity | Net equity | ||||||||
| Amounts brought forward | 20 127 | 16 249 | 3 878 | 69 110 | 86 038 | 16 928 | 15 005 | ||||||||
| Société Innovatech du Grand Montréal | 16 | 10 | 6 | 1 | 242 | 241 | 199 | ||||||||
| Société Innovatech Québec et Chaudière-Appalaches | 12 | 6 | 6 | 58 | 58 | 42 | |||||||||
| Société Innovatech Régions ressources | 1 | 1 | 8 | 8 | |||||||||||
| 20 156 | 16 266 | 3 890 | 69 111 | 86 346 | 17 235 | 15 246 | |||||||||
| Adjustments: (3) | 53 | (124 | ) | (166 | ) | ||||||||||
| 20 156 | 16 266 | 3 943 | 69 111 | 86 346 | 17 111 | 15 080 | |||||||||
- (1)
- These results were derived from audited financial statements as at December 31, 1999. The net assets of the Commission de la santé et de la sécurité du travail (CSST), including assessments collected from employers, may not be used for purposes other than those relating to its mandates. Adjustments take into account unaudited interim results as at March 31, 2000.
- (2)
- These results were derived from audited financial statements as at December 31, 1999, and adjusted according to unaudited interim results as at March 31, 2000.
- (3)
- These adjustments may be attributed mainly to the use of results derived from financial statements presented on different dates and to the application of different accounting policies. In addition, certain items recorded as net equity were charged to results for a value of $11 million.
47
APPENDIX 14
INVESTMENT IN GOVERNMENT ENTERPRISES (cont'd)
AS AT MARCH 31, 2000
COMMITMENTS OF GOVERNMENT ENTERPRISES
Hydro-Québec
Hydro-Québec has provided for a capital investment of $2 225 million for 2000.
Guarantees issued by Hydro-Québec to cover all or part of a loss stemming from a guarantee issued by a third party and for which the Government did not act as a guarantor totalled $672 million as at March 31, 2000. The guarantees were issued mainly for Hydro-Québec subsidiaries.
CONTINGENCIES OF GOVERNMENT ENTERPRISES
Commission de la santé et de la sécurité du travail
On May 26, 1988, the Supreme Court of Canada ruled that the Act respecting occupational health and safety was not applicable to businesses under federal jurisdiction. Following this ruling, the Commission reimbursed these employers for assessments that were wrongfully paid, including interest of 5% per year.
However, lawsuits were filed in Québec Superior Court by several out-of-province transportation firms which consider themselves to be under federal jurisdiction. They are claiming full reimbursement of the assessments paid to the Commission for the period 1981-1988, inclusively, rather than just the portion of assessments applicable under the Act respecting occupational health and safety. These firms are also claiming interest on their eventual refunds at the rate set under section 28 of the Act respecting the Ministère du Revenu, rather than the 5% rate determined by the Commission. These lawsuits total approximately $46 million not including the claim for interest.
The Commission is unable to predict the outcome of these lawsuits.
48
LONG-TERM INVESTMENTS
AS AT MARCH 31, 2000
(in millions of dollars)
GOVERNMENT INVESTMENTS
| | 2000 | 1999 | |||||||||
|---|---|---|---|---|---|---|---|---|---|---|---|
| | Shares and capital investments | Bonds and notes | Loans and advances | Total | Total | ||||||
| Municipalities and municipal bodies: | |||||||||||
| Municipalities | 14 | 14 | 20 | ||||||||
| Municipal bodies | 4 | 4 | 4 | ||||||||
| 18 | 18 | 24 | |||||||||
| Individuals, enterprises and other | |||||||||||
| Students | 578 | 578 | 460 | ||||||||
| Enterprises | 143 | 819 | 962 | 1 185 | |||||||
| Survivor's pension plan | 361 | 361 | 317 | ||||||||
| Other | 94 | 312 | 406 | 348 | |||||||
| 143 | 94 | 2 070 | 2 307 | 2 310 | |||||||
Allowance for doubtful accounts | 531 | 531 | 581 | ||||||||
| 143 | 94 | 1 539 | 1 776 | 1 729 | |||||||
| 143 | 94 | 1 557 | 1 794 | 1 753 | |||||||
| | | |
|---|---|---|
| Note: | Loans and advances to municipalities and municipal bodies bear interest at rates of 6.3% to 10.0%. | |
| Loans and advances to students bear interest at rates of 5.0% to 14.9%. | ||
| Loans to enterprises usually bear interest at the average rate of 8.5%. | ||
| The loan on the survivor's pension plan bears interest at a rate of 12.7% while all other loans bear interest at various rates of up to 12.0%. |
MATURITY OF INVESTMENTS
| | 2000 | |
|---|---|---|
| 2001 | 399 | |
| 2002 | 325 | |
| 2003 | 124 | |
| 2004 | 125 | |
| 2005 | 140 | |
| 1 113 | ||
| 2006-2010 | 342 | |
| 2011-2015 | 54 | |
| 2016-2020 | 143 | |
| 1 652 | ||
| No fixed maturity date | 142 | |
| 1 794 | ||
49
OTHER ACCOUNTS
AS AT MARCH 31, 2000
(in millions of dollars)
| | 2000 | 1999 | ||
|---|---|---|---|---|
| | | (Note 2) | ||
| Deferred expenses | 169 | 260 | ||
| Unrealized foreign exchange loss | 1 345 | 1 741 | ||
| 1 514 | 2 001 | |||
50
COMMITMENTS AND CONTINGENCIES
AS AT MARCH 31, 2000
(in millions of dollars)
COMMITMENTS
| | 2000 | 1999 | ||||
|---|---|---|---|---|---|---|
| | | (adjusted) | ||||
| TRANSFERS | ||||||
For repayment of the principal on borrowings for capital expenditures: | ||||||
| School boards and educational institutions | 6 513 | 6 289 | ||||
| Health and social services institutions | 3 827 | 3 640 | ||||
| Municipalities and municipal bodies | 2 993 | 2 955 | ||||
| Other beneficiaries | 257 | 249 | ||||
| 13 590 | 13 133 | |||||
| For other capital expenditures: | ||||||
| School boards and educational institutions | 2 254 | 2 066 | ||||
| Health and social services institutions | 1 686 | 1 583 | ||||
| Municipalities and municipal bodies | 892 | 1 053 | ||||
| Other beneficiaries | 681 | 580 | ||||
| 5 513 | 5 282 | |||||
| 19 103 | 18 415 | |||||
| OTHER | 45 | |||||
| 19 103 | * | 18 460 | * | |||
- *
- Commitments in foreign currency are shown at their Canadian equivalent at the exchange rates in effect on March 31 and take currency swap contracts into account.
51
APPENDIX 17
COMMITMENTS AND CONTINGENCIES (cont'd)
AS AT MARCH 31, 2000
(in millions of dollars)
SUMMARY SCHEDULE OF TRANSFER COMMITMENTS
FOR REPAYMENT OF THE PRINCIPAL ON BORROWINGS
FOR CAPITAL EXPENDITURES
| Maturity | School boards | General and vocational colleges | Universities | Health and social services institutions | Municipalities and municipal bodies | Other beneficiaries | Total | |||||||
|---|---|---|---|---|---|---|---|---|---|---|---|---|---|---|
| 2001 | 404 | 213 | 344 | 673 | 363 | 40 | 2 037 | |||||||
| 2002 | 699 | 184 | 244 | 393 | 277 | 85 | 1 882 | |||||||
| 2003 | 662 | 249 | 384 | 669 | 290 | 35 | 2 289 | |||||||
| 2004 | 289 | 123 | 154 | 682 | 296 | 39 | 1 583 | |||||||
| 2005 | 237 | 151 | 218 | 224 | 276 | 40 | 1 146 | |||||||
| 2 291 | 920 | 1 344 | 2 641 | 1 502 | 239 | 8 937 | ||||||||
2006-2010 | 1 213 | 261 | 333 | 867 | 716 | 18 | 3 408 | |||||||
| 2011-2015 | 62 | 15 | 40 | 156 | 313 | 586 | ||||||||
| 2016-2020 | 15 | 8 | 3 | 76 | 274 | 376 | ||||||||
| 2021-2025 | 1 | 4 | 64 | 96 | 165 | |||||||||
| 2026-2030 | 3 | 19 | 62 | 84 | ||||||||||
| 2031-2035 | 4 | 26 | 30 | |||||||||||
| 2036-2040 | 4 | 4 | ||||||||||||
| 3 582 | 1 211 | 1 720 | 3 827 | 2 993 | 257 | 13 590 | ||||||||
Note: This schedule was drawn up according to the dates shown on the bonds or notes at the balance sheet date. Any refinancing after that date will affect the above schedule.
52
APPENDIX 17
COMMITMENTS AND CONTINGENCIES (cont'd)
AS AT MARCH 31, 2000
(in millions of dollars)
GUARANTEED FINANCIAL INITIATIVES
| | 2000 | 1999 | ||
|---|---|---|---|---|
| Government agencies and enterprises | ||||
| Hydro-Québec(1) | 38 165 | 39 128 | ||
| Investissement-Québec(1) | 944 | 663 | ||
| Société d'habitation du Québec(1) | 121 | 242 | ||
| Other | 56 | 57 | ||
| 39 286 | 40 090 | |||
| Individuals and corporations | ||||
| Loans to farm producers(1) | 3 443 | 3 096 | ||
| Loans to students(1) | 3 340 | 3 256 | ||
| Other loans | 110 | 128 | ||
| 6 893 | 6 480 | |||
| Total guaranteed financial initiatives | 46 179 | 46 570 | ||
| Less: | ||||
| Allowance for losses on guaranteed financial initiatives | 814 | 883 | ||
| NET GUARANTEED FINANCIAL INITIATIVES | 45 365 | 45 687 | ||
- (1)
- See additional information on following pages.
53
APPENDIX 17
COMMITMENTS AND CONTINGENCIES (cont'd)
AS AT MARCH 31, 2000
(in millions of dollars)
HYDRO-QUÉBEC LOAN GUARANTEES(1)(4)
| | 2000 | 1999 | ||||||
|---|---|---|---|---|---|---|---|---|
| | Authorized | Contingent liabilities(2) | Contingent liabilities(2) | |||||
| Negotiable bonds | ||||||||
| In Canadian dollars | 15 441 | 14 762 | ||||||
| In U.S. dollars | 13 590 | 14 828 | ||||||
| Other currencies | 2 482 | 3 157 | ||||||
| 31 513 | 31 513 | 32 747 | ||||||
| Other borrowings | ||||||||
| In Canadian dollars | 2 253 | 1 706 | ||||||
| In U.S. dollars | 3 025 | 3 138 | ||||||
| Other currencies | 1 821 | 1 954 | ||||||
| 17 093 | 7 099 | 6 798 | ||||||
| Total | 38 612 | 39 545 | ||||||
| Less: Sinking fund | 447 | (3) | 417 | (3) | ||||
| 48 606 | 38 165 | 39 128 | ||||||
- (1)
- The Gouvernement du Québec, which is Hydro-Québec's sole shareholder, guarantees loans contracted in various currencies by this enterprise. The value of assets in Hydro-Québec, as shown in Appendix 14, was $58 241 million as at March 31, 2000 ($57 831 million as at March 31, 1999).
- (2)
- Loan guarantees are shown at their Canadian equivalent at the rates in effect on March 31, 2000.
- (3)
- Includes Gouvernement du Québec bonds worth $217 million as at March 31, 2000 ($198 million as at March 31, 1999).
- (4)
- Loan guarantees bear interest at fixed and variable rates and mature at various dates until 2031.
INVESTISSEMENT-QUÉBEC LOAN GUARANTEES(1)(2)
| | 2000 | 1999 | ||||||
|---|---|---|---|---|---|---|---|---|
| | Authorized | Contingent liabilities | Contingent liabilities | |||||
| Loan guarantees in effect: | ||||||||
| Business start-up and re-start investment and support programs | 103 | 173 | ||||||
| Various programs | 488 | 317 | ||||||
| Authorized loan guarantees not in effect: | ||||||||
| Various programs | 353 | 173 | ||||||
| 1 179 | 944 | 663 | ||||||
| Allowance for losses on guaranteed financial initiatives | (190 | ) | (261 | ) | ||||
| 754 | 402 | |||||||
- (1)
- The Government guarantees the payment of principal and interest on the loans concerned under the Act respecting Investissement-Québec and Garantie-Québec (R.S.Q., c. I-16)
- (2)
- The total value of securities received as loan guarantees was $143 million as at March 31, 2000.
54
APPENDIX 17
COMMITMENTS AND CONTINGENCIES (cont'd)
AS AT MARCH 31, 2000
(in millions of dollars)
SOCIÉTÉ D'HABITATION DU QUÉBEC LOAN GUARANTEES(1)
| | 2000 | 1999 | |||||
|---|---|---|---|---|---|---|---|
| | Authorized | Contingent liabilities | Contingent liabilities | ||||
| Renovation asssistance program(2) | 6 | 141 | |||||
| Assistance program for community housing(3) | 5 | 5 | |||||
| Achat-Rénovation and Accès Logis programs(4) | 110 | 96 | |||||
| 121 | 121 | 242 | |||||
| Allowance for losses on guaranteed financial initiatives | (5 | ) | (8 | ) | |||
| 116 | 234 | ||||||
- (1)
- The Société d'habitation du Québec (SHQ) guarantees the reimbursement of losses of principal and interest under the Act respecting the Société d'habitation du Québec (R.S.Q., c. S-8).
- (2)
- Loans from financial institutions guaranteed by the SHQ and granted to individuals who contracted borrowings to carry out home renovations. These loans are guaranteed for three years and may be extended for an additional year.
- (3)
- Loans from financial institutions guaranteed by the SHQ and granted to non-profit organizations for a period of 25 years. The organizations are responsible for paying the interest on these loans, which finance the cost of buildings.
- (4)
- Loans from financial institutions guaranteed by the SHQ and granted to non-profit organizations for periods of 15 and 25 years. The SHQ reimburses the interest on loans guaranteed for 15 years, while the organizations pay that on those guaranteed for 25 years. The loans finance the cost of buildings.
FARM PRODUCER LOAN GUARANTEES(1)
| | 2000 | 1999 | |||||
|---|---|---|---|---|---|---|---|
| | Authorized | Contingent liabilities | Contingent liabilities | ||||
| Act respecting the Société de financement agricole (R.S.Q., c. S-11.0101) | 2 643 | 2 193 | |||||
| Act respecting farm financing (R.S.Q., c. F-1.2) | 469 | 549 | |||||
| Act to promote long term farm credit by private institutions (R.S.Q., c. C-75.1) | 254 | 304 | |||||
| Various acts | 77 | 50 | |||||
| 3 434 | 3 443 | 3 096 | |||||
| Allowance for losses on guaranteed financial initiatives | (45 | ) | (46 | ) | |||
| 3 398 | 3 050 | ||||||
- (1)
- Balances of principal and interest on loans for which the Fonds d'assurance-prêts agricoles et forestiers reimburses losses and covers related charges.
55
APPENDIX 17
COMMITMENTS AND CONTINGENCIES (cont'd)
AS AT MARCH 31, 2000
(in millions of dollars)
STUDENT LOAN GUARANTEES(1)
| | 2000 | 1999 | |||||
|---|---|---|---|---|---|---|---|
| | Authorized | Contingent liabilities | Contingent liabilities | ||||
| Loans for which the Government pays interest | |||||||
| Borrowers are students | 1 305 | 1 465 | |||||
| Loans for which borrowers are responsible for repaying principal and interest | 1 972 | 1 719 | |||||
| Loans for the purchase of a personal computer, for which borrowers are responsible for repaying interest | 63 | 72 | |||||
| 3 340 | 3 340 | 3 256 | |||||
| Allowance for losses on guaranteed financial initiatives | (517 | ) | (507 | ) | |||
| 2 823 | 2 749 | ||||||
- (1)
- The Government guarantees the reimbursement of losses of principal and interest to lending institutions under the Act respecting financial assistance for students (R.S.Q., c. A-13.3).
56
SUMMARY OF TRANSACTIONS OF A FIDUCIARY NATURE CONDUCTED BY
GOVERNMENT AGENCIES AND FUNDS
AS AT MARCH 31, 2000
(in millions of dollars)
| | 2000 | 1999 | ||||||||||
|---|---|---|---|---|---|---|---|---|---|---|---|---|
| | Liabilities | Assets | Increase (decrease) in accrued equity | Net equity | Net equity | |||||||
| | | | | | (adjusted) | |||||||
| Caisse de dépôt et placement du Québec(1) | 19 197 | 100 263 | 12 498 | 81 066 | 68 568 | |||||||
| Comité Centraide — public sector(1) | 7 | 7 | ||||||||||
| Commission administrative des régimes de retraite et d'assurances:(1) | ||||||||||||
| RREGOP | 74 | 34 288 | 4 556 | 34 214 | 29 658 | |||||||
| PPFETQ | 122 | 15 | 122 | 107 | ||||||||
| Supplementary benefits plans | 13 | 275 | 34 | 262 | 228 | |||||||
| Commission de la construction du Québec(1) | ||||||||||||
| General Fund | 18 | 25 | 4 | 7 | 3 | |||||||
| Supplemental pension plan — general account | 53 | 3 553 | 412 | 3 500 | 3 088 | |||||||
| Supplemental pension plan — pensioners' account | 2 | 3 175 | 491 | 3 173 | 2 682 | |||||||
| Other | 261 | 1 541 | 230 | 1 280 | 1 050 | |||||||
| Curateur public (Le)(1) | 36 | 256 | 12 | 220 | 208 | |||||||
| Fonds central pour le bénéfice des personnes incarcérées(1 ) | 2 | 2 | 2 | |||||||||
| Guarantee Insurance Fund administered by the Régie des marchés agricoles et alimentaires du Québec(2) | 4 | 1 | 4 | 3 | ||||||||
| Fonds d'assurance-récolte and Fonds d'assurance-stabilisation des revenus agricoles(2) | 280 | 253 | 89 | (27 | ) | (116 | ) | |||||
| Fonds de contrats à terme(2) | 5 | 5 | ||||||||||
| Travel Agents' Security Funds(2) | 8 | 7 | 2 | (1 | ) | (3 | ) | |||||
| Support Payments Fund(2) | 306 | 306 | ||||||||||
| Fonds du régime tripartite d'assurance revenu brut à l'égard des récoltes(2) | 1 | 21 | (1 | ) | 20 | 21 | ||||||
| Fonds d'indemnisation des services financiers(1) | 1 | 2 | 1 | 1 | ||||||||
| Trust Funds(2) | 533 | 533 | ||||||||||
| Fonds national de formation de la main-d'oeuvre(2) | 2 | 75 | 30 | 73 | 43 | |||||||
| Hydro-Québec — Pension Plan(1 ) | 13 | 8 971 | 707 | 8 958 | 8 251 | |||||||
| Régie des rentes du Québec(2) | ||||||||||||
| Fonds du régime de rentes du Québec | 518 | 18 828 | 2 156 | 18 310 | 16 154 | |||||||
| Other | 17 | 20 | 1 | 3 | 2 | |||||||
| 21 345 | 172 532 | 21 237 | 151 187 | 129 950 | ||||||||
| Less: Funds entrusted to the Caisse de dépôt et placement du Québec | 61 110 | 8 265 | 61 110 | 52 845 | ||||||||
| 21 345 | 111 422 | 12 972 | 90 077 | 77 105 | ||||||||
- (1)
- Financial statements as at December 31, 1999.
- (2)
- Financial statements as at March 31, 2000.
57
TABLE OF CONTENTS