QuickLinks -- Click here to rapidly navigate through this document
Exhibit (99.7)
PUBLIC ACCOUNTS 2002-2003
VOLUME 1
CONSOLIDATED FINANCIAL STATEMENTS OF THE
GOUVERNEMENT DU QUÉBEC
Fiscal year ended March 31, 2003
Published in accordance with section 86 of the Financial
Administration Act (R.S.Q., c. A-6.001)
![]()
ISSN 0706-2869
ISBN 2-550-41717-8
Legal deposit — 1st quarter 2004
Bibliothèque nationale du Québec
II
To Her Excellency the Honourable Lise Thibault
Lieutenant-Governor of Québec
Parliament Building
Québec
Your Excellency,
The undersigned has the honour of presenting to Your Excellency the Public Accounts of the Gouvernement du Québec for the fiscal year ended March 31, 2003.
Yves Séguin
Minister of Finance
Québec, March 2004
III
(This page has been left blank intentionally.)
IV
To the Minister of Finance
Yves Séguin
Parliament Building
Québec
Dear Sir,
In accordance with the commission entrusted to me, I have the honour of presenting the Public Accounts of the Gouvernement du Québec for the fiscal year ended March 31, 2003. These accounts have been prepared under section 86 of the Financial Administration Act (R.S.Q., c. A-6.001), in accordance with the Government's accounting policies.
Respectfully yours,
Nathalie Tremblay, CA
Comptroller of Finance
Québec, March 2004
V
(This page has been left blank intentionally.)
VI
| | | | | ||
|---|---|---|---|---|---|
| INTRODUCTION | IX | ||||
SUMMARY OF CONSOLIDATED FINANCIAL TRANSACTIONS | |||||
Consolidated summary of operations | XIII | ||||
| Consolidated revenue | XV | ||||
| Consolidated expenditure | XVI | ||||
| Consolidated financial position | XVIII | ||||
| Reconciliation of revenue, expenditure and annual deficit | XIX | ||||
| Balanced Budget Act | XX | ||||
| Financial statistics | XXI | ||||
CONSOLIDATED FINANCIAL STATEMENTS | |||||
Statement of responsibility | 3 | ||||
| Auditor General's report | 4 | ||||
| Consolidated statement of operations | 7 | ||||
| Consolidated statement of accumulated deficit | 8 | ||||
| Consolidated statement of financial position | 9 | ||||
| Consolidated statement of financial requirements and financing | 10 | ||||
| Notes to financial statements | 13 | ||||
Appendices | |||||
1 | Government departments and agencies whose financial transactions were conducted within the Consolidated Revenue Fund and included in the Government's reporting entity | 35 | |||
| 2 | Agencies and special funds whose reporting entity is included in the Government's reporting entity | 38 | |||
| 3 | Enterprises included in the Government's reporting entity | 41 | |||
| 4 | Agencies and funds which conduct fiduciary transactions that are not included in the Government's reporting entity | 42 | |||
| 5 | Breakdown of revenue | 43 | |||
| 6 | Breakdown of expenditure | 44 | |||
| 7 | Short-term investments | 45 | |||
| 8 | Accounts receivable | 46 | |||
VII
| | | | | ||
|---|---|---|---|---|---|
| 9 | Investment in Government enterprises | 47 | |||
| 10 | Long-term investments | 53 | |||
| 11 | Bank overdraft | 55 | |||
| 12 | Accounts payable and accrued expenses | 56 | |||
| 13 | Debts | 58 | |||
| 14 | Net debt | 63 | |||
| 15 | Fixed assets | 64 | |||
| 16 | Commitments and contingencies | 65 | |||
| 17 | Summary of fiduciary transactions conducted by Government agencies and funds | 71 | |||
| 18 | Reserve fund | 73 |
VIII
Introduction
Each year the Ministère des Finances publishes documents on the financial position of the Gouvernement du Québec and the results of its financial transactions.
The Quarterly Presentation of Financial Transactions was published at the close of the second and third quarters of 2002 to account for changes in the financial transactions and facilitate comparison with the projections contained in the 2002-2003 Budget of March 19, 2002.
The 2002-2003 Public Accounts complete the information relating to the actual results for fiscal 2002-2003, whose main data formed part of the second Quarterly Presentation for 2003-2004.
The Public Accounts for the fiscal year ended March 31, 2003 have been prepared by the Comptroller of Finance for the Minister of Finance in accordance with the accounting policies established by the Conseil du trésor and pursuant to the provisions of section 86 of the Financial Administration Act (R.S.Q., c. A-6.001). They are published in two volumes.
Volume 1 — Consolidated Financial Statements of the Gouvernement du Québec
Volume 1 presents summary data on the consolidated financial transactions and the consolidated financial statements of the Gouvernement du Québec for the fiscal year ended March 31, 2003, accompanied by the Auditor General's report.
Volume 2 — Revenue, Appropriations, Expenditure and Investments of the Consolidated Revenue Fund and Financial Information on the Special Funds of the Gouvernement du Québec
Volume 2 is divided into three sections. The first two sections report on the operations of entities whose revenue is cashed into the Consolidated Revenue Fund or the Health Services Fund and entities whose operating activities are paid for out of these funds using appropriations allotted by Parliament. Such entities include Government departments, budgetary agencies, the National Assembly and persons designated by it, and other portfolios. The third section presents summary financial information on the special funds.
IX
(This page has been left blank intentionally.)
X
SUMMARY
OF CONSOLIDATED
FINANCIAL TRANSACTIONS
XI
(This page has been left blank intentionally.)
XII
Consolidated summary of operations
FISCAL YEAR ENDED MARCH 31, 2003
(in millions of dollars)
| | 2003 | 2002(1) | |||||
|---|---|---|---|---|---|---|---|
| | Budget* | Actual results | Actual results | ||||
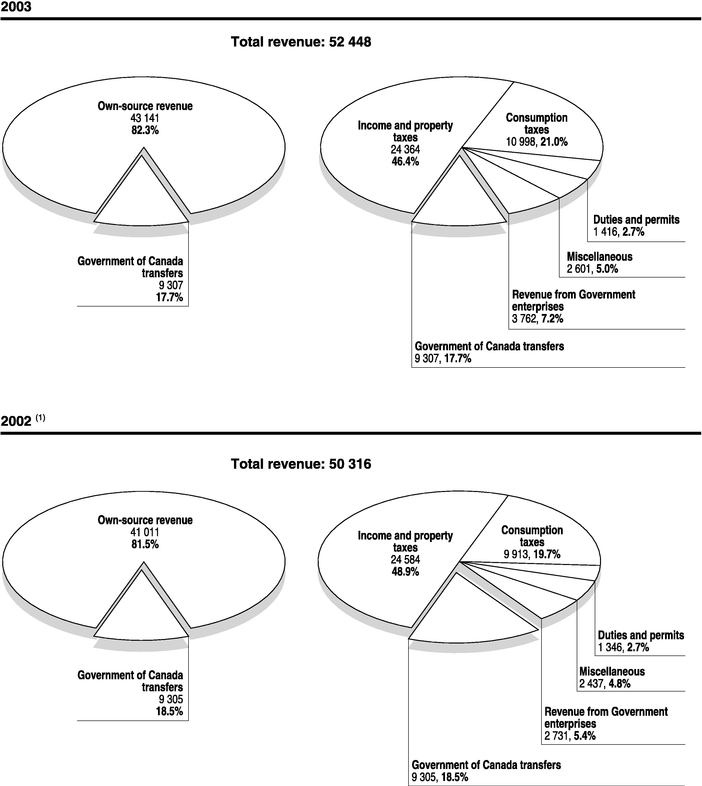
| Own-source revenue | 43 065 | 43 141 | 41 011 | ||||
| Government of Canada transfers | 8 842 | 9 307 | 9 305 | ||||
| Total revenue | 51 907 | 52 448 | 50 316 | ||||
| Expenditure (excluding debt service) | 44 713 | 46 057 | 43 983 | ||||
| Debt service | 7 194 | 7 085 | 7 261 | ||||
| Total expenditure | 51 907 | 53 142 | 51 244 | ||||
| ANNUAL DEFICIT | — | (694 | ) | (928 | ) | ||
| * On the basis of the revenue and expenditure forecasts showed in the 2002-2003 Budget of March 19, 2002. | |||||||
Under the Act to establish a budgetary surplus reserve fund (R.S.Q., c. R-25.1), the government created a reserve fund to finance certain expenditures and maintain a balanced budget. | |||||||
The changes in the reserve fund are shown in Appendix 18. | |||||||
Annual deficit | — | (694 | ) | (928 | ) | ||
| Transfer to reserve fund | — | — | — | ||||
| Use of reserve fund | — | — | 950 | ||||
| Excess of annual deficit over reserve fund | — | (694 | ) | 22 | |||
- (1)
- Certain revenue and expenditure figures for 2002 were reclassified for consistency with the presentation adopted in 2003.
XIII
Consolidated summary of operations (cont'd)
FISCAL YEAR ENDED MARCH 31, 2003
(in millions of dollars)
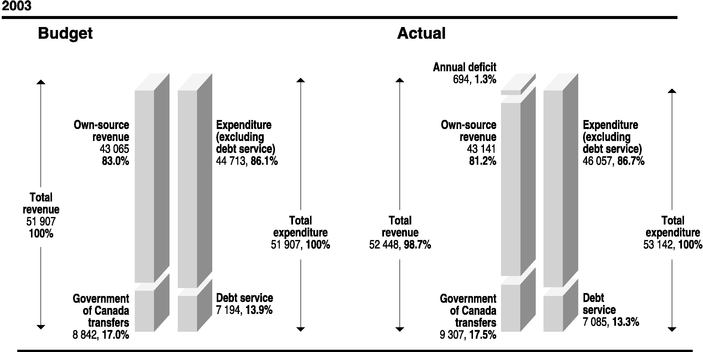
Revenue for fiscal 2002-2003 is $541 million higher than forecast in the 2002-2003 Budget of March 19, 2002. The $76-million increase in own-source revenue is due to additional revenue from consumption taxes and Government enterprises. It is largely offset by lower corporate tax revenue and an adjustment to the allocation of remittances by employers, which attributes more revenue to the Régie des rentes du Québec, a fiduciary organization of the Government, and reduces the revenue of the Consolidated Revenue Fund accordingly. As for the $465-million upward adjustment in federal transfers, it can be explained mainly by an increase in revenue from the Canada Health and Social Transfer.
Expenditure for fiscal 2002-2003, excluding debt service, is $1 344 million higher than anticipated in the 2002-2003 Budget. This increase reflects the impact of the additional resources allocated mainly to the health and social services sector, as well as the lower-than-expected decrease in the number of households receiving employment assistance.
Lastly, debt service is $109 million less than projected in the Budget. This change is due primarily to a decline in interest on pension plans.
XIV
Consolidated revenue
FISCAL YEAR ENDED MARCH 31, 2003
(in millions of dollars)
- (1)
- Certain 2002 figures were reclassified for consistency with the presentation adopted in 2003.
XV
Consolidated expenditure
FISCAL YEAR ENDED MARCH 31, 2003
(in millions of dollars)
- (1)
- Certain 2002 figures were reclassified for consistency with the presentation adopted in 2003.
XVI
- (1)
- Certain 2002 figures were reclassified for consistency with the presentation adopted in 2003.
- (2)
- Including $783 million in 2002-2003 ($622 million in 2001-2002) for the depreciation of fixed assets.
XVII
Consolidated financial position
AS AT MARCH 31, 2003
(in millions of dollars)
- (1)
- Certain 2002 figures were reclassified for consistency with the presentation adopted in 2003.
XVIII
Reconciliation of revenue, expenditure and annual deficit
FISCAL YEAR ENDED MARCH 31, 2003
(in millions of dollars)
| | 2003 | 2002 | ||||
|---|---|---|---|---|---|---|
| | | (reclassified) | ||||
| REVENUE | ||||||
| Consolidated Revenue Fund excluding | ||||||
| Government enterprises | 46 152 | 45 209 | ||||
| Government enterprises | 3 762 | 2 731 | ||||
| Government agencies and special funds | 15 011 | 12 834 | ||||
| 64 925 | 60 774 | |||||
| Elimination of inter-entity transactions | (12 477 | ) | (10 458 | ) | ||
| 52 448 | 50 316 | |||||
| �� | ||||||
EXPENDITURE | ||||||
| Consolidated Revenue Fund | 50 975 | 49 190 | ||||
| Government agencies and special funds | 14 644 | 12 512 | ||||
| 65 619 | 61 702 | |||||
| Elimination of inter-entity transactions | (12 477 | ) | (10 458 | ) | ||
| 53 142 | 51 244 | |||||
| ANNUAL DEFICIT | (694 | ) | (928 | ) | ||
Under the Act to establish a budgetary surplus reserve fund (R.S.Q., c. R-25.1), the government created a reserve fund to finance certain expenditures and maintain a balanced budget.
The changes in the reserve fund are shown in Appendix 18.
| Annual deficit | (694 | ) | (928 | ) | |
| Transfer to reserve fund | — | — | |||
| Use of reserve fund | — | 950 | |||
| Excess of annual deficit over reserve fund | (694 | ) | 22 | ||
XIX
Balanced Budget Act
In accordance with the provisions of the Balanced Budget Act (R.S.Q., c. E-12.001), the Minister of Finance must report to the National Assembly on the surplus or overruns registered during the fiscal year in relation to the objectives set by the Act.
Pursuant to the Balanced Budget Act, the accumulated surplus at the end of fiscal 2002-2003 breaks down as follows:
Accumulated surplus pursuant to the Balanced Budget Act
| | 2003 | 2002 | ||||
|---|---|---|---|---|---|---|
| | Budget | Actual results(1) | Actual results | |||
| | (in millions of dollars) | |||||
| Accumulated surplus, beginning of year | 1 871 | 1 871 | 1 849 | |||
| Surplus (overruns) reported for the year | — | (694 | ) | 22 | ||
| Accumulated surplus, end of year | 1 871 | 1 177 | 1 871 | |||
- (1)
- The accounting changes described in Note 2 did not have any effect in fiscal 2002-2003 on financial results for the year.
XX
Financial statistics
FISCAL YEAR ENDED MARCH 31, 2003
(in millions of dollars)
| Fiscal year | Revenue* | Expenditure* | (Deficit) or surplus | Net debt(1) | Fixed assets | Accumulated deficit | ||||||
|---|---|---|---|---|---|---|---|---|---|---|---|---|
| 2002-2003 | 52 448 | 53 142 | (694 | ) | 95 457 | (6) | 9 716 | 85 741 | ||||
| 2001-2002 | 50 316 | 51 244 | (928 | ) | 92 772 | (5) | 8 234 | 84 538 | ||||
| 2000-2001 | 51 040 | 49 663 | 1 377 | 88 208 | (4) | 7 166 | 81 042 | |||||
| 1999-2000 | 47 410 | 47 403 | 7 | 89 162 | (3) | 6 693 | 82 469 | |||||
| 1998-1999 | 46 720 | 46 594 | 126 | 88 810 | (2) | 6 233 | 82 577 |
- *
- Certain figures were reclassified for consistency with the presentation adopted in 2002-2003.
($M: millions of dollars)
- (1)
- Net debt represents total liabilities minus financial assets, recorded in the statement of financial position.
- (2)
- The net debt was increased by $339 M, including $217 M for the recording of fixed assets, $25 M for the recording of accounts payable and accrued expenses and $97 M for adjustments to other accounts.
- (3)
- The net debt was increased by $359 M for the recording of fixed assets.
- (4)
- The net debt was increased by $423 M, including $473 M for the recording of fixed assets, $12 M for sick leave and vacations and a decrease of $62 M for investments in Government enterprises.
- (5)
- The net debt was increased by $1 386 M, including $1 068 M for the recording of fixed assets, –$88 M for the recording of the Government's share of the foreign exchange gains or losses of enterprises, $215 M for the correction of the error made by the Canada Customs and Revenue Agency, $65 M for the change in the accounting policy for certain recoveries, $126 M for the recording of employer contributions in respect of obligations relating to sick leave and vacations, for the change in the status of a Government enterprise and for costs related to the improvement of premises. In addition, accounting changes made by Government enterprises increased the net debt by $2 250 M, including $1 338 M for the recording of foreign currency translation and $912 M for the introduction of a provision for deviations in the real rate of return.
- (6)
- The net debt was increased by $1 604 M, including $1 482 M for the recording of fixed assets and $122 M for the recording of the Government's share of translation adjustments of enterprises. In addition, accounting changes made by Government enterprises increased the net debt by $387 M, including $363 M relating to the capping mechanism used in calculating deferred gains and losses on basis on the real rate of return assumption.
XXI
(This page has been left blank intentionally.)
XXII
CONSOLIDATED FINANCIAL
STATEMENTS
(This page has been left blank intentionally.)
2
Statement of responsibility
The Government is responsible for the integrity and objectivity of the consolidated financial statements prepared by the Comptroller of Finance for the Minister of Finance in accordance with the Financial Administration Act (R.S.Q., c. A-6.001, s. 86). These statements are prepared in accordance with the accounting policies disclosed in Note 1 of the financial statements.
To fulfil its accounting and financial reporting responsibilities, the Government maintains systems of financial management and internal control designed to provide reasonable assurance that transactions are duly authorized by Parliament and properly executed and recorded.
The Comptroller of Finance takes care of Government accounting and obtains all the information needed to meet its accounting requirements from Government departments, agencies, enterprises and funds.
The Government submits its consolidated financial statements for audit assurance to the Auditor General who, in his report to the National Assembly, states the nature and scope of his audit as well as his opinion.
The financial statements are part of the Public Accounts tabled annually in the National Assembly by the Minister of Finance.
On behalf of the Gouvernement du Québec,
| Gilles Godbout Deputy Minister of Finance | Nathalie Tremblay, CA Comptroller of Finance |
| Québec, March 16, 2004 |
3
Auditor General's report
To the National Assembly,
I have audited the following consolidated financial statements of the Government of Québec for the fiscal year ended March 31, 2003:
- •
- operating results;
- •
- accumulated deficits;
- •
- financial position;
- •
- financial requirements and financing.
The Minister of Finance is responsible for the preparation of these financial statements. My responsibility is to express an opinion on these financial statements based on my audit.
I conducted my audit in accordance with Canadian generally accepted auditing standards. Those standards require that the audit be planned and performed to obtain reasonable assurance whether the financial statements are free of material misstatement. An audit includes examining, on a test basis, evidence supporting the amounts and disclosures in the financial statements. An audit also includes assessing the accounting policies used and significant estimates made by the management of government departments and agencies included in the government reporting entity, as well as evaluating the overall financial statement presentation.
Commitments for the Government and Public Employees Retirement Plan (RREGOP), the Pension Plan of Management Personnel (PPMP) and the Pension Plan of Peace Officers in Correctional Services (PPPOCS)
The liabilities recorded under "Pension plans" as at March 31, 2003 for the regular service of the RREGOP, the PPMP, excluding that of senior administration, and for the PPPOCS total $24,063 million (March 31, 2002: $22,166 million). These three plans are of the shared-cost type, namely their respective cost, i.e. the ensuing annual contribution, is shared in predetermined proportions between the employer and the participants. This sharing of the annual contribution creates a commitment for the government with respect to the financing of these plans, a commitment whose value corresponds to the fund that the government would have accumulated, had it paid its contributions on the same bases as those which were used to determine the participants' fund. In the case of the RREGOP and the PPMP, the market value of this fund was estimated at $32,677 million as at December 31, 2002 (December 31, 2001: $36,282 million). As for the PPPOCS, for which the employees' contributions were paid into the Consolidated Revenue Fund, the book value of the fund that the employees and the government would have accumulated was evaluated at $713 million as at that same date (December 31, 2001: $767 million).
4
Auditor General's report (cont'd)
In note 5 of its financial statements, the government does not clearly recognize that it has contracted commitments for the financing of these plans. Indeed, it does not indicate that the commitments to which reference is made ensue from the sharing of the annual contribution established according to the legislative provisions of these plans and the collective agreements that the government has negotiated since the creation of the plans. With respect to total commitments of $33,390 million (December 31, 2001: $37,049 million), $24,063 million (March 31, 2002: $22,166 million) are already recorded as liabilities as at March 31, 2003.
Although these commitments have no effect on the liabilities, the net debt, the accumulated deficits and the deficit of the fiscal year ended March 31, 2003, this information must be disclosed appropriately to enable readers of the financial statements to better evaluate the government's financial situation.
Reporting entity
The government reporting entity, which is described in note 1 of its financial statements, does not include the entities of the education network and those of the health and social services network. In accordance with the recommendations of the Canadian Institute of Chartered Accountants, these entities should be included in the government reporting entity as they meet the criteria for inclusion in that entity.
Given the fact that the government did not compile the necessary information, I was unable to determine the effects of the non-inclusion of the entities of the education network and of the health and social services network in the financial statements. However, based on the information that I do have, the inclusion of these entities in the government's consolidated financial statements would have a significant impact on the financial information presented in those statements.
Provision for losses on guaranteed financial initiatives
Investissement Québec establishes the provision for losses on its financial initiatives guaranteed by the government according to the credit risks and the initiatives in progress. The government records a different provision for the same initiatives according to its own assessment of the credit risks and on the basis of the authorized interventions rather than of those in progress. In my opinion, the provision established by Investissement Québec is appropriate because it is evaluated on the basis of the accrual accounting method and a meticulous analysis of the credit risks. Hence, the government should have recorded in its books, the provision calculated by Investissement Québec. The effect of not having entered an appropriate provision is to overstate the deficit of the fiscal year ended on
5
Auditor General's report (cont'd)
March 31, 2003 by $82.3 million (March 31, 2002: $50.1 million), and to overstate the provision for losses on guaranteed financial initiatives, the net debt and the accumulated deficits by $260.7 million at that date (March 31, 2002: $178.4 million).
In my opinion, except for the inappropriate disclosure by the government of its commitments concerning the financing of the RREGOP, the PPMP and the PPPOCS, the undetermined effects of the non-inclusion of the entities of the education network and those of the health and social services network, as well as the effects of the inappropriate recording of the provision for losses on guaranteed financial initiatives, these consolidated financial statements present fairly, in all material respects, the financial position of the Government of Québec as at March 31, 2003, as well as the results of its operations and the changes in its financial position for the fiscal year then ended, in accordance with the accounting policies set forth in note 1. As required by the Auditor General Act, I report that, in my opinion, these accounting policies have been applied on a basis consistent with that of the preceding fiscal year.
Another important question
Comparative financial data
The government applied a retroactive treatment to the recovery of the equalization payments by the Government of Canada for the 2001-2002 fiscal year in relation to the error of the Canada Customs and Revenue Agency. The government included in the net debt at the start of 2001-2002 the recovery of the $215 million attributable to that fiscal year, whereas it should have recorded said amount as a reduction of revenue for that fiscal year. The transfer income from the Government of Canada for 2001-2002 presented for comparison in the government's consolidated statement of operations for 2002-2003 should have been reduced by $215 million. Moreover, the deficit for 2001-2002 remained at $928 million, whereas it should have been increased to $1,143 million.
Acting Auditor General,
Doris Paradis, FCA
Québec, March 16, 2004
6
Consolidated statement of operations
FISCAL YEAR ENDED MARCH 31, 2003
(in millions of dollars)
| | | 2003 | 2002 | ||||||
|---|---|---|---|---|---|---|---|---|---|
| Appendix | | Budget* | Actual results | Actual results | |||||
| | | | | (Notes 2 and 11) | |||||
| 5 | REVENUE (Note 3) | ||||||||
| Income and property taxes | 25 703 | 24 364 | 24 584 | ||||||
| Consumption taxes | 10 435 | 10 998 | 9 913 | ||||||
| Duties and permits | 1 390 | 1 416 | 1 346 | ||||||
| Miscellaneous | 2 322 | 2 601 | 2 437 | ||||||
| 9 | Revenue from Government enterprises | 3 215 | 3 762 | 2 731 | |||||
| Own-source revenue | 43 065 | 43 141 | 41 011 | ||||||
| Government of Canada transfers | 8 842 | 9 307 | 9 305 | ||||||
| �� | Total revenue | 51 907 | 52 448 | 50 316 | |||||
| 6 | EXPENDITURE | ||||||||
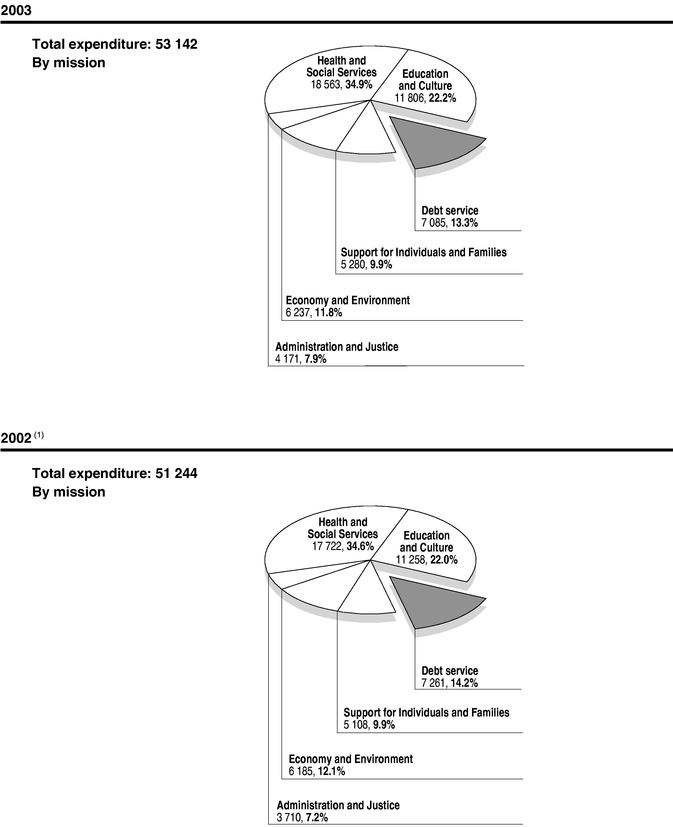
| Health and Social Services | 17 992 | 18 563 | 17 722 | ||||||
| Education and Culture | 11 785 | 11 806 | 11 258 | ||||||
| Economy and Environment | 6 029 | 6 237 | 6 185 | ||||||
| Support for Individuals and Families | 5 060 | 5 280 | 5 108 | ||||||
| Administration and Justice | 3 847 | 4 171 | 3 710 | ||||||
| Sub-total | 44 713 | 46 057 | 43 983 | ||||||
| Debt service | 7 194 | 7 085 | 7 261 | ||||||
| Total expenditure | 51 907 | 53 142 | 51 244 | ||||||
| ANNUAL DEFICIT | — | (694 | ) | (928 | ) | ||||
* On the basis of the revenue and expenditure forecasts showed in the 2002-2003 Budget of March 19, 2002. | |||||||||
Under the Act to establish a budgetary surplus reserve fund (R.S.Q., R-25.1), the government created a reserve fund to finance certain expenditures and maintain a balanced budget. | |||||||||
The changes in the reserve fund are shown in Appendix 18. | |||||||||
| Annual deficit | — | (694 | ) | (928 | ) | ||||
| Transfer to reserve fund | — | — | — | ||||||
| Use of reserve fund | — | — | 950 | ||||||
| Excess of annual deficit over reserve fund | — | (694 | ) | 22 | |||||
7
Consolidated statement of accumulated deficit
FISCAL YEAR ENDED MARCH 31, 2003
(in millions of dollars)
| | 2003 | 2002 | |||||
|---|---|---|---|---|---|---|---|
| | Budget* | Actual | Actual | ||||
| PREVIOUSLY ESTABLISHED ACCUMULATED DEFICIT, BEGINNING OF YEAR | (81 992 | ) | (84 100 | ) | (83 260 | ) | |
| Restatements (Note 2) | (406 | ) | (406 | ) | |||
| Government's share of restatements made by Government enterprises, April 1st, 2001 (Appendix 9) | (32 | ) | (32 | ) | |||
| (81 992 | ) | (84 538 | ) | (83 698 | ) | ||
| Government's share of restatements made by Government enterprises, April 1st, 2002 (Appendix 9) | (387 | ) | |||||
| Restated balance | (81 992 | ) | (84 925 | ) | (83 698 | ) | |
| Government's share of translation adjustments of Government enterprises | — | (122 | ) | 88 | |||
| Annual deficit | — | (694 | ) | (928 | ) | ||
| ACCUMULATED DEFICIT, END OF YEAR | (81 992 | ) | (85 741 | ) | (84 538 | ) | |
- *
- On the basis of the revenue and expenditure forecasts showed in the 2002-2003 Budget of March 19, 2002.
8
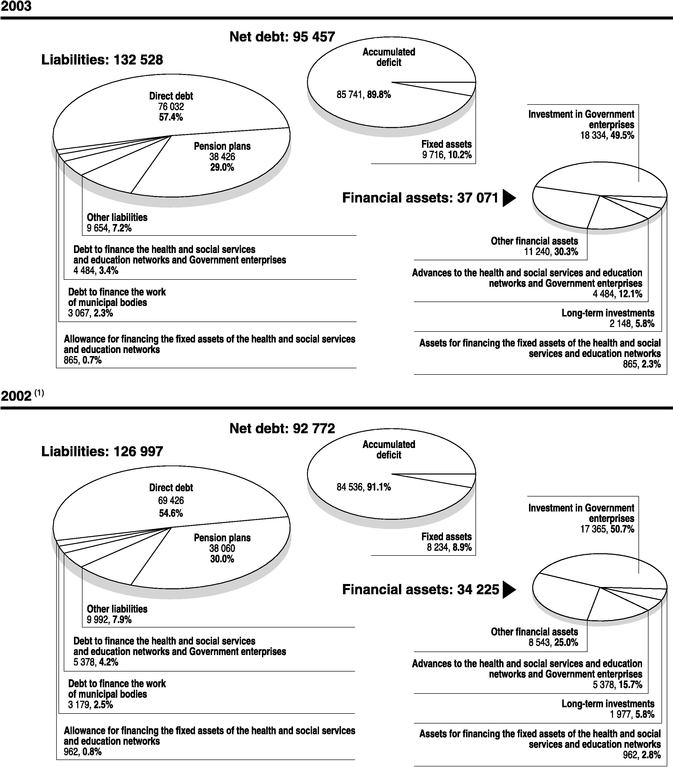
Consolidated statement of financial position
AS AT MARCH 31, 2003
(in millions of dollars)
| Appendix | | 2003 | 2002 | ||||
|---|---|---|---|---|---|---|---|
| | | | (Note 2) | ||||
| FINANCIAL ASSETS | |||||||
| 7 | Short-term investments | 4 488 | 1 445 | ||||
| 8 | Accounts receivable | 6 262 | 7 003 | ||||
| 9 | Investment in Government enterprises | 18 334 | 17 365 | ||||
| 10 | Long-term investments | 2 148 | 1 977 | ||||
| Deferred expenses related to debts | 490 | 95 | |||||
| Advances to the health and social services and education networks and Government enterprises (Note 7) | 4 484 | 5 378 | |||||
| Assets for financing the fixed assets of the health and social services and education networks (Note 8) | 865 | 962 | |||||
| TOTAL FINANCIAL ASSETS | 37 071 | 34 225 | |||||
| LIABILITIES | |||||||
| 11 | Bank overdraft | 368 | 882 | ||||
| 12 | Accounts payable and accrued expenses | 8 978 | 8 579 | ||||
| Deferred revenue | 308 | 531 | |||||
| Pension plans (Note 5) | 38 426 | 38 060 | |||||
| 13 | Direct debt (Notes 6 and 7) | 76 032 | 69 426 | ||||
| 13 | Debt to finance the health and social services and education networks and Government enterprises (Notes 6 and 7) | 4 484 | 5 378 | ||||
| 13 | Debt to finance the work of municipal bodies (Notes 6 and 7) | 3 067 | 3 179 | ||||
| Allowance for financing the fixed assets of the health and social services and education networks (Note 8) | 865 | 962 | |||||
| TOTAL LIABILITIES | 132 528 | 126 997 | |||||
| 14 | NET DEBT | (95 457 | ) | (92 772 | ) | ||
| 15 | FIXED ASSETS (Note 4) | 9 716 | 8 234 | ||||
| ACCUMULATED DEFICIT | (85 741 | ) | (84 538 | ) | |||
| 16 | Commitments and contingencies (Note 9) | ||||||
| Subsequent events (Note 12) | |||||||
| 17 | Fiduciary transactions conducted by Government agencies and funds | ||||||
| 18 | Reserve fund |
9
Consolidated statement of financial requirements and financing
FISCAL YEAR ENDED MARCH 31, 2003
(in millions of dollars)
| | 2003 | 2002 | ||||||||
|---|---|---|---|---|---|---|---|---|---|---|
| | | | (Note 11) | |||||||
| OPERATING ACTIVITIES | ||||||||||
| Annual deficit | (694 | ) | (928 | ) | ||||||
| Items not affecting liquid assets: | ||||||||||
| Doubtful accounts and other allowances | 533 | 395 | ||||||||
| Sick leave and vacations | 55 | 75 | ||||||||
| Depreciation of fixed assets | 783 | 622 | ||||||||
| Amortization of deferred expenses related to debts | 37 | 72 | ||||||||
| Amortization of deferred foreign exchange loss | 129 | 153 | ||||||||
| Amortization of discounts and premiums | 48 | 1 585 | 61 | 1 378 | ||||||
| 891 | 450 | |||||||||
| Specific purpose accounts (Appendix 12) | ||||||||||
| Payments and other debits | (510 | ) | (527 | ) | ||||||
| Receipts and other credits | 496 | (14 | ) | 567 | 40 | |||||
| Changes in financial assets and liabilities related to operations | (484 | ) | (345 | ) | ||||||
| 393 | 145 | |||||||||
Activities related to pension plans | ||||||||||
| Pension costs (Note 5) | 1 451 | 1 395 | ||||||||
| Interest charges relating to pension plans (Note 5) | 3 389 | 4 840 | 3 322 | 4 717 | ||||||
| Benefits and other payments | (2 913 | ) | (2 720 | ) | ||||||
| Employee and independent employer contributions | 80 | (2 833 | ) | 92 | (2 628 | ) | ||||
| 2 007 | 2 089 | |||||||||
| Liquid assets provided by operating activities | 2 400 | 2 234 | ||||||||
INVESTMENT ACTIVITIES | ||||||||||
| Changes in investment in Government enterprises | ||||||||||
| Investments made | (340 | ) | (648 | ) | ||||||
| Share in the results of enterprises entered as revenue less declared dividends | (1 138 | ) | (1 478 | ) | (371 | ) | (1 019 | ) | ||
| Changes in long-term investments | ||||||||||
| Investments made | (545 | ) | (426 | ) | ||||||
| Investments realized | 310 | (235 | ) | 213 | (213 | ) | ||||
| Fixed assets | ||||||||||
| Acquisition | (2 270 | ) | (1 626 | ) | ||||||
| Disposal | 5 | (2 265 | ) | 9 | (1 617 | ) | ||||
| Liquid assets used for investment activities | (3 978 | ) | (2 849 | ) | ||||||
| NET FINANCIAL REQUIREMENTS | (1 578 | ) | (615 | ) | ||||||
10
Consolidated statement of financial requirements and financing (cont'd)
FISCAL YEAR ENDED MARCH 31, 2003
(in millions of dollars)
| | 2003 | 2002 | |||||||||
|---|---|---|---|---|---|---|---|---|---|---|---|
| | | | (Note 11) | ||||||||
| FINANCING ACTIVITIES | |||||||||||
| Changes in debts | |||||||||||
| Borrowings made | 11 430 | 9 011 | |||||||||
| Borrowings repaid | (5 121 | ) | 6 309 | (5 492 | ) | 3 519 | |||||
Activities related to pension plans | |||||||||||
| Changes in the Retirement Plans | |||||||||||
| Sinking Fund | |||||||||||
| Payments | (900 | ) | (2 535 | ) | |||||||
| Reinvestment of Fund investment income | (741 | ) | (1 641 | ) | (605 | ) | (3 140 | ) | |||
| Liquid assets provided by operating activities | 4 668 | 379 | |||||||||
| Changes in liquid assets(1) | (3 090 | ) | 236 | ||||||||
| NET FINANCING | 1 578 | 615 | |||||||||
- (1)
- Liquid assets include cash in bank (Appendix 11) and short-term investments (Appendix 7).
11
(This page has been left blank intentionally.)
12
Notes to financial statements
1. Significant accounting policies
The Gouvernement du Québec accounts for its financial transactions in accordance with the accounting policies disclosed below. When necessary, the information included in the consolidated financial statements is based on best estimates and judgments.
Reporting entity
The Government's reporting entity encompasses departments, agencies, enterprises and special funds which must account for the management of their financial transactions and resources to a Minister or directly to the National Assembly and which are part of the Government or under its control. They are listed in an appendix to the financial statements.
Fiduciary transactions conducted by certain agencies and funds are not included in the Government's reporting entity. These agencies and funds are listed in an appendix to the financial statements.
Consolidation method
The accounts of the Consolidated Revenue Fund and the other entities included in the Government's reporting entity, with the exception of Government enterprises, have been standardized and combined line by line in accordance with the accounting policies disclosed below. Inter-entity transactions and balances have been eliminated.
Investment in Government enterprises is accounted for using the modified equity method. Therefore, investment in these enterprises is recorded at cost, which is adjusted annually by the Government's share in the results of these enterprises with an offsetting entry to revenue, and reduced by the portion of dividends that are paid or reported by an enterprise and that accrue to the Government. A Government enterprise has all of the following characteristics:
- a)
- it is a separate legal entity that has the authority to enter into contracts in its own name and to go before a court;
- b)
- it is vested with the financial and administrative power to carry out commercial activities;
- c)
- its main activity is the sale of goods or the delivery of services to individuals or to organizations not included in the Government's reporting entity;
- d)
- it may, during the normal course of its operations, pursue its activities and settle its debts using revenue from sources not included in the Government's reporting entity.
13
Revenue
Revenue from income and property taxes, consumption taxes, duties, permits, fines and forfeitures is recorded in the fiscal year during which it is received, after deducting reimbursements and other amounts deductible under the applicable legislation. Assessments and amounts billed before the end of the fiscal year are entered as revenue.
Revenue from Government of Canada transfers is recorded in the fiscal year during which it is received. However, claims issued and estimates of revenue from transfers related to shared-cost programs without fiscal compensation are recorded in the fiscal year during which the related expenditures are made.
Other revenue is recorded on the accrual basis. Interest income ceases to be recorded when there is no reasonable assurance that the principal or interest will be recovered.
Expenditure
Transfers are recorded in the fiscal year during which the events that give rise to them occur, insofar as the transfers have been authorized and once beneficiaries have met the eligibility criteria.
Expenditure includes the cost of goods and services acquired during the fiscal year, with the exception of fixed assets for which an annual depreciation is recorded.
Debt service interest charges resulting from transactions in foreign currency are translated into Canadian dollars at the rates in effect at the time of the transactions.
Financial assets
Short-term investments are recorded at cost and accounts receivable, loans and advances are recorded initially at cost and then brought down to their net recoverable value through valuation allowances.
Investment in Government enterprises is recorded using the modified equity method.
Other long-term investments are entered at cost and reduced by any durable loss in value. The loss in value is charged to operations for the fiscal year during which it is known.
14
Liabilities
Accounts payable and accrued expenses
Specific purpose accounts
The Financial Administration Act (R.S.Q., c. A-6.001) provides for the creation of specific purpose accounts in which amounts received in respect of a contract or an agreement calling for the allocation of funds to a specific purpose may be deposited. Consequently, certain amounts receivable or payable under shared-cost programs without fiscal compensation or as a result of third-party compensation are recorded in specific purpose accounts.
Sick leave and vacations
Obligations relating to sick leave and vacations owed to Government employees are recorded as liabilities. The annual change in this account is posted to expenditure.
Allowance for losses on guaranteed financial initiatives
Obligations resulting from borrowings and other guaranteed financial initiatives are recorded as liabilities when a loss is probable. The annual change in this allowance is posted to expenditure.
The allowance for probable losses is evaluated using a rate based on past experience regarding losses on each of the guarantee programs. Special guarantees are grouped according to risk level.
Pension plans
Government pension plans are defined benefit pension plans. Within the context of preparing the Government's financial statements, obligations relating to vested benefits are evaluated using the actuarial projected benefit method prorated on service, according to the most probable assumptions set by the Government with regard, notably, to inflation, interest and employee remuneration. This method has been adjusted, however, to reflect the way in which benefits are earned by employees.
Total cost of plans
The annual cost of vested benefits for all pension plans, including the cost of changes to the plans, and the amortization of adjustments to estimates based on actuarial gains or losses are charged to expenditure, with an offsetting entry in the retirement plans account, i.e. pension plan liability. Changes to actuarial assumptions are included in the adjustments to estimates based on actuarial gains or losses.
15
In the case of the Government and Public Employees Retirement Plan (RREGOP), the Pension Plan of Management Personnel (PPMP), the Civil Service Superannuation Plan (CSSP), the Teachers Pension Plan (TPP), the Pension Plan of Certain Teachers (PPCT) and transfers from the TPP and the CSSP to RREGOP and the PPMP, adjustments to estimates based on actuarial gains or losses are amortized using the straight-line method over a period corresponding to the estimated average remaining years of service of participants in these plans as a whole. However, adjustments to estimates based on actuarial gains or losses for the other pension plans are amortized over a period corresponding to the estimated average remaining years of service of participants in each plan.
The total cost of the pension plans also includes interest charges on obligations relating to vested benefits, with an offsetting entry to liabilities in the retirement plans account.
Retirement Plans Sinking Fund (RPSF)
Under the Financial Administration Act (R.S.Q., c. A-6.001, s. 8), the Minister of Finance may make long-term investments, by way of a deposit with the Caisse de dépôt et placement du Québec, using part of the Consolidated Revenue Fund up to an amount equal to the sums recorded as the pension plans liability, in order to create a sinking fund to provide for the payment of all or part of the benefits awarded under these plans. The RPSF's assets are recorded at a value based on their market value. The RPSF's annual investment income is calculated by applying the nominal interest rate used in the most recent actuarial valuation to the RPSF's balance at the end of the previous fiscal year.
During the actuarial valuations conducted every three years, discrepancies that can be attributed to differences between revenue recorded since the most recent actuarial valuations and investment income valuated at its market value at the end of the fiscal year are amortized using the straight-line method over a period corresponding to the estimated average remaining years of service of participants, i.e. the period applicable to estimates based on actuarial gains or losses.
The RPSF's investment income and the amortization of discrepancies observed in the course of actuarial valuations are subtracted in calculating interest charges on obligations relating to vested benefits.
Debts
Borrowings are recorded at the amount received at the time of issue, adjusted by the premium or discount amortization to obtain the amount of principal repayable at maturity. The amortization is calculated using the effective rate for each borrowing.
16
Issue expenses related to debts are deferred and amortized over the term of each borrowing using the straight-line method. The unamortized balance is included in deferred expenses related to debts.
Borrowings in foreign currency are translated into Canadian dollars at the rates in effect on March 31.
Foreign exchange gains or losses resulting from the translation of borrowings are deferred and amortized over the remaining term of each borrowing using the straight-line method.
Derivative instruments
The Government uses derivative instruments to manage foreign exchange and interest rate risks related to debts. These instruments are recorded at cost.
Derivative instruments used to manage the foreign exchange risk associated with the repayment of interest and principal on borrowings and with the cash management transactions such risk management entails, including currency swap contracts and foreign exchange forward contracts, are translated into Canadian dollars at the rates in effect on March 31. The components of these instruments, namely, financial assets and liabilities, are offset against one another and shown as "Debts" items.
Interest rate exchanges stemming from interest rate swap contracts used to change exposure to interest rate risk over the long term are reconciled with interest charges for the borrowings with which these swap contracts are associated.
Gains or losses on derivative instruments are deferred and amortized over the term of each contract. However, foreign exchange gains or losses on short-term contracts aimed at modifying the foreign exchange risk associated with long-term borrowings are amortized over the remaining term of the borrowing portfolio in the currency concerned using the straight-line method.
Debt Sinking Fund
Securities held by the sinking fund are recorded at the amount paid at the time of purchase, adjusted by the premium or discount amortization to obtain the amount of principal receivable at maturity. The amortization is calculated on the basis of the effective rate for each security.
The difference between the book value of a security and the amount received at the time of its disposal is charged to results.
17
Fixed assets
Fixed assets consist of acquired, built, developed or improved non-financial assets, whose useful life extends beyond the fiscal year and which are intended to be used on an ongoing basis for producing goods or delivering services.
They include land, buildings, facilities such as parks and outdoor recreational areas, complex networks such as dams, canals, roads and bridges, equipment such as vehicles and furniture, and the development of data processing systems.
Fixed assets are recorded at cost and depreciated — except for land, which is not depreciated — using a logical, systematic method over a period corresponding to their useful life. They are a component of net debt. Their cost includes financing charges capitalized during their construction, improvement or development.
The cost of fixed assets held under capital leases is equal to the present value of payments due. Works of art and historic property are not recorded as fixed assets but are mentioned in a note to the financial statements, and their cost is charged to expenditure for the fiscal year during which they are acquired.
Fixed assets acquired through donation or for a nominal fee are recorded at their fair value at the time of acquisition with an offsetting entry to deferred revenue liabilities, which are gradually transferred to operating results using the same term and method of amortization as for the fixed assets concerned. However, land is recorded at its nominal value.
Sums received from agencies not included in the Government's reporting entity for the purchase of fixed assets are recorded as deferred revenue liabilities and gradually transferred to operating results using the same term and method of amortization as for the fixed assets concerned. However, contributions received for the purchase of land are deducted from the latter's cost.
2. Restatements
The Government made the following restatements:
Since certain recoveries are hard to estimate before they are received, the Government had to change the accounting application method for this revenue and record it on a cash basis rather than an accrual basis, in accordance with the rules of the Canadian Institute of Chartered Accountants.
18
From 1972 to 1999, Canada Customs and Revenue Agency (CCRA) made overpayments of more than $3.4 billion to four provinces in particular (Ontario, Manitoba, British Columbia and Alberta) in regard to personal income tax. The federal government announced, as part of a solution to the error, a change in equalization formula, which increased Québec's relative fiscal capacity and thus reduced its equalization entitlements. The negative impact of the federal solution to CCRA's error on Québec's equalization entitlements obliged the government to correct its financial results of the previous years by $215 million.
Employer contributions in respect of obligations relating to sick leave and vacations owed to employees, estimated at $177 million, are now recorded as liabilities under "Sick leave and vacations" whereas previously they were recorded when employees used their holidays.
Certain costs related to the improvement of premises are now capitalized and amortized under "Buildings" whereas previously they were charged to operations.
The Centre de recherche industrielle du Québec (CRIQ) has not achieved the financial autonomy initially sought by the Government. Therefore, CRIQ has been consolidated line by line whereas previously it was considered a Government enterprise and its operations were accounted for using the modified equity method.
The retroactive application of these restatements as a whole increased (decreased) the following financial statement items:
| | 2003 | 2002 | |||
|---|---|---|---|---|---|
| | (in millions of dollars) | ||||
| Revenue | 12 | 16 | |||
| Expenditure | 12 | 16 | |||
| Investment in Government enterprises | (24 | ) | (24 | ) | |
| Long-term investments | 10 | 10 | |||
| Accounts receivable | (61 | ) | (61 | ) | |
| Bank overdraft | 12 | 7 | |||
| Accounts payable and accrued expenses | 392 | 397 | |||
| Fixed assets | 73 | 73 | |||
| Accumulated deficit | 406 | 406 | |||
19
3. Revenue
According to applicable legislation, revenue is shown after deduction of the following items:
| | 2003 | 2002 | |||||
|---|---|---|---|---|---|---|---|
| | (in millions of dollars) | ||||||
| | | (Note 11) | |||||
| Personal income tax | |||||||
| Refundable tax credits: | |||||||
| Sales tax | 456 | 693 | |||||
| Day care expenses | 200 | 211 | |||||
| Other | 113 | 96 | |||||
| Property tax refunds | 230 | 243 | |||||
| Family assistance allowances | 3 | (2 | ) | ||||
| 1 002 | 1 241 | ||||||
| Corporate taxes | |||||||
| Refundable tax credits: | |||||||
| Scientific research and experimental development | 547 | 349 | |||||
| Cinematrographic productions | 110 | 97 | |||||
| Tax credits relating to the reporting of tips | 49 | 40 | |||||
| Other | 398 | 231 | |||||
| 1 104 | 717 | ||||||
| Duties and permits | |||||||
| Silvicultural work and other forest management activities | 230 | 198 | |||||
| Highway carrier monitoring | 48 | 48 | |||||
| Refundable mining duties credits for losses pertaining to exploration and capital expenditures and other | 5 | 3 | |||||
| 283 | 249 | ||||||
| 2 389 | 2 207 | ||||||
20
4. Fixed assets
Fixed assets are recorded at cost and shown in net debt. They are depreciated over their useful life using the following methods:
| Category | Depreciation method | Useful life | ||
|---|---|---|---|---|
| Buildings | Straight-line and annuity | 10 to 50 years | ||
| Facilities | Straight-line | 5 to 10 years | ||
| Complex networks | Straight-line | 10 to 40 years | ||
| Equipment | Straight-line | 3 to 20 years | ||
| Development of data processing systems | Straight-line | 5 to 10 years |
Works of art and historic property consist mainly of paintings, sculptures, drawings, prints, photographs, installations, films and videos and their cost is charged to expenditures for the fiscal year in which they are acquired.
21
5. Pension plans
The Gouvernement du Québec contributes to several pension plans for its employees. Employees of the public and parapublic sectors, the Members of the National Assembly and the judges of the Court of Québec participate in these plans.
Pension Plans
| | Estimated number of participants as at December 31, 2002 | Number of beneficiaries as at December 31, 2002 | |||
|---|---|---|---|---|---|
| Government and Public Employees Retirement Plan (RREGOP) | 465 000 | 110 436 | |||
| Pension Plan of Management Personnel (PPMP) | 24 200 | 12 591 | |||
| Teachers Pension Plan and Pension Plan of Certain Teachers (TPP and PPCT) | 5 925 | * | 46 182 | * | |
| Civil Service Superannuation Plan (CSSP) | 2 900 | * | 24 798 | * | |
| Superannuation Plan for the Members of the Sûreté du Québec (SPMSQ) | 5 000 | 3 677 | |||
| Pension Plan of Peace Officers in Correctional Services (PPPOCS) | 2 900 | 969 | |||
| Pension Plan of the Judges of the Court of Québec (PPJCQ) | 260 | 295 | |||
| Pension Plan for Federal Employees Transferred to Employment with the Gouvernement du Québec (PPFETQ) | 275 | 71 | |||
| Pension Plan of the Members of the National Assembly (PPMNA) | 122 | 264 | |||
| 506 582 | 199 283 | ||||
- *
- These plans have not admitted any new participants since July 1, 1973.
These plans are "defined benefit" pension plans, which means that they guarantee participants a set income upon retirement, calculated on the basis of participants' average income for the best paid years, generally five, and their number of years of service. The portion of benefits accrued prior to July 1, 1982 is usually indexed to the cost of living, while those accrued after that date are partially indexed.
| There are two types of pension plans: | cost-sharing pension plans; | |
| cost-balance pension plans. |
22
In the case of RREGOP and the PPMP, the Government covers costs at a rate of 50% for years of service since July 1, 1982 and 58.33% (7/12) for years of service prior to July 1, 1982. The contributions of participants and independent employers are paid into the Caisse de dépôt et placement du Québec.
In the case of the PPPOCS, the Government covers 46% of costs, while employees cover 54%. Employee contributions are paid into the Consolidated Revenue Fund.
Cost-balance pension plans
Cost-balance pension plans are plans for which employers cover the difference between the cost of plans and the contributions paid by participants. All Government plans except RREGOP, the PPMP and the PPPOCS fall into this category. The contributions of participants and independent employers to these cost-balance plans are paid into the Consolidated Revenue Fund. The Government covers the difference between the cost of each plan and the contributions paid by participants and independent employers.
Value of actuarial obligations relating to vested benefits for the pension plans as a whole
The value of actuarial obligations relating to vested benefits for the pension plans as a whole for service rendered as at a given date is determined by actuaries of the Commission administrative des régimes de retraite et d'assurances (CARRA). For this purpose, they use the actuarial projected benefit method prorated on service and take into account, among other things, the most probable long-term economic assumptions.
| Long-term economic assumptions: | ||
| — Yield, net of inflation | 4.85% | |
| — Inflation rate | 3.00% | |
| — Salary escalation rate, net of inflation | 1.10% |
Government's liability with regard to the pension plans
The Government's liability with regard to the pension plans is recorded in conformity with the recommendations of the Canadian Institute of Chartered Accountants for public sector pension plans.
The liability recorded with respect to the pension plans is established on the basis of the value of actuarial obligations relating to vested benefits for the pension plans as a whole, taking into account certain adjustments stemming from actuarial gains or losses noted during the actuarial valuations prepared every three years. These gains or losses are amortized using the accounting policy established for this purpose. The Government's liability with regard to the pension plans also includes interest charges calculated on the basis of the value of the actuarial obligations relating to vested benefits as at a given date for the pension plans as a whole.
23
As shown by the following table concerning the main pension plans, the Government's liability with regard to the pension plans as a whole is estimated at $50 266 million as at March 31, 2003, including $27 331 million for RREGOP and the PPMP.
PENSION PLANS LIABILITY
| | Actuarial obligations relating to vested benefits | Adjustments | Pension plans liability as at March 31, 2003 | Pension plans liability as at March 31, 2002 | ||||||
|---|---|---|---|---|---|---|---|---|---|---|
| | (in millions of dollars) | |||||||||
| RREGOP | ||||||||||
| — regular service | 21 346 | (1 093 | ) | 20 253 | 18 609 | |||||
| — transferred service | 2 487 | (219 | ) | 2 268 | 2 259 | |||||
| PPMP | ||||||||||
| — regular service | 4 013 | (284 | ) | 3 729 | 3 396 | |||||
| — transferred service | 1 179 | (98 | ) | 1 081 | 1 043 | |||||
| TPP and PPCT | 15 246 | (944 | ) | 14 302 | 14 364 | |||||
| CSSP | 5 271 | (254 | ) | 5 017 | 5 067 | |||||
| Other | 3 617 | (1 | ) | 3 616 | 3 521 | |||||
| 53 159 | (2 893 | ) | 50 266 | 48 259 | ||||||
| Sinking fund(1) | (9 240 | )(2) | (2 600 | ) | (11 840 | ) | (10 199 | ) | ||
| 43 919 | (5 493 | ) | 38 426 | 38 060 | ||||||
- (1)
- During fiscal 2002-2003 the Minister of Finance made investments of $900 million in the Retirement Plans Sinking Fund ($2 535 million in 2001-2002). At March 31, 2003, $741 million in investment income ($605 million in 2002) was reinvested in the sinking fund, and was taken into account in calculating the interest charges relating to pension plans.
- (2)
- This amount corresponds to the fair value of investments with the Caisse de dépôt et placement du Québec as at March 31, 2003.
Actuarial valuations and subsequent estimates
The most recent estimates, which were filed and issued in 2003, were determined on the basis of actuarial valuations as at December 31, 2001 for the PPMNA and the PPPOCS; as at December 31, 2000 for the PPCT, the PPJCQ, the SPMSQ, the PPFETQ, the PPMP (RRAS) and service transferred from the TPP and the CSSP to RREGOP and the PPMP; as at December 31, 1999 for the CSSP, the TPP, RREGOP and the PPMP, other than service transferred from the TPP and the CSSP to RREGOP and the PPMP, and for the PPMP (RRAS).
24
Total Cost of Pension Plans
| | 2003 | 2002 | ||||
|---|---|---|---|---|---|---|
| | (in millions of dollars) | |||||
| Pension costs | ||||||
| Cost of vested benefits excluding interest charges | 1 303 | 1 253 | ||||
| Employee contributions | (76 | ) | (88 | ) | ||
| Independant employer contributions | (4 | ) | (4 | ) | ||
| 1 223 | 1 161 | |||||
| Cost of changes | 3 | (1) | 28 | |||
| Amortization of adjustments to estimates based on actuarial gains or losses | 225 | 206 | ||||
| 1 451 | 1 395 | |||||
| Interest charges relating to the pension plans | 2 648 | (2) | 2 717 | (2) | ||
| Total | 4 099 | 4 112 | ||||
- (1)
- Under the Act to amend the pension plans of the public and parapublic sectors (2002, c, 30) assented to on June 14, 2002, changes with an impact of $3 million as at March 31, 2003 were made to the PPPOCS.
- (2)
- After deducting Retirement Plans Sinking Fund investment income of $741 million in 2002-2003 ($605 million in 2001-2002).
Funding of pension plans
Actuarial valuations for funding purposes for regular service under "cost-sharing" pension plans (RREGOP, PPMP AND PPPOCS)
By law, CARRA actuaries are required to prepare, every three years, an actuarial valuation for funding purposes for each of the pension plans in order to determine the rates of contribution for these plans. To that end, the actuaries take legislative provisions and collective agreements into account using the valuation method agreed upon by the parties concerned and economic assumptions that are more conservative than those used to prepare valuations for accounting purposes.
According to these valuations, Government commitments for funding purposes are calculated as the fund that the Government would have amassed had it been required to pay contributions since 1973 on the same bases as those used to determine the rate of contribution of participants. In the case of RREGOP and the PPMP, this fund was estimated at $32 677 million at fair value and $39 800 million at cost as at December 31, 2002 ($36 282 million at fair value and $41 147 million at cost as at December 31, 2001). In the case of the PPPOCS, for which employee contributions were paid into the Consolidated Revenue Fund, the value of the fund that would have been amassed by employees and the Government was $713 million at cost as at December 31, 2002 ($767 million as at December 31, 2001).
25
The difference between these amounts and the liability recorded for these three plans represents a non-payable amount that does not have to be recorded as a liability of the Government. The difference may be attributed to the use of different economic assumptions and methods.
6. Risk management and derivative instruments
To meet the financial requirements arising from its operations for repaying maturing loans and for maintaining the desired level of liquid assets, the Government has provided itself with an annual financing and debt-management program targeting Canadian and international financial markets.
Participation in these markets involves various types of risk. Therefore, the Government devises risk-management strategies by using the different derivative instruments at its disposal.
Foreign exchange risk
Foreign exchange risk is the risk that the cash flows needed to repay the interest and principal on loans in foreign currency will vary according to market fluctuations. To manage this risk, the Government uses derivative instruments such as currency swap contracts and foreign exchange forward contracts. The purpose of such contracts is to exchange cash flows from one currency to another. These contracts mature at various dates until 2013.
After taking into account derivative instruments used to manage foreign exchange risk, the structure of the debt as at March 31, 2003 was 83% in Canadian dollars, 4% in U.S. dollars, 10% in yen and 3% in Swiss francs (as at March 31, 2002: 81% in Canadian dollars, 7% in U.S. dollars and 12% in yen).
Interest rate risk
Interest rate risk is the risk that debt service will vary unfavourably according to interest rate fluctuations. To reduce its exposure to interest rate risk, the Government uses interest rate swap contracts or short-term derivative products. Interest rate swap contracts make it possible to exchange payments of interest at fixed rates for payments of interest at variable rates or vice versa on the basis of a reference par value.
After taking into account derivative instruments used to manage interest rate risk, the structure of the debt as at March 31, 2003 was 71% at fixed rates and 29% at variable rates (as at March 31, 2002: 71.5% at fixed rates and 28.5% at variable rates).
26
Credit risk
Credit risk is the risk that a counterparty will default on his contractual obligations, an event that could entail financial losses for the Government. To protect itself from such a risk within the scope of derivative instrument transactions, the Government has adopted a credit risk management policy that limits potential losses by counterparties.
A credit limit is set for each counterparty based mainly on his credit rating. When this limit is exceeded, a process is implemented to ensure that the amounts owed by the counterparty concerned fall within the limits set.
The Government deals with major financial institutions whose credit rating is equal to or higher than its own. As at March 31, 2003, over 95% of its derivative instrument portfolio was associated with counterparties that had a double "A" or better rating. All of the Government's counterparties had at least an "A" rating with a recognized credit rating agency.
Liquidity risk
Liquidity risk is the risk that the Government will not be able to meet its financial commitments over the short term. To offset this risk, the Government has obtained lines of credit totalling C$1 165 million from various Canadian banking institutions.
In addition, the Government has concluded credit agreements for U.S. $3 500 million with a Canadian and international banking syndicate.
As at March 31, 2003, none of these credit lines or agreements had been drawn upon.
27
| | 2003 | ||||||||
|---|---|---|---|---|---|---|---|---|---|
| | Direct | Health and social services and education networks and Government enterprises(1) | |||||||
| Currency | In millions of monetary units | Total in Canadian equivalent | In millions of monetary units | Total in Canadian equivalent | |||||
| | | (in millions of dollars) | | (in millions of dollars) | |||||
| In Canadian dollars | 44 925 | 44 925 | (3) | 4 523 | 4 523 | ||||
| In U.S. dollars | 11 948 | 17 571 | 3 | 4 | |||||
| In yen | 537 601 | 6 690 | |||||||
| In euros | 5 724 | 9 170 | |||||||
| In Swiss francs | 508 | 552 | |||||||
| Other currencies(4) | 903 | ||||||||
| Less: | |||||||||
| Derivative instruments — net | (669 | ) | 1 | ||||||
| Sinking fund | 3 552 | 42 | |||||||
| Debts before deferred foreing exchange loss | 76 928 | 4 484 | |||||||
| Deferred foreign exchange loss | 896 | ||||||||
| 76 032 | 4 484 | ||||||||
| | 2002 | ||||||||
|---|---|---|---|---|---|---|---|---|---|
| | Direct | Health and social services and education networks and Government enterprises(1) | |||||||
| Currency | In millions of monetary units | Total in Canadian equivalent | In millions of monetary units | Total in Canadian equivalent | |||||
| | | (in millions of dollars) | | (in millions of dollars) | |||||
| In Canadian dollars | 38 339 | 38 339 | (3) | 5 025 | 5 025 | ||||
| In U.S. dollars | 12 718 | 20 262 | 224 | 358 | |||||
| In yen | 547 816 | 6 583 | 7 004 | 84 | |||||
| In euros | 5 053 | 7 015 | |||||||
| In Swiss francs | 10 | 9 | |||||||
| Other currencies(4) | 1 539 | ||||||||
| Less: | |||||||||
| Derivative instruments — net | 327 | 55 | |||||||
| Sinking fund | 3 151 | 34 | |||||||
| Debts before deferred foreing exchange loss | 70 269 | 5 378 | |||||||
| Deferred foreign exchange loss | 843 | ||||||||
| 69 426 | 5 378 | ||||||||
- (See Notes 1, 2, 3 and 4 on page 30)
28
2003 | |||||||||||
|---|---|---|---|---|---|---|---|---|---|---|---|
| Work of municipal bodies(2) | Total | | | ||||||||
| In millions of monetary units | Total in Canadian equivalent | In millions of monetary units | Total in Canadian equivalent | Derivative instruments — net | Total after impact of derivative instruments | ||||||
| | (in millions of dollars) | | (in millions of dollars) | (in millions of dollars) | (in millions of dollars) | ||||||
| 2 045 | 2 045 | 51 493 | 51 493 | 22 350 | 73 843 | ||||||
| 315 | 463 | 12 266 | 18 038 | (14 704 | ) | 3 334 | |||||
| 5 000 | 62 | 542 601 | 6 752 | 1 637 | 8 389 | ||||||
| 284 | 455 | 6 008 | 9 625 | (9 625 | ) | ||||||
| 508 | 552 | 1 955 | 2 507 | ||||||||
| 903 | (903 | ) | |||||||||
| (42 | ) | (710 | ) | 710 | |||||||
| 3 594 | 3 594 | ||||||||||
| 3 067 | 84 479 | 84 479 | |||||||||
| 896 | 896 | ||||||||||
| 3 067 | 83 583 | 83 583 | |||||||||
2002 | |||||||||||
|---|---|---|---|---|---|---|---|---|---|---|---|
| Work of municipal bodies(2) | Total | | | ||||||||
| In millions of monetary units | Total in Canadian equivalent | In millions of monetary units | Total in Canadian equivalent | Derivative instruments — net | Total after impact of derivative instruments | ||||||
| | (in millions of dollars) | | (in millions of dollars) | (in millions of dollars) | (in millions of dollars) | ||||||
| 2 382 | 2 382 | 45 746 | 45 746 | 20 783 | 66 529 | ||||||
| 172 | 274 | 13 114 | 20 894 | (15 199 | ) | 5 695 | |||||
| 5 000 | 60 | 559 820 | 6 727 | 3 051 | 9 778 | ||||||
| 284 | 393 | 5 337 | 7 408 | (7 408 | ) | ||||||
| 10 | 9 | 9 | |||||||||
| 1 539 | (1 539 | ) | |||||||||
| (70 | ) | 312 | (312 | ) | |||||||
| 3 185 | 3 185 | ||||||||||
| 3 179 | 78 826 | 78 826 | |||||||||
| 843 | 843 | ||||||||||
| 3 179 | 77 983 | 77 983 | |||||||||
29
Weighted average interest rate(5)
| | | | Health and social services and education networks and Government enterprises | | | ||||||||
|---|---|---|---|---|---|---|---|---|---|---|---|---|---|
| | | | Work of municipal bodies | ||||||||||
| | Direct | ||||||||||||
| Currency | |||||||||||||
| 2003 | 2002 | 2003 | 2002 | 2003 | 2002 | ||||||||
| | | (Note 11) | | | | | |||||||
| In Canadian dollars | 6.36 | % | 6.73 | % | 6.48 | % | 6.54 | % | 6.33 | % | 7.11 | % | |
| In U.S. dollars | 6.68 | 6.54 | 1.41 | 4.73 | 7.28 | 8.53 | |||||||
| In yen | 3.63 | 3.61 | 0.72 | 9.89 | 9.89 | ||||||||
| In euros | 5.37 | 5.73 | 8.37 | 8.37 | |||||||||
| In Swiss francs | 3.16 | 3.16 | |||||||||||
| Weighted average rate | 6.07 | % | 6.30 | % | 6.48 | % | 6.33 | % | 6.96 | % | 7.51 | % | |
- (1)
- To offset this debt, advances to the health and social services and education networks and to Government enterprises are granted on the same conditions as these borrowings and recorded as financial assets.
- (2)
- Under the water treatment program, the Government is committed, in accordance with an agreement with the municipalities and the Société québécoise d'assainissement des eaux (SQAE), to contributing to the financing of work costs by repaying, based on date of maturity, the principal and interest on borrowings contracted by the SQAE.
- (3)
- The Government held $282 million worth of its securities as at March 31, 2003 ($400 million in 2002).
- (4)
- In 2002 and 2003, other currencies included the pound sterling, the Australian dollar and the Swedish krona. A detailed table by type of currency and debt is presented in Appendix 13.
- (5)
- The weighted average interest rate corresponds to the effective rate of borrowings.
Debt schedules after impact of derivative instruments
Direct
| Maturing on March 31(6) | In Canadian dollars(9) | In U.S. dollars(9) | In yen | In euros | In Swiss francs | Other | Total | |||||||
|---|---|---|---|---|---|---|---|---|---|---|---|---|---|---|
| | | | | | | | (in millions of dollars) | |||||||
| 2004 | 12 171 | (5 638 | ) | 3 236 | (244 | ) | 896 | (112 | ) | 10 309 | ||||
| 2005 | 5 187 | 32 | 38 | 5 257 | ||||||||||
| 2006 | 6 127 | 70 | 12 | 5 | 6 214 | |||||||||
| 2007 | 4 875 | 42 | 19 | 4 936 | ||||||||||
| 2008 | 5 168 | 29 | 46 | 110 | 5 353 | |||||||||
| 33 528 | (5 465 | ) | 3 351 | (129 | ) | 896 | (112 | ) | 32 069 | |||||
| 2009-2013 | 17 176 | 1 330 | 2 188 | 13 | 1 611 | (4 | ) | 22 314 | ||||||
| 2014-2018 | 1 315 | 514 | 2 580 | 81 | 4 490 | |||||||||
| 2019-2023 | 1 962 | 514 | 21 | 35 | 116 | 2 648 | ||||||||
| 2024-2028 | 2 808 | 3 572 | 249 | 6 629 | ||||||||||
| 2029 and thereafter | 6 349 | 2 429 | 8 778 | |||||||||||
| 63 138 | 2 894 | 8 389 | — | 2 507 | — | 76 928 | ||||||||
30
Health and social services and education networks and Government enterprises
| Maturing on March 31(7) | In Canadian dollars(9) | In U.S. dollars(9) | In yen | In euros | In Swiss francs | Other | Total | |||||||
|---|---|---|---|---|---|---|---|---|---|---|---|---|---|---|
| | | | | | | | (in millions of dollars) | |||||||
| 2004 | 1 366 | 1 366 | ||||||||||||
| 2005 | 76 | 76 | ||||||||||||
| 2006 | 885 | 885 | ||||||||||||
| 2007 | 12 | 12 | ||||||||||||
| 2008 | 653 | 653 | ||||||||||||
| 2 992 | 2 992 | |||||||||||||
| 2009-2013 | 760 | 760 | ||||||||||||
| 2014-2018 | 27 | 27 | ||||||||||||
| 2019-2023 | 345 | 345 | ||||||||||||
| 2024-2028 | 6 | 6 | ||||||||||||
| 2029 and thereafter | 354 | 354 | ||||||||||||
| 4 484 | 4 484 | |||||||||||||
Work of municipal bodies
| Maturing on March 31(7) | In Canadian dollars(9) | In U.S. dollars(9) | In yen | In euros | In Swiss francs | Other | Total | |||||||
|---|---|---|---|---|---|---|---|---|---|---|---|---|---|---|
| | | | | | | | (in millions of dollars) | |||||||
| 2004 | 832 | 832 | ||||||||||||
| 2005 | 270 | 270 | ||||||||||||
| 2006 | 382 | 382 | ||||||||||||
| 2007 | 402 | 402 | ||||||||||||
| 2008 | 205 | 205 | ||||||||||||
| 2 091 | 2 091 | |||||||||||||
| 2009-2013 | 926 | 926 | ||||||||||||
| 2014-2018 | 50 | 50 | ||||||||||||
| 3 067 | 3 067 | |||||||||||||
- (6)
- This schedule takes into account $2 784 million for treasury bills and $2 861 million for short-term borrowings in 2004 and was drawn up considering projected repayments of $674 million in 2004, $521 million in 2005, $424 million in 2006, $404 million in 2007, $493 million in 2008 and $931 million in 2009-2013 for savings products redeemable on demand.
- (7)
- This schedule includes an amount of $519 million, for treasury bills, maturing in 2004.
- (8)
- This schedule includes an amount of $1 million, for treasury bills, maturing in 2004.
- (9)
- These schedules take into account the sinking fund of $3 154 million for debts in Canadian dollars and $440 million for debts in U.S. dollars.
31
8. Allowance for financing the fixed assets of the health and social services and education networks
Under the General and Vocational Colleges Act (R.S.Q., c. C-29), the Education Act (R.S.Q., c. I-13.3), the University Investments Act (R.S.Q., c. I-17), the Act respecting health services and social services (R.S.Q., c. S-4.2) and the Act respecting health services and social services for Cree Native persons (R.S.Q., c. S-5), the Government has created sinking funds for the purpose of repaying, out of the sums deposited by the Minister responsible, borrowings (principal and interest) contracted to finance the fixed assets of organizations in the health and social services and education networks.
The net assets of these sinking funds are as follows:
| | 2003 | 2002 | |||
|---|---|---|---|---|---|
| | (in millions of dollars) | ||||
| Sinking funds relating to borrowings by: | |||||
| General and vocational colleges in Québec | 216 | 223 | |||
| Québec school boards | 277 | 309 | |||
| Québec university establishments | 241 | 278 | |||
| Québec health and social services organizations | 131 | 152 | |||
| 865 | 962 | ||||
9. Commitments and contingencies
- A)
- Commitments for transfers to school boards and educational institutions, health and social services institutions, municipalities and municipal bodies, and other beneficiaries are shown in summary form in Appendix 16. As at March 31, 2003, these commitments totalled $21 263 million ($19 682 million as at March 31, 2002).
- B)
- Net guaranteed financial initiatives as at March 31, 2003 totalled $45 699 million ($47 079 million as at March 31, 2002) including $36 723 million as at March 31, 2003 ($38 289 million as at March 31, 2002) related to Hydro-Québec loan guarantees. These net guaranteed financial initiatives are shown in summary form in Appendix 16.
- C)
- The Government is faced with claims and lawsuits, pending or potential. Some pertain to land claims by Native groups and benefit claims by social aid recipients under 30 years of age, while others, involving $745 million ($645 million in 2002), derive from breach of contract, personal injury or property damage and other similar causes. Since the outcome of these contingencies is uncertain, it is impossible to determine the potential loss the Government might incur.
32
10. Major transactions between Government enterprises and entities included in the Government's reporting entity
The most important transactions between the Government and its enterprises break down as follows:
| | 2003 | 2002 | |||
|---|---|---|---|---|---|
| | (in millions of dollars) | ||||
| | | (Note 11) | |||
| Revenue | |||||
| Income and property taxes | 509 | 511 | |||
| Sales of goods and services | 561 | 566 | |||
| 1 070 | 1 077 | ||||
| Expenditure | |||||
| Health and Social Services | 130 | 143 | |||
| Economy and Environment | 59 | 79 | |||
| Administration and Justice | 39 | 36 | |||
| 228 | 258 | ||||
| Fixed assets | 141 | 149 | |||
| Accounts receivable | 759 | 798 | |||
| Accounts payable and accrued expenses | 159 | 141 | |||
11. COMPARATIVE FIGURES
Certain comparative figures for 2002 were reclassified for consistency with the presentation adopted in 2003.
12. SUBSEQUENT EVENTS
The value of certain Government assets might be reduced over the coming fiscal years.
- •
- The audited financial statements of the Société générale de financement for the year ended December 31, 2003 show a loss of $511 million. The Government had already accounted for part of this loss, i.e. $177 million, as at March 31, 2003, and it will have to account for the remainder, i.e. $334 million, in the next fiscal year, in accordance with its accounting policies.
33
- •
- The current repositioning of the computerized assistance project for the integrated management of human, financial and material resources might lead to a reduction in the Government's fixed assets. However, given the progress of the work, it is not yet possible to determine the monetary impact of this reduction. These fixed assets have a carrying value of $114 million as at March 31, 2003.
The Government intends to table draft legislation in the coming months to separate the insurance mission of the Société de l'assurance automobile du Québec (SAAQ) from its other mandates. Accordingly, the funds collected from motorists for the insurance mission of the SAAQ will constitute a fund in trust separate from the amounts collected for its other mandates. The Government will also review the SAAQ's structures and will grant it more autonomy to strengthen its role as an insurance company. These steps will remove the insurance fund of the SAAQ from the Government's reporting entity as of 2003-2004.
On January 9, 2004, the Superior Court ruled on the issue of pay equity. The Government did not appeal the decision and is currently holding talks with union organizations on the application of the corrective measures to be taken. However, the monetary impact of these measures has not yet been determined.
34
Government departments and agencies whose financial transactions
were conducted within the Consolidated Revenue Fund and included
in the Government's reporting entity
Affaires municipales et Métropole
Commission municipale du Québec
Régie du logement
Agriculture, Pêcheries et Alimentation
Commission de protection du territoire agricole du Québec
Régie des marchés agricoles et alimentaires du Québec
Assemblée nationale
Commissaire au lobbyisme
Conseil du trésor, Administration et Fonction publique
Commission de la fonction publique
Conseil exécutif
Conseil permanent de la jeunesse
Culture et Communications
Commission de toponymie
Commission des biens culturels du Québec
Conseil supérieur de la langue française
Office québécois de la langue française
Éducation
Commission consultative de l'enseignement privé
Commission d'évaluation de l'enseignement collégial
Conseil supérieur de l'éducation
Emploi, Solidarité sociale
Commission des partenaires du marché du travail
Environnement
Bureau d'audiences publiques sur l'environnement
Famille, Enfance et Condition féminine
Conseil de la famille et de l'enfance
Conseil des aînés
Conseil du statut de la femme
Faune et Parcs
Société de la faune et des parcs du Québec
35
APPENDIX 1
Government departments and agencies whose financial transactions
were conducted within the Consolidated Revenue Fund and included
in the Government's reporting entity (cont'd)
Finances, Économie et Recherche
Inspecteur général des institutions financières
Industrie et Commerce
Justice
Comité de la rémunération des juges de la Cour du Québec et des cours municipales
Conseil de la justice administrative
Conseil de la magistrature
Tribunal des droits de la personne
Personnes désignées par l'Assemblée nationale
Directeur général des élections — Commission de la représentation
Protecteur du citoyen
Vérificateur général
Recherche, Science et Technologie
Agence d'évaluation des technologies et des modes d'intervention en santé
Conseil de la science et de la technologie
Régions
Relations avec les citoyens et Immigration
Commission d'accès à l'information
Commission des droits de la personne et des droits de la jeunesse
Conseil des relations interculturelles
Curateur public *
Office de la protection du consommateur
Relations internationales
Ressources naturelles
Revenu
Santé et Services sociaux
Conseil de la santé et du bien-être
Conseil médical du Québec
Office des personnes handicapées du Québec
Protecteur des usagers en matière de santé et de services sociaux
36
APPENDIX 1
Government departments and agencies whose financial transactions
were conducted within the Consolidated Revenue Fund and included
in the Government's reporting entity (cont'd)
Sécurité publique
Bureau des coroners
Comité de déontologie policière
Commissaire à la déontologie policière
Commission québécoise des libérations conditionnelles
Régie des alcools, des courses et des jeux
Tourisme, Loisir et Sport
Transports
Commission des transports du Québec
Travail
Commission de l'équité salariale
Conseil consultatif du travail et de la main-d'oeuvre
Conseil des services essentiels
Régie du bâtiment du Québec
- *
- This entity also conducts fiduciary transactions that are not included in the Government's reporting entity.
37
Agencies and special funds whose reporting entity
is included in the Government's reporting entity
Agencies
Agence de l'efficacité énergétique
Agence métropolitaine de transport(1)
Bibliothèque nationale du Québec
Bureau d'accréditation des pêcheurs et des aides-pêcheurs du Québec
Bureau des services financiers(1)
Centre de recherche industrielle du Québec
Commissaire de l'industrie de la construction
Commission de la capitale nationale du Québec
Commission de reconnaissance des associations d'artistes et des associations de producteurs
Commission des lésions professionnelles
Commission des normes du travail
Commission des relations de travail
Commission des services juridiques
Commission des valeurs mobilières du Québec
Conseil des arts et des lettres du Québec
Corporation d'urgences-santé
École nationale de police du Québec(1)
École nationale des pompiers du Québec(1)
Fondation de la faune du Québec
Fonds d'aide aux recours collectifs
Fonds d'assurance-prêts agricoles et forestiers
Fonds de la recherche en santé du Québec
Fonds québécois de la recherche sur la nature et les technologies
Fonds québécois de la recherche sur la société et la culture
Héma-Québec
Institut de la statistique du Québec
Institut de tourisme et d'hôtellerie du Québec(1)
Institut national de santé publique du Québec
Investissement Québec
La Financière agricole du Québec
Musée d'art contemporain de Montréal
Musée de la civilisation
Musée national des beaux-arts du Québec
Observatoire québécois de la mondialisation
Office de la sécurité du revenu des chasseurs et piégeurs cris
Office des professions du Québec
Office Québec-Amériques pour la jeunesse
Régie de l'assurance maladie du Québec
Régie de l'énergie
Régie des installations olympiques
Régie du cinéma
38
APPENDIX 2
Agencies and special funds whose reporting entity
is included in the Government's reporting entity (cont'd)
Agencies (cont'd)
Sidbec
Société de développement de la Zone de commerce international de Montréal à Mirabel
Société de développement des entreprises culturelles
Société de la Place des Arts de Montréal(1)
Société de télédiffusion du Québec (Télé-Québec)
Société des Traversiers du Québec
Société d'habitation du Québec(1)
Société du Centre des congrès de Québec
Société du Grand Théâtre de Québec
Société du Palais des congrès de Montréal
Société du parc industriel et portuaire de Bécancour
Société du parc industriel et portuaire Québec-Sud
Société immobilière du Québec
Société nationale de l'amiante
Société québécoise d'assainissement des eaux
Société québécoise de récupération et de recyclage
Société québécoise d'information juridique
Tribunal administratif du Québec
- (1)
- Entities whose year-end date does not correspond to March 31, 2003 and for which no data were available for the period between the end of their fiscal year and March 31, 2003.
Special funds
Assistance Fund for Independent Community Action
Assistance Fund for Victims of Crime
Civil Status Fund
Collection Fund
Financial Assistance Fund for Certain Disaster Areas
Financing Fund
Fonds du Centre financier de Montréal
Forestry Fund
Fund to Combat Poverty through Reintegration into the Labour Market
Fund for the Contributions of Motorists to Public Transit
Fund for the Management of Québec Immovables on Foreign Soil
Fund for the Sale of Goods and Services of the Ministère des Transports
Geographic Information Fund
Government Information Fund
Government Services Fund
39
APPENDIX 2
Agencies and special funds whose reporting entity
is included in the Government's reporting entity (cont'd)
Special funds (cont'd)
Health Services Fund
Horse-Racing Industry Fund
Ice Storm Fund
Information Technology Fund of the Conseil du trésor
Information Technology Fund of the Ministère de la Solidarité sociale
Information Technology Fund of the Ministère du Revenu
Labour Market Development Fund
Land Information Fund
Police Services Fund
Prescription Drug Insurance Fund
Québec Youth Fund
Regional Development Fund
Register Fund of the Ministère de la Justice
Road Network Preservation and Improvement Fund
Rolling Stock Management Fund
Sinking Fund relating to Borrowings by General and Vocational Colleges in Québec
Sinking Fund relating to Borrowings by Québec Health and Social Services Agencies
Sinking Fund relating to Borrowings by Québec School Boards
Sinking Fund relating to Borrowings by Québec University Establishments
Special Olympic Fund
Support Payments Fund *
Tourism Partnership Fund
- *
- This fund also conducts fiduciary transactions that are not included in the Government's reporting entity.
40
APPENDIX 3
Enterprises included in the Government's reporting entity
Capital Financière agricole inc.
Corporation d'hébergement du Québec
Financement-Québec
Fonds d'indemnisation du courtage immobilier
Hydro-Québec *
Immobilière SHQ
IQ Immigrants Investisseurs inc.
Loto-Québec
Régie de l'assurance-dépôts du Québec
Société de développement de la Baie James
Société de l'assurance automobile du Québec
Société des alcools du Québec
Société des établissements de plein air du Québec
Société générale de financement du Québec
Société Innovatech du Grand Montréal
Société Innovatech du Sud du Québec
Société Innovatech Québec et Chaudière — Appalaches
Société Innovatech Régions ressources
- *
- This enterprise also conducts fiduciary transactions that are not included in the Government's reporting entity.
41
Agencies and funds which conduct fiduciary transactions that are not included in the Government's reporting entity
Caisse de dépôt et placement du Québec
Comité Centraide — public sector
Commission administrative des régimes de retraite et d'assurances
Commission de la construction du Québec
Curateur public (fiduciary section)
Fonds central pour le bénéfice des personnes incarcérées
Fonds d'assurance-récolte
Fonds d'assurance-stabilisation des revenus agricoles
Fonds d'indemnisation des services financiers
Fonds du compte de stabilisation du revenu agricole
Fonds du régime tripartite d'assurance revenu brut à l'égard des récoltes
Fonds national de formation de la main-d'oeuvre
Guarantee Insurance Fund administered by the Régie des marchés agricoles et alimentaires du Québec
Hydro-Québec — pension plan
Régie des rentes du Québec
Support Payments Fund (fiduciary section)
Travel Agents' Security Funds
Trust funds
42
APPENDIX 5
Breakdown of revenue
FISCAL YEAR ENDED MARCH 31, 2003
| | 2003 | 2002 | |||||
|---|---|---|---|---|---|---|---|
| | (in millions of dollars) | ||||||
| | | (Notes 2 and 11) | |||||
| Income and property taxes | |||||||
| Personal income tax | 16 174 | 15 920 | |||||
| Contributions to the Health Services Fund | 4 461 | 4 599 | |||||
| Corporate taxes | 3 729 | 4 065 | |||||
| 24 364 | 24 584 | ||||||
Consumption taxes | |||||||
| Sales | 8 358 | 7 579 | |||||
| Fuel | 1 691 | 1 579 | |||||
| Tobacco | 935 | 741 | |||||
| Pari-mutuel | 14 | 14 | |||||
| 10 998 | 9 913 | ||||||
Duties and permits | |||||||
| Motor vehicles | 751 | 723 | |||||
| Alcoholic beverages | 155 | 140 | |||||
| Natural resources | 226 | 210 | |||||
| Other | 284 | 273 | |||||
| 1 416 | 1 346 | ||||||
Miscellaneous | |||||||
| Sales of goods and services | 1 782 | 1 595 | |||||
| Interest | 376 | 452 | |||||
| Fines, forfeitures and recoveries | 443 | 390 | |||||
| 2 601 | 2 437 | ||||||
Revenue from Government enterprises | |||||||
| Société des alcools du Québec | 540 | 489 | |||||
| Loto-Québec | 1 353 | 1 352 | |||||
| Hydro-Québec | 1 840 | 1 041 | |||||
| Other | 29 | (151 | ) | ||||
| 3 762 | 2 731 | ||||||
| Total own-source revenue | 43 141 | 41 011 | |||||
Government of Canada transfers | |||||||
| Equalization | 5 315 | 5 336 | |||||
| Canada Health and Social | |||||||
| Transfer | 2 648 | 2 958 | |||||
| Other programs | 1 344 | 1 011 | |||||
| Total Government of Canada transfers | 9 307 | 9 305 | |||||
| Total revenue | 52 448 | 50 316 | |||||
43
APPENDIX 6
Breakdown of expenditure
FISCAL YEAR ENDED MARCH 31, 2003
| | 2003 | 2002 | |||
|---|---|---|---|---|---|
| | (in millions of dollars) | ||||
| | | (Notes 2 and 11) | |||
| BY SUPERCATEGORY AND CATEGORY | |||||
| Transfer | |||||
| Remuneration | 19 954 | 19 237 | |||
| Operating | 4 099 | 3 732 | |||
| Capital | 1 094 | 1 154 | |||
| Interest | 1 216 | 1 230 | |||
| Support | 11 838 | 11 482 | |||
| 38 201 | 36 835 | ||||
| Remuneration | 4 198 | 3 902 | |||
| Operating(1) | 3 125 | 2 851 | |||
| Doubtful accounts and other allowances | 533 | 395 | |||
| Sub-total | 46 057 | 43 983 | |||
| Debt service | |||||
| Interest on debt(2) | 4 437 | 4 544 | |||
| Interest relating to pension plans(3) | 2 648 | 2 717 | |||
| Sub-total | 7 085 | 7 261 | |||
| Total expenditure | 53 142 | 51 244 | |||
- (1)
- Including $783 million in 2002-2003 ($622 million in 2001-2002) for the depreciation of fixed assets.
- (2)
- After deducting $617 million in revenue in 2002-2003 ($623 million in 2001-2002), including $324 million in interest income from advances to the health and social services and education networks and to Government enterprises ($385 million in 2001-2002), $27 million in short-term investment income ($52 million in 2001-2002), and $266 million in investment income of the Sinking Fund for Government Borrowings ($186 million in 2001-2002).
- (3)
- After deducting $741 million in investment income of the Retirement Plans Sinking Fund in 2002-2003 ($605 million in 2001-2002).
44
APPENDIX 7
Short-term investments
AS AT MARCH 31, 2003
| | 2003 | 2002 | ||
|---|---|---|---|---|
| | (in millions of dollars) | |||
| Treasury bills | 361 | 70 | ||
| Notes | 2 046 | |||
| Deposit certificates | 1 726 | 768 | ||
| Banker's acceptances | 204 | 115 | ||
| Bonds | 19 | 387 | ||
| Other | 132 | 105 | ||
| 4 488 | 1 445 | |||
Rates of return on short-term investments vary mainly from 1.1% to 6.45%.
45
APPENDIX 8
Accounts receivable
AS AT MARCH 31, 2003
| | 2003 | 2002 | ||||
|---|---|---|---|---|---|---|
| | (in millions of dollars) | |||||
| | | (Note 2) | ||||
| Accounts receivable | ||||||
| Income and property taxes(1) | 2 676 | 2 679 | ||||
| Consumption taxes(1) | 1 947 | 2 375 | ||||
| Duties and permits(1) | 144 | 130 | ||||
| Miscellaneous revenue | 1 423 | 1 265 | ||||
| Revenue from Government enterprises | 75 | 139 | ||||
| Government of Canada transfers | 503 | 700 | ||||
| Specific purpose accounts | 67 | 81 | ||||
| Expenditure and other | 193 | 521 | ||||
| 7 028 | 7 890 | |||||
| Allowance for doubtful accounts | (771 | ) | (904 | ) | ||
| Accrued interest on investments | 5 | 17 | ||||
| 6 262 | 7 003 | |||||
- (1)
- Including the portion attributable to agents and assignees, i.e. $672 million for income and property taxes ($667 million in 2002), $1 405 million for consumption taxes ($1 826 million in 2002) and $121 million for duties and permits ($103 million in 2002).
46
Investment in Government enterprises
AS AT MARCH 31, 2003
Investment in Government enterprises
| | | | 2003 | 2002 | |||||
|---|---|---|---|---|---|---|---|---|---|
| | Loans and advances | Equity value | Investment in Government enterprises | Investment in Government enterprises | |||||
| | | | (in millions of dollars) | ||||||
| | | | | (Note 2) | |||||
| Capital Financière agricole inc.(1) | 24 | 24 | |||||||
| Commission de la santé et de la sécurité du travail(5) | (680 | ) | |||||||
| Corporation d'hébergement du Québec(1) | 127 | 127 | 122 | ||||||
| Financement-Québec(1) | 36 | 36 | 27 | ||||||
| Fonds d'indemnisation du courtage immobilier(3) | 5 | 5 | 4 | ||||||
| Hydro-Québec(2)(4) | 7 | 15 082 | 15 089 | 14 133 | |||||
| Immobilière SHQ(3) | 23 | 23 | 19 | ||||||
| IQ Immigrants Investisseurs inc.(1) | 3 | 3 | |||||||
| Loto-Québec(1) | 235 | 235 | 193 | ||||||
| Régie de l'assurance-dépôts du Québec(3) | 258 | 258 | 231 | ||||||
| Société de développement de la Baie James(2) | 13 | 13 | 12 | ||||||
| Société de l'assurance automobile du Québec(2) | (128 | ) | (128 | ) | 505 | ||||
| Société des alcools du Québec(1) | 34 | 34 | 34 | ||||||
| Société des établissements de plein air du Québec(1) | 45 | 45 | 29 | ||||||
| Société générale de financement du Québec(2) | 2 159 | 2 159 | 2 323 | ||||||
| Société Innovatech du Grand Montréal(1) | 236 | 236 | 266 | ||||||
| Société Innovatech du Sud du Québec(1) | 33 | 33 | 33 | ||||||
| Société Innovatech Québec et Chaudière-Appalaches(1) | 100 | 100 | 81 | ||||||
| Société Innovatech Régions ressources(1) | 42 | 42 | 33 | ||||||
| Total | 7 | 18 327 | 18 334 | 17 365 | |||||
- (1)
- Equity value was determined on the basis of audited financial statements as at March 31, 2003.
- (2)
- Equity value was determined on the basis of audited financial statements as at December 31, 2002, and adjusted according to unaudited interim results as at March 31, 2003.
- (3)
- Equity value was determined on the basis of audited financial statements as at December 31, 2002.
- (4)
- Loans and advances to Hydro-Québec have no fixed maturity date.
- (5)
- Change of status (See page 50).
47
APPENDIX 9
Investment in Government enterprises (cont'd)
AS AT MARCH 31, 2003
Summary of the financial statements of Government enterprises
| | 2003 | 2002 | |||||||||||||
|---|---|---|---|---|---|---|---|---|---|---|---|---|---|---|---|
| | Revenue | Expenditure | Net income or (net loss) | Liabilities | Assets | Net equity | Net equity | ||||||||
| | | | | | | (in millions of dollars) | |||||||||
| | | | | | | (Notes 2 and 11) | |||||||||
| Capital Financière agricole inc.(1) | 1 | 1 | 24 | 24 | |||||||||||
| Commission de la santé et de la sécurité du travail(2) | (680 | ) | |||||||||||||
| Corporation d'hébergement du Québec(1) | 254 | 224 | 30 | 3 663 | 3 790 | 127 | 122 | ||||||||
| Financement-Québec(1) | 10 | 1 | 9 | 7 500 | 7 536 | 36 | 27 | ||||||||
| Fonds d'indemnisation du courtage immobilier(2) | 5 | 5 | 4 | ||||||||||||
| Hydro-Québec(2) | 13 002 | 11 476 | 1 526 | 44 863 | 59 078 | 14 215 | 13 539 | * | |||||||
| Immobilière SHQ(2) | 218 | 214 | 4 | 2 301 | 2 324 | 23 | 19 | ||||||||
| IQ Immigrants Investisseurs inc.(1) | 17 | 14 | 3 | 537 | 540 | 3 | |||||||||
| Loto-Québec(1) | 3 749 | 2 303 | 1 446 | 755 | 990 | 235 | 193 | ||||||||
| Régie de l'assurance-dépôts du Québec(2) | 28 | 1 | 27 | 1 | 259 | 258 | 231 | ||||||||
| Société de développement de la Baie James(2) | 22 | 22 | 6 | 19 | 13 | 12 | |||||||||
| Société de l'assurance automobile du Québec(2) | 1 105 | 1 265 | (160 | ) | 7 484 | 7 452 | (32 | ) | 491 | ||||||
| Société des alcools du Québec(1) | 2 413 | 1 873 | 540 | 618 | 652 | 34 | 34 | ||||||||
| Société des établissements de plein air du Québec(1) | 86 | 84 | 2 | 131 | 172 | 41 | 23 | ||||||||
Amounts carried forward | 20 905 | 17 478 | 3 427 | 67 859 | 82 841 | 14 982 | 14 015 | ||||||||
48
APPENDIX 9
Investment in Government enterprises (cont'd)
AS AT MARCH 31, 2003
Summary of the financial statements of Government enterprises (cont'd)
| | 2003 | 2002 | |||||||||||||
|---|---|---|---|---|---|---|---|---|---|---|---|---|---|---|---|
| | Revenue | Expenditure | Net income or (net loss) | Liabilities | Assets | Net equity | Net equity | ||||||||
| | | | | | | (in millions of dollars) | |||||||||
| | | | | | | (Notes 2 and 11) | |||||||||
| Amounts brought forward | 20 905 | 17 478 | 3 427 | 67 859 | 82 841 | 14 982 | 14 015 | ||||||||
| Société générale de financement du Québec(2) | 1 204 | 1 376 | (172 | ) | 832 | 3 168 | 2 336 | 2 333 | * | ||||||
| Société Innovatech du Grand Montréal(1) | 7 | 87 | (80 | ) | 1 | 237 | 236 | 266 | |||||||
| Société Innovatech du Sud du Québec(1) | 2 | 13 | (11 | ) | 33 | 33 | 33 | ||||||||
| Société Innovatech Québec et Chaudière-Appalaches(1) | 3 | 14 | (11 | ) | 100 | 100 | 81 | ||||||||
| Société Innovatech Régions ressources(1) | 3 | 3 | 42 | 42 | 33 | ||||||||||
| 22 124 | 18 971 | 3 153 | 68 692 | 86 421 | 17 729 | 16 761 | |||||||||
| Change in the status of an enterprise | 680 | ||||||||||||||
| Adjustments(3) | (71 | ) | 598 | 597 | |||||||||||
| 3 762 | 18 327 | 17 358 | |||||||||||||
- *
- Figures restated by entities.
- (1)
- These data were derived from audited financial statements as at March 31, 2003.
- (2)
- These data were derived from audited financial statements as at December 31, 2002.
- (3)
- These adjustments stem mainly from unaudited interim results as at March 31, 2003.
49
APPENDIX 9
Investment in Government enterprises (cont'd)
AS AT MARCH 31, 2003
Change in the status of the Commission de la santé et de la sécurité du travail
In December 2002, the Government adopted the Act to amend the Act respecting occupational health and safety. Under this Act, the Government acceded to the request of the Commission de la santé et de la sécurité du travail (CSST) for more autonomy in managing its resources.
The Act stipulates that the activities of the CSST would be transferred to a social trust patrimony, the Fonds de la santé et de la sécurité du travail, on January 1, 2003.
Since this patrimony is not included in the Government's reporting entity, the Government had to write off its investment worth a negative amount of $739 million in the CSST on January 1, 2003. The net impact of this change was a $680-million increase in revenue, considering the CSST's $59-million deficit for the period between April 1, 2002 and December 31, 2002.
Government's share in the restatements made by Government enterprises
Hydro-Québec
In January 2002, Hydro-Québec complied with the new private sector standard for foreign currency translation set by the Canadian Institute of Chartered Accountants (CICA). Hydro-Québec later revised the impact of this change upward by restating its financial statements by $32 million.
The Government therefore corrected and reduced its investment in this enterprise by $32 million retroactively to April 1, 2001 without restating its results for previous years.
Société de l'assurance automobile du Québec
On January 1, 2002, this enterprise eliminated the capping mechanism used in calculating deferred gains and losses on the basis of the real rate of return assumption. This change in accounting policy was applied retroactively without restating the results for previous fiscal years. Consequently, the enterprise's net equity was reduced by $363 million as at January 1, 2002, while the deficiency in revenue over expenditure was reduced by $104 million for the fiscal year ended December 31, 2002.
50
APPENDIX 9
Investment in Government enterprises (cont'd)
AS AT MARCH 31, 2003
Government's share in the restatements made by Government enterprises (cont'd)
Société de l'assurance automobile du Québec (cont'd)
The Government therefore corrected and reduced the value of its investment in this enterprise by $363 million retroactively to April 1, 2002, without restating its results for previous years and in increasing its revenue by $104 million for the fiscal year ended March 31, 2003.
Société générale de financement du Québec
On January 1, 2002, this enterprise had to comply with a new private sector standard set by the CICA for recording goodwill and other intangible assets. The enterprise applied the change in accounting policy prospectively by restating its net equity by $24 million as at January 1, 2002, in accordance with generally accepted accounting principles for the private sector.
The Government therefore corrected the value of its investment in this enterprise prospectively by restating the investment downward by $24 million as at April 1, 2002.
Total impact
In conformity with CICA standards for the public sector, the Government recorded the changes in accounting policies made by these enterprises in the same way they did. This increased (decreased) the following financial statement items:
| | At April 1, 2002 | At April 1, 2001 | |||
|---|---|---|---|---|---|
| | (in millions of dollars) | ||||
| Investment in Government enterprises | (387 | ) | (32 | ) | |
| Accumulated deficit | 387 | 32 | |||
51
APPENDIX 9
Investment in Government enterprises (cont'd)
AS AT MARCH 31, 2003
Commitments
Corporation d'hébergement du Québec
As at March 31, 2003, the uncompleted balance of contracts signed by the Corporation and related to ongoing projects subject to contractual commitments totalled $122 million ($66 million in 2002).
Hydro-Québec
Hydro-Québec has provided for a capital investment of $3 104 million for 2003 ($2 243 million for 2002).
Hydro-Québec has issued guarantees for an amount of $90 million as at March 31, 2003 ($220 million as at March 31, 2002).
Société générale de financement
The Société is committed to acquiring $388 million worth of tangible assets over the coming fiscal years.
52
Long-term investments
AS AT MARCH 31, 2003
Government investments
| | 2003 | 2002 | |||||||||
|---|---|---|---|---|---|---|---|---|---|---|---|
| | Shares and capital investments | Bonds and notes | Loans and advances | Total | Total | ||||||
| | | | | (in millions of dollars) | |||||||
| | | | | | (Note 2) | ||||||
| Municipalities and municipal bodies | |||||||||||
| Municipalities | 7 | (1) | 7 | 9 | |||||||
| Municipal bodies | 3 | (1) | 3 | 4 | |||||||
| 7 | 3 | 10 | 13 | ||||||||
| Individuals, enterprises and other | |||||||||||
| Students | 782 | (2) | 782 | 688 | |||||||
| Enterprises | 150 | 1 031 | (3) | 1 181 | 989 | ||||||
| Survivor's pension plan | 358 | (4) | 358 | 384 | |||||||
| Other | 91 | (4) | 424 | (4) | 515 | 488 | |||||
| 150 | 91 | 2 595 | 2 836 | 2 549 | |||||||
| Allowance for doubtful accounts | 698 | 698 | 585 | ||||||||
| 150 | 91 | 1 897 | 2 138 | 1 964 | |||||||
| 150 | 98 | 1 900 | 2 148 | 1 977 | |||||||
- (1)
- Bonds and notes and loans and advances to municipalities and municipal bodies bear interest at rates of 6.3% to 10.0%.
- (2)
- Loans and advances to students bear interest at rates of 4.5% to 14.9%.
- (3)
- Loans to enterprises bear interest at an average rate of 6.25%.
- (4)
- The loan on the survivor's pension plan bears interest at a rate of 1.75% while all other loans and advances, bonds and notes bear interest at various rates of up to 13.25%.
53
APPENDIX 10
Long-term investments (cont'd)
AS AT MARCH 31, 2003
Maturity of investments
| | 2003 | |
|---|---|---|
| | (in millions of dollars) | |
| 2004 | 340 | |
| 2005 | 330 | |
| 2006 | 169 | |
| 2007 | 176 | |
| 2008 | 135 | |
| 1 150 | ||
| 2009-2013 | 513 | |
| 2014-2018 | 168 | |
| 2019-2023 | 7 | |
| 1 838 | ||
| No fixed maturity date | 310 | |
| 2 148 | ||
54
APPENDIX 11
Bank overdraft
AS AT MARCH 31, 2003
| | 2003 | 2002 | |||
|---|---|---|---|---|---|
| | (in millions of dollars) | ||||
| | | (Notes 2 and 11) | |||
| Outstanding cheques | 743 | 1 278 | |||
| Less: | |||||
| Cash in bank | 245 | 198 | |||
| Cash and notes on hand and outstanding deposits | 130 | 198 | |||
| 368 | 882 | ||||
55
APPENDIX 12
Accounts payable and accrued expenses
AS AT MARCH 31, 2003
| | 2003 | 2002 | ||
|---|---|---|---|---|
| | (in millions of dollars) | |||
| | | (Notes 2 and 11) | ||
| Remuneration | 626 | 540 | ||
| Suppliers | 1 315 | 1 375 | ||
| Advances from trust funds | 446 | 230 | ||
| Clearing account for collected taxes | 109 | 106 | ||
| Specific purpose accounts(1) | 40 | 54 | ||
| Transfers | 2 033 | 2 027 | ||
| Accrued interest on borrowings | 1 816 | 1 764 | ||
| Sick leave and vacations(2) | 1 234 | 1 173 | ||
| Allowance for losses on guaranteed financial initiatives(2) | 1 027 | 978 | ||
| Survivor's pension plan(2) | 332 | 332 | ||
| 8 978 | 8 579 | |||
- (1)
- Summary of specific purpose accounts (see table on next page).
- (2)
- Includes mainly amounts payable over the long-term.
56
APPENDIX 12
Accounts payable and accrued expenses (cont'd)
AS AT MARCH 31, 2003
- (1)
- Summary of specific purpose accounts:
| | Balance as at March 31, 2002 | Payments and other debits | Receipts and other credits | Variation for the year | Balance as at March 31, 2003 | |||||
|---|---|---|---|---|---|---|---|---|---|---|
| | (in millions of dollars) | |||||||||
| SALES OF GOODS AND SERVICES | ||||||||||
| Account for administering the Goods and Services Tax | 2 | 114 | 112 | (2 | ) | |||||
| Account for financing the assistance program for compulsive gamblers | 10 | 18 | 20 | 2 | 12 | |||||
| Account for financing services for elderly persons who are losing their autonomy | 2 | 31 | 30 | (1 | ) | 1 | ||||
| Account for financing the Prime-Vert and Québec animal health improvement programs | 21 | 21 | (21 | ) | ||||||
| Account for financing the horse-racing industry recovery plan | 1 | 23 | 23 | 1 | ||||||
| Other | 9 | 34 | 42 | 8 | 17 | |||||
GOVERNMENT OF CANADA TRANSFERS | ||||||||||
| Account for financing millennium scholarships | 1 | 71 | 73 | 2 | 3 | |||||
| Account for financing farm risk management programs | 2 | 119 | 122 | 3 | 5 | |||||
| Account for infrastructure work | 38 | 38 | ||||||||
| Other | 6 | 41 | 36 | (5 | ) | 1 | ||||
| 54 | 510 | 496 | (14 | ) | 40 | |||||
57
Debts
AS AT MARCH 31, 2003
| | 2003 | |||||||||||||||||
|---|---|---|---|---|---|---|---|---|---|---|---|---|---|---|---|---|---|---|
| | Direct | Health and social services and education networks and Government enterprises | Work of municipal bodies | Total | ||||||||||||||
| Currency | In millions of monetary units | Total in Canadian equivalent | In millions of monetary units | Total in Canadian equivalent | In millions of monetary units | Total in Canadian equivalent | In millions of monetary units | Total in Canadian equivalent | ||||||||||
| | | (in millions of dollars) | | (in millions of dollars) | | (in millions of dollars) | | (in millions of dollars) | ||||||||||
| IN CANADIAN DOLLARS | ||||||||||||||||||
| Short-term borrowings(1) | 2 516 | 2 516 | 2 516 | 2 516 | ||||||||||||||
| Treasury bills | 2 784 | 2 784 | 519 | 519 | 1 | 1 | 3 304 | 3 304 | ||||||||||
| Savings products | 3 447 | 3 447 | 3 447 | 3 447 | ||||||||||||||
| Bonds and notes | 31 969 | 31 969 | 3 964 | 3 964 | 1 824 | 1 824 | 37 757 | 37 757 | ||||||||||
| Medium-term notes on the Canadian market | 3 827 | 3 827 | 40 | 40 | 3 867 | 3 867 | ||||||||||||
| Medium-term notes on the European market | 200 | 200 | 220 | 220 | 420 | 420 | ||||||||||||
| Commitments under capital leases | 182 | 182 | 182 | 182 | ||||||||||||||
| Currency swap contracts | 21 325 | 21 325 | 3 | 3 | 1 022 | 1 022 | 22 350 | 22 350 | ||||||||||
| 66 250 | 66 250 | 4 526 | 4 526 | 3 067 | 3 067 | 73 843 | 73 843 | |||||||||||
| IN U.S. DOLLARS | ||||||||||||||||||
| Short-term borrowings(1) | 225 | 345 | 225 | 345 | ||||||||||||||
| Bonds and notes | 10 021 | 14 724 | 3 | 4 | 215 | 316 | 10 239 | 15 044 | ||||||||||
| Medium-term notes on the Canadian market | 13 | 20 | 13 | 20 | ||||||||||||||
| Medium-term notes on the U.S. market | 910 | 1 337 | 100 | 147 | 1 010 | 1 484 | ||||||||||||
| Medium-term notes on the European market | 779 | 1 145 | 779 | 1 145 | ||||||||||||||
| Currency swap contracts | (9 679 | ) | (14 237 | ) | (3 | ) | (4 | ) | (315 | ) | (463 | ) | (9 997 | ) | (14 704 | ) | ||
| 2 269 | 3 334 | — | — | — | — | 2 269 | 3 334 | |||||||||||
| IN YEN | ||||||||||||||||||
| Bonds and notes | 208 957 | 2 600 | 5 000 | 62 | 213 957 | 2 662 | ||||||||||||
| Medium-term notes on the U.S. market | 3 392 | 42 | 3 392 | 42 | ||||||||||||||
| Medium-term notes on the European market | 325 252 | 4 048 | 325 252 | 4 048 | ||||||||||||||
| Currency swap contracts | 136 514 | 1 699 | (5 000 | ) | (62 | ) | 131 514 | 1 637 | ||||||||||
| 674 115 | 8 389 | — | — | 674 115 | 8 389 | |||||||||||||
| AMOUNTS CARRIED FORWARD | 77 973 | 4 526 | 3 067 | 85 566 | ||||||||||||||
58
APPENDIX 13
Debts (cont'd)
AS AT MARCH 31, 2003
| | 2003 | |||||||||||||||||
|---|---|---|---|---|---|---|---|---|---|---|---|---|---|---|---|---|---|---|
| | Direct | Health and social services and education networks and Government enterprises | Work of municipal bodies | Total | ||||||||||||||
| Currency | In millions of monetary units | Total in Canadian equivalent | In millions of monetary units | Total in Canadian equivalent | In millions of monetary units | Total in Canadian equivalent | In millions of monetary units | Total in Canadian equivalent | ||||||||||
| | | (in millions of dollars) | | (in millions of dollars) | | (in millions of dollars) | | (in millions of dollars) | ||||||||||
| AMOUNTS BROUGHT FORWARD | 77 973 | 4 526 | 3 067 | 85 566 | ||||||||||||||
| IN EUROS | ||||||||||||||||||
| Bonds and notes | 4 766 | 7 635 | 233 | 373 | 4 999 | 8 008 | ||||||||||||
| Medium-term notes on the European market | 958 | 1 535 | 51 | 82 | 1 009 | 1 617 | ||||||||||||
| Currency swap contracts | (5 724 | ) | (9 170 | ) | (284 | ) | (455 | ) | (6 008 | ) | (9 625 | ) | ||||||
| — | — | — | — | — | — | |||||||||||||
| IN SWISS FRANCS | ||||||||||||||||||
| Bonds and notes | 508 | 552 | 508 | 552 | ||||||||||||||
| Currency swap contracts | 1 800 | 1 955 | 1 800 | 1 955 | ||||||||||||||
| 2 308 | 2 507 | 2 308 | 2 507 | |||||||||||||||
| IN POUNDS STERLING | ||||||||||||||||||
| Bonds and notes | 198 | 461 | 198 | 461 | ||||||||||||||
| Currency swap contracts | (198 | ) | (461 | ) | (198 | ) | (461 | ) | ||||||||||
| IN AUSTRALIAN DOLLARS | ||||||||||||||||||
| Bonds and notes | 399 | 355 | 399 | 355 | ||||||||||||||
| Currency swap contracts | (399 | ) | (355 | ) | (399 | ) | (355 | ) | ||||||||||
| — | — | — | — | |||||||||||||||
| IN SWEDISH KRONOR | ||||||||||||||||||
| Bonds and notes | 502 | 87 | 502 | 87 | ||||||||||||||
| Currency swap contracts | (502 | ) | (87 | ) | (502 | ) | (87 | ) | ||||||||||
| — | — | — | — | |||||||||||||||
| 80 480 | 4 526 | 3 067 | 88 073 | |||||||||||||||
| Less: | ||||||||||||||||||
| Sinking fund | 3 552 | 42 | 3 594 | |||||||||||||||
| Deferred foreign exchange loss | 896 | 896 | ||||||||||||||||
| 76 032 | 4 484 | 3 067 | 83 583 | |||||||||||||||
- (1)
- Short-term borrowings in 2003 include $207 million in banker's acceptances and bank loans, $345 million in Treasury notes, $1 910 million in notes at par and $399 million in discount notes.
59
APPENDIX 13
Debts (cont'd)
AS AT MARCH 31, 2003
| | 2002 | |||||||||||||||||
|---|---|---|---|---|---|---|---|---|---|---|---|---|---|---|---|---|---|---|
| | Direct | Health and social services and education networks and Government enterprises | Work of municipal bodies | Total | ||||||||||||||
| Currency | In millions of monetary units | Total in Canadian equivalent | In millions of monetary units | Total in Canadian equivalent | In millions of monetary units | Total in Canadian equivalent | In millions of monetary units | Total in Canadian equivalent | ||||||||||
| | | (in millions of dollars) | | (in millions of dollars) | | (in millions of dollars) | | (in millions of dollars) | ||||||||||
| | | (Note 11) | | | | | | (Note 11) | ||||||||||
| IN CANADIAN DOLLARS | ||||||||||||||||||
| Short-term borrowings(1) | 670 | 670 | 670 | 670 | ||||||||||||||
| Treasury bills | 2 530 | 2 530 | 344 | 344 | 95 | 95 | 2 969 | 2 969 | ||||||||||
| Savings products | 3 031 | 3 031 | 3 031 | 3 031 | ||||||||||||||
| Bonds and notes | 28 817 | 28 817 | 4 596 | 4 596 | 2 287 | 2 287 | 35 700 | 35 700 | ||||||||||
| Medium-term notes on the Canadian market | 3 060 | 3 060 | 85 | 85 | 3 145 | 3 145 | ||||||||||||
| Medium-term notes on the European market | 30 | 30 | 30 | 30 | ||||||||||||||
| Commitments under capital leases | 201 | 201 | 201 | 201 | ||||||||||||||
| Currency swap contracts | 19 599 | 19 599 | 387 | 387 | 797 | 797 | 20 783 | 20 783 | ||||||||||
| 57 938 | 57 938 | 5 412 | 5 412 | 3 179 | 3 179 | 66 529 | 66 529 | |||||||||||
| IN U.S. DOLLARS | ||||||||||||||||||
| Short-term borrowings(1) | 840 | 1 333 | 840 | 1 333 | ||||||||||||||
| Bonds and notes | 10 115 | 16 118 | 3 | 4 | 72 | 117 | 10 190 | 16 239 | ||||||||||
| Medium-term notes on the Canadian market | 13 | 21 | 13 | 21 | ||||||||||||||
| Medium-term notes on the U.S. market | 900 | 1 435 | 142 | 228 | 100 | 157 | 1 142 | 1 820 | ||||||||||
| Medium-term notes on the European market | 850 | 1 355 | 79 | 126 | 929 | 1 481 | ||||||||||||
| Currency swap contracts | (9 145 | ) | (14 567 | ) | (224 | ) | (358 | ) | (172 | ) | (274 | ) | (9 541 | ) | (15 199 | ) | ||
| 3 573 | 5 695 | — | — | — | — | 3 573 | 5 695 | |||||||||||
| IN YEN | ||||||||||||||||||
| Bonds and notes | 215 627 | 2 591 | 5 000 | 60 | 5 000 | 60 | 225 627 | 2 711 | ||||||||||
| Medium-term notes on the U.S. market | 3 392 | 41 | 3 392 | 41 | ||||||||||||||
| Medium-term notes on the European market | 328 797 | 3 951 | 2 004 | 24 | 330 801 | 3 975 | ||||||||||||
| Currency swap contracts | 265 942 | 3 195 | (7 004 | ) | (84 | ) | (5 000 | ) | (60 | ) | 253 938 | 3 051 | ||||||
| 813 758 | 9 778 | — | — | — | — | 813 758 | 9 778 | |||||||||||
| AMOUNTS CARRIED FORWARD | 73 411 | 5 412 | 3 179 | 82 002 | ||||||||||||||
60
APPENDIX 13
Debts (cont'd)
AS AT MARCH 31, 2003
| | 2002 | |||||||||||||||||
|---|---|---|---|---|---|---|---|---|---|---|---|---|---|---|---|---|---|---|
| | Direct | Health and social services and education networks and Government enterprises | Work of municipal bodies | Total | ||||||||||||||
| Currency | In millions of monetary units | Total in Canadian equivalent | In millions of monetary units | Total in Canadian equivalent | In millions of monetary units | Total in Canadian equivalent | In millions of monetary units | Total in Canadian equivalent | ||||||||||
| | | (in millions of dollars) | | (in millions of dollars) | | (in millions of dollars) | | (in millions of dollars) | ||||||||||
| | | (Note 11) | | | | | | (Note 11) | ||||||||||
| AMOUNTS BROUGHT FORWARD | 73 411 | 5 412 | 3 179 | 82 002 | ||||||||||||||
| IN EUROS | ||||||||||||||||||
| Bonds and notes | 3 993 | 5 543 | 233 | 323 | 4 226 | 5 866 | ||||||||||||
| Medium-term notes on the European market | 1 060 | 1 472 | 51 | 70 | 1 111 | 1 542 | ||||||||||||
| Currency swap contracts | (5 053 | ) | (7 015 | ) | (284 | ) | (393 | ) | (5 337 | ) | (7 408 | ) | ||||||
| — | — | — | — | — | — | |||||||||||||
| IN SWISS FRANCS | ||||||||||||||||||
| Bonds and notes | 510 | 482 | 510 | 482 | ||||||||||||||
| Currency swap contracts | (500 | ) | (473 | ) | (500 | ) | (473 | ) | ||||||||||
| 10 | 9 | 10 | 9 | |||||||||||||||
| IN POUNDS STERLING | ||||||||||||||||||
| Bonds and notes | 198 | 450 | 198 | 450 | ||||||||||||||
| Currency swap contracts | (198 | ) | (450 | ) | (198 | ) | (450 | ) | ||||||||||
| — | — | — | — | |||||||||||||||
| IN AUSTRALIAN DOLLARS | ||||||||||||||||||
| Bonds and notes | 634 | 539 | 634 | 539 | ||||||||||||||
| Currency swap contracts | (634 | ) | (539 | ) | (634 | ) | (539 | ) | ||||||||||
| — | — | — | — | |||||||||||||||
| IN SWEDISH KRONOR | ||||||||||||||||||
| Bonds and notes | 504 | 77 | 504 | 77 | ||||||||||||||
| Currency swap contracts | (504 | ) | (77 | ) | (504 | ) | (77 | ) | ||||||||||
| — | — | — | — | |||||||||||||||
| 73 420 | 5 412 | 3 179 | 82 011 | |||||||||||||||
| Less: | ||||||||||||||||||
| Sinking fund | 3 151 | 34 | 3 185 | |||||||||||||||
| Deferred foreign exchange loss | 843 | 843 | ||||||||||||||||
| 69 426 | 5 378 | 3 179 | 77 983 | |||||||||||||||
- (1)
- Short-term borrowings in 2002 include $361 million in banker's acceptances and bank loans, $1 333 million in Treasury notes, $3 million in notes at par and $306 million in discount notes.
61
APPENDIX 13
Debts (cont'd)
AS AT MARCH 31, 2003
Sinking fund
Changes in fund balance
for the fiscal year ended March 31, 2003
| | 2003 | 2002 | |||||
|---|---|---|---|---|---|---|---|
| | (in milllions of dollars) | ||||||
| Opening balance | 3 185 | 2 062 | |||||
| Plus: | |||||||
| Payment from the Consolidated Revenue Fund | 141 | 939 | |||||
| Net revenue | 268 | 186 | |||||
| 3 594 | 3 187 | ||||||
| Less: | |||||||
| Funds used to repay debts | 2 | ||||||
| Closing balance | 3 594 | (1) | 3 185 | (1) | |||
Sinking fund
Statement of financial position
as at March 31, 2003
| | 2003 | 2002 | ||||
|---|---|---|---|---|---|---|
| | (in millions of dollars) | |||||
| Investments | ||||||
| Treasury bills | 48 | 112 | ||||
| Bonds and notes | 3 447 | 3 037 | ||||
| 3 495 | 3 149 | |||||
| Other assets | ||||||
| Cash on hand | 1 | 5 | ||||
| Accounts receivable and accrued interest | 74 | 48 | ||||
| Deferred loss on short-term contract | 24 | |||||
| 99 | 53 | |||||
| Liabilities | ||||||
| Deferred foreign exchange gain | 17 | |||||
| Fund balance | 3 594 | (1) | 3 185 | (1) | ||
- (1)
- Including $42 million ($34 million in 2002) from the Sinking Fund for Government Borrowings contracted to finance the health and social services and education networks and Government enterprises.
62
Net debt
FOR THE FISCAL YEAR ENDED MARCH 31, 2003
| | 2003 | 2002 | |||
|---|---|---|---|---|---|
| | (in millions of dollars) | ||||
| PREVIOUSLY ESTABLISHED OPENING BALANCE | 92 261 | 90 426 | |||
| Restatements (Note 2) | 479 | 479 | |||
| Government's share of restatements made by Government enterprises, April 1st, 2001 (annexe 9) | 32 | 32 | |||
| 92 772 | 90 937 | ||||
| Government's share of restatements made by Government enterprises, April 1st, 2002 (annexe 9) | 387 | ||||
| Restated balance | 93 159 | 90 937 | |||
| Government's share of translation adjustments of Government enterprises | 122 | (88 | ) | ||
| Increase in the net book value of fixed assets | 1 482 | 995 | |||
| Annual deficit | 694 | 928 | |||
| Annual change in net debt | 2 298 | 1 835 | |||
| CLOSING BALANCE | 95 457 | 92 772 | |||
63
APPENDIX 15
Fixed assets
AS AT MARCH 31, 2003
| | Land | Buildings | Facilities | Complex networks | Equipment | Development of data processing systems | 2003 Total | 2002 Total | ||||||||||
|---|---|---|---|---|---|---|---|---|---|---|---|---|---|---|---|---|---|---|
| | | | | | | | (in millions of dollars) | |||||||||||
| Cost of fixed assets | ||||||||||||||||||
| Opening balance | 355 | 3 721 | 176 | 12 548 | 1 915 | 977 | 19 692 | 18 196 | ||||||||||
| Restatements(2) | 1 | 175 | 18 | 10 | 204 | 204 | ||||||||||||
| Restated balance | 356 | 3 896 | 176 | 12 548 | 1 933 | 987 | 19 896 | 18 400 | ||||||||||
| Acquisitions | 29 | 310 | 12 | 1433 | 211 | 275 | 2 270 | 1 626 | ||||||||||
| Disposals and other | (34 | ) | (2 | ) | (47 | ) | (6 | ) | (89 | ) | (130 | ) | ||||||
| Closing balance | 385 | 4 172 | 188 | 13 979 | 2 097 | 1 256 | 22 077 | 19 896 | ||||||||||
| Accumulated depreciation | ||||||||||||||||||
| Opening balance | 1 763 | 90 | 8 248 | 1 002 | 428 | 11 531 | 11 030 | |||||||||||
| Restatements(2) | 108 | 13 | 10 | 131 | 131 | |||||||||||||
| Restated balance | 1 871 | 90 | 8 248 | 1 015 | 438 | 11 662 | 11 161 | |||||||||||
| Depreciation expenses | 123 | 10 | 285 | 204 | 161 | 783 | 622 | |||||||||||
| Impact of disposals and other | (26 | ) | (3 | ) | (2 | ) | (47 | ) | (6 | ) | (84 | ) | (121 | ) | ||||
| Closing balance | — | 1 968 | 97 | 8 531 | 1 172 | 593 | 12 361 | 11 662 | ||||||||||
| Fixed assets (Note 4) | 385 | 2 204 | 91 | 5 448 | 925 | 663 | 9 716 | (1) | 8 234 | (1) | ||||||||
- (1)
- Including fixed assets rented under capital leases totalling $182 million in 2002-2003 ($201 million in 2001-2002).
- (2)
- Net restatements of $73 M (See Note 2).
64
APPENDIX 16
Commitments and contingencies
AS AT MARCH 31, 2003
Commitments
| | 2003 | 2002 | ||||
|---|---|---|---|---|---|---|
| | (in millions of dollars) | |||||
| Transfer for repayment of the principal on borrowings for capital expenditures: | ||||||
| School boards and educational institutions | 8 081 | 7 715 | ||||
| Health and social services institutions | 3 926 | 3 622 | ||||
| Municipalities and municipal bodies | 2 678 | 2 820 | ||||
| Other beneficiaries | 483 | 329 | ||||
| 15 168 | 14 486 | |||||
| Transfer for other capital expenditures: | ||||||
| School boards and educational institutions | 1 729 | 1 771 | ||||
| Health and social services institutions | 2 054 | 1 983 | ||||
| Municipalities and municipal bodies | 1 328 | 830 | ||||
| Other beneficiaries | 984 | 612 | ||||
| 6 095 | 5 196 | |||||
| 21 263 | * | 19 682 | * | |||
- *
- Commitments in foreign currency are shown at their Canadian equivalent at the exchange rates in effect on March 31 and take currency swap contracts into account.
Agreement between the Gouvernement du Québec and the Québec Cree
An agreement was signed by the Government and the Québec Cree in February 2002 to help the Cree achieve more autonomy and take charge of their development. The agreement also allows the Cree to play a greater role in economic development activities in the territory covered by the James Bay and Northern Québec Agreement (JBNQA).
The February 2002 agreement provides in particular for annual transfer payments to the James Bay Cree over a period of 50 years, i.e. from 2002-2003 to 2051-2052. In return, the Cree assume the obligations of the Gouvernement du Québec, Hydro-Québec and the Société d'énergie de la Baie James under certain provisions of the JBNQA, pertaining to the Cree's economic and community development. The transfer payments amount to $46 million in 2004 and $70 million annually thereafter until 2052.
65
APPENDIX 16
Commitments and contingencies (cont'd)
AS AT MARCH 31, 2003
Summary schedule of transfer commitments for repayment of the principal on borrowings for capital expenditures
| Maturity | School Boards | General and vocational colleges | Universities | Health and social services institutions | Municipalities and municipal bodies | Other beneficiaries | Total | |||||||
|---|---|---|---|---|---|---|---|---|---|---|---|---|---|---|
| | | | | | | (in millions of dollars) | ||||||||
| 2004 | 873 | 274 | 499 | 937 | 354 | 62 | 2 999 | |||||||
| 2005 | 387 | 204 | 323 | 283 | 324 | 68 | 1 589 | |||||||
| 2006 | 755 | 195 | 275 | 443 | 257 | 66 | 1 991 | |||||||
| 2007 | 410 | 212 | 384 | 514 | 248 | 68 | 1 836 | |||||||
| 2008 | 502 | 91 | 171 | 238 | 228 | 71 | 1 301 | |||||||
| 2 927 | 976 | 1 652 | 2 415 | 1 411 | 335 | 9 716 | ||||||||
| 2009-2013 | 1 195 | 490 | 489 | 1 272 | 656 | 63 | 4 165 | |||||||
| 2014-2018 | 153 | 122 | 60 | 178 | 320 | 58 | 891 | |||||||
| 2019-2023 | 6 | 5 | 2 | 57 | 167 | 27 | 264 | |||||||
| 2024-2028 | 3 | 4 | 74 | 81 | ||||||||||
| 2029-2033 | 1 | 41 | 42 | |||||||||||
| 2034-2038 | 8 | 8 | ||||||||||||
| 2039-2043 | 1 | 1 | ||||||||||||
| 4 281 | 1 597 | 2 203 | 3 926 | 2 678 | 483 | 15 168 | ||||||||
- Note:
- This schedule was drawn up according to the dates shown on bonds or notes at the balance sheet date. Any refinancing after that date will affect the above schedule.
66
APPENDIX 16
Commitments and contingencies (cont'd)
AS AT MARCH 31, 2003
Guaranteed financial initiatives
| | 2003 | 2002 | ||
|---|---|---|---|---|
| | (in millions of dollars) | |||
| Government agencies and enterprises | ||||
| Hydro-Québec(1) | 36 723 | 38 289 | ||
| Investissement Québec(1) | 1 861 | 1 847 | ||
| Société d'habitation du Québec(1) | 705 | 642 | ||
| Other | 52 | 49 | ||
| 39 341 | 40 827 | |||
| Individuals and corporations | ||||
| Loans to farm producers(1) | 4 258 | 3 991 | ||
| Loans to students(1) | 3 034 | 3 152 | ||
| Other loans | 93 | 87 | ||
| 7 385 | 7 230 | |||
| Total guaranteed financial initiatives | 46 726 | 48 057 | ||
| Less: | ||||
| Allowance for losses on guaranteed financial initiatives | 1 027 | 978 | ||
| NET GUARANTEED FINANCIAL INITIATIVES | 45 699 | 47 079 | ||
- (1)
- See additional information on following pages.
67
APPENDIX 16
Commitments and contingencies (cont'd)
AS AT MARCH 31, 2003
Hydro-Québec loan guarantees(1)(2)
| | 2003 | 2002 | |||||
|---|---|---|---|---|---|---|---|
| | Authorized | Contingent liabilities(3) | Contingent liabilities(3) | ||||
| | (in millions of dollars) | ||||||
| Negotiable bonds | |||||||
| In Canadian dollars | 13 563 | 13 563 | 13 763 | ||||
| In U.S. dollars | 11 681 | 11 681 | 14 979 | ||||
| Other currencies | 942 | 942 | 1 112 | ||||
| 26 186 | 26 186 | 29 854 | |||||
| Other borrowings | |||||||
| In Canadian dollars | 9 530 | 6 947 | 4 758 | ||||
| In U.S. dollars | 8 904 | 2 639 | 2 730 | ||||
| Other currencies | 4 593 | 1 577 | 1 500 | ||||
| 23 027 | 11 163 | 8 988 | |||||
| Total | 49 213 | 37 349 | 38 842 | ||||
| Less: Sinking fund | 626 | 553 | |||||
| 49 213 | 36 723 | 38 289 | |||||
- (1)
- The Gouvernement du Québec, which is Hydro-Québec's sole shareholder, guarantees loans contracted in various currencies by this enterprise. The value of assets in Hydro-Québec was $58 204 million as at March 31, 2003.
- (2)
- Loan guarantees bear interest at fixed and variable rates and mature at various dates until 2031.
- (3)
- Loan guarantees are shown at their Canadian equivalent at the rates in effect on March 31, 2003.
Investissement Québec loan guarantees(1)(2)
| | 2003 | 2002 | |||||
|---|---|---|---|---|---|---|---|
| | Authorized | Contingent liabilities | Contingent liabilities | ||||
| | (in millions of dollars) | ||||||
| Loan guarantees in effect | 1 395 | 1 088 | 880 | ||||
| Authorized loan guarantees not in effect | 773 | 773 | 967 | ||||
| 2 168 | 1 861 | 1 847 | |||||
| Allowance for losses on guaranteed financial initiatives | (466 | ) | (349 | ) | |||
| 1 395 | 1 498 | ||||||
- (1)
- The Government guarantees the payment of principal and interest on the loans concerned under the Act respecting Investissement Québec and La Financière du Québec (R.S.Q., c. I-16).
- (2)
- The total value of securities received as loan guarantees was $265 million as at March 31, 2003 ($186 million as at March 31, 2002).
68
APPENDIX 16
Commitments and contingencies (cont'd)
AS AT MARCH 31, 2003
Société d'habitation du Québec loan guarantees(1)
| | 2003 | 2002 | |||||
|---|---|---|---|---|---|---|---|
| | Authorized | Contingent liabilities | Contingent liabilities | ||||
| | (in millions of dollars) (adjusted) | ||||||
| Assistance program for community housing and NPOs — Private(2) | 409 | 409 | 419 | ||||
| Achat-Rénovation and Accès Logis programs(3) | 296 | 296 | 223 | ||||
| 705 | 705 | 642 | |||||
| Allowance for losses on guaranteed financial initiatives | (7 | ) | (6 | ) | |||
| 698 | 636 | ||||||
- (1)
- The Société d'habitation du Québec (SHQ) guarantees the reimbursement of losses of principal and interest under the Act respecting the Société d'habitation du Québec (R.S.Q., c. S-8).
- (2)
- Loans from financial institutions guaranteed by the SHQ and granted to non-profit organizations for a period of 25 years. The organizations are responsible for paying the interest on these loans, which finance the cost of buildings. For loans guaranteed by the Canada Mortgage and Housing Corporation (CMHC), the SHQ has concluded agreements under which it is committed to buying property taken over by the CMHC when a borrower defaults on a loan, for an amount equal to the value of the claim paid to the approved lender plus incidental expenses.
- (3)
- Loans from financial institutions guaranteed by the SHQ and granted to non-profit organizations for periods of 15 and 25 years. The SHQ reimburses the interest on loans guaranteed for 15 years, while the organizations pay that on those guaranteed for 25 years. The loans finance the cost of buildings.
Farm producer loan guarantees(1)
| | 2003 | 2002 | |||||
|---|---|---|---|---|---|---|---|
| | Authorized | Contingent liabilities | Contingent liabilities | ||||
| | (in millions of dollars) | ||||||
| Act respecting La Financière agricole du Québec (R.S.Q., c. L-0.1) | 4 049 | 4 049 | 3 759 | ||||
| Various acts | 209 | 209 | 232 | ||||
| 4 258 | 4 258 | 3 991 | |||||
| Allowance for losses on guaranteed financial initiatives | (68 | ) | (62 | ) | |||
| 4 190 | 3 929 | ||||||
- (1)
- Balances of principal and interest on loans for which the Fonds d'assurance-prêts agricoles et forestiers reimburses losses and covers related charges.
69
APPENDIX 16
Commitments and contingencies (cont'd)
AS AT MARCH 31, 2003
Student loan guarantees(1)
| | 2003 | 2002 | |||||
|---|---|---|---|---|---|---|---|
| | Authorized | Contingent liabilities | Contingent liabilities | ||||
| | (in millions of dollars) | ||||||
| Loans for which the Government repays interest as long as the borrower is a student | 1 026 | 1 026 | 1 043 | ||||
| Loans for which borrowers are responsible for repaying principal and interest | 1 963 | 1 963 | 2 060 | ||||
| Loans for the purchase of a personal computer, for which borrowers are responsible for repaying interest | 45 | 45 | 49 | ||||
| 3 034 | 3 034 | 3 152 | |||||
| Allowance for losses on guaranteed financial initiatives | (459 | ) | (521 | ) | |||
| 2 575 | 2 631 | ||||||
- (1)
- The Government guarantees the reimbursement of losses of principal and interest to lending institutions under the Act respecting financial assistance for students (R.S.Q., c. A-13.3).
70
Summary of fiduciary transactions conducted
by Government agencies and funds
AS AT MARCH 31, 2003
| | 2003 | 2002 | |||||||||||
|---|---|---|---|---|---|---|---|---|---|---|---|---|---|
| | Liabilities | Assets | Increase (decrease) in accrued equity | Net equity | Net equity | ||||||||
| | | | (in millions of dollars) | (restated) | |||||||||
| Caisse de dépôt et placement du Québec(1) | 29 734 | 107 416 | (7 591 | ) | 77 682 | 85 273 | |||||||
| Comité Centraide — public sector(1) | 9 | 9 | |||||||||||
| Commission administrative des régimes de retraite et d'assurances(1) | |||||||||||||
| RREGOP | 62 | 27 270 | (2 783 | ) | 27 208 | 29 991 | |||||||
| PPMP | 9 | 4 264 | (337 | ) | 4 255 | 4 592 | |||||||
| Other plans | 33 | 295 | (33 | ) | 262 | 295 | |||||||
| Commission de la construction du Québec(1) | |||||||||||||
| General Fund | 59 | 51 | (1 | ) | (8 | ) | (7 | ) | |||||
| Supplemental pension plan | |||||||||||||
| — general account | 196 | 2 677 | (713 | ) | 2 481 | 3 194 | |||||||
| Supplemental pension plan | |||||||||||||
| — pensioners' account | 3 | 3 204 | (1 | ) | 3 201 | 3 202 | |||||||
| Other | 236 | 1 377 | (137 | ) | 1 141 | 1 278 | |||||||
| Curateur public | 62 | 289 | (3 | ) | 227 | 230 | |||||||
| Fonds central pour le bénéfice des personnes incarcérées(1) | 2 | 2 | 2 | ||||||||||
| Guarantee Insurance Fund administered by the Régie des marchés agricoles et alimentaires du Québec | 5 | 5 | 5 | ||||||||||
| Fonds d'assurance-récolte and Fonds d'assurance-stabilisation des revenus agricoles | 343 | 111 | (252 | ) | (232 | ) | 20 | ||||||
| Travel Agents' Security Funds | 13 | 11 | (4 | ) | (2 | ) | 2 | ||||||
| Support Payments Fund | 306 | 306 | |||||||||||
| Fonds d'indemnisation des services financiers(1) | 4 | 7 | 3 | 3 | |||||||||
| Fonds du compte de stabilisation du revenu agricole | 12 | 12 | |||||||||||
| Fonds du régime tripartite d'assurance revenu brut à l'égard des récoltes | 14 | 14 | 14 | ||||||||||
| Trust funds | 564 | 564 | |||||||||||
| Amounts carried forward | 31 645 | 147 884 | (11 855 | ) | 116 239 | 128 094 | |||||||
71
APPENDIX 17
Summary of fiduciary transactions conducted
by Government agencies and funds (cont'd)
AS AT MARCH 31, 2003
| | 2003 | 2002 | |||||||||
|---|---|---|---|---|---|---|---|---|---|---|---|
| | Liabilities | Assets | Increase (decrease) in accrued equity | Net equity | Net equity | ||||||
| | | | (in millions of dollars) | (restated) | |||||||
| Amounts brought forward | 31 645 | 147 884 | (11 855 | ) | 116 239 | 128 094 | |||||
| Fonds national de formation de la main-d'?uvre | 5 | 74 | (5 | ) | 69 | 74 | |||||
| Hydro-Québec — pension plan(1) | 24 | 8 350 | (823 | ) | 8 326 | 9 149 | |||||
| Régie des rentes du Québec | |||||||||||
| Fonds du régime de rentes du Québec | 467 | 15 889 | (2 043 | ) | 15 422 | 17 465 | |||||
| Other | 30 | 30 | |||||||||
| 32 171 | 172 227 | (14 726 | ) | 140 056 | 154 782 | ||||||
| Less: Funds entrusted to the Caisse de dépôt et placement du Québec | 54 100 | (6 415 | ) | 54 100 | 60 515 | ||||||
| 32 171 | 118 127 | (8 311 | ) | 85 956 | 94 267 | ||||||
- (1)
- Financial statements as at December 31, 2002.
72
APPENDIX 18
Reserve fund
AS AT MARCH 31, 2003
| | RESERVE FUND ACCOUNTS | 2003 | 2002 | |||||||||||||
|---|---|---|---|---|---|---|---|---|---|---|---|---|---|---|---|---|
| | Health and social services | Education | Social solidarity | Research | Maintenance of a balanced budget | Total | Total | |||||||||
| | | | | | | (in millions of dollars) | ||||||||||
| Opening balance | 950 | |||||||||||||||
| Transfer to reserve fund | ||||||||||||||||
| Use of reserve fund | ||||||||||||||||
| Expenditures financed | (280 | ) | ||||||||||||||
| Maintenance of a balanced budget | (670 | ) | ||||||||||||||
| Closing balance | — | — | — | — | — | — | — | |||||||||
Under the Act to establish a budgetary surplus reserve fund (R.S.Q., c. R-25.1), the Government created a reserve fund to finance capital projects and other projects having a defined duration. However, the Government may, when it believes that the public interest so warrants, use the reserve fund for projects other than those for which it was created. The Minister of Finance determines, in the Budget Speech, the portion of the surplus for the fiscal year exceeding the budgetary objectives that is to be transferred to the reserve fund and the amounts that are to be allocated to each account.
In addition, the Government may appropriate the reserve fund in whole or in part to maintain a balanced budget.
73
TABLE OF CONTENTS
Another important question Comparative financial data