QuickLinks -- Click here to rapidly navigate through this document
The Government's Financial
Position in 2003-2004
and Public Sector Borrowings
| The government's financial transactions | 3 | |
| Revenue of the Consolidated Revenue Fund | 5 | |
| Expenditure of the Consolidated Revenue Fund | 11 | |
| Budgetary transactions of consolidated organizations | 12 | |
| Consolidated non-budgetary transactions | 13 | |
| Consolidated financing transactions | 15 | |
| Borrowings | 18 | |
| Repayment of borrowings | 22 | |
| Total government debt | 23 | |
| Structure of debt | 24 | |
| Public sector borrowings, investments and debt | 26 | |
| Public sector borrowings and investments | 26 | |
| Long-term public sector debt | 31 | |
| Historical data and preliminary results | 33 | |
| Financial transactions of the gouvernement du Québec | ||
| — Summary of consolidated financial transactions | 33 | |
| — Consolidated Revenue Fund — Revenue by source | 34 | |
| — Consolidated Revenue Fund — Expenditure by department | 35 | |
| — Consolidated non-budgetary transactions | 36 | |
| — Consolidated financing transactions | 38 | |
| Borrowings for the Consolidated Revenue Fund in 2003-2004 | 39 | |
| Borrowings for the Financing Fund in 2003-2004 | 40 | |
| Borrowings by Financement-Québec in 2003-2004 | 41 | |
| Borrowings by Hydro-Québec in 2003 | 42 | |
Appendix | ||
2.1 Consolidated budgetary transactions: revenue by source and expenditure by mission in 2003-2004 | 43 |
SECTION 2 2
The government's financial transactions1
In accordance with the objectives of the government, a balanced budget was achieved in 2003-2004, prior to consideration of the exceptional losses of the Société générale de financement du Québec (SGF). Taking into account these additional losses, the deficit stands at $364 million.
The revenue of the Consolidated Revenue Fund for fiscal 2003-2004 is revised to $52 201 million, $317 million less than anticipated in the June 12, 2003 Budget. Own-source revenue is adjusted downward by $506 million, while federal transfers are adjusted upward by $189 million.
The expenditure of the Consolidated Revenue Fund amounts to $52 468 million in 2003-2004, a downward revision of $194 million compared with the forecast of June 12, 2003. This revision corresponds to the decline in debt service. The program spending objective of $45 800 million was met.
Consolidated net financial requirements are revised to $1 433 million, a decrease of $390 million. The net financial requirements of consolidated organizations thus amount to $1 233 million and those of the Consolidated Revenue Fund to $200 million, a downward revision of $100 million compared with the June 12, 2003 Budget. This revision can be attributed to an additional dividend of $100 million from Loto-Québec.
With respect to consolidated financing transactions, the change in direct debt is adjusted upward by $1 265 million compared with the forecast of last June.
- 1
- New presentation of budgetary transactions
Sections 2 and 4 of the Budget Plan have been revised to simplify the presentation of the government's financial framework. The budgetary transactions of the Consolidated Revenue Fund, which include the profits of government enterprises, are presented separately from those of consolidated organizations. In addition, the budgetary transactions of consolidated organizations are grouped under the new heading "net results of consolidated organizations".
SECTION 2 3
GOUVERNEMENT DU QUÉBEC
SUMMARY OF CONSOLIDATED FINANCIAL TRANSACTIONS
(millions of dollars)
| | 2002-2003 | | | 2003-2004 | ||||
|---|---|---|---|---|---|---|---|---|
| | Budget Speech of June 12, 2003 | | ||||||
| | Actual results | Preliminary results | Change compared with Budget | |||||
| Budgetary transactions of Consolidated Revenue Fund1 | ||||||||
| Own-source revenue before exceptional losses of SGF | 41 197 | 43 330 | 42 824 | –506 | ||||
| Federal transfers | 8 932 | 9 188 | 9 377 | 189 | ||||
| Total revenue | 50 129 | 52 518 | 52 201 | –317 | ||||
| Program spending | –44 316 | –45 800 | –45 800 | — | ||||
| Debt service | –6 536 | –6 862 | –6 668 | 194 | ||||
| Total expenditure | –50 852 | –52 662 | –52 468 | 194 | ||||
| Net results of consolidated organizations1 | 368 | 144 | 267 | 123 | ||||
Consolidated budget balance before exceptional losses of SGF | –355 | 0 | 0 | 0 | ||||
| Exceptional losses of SGF | –339 | — | –364 | –364 | ||||
| Consolidated budget balance | –694 | 0 | –364 | –364 | ||||
Consolidated non-budgetary transactions | ||||||||
| Investments, loans and advances | –1 649 | –1 814 | –1 077 | 737 | ||||
| Capital expenditures | –1 482 | –1 334 | –978 | 356 | ||||
| Retirement plans | 2 007 | 2 041 | 2 221 | 180 | ||||
| Other accounts | 240 | –716 | –1 235 | –519 | ||||
| Consolidated non-budgetary requirements | –884 | –1 823 | –1 069 | 754 | ||||
| Consolidated net financial requirements | –1 578 | –1 823 | –1 433 | 390 | ||||
Consolidated financing transactions | ||||||||
| Change in cash position2 | –3 090 | 4 110 | 2 466 | –1 644 | ||||
| Change in direct debt2 | 6 309 | 66 | 1 331 | 1 265 | ||||
| Retirement plans sinking fund3 | –1 641 | –2 353 | –2 364 | –11 | ||||
| Total financing of consolidated transactions | 1 578 | 1 823 | 1 433 | –390 | ||||
- Note:
- A negative entry indicates a financial requirement and a positive entry, a source of financing. For the change in cash position, a negative entry indicates an increase and a positive entry, a decrease. For purposes of comparison, the data are presented on the basis of the 2004-2005 budgetary structure. Because of the changes that will be made in the family policy as of January 1, 2005, amounts previously included in program spending will be applied against revenue. The data presented in this section incorporate a restatement that covers a three-month period and that reduces own-source revenue and program spending by $132 million. Therefore, the restatement does not change the budget balance for the years concerned.
- 1
- The budgetary transactions of the Consolidated Revenue Fund, which include the profits of government enterprises, are presented separately from those of consolidated organizations. In addition, the budgetary transactions of consolidated organizations are grouped under the new heading "net results of consolidated organizations".
- 2
- The change in direct debt includes new long-term borrowings less repayment of long-term borrowings and the change in temporary borrowings outstanding. Previously, the change in temporary borrowings outstanding was included in the change in cash position. See the explanation of consolidated financing transactions given later in this section.
- 3
- This sinking fund receives amounts to be used to cover retirement benefits payable by the government under the public and parapublic sector retirement plans. The investment income of this fund is reinvested in it.
SECTION 2 4
Revenue of the Consolidated Revenue Fund
In regard to revenue, the 2003-2004 Budget anticipated own-source revenue of $43 330 million and federal transfers of $9 188 million. The forecast for own-source revenue before the exceptional losses of the SGF is adjusted downward by $506 million compared with the figure anticipated in the Budget, while the forecast for federal transfers is raised by $189 million.
Own-source revenue
Excluding government enterprises, the downward adjustment of own-source revenue amounts to $537 million. This adjustment reflects mainly the lower-than-expected revenue from personal income tax and corporate taxes.
TABLE 2.2
GOUVERNEMENT DU QUÉBEC — CONSOLIDATED REVENUE FUND
SUMMARY OF THE CHANGE IN OWN-SOURCE REVENUE
(millions of dollars)
| 2002-2003 | 2003-2004 | |||||||||
| | Actual results | Budget Speech of June 12, 2003 | Preliminary results | Change compared with Budget | Change compared with 2002-2003 | |||||
|---|---|---|---|---|---|---|---|---|---|---|
| | | | | | % | |||||
| Personal income tax | 16 048 | 16 891 | 16 454 | –437 | 2.5 | |||||
| Health Services Fund | 4 068 | 4 640 | 4 658 | 18 | 14.5 | |||||
| Corporate taxes | 3 735 | 3 926 | 3 837 | –89 | 2.7 | |||||
| Consumption taxes | 10 843 | 11 567 | 11 596 | 29 | 6.9 | |||||
| Other sources | 2 402 | 2 364 | 2 306 | –58 | –4.0 | |||||
| Sub-total before government enterprises | 37 096 | 39 388 | 38 851 | –537 | 4.7 | |||||
| Government enterprises before exceptional losses of SGF | 4 101 | 3 942 | 3 973 | 31 | –3.1 | |||||
| Total own-source revenue before exceptional losses of SGF | 41 197 | 43 330 | 42 824 | –506 | 3.9 | |||||
- Note:
- Data restated according to the information provided at the bottom of Table 2.1.
SECTION 2 5
The preliminary results for personal income tax indicate a decline of $437 million compared with the 2003-2004 Budget. Continued processing of 2002 income tax returns in 2003-2004 resulted in a lower-than-anticipated level of tax payable, particularly in the case of self-employed workers. It also led to a decline in tax instalments for 2003, since the latter are calculated on the basis of information for the 2002 taxation year.
Corporate tax revenue is revised downward by $89 million on account of lower-than-expected growth in the profits of corporations.
Consumption tax revenue is adjusted upward by $29 million. This rise is due primarily to higher revenue from the fuel tax because of an increase in the amount of fuel consumed. The increase in the tax on tobacco products announced last December also contributed to this adjustment.
However, revenue from other sources is revised downward by $58 million, owing in particular to lower-than-anticipated revenue from sales of goods and services, duties and permits and interest income.
Lastly, the profits of government enterprises, before the exceptional losses of the SGF, are revised to $3 973 million, an increase of $31 million compared with the forecast in the June 2003 Budget.
SECTION 2 6
Exceptional losses of the Société générale de financement du Québec (SGF)
The SGF has registered losses over the past three years, and these results have a major impact on government revenue.
In 2001, the losses totalled $84 million and in 2002, $172 million. Recently, the SGF announced a loss of $511 million for 2003, stemming mainly from the complete reevaluation of its investment portfolio under the supervision of a specialized firm.
The SGF also anticipates a loss of $30 million for the first quarter of 2004.
On the basis of the government's fiscal years, these losses as a whole affected the government's results by $91 million in 2001-2002, $339 million in 2002-2003 and $364 million in 2003-2004.
TABLE 2.3
SOCIÉTÉ GÉNÉRALE DE FINANCEMENT DU QUÉBEC
IMPACT OF LOSSES ON GOVERNMENT REVENUE
(millions of dollars)
| | 2001-2002 | 2002-2003 | 2003-2004 | Total | | ||||
|---|---|---|---|---|---|---|---|---|---|
| Losses of the SGF1 | |||||||||
| 2001 | –81 | –84 | 2 | ||||||
| 2002 | –10 | –162 | –172 | ||||||
| 2003 | –177 | –334 | –511 | ||||||
| 20043 | –30 | –30 | |||||||
| Total | –91 | –339 | –364 | –797 | |||||
- 1
- The SGF's fiscal year corresponds to the calendar year.
- 2
- Including a loss of $3 million charged to the government's 2000-2001 fiscal year.
- 3
- Anticipated losses from January to March 2004.
SECTION 2 7
Federal transfers
Federal transfers should reach $9 377 million for fiscal 2003-2004, an increase of $189 million compared with the forecast in the 2003-2004 Budget. However, without the deferral and spreading mechanism introduced by the federal government, revenue from federal transfers would have been revised downward by $972 million in 2003-2004.
TABLE 2.4
GOUVERNEMENT DU QUÉBEC — CONSOLIDATED REVENUE FUND
SUMMARY OF THE CHANGE IN FEDERAL TRANSFERS
(millions of dollars)
| | 2002-2003 | 2003-2004 | ||||||||
|---|---|---|---|---|---|---|---|---|---|---|
| | Actual results | Budget Speech of June 12, 2003 | Preliminary results | Change compared with Budget | Change compared with 2002-2003 | |||||
| | | | | | % | |||||
| Equalization | 5 315 | 4 145 | 4 065 | –80 | –23.5 | |||||
| Canada Health and Social Transfer (CHST) | 2 648 | 4 133 | 4 266 | 133 | 61.1 | |||||
| Other transfers related to fiscal arrangements | 34 | 15 | 64 | 49 | 88.2 | |||||
| Other programs | 935 | 895 | 982 | 87 | 5.0 | |||||
| Total federal transfers | 8 932 | 9 188 | 9 377 | 189 | 5.0 | |||||
| Less: | ||||||||||
| Impact of the deferral mechanism introduced by the federal government | — | — | 1 161 | 1 161 | — | |||||
| Total federal transfers before deferral | 8 932 | 9 188 | 8 216 | –972 | –8.0 | |||||
SECTION 2 8
Equalization revenue is revised downward by $80 million compared with the forecast in the 2003-2004 Budget. The final data compiled by Canada Revenue Agency (CRA) in regard to personal income tax and corporate taxable income lead to a major upward adjustment of Québec's fiscal capacity in relation to that of the provinces that make up the equalization program's standard. These new data thus entailed to a downward adjustment of over $1 billion in equalization revenue, including $771 million solely in respect of tax on corporate profits. However, on account of the scope of these adjustments, the federal government has allowed repayment of the major portion, i.e. $1 074 million, to be deferred and spread over a five-year period starting in 2005-2006.
Revenue from the Canada Health and Social Transfer (CHST) is adjusted upward by $133 million. A review of the value of the tax points used to calculate the CHST resulted in an increase in cash transfers. In addition, the deferral mechanism introduced by the federal government raised CHST revenue by $87 million.
The $49-million rise in other transfers related to fiscal arrangements reflects the outstanding growth of revenue from tax on preferred shares in 2002.
The $87-million revision in regard to other programs stems mainly from a reevaluation of the increase in revenue respecting immigrant integration agreements, the federal student loan program and services for people with hepatitis C.
SECTION 2 9
Measure aimed at deferring repayment of part of the decrease in federal transfers in 2003-2004
Federal transfers were to have fallen by 8.0% in 2003-2004. Indeed, a 43.7% decline in equalization revenue would have more than offset the climb in CHST revenue stemming from the federal government's February 2003 announcement on health care.
However, the federal government has allowed Québec and the other provinces to defer repayment of the downward adjustments to equalization and the CHST resulting from the updating of population data and personal income tax and corporate income tax data between the federal estimates of October 2003 and February 2004. These adjustments total $1 161 million in 2003-2004. Repayments will be made over a five-year period starting in 2005-2006, at a rate of $244 million per year.
TABLE 2.5
GOUVERNEMENT DU QUÉBEC — CONSOLIDATED REVENUE FUND
IMPACT OF THE DEFERRAL OF PART OF THE ADJUSTMENTS TO FEDERAL
TRANSFERS IN 2003-2004
(millions of dollars)
| | 2002-2003 | 2003-2004 | |||||||
|---|---|---|---|---|---|---|---|---|---|
| | | Before deferral | Deferral | After deferral | |||||
| Equalization | 5 315 | 2 991 | 1 074 | 4 065 | |||||
| % change | –43.7 | — | –23.5 | ||||||
| CHST | 2 648 | 4 179 | 87 | 4 266 | |||||
| % change | 57.8 | — | 61.1 | ||||||
| Other | 969 | 1 046 | — | 1 046 | |||||
| % change | 7.9 | — | 7.9 | ||||||
| Total | 8 932 | 8 216 | 1 161 | 9 377 | |||||
| % change | –8.0 | — | 5.0 | ||||||
SECTION 2 10
Expenditure of the Consolidated Revenue Fund
Expenditure for fiscal 2003-2004 was revised downward by $194 million to $52 468 million. This decrease corresponds to the decline in debt service.
In all, program spending rose 3.3% compared with 2002-2003, while debt service climbed 2%.
TABLE 2.6
GOUVERNEMENT DU QUÉBEC — CONSOLIDATED REVENUE FUND
SUMMARY OF THE CHANGE IN EXPENDITURE
(millions of dollars)
| | 2002-2003 | 2003-2004 | ||||||||
|---|---|---|---|---|---|---|---|---|---|---|
| | Actual results | Budget Speech of June 12, 2003 | Preliminary results | Change compared with Budget | Change compared with 2002-2003 | |||||
| | | | | | % | |||||
| Program spending | 44 316 | 45 800 | 45 800 | — | 3.3 | |||||
Debt service | ||||||||||
| Direct debt service | 3 888 | 4 177 | 3 926 | –251 | 1.0 | |||||
| Interest ascribed to retirement plans1 | 2 648 | 2 685 | 2��742 | 57 | 3.5 | |||||
| Total debt service | 6 536 | 6 862 | 6 668 | –194 | 2.0 | |||||
| Total expenditure | 50 852 | 52 662 | 52 468 | –194 | 3.2 | |||||
- Note:
- Data restated according to the information provided at the bottom of Table 2.1.
- 1
- Interest ascribed to the retirement plans is equal to interest on the actuarial obligation less the investment income of the retirement plans sinking fund.
The $45 800-million forecast for program spending includes spending adjustments made during fiscal 2003-2004. Additional spending was incurred mainly at the ministère de l'Emploi, de la Solidarité sociale et de la Famille, because of the lower-than-anticipated decrease in the number of households receiving employment assistance, and at the ministère de la Sécurité publique. However, equivalent savings were realized in other departments.
Debt service currently amounts to $6 668 million, of which $3 926 million is for direct debt service and $2 742 million for interest ascribed to the retirement plans. The $194-million downward revision of debt service essentially reflects lower-than-expected interest rates.
SECTION 2 11
Budgetary transactions of consolidated organizations
The net results of consolidated organizations amount to $267 million, $123 million more than forecast in the June 2003 Budget. This increase in net results is due to the allocation of adjustments among a large number of organizations.
TABLE 2.7
GOUVERNEMENT DU QUÉBEC — CONSOLIDATED ORGANIZATIONS
SUMMARY OF BUDGETARY TRANSACTIONS
(millions of dollars)
| | 2002-2003 | 2003-2004 | ||||||||
|---|---|---|---|---|---|---|---|---|---|---|
| | Actual results | Budget Speech of June 12, 2003 | Preliminary results | Change compared with Budget | Change compared with 2002-2003 | |||||
| | | | | | % | |||||
| Own-source revenue | 2 160 | 2 035 | 2 194 | 159 | 1.6 | |||||
| Federal transfers | 375 | 396 | 498 | 102 | 32.8 | |||||
| Total revenue | 2 535 | 2 431 | 2 692 | 261 | 6.2 | |||||
| Expenditure excluding debt service | –1 618 | –1 637 | –1 829 | –192 | 13.0 | |||||
| Debt service | –549 | –650 | –596 | 54 | 8.6 | |||||
| Total expenditure | –2 167 | –2 287 | –2 425 | –138 | 11.9 | |||||
| Net results | 368 | 144 | 267 | 123 | –27.4 | |||||
SECTION 2 12
Consolidated non-budgetary transactions
Financial requirements stemming from consolidated non-budgetary transactions amount to $1 069 million, $754 million less than forecast in the Budget Speech of June 12, 2003.
TABLE 2.8
GOUVERNEMENT DU QUEBEC
SUMMARY OF CONSOLIDATED NON-BUDGETARY TRANSACTIONS
(millions of dollars)
| | 2003-2004 | ||||||
|---|---|---|---|---|---|---|---|
| | Budget Speech of June 12, 2003 | Preliminary results | Change | ||||
| Consolidated Revenue Fund | |||||||
| Investments, loans and advances | |||||||
| Government enterprises | –1 305 | –604 | 701 | ||||
| Municipalities, municipal bodies, individuals, corporations and others | –208 | –209 | –1 | ||||
| –1 513 | –813 | 700 | |||||
| Capital expenditures | –122 | –122 | — | ||||
| Retirement plans | 2 041 | 2 221 | 180 | ||||
| Other accounts | –562 | –855 | –293 | ||||
| Total Consolidated Revenue Fund | –156 | 431 | 587 | ||||
Consolidated organizations | |||||||
| Capital expenditures | –1 212 | –856 | 356 | ||||
| Other | –455 | –644 | –189 | ||||
| Total consolidated organizations | –1 667 | –1 500 | 167 | ||||
| Consolidated non-budgetary requirements | –1 823 | –1 069 | 754 | ||||
- Note:
- A negative entry indicates a financial requirement and a positive entry, a source of financing.
SECTION 2 13
The preliminary results of the Consolidated Revenue Fund for investments, loans and advances show a $700-million decline in funding requirements compared with the June 2003 forecast. This difference can be attributed essentially to a $288-million reduction in investments and a decline in revenue from government enterprises.
Financial requirements for the retirement plans were $180 million less than forecast in June 2003. This improvement can be attributed mainly to the recording of expenditures not disbursed during the fiscal year, i.e. interest ascribed to the retirement plans.
Transactions related to other non-budgetary accounts represent year-to-year changes in these financial items. These accounts, which include, in particular, cash and bills on hand, outstanding cheques, accounts receivable and accounts payable, can fluctuate a great deal because of the variability of government cash inflow and disbursements. For 2003-2004, the balance of the other accounts of the Consolidated Revenue Fund entails a $293-million increase in financial requirements.
The $167-million decrease in the financial requirements of consolidated organizations can be explained by, among other things, a reduction in the level of capital investments.
SECTION 2 14
Consolidated financing transactions
New presentation of short-term borrowings
The government uses long-term and short-term borrowings to meet its financial requirements. Short-term borrowings include Treasury bills and temporary borrowings. At present, Treasury bills outstanding are recorded under direct debt since Treasury bills are always renewed when they mature and are used to meet long-term financial requirements. To date, however, temporary borrowings have been presented under the cash position.
For consistency, the government's total debt should be adjusted to take into account all short-term borrowings that are used to finance long-term financial requirements. The presentation of temporary borrowings will thus be identical to that of Treasury bills. It should be noted that, at the end of the fiscal year, the Consolidated Revenue Fund does not usually have short-term borrowings other than Treasury bills.
TABLE 2.9
INCLUSION OF SHORT-TERM BORROWINGS IN TOTAL DEBT
(millions of dollars)
| | 1998 | 1999 | 2000 | 2001 | 2002 | 2003 | 20041 | |||||||
|---|---|---|---|---|---|---|---|---|---|---|---|---|---|---|
| Total debt as at March 31 | 97 732 | 99 572 | 100 546 | 102 741 | 105 172 | 108 526 | 112 019 | |||||||
| Short-term borrowings outstanding other than Treasury bills | 653 | 1 541 | 1 574 | 2 107 | 2 003 | 2 861 | 2 779 | |||||||
| Total debt as at March 31 including short-term borrowings | 98 385 | 101 113 | 102 120 | 104 848 | 107 175 | 111 387 | 114 798 | |||||||
- 1
- Preliminary results.
For purposes of comparison, the financing transactions forecast in the Budget Speech of June 12, 2003 must be revised to take the new treatment of temporary borrowings into account.
In the case of the Consolidated Revenue Fund, the $3 945-million change in cash position anticipated in the June 12, 2003 Budget Speech included a $165-million decrease in temporary borrowings outstanding. This decrease is now included as a repayment of borrowings in the change in direct debt. In the case of consolidated organizations, a $509-million increase in temporary borrowings was included in the change in cash position in the last Budget. This increase in the level of temporary borrowings is now considered new borrowings in the change in direct debt.
SECTION 2 15
Financing
Preliminary results for 2003-2004 show that the change in direct debt amounts to $1 331 million, i.e. $98 million for the Consolidated Revenue Fund and $1 233 million for consolidated organizations. Borrowings in fiscal 2003-2004 amount to $7 355 million ($4 940 million for the Consolidated Revenue Fund and $2 415 million for consolidated organizations). It should be noted that the Consolidated Revenue Fund obtained pre-financing of $1 644 million that will be used to cover part of the borrowing program in 2004-2005.
TABLE 2.10
GOUVERNEMENT DU QUÉBEC
SUMMARY OF CONSOLIDATED FINANCING TRANSACTIONS
(millions of dollars)
| | 2003-2004 | ||||||||||
|---|---|---|---|---|---|---|---|---|---|---|---|
| | Budget Speech of June 12, 2003 | Change in temporary borrowings | Budget Speech of June 12, 2003 revised | Preliminary results | Change | ||||||
| Change in cash position | |||||||||||
| Consolidated Revenue Fund | 3 945 | 165 | 4 110 | 2 466 | –1 644 | ||||||
| Consolidated organizations | 509 | –509 | — | — | — | ||||||
| Total change in cash position | 4 454 | –344 | 4 110 | 2 466 | –1 644 | ||||||
Change in direct debt | |||||||||||
| Consolidated Revenue Fund | |||||||||||
| New borrowings | 2 608 | — | 2 608 | 4 940 | 2 332 | ||||||
| Repayment of borrowings | –3 900 | –165 | –4 065 | –4 842 | –777 | ||||||
| –1 292 | –165 | –1 457 | 98 | 1 555 | |||||||
| Consolidated organizations | |||||||||||
| New borrowings | 2 310 | 509 | 2 819 | 2 415 | 1 | –404 | |||||
| Repayment of borrowings | –1 296 | — | –1 296 | –1 182 | 114 | ||||||
| 1 014 | 509 | 1 523 | 1 233 | –290 | |||||||
| Total change in direct debt | –278 | 344 | 66 | 1 331 | 1 265 | ||||||
| Retirement plans sinking fund | –2 353 | — | –2 353 | –2 364 | –11 | ||||||
| Total financing of consolidated transactions | 1 823 | — | 1 823 | 1 433 | –390 | ||||||
- Note:
- A negative entry indicates a financial requirement and a positive entry, a source of financing. For the change in cash position, a negative entry indicates an increase and a positive entry, a decrease.
- 1
- Including an $83-million increase in temporary borrowings.
SECTION 2 16
Financing of the Consolidated Revenue Fund
Preliminary results show that the change in the direct debt of the Consolidated Revenue Fund is $98 million, an increase of $1 555 million compared with the figure announced in the 2003-2004 Budget Speech. Borrowings in 2003-2004 stand at $4 940 million, $2 332 million more than expected in the last Budget, mainly on account of pre-financing of $1 644 million and the $777-million increase in the repayment of borrowings.
Owing to pre-financing, the cash level will fall by only $2 466 million, even though a $4 110-million decrease was forecast in the last Budget.
Financing of consolidated organizations
The change in the direct debt of consolidated organizations should amount to $1 233 million, $290 million less than anticipated in the last Budget.
This adjustment is due to the fact that the net financial requirements of consolidated organizations are lower than forecast.
SECTION 2 17
Borrowings
In all, the government contracted long-term borrowings of $7 440 million in 2003-2004, of which $4 940 million was for Consolidated Revenue Fund needs and $2 500 million for the Financing Fund. The borrowings of the Financing Fund are used to meet the financing needs of consolidated organizations ($2 332 million) and certain government enterprises ($168 million).
In all, 97% of the financing program, or $7 231 million, was conducted in Canadian dollars. In regard to the main financial instruments used, the government carried out six public bond issues on the Canadian market for a total of $3 041 million, and real return issues for a total of $656 million. In addition, medium-term notes were issued on the Canadian market for $1 585 million, and on the European market for $498 million. In addition, private-contract financing worth $436 million was carried out with the Caisse de dépôt et placement du Québec. Lastly, savings products sold by Épargne Placements Québec should provide the government with $793 million in financing.
Only 3% of the financing program was conducted in foreign currency. A public bond issue was carried out on the Australian market for AUS$200 million (CAN$209 million) in February 2004.
SECTION 2 18
GOUVERNEMENT DU QUÉBEC
SUMMARY OF LONG-TERM BORROWINGS IN 2003-2004
(millions of dollars)
| Currency | Consolidated Revenue Fund | Consolidated organizations1 | Government enterprises | | Total | ||||||
|---|---|---|---|---|---|---|---|---|---|---|---|
| | | | | | % | ||||||
| Canadian dollar | |||||||||||
| Public issues | |||||||||||
| Negotiable bonds | 1 475 | 1 566 | — | 3 041 | 42.1 | ||||||
| Real return bonds | 656 | — | — | 656 | 9.1 | ||||||
| Medium-term notes | |||||||||||
| On the Canadian market | 1 585 | — | — | 1 585 | 21.9 | ||||||
| On the European market | — | 498 | — | 498 | 6.9 | ||||||
| Private issues | |||||||||||
| Caisse de dépôt et placement du Québec | — | 268 | 168 | 436 | 6.0 | ||||||
| Canada Pension Plan Investment Fund | 5 | — | — | 5 | 0.1 | ||||||
| Savings products | 793 | — | — | 793 | 10.9 | ||||||
| Immigrant Investor Program | 450 | — | — | 450 | 6.2 | ||||||
| Change in debt resulting from currency swaps | –233 | — | — | –233 | –3.2 | ||||||
| Sub-total | 4 731 | 2 332 | 168 | 7 231 | 97.2 | ||||||
Australian dollar | |||||||||||
| Public issue | 209 | — | — | 209 | 100.0 | ||||||
| Sub-total | 209 | — | — | 209 | 2.8 | ||||||
| Total | 4 940 | 2 332 | 168 | 7 440 | 100.0 | ||||||
- 1
- Excluding the $83-million increase in temporary borrowings.
SECTION 2 19
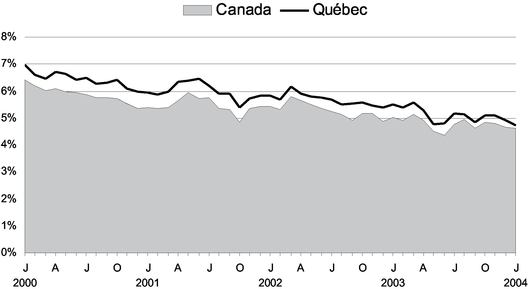
GRAPH 2.1
YIELD ON LONG-TERM (10-YEAR) SECURITIES
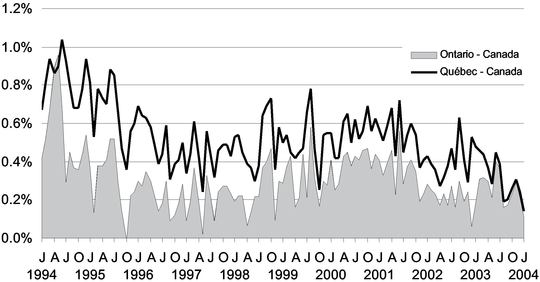
GRAPH 2.2
YIELD SPREAD ON LONG-TERM (10-YEAR) SECURITIES
SECTION 2 20
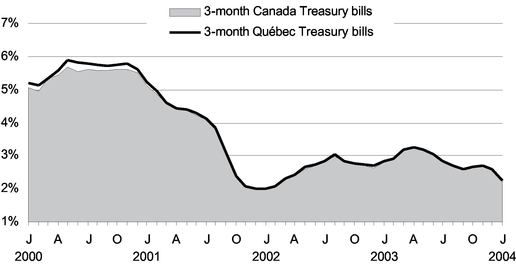
GRAPH 2.3
YIELD ON SHORT-TERM SECURITIES
SECTION 2 21
Repayment of borrowings
Preliminary results show that the repayment of borrowings of the Consolidated Revenue Fund and consolidated organizations for fiscal 2003-2004 amounts to $6 024 million, $663 million more than forecast in the June 12, 2003 Budget Speech.
Repayment of borrowings of the Consolidated Revenue Fund
Preliminary results show that the repayment of borrowings of the Consolidated Revenue Fund amounts to $4 842 million, $777 million more than forecast in the Budget Speech of last June. This increase is due in particular to higher-than-anticipated repayments of savings products and higher-than-expected revenue of the sinking fund for government borrowings.
Repayment of borrowings of consolidated organizations
Preliminary results show that the repayment of borrowings of consolidated organizations for fiscal 2003-2004 stands at $1 182 million, $114 million less than forecast in the last Budget.
SECTION 2 22
Total government debt
The government's total debt consists of the consolidated direct debt and the net retirement plans liability. The consolidated direct debt is the sum of the direct debt of the Consolidated Revenue Fund and the debt of consolidated organizations. The net retirement plans liability consists of the retirement plans liability minus the balance of the retirement plans sinking fund (RPSF), an asset that will eventually be used to pay the retirement benefits of public and parapublic sector employees.
Preliminary results show that the government's consolidated direct debt amounts to $78 159 million as at March 31, 2004, or $68 692 million as direct debt of the Consolidated Revenue Fund and $9 467 million as debt of the consolidated organizations.
It should be noted that an amount of $1 644 million included in the consolidated direct debt represents pre-financing in 2003-2004 that will be used to cover part of the borrowing program in 2004-2005.
As at March 31, 2004, the net retirement plans liability stands at $38 283 million.
Excluding pre-financing, the government's total debt is $114 798 million as at March 31, 2004.
TABLE 2.12
TOTAL GOVERNMENT DEBT AS AT MARCH 31, 20041
(millions of dollars)
| | Consolidated direct debt | | | |||||||
|---|---|---|---|---|---|---|---|---|---|---|
| | Consolidated Revenue Fund | Consolidated organizations | Total | Net retirement plans liability | Total debt | |||||
| Debt as at March 31, 2004 | 68 692 | 9 467 | 78 159 | 52 487 | 130 646 | |||||
| Retirement plans sinking fund | — | — | — | –14 204 | –14 204 | |||||
| Sub-total | 68 692 | 9 467 | 78 159 | 38 283 | 116 442 | |||||
| Pre-financing | –1 644 | — | –1 644 | — | –1 644 | |||||
| Total | 67 048 | 9 467 | 76 515 | 38 283 | 114 798 | |||||
- 1
- Preliminary results.
SECTION 2 23
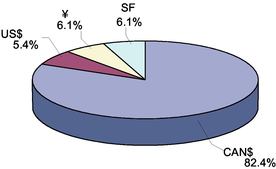
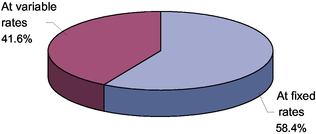
As at March 31, 2004, the proportion of the direct debt of the Consolidated Revenue Fund in Canadian dollars should amount to 82.4% and the proportion in foreign currency, 17.6%. In addition, as at March 31, 2004, the share at fixed interest rates and the share at variable interest rates should be 58.4% and 41.6% respectively.
GRAPH 2.4
STRUCTURE OF THE DIRECT DEBT OF THE CONSOLIDATED REVENUE FUND AS AT MARCH 31, 20041
| BY CURRENCY | BY INTEREST RATE | |
|---|---|---|
 |  |
- 1
- Preliminary results.
SECTION 2 24
Including the debt of consolidated organizations and the net retirement plans liability, the proportion of the total debt in Canadian dollars should amount to 89.6% and that in foreign currency, 10.4% as at March 31, 2004.
TABLE 2.13
STRUCTURE OF THE TOTAL DEBT AS AT MARCH 31, 20041
(millions of dollars)
| | Consolidated direct debt | | | | ||||||||||||
|---|---|---|---|---|---|---|---|---|---|---|---|---|---|---|---|---|
| Currency | Consolidated Revenue Fund | % | Consolidated organizations | Total | % | Net retirement plans liability | Total debt | % | ||||||||
| Canadian dollar | 56 583 | 82.4 | 9 467 | 66 050 | 84.5 | 38 283 | 104 333 | 89.6 | ||||||||
| US dollar | 3 689 | 5.4 | — | 3 689 | 4.7 | — | 3 689 | 3.2 | ||||||||
| Yen | 4 210 | 6.1 | — | 4 210 | 5.4 | — | 4 210 | 3.6 | ||||||||
| Swiss franc | 4 210 | 6.1 | — | 4 210 | 5.4 | — | 4 210 | 3.6 | ||||||||
| Sub-total | 68 692 | 100.0 | 9 467 | 78 159 | 100.0 | 38 283 | 116 442 | 100.0 | ||||||||
| Pre-financing | –1 644 | — | –1 644 | — | –1 644 | |||||||||||
| Total | 67 048 | 9 467 | 76 515 | 38 283 | 114 798 | |||||||||||
- Note:
- The debt in foreign currency is expressed in the Canadian equivalent based on the exchange rates in effect on March 24, 2004.
- 1
- Preliminary results.
SECTION 2 25
Public sector borrowings, investments and debt
Public sector borrowings and investments
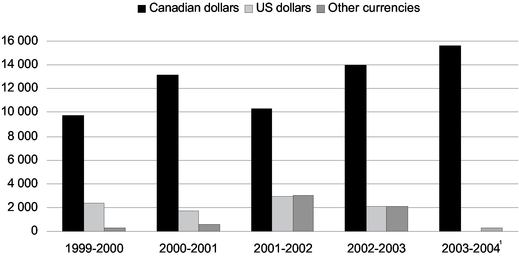
Preliminary results for 2003-2004 show that gross long-term public sector borrowings amount to $15 917 million.
Gross borrowings in Canadian dollars total $15 658 million, or 98.4% of total borrowings by the public sector. Gross borrowings in foreign currency total $259 million, or 1.6% of public sector borrowings as a whole.
TABLE 2.14
NET LONG-TERM PUBLIC SECTOR BORROWINGS
(millions of dollars)
| | 1999-2000 | 2000-2001 | 2001-2002 | 2002-2003 | 2003-20041 | ||||||
|---|---|---|---|---|---|---|---|---|---|---|---|
| Gross borrowings | |||||||||||
| Government2,3 | 5 677 | 8 757 | 8 438 | 10 079 | 7 050 | ||||||
| Educational institutions | 1 366 | 1 540 | 1 179 | 2 012 | 1 213 | ||||||
| Health and social services institutions | 66 | 528 | 429 | 1 127 | 668 | ||||||
| Hydro-Québec4 | 2 212 | 2 124 | 3 388 | 1 923 | 2 249 | ||||||
| Other government enterprises | 488 | 16 | 274 | 192 | 194 | ||||||
| Municipalities and municipal bodies | 2 594 | 2 488 | 2 595 | 2 880 | 4 543 | ||||||
| Total gross borrowings | 12 403 | 15 453 | 16 303 | 18 213 | 15 917 | ||||||
| Repayment of borrowings | 12 473 | 13 103 | 13 060 | 11 275 | 13 412 | ||||||
| Sub-total | –70 | 2 350 | 3 243 | 6 938 | 2 505 | ||||||
| Pre-financing | |||||||||||
| for the current year | –506 | –1 475 | –1 154 | –3 967 | –1 644 | ||||||
| for the previous year | 2 831 | 506 | 1 475 | 1 154 | 3 967 | ||||||
| Net long-term borrowings | 2 255 | 1 381 | 3 564 | 4 125 | 4 828 | ||||||
- 1
- Preliminary results.
- 2
- Amounts borrowed to cover the requirements of the Consolidated Revenue Fund and consolidated organizations, excluding net amounts received under interest rate and currency swap agreements, which explains the difference between this list and the list of borrowings given later in this text. These amounts also exclude borrowings made to cover the requirements of certain government enterprises and Financement-Québec, which are distributed among the organizations and networks for which they are intended.
- 3
- The government's gross borrowings include short-term borrowings used to finance long-term financial requirements.
- 4
- Amounts borrowed as at December 31 of each year.
SECTION 2 26
GRAPH 2.5
GROSS PUBLIC SECTOR BORROWINGS BY CURRENCY
(millions of dollars)
- 1
- Preliminary results.
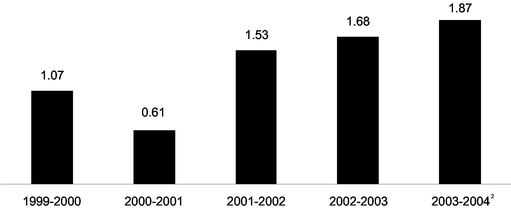
To ensure that borrowings in a given fiscal year are on a basis comparable with investments and gross domestic product, pre-financing must be allocated to the years to which it applies. Net long-term public sector borrowings for 2003-2004 amount to $4 828 million, an increase of $703 million compared with the previous year. Consequently, the ratio of net long-term borrowings to gross domestic product rose from 1.68% of GDP in 2002-2003 to 1.87% in 2003-2004.
GRAPH 2.6
NET LONG-TERM PUBLIC SECTOR BORROWINGS1
(as a percentage of GDP)
- 1
- Adjusted by pre-financing.
- 2
- Preliminary results.
SECTION 2 27
Preliminary results show that public sector investments total $9 704 million in 2003-2004, $885 million more than the previous year. This increase can be attributed mainly to the growth in investments by Hydro-Québec. Compared with the previous year, Hydro-Québec invested $400 million more for developing its production capacity (Toulnustouc, Eastmain-1) and $200 million in its power transmission grid, particularly to reinforce the Montérégie loop.
TABLE 2.15
PUBLIC SECTOR INVESTMENTS
(millions of dollars)
| | 1999-2000 | 2000-2001 | 2001-2002 | 2002-2003 | 2003-20041 | |||||
|---|---|---|---|---|---|---|---|---|---|---|
| Government2 | 1 085 | 1 448 | 1 614 | 2 031 | 1 624 | |||||
| Educational institutions3 | 702 | 691 | 703 | 1 070 | 1 216 | |||||
| Health and social services institutions3 | 615 | 699 | 706 | 785 | 860 | |||||
| Hydro-Québec4 | 1 457 | 1 632 | 1 686 | 2 208 | 2 895 | |||||
| Other government enterprises5 | 376 | 666 | 934 | 960 | 932 | |||||
| Municipalities and municipal bodies6 | 1 703 | 1 601 | 1 855 | 1 765 | 2 177 | |||||
| 5 938 | 6 737 | 7 498 | 8 819 | 9 704 | ||||||
- 1
- Preliminary results.
- 2
- Government investments include its capital expenditures as well as grants and loans for investments made available to economic agents outside the public sector. Financial investments for other components of the public sector are therefore excluded. Government investments also include investments by consolidated organizations.
Sources: Public accounts of the gouvernement du Québec, Secrétariat du Conseil du trésor and ministère des Finances.
- 3
- Investments by school boards, colleges, universities and health and social services institutions include the share paid by the government and that paid by the institutions themselves. It should be noted that the share paid by the government is financed by subsidies for debt service.
Sources: Secrétariat du Conseil du trésor and ministère des Finances.
- 4
- Investments by Hydro-Québec are shown on a calendar-year basis. They exclude financial investments and commercial programs.
Sources: Hydro-Québec and ministère des Finances.
- 5
- Investments by government enterprises correspond to the increase in long-term assets. They exclude investments by consolidated organizations and the Société québécoise d'assainissement des eaux, which are included under "Government" and "Municipalities and municipal bodies" respectively.
Sources: Financial statements of the enterprises of the gouvernement du Québec and ministère des Finances.
- 6
- Investments by municipalities and municipal bodies also include those related to water purification, public transportation and cultural and community facilities.
Sources: Secrétariat du Conseil du trésor, ministère des Affaires municipales, du Sport et du Loisir and ministère des Finances.
SECTION 2 28
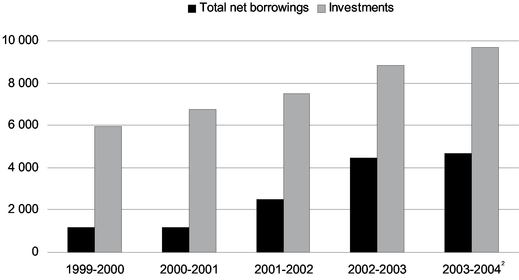
The following table presents a comparative analysis of borrowings and investments by the public sector as a whole. Total net public sector borrowings include the change in the net retirement plans liability.
In 2003-2004, total net public sector borrowings are once again lower than investments. The ratio of net borrowings to investments is 0.48.
TABLE 2.16
TOTAL NET BORROWINGS AND INVESTMENTS BY THE PUBLIC SECTOR
(millions of dollars)
| | 1999-2000 | 2000-2001 | 2001-2002 | 2002-2003 | 2003-20041 | |||||
|---|---|---|---|---|---|---|---|---|---|---|
| Net long-term borrowings2 | 2 255 | 1 381 | 3 564 | 4 125 | 4 828 | |||||
| Change in the net retirement plans liability3 | –1 091 | –226 | –1 051 | 366 | –143 | |||||
| Total net borrowings | 1 164 | 1 155 | 2 513 | 4 491 | 4 685 | |||||
| Investments | 5 938 | 6 737 | 7 498 | 8 819 | 9 704 | |||||
| Ratio | 0.20 | 0.17 | 0.34 | 0.51 | 0.48 | |||||
- 1
- Preliminary results.
- 2
- Adjusted by pre-financing.
- 3
- This amount takes into account deposits made in the retirement plans sinking fund and the income of this fund.
SECTION 2 29
GRAPH 2.7
TOTAL NET BORROWINGS1 AND INVESTMENTS BY THE PUBLIC SECTOR
(millions of dollars)
- 1
- Adjusted by pre-financing.
- 2
- Preliminary results.
SECTION 2 30
Long-term public sector debt
Long-term public sector debt includes the government's total debt as well as the debts of the networks, Hydro-Québec, the municipalities and other government enterprises. In many cases, this debt has served to finance public infrastructure, such as roads, schools, hospitals, hydroelectric dams and water purification plants.
Preliminary results show that the public sector debt should be $181 764 million as at March 31, 2004.
TABLE 2.17
LONG-TERM PUBLIC SECTOR DEBT1
(millions of dollars)
| | As at March 31 | |||||||||
|---|---|---|---|---|---|---|---|---|---|---|
| | 2000 | 2001 | 2002 | 2003 | 20042 | |||||
| Total government debt3,4 | 102 120 | 104 848 | 107 175 | 111 387 | 114 798 | |||||
| Health and social services and education networks | 7 645 | 8 787 | 9 588 | 11 008 | 10 885 | |||||
| Hydro-Québec | 38 135 | 38 979 | 37 893 | 35 639 | 34 776 | |||||
| Other government enterprises | 4 445 | 4 345 | 3 906 | 3 955 | 3 535 | |||||
| Municipalities and municipal bodies5 | 17 211 | 16 699 | 16 777 | 16 530 | 17 770 | |||||
| Total | 169 556 | 173 658 | 175 339 | 178 519 | 181 764 | |||||
- 1
- Including Treasury bills outstanding of the Consolidated Revenue Fund and the Financing Fund. As at March 31, 2004, Treasury bills outstanding should amount to $2 111 million for the Consolidated Revenue Fund and $1 197 million for the Financing Fund. The Treasury bills of the Financing Fund are used to meet the long-term financing needs of consolidated organizations, the Société québécoise d'assainissement des eaux and certain government enterprises.
- 2
- Preliminary results.
- 3
- Consolidated direct debt and net retirement plans liability, excluding pre-financing totalling $506 million in 1999-2000, $1 475 million in 2000-2001, $1 154 million in 2001-2002, $3 967 million in 2002-2003 and $1 644 million in 2003-2004. These borrowings are allocated to the years to which they apply.
- 4
- Including temporary borrowings used to meet long-term financing needs.
- 5
- Includes the long-term debt of the Société québécoise d'assainissement des eaux.
SECTION 2 31
Historical data and preliminary results
TABLE 2.18
GOUVERNEMENT DU QUEBEC
SUMMARY OF CONSOLIDATED FINANCIAL TRANSACTIONS
(millions of dollars)
| | 2000-2001 | 2001-2002 | 2002-2003 | 2003-20041 | ||||
|---|---|---|---|---|---|---|---|---|
| Budgetary transactions of Consolidated Revenue Fund2 | ||||||||
| Own-source revenue before exceptional losses of SGF | 40 921 | 39 023 | 41 197 | 42 824 | ||||
| Federal transfers | 7 895 | 8 885 | 8 932 | 9 377 | ||||
| Total revenue | 48 816 | 47 908 | 50 129 | 52 201 | ||||
| Program spending | –40 751 | –42 380 | –44 316 | –45 800 | ||||
| Debt service | –6 972 | –6 687 | –6 536 | –6 668 | ||||
| Total expenditure | –47 723 | –49 067 | –50 852 | –52 468 | ||||
| Net results of consolidated organizations2 | 284 | 322 | 368 | 267 | ||||
Budgetary reserve | ||||||||
| Funds allocated to reserve | –950 | — | — | — | ||||
| Use of funds allocated to reserve | — | 950 | — | — | ||||
Consolidated budget balance before exceptional losses of SGF | 427 | 113 | –355 | 0 | ||||
| Exceptional losses of SGF | — | –91 | –339 | –364 | ||||
| Consolidated budget balance | 427 | 22 | –694 | –364 | ||||
Consolidated non-budgetary transactions | ||||||||
| Investments, loans and advances | –1 632 | –1 142 | –1 649 | –1 077 | ||||
| Capital expenditures | –473 | –995 | –1 482 | –978 | ||||
| Retirement plans | 1 793 | 2 089 | 2 007 | 2 221 | ||||
| Other accounts | –631 | –589 | 240 | –1 235 | ||||
| Consolidated non-budgetary requirements | –943 | –637 | –884 | –1 069 | ||||
| Consolidated net financial requirements | –516 | –615 | –1 578 | –1 433 | ||||
Consolidated financing transactions | ||||||||
| Change in cash position3 | –1 006 | 236 | –3 090 | 2 466 | ||||
| Change in direct debt3 | 3 541 | 3 519 | 6 309 | 1 331 | ||||
| Retirement plans sinking fund4 | –2 019 | –3 140 | –1 641 | –2 364 | ||||
| Total financing of consolidated transactions | 516 | 615 | 1 578 | 1 433 | ||||
- Note:
- A negative entry indicates a financial requirement and a positive entry, a source of financing. For the change in cash position, a negative entry indicates an increase and a positive entry, a decrease. For purposes of comparison, the data are presented on the basis of the 2004-2005 budgetary structure. Because of the changes that will be made in the family policy as of January 1, 2005, amounts previously found under program spending will be recorded as revenue. The data presented in this table incorporate a restatement that covers a three-month period and that reduces own-source revenue and program spending by $132 million for each fiscal year, without changing the budget balance.
- 1
- Preliminary results.
- 2
- The budgetary transactions of the Consolidated Revenue Fund, which include the profits of government enterprises, are presented separately from those of consolidated organizations. In addition, the budgetary transactions of consolidated organizations are grouped under the new heading "net results of consolidated organizations".
- 3
- The change in direct debt includes new long-term borrowings less repayment of long-term borrowings and the change in temporary borrowings outstanding. Previously, the change in temporary borrowings outstanding was included in the change in cash position. See the explanation of consolidated financing transactions given earlier.
- 4
- This sinking fund receives amounts to be used to cover retirement benefits payable by the government under the public and parapublic sector retirement plans. The investment income of this fund is reinvested in it.
SECTION 2 33
TABLE 2.19
GOUVERNEMENT DU QUÉBEC — CONSOLIDATED REVENUE FUND
REVENUE BY SOURCE BEFORE THE EXCEPTIONAL LOSSES OF THE SGF
(millions of dollars)
| | 2000-2001 | 2001-2002 | 2002-2003 | 2003-20041 | |||||
|---|---|---|---|---|---|---|---|---|---|
| Own-source revenue | |||||||||
| Income and property taxes | |||||||||
| Personal income tax | 16 984 | 15 791 | 16 048 | 16 454 | |||||
| Contributions to Health Services Fund | 4 488 | 4 291 | 4 068 | 4 658 | |||||
| Corporate taxes2 | 4 217 | 4 029 | 3 735 | 3 837 | |||||
| 25 689 | 24 111 | 23 851 | 24 949 | ||||||
| Consumption taxes | |||||||||
| Sales | 7 374 | 7 557 | 8 331 | 9 003 | |||||
| Fuel | 1 536 | 1 536 | 1 645 | 1 670 | |||||
| Tobacco | 483 | 652 | 867 | 923 | |||||
| 9 393 | 9 745 | 10 843 | 11 596 | ||||||
| Duties and permits | |||||||||
| Motor vehicles | 646 | 662 | 690 | 700 | |||||
| Alcoholic beverages | 146 | 140 | 155 | 156 | |||||
| Natural resources | 265 | 188 | 201 | 124 | |||||
| Other | 180 | 177 | 178 | 171 | |||||
| 1 237 | 1 167 | 1 224 | 1 151 | ||||||
| Miscellaneous | |||||||||
| Sales of goods and services | 406 | 412 | 440 | 434 | |||||
| Interest | 390 | 395 | 321 | 332 | |||||
| Fines, forfeitures and recoveries | 310 | 371 | 417 | 389 | |||||
| 1 106 | 1 178 | 1 178 | 1 155 | ||||||
| Revenue from government enterprises before exceptional losses of SGF | |||||||||
| Société des alcools du Québec | 471 | 489 | 540 | 563 | |||||
| Loto-Québec | 1 358 | 1 352 | 1 353 | 1 393 | |||||
| Hydro-Québec | 1 160 | 1 041 | 1 840 | 2 026 | |||||
| Other | 507 | –60 | 368 | –9 | |||||
| 3 496 | 2 822 | 4 101 | 3 973 | ||||||
Total own-source revenue before exceptional losses of SGF | 40 921 | 39 023 | 41 197 | 42 824 | |||||
Federal transfers | |||||||||
| Equalization | 5 650 | 5 336 | 5 315 | 4 065 | |||||
| Canada Health and Social Transfer | 1 597 | 2 958 | 2 648 | 4 266 | |||||
| Other transfers related to fiscal arrangements | 30 | 27 | 34 | 64 | |||||
| Other programs | 618 | 564 | 935 | 982 | |||||
| Total federal transfers | 7 895 | 8 885 | 8 932 | 9 377 | |||||
| Total revenue before exceptional losses of SGF | 48 816 | 47 908 | 50 129 | 52 201 | |||||
- Note:
- Data restated according to the information provided at the bottom of Table 2.18.
- 1
- Preliminary results.
- 2
- Includes tax on corporate profits, tax on capital and tax on insurance company premiums, as well as tax on telecommunications, gas and electricity.
SECTION 2 34
TABLEAU 2.20
GOUVERNEMENT DU QUÉBEC — CONSOLIDATED REVENUE FUND
EXPENDITURE BY DEPARTMENT
(millions of dollars)
| | 2000-2001 | 2001-2002 | 2002-2003 | 2003-20041 | |||||
|---|---|---|---|---|---|---|---|---|---|
| Program spending | |||||||||
| Assemblée nationale | 80 | 88 | 92 | 94 | |||||
| Personnes désignées par l'Assemblée nationale | 42 | 50 | 63 | 97 | |||||
| Affaires municipales, Sport et Loisir | 1 388 | 1 626 | 1 584 | 1 575 | |||||
| Agriculture, Pêcheries et Alimentation | 714 | 651 | 641 | 664 | |||||
| Conseil du trésor et Administration gouvernementale | 446 | 475 | 523 | 488 | 2 | ||||
| Conseil exécutif | 79 | 94 | 139 | 168 | 2 | ||||
| Culture et Communications | 528 | 479 | 490 | 512 | |||||
| Développement économique et régional et Recherche | 1 095 | 1 008 | 1 086 | 798 | 2 | ||||
| Éducation | 10 124 | 10 542 | 11 099 | 11 469 | |||||
| Emploi, Solidarité sociale et Famille | 5 530 | 5 636 | 5 823 | 5 993 | |||||
| Environnement | 155 | 178 | 177 | 180 | |||||
| Finances (excluding debt service) | 115 | 116 | 127 | 152 | 2 | ||||
| Justice | 468 | 509 | 542 | 573 | |||||
| Relations avec les citoyens et Immigration | 185 | 220 | 246 | 210 | |||||
| Relations internationales | 104 | 111 | 111 | 112 | |||||
| Ressources naturelles, Faune et Parcs | 564 | 502 | 506 | 485 | |||||
| Revenu | 715 | 613 | 778 | 642 | |||||
| Santé et Services sociaux | 16 095 | 17 189 | 17 919 | 19 105 | |||||
| Sécurité publique | 744 | 799 | 871 | 924 | |||||
| Transports | 1 501 | 1 406 | 1 429 | 1 488 | |||||
| Travail | 79 | 88 | 70 | 69 | |||||
| Total program spending | 40 751 | 42 380 | 44 316 | 45 800 | |||||
Debt service | |||||||||
| Direct debt service | 4 378 | 3 970 | 3 888 | 3 926 | |||||
| Interest on retirement plans | 2 594 | 2 717 | 2 648 | 2 742 | |||||
| Total debt service | 6 972 | 6 687 | 6 536 | 6 668 | |||||
| Total expenditure | 47 723 | 49 067 | 50 852 | 52 468 | |||||
- Note:
- Data restated according to the information provided at the bottom of Table 2.18. In addition, since the data are rounded off, the sum of the amounts recorded for each department may not correspond to the total.
- 1
- Preliminary results.
- 2
- These amounts contain provisions that allow appropriations to be transferred to other departments between the date the Budget documents are produced and the end of the fiscal year.
SECTION 2 35
GOUVERNEMENT DU QUÉBEC
CONSOLIDATED NON-BUDGETARY TRANSACTIONS
(millions of dollars)
| | 2000-2001 | 2001-2002 | 2002-2003 | 2003-20041 | ||||||
|---|---|---|---|---|---|---|---|---|---|---|
| Investments, loans and advances | ||||||||||
| Consolidated Revenue Fund | ||||||||||
Government enterprises | ||||||||||
| Shares and investments | ||||||||||
| Société générale de financement du Québec | –350 | –550 | –200 | — | ||||||
| Société Innovatech du Grand Montréal | –42 | –20 | –50 | — | ||||||
| Société Innovatech Québec et Chaudière-Appalaches | –11 | –29 | –30 | –2 | ||||||
| Société Innovatech Sud du Québec | –6 | –19 | –11 | –1 | ||||||
| Société Innovatech Régions ressources | –13 | –12 | –8 | –9 | ||||||
| Other | –3 | –18 | –41 | — | ||||||
| –425 | –648 | –340 | –12 | |||||||
| Change in the equity value of investments | –1 157 | –371 | –1 138 | –587 | ||||||
| Loans and advances | — | — | — | –5 | ||||||
| Total government enterprises | –1 582 | –1 019 | –1 478 | –604 | ||||||
| Individuals, corporations and others | –20 | –173 | –45 | –211 | ||||||
| Municipalities and municipal bodies | 1 | 4 | 2 | 2 | ||||||
| –1 601 | –1 188 | –1 521 | –813 | |||||||
| Consolidated organizations | –31 | 46 | –128 | –264 | ||||||
| Total investments, loans and advances | –1 632 | –1 142 | –1 649 | –1 077 | ||||||
Capital expenditures | ||||||||||
| Consolidated Revenue Fund | ||||||||||
| Net investments | –144 | –135 | –200 | –334 | ||||||
| Amortization | 334 | 193 | 207 | 212 | ||||||
| 190 | 58 | 7 | –122 | |||||||
| Consolidated organizations | –663 | –1 053 | –1 489 | –856 | ||||||
| Total capital expenditures | –473 | –995 | –1 482 | –978 | ||||||
- 1
- Preliminary results.
SECTION 2 36
TABLE 2.21 (CONT.)
GOUVERNEMENT DU QUÉBEC
CONSOLIDATED NON-BUDGETARY TRANSACTIONS
(millions of dollars)
| | 2000-2001 | 2001-2002 | 2002-2003 | 2003-20041 | ||||||
|---|---|---|---|---|---|---|---|---|---|---|
| Retirement plans | ||||||||||
| Contributions by the government as employer | ||||||||||
| RREGOP and PPMP | ||||||||||
| Cost of credited service2 | 990 | 1 014 | 1 053 | 1 068 | ||||||
| Amortization of actuarial gain (–) or loss | 66 | 141 | 155 | 153 | ||||||
| Other plans | ||||||||||
| Cost of credited service2 | 166 | 147 | 170 | 161 | ||||||
| Amortization of actuarial gain (–) or loss | 26 | 65 | 70 | 73 | ||||||
| Cost of changes | — | 28 | 3 | — | ||||||
| Total government contribution | 1 248 | 1 395 | 1 451 | 1 455 | ||||||
| Contributions by independent employers | — | 4 | 4 | 5 | ||||||
| Participants' contributions | 106 | 88 | 76 | 200 | ||||||
| Total contributions | 106 | 92 | 80 | 205 | ||||||
| Benefits, repayments and administrative expenses | –2 567 | –2 720 | –2 913 | –3 043 | ||||||
| Interest on actuarial obligation | 3 006 | 3 322 | 3 389 | 3 604 | ||||||
| Total retirement plans | 1 793 | 2 089 | 2 007 | 2 221 | ||||||
Other accounts | ||||||||||
| Consolidated Revenue Fund | –490 | –652 | 244 | –855 | ||||||
| Consolidated organizations | –141 | 63 | –4 | –380 | ||||||
| Total other accounts | –631 | –589 | 240 | –1 235 | ||||||
| Total consolidated non-budgetary transactions | –943 | –637 | –884 | –1 069 | ||||||
- Note:
- A negative entry indicates a financial requirement and a positive entry, a source of financing.
- 1
- Preliminary results.
- 2
- Actuarial value of retirement benefits vested during the fiscal year, calculated according to the actuarial projected benefit method prorated on service.
SECTION 2 37
TABLE 2.22
GOUVERNEMENT DU QUÉBEC
CONSOLIDATED FINANCING TRANSACTIONS
(millions of dollars)
| | 2000-2001 | 2001-2002 | 2002-2003 | 2003-20041 | |||||
|---|---|---|---|---|---|---|---|---|---|
| Change in cash position | |||||||||
| Consolidated Revenue Fund | –969 | 323 | –2 978 | 2 466 | |||||
| Consolidated organizations | –37 | –87 | –112 | — | |||||
| Total change in cash position | –1 006 | 236 | –3 090 | 2 466 | |||||
Change in direct debt | |||||||||
| Consolidated Revenue Fund | |||||||||
| New borrowings | 7 569 | 7 700 | 8 862 | 4 940 | |||||
| Repayment of borrowings | –4 616 | –4 890 | –3 943 | –4 842 | |||||
| 2 953 | 2 810 | 4 919 | 98 | ||||||
| Consolidated organizations | |||||||||
| New borrowings | 1 558 | 1 311 | 2 568 | 2 415 | |||||
| Repayment of borrowings | –970 | –602 | –1 178 | –1 182 | |||||
| 588 | 709 | 1 390 | 1 233 | ||||||
| Total change in direct debt | 3 541 | 3 519 | 6 309 | 1 331 | |||||
| Retirement plans sinking fund2 | –2 019 | –3 140 | –1 641 | –2 364 | |||||
| Total financing of consolidated transactions | 516 | 615 | 1 578 | 1 433 | |||||
- Note:
- A negative entry indicates a financial requirement and a positive entry, a source of financing. For the change in cash position, a negative entry indicates an increase and a positive entry, a decrease.
- 1
- Preliminary results.
- 2
- This sinking fund receives amounts to be used to cover retirement benefits payable by the government under the public and parapublic sector retirement plans. The investment income of this fund is reinvested in it and applied against the interest on the actuarial obligation to obtain the interest charge on the retirement plans.
SECTION 2 38
TABLE 2.23
GOUVERNEMENT DU QUÉBEC
BORROWINGS FOR THE CONSOLIDATED REVENUE FUND IN 2003-2004
| Amount in Canadian dollars1 | Face value in foreign currency | Interest rate2 | Date of issue | Date of maturity | Price to investor | Yield to investor3 | ||||||
|---|---|---|---|---|---|---|---|---|---|---|---|---|
| (millions) | % | | | $ | % | |||||||
| 503 | — | 5.75 | July 28 | 2036-12-01 | 100.555 | 5.712 | ||||||
| 504 | — | 5.75 | December 1 | 2036-12-01 | 100.710 | 5.702 | ||||||
| 209 | AUS$200 | 6.00 | February 18 | 2009-02-18 | 100.000 | 6.000 | ||||||
| 468 | — | 5.25 | March 11 | 2013-10-01 | 105.089 | 4.586 | ||||||
| 1 585 | 4 | — | Various | Various | Various | Various | Various | |||||
| 656 | 5 | — | Various | Various | Various | Various | Various | |||||
| 793 | 6 | — | Various | Various | Various | Various | Various | |||||
| 5 | 7 | — | Various | Various | Various | Various | Various | |||||
| 450 | 8 | — | Various | Various | Various | Various | Various | |||||
| –233 | 9 | Various | Various | Various | Various | Various | Various | |||||
| 4 940 | ||||||||||||
- 1
- Borrowings in foreign currency given in Canadian equivalent of their value on the date of borrowing.
- 2
- Interest payable semi-annually except if another frequency is indicated in a note.
- 3
- Yield to investor is determined on the basis of interest payable semi-annually.
- 4
- Medium-term notes on the Canadian market.
- 5
- Real return bonds. The principal and the interest rate of these bonds are adjusted according to the change in the Consumer Price Index in Canada.
- 6
- Savings products issued by Épargne Placements Québec.
- 7
- Borrowings from the Canada Pension Plan Investment Fund.
- 8
- Immigrant Investor Program.
- 9
- Amount received (disbursed) under interest rate and currency swap agreements.
- Note:
- The Québec government has credit agreements with various banks and financial institutions for a total of US$3 500 million. None of these credit agreements is being drawn upon.
SECTION 2 39
GOUVERNEMENT DU QUÉBEC
BORROWINGS FOR THE FINANCING FUND IN 2003-2004
| | Amount in Canadian dollars1 | Face value in foreign currency | Interest rate2 | Date of issue | Date of maturity | Price to investor | Yield to investor3 | |||||||
|---|---|---|---|---|---|---|---|---|---|---|---|---|---|---|
| | (millions) | % | | | $ | % | ||||||||
| A. Borrowings for consolidated organizations | ||||||||||||||
| 498 | 4 | — | 4.25 | 5 | July 9 | 2010-07-09 | 99.530 | 4.329 | ||||||
| 502 | — | 5.25 | July 21 | 2013-10-01 | 100.423 | 5.195 | ||||||||
| 65 | 6 | — | 6.25 | September 4 | 2010-12-01 | 107.903 | 4.937 | |||||||
| 60 | 6 | — | 5.25 | September 4 | 2013-10-01 | 99.872 | 5.266 | |||||||
| 504 | — | 5.25 | September 15 | 2013-10-01 | 100.782 | 5.149 | ||||||||
| 50 | 6 | — | 6.25 | November 4 | 2032-06-01 | 105.071 | 5.881 | |||||||
| 503 | — | 5.25 | November 20 | 2013-10-01 | 100.690 | 5.159 | ||||||||
| 77 | 6 | — | 5.25 | December 10 | 2013-10-01 | 100.625 | 5.167 | |||||||
| 16 | 6 | — | 5.25 | December 19 | 2013-10-01 | 101.367 | 5.070 | |||||||
| 57 | — | 5.25 | March 11 | 2013-10-01 | 105.089 | 4.586 | ||||||||
Sub-total | 2 332 | |||||||||||||
B. Borrowings for certain government enterprises | ||||||||||||||
| 85 | 6 | — | 6.25 | September 4 | 2032-06-01 | 105.407 | 5.858 | |||||||
| 83 | 6 | — | 5.25 | December 12 | 2036-12-01 | 100.071 | 5.745 | |||||||
Sub-total | 168 | |||||||||||||
Total | 2 500 | |||||||||||||
- 1
- Borrowings in foreign currency given in Canadian equivalent of their value on the date of borrowing.
- 2
- Interest payable semi-annually except if another frequency is indicated in a note.
- 3
- Yield to investor is determined on the basis of interest payable semi-annually.
- 4
- Medium-term notes on the European market.
- 5
- Interest payable annually.
- 6
- Borrowings fully subscribed by the Caisse de dépôt et placement du Québec.
SECTION 2 40
TABLE 2.25
GOUVERNEMENT DU QUÉBEC
BORROWINGS BY FINANCEMENT-QUÉBEC IN 2003-2004
| | Amount in Canadian dollars1 | Face value in foreign currency | Interest rate2 | Date of issue | Date of maturity | Price to investor | Yield to investor3 | |||||||
|---|---|---|---|---|---|---|---|---|---|---|---|---|---|---|
| | (millions) | % | | | $ | % | ||||||||
| 500 | 4 | — | Variable | 5 | July 4 | 2007-07-04 | 100.000 | Variable | ||||||
| 501 | — | 4.75 | October 21 | 2009-12-01 | 100.237 | 4.704 | ||||||||
| 507 | — | 4.75 | January 9 | 2009-12-01 | 101.401 | 4.476 | ||||||||
| 1 508 | ||||||||||||||
- 1
- Borrowings in foreign currency given in Canadian equivalent of their value on the date of borrowing.
- 2
- Interest payable semi-annually except if another frequency is indicated in a note.
- 3
- Yield to investor is determined on the basis of interest payable semi-annually.
- 4
- Medium-term notes on the Canadian market.
- 5
- Interest payable quarterly.
SECTION 2 41
TABLE 2.26
GOUVERNEMENT DU QUÉBEC
BORROWINGS BY HYDRO-QUÉBEC IN 20031
| | Amount in Canadian dollars2 | Face value in foreign currency | Interest rate3 | Date of issue | Date of maturity | Price to investor | Yield to investor4 | |||||||
|---|---|---|---|---|---|---|---|---|---|---|---|---|---|---|
| | (millions) | % | | | $ | % | ||||||||
| 2 249 | 5 | Various | Various | Various | Various | Various | Various | |||||||
| 334 | 6 | Various | Various | Various | Various | Various | Various | |||||||
| 2 583 | ||||||||||||||
- 1
- Borrowings contracted as at December 31, 2003.
- 2
- Borrowings in foreign currency given in Canadian equivalent of their value on the date of borrowing.
- 3
- Interest payable semi-annually except if another frequency is indicated in a note.
- 4
- Yield to investor is determined on the basis of interest payable semi-annually.
- 5
- Medium-term notes on the Canadian market.
- 6
- Amount received under interest rate and currency swap agreements.
- Note:
- Hydro-Québec has credit agreements with various banks and financial institutions for a total of US$1 500 million. None of the credit agreements was being drawn upon at December 31, 2003.
SECTION 2 42
| | | |
|---|---|---|
| Section 2 | Appendix 2.1 |
Consolidated budgetary transactions: revenue by source and expenditure by mission in 2003-2004
SECTION 2 43
GOUVERNEMENT DU QUÉBEC
CONSOLIDATED BUDGETARY TRANSACTIONS: REVENUE BY SOURCE AND EXPENDITURE BY MISSION IN 2003-2004
(millions of dollars)
| | Consolidated results | | | Preliminary results | ||||
|---|---|---|---|---|---|---|---|---|
| | Budget Speech of June 12, 2003 | Consolidated Revenue Fund | Consolidated organizations | Consolidated results | ||||
| Revenue by source | ||||||||
| Income and property taxes | 25 915 | 24 949 | 475 | 25 424 | ||||
| Consumption taxes | 11 715 | 11 596 | 140 | 11 736 | ||||
| Duties and permits | 1 318 | 1 151 | 132 | 1 283 | ||||
| Miscellaneous | 2 475 | 1 155 | 1 447 | 2 602 | ||||
| Revenue from government enterprises before exceptional losses of SGF | 3 942 | 3 973 | — | 3 973 | ||||
| Own-source revenue before exceptional losses of SGF | 45 365 | 45 018 | ||||||
| Federal transfers | 9 584 | 9 377 | 498 | 9 875 | ||||
| Total revenue before exceptional losses of SGF | 54 949 | 54 893 | ||||||
Expenditure by mission | ||||||||
| Health and Social Services | –19 734 | –19 105 | –662 | –19 767 | ||||
| Education and Culture | –12 220 | –12 162 | –53 | –12 215 | ||||
| Economy and Environment | –6 014 | –5 608 | –604 | –6 212 | ||||
| Support for Individuals and Families | –5 164 | –5 240 | –73 | –5 313 | ||||
| Administration and Justice | –4 305 | –3 685 | –437 | –4 122 | ||||
| Program spending | –47 437 | 1 | –47 629 | |||||
| Debt service | –7 512 | –6 668 | –596 | –7 264 | ||||
| Total expenditure | –54 949 | –54 893 | ||||||
| Consolidated budget balance before exceptional losses of SGF | 0 | 0 | ||||||
| Exceptional losses of SGF | — | –364 | ||||||
| Consolidated budget balance | 0 | –364 | ||||||
- Note:
- This purpose of this table, which presents revenue by source and expenditure by mission for fiscal 2003-2004, is to provide better reconciliation with the consolidated statement of operating results as it should be presented in the government's financial statements for that fiscal year.
- 1
- The breakdown of expenditure by mission is the same as that which prevailed at the time of the June 12, 2003 Budget Speech.
SECTION 2 45
Section 2