Exhibit 99.5
| PUBLIC ACCOUNTS 2023-2024 | Consolidated Financial Statements of the Gouvernement du Québec |
Fiscal year ended March 31, 2024
Published in accordance with section 86
of the Financial Administration Act (CQLR, chapter A-6.001)
![]()
Public Accounts 2023-2024 - Volume 1
Legal deposit - Bibliothèque et Archives nationales du Québec
October 2024
ISSN 0706-2850 (Print version)
ISSN 1925-1823 (PDF)
© Gouvernement du Québec, 2024
Her Honour the Honourable Manon Jeannotte
Lieutenant Governor of Québec
Parliament Building
Québec
Your Honour,
I am pleased to present you with the Public Accounts of the Gouvernement du Québec for the fiscal year ended March 31, 2024. They are presented in two volumes:
Volume 1 includes the consolidated financial statements of the Gouvernement du Québec audited by the Auditor General of Québec, a financial analysis of these financial statements, the budgetary balance established in accordance with the Balanced Budget Act as well as changes in main trends, including those of the government's consolidated revenue and expenditure and net debt over 10 fiscal years.
Volume 2 includes the report of excess expenditures and other costs of budgetary departments and bodies over appropriations approved by Parliament and the report of special funds' excess expenditures and investments over amounts approved by Parliament as well as detailed information for each department, budgetary body, and special fund.
Respectfully yours,
Eric Girard
Minister of Finance
Québec, October 2024
Mr. Eric Girard
Minister of Finance
Parliament Building
Québec
Dear Minister,
In accordance with the commission entrusted to me, I have the honour of presenting the Public Accounts of the Gouvernement du Québec for the fiscal year ended March 31, 2024. These accounts have been prepared under section 86 of the Financial Administration Act (CQLR, chapter A-6.001), in accordance with the government's accounting policies and the public sector accounting standards.
Respectfully yours,
Lucie Pageau, CPA
Comptroller of Finance
Québec, October 2024
Table of contents
Presentation of the Public Accounts
The Public Accounts 2023-2024 have been prepared by the Comptroller of Finance for the Minister of Finance in accordance with the public sector accounting standards and pursuant to the provisions of section 86 of the Financial Administration Act (CQLR, chapter A-6.001). They are published in two volumes. In addition to these volumes, further information to facilitate an understanding of the public accounts is published on the Ministère des Finances website in the section Public Accounts.
Volume 1 - Consolidated financial statements of the Gouvernement du Québec
Volume 1 presents the results and financial position of the Gouvernement du Québec. The financial operations include those of the National Assembly, of the people it appoints, of the government departments, and of all bodies, funds and enterprises controlled by the government.
Volume 1 presents a financial analysis to increase the usefulness and transparency of these consolidated financial statements. The analysis includes the highlights for the 2023-2024 fiscal year and compares the actual results with both forecast results forecast in the 2023-2024 budget and the 2022-2023 results. It also presents the government's budget balance in compliance with the Balanced Budget Act. Finally, it presents the development of main trends relating to important items in the consolidated financial statements and the outcome of the analysis of 10 indicators.
In accordance with the Auditor General Act (CQLR, chapter V-5.01), the Auditor General of Québec prepares an Independent Auditor's Report included with the government's consolidated financial statements and in which she expresses her opinion on the financial statements.
Volume 2 - Financial information on the Consolidated Revenue Fund: general fund and special funds
Volume 2 presents the financial information on the Consolidated Revenue Fund, which is made up of the general fund and the special funds. This volume is divided into two sections. The first section shows the revenue of government departments and budget-funded bodies, their authorized appropriations, the expenses and other costs charged to each of these appropriations and, lastly, the financial operations of the specified purpose accounts they administer. The second section presents the revenue of the special funds as well as their approved and realized expenses and investments.
Acknowledgements
Preparing the Public Accounts requires the participation and collaboration of many employees from different government departments, funds, bodies, and organizations, from the health and social services, education and higher education networks as well as from government enterprises. We would like to thank all of them for their help in preparing these documents.
ANALYSIS OF THE
CONSOLIDATED
FINANCIAL STATEMENTS
▌ 1. Highlights for fiscal year 2023-2024
Summary of consolidated results
Fiscal year ended March 31, 2024
(millions of dollars, unless otherwise indicated)
| Actual results | Actual results | Change | |||||||||||||||||||
| as at | Change | as at | compared with | ||||||||||||||||||
| Budget | March 31, | compared | March 31, | the 2022-2023 | |||||||||||||||||
| 2023-2024 | (1),(2) | 2024 | with Budget | 2023 (3) | actual results | ||||||||||||||||
| M$ | % | (restated) | M$ | % | |||||||||||||||||
| REVENUE | |||||||||||||||||||||
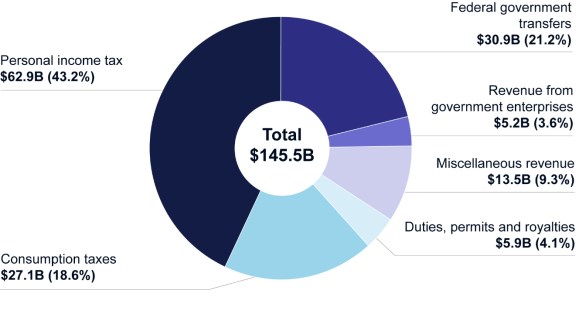
| Income and property taxes | 65 446 | 62 948 | (2 498 | ) | (3.8 | ) | 64 521 | (1 573 | ) | (2.4 | ) | ||||||||||
| Consumption taxes | 27 290 | 27 083 | (207 | ) | (0.8 | ) | 26 597 | 486 | 1.8 | ||||||||||||
| Duties, permits and royalties | 5 739 | 5 888 | 149 | 2.6 | 5 784 | 104 | 1.8 | ||||||||||||||
| Miscellaneous revenue | 12 707 | 13 505 | 798 | 6.3 | 11 984 | 1 521 | 12.7 | ||||||||||||||
| Revenue from government enterprises | 6 807 | 5 241 | (1 566 | ) | (23.0 | ) | 6 620 | (1 379 | ) | (20.8 | ) | ||||||||||
| Own-source revenue | 117 989 | 114 665 | (3 324 | ) | (2.8 | ) | 115 506 | (841 | ) | (0.7 | ) | ||||||||||
| Federal government transfers | 29 742 | 30 876 | 1 134 | 3.8 | 28 737 | 2 139 | 7.4 | ||||||||||||||
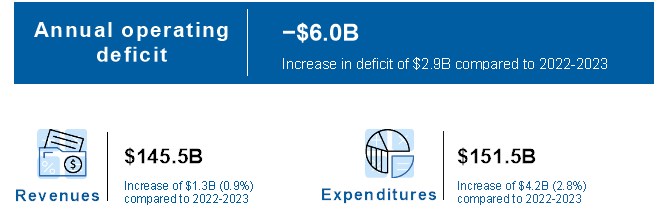
| Total revenue | 147 731 | 145 541 | (2 190 | ) | (1.5 | ) | 144 243 | 1 298 | 0.9 | ||||||||||||
| EXPENDITURE | |||||||||||||||||||||
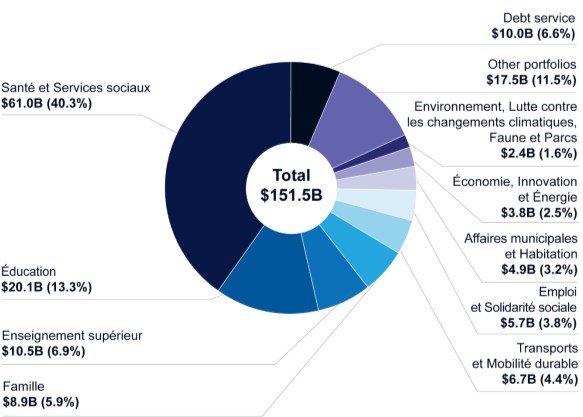
| Santé et Services sociaux | 59 015 | 61 000 | 1 985 | 3.4 | 59 341 | 1 659 | 2.8 | ||||||||||||||
| Éducation | 20 335 | 20 058 | (277 | ) | (1.4 | ) | 19 511 | 547 | 2.8 | ||||||||||||
| Enseignement supérieur | 10 480 | 10 476 | (4 | ) | 0.0 | 9 655 | 821 | 8.5 | |||||||||||||
| Famille | 8 210 | 8 917 | 707 | 8.6 | 7 835 | 1 082 | 13.8 | ||||||||||||||
| Transports et Mobilité durable | 6 957 | 6 700 | (257 | ) | (3.7 | ) | 6 400 | 300 | 4.7 | ||||||||||||
| Emploi et Solidarité sociale | 5 322 | 5 728 | 406 | 7.6 | 8 983 | (3 255 | ) | (36.2 | ) | ||||||||||||
| Affaires municipales et Habitation | 4 546 | 4 914 | 368 | 8.1 | 4 936 | (22 | ) | (0.4 | ) | ||||||||||||
| Économie, Innovation et Énergie | 3 680 | 3 830 | 150 | 4.1 | 3 280 | 550 | 16.8 | ||||||||||||||
| Environnement, Lutte contre les changements climatiques, Faune et Parcs | 2 283 | 2 431 | 148 | 6.5 | 1 673 | 758 | 45.3 | ||||||||||||||
| Other portfolios | 17 564 | 17 499 | (65 | ) | (0.4 | ) | 15 533 | 1 966 | 12.7 | ||||||||||||
| Sub-total | 138 392 | 141 553 | 3 161 | 2.3 | 137 147 | 4 406 | 3.2 | ||||||||||||||
| Debt service | 9 464 | 9 982 | 518 | 5.5 | 10 222 | (240 | ) | (2.3 | ) | ||||||||||||
| Total expenditure | 147 856 | 151 535 | 3 679 | 2.5 | 147 369 | 4 166 | 2.8 | ||||||||||||||
| Provision for contingencies | 1 500 | (1 500 | ) | (100.0 | ) | ||||||||||||||||
| ANNUAL OPERATING DEFICIT | (1 625 | ) | (5 994 | ) | (4 369 | ) | ― | (3 126 | ) | (2 868 | ) | ― | |||||||||
(1) These numbers correspond to data presented in Budget 2023-2024 of the Ministère des Finances tabled on March 21, 2023, adjusted to ensure comparability with the expenditures as at March 31, 2024. Details of these reclassifications are presented in Note 3 of the consolidated financial statements.
(2) For the purposes of establishing budget forecasts, certain factors that constitute risk and uncertainty factors do not depend directly on the government but can lead to real results that differ from those anticipated. Such factors are presented in Appendix 1, "Risks and uncertainties".
(3) Certain figures for 2022-2023 have been reclassified for consistency with the presentation adopted as at March 31, 2024.
1. Highlights for fiscal year 2023-2024 (cont'd)
1. Highlights for fiscal year 2023-2024 (cont'd)
Total revenue as at March 31, 2024
(billions of dollars, percentage of total revenue)
Expenditure as at March 31, 2024
(billions of dollars, percentage of total expenditure)
1. Highlights for fiscal year 2023-2024 (cont'd)
1. Highlights for fiscal year 2023-2024 (cont'd)
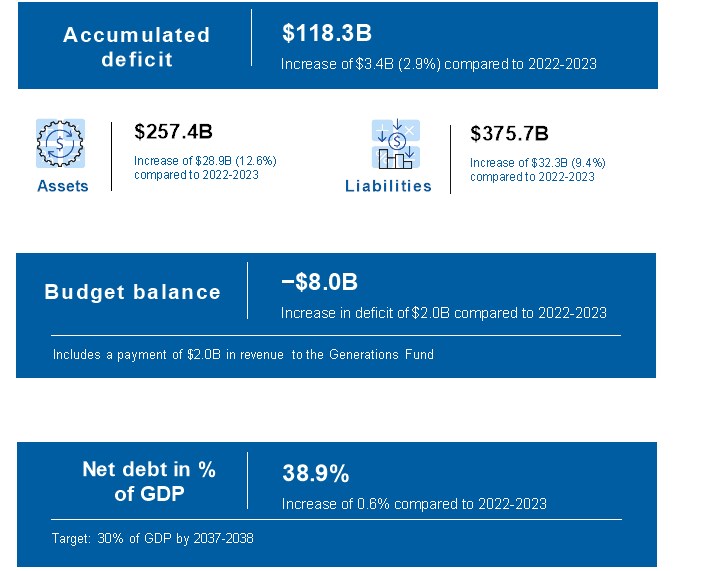
Budget balance
In Budget 2023-2024, tabled on March 21, 2023, the government forecast a deficit of $1 625 million for fiscal 2023-2024 as well as a budgetary deficit of $3 998 million within the meaning of the Balanced Budget Act (CQLR, chapter E-12.00002), taking into account the payment of $2 373 million in dedicated revenue to the Generations Fund.
The consolidated financial statements of the Gouvernement du Québec for the fiscal year ended March 31, 2024 show an annual operating deficit of $5 994 million. Taking into account deposits of revenues dedicated to the Generations Fund of $2 047 million, the budgetary balance withing the meaning of the Balanced Budget Act for the fiscal year ended March 31, 2024 shows a deficit of $8 041 million.
Plan to restore balanced budget
In December 2023, the Balanced Budget Act was modernized to make its administration more flexible and simpler while maintaining the constraint related to budget balance. In keeping with the provisions in the modernized Act, the $6 084-million budget deficit observed for fiscal year 2022-2023 in the Public Accounts tabled in the fall of 2023 obliges the government to present a plan to restore balanced budget not later than the publication of Budget 2025-2026. The plan must present decreasing deficits over a maximum period of five years and make provision for a balanced budget not later than 2029-2030. Moreover, the government must, for the fiscal year preceding the year in which balanced budget is achieved, make provision for a deficit representing 25% or less of the 2022-2023 budget deficit, i.e., a maximum of $1 521 million.
▌ 2. Variance analysis
In accordance with the standards set out by the Public Sector Accounting Board, the financial analysis that accompanies the government's consolidated financial statements compares real results with those in its initial budget, adjusted to take into account some reclassifications,1 as well as those of the previous fiscal year.
______________________________________
1 The budget forecasts for expenditures by portfolios have been reclassified to ensure comparability with actual expenditures recorded as at March 31, 2024. Details of these reclassifications are presented in Note 3 of the consolidated financial statements.
2. Variance analysis (cont'd)
2.1. Own-source revenue
Income and property taxes
Fiscal year ended March 31, 2024
(millions of dollars, unless otherwise indicated)
| Actual results | Change with | Actual results | Change with | ||||||||||||||||||
| Budget | as at | 2023-2024 | as at | 2022-2023 | |||||||||||||||||
| 2023-2024 | March 31, 2024 | budget | March 31, 2023 | actual results | |||||||||||||||||
| M$ | % | M$ | % | ||||||||||||||||||
| Personal income tax | 43 126 | 41 863 | (1 263 | ) | (2.9 | ) | 42 251 | (388 | ) | (0.9 | ) | ||||||||||
| Contributions for health services | 7 944 | 8 533 | 589 | 7.4 | 7 914 | 619 | 7.8 | ||||||||||||||
| Corporate taxes | 13 192 | 11 402 | (1 790 | ) | (13.6 | ) | 13 243 | (1 841 | ) | (13.9 | ) | ||||||||||
| School property tax | 1 184 | 1 150 | (34 | ) | (2.9 | ) | 1 113 | 37 | 3.3 | ||||||||||||
| TOTAL | 65 446 | 62 948 | (2 498 | ) | (3.8 | ) | 64 521 | (1 573 | ) | (2.4 | ) | ||||||||||
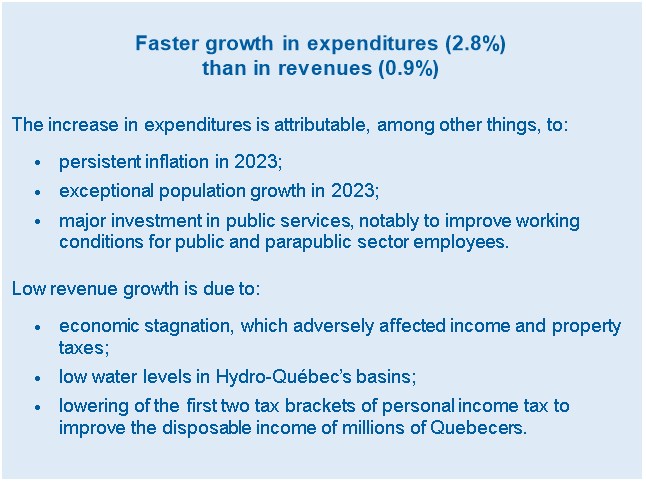
The 2023-2024 forecast of $65 446 million reflected impact on tax revenues of moderate growth of the economic activity in 2023 on tax revenues, mainly as regards personal income tax revenues, which stood at $43 126 million, a slight increase over real results as at March 31, 2023. This forecast was due in particular to growth in household income, which in turn was supported by a robust labour market and by growth in wages and salaries. On the other hand, it also considered the impact of the lowering of the first two tax brackets, which came into force on January 1, 2023. Revenue forecasts related to corporation taxes and health services contributions, which were fairly stable in relation to real results as at March 31, 2023, took into account an expected −4.9% change in the operating surplus in 2023 and 5.3% in 2024, and the impact of the new tax holiday for major investment projects.
The increase in nominal GDP of 3.7% in 2023 exceeded the 2.7% forecast announced in Budget 2023-2024. However, the increase stemmed by and large from persistent inflation in 2023. Indeed, real GDP, which excludes the impact of inflation, fell by 0.4% in relation to the forecast in 2023. It grew by 0.2% as against the 0.6% increase anticipated in Budget 2023-2024. Accordingly, despite the increase in wages and salaries, persistent inflation and the impact of greater-than-anticipated tightening of monetary policy curbed economic activity in 2023. These less favourable than anticipated economic prospects affected income and property taxes, which were 3.8% lower than forecast.
More specifically, personal income tax and corporation tax revenues declined by 2.9% and 13.6% in relation to the budget, and by 0.9% and 13.9% compared with real results as at March 31, 2023.
2. Variance analysis (cont'd)
2.1. Own-source revenue (cont'd)
Income and property taxes (cont'd)
The variation in personal income tax in relation to the budget is attributable in particular to lower-than-anticipated tax revenue in fiscal year 2023-2024, despite the upward adjustment of wages and salaries. This variation is also attributable to less favourable changes in capital gains and the income of individuals in business observed in the wake of the processing of income tax returns for the 2023 taxation year. The reduction in relation to 2022-2023 is mainly due to the downturn in revenues attributable to the lowering on January 1, 2023, of the first two tax brackets by 1 percentage point, and the significant indexation of the taxation system1 pertaining to 2023 (6.44%) and 2024 (5.08%).
As for corporation taxes, the 13.9% reduction in the net operating surplus of corporations largely explains the 13.9% decrease compared with real results as at March 31, 2023, and the 13.6% downward variation in relation to the forecast, mainly because of the economic slowdown and lower prices for raw materials, which affected the prices of natural resource exports.
Furthermore, revenues from health services contributions rose by 7.4% in relation to the budget and by 7.8% in relation to real results as at March 31, 2023. The variations stem mainly from wage and salary gains, which stood at 6.0% in 2023, sustained by labour market dynamism.
______________________________________
1 The statutory indexation of the main parameters of the personal income tax system, namely the various tax brackets, the basic amount and several deductions and tax credits. The indexation rate is determined by the increase in the Québec consumer price index, excluding alcohol, tobacco and recreational cannabis.
2. Variance analysis (cont'd)
2.1. Own-source revenue (cont'd)
Consumption taxes
Fiscal year ended March 31, 2024
(millions of dollars, unless otherwise indicated)
| Actual results | Change with | Actual results | Change with | ||||||||||||||||||
| Budget | as at | 2023-2024 | as at | 2022-2023 | |||||||||||||||||
| 2023-2024 | March 31, 2024 | budget | March 31, 2023 | actual results | |||||||||||||||||
| M$ | % | M$ | % | ||||||||||||||||||
| Sales | 23 505 | 23 306 | (199 | ) | (0.8 | ) | 22 909 | 397 | 1.7 | ||||||||||||
| Fuel | 2 081 | 2 157 | 76 | 3.7 | 2 157 | 0 | 0.0 | ||||||||||||||
| Tobacco | 982 | 912 | (70 | ) | (7.1 | ) | 817 | 95 | 11.6 | ||||||||||||
| Alcoholic beverages | 635 | 618 | (17 | ) | (2.7 | ) | 635 | (17 | ) | (2.7 | ) | ||||||||||
| Other | 87 | 90 | 3 | 3.4 | 79 | 11 | 13.9 | ||||||||||||||
| TOTAL | 27 290 | 27 083 | (207 | ) | (0.8 | ) | 26 597 | 486 | 1.8 | ||||||||||||
The 2023-2024 forecast of $27 290 million reflected notably a growth in household consumption1 compared with the previous year, growth supported among other things by a robust labour market, wage increases, and the support measures announced by different levels of government to help households face inflation. What is more, anticipated consumption tax revenues lagged, especially because of the anticipated downturn in investments in residential construction, stemming from the impact on household budgets of higher interest payments and the increased cost of living.
As at March 31, 2024, revenue from consumption taxes, mainly the Québec sales tax, is slightly below forecasts, with a downward variation of 0.8% due, in particular, to greater-than-anticipated downturn in investments in residential construction.
Compared with actual results as at March 31, 2023, revenue from consumption taxes is up 1.8%. This change is mainly attributable to a 4.7% increase in household consumption in 2023, sustained by population growth, accumulated household savings, the reduction in personal income tax, and wage and salary gains. Higher revenues are partially offset by the mitigating effect of higher interest rates and inflation on household consumption and the slowdown in investments in residential construction, which fell by 14.8% during the same period. Moreover, the increase in the specific tax on tobacco products, came into force in February 2023, is the main factor that explains the $95-million increase in this source of revenue.
______________________________________
1 Household consumption excluding food expenditures and shelter.
2. Variance analysis (cont'd)
2.1. Own-source revenue (cont'd)
Duties, permits and royalties
Fiscal year ended March 31, 2024
(millions of dollars, unless otherwise indicated)
| Actual results | Change with | Actual results | Change with | ||||||||||||||||||
| Budget | as at | 2023-2024 | as at | 2022-2023 | |||||||||||||||||
| 2023-2024 | March 31, 2024 | budget | March 31, 2023 | actual results | |||||||||||||||||
| M$ | % | M$ | % | ||||||||||||||||||
| Motor vehicles | 1 626 | 1 744 | 118 | 7.3 | 1 616 | 128 | 7.9 | ||||||||||||||
| Natural resources | 1 821 | 1 594 | (227 | ) | (12.5 | ) | 2 006 | (412 | ) | (20.5 | ) | ||||||||||
| Greenhouse gas emissions | 1 353 | 1 549 | 196 | 14.5 | 1 267 | 282 | 22.3 | ||||||||||||||
| Other | 939 | 1 001 | 62 | 6.6 | 895 | 106 | 11.8 | ||||||||||||||
| TOTAL | 5 739 | 5 888 | 149 | 2.6 | 5 784 | 104 | 1.8 | ||||||||||||||
The 2023-2024 forecast of $5 739 million, which was comparable to actual results as at March 31, 2023, included a drop in government natural resource royalties, more specifically mining royalties, because of the anticipated downturn in metal prices. On the other hand, revenues from greenhouse gas (GHG) emission rights auction sales were expected to increase. Lastly, the revenue forecast for duties, permits and royalties also considered the impact of capping at 3% the indexation of government user fees.
As at March 31, 2024, revenues from duties, permits and royalties totalling $5 888 million were 2.6% higher than forecast in the budget and 1.8% higher than real results for 2022-2023. The different sources of revenue nonetheless experienced variations that were offset, with the most significant ones pertaining to natural-resource-related revenues and GHG emissions.
Natural resources
Such revenues were $227 million lower than forecast and $412 million below the previous year's figure. The reduction in mining royalties explains the downward variations. Indeed, lower market prices for metals and the significant increase in production costs that certain corporations demanded in the wake of investments depressed mining profits subject to such royalties. The downturn in natural-resource-related revenues is also attributable to reduced revenues from timber sales, due in particular to lower prices for finished products. This decline exceeded the forecast for 2023-2024.
GHG emissions
These revenues exceed the forecast by $196 million and revenues in the preceding year by $282 million. The upturn in relation to the forecast stems mainly from higher-than-anticipated growth in the average price of the units sold. Despite the lower volume of GHG emission rights auction sales compared with 2022-2023, the revenues increased because of higher average prices for the units sold.
2. Variance analysis (cont'd)
2.1. Own-source revenue (cont'd)
Miscellaneous revenue
Fiscal year ended March 31, 2024
(millions of dollars, unless otherwise indicated)
| Actual results | Change with | Actual results | Change with | ||||||||||||||||||
| Budget | as at | 2023-2024 | as at | 2022-2023 | |||||||||||||||||
| 2023-2024 | March 31, 2024 | budget | March 31, 2023 | actual results | |||||||||||||||||
| M$ | % | M$ | % | ||||||||||||||||||
| Miscellaneous revenue | 12 707 | 13 505 | 798 | 6.3 | 11 984 | 1 521 | 12.7 | ||||||||||||||
The 2023-2024 forecast of $12 707 million reflected a generalized growth in the various revenues generated by the different organizations that make up the government, particularly revenues of the health and social services, education and higher education networks. Among other things, the forecast took into account an increase in revenues from tuition fees, linked to an expected growth in the higher education clientele, bearing in mind the impact of capping at 3% the indexation of government user fees.
Actual miscellaneous revenue as at March 31, 2024 of $13 505 million exceeds the forecast by 6.3%. This variation is due in particular to higher-than-forecast growth in interest income on tax receivables administered by the Agence du revenu du Québec, growth explained in part by the rise in interest rates. This variation also stems from a higher-than-anticipated increase in the goodwill of bodies in the health and social services, education, and higher education networks attributable, by way of an example, to a stronger-than-anticipated post-pandemic recovery.
Compared to the previous fiscal year's actual results, revenue growth can be broken down as follows (millions of dollars):
| Actual results | Actual results | |||||||||||
| as at | as at | |||||||||||
| March 31, 2024 | March 31, 2023 | Variance | ||||||||||
| M$ | % | |||||||||||
| Sales of goods and services | 6 354 | 6 242 | 112 | 1.8 | ||||||||
| Health and social services network user contributions | 1 667 | 1 513 | 154 | 10.2 | ||||||||
| Income on accounts receivable and loans | 1 784 | 1 052 | 732 | 69.6 | ||||||||
| Income on investments | 829 | 525 | 304 | 57.9 | ||||||||
| Fines, forfeitures and recoveries | 1 232 | 1 228 | 4 | 0.3 | ||||||||
| Third-party donations | 1 004 | 904 | 100 | 11.1 | ||||||||
| Tuition fees | 543 | 451 | 92 | 20.4 | ||||||||
| Transfers from entities other than the federal government | 92 | 69 | 23 | 33.3 | ||||||||
| TOTAL | 13 505 | 11 984 | 1 521 | 12.7 | ||||||||
2. Variance analysis (cont'd)
2.1. Own-source revenue (cont'd)
Miscellaneous revenue (cont'd)
The overall growth of $1 521 million is mainly the result of the increase relating to health and social services network user contributions, income on accounts receivable and loans as well as income on investments.
Health and social services network user contributions
The $154-million increase is due to the increase in revenues from health and social services institutions, attributable among other things to growth in contributions from non-resident users, and to higher revenues from users of adult residential care in rehabilitation centres and residential and long-term care centres.
Income on accounts receivable and loans
The $732-million increase is mainly due to higher interest income on tax claims administered by the Agence du revenu du Québec, notably due to higher interest rates on accounts receivable.
Income on investments
The $304-million increase is mainly attributable to more significant realized gains in 2023-2024 than in 2022-2023, in particular because of favourable equity market performance.
2. Variance analysis (cont'd)
2.1. Own-source revenue (cont'd)
Revenue from government enterprises
Fiscal year ended March 31, 2024
(millions of dollars, unless otherwise indicated)
| Actual results | Change with | Actual results | Change with | ||||||||||||||||||
| Budget | as at | 2023-2024 | as at | 2022-2023 | |||||||||||||||||
| 2023-2024 | March 31, 2024 | budget | March 31, 2023 | actual results | |||||||||||||||||
| M$ | % | M$ | % | ||||||||||||||||||
| Hydro-Québec | 3 525 | 2 027 | (1 498 | ) | (42.5 | ) | 3 665 | (1 638 | ) | (44.7 | ) | ||||||||||
| Société des alcools du Québec | 1 459 | 1 428 | (31 | ) | (2.1 | ) | 1 427 | 1 | 0.1 | ||||||||||||
| Loto-Québec | 1 498 | 1 508 | 10 | 0.7 | 1 597 | (89 | ) | (5.6 | ) | ||||||||||||
| Investissement Québec | 216 | 121 | (95 | ) | (44.0 | ) | (226 | ) | 347 | 153.5 | |||||||||||
| Other | 109 | 157 | 48 | 44.0 | 157 | ― | ― | ||||||||||||||
| TOTAL | 6 807 | 5 241 | (1 566 | ) | (23.0 | ) | 6 620 | (1 379 | ) | (20.8 | ) | ||||||||||
The 2023-2024 forecast of $6 807 million reflected a return to normalcy in the anticipated results of Investissement Québec, which fell significantly because of the volatility of rates on the financial markets and the uncertain economic outlook in 2022-2023. The forecasts also reflected a downturn in Hydro-Québec's expected results, stemming from the anticipated reduction in the value of its electricity exports.
Hydro-Québec
The net value of Hydro-Québec's electricity exports fell more markedly than forecast in 2023-2024. This situation is due to the low runoff in the regions where the main basins are located stemming from scarce snow cover at the end of the winter of 2022-2023, lower-than-normal flood waters, and modest summer and fall precipitation in northern Québec. This context led to reduced electricity surpluses for sale in 2023-2024, which explains the 42.5% variation in relation to Budget 2023-2024 and the 44.7% decrease in relation to real results for 2022-2023. Additionally, the government corporation's higher operating expenses exacerbated the reduction in relation to 2022-2023 mainly as a result of more extensive maintenance work aimed at enhancing the quality and reliability of the service.
Investissement Québec
Revenues from Investissement Québec were 44.0% lower than forecast, and 153.5% higher than actual results as at March 31, 2023. The return to normalcy of the expected results did not fully materialize because of financial market volatility and the global context of economic uncertainty. The increase in relation to 2022-2023 is attributable to the unfavourable yields sustained in 2022-2023 in the investments of the venture capital and investment fund portfolio because of the downward spiral of financial markets.
2. Variance analysis (cont'd)
2.2. Federal government transfers
Federal government transfers
Fiscal year ended March 31, 2024
(millions of dollars, unless otherwise indicated)
| Actual results | Change with | Actual results | Change with | ||||||||||||||||||
| Budget | as at | 2023-2024 | as at | 2022-2023 | |||||||||||||||||
| 2023-2024 | March 31, 2024 | budget | March 31, 2023 | actual results | |||||||||||||||||
| M$ | % | M$ | % | ||||||||||||||||||
| Equalization | 14 037 | 14 037 | ― | ― | 13 666 | 371 | 2.7 | ||||||||||||||
| Health transfers | 8 660 | 8 714 | 54 | 0.6 | 7 082 | 1 632 | 23.0 | ||||||||||||||
| Transfers for post-secondary education and other social programs | 1 366 | 1 451 | 85 | 6.2 | 1 294 | 157 | 12.1 | ||||||||||||||
| Other programs | 5 679 | 6 674 | 995 | 17.5 | 6 695 | (21 | ) | (0.3 | ) | ||||||||||||
| TOTAL | 29 742 | 30 876 | 1 134 | 3.8 | 28 737 | 2 139 | 7.4 | ||||||||||||||
The 2023-2024 forecast of $29 742 million mainly considered an increase in equalization and the Canada Health Transfer (CHT) due to anticipated growth in Canada's nominal GDP. The forecast also included a one-off increase in the CHT, of which Québec's share was estimated at $447 million.
As at March 31, 2024, federal government transfers of $30 876 million exceed forecast by $1 134 million, or 3.8%
This variation is notably attributable to:
a reduction in the value of the Québec special abatement,1 which has led to a greater-than-forecast increase of $168 million in transfers for health and of $103 million in transfers for post-secondary education and other social programs;
higher-than-forecast revenues of $995 million from the "Other programs" category, due in particular to:
- $225 million in unplanned revenues related to the conclusion in November 2023 of the agreement concerning the Housing Accelerator Fund, for a total of $900 million over four years,
- higher-than-anticipated federal government transfer revenues of $194 million for for personal protective equipment (PPE) and other supplies received and used by March 31, 2024,
______________________________________
1 The Québec special abatement (16.5% of federal personal income tax collected in Québec) is subtracted from federal government transfer revenues.
2. Variance analysis (cont'd)
2.2. Federal government transfers (cont'd)
- the completion at a higher-than-anticipated pace of infrastructure projects subject to federal financing, including those financed by the Société de financement des infrastructures locales, in respect of which $290 million more in revenues than anticipated were recorded.
Compared with actual results for 2022-2023, those for 2023-2024 show an increase of $2 139 million, due to the net impact of the following items:
Equalization
The growth of $371 million, or 2.7%, in equalization revenues is explained by the increase in the equalization envelope across Canada, whose growth is linked to that of Canada's nominal GDP.
Health transfers
The $1 632-million increase in health transfers is due in particular to:
$833 million due to the growth of the Canada Health Transfer related to the variation in Canada's nominal GDP;
$124 million in the wake of the reduction in the value of the Québec special abatement, a portion of which is subtracted from the Canada Health Transfer;
$627 million following the conclusion of two new agreements that call for additional funding to support Québec's priorities in the realm of health and long-term care.
Transfers for post-secondary education and other social programs
The $157-million increase is attributable to increases of:
$71 million resulting from the indexation of the Canada Social Transfer;
$86 million following the reduction in the value of the Québec special abatement, a portion of which is deducted from the Canada Social Transfer.
Other programs
The $21-million decrease in transfer revenues for other programs is explained by various changes:
a one-off federal transfer of of $197 million in 2022-2023 to help support public transit authorities in the wake of the pandemic;
a $444-million decrease in federal government transfer revenues related to pandemic-related PPE and other supplies received and used by March 31, 2024.
The decrease is partly offset by:
a $250-million increase in revenues from the asymmetrical childcare agreement signed in 2021-2022 for a period of 5 years;
a $225-million grant stemming from the new agreement pertaining to the Housing Accelerator Fund.
2. Variance analysis (cont'd)
2.3. Comparison of actual and anticipated expenditures
Consolidated expenditure
Fiscal year ended March 31, 2024
(millions of dollars, unless otherwise indicated)
| Expenditure | ||||||||||||
| Budget | as at | |||||||||||
| 2023-2024 | March 31, 2024 | Variation | ||||||||||
| M$ | % | |||||||||||
| Portfolios expenditure | 138 392 | 141 553 | 3 161 | 2.3 | ||||||||
| Debt services | 9 464 | 9 982 | 518 | 5.5 | ||||||||
| Consolidated expenditure | 147 856 | 151 535 | 3 679 | 2.5 | ||||||||
Portfolio expenditures
Expenditure estimates are established for each portfolio when the budget is prepared. Such estimates, funds are stipulated in the Contingency Fund of the Conseil du trésor et Administration gouvernementale portfolio to notably cover1 unforeseen expenditures under government programs. Accordingly, portfolio expenditures are managed in a comprehensive manner, notably to ensure enhanced budget agility and the sound, efficient management of public funds.
The actual expenditures that the Contingency Fund covers are recorded in the portfolios that benefited from them. This situation can engender variations in relation to the initial budget allocated to certain portfolios when they are absorbed by the amounts budgeted in the Contingency Fund.
Moreover, during the economic and financial update, the spending forecasts for the portfolios may be subject to a revision, as they could also be when the subsequent budget is tabled.
Overall, 2023-2024 portfolio expenditures stand at $141 553 million, i.e., a $3 161 million or 2.3% surplus in relation to the $138 392 million forecast. This discrepancy is due notably to:
higher-than-anticipated expenditures of $610 million in the Santé et Services sociaux portfolio concerning PPE and other supplies;
$1 247 million in higher-than-anticipated compensation expenses related to independent labour in health and social services institutions;
______________________________________
1 The Contingency Fund is also intended to cover expenditures on subsidized infrastructure as well as certain measures announced in the Budget. In the 2023-2024 budget plan, forecasts for these expenditures are included in the portfolios that plan to carry them out.
2. Variance analysis (cont'd)
2.3. Comparison of actual and anticipated expenditures (cont'd)
Portfolio expenditures (cont'd)
- the additional expenditures announced in Update on Québec's Economic and Financial Situation - Fall 2023:
- $265 million in additional emergency assistance granted by the Transports et Mobilité durable portfolio to cover the anticipated deficit of public transit companies,
- $184 million in additional subsidies paid by the Affaires municipales et Habitation portfolio to build 7 500 affordable new public housing units under the Québec Affordable Housing Program and the partnership with the tax-advantaged funds,
- $128 million in higher-than-anticipated financial assistance payments by the Environnement, Lutte contre les changements climatiques, Faune et Parcs portfolio to support climate change adaptation measures;
$285 million in advance payments, announced in the 2024-2025 Budget Plan, made by the Famille portfolio concerning subsidies to the operation of educational childcare services for 2024-2025;
the unforeseen expenditures of $144 million plus interest of the Transports et Mobilité durable portfolio to compensate the owners of taxi permits following a judgment handed down by the court concerning the class action lawsuit launched against the government;
the higher-than-anticipated last-resort financial assistance of $323 million granted by the Emploi et Solidarité sociale portfolio notably caused by a higher-than-anticipated number of beneficiaries and a revision of the indexation of benefits during the year;
higher-than-anticipated subsidies of $308 million by the Affaires municipales et Habitation portfolio granted for municipal infrastructure projects, engendered, in particular, by more extensive-than-anticipated work;
- a higher-than-anticipated increase in the number of applications and the average amount granted for the following tax credits of the Économie, Innovation et Énergie portfolio:
– the investment tax credit, in the higher-than-anticipated amount of $192 million,
– the tax credits for scientific research and experimental development, in the higher-than-anticipated amount of $110 million;
- higher-than-anticipated subsidies of $273 million by the Finances portfolio attributable to the extension of the gasoline tax program and Québec's contribution, the extension which was not known when the budget was prepared.
2. Variance analysis (cont'd)
2.3. Comparison of actual and anticipated expenditures (cont'd)
Portfolio expenditures (cont'd)
Moreover, wage provisions stemming from the government offers submitted and the agreements concluded in the context of the renewal of the collective agreements, more specifically in the Santé et Services sociaux and Éducation portfolios, contributed to the surplus in relation to the forecasts. However, this surplus was offset by the non-realization of expenditures on the order of $651 million in the Éducation portfolio stemming from the strike by school staff in the fall of 2023.
Lastly, the subsidies granted for municipal and collective transportation infrastructure projects were $575 million lower than anticipated for the Transports et Mobilité durable portfolio, mainly because the work completed was less extensive than anticipated.
Debt service
The $518-million surplus in debt service expenditures in relation to the forecast is mainly explained by a higher-than-anticipated increase in interest rates.
Compliance with legislative authorizations
A surplus of consolidated expenditures in relation to those stipulated in the portfolios does not automatically require the approval of appropriations or the issuance by Parliament of additional expenditure authorizations. Indeed, the consolidated expenditures include those of government departments, budgetary organizations, special funds, non-budget-funded bodies and bodies in the health and social services, education and higher education networks. Only the expenditures of government departments, budgetary organizations, and special funds are subject to an annual parliamentary vote. Furthermore, certain expenditures are covered by permanent appropriations granted pursuant to specific statutes or by the appropriations provided in the Contingency Fund.
In 2023-2024, no excess expenditure and other costs were observed in the annual appropriations of the government departments while surpluses of $1 190 million and $652 million, respectively, on the amounts approved were observed in the expenditures and investments of the special funds.
2. Variance analysis (cont'd)
2.4. Comparison of expenditures with those of the preceding year
Santé et services sociaux
Fiscal year ended March 31, 2024
(millions of dollars, unless otherwise indicated)
| Expenditure | Expenditure | |||||||||||
| as at | as at | |||||||||||
| March 31, 2024 | March 31, 2023 | Variance | ||||||||||
| (restated) | M$ | % | ||||||||||
| Transfers | 8 524 | 8 168 | 356 | 4.4 | ||||||||
| Remuneration | 37 626 | 36 490 | 1 136 | 3.1 | ||||||||
| Operating | 14 713 | 14 562 | 151 | 1.0 | ||||||||
| Doubtful accounts and other allowances | 137 | 121 | 16 | 13.2 | ||||||||
| TOTAL | 61 000 | 59 341 | 1 659 | 2.8 | ||||||||
This portfolio includes mainly the activities of the health and social services network institutions and the programs administered by the Régie de l'assurance maladie du Québec. It also includes the expenditures of other health-related government agencies such as Héma-Québec.
The increase of $1 659 million compared with expenditures in 2022-2023 stems essentially from the increase in transfer expenditures, remuneration, and operations.
Transfers
The $356-million increase in transfer expenditures is attributable in particular to:
a $130-million increase attributable to spending growth related to the tax credit for senior assistance and the tax credit for home-support services for seniors;
a $92-million increase in the expenditures of health and social services institutions to support community-based organizations.
Remuneration
The $1 136 million increase in compensation expenses is mainly explained by:
a $549-million increase in expenditures related to wage provisions of health and social services institutions stemming from the government offers submitted and the agreements concluded in the context of the renewal of the collective agreements;
a $643-million increase in costs related to reliance on independent labour in health and social services institutions because of the labour shortage and the increase in the average hourly rate during the fiscal year;
2. Variance analysis (cont'd)
2.4. Comparison of expenditures with those of the preceding year (cont'd)
Santé et services sociaux (cont'd)
- a $450-million increase in the remuneration of general practitioners and specialists because of the increase in the number of medical services rendered and their costs.
These increases are partially offset by a $760-million reduction in expenditures attributable to the incentive pay granted in 2022-2023 in the health and social services institutions.
Operating
The $151-million increase in operating expenditures is attributable to several variations, including:
a $224-million increase in the cost of medicines, mainly those used for cancer treatments;
a $151-million increase in remuneration paid to non-institutional staff, mainly because of higher costs and the purchase of new spaces;
a $56-million increase in maintenance and repair expenditures, a $50-million increase in food costs, and a $100-million increase in medical and surgical supplies, due in particular to inflation;
a $779-million decrease in the consumption of PPE and other supplies.
2. Variance analysis (cont'd)
2.4. Comparison of expenditures with those of the preceding year (cont'd)
Éducation
Fiscal year ended March 31, 2024
(millions of dollars, unless otherwise indicated)
| Expenditure | Expenditure | |||||||||||
| as at | as at | |||||||||||
| March 31, 2024 | March 31, 2023 | Variance | ||||||||||
| (restated) | M$ | % | ||||||||||
| Transfers | 1 362 | 1 095 | 267 | 24.4 | ||||||||
| Remuneration | 14 236 | 14 194 | 42 | 0.3 | ||||||||
| Operating | 4 449 | 4 212 | 237 | 5.6 | ||||||||
| Doubtful accounts and other allowances | 11 | 10 | 1 | 10.0 | ||||||||
| TOTAL | 20 058 | 19 511 | 547 | 2.8 | ||||||||
This portfolio mainly covers the activities of preschool, primary and secondary education institutions. It also includes programs to promote leisure and sports activities, and to manage national parks.
The $547-million increase in expenditures in relation to 2022-2023 stems by and large from the increase in transfer and operating expenditures. While overall compensation expenses did not increase substantially, they nonetheless experienced various fluctuations that were compensated.
Transfers
The $267-million increase in transfer expenditures stems principally from growth in subsidies granted to private educational institutions, especially to consider the indexation of staff wages and to support their infrastructure projects.
Remuneration
The $42-million increase in compensation expenses is mainly due to:
a $341-million increase in expenditures related to wage provisions stemming from the government offers submitted and the agreements concluded to renew the collective agreements;
a $376-million increase in expenditures pertaining to wage progression and the increase in teaching staff in response to rising student numbers.
Both increases are largely offset by the non-realization of $651 million in remuneration expenditures due to the strike by school staff in the fall of 2023.
Operating
The $237-million increase in operating expenditures is attributable, in particular, to the increase in the cost of school transportation, higher expenditures related to building maintenance and sports, cultural, and extracurricular activities, and the leasing of additional space to accommodate higher school enrolments.
2. Variance analysis (cont'd)
2.4. Comparison of expenditures with those of the preceding year (cont'd)
Enseignement supérieur
Fiscal year ended March 31, 2024
(millions of dollars, unless otherwise indicated)
| Expenditure | Expenditure | |||||||||||
| as at | as at | |||||||||||
| March 31, 2024 | March 31, 2023 | Variance | ||||||||||
| (restated) | M$ | % | ||||||||||
| Transfers | 4 903 | 4 597 | 306 | 6.7 | ||||||||
| Remuneration | 4 209 | 3 958 | 251 | 6.3 | ||||||||
| Operating | 1 324 | 1 119 | 205 | 18.3 | ||||||||
| Doubtful accounts and other allowances | 40 | (19 | ) | 59 | (310.5 | ) | ||||||
| TOTAL | 10 476 | 9 655 | 821 | 8.5 | ||||||||
This portfolio mainly comprises expenditures on college and university educational institutions. It also includes student financial assistance.
The $821-million increase in expenditures in relation to 2022-2023 stems by and large from the increase in transfer, remuneration, and operating expenditures.
Transfers
The $306-million increase in transfer expenditures is mainly explained by:
a $195-million increase related to the increase in subsidies for private universities, in particular to consider wage indexation in 2023-2024;
a $143-million increase attributable to the impact of a full year of the Québec Perspective Scholarship program introduced in September 2022.
Remuneration
The $251-million increase in compensation expenses is mainly due to the wage provisions stemming from the government's offers submitted and the agreements concluded in the context of the renewal of the collective agreements and wage progression.
Operating
The $205-million increase in operating expenditures in 2023-2024 stems from insignificant variations.
2. Variance analysis (cont'd)
2.4. Comparison of expenditures with those of the preceding year (cont'd)
Famille
Fiscal year ended March 31, 2024
(millions of dollars, unless otherwise indicated)
| Expenditure | Expenditure | |||||||||||
| as at | as at | |||||||||||
| March 31, 2024 | March 31, 2023 | Variance | ||||||||||
| M$ | % | |||||||||||
| Transfers | 8 680 | 7 627 | 1 053 | 13.8 | ||||||||
| Remuneration | 134 | 117 | 17 | 14.5 | ||||||||
| Operating | 103 | 91 | 12 | 13.2 | ||||||||
| Doubtful accounts and other allowances | ― | ― | ― | ― | ||||||||
| TOTAL | 8 917 | 7 835 | 1 082 | 13.8 | ||||||||
This portfolio mainly includes expenses dedicated to the financing of educational childcare services and financial assistance for families.
Expenditures increased by $1 082 million in relation to 2022-2023, which is essentially attributable to higher transfer expenditures.
Transfers
The $1 053 million increase in transfer expenditures stems chiefly from:
a $566-million increase in the subsidies granted to childcare centres and daycare centres, mainly because of the creation of new spaces in the network and the allocation to the managers of home childcare services of new subsidized spaces;
a $229-million increase in expenditures related to the Family Allowance tax credit resulting from the 6.44% indexation of the credit on January 1, 2023, and 5.08% on January 1, 2024.
2. Variance analysis (cont'd)
2.4. Comparison of expenditures with those of the preceding year (cont'd)
Transport et Mobilité durable
Fiscal year ended March 31, 2024
(millions of dollars, unless otherwise indicated)
| Expenditure | Expenditure | |||||||||||
| as at | as at | |||||||||||
| March 31, 2024 | March 31, 2023 | Variance | ||||||||||
| (restated) | M$ | % | ||||||||||
| Transfers | 2 565 | 2 699 | (134 | ) | (5.0 | ) | ||||||
| Remuneration | 827 | 708 | 119 | 16.8 | ||||||||
| Operating | 3 299 | 2 984 | 315 | 10.6 | ||||||||
| Doubtful accounts and other allowances | 9 | 9 | ― | ― | ||||||||
| TOTAL | 6 700 | 6 400 | 300 | 4.7 | ||||||||
This portfolio mainly includes expenditures for the construction, maintenance and operation of road infrastructure, as well as the financing of public transit services. This portfolio also includes expenditures related to the management of the government's fleet of rolling stock, aircrafts and ferry services.
The $300-million increase in expenditures in relation to 2022-2023 is mainly attributable to higher operating expenditures, partially offset by a reduction in transfer expenditures.
Transfers
The $134-million decrease in transfer expenditures is primarily due to the non-recurrence of one-off initiatives in 2022-2023 to support collective transportation and the road network, including:
advance payments of subsidies for collective transportation totalling $500 million in 2022-2023, i.e., $237 million paid to the Réseau de transport de la Capitale, $146 million to the Autorité régionale de transport métropolitain (ARTM), and $117 million to the Société de transport de Laval;
$200 million in selective assistance attributed to the ARTM in 2022-2023 to support the revival of collective transportation;
$197 million in subsidies to support transit companies faced with the repercussions of the COVID-19 pandemic, granted through the Programme d'aide d'urgence au transport collectif des personnes (PAUTCP) pursuant to the Accord sur la relance sécuritaire.
2. Variance analysis (cont'd)
2.4. Comparison of expenditures with those of the preceding year (cont'd)
Transport et Mobilité durable (cont'd)
This decrease is partially offset by:
a $329-million increase in the subsidies granted for municipal infrastructure and collective transportation projects, mainly because of more extensive work carried out than in 2022-2023;
$265 million in additional emergency assistance to offset part of the anticipated deficit in 2024 of transit companies;
$200 million in additional assistance to support the revival of collective transportation.
Operating
The $315-million increase in operating expenditures is mainly due to the recognition of expenditures, i.e., $144 million plus interest, to compensate the owners of taxi permits in the wake of a judgment handed down by the court concerning a class action lawsuit launched against the government.
2. Variance analysis (cont'd)
2.4. Comparison of expenditures with those of the preceding year (cont'd)
Emploi et Solidarité sociale
Fiscal year ended March 31, 2024
(millions of dollars, unless otherwise indicated)
| Expenditure | Expenditure | |||||||||||
| as at | as at | |||||||||||
| March 31, 2024 | March 31, 2023 | Variance | ||||||||||
| M$ | % | |||||||||||
| Transfers | 5 018 | 8 372 | (3 354 | ) | (40.1 | ) | ||||||
| Remuneration | 503 | 442 | 61 | 13.8 | ||||||||
| Operating | 163 | 145 | 18 | 12.4 | ||||||||
| Doubtful accounts and other allowances | 44 | 24 | 20 | 83.3 | ||||||||
| TOTAL | 5 728 | 8 983 | (3 255 | ) | (36.2 | ) | ||||||
This portfolio mainly includes expenditures on financial assistance programs for individuals, including last-resort financial assistance and employment assistance programs. Expenditures related to the activities of Services Québec, the Directeur de l'état civil and the Registraire des entreprises, as well as to the administration of the Québec Parental Insurance Plan, are also included in this portfolio.
The $3 255-million decrease in expenditures in relation to 2022-2023 is mainly attributable to a reduction in transfer expenditures.
Transfers
The $3 354 million decrease in transfers is attributable mainly to:
the $3 371 million decrease stemming from the non-recurrence of the one-time amounts granted in 2022-2023 to contend with the rising cost of living;
the $184-million decrease in expenditures pertaining to the allowances granted to individuals participating in labour force training, especially caused by the conclusion of activities related to the Programme pour la requalification et l'accompagnement en technologies de l'information et des communications (PRATIC);
the payment of a one-off envelope of $100 million in 2022-2023 to the Programme de formations de courte durée (COUD) to support businesses encountering recruiting problems.
This reduction is partially offset by a $321-million increase in the costs associated with last-resort financial assistance, attributable to the increase in the clientele stemming, in particular, from an increase in the number of asylum seekers and the annual indexation of benefits. This $321-million increase is also attributable to the impact of a full year of the new Basic Income Program intended for individuals with a persistent severely limited capacity for employment, which stems from the Government Action Plan to Foster Economic Inclusion and Social Participation, which seeks to lift 100 000 individuals out of poverty and increase the income of the poor.
2. Variance analysis (cont'd)
2.4. Comparison of expenditures with those of the preceding year (cont'd)
Affaires municipales et Habitation
Fiscal year ended March 31, 2024
(millions of dollars, unless otherwise indicated)
| Expenditure | Expenditure | |||||||||||
| as at | as at | |||||||||||
| March 31, 2024 | March 31, 2023 | Variance | ||||||||||
| (restated) | M$ | % | ||||||||||
| Transfers | 4 547 | 4 624 | (77 | ) | (1.7 | ) | ||||||
| Remuneration | 132 | 117 | 15 | 12.8 | ||||||||
| Operating | 157 | 183 | (26 | ) | (14.2 | ) | ||||||
| Doubtful accounts and other allowances | 78 | 12 | 66 | 550.0 | ||||||||
| TOTAL | 4 914 | 4 936 | (22 | ) | (0.4 | ) | ||||||
This portfolio mainly includes expenditures on financial support for municipalities, notably for infrastructure, social housing and compensation in lieu of taxes, as well as regional and metropolitan development measures.
The $22-million decrease in expenditures in relation to 2022-2023 is attributable to variations, including a reduction in transfer expenditures.
Transfers
The $77-million decrease in the transfer expenditure in relation to the results of the preceding year is mainly due to:
- a $694-million reduction in the subsidies granted to municipal infrastructure projects, stemming, in particular, from:
– write-downs of $421 million made in 2022-2023 for municipal infrastructure projects in respect of which the work was carried out in previous years,
– $251 million in non-recurrent subsidies granted in 2022-2023 to accelerate the completion and support the purchase and construction of affordable social housing units.
2. Variance analysis (cont'd)
2.4. Comparison of expenditures with those of the preceding year (cont'd)
Affaires municipales et Habitation (cont'd)
This decrease is partially offset by:
$310 million of additional expenditures attributable to the program to share with the municipalities the growth in revenues of 1 point of Québec sales tax;
a $124-million increase due to the AccèsLogis Québec program and the new Québec affordable housing program;
a $92-million increase attributable to the Shelter Allowance Program because of the increase in the number of beneficiary households following the simplification of the financial assistance application process;
$109 million in additional subsidies granted to build affordable social housing units under the partnership with the tax-advantaged funds.
2. Variance analysis (cont'd)
2.4. Comparison of expenditures with those of the preceding year (cont'd)
Économie, Innovation et Énergie
Fiscal year ended March 31, 2024
(millions of dollars, unless otherwise indicated)
| Expenditure | Expenditure | |||||||||||
| as at | as at | |||||||||||
| March 31, 2024 | March 31, 2023 | Variance | ||||||||||
| M$ | % | |||||||||||
| Transfers | 3 238 | 2 819 | 419 | 14.9 | ||||||||
| Remuneration | 93 | 83 | 10 | 12.0 | ||||||||
| Operating | 217 | 179 | 38 | 21.2 | ||||||||
| Doubtful accounts and other allowances | 282 | 199 | 83 | 41.7 | ||||||||
| TOTAL | 3 830 | 3 280 | 550 | 16.8 | ||||||||
This portfolio mainly includes expenditures dedicated to financing economic development projects, as well as supporting research, innovation and the development of energy resources.
The $550-million increase in expenditures in relation to 2022-2023 stems by and large from the increase in transfer expenditures.
Transfers
The $419-million increase is mainly attributable to an increase in the number of applications and the average amount granted for the following tax credits:
the investment tax credit, in respect of which expenditures rose by $251 million;
the tax credits for scientific research and experimental development, in respect of which expenditures increased by $177 million.
2. Variance analysis (cont'd)
2.4. Comparison of expenditures with those of the preceding year (cont'd)
Environnement, Lutte contre les changements climatiques, Faune et Parcs
Fiscal year ended March 31, 2024
(millions of dollars, unless otherwise indicated)
| Expenditure | Expenditure | |||||||||||
| as at | as at | |||||||||||
| March 31, 2024 | March 31, 2023 | Variance | ||||||||||
| M$ | % | |||||||||||
| Transfers | 1 726 | 1 083 | 643 | 59.4 | ||||||||
| Remuneration | 337 | 293 | 44 | 15.0 | ||||||||
| Operating | 364 | 293 | 71 | 24.2 | ||||||||
| Doubtful accounts and other allowances | 4 | 4 | ― | ― | ||||||||
| TOTAL | 2 431 | 1 673 | 758 | 45.3 | ||||||||
This portfolio mainly includes expenditures on measures to fight climate change, protect the environment and conserve biodiversity. These expenditures also include the operation of public dams, land management of the State's water domain, and the conservation of wildlife resources and their habitats.
Expenditures in 2023-2024 increased by $758 million in relation to those in the preceding year. This variation is mainly attributable mainly to an increase in transfer expenditures.
Transfers
The $643-million change in transfer expenditures in relation to the results of the preceding year is chiefly attributable to the impacts of the enhancement of the 2030 Plan for a Green Economy announced in Budget 2023-2024, including:
the $278-million increase in subsidies granted under the Drive Electric program because of a significant increase in electric vehicle sales;
the $143-million increase in subsidies granted to Hydro-Québec in particular to carry out five conversion projects on off-grid electricity distribution systems. The subsidies are intended to support the industry in the attainment of carbon neutrality without increasing demand on Hydro-Québec's central system;
the $97-million increase stemming, in particular, from subsidies related to programs that seek to reduce GHG emissions, i.e., ÉcoPerformance, Technoclimat, and Valorisation des rejets thermiques.
2. Variance analysis (cont'd)
2.4. Comparison of expenditures with those of the preceding year (cont'd)
Other portfolios
Fiscal year ended March 31, 2024
(millions of dollars, unless otherwise indicated)
| Expenditure | Expenditure | |||||||||||
| as at | as at | |||||||||||
| March 31, 2024 | March 31, 2023 | Variance | ||||||||||
| M$ | % | |||||||||||
| Transfers | 6 803 | 5 792 | 1 011 | 17.5 | ||||||||
| Remuneration | 6 409 | 5 994 | 415 | 6.9 | ||||||||
| Operating | 3 745 | 3 383 | 362 | 10.7 | ||||||||
| Doubtful accounts and other allowances | 542 | 364 | 178 | 48.9 | ||||||||
| TOTAL | 17 499 | 15 533 | 1 966 | 12.7 | ||||||||
This group includes the expenditures of 16 other portfolios encompassing programs in the culture, immigration, tourism, and natural resources sectors, and the activities of the judicial system, public security, international relations, legislative power, and central bodies.1
The $1 966-million increase in expenditures in relation to 2022-2023 stems from higher in expenditures in the four categories.
Transfers
The $1 011-million increase in transfers in 2023-2024 results from several variations within the group's portfolios, including:
a $371-million increase in expenditures associated with the tax credit for film production services resulting from a rising number of applications and an increase in the average amount requested. This credit, linked to the Culture et Communications portfolio, seeks to promote shooting in Québec of foreign film productions;
financial assistance totalling $100 million paid to telecommunications firms under the project administered by the Conseil exécutif portfolio to enhance regional cell phone coverage in Québec through the construction of cell phone sites in certain regions.
Remuneration
The $415-million increase in compensation expenditures is due, in particular, to the wage provisions stemming from the government's offers submitted and the agreements concluded in the context of the renewal of the collective agreements.
______________________________________
1 The Ministère des Finances, the Ministère du Conseil exécutif, and the Secrétariat du Conseil du trésor.
2. Variance analysis (cont'd)
2.4. Comparison of expenditures with those of the preceding year (cont'd)
Other portfolios (cont'd)
Operating
The $362-million increase in operating expenditures in 2023-2024 results from insignificant variations within the group's 16 portfolios.
Doubtful accounts and other allowances
The $178-million increase in doubtful account expenditures and other provisions is essentially due to the revision of the estimates of the doubtful account expenditure, attributable to the higher accounts receivable balance compared with 2022-2023.
2. Variance analysis (cont'd)
2.4. Comparison of expenditures with those of the preceding year (cont'd)
Debt service
Fiscal year ended March 31, 2024
(millions of dollars, unless otherwise indicated)
| Expenditure as at March 31, 2024 | Expenditure as at March 31, 2023 | Variance | ||||||||||
| M$ | % | |||||||||||
| Debt service | 9 982 | 10 222 | (240 | ) | (2.3 | ) | ||||||
Debt service mainly comprises interest on the debt and interest on retirement plans liability and other future benefits1 of public and parapublic sector employees. Note 5 in the consolidated financial statements breaks down the composition of debt service.
The $240-million decrease in debt service in relation to 2022-2023 is attributable to:
the $1 235-million increase in investment income of the sinking funds pertaining to borrowings.2 In 2023-2024, the funds recorded losses on the disposal of assets in the context of the management of investment activities below those observed in 2022-2023;
the $560-million increase attributable to the investment income of the funds linked to the pension plans and other employee future benefits. Such revenues reduce the expenditure.
These variations are partially offset by an increase totalling $1 555 million in the other elements comprising debt service, especially because of growth in the average volume of debts contracted on financial markets and higher interest rates.
______________________________________
1 This corresponds to the interest on obligations relating to retirement plans and other future benefits of public and parapublic sector employees, minus the investment income of the Retirement Plans Sinking Fund (RPSF) and the specific funds of the plans.
2 Revenues from the sinking funds pertaining to borrowings are deducted from debt service. They comprise interest generated on the investments and gains and losses on dispositions of assets.
▌ 3. Balanced Budget Act
Budget balance
The Balanced Budget Act (the Act) specifies the calculation of the budget balance and decrees the applicable rules when a budgetary deficit is anticipated or observed. The budget balance corresponds to the annual surplus (deficit) related to the activities from which are deducted the revenues allocated to the Generations Fund.
The Act stipulates that the government cannot provide for a budgetary deficit except under one of the following three specific circumstances:
a catastrophe that significantly affects revenues or expenditures;
a significant deterioration in economic conditions;
changes in the federal transfer programs to the provinces that would reduce the transfer payments paid to the government.
In December 2023, the Act was modernized to enhance its flexibility and simplicity while maintaining the constraint related to budget balance. From this modernization stem, in particular, the abolition of the stabilization reserve and the increase in the threshold of the budgetary deficit beyond which the submission by the government of a plan to restore fiscal balance is required. This threshold stood at $1 billion in the Act prior to its modernization. Henceforth, the government must submit a plan to restore balanced budget when it observes a budgetary deficit higher than the revenues recorded for a given year in the Generations Fund. The plan must be submitted not later than the time of the second Budget Speech given after the presentation of the Public Accounts.
Within the meaning of the modernized Act, the 2022-2023 Public Accounts, published in the fall of 2023, indicated a budgetary deficit of $6 084 million.1 Since this deficit exceeds the revenues allocated to the Generations Fund, which stood at $3 082 million, a plan to restore balanced budget must be presented with the 2025-2026 Budget Speech.
Fiscal year 2023-2024
The budgetary balance for the fiscal year ended March 31, 2024 is a deficit of $8 041 million after taking into account the allocation of $2 047 million to the Generations Fund.
______________________________________
1 The budget balance before use of the stabilization reserve.
3. Balanced Budget Act (cont'd)
Budget balance within the meaning of the Balanced Budget Act
Fiscal year ended March 31, 2024
(millions of dollars)
| Actual results | ||||||
| Budget | as at | |||||
| 2023-2024 | March 31, 2024 | |||||
| Annual deficit | (1 625 | ) | (5 994 | ) | ||
| Revenue of the Generations Fund | (2 373 | ) | (2 047 | ) | ||
| Budget balance | (3 998 | ) | (8 041 | ) |
Change in budget balance
(millions of dollars)

Note: In accordance with the Balanced Budget Act, the budgetary balance does not include the retroactive effect of a new CPA Canada standard for years prior to its coming into force. Thus, although the annual surpluses (deficits) were restated to reflect the application of the accounting standard relating to asset revenues and the standard pertaining to public private partnerships, these restatements had no impact on the budgetary balance.
(1) The provisions of the Balanced Budget Act prohibiting budgetary deficits did not apply to these years.
(2) Recourse to the stabilization reserve made it possible to achieve a balanced budget for 2020-2021 and 2021-2022 and to establish the budget deficit at $5 635M for 2022-2023. The budget balance within the meaning of the Balanced Budget Act after the stabilization reserve is presented in Table 1.4 of the financial statistics (page 68).
(3) The stabilization reserve was abrogated in 2023-2024.
3. Balanced Budget Act (cont'd)
A $725-million budget deficit was recorded in fiscal 2014-2015 in compliance with the Act then in force, since the provisions prohibiting a budget deficit were adopted in 2015-2016. The government's budgetary balances improved continuously from 2014-2015 to 2018-2019, benefiting in particular from a favourable economic situation.
On March 13, 2020, the Québec government declared a health emergency due to the global COVID-19 pandemic. Initiatives implemented to address the crisis and stimulate the economy, combined with the impact of the lockdown and temporary institutional closures, significantly affected the government's financial results for years 2019-2020 to 2021-2022.1 Against this backdrop, to gradually reduce the deficit without curtailing services to Quebecers or a revival of sustainable economic growth, the provisions in the Act that prohibited the recording or anticipation of a budget deficit and those obliging the government to resolve any deficit were suspended for the 2021-2022 to 2022-2023 fiscal years.
In 2022-2023, the budget deficit of $5 635 million2 is mainly due to measures put in place to help Quebecers cope with the rising cost of living in light of high inflation.
Lastly, in 2023-2024, the budget deficit of $8 041 million is attributable to more rapid growth in expenditures (2.8%) than in revenues (0.9%). Sluggish revenue growth is mainly explained by economic stagnation in Québec, which adversely affected income and property taxes, reduced Hydro-Québec exports due to low runoff in its main basins. As for the spending growth, it is attributable to growth in portfolio expenditures (3.2%), stemming notably from persistent inflation in 2023, by higher-than-anticipated population growth and by a major investment in public services, notably to improve working conditions for public and parapublic sector employees.
Generations Fund
The Generations Fund, created under the Act to reduce the debt and establish the Generations Fund, is used exclusively to repay the government's gross debt. The statement of change in the balance of the Generations Fund is presented in Note 12 "Generations Fund" of the consolidated financial statements.
In December 2023, the Act was amended to modify the sources of revenue devoted to the Generations Fund starting in fiscal 2023-2024. Accordingly, revenues stemming from the indexation of the price of heritage pool electricity, mining revenue, an annual amount of $500 million from the specific tax on alcoholic beverages, and amounts relating to the liquidation of unclaimed property were no longer allocated to the Generations Fund.
______________________________________
1 The change in the application of the accounting standard on government transfers also contributed to the budgetary deficit for 2020-2021.
2 The budget balance stood at $6 084 million. As stipulated in the Act prior to its modernization, it was reduced to $5 635 million after the use of the $449 million balance in the stabilization reserve.
3. Balanced Budget Act (cont'd)
Generations Fund (cont'd)
In keeping with the amended Act, the sources of revenue allocated to the Generations Fund are:
the water-power royalties that Hydro-Québec and private power producers pay;
Hydro-Québec's $650-million annual additional contribution drawn from the dividend that Hydro-Québec pays the government;
gifts, bequests, and other contributions received by the Minister of Finance for debt reduction;
revenues form the investment of the funds that make up the Generations Fund.
▌ 4. Analysis of main trends
The main trends are established with the financial information from the consolidated financial statements of the Gouvernement du Québec.
Where financial statements have been restated in a subsequent fiscal year, the restated data has been used. In 2023-2024, the accounting changes applied retroactively, presented in Note 3 of the consolidated financial statements, required the restatement of data for previous fiscal years presented in certain charts.
The data presented put into perspective the trends observed over the past 10 years for the following main items:
the annual surplus (deficit);
consolidated revenue by sources;
consolidated expenditures by portfolios;
the net book value of fixed assets;
the government's gross debt.
Change in annual surplus (deficit)
(millions of dollars)
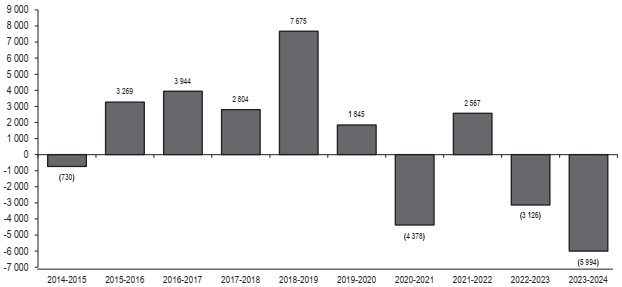
| Between 2014-2015 and 2018-2019, annual results overall improved, which allowed for the return to a surplus starting in 2015-2016. This was driven by, among other things, restrained growth in expenditures and a favourable economic environment. Growth in annual results ended in 2019-2020 due to targeted initiatives in the budget and the COVID-19 pandemic, which resulted in lost revenue and additional expenses for the government. However, the government's finances were more impacted by the negative effects of the pandemic in 2020-2021, which explains the significant deficit of $4 378 million. |
4. Analysis of main trends (cont'd)
Despite the impact of the many measures adopted by the government to address the health emergency in 2021-2022, Québec's finances benefited from the positive effects of the economic rebound and were particularly stimulated by the easing of the health measures, which resulted in a surplus of $2 567 million.
However, the economic recovery in 2021-2022 engendered significant inflationary pressure for 2022-2023 and led to a rise in the cost of living. To contend with the increase, the government established the Anti-Inflation Shield. The attendant measures, i.e., the increase in the senior assistance amount, the payment of a new one-time cost-of-living amount and the capping of indexation of several government rates, mainly explain the $3 126-million deficit recorded in 2022-2023.
In 2023-2024, the government recorded a deficit of $5 994 million. This deficit is attributable to a more rapid growth in spending (2.8%) than in revenues (0.9%).
4. Analysis of main trends (cont'd)
Change in consolidated revenue
Revenue by source
(millions of dollars)
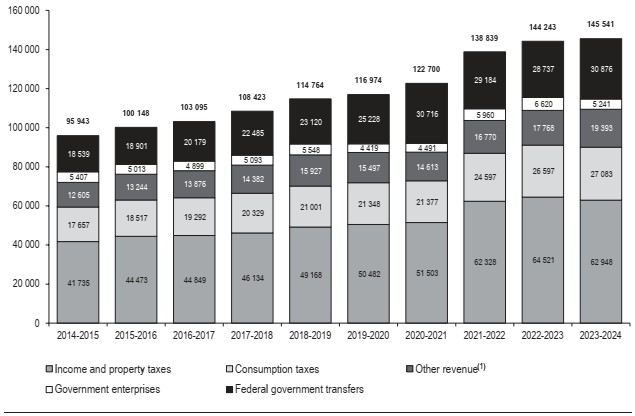
(1) Other revenue includes revenue from duties and permits as well as miscellaneous revenue.
The government's consolidated revenue rose from $95 943 million to $145 541 million from 2014-2015 to 2023-2024. Over this period, the annual average growth of this revenue was 4.7%, while that of GDP was 4.6%. Since 2014-2015, total revenue has grown steadily. Following stronger growth of 13.2% between 2020-2021 and 2021-2022 due to the post-pandemic economic recovery, growth in total consolidated revenues considerably slowed, to reach 3.9% in 2022-2023 then 0.9% in 2023-2024. This lower-than-average annual growth is mainly explained by the economic slowdown that began in 2022-2023, the lowering of the first two tax brackets of personal income tax since January 1, 2023 announced in Budget 2023-2024, and Hydro-Québec's weaker results stemming from the low runoff from its main basins in 2023-2024.
4. Analysis of main trends (cont'd)
Change in consolidated revenue (cont'd)
Tax revenue - Income and property taxes
Income and property taxes by source
(millions of dollars)
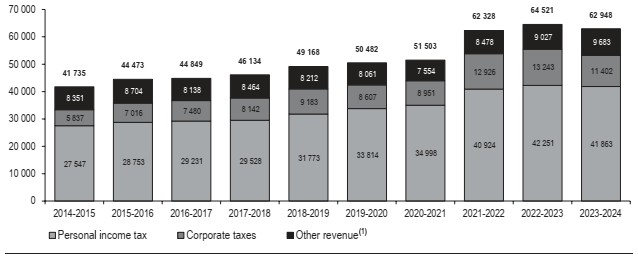
(1) Other tax revenue includes contributions for health services and the school property tax.
Revenues from income and property taxes increased from $41 735 million in 2014-2015 to $62 948 million in 2023-2024. Average annual growth in such revenue during the period stood at 4.7%.
Personal and corporate tax revenues have experienced, respectively, average annual growth of 4.8% and 7.7% since 2014-2015. This increase was especially pronounced in 2021-2022, i.e., 16.9% for personal income tax and 44.4% for corporate tax, because of an economic rebound spurred in particular by the relaxation of the public health measures introduced during the pandemic. On the one hand, such economic strength led to a dynamic employment market and labour shortages that nudged household wages and salaries upward. On the other hand, it was sustained by a marked increase in the net operating surplus of corporations.
In 2022-2023, growth continued in revenues from personal income and corporate taxes but more moderately than in the preceding year because of an economic contraction that began during the year. Moreover, the slowdown in personal income tax was exacerbated by the lowering of the first two tax brackets by 1 percentage point starting January 1, 2023, and the significant impact of the indexation of the taxation system1 for 2023.
______________________________________
1 The indexation of the main parameters of the personal income tax system stipulated by the law, i.e., the income tax brackets, the basic personal amount, and several deductions and tax credits. The indexation rate is determined according to the increase in the consumer price index in Québec, without alcohol, tobacco, and recreational cannabis.
4. Analysis of main trends (cont'd)
Change in consolidated revenue (cont'd)
Tax revenue - Income and property taxes (cont'd)
In 2023-2024, for the first time during the reference period, personal income tax and corporate tax revenues decreased in relation to the preceding year mainly because of the decline in the net operating surplus of corporations, the impact on a full fiscal year of the lowering of the first two tax brackets by 1 percentage point for individuals, and significant indexation of the taxation system for 2023 and 2024.
Lastly, other tax revenues remained relatively stable over the reference period with average annual growth of 1.7%. Revenues related to contributions for health services increased in keeping with growth in wages and salaries since 2014-2015. However, this increase was offset by the reduction in school property tax revenues during the same period following the implementation of the reform aimed at gradually reducing the school tax rate in Québec starting in 2018-2019.
Tax revenue - Consumption taxes
Revenue from consumption taxes has grown regularly since fiscal 2014-2015, going from $17 657 million to $27 083 million in 2023-2024. The average annual growth rate for the period was 4.9% owing to sustained growth in retail sales and, particularly for 2021-2022 and 2022-2023, the high inflation that contributed to the sharp rise in prices of goods and services subject to consumption taxes.
Federal government transfers
Federal government transfer revenue rose from $18 539 million in 2014-2015 to $30 876 million in 2023-2024, which represents an average growth of 5.8% per year. Federal transfers have been in continuous growth to and including 2020-2021.
Between 2014-2015 and 2020-2021, this growth is due to the increase in all categories of federal transfers and more specifically for 2020-2021, to federal government transfers made to support the implementation by the provinces of pandemic-related measures and to partly compensate Québec's efforts to mitigate the financial impact of the COVID-19 pandemic. The one-time nature of several of these support measures account for the decrease in transfer revenue in 2021-2022 and 2022-2023. Lastly, the 7.4% increase in federal transfers in 2023-2024 resulted, in particular, from the growth in the Canada Health Transfer related to the change in Canada's nominal GDP.
4. Analysis of main trends (cont'd)
Change in consolidated revenue (cont'd)
Government enterprises
Revenue from government enterprises, which consists mainly of the results of Hydro-Québec, Loto-Québec, the Société des alcools du Québec and Investissement Québec, went from $5 407 million in 2014-2015 to $5 241 million in 2023-2024, which corresponds to an average annual decrease of 0.3%.
Revenue from government enterprises decreased significantly in 2019-2020, due in particular to the effect of the weather and following Hydro-Québec's exceptional gain in 2018-2019 from the partial sale of the TM4 subsidiary. This revenue remained at the same level in 2020-2021 due to the impact of the pandemic and started to grow again in 2021-2022 following the gradual resumption of activities, combined with the post-pandemic economic recovery. The growth in revenue in 2022-2023 is essentially attributable to higher energy prices, which have increased the value of Hydro-Québec's exports. Lastly, the significant decrease of 20.8% that occurred in 2023-2024 is attributable, in particular, to lower net electricity exports because of the low runoff in the government corporation's reservoirs.
Other revenue
Other revenue increased from $12 605 million in 2014-2015 to $19 393 million in 2023-2024. Their average annual growth was 4.9% for this period. With the exception of 2019-2020 and 2020-2021, which show a decline, the change in other revenue reflects an upward trend.
Among the factors explaining this growth since 2014-2015 are:
growth of the auction of GHG emission allowances under Québec's cap-and-trade system for GHG emission allowances;
growth in the income of the Generations Fund, in particular growth from portfolio investments;
growth in revenue from registration fees;
growth in revenue from mining resources;
an increase in revenue related to user contributions in the health and social services, education and higher education networks.
4. Analysis of main trends (cont'd)
Change in consolidated expenditure
Expenditure by portfolios
(millions of dollars)

Expenditure by portfolios
(percentage of consolidated expenditures)
Portfolio | 2014-2015 | 2015-2016 | 2016-2017 | 2017-2018 | 2018-2019 | 2019-2020 | 2020-2021 | 2021-2022 | 2022-2023 | 2023-2024 |
Santé et Services sociaux | 38.3 | 38.9 | 39.2 | 38.2 | 39.0 | 38.6 | 42.2 | 41.5 | 40.3 | 40.3 |
Éducation | 13.6 | 13.5 | 13.9 | 13.5 | 13.9 | 13.8 | 13.0 | 12.8 | 13.2 | 13.2 |
Enseignement supérieur | 7.0 | 7.3 | 7.2 | 7.2 | 7.4 | 7.2 | 6.6 | 6.4 | 6.6 | 6.9 |
Other portfolios | 30.4 | 29.8 | 30.0 | 32.2 | 31.4 | 33.6 | 32.0 | 32.8 | 33.0 | 33.0 |
Debt service | 10.7 | 10.5 | 9.7 | 8.9 | 8.3 | 6.8 | 6.2 | 6.5 | 6.9 | 6.6 |
The government's consolidated expenditure level increased by $54 862 million from 2014-2015 to 2023-2024, from $96 673 million to $151 535 million. The average annual growth was 5.1%. Moreover, the share of consolidated expenditure devoted to the Santé et Services sociaux portfolio rose by 2.0 percentage points over the reference period, while the share devoted to debt service fell by 4.1 percentage points.
4. Analysis of main trends (cont'd)
Change in consolidated expenditure (cont'd)
Santé et Services sociaux portfolio
Expenditure in the Santé et Services sociaux portfolio has risen steadily since 2014-2015, with average annual growth of 5.7% between 2014-2015 and 2023-2024, compared with 5.1% for consolidated expenditure. This reflects the growing importance of spending in this portfolio, which rose from 38.3% in 2014-2015 to 40.3% in 2023-2024. Growth was more pronounced in the period from 2019-2020 to 2022-2023, mainly due to additional spending in health and social services to manage the pandemic. During this period, spending grew at an average annual rate of 10.1%, compared to 8.6% for total consolidated expenditure.
Éducation and Enseignement supérieur portfolios
Expenditure in the Éducation and Enseignement supérieur portfolios shows average annual growth of 4.8% and 5.0% respectively over the reference period, which is similar to the growth in total consolidated expenditure (5.1%). Consequently, the share of spending devoted to these portfolios remained more or less stable between 2014-2015 and 2023-2024, from 13.6% to 13.2% for education and from 7.0% to 6.9% for higher education.
Nevertheless, from 2021-2022 to 2023-2024, growth in spending on these two portfolios, namely 7.3% in education and 9.4% in higher education, was more pronounced than the average annual growth in consolidated expenditure of 5.5%. In the case of the Éducation portfolio, this was due in particular to increments, wage provisions, the increase in the number of teachers due to the rise in the number of students, and the rising cost of school transportation. For the Enseignement supérieur portfolio, growth is attributable, among other things, to increments, wage provisions and an increase in subsidies to private universities to improve higher education graduation rates. In particular, growth between 2022-2023 and 2023-2024 remained at an elevated level in the higher education system, reaching 8.5%, in particular because of the increase in funding granted to private universities, growth in remuneration, and the Perspective Québec scholarship program.
4. Analysis of main trends (cont'd)
Change in consolidated expenditure (cont'd)
Other portfolios
Expenditure in other portfolios, of which there are 22 in 2023-2024, grew at an average annual rate of 6.1% over the reference period, i.e., at a rate superior to that in the Santé et Services sociaux portfolio (5.7%), and higher than that in the Éducation and Enseignement supérieur portfolios (4.8% and 5.0%). The share of consolidated expenditure allocated to the other portfolios increased by 2.6 percentage points during the reference period, attributable, in particular, to:
the implementation, in 2021-2022 and 2022-2023, of measures to help Quebecers cope with the rising cost of living, including one-time payments and an increase in the senior assistance amount (Emploi et Solidarité sociale portfolio);
the increase in spending related to investments in road network improvement, development and maintenance, and in transportation systems (Transports et Mobilité durable portfolio);
growth in spending on municipal infrastructure and housing, particularly to improve access to housing and to contribute to the repair and construction of water supply and sewer systems and the treatment of municipal wastewater in all regions of Québec (Affaires municipales et Habitation and Finances portfolios);
growth in financial support for childcare centres and other day care services, the increase in the Family Allowance and the creation of new subsidized childcare service spaces (Famille portfolio);
increased action on environmental protection, sustainable development and climate change (Environnement, Lutte contre les changements climatiques, Faune et Parcs portfolio).
Debt service
Between 2014-2015 and 2019-2020, debt service has declined steadily before showing a slight increase of 0.2% in 2020-2021 followed by sharp increases of 12.2% in 2021-2022 and 16.1% in 2023-2024. These increases are primarily due to higher interest rates. In 2023-2024, debt service decreased by 2.3%, despite growth in the average volume of debts and the impact of higher rates on the interest expense, because of the impact of the variation in revenues from the Retirement Plans Sinking Fund (RPSF) applied to reduce the interest expense.
Despite the higher interest rates since 2021-2022, the average annual decline in debt service is 0.4% for the entire reference period and the share of expenditure devoted to debt service fell from 10.7% in 2014-2015 to 6.6% in 2023-2024.
4. Analysis of main trends (cont'd)
Change in the net book value of fixed assets
(millions of dollars)
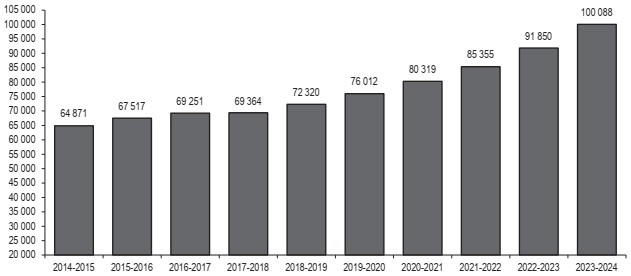
Fixed assets can be broken down into several different categories, including complex networks, which consist mainly of net investments in road infrastructure. Such investments accounted for 32.9% of the total net book value of fixed assets as at March 31, 2024.
The net book value of fixed assets increased by $8 238 million over the past year, from $91 850 million as at March 31, 2023 to $100 088 million as at March 31, 2024. This increase shows that investments in fixed assets outstrip the related depreciation of the government's fixed assets as a whole.
4. Analysis of main trends (cont'd)
Government's net debt
(millions of dollars)
Increase of the net debt from March 31, 2014 to March 31, 2024
Net debt as at March 31, 2014 stood at $195 304 million. It amounted to $220 016 million as at March 31, 2024. Accordingly, for fiscal 2014-2015 to 2023-2024, the government's net debt rose by $24 712 million. This increase is due to:
cumulative budgetary deficits of $17 292 million;
government capital assets investments of $40 159 million.
The increase in the net debt is offset by:
deposits in the Generations Fund, which reduced the net debt by $25 168 million;
change in other factors which decreased the net debt by $7 571 million.
Trends in the government's net debt from March 31, 2014 to March 31, 2024
(millions of dollars, unless otherwise indicated)

(1) For the purpose of establishing the trends in net debt, the budget deficits (surpluses) were established based on the restated annual deficits (surpluses) established on page 41, minus the Generations Fund's revenues.
(2) The other trends concerning the net debt include changes in other non-financial assets, other factors of the comprehensive income of government enterprises, net revaluation losses, and losses pertaining to accounting changes. Table 1.2 of the financial statistics (page 66) presents the detailed variations affecting such factors.
▌ 5. Results of the indicator analysis
The financial indicator analysis aims primarily to clarify and explain the information contained in the government's consolidated financial statements.
Where financial statements have been restated in a subsequent financial year, the restated data has been used. In 2023-2024, the accounting changes applied retroactively, presented in Note 3 of the consolidated financial statements, required the restatement of data for previous fiscal years presented in certain charts.
The Québec government presents 10 indicators based on those established by the Public Sector Accounting Board in a Statement of Recommended Practice. These indicators are intended to measure a government's sustainability, flexibility and vulnerability.
Sustainability refers to the degree to which the government can meet its existing financial obligations without increasing, in relative terms, the debt or tax burden on the economy.
Flexibility is the extent to which the government can change its debt burden or the tax burden of its citizens to meet its existing financial obligations without compromising its ability to meet its future obligations.
Vulnerability is the degree to which the government is dependent on sources of funding outside its control or influence.
5. Results of the indicator analysis (cont'd)
Indicator's evolution over the past 5 years
(percent)
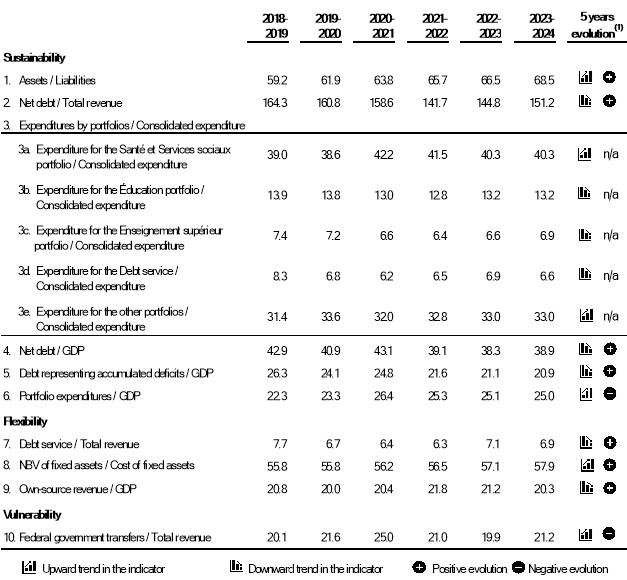
(1) The trend (upward or downward) is determined by comparing the values furthest away from the reference period, namely those for 2023-2024 and those for 2018-2019.
In this section, gross domestic products (GDP) used correspond to nominal GDPs as of September 25, 2024. Where applicable, GDPs for the reference years are adjusted for the purpose of calculating the indicators.
5. Results of the indicator analysis (cont'd)
Indicator 1: Assets to total liabilities
This indicator illustrates the extent to which the government finances its current operations through liabilities. A ratio of over 100% indicates that it accumulated a surplus in the past and that the value of the government's financial and non-financial assets is higher than that of its liabilities. A ratio of less than 100% indicates that the government accumulated a deficit in the past and that the value of its financial and non-financial assets is lower than that of its liabilities. An upward ratio illustrates a favourable trend.
Financial and non-financial assets
(percentage of total liabilities)
The ratio of financial and non-financial assets to total liabilities was 51.9% in 2014-2015. The ratio stood at 68.5% as at March 31, 2024. Taking the accumulated deficit into account, the value of assets is still lower than that of liabilities. In addition, the improvement in the ratio that is observed shows that assets have climbed at a faster rate than liabilities.
5. Results of the indicator analysis (cont'd)
Indicator 2: Net debt to total revenue
This indicator measures the requisite future revenues to cover past operations. A falling ratio indicates the government's tendency to reduce its net debt. Conversely, a rising ratio indicates that it will take longer to reduce its net debt.
Net debt
(percentage of total revenue)
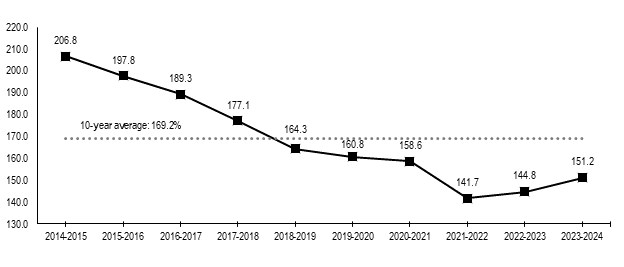
Between 2014-2015 and 2021-2022, the change in the ratio shows a steady decline from 206.8% to 141.7%. This decline means that revenue is growing at a faster rate than net debt. The more pronounced decline in the ratio in 2021-2022 is explained by a significant growth of 13.2% in total revenue, resulting mainly from the effects of the economic rebound, compared to a 1.1% growth in the net debt for the same period.
In 2022-2023, the ratio rose by 3.1 percentage points, due to a 6.1% increase in net debt, while total revenues increased less significantly over the same period, by 3.9%. This more pronounced change in net debt notably resulted from the impact of the annual deficit, influenced by the measures implemented to combat inflation, and by the growth in capital assets investments, notably in the health and social services and education networks. Lastly, in 2023-2024, the ratio continued to rise to 151.2% because of more significant growth in relative terms of the net debt (5.4%) than consolidated revenue (0.9%), especially because of the economic slowdown.
Indicator 3: Expenditures by portfolios to consolidated expenditure
This indicator, presented in section 4, Analysis of main trends (page 47), illustrates the evolution of the distribution of consolidated government expenditure between portfolios.
5. Results of the indicator analysis (cont'd)
Indicator 4: Net debt to GDP
This indicator puts the government's net debt into perspective with its ability to pay, as measured by GDP. A downward trend in this ratio means that government debt is becoming less of a burden on the economy, while an upward trend may lead the government to take measures to reduce the debt burden, such as raising taxes or reducing portfolio expenditures to cover interest costs.
The government adopted targets in the Act to reduce the debt and establish the Generations Fund, i.e., to reduce the net debt burden to 33% of GDP by 2032-2033, and to 30% of GDP by 2037-2038.
Net debt
(percentage of GDP)
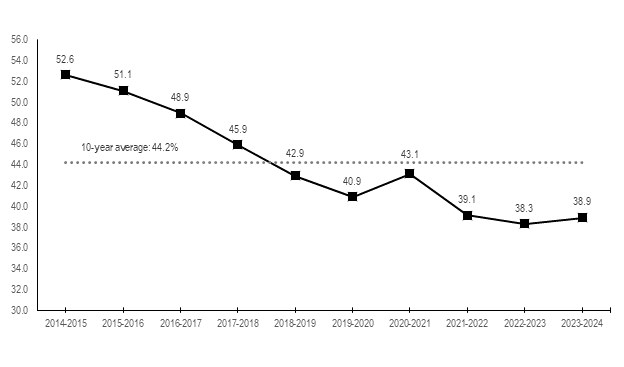
The net debt-to-GDP ratio declined between 2014-2015 and 2019-2020, reaching a low of 40.9%. The increase in the ratio of 2.2 percentage points in 2020-2021, bringing it to 43.1% is explained by an increase in debt to cope with the pandemic and a decline 1.8% in GDP caused by confinement measures, including temporary closures of certain economic sectors. Strong GDP growth (11.6%) in 2021-2022, driven mainly by the economic recovery following the easing of health measures, meant that the ratio was lower than its pre-pandemic level. The ratio continued to fall in 2022-2023, to reach 38.3%, despite a 6.1% rise in net debt, due to a robust increase in GDP (8.4%) related to sustained economic vigour since the 2021-2022 recovery.
Lastly, in 2023-2024, the ratio increased slightly to 38.9%, because of more significant growth in relative terms in the net debt (5.4%) than in GDP (3.7%), attributable to the economic downturn.
5. Results of the indicator analysis (cont'd)
Indicator 5: Debt representing accumulated deficits to GDP
This indicator relates the debt representing accumulated deficits, or the debt not used to finance assets, with the government's ability to pay, as measured by GDP. A downward trend in this ratio means a reduction in the relative weight of the debt representing accumulated deficits.
Debt representing accumulated deficits
(percentage of GDP)
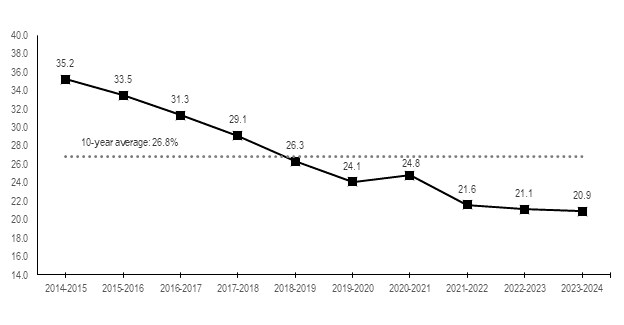
The ratio of the debt representing accumulated deficits to GDP gradually declined from 2014-2015 to 2019-2020, from 35.2% to 24.1%. It then increased by 0.7 percentage point to reach 24.8% as at March 31, 2021. This increase in the ratio in relation to 2019-2020 is attributable to the deficit in the 2020-2021 fiscal year and a 1.8% downturn in GDP stemming from the confinement measures, including the temporary closing of certain economic sectors. The strong GDP growth (11.6%) in 2021-2022, due primarily to the economic rebound following the easing of the health measures, brought the ratio below its pre-pandemic level. In 2022-2023 and 2023-2024, GDP growth of 8.4% and 3.7% brought this ratio down to 21.1% and then to 20.9%, the latter being the lowest level during the reference period.
5. Results of the indicator analysis (cont'd)
Indicator 6: Portfolio expenditures to GDP
This indicator makes it possible to compare the growth of government spending with that of the economy over the years. A decline (increase) in this indicator means that spending is growing less (more) rapidly than the economy. The indicator shows the change in the relative weight of the cost of public services in the economy.
Portfolio expenditures
(percentage of GDP)

Between 2014-2015 and 2019-2020, the portfolio expenditures-to-GDP ratio was maintained, going from 22.9% to 23.3%. In 2020-2021, this ratio jumped significantly to a high of 26.4%. The key factors of such growth are one-time costs related to the COVID-19 pandemic combined with the 1.8% decline in GDP caused by confinement measures, including the temporary shutdowns of certain economic sectors.
From 2021-2022 to 2022-2023, the ratio decreased by 0.2 percentage point, reaching 25.1%. This decrease was due to a growth in GDP (8.4%) that was higher than the increase in expenditure (7.6%). The growth in GDP is related to the rebound in the economy from 2021-2022, following the lifting of the health emergency. The increase in expenditure is explained by the one-time costs associated with the health emergency, including those to support the health and social services network, and by the support measures implemented to help the population cope with to the rising cost of living. Lastly, the ratio fell in 2023-2024 for the third consecutive year, to 25.0%, because growth in GDP (3.7%) outpaced expenditures (3.2%).
5. Results of the indicator analysis (cont'd)
Indicator 7: Debt service to total revenue
This indicator illustrates the share of government revenue that must be allocated to debt service. A decline in this ratio over time means that a larger share of revenue can be devoted to other portfolio expenditures.
Debt service
(percentage of total revenue)
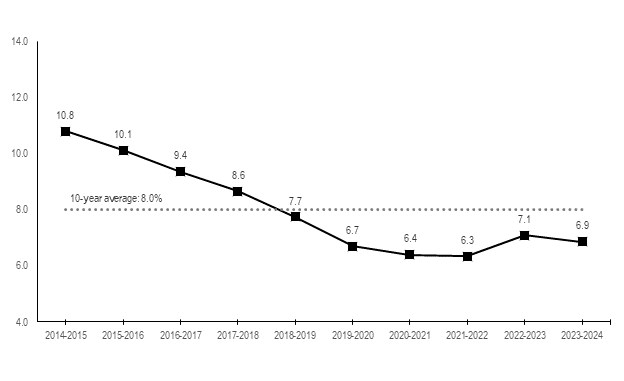
The proportion of revenue devoted to debt service fell constantly from 2014-2015 to 2021-2022, going from 10.8% to 6.3%, then rebounded in 2022-2023 to reach 7.1%. This increase is due in particular to a 16.1% growth in debt service higher than the 3.9% increase in total revenues. The growth in debt service stems from the rise in interest rates and the 7.2% increase in gross debt in 2022-2023. In 2023-2024, the ratio fell by 0.2 percentage point because of reduced debt service stemming, in particular, from the impact of revenues from the sinking funds pertaining to loans applied to reduce the interest expense, since the losses on the sale of assets observed were significantly lower than in 2022-2023. During the past year, the increase in revenues exceeded growth in the interest expense engendered by higher interest rates and the average volume of debts.
5. Results of the indicator analysis (cont'd)
Indicator 8: Net book value of fixed assets to their cost
This indicator shows the extent to which the estimated remaining useful life of tangible assets will enable the government to supply products and services in the future. An increase in this ratio indicates that on average the age of fixed assets is lower, and thus that their remaining useful life is longer. The fixed assets can thus be used for a longer period of time before they need to be replaced.
Net book value of fixed assets
(percentage of the cost of fixed assets)

The net book value to the cost of fixed assets indicator has gradually declined between 2014-2015 and 2018-2019 to a low of 55.8% at March 31, 2019. Following this decline, the ratio remained steady in 2019-2020 then increased to reach 57.9% in 2023-2024 because of investments in capital assets, especially in health and education institutions and the road network.
5. Results of the indicator analysis (cont'd)
Indicator 9: Own-source revenue to GDP
This indicator shows the proportion of collective wealth that the government must collect in order to fund public services. The government's own-source revenue consists of income tax and other taxes, user fees and other revenue derived from its enterprises in particular. This revenue includes all of the government's revenue, apart from transfers received from the federal government. A decline in this ratio over time tends to indicate that more created wealth is directly available to taxpayers, while an increase suggests reduced government flexibility regarding future revenues.
Own-source revenue
(percentage of GDP)
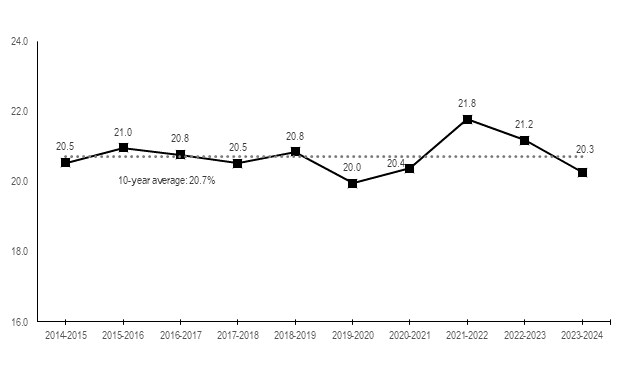
Throughout the reference period, the ratio of own-source revenue to GDP was relatively stable going from 20.5% to 20.3%. Nevertheless, the ratio has trended downward between 2015-2016 and 2019-2020, mainly because of the measures to reduce the tax burden implemented by the government and the growth of the economy. The 2018-2019 rebound is primarily explained by income from portfolio investments of the Generations Fund resulting from withdrawals totalling $8 billion, as well as an exceptional gain in Hydro-Québec's income related to the partial sale of the TM4 subsidiary. In 2020-2021, the increase in the ratio to 20.4% was mainly because of the drop in GDP (1.8%) stemming from the confinement measures, including the temporary closing of certain economic sectors. The economic recovery has caused the ratio of own-source revenue to GDP to jump to 21.8% in 2021-2022. The increase stems from growth in own-source revenue (19.2%) exceeding that of GDP (11.6%). Lastly, the ratio fell from 2022-2023 to 20.3% in 2023-2024, in particular because of the lowering of the first two tax brackets since January 1, 2023, and the economic contraction, whose impact in relative terms was more significant on own-source revenue than on GDP. Indeed, own-source revenue decreased by 0.7% in 2023-2024, while GDP grew by 3.7%.
5. Results of the indicator analysis (cont'd)
Indicator 10: Transfers from the federal government to total revenue
Transfers received from the federal government comprise equalization payments, payments from transfers for health care, and for post-secondary education and other social programs, and amounts transferred under various agreements. This indicator measures the proportion of the Québec government's revenue that comes from the federal government.
Federal government transfers
(percentage of total revenue)
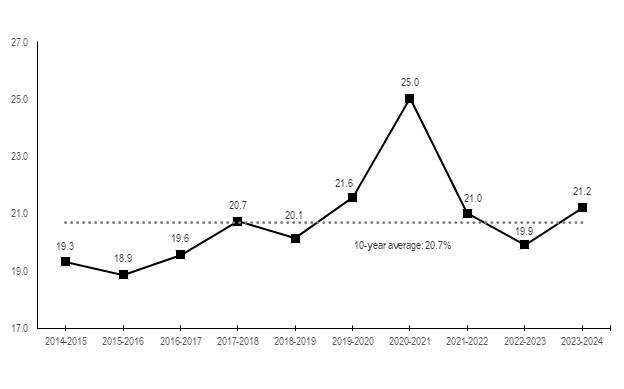
Between 2014-2015 and 2020-2021, the ratio of federal government transfers in relation to total revenues shows an upward trend, to reach 25.0%, in particular because of the continued increase in equalization revenue and health transfers. The more pronounced change in the ratio in 2020-2021 is explained by a significant increase in transfers, which aim to support the implementation by the provinces of COVID-19 pandemic-related measures. In 2021-2022, the ratio fell sharply reaching 21.0% following the decrease in transfers related to the management of the pandemic and significant growth (13.2%) in total revenues in the context of economic recovery. The ratio then fell by 1.1 percentage point in 2022-2023 to 19.9%, due in particular to the end of certain health transfers linked to the pandemic which led to a 1.5% reduction in federal government transfers. In 2023-2024, the ratio increased by 1.3 percentage point due to a significant increase in transfers (7.4%), more specifically health transfers, while total revenues increased slightly (0.9%).
▌ 6. Additional information
Government's gross debt
(millions of dollars, unless otherwise indicated)
| As at March 31 | |||||||
| 2024 | 2023 | ||||||
| (restated data) | |||||||
| Debts(1) | 281 958 | 257 390 | |||||
| Plus: | Self-held securities by the Gouvernement du Québec | 13 786 | 15 573 | ||||
| Liabilities related to derivative instruments | 9 911 | 10 684 | |||||
| Pension plans and other employee future benefits liabilities | 3 620 | 6 785 | |||||
| Less: | Generations Fund | (18 458 | ) | (18 911 | ) | ||
| Sinking funds relating to borrowings | |||||||
| (balance before compensation of self-held securities) | (31 786 | ) | (31 735 | ) | |||
| Assets related to derivative instruments | (10 049 | ) | (11 209 | ) | |||
| Gross debt including advance borrowings | 248 982 | 228 577 | |||||
| Less: | Advance borrowings | (3 150 | ) | (2 233 | ) | ||
| Gross debt | 245 832 | 226 344 | |||||
| As a % of nominal GDP | 43.5% | 41.5% | |||||
Note : The calculation of gross debt as at March 31, 2023 considers the retroactive application of the Section PS 3160, Public Private Partnerships accounting standard (see NOTE 3 in the consolidated financial statements).
(1) The government contracted $5 636M in debts on the financial markets in respect of which the cash flow was receivable as at March 31, 2024 (no cash flow pertaining to the debts was receivable as at March 31, 2023). Such debts were excluded from the calculation of the gross debt since it does not consider the amounts collected as at March 31.
6. Additional information (cont'd)
Net financial surpluses (requirements) and financing transactions
Net financial surpluses or requirements represent the gap between the government's cash receipts and cash payments. More specifically, they mark the government's available or required cash flow levels after it has conducted all its activities during a given fiscal year. They take into account:
changes in annual surpluses (deficits);
resources or requirements arising from, among other things, the acquisition or disposal of fixed assets, investments, loans and advances, as well as other activities such as the payment of accounts payable and accrued expenses and the collection of accounts receivable.
The primary objective of determining net financial surpluses or requirements is to provide the Ministère des Finances with the most accurate information so that it can make decisions about changes in government borrowing.
Generally, the impact of net financial surpluses or requirements will have a corresponding impact on gross debt, i.e. increases in net financial requirements will entail borrowing, thereby increasing gross debt, while net financial surpluses lead to loan repayments, thereby reducing gross debt.
Financing transactions show the loans contracted (repaid) and the cash flow generated (used) for all government activities during the fiscal year.
Net financial surpluses (requirements) and financing transactions
(millions of dollars)
| Fiscal year ended March 31 | ||||||
| 2024 | 2023 | |||||
| (restated data) | ||||||
| Cash flow provided by operating activities | (5 065 | ) | (4 750 | ) | ||
| Cash flow used for investments activities(1) | 1 412 | 5 172 | ||||
| Cash flow used for fixed asset investment activities | (13 618 | ) | (11445 | ) | ||
| Net financial surplus (requirements) | (17 271 | ) | (11 023 | ) | ||
| Cash flow provided by financing activities(1) | 22 271 | 11 037 | ||||
| Change in cash flow during the fiscal year | (5 000 | ) | (14 | ) | ||
| Financing transactions | 17 271 | 11 023 | ||||
(1) The investments made related to cash management whose maturity date at the time of acquisition was between 3 and 12 months and withdrawals from the Generations Fund to repay debt, presented in the cash flows used for investment activities totalled respectively $3 807M as at March 31, 2024 ($133M as at March 31, 2023) and $2 500M (no withdrawal as at March 31, 2023). The early redemption of securities, presented in the cash flows related to investment activities, totalled $6 250M as at March 31, 2023 (there was no redemption of securities as at March 31, 2024). For the purposes of the net financial requirements (needs) and financing transactions, such transactions are presented in the cash flows used for financing activities.
6. Additional information (cont'd)
Financial statistics
These tables present certain information published in the government's consolidated financial statements.
Where financial statements have been restated in a subsequent financial year, the restated data has been used. In 2023-2024, the accounting changes applied retroactively, presented in NOTE 3 of the consolidated financial statements, required the restatement of data for previous fiscal years presented in tables 1.1, 1.2 and 1.4.
Table 1.1 - Historical data for consolidated financial statement items
Fiscal year ended March 31
(millions of dollars)
Fiscal | Revenue | Expenditure | Surplus | Financial | Liabilities | Net debt | Non-Financial | Accumulated |
2023-2024 | 145 541 | 151 535 | (5 994) | 155 680 | (375 696) | (220 016) | 101 711 | (118 305) |
2022-2023 | 144 243 | 147 369 | (3 126) | 134 607 | (343 427) | (208 820) | 93 884 | (114 936) |
2021-2022 | 138 839 | 136 272 | 2 567 | 120 565 | (317 354) | (196 789) | 87 891 | (108 898) |
2020-2021 | 122 700 | 127 078 | (4 378) | 115 128 | (309 717) | (194 589) | 82 432 | (112 157) |
2019-2020 | 116 974 | 115 129 | 1 845 | 103 614 | (291 666) | (188 052) | 77 066 | (110 986) |
2018-2019 | 114 764 | 107 089 | 7 675 | 94 557 | (283 134) | (188 577) | 73 113 | (115 464) |
2017-2018 | 108 423 | 105 619 | 2 804 | 98 004 | (290 007) | (192 003) | 70 123 | (121 880) |
2016-2017 | 103 095 | 99 151 | 3 944 | 89 102 | (284 253) | (195 151) | 70 003 | (125 148) |
2015-2016 | 100 148 | 96 879 | 3 269 | 80 928 | (278 980) | (198 052) | 68 241 | (129 811) |
2014-2015 | 95 943 | 96 673 | (730) | 77 369 | (275 757) | (198 388) | 65 615 | (132 773) |
(1) The budget balance within the meaning of the Balanced Budget Act is presented in Table 1.4 (page 68).
(2) Table 1.3 (page 67) presents the breakdown of the annual change in accumulated operating deficit attributable to the accounting changes.
6. Additional information (cont'd)
Financial statistics (cont'd)
Table 1.2 - Trends in the government's net debt
Fiscal year ended March 31
(millions of dollars)
(millions of dollars)
| Fiscal year | Net debt, beginning of the year | Changing factors in net debt | Net debt, end of the year | |||||||
| Budgetary deficit (surplus)(1) | Net fixed assets | Revenues dedicated to the Generations Fund | Other factors | Total variation | ||||||
| Other financials assets | Other comprehensive income items of government enterprises | Net remeasure- ment losses (gains)(2) | Accounting changes | |||||||
| 2023-2024 | 208 820 | 8 041 | 8 238 | (2 047) | (411) | (1 852) | (773) | - | 11 196 | 220 016 |
| 2022-2023 | 196 789 | 6 208 | 6 495 | (3 082) | (498) | (947) | 3 855 | - | 12 031 | 208 820 |
| 2021-2022 | 194 589 | 1 050 | 5 036 | (3 617) | 422 | (691) | - | - | 2 200 | 196 789 |
| 2020-2021 | 188 052 | 7 691 | 4 307 | (3 313) | 1 060 | (3 208) | - | - | 6 537 | 194 589 |
| 2019-2020 | 188 577 | 761 | 3 692 | (2 606) | 260 | (2 632) | - | - | (525) | 188 052 |
| 2018-2019 | 192 003 | (4 198) | 2 956 | (3 477) | 35 | 1 258 | - | - | (3 426) | 188 577 |
| 2017-2018 | 195 151 | (511) | 2 126 | (2 293) | 7 | (464) | - | (2 013) | (3 148) | 192 003 |
| 2016-2017 | 198 052 | (1 943) | 1 734 | (2 001) | 28 | (719) | - | - | (2 901) | 195 151 |
| 2015-2016 | 198 388 | (1 816) | 2 646 | (1 453) | (19) | 306 | - | - | (336) | 198 052 |
| 2014-2015 | 195 304 | 2 009 | 2 929 | (1 279) | 31 | (606) | - | - | 3 084 | 198 388 |
| Total | 17 292 | 40 159 | (25 168) | 915 | (9 555) | 3 082 | (2 013) | 24 712 | ||
| (7 571) | ||||||||||
(1) To establish trends in the net debt, budget deficits (surpluses) have been established based on the restated annual deficits (surpluses) established on page 41, reduced by revenues from the Generations Fund.
(2) Accounting of the net remeasurement gains and losses has, since April 1, 2022, stemmed from the prospective application of the accounting standards governing financial instruments.
6. Additional information (cont'd)
Financial statistics (cont'd)
Table 1.3 - Breakdown of the annual change in accumulated operating deficits attributable to accounting changes
Fiscal year ended March 31
(millions of dollars)
| Fiscal year | Restatements of operating accumulated deficits | Total | Details of adjustments | |
| Government enterprises | Departments and bodies | |||
| 2023-2024 | ― | 57 | 57 | Application of the new accounting standard governing public-private partnerships ($279M) and the standard governing revenues (-$748M) and restatement of asset retirement obligations ($526M) |
| 2022-2023 | ― | (3 777) | (3 777) | Application of the accounting standard relating to asset retirement obligations ($3 777M). |
| 2021-2022 | ― | ― | ― | |
| 2020-2021 | ― | (12 504) | (12 504) | Change in the application of the accounting standard on government transfers in order to account for transfer expenditures according to the completion progress of eligible work by transfer recipients ($12 504M). |
| 2019-2020 | ― | ― | ― | |
| 2018-2019 | 45 | ― | 45 | Hydro-Québec's adoption of new guidance of the Financial Accounting Standards Board (FASB) on leases ($10M). Accounting changes made by other government enterprises to comply with new International Reporting Standards (IFRS) on financial instruments ($35M). |
| 2017-2018 | ― | ― | ― | |
| 2016-2017 | ― | ― | ― | |
| 2015-2016 | (107) | ― | (107) | Finalization of the adjustments made in 2014-2015 to comply with IFRS ($107M). |
| 2014-2015 | (2 252) | 294 | (1 958) | Departments and bodies: adjustment to revenue for previous years, in respect of the sale tax, collected by Canada Revenue Agency from selected listed financial institutions ($294M). Government enterprises: adjustment to comply with IFRS ($2 252M). |
6. Additional information (cont'd)
Financial statistics (cont'd)
Table 1.4 - Budget balance within the meaning of the Balanced Budget Act
Fiscal year ended March 31
(millions of dollars)
(millions of dollars)
Fiscal | Restated | Generations | Sub-total | Adjustments(1) | Budget | Stabilization reserve |
| |
Allocation | Use of the | |||||||
2023-2024 | (5 994) | (2 047) | (8 041) |
| (8 041) |
|
| s. o. |
2022-2023 | (3 126) | (3 082) | (6 208) | 124 | (6 084) |
| 449 | (5 635) |
2021-2022 | 2 567 | (3 617) | (1 050) | 278 | (772) |
| 772 | ― |
2020-2021 | (4 378) | (3 313) | (7 691) | (3 069) | (10 760) |
| 10 760 | ― |
2019-2020 | 1 845 | (2 606) | (761) | 765 | 4 | (4) |
| ― |
2018-2019 | 7 675 | (3 477) | 4 198 | 605 | 4 803 | (4 803) |
| ― |
2017-2018 | 2 804 | (2 293) | 511 | 2 111 | 2 622 | (2 622) |
| ― |
2016-2017 | 3 944 | (2 001) | 1 943 | 418 | 2 361 | (2 361) |
| ― |
2015-2016 | 3 269 | (1 453) | 1 816 | 375 | 2 191 | (2 191) |
| ― |
2014-2015 | (730) | (1 279) | (2 009) | 1 284 | (725) |
|
| (725) |
(1) In order to comply with the Budget Balance Act's provisions, it is necessary to make adjustements to the adjusted annual surpluses and deficits are required to establish the budgetary balance. One of these adjustments is that accounting changes that require affecting the accumulated deficits must be considered in the fiscal year in which the change is made. Thus, adjustments have notably been made to take into account, first, the fact that restatements arising from the application of the new accounting standard relating to public private partnerships and the standard governing revenues are not to be taken into account in establishing budget balances and, second, due to the fact that the change in application of the accounting standard respecting transfer payments must only affect the establishement of the 2020-2021 budget balance.
(2) Provisions in the Budget Balance Act prohibiting a budget deficit did not apply to the years 2014-2015, 2021-2022, and 2022-2023.
Appendix 1
Risks and uncertainties
The following factors are elements of risk and uncertainty that are not directly dependent on the government but that can cause actual results to differ from forecast results:
the economic forecasts the government uses to determine its annual budgetary revenue, particularly those concerning changes in economic growth, employment and the Consumer Price Index. For example, a 1-percentage-point difference in nominal GDP has an impact of about $1 billion on own-source revenue excluding revenue from government enterprises;
the level of spending, whose cost is related to the economic situation. These factors include, in particular:
- a variation in the clientele, concerning for example individuals receiving last-resort financial assistance or those attending educational institutions,
- technological changes, which affect, by way of an example, the cost of medicines and diagnostic medical equipment,
- labour shortages in the context of a reduced labour pool, which limits the government's ability to implement its programs,
- the change in the general level of prices, which affects each government portfolio differently;
revenue from government enterprises which varies according to assumptions concerning such things as weather conditions, which are hard to predict. For example, a variation of 1ºC in winter temperatures compared to normal temperatures has a nearly $75-million impact on Hydro-Québec's net earnings;
the economic, taxation and population data the government uses to determine revenue from federal government transfers, as well as the negotiations carried out regularly with the federal government. These data and negotiations can both affect federal government transfer revenue;
unforeseen situations such as a pandemic, natural catastrophes or work stoppages;
the change in interest rates and in returns of the Retirement Plans Sinking Fund (RPSF), which have an impact on debt service;
the risk that a financial intermediary will default on its contractual obligations (credit risk);
the settlement of certain claims and lawsuits pending against the government before the courts.
The consolidated financial statements also set forth in its notes the uncertainties to which the estimates needed to prepare these statements are subject.
Appendix 1
Risks and uncertainties (cont'd)
To reduce its exposure to risk, the government develops management strategies for some of these variables. With the help of economic, fiscal and budgetary policies, the government can influence its revenue and expenditure, other than debt service, by:
using economic forecasts that do not anticipate overly high or overly low revenue-a situation that could lead to inappropriate policy decisions;
monitoring economic, budgetary and financial indicators, including the monitoring of its consolidated revenue and expenditure;
implementing economic support measures.
A government cannot prevent a recession or an economic slowdown single-handedly. However, it has the necessary means to play a stabilizing role in order to offset the effects of an economic slowdown and speed up the recovery.
In addition, financing policies lead the government to have an impact on its debt service through various strategies.
The financial framework includes a contingency reserve to contend with risks resulting from the economic situation or other events that affect the government's financial situation. It also includes the Contingency Fund, which is a reserve administered by the Conseil du trésor aimed, in particular, at covering unforeseen expenditures that can arise in government programs during the fiscal year and at covering certain measures announced in the budget.
CONSOLIDATED
FINANCIAL
STATEMENTS
Fiscal year 2023-2024
Statement of responsibility
The Comptroller of Finance is responsible for preparing the government's consolidated financial statements for the Minister of Finance in accordance with the provisions of section 86 of the Financial Administration Act (CQLR, chapter A-6.001). The Comptroller of Finance is also responsible for the integrity and objectivity of the consolidated financial statements in accordance with the accounting policies disclosed in the notes and established pursuant to the public sector accounting standards.
To fulfill their accounting and financial reporting responsibilities, the Comptroller of Finance and the entities making up the government's reporting entity maintain financial management systems and internal controls that take costs, benefits and risks into account. These systems are designed to provide reasonable assurance that transactions are duly authorized by Parliament, carried out based on the adopted regulations, and properly recognized in order to account for the use of public funds.
The Comptroller of Finance obtains all the information needed to meet the accounting requirements from government departments, bodies, enterprises and funds and implements processes to ensure that this information is reliable. The Comptroller of Finance submits the government's consolidated financial statements for audit to the Auditor General of Québec which states the nature and scope of its audit and expresses its opinion in its independent auditor's report to the National Assembly.
The consolidated financial statements are part of the Public Accounts and are tabled annually in the National Assembly by the Minister of Finance.
On behalf of the Gouvernement du Québec,
| Julie Gingras | Lucie Pageau, CPA |
| Deputy Minister of Finance | Comptroller of Finance |
| Québec, September 30, 2024 |

INDEPENDENT AUDITOR'S REPORT
To the National Assembly
Report on the Audit of the Consolidated Financial Statements
Opinion
I have audited the consolidated financial statements of the Gouvernement du Québec (the Government), which comprise the consolidated statement of financial position as at March 31, 2024, and the consolidated statement of operations and accumulated operating deficit, consolidated statement of change in net debt, consolidated statement of remeasurement gains and losses and consolidated statement of cash flow for the year then ended, and notes and appendices to the consolidated financial statements, including a summary of significant accounting policies.
In my opinion, the accompanying consolidated financial statements present fairly, in all material respects, the consolidated financial position of the Government as at March 31, 2024, and its consolidated results of operations, its consolidated remeasurement gains and losses, its consolidated changes in net debt and its consolidated cash flow for the year then ended in accordance with Canadian public sector accounting standards.
Basis for Opinion
I conducted my audit in accordance with Canadian generally accepted auditing standards. My responsibilities under those standards are further described in the Auditor's Responsibilities for the Audit of the Consolidated Financial Statements section of my report. I am independent of the Government in accordance with the ethical requirements that are relevant to my audit of the consolidated financial statements in Canada, and I have fulfilled my other ethical responsibilities in accordance with these requirements. I believe that the audit evidence I have obtained is sufficient and appropriate to provide a basis for my opinion.
Key Audit Matters
Key audit matters are those matters that, in my professional judgment, were of most significance in my audit of the consolidated financial statements of the current period. These matters were addressed in the context of my audit of the consolidated financial statements as a whole, and in forming my opinion thereon, and I do not provide a separate opinion on these matters.
Key audit matter | How the matter was addressed in the audit |
Asset retirement obligations | |
As mentioned in Note 15 Environmental liability and asset retirement obligations of the government's consolidated financial statements, these obligations amounted to $4,658 million as at March 31, 2024, and mainly concern the future removal of asbestos from government buildings. The government made several assumptions and exercised a significant degree of judgment in determining the discount and indexation rates, the cost of asset retirement activities, and the timetable for completing those activities. As a result, the amounts recorded in the consolidated financial statements may vary significantly over the coming years as these assumptions are revised in response to new information. It is due to the magnitude of the amount of obligations and the significant degree of judgment exercised by the government in setting the various assumptions that the valuation of asset retirement obligations is considered a key audit matter. | My approach to addressing this matter included the following procedures:
– the costs of asset retirement activities, – the timetable for completing those activities, – the discount rates, – the indexation rates for estimated costs;
I used the services of an engineering firm as well as valuation experts to assist me in my audit. |
Obligations relating to accrued benefits under the pension plans | |
As mentioned in Note 16 Assets and liabilities regarding pension plans and other employee future benefits of the government's consolidated financial statements, the obligations relating to accrued benefits under the pension plans amounted to $124,640 million as at March 31, 2024. Obligations relating to accrued benefits under the defined-benefit pension plans are recognized using the projected benefit method prorated on years of service and the most probable assumptions set by the government. The government has exercised a significant degree of judgment in determining the discount rates and making the assumptions required to estimate these amounts. As a result, the amounts recorded in the consolidated financial statements may vary significantly as these assumptions are realized or revised as new information becomes available.
| My approach to addressing this matter included the following procedures:
|
Key audit matter | How the matter was addressed in the audit |
It is due to the magnitude of the amount of obligations and the significant degree of judgment exercised by the government in setting the actuarial assumptions that the valuation of obligations relating to accrued benefits under the pension plans is considered a key audit matter. | I used the services of an actuarial consulting firm to assist me in my audit. |
Personal income tax | |
The government recognized an adjustment to its personal income tax revenues as at the date of the consolidated financial statements to account for revenue not collected and refunds not issued before the end of the year. These adjustments are recorded on the basis of estimates established according to transactions that took place after the end of the fiscal year. Moreover, the government recognizes the income taxes receivable at realizable value, that is, an amount equivalent to what the government expects to receive. These accounts receivable are then brought down to net recoverable value by means of an allowance for doubtful accounts. The realizable value of revenue is estimated based on the settlement rates of similar files in the past, while the allowance for doubtful accounts rate is calculated on the basis of a statistical sample of accounts receivable representative of the population as a whole. It is due to the magnitude of the amounts estimated and the significant degree of judgment exercised by the government in setting the assumptions that the establishment of these estimates is considered a key audit matter. Information on personal income tax is provided in the following notes:
| My approach to addressing this matter included the following procedures:
I used the services of a statistics expert to assist me in my audit. |
Other Information
Management is responsible for the other information. The other information comprises the information included in Volume 1 of the 2023-2024 Public Accounts, but does not include the consolidated financial statements and my auditor's report thereon.
My opinion on the consolidated financial statements does not cover the other information and I do not express any form of assurance conclusion thereon.
In connection with my audit of the consolidated financial statements, my responsibility is to read the other information and, in doing so, consider whether the other information is materially inconsistent with the consolidated financial statements or my knowledge obtained in the audit, or otherwise appears to be materially misstated.
I obtained Volume 1 of the 2023-2024 Public Accounts prior to the date of this auditor's report. If, based on the work I have performed, I conclude that there is a material misstatement of this other information, I am required to report that fact in this auditor's report. I have nothing to report in this regard.
Responsibilities of Management for the Consolidated Financial Statements
Management is responsible for the preparation and fair presentation of the consolidated financial statements in accordance with Canadian public sector accounting standards, and for such internal control as management determines is necessary to enable the preparation of consolidated financial statements that are free from material misstatement, whether due to fraud or error.
In preparing the consolidated financial statements, management is responsible for assessing the Government's ability to continue as a going concern, disclosing, as applicable, matters related to going concern and using the going concern basis of accounting. Management believes the Government has the ability to continue its operations.
Auditor's Responsibilities for the Audit of the Consolidated Financial Statements
My objectives are to obtain reasonable assurance about whether the consolidated financial statements as a whole are free from material misstatement, whether due to fraud or error, and to issue an auditor's report that includes my opinion. Reasonable assurance is a high level of assurance, but is not a guarantee that an audit conducted in accordance with Canadian generally accepted auditing standards will always detect a material misstatement when it exists. Misstatements can arise from fraud or error and are considered material if, individually or in the aggregate, they could reasonably be expected to influence the economic decisions of users taken on the basis of these consolidated financial statements.
As part of an audit in accordance with Canadian generally accepted auditing standards, I exercise professional judgment and maintain professional skepticism throughout the audit. I also:
Identify and assess the risks of material misstatement of the consolidated financial statements, whether due to fraud or error, design and perform audit procedures responsive to those risks, and obtain audit evidence that is sufficient and appropriate to provide a basis for my opinion. The risk of not detecting a material misstatement resulting from fraud is higher than for one resulting from error, as fraud may involve collusion, forgery, intentional omissions, misrepresentations, or the override of internal control.
Obtain an understanding of internal control relevant to the audit in order to design audit procedures that are appropriate in the circumstances, but not for the purpose of expressing an opinion on the effectiveness of the Government's internal control.
Evaluate the appropriateness of accounting policies used and the reasonableness of accounting estimates and related disclosures made by management.
Conclude on the appropriateness of management's use of the going concern basis of accounting and, based on the audit evidence obtained, whether a material uncertainty exists related to events or conditions that may cast significant doubt on the Government's ability to continue as a going concern. If I conclude that a material uncertainty exists, I am required to draw attention in my auditor's report to the related disclosures in the consolidated financial statements or, if such disclosures are inadequate, to modify my opinion. My conclusions are based on the audit evidence obtained up to the date of my auditor's report. However, future events or conditions may cause the Government to cease to continue as a going concern.
Evaluate the overall presentation, structure and content of the consolidated financial statements, including the disclosures, and whether the consolidated financial statements represent the underlying transactions and events in a manner that achieves fair presentation.
Obtain sufficient appropriate audit evidence regarding the financial information of the entities or activities within the Government to express an opinion on the consolidated financial statements. I am responsible for the direction, supervision and performance of the group audit. I remain solely responsible for my audit opinion.
I communicate with management regarding, among other matters, the planned scope and timing of the audit and significant audit findings, including any significant deficiencies in internal control that I identify during my audit.
I also provide management with a statement that I have complied with relevant ethical requirements regarding independence, and to communicate with them all relationships and other matters that may reasonably be thought to bear on my independence, and where applicable, related safeguards.
From the matters communicated with management, I determine those matters that were of most significance in the audit of the consolidated financial statements of the current period and are therefore the key audit matters. I describe these matters in my auditor's report unless law or regulation precludes public disclosure about the matter or when, in extremely rare circumstances, I determine that a matter should not be communicated in my report because the adverse consequences of doing so would reasonably be expected to outweigh the public interest benefits of such communication.
Report on Other Legal and Regulatory Requirements
As required by the Auditor General Act (CQLR, chapter V-5.01), I report that, in my opinion, the consolidated financial statements present fairly, in all material respects, the consolidated financial position of the Governement as at March 31, 2024, and the consolidated results of its operations and the changes in its consolidated financial position for the year then ended in accordance with the accounting policies of the Governement as stated in the notes to the consolidated financial statements.
As required by the Auditor General Act (CQLR, chapter V-5.01), I report that, in my opinion, after giving retroactive effect to the change in accounting policies for revenue and public private partnerships as explained in Note 3, these standards have been applied on a basis consistent with that of the preceding year.
Guylaine Leclerc, FCPA auditor
Auditor General of Québec
Québec, September 30, 2024
Consolidated statement of operations and accumulated operating deficit
FISCAL YEAR ENDED MARCH 31, 2024
(millions of dollars)
| 2024 | 2023 | |||||||||
| Notes | Budget | Actual results | Actual results | |||||||
| (Note 3) | (restated - Note 3) | |||||||||
| REVENUE | 4 | |||||||||
| Income and property taxes | 65 446 | 62 948 | 64 521 | |||||||
| Consumption taxes | 27 290 | 27 083 | 26 597 | |||||||
| Duties, permits and royalties | 5 739 | 5 888 | 5 784 | |||||||
| Miscellaneous revenue | 12 707 | 13 505 | 11 984 | |||||||
| Revenue from government enterprises | 10 | 6 807 | 5 241 | 6 620 | ||||||
| Own-source revenue | 117 989 | 114 665 | 115 506 | |||||||
| Federal government transfers | 29 742 | 30 876 | 28 737 | |||||||
| Total revenue | 147 731 | 145 541 | 144 243 | |||||||
| EXPENDITURE | 5 | |||||||||
| Santé et Services sociaux | 59 015 | 61 000 | 59 341 | |||||||
| Éducation | 20 335 | 20 058 | 19 511 | |||||||
| Enseignement supérieur | 10 480 | 10 476 | 9 655 | |||||||
| Famille | 8 210 | 8 917 | 7 835 | |||||||
| Transports et Mobilité durable | 6 957 | 6 700 | 6 400 | |||||||
| Emploi et Solidarité sociale | 5 322 | 5 728 | 8 983 | |||||||
| Affaires municipales et Habitation | 4 546 | 4 914 | 4 936 | |||||||
| Économie, Innovation et Énergie | 3 680 | 3 830 | 3 280 | |||||||
| Environnement, Lutte contre les changements climatiques, Faune et Parcs | 2 283 | 2 431 | 1 673 | |||||||
| Other portfolios | 17 564 | 17 499 | 15 533 | |||||||
| Portfolio expenditure | 138 392 | 141 553 | 137 147 | |||||||
| Debt service | 9 464 | 9 982 | 10 222 | |||||||
| Total expenditure | 147 856 | 151 535 | 147 369 | |||||||
| Provision for contingencies | 1 500 | ― | ― | |||||||
| ANNUAL OPERATING DEFICIT | (1 625 | ) | (5 994 | ) | (3 126 | ) | ||||
| ACCUMULATED OPERATING DEFICIT | ||||||||||
| PREVIOUSLY ESTABLISHED OPENING BALANCE | (117 528 | ) | (114 526 | ) | ||||||
| Accounting changes | 3 | (57 | ) | 67 | ||||||
| RESTATED OPENING BALANCE | (117 585 | ) | (114 459 | ) | ||||||
| CLOSING BALANCE | (123 579 | ) | (117 585 | ) | ||||||
The notes to the financial statements and the appendices are an integral part of the consolidated financial statements.
Consolidated statement of financial position
AS AT MARCH 31, 2024
(millions of dollars)
| Notes | 2024 | 2023 | |||||||
| (restated - Note 3) | |||||||||
| FINANCIAL ASSETS | |||||||||
| Cash and cash equivalents | 7 | 14 981 | 9 981 | ||||||
| Accounts receivable | 8 | 32 912 | 25 112 | ||||||
| Investments | 9 | 11 368 | 7 804 | ||||||
| Investment in government enterprises | 10 | 38 555 | 36 815 | ||||||
| Loans | 11 | 6 872 | 5 875 | ||||||
| Generations Fund | 12 | 18 458 | 18 911 | ||||||
| Sinking funds relating to borrowings | 18 | 21 748 | 18 249 | ||||||
| Assets related to derivative financial instruments | 17 | 10 049 | 11 209 | ||||||
| Assets regarding other employee future benefits | 16 | 423 | 452 | ||||||
| Other financial assets | 314 | 199 | |||||||
| Total financial assets | 155 680 | 134 607 | |||||||
| LIABILITIES | |||||||||
| Accounts payable, accrued expenses and other allowances | 13 | 57 709 | 51 716 | ||||||
| Deferred revenue | 14 | 8 437 | 8 306 | ||||||
| Environmental liability and asset retirement obligations | 15 | 8 002 | 8 094 | ||||||
| Liabilities regarding pension plans and other employee future benefits | 16 | 4 043 | 7 237 | ||||||
| Liabilities related to derivative financial instruments | 17 | 9 911 | 10 684 | ||||||
| Debts | 18 | 287 594 | 257 390 | ||||||
| Total liabilities | 375 696 | 343 427 | |||||||
| NET DEBT | (220 016 | ) | (208 820 | ) | |||||
| NON-FINANCIAL ASSETS | |||||||||
| Fixed assets | 19 | 100 088 | 91 850 | ||||||
| Other non-financial assets | 1 623 | 2 034 | |||||||
| Total non-financial assets | 101 711 | 93 884 | |||||||
| ACCUMULATED DEFICIT | (118 305 | ) | (114 936 | ) | |||||
| Accumulated operating deficit | (123 579 | ) | (117 585 | ) | |||||
| Accumulated remeasurement gains | 5 274 | 2 649 | |||||||
| (118 305 | ) | (114 936 | ) | ||||||
| Contractual obligations and contractual rights | 20 | ||||||||
| Contingencies | 21 |
The notes to the financial statements and the appendices are an integral part of the consolidated financial statements.
Consolidated statement of change in net debt
FISCAL YEAR ENDED MARCH 31, 2024
(millions of dollars)
FISCAL YEAR ENDED MARCH 31, 2024 (millions of dollars)
| 2024 | 2023 | |||||||||
| Notes | Budget (1) | Actual results | Actual results | |||||||
| (restated - Note 3) | ||||||||||
| Annual operating deficit | (1 625 | ) | (5 994 | ) | (3126 | ) | ||||
| Change due to fixed assets | 19 | |||||||||
| Acquisition and work in progress | (10 731 | ) | (13 945 | ) | (11 869 | ) | ||||
| Depreciation | 4 757 | 5 108 | 4 888 | |||||||
| Disposals, reductions in value and other | 599 | 486 | ||||||||
| (5 974 | ) | (8 238 | ) | (6 495 | ) | |||||
| Change due to other non-financial assets | 411 | 498 | ||||||||
| Other comprehensive income items of government enterprises | 10 | 1 852 | 947 | |||||||
| Net remeasurement gains (losses) | 773 | (3 150 | ) | |||||||
| Increase in the net debt | (7 599 | ) | (11 196 | ) | (11 326 | ) | ||||
| NET DEBT | ||||||||||
| PREVIOUSLY ESTABLISHED OPENING BALANCE | (206 845 | ) | (208 712 | ) | (197 505 | ) | ||||
| Accounting changes | 3 | (108 | ) | 11 | ||||||
| RESTATED OPENING BALANCE | (206 845 | ) | (208 820 | ) | (197 494 | ) | ||||
| CLOSING BALANCE | (214 444 | ) | (220 016 | ) | (208 820 | ) | ||||
The notes to the financial statements and the appendices are an integral part of the consolidated financial statements.
(1) According to data presented in Budget 2023-2024 of the Ministère des Finances tabled on March 21, 2023.
Consolidated statement of remeasurement gains and losses
FISCAL YEAR ENDED MARCH 31, 2024
(millions of dollars)
(millions of dollars)
| Notes | 2024 | 2023 | |||||||||||||
| Financial | Government | ||||||||||||||
| instruments | enterprises (1) | Total | Total | ||||||||||||
| ACCUMULATED REMEASUREMENT GAINS (LOSSES), BEGINNING OF YEAR | (3 855 | ) | 6 504 | 2 649 | 4 852 | ||||||||||
| Unrealized gains (losses) | |||||||||||||||
| Foreign exchange | (108 | ) | (108 | ) | (3 723 | ) | |||||||||
| Derivative financial instruments(2) | 864 | 864 | 650 | ||||||||||||
| Investments at fair value | (82 | ) | (82 | ) | (76 | ) | |||||||||
| 674 | 674 | (3 149 | ) | ||||||||||||
| Amounts reclassified to consolidated statement of operations | |||||||||||||||
| Foreign exchange | 227 | 227 | 485 | ||||||||||||
| Deriative financial instruments(3) | (134 | ) | (134 | ) | (508 | ) | |||||||||
| Investments at fair value | 6 | 6 | 22 | ||||||||||||
| 99 | 99 | (1 | ) | ||||||||||||
| Other comprehensive income items of government enterprises | 10 | ||||||||||||||
| Employee future benefits | 1 629 | 1 629 | (558 | ) | |||||||||||
| Financial instruments | 215 | 215 | 1 418 | ||||||||||||
| Other | 8 | 8 | 87 | ||||||||||||
| 1 852 | 1 852 | 947 | |||||||||||||
| Net remeasurement gains (losses) | 773 | 1 852 | 2 625 | (2 203 | ) | ||||||||||
| ACCUMULATED REMEASUREMENT GAINS (LOSSES), END OF YEAR | (3 082 | ) | 8 356 | 5 274 | 2 649 | ||||||||||
The notes to the financial statements and the appendices are an integral part of the consolidated financial statements.
(1) The composition of the accumulated remeasurement gains of government enterprises is presented in NOTE 10.
(2) Net unrealized gains of $864M ($650M in 2022-2023) consist of $43M in foreign exchange gains ($3 761M in 2022-2023) and $821M in fair value gains ($3 111M in fair value losses in 2022-2023).
(3) The amounts reclassified in income of $134M ($508M in 2022-2023) consist of $181M in foreign exchange gains ($512M in 2022-2023) and $47M in fair value losses ($4M in 2022-2023).
Consolidated statement of cash flow
FISCAL YEAR ENDED MARCH 31, 2024
(millions of dollars)
| Notes | 2024 | 2023 | |||||||
| (restated - Note 3) | |||||||||
| OPERATING ACTIVITIES | |||||||||
| Annual operating deficit | (5 994 | ) | (3 126 | ) | |||||
| Items not affecting cash flow | 22 | 6 031 | 5 981 | ||||||
| Change in assets and liabilities related to operations | 22 | 2 785 | 24 | ||||||
| Benefits paid for pension plans and other employee future benefits | (7 887 | ) | (7 629 | ) | |||||
| Cash flow used for operating activities | (5 065 | ) | (4 750 | ) | |||||
| INVESTMENT ACTIVITIES | |||||||||
| Investments made | (6 720 | ) | (6 833 | ) | |||||
| Investments received | 1 557 | 3 782 | |||||||
| Loans made | (2 251 | ) | (1 478 | ) | |||||
| Loans received | 925 | 661 | |||||||
| Government enterprises | |||||||||
| Equity related operations | (121 | ) | (163 | ) | |||||
| Loans and advances made | (3 967 | ) | (1 847 | ) | |||||
| Loans and advances received | 3 936 | 1 105 | |||||||
| Dividends received | 5 747 | 6 364 | |||||||
| Investments in the Generations Fund | (1 501 | ) | (2 802 | ) | |||||
| Withdrawals from the Generations Fund | 2 500 | ||||||||
| Cash flow from (used for) investment activities | 105 | (1 211 | ) | ||||||
| FIXED ASSET INVESTMENT ACTIVITIES | |||||||||
| Fixed assets acquired and work in progress | (13 649 | ) | (11 502 | ) | |||||
| Fixed assets disposed of | 31 | 57 | |||||||
| Cash flow used for fixed assets investment activities | (13 618 | ) | (11 445 | ) | |||||
| FINANCING ACTIVITIES | |||||||||
| Debt issued | 36 338 | 28 861 | |||||||
| Debt repaid | (12 956 | ) | (11 073 | ) | |||||
| Investments in sinking funds relating to borrowings | (4 939 | ) | (4 237 | ) | |||||
| Withdrawals from sinking funds relating to borrowings | 4 824 | 3 591 | |||||||
| Pension plans and other employee future benefits funds | 311 | 278 | |||||||
| Cash flow from financing activities | 23 578 | 17 420 | |||||||
| Increase in cash and cash equivalents | 5 000 | 14 | |||||||
| CASH AND CASH EQUIVALENTS, BEGINNING OF YEAR | 9 981 | 9 967 | |||||||
| CASH AND CASH EQUIVALENTS, END OF YEAR | 14 981 | 9 981 |
The notes to the financial statements and the appendices are an integral part of the consolidated financial statements.
Notes to the consolidated financial statements
▌ 1. Summary of significant accounting policies
Accounting framework
The Gouvernement du Québec accounts for its financial transactions in accordance with the accounting policies adopted by the Conseil du trésor. The primary source of reference for establishing these policies are the Canadian public sector accounting standards.
Reporting entity
The government's reporting entity encompasses the financial transactions of the National Assembly and persons appointed by the National Assembly, departments and all the bodies, funds and enterprises under the government's control, that is, entities for which the government has the power to direct their financial and administrative policies, such that their activities will provide the government with anticipated benefits or expose it to a risk of loss.
All of the entities in the government's reporting entity over which the government exercises control are listed in APPENDIX 1. Property held and fiduciary activities carried out by government departments and bodies on behalf of the designated beneficiaries mentioned in APPENDIX 3 are not included in the government's reporting entity.
Consolidation methods
The assets, liabilities, revenues and expenditures of entities included in the government's reporting entity, with the exception of government enterprises, are consolidated line by line in the financial statements. Prior to consolidation, the accounts of each entity are harmonized according to the government's accounting policies. Inter-entity transactions and balances as well as unrealized gains and losses relating to transactions on assets and liabilities that remain within the government's reporting entity are eliminated.
Investments in government enterprises
Investments in government enterprises represent a financial asset for the government and, given their commercial orientation, management autonomy and financial self-sufficiency, they are accounted for using the modified equity method.
According to this method, which does not require that accounting policies be harmonized with those of the government, investments and interests are accounted for at cost. Every year, the cost is adjusted based on the government's share in the results of these enterprises, the counterpart being recognized in income. Cost is also adjusted based on the government's share of other comprehensive income items, with an offsetting entry in accumulated remeasurement gains and losses. The value of the investments is reduced by declared dividends and adjusted by the amount of the elimination of unrealized inter-entity gains and losses pertaining to assets and liabilities that remain within the government's reporting entity.
1. Summary of significant accounting policies (cont'd)
Translation of foreign currency
On the date a foreign currency transaction is entered into, all assets, liabilities and amounts reported in the statement of operations are translated into Canadian dollars at the exchange rate prevailing on that date. At the end of the fiscal year, monetary assets and liabilities denominated in foreign currencies are translated into Canadian dollars at the exchange rate in effect at that date. For certain designated financial instruments, foreign exchange gains and losses are recognized directly to results, and not through the statement of remeasurement gains and losses.
Remeasurement gains and losses
Unrealized gains and losses attributable to financial instruments recognized at fair value and due to changes in foreign exchange rates are presented in consolidated statement of remeasurement gains and losses until the settlement date of the financial instrument. At that date, the accumulated balance of remeasurement gains and losses relating to these instruments is reclassified to results.
Government enterprises recognize some unrealized gains or losses on financial instruments and the actuarial gains or losses on future benefits among the other items of comprehensive income, in accordance with International Financial Reporting Standards (IFRS). Those other items are not included in the government's results and are recognized in the accumulated remeasurement gains (losses). When these gains or losses on financial instruments are realized, they will be reclassified in revenue from government enterprises and recognized as such in the government's result. Gains and losses on future benefits will never be reclassified among the government's operating results.
Measurement uncertainties
Measurement uncertainty exists when there is a difference between the amount recognized or disclosed in the consolidated financial statements and another reasonably possible amount. Some uncertainties are called "material" when the range of reasonably possible amounts is wide and when the situation could influence decisions made by the users of the consolidated financial statements. The impact of the resolution of the uncertainties may be felt in the short term or in a longer term.
The government has determined that material measurement uncertainty in the short term was attributable to the assumptions used to determine the allowances for contingencies (NOTE 21) pertaining to lawsuits and disputes. Investment in government enterprises (NOTE 10), environmental liability and asset retirement obligations (NOTE 15), and pension plans obligations (NOTE 16) present a long-term material measurement uncertainty due to the assumptions used to determine their value.
1. Summary of significant accounting policies (cont'd)
Other measurement uncertainties are attributable to the estimates made in the course of the government's regular operations. New events, experience acquired or the information available to the government may lead to short-term revision of the allowances for doubtful accounts in accounts receivable (NOTE 8), tax revenue and the corresponding receivable and payable amounts (NOTES 8 and 13), long-term declines in investments (NOTE 9), the fair value of derivative financial instruments (NOTE 17), allowances for loan declines (NOTE 11), grants to be paid at the rate of repayment of the loans contracted by the recipients (NOTE 13), transfer revenue from the federal government receivable or deferred (NOTES 8 and 14), and provisions for losses on guaranteed financial initiatives (NOTE 13).
Moreover, the useful life of fixed assets is estimated based on the period during which they should be of use to the government. The length of some contracts presented in the contractual obligations and contractual rights is also estimated.
The estimates and assumptions the government uses to recognize or disclose some items in the consolidated financial statements are based on the most reliable data and the most likely assumptions available, and require the application of professional judgment.
It is reasonably possible that the amounts will change after the annual revision of the estimates and assumptions. Accounting estimates are revised during the estimate revision period if they concern only that period, or during that revision period and the next ones if they concern several periods. Further information about the nature and circumstances giving rise to measurement uncertainty is disclosed in the appropriate Notes.
1. Summary of significant accounting policies (cont'd)
Significant accounting policies by component
To increase the consolidated financial statements' understandability, significant accounting policies by component are detailed in the following accompanying notes:
Notes | Components |
NOTE 4 | Revenue |
NOTE 5 | Expenditure |
NOTE 6 | Financial instruments and risks |
NOTE 7 | Cash and cash equivalents |
NOTE 8 | Accounts receivable |
NOTE 9 | Investments |
NOTE 10 | Investments in government enterprises |
NOTE 11 | Loans |
NOTE 12 | Generations Fund |
NOTE 13 | Accounts payable, accrued expenses and other allowances |
NOTE 14 | Deferred revenue |
NOTE 15 | Environmental liability and asset retirement obligations |
NOTE 16 | Assets and liabilities regarding pension plans and other employee future benefits |
NOTE 17 | Assets and liabilities related to derivative financial instruments |
NOTE 18 | Debts |
NOTE 19 | Fixed assets |
NOTE 20 | Contractual obligations and contractual rights |
NOTE 21 | Contingencies |
▌ 2. Compliance with legislative authorizations
The government must be authorized by Parliament to draw money from the Consolidated Revenue Fund. Parliament grants this authorization by annually passing laws on appropriations or by adopting specific laws authorizing appropriations, which authorize departments and budget-funded bodies to make expenditures, capital acquisitions, loans, and investments, and bear other costs out of the general fund. For special funds, the annual expenditure and investment forecasts are approved by Parliament in the context of the adoption of appropriation acts or special acts, in particular when a special fund is established.
In accordance with section 86 of the Financial Administration Act (CQLR, chapter A-6.001), Volume 2 of the public accounts reports on the annual use of legislative authorizations for investments and expenditures for each of the departmental portfolios and special funds.
For the fiscal year ended March 31, 2024, no surpluses of expenditures and other costs over annual appropriations were recognized. Surpluses, corresponding respectively to $1 190 million and $652 million of expenditures and investments of special funds over approved amounts were recognized.
▌ 3. Accounting changes and reclassifications
Adoption of new accounting standards
Revenue
On April 1, 2023, the government retroactively applied accounting standard SP 3400, Revenue. This standard provides indications concerning revenue accounting, the evaluation, and the presentation of revenues that are not treated by another accounting standard. The government revenues concerned are those from duties, permits and royalties as well as certain miscellaneous revenue.
Under the standard, the revenues in respect of which the government has a performance obligation are recorded as soon as the obligation is fulfilled, i.e., at a given time or gradually. The government has a performance obligation when it must provide a service or specific good in exchange for the amount received from an individual or a business. Revenues from duties, permits and royalties as well as certain miscellaneous revenue that do not entail a performance obligation are recognized when the government is empowered to demand or levy them in pursuance of a past event.
In application of this standard, revenues from duties stemming from the issuance of registration certificates and drivers' licences are no longer recorded on the duration of their validity but when the benefits associated with the duties are transferred to the individual or to the business. Such benefits are transferred at the time of the first of the two following events: (a) the individual or the business has confirmed its decision to renew the duty by paying it; or (b) the duties came into force. Moreover, the government records a reserve for the future reimbursement of duties and permits that it is expecting.
3. Accounting changes and reclassifications (cont'd)
Public Private Partnerships
On April 1, 2023, the government retroactively applied accounting standard SP 3160, Public Private Partnerships. This standard provides indications concerning the recognition, measurement, and presentation of infrastructure acquired by the government in the form of a public private partnership (PPP). In particular, it identifies what constitutes an infrastructure asset completed under a PPP and specifies that assets and liabilities must be recognized when the public sector entity obtains control of such infrastructure. PPP were previously recognized in the government's consolidated financial statements pursuant to indications of other existing standards, especially those stipulated in guideline PSG-2 - Leased Tangible Capital Assets.
In application of this standard, the recognition of financial liabilities has been reviewed in order to use the implicit rate of each PPP instead of the average government borrowing rate. Since the rates are higher, the revision has reduced the portion of the capital reimbursed on the debts of the PPP agreements and increased the debt service and, consequently, the accumulated deficit.
Purchased Intangibles
On April 1, 2023, the government prospectively applied guideline PSG-8 - Purchased Intangibles. The guideline stipulates that the intangibles purchased must from now on be recognized as assets rather than expenditures. Intangibles exclude software, which is recorded as capital property in keeping with existing standards.
The adoption of this guideline has not had any impact on the consolidated financial statements.
3. Accounting changes and reclassifications (cont'd)
Accounting restatement
Asset retirement obligations
The government applied the standard governing asset retirement obligations (ARO) for the first time in 2022-2023, in a modified retroactive manner. The 2022-2023 liabilities were modified to consider the asset retirement obligations that were omitted, and to correct certain parameters used for the evaluation. The changes were recorded retroactively with the restatement of previous fiscal years.
Impacts of applying accounting changes
These accounting changes have resulted in changes in the following components of the consolidated financial statements:
| Fiscal year ended March 31, 2023 | ||||||||||||
| Revenue | PPP | ARO | Total | |||||||||
| CONSOLIDATED STATEMENT OF OPERATIONS AND ACCUMULATED OPERATING DEFICIT | ||||||||||||
| (millions of dollars) | ||||||||||||
| (Decrease) in own-source revenue | (56 | ) | ― | ― | (56 | ) | ||||||
| (Decrease) increase in portfolio expenditure | ― | (131 | ) | 35 | (96 | ) | ||||||
| Increase in debt service | 164 | 164 | ||||||||||
| Increase in expenditure | ― | 33 | 35 | 68 | ||||||||
| Increase in annual operating deficit | 56 | 33 | 35 | 124 | ||||||||
| (Decrease) increase in opening accumulated operating deficit | (804 | ) | 246 | 491 | (67 | ) | ||||||
| Increase (decrease) in closing accumulated operating deficit | (748 | ) | 279 | 526 | 57 | |||||||
3. Accounting changes and reclassifications (cont'd)
| Fiscal year ended March 31, 2023 | ||||||||||||
| Revenue | PPP (1) | ARO | Total | |||||||||
| CONSOLIDATED STATEMENT OF FINANCIAL POSITION | ||||||||||||
| (millions of dollars) | ||||||||||||
| (Decrease) in financial assets | ||||||||||||
| Accounts receivable | (2 | ) | (2 | ) | ||||||||
| Increase (decrease) in liabilities | ||||||||||||
| Accounts payable, accrued expenses and other allowances | 95 | 95 | ||||||||||
| Deferred revenue | (845 | ) | (845 | ) | ||||||||
| Environmental liability and asset retirement obligations | 577 | 577 | ||||||||||
| Debts | 279 | 279 | ||||||||||
| Increase (decrease) in liabilities | (750 | ) | 279 | 577 | 106 | |||||||
| Increase (decrease) in net debt | (748 | ) | 279 | 577 | 108 | |||||||
| Increase in fixed assets and in non-financial assets | ― | ― | 51 | 51 | ||||||||
| Increase (decrease) in accumulated deficit | (748 | ) | 279 | 526 | 57 | |||||||
| CONSOLIDATED STATEMENT OF CHANGE IN NET DEBT | ||||||||||||
| (millions of dollars) | ||||||||||||
| Increase in annual operating deficit | 56 | 33 | 35 | 124 | ||||||||
| (Decrease) in change due to fixed assets | (5 | ) | (5 | ) | ||||||||
| (Decrease) increase in opening net debt | (804 | ) | 246 | 547 | (11 | ) | ||||||
| Increase (decrease) in closing net debt | (748 | ) | 279 | 577 | 108 | |||||||
(1) The application of this standard has led to the recognition as capital leases of the agreements of residential and long-term care centres (CHSLD) that were previously recognized as public private partnership agreements. The changes have not affected the book value of the capital assets (cost of $103M, accumulated depreciation of $45M, and net book value of $58M) and the debts (book value of $70M).
3. Accounting changes and reclassifications (cont'd)
Reclassification of budget forecasts
Budget forecasts for activities supporting the integration and francization of immigrants have been reclassified to ensure comparability with actual expenditures as at March 31, 2024.
Reconciliation of forecasts between the 2023-2024 budget and the consolidated financial statements
(millions of dollars)
| Budget after | |||||||||
| Budget (1) | Reclassifications | reclassifications | |||||||
| EXPENDITURE | |||||||||
| Éducation | 20 203 | 132 | 20 335 | ||||||
| Emploi et Solidarité sociale | 5 250 | 72 | 5 322 | ||||||
| Other portfolios | 17 768 | (204 | ) | 17 564 | |||||
| Total | 43 221 | ― | 43 221 | ||||||
(1) According to data presented in Budget 2023-2024 of the Ministère des finances tabled on March 21, 2023.
Reclassification of comparative financial data
Certain 2022-2023 financial data have been reclassified to comply with the 2023-2024 presentation method.
▌ 4. Revenue
Significant accounting policies |
Tax revenue (income and property taxes and consumption taxes) Once the tax measures have been authorized by Parliament, tax revenue is recognized in the following manner:
Tax revenue does not take into account estimates concerning taxes due on unreported revenue within the time prescribed. These amounts are recognized when notices of assessments are issued or following tax check activities or after the filing of tax returns by taxpayers. Duties, permits, royalties and miscellaneous revenue Revenues from duties, permits and royalties as well as miscellaneous revenue in respect of which the government has a performance obligation are recorded as soon as the obligation is fulfilled, i.e., at a given time or gradually. The government has a performance obligation when it must provide a service or specific good in exchange for the amount received from an individual or a business. More specifically:
– the individual or the business has confirmed its decision to renew the fee by paying it, or – the fees came into force;
|
4. Revenue (cont'd)
Significant accounting policies (cont'd) |
Revenues from rights, permits, and fees as well as miscellaneous revenue that do not entail a performance obligation are recognized when the government is empowered to demand or levy them in pursuance of a past event. More specifically:
Income from interest on accounts receivable and loans as well as income from portfolio investments are recognized as they are earned. They cease to be recognized when the recovery of interest or principal is not reasonably assured. Revenue from donors other than governments is recognized in the year of its donation when such revenue is not designated for a specific purpose. When, on the contrary, such revenue is designated for a specific purpose, it is recognized in revenue according to the conditions of the designation. In the case of donations related to land, the revenue is recognized in the year of acquisition. Transfers from governments Transfers from the federal government and other governments are recognized in revenue for the fiscal year in which they are authorized by the transferring government and in which the eligibility criteria are met, except if the stipulations create an obligation that meets the definition of a liability. In such situations, the transfer is recognized in revenue as the liabilitiy is paid. |
Measurement uncertainties |
The measurement uncertainties that affect revenue are presented in NOTE 8 on accounts receivable, NOTE 13 on accounts payable, accrued expenses and other allowances related to income taxes and other taxes refundable and NOTE 14 on deferred revenue. |
4. Revenue (cont'd)
Revenue by source
(millions of dollars)
| Fiscal year ended March 31 | ||||||
| 2024 | 2023 | |||||
| (restated - Note 3) | ||||||
| Own-source revenue | ||||||
| Income and property taxes | ||||||
| Personal income tax | 41 863 | 42 251 | ||||
| Contributions for health services | 8 533 | 7 914 | ||||
| Corporate taxes | 11 402 | 13 243 | ||||
| School property tax | 1 150 | 1 113 | ||||
| 62 948 | 64 521 | |||||
| Consumption taxes | ||||||
| Sales(1) | 23 306 | 22 909 | ||||
| Fuel | 2 157 | 2 157 | ||||
| Tobacco | 912 | 817 | ||||
| Alcoholic beverages | 618 | 635 | ||||
| Other | 90 | 79 | ||||
| 27 083 | 26 597 | |||||
| Duties, permits and royalties | ||||||
| Motor vehicles | 1 744 | 1 616 | ||||
| Natural resources | 1 594 | 2 006 | ||||
| Greenhouse gas emissions | 1 549 | 1 267 | ||||
| Other | 1 001 | 895 | ||||
| 5 888 | 5 784 | |||||
| Miscellaneous revenue | ||||||
| Sales of goods and services | 6 354 | 6 242 | ||||
| User contributions from the health and social services network | 1 667 | 1 513 | ||||
| Income on accounts receivable and loans | 1 784 | 1 052 | ||||
| Income on investments | 829 | 525 | ||||
| Fines, forfeitures and recoveries | 1 232 | 1 228 | ||||
| Third-party donations | 1 004 | 904 | ||||
| Tuition fees | 543 | 451 | ||||
| Transfers from entities other than the federal government | 92 | 69 | ||||
| 13 505 | 11 984 | |||||
| Revenue from government enterprises | ||||||
| Hydro-Québec | 2 027 | 3 665 | ||||
| Société des alcools du Québec | 1 428 | 1 427 | ||||
| Loto-Québec | 1 508 | 1 597 | ||||
| Investissement Québec | 121 | (226 | ) | |||
| Other | 157 | 157 | ||||
| 5 241 | 6 620 | |||||
| Total own-source revenue | 114 665 | 115 506 | ||||
| Federal government transfers | ||||||
| Equalization | 14 037 | 13 666 | ||||
| Health transfers | 8 714 | 7 082 | ||||
| Transfers for post-secondary education and other social programs | 1 451 | 1 294 | ||||
| Other programs | 6 674 | 6 695 | ||||
| Total federal government transfers | 30 876 | 28 737 | ||||
| Total revenue | 145 541 | 144 243 | ||||
(1) The solidarity tax credit, worth $1 800M ($1 650M in 2022-2023), is an abatement since it is designed to refund certain taxes to low-income households. It is presented as a reduction of consumption tax revenue on sales.
4. Revenue (cont'd)
Income and property taxes - Additional information on refundable tax credits
In accordance with the applicable tax legislation, refundable tax credits reduce related tax revenue. However, Canadian public sector accounting standards require that these credits be presented in expenditure when they represent transfers funded by the tax system, that is, when they confer on a taxpayer a financial benefit other than a reduction of the income or other taxes that the taxpayer would otherwise have had to pay the government.
The refundable tax credits of $11 248 million ($13 115 million in 2022-2023) have been reclassified in transfer expenditures, meaning that revenue derived from income and property taxes amount to $62 948 million ($64 521 million in 2022-2023).
Income and property taxes - Reclassification of refundable tax credits
(millions of dollars)
| Fiscal year ended March 31 | ||||||||||||
| 2024 | 2023 | |||||||||||
| Tax revenue | ||||||||||||
| net of | ||||||||||||
| refundable | Refundable tax | |||||||||||
| tax credits | credits | Total | Total | |||||||||
| Income and property taxes | ||||||||||||
| Personal income tax | 33 922 | 7 941 | 41 863 | 42 251 | ||||||||
| Contributions for health services | 8 533 | 8 533 | 7 914 | |||||||||
| Corporate taxes | 8 095 | 3 307 | 11 402 | 13 243 | ||||||||
| School property tax | 1 150 | 1 150 | 1 113 | |||||||||
| 51 700 | 11 248 | 62 948 | 64 521 | |||||||||
4. Revenue (cont'd)
Additional information - Tax-funded transfer expenditures by portfolios
(millions of dollars)
| Fiscal year ended March 31 | ||||||||||||||||||||||||
| 2024 | 2023 | |||||||||||||||||||||||
| Santé et | Emploi et | Économie, | Culture et | |||||||||||||||||||||
| Services | Solidarité | Innovation | Communi- | |||||||||||||||||||||
| sociaux | Famille | sociale | et Énergie | cations | Other | Total | Total | |||||||||||||||||
| Income and property taxes | ||||||||||||||||||||||||
| Personal income tax | ||||||||||||||||||||||||
| Refundable tax credits | ||||||||||||||||||||||||
| Family Allowance | 3 632 | 3 632 | 3 403 | |||||||||||||||||||||
| Senior assistance | 1 704 | 1 704 | 1 661 | |||||||||||||||||||||
| Childcare expenses | 995 | 995 | 936 | |||||||||||||||||||||
| Home-support services for seniors | 737 | 737 | 650 | |||||||||||||||||||||
| Work premium | 309 | 309 | 259 | |||||||||||||||||||||
| Caregivers | 203 | 203 | 187 | |||||||||||||||||||||
| Québec education savings incentive | 122 | 122 | 140 | |||||||||||||||||||||
| Increase in the cost of living | 69 | 69 | 3 440 | |||||||||||||||||||||
| Other | 88 | 33 | 49 | 170 | 148 | |||||||||||||||||||
| 2 732 | 4 627 | 411 | ― | ― | 171 | 7 941 | 10 824 | |||||||||||||||||
| Corporate taxes | ||||||||||||||||||||||||
| Refundable tax credits | ||||||||||||||||||||||||
| Film production | 834 | 834 | 463 | |||||||||||||||||||||
| Scientific research and experimental development | 563 | 563 | 386 | |||||||||||||||||||||
| Investments | 545 | 545 | 294 | |||||||||||||||||||||
| E-business development | 452 | 452 | 433 | |||||||||||||||||||||
| Multimedia titles | 412 | 412 | 334 | |||||||||||||||||||||
| Resources | 104 | 104 | 113 | |||||||||||||||||||||
| Other | 32 | 128 | 75 | 162 | 397 | 268 | ||||||||||||||||||
| ― | ― | 32 | 2 100 | 909 | 266 | 3 307 | 2 291 | |||||||||||||||||
| 2 732 | 4 627 | 443 | 2 100 | 909 | 437 | 11 248 | 13 115 | |||||||||||||||||
▌ 5. Expenditure
Significant accounting policies |
Transfer expenditures Transfer expenditures are recognized in the fiscal year during which they are duly authorized and in which the recipients satisfied the eligibility criteria. Remuneration and operating expenses Remuneration and operating expenses are recognized in the fiscal year during which the goods are consumed or the services are delivered. Debt service expenditure Interest on debt is recorded using the effective interest rate method. Interest on assets and liabilities related to derivative financial instruments are recorded when they are incurred. Interest on retirement plans and other future fringe benefits are established by the application of the discount rate for the obligation pertaining to the acquired benefits of each plan or program to the average value of the attendant obligation. |
Measurement uncertainties |
Measurement uncertainties that affect expenditures are presented in NOTE 8 on accounts receivable, NOTE 9 on investments, NOTE 11 on loans, NOTE 13 on accounts payable, accrued expenses and other allowances, NOTE 15 on environmental liability and asset retirement obligations, NOTE 16 on pension plans and other future benefits and NOTE 21 on contingencies. |
Expenditure by supercategories
(millions of dollars)
Expenditure by supercategories (millions of dollars)
| Fiscal year ended March 31 | ||||||
| 2024 | 2023 | |||||
| (restated - Note 3) | ||||||
| Portfolio expenditure | ||||||
| Transfers | 47 366 | 46 876 | ||||
| Remuneration | 64 506 | 62 396 | ||||
| Operating(1) | 28 534 | 27 151 | ||||
| Doubtful accounts and other allowances | 1 147 | 724 | ||||
| Sub-total | 141 553 | 137 147 | ||||
| Debt service | 9 982 | 10 222 | ||||
| Total expenditure | 151 535 | 147 369 | ||||
(1) Operating expenditure include equipment and procurement (for example, drugs and medical and surgical supplies), professional fees, private sector services to individuals in private long-term care centres, maintenance and repairs, transportation services, advertising and communication services, as well as depreciation of fixed assets (NOTE 19).
5. Expenditure (cont'd)
Debt service
(millions of dollars)
| Fiscal year ended March 31 | ||||||
| 2024 | 2023 | |||||
| (restated - Note 3) | ||||||
| Debts | 9 739 | 8 698 | ||||
| Interest on debts | ||||||
| Expenditure on assets and liabilities related to derivatives financial instruments | 3 409 | 1 629 | ||||
| Losses on investments of the sinking funds relating to borrowings | 863 | 1 964 | ||||
| Expenditure on cash equivalents and on investments | 43 | |||||
| 14 011 | 12 334 | |||||
| Revenue on assets and liabilities related to derivatives financial instruments | (2 232 | ) | (1 070 | ) | ||
| Revenue on investments of the sinking funds relating to borrowings | (1 093 | ) | (959 | ) | ||
| Revenue on cash equivalents and on investments | (832 | ) | (471 | ) | ||
| (4 157 | ) | (2 500 | ) | |||
| 9 854 | 9 834 | |||||
| Pension plans and other employee future benefits | ||||||
| Interest on obligations relating to accrued benefits | 7 950 | 7 650 | ||||
| Investment income of the Retirement Plans Sinking Fund, the specific pension funds and the other employee future benefits funds | (7 822 | ) | (7 262 | ) | ||
| 128 | 388 | |||||
| 9 982 | 10 222 | |||||
▌ 6. Financial instruments and risks
Significant accounting policies |
Classification and recognition of financial instruments On initial recognition, financial instruments are classified as either financial instruments recognized at cost or at amortized cost, or as financial instruments recognized at fair value. Financial instruments recognized at cost or at amortized cost After initial recognition, the government measures financial assets and liabilities at amortized cost, taking into account the following adjustments:
Cash and cash equivalents, accounts receivable,1 investments other than those made up of equity instruments quoted in an active market, loans, the Generations Fund, sinking funds relating to borrowings and sums receivable from counterparties included in assets related to derivative financial instruments are classified as financial assets recognized at cost or at amortized cost. Accounts payable, accrued expenses and other allowances,2 sums payable to counterparties included in derivative financial instrument liabilities, and debts are classified as liabilities at cost or at amortized cost. Financial instruments recognized at fair value Investments in equity instruments quoted in an active market, and assets and liabilities associated with derivative financial instruments, other than sums receivable from (payable to) counterparties, are classified as financial instruments recognized at fair value. Transaction costs Transaction costs relating to financial instruments recognized at fair value are recognized in expenses at the transaction date, while those relating to financial instruments recognized at cost or at amortized cost are added to their book value. |
______________________________________
1 Excluding income tax and taxes receivable and certain receivables stemming from the categories of duties, permits and royalties as well as miscellaneous revenues that are not financial instruments.
2 Excluding income taxes and other taxes refundable, accrued compensation benefits remuneration-related, advances from trust funds and clearing accounts for collected taxes that are not financial instruments.
6. Financial instruments and risks (cont'd)
Significant accounting policies (cont'd) |
Offsetting of financial instruments Treasury securities In the course of its operations, the government may repurchase its own debt securities on the financial markets without cancelling, extinguishing or discharging the corresponding debts. These securities constitute assets for the government, and the corresponding debts are offset in the consolidated statement of financial position. Interest income and expense relating to these shares and debts are also presented net in the consolidated statement of operations and accumulated operating deficit. Other offset financial assets and financial liabilities A financial asset and a financial liability are offset and the net balance presented in the consolidated statement of financial position only if the following conditions are met:
|
6. Financial instruments and risks (cont'd)
In the normal course of operations, the government is exposed to various types of risk, such as credit risk, liquidity risk and market risk. Control and management policies and procedures are in place to manage these risks and reduce their potential impact.
| Components of the consolidated financial statements | Significant risk exposure | Note | ||||
| Credit risk | Liquidity risk | Market risk | ||||
| Currency | Interest rate | Price | ||||
| Cash and cash equivalents | 7 | |||||
| Accounts receivable | 8 | |||||
| Investments | 9 | |||||
| Loans | 11 | |||||
| Generations Fund | 12 | |||||
| Accounts payable, accrued expenses and other allowances | 13 | |||||
| Assets related to derivative financial instruments | 17 | |||||
| Liabilities related to derivative financial instruments | 17 | |||||
| Debts | 18 | |||||
| Sinking funds relating to borrowings | 18 | |||||
6. Financial instruments and risks (cont'd)
Credit risk
Credit risk is the risk that the counterparty to a financial instrument will fail to meet an obligation and cause the government to incur a financial loss.
All financial instruments recognized as financial assets expose the government to credit risk, with the exception of investments in equity instruments.
At fiscal year-end, the government's maximum exposure to credit risk corresponds to the book value of financial assets which are financial instruments, without taking into account guarantees held or any other credit enhancements. The government is also exposed to credit risk associated with guarantees totalling $17 178 million ($16 950 million as per March 31, 2023) granted on financing initiatives, net of the allowance for losses on guaranteed financing initiatives (Note 13), as well as on loan pledges (Note 20).
Liquidity risk
Liquidity risk is the risk that the government will encounter difficulties in meeting its financial liabilities.
Schedule of undiscounted contractual cash flows
(millions of dollars)
| Maturing on March 31(1) | ||||||||||||||||||
| 2024 | 2023 | |||||||||||||||||
| Maturing on March 31(1) | ||||||||||||||||||
| 2026 and | 2028 and | 2030 and | ||||||||||||||||
| 2025 | 2027 | 2029 | thereafter | Total | Total | |||||||||||||
| Liabilities arising from transfers(2) | 9 703 | 2 273 | 1 408 | 5 147 | 18 531 | 16 398 | ||||||||||||
| Debts contracted on financial markets | 50 745 | 54 709 | 39 977 | 267 402 | 412 833 | 376 530 | ||||||||||||
| Debts arising from agreements and contracts | 438 | 873 | 874 | 7 319 | 9 504 | 6 961 | ||||||||||||
| Liabilities related to derivative financial instruments | 4 747 | 3 813 | 2 558 | 3 763 | 14 881 | 17 779 | ||||||||||||
| 65 633 | (3) | 61 668 | 44 817 | 283 631 | 455 749 | 417 668 | ||||||||||||
| Assets related to derivative financial instruments(4) | (6 557 | ) | (2 076 | ) | (850 | ) | (2 248 | ) | (11 731 | ) | (13 189 | ) | ||||||
| 59 076 | 59 592 | 43 967 | 281 383 | 444 018 | 404 479 | |||||||||||||
(1) Amounts shown include interest and amounts related to debt whose securities are held in treasury.
(2) With the exception of these liabilities, most accounts payable, accrued expenses and other allowances are due in the short term and settled in the following fiscal year.
(3) In addition to this amount, cash flows related to liabilities in the sinking funds relating to borrowings totalling $3 813M will be paid in fiscal 2024-2025.
(4) Such assets are closely linked to liabilities related to derivative financial instruments since the government uses them to manage risks related to debts contracted on the financial markets.
6. Financial instruments and risks (cont'd)
Overall liquidity risk management
To meet its financial requirements arising from its operations and investment activities, as well as those related to repayments of borrowings that are maturing, the government has provided itself with an annual financing and debt management program based on Canadian and international financial markets.
Day-to-day cash management is based on regularly updated cash forecasts and enables the government to manage the desynchronization of cash inflows and outflows. This liquidity management relies on various tools, such as short-term borrowing programs, credit facilities and sound management of cash and short-term investments.
In addition, the government has set up sinking funds relating to borrowings (Note 18) to provide for the repayment of debts contracted on financial markets, in accordance with the Financial Administration Act (CQLR, chapter A-6.001). The government makes annual contributions to these funds.
The government has also created the Generations Fund (Note 12), whose purpose is to reduce the government's debt. The government makes annual payments, which are deposited with the Caisse de dépôt et placement du Québec in accordance with the Act to reduce the debt and establish the Generations Fund (CQLR, chapter R 2.2.0.1). The government may withdraw sums to repay the debt.
Market risk
Market risk is the risk that the fair value or future cash flows of a financial instrument will fluctuate because of changes in market conditions. Market risk includes currency risk, interest rate risk and price risk. The government is exposed to all of these risks.
6. Financial instruments and risks (cont'd)
Currency risk
Currency risk is the risk that the fair value or future cash flows of a financial instrument will fluctuate because of changes in foreign exchange rates.
Exposure to currency risk
(millions of dollars)
| As at March 31 | |||||||||||||||
| 2024 | 2023 | ||||||||||||||
| Equivalent in Canadien dollars | |||||||||||||||
| Other | |||||||||||||||
| US dollars | Euros | currencies (1) | Total | Total | |||||||||||
| Sinking funds relating to borrowings(2) | 2 691 | 2 691 | 3 527 | ||||||||||||
| Assets and liabilities related to derivative financial instruments | 43 720 | 29 602 | 5 270 | 78 592 | 59 361 | ||||||||||
| Debts(2) | (43 464 | ) | (29 699 | ) | (5 268 | ) | (78 431 | ) | (62 693 | ) | |||||
| Net exposure | 2 947 | (97 | ) | 2 | 2 852 | 195 | |||||||||
(1) Other currencies include the Australian dollar, pound sterling, Swiss franc, yen, Swedish krona and New Zealand dollar.
(2) Amounts shown include treasury securities.
Overall currency risk management
The government uses derivative financial instruments to manage currency risk in order to approach the absence of exposure on currency debts.
During the fiscal year, the government modified its management strategy to focus solely on the use of derivative financial instruments. Previously, the acquisition of assets denominated in foreign currencies within the sinking funds linked to borrowings were an additional measure of the management strategy to manage currency debts.
However, in the context of the management of sinking funds relating to borrowings and in accordance with the investment policy, the government is investing in securities denominated in foreign currencies, which exposes it to fluctuating exchange rates on a small portion of its assets.
As at March 31, 2024, a 10% rise or fall in the Canadian dollar against the US dollar would have had an impact of nearly $300 million on the government's operating results (the impact was negligible as at March 31, 2023). For the other currencies, such a change would have had a negligible impact on the government's operating results.
6. Financial instruments and risks (cont'd)
Intetest rate risk
Interest rate risk is the risk that the fair value or future cash flows of a financial instrument will fluctuate because of changes in market interest rates.
Exposure to interest rate risk
(millions of dollars)
| As at March 31 | ||||||
| 2024 | 2023 | |||||
| Cash and cash equivalents | 15 118 | 9 981 | ||||
| Investments(1) | 4 080 | 282 | ||||
| Loans | 1 634 | 1 614 | ||||
| Generations Fund | 1 329 | 1 786 | ||||
| Sinking funds relating to borrowings(1) | 13 245 | 16 064 | ||||
| Assets and liabilities related to derivative financial instruments | (14 277 | ) | (22 218 | ) | ||
| Debts(1) | (42 281 | ) | (28540 | ) | ||
| Net exposure | (21 152 | ) | (21 031 | ) | ||
(1) Amounts shown include treasury securities.
Overall interest rate risk management
The government relies on several strategies to manage interest rate risk, including the use of derivative financial instruments. Moreover, investments in sinking funds related to borrowings exposed to the interest rate risk are contributing to reducing the exposure to such risk of financial liabilities.
As at March 31, 2024 and 2023, a 1% rise or fall in interest rates would have had an impact of nearly $200 million on the government's operating results.
Price risk
Price risk is the risk that the fair value or future cash flows of a financial instrument will fluctuate because of changes in market prices other than those arising from interest rate risk or currency risk, whether those changes are caused by factors specific to the individual instrument or its issuer, or by factors affecting all similar financial instruments traded in the market.
At fiscal year-end, the components of the consolidated financial statements with exposure to price risk are limited to investments in equity instruments quoted in an active market, with a book value of $458 million ($512 million as at March 31, 2023).
As at March 31, 2024 and 2023, a 10% rise or fall in stock market prices would have had a negligible impact on the government's operating results.
6. Financial instruments and risks (cont'd)
Among the financial instruments recognized at cost or at amortized cost, investments in equity instruments not quoted in an active market or in the form of participation deposits in a particular fund of the Caisse de dépôt et placement du Québec are not exposed to price risk. Although their fair value may fluctuate due to changes in market prices, they affect the government's consolidated financial statements only when they are disposed of, or in the event of an other-than-temporary decline in value.
▌ 7. Cash and cash equivalents
Significant accounting policy |
Cash and cash equivalents are comprised of cash and investments which are held for the purpose of meeting short-term cash commitments. These investments, highly liquid, are easily convertible into a known amount of cash and unlikely to change significantly in value. |
Cash and cash equivalents
(millions of dollars)
| As at March 31 | ||||||
| 2024 | 2023 | |||||
| Cash(1) | 5 681 | 4 555 | ||||
| Cash equivalents | 9 300 | 5 426 | ||||
| 14 981 | 9 981 | |||||
(1) Cash is shown net of a $949M ($970M as at March 31, 2023) bank overdraft arising from outstanding cheques.
Credit risk management
The credit risk associated with cash and cash equivalents is low. The government has adopted a management framework that limits the risks associated with its investments, including cash equivalents. This framework sets out criteria such as the minimum credit rating required for the selection of authorized issuers, that are mainly financial institutions and governments.
Interest rate risk management
Some cash equivalents bear interest. However, the interest rate risk associated with these transactions is limited, since the maturities of these securities are very short and the government may use derivative financial instruments, in accordance with its management policies.
▌ 8. Accounts receivable
Significant accounting policies |
Income taxes and other taxes receivable are recognized at realizable value, that is, an amount equivalent to what the government expects to receive. These accounts receivable are subsequently brought down to the net recoverable value by means of an allowance for doubtful accounts. Revenue from personal income tax, contributions for health services and consumption taxes uncollected at the end of the fiscal year are recognized as income taxes and other taxes receivable; the amounts are estimated based on the transactions carried out after the end of the fiscal year. Revenue from corporate taxes uncollected at the end of the fiscal year is recognized as taxes receivable; the amounts are based on notices of assessment issued before the end of the fiscal year. Other accounts receivable are recognized at cost or amortized cost. The annual change in the allowance for doubtful accounts is recognized as an expense. |
Measurement uncertainties |
Initial assessment of income taxes and other taxes receivable Income taxes and other taxes receivable stemming from notices of assessment issued after tax checks and contested taxpayer notices are based on estimates that may be hard to measure. The initial evaluation of the amounts the government expects to collect with regard to such notices is based on the settlement rates of similar files in the past. Adjustments resulting from new information obtained after checks or court rulings are recognized in the fiscal year when they become known. Estimate of allowances for doubtful accounts The allowance for doubtful accounts relating to taxes receivable is uncertain due to the fact that it is estimated on the basis of a statistical sample of accounts receivable representative of the population as a whole. The accounts receivable's potential recoverable amount in the sample is determined primarily by considering the financial position of taxpayers. The allowance for doubtful accounts relating to duties, permits and royalties as well as miscellaneous revenue is uncertain because it is estimated using statistical samples or evaluations of the credit risk of accounts receivable. Federal government transfers Transfers from the federal government receivable for cost-sharing programs to provide financial assistance to third parties are subject to measurement uncertainty due to possible discrepancies between the estimate of eligible expenditures made by third parties and the work actually performed. |
8. Accounts receivable (cont'd)
Details of accounts receivable
(millions of dollars)
| As at March 31 | ||||||
| 2024 | 2023 | |||||
| (restated - Note 3) | ||||||
| Income taxes and other taxes receivable | ||||||
| Income and property taxes | 10 995 | 11 114 | ||||
| Consumption taxes | 6 737 | 5 679 | ||||
| Allowance for doubtful accounts | (1 851 | ) | (1 754 | ) | ||
| 15 881 | 15 039 | |||||
| Duties, permits, royalties and miscellaneous revenue | ||||||
| Duties, permits and royalties | 680 | 583 | ||||
| Miscellaneous revenue | 7 012 | 6 367 | ||||
| Allowance for doubtful accounts | (1 096 | ) | (967 | ) | ||
| 6 596 | 5 983 | |||||
| Other | ||||||
| Revenue from government enterprises - dividends | 375 | 617 | ||||
| Federal government transfers | 4 424 | 3 473 | ||||
| Receivable cash concerning debts contracted on the financial markets | 5 636 | |||||
| 10 435 | 4 090 | |||||
| 32 912 | 25 112 | |||||
The government is exposed to credit risk arising from the inability of certain receivables to settle their obligations, which could result in a financial loss for the government.
Managing credit risk associated with tax receivables
The credit risk associated with tax receivables is low. On the one hand, amounts receivable totalling $17 732 million ($16 793 million as at March 31, 2023) were mainly received in the first months of fiscal 2024-2025. On the other hand, in order to reduce the credit risk associated with unreceived tax receivables, the government uses a legal offsetting mechanism before issuing a refund to a creditor. Moreover, it recognizes receivables at their net recoverable value through an allowance for doubtful accounts. In the government's opinion, the allowance of $1 851 million ($1 754 million as at March 31, 2023) is sufficient to consider credit risk.
8. Accounts receivable (cont'd)
Credit risk management associated with other receivables
The government is exposed to credit risk in respect of other receivables. To protect itself against this risk, the government has established control and management policies and procedures. These policies and procedures include provisions relating to credit risk assessment, acceptable risk levels, periodic monitoring and collection measures, and the assessment of the allowance for doubtful accounts. The government periodically assesses the practices in place and, if necessary, adjusts them based on the observations and results obtained.
Credit risk - Age of other accounts receivable
(millions of dollars)
| As at March 31, 2024 | |||||||||||||||
| Duties, permits | Miscellaneous | ||||||||||||||
| and royalties | revenue | Sub-total | Other | Total | |||||||||||
| Less than 1 month | 641 | 2 124 | 2 765 | 6 978 | 9 743 | ||||||||||
| 1 month to less than 3 months | 3 | 1 245 | 1 248 | 911 | 2 159 | ||||||||||
| 3 months to less than 12 months | 8 | 1 734 | 1 742 | 1 322 | 3 064 | ||||||||||
| 12 months and more | 28 | 1 909 | 1 937 | 1 224 | 3 161 | ||||||||||
| 680 | 7 012 | 7 692 | 10 435 | 18 127 | |||||||||||
| Allowance for doubtful accounts | (1 096 | ) | (1 096 | ) | |||||||||||
| 6 596 | 10 435 | 17 031 | |||||||||||||
The credit quality of other accounts receivable that are neither past due nor impaired is deemed adequate.
▌ 9. Investments
Significant accounting policies |
Investments are recognized at cost or amortized cost, with the exception of investments in equity instruments quoted on an active market, which are recognized at fair value. When investments have significant concessionary terms, that is, if there is a significant difference between their nominal value and their present value using the weighted average rate for government's debt, the investments are recognized at their present value when they take effect. This difference constitutes a grant component, which is recognized as a transfer expenditure. Subsequently, investment income is recognized and added to the book value of the investment until their maturity date, using the effective interest method. When an investment experiences a loss in value that is other than a temporary decline, its book value is reduced to reflect the decline in value. Any reduction in the book value of an investment recognized at cost or amortized cost is recognized as an expense and cannot be reversed. Where applicable, the subsequent recovery of a written-off investment is recognized in income. When the book value of an investment recognized at fair value has been reduced to reflect an other-than-temporary decline in value, the accumulated balance of unrealized losses recognized under remeasurement gains and losses is reclassified to results. |
Measurement uncertainty |
Investments in equity instruments in the form of shares and equity are subject to measurement uncertainty because assumptions are used to estimate their recoverable value. The factors the government relies on for determining whether there is a loss in value that is other than a temporary decline in these investments include their length and how sharply the fair value declined compared to cost. For investments in private equity instruments, the government estimates the recoverable value with the help of experts and approaches based on models that take into account current economic conditions, the financial situation and the profitability outlook for each issuing entity. |
9. Investments (cont'd)
Investments by nature of securities held by maturity at acquisition
(millions of dollars)
| As at March 31 | |||||||||||||||
| 2024 | 2023 | ||||||||||||||
| 3 to 12 | More than | ||||||||||||||
| months | 12 months | No maturity | Total | Total | |||||||||||
| Recorded at cost or at amortized cost | |||||||||||||||
| Equity instruments not quoted in an active market | 4 103 | 4 103 | 3 799 | ||||||||||||
| Treasury Bills(1),(2) | 2 666 | 2 666 | ― | ||||||||||||
| Participation deposits(3) | 2 372 | 2 372 | 2 191 | ||||||||||||
| Bonds(1),(2) | |||||||||||||||
| Municipalities and municipal bodies | 666 | 666 | 447 | ||||||||||||
| Federal and provincial governments | 169 | 169 | 449 | ||||||||||||
| Enterprises | 4 | 51 | 55 | 99 | |||||||||||
| Other | 1 | 1 | 2 | 3 | |||||||||||
| Deposit certificates | 448 | 26 | 474 | 90 | |||||||||||
| Other(2) | 293 | 110 | 403 | 214 | |||||||||||
| 3 411 | 1 023 | 6 476 | 10 910 | 7 292 | |||||||||||
| Recorded at fair value | |||||||||||||||
| Equity instruments quoted in an active market(4) | 458 | 458 | 512 | ||||||||||||
| 3 411 | 1 023 | 6 934 | 11 368 | 7 804 | |||||||||||
(1) The government held $3 865M ($2 215M as at March 31, 2023) of its own securities in Treasury bills and bonds. These securities are offset against the corresponding debts.
(2) The quoted market value of marketable securities in active markets was $3 714M ($1 031M as at March 31, 2023) and their book value was $3 723M ($1 047M as at March 31, 2023).
(3) The government holds participation units in specific funds entrusted to the Caisse de dépôt et placement du Québec.
(4) Fair value measurements for these financial instruments are based on level 1 of the fair value hierarchy, that is, on observable prices (unadjusted) in active markets available at the measurement date for identical assets.
Policies governing investment activities
The government has established policies governing long-term investment activities. These investment policies aim to optimize investment returns while maintaining the degree of risk at a level deemed appropriate by the government.
9. Investments (cont'd)
Investment deposits
Investment deposits are held in six specific funds of the Caisse de dépôt et placement du Québec (the Caisse). For each of these funds, an investment policy has been established based on a number of factors, including 10-year return forecasts, the long-term target allocation of asset classes that make up the benchmark portfolio and the permitted deviations from the target portfolio. These policies also take into account positions taken in derivative financial instruments and determine the level of exposure to market risk.
The Caisse manages all market risks on an integrated basis for all specialized portfolios. The main elements contributing to risk, such as industry sectors, geographic regions and issuers, are taken into account.
Credit risk management
All investments expose the government to credit risk, with the exception of investments in equity instruments.
With regard to investment deposits with the Caisse, the credit risk is managed by setting investment policies so as to reduce the exposure to risk to a level that the government deems acceptable. Furthermore, credit risk analyses are carried out globally by the Caisse for all the portfolios it manages. Since the net assets of the government's special funds are invested in underlying portfolios, the funds are indirectly exposed to credit risk. The Caisse's exposure is described in detail in its own financial statements.
Moreover, all transactions relating to financial instruments held directly by the specific funds are conducted with the Caisse, which benefits from an AAA credit rating. With regard to other investments, credit risk is considered low, since counterparties enjoy high credit ratings from rating agencies and funds are safely invested in authorized investments, in accordance with the Financial Administration Act (CQLR, chapter A-6.001) and the Regulation respecting investments made by a body (CQLR, chapter A-6.001, r. 8).
Price risk
The government is exposed to price risk with respect to equity instruments quoted in an active market, whose fair value fluctuates due to changes in stock market prices. As a result, a decline in stock market prices could generate unrealized losses in the consolidated statement of remeasurement gains and losses or, if such a reduction indicates a permanent decline in value, losses in the consolidated statement of operations and accumulated operating deficit.
▌ 10. Investment in government enterprises
Significant accounting policies |
Investment in government enterprises is recognized using the modified equity method based on the government's proportionate share of each enterprise. The financial information from government enterprises is based on the IFRS, except for information from Hydro-Québec, which is based on generally accepted accounting principles (GAAP) in the United States. Adjustments are made to Hydro-Québec's financial information to bring it in line with the IFRS standards; such adjustments mainly concern employee future benefits, financial instruments and asset retirement obligations. |
Material measurement uncertainty |
Investments in government enterprises are subject to uncertainty related to the measure stemming from the use of assumptions in the evaluation of the assets and liabilities pertaining to pension plans and other employee future benefits of Hydro-Québec. Changes to the assumptions used could engender significant changes in the valuation of participations in government enterprises and remeasurement gains or losses. |
10. Investment in government enterprises (cont'd)
Financial information on government enterprises
(millions of dollars)
| As at March 31 | ||||||||||||||||||||||||||||||
| 2024 | 2023 | |||||||||||||||||||||||||||||
| Investis- | Société des | |||||||||||||||||||||||||||||
| sement | Loto- | alcools du | ||||||||||||||||||||||||||||
| Hydro-Québec | Québec | Québec | Québec | Other | Total | Total | ||||||||||||||||||||||||
| (US GAAP) | (IFRS) | |||||||||||||||||||||||||||||
| Adjustments | ||||||||||||||||||||||||||||||
| for the | ||||||||||||||||||||||||||||||
| December 31, | three-month | Adjustments - | March 31, | |||||||||||||||||||||||||||
| 2023 | periods | IFRS (1) | 2024 | |||||||||||||||||||||||||||
| STATEMENT OF OPERATIONS | ||||||||||||||||||||||||||||||
| Revenue | 16 086 | (611 | ) | (1 | ) | 15 474 | 1 408 | 2 951 | 4 194 | 860 | 24 887 | 25 763 | ||||||||||||||||||
| Expenditure | 12 798 | 44 | 603 | 13 445 | 1 285 | 1 440 | 2 766 | 701 | 19 637 | 19 162 | ||||||||||||||||||||
| Annual (deficit) surplus | 3 288 | (655 | ) | (604 | ) | 2 029 | 123 | 1 511 | 1 428 | 159 | 5 250 | 6 601 | ||||||||||||||||||
| Consolidation adjustments | (2 | ) | (2 | ) | (3 | ) | (2 | ) | (9 | ) | 19 | |||||||||||||||||||
| Revenue from government enterprises | 2 027 | 121 | 1 508 | 1 428 | 157 | 5 241 | 6 620 | |||||||||||||||||||||||
| Other comprehensive income items | (172 | ) | (301 | ) | 2 310 | 1 837 | 14 | ― | (4 | ) | 5 | 1 852 | 947 | |||||||||||||||||
| STATEMENT OF FINANCIAL POSITION | ||||||||||||||||||||||||||||||
| Fixed assets | 76 185 | 461 | 1 089 | 77 735 | 306 | 673 | 267 | 532 | 79 513 | 76 966 | ||||||||||||||||||||
| Other assets | 16 483 | 3 894 | 1 362 | 21 739 | 9 361 | 471 | 1 041 | 609 | 33 221 | 31 256 | ||||||||||||||||||||
| Total assets | 92 668 | 4 355 | 2 451 | 99 474 | 9 667 | 1 144 | 1 308 | 1 141 | 112 734 | 108 222 | ||||||||||||||||||||
| Debts and advances | 55 155 | 5 613 | 115 | 60 883 | 4 451 | 478 | 295 | 77 | 66 184 | 63 349 | ||||||||||||||||||||
| Other liabilities | 9 986 | (2 820 | ) | 1 249 | 8 415 | (2) | 513 | 400 | 979 | 480 | 10 787 | 10 826 | ||||||||||||||||||
| Total liabilities | 65 141 | 2 793 | 1 364 | 69 298 | 4 964 | 878 | 1 274 | 557 | 76 971 | 74 175 | ||||||||||||||||||||
| Accumulated other comprehensive income items | 243 | (14 | ) | 7 908 | 8 137 | 34 | 180 | (11 | ) | (8 | ) | 8 332 | 6 481 | |||||||||||||||||
| Other shareholders' equity items | 27 284 | 1 576 | (6 821 | ) | 22 039 | 4 669 | 86 | 45 | 592 | 27 431 | 27 566 | |||||||||||||||||||
| Total shareholders' equity | 27 527 | 1 562 | 1 087 | 30 176 | 4 703 | 266 | 34 | 584 | 35 763 | 34 047 | ||||||||||||||||||||
| Consolidation adjustments | 17 | 21 | 25 | 63 | 70 | |||||||||||||||||||||||||
| Equity value (modified method) | 30 193 | 4 724 | 266 | 34 | 609 | 35 826 | 34 117 | |||||||||||||||||||||||
| Loans | 2 489 | 206 | 34 | 2 729 | 2 698 | |||||||||||||||||||||||||
| Investment in government enterprises | 30 193 | 7 213 | 472 | 34 | 643 | 38 555 | 36 815 | |||||||||||||||||||||||
| Dividends and other contributions paid | 2 466 | ― | 1 511 | 1 428 | 104 | 5 509 | 6 540 | |||||||||||||||||||||||
| Main contractual obligations | 105 682 | 1 481 | 68 | ― | 43 | 107 274 | 105 592 | |||||||||||||||||||||||
| Main contingent liabilities | 6 200 | (3) | 406 | ― | 3 | ― | 6 609 | 6 833 | ||||||||||||||||||||||
(1) The adjustments to bring Hydro-Québec's financial information in line with the IFRS resulted in an increase in the government's share in this enterprise of $1 706M, as these adjustments led to a $604M reduction in the income from government enterprises and a $2 310M increase in the other items of the comprehensive income. The combined adjustments to IFRS had the effect of increasing the government's share by $1 087M (decreasing it by $619M as at March 31, 2023).
(2) The government granted a financial guarantee of $685M ($685M as at March 31, 2023) for the Gentilly-2 nuclear generating station. In order to finance the costs related to long-term nuclear fuel waste management, Hydro-Québec set up a trust of $184M ($178M as at March 31, 2023).
(3) This sum is pertaining to two lawsuits for damages and interest filed by Innu Nation inc and Innus de Uashat mak Mani-utenam. Joint lawsuits have also been instituted against Hydro-Québec and the government. Those lawsuits are disclosed in Note 21 on contingencies.
10. Investment in government enterprises (cont'd)
Accumulated other comprehensive income items of government enterprises
(millions of dollars)
| Fiscal year ended March 31 | |||||||||||||||
| 2024 | 2023 | ||||||||||||||
| Gains on | Unrealized gains | ||||||||||||||
| employee future | on financial | ||||||||||||||
| benefits | instruments | Other | Total | Total | |||||||||||
| Accumulated remeasurement gains, beginning of year | 5 973 | 393 | 138 | 6 504 | 5 557 | ||||||||||
| Other comprehensive income items of government enterprises | 1 629 | 215 | 8 | 1 852 | 947 | ||||||||||
| Accumulated remeasurement gains, end of year | 7 602 | 608 | 146 | 8 356 | 6 504 | ||||||||||
| Accumulated items reclassified in other shareholders' equity items | (24 | ) | (24 | ) | (23 | ) | |||||||||
| Accumulated other comprehensive income items | 7 578 | 608 | 146 | 8 332 | 6 481 | ||||||||||
Inter-entity operations and operations with third-parties not included in the reporting entity
(millions of dollars)
| As at March 31 | ||||||||||||||||||
| 2024 | 2023 | |||||||||||||||||
| Third parties | Third parties | |||||||||||||||||
| not included in | not included in | |||||||||||||||||
| Inter- | the reporting | Inter- | the reporting | |||||||||||||||
| entities | entity | Total | entities | entity | Total | |||||||||||||
| STATEMENT OF OPERATIONS | ||||||||||||||||||
| Revenue | 1 145 | 23 742 | 24 887 | 1 031 | 24 732 | 25 763 | ||||||||||||
| Expenditure | 1 819 | 17 818 | 19 637 | 1 795 | 17 367 | 19 162 | ||||||||||||
| Annual surplus (deficit) | (674 | ) | 5 924 | 5 250 | (764 | ) | 7 365 | 6 601 | ||||||||||
| STATEMENT OF FINANCIAL POSITION | ||||||||||||||||||
| Fixed assets | 79 513 | 79 513 | 76 966 | 76 966 | ||||||||||||||
| Other assets | 2 597 | 30 624 | 33 221 | 3 383 | 27 873 | 31 256 | ||||||||||||
| Total assets | 2 597 | 110 137 | 112 734 | 3 383 | 104 839 | 108 222 | ||||||||||||
| Debts and advances | 2 761 | 63 423 | 66 184 | 2 729 | 60 620 | 63 349 | ||||||||||||
| Other liabilities | 936 | 9 851 | 10 787 | 1 019 | 9 807 | 10 826 | ||||||||||||
| Total liabilities | 3 697 | 73 274 | 76 971 | 3 748 | 70 427 | 74 175 | ||||||||||||
| Loans granted to government enterprises | 2 729 | 2 698 | ||||||||||||||||
| Dividends and other contributions paid | 5 509 | 6 540 | ||||||||||||||||
10. Investment in government enterprises (cont'd)
Repayment schedule for debts and advances contracted with third parties and with the government
(millions of dollars)
| 2030 and | |||||||||||||||||||||
| 2025 | 2026 | 2027 | 2028 | 2029 | thereafter | Total | |||||||||||||||
| Hydro-Québec | |||||||||||||||||||||
| Third parties not included in the reporting entity | 5 542 | 453 | 741 | 64 | 2 459 | 51 625 | 60 884 | ||||||||||||||
| Investissement Québec | |||||||||||||||||||||
| Third parties not included in the reporting entity | 485 | 607 | 331 | 348 | 238 | 49 | 2 058 | ||||||||||||||
| Government | 1 117 | 813 | 378 | 131 | 69 | 35 | 2 543 | ||||||||||||||
| 1 602 | 1 420 | 709 | 479 | 307 | 84 | 4 601 | |||||||||||||||
| Loto-Québec | |||||||||||||||||||||
| Third parties not included in the reporting entity | 252 | 8 | 5 | 1 | 1 | 10 | 277 | ||||||||||||||
| Government | 17 | 16 | 17 | 17 | 12 | 128 | 207 | ||||||||||||||
| 269 | 24 | 22 | 18 | 13 | 138 | 484 | |||||||||||||||
| Société des alcools du Québec | |||||||||||||||||||||
| Third parties not included in the reporting entity | 54 | 48 | 42 | 36 | 30 | 105 | 315 | ||||||||||||||
| Other | |||||||||||||||||||||
| Third parties not included in the reporting entity | 5 | 5 | 6 | 6 | 6 | 16 | 44 | ||||||||||||||
| Government | 17 | 1 | 4 | 1 | 1 | 9 | 33 | ||||||||||||||
| 22 | 6 | 10 | 7 | 7 | 25 | 77 | |||||||||||||||
| Total debt and advances | |||||||||||||||||||||
| Third parties not included in the reporting entity | 6 338 | 1 121 | 1 125 | 455 | 2 734 | 51 805 | 63 578 | ||||||||||||||
| Government | 1 151 | 830 | 399 | 149 | 82 | 172 | 2 783 | ||||||||||||||
| 7 489 | 1 951 | 1 524 | 604 | 2 816 | 51 977 | 66 361 | |||||||||||||||
Note: The government guarantees borrowings contracted by Hydro-Québec and Investissement Québec in different currencies. The net value of these guaranteed borrowings stood at $57 376M ($53 782M as at March 31, 2023) for Hydro-Québec and at $1 941M ($2 753M as at March 31, 2023) for Investissement Québec.
▌ 11. Loans
Significant accounting policies |
Loans are recognized at cost. When loans have significant concessionary terms, that is, there is a significant difference between their nominal value and their present value using the weighted average rate for government's debt, the loans are recognized at their present value when they take effect. This difference constitutes a grant component, which is recognized as a transfer expenditure. Subsequently, interest income is recognized and added to the book value of the loan until its maturity date, using the effective interest method. When a direct link can be established between government transfers and the repayment of a loan, the latter is recognized as a transfer expenditure. When the facts or circumstances point to the risk of a loss, a valuation allowance is recognized as a reduction in loans in order to reflect their net recoverable value. The annual change in this allowance is recognized as an expenditure and, where applicable, the subsequent recovery of a written-off loan is recognized in income. |
Measurement uncertainty |
Loans are subject to measurement uncertainty because estimates and assumptions are used to determine the valuation allowance and the net recovery value of the loans. The valuation allowance estimate is revised regularly and adjusted to take several factors into account, including the rate of past losses, sector risks and the borrower's financial situation. |
11. Loans (cont'd)
Loans granted and weighted average rate by category of borrower
| As at March 31 | |||||||||||||||||||
| 2024 | 2023 | ||||||||||||||||||
| Weighted | Valuation | Net book | Valuation | Net book | |||||||||||||||
| average rate | Cost | allowances | value | Cost | allowances | value | |||||||||||||
| (percent) | (millions of dollars) | (millions of dollars) | |||||||||||||||||
| Local administrations | |||||||||||||||||||
| Municipalities | 2.96 | 403 | (40 | ) | 363 | 432 | (41 | ) | 391 | ||||||||||
| Municipal bodies | 3.87 | 2 108 | (66 | ) | 2 042 | 1 909 | (64 | ) | 1 845 | ||||||||||
| 3.73 | 2 511 | (106 | ) | 2 405 | 2 341 | (105 | ) | 2 236 | |||||||||||
| Enterprises(1),(2) | 2.73 | 4 817 | (1 138 | ) | 3 679 | 3 960 | (894 | ) | 3 066 | ||||||||||
| Students | 7.55 | 577 | (210 | ) | 367 | 576 | (206 | ) | 370 | ||||||||||
| Other | 5.09 | 439 | (18 | ) | 421 | 220 | (17 | ) | 203 | ||||||||||
| 5 833 | (1 366 | ) | 4 467 | 4 756 | (1 117 | ) | 3 639 | ||||||||||||
| 3.48 | 8 344 | (1 472 | ) | 6 872 | 7 097 | (1 222 | ) | 5 875 | |||||||||||
(1) Loans with repayment clauses based on royalties are included in the loans to enterprises. The conditions associated with these loans are such that the entire amount advanced is similar to a subsidy. Therefore, these loans have a zero value.
(2) Loans to enterprises include US$270M (US$61M as at March 31, 2023) in loans, whose equivalent value is CAN$406M (CAN$82M as at March 31, 2023), and €145M (€81M as at March 31, 2023) in loans whose equivalent value is CAN$212M (CAN$119M as at March 31, 2023).
11. Loans (cont'd)
Schedule of loan payments receivable by category of borrower
(millions of dollars)
| Municipalities | |||||||||||||||
| Maturing on | and municipal | ||||||||||||||
| March 31 | bodies | Enterprises | Students | Other | Total | ||||||||||
| 2025 | 788 | 774 | 48 | 282 | 1 892 | ||||||||||
| 2026 | 137 | 529 | 48 | 7 | 721 | ||||||||||
| 2027 | 135 | 532 | 48 | 7 | 722 | ||||||||||
| 2028 | 120 | 847 | 48 | 6 | 1 021 | ||||||||||
| 2029 | 123 | 502 | 48 | 6 | 679 | ||||||||||
| 1 303 | 3 184 | 240 | 308 | 5 035 | |||||||||||
| 2030-2034 | 591 | 1 328 | 240 | 34 | 2 193 | ||||||||||
| 2035-2039 | 227 | 464 | 97 | 32 | 820 | ||||||||||
| 2040-2044 | 121 | 49 | 170 | ||||||||||||
| 2045-2049 | 35 | 5 | 40 | ||||||||||||
| 2050 and thereafter | 17 | 6 | 1 | 24 | |||||||||||
| 2 294 | 5 036 | 577 | 375 | 8 282 | |||||||||||
| No fixed maturity date | 236 | 28 | 76 | 340 | |||||||||||
| 2 530 | 5 064 | 577 | 451 | 8 622 | |||||||||||
(1) The payment schedule for loans is based on the contractual cash flows stipulated in the contracts. This basis differs from the net book value of loans, which, for the purposes of evaluation, considers in particular valuation allowances and significant concessionary terms. These elements have a net effect of $1 750M.
Credit risk management
As part of its operations, the government grants loans and receives assets as collateral. The majority of loans are granted by the Economic Development Fund. Decisions to grant these loans are based primarily on a risk assessment that takes into account such factors as the creditworthiness of the third party, available guarantees, and the transaction's compliance with policies, standards and procedures in effect. A systematic follow-up of interventions is then carried out.
11. Loans (cont'd)
The cost of the loans granted by the Economic Development Fund was $4 647 million ($3 775 million as at March 31, 2023). These loans are mainly granted to businesses operating in the secondary sector.
Proportion of Economic Development Fund loans with significant securities and sureties by loan categories
| As at March 31 | ||||||||||||
| 2024 | 2023 | |||||||||||
| Proportion of | Proportion of | |||||||||||
| the nominal | the nominal | |||||||||||
| Cost | balance of loans | Cost | balance of loans | |||||||||
| (millions of dollars) | (percent) | (millions of dollars) | (percent) | |||||||||
| Loans - fixed rate | 2 600 | 42 | 1 779 | 32 | ||||||||
| Loans - variable rate | 320 | 51 | 498 | 54 | ||||||||
| Loans - no interest | 1 727 | 47 | 1 498 | 43 | ||||||||
As for loans granted by other entities within the reporting entity, the cost of which was $3 697 million ($3 322 million as at March 31, 2023), the guarantees received totalled $169 million ($183 million as at March 31, 2023).
The credit quality of loans that are neither past due nor impaired is deemed adequate.
Interest rate risk management
The majority of loans are fixed-rate. For variable-rate loans, changes in interest rates lead to fluctuations in the interest income earned. However, this interest rate risk is limited, because debt with substantially the same terms as the loans are contracted. If necessary, financial derivative instruments may be used.
▌ 12. Generations Fund
The purpose of the Generations Fund, created under the Act to reduce the debt and establish the Generations Fund (CQLR, chapter R-2.2.0.1), is to reduce the government's debt. In accordance with this Act, the fund's assets are used exclusively to repay the government's debt.
Significant accounting policies |
Demand and participation deposits in a particular fund of the Caisse de dépôt et placement du Québec (the Caisse) are recognized at cost. Where participation deposits suffer a loss in value that is other than a temporary decline, their book value is reduced to reflect this decline and the resulting reduction in value is recognized to expenditure. At the time of disposition of participation deposits, the difference between the amount received and the book value of these units established using the average cost method is recognized to results. |
Statement of financial position
(millions of dollars)
| As at March 31 | ||||||
| 2024 | 2023 | |||||
| Sums managed by the Caisse de dépôt et placement du Québec | ||||||
| Demand deposits | 1 329 | 1 786 | ||||
| Income receivable on investments | 86 | 46 | ||||
| Participation deposits(1) | 16 998 | 16 998 | ||||
| 18 413 | 18 830 | |||||
| Accounts receivable | 45 | 81 | ||||
| Fund balance | 18 458 | 18 911 | ||||
(1) The Generations Fund holds participation units in a specific fund at the Caisse. These units are repaid with prior notice according to the Caisse's settlement terms and conditions at the fair value of the fund's net equity at the end of each month. The Generations Fund had 14 108 127 participation units with a total fair value of $19 484M (14 108 127 participation units with a total fair value of $18 629M as at March 31, 2023).
12. Generations Fund (cont'd)
Statement of change in the balance of the Generations Fund
(millions of dollars)
| Fiscal year ended March 31 | |||||||||
| 2024 | 2023 | ||||||||
| Actual | Actual | ||||||||
| Budget (1) | results | results | |||||||
| Opening balance | 19 180 | 18 911 | 15 829 | ||||||
| Own-source revenue | |||||||||
| Consumption taxes | |||||||||
| Specific tax on alcoholic beverages | 500 | ||||||||
| Duties, permits and royalties | |||||||||
| Water-power royalties | 934 | 815 | 888 | ||||||
| Mining revenues | 578 | ||||||||
| Miscellaneous revenue | |||||||||
| Unclaimed property | 74 | ||||||||
| Revenue on investments | 789 | 582 | 283 | ||||||
| Revenue from government enterprises, taken out of dividends | |||||||||
| Hydro-Québec | |||||||||
| Indexation of the average cost of heritage pool electricity | 544 | ||||||||
| Additional contribution from Hydro-Québec | 650 | 650 | 215 | ||||||
| Total own-source revenue | 2 373 | 2 047 | 3 082 | ||||||
| Balance before debt repayment | 21 553 | 20 958 | 18 911 | ||||||
| Sums used to repay debts | (2 500 | ) | (2500 | ) | |||||
| Closing balance | 19 053 | 18 458 | 18 911 | ||||||
(1) According to data presented in Budget 2023-2024 of the Ministère des Finances tabled on March 21, 2023.
Credit risk management
The government partly manages the credit risk associated with participation deposits at the Caisse by determining the composition of the benchmark portfolio, thereby reducing exposure to risk to a level deemed acceptable by the government.
Credit risk analyses are carried out globally by the Caisse for all the portfolios it manages. Since the net assets of the Generations Fund special fund are invested in underlying portfolios, the fund is indirectly exposed to credit risk. The Caisse's exposure is detailed in its own financial statements.
Moreover, all transactions relating to financial instruments held directly by the specific fund are conducted with the Caisse, which benefits from an AAA credit rating.
12. Generations Fund (cont'd)
Interest rate risk management
Demand deposits bear interest. However, the interest rate risk associated with this financial asset is limited, since the demand deposit account represents the equivalent of the government's bank balance deposited with the Caisse. In general, sums deposited in this account are reinvested in the purchase of participation units (participation deposits) the following month.
Investment policy
The Generations Fund is administered according to an investment policy determined by the Ministère des Finances in collaboration with the managers of the Caisse. This investment policy aims to optimize rates of return on investments while maintaining the degree of risk at a level deemed appropriate by the government.
This policy is based on a number of factors, including 10-year return and risk forecasts, the long-term target allocation of asset classes making up the benchmark portfolio, and permitted deviations from the target portfolio. It also takes into account positions taken in derivative financial instruments and determines the level of exposure to market risk, including the target level of currency exposure.
The investment policy for the benchmark portfolio of the specific fund is as follows:
Investment policy
(percentage of net assets of special funds)
| Specialized portfolios | |||
| Short-term equities | 1.00 | ||
| Rate | 10.00 | ||
| Credit | 30.00 | ||
| Total - Fixed revenue | 41.00 | ||
| Infrastructure | 9.00 | ||
| Real estate | 7.00 | ||
| Total - Real assets | 16.00 | ||
| Stock markets | 34.00 | ||
| Private equities | 9.00 | ||
| Total - Equities | 43.00 | ||
| Asset breakdown | ― | ||
| Total | 100.00 |
The Caisse manages all market risks on an integrated basis for all specialized portfolios. The main elements contributing to risk, such as industry sectors, geographic regions and issuers, are taken into account.
▌ 13. Accounts payable, accrued expenses and other allowances
Significant accounting policies |
Refunds of income and other taxes The amounts of refunds of income and other taxes are based on notices of assessment issued before the end of the fiscal year. Refunds of individual income taxes and consumption taxes that have not yet been made at the fiscal year end are recognized as accounts payable and accrued expenses per estimates based on transactions carried out after the end of the fiscal year. Liabilities stemming from transfers Liabilities stemming from transfers are recognized in the fiscal year during which the transfers were duly authorized and during which the recipients met the eligibility criteria. Allowance for losses on guaranteed financial initiatives Obligations resulting from financial initiatives guaranteed by the government, mainly loan guarantees, are recognized on the basis of probable losses. The allowance is established on the balance of the guaranteed financial initiatives reduced by the estimated realizable value of the security and surety obtained. The annual change in the allowance is recognized in expenditure. Probable losses are annually estimated by grouping financial initiatives into various risk classes and applying an average loss rate to each class. In the case of enterprises whose government-guaranteed financial initiatives show an exceptionally high cumulative balance or are characterized by specific features, the estimate of probable losses relating to these initiatives is made using case-by-case analysis, regardless of risk class. The authorized guarantees in effect that are not subject to an allowance constitute a contingent liability for the government. |
Measurement uncertainties |
Initial valuation of income and other taxes to be refunded Income and other tax refunds stemming from disputed taxpayer notices of assessment are based on estimates for which measurement may be uncertain. The initial valuation of the amounts the government expects to pay with regard to such disputes is based mainly on the settlement rates of similar files in the past. Estimation of liabilities stemming from transfers Grants to be paid at the rate of repayment of the loans contracted by the recipients are recognized as work progresses on the basis of information held by the government These liabilities are subject to measurement uncertainty due to possible differences between the estimate of the government's expenditures or work progress and actual expenditures or work performed, as the case may be. Allowance for losses on guaranteed financial initiatives The allowance for losses on financial guarantees is subject to measurement uncertainty because of the assumptions used to assess the likelihood of a borrower defaulting on one of his obligations and forcing the government to make good on the financial guarantee. Financial guarantees are grouped into different hazard classes with an average rate applied for each one. The allowance rate is based on past experience, the type of guarantee and past losses. When the allowances are taken individually, the main considerations are the sector risks and the borrower's financial situation. |
13. Accounts payable, accrued expenses and other allowances (cont'd)
Details of accounts payable, accrued expenses and other allowances
(millions of dollars)
(millions of dollars)
| As at March 31 | ||||||
| 2024 | 2023 | |||||
| (restated - Note 3) | ||||||
| Remuneration | 15 707 | 13 989 | ||||
| Liabilities stemming from transfers | ||||||
| Grants to be paid at the rate of repayment of the loans contracted by the recipients(1) | 7 225 | 7 078 | ||||
| Other grants to be paid | 9 677 | 7 923 | ||||
| Income taxes and other taxes refundable | ||||||
| Income and property taxes | 6 949 | 6 328 | ||||
| Consumption taxes | 3 387 | 3 060 | ||||
| Suppliers | 8 679 | 7 500 | ||||
| Accrued interest on debts | 3 546 | 3 232 | ||||
| Advances from trust funds | 1 135 | 1 212 | ||||
| Clearing accounts for collected taxes | 763 | 830 | ||||
| Allowance for losses on guaranteed financial initiatives | 641 | 564 | ||||
| 57 709 | 51 716 | |||||
(1) In addition to the sums payable as a part of its transfer programs, the government subsidizes the interest that will be borne by the recipients in subsequent years.
13. Accounts payable, accrued expenses and other allowances (cont'd)
Guaranteed loans and other guaranteed financial initiatives by third party category
(millions of dollars)
| As at March 31 | ||||||||||||||||||||||||
| 2024 | 2023 | |||||||||||||||||||||||
| Authorized limit | Authorized guarantees in effect | Allowance for losses on guaranteed financial initiatives | Net risk under guarantees | Authorized limit | Authorized guarantees in effect | Allowance for losses on guaranteed financial initiatives | Net risk under guarantees | |||||||||||||||||
| Enterprises | 194 | 187 | (1) | (96 | ) | 91 | 532 | 472 | (1) | (129 | ) | 343 | ||||||||||||
| Non-profit organizations and cooperatives | 2 635 | 2 609 | (2) | (216 | ) | 2 393 | 2 613 | 2 609 | (2) | (137 | ) | 2 472 | ||||||||||||
| Forest, farm and fisheries' sector producer | 7 908 | 7 176 | (3) | (93 | ) | 7 083 | 7 715 | 6 851 | (3) | (66 | ) | 6 785 | ||||||||||||
| Students | ||||||||||||||||||||||||
| Borrowings for which the Government pays interest as long as the borrower is a student(4) | 1 447 | 1 447 | (5) | 1 447 | 1 404 | 1 404 | (5) | 1 404 | ||||||||||||||||
| Borrowings for which borrowers are responsible for paying principal and interest | 2 407 | 2 407 | (5) | (236 | ) | 2 171 | 2 442 | 2 442 | (5) | (232 | ) | 2 210 | ||||||||||||
| 13 826 | (641 | ) | 13 185 | 13 778 | (564 | ) | 13 214 | |||||||||||||||||
(1) Guarantees of $176M ($459M as at March 31, 2023) were granted by the government under the Act respecting Investissement Québec (CQLR, chapter I-16.0.1). In addition to loan guarantees, the guarantees include loss and payment guarantees introduced to facilitate the funding of aircraft purchasers. As at March 31, 2024, the government has received significant securities and sureties for 55% of the nominal balance of its guarantee portfolio (48% of the nominal balance as at March 31, 2023).
(2) Guarantees of $2 582M ($2 581M as at March 31, 2023) are granted by the government under the Act respecting the Société d'habitation du Québec (CQLR, chapter S-8). The government guarantees borrowings with financial institutions contracted by non-profit organizations and cooperatives for periods of 25 or 35 years following its approval of an extension. The principal and interest associated with these borrowings are covered by the non-profit organization or the cooperative. These borrowings finance the acquiring of buildings. These guarantees totalled $2 522M ($2 509M as at March 31, 2023).
(3) Guarantees of $6 990M ($6 673M as at March 31, 2023) are granted by the government under the Act respecting La Financière agricole du Québec (CQLR, chapter L-0.1). This amount corresponds to balances of principal and interest on borrowings for which La Financière agricole du Québec reimburses the lenders' residual losses and related charges. The producers' assets are held as securities by the lenders; they consist particularly of farm or forest production units, milk quotas and surety.
(4) These borrowings bear interest at the banker's acceptance rate plus 150 basis points.
(5) The guarantees are granted by the government under the Act respecting financial assistance for education expenses (CQLR, chapter A-13.3). It guarantees the reimbursement of losses of principal and interest to lending institutions.
▌ 14. Deferred revenue
Significant accounting policies |
Revenue from government transfers is deferred when the stipulations as to the use of the transferred or received resources or as to the actions to be taken in order to keep them create an obligation that meets the definition of a liability. When these stipulations are of a general nature, the actions or communications of the government that establish those stipulations up to the date of the financial statements may also create a liability. When transfer revenue is deferred, it is recognized as revenue as the liabilities are paid. Revenue from donors other than governments that is designated for a specific purpose is deferred and recognized as revenue when the resources are used for their prescribed purposes. Donations in the form of fixed assets or cash to acquire those resources will be deferred and recognized in revenue at the same pace as fixed asset depreciation. Revenue from school taxes is deferred and recognized in revenue for the period during which it is levied. |
Measurement uncertainty |
Deferred transfer revenue from the federal government is subject to measurement uncertainty due to possible differences between the estimate of the government's expenditures or work progress and actual expenditures or work performed. |
14. Deferred revenue (cont'd)
Deferred revenue by source or by nature
(millions of dollars)
| As at March 31 | ||||||
| 2024 | 2023 | |||||
| (restated - Note 3) | ||||||
| Federal government transfers | 4 988 | 5 016 | ||||
| Third-party donations(1) | 2 242 | 2 153 | ||||
| Transfers from entities other than the federal government | 130 | 144 | ||||
| School property tax | 300 | 288 | ||||
| Guarantee fees for Hydro-Québec borrowings | 194 | 184 | ||||
| Other | 583 | 521 | ||||
| 8 437 | 8 306 | |||||
(1) The third-party donations are mainly from non-profit organizations, including foundations that provide financial support to public institutions in the health and social services network.
Deferred revenue - Stipulations of federal government transfers
(millions of dollars)
| As at March 31 | ||||||
| 2024 | 2023 | |||||
| For acquisition or construction of fixed assets | 3 076 | 2 892 | ||||
| For other purposes | ||||||
| Financing of municipal and local infrastructures | 837 | 1 136 | ||||
| Financing of research and other projects | 1 075 | 988 | ||||
| 1 912 | 2 124 | |||||
| 4 988 | 5 016 | |||||
Deferred revenue - Third-party donation restriction and variations
(millions of dollars)
| Fiscal year ended March 31, 2024 | |||||||||||||||
| Opening | New | Recognition | Closing | Balance as at | |||||||||||
| balance | donations | in revenue | balance | March 31, 2023 | |||||||||||
| Third-party donations | |||||||||||||||
| For acquisition of fixed assets | 1 311 | 150 | 111 | 1 350 | 1 311 | ||||||||||
| For other purposes | 842 | 821 | 771 | 892 | 842 | ||||||||||
| 2 153 | 971 | 882 | 2 242 | 2 153 | |||||||||||
▌ 15. Environmental liability and asset retirement obligations
The environmental liability represents the government's obligation to remediate contaminated sites resulting from current or past activities of various kinds, such as mining, industrial, commercial or institutional activities carried out by the government or by third parties. These activities may have taken place on a third person's private property that was abandoned.
Asset retirement obligations mainly concern the removal of asbestos from buildings. In accordance with current laws and regulations, the government will fulfill these obligations when these fixed assets are demolished or renovated.
Significant accounting policies |
Environmental liability An obligation arising from the remediation of a contaminated site is recognized as an environmental liability when all the following conditions are met:
Sites the government does not plan to remediate are those that do not pose a danger to public health and safety or those where the contamination is hardly likely to have a significant environmental impact. The environmental liability includes the estimated costs of contaminated sites management and remediation, which are increased to reflect the degree of precision associated with the estimation method used. This measurement represents the government's best estimate of the costs required to settle the obligation. The liability recognized is adjusted each year based on new contaminated sites to be remediated, actual costs incurred and revisions to estimates. Asset retirement obligations An asset retirement obligation is recognized when all the following conditions are met:
Asset retirement costs are capitalized as part of the cost of the assets concerned and amortized on a straight-line basis from the date of the legal obligation until the planned completion of the asset retirement activities. |
15. Environmental liability and asset retirement obligations (cont'd)
Significant accounting policies (cont'd) |
Asset retirement obligations (cont'd) The initial measurement of the liability is made by discounting the estimated cash flows required to perform the asset retirement activities. Cash flows are adjusted for inflation and discounted using a discount rate that represents the government's best estimate of the cost of funds required to settle the obligation at maturity. When the date of decommissioning activities is not foreseeable, cash flows are not discounted, although they are adjusted annually according to inflation. The recorded liability is adjusted annually for new obligations, actual costs incurred, revised estimates and accretion expense. These adjustments are recognized as an increase or decrease in the book value of the asset concerned. The adjusted book value of the asset is amortized prospectively. Liabilities relating to the retirement of heritage buildings are not presented in the financial statements, because the government is required to maintain the integrity of these buildings under the Cultural Heritage Act. Therefore, the probable retirement date of these buildings is so far in the future that the present value of the obligation is negligible. |
Material measurement uncertainties |
Environmental liability Environmental liability is subject to measurement uncertainty and may vary because different methods are used to estimate the remediation and management costs, which are increased according to the degree of precision deployed. It is also subject to measurement uncertainty due to the constantly evolving technology used for remediation and due to the inherent limitations of measurement of the extent and nature of the remediation required. The main assumptions used to estimate the liability are related to the contaminated areas, labour and material costs and the choice of technologies available to eliminate or control contamination. Changes to those assumptions and the regulations could entail significant changes to the recorded liabilities. Assets retirement obligations The liability relating to asset retirement obligations is subject to measurement uncertainty and may vary due to the continually evolving technologies used in asset retirement activities, and to differences between the assumptions used in measuring the liability and actual results. The main assumptions used include the estimated costs of asset retirement, the indexation rate for these costs, the discount rate and the discount period. In addition, the obligation to safely dispose of asbestos in buildings is subject to measurement uncertainty due to the inherent limitations in assessing the quantities of asbestos contained therein, as well as the estimated cash flow schedule to carry out the work. Changes in the key assumptions, in the technology used or in regulations could result in significant changes to the measurement of recorded asset retirement obligations. |
15. Environmental liability and asset retirement obligations (cont'd)
Summary of obligations
(millions of dollars)
| As at March 31 | ||||||
| 2024 | 2023 | |||||
| (restated - Note 3) | ||||||
| Environmental liability | 3 344 | 3 127 | ||||
| Asset retirement obligations | 4 658 | 4 967 | ||||
| 8 002 | 8 094 | |||||
Environmental liability
Number of sites inventoried
| As at March 31 | ||||||||||||
| 2024 | 2023 | |||||||||||
| Number of sites | Liability | Number of sites | Liability | |||||||||
| (millions of dollars) | (millions of dollars) | |||||||||||
| Direct responsibility | 1 154 | 2 857 | 1 171 | 2 401 | ||||||||
| Likely responsibility | 174 | 487 | 192 | 726 | ||||||||
| 1 328 | 3 344 | (1) | 1 363 | (2) | 3 127 | (1) | ||||||
(1) The environmental liability takes into account a cost increase of $699M, representing an average rate of 26% ($693M and 29% as at March 31, 2023).
(2) The number of sites as at March 31, 2023, decreased from 1 690 to 1 363 because certain lots subject to the same contamination event whose rehabilitation must be managed as a single site were grouped together, i.e., the steps in the rehabilitation process are carried out simultaneously on all the lots at the site.
Changes in environmental liability
(millions of dollars)
| Fiscal year ended March 31 | ||||||
| 2024 | 2023 | |||||
| Opening balance | 3 127 | 2 812 | ||||
| New contaminated sites to be remediated | 56 | 90 | ||||
| Remediation work carried out | (61 | ) | (48 | ) | ||
| Revision of the estimates | 222 | 273 | ||||
| Closing balance | 3 344 | 3 127 | ||||
15. Environmental liability and asset retirement obligations (cont'd)
Asset retirement obligations
Changes in asset retirement obligations
(millions of dollars)
| Fiscal year ended March 31 | ||||||
| 2024 | 2023 | |||||
| (restated - Note 3) | ||||||
| Previously established opening balance | 4 390 | 4 592 | ||||
| Accounting change (note 3) | 577 | 549 | ||||
| Restated opening balance | 4 967 | 5 141 | ||||
| New asset retirement obligations | 4 | |||||
| Work completed | (28 | ) | ||||
| Accretion expense | 235 | 245 | ||||
| Revision of the estimates | (520 | ) | (419 | ) | ||
| Closing balance | 4 658 | 4 967 | ||||
The estimated costs of carrying out asset retirement activities as at March 31, 2024 total $9 020 million ($9 869 million as at March 31, 2023). Cash flows related to estimated costs of $887 million ($1 043 million in 2023) are not discounted since the completion date of the decommissioning is not foreseeable.
Main assumptions
| As at March 31 | ||||||
| 2024 | 2023 | |||||
| Indexation rate for estimated costs (percent) | 0.64 to 9.66 | 2.21 to 11.17 | ||||
| Discount rate, including inflation (percent) | 4.04 to 4.98 | 3.52 to 5.54 | ||||
| Discount period (years)(1) | 1 to 100 | 1 to 101 | ||||
(1) The period of discounting presented considers the estimated duration of the performance of the decommissioning work, which usually spans a period of less than one year.
15. Environmental liability and asset retirement obligations (cont'd)
Impact of a change in the main assumptions on the value of asset retirement obligations
| Impact on the value of obligations | |||||
| Assumptions | Change | as at March 31, 2024 | |||
| (millions of dollars) | (percent) | ||||
| - Estimated costs | - Increase of 10.00 % | 466 | +10.00 | ||
| - Decrease of 10.00 % | (466) | -10.00 | |||
| - Indexation rate for estimated costs | - Increase of 0.25% | 306 | +6.57 | ||
| - Decrease of 0.25% | (278) | -5.97 | |||
| - Discount rate, including inflation | - Increase of 0.25% | (270) | -5.80 | ||
| - Decrease of 0.25% | 298 | +6.40 | |||
| - Discount period | - Increase of 5 years | (464) | -9.96 | ||
| - Decrease of 5 years | 522 | +11.21 | |||
▌ 16. Assets and liabilities regarding pension plans and other employee future benefits
Significant accounting policies |
Assets and liabilities of pension plans and other employee future benefits consist of the Retirement Plans Sinking Fund (RPSF), the specific pension funds and other employee future benefit programs funds as well as the obligations relating to accrued benefits under the pension plans and other employee future benefits. When the book value of a fund exceeds the value of the corresponding liability and the government can benefit from the excess, its net value is shown as an asset. Conversely, when the liability exceeds the book value of the established asset, its net value is shown as a liability. Retirement Plans Sinking Fund and specific pension funds The investments of the RPSF, specific pension funds and employee future benefit programs funds are recognized at an adjusted market value. With this valuation method, the difference between the real return based on market value and the forecast return is amortized over five years. When the adjusted market value of a pension plan fund is higher than that of its obligations, the resulting surplus is capped through a valuation allowance so that the pension plans asset reflects only the future benefit that the government expects to derive from this surplus. The annual change in the allowance is charged to expenditure. Actuarial gains and losses attributable to the use of the forecast rate of return are amortized using the straight-line method. The amortization period corresponds to the expected average remaining service life (EARSL) of plan or program. The annual return of a fund is obtained by applying the rate of return stipulated in the actuarial valuations of the obligations of each pension plan or the employee future benefit program to the average balance of the plan in question. Obligations relating to the pension plans and other employee future benefits Obligations relating to defined-benefit pension plans and employee future benefit programs are recognized using the projected benefit method prorated on years of service and the most probable assumptions set by the government. The method used takes into account the way in which benefits payable by the government are accrued by participants. The Survivor's Pension Plan's obligations are recognized using an actuarial method that determines the present value of the pensions accrued by beneficiaries as a result of the eligible person's death. Actuarial gains and losses determined during the remeasurement of obligations stem from experience adjustments to forecasts and from changes to assumptions. They are recognized in expenditure using the straight-line method, as of the fiscal year following the year in which they are taken into account in the value of obligations relating to accrued benefits. The amortization period corresponds to the EARSL of plan or program participants. For the Survivor's Pension Plan, the amortization period corresponds to the average remaining life expectancy of beneficiaries. Annual interest is determined by applying the discount rate of the obligation relating to accrued benefits to each program or plan to the average value of the related obligation. |
16. Assets and liabilities regarding pension plans and other employee future benefits (cont'd)
Material measurement uncertainty |
Obligations relating to pension plans may vary because of differences between the economic and demographic assumptions made for actuarial valuation purposes and the actual results. The impact of a change in the main assumptions on the value of obligations relating to accrued benefits under the four main pension plans is shown after the table "Main economic assumptions used". |
Assets and liabilities regarding pension plans and other employee future benefits
(millions of dollars)
| As at March 31 | ||||||||||||||||||
| 2024 | 2023 | |||||||||||||||||
| Net assets | Net assets | |||||||||||||||||
| Assets | Liabilities | (net liabilities) | Assets | Liabilities | (net liabilities) | |||||||||||||
| Pension plans | 120 902 | 124 640 | (3 738 | ) | 113 903 | 120 845 | (6 942 | ) | ||||||||||
| Université du Québec programs | 305 | (305 | ) | 295 | (295 | ) | ||||||||||||
| 120 902 | 124 945 | (4 043 | ) | 113 903 | 121 140 | (7 237 | ) | |||||||||||
| Accumulated Sick Leave | 969 | 574 | 395 | 1 042 | 612 | 430 | ||||||||||||
| Survivor's Pension Plan | 464 | 436 | 28 | 459 | 437 | 22 | ||||||||||||
| 1 433 | 1 010 | 423 | 1 501 | 1 049 | 452 | |||||||||||||
| 122 335 | 125 955 | (3 620 | ) | 115 404 | 122 189 | (6 785 | ) | |||||||||||
The government put in place employee future benefits programs that provide for the accumulation of sick leave and the payment of survivors' pensions. These programs result in long-term obligations for the government, which assumes the full cost of these programs.
Accumulated sick leave
Certain public service employees subject to the Public Service Act (CQLR, chapter F-3.1.1) can accumulate, in a reserve, the unused sick leave days they are entitled to annually.
For non-management employees, the number of unused sick leave days that may be accumulated in a reserve is limited to 20. This reserve is convertible into cash in its entirety in the event of termination of the employment relationship and may not be used during preretirement leave.
16. Assets and liabilities regarding pension plans and other employee future benefits (cont'd)
Accumulated sick leave (cont'd)
For non-unionized employees who are members of the Pension Plan of Management Personnel (PPMP) and Retirement Plan for Seniors Officials (RPSO), mainly management, the days accumulated in the reserve before they become managers can be utilized as fully paid leave days in certain situations provided for in the different labour agreements or for preretirement leave. In case of termination of employment, retirement or death, the employees receive in money 50% of the value of these accumulated days, up to an amount representing the equivalent of 66 days' salary.
The Financial Administration Act (CQLR, chapter A-6.001) authorizes the Minister of Finance to deposit money with the Caisse de dépôt et placement du Québec (the Caisse), up to an amount equal to the value of its obligation relating to accumulated sick leave in order to build up the Accumulated Sick Leave Fund. The purpose of this fund is to provide for the payment of some or all of the benefits due to employees for accumulated sick leave.
Actuarial gains and losses are amortized over the EARSL, which ranges from 14 to 15 years.
Survivor's Pension Plan
The Survivor's Pension Plan stipulates that a pension is paid to the spouse and dependent children following the death of an eligible person. The plan chiefly covers management and similar personnel in the public and parapublic sectors. The government pays amounts into a fund at the Caisse, reserved exclusively for the payment of benefits earned by plan beneficiaries.
Actuarial gains and losses are amortized over the average remaining life expectancy of the beneficiaries, which is 18 years.
Assets regarding other employee future benefits
(millions of dollars)
| As at March 31 | ||||||||||||
| Accumulated | Survivor's | |||||||||||
| Sick Leave | Pension Plan | 2024 | 2023 | |||||||||
| Other employee future benefits funds | 1 070 | 482 | 1 552 | 1 637 | ||||||||
| Less: | ||||||||||||
| Obligations relating to accrued benefits | 577 | 454 | 1 031 | 1 064 | ||||||||
| 493 | 28 | 521 | 573 | |||||||||
| Plus: | ||||||||||||
| Unamortized actuarial gains | (98 | ) | (98 | ) | (121 | ) | ||||||
| 395 | 28 | 423 | 452 | |||||||||
16. Assets and liabilities regarding pension plans and other employee future benefits (cont'd)
Change in the adjusted market value of other employee future benefit funds
(millions of dollars)
| Fiscal year ended March 31 | ||||||||||||
| 2024 | 2023 | |||||||||||
| Accumulated | Survivor's | |||||||||||
| Sick Leave | Pension Plan | |||||||||||
| Fund | Fund | Total | Total | |||||||||
| Adjusted market value, beginning of year | 1 160 | 477 | 1 637 | 1 714 | ||||||||
| Anticipated investment income(1) | 71 | 30 | 101 | 106 | ||||||||
| Deposits from the general fund of the Consolidated Revenue Fund | 17 | 17 | 9 | |||||||||
| Repayments to depositors(2) | (160 | ) | (160 | ) | (155 | ) | ||||||
| Benefits paid | (40 | ) | (40 | ) | (38 | ) | ||||||
| Actuarial (losses) gains | (1 | ) | (2 | ) | (3 | ) | 1 | |||||
| Adjusted market value, end of year(3) | 1 070 | 482 | 1 552 | 1 637 | ||||||||
(1) The forecast returns on the assets of the Accumulated Sick Leave Fund and the Survivor's Pension Plan Fund both amount to 6.35% (6.35% in 2022-2023); the realized returns, based on the market value of investments, were 5.81% and 5.46%, respectively (2.18% and 2.14% in 2022-2023).
(2) Under the Financial Administration Act (CQLR, chapter A-6.001), the payment of any benefit that affects the liabilities of the obligation relating to accumulated sick leave may be repaid to depositors out of the Accumulated Sick Leave Fund.
(3) The market values of the Accumulated Sick Leave Fund and the Survivor's Pension Plan Fund were $1 085M and $482M respectively ($1 179M and $479M as at March 31, 2023).
Change in obligations relating to accrued other employee future benefits
(millions of dollars)
| Fiscal year ended March 31 | ||||||||||||
| 2024 | 2023 | |||||||||||
| Accumulated | Survivor's | |||||||||||
| sick leave | Pension Plan | Total | Total | |||||||||
| Obligations, beginning of year | 609 | 455 | 1 064 | 1 166 | ||||||||
| Cost of accrued benefits | 53 | 11 | 64 | 38 | ||||||||
| Interest on obligations | 31 | 28 | 59 | 68 | ||||||||
| Benefits paid | (129 | ) | (40 | ) | (169 | ) | (202 | ) | ||||
| Actuarial losses (gains) | 13 | 13 | (6 | ) | ||||||||
| Obligations, end of year | 577 | 454 | 1 031 | 1 064 | ||||||||
16. Assets and liabilities regarding pension plans and other employee future benefits (cont'd)
Actuarial valuations
Every three years, the value of obligations relating to accrued benefits of the accumulated sick leave and Survivors' Pension Plan is determined by actuarial valuations. The value of these obligations is extrapolated for the period between two actuarial valuations.
Date of the most recent actuarial valuations used to determine the value of obligations related to vested benefits
| March 31, 2022 | December 31, 2021 | |
| (filed in 2021-2022) | (filed in 2021-2022) | |
| Accumulated sick leave | Survivor's Pension Plan | |
Note: The filing year corresponds to the government's fiscal year for which an actuarial valuation of the plan is required based on the production schedule of the valuation.
Main long-term economic assumptions
(per cent)
| Accumulated | Survivor's | |||||
| sick leave | Pension Plan | |||||
| Rate of return, net of inflation | 4.35 | 4.35 | ||||
| Inflation rate | 2.00 | 2.00 | ||||
| Discount rate for obligations relating to accrued benefits | 6.35 | 6.35 | ||||
| Salary growth rate, net of inflation | 0.50 | ― |
Accrued benefits expense relating to other employee future benefits
(millions of dollars)
| Fiscal year ended March 31 | ||||||||||||
| 2024 | 2023 | |||||||||||
| Accumulated | Survivor's | |||||||||||
| sick leave | Pension Plan | Total | Total | |||||||||
| Cost of accrued benefits | 53 | 11 | 64 | 38 | ||||||||
| Amortization of actuarial losses | 6 | 1 | 7 | 11 | ||||||||
| 59 | 12 | 71 | 49 | |||||||||
16. Assets and liabilities regarding pension plans and other employee future benefits (cont'd)
Debt service expense (revenue) relating to other employee future benefits
(millions of dollars)
| Fiscal year ended March 31 | ||||||||||||
| 2024 | 2023 | |||||||||||
| Accumulated | Survivor's | |||||||||||
| sick leave | Pension Plan | Total | Total | |||||||||
| Interest on obligations relating to accrued benefits | 31 | 28 | 59 | 68 | ||||||||
| Investment income of the funds | (86 | ) | (29 | ) | (115 | ) | (120 | ) | ||||
| (55 | ) | (1 | ) | (56 | ) | (52 | ) | |||||
Pension plans
Several defined-benefit pension plans have been put in place by the government for its employees, for the Members of the National Assembly and for the judges. The government and participants contribute to the funding of all of these plans.
The government's defined benefits plans are divided into two categories: cost-sharing and cost-balance plans. The distinction lies in the government's responsibility for funding vested benefits and for paying benefits.
The obligations related to vested benefits borne by the participants and the net assets available for paying those benefits are set out in Appendix 4 entitled "Fiduciary transactions conducted by the government", under "Retraite Québec". Further information can be found in the financial statements of plans published by Retraite Québec.
The government's pension plans grant a defined benefit to participants when they retire, benefit calculated on the basis of an average for their best paid years, generally five, and their number of years of service. The portion of benefits accrued after July 1, 1982 or, in the case of the Pension Plan of the Université du Québec (PPUQ), after January 1, 2005, is partially indexed to the cost of living; the portion of benefits accrued before those dates is usually indexed.
The government allows its enterprises and organizations not included in the government's reporting entity1 to join its pension plans, with the employers making contributions to the plans.
______________________________________
1 It is mainly organizations that conduct fiduciary transactions for the government or provide services to bodies within the government's reporting entity.
16. Assets and liabilities regarding pension plans and other employee future benefits (cont'd)
Funding and paying benefits
The government established the RPSF to create an asset for paying all or part of the pension plans' benefits. The RPSF is for plans whose benefits are paid by the general fund of the Consolidated Revenue Fund.
Some pension plans have their own pension funds so that they can pay the benefits required by their provisions. If the amounts in a pension fund are insufficient to pay the benefits payable by the government, or if there is no pension fund, the benefits are paid by the general fund of the Consolidated Revenue Fund. This situation does not apply to the PPUQ.
Université du Québec programs
L'Université du Québec and its constituent universities offer their employees certain lump-sum payments upon early retirement as well as a retiree group insurance plan. These programs give rise to long-term obligations, the costs of which are borne in whole or in part by the government.
16. Assets and liabilities regarding pension plans and other employee future benefits (cont'd)
Characteristics of the benefit plans and the other employee future benefits
| Types of plans and programs | ||||||||||||
| Expected average | ||||||||||||
| Presence of | remaining service | |||||||||||
| Benefit plans and other | Cost- | Cost- | a specific | life (EARSL) | ||||||||
| employee future benefits | sharing(1) | balance | fund | (in years) (2) | ||||||||
| RREGOP(3) | 15 | |||||||||||
| - regular service(4) | ✓ 50.0% | |||||||||||
| - service transferred from the TPP and the CSSP | ✓ | |||||||||||
| - pension credits acquired following plan-to-plan transfers | ✓ | ✓ | ||||||||||
| PPMP | 11 | |||||||||||
| - regular service - excluding pensioners' benefits prior to January 1, 2015(4) | ✓ 50.0% | (5) | ||||||||||
| - regular service - pensioners' benefits prior to January 1, 2015 | ✓ | (6) | ||||||||||
| - service transferred from the TPP and the CSSP | ✓ | |||||||||||
| - RPSO | ✓ | |||||||||||
| TPP(3) | ✓ | 15 | ||||||||||
| PPCT(3) | ✓ | 15 | ||||||||||
| CSSP(3) | ✓ | 15 | ||||||||||
| PPUQ | ✓ | ✓ | 11 | |||||||||
| SPMSQ | 15 | |||||||||||
| - regular service since January 1, 2007 | ✓ 50.0% | (7) | ✓ | (8) | ||||||||
| - regular service prior to January 1, 2007 | ✓ | |||||||||||
| PPPOCS | ✓ 54.0% | (9) | 15 | |||||||||
| PPCJQ | ✓ | 10 | ||||||||||
| PPFEQ | ✓ | ✓ | 2 | |||||||||
| PPMNA | ✓ | 7 | ||||||||||
| Université du Québec programs | ✓ 50.0% | ✓ | 14 | |||||||||
(1) The percentage indicated represents the portion of obligations relating to accrued benefits payable by the government.
(2) The EARSL is used to determine the amortization period for the plan's actuarial gains and losses.
(3) A common EARSL is used for this group of plans whose continuity is ensured by the Government and Public Employees Retirement Plan (RREGOP).
(4) Contributions paid by employers required to pay contributions are deposited in a transitional fund. This fund is liquidated regularly because the sums deposited in it are used to pay benefits.
(5) The government's portion is 58.3% in the case of benefits accrued prior to July 1, 1982.
(6) In accordance with the Act to foster the financial health and sustainability of the Pension Plan of Management Personnel and to amend various legislative provisions (S.Q. 2017, chapter 7), the government covers the portion of benefits payable by participants to pensioners who retired before January 1, 2015 or to their assigns. In exchange, a share of the value of the contribution fund of PPMP participants was deposited to the RPSF.
(7) The government's portion is 50.0% in the case of benefits accrued since January 1, 2022, 55.0% in the case of benefits accrued between January 1, 2021 and January 1, 2022, 61.0% in the case of benefits accrued between January 1, 2020 and January 1st, 2021 and 66.7% in the case of benefits accrued before January 1st, 2020.
(8) Every three years at the latest, the government must pay its contributions into the fund, as determined by the actuarial valuation realized for that purpose.
(9) The government's portion is 46.0% in the case of benefits accrued prior to January 1, 2013.
16. Assets and liabilities regarding pension plans and other employee future benefits (cont'd)
Liabilities regarding the pension plans and other employee future benefits
(millions of dollars)
| As at March 31 | |||||||||||||
| Value before | |||||||||||||
| unamortized | Unamortized | ||||||||||||
| actuarial | actuarial | ||||||||||||
| (losses) gains | (losses) gains | 2024 | 2023 | ||||||||||
| Obligations relating to accrued benefits | |||||||||||||
| RREGOP | |||||||||||||
| - | regular service | 82 918 | (5 047 | ) | 77 871 | 74 285 | |||||||
| - | transferred service | 1 856 | (205 | ) | 1 651 | 2 191 | |||||||
| PPMP | |||||||||||||
| - | regular service | 19 758 | (419 | ) | 19 339 | 18 642 | |||||||
| - | transferred service | 942 | (75 | ) | 867 | 896 | |||||||
| - | RPSO | 2 546 | (133 | ) | 2 413 | 2 267 | |||||||
| TPP | 8 005 | (762 | ) | 7 243 | 7 587 | ||||||||
| PPCT | 894 | (137 | ) | 757 | 800 | ||||||||
| CSSP | 2 513 | (220 | ) | 2 293 | 2 428 | ||||||||
| PPUQ | 4 843 | 173 | 5 016 | 4 820 | |||||||||
| SPMSQ | 5 605 | (549 | ) | 5 056 | 4 908 | ||||||||
| PPPOCS | 746 | (52 | ) | 694 | 657 | ||||||||
| PPCJQ | 1 082 | (101 | ) | 981 | 923 | ||||||||
| PPFEQ | 221 | (7 | ) | 214 | 205 | ||||||||
| PPMNA | 260 | (15 | ) | 245 | 236 | ||||||||
| 132 189 | (7 549 | ) | 124 640 | 120 845 | |||||||||
| Less: | |||||||||||||
| Retirement Plans Sinking Fund | 117 671 | 3 389 | 114 282 | 107 059 | |||||||||
| Specific pension plan funds | |||||||||||||
| PPUQ fund | 5 812 | 131 | 5 681 | 5 363 | |||||||||
| SPMSQ fund | 1 292 | 38 | 1 254 | 1 211 | |||||||||
| Other pension plan funds | 451 | 5 | 446 | 913 | |||||||||
| Valluation allowance - PPUQ | (684 | ) | (684 | ) | (561 | ) | |||||||
| Valluation allowance - other funds | (77 | ) | (77 | ) | (82 | ) | |||||||
| 6 794 | 174 | 6 620 | 6 844 | ||||||||||
| 7 724 | (3 986 | ) | 3 738 | 6 942 | |||||||||
| Université du Québec programs | |||||||||||||
| Obligations relating to accrued benefits | 284 | 21 | 305 | 295 | |||||||||
| 8 008 | (3 965 | ) | 4 043 | 7 237 | |||||||||
16. Assets and liabilities regarding pension plans and other employee future benefits (cont'd)
Change in obligations relating to accrued pension plan benefits and other employee future benefits
(millions of dollars)
| Fiscal year ended March 31 | ||||||||||||
| 2024 | 2023 | |||||||||||
| Université | Université | |||||||||||
| Pension | du Québec | Pension | du Québec | |||||||||
| plans | programs | plans | programs | |||||||||
| Obligations, beginning of year | 126 908 | 271 | 121 942 | 294 | ||||||||
| Cost of accrued benefits | 3 352 | 19 | 3 267 | 21 | ||||||||
| Interest on obligations | 7 881 | 10 | 7 572 | 10 | ||||||||
| Compensation | 36 | 96 | ||||||||||
| Benefits paid | (7 734 | ) | (22 | ) | (7 437 | ) | (23 | ) | ||||
| Plan-to-plan transfers | 38 | 33 | ||||||||||
| Changes to plans | 8 | 7 | ||||||||||
| Actuarial losses (gains) | 2 162 | 6 | 1 424 | (31 | ) | |||||||
| Change in obligations relating to certain pension credits(1) | (462 | ) | 4 | |||||||||
| Obligations, end of year | 132 189 | 284 | 126 908 | 271 | ||||||||
(1) Pursuant to the Act amending mainly certain Acts establishing public sector pension plans (SQ 2023, chapter 6), assented to in April 2023, the government has transferred to the members' fund the fund established to cover the payment of certain pension credits acquired following the transfer of supplemental pension plans to RREGOP. The participants in the RREGOP now assume the obligations pertaining to these pension credits. In exchange for the settlement of these obligations, the government received $44.5M from the members' fund, which was collected in the Consolidated Revenue Fund and does not affect the liabilities of the pension plans.
16. Assets and liabilities regarding pension plans and other employee future benefits (cont'd)
Actuarial valuations
Every three years, the value of obligations relating to accrued benefits of the pension plans and the Université du Québec programs is determined by actuarial valuations. The value of these obligations is extrapolated for the period between two actuarial valuations.
Date of the most recent actuarial valuations used to determine the value of obligations related to vested benefits
| December 31, 2023 | December 31, 2022 | December 31, 2021 | December 31, 2020 | |||
| (filed in 2023-2024) | (filed in 2023-2024) | (filed in 2022-2023) | (filed in 2021-2022) | |||
| PPUQ | RPSO | RREGOP | RREGOP | |||
| PPPOCS | - pension credits related to plan-to-plan transfers | - regular service | ||||
| PPCJQ | - redemption of years of service | - service transferred from the CSSP and the TPP | ||||
| PPFEQ | PPCT | PPMP | ||||
| PPMNA | SPMSQ | - regular service(1) | ||||
| Université du Québec programs | - service transferred from the CSSP and the TPP | |||||
| TPP | ||||||
| CSSP | ||||||
Note: The filing year corresponds to the government fiscal year for which an actuarial valuation of the plan is required, based on the timetable for preparing the valuation.
(1) PPMP regular service is divided into two categories, as shown previously in the table entitled "Characteristics of the benefit plans and the other employee future benefits".
Main economic assumptions
(percent)
| Université | |||||||||||||||
| Plans administered by | du Québec | ||||||||||||||
| Retraite Québec | PPUQ | programs | |||||||||||||
| 2034 and | 2034 and | 2024 and | |||||||||||||
| 2024-2033 | thereafter | 2024-2033 | thereafter | thereafter | |||||||||||
| Rate of return, net of inflation | 4.35 | 4.35 | 4.70 | 4.70 | ― | ||||||||||
| Inflation rate | 2.00 | 2.00 | 2.00 | 2.00 | 2.00 | ||||||||||
| Discount rate for obligations relating to accrued benefits | 6.35 | 6.35 | 6.70 | 6.70 | 3.90 | ||||||||||
| Salary growth rate, net of inflation | 0.64 | 0.50 | 0.64 | 0.50 | 0.50 | ||||||||||
16. Assets and liabilities regarding pension plans and other employee future benefits (cont'd)
Impact of a change in the main assumptions on the value of obligations relating to accrued benefits under the main pension plans
| Assumptions | Change | Impact on the value of obligations | ||||||
| as at March 31, 2024 | ||||||||
| (millions of dollars) | (percent) | |||||||
| Economic | ||||||||
| - Rate of return, net of inflation | - Increase of 0.05% | (750 | ) | -0.65 | ||||
| - Decrease of 0.05% | 760 | +0.65 | ||||||
| - Inflation rate | - Increase of 0.25% | (1 640 | ) | -1.41 | ||||
| - Decrease of 0.25% | 1 740 | +1.50 | ||||||
| - Salary growth rate, net of inflation | - Increase of 0.25% | 650 | +0.56 | |||||
| - Decrease of 0.25% | (630 | ) | -0.54 | |||||
| Demographic | ||||||||
| - Life expectancy(1) | - Increase of 0.5 year | 860 | +0.74 | |||||
| - Decrease of 0.5 year | (880 | ) | -0.76 | |||||
Note: The main pension plans are the RREGOP - regular service, the PPMP - regular service, the Teachers Pension Plan (TPP) and the Superannuation Plan for the Members of the Sûreté du Québec (SPMSQ).
(1) According to current RREGOP assumptions, the life expectancy of recipients aged 60 is 26.7 years for men and 29.7 years for women.
RPSF investment policy
The sums deposited in the RPSF are entrusted to the Caisse. The Caisse manages these sums according to the investment policy set by the Minister of Finance. This policy provides for investments in a diversified portfolio that includes fixed income securities (for example, bonds), inflation-sensitive investments (for example, actual assets such as real estate assets and infrastructure) and equity.
RPSF portfolio
(percent)
| As at March 31 | ||||||
| 2024 | 2023 | |||||
| Fixed-income securities | 34.00 | 33.00 | ||||
| Actual assets | 23.50 | 23.50 | ||||
| Equity | 42.50 | 43.50 | ||||
| 100.00 | 100.00 | |||||
16. Assets and liabilities regarding pension plans and other employee future benefits (cont'd)
Change in the adjusted market value of the RPSF and specific pension plan funds
(millions of dollars)
| Fiscal year ended March 31 | ||||||||||||||||||
| 2024 | 2023 | |||||||||||||||||
| Other | ||||||||||||||||||
| PPUQ | SPMSQ | pension | ||||||||||||||||
| RPSF | fund | fund | plan funds | Total | Total | |||||||||||||
| Adjusted market value, beginning of year | 110 948 | 5 499 | 1 258 | 926 | 118 631 | 111 809 | ||||||||||||
| Anticipated investment income | 7 045 | (1) | 355 | 79 | 25 | 7 504 | 7 061 | |||||||||||
| Contributions paid(2) | 172 | 333 | 505 | 477 | ||||||||||||||
| Benefits paid | (228 | ) | (41 | ) | (364 | ) | (633 | ) | (571 | ) | ||||||||
| Actuarial (losses) gains | (322 | ) | 14 | (4 | ) | (7 | ) | (319 | ) | (149 | ) | |||||||
| Change in the value of assets relating to certain pension credits(3) | (462 | ) | (462 | ) | 4 | |||||||||||||
| Adjusted market value, end of year(4) | 117 671 | 5 812 | 1 292 | 451 | 125 226 | 118 631 | ||||||||||||
(1) The forecast return on the RPSF was 6.35% (6.35% in 2022-2023); the realized return, based on the market value of investments, was 5.97% (2.57% in 2022-2023).
(2) This item included $238M ($231M in 2022-2023) in contributions from participants, government enterprises and organizations not included in the government's reporting entity.
(3) Pursuant to the Act amending mainly certain Acts establishing public sector pension plans (SQ 2023, chapter 6), assented to in April 2023, the government has transferred to the members' fund the fund established to cover the payment of certain pension credits acquired following the transfer of supplemental pension plans to RREGOP. The members of the RREGOP now assume the obligations pertaining to these pension credits. In exchange for the settlement of these obligations, the government received $44.5M from the members' fund, which was collected in the Consolidated Revenue Fund and does not affect the liabilities of the pension plans.
(4) The market value of the RPSF and the specific pension plan funds totalled $125 699M ($119 087M as at March 31, 2023). More precisely, the respective market values of the RPSF, the PPUQ fund, the SPMSQ fund and other specific pension funds were $118 068M, $5 896M, $1 294M and $441M, respectively ($111 400M, $5 521M, $1 260M and $906M, respectively, as at March 31, 2023).
16. Assets and liabilities regarding pension plans and other employee future benefits (cont'd)
Accrued benefits expense relating to pension plans and other employee future benefits
(millions of dollars)
| Fiscal year ended March 31 | ||||||||||||||||||
| 2024 | 2023 | |||||||||||||||||
| Université | Université | |||||||||||||||||
| Pension | du Québec | Pension | du Québec | |||||||||||||||
| plans | programs | Total | plans | programs | Total | |||||||||||||
| Cost of accrued benefits | 3 352 | 19 | 3 371 | 3 267 | 21 | 3 288 | ||||||||||||
| Compensation | 36 | 36 | 96 | 96 | ||||||||||||||
| Contributions from participants and employers | (238 | ) | (238 | ) | (231 | ) | (231 | ) | ||||||||||
| 3 150 | 19 | 3 169 | 3 132 | 21 | 3 153 | |||||||||||||
| Changes to plans | 8 | 8 | 7 | 7 | ||||||||||||||
| Amortization of actuarial losses | 676 | 3 | 679 | 734 | 5 | 739 | ||||||||||||
| Change in valuation allowances | 118 | 118 | 112 | 112 | ||||||||||||||
| 3 952 | 22 | 3 974 | 3 985 | 26 | 4 011 | |||||||||||||
Debt service expense relating to pension plans and other employee future benefits
(millions of dollars)
| Fiscal year ended March 31 | ||||||||||||||||||
| 2024 | 2023 | |||||||||||||||||
| Université | Université | |||||||||||||||||
| Pension | du Québec | Pension | du Québec | |||||||||||||||
| plans | programs | Total | plans | programs | Total | |||||||||||||
| Interest on obligations relating to accrued benefits | 7 881 | 10 | 7 891 | 7 572 | 10 | 7 582 | ||||||||||||
| Investment income of the funds(1) | (7 707 | ) | (7 707 | ) | (7 142 | ) | (7 142 | ) | ||||||||||
| 174 | 10 | 184 | 430 | 10 | 440 | |||||||||||||
(1) This revenue includes $203M ($81M in 2022-2023) stemming from the depreciation of the actuarial gains related to the RPSF and the specific retirement plan funds.
▌ 17. Assets and liabilities related to derivative financial instruments
The government uses derivative financial instruments to manage the financial risks associated with its financial assets and liabilities. Derivative financial instruments such as currency swap contracts and foreign exchange forward contracts are used to manage the foreign exchange risk associated with the repayment of interest and principal on foreign currency debts and the related cash management, as well as for other operations carried out in foreign currencies.
Interest rate swap contracts are used to modify exposure to interest rate risk on long-term financial instruments to meet the target breakdown of fixed-rate and variable-rate debt set by the government in its risk management strategies.
Significant accounting policies |
Derivative financial instruments are recognized at fair value. Sums receivable from (payable to) counterparties are recognized at cost or amortized cost. The government elects to recognize directly in income foreign exchange gains and losses on sums receivable from (payable to) counterparties and on foreign exchange forward contracts to cover these amounts, as well as on foreign currency operations. |
Measurement uncertainty |
Derivative financial instruments are subject to measurement uncertainty due to the use of assumptions in measuring their fair value. The measurement methods used for these instruments are presented below. |
Measurement method for derivative financial instruments
The fair value of these financial instruments is based on Level 2 of the fair value hierarchy, which means that the fair value is calculated using valuation techniques whose significant inputs are observable, either directly or indirectly.
Interest rate swaps and currency swaps are valued by discounting future cash flows to present value at the current exchange rates. Variable future cash flows are determined on the basis of forward interest rate structures.
Foreign exchange forward contracts are valued by discounting future cash flows to present value at the current exchange rate.
These valuations require the development and use of assumptions that take into account observable inputs such as interest rate curves, yield curves as well as foreign exchange rates. The valuation method for certain swaps and other derivatives may take into account additional observable data, such as underlying instruments prices and volatility.
17. Assets and liabilities related to derivative financial instruments (cont'd)
Details of assets and liabilities related to derivative financial instruments
(millions of dollars)
| As at March 31 | ||||||
| 2024 | 2023 | |||||
| ASSETS RELATED TO DERIVATIVE FINANCIAL INSTRUMENTS | ||||||
| Recorded at cost or amortized cost | ||||||
| Sums receivable from counterparties | 4 127 | 5 043 | ||||
| Recorded at fair value | ||||||
| Currency swap contracts | 2 805 | 2 971 | ||||
| Interest rate swap contracts | 2 717 | 2 817 | ||||
| Other | 400 | 378 | ||||
| 5 922 | 6 166 | |||||
| 10 049 | 11 209 | |||||
| LIABILITIES RELATED TO DERIVATIVE FINANCIAL INSTRUMENTS | ||||||
| Recorded at cost or amortized cost | ||||||
| Sums payable to counterparties | 1 379 | 1 446 | ||||
| Recorded at fair value | ||||||
| Currency swap contracts | 2 539 | 2 843 | ||||
| Interest rate swap contracts | 5 637 | 6 043 | ||||
| Other | 356 | 352 | ||||
| 8 532 | 9 238 | |||||
| 9 911 | 10 684 | |||||
17. Assets and liabilities related to derivative financial instruments (cont'd)
Credit and liquidity risks management
As part of credit risk management for transactions involving derivative financial instruments, the government has adopted a credit risk management policy that limits potential counterparty losses. In accordance with this policy, the government conducts the transactions on over-the-counter derivative financial instruments only with counterparties with which it has concluded framework agreements.
Under framework agreements, a credit support is provided when the fair value of the derivative financial instruments held exceeds a certain threshold. The excess can then be covered through short-term securities or cash and recognized as sums receivable from (payable to) counterparties. This credit support helps limit the government's liquidity risk, in addition to its credit risk, with respect to derivative financial instruments transactions. In addition, for certain derivative financial instruments, the government exchanges guarantees with its counterparties.
The government conducts the transactions with major financial institutions whose credit rating is evaluated by at least two credit rating agencies, one of which must be Standard & Poor's or Moody's. When a transaction agreement comes into effect, the financial institution must have a rating of A or higher from at least one of the agencies that evaluated it. As at March 31, 2024 and 2023, 100% of the transactions in effect met this criterion.
Currency risk management
Certain sums receivable from (payable to) counterparties are denominated in foreign currencies. To limit the currency risk associated with these sums, the government uses foreign exchange forward contracts.
▌ 18. Debts
The government's debts mainly comprise debts contracted on the financial markets. Sinking funds relating to borrowings arise from commitments made by the government to repay these debts.
They also include those stemming from public private partnerships in respect of which the government makes payments to the partner that are recorded as debts for the portion of the capital assets built (Note 19), or presented as contractual obligations (Note 20) for the portion relating to future maintenance or the future exploitation of the capital assets.
Significant accounting policies |
Debts Debts are recognized at amortized cost using the effective interest method. Sinking funds relating to borrowings Financial instruments included in sinking funds relating to borrowings are recognized at cost or amortized cost using the effective interest method. Moreover, the government conducts purchases and sales of securities, such as Treasury bills and bonds, which it agrees to resell or repurchase from a counterparty at a future date. These transactions are reverse repurchase agreements or repurchase agreements. The government disburses or receives an amount upon conclusion of these transactions. Securities purchased under reverse repurchase agreements Under these operations, the counterparty retains the risks and benefits associated with the securities. An amount receivable is recognized under "Securities purchased under reverse repurchase agreements" when the amount is disbursed. Moreover, the government can sell these securities, but must purchase them on terms similar to those sold, in order to deliver them to the counterparty at the time stipulated in the reverse repurchase agreement. In this case, the obligation to deliver securities with similar conditions is recognized in liabilities under "Obligations to deliver securities" until the securities are effectively delivered to the counterparty. Securities sold under repurchase agreements Securities sold remain recorded in the consolidated statement of financial position, as the government retains the risks and benefits associated with these securities. An amount receivable is recognized under "Securities sold under repurchase agreements" when the amount is cashed. |
18. Debts (cont'd)
Debts by category
(millions of dollars)
| As at March 31 | ||||||||||||||||||
| 2024 | 2023 | |||||||||||||||||
| (restated - Note 3) | ||||||||||||||||||
| Equivalent in Canadian dollars | ||||||||||||||||||
| Canadian | US | Other | ||||||||||||||||
| dollars | dollars | Euros | currencies (1) | Total | Total | |||||||||||||
| Debts contracted on financial markets | ||||||||||||||||||
| Bonds and notes(2),(3) | 194 609 | 34 782 | 29 699 | 5 268 | 264 358 | 245 923 | ||||||||||||
| Savings products(3) | 15 162 | 15 162 | 13 645 | |||||||||||||||
| Treasury bills(2) | 8 410 | 8 410 | 6 439 | |||||||||||||||
| Short-term borrowings(4) | 341 | 8 681 | 9 022 | 2 455 | ||||||||||||||
| Mortgage loans | 39 | 39 | 43 | |||||||||||||||
| 218 561 | 43 463 | 29 699 | 5 268 | 296 991 | (5) | 268 505 | ||||||||||||
| Less: | ||||||||||||||||||
| Debts whose securities are held in treasury | ||||||||||||||||||
| Bonds and notes | 11 366 | 2 385 | 13 751 | 15 573 | ||||||||||||||
| Treasury bills | 35 | 35 | ― | |||||||||||||||
| 11 401 | 2 385 | ― | ― | 13 786 | 15 573 | |||||||||||||
| Sub-total | 207 160 | 41 078 | 29 699 | 5 268 | 283 205 | 252 932 | ||||||||||||
| Debts arising from agreements and contracts | ||||||||||||||||||
| Private-public partnership agreements | 3 830 | 3 830 | 3 891 | |||||||||||||||
| Capital leases | 559 | 559 | 567 | |||||||||||||||
| 4 389 | ― | ― | ― | 4 389 | 4 458 | |||||||||||||
| Total debts | 211 549 | 41 078 | 29 699 | 5 268 | 287 594 | 257 390 | ||||||||||||
(1) Other currencies included the Australian dollar, the pound sterling, the Swiss franc, the yen, the Swedish krona and the New Zealand dollar.
(2) The Government held $831M ($801M as at March 31, 2023) of these securities through its investments in government enterprises.
(3) These categories included securities issued with a book value of $4 037M ($4 212M as at March 31, 2023), the proceeds of which are allocated to specific projects with environmental benefits.
(4) Short-term borrowings are mainly comprised of bank loans and short-term notes.
(5) The government had debts contracted on the financial markets in respect of which the cash totalling $5 636M has not been received as at March 31, 2024 (no cash was received to this end as at March 31, 2023).
18 Debts (cont'd)
Debts arising from public private partnership agreements and capital leases
(millions of dollars)
| As at March 31 | |||||||||||||||
| 2024 | 2023 | ||||||||||||||
| (restated - Note 3) | |||||||||||||||
| Equivalent in Canadian dollars | |||||||||||||||
| Number of | Contractual | ||||||||||||||
| agreements | Maturity | obligations (1) | Debts | Debts | |||||||||||
| Public private partnership agreements(2) | |||||||||||||||
| University hospitals | 3 | 2044 to 2050 | 3 228 | 2 586 | 2 623 | ||||||||||
| Université de Montréal and McGill University (including their respective research centres) | |||||||||||||||
| Road transportation infrastructure | 2 | 2043 | 528 | 1 107 | 1 127 | ||||||||||
| Autoroutes 25 and 30 (including their respective toll bridges) | |||||||||||||||
| Other | 2 | 2039 to 2044 | 310 | 137 | 141 | ||||||||||
| Maison symphonique de Montréal | |||||||||||||||
| Centre de détention Sorel-Tracy | |||||||||||||||
| 7 | 4 066 | 3 830 | 3 891 | ||||||||||||
| Capital leases | 559 | 567 | |||||||||||||
| 4 389 | 4 458 | ||||||||||||||
(1) These contractual obligations to supply goods and services (Note 20) mainly concern infrastructure exploitation and maintenance.
(2) The agreements have been concluded for a period ranging from 25 to 39 years.
18 Debts (cont'd)
Weighted average rate of debts
(percent)
| As at March 31 | ||||||
| 2024 | 2023 | |||||
| (restated - Note 3) | ||||||
| Rate by currency - Before consideration of assets and liabilities related to derivative financial instruments | ||||||
| Debts contracted on financial markets | ||||||
| In Canadian dollars | 3.60 | 3.49 | ||||
| In US dollars | 3.71 | 3.40 | ||||
| In euros | 1.16 | 1.06 | ||||
| In other currencies(1) | 2.20 | 2.11 | ||||
| Debts arising from private-public partnership agreements | ||||||
| In Canadian dollars | 8.54 | 8.54 | ||||
| Debts arising from capital leases | ||||||
| In Canadian dollars | 5.01 | 5.01 | ||||
| Weighted average government rate - After consideration of assets and liabilities related to derivative financial instruments | 3.87 | 3.73 | ||||
Note: Weighted average rates for debt contracted on financial markets are determined on the basis of effective interest rates prevailing at March 31, and the average weighted rate of the debts stemming from public private partnerships is determined according to the implicit rate of each agreement.
(1) Other currencies included the Australian dollar, the pound sterling, the Swiss franc, the yen, the Swedish krona and the New Zealand dollar.
18 Debts (cont'd)
Debt repayment schedule
(millions of dollars)
| Equivalent in Canadian dollars | |||||||||
| Maturing on March 31 | Debts contracted on financial markets (nominal value)(1) | Debts arising from agreements and contracts | Total | ||||||
| 2025 | 42 308 | 85 | 42 393 | ||||||
| 2026 | 20 837 | 91 | 20 928 | ||||||
| 2027 | 18 488 | 98 | 18 586 | ||||||
| 2028 | 12 903 | 106 | 13 009 | ||||||
| 2029 | 13 845 | 115 | 13 960 | ||||||
| 108 381 | 495 | 108 876 | |||||||
| 2030-2034 | 93 158 | 712 | 93 870 | ||||||
| 2035-2039 | 13 149 | 993 | 14 142 | ||||||
| 2040-2044 | 18 247 | 1 275 | 19 522 | ||||||
| 2045-2049 | 21 655 | 650 | 33 305 | ||||||
| 2050 and thereafter | 40 361 | 264 | 40 625 | ||||||
| 294 951 | 4 389 | 299 340 | |||||||
| Less: | |||||||||
| Debts whose securities are held in treasury | 13 728 | 13 728 | |||||||
| 281 223(2 | ) | 4 389 | 285 612 | ||||||
(1) This schedule provides for repayments of $2 781M in 2025, $702M in 2026, $442M in 2027, $298M in 2028, $194M in 2029 and $237M for the years 2030-2034 in respect of demand redeemable savings products of $4 654M.
(2) The repayment schedule for debts contracted on the financial markets is based on the nominal value of the debts stipulated in the contracts. This basis differs from the book value of debts, which, for the purposes of calculating the effective interest rate, takes into account transaction costs, and discounts and premiums. These elements have a net effect of $1 982M.
Risks management relating to debts
In order to meet its financial requirements arising from its operations and investment activities as well as those related to the repayment of borrowings that are maturing, the government has provided itself with an annual financing and debt-management program based on Canadian and international financial markets.
Participation in these markets exposes the government to liquidity risk, interest rate risk and currency risk. Therefore, the government devises risk-management strategies using the different derivative financial instruments at its disposal. Risk management is carried out on debts contracted on the markets, including debts whose securities are held in treasury.
18. Debts (cont'd)
Liquidity risk
In order to limit the liquidity risk, the government has, among other things, lines of credit notably in the general fund of the Consolidated Revenue Fund totalling CAN$1 165 million with various Canadian banking institutions. As at March 31, 2024 and 2023, the balance of these lines was nil.
The government also has a credit agreement totalling US$3 250 million with a Canadian and international banking syndicate. To date, no transactions have been carried out under this credit agreement.
In addition, the government maintains prudential liquid assets in the sinking funds for government borrowings, invested mainly in highly liquid securities of the federal government. In the event of major disruptions in financial markets, these securities can be sold and the liquid assets recovered rapidly, thus enabling the government to honour its financial commitments. As at March 31, 2024, the book value of prudential liquid assets was CAN$13 200 million (CAN$13 171 million as at March 31, 2023).
Currency risk
To manage the currency risk, the government uses derivative financial instruments aimed at exchanging cash flows from one currency to another, such as currency swap contracts and foreign exchange forward contracts.
After taking into account the effect of the derivative financial instruments used to manage currency risk, the net exposure of foreign currency debts contracted on the markets was negligible at March 31, 2024 and as at March 31, 2023 compared with the nominal value of the debts. It amounts to $183 million ($143 million as at March 31, 2023).
Net exposure after currency risk management on debt in foreign currencies contracted on financial markets
(millions of dollars)
| As at March 31 | ||||||||||||
| 2024 | 2023 | |||||||||||
| Equivalent in Canadian dollars | ||||||||||||
| Derivative | ||||||||||||
| financial | Net | Net | ||||||||||
| Debts | instruments | |||||||||||
| (nominal value) | (nominal value) | exposure | exposure | |||||||||
| In US dollars | 43 583 | 43 540 | 43 | 41 | ||||||||
| In euros | 29 803 | 29 663 | 140 | 102 | ||||||||
| In other currencies | 5 270 | 5 270 | ― | ― | ||||||||
| 78 656 | 78 473 | 183 | 143 | |||||||||
18. Debts (cont'd)
Interest rate risk
To manage its exposure to interest rate risk, the government uses interest rate swap contracts or other types of derivative financial instruments. Interest rate swap contracts make it possible to exchange payments of interest at variable rates for payments of interest at fixed rates, or vice versa, on the basis of a reference par value.
After taking into account derivative financial instruments used to manage interest rate risk and sinking funds relating to borrowings, debt contracted on financial markets consisted of 84% fixed-rate debt and 16% variable-rate debt as at March 31, 2024 (83% at fixed interest rates and 17% at variable interest rates as at March 31, 2023). Fixed-rate debt is debt that will not mature or change interest rate during the next fiscal year.
Sinking funds relating to borrowings
These funds are attached to $108 620 million of debt ($106 484 million as at March 31, 2023).
Balance of sinking funds relating to borrowings
(millions of dollars)
| As at March 31 | ||||||
| 2024 | 2023 | |||||
| Equivalent in Canadian dollars | ||||||
| Assets | ||||||
| Investments(1) | ||||||
| Treasury bills | 9 987 | 9 172 | ||||
| Bonds and notes(2),(3) | 12 252 | 9 419 | ||||
| 22 239 | 18 591 | |||||
| Securities purchased under reverse repurchase agreements | 3 089 | 7 407 | ||||
| Accrued interest and other assets(2) | 96 | 59 | ||||
| 25 424 | 26 057 | |||||
| Liabilities | ||||||
| Securities sold under repurchase agreements | 2 418 | 5 121 | ||||
| Obligations to deliver securities | 1 243 | 2 623 | ||||
| Other | 15 | 64 | ||||
| 3 676 | 7 808 | |||||
| Funds balance | 21 748 | 18 249 | ||||
(1) The price of securities quoted in an active market was $22 107M ($18 351M as at March 31, 2023) and their book value was $22 239M ($18 591M as at March 31, 2023).
(2) The government also held $9 921M ($13 358M as at March 31, 2023) of its own securities in bonds and notes and $117M ($128M as at March 31, 2023) in accrued interest on these securities. These items are offset against the corresponding debts.
(3) As part of its operations related to risk management, the government gives as security financial securities. As at March 31, 2024, the government had given investment securities whose book value was $83M ($217M as at March 31, 2023).
18. Debts (cont'd)
Change in the balance of sinking funds relating to borrowings
(millions of dollars)
| Fiscal year ended March 31 | ||||||
| 2024 | 2023 | |||||
| Equivalent in Canadian dollars | ||||||
| Opening balance before offsetting securities held in treasury | 31 735 | 32 134 | ||||
| Payments from the general fund of the Consolidated Revenue Fund and from other entities included in the government's reporting entity | 4 228 | 3 586 | ||||
| Net gains (losses) on investments | 664 | (637 | ) | |||
| Net remeasurement (losses) gains | (17 | ) | 243 | |||
| 36 610 | 35 326 | |||||
| Sums used to repay debts | (4 824 | ) | (3 591 | ) | ||
| Balance before offsetting securities held in treasury | 31 786 | 31 735 | ||||
| Less: | ||||||
| Securities held in treasury | 10 038 | 13 486 | ||||
| Closing balance | 21 748 | 18 249 | ||||
Risks management of sinking funds relating to borrowings
Risk management is carried out on assets and liabilities held in sinking funds relating to borrowings, including those whose securities are held in treasury. The monetary sums making up these funds are managed according to an investment policy.
18. Debts (cont'd)
Credit and liquidity risks
The credit risk associated with investments held in sinking funds relating to borrowings is limited, because the management framework and the investment policy limit the risks associated with government investments. This framework includes criteria such as the minimum credit rating required for the selection of authorized issuers, which are mainly financial institutions and governments.
The credit and liquidity risks associated with reverse repurchase and repurchase agreement transactions are low, since the government has adopted a management policy specific to these financial instruments, which enables it to limit potential losses. Under this policy, agreements are signed with counterparties, providing for the exchange of guarantees based on the net position related to these transactions.
Debt repayment schedule after effect of derivative financial instruments and amounts accumulated in sinking funds relating to borrowings
(millions of dollars)
| Equivalent in Canadian dollars | |||||||||||||||||||||
| Debts contracted on financial markets after taking into account derivative financial instruments (nominal value) | |||||||||||||||||||||
| Sinking funds | |||||||||||||||||||||
| Maturing on | Canadian | Other | relating to | ||||||||||||||||||
| March 31 | dollars | US dollars | Euros | currencies | Sub-total | borrowings | Total | ||||||||||||||
| 2025 | 41 800 | 41 800 | (6 498 | ) | 35 302 | ||||||||||||||||
| 2026 | 20 955 | 20 955 | (3 322 | ) | 17 633 | ||||||||||||||||
| 2027 | 18 046 | 18 046 | (3 446 | ) | 14 600 | ||||||||||||||||
| 2028 | 12 939 | 12 939 | (1 463 | ) | 11 476 | ||||||||||||||||
| 2029 | 13 833 | 3 | 13 836 | (1 801 | ) | 12 035 | |||||||||||||||
| 107 573 | 3 | ― | ― | 107 576 | (16 530 | ) | 91 046 | ||||||||||||||
| 2030-2034 | 92 755 | 40 | 80 | 92 875 | (11 191 | ) | 81 684 | ||||||||||||||
| 2035-2039 | 13 025 | 61 | 13 086 | ― | 13 086 | ||||||||||||||||
| 2040-2044 | 18 247 | 18 247 | (1 242 | ) | 17 005 | ||||||||||||||||
| 2045-2049 | 21 655 | 21 655 | (1 826 | ) | 19 829 | ||||||||||||||||
| 2050 and thereafter | 40 361 | 40 361 | (997 | ) | 39 364 | ||||||||||||||||
| 293 616 | 43 | 141 | ― | 293 800 | (1) | (31 786 | ) | 262 014 | |||||||||||||
(1) The repayment schedule for debt contracted on financial markets is based on the nominal value of the debt provided for in the contracts, and takes into account the effect of derivative financial instruments. This basis differs from the book value of $296 991M, as transaction costs, discounts and premiums of $2 040M are not included in the nominal value, while the net effect of downward derivative financial instruments of $1 151M is not included in the book value.
▌ 19. Fixed assets
Significant accounting policies |
Fixed assets Fixed assets are recognized at cost and depreciated except for land-which is not depreciated-on a straight-line basis over a period corresponding to their useful life. Their cost includes financing charges capitalized during their construction, improvement, development as well as asset retirement costs, where applicable. Fixed assets under construction, development or improvement are not depreciated. Works of art and historic properties, such as paintings, sculptures, drawings, prints, photographs, films and videos are recognized as expenditure in the fiscal year during which they are acquired. Fixed assets acquired through government transfer or through donation, including those acquired for a nominal value, are recognized at their fair value at the time of acquisition. Land in the public domain and natural resources, such as forests, water and mining resources, which the government holds by virtue without their being purchased, are not recorded in the government's consolidated financial statements. Fixed assets held under capital leases The cost of fixed assets held under capital leases is equal to the present value of minimum payments due for the rental of such assets, without exceeding the fair value of the leased asset. Fixed assets acquired under public private partnership agreements Fixed assets acquired under public private partnership agreements constitute infrastructure projects stemming from long-term contracts by which the government forms a partnership with at least one private partner to complete them and that satisfy the following conditions:
The capital assets acquired under the public private partnership agreements are recognized at cost, which represents the fair value on the date of recognition and are amortized on a straight-line basis over a period corresponding to their useful life. |
19. Fixed assets (cont'd)
Categories |
| Useful life |
Buildings (Institutional and operational buildings, leasehold improvements, etc.) |
| 10 to 50 years(1) |
Facilities (Organization and development of natural spaces: land, parks, forests, |
| 5 to 20 years |
Complex networks (Road, maritime and air transportation infrastructures, natural resource development networks, dams and other large structures, etc.) |
| 10 to 60 years |
Equipment (Transport vehicles, machinery, office furniture and equipment, specialized medical, educational, scientific or industrial equipment, etc.) |
| 3 to 30 years |
Data processing and office automation equipment (Computers, printers and other peripheral devices, software, telecommunication, radiocommunication or information processing equipment, etc.) |
| 3 to 10 years |
Development of data processing systems (Design, production and implementation of data processing systems, including equipment and software acquired for this purpose) |
| 5 to 10 years |
(1) Asset retirement costs capitalized in the buildings category are amortized over a period of up to 125 years.
19. Fixed assets (cont'd)
Change in fixed assets by category
(millions of dollars)
| Land | Buildings | Facilities | Complex networks | Equipment | Data processing and office automation equipment | Develop- ment of data processing systems | Total | |||||||||||||||||
| COST | ||||||||||||||||||||||||
| Previously established opening balance | 3 136 | 78 310 | 2 698 | 51 894 | 14 010 | 4 065 | 6 592 | 160 705 | ||||||||||||||||
| Accounting changes (Note 3) | 242 | 242 | ||||||||||||||||||||||
| Restated opening balance | 3 136 | 78 552 | 2 698 | 51 894 | 14 010 | 4 065 | 6 592 | 160 947 | ||||||||||||||||
| Acquisitions | 132 | 882 | 21 | 36 | 1 099 | 534 | 90 | 2 794 | ||||||||||||||||
| Work in progress | 6 557 | 286 | 3 679 | 105 | 97 | 427 | 11 151 | |||||||||||||||||
| Impact of disposals and reductions in value | (9 | ) | (113 | ) | (4 | ) | (465 | ) | (466 | ) | (309 | ) | (102 | ) | (1 468 | ) | ||||||||
| Restatements and other adjustments | 2 | (529 | ) | 4 | (2 | ) | (6 | ) | 4 | 1 | (526 | )(1) | ||||||||||||
| Closing balance | 3 261 | 85 349 | 3 005 | 55 142 | 14 742 | 4 391 | 7 008 | 172 898 | ||||||||||||||||
| ACCUMULATED DEPRECIATION | ||||||||||||||||||||||||
| Previously established opening balance | 30 520 | 1 040 | 21 102 | 8 986 | 2 920 | 4 338 | 68 906 | |||||||||||||||||
| Accounting changes (Note 3) | 191 | 191 | ||||||||||||||||||||||
| Restated opening balance | 30 711 | 1 040 | 21 102 | 8 986 | 2 920 | 4 338 | 69 097 | |||||||||||||||||
| Depreciation expenses | 1 703 | 126 | 1 538 | 835 | 550 | 356 | 5 108 | |||||||||||||||||
| Impact of disposals | (82 | ) | (3 | ) | (462 | ) | (447 | ) | (312 | ) | (85 | ) | (1 391 | ) | ||||||||||
| Restatements and other adjustments | (4 | ) | 4 | (5 | ) | 2 | (1 | ) | (4 | ) | ||||||||||||||
| Closing balance | ― | 32 328 | 1 167 | 22 178 | 9 369 | 3 160 | 4 608 | 72 810 | ||||||||||||||||
| Net book value as at March 31, 2024 | 3 261 | 53 021 | 1 838 | 32 964 | 5 373 | 1 231 | 2 400 | 100 088 | ||||||||||||||||
| Net book value as at March 31, 2023 (restated - Note 3) | 3 136 | 47 841 | 1 658 | 30 792 | 5 024 | 1 145 | 2 254 | 91 850 | ||||||||||||||||
(1) Restatements and other adjustments include $520M in downward adjustments to the cost of fixed assets arising from revised estimates of asset retirement obligations (Note 15). These adjustments mainly concern buildings.
19. Fixed assets (cont'd)
Fixed assets acquired under public private partnership agreements
(millions of dollars)
| Complex | |||||||||||||||
| Buildings | Facilities | networks | Equipment | Total | |||||||||||
| Cost | 5 311 | 196 | 2 303 | 152 | 7 962 | ||||||||||
| Accumulated depreciation(1) | 814 | 68 | 669 | 84 | 1 635 | ||||||||||
| Net book value as at March 31, 2024 | 4 497 | 128 | 1 634 | 68 | 6 327 | (2) | |||||||||
| Net book value as at March 31, 2023 (restated - Note 3) | 4 603 | 137 | 1 691 | 78 | 6 509 | (2) | |||||||||
Note: In exchange for the capital assets acquired, a financial liability is recognized in the debts stemming from the public private partnership agreements (Note 18) for all the agreements.
(1) The amortization expense of such capital assets stood at $188M ($185M in 2022-2023).
(2) Net book value stood at $4 454M for university hospitals ($4 571M as at March 31, 2023), $1 634M for road transportation infrastructure ($1 691M as at March 31, 2023), and $239M for the other agreements ($247M as at March 31, 2023).
Fixed assets rented under capital leases
(millions of dollars)
| Buildings | Equipment | Other | Total | |||||||||
| Cost | 605 | 8 | 83 | 696 | ||||||||
| Accumulated depreciation | 163 | 7 | 28 | 198 | ||||||||
| Net book value as at March 31, 2024 | 442 | 1 | 55 | 498 | ||||||||
| Net book value as at March 31, 2023 (restated - Note 3) | 462 | 45 | 4 | 511 |
Fixed assets under construction, development or improvements (work in progress)
(millions of dollars)
| Data | |||||||||||||||||||||
| processing | Development | ||||||||||||||||||||
| and office | of data | ||||||||||||||||||||
| Complex | automation | processing | |||||||||||||||||||
| Buildings | Facilities | networks | Equipment | equipment | systems | Total | |||||||||||||||
| Cost as at March 31, 2024 | 11 523 | 230 | 1 014 | 188 | 131 | 710 | 13 796 | ||||||||||||||
| Cost as at March 31, 2023 | 9 332 | 336 | 621 | 163 | 113 | 630 | 11 195 | ||||||||||||||
Note: No depreciation expense was recorded for these fixed assets in 2023-2024 and 2022-2023.
▌ 20. Contractual obligations and contractual rights
Significant accounting policies |
A contractual obligation is presented when all of the following conditions are met:
A contractual right is disclosed under the same circumstances, that is, when there is a legally enforceable written document as at March 31 depriving the other party of discretionary power and will lead to an inflow of economic resources for the government when the transaction or event occurs. Contractual obligations or rights stemming from agreements of indeterminate length are calculated and presented over a six-year period: each of the first five years of the agreements and an additional year for the balance. Contractual obligations resulting from agreements where the amounts are paid in perpetuity are spread over 30 years. |
20. Contractual obligations and contractual rights (cont'd)
Contractual obligations by expenditure and investment category
(millions of dollars)
| Expenditures | Investments | |||||||||||||||||||||||
| Transfers | Operating | |||||||||||||||||||||||
| Agreements | ||||||||||||||||||||||||
| concerning | Procurement | Acquisitions | Loan and | |||||||||||||||||||||
| Maturing | non-capital | Operating | of goods and | of fixed | investment | |||||||||||||||||||
| on March 31 | Capital | expenditures | leases | services | Other | assets | pledges | Total | ||||||||||||||||
| 2025 | 4 956 | 5 763 | 715 | 7 319 | 653 | 9 003 | 2 381 | 30 790 | ||||||||||||||||
| 2026 | 2 583 | 4 037 | 578 | 4 441 | 481 | 3 687 | 943 | 16 750 | ||||||||||||||||
| 2027 | 3 301 | 2 951 | 492 | 3 333 | 265 | 2 066 | 323 | 12 731 | ||||||||||||||||
| 2028 | 2 057 | 2 086 | 422 | 2 602 | 22 | 1 399 | 67 | 8 655 | ||||||||||||||||
| 2029 | 1 212 | 1 721 | 361 | 1 851 | 37 | 435 | 34 | 5 651 | ||||||||||||||||
| 14 109 | 16 558 | 2 568 | 19 546 | 1 458 | 16 590 | 3 748 | 74 577 | |||||||||||||||||
| 2030 and thereafter | 5 699 | 5 356 | 1 626 | 15 505 | 333 | 131 | 28 650 | |||||||||||||||||
| 19 808 | 21 914 | 4 194 | 35 051 | 1 458 | 16 923 | 3 879 | 103 227 | |||||||||||||||||
| No fixed maturity date | 925 | 925 | ||||||||||||||||||||||
| 19 808 | 21 914 | 4 194 | 35 051 | 1 458 | 16 923 | 4 804 | 104 152 | |||||||||||||||||
Contractual rights by revenue source
(millions of dollars)
| Transfers | |||||||||||||||
| Maturing | Natural | Sales of goods | from federal | ||||||||||||
| on March 31 | resources | and services | government | Other | Total | ||||||||||
| 2025 | 349 | 766 | 6 547 | 294 | 7 956 | ||||||||||
| 2026 | 116 | 679 | 6 502 | 83 | 7 380 | ||||||||||
| 2027 | 64 | 674 | 5 076 | 36 | 5 850 | ||||||||||
| 2028 | 62 | 687 | 3 964 | 19 | 4 732 | ||||||||||
| 2029 | 25 | 706 | 2 573 | 9 | 3 313 | ||||||||||
| 616 | 3 512 | 24 662 | 441 | 29 231 | |||||||||||
| 2030 and thereafter | 137 | 2 376 | 4 559 | 31 | 7 103 | ||||||||||
| 753 | 5 888 | 29 221 | 472 | 36 334 |
▌ 21. Contingencies
Significant accounting policies |
Contingent liabilities Obligations stemming from lawsuits and disputes are recognized as liabilities when a future event is likely to confirm the existence of a liability as at the date of the financial statements and a reasonable estimate of the loss can be made. If it is impossible to determine the probability of the event occurring, or if the event is likely to occur but no reasonable estimate can be made, a contingent liability is presented in an additional note. The accounting policies used for contingent liabilities relating to environmental liabilites and allowances for losses from guaranteed financial initiatives are presented in Note 13 on accounts payable, accrued expenses and other allowances and in Note 15 on environmental liability and asset retirement obligations, respectively. |
Material measurement uncertainties |
Contingent liabilities may vary based on the assumptions made to determine the likelihood that an existing situation will be resolved as at the date of the financial statements and the assumptions made to estimate the value of contingent liabilities. Among the assumptions used are past experience, current negotiations, recent settlements and court rulings. Those forecasts may vary widely in the coming year. Since the disclosure of information could negatively affect the outcomes of lawsuits and disputes, information as to the amounts and extent of related uncertainties is not provided. The measurement uncertainty with respect to the allowance for losses on guaranteed financial initiatives and environmental liability is presented in Note 13 on accounts payable, accrued expenses and other allowances and in Note 15 on environmental liability and asset retirement obligations, respectively. |
21. Contingencies (cont'd)
Contingent liabilities
Legal proceedings and disputes - Claims
A number of claims have been instituted against the government, which is also involved in legal proceedings before the courts. These different disputes result from breaches of contract and damages suffered by individuals or property. In some cases, the amounts claimed are mentioned, in others, no mention is made of them. Claims for which an amount has been established by the government total $4 834 million, after deducting the allowances taken in this regard.
Some of Québec's Indigenous communities have instituted legal proceedings involving $10 052 million in damages and interest against the government for land claims, the recognition of certain ancestral rights and other related questions. These proceedings are at different stages (some proceedings being currently suspended or inactive) and should eventually be resolved through negotiations, rulings or the abandonment of proceedings by applicants. Since the outcome of these legal proceedings and disputes is uncertain, the government cannot determine its potential losses.
Legal proceedings and disputes - Complaints and application of the Pay Equity Act
From the standpoint of the application of the Pay Equity Act (CQLR, chapter E-12.001), the government makes a provision for a job class when it is likely that this job class will benefit from a salary adjustment as a result of a pay equity audit, or a complaint and it can reasonably estimate the amount it will have to pay. In this regard, the government is subject to complaints and recourse to the Tribunal administratif du travail by some of its employees and unions representing them, particularly within the framework of pay equity audits conducted in 2010 and 2015 for the unionized staff in the parapublic sector plan.
During the year, the Conseil du trésor revealed the results of the 2020 pay equity audit of the parapublic sector plan. Under the Pay Equity Act, employees and the unions that represent them had until May 18, 2024 to submit complaints to the Commission des normes, de l'équité, de la santé et de la sécurité du travail (CNESST). The investigation process is ongoing at the CNESST, which will submit a report on the complaints to the Conseil du trésor in the next fiscal year.
The estimation method used to value the possible liability includes the assumptions that the government deems to be the most probable.
▌ 22. Cash flow information
Items not affecting cash flow
(millions of dollars)
| Fiscal year ended March 31 | ||||||||||||
| 2024 | 2023 | |||||||||||
| (restated - Note 3) | ||||||||||||
| Doubtful accounts | 716 | 534 | ||||||||||
| Allowances related to loans, investments and guaranteed financial initiatives | 386 | 306 | ||||||||||
| Capitalized interest on loans and investments | (167 | ) | (97 | ) | ||||||||
| Reinvestment of the income from Generations Fund investments | (582 | ) | (283 | ) | ||||||||
| Revenue from government enterprises | (5 241 | ) | (6 620 | ) | ||||||||
| Losses on the disposal of assets | 623 | 1 457 | ||||||||||
| Adjustment of debts to the effective interest rate | 110 | 208 | ||||||||||
| Loss in value of assets other than temporary | 427 | 604 | ||||||||||
| Amortization of deferred revenue related to the acquisition of fixed assets | (282 | ) | (252 | ) | ||||||||
| Activities related to pension plans and other employee future benefits | ||||||||||||
| Cost of accrued benefits | 3 471 | 3 422 | ||||||||||
| Changes to plans | 8 | 7 | ||||||||||
| Amortization of actuarial losses | 686 | 750 | ||||||||||
| Interest on obligations relating to accrued benefits | 7 950 | 7 650 | ||||||||||
| Change in valuation allowances | 118 | 112 | ||||||||||
| 12 233 | 11 941 | |||||||||||
| Reinvestment of revenue from fund's investments | (7 822 | ) | 4 411 | (7 262 | ) | 4 679 | ||||||
| Depreciation of fixed assets | 5 108 | 4 888 | ||||||||||
| Accretion expenses and others on asset retirement obligations | 235 | 245 | ||||||||||
| Revision of the estimates and others related to environmental liability | 278 | 363 | ||||||||||
| Other items not affecting cash flow | 9 | (51 | ) | |||||||||
| 6 031 | 5 981 | |||||||||||
22. Cash flow information (cont'd)
Change in assets and liabilities related to operations
(millions of dollars)
| Fiscal year ended March 31 | ||||||
| 2024 | 2023 | |||||
| (restated - Note 3) | ||||||
| Assets | ||||||
| Accounts receivable | (3 125 | ) | (2 246 | ) | ||
| Generations Fund - accounts receivable | 36 | 3 | ||||
| Other financial assets | (115 | ) | 538 | |||
| Other non-financial assets | 36 | 92 | ||||
| (3 168 | ) | (1 613 | ) | |||
| Liabilities | ||||||
| Accounts payable, accrued expenses and other allowances | 5 601 | 1 339 | ||||
| Deferred revenue | 413 | 346 | ||||
| Environmental liabilities | (61 | ) | (48 | ) | ||
| 5 953 | 1 637 | |||||
| 2 785 | 24 | |||||
Additional information
(millions of dollars)
| Fiscal year ended March 31 | ||||||
| 2024 | 2023 | |||||
| (restated - Note 3) | ||||||
| Interest paid | 9 984 | 9 014 | ||||
| Fixed asset acquisition included in accounts payable and accrued expenses | 2 037 | 1 746 | ||||
▌ 23. Related party information
The government is a related party to its key management personnel, their close relatives and entities for which one or more of those people have the power to guide financial and administrative decisions. The government's main management personnel are ministers, deputy ministers, and presidents and executive directors or their equivalent.
The government concluded no significant transactions with related parties during fiscal 2023-2024, for amounts different from those that would have been established between non-related parties.
Appendix 1
Reporting entity by portfolios
The government sets up programs administered directly by government entities, including departments and agencies. All entities under the responsibility of a minister constitute a portfolio. The National Assembly and persons appointed by it also constitute portfolios.
National Assembly
National Assembly
Persons Appointed by the National Assembly
Auditor General
Chief Electoral Officer
French language Commissioner
Lobbyists Commissioner
Public Protector
The Ethics Commissioner
Affaires municipales et Habitation
Department and budget-funded bodies
Affaires municipales et Habitation
Administrative Housing Tribunal
Commission municipale du Québec
Non-budget-funded body
Société d'habitation du Québec
Special fund
Regions and Rurality Fund
Agriculture, Pêcheries et Alimentation
Department and budget-funded bodies
Agriculture, Pêcheries et Alimentation
Commission de protection du territoire agricole du Québec
Régie des marchés agricoles et alimentaires du Québec
Non-budget-funded bodies
Institut de technologie agroalimentaire du Québec (June 30)
La Financière agricole du Québec
Government enterprise1
Capital Financière agricole inc.
Conseil du trésor et Administration gouvernementale
Department and budget-funded body
Conseil du trésor et Administration gouvernementale
Commission de la fonction publique
Appendix 1
Reporting entity by portfolios (cont'd)
Conseil du trésor et Administration gouvernementale (cont'd)
Non-budget-funded bodies
Autorité des marchés publics
Centre d'acquisitions gouvernementales
Commission de la capitale nationale du Québec
Office des professions du Québec
Société québécoise des infrastructures
Special fund
Capitale-Nationale Region Fund
Conseil exécutif
Department and budget-funded body
Conseil exécutif
Commission d'accès à l'information
Culture et Communications
Department and budget-funded body
Culture et Communications
Conseil du patrimoine culturel du Québec
Non-budget-funded bodies
Bibliothèque et Archives nationales du Québec
Conseil des arts et des lettres du Québec
Conservatoire de musique et d'art dramatique du Québec (June 30)
Musée d'art contemporain de Montréal
Musée de la Civilisation
Musée national des beaux-arts du Québec
Société de développement des entreprises culturelles
Société de la Place des Arts de Montréal
Société de télédiffusion du Québec (Télé-Québec)
Société du Grand Théâtre de Québec (August 31)
Special funds
Avenir Mécénat Culture Fund
Québec Cultural Heritage Fund
Cybersécurité et Numérique
Department
Cybersécurité et Numérique
Special fund
Cybersecurity and Digital Technology Fund
Économie, Innovation et Énergie
Department and budget-funded body
Économie et Innovation
Commission de l'éthique en science et en technologie
Appendix 1
Reporting entity by portfolios (cont'd)
Économie, Innovation et Énergie (cont'd)
Non-budget-funded bodies
Fonds de recherche du Québec-Nature et technologies - Québec Research Fund-Nature
and Technology
Fonds de recherche du Québec-Santé - Québec Research Fund-Health
Fonds de recherche du Québec-Société et culture - Québec Research Fund-Society
and Culture
Régie de l'énergie
Société portuaire du Bas-Saint-Laurent et de la Gaspésie inc.
Special funds
Economic Development Fund
Natural Resources and Energy Capital Fund
Natural Resources Fund (fossil energy management component)2
Québec Enterprise Growth Fund
Government enterprises1
Fonds d'investissement Eurêka S.E.C.
Hydro-Québec3 (December 31)
Investissement Québec3
Société du parc industriel et portuaire de Bécancour3
Éducation
Department and budget-funded bodies
Éducation
Commission consultative de l'enseignement privé
Conseil supérieur de l'éducation
National Student Ombudsman
Non-budget-funded bodies
Institut national des mines
Société des établissements de plein air du Québec
Société des parcs de sciences naturelles du Québec
Special fund
Sports and Physical Activity Development Fund
Organizations in the government's education network - School service centres4
Centre de services scolaire au Coeur-des-Vallées
Centre de services scolaire de Charlevoix
Centre de services scolaire de Kamouraska-Rivière-du-Loup
Centre de services scolaire de la Baie-James
Centre de services scolaire de la Beauce-Etchemin
Centre de services scolaire de la Capitale
Centre de services scolaire de la Côte-du-Sud
Centre de services scolaire De La Jonquière
Centre de services scolaire de la Moyenne-Côte-Nord
Centre de services scolaire de la Pointe-de-l'Île
Centre de services scolaire de la Région-de-Sherbrooke
Appendix 1
Reporting entity by portfolios (cont'd)
Éducation (cont'd)
Organizations in the government's education network - School service centres4 (cont'd)
Centre de services scolaire de la Riveraine
Centre de services scolaire de la Rivière-du-Nord
Centre de services scolaire de Laval
Centre de services scolaire de la Vallée-des-Tisserands
Centre de services scolaire de l'Énergie
Centre de services scolaire de l'Estuaire
Centre de services scolaire de l'Or-et-des-Bois
Centre de services scolaire de Montréal
Centre de services scolaire de Portneuf
Centre de services scolaire de Rouyn-Noranda
Centre de services scolaire des Affluents
Centre de services scolaire de Saint-Hyacinthe
Centre de services scolaire des Appalaches
Centre de services scolaire des Bois-Francs
Centre de services scolaire des Chênes
Centre de services scolaire des Chic-Chocs
Centre de services scolaire des Découvreurs
Centre de services scolaire des Draveurs
Centre de services scolaire des Grandes-Seigneuries
Centre de services scolaire des Hautes-Laurentides
Centre de services scolaire des Hautes-Rivières
Centre de services scolaire des Hauts-Bois-de-l'Outaouais
Centre de services scolaire des Hauts-Cantons
Centre de services scolaire des Îles
Centre de services scolaire des Laurentides
Centre de services scolaire des Mille-Îles
Centre de services scolaire des Monts-et-Marées
Centre de services scolaire des Navigateurs
Centre de services scolaire de Sorel-Tracy
Centre de services scolaire des Patriotes
Centre de services scolaire des Phares
Centre de services scolaire des Portages-de-l'Outaouais
Centre de services scolaire des Premières-Seigneuries
Centre de services scolaire des Rives-du-Saguenay
Centre de services scolaire des Samares
Centre de services scolaire des Sommets
Centre de services scolaire des Trois-Lacs
Centre de services scolaire du Chemin-du-Roy
Centre de services scolaire du Fer
Centre de services scolaire du Fleuve-et-des-Lacs
Centre de services scolaire du Lac-Abitibi
Centre de services scolaire du Lac-Saint-Jean
Centre de services scolaire du Lac-Témiscamingue
Appendix 1
Reporting entity by portfolios (cont'd)
Éducation (cont'd)
Organizations in the government's education network - School service centres4 (cont'd)
Centre de services scolaire du Littoral
Centre de services scolaire du Pays-des-Bleuets
Centre de services scolaire du Val-des-Cerfs
Centre de services scolaire Harricana
Centre de services scolaire Marguerite-Bourgeoys
Centre de services scolaire Marie-Victorin
Centre de services scolaire René-Lévesque
Organizations in the government's education network - School boards4
Commission scolaire Central Québec - Central Québec School Board
Commission scolaire crie - Cree School Board
Commission scolaire Eastern Shores - Eastern Shores School Board
Commission scolaire Eastern Townships - Eastern Townships School Board
Commission scolaire English-Montréal - English Montreal School Board
Commission scolaire Kativik - Kativik School Board
Commission scolaire Lester-B.-Pearson - Lester B. Pearson School Board
Commission scolaire New Frontiers - New Frontiers School Board
Commission scolaire Riverside - Riverside School Board
Commission scolaire Sir-Wilfrid-Laurier - Sir Wilfrid Laurier School Board
Commission scolaire Western Québec - Western Québec School Board
Comité de gestion de la taxe scolaire de l'île de Montréal
Emploi et Solidarité sociale
Department and budget-funded body
Emploi et Solidarité sociale
Commission des partenaires du marché du travail
Non-budget-funded body
Office de la sécurité économique des chasseurs cris - Cree Hunters Economic Security Board
(June 30)
Special funds
Assistance Fund for Independent Community Action
Goods and Services Fund
Information Technology Fund of the Ministère de l'Emploi et de la Solidarité sociale
Labour Market Development Fund
Québec Fund for Social Initiatives
Enseignement supérieur
Department and budget-funded bodies
Enseignement supérieur
Comité consultatif sur l'accessibilité financière aux études
Commission d'évaluation de l'enseignement collégial
Non-budget-funded body
Institut de tourisme et d'hôtellerie du Québec (June 30)
Appendix 1
Reporting entity by portfolios (cont'd)
Enseignement supérieur (cont'd)
Special fund
University Excellence and Performance Fund
Organizations in the government's higher education networks - General and vocational colleges (CEGEPs)4
Cégep André-Laurendeau
Cégep Beauce-Appalaches
Cégep d'Ahuntsic
Cégep de Baie-Comeau
Cégep de Bois-de-Boulogne
Cégep de Chicoutimi
Cégep de Drummondville
Cégep de Granby
Cégep de Jonquière
Cégep de l'Abitibi-Témiscamingue
Cégep de la Gaspésie et des Îles
Cégep de La Pocatière
Cégep de Lévis
Cégep de l'Outaouais
Cégep de Maisonneuve
Cégep de Matane
Cégep de Rimouski
Cégep de Rivière-du-Loup
Cégep de Rosemont
Cégep de Sainte-Foy
Cégep de Saint-Hyacinthe
Cégep de Saint-Jérôme
Cégep de Saint-Laurent
Cégep de Sept-Îles
Cégep de Shawinigan
Cégep de Sherbrooke
Cégep de Sorel-Tracy
Cégep de St-Félicien
Cégep de Thetford
Cégep de Trois-Rivières
Cégep de Valleyfield
Cégep de Victoriaville
Cégep du Vieux Montréal
Cégep Édouard-Montpetit
Cégep François-Xavier Garneau
Cégep Gérald-Godin
Cégep Limoilou
Cégep Lionel-Groulx
Cégep Marie-Victorin
Cégep Montmorency
Appendix 1
Reporting entity by portfolios (cont'd)
Enseignement supérieur (cont'd)
Organizations in the government's higher education networks - General and vocational colleges (CEGEPs)4 (cont'd)
Cégep régional Champlain - Champlain Regional College
Cégep régional de Lanaudière
Cégep Saint-Jean-sur-Richelieu
Collège d'Alma
Dawson College
Heritage College
John Abbott College
Vanier College of General and Vocational Education
Organizations in the government's higher education networks - Université du Québec and its constituent universities5
École de technologie supérieure
École nationale d'administration publique
Institut national de la recherche scientifique
Télé-université
Université du Québec
Université du Québec à Chicoutimi
Université du Québec à Montréal
Université du Québec à Rimouski
Université du Québec à Trois-Rivières
Université du Québec en Abitibi-Témiscamingue
Université du Québec en Outaouais
Environnement, Lutte contre les changements climatiques, Faune et Parcs
Department and budget-funded body
Environnement, Lutte contre les changements climatiques, Faune et Parcs
Bureau d'audiences publiques sur l'environnement
Non-budget-funded bodies
Fondation de la faune du Québec
Société québécoise de récupération et de recyclage
Special funds
Blue Fund
Electrification and Climate Change Fund
Energy Transition, Innovation and Efficiency Fund
Fund for the Protection of the Environment and the Waters in the Domain of the State
Natural Resources Fund (Wildlife conservation and development component)2
Famille
Department and budget-funded body
Famille
Curateur public
Special fund
Educational Childcare Services Fund
Appendix 1
Reporting entity by portfolios (cont'd)
Finances
Department
Finances6
Non-budget-funded bodies
Agence du revenu du Québec7
Autorité des marchés financiers
Financement-Québec
Institut de la statistique du Québec
Société de financement des infrastructures locales du Québec
Société nationale de l'amiante8
Special funds
Financing Fund
Financial Markets Administrative Tribunal (Fund of the)9
Fund to Combat Addiction
Generations Fund
Health Services Fund
IFC Montréal Fund
Northern Plan Fund
Special Contracts and Financial Assistance for Investment Fund
Tax Administration Fund
Government enterprises1
Loto-Québec
Société des alcools du Québec (fiscal year ended on the last Saturday of March)
Société québécoise du cannabis (fiscal year ended on the last Saturday of March)
Immigration, Francisation et Intégration
Department
Immigration, Francisation et Intégration
Justice
Department and budget-funded bodies
Justice
Commission des droits de la personne et des droits de la jeunesse
Committee on the Remuneration of Criminal and Penal Prosecuting Attorneys
Committee on the remuneration of judges and justices of the peace
Conseil de la justice administrative
Conseil de la magistrature
Directeur des poursuites criminelles et pénales
Human Rights Tribunal
Office de la protection du consommateur
Non-budget-funded bodies
Commission des services juridiques
Fonds d'aide aux actions collectives
Société québécoise d'information juridique
Appendix 1
Reporting entity by portfolios (cont'd)
Justice (cont'd)
Special funds
Access to Justice Fund
Administrative Tribunal of Québec (Fund of the)9
Fund dedicated to assistance for persons who are victims of criminal offences
Register Fund of the Ministère de la Justice
Langue française
Department and budget-funded bodies
Langue française
Commission de toponymie
Office québécois de la langue française
Non-budget-funded body
Centre de la francophonie des Amériques
Relations internationales et Francophonie
Department and budget-funded body
Relations internationales et Francophonie
Conseil du statut de la femme
Non-budget-funded body
Office Québec-Monde pour la jeunesse
Ressources naturelles et Forêts
Department
Ressources naturelles et Forêts
Non-budget-funded bodies
Société de développement de la Baie-James (December 31)
Société du Plan Nord
Special funds
Natural Resources Fund (forestry, sustainable forest development, mining heritage and mining
activity management components)2
Territorial Information Fund
Government enterprise1
Société ferroviaire et portuaire de Pointe-Noire S.E.C.
Santé et Services sociaux
Department and budget-funded bodies
Santé et Services sociaux
Commissaire à la santé et au bien-être
Office des personnes handicapées du Québec
Non-budget-funded bodies
Corporation d'urgences-santé
Fonds de l'assurance médicaments - Prescription Drug Insurance Fund
Héma-Québec
Appendix 1
Reporting entity by portfolios (cont'd)
Santé et Services sociaux (cont'd)
Non-budget-funded bodies (cont'd)
Institut national de santé publique du Québec
Institut national d'excellence en santé et en services sociaux
Régie de l'assurance maladie du Québec
Special funds
Cannabis Prevention and Research Fund
Health and Social Services Information Resources Fund
Organizations in the government's health and social services network - Integrated health and social services centres
Centre intégré de santé et de services sociaux de Chaudière-Appalaches
Centre intégré de santé et de services sociaux de l'Abitibi-Témiscamingue
Centre intégré de santé et de services sociaux de la Côte-Nord
Centre intégré de santé et de services sociaux de la Gaspésie
Centre intégré de santé et de services sociaux de la Montérégie-Centre
Centre intégré de santé et de services sociaux de la Montérégie-Est
Centre intégré de santé et de services sociaux de la Montérégie-Ouest
Centre intégré de santé et de services sociaux de Lanaudière
Centre intégré de santé et de services sociaux de Laval
Centre intégré de santé et de services sociaux de l'Outaouais
Centre intégré de santé et de services sociaux des Îles
Centre intégré de santé et de services sociaux des Laurentides
Centre intégré de santé et de services sociaux du Bas-Saint-Laurent
Centre intégré universitaire de santé et de services sociaux de la Capitale-Nationale
Centre intégré universitaire de santé et de services sociaux de la Mauricie-et-du-Centre-
du-Québec
Centre intégré universitaire de santé et de services sociaux de l'Est-de-l'Île-de-Montréal
Centre intégré universitaire de santé et de services sociaux de l'Estrie - Centre hospitalier
universitaire de Sherbrooke
Centre intégré universitaire de santé et de services sociaux de l'Ouest-de-l'Île-de-Montréal
Centre intégré universitaire de santé et de services sociaux du Centre-Ouest-de-l'Île-
de-Montréal
Centre intégré universitaire de santé et de services sociaux du Centre-Sud-de-l'Île-de-Montréal
Centre intégré universitaire de santé et de services sociaux du Nord-de-l'Île-de-Montréal
Centre intégré universitaire de santé et de services sociaux du Saguenay-Lac-Saint-Jean
Organizations in the government's health and social services network - other public institutions and regional authorities
Centre de santé Inuulitsivik - Inuulitsivik Health Centre
Centre de santé Tulattavik de l'Ungava - Ungava Tulattavik Health Centre
Centre hospitalier de l'Université de Montréal
Centre hospitalier universitaire Sainte-Justine
Centre régional de santé et de services sociaux de la Baie-James
Centre universitaire de santé McGill - McGill University Health Centre
CHU de Québec - Université Laval
CLSC Naskapi
Appendix 1
Reporting entity by portfolios (cont'd)
Santé et Services sociaux (cont'd)
Organizations in the government's health and social services network - other public institutions and regional authorities (cont'd)
Conseil cri de la santé et des services sociaux de la Baie-James - Cree Board of Health
and Social Services of James Bay
Institut de cardiologie de Montréal
Institut national de psychiatrie légale Philippe-Pinel
Institut universitaire de cardiologie et de pneumologie de Québec - Université Laval
Régie régionale de la santé et des services sociaux du Nunavik - Nunavik Regional Board
of Health and Social Services
Sécurité publique
Department and budget-funded bodies
Sécurité publique
Bureau des enquêtes indépendantes
Bureau du coroner
Commissaire à la déontologie policière
Commissaire à la lutte contre la corruption
Commission québécoise des libérations conditionnelles
Régie des alcools, des courses et des jeux
Tribunal administratif de déontologie policière
Non-budget-funded bodies
École nationale de police du Québec (June 30)
École nationale des pompiers du Québec (June 30)
Special fund
Police Services Fund
Tourisme
Department
Tourisme
Non-budget-funded bodies
Société de développement et de mise en valeur du Parc olympique
Société du Centre des congrès de Québec
Société du Palais des congrès de Montréal
Special fund
Tourism Partnership Fund
Transports et Mobilité durable
Department and budget-funded body
Transports et Mobilité durable
Commission des transports du Québec
Non-budget-funded bodies
Société de l'assurance automobile du Québec (December 31)
Société des Traversiers du Québec
Appendix 1
Reporting entity by portfolios (cont'd)
Transports et Mobilité durable (cont'd)
Special funds
Air Service Fund
Highway Safety Fund
Land Transportation Network Fund
Rolling Stock Management Fund
Travail
Department
Travail
Non-budget-funded body
Régie du bâtiment du Québec
Special fund
Administrative Labour Tribunal (Fund of the)9
Note: When an entity's fiscal year ends on a date other than March 31, it is indicated in parentheses. For the purposes of consolidation in the government's financial statements, interim data are then used for the period between the end of the fiscal year and March 31.
1. The government holds a 100% share of those enterprises, except for Capitale Financière agricole inc. where it holds 90.10%.
2. The Natural Resources Fund, established under the Act respecting the Ministère des Ressources naturelles et de la Faune (CQLR, chapter M-25.2), is composed of various components. Financial information on the fossil energy management component is presented in the Économie, Innovation et Énergie portfolio. Financial information for the wildlife conservation and development component is included in the Environnement, Lutte contre les changements climatiques, Faune et Parcs portfolio. Lastly, financial information for all other components is combined and presented in the Ressources naturelles et Forêts portfolio.
3. The Minister of Economy, Innovation and Energy is responsible for the application of the incorporating acts of Hydro-Québec, Investissement Québec and the Société du parc industriel et portuaire de Bécancour. However, their revenues are recognized in the Finances portfolio, since the shares of these government enterprises are held by the Minister of Finance.
4. The fiscal year of the school service centres, school boards and colleges ends on June 30. Interim data are used for the period between the end of their fiscal year and March 31.
5. The financial data of the Université du Québec and its constituent universities that were used for consolidation purposes cover the period from May 1, 2023 to April 30, 2024, the date on which their fiscal year ends. Operations and events relating to these entities that occurred between April 1 and 30, 2024 did not have a material financial impact on the government's financial position and consolidated results.
6. In accordance with section 9 of the Executive Power Act (CQLR, chapter E-18), Order-in-Council 1689-2022 entrusts the functions and responsibilities of the Minister of Revenue to the Minister of Finance.
7. Transactions of the general fund of the Consolidated Revenue Fund related to the enforcement or administration of any statute under the responsibility of the Minister of Revenue are administered by the Agence du revenu du Québec.
8. The Société nationale de l'amiante has ceased its operations. Since June 1, 2016, this entity has been constituted as a legal person established in the public interest governed by the provisions of the Business Corporations Act (CQLR, chapter S-3.1.1).
9. The financial data for this special fund, which were used for consolidation purposes, also include those pertaining to the body financed by this fund.
Appendix 2
Segment disclosures
Consolidated statement of revenue
(millions of dollars)
| Fiscal year ended March 31, 2024 | |||||||||||||||||||||
| Income | Duties, | Revenue | |||||||||||||||||||
| and | permits | Miscella- | from | Federal | |||||||||||||||||
| property | Consump- | and | neous | government | government | ||||||||||||||||
| taxes | tion taxes | royalties | revenue | enterprises | transfers | Total | |||||||||||||||
| PORTFOLIOS | |||||||||||||||||||||
| Assemblée nationale | 13 | 13 | |||||||||||||||||||
| Personnes désignées par | |||||||||||||||||||||
| l'Assemblée nationale | 1 | 1 | |||||||||||||||||||
| Affaires municipales et Habitation | 8 | 291 | 664 | 963 | |||||||||||||||||
| Agriculture, Pêcheries et Alimentation | 32 | 80 | 192 | 304 | |||||||||||||||||
| Conseil du trésor et Administration gouvernementale | 1 | 185 | 186 | ||||||||||||||||||
| Conseil exécutif | 14 | 15 | 29 | ||||||||||||||||||
| Culture et Communications | 30 | 1 | 149 | 2 | 182 | ||||||||||||||||
| Cybersécurité et Numérique | 40 | 40 | |||||||||||||||||||
| Économie, Innovation et Énergie(1) | 26 | 201 | 68 | 295 | |||||||||||||||||
| Éducation | 1 150 | 90 | 1 420 | 446 | 3 106 | ||||||||||||||||
| Emploi et Solidarité sociale | 39 | 188 | 931 | 1 158 | |||||||||||||||||
| Enseignement supérieur | 1 086 | 247 | 1 333 | ||||||||||||||||||
| Environnement, Lutte contre les changements climatiques, Faune et Parcs | 36 | 1 923 | 75 | 86 | 2 120 | ||||||||||||||||
| Famille | 27 | 6 | 33 | ||||||||||||||||||
| Finances | 61 798 | 24 634 | 1 571 | 3 118 | 5 234 | 26 497 | 122 852 | ||||||||||||||
| Immigration, Francisation et Intégration | 87 | 12 | 775 | 874 | |||||||||||||||||
| Justice | 6 | 337 | 60 | 403 | |||||||||||||||||
| Langue française | |||||||||||||||||||||
| Relations internationales et Francophonie | 4 | 9 | 13 | ||||||||||||||||||
| Ressources naturelles et Forêts | 401 | 243 | 7 | 15 | 666 | ||||||||||||||||
| Santé et Services sociaux | 2 | 4 926 | 619 | 5 547 | |||||||||||||||||
| Sécurité publique | 27 | 474 | 55 | 556 | |||||||||||||||||
| Tourisme | 155 | 3 | 85 | 243 | |||||||||||||||||
| Transports et Mobilité durable | 2 138 | 1 643 | 455 | 195 | 4 431 | ||||||||||||||||
| Travail | 91 | 102 | 193 | ||||||||||||||||||
| Total revenue | 62 948 | 27 083 | 5 888 | 13 505 | 5 241 | 30 876 | 145 541 | ||||||||||||||
(1) The Minister of Economy, Innovation and Energy is responsible for the application of the incorporating acts of Hydro-Québec, Investissement Québec and the Société du parc industriel et portuaire de Bécancour. However, their revenues are recognized in the Finances portfolio, since the shares of these government enterprises are held by the Minister of Finance.
Appendix 2
Segment disclosures (cont'd)
Consolidated statement of revenue (cont'd)
(millions of dollars)
| Fiscal year ended March 31, 2023 (restated - Note 3) | |||||||||||||||||||||
| Income | Duties, | Revenue | |||||||||||||||||||
| and | permits | Miscella- | from | Federal | |||||||||||||||||
| property | Consumpti | and | neous | government | government | ||||||||||||||||
| taxes | on taxes | royalties | revenue | enterprises | transfers | Total | |||||||||||||||
| PORTFOLIOS | |||||||||||||||||||||
| Assemblée nationale | 7 | 7 | |||||||||||||||||||
| Personnes désignées par l'Assemblée nationale | 2 | 2 | |||||||||||||||||||
| Affaires municipales et Habitation | 6 | 285 | 596 | 887 | |||||||||||||||||
| Agriculture, Pêcheries et Alimentation | 27 | 50 | 162 | 239 | |||||||||||||||||
| Conseil du trésor et Administration gouvernementale | 1 | 142 | 143 | ||||||||||||||||||
| Conseil exécutif | 5 | 39 | 44 | ||||||||||||||||||
| Culture et Communications | 35 | 1 | 124 | 2 | 162 | ||||||||||||||||
| Cybersécurité et Numérique | 37 | 37 | |||||||||||||||||||
| Économie, Innovation et Énergie(1) | 19 | 278 | 21 | 318 | |||||||||||||||||
| Éducation | 1 113 | 90 | 1 309 | 422 | 2 934 | ||||||||||||||||
| Emploi et Solidarité sociale | 37 | 182 | 954 | 1 173 | |||||||||||||||||
| Enseignement supérieur | 948 | 243 | 1 191 | ||||||||||||||||||
| Environnement, Lutte contre les changements climatiques, Faune et Parcs | 36 | 1 589 | 110 | 118 | 1 853 | ||||||||||||||||
| Famille | 24 | 3 | 27 | ||||||||||||||||||
| Finances | 63 408 | 24 146 | 1 829 | 2 095 | 6 581 | 24 058 | 122 117 | ||||||||||||||
| Immigration, Francisation et Intégration | 62 | 17 | 794 | 873 | |||||||||||||||||
| Justice | 4 | 327 | 45 | 376 | |||||||||||||||||
| Langue française | |||||||||||||||||||||
| Relations internationales et Francophonie | 2 | 17 | 19 | ||||||||||||||||||
| Ressources naturelles et Forêts | 536 | 253 | 39 | 48 | 876 | ||||||||||||||||
| Santé et Services sociaux | 2 | 4 731 | 1 091 | 5 824 | |||||||||||||||||
| Sécurité publique | 28 | 454 | 35 | 517 | |||||||||||||||||
| Tourisme | 149 | 2 | 104 | 255 | |||||||||||||||||
| Transports et Mobilité durable | 2 141 | 1 529 | 434 | 92 | 4 196 | ||||||||||||||||
| Travail | 88 | 85 | 173 | ||||||||||||||||||
| Total revenue | 64 521 | 26 597 | 5 784 | 11 984 | 6 620 | 28 737 | 144 243 | ||||||||||||||
(1) The Minister of Economy, Innovation and Energy is responsible for the application of the incorporating acts of Hydro-Québec, Investissement Québec and the Société du parc industriel et portuaire de Bécancour. However, their revenues are recognized in the Finances portfolio, since the shares of these government enterprises are held by the Minister of Finance.
Appendix 2
Segment disclosures (cont'd)
Consolidated statement of expenditure
(millions of dollars)
| Fiscal year ended March 31, 2024 | |||||||||||||||
| Doubtful accounts | |||||||||||||||
| and other | |||||||||||||||
| Transfers | Remuneration | Operating | allowances | Total | |||||||||||
| PORTFOLIOS | |||||||||||||||
| Assemblée nationale | 128 | 53 | 181 | ||||||||||||
| Personnes désignées par l'Assemblée nationale | 13 | 92 | 30 | 135 | |||||||||||
| Affaires municipales et Habitation | 4 547 | 132 | 157 | 78 | 4 914 | ||||||||||
| Agriculture, Pêcheries et Alimentation | 1 154 | 223 | 98 | 27 | 1 502 | ||||||||||
| Conseil du trésor et Administration gouvernementale | 53 | 733 | 255 | (1 | ) | 1 040 | |||||||||
| Conseil exécutif | 743 | 144 | 29 | 916 | |||||||||||
| Culture et Communications | 1 595 | 223 | 297 | 6 | 2 121 | ||||||||||
| Cybersécurité et Numérique | 83 | 122 | 205 | ||||||||||||
| Économie, Innovation et Énergie | 3 238 | 93 | 217 | 282 | 3 830 | ||||||||||
| Éducation | 1 362 | 14 236 | 4 449 | 11 | 20 058 | ||||||||||
| Emploi et Solidarité sociale | 5 018 | 503 | 163 | 44 | 5 728 | ||||||||||
| Enseignement supérieur | 4 903 | 4 209 | 1 324 | 40 | 10 476 | ||||||||||
| Environnement, Lutte contre les changements climatiques, Faune et Parcs | 1 726 | 337 | 364 | 4 | 2 431 | ||||||||||
| Famille | 8 680 | 134 | 103 | 8 917 | |||||||||||
| Finances | 1 340 | 1 366 | 555 | 489 | 3 750 | ||||||||||
| Immigration, Francisation et Intégration | 295 | 184 | 83 | 562 | |||||||||||
| Justice | 433 | 857 | 597 | 16 | 1 903 | ||||||||||
| Langue française | 11 | 40 | 9 | 60 | |||||||||||
| Relations internationales et Francophonie | 57 | 89 | 36 | 182 | |||||||||||
| Ressources naturelles et Forêts | 426 | 283 | 772 | 5 | 1 486 | ||||||||||
| Santé et Services sociaux | 8 524 | 37 626 | 14 713 | 137 | 61 000 | ||||||||||
| Sécurité publique | 364 | 1 750 | 636 | 2 750 | |||||||||||
| Tourisme | 296 | 71 | 130 | 497 | |||||||||||
| Transports et Mobilité durable | 2 565 | 827 | 3 299 | 9 | 6 700 | ||||||||||
| Travail | 23 | 143 | 43 | 209 | |||||||||||
| Expenditure by portfolio | 47 366 | 64 506 | 28 534 | 1 147 | 141 553 | ||||||||||
| Debt service | 9 982 | ||||||||||||||
| Total expenditure | 151 535 | ||||||||||||||
Appendix 2
Segment disclosures (cont'd)
Consolidated statement of expenditure (cont'd)
(millions of dollars)
| Fiscal year ended March 31, 2023 (restated - Note 3) | |||||||||||||||
| Transfers | Remuneration | Operating | Doubtful accounts and other allowances | Total | |||||||||||
| PORTFOLIOS | |||||||||||||||
| Assemblée nationale | 119 | 47 | 166 | ||||||||||||
| Personnes désignées par l'Assemblée nationale | 30 | 139 | 56 | 225 | |||||||||||
| Affaires municipales et Habitation | 4 624 | 117 | 183 | 12 | 4 936 | ||||||||||
| Agriculture, Pêcheries et Alimentation | 1 038 | 208 | 85 | 6 | 1 337 | ||||||||||
| Conseil du trésor et Administration gouvernementale | 68 | 863 | 194 | 1 | 1 126 | ||||||||||
| Conseil exécutif | 603 | 129 | 42 | 774 | |||||||||||
| Culture et Communications | 1 232 | 198 | 256 | 4 | 1 690 | ||||||||||
| Cybersécurité et Numérique | 63 | 109 | 172 | ||||||||||||
| Économie, Innovation et Énergie | 2 819 | 83 | 179 | 199 | 3 280 | ||||||||||
| Éducation | 1 095 | 14 194 | 4 212 | 10 | 19 511 | ||||||||||
| Emploi et Solidarité sociale | 8 372 | 442 | 145 | 24 | 8 983 | ||||||||||
| Enseignement supérieur | 4 597 | 3 958 | 1 119 | (19 | ) | 9 655 | |||||||||
| Environnement, Lutte contre les changements climatiques, Faune et Parcs | 1 083 | 293 | 293 | 4 | 1 673 | ||||||||||
| Famille | 7 627 | 117 | 91 | 7 835 | |||||||||||
| Finances | 1 263 | 1 215 | 542 | 345 | 3 365 | ||||||||||
| Immigration, Francisation et Intégration | 226 | 145 | 74 | 445 | |||||||||||
| Justice | 340 | 758 | 389 | 7 | 1 494 | ||||||||||
| Langue française | 12 | 28 | 6 | 46 | |||||||||||
| Relations internationales et Francophonie | 59 | 81 | 36 | 176 | |||||||||||
| Ressources naturelles et Forêts | 386 | 265 | 755 | 1 406 | |||||||||||
| Santé et Services sociaux | 8 168 | 36 490 | 14 562 | 121 | 59 341 | ||||||||||
| Sécurité publique | 192 | 1 584 | 614 | 2 390 | |||||||||||
| Tourisme | 324 | 64 | 143 | 1 | 532 | ||||||||||
| Transports et Mobilité durable | 2 699 | 708 | 2 984 | 9 | 6 400 | ||||||||||
| Travail | 19 | 135 | 35 | 189 | |||||||||||
| Expenditure by portfolio | 46 876 | 62 396 | 27 151 | 724 | 137 147 | ||||||||||
| Debt service | 10 222 | ||||||||||||||
| Total expenditure | 147 369 | ||||||||||||||
Appendix 3
Properties and fiduciary transactions
Properties held and fiduciary activities are entrusted to a government department or body (the trustee) to administer in accordance with applicable contractual or legal provisions. The trustee holds and administers the property for the benefit of, and on behalf of, designated beneficiaries. The property entrusted to a trustee must be for a specific purpose defined by the donor. Properties held and fiduciary activities are not included in the reporting entity as they are not owned by the government.
Accounts under administration (December 31)
Under administration of the Curateur public
Account under administration of the Educational Childcare Services Fund
under administration of the Ministère de la Famille
Caisse de dépôt et placement du Québec (December 31)
Cautionnements individuels des agents de voyages
under administration of the Office de la protection du consommateur
Comité Entraide - public and parapublic sectors
under administration of the Ministère du Travail, de l'Emploi et de la Solidarité sociale
Commission de la construction du Québec (December 31)
Compensation regime for municipal bodies
under administration of the Société québécoise de récupération et de recyclage
Conseil de gestion de l'assurance parentale (December 31)
Fonds central de soutien à la réinsertion sociale (December 31)
under administration of the Ministère de la Sécurité publique
Fonds d'assurance automobile du Québec (December 31)
under administration of the Société de l'assurance automobile du Québec
Fonds d'assurance-garantie
under administration of the Régie des marchés agricoles et alimentaires du Québec
Fonds d'assurance-récolte
Fonds d'assurance-stabilisation des revenus agricoles
under administration of the La Financière agricole du Québec
Fonds des pensions alimentaires
under administration of the Agence du revenu du Québec
Fonds d'indemnisation des clients des agents de voyages
under administration of the Office de la protection du consommateur
Fonds d'indemnisation des services financiers
under administration of the Autorité des marchés financiers
Appendix 3
Properties and fiduciary transactions (cont'd)
Guarantee fund
under administration of the Régie du bâtiment du Québec
Parental Insurance Fund (December 31)
under administration of the Conseil de gestion de l'assurance parentale (December 31)
Retraite Québec (December 31)
Trust fund under administration of the Bureau général de dépôts pour le Québec
under administration of the Ministère des Finances
Unclaimed property (December 31)
under administration of the Agence du revenu du Québec
Workforce Skills Development and Recognition Fund
under administration of the Ministère du Travail, de l'Emploi et de la Solidarité sociale
Note: When a fiscal year ends on a date other than March 31, it is indicated in parentheses.
Appendix 4
Fiduciary transactions conducted by the government
Summary of properties held and fiduciary transactions administered for designated beneficiaries
(millions of dollars)
| As at March 31, 2024 | |||||||||
| Net assets | |||||||||
| Assets | Liabilities | (liabilities) | |||||||
| Account under administration of the Educational | |||||||||
| Childcare Services Fund | 3 | 3 | ― | ||||||
| Accounts under administration(1), under administration | |||||||||
| of the Curateur public | 831 | 118 | 713 | ||||||
| Caisse de dépôt et placement du Québec(1) | 511 449 | 77 202 | 434 247 | (2),(3) | |||||
| Cautionnements individuels des agents de voyages | 9 | (2) | 5 | 4 | |||||
| Comité Entraide - public and parapublic sectors | 3 | 3 | ― | ||||||
| Commission de la construction du Québec | |||||||||
| General administration fund(1) | 328 | 239 | 89 | ||||||
| Supplemental Pension Plan(1) : | |||||||||
| general account | 3 442 | (2) | 1 573 | 1 869 | |||||
| complementary account | 18 291 | (2) | 18 291 | ― | |||||
| pensioners' account | 9 560 | (2) | 9 506 | 54 | |||||
| Other funds(1) | 2 962 | 1 872 | 1 090 | ||||||
| Conseil de gestion de l'assurance parentale(1) | 10 | 10 | ― | ||||||
| Parental Insurance Fund(1) | 724 | (2) | 144 | 580 | |||||
| Fonds central de soutien à la réinsertion sociale(1) | 3 | ― | 3 | ||||||
| Fonds d'assurance automobile du Québec(1) | 13 636 | (2) | 10 507 | 3 129 | |||||
| Fonds d'assurance-garantie | 12 | (2) | ― | 12 | |||||
| Fonds d'assurance-récolte | 261 | (2) | 36 | 225 | |||||
| Fonds d'assurance-stabilisation des revenus agricoles | 12 | 289 | (277 | ) | |||||
| Fonds des pensions alimentaires | 186 | 186 | ― | ||||||
| Fonds d'indemnisation des clients des agents de voyages | 161 | (2) | 4 | 157 | |||||
| Fonds d'indemnisation des services financiers | 133 | (2) | 25 | 108 | |||||
| Guaranty fund | 37 | ― | 37 | ||||||
Appendix 4
Fiduciary transactions conducted by the government (cont'd)
Summary of properties held and fiduciary transactions administered for designated beneficiaries (cont'd)
(millions of dollars)
| As at March 31, 2024 | |||||||||
| Assets | Liabilities | Net assets (liabilities) | |||||||
| Retraite Québec(1) | 303 | 285 | 18 | ||||||
| Government pension plans - share paid by participants(1): | |||||||||
| RREGOP | 86 948 | (2) | 78 529 | 8 419 | |||||
| PPMP | 12 171 | (2) | 10 531 | 1 640 | |||||
| PPPOCS | 822 | (2) | 750 | 72 | |||||
| SPMSQ | 989 | (2) | 967 | 22 | |||||
| Other pension plans administered by Retraite Québec(1) | 451 | (2) | 354 | 97 | |||||
| Québec Pension Plan Fund(1) | |||||||||
| Québec Pension Plan - Base plan | 112 755 | (2) | 1 063 | 111 692 | |||||
| Québec Pension Plan - Additional plan | 10 160 | (2) | 3 | 10 157 | |||||
| Trust fund under administration of the Bureau général de dépôts pour le Québec | 1 140 | 1 140 | ― | ||||||
| Unclaimed property(1), under administration of the Agence du revenu du Québec | 350 | 147 | 203 | ||||||
| Workforce Skills Development and Recognition Fund | 331 | 35 | 296 | ||||||
(1) The data are as at December 31, 2023, that is, the end date of the trust fund's fiscal year.
(2) The funds of certain trusts are entrusted in whole or in part to the Caisse de dépôt et placement du Québec (the Caisse). The net assets of the Caisse, shown at fair value, included $266 718M in funds entrusted to it by these trusts.
(3) The net assets of the Caisse include assets taken into account in the government's consolidated financial statements, particularly those of the Retirement Plans Sinking Fund and the Generations Fund. The fair value of these assets was $145 044M.
GLOSSARY
Glossary
The following terms are used in the sections "Analysis of the consolidated financial statements" and "Consolidated financial statements" contained in this volume.
Accrual basis of accounting
The accrual basis of accounting is an accounting method that involves taking into account, in determining net results of the revenues earned and the expenditures incurred during a fiscal year, without considering the moment the transactions were settled through cash receipts or disbursements or in any other manner.
Advance borrowings
Advance borrowings are borrowings made by the general fund of the Consolidated Revenue Fund in a fiscal year, of which the cash has been received as at March 31, 2024, to meet its financial requirements in the next fiscal year.
Consolidated Revenue Fund
The Consolidated Revenue Fund consists of all money received or collected from various sources over which the Parliament of Québec has the power of appropriation. It comprises a general fund and special funds.
Contingency Fund
The Contingency Fund is a provision administered by the Conseil du trésor which is intended in particular to cover unforeseen expenses that may arise in any of the government programs during the fiscal year, as well as the cost of certain measures announced in the budget.
Cost-sharing plans
Cost-sharing pension plans are joint plans for which the government's responsibility for payment of the benefits granted by the plan is limited to its share of the cost of benefits accrued by employees.
Cost-balance plans
Cost-balance pension plans are plans for which the government covers the total cost of accrued benefits, net of the contributions paid by employees and certain employers.
Debt representing accumulated deficits
The debt representing accumulated deficits consists of the accumulated operating deficits and accumulated remeasurement gains and losses.
Derivative financial instruments
Derivative financial instruments are instruments whose value fluctuates according to an underlying instrument (for example, an interest rate, a foreign exchange rate, an index or the price of a commodity) without requiring the holding or delivery of the underlying instrument itself.
Glossary (cont'd)
Effective interest method
The effective interest method is used to establish the amortized cost of a financial asset or financial liability (or a group of financial assets or financial liabilities), and to allocate interest income or interest expense appropriately between the fiscal years. The effective interest rate takes into account transaction costs, discounts and premiums.
Fair value
Fair value is the amount of the consideration that would be agreed upon in an arm's length transaction between knowledgeable, willing parties who are under no compulsion to act.
Financial assets
Financial assets represent assets that are used to repay existing debts or to finance future operations. They are not intended to be used to deliver public services.
Financial instruments
Financial instruments are any contracts that give rise to financial assets, such as investments and loans, and financial liabilities or equity instrument, such as debt, derivatives and equities.
Financial liabilities
Financial liabilities are liabilities corresponding to an obligation:
to deliver cash or another financial asset;
to exchange financial instruments under conditions that are potentially unfavorable to the government.
General fund
The general fund consists of money paid into the Consolidated Revenue Fund that has not been credited to a special fund under legislative provisions.
Generations Fund
Under the Act to reduce the debt and establish the Generations Fund (CQLR, chapter R-2.2.0.1), the Minister of Finance deposits the sums that make up this fund with the Caisse de dépôt et placement du Québec. These sums are used exclusively for repaying the government's gross debt.
Glossary (cont'd)
Government enterprises
A government enterprise has all of the following characteristics:
it is a separate legal entity that has the authority to enter into contracts in its own name and to go before a court;
it is vested with the financial and administrative power to carry out commercial activities;
its main activity is the sale of goods or the delivery of services to individuals or to organizations not included in the government's reporting entity;
it may, during the normal course of its operations, pursue its activities and settle its debts using revenue from sources not included in the government's reporting entity.
Gross debt
The gross debt corresponds to the sum of debts (before offsetting treasury securities) of which the cash has been received as at March 31, 2024, liabilities related to derivative financial instruments and the net liability regarding the pension plans and other employee future benefits. The balances of the Generations Fund, sinking funds relating to borrowings (before offsetting treasury securities), assets related to derivative financial instruments and advance borrowings are deducted from this sum.
Gross domestic product (GDP)
GDP is the value of all goods and services produced within the geographical limits of a country or a territory during a given calendar year.
Liabilities
Liabilities are obligations of the government toward third parties on the consolidated financial statement date arising from past transactions or events, and whose fulfilment will give rise to an outflow of resources representative of economic benefits in the future.
Net debt
The net debt corresponds to the difference between the government's financial assets and its liabilities. It consists of accumulated deficits and non-financial assets.
Non-budget-funded bodies
Non-budget-funded bodies depend in whole or in part on departments for their funding. However, non-budget-funded bodies have more autonomy than those funded by budgetary appropriations. Although non-budget-funded bodies also answer to a minister, the legislation grants their management more extensive funding and operating powers.
Non-financial assets
Non financial assets represent assets that are used in the normal course of the government's activities to deliver public services.
Glossary (cont'd)
Organizations in the government's networks
The network bodies are part of four networks:
the health and social services network includes integrated health and social services centres, as well as other public institutions and regional authorities;
the education network includes school service centres and school boards;
the higher education networks include general and vocational colleges (CEGEPs) and the Université du Québec and its constituent universities.
All of these organizations, which are funded largely through budgetary appropriations of their responsible department, are autonomous in regard to the delivery of public services. They are legal entities that are vested with the financial and administrative powers needed to provide public services. In addition, the government's ability to dispose of their assets is subject to major restrictions.
Own-source revenue
Own-source revenue consists of revenue from income and property taxes, consumption taxes, duties, permits and royalties, miscellaneous sources and government enterprises.
Retirement Plans Sinking Fund (RPSF)
Under the Financial Administration Act (CQLR, chapter A-6.001), the Minister of Finance may make long-term investments by depositing money from the general fund of the Consolidated Revenue Fund with the Caisse de dépôt et placement du Québec, up to an amount equal to the sums recognized as the pension plans liability, in order to create a sinking fund to provide for the payment of all or part of the benefits awarded under these plans.
Sinking Fund relating to government borrowings
Under the Financial Administration Act (CQLR, chapter A-6.001), the Minister of Finance may create a sinking fund to provide for the repayment of any borrowing that is part of the government's debt. To that end, the Minister may, with the authorization of the government, take out of the general fund of the Consolidated Revenue Fund any sum the Minister pays into the sinking fund. In addition, prudential liquid assets are kept in the sinking fund to enable the government to fulfill its financial commitments in the event of major disruptions in financial markets.
Special fund
A special fund is a fund established by an Act to provide for certain financial commitments of a minister, a budget-funded body or a non-budget-funded body exercising an adjudicative function. Legislative provisions determine which sums paid into the Consolidated Revenue Fund must be credited to a special fund.
Glossary (cont'd)
Supercategories
Supercategories consist of the categories used to account for expenditures, other than that of the debt service.
Transfer
This supercategory includes expenditures that are paid out to provide beneficiaries with various forms of financial support. For the government, these expenditures do not constitute direct acquisitions of goods or services or funds granted for the purpose of obtaining a return, as in the case of an investment, or amounts for which it expects to be repaid at a later date, as in the case of loans.
Remuneration
This supercategory includes expenditures incurred for ordinary remuneration, overtime and certain other indemnities paid directly by the government to permanent and part-time employees and to casual employees, including students and seasonal employees. It also includes the remuneration of health professionals, including that of the independent workforce, as well as salaries and allowances paid to members of the National Assembly, any person appointed or designated by the National Assembly to hold a public office and the personnel directed by that person, judges and members of the Sûreté du Québec. Lastly, it includes all benefits and other contributions paid by the government in its capacity as an employer, particularly, contributions to the pension plans, the Québec Pension Plan, the Québec Parental Insurance Plan and employment insurance.
Operating
This supercategory includes expenditures incurred in the course of administrative activities, apart from remuneration expenses, transfer expenses, doubtful accounts and other allowances, and debt service. In particular, it includes the estimated cost of reassessments and of the government's new obligations regarding the remediation of contaminated sites, as well as the depreciation of fixed assets and accretion expenses.
Doubtful accounts and other allowances
This supercategory includes expenditures resulting from changes in the allowance for doubtful accounts, the allowance for losses on financial initiatives guaranteed by the government and the valuation allowance for loans, investments and advances.
Transfer expenditures
Transfers are economic benefits granted by a government to a recipient, for no consideration in goods or services and for which the government does not expect to be reimbursed at a later date or to obtain a direct financial return.