Exhibit 99.22

|
| Note to the reader: Québec Economic Plan |
The initiatives announced in the November 2017 update of the Québec Economic Plan totalling $1.3 billion in 2017-2018, including an additional reduction in the tax burden on individuals, are partly included in this report. Added to these are the initiatives in the March 2018 Québec Economic Plan, which amount to $848 million. Taking into account these initiatives and the other projected results between March 1 and March 31, 2018, a budgetary surplus of $850 million is forecast for 2017-2018
| | | | | | | | | | | | | | | | |
| SUMMARY OF CONSOLIDATED BUDGETARY TRANSACTIONS | | | | | | | | | | |
| (unaudited data, millions of dollars) | | | | | | | | | | | | | | | | |
| | | | | | | | | | | | | | March 2018 |
| | February | | April to February | | Québec Economic Plan(1) |
| | 2017(2) | | 2018 | | | 2016-2017(2) | | 2017-2018 | | Change (%) | | | 2017-2018 | | Change (%) | |
| GENERAL FUND | | | | | | | | | | | | | | | | |
| Revenue | | | | | | | | | | | | | | | | |
| Own-source revenue | 4 884 | | 5 164 | | | 52 968 | | 54 494 | | 2.9 | | | 60 356 | | 1.3 | |
| Federal transfers | 1 565 | | 1 669 | | | 17 060 | | 18 518 | | 8.5 | | | 20 249 | | 9.0 | |
| Total revenue | 6 449 | | 6 833 | | | 70 028 | | 73 012 | | 4.3 | | | 80 605 | | 3.1 | |
| Expenditure | | | | | | | | | | | | | | | | |
| Program spending | –5 327 | | –5 472 | | | –61 612 | | –63 805 | | 3.6 | | | –72 591 | | 4.6 | |
| Debt service | –647 | | –619 | | | –6 915 | | –6 568 | | –5.0 | | | –7 220 | | –4.3 | |
| Total expenditure | –5 974 | | –6 091 | | | –68 527 | | –70 373 | | 2.7 | | | –79 811 | | 3.8 | |
| NET RESULTS OF | | | | | | | | | | | | | | | | |
| CONSOLIDATED ENTITIES(3) | | | | | | | | | | | | | | | | |
| Non-budget-funded bodies and special funds(4) | –42 | | 254 | | | 1 068 | | 1 383 | | — | | | –44 | | — | |
| Health and social services and education networks(5) | 18 | | 9 | | | 19 | | 92 | | — | | | 100 | | — | |
| Generations Fund | 151 | | 179 | | | 1 820 | | 1 997 | | — | | | 2 292 | | — | |
| Total consolidated entities | 127 | | 442 | | | 2 907 | | 3 472 | | — | | | 2 348 | | — | |
| SURPLUS (DEFICIT) | 602 | | 1 184 | | | 4 408 | | 6 111 | | — | | | 3 142 | | — | |
| BALANCED BUDGET ACT | | | | | | | | | | | | | | | | |
| Deposits of dedicated revenues in the Generations Fund | –151 | | –179 | | | –1 820 | | –1 997 | | — | | | –2 292 | | — | |
| BUDGETARY BALANCE(6) | 451 | | 1 005 | | | 2 588 | | 4 114 | | — | | | 850 | | — | |
 CHANGE IN THE BUDGETARY SITUATION IN 2017-2018
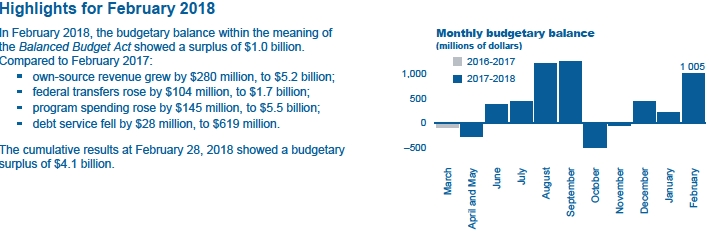
The cumulative results at February 28, 2018 showed a $4.1-billion budgetary surplus for 2017-2018.
A budgetary surplus of $850 million is forecast for 2017-2018 in the March 2018 Québec Economic Plan.
The projected decrease in the surplus in March 2018 is due to:
a $1.1-billion reduction in the tax burden on individuals, for which a $71-million balance has yet to be recorded by March 31, 2018,
$41 million to reduce poverty, for which a $17-million balance has yet to be recorded,
$129 million for educational success and health, for which a $120-million balance has yet to be recorded,
$86 million to support regional economies, for which an $83-million balance has yet to be recorded;
the new initiatives in the March 2018 Québec Economic Plan, which amount to $848 million;
the other projected results amounting to $2.1 billion in March 2018:
the government's $733-million contribution to the Autorité régionale de transport métropolitain (ARTM) for the operation of the Réseau express métropolitain (REM),
support of $250 million for the taxi industry,
the achievement of spending targets by government departments and bodies and of revenue targets.
| | |
| CHANGE IN THE FINANCIAL FRAMEWORK FOR 2017-2018 | | |
| (millions of dollars) | | |
| | 2017-2018 | |
| MONTHLY REPORT ON FINANCIAL TRANSACTIONS AT FEBRUARY 28, 2018 | 4 114 | |
| RESULTS PROJECTED IN MARCH 2018 | | |
| Initiatives in the November 2017 update | –291 | |
| Initiatives in the March 2018 Québec Economic Plan | | |
| – Additional investments in health | –136 | |
| – Further investments to support families and communities | –72 | |
| – Fostering of economic development | –640 | |
| Subtotal | –848 | |
| Other projected results | | |
| – Government's contribution to the ARTM for the operation of the REM | –733 | |
| – Support for the taxi industry | –250 | |
| – Achievement of spending and revenue targets | –1 142 | |
| Subtotal | –2 125 | |
| BUDGETARY BALANCE(6) – MARCH 2018 QUÉBEC ECONOMIC PLAN | 850 | |
2
GENERAL FUND REVENUE
For February 2018, General Fund revenue reached $6.8 billion, an increase of $384 million, or 6.0%, compared to February 2017.
Own-source revenue reached $5.2 billion, an increase of $280 million, or 5.7%, compared to February 2017.
Federal transfers amounted to $1.7 billion, up $104 million compared to February 2017.
Since the beginning of the fiscal year, General Fund revenue has totalled $73.0 billion, an increase of $3.0 billion, or 4.3%, compared to February 28, 2017.
| | | | | | | | | | | | | |
| GENERAL FUND REVENUE | | | | | | | | | | | | | |
| (unaudited data, millions of dollars) | | | | | | | | | | | | | |
| | February | | April to February |
| Revenue by source | 2017(2) | | 2018 | | Change (%) | | | 2016-2017(2) | | 2017-2018 | | Change (%) | |
| Own-source revenue excluding revenue from government enterprises | | | | | | | | | | | | | |
| Income and property taxes | | | | | | | | | | | | | |
Personal income tax | 1 749 | | 1 639 | | –6.3 | | | 20 250 | | 19 687 | | –2.8 | |
Contributions for health services | 538 | | 542 | | 0.7 | | | 6 508 | | 6 703 | | 3.0 | |
Corporate taxes | 836 | | 966 | | 15.6 | | | 4 246 | | 5 073 | | 19.5 | |
| Consumption taxes | 1 064 | | 1 349 | | 26.8 | | | 16 298 | | 17 573 | | 7.8 | |
| Other sources | 95 | | 108 | | 13.7 | | | 1 442 | | 1 415 | | –1.9 | |
| Total own-source revenue excluding revenue from government enterprises | 4 282 | | 4 604 | | 7.5 | | | 48 744 | | 50 451 | | 3.5 | |
| Revenue from government enterprises | 602 | | 560 | | –7.0 | | | 4 224 | | 4 043 | | –4.3 | |
| Total own-source revenue | 4 884 | | 5 164 | | 5.7 | | | 52 968 | | 54 494 | | 2.9 | |
| Federal transfers | | | | | | | | | | | | | |
| Equalization | 836 | | 923 | | 10.4 | | | 9 194 | | 10 157 | | 10.5 | |
| Health transfers | 497 | | 520 | | 4.6 | | | 5 449 | | 5 691 | | 4.4 | |
| Transfers for post-secondary education and other social programs | 137 | | 142 | | 3.6 | | | 1 497 | | 1 559 | | 4.1 | |
| Other programs | 95 | | 84 | | –11.6 | | | 920 | | 1 111 | | 20.8 | |
| Total federal transfers | 1 565 | | 1 669 | | 6.6 | | | 17 060 | | 18 518 | | 8.5 | |
| TOTAL | 6 449 | | 6 833 | | 6.0 | | | 70 028 | | 73 012 | | 4.3 | |
3
GENERAL FUND EXPENDITURE
For February 2018, General Fund expenditure totalled $6.1 billion, up $117 million, or 2.0%, compared to the same period the previous fiscal year.
Program spending rose by $145 million, or 2.7%, to $5.5 billion.
Debt service amounted to $619 million, a decrease of $28 million compared to last year.
Since the beginning of the fiscal year, General Fund expenditure has totalled $70.4 billion, up $1.8 billion compared to the same period the previous fiscal year.
| | | | | | | | | | | | | |
| GENERAL FUND EXPENDITURE | | | | | | | | | | | | | |
| (unaudited data, millions of dollars) | | | | | | | | | | | | | |
| | February | | April to February |
| Expenditure by mission | 2017(2) | | 2018 | | Change (%) | | | 2016-2017(2) | | 2017-2018 | | Change (%) | |
| Program spending | | | | | | | | | | | | | |
| Health and Social Services | 2 615 | | 2 698 | | 3.2 | | | 31 689 | | 32 716 | | 3.2 | |
| Education and Culture | 1 557 | | 1 605 | | 3.1 | | | 16 247 | | 16 901 | | 4.0 | |
| Economy and Environment | 382 | | 354 | | –7.3 | | | 4 530 | | 4 451 | | –1.7 | |
| Support for Individuals and Families | 495 | | 507 | | 2.4 | | | 5 664 | | 5 668 | | 0.1 | |
| Administration and Justice | 278 | | 308 | | 10.8 | | | 3 482 | | 4 069 | | 16.9 | |
| Total program spending | 5 327 | | 5 472 | | 2.7 | | | 61 612 | | 63 805 | | 3.6 | |
| Debt service | 647 | | 619 | | –4.3 | | | 6 915 | | 6 568 | | –5.0 | |
| TOTAL | 5 974 | | 6 091 | | 2.0 | | | 68 527 | | 70 373 | | 2.7 | |
4
CONSOLIDATED ENTITIES
For February 2018, the results of consolidated entities showed a surplus of $442 million. These results include:
a surplus of $306 million for special funds;
dedicated revenues of $179 million for the Generations Fund;
a deficit of $52 million for non-budget-funded bodies;
a surplus of $9 million for the health and social services and education networks.
Since the beginning of the fiscal year, the results of consolidated entities have shown a surplus of $3.5 billion. These results include:
a surplus of $1.1 billion for special funds;
dedicated revenues of $2.0 billion for the Generations Fund;
a surplus of $246 million for non-budget-funded bodies;
a surplus of $92 million for the health and social services and education networks.
| | | | | | | | | | | | | | | | | | |
| DETAILS OF THE TRANSACTIONS OF CONSOLIDATED ENTITIES | | | | | | | | | | | |
| (unaudited data, millions of dollars) | | | | | | | | | | | | | | | |
| | February 2018 |
| | Special funds | | Generations Fund | | Specified purpose accounts | | Transfers (expenditures) related to the tax system | | Non-budget-funded bodies | | Health and education networks (5) | | Total | | Consolidation adjustments (7) | | Total | |
| Revenue | 1 455 | | 179 | | 35 | | 405 | | 1 909 | | — | | 3 983 | | –2 551 | | 1 432 | |
| Expenditure | | | | | | | | | | | | | | | | | | |
Expenditure | –971 | | — | | –35 | | –405 | | –1 926 | | 9 | | –3 328 | | 2 474 | | –854 | |
Debt service | –178 | | — | | — | | — | | –35 | | — | | –213 | | 77 | | –136 | |
| Subtotal | –1 149 | | — | | –35 | | –405 | | –1 961 | | 9 | | –3 541 | | 2 551 | | –990 | |
| SURPLUS (DEFICIT) | 306 | | 179 | | — | | — | | –52 | | 9 | | 442 | | — | | 442 | |
| | | | | | | | | | | | | | |
| | April 2017 to February 2018 |
| | Special funds | | Generations Fund | | Specified purpose accounts | | Transfers (expenditures) related to the tax system | | Non-budget-funded bodies | | Health and education networks (5) | | Total | | Consolidation adjustments (7) | | Total | |
| Revenue | 12 109 | | 1 997 | | 895 | | 5 560 | | 21 783 | | — | | 42 344 | | –24 128 | | 18 216 | |
| Expenditure | | | | | | | | | | | | | | | | | | |
Expenditure | –8 902 | | — | | –895 | | –5 560 | | –21 000 | | 92 | | –36 265 | | 23 225 | | –13 040 | |
Debt service | –2 070 | | — | | — | | — | | –537 | | — | | –2 607 | | 903 | | –1 704 | |
| Subtotal | –10 972 | | — | | –895 | | –5 560 | | –21 537 | | 92 | | –38 872 | | 24 128 | | –14 744 | |
| SURPLUS (DEFICIT) | 1 137 | | 1 997 | | — | | — | | 246 | | 92 | | 3 472 | | — | | 3 472 | |
5
NET FINANCIAL SURPLUS (REQUIREMENTS)
Net financial surpluses (requirements) reflect the current budgetary balance, as well as the year-over-year change in receipts and disbursements in the course of the government’s transactions.
For February 2018, the consolidated net financial surplus stood at $718 million, a decrease of $385 million over last year.
Since the beginning of the fiscal year, the consolidated net financial surplus has stood at $6.3 billion, an increase of $3.2 billion over last year.
| | | | | | | | | | | | | |
| CONSOLIDATED BUDGETARY AND FINANCIAL TRANSACTIONS | | | | | | | | | | | | |
| (unaudited data, millions of dollars) | | | | | | | | | | | | | |
| | February | | April to February |
| | 2017 | (2) | 2018 | | Change | | | 2016-2017 | (2) | 2017-2018 | | Change | |
| GENERAL FUND | | | | | | | | | | | | | |
| Revenue | | | | | | | | | | | | | |
| Own-source revenue | 4 884 | | 5 164 | | 280 | | | 52 968 | | 54 494 | | 1 526 | |
| Federal transfers | 1 565 | | 1 669 | | 104 | | | 17 060 | | 18 518 | | 1 458 | |
| Total revenue | 6 449 | | 6 833 | | 384 | | | 70 028 | | 73 012 | | 2 984 | |
| Expenditure | | | | | | | | | | | | | |
| Program spending | –5 327 | | –5 472 | | –145 | | | –61 612 | | –63 805 | | –2 193 | |
| Debt service | –647 | | –619 | | 28 | | | –6 915 | | –6 568 | | 347 | |
| Total expenditure | –5 974 | | –6 091 | | –117 | | | –68 527 | | –70 373 | | –1 846 | |
| NET RESULTS OF CONSOLIDATED ENTITIES(3) | | | | | | | | | | | | | |
| Non-budget-funded bodies and special funds(4) | –42 | | 254 | | 296 | | | 1 068 | | 1 383 | | 315 | |
| Health and social services and education networks(5) | 18 | | 9 | | –9 | | | 19 | | 92 | | 73 | |
| Generations Fund | 151 | | 179 | | 28 | | | 1 820 | | 1 997 | | 177 | |
| Total consolidated entities | 127 | | 442 | | 315 | | | 2 907 | | 3 472 | | 565 | |
| SURPLUS (DEFICIT) | 602 | | 1 184 | | 582 | | | 4 408 | | 6 111 | | 1 703 | |
| Consolidated non-budgetary surplus (requirements) | 501 | | –466 | | –967 | | | –1 279 | | 176 | | 1 455 | |
| CONSOLIDATED NET FINANCIAL SURPLUS (REQUIREMENTS) | 1 103 | | 718 | | –385 | | | 3 129 | | 6 287 | | 3 158 | |
6
Appendix
| | | | | | | | |
| BUDGET FORECASTS FOR 2017-2018 | | | | | | | | |
| (millions of dollars) | | | | | | | | |
| | March 2017 | | | | March 2018 | | | |
| | Québec | | | | Québec | | | |
| | Economic Plan | | Adjustments | | Economic Plan | (1) | Change (%) | (8) |
| Own-source revenue excluding revenue from government enterprises | | | | | | | | |
| Income and property taxes | | | | | | | | |
Personal income tax | 23 687 | | –1 494 | | 22 193 | | –2.2 | |
Contributions for health services | 7 261 | | 101 | | 7 362 | | 2.1 | |
Corporate taxes | 5 311 | | 603 | | 5 914 | | 12.1 | |
| Consumption taxes | 18 275 | | 670 | | 18 945 | | 5.6 | |
| Other sources | 1 665 | | –25 | | 1 640 | | –4.0 | |
| Total own-source revenue excluding revenue from government enterprises | 56 199 | | –145 | | 56 054 | | 2.2 | |
| Revenue from government enterprises | 4 050 | | 252 | | 4 302 | | –9.1 | |
| Total own-source revenue | 60 249 | | 107 | | 60 356 | | 1.3 | |
| Federal transfers | 20 053 | | 196 | | 20 249 | | 9.0 | |
| TOTAL GENERAL FUND REVENUE | 80 302 | | 303 | | 80 605 | | 3.1 | |
| Program spending | | | | | | | | |
| Health and Social Services | –36 764 | | –105 | | –36 869 | | 4.2 | |
| Education and Culture | –18 877 | | 22 | | –18 855 | | 5.2 | |
| Economy and Environment | –5 418 | | — | | –5 418 | | –1.6 | |
| Support for Individuals and Families | –6 274 | | –89 | | –6 363 | | 0.5 | |
| Administration and Justice | –5 258 | | 172 | | –5 086 | | 20.5 | |
| Total program spending | –72 591 | | — | | –72 591 | | 4.6 | |
| Debt service | –7 776 | | 556 | | –7 220 | | –4.3 | |
| TOTAL GENERAL FUND EXPENDITURE | –80 367 | | 556 | | –79 811 | | 3.8 | |
| Net results of consolidated entities | | | | | | | | |
| Non-budget-funded bodies and special funds(4) | 165 | | –209 | | –44 | | — | |
| Health and social services and education networks(5) | — | | 100 | | 100 | | — | |
| Generations Fund | 2 488 | | –196 | | 2 292 | | — | |
| TOTAL CONSOLIDATED ENTITIES | 2 653 | | –305 | | 2 348 | | — | |
| Contingency reserve | –100 | | 100 | | — | | — | |
| SURPLUS (DEFICIT) | 2 488 | | 654 | | 3 142 | | — | |
| BALANCED BUDGET ACT | | | | | | | — | |
| Deposits of dedicated revenues in the Generations Fund | –2 488 | | 196 | | –2 292 | | — | |
| BUDGETARY BALANCE(6) | — | | 850 | | 850 | | — | |
7
| Notes | |
| (1) | The presentation of the budgetary information in this monthly report is consistent with that of the financial framework for the General Fund and consolidated entities as published on page A.25 of The Québec Economic Plan – March 2018. |
| (2) | The 2016-2017 data in the monthly report have been reclassified to account for changes in the 2017-2018 budgetary structure, in particular the elimination of the Fund to Finance Health and Social Services Institutions. |
| (3) | Details of transactions by type of entity are presented on page 5 of this report. |
| (4) | These results include consolidation adjustments. |
| (5) | The results of the networks are presented according to the modified equity method of accounting. |
| (6) | Budgetary balance within the meaning of the Balanced Budget Act. |
| (7) | Consolidation adjustments include the elimination of General Fund program spending. |
| (8) | This is the annual change compared to actual results in 2016-2017. |
The next monthly report, which will present the preliminary results at March 31, 2018, will be published on June 22, 2018.
For more information, contact the Direction des communications of the Ministère des Finances at 418 528-7382.
The report is also available on the Ministère des Finances website: www.finances.gouv.qc.ca.
8