Exhibit 99.3

Note to the reader: Preliminary results for 2017-2018
The results published on June 22, 2018 regarding the fiscal year ended March 31, 2018 are preliminary. These results will be revised to reflect additional information obtained until the financial close. The final results will be presented in Public Accounts 2017-2018.
| | | | | | | | | | | | | | | | |
| SUMMARY OF CONSOLIDATED BUDGETARY TRANSACTIONS |
| (unaudited data, millions of dollars) |
| | | | | | | | | | | | | | March 2018 |
| | March | | April to March | | Québec Economic Plan(1) |
| | 2017 | (2) | 2018 | | | 2016-2017(2) | | 2017-2018 | | Change (%) | | | 2017-2018 | | Change (%) | |
| GENERAL FUND | | | | | | | | | | | | | | | | |
| Revenue | | | | | | | | | | | | | | | | |
| Own-source revenue | 6 598 | | 7 318 | | | 59 566 | | 61 812 | | 3.8 | | | 60 356 | | 1.3 | |
| Federal transfers | 1 522 | | 1 615 | | | 18 582 | | 20 133 | | 8.3 | | | 20 249 | | 9.0 | |
| Total revenue | 8 120 | | 8 933 | | | 78 148 | | 81 945 | | 4.9 | | | 80 605 | | 3.1 | |
| Expenditure | | | | | | | | | | | | | | | | |
| Program spending | –7 764 | | –8 788 | | | –69 376 | | –72 593 | | 4.6 | | | –72 591 | | 4.6 | |
| Debt service | –628 | | –580 | | | –7 543 | | –7 148 | | –5.2 | | | –7 220 | | –4.3 | |
| Total expenditure | –8 392 | | –9 368 | | | –76 919 | | –79 741 | | 3.7 | | | –79 811 | | 3.8 | |
| NET RESULTS OF CONSOLIDATED ENTITIES(3) | | | | | | | | | | | | | | | | |
| Non-budget-funded bodies and special funds(4) | –225 | | –1 320 | | | 843 | | 63 | | — | | | –44 | | — | |
| Health and social services and education networks(5) | 270 | | 8 | | | 289 | | 100 | | — | | | 100 | | — | |
| Generations Fund | 181 | | 296 | | | 2 001 | | 2 293 | | — | | | 2 292 | | — | |
| Total consolidated entities | 226 | | –1 016 | | | 3 133 | | 2 456 | | — | | | 2 348 | | — | |
| SURPLUS (DEFICIT) | –46 | | –1 451 | | | 4 362 | | 4 660 | | ��� | | | 3 142 | | — | |
| BALANCED BUDGET ACT | | | | | | | | | | | | | | | | |
| Deposits of dedicated revenues in the Generations Fund | –181 | | –296 | | | –2 001 | | –2 293 | | — | | | –2 292 | | — | |
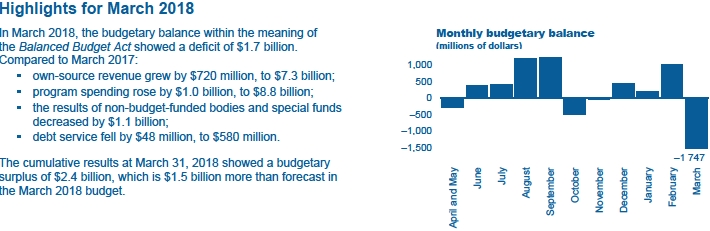
| BUDGETARY BALANCE(6) | –227 | | –1 747 | | | 2 361 | | 2 367 | | — | | | 850 | | — | |
 GENERAL FUND REVENUE
For March 2018, General Fund revenue reached $8.9 billion, an increase of $813 million, or 10.0%, compared to March 2017.
Own-source revenue reached $7.3 billion, an increase of $720 million, or 10.9%, compared to March 2017.
– This increase is due primarily to growth in revenue from personal income tax ($611 million).
Federal transfers amounted to $1.6 billion, up $93 million compared to March 2017.
Since the beginning of the fiscal year, General Fund revenue has totalled $81.9 billion, an increase of $3.8 billion, or 4.9%, compared to March 31, 2017.
Own-source revenue stood at $61.8 billion, up $2.2 billion, or 3.8%, from last year.
– This increase is due primarily to growth in consumption taxes ($1.1 billion) and corporate taxes ($821 million).
Federal transfers amounted to $20.1 billion, up $1.6 billion compared to March 31, 2017.
| | | | | | | | | | | | | |
| GENERAL FUND REVENUE | | | | | | | | | | | | | |
| (unaudited data, millions of dollars) | | | | | | | | | | | | | |
| | | | March | | | | | | | April to March | | | |
| Revenue by source | 2017 | (2) | 2018 | | Change (%) | | | 2016-2017 | (2) | 2017-2018 | | Change (%) | |
| Own-source revenue excluding revenue from government enterprises | | | | | | | | | | | | | |
| Income and property taxes | | | | | | | | | | | | | |
| Personal income tax | 2 442 | | 3 053 | | 25.0 | | | 22 692 | | 22 740 | | 0.2 | |
| Contributions for health services | 702 | | 806 | | 14.8 | | | 7 210 | | 7 509 | | 4.1 | |
| Corporate taxes | 1 027 | | 1 021 | | –0.6 | | | 5 273 | | 6 094 | | 15.6 | |
| Consumption taxes | 1 649 | | 1 496 | | –9.3 | | | 17 947 | | 19 069 | | 6.3 | |
| Other sources | 267 | | 320 | | 19.9 | | | 1 709 | | 1 735 | | 1.5 | |
| Total own-source revenue excluding revenue from government enterprises | 6 087 | | 6 696 | | 10.0 | | | 54 831 | | 57 147 | | 4.2 | |
| Revenue from government enterprises | 511 | | 622 | | 21.7 | | | 4 735 | | 4 665 | | –1.5 | |
| Total own-source revenue | 6 598 | | 7 318 | | 10.9 | | | 59 566 | | 61 812 | | 3.8 | |
| Federal transfers | | | | | | | | | | | | | |
| Equalization | 836 | | 924 | | 10.5 | | | 10 030 | | 11 081 | | 10.5 | |
| Health transfers | 497 | | 437 | | –12.1 | | | 5 946 | | 6 128 | | 3.1 | |
| Transfers for post-secondary education and other social programs | 138 | | 108 | | –21.7 | | | 1 635 | | 1 667 | | 2.0 | |
| Other programs | 51 | | 146 | | 186.3 | | | 971 | | 1 257 | | 29.5 | |
| Total federal transfers | 1 522 | | 1 615 | | 6.1 | | | 18 582 | | 20 133 | | 8.3 | |
| TOTAL | 8 120 | | 8 933 | | 10.0 | | | 78 148 | | 81 945 | | 4.9 | |
2
GENERAL FUND EXPENDITURE
For March 2018, General Fund expenditure totalled $9.4 billion, up $976 million, or 11.6%, compared to the same period the previous fiscal year.
Program spending rose by $1.0 billion, or 13.2%, to $8.8 billion.
Debt service amounted to $580 million, a decrease of $48 million compared to last year.
Since the beginning of the fiscal year, General Fund expenditure has totalled $79.7 billion, up $2.8 billion compared to the same period the previous fiscal year.
Program spending rose by $3.2 billion, or 4.6%, to $72.6 billion.
– The most significant changes were in the Health and Social Services mission ($1.4 billion), the Education and Culture mission ($1.1 billion), the Administration and Justice mission ($446 million) and the Economy and environment mission ($342 million).
Debt service amounted to $7.1 billion, a decrease of $395 million compared to last year.
| | | | | | | | | | | | | |
| GENERAL FUND EXPENDITURE | | | | | | | | | | | | | |
| (unaudited data, millions of dollars) | | | | | | | | | | | | | |
| | | | March | | | | | | | April to March | | | |
| Expenditure by mission | 2017 | (2) | 2018 | | Change (%) | | | 2016-2017(2) | | 2017-2018 | | Change (%) | |
| Program spending | | | | | | | | | | | | | |
| Health and Social Services | 3 701 | | 4 029 | | 8.9 | | | 35 390 | | 36 745 | | 3.8 | |
| Education and Culture | 1 679 | | 2 105 | | 25.4 | | | 17 926 | | 19 006 | | 6.0 | |
| Economy and Environment | 976 | | 1 397 | | 43.1 | | | 5 506 | | 5 848 | | 6.2 | |
| Support for Individuals and Families | 669 | | 659 | | –1.5 | | | 6 333 | | 6 327 | | –0.1 | |
| Administration and Justice | 739 | | 598 | | –19.1 | | | 4 221 | | 4 667 | | 10.6 | |
| Total program spending | 7 764 | | 8 788 | | 13.2 | | | 69 376 | | 72 593 | | 4.6 | |
| Debt service | 628 | | 580 | | –7.6 | | | 7 543 | | 7 148 | | –5.2 | |
| TOTAL | 8 392 | | 9 368 | | 11.6 | | | 76 919 | | 79 741 | | 3.7 | |
3
CONSOLIDATED ENTITIES
For March 2018, the results of consolidated entities showed a deficit of $1.0 billion. These results include:
a deficit of $1.4 billion for special funds;
dedicated revenues of $296 million for the Generations Fund;
a surplus of $124 million for non-budget-funded bodies;
a surplus of $8 million for the health and social services and education networks.
Since the beginning of the fiscal year, the results of consolidated entities have shown a surplus of $2.5 billion. These results include:
a deficit of $307 million for special funds;
dedicated revenues of $2.3 billion for the Generations Fund;
a surplus of $370 million for non-budget-funded bodies;
a surplus of $100 million for the health and social services and education networks.
| | | | | | | | | | | | | | | | | | |
| DETAILS OF THE TRANSACTIONS OF CONSOLIDATED ENTITIES | | | | | | | | | | | |
| (unaudited data, millions of dollars) | | | | | | | | | | | | | | | |
| | | | | | | | March 2018 | | | | | | |
| | Special funds | | Generations Fund | | Specified accounts purpose | | Transfers (expenditures) related tax system to the | | Non-budget funded bodies | | Health and education networks (5) | | Total | | Consolidation adjustments (7) | | Total | |
| Revenue | 1 443 | | 296 | | 602 | | 414 | | 2 945 | | — | | 5 700 | | –2 918 | | 2 782 | |
| Expenditure | | | | | | | | | | | | | | | | | | |
| Expenditure | –2 773 | | — | | –602 | | –414 | | –2 771 | | 8 | | –6 552 | | 2 868 | | –3 684 | |
| Debt service | –114 | | — | | — | | — | | –50 | | — | | –164 | | 50 | | –114 | |
| Subtotal | –2 887 | | — | | –602 | | –414 | | –2 821 | | 8 | | –6 716 | | 2 918 | | –3 798 | |
| SURPLUS (DEFICIT) | –1 444 | | 296 | | — | | — | | 124 | | 8 | | –1 016 | | — | | –1 016 | |
| | | | | | | | | | | | | | | | |
| | | | | | | | April to March 2018 | | | | | | |
| | Special funds | | Generations Fund | | Specified accounts purpose | | Transfers (expenditures) related tax system to the | | Non-budget funded bodies | | Health and education networks (5) | | Total | | Consolidation adjustments (7) | | Total | |
| Revenue | 13 552 | | 2 293 | | 1 497 | | 5 974 | | 24 728 | | — | | 48 044 | | –27 046 | | 20 998 | |
| Expenditure | | | | | | | | | | | | | | | | | | |
| Expenditure | –11 675 | | — | | –1 497 | | –5 974 | | –23 771 | | 100 | | –42 817 | | 26 093 | | –16 724 | |
| Debt service | –2 184 | | — | | — | | — | | –587 | | — | | –2 771 | | 953 | | –1 818 | |
| Subtotal | –13 859 | | — | | –1 497 | | –5 974 | | –24 358 | | 100 | | –45 588 | | 27 046 | | –18 542 | |
| SURPLUS (DEFICIT) | –307 | | 2 293 | | — | | — | | 370 | | 100 | | 2 456 | | — | | 2 456 | |
4
NET FINANCIAL SURPLUS (REQUIREMENTS)
Net financial surpluses (requirements) reflect the current budgetary balance, as well as the year-over-year change in receipts and disbursements in the course of the government’s transactions.
For March 2018, the consolidated net financial requirements stood at $1.9 billion, compared to a financial surplus of $1.6 billion last year.
Since the beginning of the fiscal year, the consolidated net financial surplus has stood at $4.4 billion, a decrease of $358 million over last year.
| | | | | | | | | | | | | |
| CONSOLIDATED BUDGETARY AND FINANCIAL TRANSACTIONS | | | | | | | | | | | | |
| (unaudited data, millions of dollars) | | | | | | | | | | | | | |
| | March | | April to March |
| | 2017 | (2) | 2018 | | Change | | | 2016-2017(2) | | 2017-2018 | | Change | |
| GENERAL FUND | | | | | | | | | | | | | |
| Revenue | | | | | | | | | | | | | |
| Own-source revenue | 6 598 | | 7 318 | | 720 | | | 59 566 | | 61 812 | | 2 246 | |
| Federal transfers | 1 522 | | 1 615 | | 93 | | | 18 582 | | 20 133 | | 1 551 | |
| Total revenue | 8 120 | | 8 933 | | 813 | | | 78 148 | | 81 945 | | 3 797 | |
| Expenditure | | | | | | | | | | | | | |
| Program spending | –7 764 | | –8 788 | | –1 024 | | | –69 376 | | –72 593 | | –3 217 | |
| Debt service | –628 | | –580 | | 48 | | | –7 543 | | –7 148 | | 395 | |
| Total expenditure | –8 392 | | –9 368 | | –976 | | | –76 919 | | –79 741 | | –2 822 | |
| NET RESULTS OF CONSOLIDATED ENTITIES(3) | | | | | | | | | | | | | |
| Non-budget-funded bodies and special funds(4) | –225 | | –1 320 | | –1 095 | | | 843 | | 63 | | –780 | |
| Health and social services and education networks(5) | 270 | | 8 | | –262 | | | 289 | | 100 | | –189 | |
| Generations Fund | 181 | | 296 | | 115 | | | 2 001 | | 2 293 | | 292 | |
| Total consolidated entities | 226 | | –1 016 | | –1 242 | | | 3 133 | | 2 456 | | –677 | |
| SURPLUS (DEFICIT) | –46 | | –1 451 | | –1 405 | | | 4 362 | | 4 660 | | 298 | |
| Consolidated non-budgetary surplus (requirements) | 1 658 | | –453 | | –2 111 | | | 379 | | –277 | | –656 | |
| CONSOLIDATED NET FINANCIAL SURPLUS (REQUIREMENTS) | 1 612 | | –1 904 | | –3 516 | | | 4 741 | | 4 383 | | –358 | |
5
CHANGE IN THE RESULTS SINCE THE MARCH 2018 QUÉBEC ECONOMIC PLAN
For 2017-2018, the preliminary budgetary balance stood at $2.4 billion, while the March 2018 Québec Economic Plan anticipated a $850-million surplus.
This improvement reflects, in particular, the Québec economy’s strong performance. Compared to the forecasts of the March 2018 budget, a $1.5-billion increase in own-source revenue was recorded.
Revenue from personal income tax was $547 million above the forecast.
Corporate taxes were up $180 million.
Revenue from government enterprises showed a $363-million improvement.
The $72.6-billion target set for program spending was achieved, which is a 4.6% increase.
The 3.8% increase in Health and Social Services spending was in line with the target of 4.2%. In Education and Culture, the increase of 6.0% reported is slightly higher than that of 5.2% expected.
The 6.2% increase in Economy and Environment spending mainly reflects the implementation of measures to support the Québec economy.
Lastly, the results of bodies and special funds improved by $107 million.
6
| | | | | | | | | | |
| CHANGE IN THE RESULTS FOR 2017-2018 SINCE THE MARCH 2018 QUÉBEC ECONOMIC PLAN | | | | |
| | March 2018 | | | Preliminary results |
| | Québec Economic Plan(1) | | | at June 22 |
| | $million | | % change | | Adjustments | | $million | | % change | |
| Own-source revenue excluding revenue from | | | | | | | | | | |
| government enterprises | | | | | | | | | | |
| Income and property taxes | | | | | | | | | | |
Personal income tax | 22 193 | | –2.2 | | 547 | | 22 740 | | 0.2 | |
Contributions for health services | 7 362 | | 2.1 | | 147 | | 7 509 | | 4.1 | |
Corporate taxes | 5 914 | | 12.2 | | 180 | | 6 094 | | 15.6 | |
| Consumption taxes | 18 945 | | 5.6 | | 124 | | 19 069 | | 6.3 | |
| Other sources | 1 640 | | –4.0 | | 95 | | 1 735 | | 1.5 | |
| Total own-source revenue excluding revenue from government enterprises | 56 054 | | 2.2 | | 1 093 | | 57 147 | | 4.2 | |
| Revenue from government enterprises | 4 302 | | –9.1 | | 363 | | 4 665 | | –1.5 | |
| Total own-source revenue | 60 356 | | 1.3 | | 1 456 | | 61 812 | | 3.8 | |
| Federal transfers | 20 249 | | 9.0 | | –116 | | 20 133 | | 8.3 | |
| TOTAL GENERAL FUND REVENUE | 80 605 | | 3.1 | | 1 340 | | 81 945 | | 4.9 | |
| Program spending | | | | | | | | | | |
| Health and Social Services | –36 869 | | 4.2 | | 124 | | –36 745 | | 3.8 | |
| Education and Culture | –18 855 | | 5.2 | | –151 | | –19 006 | | 6.0 | |
| Economy and Environment | –5 418 | | –1.6 | | –430 | | –5 848 | | 6.2 | |
| Support for Individuals and Families | –6 363 | | 0.5 | | 36 | | –6 327 | | –0.1 | |
| Administration and Justice | –5 086 | | 20.5 | | 419 | | –4 667 | | 10.6 | |
| Total program spending | –72 591 | | 4.6 | | –2 | | –72 593 | | 4.6 | |
| Debt service | –7 220 | | –4.3 | | 72 | | –7 148 | | –5.2 | |
| TOTAL GENERAL FUND EXPENDITURE | –79 811 | | 3.8 | | 70 | | –79 741 | | 3.7 | |
| Net results of consolidated entities | | | | | | | | | | |
| Non-budget-funded bodies and special funds(4) | –44 | | — | | 107 | | 63 | | — | |
| Health and social services and education networks(5) | 100 | | — | | — | | 100 | | — | |
| Generations Fund | 2 292 | | — | | 1 | | 2 293 | | — | |
| TOTAL CONSOLIDATED ENTITIES | 2 348 | | — | | 108 | | 2 456 | | — | |
| SURPLUS (DEFICIT) | 3 142 | | — | | 1 518 | | 4 660 | | — | |
| BALANCED BUDGET ACT | | | | | | | | | | |
| Deposits of dedicated revenues in the Generations Fund | –2 292 | | — | | –1 | | –2 293 | | — | |
| BUDGETARY BALANCE(6) | 850 | | — | | 1 517 | | 2 367 | | — | |
7
| Notes | |
| | |
| (1) | The presentation of the budgetary information in this monthly report is consistent with that of the financial framework for the General Fund and consolidated entities as published on page A.25 of The Québec Economic Plan – March 2018. |
| (2) | The 2016-2017 data in the monthly report have been reclassified to account for changes in the 2017-2018 budgetary structure, in particular the elimination of the Fund to Finance Health and Social Services Institutions. |
| (3) | Details of transactions by type of entity are presented on page 4 of this report. |
| (4) | These results include consolidation adjustments. |
| (5) | The results of the networks are presented according to the modified equity method of accounting. |
| (6) | Budgetary balance within the meaning of the Balanced Budget Act. |
| (7) | Consolidation adjustments include the elimination of General Fund program spending. |
For 2018-2019, barring exceptional circumstances requiring postponement, the monthly reports will be published on the following dates:
| |
| 2018-2019 PUBLICATION DATES | |
| Report at May 31 | August 24, 2018 |
| Report at June 30 | September 7, 2018 |
| Report at July 31 | October 5, 2018 |
| Report at August 31 | November 2, 2018 |
| Report at September 30 | December 7, 2018 |
| Report at October 31 | January 11, 2019 |
| Report at November 30 | February 8, 2019 |
| Report at December 31 | March 8, 2019 |
| Report at January 31 | April 5, 2019 |
| Report at February 28 | May 3, 2019 |
| Preliminary report at March 31 | June 21, 2019 |
For more information, contact the Direction des communications of the Ministère des Finances at 418 528-7382.
The report is also available on the Ministère des Finances website: www.finances.gouv.qc.ca.
8