Exhibit 99.23

|
Note to the reader
The monthly report on financial transactions provides an overview of the Québec government s monthly financial results. It is produced to increase the transparency of public finances and to provide regular monitoring on the achievement of the budgetary balance target for the fiscal year. The financial information presented in this report is unaudited and is based on the accounting policies used in the government’s annual financial statements.(1) In March 2020, the World Health Organization declared a COVID-19 pandemic. This pandemic and the measures put in place to deal with it are constantly evolving and have significant impacts on the economy and the activities of the Québec government. The first impacts on the government’s financial situation will be reflected in the March 2020 results. The Monthly Report on Financial Transactions at February 29, 2020 will be published on May 22, 2020. |
| | | | | | | | | | | | | | | |
| SUMMARY OF CONSOLIDATED RESULTS | | | | | | | | | | | | | | |
| (unaudited data, millions of dollars) | | | | | | | | | | | | | | | |
| | January | | April to January |
| | 2019 | | 2020 | | Change | | | 2018-2019 | | 2019-2020 | | Change | | Change (%) | |
| Own-source revenue | 7 200 | | 7 431 | | 231 | | | 74 997 | | 76 840 | | 1 843 | | 2.5 | |
| Federal transfers | 1 845 | | 2 118 | | 273 | | | 18 539 | | 20 062 | | 1 523 | | 8.2 | |
| Consolidated revenue | 9 045 | | 9 549 | | 504 | | | 93 536 | | 96 902 | | 3 366 | | 3.6 | |
| Portfolio expenditures | -8 748 | | -9 244 | | -496 | | | -78 393 | | -83 220 | | -4 827 | | 6.2 | |
| Debt service | -681 | | -570 | | 111 | | | -7 303 | | -6 327 | | 976 | | -13.4 | |
| Consolidated expenditure | -9 429 | | -9 814 | | -385 | | | -85 696 | | -89 547 | | -3 851 | | 4.5 | |
| SURPLUS (DEFICIT)(2) | -384 | | -265 | | 119 | | | 7 840 | | 7 355 | | -485 | | - | |
| BALANCED BUDGET ACT | | | | | | | | | | | | | | | |
| Deposits of dedicated revenues in the Generations Fund | -233 | | -325 | | -92 | | | -2 580 | | -2 122 | | 458 | | - | |
| BUDGETARY BALANCE(3) | -617 | | -590 | | 27 | | | 5 260 | | 5 233 | | -27 | | - | |
CONSOLIDATED REVENUE
Own-source revenue
| | | | | | | | | | | | | | | |
| OWN-SOURCE REVENUE | | | | | | | | | | | | | | | |
| (unaudited data, millions of dollars) | | | | | | | | | | | | | | | |
| | January | | April to January |
| | 2019 | | 2020 | | Change | | | 2018-2019 | | 2019-2020 | | Change | | Change (%) | |
| Income and property taxes | | | | | | | | | | | | | | | |
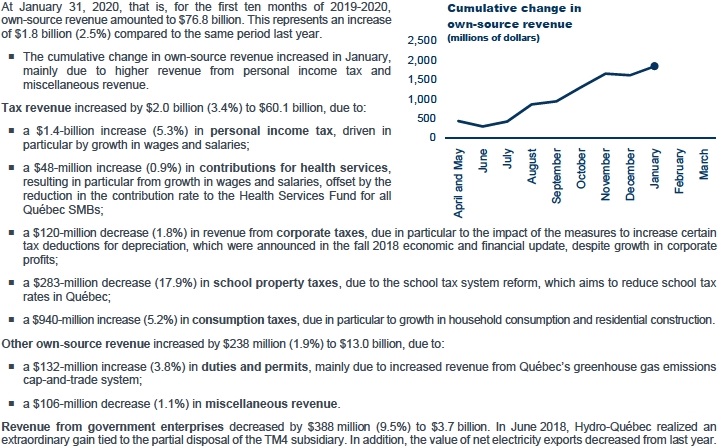
Personal income tax | 2 451 | | 2 618 | | 167 | | | 26 456 | | 27 864 | | 1 408 | | 5.3 | |
Contributions for health services | 513 | | 508 | | -5 | | | 5 426 | | 5 474 | | 48 | | 0.9 | |
Corporate taxes | 674 | | 633 | | -41 | | | 6 674 | | 6 554 | | -120 | | -1.8 | |
School property tax | 144 | | 129 | | -15 | | | 1 580 | | 1 297 | | -283 | | -17.9 | |
| Consumption taxes | 1 347 | | 1 301 | | -46 | | | 17 969 | | 18 909 | | 940 | | 5.2 | |
| Tax revenue | 5 129 | | 5 189 | | 60 | | | 58 105 | | 60 098 | | 1 993 | | 3.4 | |
| Duties and permits | 348 | | 333 | | -15 | | | 3 437 | | 3 569 | | 132 | | 3.8 | |
| Miscellaneous revenue | 878 | | 1 050 | | 172 | | | 9 354 | | 9 460 | | 106 | | 1.1 | |
| Other own-source revenue | 1 226 | | 1 383 | | 157 | | | 12 791 | | 13 029 | | 238 | | 1.9 | |
| Total own-source revenue excluding revenue from government enterprises | 6 355 | | 6 572 | | 217 | | | 70 896 | | 73 127 | | 2 231 | | 3.1 | |
| Revenue from government enterprises | 845 | | 859 | | 14 | | | 4 101 | | 3 713 | | -388 | | -9.5 | |
| TOTAL | 7 200 | | 7 431 | | 231 | | | 74 997 | | 76 840 | | 1 843 | | 2.5 | |
2
Federal transfers
| | | | | | | | | | | | | | | |
| FEDERAL TRANSFERS | | | | | | | | | | | | | | | |
| (unaudited data, millions of dollars) | | | | | | | | | | | | | | | |
| | January | | April to January |
| | 2019 | | 2020 | | Change | | | 2018-2019 | | 2019-2020 | | Change | | Change (%) | |
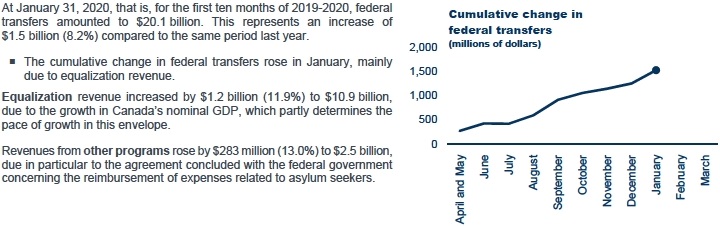
| Equalization | 978 | | 1 094 | | 116 | | | 9 777 | | 10 937 | | 1 160 | | 11.9 | |
| Health transfers | 500 | | 540 | | 40 | | | 5 257 | | 5 397 | | 140 | | 2.7 | |
| Transfers for post-secondary education and other social programs | 117 | | 127 | | 10 | | | 1 330 | | 1 270 | | -60 | | -4.5 | |
| Other programs | 250 | | 357 | | 107 | | | 2 175 | | 2 458 | | 283 | | 13.0 | |
| TOTAL | 1 845 | | 2 118 | | 273 | | | 18 539 | | 20 062 | | 1 523 | | 8.2 | |
3
CONSOLIDATED EXPENDITURE
| | | | | | | | | | | | | | | |
| CONSOLIDATED EXPENDITURES BY PORTFOLIO(4) | | | | | | | | | | | | |
| (unaudited data, millions of dollars) | | | | | | | | | | | | | | | |
| | January | | April to January |
| | 2019 | (5) | 2020 | | Change | | | 2018-2019 | (5) | 2019-2020 | | Change | | Change (%) | |
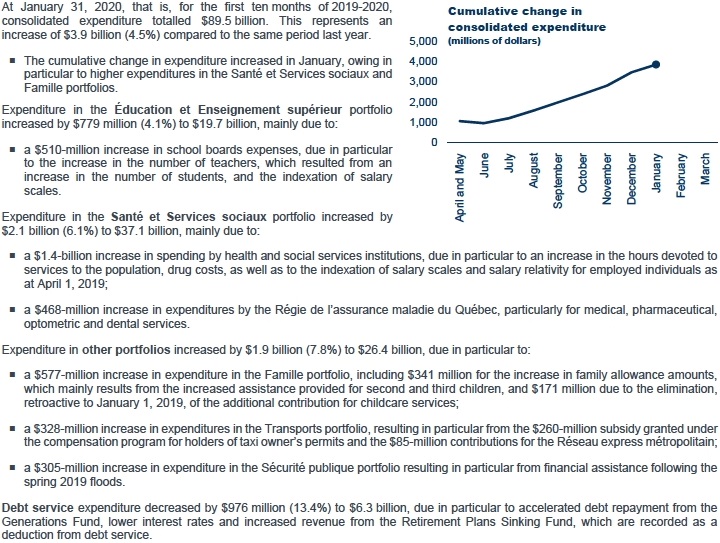
| Éducation et Enseignement supérieur | 2 253 | | 2 292 | | 39 | | | 18 900 | | 19 679 | | 779 | | 4.1 | |
| Santé et Services sociaux | 3 709 | | 3 945 | | 236 | | | 35 008 | | 37 146 | | 2 138 | | 6.1 | |
| Other portfolios(6) | 2 786 | | 3 007 | | 221 | | | 24 485 | | 26 395 | | 1 910 | | 7.8 | |
| Portfolio expenditures | 8 748 | | 9 244 | | 496 | | | 78 393 | | 83 220 | | 4 827 | | 6.2 | |
| Debt service | 681 | | 570 | | -111 | | | 7 303 | | 6 327 | | -976 | | -13.4 | |
| TOTAL | 9 429 | | 9 814 | | 385 | | | 85 696 | | 89 547 | | 3 851 | | 4.5 | |
4
NET FINANCIAL SURPLUSES OR REQUIREMENTS
|
| Composition of net financial surpluses or requirements The government’s revenues and expenditures are established on an accrual basis of accounting. Revenues are recognized when earned and expenses when incurred, regardless of when receipts and disbursements occur. Financial surpluses (requirements), on the other hand, consist of the difference between receipts and disbursements resulting from government activities. To meet its net financial requirements, the government uses a variety of financing sources, including cash and borrowings. The various items for net financial requirements represent net receipts and disbursements generated by the government’s loans, interests in its enterprises, fixed assets and other investments, as well as by retirement plans and other employee future benefits and by other accounts. This last item includes the payment of accounts payable and the collection of accounts receivable. |
For the period April 2019 to January 2020, net financial surpluses amount to $5.2 billion and are mainly due to:
the $7.4-billion surplus resulting from the difference between government revenues and expenditures;
the $3.7-billion financial requirements for investments, loans and advances, including growth in the equity basis of government enterprises,(7) the increase in investments made through the Economic Development Fund and a $283-million investment in preferred shares of REM inc.;
the $2.8-billion financial requirements for government capital investments resulting from $6.3 billion in investments, including $3.0 billion by health and social services and educational institutions, mainly to expand, build and redevelop infrastructure, and $2.1 billion by the Land Transportation Network Fund, principally to replace road infrastructure. These investments are partially offset by amortization expenses of $3.4 billion;(7)
the $2.7-billion financial surplus related to retirement plans and other employee future benefits liabilities, resulting from an increase in these liabilities of $7.9 billion, less the payment of government employees benefits of $5.3 billion;
the $1.6-billion financial surplus for other accounts.(8)
| | | | |
| NET FINANCIAL SURPLUSES OR REQUIREMENTS | | | | |
| (unaudited data, millions of dollars) | | | | |
| | April to January |
| | 2018-2019 | | 2019-2020 | |
| SURPLUS (DEFICIT)(2) | 7 840 | | 7 355 | |
| Non-budgetary transactions | | | | |
| Investments, loans and advances | -2 940 | | -3 694 | |
| Capital investments | -1 909 | | -2 790 | |
| Retirement plans and other employee future benefits | 2 161 | | 2 721 | |
| Other accounts(8) | 41 | | 1 643 | |
| Total non-budgetary transactions | -2 647 | | -2 120 | |
| NET FINANCIAL SURPLUSES (REQUIREMENTS) | 5 193 | | 5 235 | |
5
 CHANGE IN THE BUDGETARY BALANCE IN 2019-2020
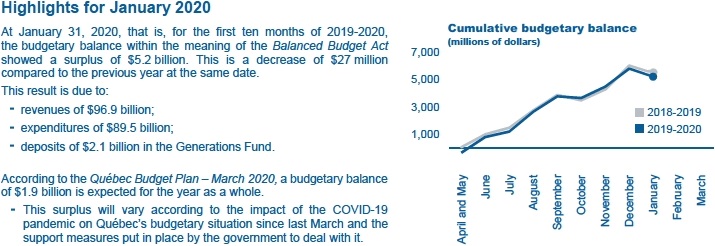
Results at January 31, 2020 showed a budgetary surplus of $5.2 billion for the first ten months of the year.
According to the Québec Budget Plan - March 2020, a budgetary balance of $1.9 billion is expected for 2019-2020. The decrease in the budgetary balance over the last two months of the fiscal year is due to:
an anticipated slowdown in the growth of own-source revenue which, coupled with an anticipated acceleration in the growth of portfolio expenditures and the estimated losses on the CSeries investment, will contribute to reducing the surplus by $1.9 billion from February to March 2020;
the initiatives announced in the fall 2019 Update on Québec’s Economic and Financial Situation, for which a balance of $457 million remains to be recorded;
the targeted initiatives announced in the Québec Budget Plan - March 2020, which total $947 million in 2019-2020.
This surplus will vary according to the impact of the COVID-19 pandemic on Québec’s budgetary situation since last March and the support measures put in place by the government to deal with it.
The next update of the budgetary balance for 2019-2020, scheduled at the time of the release of the preliminary results at March 31, 2020, will take these elements into account.
| | |
| CHANGE IN THE BUDGETARY BALANCE FOR 2019-2020 | | |
| (millions of dollars) | | |
| | 2019-2020 | |
| MONTHLY REPORT ON FINANCIAL TRANSACTIONS AT JANUARY 31, 2020(3) | 5 233 | |
| UPCOMING RESULTS FOR FEBRUARY TO MARCH 2020 | | |
| Results excluding initiatives | | |
- Consolidated revenue | 21 041 | |
- Consolidated expenditure | -21 856 | |
- Deposits of dedicated revenues in the Generations Fund | -511 | |
- Estimated losses on the CSeries investment | -603 | |
Subtotal | -1 929 | |
| Balance of the fall 2019 update’s initiatives to be completed | -457 | |
| Initiatives in the Québec Budget Plan - March 2020 | -947 | |
| TOTAL | -3 333 | |
| PROJECTED BUDGETARY BALANCE(3) - BUDGET 2020-2021 | 1 900 | |
6
APPENDIX 1: BUDGET FORECASTS - CHANGE SINCE THE MARCH 2019 BUDGET
| | | | | | | | |
| BUDGET FORECASTS FOR 2019-2020 | | | | | | | | |
| (millions of dollars) | | | | | | | | |
| | March 2019 | | | | March 2020 | | | |
| | Budget | | Adjustments | | Budget | (9) | Change (%) | (10) |
| CONSOLIDATED REVENUE | | | | | | | | |
| Income and property taxes | | | | | | | | |
Personal income tax | 32 498 | | 1 004 | | 33 502 | | 5.4 | |
Contributions for health services | 6 596 | | -3 | | 6 593 | | 3.7 | |
Corporate taxes | 8 516 | | 196 | | 8 712 | | -5.1 | |
School property tax | 1 553 | | 3 | | 1 556 | | -16.0 | |
| Consumption taxes | 21 864 | | 254 | | 22 118 | | 5.3 | |
| Tax revenue | 71 027 | | 1 454 | | 72 481 | | 3.3 | |
| Duties and permits | 4 229 | | 283 | | 4 512 | | 3.5 | |
| Miscellaneous revenue | 10 680 | | 480 | | 11 160 | | -3.4 | |
| Other own-source revenue | 14 909 | | 763 | | 15 672 | | -1.5 | |
| Total own-source revenue excluding revenue from government enterprises | 85 936 | | 2 217 | | 88 153 | | 2.4 | |
| Revenue from government enterprises | 4 778 | | -85 | | 4 693 | | -15.4 | |
| Total own-source revenue | 90 714 | | 2 132 | | 92 846 | | 1.3 | |
| Federal transfers | 24 924 | | 173 | | 25 097 | | 8.6 | |
| Total consolidated revenue | 115 638 | | 2 305 | | 117 943 | | 2.8 | |
| CONSOLIDATED EXPENDITURE | | | | | | | | |
| Éducation et Enseignement supérieur | -24 436 | | -191 | | -24 627 | | 6.7 | |
| Santé et Services sociaux | -45 433 | | 56 | | -45 377 | | 6.6 | |
| Other portfolios(6) | -34 169 | | -789 | | -34 958 | | 8.9 | |
| Portfolio expenditures | -104 038 | | -924 | | -104 962 | | 7.4 | |
| Debt service | -8 996 | | 1 151 | | -7 845 | | -10.1 | |
| Total consolidated expenditure | -113 034 | | 227 | | -112 807 | | 6.0 | |
| Contingency reserve | -100 | | 100 | | - | | - | |
| Estimated losses on the CSeries investment | - | | -603 | | -603 | | - | |
| SURPLUS (DEFICIT)(2) | 2 504 | | 2 029 | | 4 533 | | - | |
| BALANCED BUDGET ACT | | | | | | | | |
| Deposits of dedicated revenues in the Generations Fund | -2 504 | | -129 | | -2 633 | | - | |
| BUDGETARY BALANCE(3) | - | | 1 900 | | 1 900 | | - | |
7
APPENDIX 2: EXPENDITURES BY MISSION
Government expenditures are broken down into five missions that focus on public services. This breakdown of government expenditure in its main areas of activity is a stable indicator over time, as it is generally not influenced by ministerial changes. Moreover, since this breakdown is also used in the Public Accounts, its presentation in the monthly report on financial transactions allows for a better monitoring of actual results over the course of the year.
The missions dedicated to public services are:
Health and Social Services, which consists primarily of the activities of the health and social services network and the programs administered by the Régie de l’assurance maladie du Québec;
Education and Culture, which consists primarily of the activities of the education networks, student financial assistance, programs in the culture sector and immigration-related programs;
Economy and Environment, which primarily includes programs related to economic development, employment assistance measures, international relations, the environment and infrastructure support;
Support for Individuals and Families, which includes, in particular, last resort financial assistance, assistance measures for families and seniors, and certain legal aid measures;
Administration and Justice, which consists of the activities of the legislature, central bodies and public security, as well as administrative programs.
| | | | | | | | | |
| CONSOLIDATED EXPENDITURES BY MISSION EXCLUDING DEBT SERVICE | | | | | | | | |
| (unaudited data, millions of dollars) | | | | | | | | | |
| | January | | April to January |
| | 2019 | (5) | 2020 | | | 2018-2019 | (5) | 2019-2020 | |
| Health and Social Services | 3 613 | | 3 864 | | | 34 205 | | 36 313 | |
| Education and Culture | 2 316 | | 2 363 | | | 19 527 | | 20 341 | |
| Economy and Environment | 1 079 | | 1 153 | | | 10 107 | | 10 722 | |
| Support for Individuals and Families | 1 097 | | 1 238 | | | 8 631 | | 9 282 | |
| Administration and Justice | 643 | | 626 | | | 5 923 | | 6 562 | |
| TOTAL | 8 748 | | 9 244 | | | 78 393 | | 83 220 | |
8
APPENDIX 3: MONTHLY APPLICATION OF ACCOUNTING POLICIES
Since April 1, 2019, the government has included in the monthly report on financial transactions three accounting policies used in the development of the government’s consolidated financial statements. These changes have no impact on the government’s consolidated financial statements.
Monthly financial information of bodies in the health and social services and education networks
The monthly financial information of network bodies is now consolidated on a line-by-line basis using a methodology which allows the government to take into account or estimate the actual financial information of network bodies. They were previously recognized using the modified equity method of accounting based on provisional information that was distributed on a straight-line basis and adjusted at the end of the financial year.
Personal income tax revenues and health care contributions
The government estimates revenues from personal income tax and contributions for health services withheld at source by employers and payers (agents) that have not been collected by the government by the end of the month. The new method of estimating these amounts considers the remuneration earned by taxpayers instead of the remuneration paid to them during the month.
Monthly application of the accounting standard on transfer payments
The government has reviewed its monthly application of the standard on transfer payments. Henceforth, transfer payments are recognized when they are authorized by the transferring entity and the eligibility criteria are met by the recipient entity. These transfers were previously recognized on a straight-line basis or on a disbursement basis, depending on the entity. This accounting change affects the government’s results only when transfer payments are made outside the government’s reporting entity.
These changes were applied retroactively with restatement of prior periods and resulted in changes to the government’s surplus and budgetary balance for the period April 2018 to January 2019, as illustrated in the table below.
| | | | | | | | |
| CHANGES IN THE CONSOLIDATED RESULTS OF 2018-2019 | | | | | | | |
| (unaudited data, millions of dollars) |
| | April 2018 to January 2019 |
| | | | Method of estimating | | Standard | | | |
| | Financial information of | | tax revenues | | on transfer | | | |
| | network bodies | | received by agents | | payments | | Total | |
| PREVIOUSLY REPORTED SURPLUS(2) | | | | | | | 7 896 | |
| Revenue | | | | | | | | |
Own-source revenue | 3 574 | | 428 | | - | | 4 002 | |
Federal transfers | 238 | | - | | -53 | | 185 | |
| Total revenue | 3 812 | | 428 | | -53 | | 4 187 | |
| Expenditure | | | | | | | | |
Portfolio expenditures | -3 976 | | - | | -92 | | -4 068 | |
Debt service | -175 | | - | | - | | -175 | |
| Total expenditure | -4 151 | | - | | -92 | | -4 243 | |
| TOTAL ADJUSTMENTS | -339 | | 428 | | -145 | | -56 | |
| RESTATED SURPLUS(2) | | | | | | | 7 840 | |
| Deposits of dedicated revenues in the Generations Fund | | | | | | | -2 580 | |
| RESTATED BUDGETARY BALANCE(3) | | | | | | | 5 260 | |
In addition, certain figures for April 2018 to January 2019 have been reclassified to reflect the presentation adopted for 2019-2020. These reclassifications have no impact on the government’s surplus or budgetary balance.
9
Consolidated financial information
Consolidated results include the results of all entities that are part of the government’s reporting entity, i.e., that are under its control. To determine consolidated results, the government eliminates transactions carried out between entities in the reporting entity. Additional information on the government’s financial organization and the financing of public services can be found on pages 13 to 18 of the document titled “Budgetary Process and Documents: Public Financial Accountability” (in French only).
Notes | |
| (1) | The government’s accounting policies can be found on pages 91 to 102 of the Public Accounts 201 8-2019. |
| (2) | Balance as defined in the Public Accounts. |
| (3) | Budgetary balance within the meaning of the Balanced Budget Act. |
| (4) | Consolidated expenditures by mission are presented in Appendix 2. |
| (5) | Certain expenditures were reclassified between portfolios and between missions to consider the transition to the 2019-2020 budgetary structure. |
| (6) | Other portfolios include inter-portfolio eliminations resulting from the elimination of reciprocal transactions between entities in different portfolios. |
| (7) | These items, which are included in the government’s budgetary surplus (deficit), are eliminated in non-budgetary transactions because they have no effect on cash flow. |
| (8) | The surpluses or financial requirements pertaining to other accounts can vary significantly from one month to the next, in particular according to the time when the government collects or disburses funds related to its activities. For example, when the last day of the month is not a business day, QST remittances are collected at the beginning of the following month, such that the equivalent of two months’ remittances can be collected in a given month. |
| (9) | The presentation of the budgetary information in this monthly report is consistent with that of the consolidated financial framework as published on page A.21 of the Québec Budget Plan - March 2020. |
| (10) | This is the annual change compared to actual results in 2018-2019. |
| |
| | For more information, contact the Direction des communications of the Ministère des Finances at 418 528-7382. |
| | |
| | The report is also available on the Ministère des Finances website: www.finances.gouv.qc.ca. |
10