Exhibit 99.22

|
Note to the reader The Monthly Report on Financial Transactions provides an overview of the Québec government’s monthly financial results. It is produced to increase the transparency of public finances and to provide regular monitoring of the achievement of the budgetary balance target for the fiscal year. The financial information presented in this report is unaudited and is based on the accounting policies used in the government’s annual financial statements.(1) In March 2020, the World Health Organization declared a COVID-19 pandemic. The pandemic and the measures implemented to deal with it are having significant impacts, in particular on the Québec government’s financial situation. The Monthly Report on Financial Transactions at February 28, 2021 will be published on May 28, 2021. |

| | | | | | | | | | | | | | | |
| SUMMARY OF CONSOLIDATED RESULTS | | | | | | | | | | | | | | |
| (unaudited data, millions of dollars) | | | | | | | | | | | | | | | |
| | January | | April to January |
| | 2020 | | 2021 | | Change | | | 2019-2020 | | 2020-2021 | | Change | | Change (%) | |
| Own-source revenue | 7 431 | | 7 502 | | 71 | | | 76 840 | | 73 730 | | -3 110 | | -4.0 | |
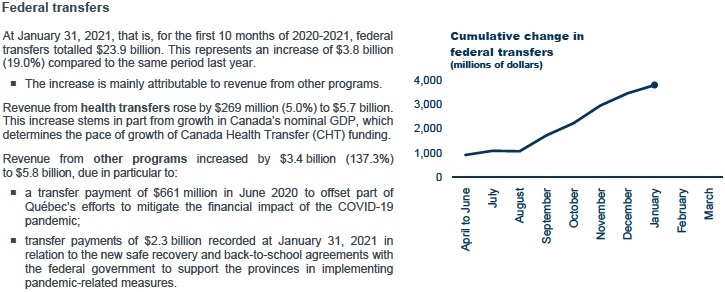
| Federal transfers | 2 118 | | 2 456 | | 338 | | | 20 062 | | 23 867 | | 3 805 | | 19.0 | |
| Consolidated revenue | 9 549 | | 9 958 | | 409 | | | 96 902 | | 97 597 | | 695 | | 0.7 | |
| Portfolio expenditures(2) | -9 288 | | -10 666 | | -1 378 | | | -83 659 | | -94 389 | | -10 730 | | 12.8 | |
| Debt service | -570 | | -701 | | -131 | | | -6 327 | | -6 074 | | 253 | | -4.0 | |
| Consolidated expenditure | -9 858 | | -11 367 | | -1 509 | | | -89 986 | | -100 463 | | -10 477 | | 11.6 | |
| SURPLUS (DEFICIT)(3) | -309 | | -1 409 | | -1 100 | | | 6 916 | | -2 866 | | -9 782 | | - | |
| BALANCED BUDGET ACT | | | | | | | | | | | | | | | |
| Deposits of dedicated revenues in the Generations Fund | -325 | | -485 | | -160 | | | -2 122 | | -2 579 | | -457 | | - | |
| BUDGETARY BALANCE(4) | -634 | | -1 894 | | -1 260 | | | 4 794 | | -5 445 | | -10 239 | | - | |
1
 CHANGE IN THE BUDGETARY BALANCE IN 2020-2021
According to the data presented in the Québec Budget Plan - March 2021, a budgetary deficit of $15.0 billion was expected for 2020-2021, before the use of the stabilization reserve.
Based on available information, a one-time upward revision of $1.8 billion in the budgetary balance is expected for 2020-2021, bringing the deficit to $13.3 billion. This revision comes from:
a $712-million increase in tax revenue due to higher-than-expected receipts, primarily from corporate taxes;
a federal government contribution for high-speed Internet of $413 million;
a $625-million reduction in the $1.3-billion provision to mitigate potential economic risks and fund additional support and recovery measures. This provision is to cover risks related to the remaining uncertainty regarding the upcoming monthly budget monitoring and items that could arise prior to the release of the Public Accounts 2020-2021.
The use of the stabilization reserve will reduce the budgetary deficit to $4.5 billion.
Preliminary results for the year 2020-2021 will be presented in the Monthly Report on Financial Transactions at March 31, 2021.
| | |
| CHANGE IN THE BUDGETARY BALANCE | | |
| (millions of dollars) | | |
| | 2020-2021 | |
| BUDGETARY BALANCE BEFORE THE USE OF THE STABILIZATION RESERVE - MARCH 2021 BUDGET | -15 000 | |
| NEW INFORMATION SINCE MARCH 2021 BUDGET | | |
- Increase in tax revenue | 712 | |
- Federal government contribution for high-speed Internet | 413 | |
- Adjustment of the provision for economic risks and other support and recovery measures | 625 | |
| Subtotal | 1 750 | |
| BUDGETARY BALANCE BEFORE THE USE OF THE STABILIZATION RESERVE | -13 250 | |
| Use of the stabilization reserve | 8 760 | |
| BUDGETARY BALANCE(5) - UPDATE OF THE ANNUAL ESTIMATE | -4 490 | |
2
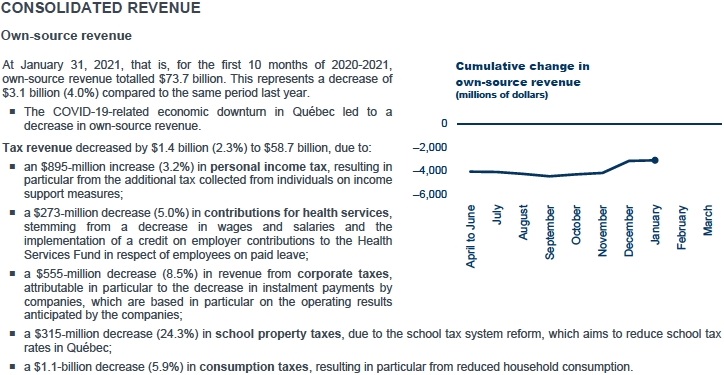
Other own-source revenue decreased by $1.1 billion (8.3%) to $11.9 billion, due to:
a $63-million decrease (1.8%) in duties and permits, mainly attributable to the decrease in revenues collected under Québec’s cap- and-trade system for greenhouse gas emission allowances, partly offset by increased mining revenues due to sustained metal prices in markets in 2020;
a $1.0-billion decrease (10.8%) in miscellaneous revenue, attributable to reduced revenue from the sale of goods and services caused by COVID-19-related confinement measures, as well as lower revenue from Natural Resources and Energy Capital Fund in connection with the sale of shares held in Quebec Iron Ore in 2019-2020.
Revenue from government enterprises decreased by $660 million (17.8%) to $3.1 billion. The decrease stems principally from Loto-Québec’s results, affected by the temporary closing of casinos, gaming halls, and sales outlets. Moreover, Hydro-Québec observed a drop in electricity consumption in Québec. These decreases are partially offset by an increase in Investissement Québec’s results, stemming from an increase in the value of the securities in its portfolio due to the rapid stock market recovery.
| | | | | | | | | | | | | | | |
| OWN-SOURCE REVENUE | | | | | | | | | | | | | | | |
| (unaudited data, millions of dollars) | | | | | | | | | | | | | | | |
| | January | | April to January |
| | 2020 | | 2021 | | Change | | | 2019-2020 | | 2020-2021 | | Change | | Change (%) | |
| Income and property taxes | | | | | | | | | | | | | | | |
Personal income tax | 2 618 | | 2 870 | | 252 | | | 27 864 | | 28 759 | | 895 | | 3.2 | |
Contributions for health services | 508 | | 482 | | -26 | | | 5 474 | | 5 201 | | -273 | | -5.0 | |
Corporate taxes | 633 | | 691 | | 58 | | | 6 554 | | 5 999 | | -555 | | -8.5 | |
School property tax | 129 | | 90 | | -39 | | | 1 297 | | 982 | | -315 | | -24.3 | |
| Consumption taxes | 1 301 | | 1 181 | | -120 | | | 18 909 | | 17 790 | | -1 119 | | -5.9 | |
| Tax revenue | 5 189 | | 5 314 | | 125 | | | 60 098 | | 58 731 | | -1 367 | | -2.3 | |
| Duties and permits | 333 | | 372 | | 39 | | | 3 569 | | 3 506 | | -63 | | -1.8 | |
| Miscellaneous revenue | 1 050 | | 1 103 | | 53 | | | 9 460 | | 8 440 | | -1 020 | | -10.8 | |
| Other own-source revenue | 1 383 | | 1 475 | | 92 | | | 13 029 | | 11 946 | | -1 083 | | -8.3 | |
| Total own-source revenue excluding revenue from government enterprises | 6 572 | | 6 789 | | 217 | | | 73 127 | | 70 677 | | -2 450 | | -3.4 | |
| Revenue from government enterprises | 859 | | 713 | | -146 | | | 3 713 | | 3 053 | | -660 | | -17.8 | |
| TOTAL | 7 431 | | 7 502 | | 71 | | | 76 840 | | 73 730 | | -3 110 | | -4.0 | |
3
| | | | | | | | | | | | | | | |
| FEDERAL TRANSFERS | | | | | | | | | | | | | | | |
| (unaudited data, millions of dollars) | | | | | | | | | | | | | | | |
| | January | | April to January |
| | 2020 | | 2021 | | Change | | | 2019-2020 | | 2020-2021 | | Change | | Change (%) | |
| Equalization | 1 094 | | 1 105 | | 11 | | | 10 937 | | 11 044 | | 107 | | 1.0 | |
| Health transfers | 540 | | 566 | | 26 | | | 5 397 | | 5 666 | | 269 | | 5.0 | |
| Transfers for post-secondary education and other social programs | 127 | | 132 | | 5 | | | 1 270 | | 1 325 | | 55 | | 4.3 | |
| Other programs | 357 | | 653 | | 296 | | | 2 458 | | 5 832 | | 3 374 | | 137.3 | |
| TOTAL | 2 118 | | 2 456 | | 338 | | | 20 062 | | 23 867 | | 3 805 | | 19.0 | |
4
Expenditure in other portfolios increased by $3.5 billion (13.1%) to $29.8 billion, due to:
a $1.2-billion increase in expenditure in the Finances portfolio, attributable in part to Québec’s contribution to the Canada Emergency Commercial Rent Assistance (CECRA) program, the Incentive Program to Retain Essential Workers (PIRTE) and the Gas Tax and Québec Contribution Program (TECQ);
a $649-million increase in expenditure in the Transports portfolio, mainly due to financial assistance granted for public passenger transit under the Programme d’aide d’urgence au transport collectif des personnes;
a $616-million increase in expenditure in the Affaires municipales et Habitation portfolio, mainly due to financial assistance to support municipalities in the context of the pandemic provided for in the Safe Restart Agreement;
a $483-million increase in expenditure in the Famille portfolio, including a $400-million increase related to the full enhancement of the family allowance announced in the November 2019 Update on Québec’s Economic and Financial Situation;
a $390-million increase in expenditure in the Économie et Innovation portfolio, which stems from tax credits, including those for investments in manufacturing and processing equipment, for multimedia titles and for scientific research and experimental development, as well as from the Concerted Temporary Action Program for Businesses (PACTE) and the Emergency Assistance Program for Small and Medium Sized Businesses (PAUPME);
a $357-million decrease in expenditure in the Sécurité publique portfolio, attributable to the financial assistance granted in 2019-2020 with respect to flooding in the spring of 2019.
Debt service expenditure decreased by $253 million (4.0%) to $6.1 billion because of lower interest rates.
| | | | | | | | | | | | | | | |
| CONSOLIDATED EXPENDITURES BY PORTFOLIO(6) | | | | | | | | | | | | | | |
| (unaudited data, millions of dollars) | | | | | | | | | | | | | | | |
| | January | | April to January |
| | 2020 | (7) | 2021 | | Change | | | 2019-2020 | (7) | 2020-2021 | | Change | | Change (%) | |
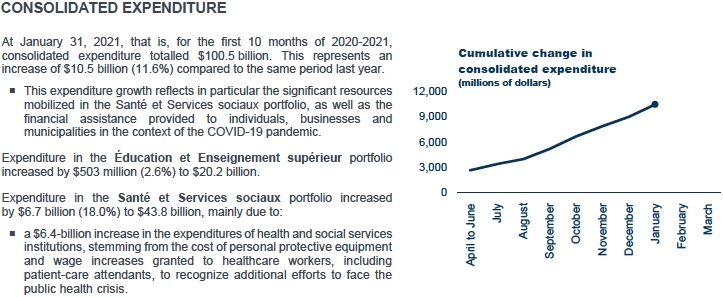
| Éducation et Enseignement supérieur | 2 292 | | 2 408 | | 116 | | | 19 679 | | 20 182 | | 503 | | 2.6 | |
| Santé et Services sociaux | 3 945 | | 4 717 | | 772 | | | 37 146 | | 43 832 | | 6 686 | | 18.0 | |
| Other portfolios(8) | 3 007 | | 3 488 | | 481 | | | 26 395 | | 29 848 | | 3 453 | | 13.1 | |
| Change in application of the accounting standard respecting transfer payments | 44 | | 53 | | 9 | | | 439 | | 527 | | 88 | | 20.0 | |
| Portfolio expenditures | 9 288 | | 10 666 | | 1 378 | | | 83 659 | | 94 389 | | 10 730 | | 12.8 | |
| Debt service | 570 | | 701 | | 131 | | | 6 327 | | 6 074 | | -253 | | -4.0 | |
| TOTAL | 9 858 | | 11 367 | | 1 509 | | | 89 986 | | 100 463 | | 10 477 | | 11.6 | |
5
NET FINANCIAL SURPLUSES OR REQUIREMENTS
|
Composition of net financial surpluses or requirements The government’s revenues and expenditures are established on an accrual basis of accounting. Revenues are recognized when earned and expenses when incurred, regardless of when receipts and disbursements occur. Net financial surpluses (requirements), on the other hand, consist of the difference between receipts and disbursements resulting from government activities. To meet its net financial requirements, the government uses a variety of financing sources, including cash and borrowings. The various items for net financial requirements represent net receipts and disbursements generated by the government’s loans, interests in its enterprises, fixed assets and other investments, as well as by retirement plans and other employee future benefits, and by other accounts. This last item includes the payment of accounts payable and the collection of accounts receivable. Deposits in the Generations Fund also result in financial requirements. Beginning with the Monthly Report on Financial Transactions at December 31, 2020, the presentation of net financial surpluses (requirements) has been modified to make it comparable to the presentation used in the Québec Budget Plan - March 2021. Thus, the heading “Investments, loans and advances” now includes the change in short-term investments, and the heading “Retirement plans and other employee future benefits” now takes into account the reinvestment of investment income from the Retirement Plans Sinking Fund and specific funds. A new heading, “Deposits in the Generations Fund,” includes the financial requirements generated by the revenues dedicated to the Generations Fund. |
For the period of April 2020 to January 2021, net financial requirements amount to $21.9 billion and are due to:
the $2.9-billion deficit resulting from the difference between government revenues and expenditures;
the $12.4-billion financial requirements for investments, loans and advances, due primarily to an increase in short-term investments of $8.3 billion as part of overall cash management, as well as an increase in loans, especially those granted through support measures for businesses affected by the COVID-19 pandemic, and the growth in the consolidation value of government enterprises;(9)
the $3.1-billion financial requirements for government capital investments, due to investments of $6.7 billion, partially offset by amortization expenses of $3.6 billion;(9)
the $2.2-billion financial requirements related to retirement plans and other employee future benefits liabilities, resulting from the payment of government employee benefits of $5.5 billion, partially offset by the net cost of plans of $3.3 billion;(9)
the $1.3-billion financial surplus from other accounts;(10)
the $2.6-billion financial requirements generated by the deposits in the Generations Fund.
| | | | |
| NET FINANCIAL SURPLUSES OR REQUIREMENTS | | | | |
| (unaudited data, millions of dollars) | | | | |
| | April to January |
| | 2019-2020 | | 2020-2021 | |
| SURPLUS (DEFICIT)(3) | 6 916 | | -2 866 | |
| Non-budgetary transactions | | | | |
| Investments, loans and advances | -5 926 | | -12 409 | |
| Capital investments | -2 790 | | -3 106 | |
| Retirement plans and other employee future benefits | -2 092 | | -2 209 | |
| Other accounts(10) | 1 999 | | 1 251 | |
| Deposits in the Generations Fund | -2 122 | | -2 579 | |
| Total non-budgetary transactions | -10 931 | | -19 052 | |
| NET FINANCIAL SURPLUSES (REQUIREMENTS) | -4 015 | | -21 918 | |
6
APPENDIX 1: BUDGET FORECASTS - CHANGE SINCE THE MARCH 2020 BUDGET
| | | | | | | | |
| BUDGET FORECASTS FOR 2020-2021 | | | | | | | | |
| (millions of dollars) | | | | | | | | |
| | March 2020 | | | | March 2021 | | | |
| | Budget | | Adjustments | | Budget | (11) | Change (%) | (12) |
| CONSOLIDATED REVENUE | | | | | | | | |
| Income and property taxes | | | | | | | | |
Personal income tax | 35 435 | | -219 | | 35 216 | | 4.1 | |
Contributions for health services | 6 896 | | -441 | | 6 455 | | -1.0 | |
Corporate taxes | 8 530 | | -545 | | 7 985 | | -7.2 | |
School property tax | 1 349 | | -183 | | 1 166 | | -24.2 | |
| Consumption taxes | 22 961 | | -2 639 | | 20 322 | | -4.8 | |
| Tax revenue | 75 171 | | -4 027 | | 71 144 | | -1.0 | |
| Duties and permits | 4 643 | | -265 | | 4 378 | | -3.5 | |
| Miscellaneous revenue | 10 975 | | -457 | | 10 518 | | -4.1 | |
| Other own-source revenue | 15 618 | | -722 | | 14 896 | | -3.9 | |
| Total own-source revenue excluding revenue from government enterprises | 90 789 | | -4 749 | | 86 040 | | -1.5 | |
| Revenue from government enterprises | 4 814 | | -826 | | 3 988 | | -9.8 | |
| Total own-source revenue | 95 603 | | -5 575 | | 90 028 | | -1.9 | |
| Federal transfers | 25 692 | | 4 582 | | 30 274 | | 20.0 | |
| Total consolidated revenue | 121 295 | | -993 | | 120 302 | | 2.8 | |
| CONSOLIDATED EXPENDITURE | | | | | | | | |
| Éducation et Enseignement supérieur | -25 734 | | -639 | | -26 373 | | 8.1 | |
| Santé et Services sociaux | -47 760 | | -6 022 | | -53 782 | | 20.0 | |
| Other portfolios(8) | -36 806 | | -5 780 | | -42 586 | | 13.7 | |
| Change in application of the accounting standard respecting transfer payments | - | | -632 | | -632 | | - | |
| Portfolio expenditures | -110 300 | | -13 073 | | -123 373 | | 15.1 | |
| Debt service | -8 266 | | 601 | | -7 665 | | -0.1 | |
| Total consolidated expenditure | -118 566 | | -12 472 | | -131 038 | | 14.1 | |
| Provision for economic risks and other support and recovery measures | - | | -1 250 | | -1 250 | | - | |
| SURPLUS (DEFICIT)(3) | 2 729 | | -14 715 | | -11 986 | | - | |
| BALANCED BUDGET ACT | | | | | | | | |
| Deposits of dedicated revenues in the Generations Fund | -2 729 | | -285 | | -3 014 | | - | |
| BUDGETARY BALANCE BEFORE USE OF THE STABILIZATION RESERVE | - | | -15 000 | | -15 000 | | - | |
| Use of the stabilization reserve | - | | 8 760 | | 8 760 | | - | |
| BUDGETARY BALANCE(5) | - | | -6 240 | | -6 240 | | - | |
7
APPENDIX 2: EXPENDITURES BY MISSION
Government expenditures are broken down into five public service missions. This breakdown of the government’s expenditures into its main areas of activity is a stable indicator over time because it is usually not influenced by Cabinet shuffles. Moreover, since this breakdown is also used in the Public Accounts, its presentation in the Monthly Report on Financial Transactions allows for a better monitoring of actual results over the course of the year.
The public service missions are:
Health and Social Services, which consists primarily of the activities of the health and social services network and the programs administered by the Régie de l’assurance maladie du Québec;
Education and Culture, which consists primarily of the activities of the education networks, student financial assistance, programs in the culture sector and immigration-related programs;
Economy and Environment, which primarily includes programs related to economic development, employment assistance measures, international relations, the environment and infrastructure support;
Support for Individuals and Families, which includes, in particular, last resort financial assistance, assistance measures for families and seniors, and certain legal aid measures;
Administration and Justice, which consists mainly of the activities of the legislature, central bodies and public security, as well as administrative programs.
| | | | | | | | | |
| CONSOLIDATED EXPENDITURES BY MISSION EXCLUDING DEBT SERVICE | | | | | | | | |
| (unaudited data, millions of dollars) | | | | | | | | | |
| | January | | April to January |
| | 2020 | (7) | 2021 | | | 2019-2020 | (7) | 2020-2021 | |
| Health and Social Services | 3 860 | | 4 596 | | | 36 313 | | 42 706 | |
| Education and Culture | 2 347 | | 2 512 | | | 20 323 | | 21 053 | |
| Economy and Environment | 1 154 | | 1 366 | | | 10 722 | | 12 560 | |
| Support for Individuals and Families | 1 242 | | 1 239 | | | 9 282 | | 9 702 | |
| Administration and Justice | 641 | | 900 | | | 6 580 | | 7 841 | |
| Change in application of the accounting standard respecting transfer payments | 44 | | 53 | | | 439 | | 527 | |
| TOTAL | 9 288 | | 10 666 | | | 83 659 | | 94 389 | |
8
Consolidated financial information
Consolidated results include the results of all entities that are part of the government’s reporting entity, i.e. that are under its control. To determine consolidated results, the government eliminates transactions carried out between entities in the reporting entity. Additional information on the government’s financial organization and the financing of public services can be found on pages 13 to 18 of the document titled “Budgetary Process and Documents: Public Financial Accountability” (in French only).
Change in application of the accounting standard respecting transfer payments
In April 2012, a revised accounting standard respecting transfer payments came into effect. Under this standard, the government must enter an expenditure in the fiscal year in which the transfer is authorized and the beneficiary meets eligibility criteria. The interpretation of the notion of authorization for programs requiring approval of annual appropriations by the National Assembly gave rise to a difference of opinion with the Auditor General of Québec, who issued a qualified opinion in his audit of the government’s consolidated financial statements from 2012-2013 to 2019-2020.
To ensure greater comparability of financial information with the federal government and the other provinces and to comply with the recommendation of the Auditor General of Québec, the Québec government is modifying the application of this standard. Thus, financial contributions to infrastructure projects owned by third parties are recorded faster as expenditure, i.e. over the period of completion of the eligible work, rather than the period of repayment of the debt contracted by the recipients.
In this monthly report, the estimated impact of this change has been accounted for retroactively with a restatement of figures for prior periods.
Notes
| (1) | A summary of the government’s accounting policies can be found on pages 82 to 85 of Volume 1 of the Public Accounts 2019-2020. |
| (2) | Portfolio expenditure includes the impact of the change in application of the accounting standard respecting transfer payments. |
| (3) | Balance as defined in the Public Accounts. |
| (4) | Budgetary balance within the meaning of the Balanced Budget Act. |
| (5) | Budgetary balance within the meaning of the Balanced Budget Act, after use of the stabilization reserve. |
| (6) | Consolidated expenditures by mission are presented in Appendix 2. |
| (7) | Certain expenditures were reclassified between portfolios and between missions to take into account the transition to the 2020-2021 budgetary structure. |
| (8) | Other portfolios include inter-portfolio eliminations resulting from the elimination of reciprocal transactions between entities in different portfolios. |
| (9) | These items, which are included in the government’s budgetary surplus (deficit), are eliminated in non-budgetary transactions because they have no effect on cash flow. |
| (10) | The financial surpluses or requirements pertaining to other accounts can vary significantly from one month to the next, in particular according to the time when the government collects or disburses funds related to its activities. For example, when the last day of the month is not a business day, QST remittances are collected at the beginning of the following month, such that the equivalent of two months’ remittances can be collected in a given month. |
| (11) | The presentation of the budgetary information in this monthly report is consistent with that of the financial framework as published in the Québec Budget Plan - March 2021. |
| (12) | This is the annual change compared to results in 2019-2020. |
| | |
| |
| | For more information, contact the Direction des communications of the Ministère des Finances at 418-528-7382. |
| | |
| | The report is also available on the Ministère des Finances website: www.finances.gouv.qc.ca. |
9