Exhibit 99.13
![]()
| Note to the reader The Monthly Report on Financial Transactions provides an overview of the Québec government’s monthly financial results. It is produced to increase the transparency of public finances and to provide regular monitoring of the achievement of the budgetary balance target for the fiscal year. The financial information presented in this report is unaudited and is based on the accounting policies used in the government’s annual financial statements.(1) In March 2020, the World Health Organization declared a COVID-19 pandemic. The pandemic and the measures implemented to deal with it are having significant impacts, in particular on the Québec government’s financial situation. The Monthly Report on Financial Transactions at January 31, 2022, will be published on April 22, 2022. |
| SUMMARY OF CONSOLIDATED RESULTS | |||||||||||||||
| (unaudited data, millions of dollars) | |||||||||||||||
| December | April to December | ||||||||||||||
| 2020 | 2021 | Change | 2020-2021 | 2021-2022 | Change | Change (%) | |||||||||
| Own-source revenue | 9 672 | 10 956 | 1 284 | 66 228 | 79 454 | 13 226 | 20.0 | ||||||||
| Federal transfers | 2 496 | 2 366 | –130 | 21 411 | 21 079 | –332 | –1.6 | ||||||||
| Consolidated revenue | 12 168 | 13 322 | 1 154 | 87 639 | 100 533 | 12 894 | 14.7 | ||||||||
| Portfolio expenditures(2) | –9 637 | –9 842 | –205 | –83 493 | –87 585 | –4 092 | 4.9 | ||||||||
| Debt service | –642 | –662 | –20 | –5 373 | –6 421 | –1 048 | 19.5 | ||||||||
| Consolidated expenditure | –10 279 | –10 504 | –225 | –88 866 | –94 006 | –5 140 | 5.8 | ||||||||
| SURPLUS (DEFICIT)(3) | 1 889 | 2 818 | 929 | –1 227 | 6 527 | 7 754 | — | ||||||||
| BALANCED BUDGET ACT | |||||||||||||||
| Deposits of dedicated revenues in the Generations Fund | –315 | –311 | 4 | –2 094 | –2 547 | –453 | — | ||||||||
| BUDGETARY BALANCE(4) | 1 574 | 2 507 | 933 | –3 321 | 3 980 | 7 301 | — | ||||||||
1
Other own-source revenue increased by $1.8 billion (17.1%) to $12.3 billion, due to:
a $1.1-billion increase (34.0%) in duties and permits, owing mainly to the increase in mining revenues resulting from sustained metal prices in markets since 2020 and to the increase in revenues collected under Québec’s cap-and-trade system for greenhouse gas emission allowances;
a $728-million increase (9.9%) in miscellaneous revenue, owing in particular to higher revenues from the sale of goods and services due to the easing of lockdown measures related to the COVID-19 pandemic compared to the same period in 2020.
Revenue from government enterprises increased by $1.3 billion (57.4%) to $3.7 billion. This increase is mainly attributable to the impact of COVID-19 on the results of government enterprises in 2020-2021, particularly those of Hydro-Québec and Loto-Québec.
| OWN-SOURCE REVENUE | |||||||||||||||
| (unaudited data, millions of dollars) | |||||||||||||||
| December | April to December | ||||||||||||||
| 2020 | 2021 | Change | 2020-2021 | 2021-2022 | Change | Change (%) | |||||||||
| Income and property taxes | |||||||||||||||
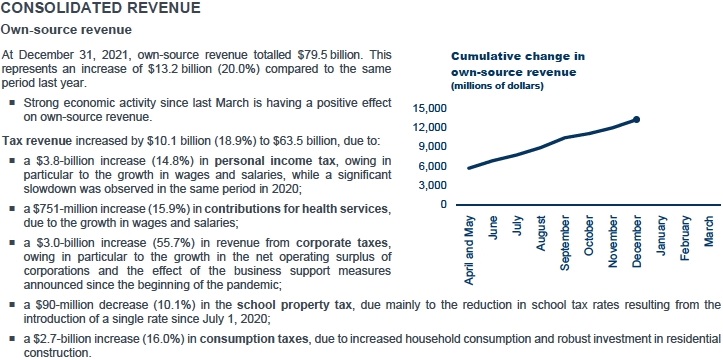
Personal income tax | 4 315 | 4 627 | 312 | 25 889 | 29 708 | 3 819 | 14.8 | ||||||||
Contributions for health services | 771 | 731 | –40 | 4 719 | 5 470 | 751 | 15.9 | ||||||||
Corporate taxes | 889 | 1 372 | 483 | 5 308 | 8 265 | 2 957 | 55.7 | ||||||||
School property tax | 87 | 90 | 3 | 892 | 802 | –90 | –10.1 | ||||||||
| Consumption taxes | 1 784 | 2 243 | 459 | 16 609 | 19 263 | 2 654 | 16.0 | ||||||||
| Tax revenue | 7 846 | 9 063 | 1 217 | 53 417 | 63 508 | 10 091 | 18.9 | ||||||||
| Duties and permits | 351 | 372 | 21 | 3 134 | 4 199 | 1 065 | 34.0 | ||||||||
| Miscellaneous revenue | 949 | 929 | –20 | 7 337 | 8 065 | 728 | 9.9 | ||||||||
| Other own-source revenue | 1 300 | 1 301 | 1 | 10 471 | 12 264 | 1 793 | 17.1 | ||||||||
| Total own-source revenue excluding revenue from government enterprises | 9 146 | 10 364 | 1 218 | 63 888 | 75 772 | 11 884 | 18.6 | ||||||||
| Revenue from government enterprises | 526 | 592 | 66 | 2 340 | 3 682 | 1 342 | 57.4 | ||||||||
| TOTAL | 9 672 | 10 956 | 1 284 | 66 228 | 79 454 | 13 226 | 20.0 | ||||||||
2
| FEDERAL TRANSFERS | |||||||||||||||
| (unaudited data, millions of dollars) | |||||||||||||||
| December | April to December | ||||||||||||||
| 2020 | 2021 | Change | 2020-2021 | 2021-2022 | Change | Change (%) | |||||||||
| Equalization | 1 104 | 1 093 | –11 | 9 939 | 9 839 | –100 | –1.0 | ||||||||
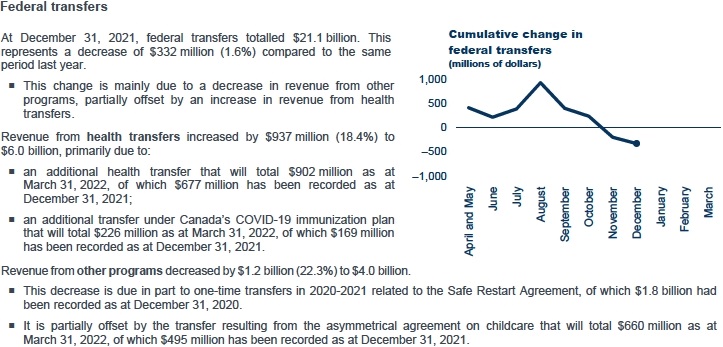
| Health transfers | 552 | 611 | 59 | 5 100 | 6 037 | 937 | 18.4 | ||||||||
| Transfers for post-secondary education and other social programs | 124 | 95 | –29 | 1 193 | 1 178 | –15 | –1.3 | ||||||||
| Other programs | 716 | 567 | –149 | 5 179 | 4 025 | –1 154 | –22.3 | ||||||||
| TOTAL | 2 496 | 2 366 | –130 | 21 411 | 21 079 | –332 | –1.6 | ||||||||
3
Expenditure in the Éducation portfolio increased by $828 million (7.1%) to $12.6 billion. This increase is explained, in particular, by the reopening of schools, which were temporarily closed in the spring of 2020 due to the COVID-19 pandemic.
Expenditure in the Enseignement supérieur portfolio increased by $282 million (4.6%) to $6.4 billion. This growth is due in part to the resumption of some activities that were limited in 2020-2021 in higher education institutions.
Expenditure in other portfolios increased by $470 million (1.8%) to $27.0 billion, due in particular to:
a $601-million increase in expenditure in the Travail, Emploi et Solidarité sociale portfolio, mainly due to the implementation of the extraordinary cost of living allowance announced in the November 2021 Update on Québec’s Economic and Financial Situation;
a $236-million increase in expenditure in the Famille portfolio, mainly due to the increase in the refundable tax credit for childcare expenses announced in the November 2021 Update on Québec’s Economic and Financial Situation;
a $523-million decrease in expenditure in the Affaires municipales et Habitation portfolio, mainly due to one-time financial assistance in 2020-2021 under the Safe Restart Agreement to support municipalities in the context of the pandemic.
Debt service expenditure increased by $1.0 billion (19.5%) to $6.4 billion. This increase is mainly due to the rise in interest rates.
| CONSOLIDATED EXPENDITURES BY PORTFOLIO(5) | |||||||||||||||
| (unaudited data, millions of dollars) | |||||||||||||||
| December | April to December | ||||||||||||||
| 2020(6) | 2021 | Change | 2020-2021(6) | 2021-2022 | Change | Change (%) | |||||||||
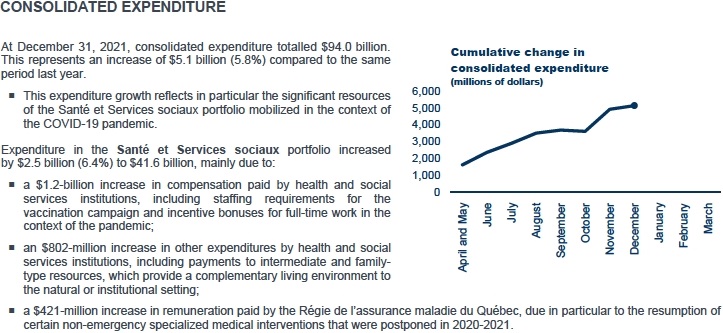
| Santé et Services sociaux | 4 593 | 4 446 | –147 | 39 115 | 41 627 | 2 512 | 6.4 | ||||||||
| Éducation | 1 389 | 1 582 | 193 | 11 725 | 12 553 | 828 | 7.1 | ||||||||
| Enseignement supérieur | 813 | 787 | –26 | 6 088 | 6 370 | 282 | 4.6 | ||||||||
| Other portfolios(7) | 2 842 | 3 027 | 185 | 26 565 | 27 035 | 470 | 1.8 | ||||||||
| Portfolio expenditures | 9 637 | 9 842 | 205 | 83 493 | 87 585 | 4 092 | 4.9 | ||||||||
| Debt service | 642 | 662 | 20 | 5 373 | 6 421 | 1 048 | 19.5 | ||||||||
| TOTAL | 10 279 | 10 504 | 225 | 88 866 | 94 006 | 5 140 | 5.8 | ||||||||
4
NET FINANCIAL SURPLUSES OR REQUIREMENTS
| Composition of net financial surpluses or requirements The government’s revenue and expenditure are established on an accrual basis of accounting. Revenue is recognized when earned and expenditure when incurred, regardless of when receipts and disbursements occur. Net financial surpluses (requirements), on the other hand, consist of the difference between receipts and disbursements resulting from government activities. To meet its net financial requirements, the government uses a variety of financing sources, including cash and borrowings. The various items for net financial requirements represent net receipts and disbursements generated by the government’s loans, interests in its enterprises, fixed assets and other investments, as well as by retirement plans and other employee future benefits, and by other accounts. This last item includes the payment of accounts payable and the collection of accounts receivable. Deposits in the Generations Fund also result in financial requirements. |
For the period April to December 2021, net financial requirements amount to $10.7 billion and are due to:
the $6.5-billion surplus resulting from the difference between government revenue and expenditure;
the $9.1-billion financial requirements for investments, loans and advances, due primarily to an increase in short-term investments of $5.7 billion as part of overall cash management, as well as the growth in the consolidation value of government enterprises;(8)
the $3.3-billion financial requirements related to government capital investments, mainly due to investments of $6.5 billion, offset by amortization expenses of $3.3 billion;(8)
the $2.3-billion financial requirements related to retirement plans and other employee future benefits liabilities, resulting from the payment of government employee benefits of $5.0 billion, partially offset by the net cost of plans of $2.7 billion;(8)
the $12-million financial surplus for other accounts;(9)
the $2.5-billion financial requirements generated by deposits in the Generations Fund.
| NET FINANCIAL SURPLUSES OR REQUIREMENTS | ||||
| (unaudited data, millions of dollars) | ||||
| April to December | ||||
| 2020-2021 | 2021-2022 | |||
| SURPLUS (DEFICIT)(3) | –1 227 | 6 527 | ||
| Non-budgetary transactions | ||||
| Investments, loans and advances | –9 974 | –9 074 | ||
| Capital investments | –2 984 | –3 283 | ||
| Retirement plans and other employee future benefits | –2 043 | –2 331 | ||
| Other accounts(9) | –2 754 | 12 | ||
| Deposits in the Generations Fund | –2 094 | –2 547 | ||
| Total non-budgetary transactions | –19 849 | –17 223 | ||
| NET FINANCIAL SURPLUSES (REQUIREMENTS) | –21 076 | –10 696 |
5
 CHANGE IN THE BUDGETARY BALANCE IN 2021-2022
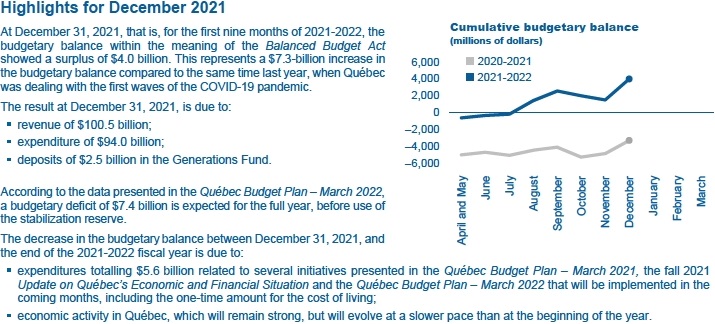
Results at December 31, 2021, that is, for the first nine months of the fiscal year, showed a budgetary surplus of $4.0 billion.
According to the data presented in the Québec Budget Plan – March 2022, a budgetary deficit of $7.4 billion is expected for the entire year 2021-2022, before use of the stabilization reserve.
For the last three months of the fiscal year, that is, from January to March 2022, the budgetary deficit will come from:
results excluding initiatives, which will increase the deficit by $5.7 billion;
A significant portion of the anticipated annual expenditures will be made in the last three months.
Moreover, growth in own-source revenue will gradually slow from 20.0% after nine months to 15.3% for the full fiscal year, similar to the projected change in nominal GDP (11.3%). High growth at the beginning of 2021-2022 is mainly due to the strong recovery in economic activities, while a significant slowdown was observed in the same period in 2020-2021. This effect will subside by the end of the fiscal year.
initiatives presented in the Québec Budget Plan – March 2021, of which a balance of $1.4 billion has yet to be recorded;
initiatives presented in the fall 2021 Update on Québec’s Economic and Financial Situation, of which a balance of $784 million has yet to be recorded;
new initiatives presented in the Québec Budget Plan – March 2022, which will total $3.4 billion by March 31, 2022.
The use of the stabilization reserve will reduce the budgetary deficit to $6.1 billion.
Moreover, the financial framework set out in the Québec Budget Plan – March 2022 is based on prudent economic forecasts in a context of continuing uncertainty due to both the pandemic and Russia’s invasion of Ukraine.
| CHANGE IN THE BUDGETARY BALANCE IN 2021-2022 | ||
| (millions of dollars) | ||
| 2021-2022 | ||
| BUDGETARY BALANCE(4) – MONTHLY REPORT ON FINANCIAL TRANSACTIONS AT DECEMBER 31, 2021 | 3 980 | |
| UPCOMING RESULTS FROM JANUARY TO MARCH 2022 | ||
| Results excluding initiatives | ||
– Consolidated revenue | 34 907 | |
– Consolidated expenditure | –39 721 | |
– Deposits of dedicated revenues in the Generations Fund | –910 | |
Subtotal | –5 724 | |
| Balance of initiatives in the March 2021 budget to be recorded | –1 408 | |
| Balance of initiatives in the November 2021 update to be recorded | –784 | |
| Initiatives in the March 2022 budget | –3 418 | |
| TOTAL UPCOMING RESULTS | –11 334 | |
| PROJECTED BUDGETARY BALANCE BEFORE USE OF THE STABILIZATION RESERVE | –7 354 | |
| Use of the stabilization reserve | 1 221 | |
| PROJECTED BUDGETARY BALANCE(4) – MARCH 2022 BUDGET | –6 133 |
6
APPENDIX 1: BUDGET FORECASTS – CHANGE SINCE THE MARCH 2021 BUDGET
| BUDGET FORECASTS FOR 2021-2022 | ||||||||
| (millions of dollars) | ||||||||
| March 2021 | March 2022 | |||||||
| budget | Adjustments | budget | (10) | Change (%) | (11) | |||
| CONSOLIDATED REVENUE | ||||||||
| Income and property taxes | ||||||||
Personal income tax | 35 921 | 3 173 | 39 094 | 11.7 | ||||
Contributions for health services | 6 796 | 221 | 7 017 | 9.7 | ||||
Corporate taxes | 8 013 | 3 971 | 11 984 | 33.9 | ||||
School property tax | 1 113 | –33 | 1 080 | –6.6 | ||||
| Consumption taxes | 23 325 | 1 211 | 24 536 | 14.8 | ||||
| Tax revenue | 75 168 | 8 543 | 83 711 | 14.9 | ||||
| Duties and permits | 4 853 | 832 | 5 685 | 23.2 | ||||
| Miscellaneous revenue | 10 989 | 35 | 11 024 | 11.5 | ||||
| Other own-source revenue | 15 842 | 867 | 16 709 | 15.3 | ||||
| Total own-source revenue excluding | ||||||||
| revenue from government enterprises | 91 010 | 9 410 | 100 420 | 14.9 | ||||
| Revenue from government enterprises | 4 658 | 836 | 5 494 | 22.3 | ||||
| Total own-source revenue | 95 668 | 10 246 | 105 914 | 15.3 | ||||
| Federal transfers | 26 899 | 2 648 | 29 547 | –3.8 | ||||
| Total consolidated revenue | 122 567 | 12 894 | 135 461 | 10.5 | ||||
| CONSOLIDATED EXPENDITURE | ||||||||
| Santé et Services sociaux | –52 358 | –5 868 | –58 226 | 6.4 | ||||
| Éducation | –18 312 | 44 | –18 268 | 7.9 | ||||
| Enseignement supérieur | –9 491 | 358 | –9 133 | 9.6 | ||||
| Other portfolios(7) | –41 763 | –3 527 | –45 290 | 15.8 | ||||
| Portfolio expenditures | –121 924 | –8 993 | –130 917 | 9.9 | ||||
| Debt service | –8 563 | 122 | –8 441 | 9.8 | ||||
| Total consolidated expenditure | –130 487 | –8 871 | –139 358 | 9.9 | ||||
| Provision for economic risks and other support and recovery measures | –1 250 | 1 250 | — | — | ||||
| SURPLUS (DEFICIT)(3) | –9 170 | 5 273 | –3 897 | — | ||||
| BALANCED BUDGET ACT | ||||||||
| Deposits of dedicated revenues in the Generations Fund | –3 080 | –377 | –3 457 | — | ||||
| BUDGETARY BALANCE BEFORE USE OF THE STABILIZATION RESERVE | –12 250 | 4 896 | –7 354 | — | ||||
| Use of the stabilization reserve | — | 1 221 | 1 221 | — | ||||
| BUDGETARY BALANCE(4) | –12 250 | 6 117 | –6 133 | — |
7
APPENDIX 2: EXPENDITURES BY MISSION
Government expenditures are broken down into five public service missions. This breakdown of the government’s expenditures into its main areas of activity is a stable indicator over time because it is usually not influenced by Cabinet shuffles. Moreover, since this breakdown is also used in public accounts, its presentation in the Monthly Report on Financial Transactions allows for a better monitoring of actual results over the course of the year.
The public service missions are:
Health and Social Services, which consists primarily of the activities of the health and social services network and the programs administered by the Régie de l’assurance maladie du Québec;
Education and Culture, which consists primarily of the activities of the education networks, student financial assistance, programs in the culture sector and immigration-related programs;
Economy and Environment, which primarily includes programs related to economic development, employment assistance measures, international relations, the environment and infrastructure support;
Support for Individuals and Families, which includes, in particular, last-resort financial assistance, assistance measures for families and seniors, and certain legal aid measures;
Administration and Justice, which consists mainly of the activities of legislature, central bodies and public security, as well as administrative programs.
| CONSOLIDATED EXPENDITURES BY MISSION EXCLUDING DEBT SERVICE | |||||||||
| (unaudited data, millions of dollars) | |||||||||
| December | April to December | ||||||||
| 2020 | (6) | 2021 | 2020-2021 | (6) | 2021-2022 | ||||
| Health and Social Services | 4 462 | 4 319 | 38 110 | 40 764 | |||||
| Education and Culture | 2 252 | 2 489 | 18 516 | 19 708 | |||||
| Economy and Environment | 1 322 | 1 476 | 11 102 | 11 577 | |||||
| Support for Individuals and Families | 823 | 858 | 8 463 | 9 353 | |||||
| Administration and Justice | 778 | 700 | 7 302 | 6 183 | |||||
| TOTAL | 9 637 | 9 842 | 83 493 | 87 585 | |||||
8
Consolidated financial information
Consolidated results include the results of all entities that are part of the government’s reporting entity, i.e., that are under its control. To determine consolidated results, the government eliminates transactions carried out between entities in the reporting entity. Additional information on the government’s financial organization and the funding of public services can be found on pages 13 to 18 of the document titled “Budgetary Process and Documents: Public Financial Accountability” (in French only).
Change in the application of the accounting standard respecting transfer payments
The Québec government contributes to the funding of public infrastructure owned by third parties. In most cases, funding is provided through annual transfers paid according to a schedule that corresponds to the rate of repayment of the loans contracted by the recipients to carry out the projects.
For these infrastructure projects, the government changed the application of PS 3410, Transfer payments, to account for transfer expenditures based on the period of completion of eligible work by transfer recipients. Previously, transfer expenditures were recorded at the rate of disbursements authorized by Parliament and the balance of funded work was reported in contractual obligations. This change results in more timely recognition of transfer expenditures in the government’s consolidated financial statements.
In this monthly report, the estimated impact of this change has been accounted for retroactively and is included in the consolidated expenditures. The Public Accounts 2020-2021 present the final impact of the application of the accounting standard, including on the government’s accumulated deficit as at March 31, 2021.
Notes
| (1) | A summary of the government’s accounting policies can be found on pages 74 to 77 of Volume 1 of the Public Accounts 2020-2021. |
| (2) | Portfolio expenditures include the impact of the change in the application of the accounting standard respecting transfer payments. |
| (3) | Balance as defined in the Public Accounts. |
| (4) | Budgetary balance within the meaning of the Balanced Budget Act. |
| (5) | Consolidated expenditures by mission are presented in Appendix 2. |
| (6) | Certain expenditures were reclassified between portfolios and between missions to take into account the transition to the 2021-2022 budgetary structure. |
| (7) | Other portfolios include inter-portfolio eliminations resulting from the elimination of reciprocal transactions between entities in different portfolios. |
| (8) | These items, which are included in the government’s budgetary surplus (deficit), are eliminated in non-budgetary transactions because they have no effect on cash flow. |
| (9) | The financial surpluses or requirements pertaining to other accounts can vary significantly from one month to the next, in particular according to the time when the government collects or disburses funds related to its activities. For example, when the last day of the month is not a business day, QST remittances are collected at the beginning of the following month, such that the equivalent of two months’ remittances can be collected in a given month. |
| (10) | The presentation of the budgetary information in this monthly report is consistent with that of the financial framework as published in the Québec Budget Plan – March 2022. |
| (11) | This is the annual change compared to results in 2020-2021. |
| For more information, contact the Direction des communications of the Ministère des Finances at 418-528-7382. | |
| The report is also available on the Ministère des Finances website: www.finances.gouv.qc.ca. |
9