Exhibit 99.4
Message from the minister of finance
Mr. François Paradis
President of the National Assembly
Hôtel du Parlement
Québec (Québec) G1A 1A4
Dear Mr. Paradis,
I am pleased to send you the Pre-election Report on the State of Québec’s Public Finances – August 2022, in accordance with the Act respecting the Ministère des Finances.
| — | In April 2015, the National Assembly passed legislative provisions mandating the Minister of Finance to publish a pre-election report on the state of public finances, prior to fixed-date general elections. |
| — | The Auditor General Act mandates the Auditor General of Québec to prepare a report giving its opinion on the plausibility of the forecasts and assumptions in the pre-election report published by the Minister of Finance. The Auditor General of Québec’s conclusion, which is provided herewith, is based on data available as at July 8, 2022. |
The Pre-election Report on the State of Québec’s Public Finances – August 2022 is based on the financial framework of the Québec Budget Plan – March 2022, to which the necessary adjustments were made to take into account the most recent information.
Given the uncertain context, the Pre-election Report on the State of Québec’s Public Finances – August 2022 is based on balanced economic forecasts and a prudent financial framework.
Despite the strong economic recovery since 2021 and continued growth in 2022, Québec is not immune to economic slowdowns resulting from the high inflation of recent months and interest rate hikes, or to possible jolts in the global pandemic situation.
| — | For this reason, the financial framework is based on balanced economic forecasts that incorporate both upward and downward risks. It includes a provision for economic risks and other support and recovery measures of $10.0 billion and growing deposits in the Generations Fund over the forecast horizon. |
The financial framework includes the measures announced in the Québec Budget Plan – March 2022. It also takes into account:
| — | a balanced approach combining sound management of public finances with stable and predictable funding of the government’s main missions; |
| — | Growth in revenue reflects Québec’s good economic health. The funding of expenditures corresponds to the cost of the services announced. |
| — | the continuity of high levels of investment in public infrastructure and the continued reduction of the debt burden. |
| | | Message from the Minister of Finance | 1 |
For 2022-2023 to 2026-2027, the financial framework provides for approximately $2.3 billion in improvements annually, compared to the Québec Budget Plan – March 2022.
| — | Despite current uncertainties, the budgetary balance deficit now stands at $1.9 billion in 2026-2027. |
| — | Excluding the provision for economic risks and other support and recovery measures, the budgetary balance within the meaning of the Balanced Budget Act, that is, after deposits of dedicated revenues in the Generations Fund, is achieved over the entire horizon of the financial framework. |
Québec relies on a diversified and resilient economy as well as on sound public finances that allow it to cope with the volatility of global economic activity.
Lastly, the Pre-election Report on the State of Québec’s Public Finances – August 2022 provides citizens with a financial framework that constitutes a reference point on the eve of the next general elections in Québec.
Sincerely,
Eric Girard
Minister of Finance
Québec, August 2022
2 | Pre-election Report on the State of Québec’s Public Finances – August 2022 | | |
STATEMENT CONCERNING THE RESPONSIBILITY
OF THE MINISTÈRE DES FINANCES
The Pre-election Report on the State of Québec’s Public Finances – August 2022 was prepared by the Ministère des Finances pursuant to the Act respecting the Ministère des Finances. The financial framework in the report is based on the data published in the Québec Budget Plan – March 2022 and takes into account the most recent available financial data, as at July 8, 2022.1
The Ministère des Finances is responsible for the information in the report. As required under the law, the report includes:
| — | economic forecasts and assumptions; |
| — | the projected components of the government’s financial framework; |
| — | expenditure forecasts prepared in collaboration with the Chair of the Conseil du trésor, broken down by field of State activity; |
| — | the reports required under section 15 of the Balanced Budget Act and section 11 of the Act to reduce the debt and establish the Generations Fund. |
The economic forecasts for Québec take into account a number of external and internal factors, such as:
| — | the economic situation of Québec’s main trading partners; |
| — | monetary policies and financial markets; |
| — | Québec’s domestic demand; |
| — | the labour market; |
| — | the underlying impacts of the health situation, including supply chain disruptions; |
| — | uncertainties related to the Russian invasion of Ukraine. |
As for the revenue and expenditure forecasts, they are based on assumptions pertaining to the evolution of the Québec economy that take into account, in particular, the external and internal factors mentioned above, as well as assumptions regarding the change in federal transfers and the cost of government services.
Economic forecast as well as revenue and expenditure forecasts include the measures and programs that are to be implemented by the government.
The financial impacts of the new accounting standards that come into effect on April 1, 2022 or April 1, 2023, have not been included in the consolidated forecasts of the Québec government’s revenue, expenditure, and debt over the budgetary horizon, as they are not significant or cannot be estimated as of the date of the report.2
The budgetary balance and debt data are established based on the definitions in the Balanced Budget Act and the Act to reduce the debt and establish the Generations Fund.
| 1 | Unless otherwise indicated, this document is based on financial information available as at July 8, 2022. In addition, the budgetary data presented for 2021-2022 are preliminary estimates and those for subsequent years are forecasts. |
| 2 | Accounting standards effective April 1, 2022 or April 1, 2023 are presented in Appendix 4. |
| | | Statement Concerning the Responsibility of the Ministère des Finances | 3 |
The forecasts presented in this report are underpinned by reasonable, plausible assumptions that reflect best practices, particularly those recommended by international organizations such as the Organisation for Economic Co-operation and Development (OECD).
Finally, I would like to thank the department’s staff for their hard work and cooperation in completing this exercise.
Julie Gingras
Deputy Minister of Finance
Québec, August 2022
4 | Pre-election Report on the State of Québec’s Public Finances – August 2022 | | |
ASSURANCE REPORT OF THE AUDITOR GENERAL OF QUÉBEC ON THE 2022 PRE-ELECTION REPORT
To the National Assembly of Québec,
I have performed an assurance review engagement on the plausibility of the assumptions and forecasts presented in the attached pre-election report, prepared by the Minister of Finance. My work involved examining, in all material aspects, the assumptions made and the financial framework forecasts for the following three fiscal years: 2022-2023, 2023-2024 and 2024-2025. The audit of the consolidated financial statements of the Gouvernement du Québec for the 2021-2022 fiscal year was underway at the time of my work; therefore, I do not express any conclusion on these data, presented in the pre-election report.
As the forecasts are based on assumptions about future events, the actual results will be different from the information presented in the pre-election report, and differences could be significant. Thus, I do not express any conclusion on the likelihood that the forecasts will materialize.
In accordance with the Auditor General Act, I report that I have received all the information, reports and explanations requested to express my conclusion.
Conclusion of the Auditor General’s review
Based on the procedures implemented and the evidence obtained, as of July 8, 2022, the assumptions made and forecasts related to the financial framework and debt for the 2022-2023, 2023-2024 and 2024-2025 fiscal years are plausible, in all material respects and according to the objective and the criteria set by the Auditor General.
Auditor General’s comments
Without detracting from my conclusion, I would like to make the following comments:
Very high level of uncertainty about the economic situation
First, for 2022-2023, the margins of prudence of $2.2 billion in the pre-election report include $2 billion in planned spending, primarily related to COVID-19, which should instead be presented as portfolio expenditures. As a result, the margins for 2022-2023 actually amount to $0.2 billion, which I deem reasonable. Otherwise, as certain expenditures may not be made within the prescribed deadlines, and more persistent inflation could have a positive temporary impact on revenues, an additional surplus could emerge, and the budget balance deficit could improve accordingly.
Second, there is currently a very high level of uncertainty regarding the economic situation. Given this high degree of uncertainty, I have deemed it appropriate to include significant margins of prudence of $2.4 billion in 2023-2024 and $2.25 billion in 2024-2025. However, I have been unable to assess whether these margins are sufficient or excessive. The use of margins will depend primarily on whether economic risks, such as a recession, materialize and if so, to what extent. If economic risks do not materialize, and as some expenditures may not be made within the prescribed deadlines, the surplus for the government’s consolidated financial statement purposes could be higher than expected, and the budget balance deficit could improve accordingly.
| | | Assurance report of the Auditor General of Québec on the 2022 pre-election report | 5 |
Third, to illustrate the impacts of unusually high uncertainty, it would have been useful, following the example of other institutions, to present an alternative scenario that estimates the potential impact posed by the materialization of the major risks on Québec’s economic outlook and the financial framework. Indeed, the information contained in the pre-election report is limited to presenting an estimate of the potential impacts of a recession on nominal GDP growth and own-source revenue based on an average of recent recessions (box on page 14 of the pre-election report).
The Auditor General of Quebec’s detailed analysis of the Pre-Election report
In addition to this report, I have prepared a report entitled The Auditor General of Québec’s detailed analysis of the Pre-Election report 2022, in which I explain in detail my work and the bases for my conclusion, and present additional information necessary for the reader to fully assess the assumptions and forecasts in the pre-election report. This detailed report also contains various comments on the presentation of information in the pre-election report, as well as the objective and criteria used to assess this presentation. It will be available on the Auditor General’s website.
Responsibility of the Ministère des Finances
Under the Act respecting the Ministère des Finances, the Minister must prepare and publish, prior to the general election that follows the expiry of a Legislature, a pre-election report on the state of Québec’s public finances. This responsibility includes making assumptions and forecasts that are deemed plausible.
Responsibility of the Auditor General
My responsibility is to review the plausibility of the assumptions and forecasts presented in the pre-election report, as of July 8, 2022, based on the procedures I have implemented and the evidence I have obtained with regard to the objective and criteria I have deemed suitable. This objective and these criteria are provided below. I must also indicate whether I received all the information and documents requested. I conducted the engagement in accordance with Canadian Standards on Assurance Engagements 3001: Direct Engagements. This standard requires me to plan and perform the engagement so as to obtain assurance that is meaningful in the circumstances.
| Objective | Assessment criteria | |
| Determine whether the budget assumptions and forecasts used to develop the financial framework and debt presented in the pre-election report are plausible. | – The assumptions used are justified and constitute a reasonable basis for establishing forecasts. – The forecasts reflect the selected assumptions. – The assumptions and forecasts take into account the most recent financial information and the latest government orientations and decisions. – The forecasts are established in accordance with Canadian accounting standards in the public sector. |
Because of the purpose of the review engagement, which focuses on forecasts, the nature of the implemented procedures is different from what is done in audit engagements, and the level of assurance obtained is thus lower.
The implemented procedures therefore rely on my judgment. These include, to the extent deemed appropriate, analysis of the budget process, requests for information, cross-referencing of documents or reconciliation with supporting documents, analytical procedures, assessment of the estimation methods used and the Ministère des Finance’s economic forecasting models, review of sensitivity calculations and analyses. Finally, the consultation of public finance specialists and economists, including econometric analysts, form an integral part of the procedures.
6 | Pre-election Report on the State of Québec’s Public Finances – August 2022 | | |
The Auditor General’s independence and quality control
The Auditor General complied with the relevant ethical requirements and code of ethics that are applicable to the practice of public accounting and related to assurance engagements, published by various professional accounting bodies, which are based on the fundamental principles of integrity, objectivity, professional competence and due care, confidentiality and professional behaviour. The Auditor General applies the Canadian Standard on Quality Control 1, Quality Control for Firms that Perform Audits and Reviews of Financial Statements, and Other Assurance Engagements and accordingly maintains a comprehensive quality control system that includes documented policies and procedures for compliance with ethical requirements, professional standards and applicable legal and regulatory requirements.
Guylaine Leclerc, FCPA Auditor
Auditor General of Québec
Québec, August 8, 2022
| | | Assurance report of the Auditor General of Québec on the 2022 pre-election report | 7 |
Pre-election report on the state of Québec’s
public finances
|
| 9 |
| APPENDIX 4: | Upcoming changes to accounting standards | 95 |
| APPENDIX 5: | Requirements under the Act respecting the Ministère des Finances and the Auditor General Act | 97 |
10 | Pre-election Report on the State of Québec’s Public Finances – August 2022 | | |
Québec’s financial situation is based on balanced economic forecasts,3 that is, on the most likely scenario, and a prudent financial framework.
| — | Québec’s economy recovered in 2021. After a historic decline of 5.5% in 2020, real gross domestic product (GDP) grew by 5.6%. |
| — | Economic activity will continue to grow despite the risks inherent to the forecast scenario. |
The economic forecast scenario incorporates the uncertainties and risks related to the particular context in which Québec is evolving.
The economic forecasts for 2022 assume an increase in Québec’s real GDP (+3.4%) similar to that expected on average by private sector forecasters (+3.2%).4
| — | The additional own-source revenue resulting from the favourable revision of economic indicators will make it possible to finance: |
| — | the entire cost of renewing existing programs. In fact, there are no remaining shortfall for portfolio expenditures; |
| — | the anticipated increase in costs related to the delivery of public services; |
| — | annual investments provided for in the Québec Infrastructure Plan (QIP). |
| — | The financial framework includes increasing deposits in the Generations Fund over the forecast horizon, stable and predictable financing of government actions, and government decisions made since the 2022-2023 budget. |
| — | Although the government is not shielded from the uncertainties that could affect its financial framework, it does not foresee economic slowdowns of the magnitude of those resulting from a recession in the short term. However, should economic slowdowns occur, the provisions in the financial framework will be adequate to deal with it. |
| — | The financial framework includes a provision for economic risks and other support and recovery measures totaling $10.0 billion between 2022-2023 and 2026-2027. |
Excluding the provision for economic risks and other support and recovery measures, the budgetary balance within the meaning of the Balanced Budget Act, that is, after deposits of dedicated revenues in the Generations Fund, is achieved over the entire horizon of the financial framework.
| — | The Act to reduce the debt and establish the Generations Fund stipulates that, for fiscal 2025-2026, the gross debt must not exceed 45% of GDP while the debt representing accumulated deficits must not exceed 17% of GDP. These two objectives are currently expected to be met if the risks of a recession do not materialize. |
| 3 | The Ministère des Finances’ economic forecast is balanced. It incorporates both upward and downward risks. |
| 4 | Based on the Ministère des Finances survey as at June 21, 2022, which includes the forecasts of 11 private sector institutions. |
| | | Highlights | 11 |
| q | Québec’s economic outlook |
Table 1 shows a summary of the main indicators of the economic outlook.
TABLE 1
Québec’s economic outlook
(annual average, percentage change, unless otherwise indicated)
| 2021 | 2022 | 2023 | 2024 | 2025 | 2026 | |||||||||||||||||||
| Output | ||||||||||||||||||||||||
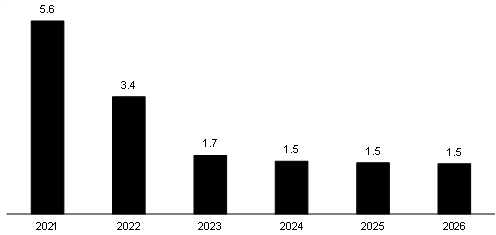
| Real GDP | 5.6 | 3.4 | 1.7 | 1.5 | 1.5 | 1.5 | ||||||||||||||||||
| Nominal GDP | 12.5 | 9.6 | 3.8 | �� | 3.6 | 3.5 | 3.5 | |||||||||||||||||
| Nominal GDP (billions of dollars) | 505.1 | 553.6 | 574.4 | 595.3 | 616.4 | 638.0 | ||||||||||||||||||
| Components of GDP (in real terms) | ||||||||||||||||||||||||
| Final domestic demand | 5.7 | 3.8 | 1.5 | 1.2 | 1.3 | 1.1 | ||||||||||||||||||
| – Household consumption | 5.8 | 5.3 | 2.3 | 1.5 | 1.5 | 1.5 | ||||||||||||||||||
| – Government spending and investment | 4.9 | 2.6 | 0.6 | 0.8 | 1.1 | 0.1 | ||||||||||||||||||
| – Residential investment | 12.7 | -2.6 | -3.0 | -0.2 | 0.2 | 0.3 | ||||||||||||||||||
| – Non-residential business investment | 3.3 | 4.9 | 3.6 | 2.1 | 2.1 | 2.2 | ||||||||||||||||||
| Exports | 4.6 | 2.1 | 3.0 | 2.7 | 2.6 | 2.2 | ||||||||||||||||||
| Imports | 8.8 | 4.2 | 2.1 | 1.7 | 2.2 | 1.3 | ||||||||||||||||||
| Labour market | ||||||||||||||||||||||||
| Population (thousands) | 8 604 | 8 687 | 8 763 | 8 830 | 8 891 | 8 942 | ||||||||||||||||||
| Population aged 15 and over (thousands) | 7 099 | 7 153 | 7 224 | 7 289 | 7 348 | 7 399 | ||||||||||||||||||
| Jobs (thousands) | 4 269 | 4 397 | 4 447 | 4 473 | 4 496 | 4 518 | ||||||||||||||||||
| Job creation (thousands) | 169.4 | 128.0 | 49.5 | 26.2 | 23.5 | 21.7 | ||||||||||||||||||
| Unemployment rate (per cent) | 6.1 | 4.2 | 3.9 | 3.8 | 3.7 | 3.6 | ||||||||||||||||||
| Other economic indicators (in nominal terms) | ||||||||||||||||||||||||
| Household consumption | 9.2 | 11.2 | 5.1 | 3.2 | 3.3 | 3.3 | ||||||||||||||||||
| – Excluding food products and housing | 11.1 | 13.2 | 5.2 | 3.1 | 3.2 | 3.1 | ||||||||||||||||||
| Housing starts (thousands of units) | 68.0 | 64.6 | 58.3 | 52.9 | 50.1 | 48.5 | ||||||||||||||||||
| Residential investment | 29.8 | 6.2 | -0.5 | 1.8 | 2.3 | 2.4 | ||||||||||||||||||
| Non-residential business investment | 7.2 | 11.1 | 5.6 | 3.3 | 3.9 | 4.1 | ||||||||||||||||||
| Wages and salaries | 9.4 | 10.7 | 4.0 | 3.1 | 3.2 | 3.1 | ||||||||||||||||||
| Household income | 7.6 | 6.8 | 2.4 | 3.3 | 3.4 | 3.2 | ||||||||||||||||||
| Net operating surplus of corporations | 16.8 | -4.6 | 0.2 | 5.8 | 4.0 | 3.8 | ||||||||||||||||||
| Consumer price index | 3.8 | 6.5 | 3.2 | 2.0 | 1.9 | 1.9 | ||||||||||||||||||
| – Excluding food and energy | 3.0 | 4.4 | 3.3 | 2.1 | 2.1 | 2.1 | ||||||||||||||||||
| GDP per capita (in $) | 58 701 | 63 727 | 65 546 | 67 420 | 69 329 | 71 341 | ||||||||||||||||||
| Per capita disposable income (in $) | 34 849 | 36 160 | 35 930 | 36 867 | 37 839 | 38 845 | ||||||||||||||||||
Sources: Institut de la statistique du Québec, Statistics Canada, Canada Mortgage and Housing Corporation and Ministère des Finances du Québec.
12 | Pre-election Report on the State of Québec’s Public Finances – August 2022 | | |
| q | Financial framework |
Table 2 shows the detailed multi-year financial framework.
TABLE 2
Financial framework from 2021-2022 to 2026-2027
(millions of dollars)
| 2021- 2022- | 2022- 2023- | 2023- 2024- | 2024- 2025- | 2025- 2026- | 2026- 2027- | 2021- 2027(1) | ||||||||||||||||||||||
| Revenue | ||||||||||||||||||||||||||||
| Personal income tax | 41 285 | 43 414 | 45 272 | 46 660 | 48 519 | 50 278 | ||||||||||||||||||||||
| Contributions for health services | 7 367 | 7 784 | 7 964 | 8 187 | 8 393 | 8 603 | ||||||||||||||||||||||
| Corporate taxes | 12 927 | 11 925 | 11 867 | 12 803 | 13 536 | 14 131 | ||||||||||||||||||||||
| School property tax | 1 081 | 1 048 | 1 106 | 1 187 | 1 251 | 1 299 | ||||||||||||||||||||||
| Consumption taxes | 24 673 | 27 345 | 28 140 | 29 006 | 29 743 | 30 475 | ||||||||||||||||||||||
| Duties and permits | 6 049 | 5 518 | 5 494 | 5 544 | 5 678 | 5 810 | ||||||||||||||||||||||
| Miscellaneous revenue | 10 902 | 11 629 | 12 450 | 13 061 | 13 483 | 14 051 | ||||||||||||||||||||||
| Government enterprises | 5 967 | 6 207 | 6 688 | 7 040 | 6 713 | 6 994 | ||||||||||||||||||||||
| Own-source revenue | 110 251 | 114 870 | 118 981 | 123 488 | 127 316 | 131 641 | ||||||||||||||||||||||
| % change | 20.0 | 4.2 | 3.6 | 3.8 | 3.1 | 3.4 | 6.2 | |||||||||||||||||||||
| Federal transfers | 29 141 | 29 600 | 29 631 | 29 921 | 31 813 | 32 345 | ||||||||||||||||||||||
| % change | –5.1 | 1.6 | 0.1 | 1.0 | 6.3 | 1.7 | 0.9 | |||||||||||||||||||||
| Total revenue | 139 392 | 144 470 | 148 612 | 153 409 | 159 129 | 163 986 | ||||||||||||||||||||||
| % change | 13.7 | 3.6 | 2.9 | 3.2 | 3.7 | 3.1 | 5.0 | |||||||||||||||||||||
| Expenditure | ||||||||||||||||||||||||||||
| Portfolio expenditures | –118 272 | –128 154 | –134 472 | –138 370 | –144 246 | –147 959 | ||||||||||||||||||||||
| % change | 11.4 | 8.4 | 4.9 | 2.9 | 4.2 | 2.6 | 5.7 | |||||||||||||||||||||
| Debt service | –8 619 | –10 189 | –9 000 | –9 888 | –9 990 | –10 808 | ||||||||||||||||||||||
| % change | 12.1 | 18.2 | –11.7 | 9.9 | 1.0 | 8.2 | 5.8 | |||||||||||||||||||||
| Total expenditure | –126 891 | –138 343 | –143 472 | –148 258 | –154 236 | –158 767 | ||||||||||||||||||||||
| % change | 11.5 | 9.0 | 3.7 | 3.3 | 4.0 | 2.9 | 5.7 | |||||||||||||||||||||
| Expenditure associated with COVID-19 support and recovery measures | –9 178 | –2 355 | –462 | –18 | — | — | ||||||||||||||||||||||
| Provision for economic risks and other support and recovery measures | — | –2 000 | –2 000 | –2 000 | –2 000 | –2 000 | ||||||||||||||||||||||
| SURPLUS | 3 323 | 1 772 | 2 678 | 3 133 | 2 893 | 3 219 | ||||||||||||||||||||||
| BALANCED BUDGET ACT | ||||||||||||||||||||||||||||
| Deposits of dedicated revenues in the Generations Fund | –3 617 | –3 428 | –3 955 | –4 546 | –4 800 | –5 163 | ||||||||||||||||||||||
| BUDGETARY BALANCE BEFORE USE OF THE STABILIZATION RESERVE | –294 | –1 656 | –1 277 | –1 413 | –1 907 | –1 944 | ||||||||||||||||||||||
| Use of the stabilization reserve | 294 | 927 | — | — | — | — | ||||||||||||||||||||||
| BUDGETARY BALANCE(2) | — | –729 | –1 277 | –1 413 | –1 907 | –1 944 | ||||||||||||||||||||||
Note: Totals may not add due to rounding.
| (1) | Average annual growth rate, corresponding to the geometric average over six years, from 2021-2022 to 2026-2027. |
| (2) | Budgetary balance within the meaning of the Balanced Budget Act, after use of the stabilization reserve. |
| | | Highlights | 13 |
| Potential effects of a recession on the financial framework |
Like several advanced economies, Québec is not immune to an economic and financial recession. The COVID-19 pandemic, the expansionary fiscal policies of governments, the synchronized rebound in global demand, and Russia’s invasion of Ukraine have led to a significant increase in inflation. As a result, central banks have begun to tighten monetary policy and reduce the size of their balance sheets. The persistence of inflation and the possibility that central banks may have to rise interest rates above the equilibrium neutral rates to reduce inflation substantially increase the risk of a recession. Data on the economic situation in Québec is currently favourable. However, if a recession were to occur in Québec, it could have repercussions on the financial framework, causing revenue to decline and expenditure to increase.
In Québec, analysis of historical data indicates that a medium-sized recession could result in a revision to nominal GDP growth of −2.8 percentage points in the first year of the shock and −0.7 percentage points in the following year relative to a baseline scenario. Because of the economic recovery that typically follows a slowdown, nominal GDP growth would be revised upward for the subsequent three years. After these five years, nominal GDP growth would return to a pre-recession level. Such an economic slowdown could have different repercussions on the financial framework.
| – | The government’s own-source revenue could decrease, primarily revenues whose tax bases depend on different economic parameters such as wages and salaries, the net operating surplus of corporations or household consumption. For example, revenue could decline by approximately $8.3 billion over a five-year period, before returning to a level comparable to what was expected before the recession. |
| – | Expenditure could increase, particularly for certain programs that offer financial assistance to individuals and businesses, for example last-resort financial assistance or assistance programs for small- and medium-sized businesses, as needs increase during times of economic difficulty. The implementation of new support measures and economic recovery initiatives, among other things, could also have an upward impact on expenditure. |
The financial framework incorporates a provision for economic risks and other support and recovery measures designed to manage unforeseen events affecting public finances. This provision, which totals $10.0 billion over five years, could be used to counter the effects of a potential recession.
| Nominal GDP growth adjustment | Adjustment to own-source revenue(1) | |
| (percentage points) | (billions of dollars) |
 | 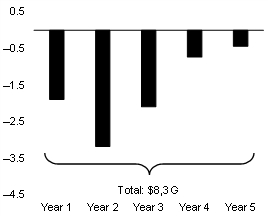 |
| (1) Own-source revenue excluding revenue from government enterprises. |
14 | Pre-election Report on the State of Québec’s Public Finances – August 2022 | | |
| 1. | Economic and financial forecasts |
| 1.1 | Changes in Québec’s situation |
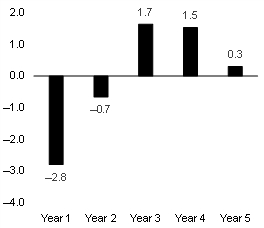
The Québec economy recovered in 2021. After a historic decline of 5.5% in 2020, real GDP grew by 5.6%.
| — | In 2021, economic growth was stronger in Québec than in Canada (+4.5%). |
Economic activity will continue to grow despite the risks inherent in the forecast scenario.
| — | With the recovery period having been completed quickly in 2021, the economy will evolve closer to its potential over the next few years. |
| — | Real GDP increases of 3.4% in 2022 and 1.7% in 2023 are expected. |
| — | From 2024 to 2026, average annual growth is expected to stand at 1.5%. |
| CHART 1 Economic growth in Québec |
| (real GDP, percentage change) |
| Sources: | Institut de la statistique du Québec, Statistics Canada and Ministère des Finances du Québec. |
| | | Economic and Financial Forecasts | 15 |
| q | Contribution of factors to real GDP growth |
The increase in real GDP is based on the following elements:
| — | growth in the pool of potential workers, specifically the change in the population aged 15 to 64; |
| — | improvement in the employment rate, that is, the total number of people employed relative to the population aged 15 to 64; |
| — | productivity growth, that is, the change in output per job. |
Because of the aging population, the contribution of the potential labour pool to economic growth will be limited.
In addition, labour shortages will limit the gains that can still be made in terms of improving the employment rate.
Therefore, in a context of demographic aging and labour shortage, productivity gains are the main factor that will support Québec’s economic growth over the next few years.
Moreover, growth in real GDP per capita is expected to continue over the next few years at a slightly higher rate than that recorded between 2009 and 2018, despite demographic aging.
TABLE 3
Contribution of economic growth factors in Québec
| (average annual percentage change and contribution in percentage points) |
2009- 2018 | 2019 | 2020 | 2021 | 2022 | 2023 | 2024 | 2025 | 2026 | ||||||||||||||||||||||||||||
| Real GDP | 1.5 | 2.8 | -5.5 | 5.6 | 3.4 | 1.7 | 1.5 | 1.5 | 1.5 | |||||||||||||||||||||||||||
| Growth factors (contribution) | ||||||||||||||||||||||||||||||||||||
| Potential labour pool(1) | 0.2 | 0.4 | -0.1 | –0.2 | –0.1 | 0.2 | 0.1 | 0.0 | –0.1 | |||||||||||||||||||||||||||
| Employment rate(2) | 0.7 | 1.6 | -4.8 | 4.4 | 3.1 | 0.9 | 0.5 | 0.5 | 0.6 | |||||||||||||||||||||||||||
| Productivity(3) | 0.7 | 0.7 | -0.7 | 1.4 | 0.4 | 0.6 | 1.0 | 1.0 | 1.0 | |||||||||||||||||||||||||||
| REAL GDP PER CAPITA | 0.7 | 1.6 | -6.3 | 5.3 | 2.5 | 0.8 | 0.8 | 0.8 | 0.9 | |||||||||||||||||||||||||||
Note: Totals may not add due to rounding.
| (1) | Population aged 15 to 64. |
| (2) | The employment rate corresponds to the total number of workers in proportion to the population aged 15 to 64. |
| (3) | Productivity as measured by real GDP per job. |
Sources: Institut de la statistique du Québec, Statistics Canada and Ministère des Finances du Québec.
16 | Pre-election Report on the State of Québec’s Public Finances – August 2022 | | |
| ■ | Demographic change |
Population aging can be defined as a change in the balance between age groups, combining a decrease in the proportion of the population aged 15 to 64 in the total population with an increase in the proportion of people aged 65 and over.
| — | The demographic weight of the population aged 15 to 64 is therefore expected to fall from 64.0% of the total population in 2021 to 60.4% in 2030. |
| — | Conversely, the proportion of the population aged 65 and over in the total population is expected to increase from 20.3% in 2021 to 24.8% in 2030. |
However, the population aged 15 to 64 is the main pool of potential workers.
| — | The decrease in its demographic weight limits the possible increase in the active population and increases pressures on the labour market and on production. |
| — | As a result, employers are faced with recruitment difficulties while economic activity continues to grow. |
CHART 2
Demographic weight of different age groups
(proportion of certain age groups in the total population, in per cent)
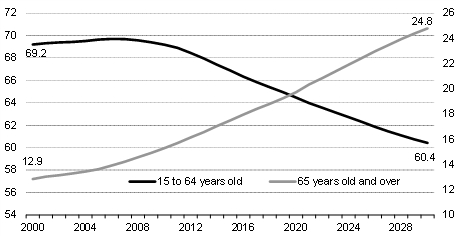
Sources: Institut de la Statistique du Québec, Statistics Canada and Ministère des Finances du Québec.
| | | Economic and Financial Forecasts | 17 |
| ■ | State of the labour market |
The Québec labour market must deal with the challenge of labour availability. Indeed, some businesses are having difficulty hiring staff.
| — | In the first quarter of 2022, there were just over 224 000 unfilled positions in Québec, that is, approximately 96 000 more positions than in the first quarter of 2020. This is an increase of 74.7% in two years. |
| — | The vacancy rate, which is the number of vacant positions as a percentage of all vacant or occupied positions, is increasing. It rose to 5.8% in the first quarter of 2022, compared to 3.4% in the first quarter of 2020. |
In addition, Québec has fewer potential workers who can fill available positions.
| — | For example, in the first quarter of 2020, Québec had 2.3 unemployed individuals per vacant job. |
| — | In the first quarter of 2022, the ratio declined to 1.0 unemployed individual. |
In the coming months, employers will continue to face recruitment challenges as economic activity continues to grow.
| — | Nevertheless, the effects of the labour shortage could be mitigated by business productivity gains, an increase in the participation rate, and the effect of government measures to increase the graduation and training of the workforce. |
TABLE 4
Change in the number of vacancies and unemployed individuals in Québec
| (number of vacancies and unemployed individuals in units, vacancy rate in per cent) | ||||||||||||
| 1st quarter of 2020 | 1st quarter of 2022 | Difference(1) | ||||||||||
| Number of vacancies | 128 410 | 224 370 | 95 960 | |||||||||
| Vacancy rate(2) | 3.4 | 5.8 | 2.4 | |||||||||
| Number of unemployed individuals | 291 700 | 230 500 | –61 200 | |||||||||
| NUMBER OF UNEMPLOYED INDIVIDUALS PER VACANCY | 2.3 | 1.0 | –1.2 | |||||||||
Note: Data are not seasonally adjusted. It is recommended to compare quarterly data with those from a corresponding quarter.
| (1) | Actual differences may not correspond to those shown due to rounding. |
| (2) | Number of vacancies as a percentage of all jobs, either filled or vacant. |
Sources: Statistics Canada and Ministère des Finances du Québec.
18 | Pre-election Report on the State of Québec’s Public Finances – August 2022 | | |
| q | Growth in nominal GDP |
After increasing by 12.5% in 2021, nominal GDP is expected to grow by 9.6% in 2022, 3.8% in 2023 and 3.6% on average annually from 2024 to 2026.
This nominal GDP growth will stem from the combined impact of the increase in real economic activity and the GDP deflator, which measures price changes in the overall economy.
| — | Real GDP is expected to increase by 3.4% in 2022, 1.7% in 2023 and 1.5% for the years 2024 to 2026, a level closer to its potential. |
| — | The GDP deflator is projected to rise by 6.0% in 2022 and 2.0% on average for the years 2023 to 2026. |
| — | In 2022, the increase in prices of Québec exported goods, particularly aluminum, metals and ores prices, will lead to an improvement in the terms of trade (+1.0%). |
| — | In addition, growth in the consumer price index (CPI) is expected to accelerate to 6.5%. On net, the GDP deflator is expected to grow by 6.0%. |
TABLE 5
GDP growth in Québec
| (percentage change) | ||||||||||||||||||||||||
| 2021 | 2022 | 2023 | 2024 | 2025 | 2026 | |||||||||||||||||||
| Real GDP | 5.6 | 3.4 | 1.7 | 1.5 | 1.5 | 1.5 | ||||||||||||||||||
| Prices – GDP deflator | 6.5 | 6.0 | 2.0 | 2.1 | 2.0 | 2.0 | ||||||||||||||||||
| – CPI | 3.8 | 6.5 | 3.2 | 2.0 | 1.9 | 1.9 | ||||||||||||||||||
| – Terms of trade | 4.9 | 1.0 | –0.3 | 0.8 | 0.3 | 0.2 | ||||||||||||||||||
| NOMINAL GDP | 12.5 | 9.6 | 3.8 | 3.6 | 3.5 | 3.5 | ||||||||||||||||||
Note: Totals may not add due to rounding.
Sources: Institut de la statistique du Québec, Statistics Canada and Ministère des Finances du Québec.
| | | Economic and Financial Forecasts | 19 |
| q | Private sector five-year economic outlook |
The Ministère des Finances’ forecasts incorporate the uncertainties and risks inherent in the particular context in which Québec is evolving. They are balanced, meaning that they incorporate both upward and downward risks.
| — | In 2022, the Ministère des Finances forecasts an increase in economic activity (+3.4%), slightly higher to that expected on average by private sector forecasters (+3.2%). |
| — | The Ministère des Finances’ forecast incorporates the official economic accounts statistics that were released on June 28, 2022 by the Institut de la statistique du Québec. According to these estimates, the economic growth in Québec was very strong in the first quarter of 2022. However, the private sector forecast survey was completed on June 21, 2022. Therefore, the forecasts do not take into account this update for the beginning of 2022. |
| — | In 2023, the Ministère des Finances estimates that the increase in economic activity (+1.7%) will be equivalent to that expected on average by private sector forecasters (+1.7%). |
Moreover, over a five-year horizon, that is, from 2022 to 2026:
| — | the expected average growth is 1.9% for real GDP, equivalent to that expected by the private sector (+1.9%); |
| — | the average annual increase expected is 4.8% for nominal GDP, which is greater than that expected by the private sector (+4.5%). |
| — | The stronger-than-expected increase in nominal GDP in the first quarter of 2022 accounts for the difference between the Ministère des Finances’ forecast and the private sector average for the year 2022 as a whole and the five-year forecast. From 2023 onward, the anticipated annual growth rates are similar to those of the private sector. |
TABLE 6
Economic outlook for Québec – Comparison with the private sector
(real GDP, percentage change)
| 2021 | 2022 | 2023 | 2024 | 2025 | 2026 | Average 2022-2026 | ||||||||||||||||||||||
| Real GDP | ||||||||||||||||||||||||||||
| – Ministère des Finances du Québec | 5.6 | 3.4 | 1.7 | 1.5 | 1.5 | 1.5 | 1.9 | |||||||||||||||||||||
| – Private sector average | 6.1 | 3.2 | 1.7 | 1.6 | 1.6 | 1.5 | 1.9 | |||||||||||||||||||||
| Prices – GDP deflator | ||||||||||||||||||||||||||||
| – Ministère des Finances du Québec | 6.5 | 6.0 | 2.0 | 2.1 | 2.0 | 2.0 | 2.8 | |||||||||||||||||||||
| – Private sector average | 6.6 | 5.1 | 2.2 | 1.9 | 1.9 | 1.9 | 2.6 | |||||||||||||||||||||
| Nominal GDP | ||||||||||||||||||||||||||||
| – Ministère des Finances du Québec | 12.5 | 9.6 | 3.8 | 3.6 | 3.5 | 3.5 | 4.8 | |||||||||||||||||||||
| – Private sector average | 12.8 | 8.3 | 3.9 | 3.5 | 3.5 | 3.4 | 4.5 | |||||||||||||||||||||
Sources: Ministère des Finances du Québec and Ministère des Finances du Québec survey as at June 21, 2022, which includes the forecasts of 11 private sector institutions.
20 | Pre-election Report on the State of Québec’s Public Finances – August 2022 | | |
| 1.2 | Assumptions, risks and sensitivity analysis |
The Ministère des Finances establishes the economic forecast taking into account a number of external and internal factors that influence Québec’s economic outlook.
| q | Assumptions |
| ■ | External factors |
The assumptions of the Ministère des Finances forecasts are based on various external factors, including changes in the economic situation of Québec’s main trading partners, monetary policies, financial markets, oil prices and the evolution of the pandemic worldwide.
| ■ | Economic situation of Québec’s main trading partners |
The Québec economy is open to the world, so economic activity is affected by the economic situation of Québec’s main trading partners.
| — | In Canada, real GDP growth is expected to reach 3.8% in 2022, 2.3% in 2023 and 1.7% per year from 2024 to 2026. These are higher growth rates than those recorded in Québec. |
| — | In 2021, the economic recovery was stronger in Québec (+5.6%) than in Canada (+4.5%). |
| ‒ | In fact, the rebound in real GDP in Canada in 2021 was held back by several one-time events such as the forest fires in western Canada and the floods in British Columbia. In addition, the global shortage of microchips has forced the temporary closure of some automobile manufacturing plants in Ontario. |
| ‒ | Thus, the recovery period, which will continue into 2022 in Canada, will result in greater economic growth than in Québec. |
| — | In the United States, growth is expected to reach 2.8% in 2022, 1.8% in 2023, 1.9% in 2024, 1.9% in 2025 and 1.8% in 2026. |
| — | Global economic activity is expected to stand at 3.1% in 2022, 3.1% in 2023, 3.3% in 2024 and 3.2% in 2025 and 2026. |
TABLE 7
Economic growth
(real GDP, percentage change)
| 2021 | 2022 | 2023 | 2024 | 2025 | 2026 | |||||||||||||||||||
| Québec | 5.6 | 3.4 | 1.7 | 1.5 | 1.5 | 1.5 | ||||||||||||||||||
| Ontario(1) | 4.3 | 3.8 | 2.3 | — | — | — | ||||||||||||||||||
| Canada | 4.5 | 3.8 | 2.3 | 1.7 | 1.7 | 1.7 | ||||||||||||||||||
| United States | 5.7 | 2.8 | 1.8 | 1.9 | 1.9 | 1.8 | ||||||||||||||||||
| World | 6.1 | 3.1 | 3.1 | 3.3 | 3.2 | 3.2 | ||||||||||||||||||
| (1) | For 2022 and 2023, this is a Ministère des Finances du Québec survey as at June 21, 2022, which includes the forecasts of 9 private sector institutions. |
Sources: Institut de la statistique du Québec, Ontario Ministry of Finance, Statistics Canada, International Monetary Fund, IHS Markit, Datastream, Bloomberg, Eurostat and Ministère des Finances du Québec.
| | | Economic and Financial Forecasts | 21 |
| ■ | Monetary policies and financial markets |
§ Policy interest rate in the United States and Canada
The Bank of Canada has raised its policy interest rate by 225 basis points since March 2022, to 2.50% in July 2022.5 The policy interest rate had remained at 0.25% since March 2020, that is, since the beginning of the pandemic.
| — | Against a backdrop of strong inflationary pressures, the Canadian policy interest rate is expected to be raised by a total of 250 basis points in 2022. This will bring it to 2.75% by the end of 2022, which is in the top half of the Bank of Canada’s neutral rate estimate range (between 2% and 3%). In addition, the Bank of Canada began reducing the size of its balance sheet in April 2022. |
The U.S. Federal Reserve has raised its policy interest rate by 150 basis points since March 2022, bringing it to the 1.50%-1.75% range in June 2022. The Federal Reserve has signaled that it will make several additional rate hikes this year in response to high inflation.
| — | As such, the U.S. policy interest rate is expected to be raised by a total of 275 basis points in 2022. This would put it within the 2.75%-3.00% range at the end of this year. The Federal Reserve’s balance sheet reduction, which began in June 2022, will be in addition to the interest rate hikes. |
§ Bond yields
Since late 2021, bond yields have risen sharply in the majority of advanced economies, with the Canadian 10-year yield exceeding 3% during the spring of 2022. This increase is primarily due to a recalibration of financial market expectations regarding the pace of policy interest rate increases.
| — | Bond yields are projected to increase slightly over the next few quarters. They are expected to move downward during 2023 with the expected moderation in financial market expectations of future policy interest rate changes. |
§ Canadian dollar
The Canadian dollar has generally fluctuated within a range of 78 to 80 U.S. cents since the beginning of 2022.
| — | The Canadian currency is expected to continue to move near these levels over the next few quarters as the Bank of Canada and the U.S. Federal Reserve are expected to tighten monetary policy at roughly the same pace. |
| — | Moreover, episodes of volatility in the financial markets could support the U.S. dollar at the expense of the Canadian dollar, among others. |
| 5 | The financial forecast for the pre-election report was completed on July 8, 2022, prior to the Bank of Canada’s announcement of July 13, 2022. |
| 22 | Pre-election Report on the State of Québec’s Public Finances – August 2022 | | |
| ■ | Oil prices |
Oil prices have risen sharply since the end of 2021, when the price of West Texas Intermediate (WTI) rose from an average of US$71 per barrel in December 2021 to an average of US$114 in June 2022.
| — | Oil prices were already benefiting from a supply deficit in the global market. The war in Ukraine and concerns about global oil supply have further supported prices in recent months. |
Oil prices remain high but are expected to begin a gradual decline in the second half of 2022 with the anticipated increase in production from countries outside the Organization of the Petroleum Exporting Countries (OPEC).
| — | Nonetheless, there is still considerable uncertainty about the evolution of oil prices. |
TABLE 8
Canadian financial markets
(average annual percentage rates, unless otherwise indicated, end-of-year data in brackets)
| 2021 | 2022 | 2023 | 2024 | 2025 | 2026 | |||||||||||||||||||
| 0.3 | 1.6 | 2.8 | 2.8 | 2.8 | 2.8 | |||||||||||||||||||
| Overnight rate target | (0.3 | ) | (2.8 | ) | (2.8 | ) | (2.8 | ) | (2.8 | ) | (2.8 | ) | ||||||||||||
| 0.1 | 1.6 | 2.7 | 2.7 | 2.7 | 2.7 | |||||||||||||||||||
| 3-month Treasury bill | (0.2 | ) | (2.7 | ) | (2.7 | ) | (2.7 | ) | (2.7 | ) | (2.7 | ) | ||||||||||||
| 1.4 | 2.9 | 3.1 | 3.0 | 3.0 | 3.0 | |||||||||||||||||||
| 10-year bond | (1.5 | ) | (3.3 | ) | (3.0 | ) | (3.0 | ) | (3.0 | ) | (3.0 | ) | ||||||||||||
| 79.7 | 79.0 | 79.9 | 80.0 | 80.0 | 80.0 | |||||||||||||||||||
| Canadian dollar (in U.S. cents) | (78.5 | ) | (79.5 | ) | (80.0 | ) | (80.0 | ) | (80.0 | ) | (80.0 | ) | ||||||||||||
| 1.25 | 1.27 | 1.25 | 1.25 | 1.25 | 1.25 | |||||||||||||||||||
| U.S. dollar (in Canadian dollar) | (1.27 | ) | (1.26 | ) | (1.25 | ) | (1.25 | ) | (1.25 | ) | (1.25 | ) | ||||||||||||
| 71 | 104 | 94 | 87 | 79 | 71 | |||||||||||||||||||
| Brent crude oil (in U.S. dollars per barrel) | (74 | ) | (100 | ) | (90 | ) | (84 | ) | (76 | ) | (69 | ) | ||||||||||||
| 68 | 100 | 90 | 83 | 75 | 68 | |||||||||||||||||||
| WTI crude oil (in U.S. dollars per barrel) | (71 | ) | (96 | ) | (86 | ) | (80 | ) | (72 | ) | (66 | ) | ||||||||||||
| 54 | 87 | 77 | 69 | 61 | 54 | |||||||||||||||||||
| WCS crude oil (in U.S. dollars per barrel) | (55 | ) | (83 | ) | (73 | ) | (66 | ) | (58 | ) | (52 | ) | ||||||||||||
Sources: Statistics Canada, Bloomberg and Ministère des Finances du Québec.
| ■ | Factors internal to the Québec economy |
Economic forecasts are based on the determination of the elements of aggregate domestic demand as well as the external sector. The latter reflects, among other things, the ability of Québec businesses to take advantage of demand from Québec’s main trading partners.
Moreover, the situation of the labour market is a determining factor in the evolution of the Québec economy.
| | | Economic and Financial Forecasts | 23 |
| ■ | Domestic demand |
Domestic demand consists of the sum of the following components:
| — | household consumption expenditure; |
| — | residential investment; |
| — | non-residential business investment; |
| — | expenditure on goods and services and governments’ investments. |
Following growth of 5.7% in real terms in 2021, domestic demand is forecast to progress to 3.8% in 2022 and 1.5% in 2023. Thereafter, growth will decelerate to 1.2% in 2024, 1.3% in 2025 and 1.1% in 2026.
| § | Household consumption expenditure |
Following a gain of 5.8% in real terms in 2021, household consumption expenditure is forecast to grow to 5.3% in 2022, 2.3% in 2023 and 1.5% annually from 2024 to 2026.
| — | In the short term, the withdrawal of health measures will encourage spending on services. In addition, households will continue to spend the savings accumulated since the beginning of the pandemic, which will support their spending. Furthermore, wages and salaries will increase, supported by the robust labour market and the labour shortage. |
| — | However, prices, especially for gasoline, remain high, but should gradually slow down in the second half of 2022. |
| — | Also, rising interest rates will limit the volume of goods and services consumed by households. |
| § | Residential investment |
In 2021, residential investment grew by 12.7% in real terms to a record $33.2 billion. After this record year, residential investment is expected to decline by 2.6% in 2022 and 3.0% in 2023. Despite these declines, the level of investment will remain high from a historical perspective. From 2024 to 2026, residential investment is expected to grow by an average of 0.1% annually.
| — | In the short term, the decline in affordability due to rising house prices and mortgage interest rates as well as stricter mortgage rules will help to moderate the residential market. |
| — | However, some elements will continue to support economic activity in this sector. In particular, the inventory of unsold new properties is low, which will support residential construction. In addition, a strong labour market and a pickup in immigration will continue to support housing demand. |
| § | Non-residential business investment |
After a 3.3% growth in 2021, non-residential business investment is expected to grow by 4.9% in 2022 and 3.6% in 2023. Growth in this type of investment will slow to 2.1% in 2024, 2.1% in 2025 and 2.2% in 2026.
| 24 | Pre-election Report on the State of Québec’s Public Finances – August 2022 | | |
Different factors will drive the increase in non-residential business investment, including:
| — | rising demand, which will put pressure on production capacity; |
| — | the labour shortage, which will encourage entrepreneurs to invest in machinery and equipment in order to increase their productivity and automate production; |
| — | the transition to a low-carbon economy, which will have a positive impact on business expenditure; |
| — | the digital shift in the economy, which will boost spending on intellectual property products. |
| § | Expenditure on goods and services and governments’ investments |
After growing by 4.7% in 2021, the value of governments’ investments is expected to increase by 9.5% in 2022 and 3.7% in 2023. Growth will continue over the next few years (+0.8% in 2024 and +0.4% in 2025) before declining by 0.4% in 2026. The value of governments investments in Québec is therefore expected to reach $23.8 billion in nominal terms in 2026.
| — | In particular, investments under the 2022-2032 QIP6 will amount to $142.5 billion, of which $80 billion is planned for the first five years, that is, from 2022-2023 to 2026-2027. |
| — | In addition, the federal government’s Investing in Canada Infrastructure Program and the high levels of investment planned in Québec’s major municipalities, including Montréal, Québec and Laval, will also support the growth in investments. |
Through their purchases of goods and services, the various levels of government will also contribute to the growth in economic activity.
| ■ | Job creation, unemployment and the workforce |
After an annual increase of 169 400 jobs in 2021, job creation will continue in the next few years.
| — | In 2022, 128 000 jobs will be created (+3.0%), then 49 500 in 2023 (+1.1%), 26 200 in 2024 (+0.6%), 23 500 in 2025 (+0.5%) and 21 700 in 2026 (+0.5%). |
Job creation will be driven by continued economic growth. In addition, the lifting of most public health restrictions will result in job gains in the industries that were hit the hardest by the pandemic. However, the labour shortage will slow the pace of hiring in the coming years.
The strong demand for labour will result in a decline in the unemployment rate, which is expected to fall from an average of 6.1% in 2021 to 4.2% in 2022, 3.9% in 2023, 3.8% in 2024, 3.7% in 2025 and 3.6% in 2026.
Despite the positive outlook for the labour market, the aging of the population is limiting the growth of the labour force and increasing pressures on the labour market and production.
| 6 | The 2022-2032 Québec Infrastructure Plan is available at: www.tresor.gouv.qc.ca/fileadmin/PDF/budget_depenses/22-23/6-Quebec_Infrastructure_Plan.pdf. |
| | | Economic and Financial Forecasts | 25 |
| ■ | External sector |
Following an increase of 4.6% in 2021 in real terms, export growth is expected to reach 2.1% in 2022, 3.0% in 2023, 2.7% in 2024, 2.6% in 2025, and 2.2% in 2026.
| — | Exports will benefit from an increase in external demand, particularly in the United States. |
| — | Québec will also benefit from a recovery in tourism activities, which will fuel growth in international service exports. |
Import growth is expected to reach 4.2% in 2022, 2.1% in 2023, 1.7% in 2024, 2.2% in 2025 and 1.3% in 2026.
| — | This reflects continued growth in domestic demand, particularly household consumption and investment in machinery and equipment. In addition, imports will be stimulated by a rebound in travel spending by Quebecers. |
In the short term, however, supply chain disruptions will continue to weigh on the external sector. In addition, Russia’s invasion of Ukraine will limit global trade.
| 26 | Pre-election Report on the State of Québec’s Public Finances – August 2022 | | |
| q | Risks and sensitivity analysis for economic forecasts |
| ■ | Risks |
The financial market and economic forecasts are based on several assumptions. Associated with some of these are risks that could affect the global economic and financial scenario and the anticipated developments in the Québec economy.
Since the publication of the Québec Budget Plan – March 2022, the risk of a recession has increased due to rising prices and interest rates. However, the probability of a recession occurring in Québec in the coming quarters remains relatively moderate.
Moreover, the risks outlined in the Québec Budget Plan – March 2022, remain present.7
| — | Given the Québec economy’s high degree of openness to trade, Québec’s economic variables could be influenced by several external factors, such as: |
| — | the war in Ukraine; |
| — | high inflation that persists longer than expected; |
| — | monetary tightening at a different rate than expected; |
| — | continued supply chain disruptions; |
| — | a different evolution of oil prices; |
| — | a sharper-than-expected slowdown in the Chinese economy; |
| — | the pandemic’s evolution on a global scale. |
| — | Other risks or events are internal. They could lead to changes in certain economic variables in Québec that are different from what was anticipated, such as: |
| — | a faster and more pronounced adjustment in the real estate sector in Québec and Canada; |
| — | a slower-than-expected recovery in international immigration; |
| — | the labour shortage. |
| ■ | Sensitivity analysis |
Economic forecasts take into account certain elements of uncertainty. The realization of these uncertainties may lead to different results than those forecast.
| ■ | Sensitivity of Québec’s GDP to external variables |
The Québec economy is characterized by a high degree of openness to trade. Therefore, Québec’s economic variables are influenced by several external factors.
| — | The most important ones are related to the economic activity of Québec’s main trading partners, namely the United States and the Canadian provinces. |
| 7 | The main risks that could influence the economic forecast scenario are presented in the Québec Budget Plan – March 2022, pages H.59 to H.62. |
| | | Economic and Financial Forecasts | 27 |
| ■ | Impacts of external variables on the Québec economy |
The results of a sensitivity analysis conducted with a structural vector autoregression model8 on the basis of historical data show that a 1% variation in U.S. real GDP entails on average a change of 0.45% in Québec’s real GDP.
| — | The maximum effect is felt two quarters later. |
Moreover, this model shows that a 1% variation in Ontario’s real GDP gives rise on average to a change of 0.42% in Québec’s real GDP.
| — | The maximum effect is felt one quarter later. |
Ontario is the Canadian province with which Québec has the most commercial ties, in addition to having a similar economic structure.
In 2018, exports to Ontario accounted for 59% of Québec’s interprovincial exports. Also, the effects measured for Ontario and the United States are not additive.
TABLE 9
Impact of external shocks on Québec’s real
GDP growth rate
| External shocks of 1% | Maturity(1) (quarters) | Impact on Québec’s real GDP (percentage point) | |
| U.S. real GDP | 2 | 0.45 | |
| Ontario real GDP | 1 | 0.42 |
| (1) | Maturity corresponds to the number of quarters needed to record the greatest impact on Québec’s real GDP, presented in the right-hand column. |
Sources: Institut de la statistique du Québec, Statistics Canada, Ontario Ministry of Finance, IHS Markit, Bloomberg and Ministère des Finances du Québec.
| 8 | This is an econometric technique used to estimate, from a large number of observations, the extent to which fluctuations in one economic variable influence another. |
| 28 | Pre-election Report on the State of Québec’s Public Finances – August 2022 | | |
| 1.3 | Main adjustments since March 2022 |
Overall, from 2022 to 2026, the economic forecasts underlying the financial framework in the pre-election report are comparable to those in the Québec Budget Plan − March 2022.
| — | Economic growth in Québec is expected to reach 3.4% in 2022 and 1.7% in 2023. |
| — | For 2022, this is an upward adjustment of 0.7 percentage points from the March 2022 forecast. The year 2023, on the other hand, has been adjusted downward (−0.3 percentage points from March 2022). The growth forecast for 2024 to 2026 remains unchanged. |
The Ministère des Finances’ growth forecasts in the pre-election report are similar to those of the private sector. In June 2022, the private sector revised its economic forecast from the March 2022 forecast.
| — | In June 2022, private sector economists anticipated, on average, an increase in real GDP of 3.2% for 2022. This is an upward revision of 0.1 percentage points compared to what they had forecast in March 2022. |
| — | Remember that this forecast is similar to that of the Ministère des Finances (+3.4%). |
| — | Also in June 2022, private sector economists anticipated an increase in real GDP of 1.7% for 2023, which represents a downward adjustment of 0.8 percentage points to what they had forecast in March 2022. |
| — | This forecast is equivalent to that of the Ministère des Finances (+1.7%). |
TABLE 10
Economic outlook according to the Ministère des Finances du Québec and the private sector
(real GDP, percentage change)
| 2021 | 2022 | 2023 | 2024 | 2025 | 2026 | Average 2022-2026 | ||||||||||||||||||||||
| Ministère des Finances du Québec | ||||||||||||||||||||||||||||
| – 2022-2023 budget | 6.3 | 2.7 | 2.0 | 1.5 | 1.5 | 1.5 | 1.8 | |||||||||||||||||||||
| – 2022 pre-election report | 5.6 | 3.4 | 1.7 | 1.5 | 1.5 | 1.5 | 1.9 | |||||||||||||||||||||
| Private sector average | ||||||||||||||||||||||||||||
| – March 2022(1) | 6.2 | 3.1 | 2.5 | 1.7 | 1.5 | 1.6 | 2.1 | |||||||||||||||||||||
| – June 2022(2) | 6.1 | 3.2 | 1.7 | 1.6 | 1.6 | 1.5 | 1.9 | |||||||||||||||||||||
Note: Totals may not add due to rounding.
| (1) | Ministère des Finances du Québec survey as at March 8, 2022, which includes the forecasts of 11 private sector institutions. |
| (2) | Ministère des Finances du Québec survey as at June 21, 2022, which includes the forecasts of 11 private sector institutions. |
| Source: | Ministère des Finances du Québec. |
| | | Economic and Financial Forecasts | 29 |
| 2. | Financial framework |
| 2.1 | Multi-year budgetary outlook |
The Pre-election Report on the State of Québec’s Public Finances – August 2022 presents the revenue and expenditure outlook for the Québec government until 2026-2027.
Revenue amounts to $144.5 billion in 2022-2023, with growth of 3.6%. It will reach 2.9% in 2023-2024.
| — | From 2021-2022 to 2026-2027, the annual growth in own-source revenue will reach 6.2% on average. |
Total expenditure9 amounts to $138.3 billion in 2022-2023, with growth of 9.0%.10 It will reach 3.7% in 2023-2024.
| — | From 2021-2022 to 2026-2027, the annual growth in expenditure will reach 5.7% on average. |
The change in revenue and expenditure takes into account the fiscal measures and budgetary initiatives that have been announced since the 2022-2023 budget.
Expenditure associated with COVID-19 support and recovery measures totals $2.4 billion in 2022-2023.
| — | The cost of these temporary measures, which fade as of 2023-2024, is presented separately from expenditure to isolate their cyclical impact on the growth in expenditure. |
The financial framework includes a provision for economic risks and other support and recovery measures totalling $2.0 billion per year as of 2022-2023.
| — | These provisions cover various risks that could affect the expenditure or revenue forecast in the financial framework, such as increased expenditures and debt service due to inflation and rising interest rates, or a decline in revenue related to the economic consequences of the ongoing war in Ukraine or the changing epidemiological situation of COVID-19. |
Based on the requirements of the Balanced Budget Act, the budget balance before use of the stabilization reserve shows a deficit of less than $2.0 billion between 2022-2023 and 2026-2027.
| — | Excluding the provision for economic risks and other support and recovery measures, the budgetary balance, after deposits of dedicated revenues in the Generations Fund, is achieved over the entire horizon of the financial framework. |
| 9 | Expenditure before taking into account expenditure associated with COVID-19 support and recovery measures. |
| 10 | Compared with the 2022-2023 budget, this growth is higher by 4.2 percentage points. This is primarily due to lower-than-expected expenditures in 2021-2022. |
| | | Financial Framework | 31 |
TABLE 11
Financial framework from 2021-2022 to 2026-2027
(millions of dollars)
| 2021- 2022- | 2022- 2023- | 2023- 2024- | 2024- 2025- | 2025- 2026- | 2026- 2027- | 2021- 2027(1) | ||||||||||||||||||||||
| Revenue | ||||||||||||||||||||||||||||
| Personal income tax | 41 285 | 43 414 | 45 272 | 46 660 | 48 519 | 50 278 | ||||||||||||||||||||||
| Contributions for health services | 7 367 | 7 784 | 7 964 | 8 187 | 8 393 | 8 603 | ||||||||||||||||||||||
| Corporate taxes | 12 927 | 11 925 | 11 867 | 12 803 | 13 536 | 14 131 | ||||||||||||||||||||||
| School property tax | 1 081 | 1 048 | 1 106 | 1 187 | 1 251 | 1 299 | ||||||||||||||||||||||
| Consumption taxes | 24 673 | 27 345 | 28 140 | 29 006 | 29 743 | 30 475 | ||||||||||||||||||||||
| Duties and permits | 6 049 | 5 518 | 5 494 | 5 544 | 5 678 | 5 810 | ||||||||||||||||||||||
| Miscellaneous revenue | 10 902 | 11 629 | 12 450 | 13 061 | 13 483 | 14 051 | ||||||||||||||||||||||
| Government enterprises | 5 967 | 6 207 | 6 688 | 7 040 | 6 713 | 6 994 | ||||||||||||||||||||||
| Own-source revenue | 110 251 | 114 870 | 118 981 | 123 488 | 127 316 | 131 641 | ||||||||||||||||||||||
| % change | 20.0 | 4.2 | 3.6 | 3.8 | 3.1 | 3.4 | 6.2 | |||||||||||||||||||||
| Federal transfers | 29 141 | 29 600 | 29 631 | 29 921 | 31 813 | 32 345 | ||||||||||||||||||||||
| % change | –5.1 | 1.6 | 0.1 | 1.0 | 6.3 | 1.7 | 0.9 | |||||||||||||||||||||
| Total revenue | 139 392 | 144 470 | 148 612 | 153 409 | 159 129 | 163 986 | ||||||||||||||||||||||
| % change | 13.7 | 3.6 | 2.9 | 3.2 | 3.7 | 3.1 | 5.0 | |||||||||||||||||||||
| Expenditure | ||||||||||||||||||||||||||||
| Portfolio expenditures | –118 272 | –128 154 | –134 472 | –138 370 | –144 246 | –147 959 | ||||||||||||||||||||||
| % change | 11.4 | 8.4 | 4.9 | 2.9 | 4.2 | 2.6 | 5.7 | |||||||||||||||||||||
| Debt service | –8 619 | –10 189 | –9 000 | –9 888 | –9 990 | –10 808 | ||||||||||||||||||||||
| % change | 12.1 | 18.2 | –11.7 | 9.9 | 1.0 | 8.2 | 5.8 | |||||||||||||||||||||
| Total expenditure | –126 891 | –138 343 | –143 472 | –148 258 | –154 236 | –158 767 | ||||||||||||||||||||||
| % change | 11.5 | 9.0 | 3.7 | 3.3 | 4.0 | 2.9 | 5.7 | |||||||||||||||||||||
| Expenditure associated with COVID-19 support and recovery measures | –9 178 | –2 355 | –462 | –18 | — | — | ||||||||||||||||||||||
| Provision for economic risks and other support and recovery measures | — | –2 000 | –2 000 | –2 000 | –2 000 | –2 000 | ||||||||||||||||||||||
| SURPLUS | 3 323 | 1 772 | 2 678 | 3 133 | 2 893 | 3 219 | ||||||||||||||||||||||
| BALANCED BUDGET ACT | ||||||||||||||||||||||||||||
| Deposits of dedicated revenues in the Generations Fund | –3 617 | –3 428 | –3 955 | –4 546 | –4 800 | –5 163 | ||||||||||||||||||||||
| BUDGETARY BALANCE BEFORE USE OF THE STABILIZATION RESERVE | –294 | –1 656 | –1 277 | –1 413 | –1 907 | –1 944 | ||||||||||||||||||||||
| Use of the stabilization reserve | 294 | 927 | — | — | — | — | ||||||||||||||||||||||
| BUDGETARY BALANCE(2) | — | –729 | –1 277 | –1 413 | –1 907 | –1 944 | ||||||||||||||||||||||
Note: Totals may not add due to rounding.
| (1) | Average annual growth rate, corresponding to the geometric mean over six years, from 2021-2022 to 2026-2027. |
| (2) | Budgetary balance within the meaning of the Balanced Budget Act after use of the stabilization reserve. |
| 32 | Pre-election Report on the State of Québec’s Public Finances – August 2022 | | |
| 2.2 | Main variables |
TABLE 12
Main variables of Québec’s financial framework
| Variables | |
| REVENUE | |
| Own-source revenue excluding revenue from government enterprises | |
| – Personal income tax | – Wages and salaries – Employment insurance – Pension income – Self-employed income – Capital gains – Interest income |
| – Contributions for health services | – Wages and salaries |
| – Corporate taxes | – Net operating surplus of corporations – Gross operating surplus of corporations – CPI |
| – Sales tax | – Consumption excluding food products and housing – Residential investment |
| – Specific taxes (fuel, tobacco products and alcoholic beverages) | – Per capita household disposable income – CPI – Gas prices |
| Own-source revenue from government enterprises | |
| – Hydro-Québec | – Normal winter temperatures, CPI and volume price of energy on external markets |
| – Loto-Québec | – Consumption patterns of customers |
| – Société des alcools du Québec | – Consumption patterns of customers |
| – Société québécoise du cannabis | – Consumption patterns of customers |
| – Investissement Québec | – Economic situation and anticipated returns on investment projects |
| Revenue from federal transfers | |
| – Equalization | – Canada’s nominal GDP – Population of the provinces – Basic federal tax – Corporate taxable income – Revenue from natural resources |
| – Health transfers | – Canada’s nominal GDP – Population of the provinces – Basic federal tax |
| – Transfers for post-secondary education and other social programs | – Population of the provinces – Basic federal tax |
| – Other programs | – Agreements with the federal government (e.g., labour market agreements and infrastructure agreements) |
| EXPENDITURE | – Budgetary policy directions, including budgetary measures – Program renewal costs: ▪ demographics ▪ prices (inflation, salary increases for government employees) |
| DEBT SERVICE | – Debt level – Interest rate – Returns on the Retirement Plans Sinking Fund (RPSF) |
| DEBT | – Budgetary balance – Capital investments – Loans, investments and advances – Deposits made annually in the Generations Fund |
| INFRASTRUCTURE | – Québec Infrastructure Plan (QIP) |
| | | Financial Framework | 33 |
| 2.3 | Assumptions, risks and margins for prudence |
The Ministère des Finances’ forecasts rely on economic and budgetary assumptions. For example, Québec’s real GDP forecast takes into account certain external factors, such as the economic growth of Québec’s major trading partners, exchange rates and oil prices, and internal factors, such as changes in domestic demand.
Certain risks are associated with taking into account these assumptions. The sensitivity analysis is carried out to evaluate the impact of those risks on the forecasts and to present the estimated repercussions of a variation in any of the assumptions used to establish the financial framework.
Tables 13 and 14 provide the assumptions related to the financial framework as well as the risks and their effects.
TABLE 13
Main assumptions of Québec’s financial framework
| Assumptions | |
| ECONOMIC GROWTH | – Moderation of domestic demand growth, including: ▪ expected deceleration in growth of household consumption expenditure and non-residential business investment ▪ slowdown in residential sector activity ▪ maintenance of a high level of investment by governments – The vigour of the labour market will continue, but aging demographics will add to pressures on employment and the unemployment rate – Slowdown in export and import growth – Additional hike in policy interest rate in Canada and the U.S. by the end of 2022 – Rise in U.S. and Canadian bond yields – Canadian dollar remains near 80 U.S. cents – Decrease in oil prices starting in the second half of 2022 – Moderation in global economic growth in 2022 and 2023 relative to 2021 – Tightening of monetary policy in several advanced economies to combat high inflation |
| 34 | Pre-election Report on the State of Québec’s Public Finances – August 2022 | | |
| q | Risks and sensitivity analysis |
TABLE 14
Main risks to Québec’s financial position
| Risks | Estimated impact in 2022-2023 | Page ref. | |
| Financial framework | Economic variables | ||
| Impact of external variables on the Québec economy | |||
| – Variation of 1 percentage point in the U.S. real GDP | Impact of 0.45 percentage points on Québec’s real GDP | 28 | |
| – Variation of 1 percentage point in Ontario’s real GDP | Impact of 0.42 percentage points on Québec’s real GDP | 28 | |
| Own-source revenue | |||
| Global slowdown | |||
| – Variation of 1 percentage point in Québec’s nominal GDP growth (equivalent to a 1 percentage point variation in the CPI growth) | Impact of $1.0 billion on own-source revenue(1) | 52 | |
| – Typical recession | Impact of $8.3 billion on own-source revenue(1) | ||
| Government enterprises | |||
| – Variation of 1 °C in winter temperatures compared to normal temperatures | Impact of $120 million(2) on Hydro-Québec’s net earnings | 53 | |
| Federal transfers | |||
| – Variation of 0.1 percentage point in the proportion of Québec’s population in Canada | Impact of $200 million on federal transfers | 58 | |
| Expenditure | Portfolio expenditures | ||
| – Variation of 1 percentage point in the total population | Impact of $1 020 million on expenditure | 72 | |
| – Additional variation of 1 percentage point in costs related to technology in the health sector | Impact of $385 million on expenditure | 70 | |
| – Variation of 1 percentage point in general level of prices | Impact of $570 million on expenditure | 72 | |
| Public capital investment completion rate for a given year (5% difference) | Impact of $82 million per year on expenditure (depreciation and interest) | ||
| Environmental disaster | Undetermined impact | ||
| Unforeseen expenditure under government programs | Undetermined impact | ||
| Debt service | |||
| – Variation of 1 percentage point in interest rates(3) | Impact of $553 million on expenditure | 74 | |
| – Variation of 1 percentage point in returns on the Retirement Plans Sinking Fund (RPSF)(4) | Impact of $30 million on expenditure | 74 |
| (1) | Own-source revenue excluding revenue from government enterprises. |
| (2) | Estimated impact for 2023. |
| (3) | Ultimately, in the fifth year, the impact of a greater-than-expected variation in interest rates of 1 percentage point would result in a variation in debt service of over $1.8 billion. |
| (4) | Ultimately, in the fifth year, the impact of a variation of 1 percentage point in returns on the RPSF would result in a variation in debt service of $178 million. |
| | | Financial Framework | 35 |
| ■ | Expenditure shortfall |
The multi-year expenditure target is put into perspective with the cost of renewing government programs to control the existing annual gap, if any.11
If the multi-year portfolio expenditure target is below government program renewal costs, priorities must be established and choices involving measures to control spending, either by a reallocation or an increase in the expenditure target, could be implemented to reduce, even eliminate, the shortfall to be offset.
Based on the financial framework of the 2022-2023 budget and the adjustments that have been made since then, the gap between government program renewal costs and the expenditure target is non-existent for the next three years.
TABLE 15
Shortfall for portfolio expenditures
(millions of dollars)
| 2022-2023 | 2023-2024 | 2024-2025 | ||||||||||
| Cost of renewing government programs | 128 154 | 134 472 | 138 370 | |||||||||
| Portfolio expenditure target | 128 154 | 134 472 | 138 370 | |||||||||
| SHORTFALL TO BE RESOLVED | — | — | — | |||||||||
| 11 | Additional information on the management of gaps between the cost of renewing government programs and the multi-year expenditure target is presented in the assumptions for portfolio expenditures on pages 65 and 66. |
| 36 | Pre-election Report on the State of Québec’s Public Finances – August 2022 | | |
| q | Margins for prudence |
The provisions built into the financial framework total $11.8 billion by 2026-2027. These provisions cover risks that could influence the financial framework and thus respond to either an unanticipated decline in revenue or an unanticipated growth in expenditure.
The financial framework includes a provision of $2.0 billion in 2022-2023 to mitigate potential economic risks and fund additional support and recovery measures that may be required. The inclusion of such a provision is necessary due to the current economic, public health, and geopolitical risks.
| — | Indeed, the geopolitical tensions arising from the war in Ukraine represent one factor that could influence global economic developments, particularly in Europe, as well as changes in energy and food prices. |
| — | Changes in interest rates could further impact the economic outlook and developments in the financial markets. In addition, the labour shortage and disturbances seen worldwide, such as supply chain disruptions, will continue to exert inflationary pressures and could weigh on economic growth. |
| — | In addition, despite the lifting of the public health emergency, the global epidemiological situation relating to COVID-19 is currently experiencing some turbulence. In the event of a deterioration of the public health situation in Québec, the provision allows the government to ensure, among other things, the holding of vaccination and testing activities and the addition of protective equipment and staff without deteriorating the budgetary balance. To address this risk, $1.7 billion is being earmarked in 2022-2023 from this reserve. In addition, this amount will be used to fund measures announced on July 22 for health care employees as Québec deals with the seventh wave of the pandemic. |
From 2023-2024 to 2026-2027, the provisions for economic risks and other support and recovery measures were increased since the 2022-2023 budget. For example, they could be used to offset the repercussions of a recession on the financial framework.
| — | Like several advanced economies, Québec is not immune to an economic and financial recession. The COVID-19 pandemic, the expansionary fiscal policies of governments, the synchronized rebound in global demand and Russia’s invasion of Ukraine have led to a significant increase in inflation. As a result, central banks have begun to tighten monetary policy and reduce the size of their balance sheets. The persistence of inflation and the possibility that central banks may have to rise interest rates above the equilibrium neutral rates to reduce inflation substantially increase the risk of a recession. Moreover, data on the economic situation in Québec is currently favourable. |
TABLE 16
Margins for prudence
(millions of dollars)
| 2022-2023 | 2023-2024 | 2024-2025 | 2025-2026 | 2026-2027 | Total | |||||||||||||||||||
| Contingency Fund reserve | 200 | 400 | 400 | 400 | 400 | 1 800 | ||||||||||||||||||
| Provision for economic risks and other support and recovery measures | 2 000 | 2 000 | 2 000 | 2 000 | 2 000 | 10 000 | ||||||||||||||||||
| TOTAL | 2 200 | 2 400 | 2 400 | 2 400 | 2 400 | 11 800 | ||||||||||||||||||
| | | Financial Framework | 37 |
| 2.4 | Main adjustments since March 2022 |
This section summarizes the main revisions of the financial framework since the publication of the 2022-2023 budget, in March 2022.
| q | Change in the budgetary situation in 2021-2022 |
Preliminary estimates for fiscal 2021-2022 show a decrease in the budget deficit of $7.1 billion before use of the stabilization reserve compared to what was forecast in March 2022. These adjustments are due to:
| — | a $3.9-billion increase in own-source revenue excluding revenue from government enterprises, stemming mainly from tax revenues related to the 1.2-percentage-point upward adjustment to nominal GDP in 2021, including: |
| — | $2.2 billion in personal income tax, primarily due to higher-than-expected levels of source deductions and capital gains reported on tax returns for the 2021 taxation year, |
| — | $943 million in corporate taxes, an increase that is due in part to a higher net operating surplus of corporations in 2021; |
| — | a $473-million increase in revenue from government enterprises, mainly due to higher results from Hydro-Québec as a result of the impact of the cold winter of 2022; |
| — | a $406-million decrease in revenue from federal transfers due, for the most part, to the pace of completion of infrastructure projects funded by the federal government; |
| — | lower-than-expected portfolio expenditures of $3.6 billion, including: |
| — | $625 million in the Santé et Services sociaux portfolio, primarily due to lower payroll cost than forecast in the 2022-2023 budget, |
| — | $428 million in the Éducation portfolio, due to lower-than-expected expenditure for school service centres, |
| — | $385 million in the Enseignement supérieur portfolio, primarily due to lower-than-anticipated CEGEP expenditure and the cost of the loans and grants program, |
| — | $459 million in the Économie et Innovation portfolio, a decrease that is partly attributable to lower-than-expected expenditure by the Economic Development Fund, |
| — | $401 million in the Travail, Emploi et Solidarité sociale portfolio, particularly due to a decrease in the number of people receiving social assistance and the lower-than-expected costs for certain refundable tax credits; |
| — | a $178-million increase in expenditure for debt service due to the increase in interest rates; |
| — | a $135-million increase in expenditure related to COVID-19 support and recovery measures related to higher health costs; |
| 38 | Pre-election Report on the State of Québec’s Public Finances – August 2022 | | |
| — | a $160-million increase in deposits of dedicated revenues in the Generations Fund, mainly due to: |
| — | the $220-million increase in mining revenues reflecting the greater-than-expected effect of higher metal prices in 2020 and 2021, |
| — | the $76-million decrease in investment income, due to the inclusion of lower-than-expected actual income in recent months. |
As a result of these improvements, a budgetary deficit before use of the stabilization reserve of $294 million is projected for 2021-2022 based on the preliminary estimates released on June 30, 2022 in the Monthly Report on Financial Transactions Preliminary at March 31, 2022.
TABLE 17
Adjustments to the 2021-2022 financial framework since March 2022
(millions of dollars)
| 2021-2022 | ||||
| BUDGETARY BALANCE – MARCH 2022(1) | −7 354 | |||
| Own-source revenue | ||||
| – Tax revenue | 3 622 | |||
| – Other revenue | 242 | |||
| Subtotal | 3 864 | |||
| Revenue from government enterprises | 473 | |||
| Total own-source revenue | 4 337 | |||
| Federal transfers | –406 | |||
| Revenue | 3 931 | |||
| Portfolio expenditures | 3 602 | |||
| Debt service | –178 | |||
| Expenditure | 3 424 | |||
| Expenditure associated with COVID-19 support and recovery measures | –135 | |||
| Deposits of dedicated revenues in the Generations Fund | –160 | |||
| TOTAL ADJUSTMENTS | 7 060 | |||
| BUDGETARY BALANCE – AUGUST 2022(1) | –294 | |||
| Notes: | Totals may not add due to rounding. |
Preliminary estimates.
| (1) | Budgetary balance within the meaning of the Balanced Budget Act before use of the stabilization reserve. |
| | | Financial Framework | 39 |
| q | Adjustments in the financial framework from 2022-2023 to 2024-2025 |
The growth in economic activity and the directions taken since the 2022-2023 budget result in adjustments to the government’s financial situation that average $3.4 billion per year from 2022-2023 to 2024-2025.
The financial framework presented takes into account risks related to the economic situation, including the impact of inflation on spending, as well as downward revisions to budget deficits of approximately $4.8 billion in 2022-2023, $2.6 billion in 2023-2024, and $2.3 billion in 2024-2025.
In addition, the provision for economic risks and other support and recovery measures is revised upward by $500 million per year beginning in 2023-2024. The increase in the provision is intended to address the increased risks that could affect the financial framework, such as the impact of an economic slowdown or a recession.
| ■ | Adjustments in the economic and budgetary situation |
Overall, the adjustments related to the economic and budgetary situation total $4.4 billion in 2022-2023, $3.3 billion in 2023-2024 and $3.0 billion in 2024-2025. In particular, these adjustments are attributable to:
| — | positive adjustments to own-source revenue excluding revenue from government enterprises of $4.7 billion in 2022-2023, $5.6 billion in 2023-2024 and $5.7 billion in 2024-2025 owing mainly to the recurrence of higher-than-expected results in 2021-2022 stemming from the good performance of the Québec economy. More specifically, these revisions concern: |
| — | personal income tax and contributions for health services, whose respective average adjustments of $2.8 billion and $510 million per year from 2022-2023 to 2024-2025 are explained, in particular, by the upward adjustment of wages and salaries by 2.6 percentage points in 2022 and 0.7 percentage points in 2023, |
| — | corporate taxes, which are adjusted by an average of $1.0 billion per year from 2022-2023 to 2024-2025 primarily due to the recurrence of better-than-expected results in 2021-2022, |
| — | consumption taxes, which are adjusted by an average of $700 million per year from 2022-2023 to 2024-2025, primarily due to the upward adjustment of household consumption12 by 1.2 percentage points in 2022 and 1.3 percentage points in 2023, |
| — | carbon market revenues, which are adjusted by an average of $194 million per year from 2022-2023 to 2024-2025 primarily due to the more favourable-than-expected recurrence of greenhouse gas (GHG) emission unit prices in 2021-2022, |
| — | other revenues, which include, but are not limited to, duties and permits, the school property tax, and miscellaneous revenue, which are adjusted by an average of approximately $175 million per year from 2022-2023 to 2024-2025; |
| — | upward adjustments in revenue from government enterprises of $579 million in 2022-2023, $755 million in 2023-2024 and $880 million in 2024-2025, primarily related to the increase in the anticipated results of Hydro-Québec following the expected increases in its electricity sales in Québec and in the value of its exports; |
| 12 | Consumption excluding food products and housing. |
| 40 | Pre-election Report on the State of Québec’s Public Finances – August 2022 | | |
| — | an $810-million increase in federal transfers in 2022-2023, which is explained, in particular, by a one-time payment of $450 million to catch up on surgeries, a decrease of $117 million in 2023-2024 and an increase of $803 million in 2024-2025; |
| — | The increase in federal transfers in 2024-2025 is due to additional equalization revenues, in part due to the increase in the envelope across Canada, which grows in line with Canadian nominal GDP. |
| — | an increase in portfolio expenditures of $0.4 billion in 2022-2023, $2.7 billion in 2023-2024 and $3.1 billion in 2024-2025 due to: |
| — | the full funding of renewal costs for existing programs. In fact, there are no remaining expenditure gaps, |
| — | the expected increase in the costs related to the provision of public services, |
| — | annual investments provided for in the Québec Infrastructure Plan (QIP); |
| — | an increase in debt service of $1.3 billion in 2022-2023, $275 million in 2023-2024 and $1.1 billion in 2024-2025 due to higher interest rates, a lower-than-expected return on the Retirement Plans Sinking Fund (RPSF) in 2022-2023 (−4.75% instead of +6.35%) and new actuarial valuations of pension plans; |
| — | a decrease in deposits in the Generations Fund of $17 million in 2022-2023 due to lower investment income, partially offset by higher mining revenues and electricity prices, followed by increases of $20 million in 2023-2024 and $166 million in 2024-2025. |
| | | Financial Framework | 41 |
TABLE 18
Adjustments in the financial framework since March 2022
(millions of dollars)
| 2022-2023 | 2023-2024 | 2024-2025 | ||||||||||
| BUDGETARY BALANCE – MARCH 2022 | –6 450 | –3 900 | –3 750 | |||||||||
| ECONOMIC AND BUDGETARY SITUATION | ||||||||||||
| Own-source revenue excluding revenue from government enterprises | ||||||||||||
| – Personal income tax | 2 267 | 3 075 | 2 987 | |||||||||
| – Contributions for health services | 485 | 508 | 538 | |||||||||
| – Corporate taxes | 1 043 | 957 | 1 027 | |||||||||
| – Consumption taxes | 639 | 699 | 762 | |||||||||
| – Carbon market | 224 | 179 | 179 | |||||||||
| – Other revenue | 72 | 207 | 246 | |||||||||
| Subtotal | 4 730 | 5 625 | 5 739 | |||||||||
| Revenue from government enterprises | 579 | 755 | 880 | |||||||||
| Subtotal – Own-source revenue | 5 309 | 6 380 | 6 619 | |||||||||
| Federal transfers | 810 | –117 | 803 | |||||||||
| Subtotal – Revenue | 6 119 | 6 263 | 7 422 | |||||||||
| Portfolio expenditures | –365 | –2 665 | –3 144 | |||||||||
| Debt service | –1 347 | –275 | –1 095 | |||||||||
| Subtotal – Expenditure | –1 712 | –2 940 | –4 239 | |||||||||
| Deposits of dedicated revenues in the Generations Fund | 17 | –20 | –166 | |||||||||
| TOTAL ADJUSTMENTS IN THE ECONOMIC AND BUDGETARY SITUATION | 4 424 | 3 304 | 3 018 | |||||||||
| INITIATIVES SINCE MARCH 2022 | –130 | –181 | –181 | |||||||||
| Provision for economic risks and other support and recovery measures | 500 | –500 | –500 | |||||||||
| BUDGETARY BALANCE BEFORE USE OF THE STABILIZATION RESERVE | –1 656 | –1 277 | –1 413 | |||||||||
| Use of the stabilization reserve | 927 | — | — | |||||||||
| BUDGETARY BALANCE(1) – AUGUST 2022 | –729 | –1 277 | –1 413 | |||||||||
Note: Totals may not add due to rounding.
| (1) | Budgetary balance within the meaning of the Balanced Budget Act, after use of the stabilization reserve. |
| 42 | Pre-election Report on the State of Québec’s Public Finances – August 2022 | | |
| Information incorporated into the financial framework |
The financial framework presented in the Pre-election Report on the State of Québec’s Public Finances – August 2022 integrates all the information available since the publication of the Québec Budget Plan – March 2022. More specifically, the adjustments to revenue and expenditure take into account, among other things:
| – | preliminary budgetary estimates for 2021-2022; |
| – | recent changes in the economic and budgetary situation in Québec; |
| – | the financial impact of the measures announced in the April and June 2022 information bulletins, including those aimed at harmonizing Québec’s tax system with the changes proposed by the federal government; |
| – | the financial impact of other announcements made by the Québec government since the budget 2022-2023. |
April 29 and June 9, 2022 information bulletins
Since the presentation of the Québec Budget Plan – March 2022, the Ministère des Finances published two information bulletins. These bulletins present the changes that will be made to the Québec tax system in order to harmonize it with the measures proposed by the federal government1 in recent months, including in its April 7 budget. These measures affect the personal and corporate tax systems, as well as the sales tax system. They include:
| – | the introduction of the Tax-Free First Home Savings Account; |
| – | the enhancement of the Home Buyers’ Tax Credit; |
| – | the expansion of eligibility for the small business deduction; |
| – | adjustments to ensure the integrity of the tax system and the use of new international accounting standards for tax purposes, including the application of International Financial Reporting Standards to insurance contracts and the limit on interest deductibility; |
| – | the extension of eligibility for the immediate expensing measure to sole proprietorships and certain partnerships; |
| – | enhancements to accelerated depreciation measures for businesses. |
Moreover, other tax changes were announced, such as:
| – | an easing of the refundable tax credit to foster the retention of experienced workers and of the tax credit regarding persons with a severely limited capacity for employment; |
| – | the renewal of the patronage dividend tax deferral mechanism. |
The financial impact of the measures announced in the information bulletins published since March 2022 totals −$67.2 million in 2022-2023, $193.3 million in 2023-2024 and $200 million in 2024-2025.
| 1 | For more information on the tax changes and measures announced to harmonize Québec’s tax system with the measures proposed by the federal government, see the information bulletins issued on April 29 and June 9, 2022. |
| | | Financial Framework | 43 |
| Information incorporated into the financial framework (cont.) |
Other measures announced since the 2022-2023 budget
The financial framework also incorporates the financial impact of various measures announced since the presentation of the 2022-2023 budget, namely:
| – | the change of purpose of the Bibliothèque Saint-Sulpice to allow it to house the Maison de la chanson et de la musique du Québec; |
| – | the grant to SpaceX to complete high-speed Internet coverage and reduce the monthly subscription cost of the service; |
| – | the reduction in the school tax rate to limit the tax increase to an average of 2% to 3%. |
The financial impact of these measures totals −$130.0 million in 2022-2023, then −$180.6 million in 2023-2024 and in 2024-2025.
Financial impact of the announced measures integrated to the financial framework since the publication of the Québec Budget Plan – March 2022
(millions of dollars)
| 2022-2023 | 2023-2024 | 2024-2025 | 2025-2026 | 2026-2027 | Total | |||||||||||||||||||
| April 29 and June 9, 2022 information bulletins(1) | ||||||||||||||||||||||||
| – Impact on revenue | –63.7 | 203.8 | 216.4 | 268.0 | 258.5 | 882.9 | ||||||||||||||||||
| – Impact on expenditure | –3.5 | –10.5 | –16.4 | –19.1 | –20.5 | –70.0 | ||||||||||||||||||
| Subtotal | –67.2 | 193.3 | 200.0 | 248.9 | 238.0 | 812.9 | ||||||||||||||||||
| Initiatives since March 2022 | ||||||||||||||||||||||||
| – Impact on revenue | –130.0 | –173.4 | –173.4 | –173.4 | –173.4 | –823.6 | ||||||||||||||||||
| – Impact on expenditure | — | –7.2 | –7.2 | –8.8 | –7.3 | –30.5 | ||||||||||||||||||
| Subtotal | –130.0 | –180.6 | –180.6 | –182.2 | –180.7 | –854.1 | ||||||||||||||||||
| TOTAL | –197.2 | 12.7 | 19.4 | 66.7 | 57.3 | –41.2 | ||||||||||||||||||
| (1) | Revisions included in those on the economic and financial situation. |
In addition, on June 29, 2022, the government announced that agreements in principle had been reached with the Fonds de solidarité FTQ, the Mouvement Desjardins and Fondaction to make 3 000 new affordable social housing units.
When this initiative is formalized through the signing of official agreements, the financial impact of $395 million will be funded from provisions built into the financial framework.
| 44 | Pre-election Report on the State of Québec’s Public Finances – August 2022 | | |
| 3. | Detailed revenue and expenditure forecasts |
| 3.1 | Change in revenue |
This section presents the government’s revenue for 2021-2022 to 2024-2025. Revenue totals $144.5 billion in 2022-2023, that is, $114.9 billion in own-source revenue and $29.6 billion in federal transfers.
| — | Revenue will total $148.6 billion for 2023-2024 and $153.4 billion for 2024-2025. |
| — | Revenue growth is forecast at 3.6% in 2022-2023, 2.9% in 2023-2024 and 3.2% in 2024-2025. |
TABLE 19
Change in revenue
(millions of dollars)
| 2021-2022 | 2022-2023 | 2023-2024 | 2024-2025 | |||||||||||||
| Own-source revenue | ||||||||||||||||
| Own-source revenue excluding revenue from government enterprises | 104 284 | 108 663 | 112 293 | 116 448 | ||||||||||||
| % change | 19.3 | 4.2 | 3.3 | 3.7 | ||||||||||||
| Revenue from government enterprises | 5 967 | 6 207 | 6 688 | 7 040 | ||||||||||||
| % change | 32.9 | 4.0 | 7.7 | 5.3 | ||||||||||||
| Subtotal | 110 251 | 114 870 | 118 981 | 123 488 | ||||||||||||
| % change | 20.0 | 4.2 | 3.6 | 3.8 | ||||||||||||
| Federal transfers | 29 141 | 29 600 | 29 631 | 29 921 | ||||||||||||
| % change | –5.1 | 1.6 | 0.1 | 1.0 | ||||||||||||
| TOTAL | 139 392 | 144 470 | 148 612 | 153 409 | ||||||||||||
| % change | 13.7 | 3.6 | 2.9 | 3.2 | ||||||||||||
| | | Detailed Revenue | 45 |
| 3.1.1 | Own-source revenue excluding revenue from government enterprises |
Own-source revenue excluding revenue from government enterprises consists mainly of tax revenue, including personal income tax, contributions for health services, corporate taxes, the school property tax, and consumption taxes.
| — | How it changes generally reflects change in economic activity in Québec and changes in the tax systems. |
Own-source revenue also includes other revenue sources, that is, duties and permits, in particular, revenue from the carbon market, and miscellaneous revenue, such as interest, the sale of goods and services, as well as fines, forfeitures and recoveries.
Own-source revenue excluding revenue from government enterprises is expected to grow by 4.2% in 2022-2023. It will reach 3.3% in 2023-2024 and 3.7% in 2024-2025.
| 46 | Pre-election Report on the State of Québec’s Public Finances – August 2022 | | |
TABLE 20
Change in own-source revenue excluding revenue from government enterprises
(millions of dollars)
| 2021-2022 | 2022-2023 | 2023-2024 | 2024-2025 | |||||||||||||
| Tax revenue | ||||||||||||||||
| Personal income tax | 41 285 | 43 414 | 45 272 | 46 660 | ||||||||||||
| % change | 18.0 | 5.2 | 4.3 | 3.1 | ||||||||||||
| Contributions for health services | 7 367 | 7 784 | 7 964 | 8 187 | ||||||||||||
| % change | 15.1 | 5.7 | 2.3 | 2.8 | ||||||||||||
| Corporate taxes | 12 927 | 11 925 | 11 867 | 12 803 | ||||||||||||
| % change | 44.4 | –7.8 | (1) | –0.5 | (1) | 7.9 | (1) | |||||||||
| School property tax | 1 081 | 1 048 | 1 106 | 1 187 | ||||||||||||
| % change | –6.5 | (2) | –3.1 | (3) | 5.5 | 7.3 | ||||||||||
| Consumption taxes | 24 673 | 27 345 | 28 140 | 29 006 | ||||||||||||
| % change | 15.4 | 10.8 | (4) | 2.9 | 3.1 | |||||||||||
| Subtotal | 87 333 | 91 516 | 94 349 | 97 843 | ||||||||||||
| % change | 19.8 | 4.8 | 3.1 | 3.7 | ||||||||||||
| Other revenue | ||||||||||||||||
| Duties and permits | 6 049 | 5 518 | 5 494 | 5 544 | ||||||||||||
| % change | 31.1 | –8.8 | (5) | –0.4 | (5) | 0.9 | ||||||||||
| Miscellaneous revenue | 10 902 | 11 629 | 12 450 | 13 061 | ||||||||||||
| % change | 10.3 | 6.7 | 7.1 | 4.9 | ||||||||||||
| Subtotal | 16 951 | 17 147 | 17 944 | 18 605 | ||||||||||||
| % change | 16.9 | 1.2 | 4.6 | 3.7 | ||||||||||||
| TOTAL | 104 284 | 108 663 | 112 293 | 116 448 | ||||||||||||
| % change | 19.3 | 4.2 | 3.3 | 3.7 | ||||||||||||
| (1) | The change in corporate tax revenue from 2022-2023 to 2024-2025 is due in part to the change in the net operating surplus of corporations of -4.6% in 2022, 0.2% in 2023 and 5.8% in 2024. |
| (2) | The decrease in school property tax revenue in 2021-2022 is due to the effect of the implementation of a single school tax rate on July 1, 2020. |
| (3) | The decrease in school property tax revenue in 2022-2023 is explained by the $130 million financial impact of the additional contribution from the government to limit the average increase in the school tax bill from 2% to 3% for 2022-2023. |
| (4) | The 10.8% growth in consumption taxes in 2022-2023 is due in part to a 13.2% increase in household consumption and a 6.2% increase in residential construction investment in 2022. |
| (5) | The decrease in revenue from duties and permits in 2022-2023 and 2023-2024 is mainly due to the decrease in natural resources revenue. |
| | | Detailed Revenue | 47 |
The bulk of own-source revenue is deposited in the General Fund to finance the government’s missions. The remainder of this revenue is paid, in particular, into special funds (to fund specific programs) and the Generations Fund (to reduce the debt), as well as into non-budget funded bodies and the health and social services, education and higher education networks (to fund their activities).
Growth in own-source revenue, before the measures already announced are taken into account, essentially reflects nominal GDP growth.
In 2021-2022, strong economic activity, supported by rising prices, resulted in nominal GDP growth of 14.9% for the fiscal year, which had a positive impact on own-source revenue. Growth in own-source revenue, which exceeded the growth in nominal GDP, is due to:
| — | revenue from personal income tax and consumption taxes, which benefited from the economic recovery and government assistance to individuals and businesses; |
| — | an exceptional performance in revenue from corporate taxes, which were supported by the resilience of businesses in the face of the pandemic and by a shift in the market basket of economic agents towards higher value-added products. |
In 2022-2023, growth in own-source revenue, which was slightly lower than growth in nominal GDP, is due in particular to the return to normal household consumption behaviour in 2022, which brings the change in corporate taxes back to historically-observed levels.
In 2023-2024, the lower growth in own-source revenue is explained by the effect of higher inflation in 2022 on the indexation of the parameters of the personal income tax for the 2023 taxation year.
CHART 3
Growth in own-source revenue excluding revenue from government enterprises
(per cent)
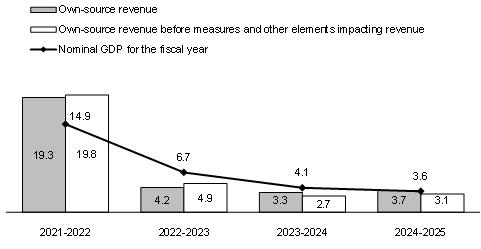 |
| 48 | Pre-election Report on the State of Québec’s Public Finances – August 2022 | | |
| q | Tax revenue |
Revenue from personal income tax, the government’s largest revenue source, posts $43.4 billion in 2022-2023, up 5.2% compared to 2021-2022. It will reach $45.3 billion in 2023-2024 and $46.7 billion in 2024-2025, a growth of 4.3% and 3.1% respectively.
| — | This growth reflects, among other things, the increase in household income, including wages and salaries, which, due to the increase in employment and the labour shortage, will grow by 10.7% in 2022, 4.0% in 2023 and 3.1% in 2024. |
| — | It also takes into account all the parameters of the personal income tax system, such as indexation and the progressive nature of the tax system. |
Contributions for health services stand at $7.8 billion in 2022-2023, which will then increase to $8.0 billion in 2023-2024 and $8.2 billion in 2024-2025, an increase of 5.7%, 2.3% and 2.8% respectively.
| — | This change reflects the expected growth in wages and salaries. |
Corporate tax revenue reaches $11.9 billion in 2022-2023, a change of −7.8%. It will also stand at $11.9 billion in 2023-2024 and $12.8 billion in 2024-2025, a change of −0.5% and 7.9% respectively.
| — | This change is influenced by the projected change in the net operating surplus of corporations of −4.6% in 2022, 0.2% in 2023 and 5.8% in 2024. |
| — | It also reflects the measures implemented in recent years to ease the tax burden, particularly the reduced corporate tax rate for SMBs announced in the 2021-2022 budget. |
Revenue from the school property tax stands at $1.0 billion in 2022-2023, down 3.1% compared to 2021-2022. It will reach $1.1 billion in 2023-2024 and $1.2 billion in 2024-2025, an increase of 5.5% and 7.3% respectively.
| — | The change in revenue from the school property tax takes into account the increase in the number of students and the projected increase in the cost of services funded by the school property tax. |
| — | It also takes into account the additional $173.4 million annual contribution from the government to limit the average increase in the school tax bill from 2% to 3% for 2022-2023. |
Consumption tax revenue totals $27.3 billion in 2022-2023, up 10.8% compared to 2021-2022. It will reach $28.1 billion in 2023-2024 and $29.0 billion in 2024-2025, a growth of 2.9% and 3.1% respectively.
| — | This change reflects the projected growth in household consumption,13 in particular, of 13.2% in 2022, 5.2% in 2023 and 3.1% in 2024. |
| — | It also reflects the projected change in residential construction of 6.2% in 2022, −0.5% in 2023 and 1.8% in 2024. |
| 13 | Household consumption excluding food products and housing. |
| | | Detailed Revenue | 49 |
| q | Other revenue |
Revenue from duties and permits14 totals $5.5 billion in 2022-2023, down 8.8% compared to 2021-2022. It will stand at $5.5 billion also in 2023-2024 and 2024-2025, a change of −0.4% and 0.9% respectively.
| — | The 8.8% decrease in revenue from duties and permits in 2022-2023 is explained by, among other things, the decrease in revenue from natural resources. |
Miscellaneous revenue15 stands at $11.6 billion in 2022-2023, which represents growth of 6.7% compared to 2021-2022. It will reach $12.5 billion in 2023-2024 and $13.1 billion in 2024-2025, which represents an increase of 7.1% and 4.9% respectively.
| — | This change stems mainly from the anticipated revenue of special funds, non-budget funded bodies, and bodies in the health and social services, education and higher education networks. |
| — | For example, the change in revenue from the education and higher education networks is influenced by, among other things, tuition fee revenues, the change in clienteles, and user revenues. |
| q | Assumptions, risks and sensitivity analysis for own-source revenue |
| ■ | Assumptions |
The forecast for own-source revenue excluding revenue from government enterprises is based on a number of assumptions, data elements and forecast models that take into account the economic outlook established by the Ministère des Finances.16
These models reflect the relations between a revenue source and its key economic determinants. For example:
| — | personal income tax estimate is closely tied to changes in wages and salaries, employment insurance, pension income, self-employed income, capital gains and interest income; |
| — | contributions for health services forecast is directly affected by changes in wages and salaries; |
| — | corporate taxes estimate depends in large part on changes in the net operating surplus of corporations; |
| — | Québec sales tax (QST) forecast hinges primarily on the growth outlook for household consumption (excluding food products and housing) and residential investment; |
| — | specific taxes (fuel, tobacco products and alcoholic beverages) estimate reflects changes in the consumer price index and various economic indicators, such as gas prices and per capita household disposable income. |
In addition, the own-source revenue forecast relies on the most recent data available during the establishment of the financial framework, such as Revenu Québec data derived from tax returns and tax bases, as well as preliminary data from the Québec government’s public accounts.
| 14 | Details of revenue from duties and permits are shown in Appendix 1 |
| 15 | Details of miscellaneous revenue are shown in Appendix 1. |
| 16 | The main assumptions underpinning the economic outlook established by the Ministère des Finances are presented on pages 21 to 26. |
| 50 | Pre-election Report on the State of Québec’s Public Finances – August 2022 | | |
Estimates take into account the existing tax system and the anticipated financial impact of tax and budgetary measures announced by the Québec government, including the harmonization of such measures with the federal budget.
| ■ | Risks |
Completion of the accounting for 2021-2022 data, and in-year revenue monitoring for fiscal 2022-2023 are elements of risk and uncertainty that can produce results different from those forecast and affect revenue levels in 2022-2023 and subsequent years.
Final actual data for fiscal 2021-2022 will be released when the Québec government’s public accounts are tabled in the fall of 2022.
Lastly, the forecasts for 2022-2023 and subsequent years carry a level of risk and uncertainty, given that they are based on assumptions concerning future events, such as changes in the economic situation.
For example, the forecast for corporate tax revenue entails a significant level of uncertainty due to the combination of several economic, decision-making and administrative factors, such as:
| — | the legal framework allowing businesses to make tax-related choices, including the use of loss carryovers; |
| — | the possibility of adjusting installment payments; |
| — | the time required to file and process income tax returns, which influences the accounting for corporate taxes. |
Moreover, several risks continue to weigh on own-source revenue forecasts from 2022-2023. For example:
| — | the invasion of Ukraine, ongoing bottlenecks in supply chains and upward pressure on wages could strain volumes and prices of some goods, reduce activity in certain sectors, and affect corporate profits, posing a risk to corporate tax revenue forecasts; |
| — | interest rate and price hikes, as well as the gradual withdrawal of government assistance could affect household disposable income and purchasing power, which poses a risk to consumption tax revenue forecasts; |
| — | price volatility due to rising commodity prices is weighing on the prices of fuel and certain goods and services, which affects the purchasing power of households and the production costs of businesses, posing a risk to consumption and corporate tax revenue forecasts; |
| — | the low availability of labour and the resulting pressure on wages and salaries, which pose a risk to, among other things, personal income tax revenue forecasts. |
| | | Detailed Revenue | 51 |
| ■ | Sensitivity analysis |
In general, the nominal GDP forecast is a very good indicator of growth in own-source revenue,17 given the direct link between taxable bases and nominal GDP.
| — | The Ministère des Finances estimates that a change of 1 percentage point in nominal GDP has an impact of approximately $1.0 billion on the government’s own-source revenue. |
This sensitivity analysis is based on an adjustment of each taxable base in proportion to the adjustment of nominal GDP.
| — | In reality, a change in economic outlook can have a greater impact on certain economic variables, as well as greater repercussions on certain taxable bases and smaller ones on others. |
The sensitivity analysis sets an average historical relationship between the change in own-source revenue and growth in nominal GDP. Accordingly, while remaining valid, it may prove inaccurate for a given year depending on the economic situation.
| — | Indeed, for a given year, economic fluctuations may have different impacts on revenue because of changes in the behaviour of economic agents. |
| — | In these situations, the variation in own-source revenue can be more or less pronounced compared to that in nominal GDP. |
TABLE 21
Sensitivity of own-source revenue excluding revenue from government enterprises
to major economic variables
| Variables | Growth forecasts for 2022 | Impacts for fiscal 2022-2023 |
| Nominal GDP | 9.6% | A variation of 1 percentage point changes own-source revenue(1) by approximately $1 billion. |
| Wages and salaries | 10.7% | A variation of 1 percentage point changes personal income tax revenue by approximately $410 million. |
| Employment insurance | −61.8% | A variation of 1 percentage point changes personal income tax revenue by approximately $5 million. |
| Pension income | 4.5% | A variation of 1 percentage point changes personal income tax revenue by approximately $60 million. |
| Net operating surplus of corporations | −4.6% | A variation of 1 percentage point changes corporate tax revenue by approximately $65 million. |
| Consumption excluding food products and housing | 13.2% | A variation of 1 percentage point changes QST revenue by approximately $200 million. |
| Residential investment | 6.2% | A variation of 1 percentage point changes QST revenue by approximately $45 million. |
| (1) | Own-source revenue excluding revenue from government enterprises. |
| 17 | Own-source revenue excluding revenue from government enterprises. |
| 52 | Pre-election Report on the State of Québec’s Public Finances – August 2022 | | |
| 3.1.2 | Revenue from government enterprises |
Government enterprises consist of public corporations that play a commercial role, have managerial autonomy and are financially self-sufficient. The revenue from government enterprises corresponds in large part to the net earnings of these corporations.
Revenue from government enterprises amounts to $6.0 billion in 2021-2022, an increase of 32.9%, $6.2 billion in 2022-2023, an increase of 4.0%, $6.7 billion in 2023-2024, an increase of 7.7%, and $7.0 billion in 2024-2025, an increase of 5.3%.
TABLE 22
Changes in revenue from government enterprises
| (millions of dollars) | ||||||||||||||||
| 2021-2022 | 2022-2023 | 2023-2024 | 2024-2025 | |||||||||||||
| Hydro-Québec | 3 061 | 3 200 | 3 450 | 3 750 | ||||||||||||
| Loto-Québec | 1 118 | 1 301 | 1 461 | 1 479 | ||||||||||||
| Société des alcools du Québec | 1 350 | 1 369 | 1 410 | 1 421 | ||||||||||||
| Investissement Québec | 345 | 231 | 252 | 276 | ||||||||||||
| Société québécoise du cannabis(1) | 76 | 94 | 105 | 104 | ||||||||||||
| Others(2) | 17 | 12 | 10 | 10 | ||||||||||||
| TOTAL | 5 967 | 6 207 | 6 688 | 7 040 | ||||||||||||
| % change | 32.9 | 4.0 | 7.7 | 5.3 | ||||||||||||
| (1) | Revenue is allocated to the Fund to Combat Addiction. |
| (2) | The government’s other enterprises are the Société ferroviaire et portuaire de Pointe-Noire, Capital Financière agricole and the Société du parc industriel et portuaire de Bécancour. |
The 32.9% growth in 2021-2022 primarily reflects a gradual return to normal by the expected results following exceptional declines caused by COVID-19 in 2020-2021. It includes an increase in the anticipated results of:
| — | Hydro-Québec, following mainly the increase in electricity sales in Québec; |
| — | Loto-Québec, attributable to a gradual reopening of its facilities with the required physical distancing measures. |
Growth of 4.0% in 2022-2023 is explained, in particular, by the increase in the expected results of:
| — | Loto-Québec, due to the gradual return to full operation; |
| — | Hydro-Québec, due to the increase in the value of exports and electricity sales in Québec. |
Growth of 7.7% in 2023-2024 is explained, in particular, by the increase in the expected results of:
| — | Hydro-Québec, due to the increase of electricity sales in Québec; |
| — | Loto-Québec, following an increase in the profits across all its activity sectors after the return to normal of its activities due to the scheduled lifting of public health measures. |
Growth of 5.3% in 2024-2025 is explained, in particular, by the increase in the expected results of Hydro-Québec, due to the increase in electricity sales in Québec.
| | | Detailed Revenue | 53 |
| q | Assumptions, risks and sensitivity analysis for government enterprises |
| ■ | Assumptions |
The revenue forecasts of government enterprises vary mainly in light of Hydro-Québec’s results, since its revenue accounts for nearly half of revenue from government enterprises.
| — | Hydro-Québec considers, in particular, normal winter temperatures, the consumer price index as well as energy volume and prices on external markets to determine its forecasts. |
| — | Revenue from Loto-Québec, the Société des alcools du Québec and the Société québécoise du cannabis is estimated, in particular, according to the consumption habits of their customers. |
| — | Revenue from Investissement Québec depends on economic conditions and the anticipated returns from investment projects. |
| ■ | Risks |
The forecasts of government enterprises depend on the information available when they are produced. Information updates, such as the evolution of the pandemic, can therefore affect the forecasts.
| — | In addition, it should be noted that certain assumptions, such as weather conditions, are hard to forecast. |
| ■ | Sensitivity analysis |
For Hydro-Québec, a variation of:
| — | 1.0 US¢/kWh in energy prices on external markets has an impact of approximately $210 million on its net annual earnings; |
| — | 1 °C in winter temperatures compared to normal temperatures changes its net earnings by approximately $120 million. |
For Loto-Québec, a variation of 1% in sales changes its net earnings by more than $10 million.
For the Société des alcools du Québec, a 1% variation in sales changes its net earnings by nearly $20 million.
For Investissement Québec, a variation of 1 percentage point in interest rates changes its net earnings by nearly $10 million.
For the Société québécoise du cannabis, a 1% variation in sales changes its net earnings by nearly $2 million.
| 54 | Pre-election Report on the State of Québec’s Public Finances – August 2022 | | |
| 3.1.3 | Federal transfers |
Revenue from federal transfers stands at $29.1 billion in 2021-2022. Small changes in federal transfers are expected in 2022-2023 (1.6%), in 2023-2024 (0.1%) and in 2024-2025 (1.0%).
Equalization revenue and health transfers will increase starting in 2023-2024 due to the increase in the envelopes across Canada, which grows in line with Canadian nominal GDP.18
On the other hand, revenues from other programs are expected to decrease starting in 2023-2024, due to the non-recurrence of some assistance and the pace of completion of infrastructure projects funded by the federal government.
TABLE 23
Changes in federal transfers
| (millions of dollars) | ||||||||||||||||
| 2021-2022 | 2022-2023 | 2023-2024 | 2024-2025 | |||||||||||||
| Equalization | 13 119 | 13 666 | 14 075 | 14 536 | ||||||||||||
| % change | –1.0 | 4.2 | 3.0 | 3.3 | ||||||||||||
| Health transfers(1) | 8 244 | 7 423 | 7 830 | 8 346 | ||||||||||||
| % change | 21.2 | –10.0 | 5.5 | 6.6 | ||||||||||||
| Transfers for post-secondary education and other social programs | 1 555 | 1 466 | 1 531 | 1 563 | ||||||||||||
| % change | –2.2 | –5.7 | 4.4 | 2.1 | ||||||||||||
| Other programs | 6 223 | 7 045 | 6 195 | 5 476 | ||||||||||||
| % change | –31.4 | 13.2 | –12.1 | –11.6 | ||||||||||||
| TOTAL | 29 141 | 29 600 | 29 631 | 29 921 | ||||||||||||
| % change | –5.1 | 1.6 | 0.1 | 1.0 | ||||||||||||
| (1) | Health transfers will decrease in 2022-2023 by 10.0% due to a one-time payment the previous year to support the health system and vaccination in the context of the pandemic. |
| 18 | In 2023-2024, the increases in the CHT and the equalization program are based on average annual growth in Canadian nominal GDP in 2021 (1/3), in 2022 (1/3) and in 2023 (1/3). These are high growth years. |
| | | Detailed Revenue | 55 |
| q | Assumptions, risks and sensitivity analysis for federal transfers |
| ■ | Assumptions |
Revenue from federal transfers refers to federal government revenue paid to Québec pursuant to the Federal-Provincial Fiscal Arrangements Act, to which is added revenue from other programs under bilateral agreements.
It includes mainly equalization revenue and revenues from the Canada Health Transfer (CHT)19 and the Canada Social Transfer (CST).
| ■ | Equalization |
The equalization program is intended to make up the differences in the fiscal capacity of the provinces in relation to the average for the 10 provinces thereby enabling the equalization-receiving provinces to offer public services at reasonably comparable levels of quality and taxation.
| — | Since 2009-2010, the equalization envelope no longer corresponds to differences in fiscal capacity, because it grows at the same pace as Canada’s nominal GDP. |
The calculation of equalization payments is based on the per capita fiscal capacity of a province, which is defined as the revenue that the province would obtain if it applied the average tax rates in effect in the 10 provinces to its own tax bases.
| — | To establish Québec’s payments, the fiscal capacity of each of the provinces, based on economic and fiscal data, must be considered. |
Québec’s equalization revenue for 2022-2023 and previous years was confirmed by the federal government and will not be adjusted.
| ■ | Canada Health Transfer and Canada Social Transfer |
Health transfers consist primarily of revenue from the CHT. They also include revenue from bilateral health agreements. These agreements are fixed in duration.
Transfers for post-secondary education and other social programs are determined according to revenue from the CST.20
| — | The CHT envelope increases at the same pace as Canada’s nominal GDP, while the CST envelope increases by 3% per year. |
| — | The envelopes are broken down per capita. |
| ■ | Other programs |
Revenue from other programs stems, for the most part, from agreements with the federal government that have different objectives, such as the integration of immigrants, labour market agreements, and infrastructure agreements.
| 19 | The Council of the Federation is asking the federal government to increase the CHT to 35% of provincial and territorial health expenditures. No revenue associated with this request was built into the financial framework. |
| 20 | Québec’s CHT and CST revenues are deducted from a portion of the value of the special Québec abatement. |
| 56 | Pre-election Report on the State of Québec’s Public Finances – August 2022 | | |
| ■ | Risks |
| ■ | Equalization |
The main risk with respect to equalization forecasts concerns the estimation of the fiscal capacity of each of the provinces, since the federal government does not release forecasts for equalization payments by province.
The federal government publishes only the equalization payments of each of the provinces for the current year and a five-year projection of the overall equalization envelope.
Provinces receiving equalization must therefore make their own equalization revenue forecast using a detailed formula.
| — | In particular, estimating Québec’s equalization revenue involves forecasting the fiscal capacity of each of the provinces, which requires many variables to be taken into account, such as the basic federal tax (BFT) for the personal income tax base and the net operating surplus for the corporate income tax base. |
| — | The equalization program is usually reviewed every five years. A review can result in changes to the equalization formula. |
| ■ | Canada Health Transfer and Canada Social Transfer |
The main risks with respect to forecasting CHT and CST revenues concern the estimation of the value of the special Québec abatement, which is based on Québec’s economic variables and the impact of any fiscal changes to the BFT by the federal government and the estimated population of the provinces and territories.
| ■ | Sensitivity analysis |
The forecast revenues from equalization, the CHT and the CST hinge, in particular, on the following economic and demographic variables:
| — | growth of Canada’s nominal GDP, because the equalization and CHT envelopes grow in pace with Canada’s nominal GDP; |
| — | growth in wages and salaries, the main indicator of the BFT, which determines: |
| — | Québec’s fiscal capacity with respect to the personal income tax base considered in the equalization program, |
| — | the value of the special Québec abatement, which is subtracted from the CHT and the CST (respectively 62% and 38% of the 13.5 BFT points in Québec); |
| — | Québec’s share of provincial populations, given that: |
| — | equalization revenue is calculated on the basis on a province’s per capita fiscal capacity, |
| — | the CHT and the CST are allocated on a per capita basis. |
In addition to the equalization revenue forecast, the sensitivity analysis takes into account the net operating surplus of corporations, the main indicator of taxable corporate income, which determines Québec’s fiscal capacity in regard to the corporate income tax base.
The sensitivity analysis may not apply for a given year because of special economic conditions or changes made by the federal government to the operation of these transfers.
| | | Detailed Revenue | 57 |
Moreover, the sensitivity analysis of equalization revenue is based on an increase of 1 percentage point in the growth of Québec’s economic variables, without any impact on the growth of those of the other provinces.
TABLE 24
Sensitivity of federal transfer revenue to major economic
and demographic variables
| Variables | Forecasts for 2022 | Impacts for fiscal 2022-2023 |
| Growth in Canada’s nominal GDP | 11.7% | An increase of 1 percentage point raises equalization revenue(1) by approximately $25 million. |
| An increase of 1 percentage point raises CHT revenue(1) by approximately $35 million. | ||
| Growth in wages and salaries in Québec | 10.7% | An increase of 1 percentage point reduces equalization revenue(2) by approximately $85 million. |
| An increase of 1 percentage point reduces CHT and CST revenues by approximately $50 million. | ||
| Growth in the net operating surplus of corporations in Québec | −4.6% | An increase of 1 percentage point reduces equalization revenue(2) by approximately $15 million. |
| Québec’s share of the population in Canada | 22.4% | An increase of 0.1 percentage points raises equalization revenue(2) by approximately $140 million. |
| An increase of 0.1 percentage points raises CHT and CST revenues by approximately $60 million. |
| (1) | Equalization and CHT envelopes for 2022-2023 were established by the federal government in December 2021 and will not be adjusted. Increased growth in 2022 will have an impact as of 2023-2024. |
| (2) | Due to the two-year lag in the equalization formula, increased growth in 2022 will have an impact as of 2024-2025. The impact for 2022-2023 and 2023-2024 would be nil. |
| 58 | Pre-election Report on the State of Québec’s Public Finances – August 2022 | | |
| 3.2 | Change in expenditure |
Expenditure includes both portfolio expenditures tied to the delivery of public services, which are influenced by demographics and prices, and debt service.
Expenditure21 totals $126.9 billion in 2021-2022, with $118.3 billion in portfolio expenditures and $8.6 billion in debt service.
| — | It will reach $138.3 billion in 2022-2023, $143.5 billion in 2023-2024 and $148.3 billion in 2024-2025. |
Expenditure growth stands at 11.5% in 2021-2022, and will reach 9.0%22 in 2022-2023, 3.7% in 2023-2024 and 3.3% in 2024-2025.
The 11.5% growth in expenditure in 2021-2022 is due to:
| — | the 11.4% growth in portfolio expenditures, which stems from the one-time cost of living amount as well as the resumption of government activities that were slow in 2020, that is, during the first year of the pandemic; |
| — | the 12.1% increase in debt service, caused by the increase in the debt and the rise in interest rates. |
TABLE 25
Change in expenditure
| (millions of dollars) | ||||||||||||||||
| 2021-2022 | 2022-2023 | 2023-2024 | 2024-2025 | |||||||||||||
| Portfolio expenditures | 118 272 | 128 154 | 134 472 | 138 370 | ||||||||||||
| % change | 11.4 | 8.4 | (1) | 4.9 | 2.9 | |||||||||||
| Debt service | 8 619 | 10 189 | 9 000 | 9 888 | ||||||||||||
| % change | 12.1 | 18.2 | –11.7 | 9.9 | ||||||||||||
| TOTAL(2) | 126 891 | 138 343 | 143 472 | 148 258 | ||||||||||||
| % change | 11.5 | 9.0 | 3.7 | 3.3 | ||||||||||||
| (1) | Compared to the 2022-2023 budget, this growth is 3.5 percentage points higher. This is primarily due to lower-than-expected expenditure in 2021-2022, particularly in the Santé et Services sociaux, Éducation, Enseignement supérieur and Économie et Innovation portfolios. |
| (2) | Expenditure associated with COVID-19 support and recovery measures are not included in total expenditure. |
| 3.2.1 | Portfolio expenditures |
To achieve its objectives and carry out its activities, the government sets up programs that are administered by government entities, including departments and bodies. The set of entities under the responsibility of a minister constitutes a portfolio.23
Before taking into account expenditure associated with COVID-19 support and recovery measures, portfolio expenditures will amount to $118.3 billion in 2021-2022, $128.2 billion in 2022-2023, $134.5 billion in 2023-2024 and $138.4 billion in 2024-2025.
Expenditure associated with COVID-19 support and recovery measures will amount to $9.2 billion in 2021-2022, $2.4 billion in 2022-2023 and $0.5 billion in 2023-2024.
| 21 | COVID-19 support and recovery measures are not included in total expenditure. |
| 22 | Compared to the 2022-2023 budget, this growth is 4.2 percentage points higher. This is primarily due to lower-than-expected expenditure in 2021-2022. |
| 23 | Entities for each departmental portfolio are presented in Appendix 3. Details of portfolio expenditures are shown in Appendix 2. |
| | | Detailed Revenue | 59 |
TABLE 26
Change in portfolio expenditures
| (millions of dollars) | ||||||||||||||||
| 2021-2022 | 2022-2023 | 2023-2024 | 2024-2025 | |||||||||||||
| Santé et Services sociaux | 50 416 | 54 299 | 58 753 | 61 170 | ||||||||||||
| % change | 8.4 | 7.7 | 8.2 | 4.1 | ||||||||||||
| Éducation | 17 656 | 19 212 | 20 248 | 20 947 | ||||||||||||
| % change | 6.6 | 8.8 | 5.4 | 3.5 | ||||||||||||
| Enseignement supérieur | 8 518 | 10 231 | 10 717 | 11 067 | ||||||||||||
| % change | 2.9 | 20.1 | (1) | 4.8 | 3.3 | |||||||||||
| Famille | 7 418 | 8 060 | 8 301 | 8 417 | ||||||||||||
| % change | 11.0 | 8.7 | (2) | 3.0 | 1.4 | |||||||||||
| Transports | 6 858 | 6 776 | 6 906 | 8 217 | ||||||||||||
| % change | 31.8 | –1.2 | 1.9 | 19.0 | (3) | |||||||||||
| Travail, Emploi et Solidarité sociale | 8 728 | 5 667 | 5 571 | 5 525 | ||||||||||||
| % change | 82.9 | –35.1 | (4) | –1.7 | –0.8 | |||||||||||
| Affaires municipales et Habitation | 3 609 | 4 399 | 4 417 | 4 427 | ||||||||||||
| % change | 17.0 | 21.9 | (5) | 0.4 | (5) | 0.2 | (5) | |||||||||
| Économie et Innovation(6) | 2 574 | 3 642 | 3 322 | 3 267 | ||||||||||||
| % change | –9.5 | 41.5 | (7) | –8.8 | –1.6 | |||||||||||
| Environnement et Lutte contre les changements climatiques | 1 850 | 2 233 | 2 213 | 2 198 | ||||||||||||
| % change | 60.3 | 20.7 | (8) | –0.9 | -0.7 | |||||||||||
| Other portfolios(9) | 10 646 | 13 636 | 14 025 | 13 135 | ||||||||||||
| % change | –3.4 | 28.1 | 2.9 | –6.3 | ||||||||||||
| Subtotal | 118 272 | 128 154 | 134 472 | 138 370 | ||||||||||||
| % change | 11.4 | 8.4 | 4.9 | 2.9 | ||||||||||||
| Expenditure associated with COVID-19 support and recovery measures | 9 178 | 2 355 | 462 | 18 | ||||||||||||
| TOTAL | 127 450 | 130 509 | 134 934 | 138 388 | ||||||||||||
| % change | 7.0 | 2.4 | 3.4 | 2.6 | ||||||||||||
| Notes: | Totals may not add due to rounding. Change in portfolio expenditures including COVID-19 support and recovery measures is shown in Appendix 2. |
| (1) | Growth is explained in particular by the introduction of the Québec Perspective scholarships, the initiatives of the 2022-2023 budget, the increase in infrastructure investment and the enhancement of the student financial assistance program. |
| (2) | Growth is explained in particular by the financing of new subsidized childcare spaces and the remuneration of their staff. |
| (3) | Growth is primarily due to the enhancement of the Land Transportation Network Fund. |
| (4) | Differences in 2022-2023 and 2023-2024 are due, in part, to the non-recurrence of the one-time cost-of-living amount. |
| (5) | Growth is explained by the acceleration of social housing in 2022-2023 and, from 2023-2024, by the update of the value of the one-point growth share of the QST under the fiscal pact. |
| (6) | The negative growth in this portfolio is explained in particular by the completion of certain initiatives. In addition, expenditure in this portfolio may vary according to the economic context. |
| (7) | The growth is explained in particular by the deployment of the Québec Research and Innovation Investment Strategy 2022-2027 and the increase in the provision for financial interventions. |
| (8) | The growth is primarily due to increased spending in the Electrification and Climate Change Fund. |
| (9) | Other portfolios include inter-portfolio eliminations resulting from the elimination of reciprocal transactions between entities in different portfolios. |
| 60 | Pre-election Report on the State of Québec’s Public Finances – August 2022 | | |
| q | Santé et Services sociaux |
The expenditures of the Santé et Services sociaux portfolio mainly include the activities of the bodies in the health and social services network and the programs administered by the Régie de l’assurance maladie du Québec. This portfolio also includes the expenditures of other governmental organizations related to health, such as Héma-Québec. These expenditures are influenced by the growth and aging of the population, the remuneration of health care facility staff, as well as the introduction of new technologies and medications.
Growth in this portfolio is explained both by the implementation of measures to restore the health system and improve care and services to the population and by the increased needs of the bodies in the health and social services network. In addition, the renewal costs identified in the 2022-2023 budget are now fully funded.
| q | Éducation |
Expenditures in the Éducation portfolio are primarily directed to the activities of pre-school, elementary and secondary educational institutions. This portfolio also includes programs to promote recreational and sports activities as well as programs related to the status of women. In general, they vary according to the evolution of the clienteles and the remuneration of the personnel of the school service centers and school boards.
Growth in this portfolio is explained, particularly for 2022-2023, by the improvement of tutoring and support for educational success and school perseverance.
| q | Enseignement supérieur |
Expenditures in the Enseignement supérieur portfolio are primarily related to the activities of educational institutions at the college and university level. This portfolio also includes student financial assistance. In general, they vary according to changes in the clientele and in the remuneration of college and university network personnel.
The significant growth in this portfolio, mainly in 2022-2023, is explained by the implementation of the Québec Perspective scholarships, the initiatives announced in the 2022-2023 budget, the increase in infrastructure investment as well as the improvement of the student financial assistance program.
| q | Famille |
The expenditures in the Famille portfolio primarily include funding for childcare and family benefits.
Growth in this portfolio is related to the funding of new subsidized childcare spaces and staff salaries.
| q | Transports |
The expenditures in the Transports portfolio primarily include the construction, maintenance and operation of road infrastructure and the funding of public transit services. Expenditures also include the management of the government’s rolling stock, air fleet and ferry services.
Growth in this portfolio is driven, most significantly in 2024-2025, by increased investment in public transit.
| | | Detailed Revenue | 61 |
| q | Travail, Emploi et Solidarité sociale |
Expenditures in the Travail, Emploi et Solidarité sociale portfolio mainly include financial assistance programs for individuals, including last-resort financial assistance, and employment assistance programs. They also include the administration of local employment centers and the Québec Parental Insurance Plan, as well as workplace supervision.
The changes in this portfolio are explained, in particular, by the non-recurrence of the one-time cost-of-living amount announced in the Update on Québec’s Economic and Financial Situation – Fall 2021 and the one-time cost-of-living amount announced in the 2022-2023 budget.
| q | Affaires municipales et Habitation |
Expenditures in the Affaires municipales et Habitation portfolio mainly include financial support to municipalities, particularly for infrastructure, social housing and compensation in lieu of taxes, as well as regional and metropolitan development measures.
Growth in this portfolio is explained by the acceleration of the construction of social housing in 2022-2023 and, from in 2023-2024, by the update of the value of the one-point growth share of the QST under the fiscal pact.
| q | Économie et Innovation |
Expenditures in the Économie et Innovation portfolio are mainly allocated to the financing of economic development projects and support for research and innovation.
The growth is explained in particular by the deployment of the Québec Research and Innovation Strategy and the increase in the provision for financial interventions.
| q | Environnement et Lutte contre les changements climatiques |
Expenditures in the Environnement et Lutte contre les changements climatiques portfolio are primarily directed at funding measures to combat climate change, protect the environment and preserve biodiversity. Expenditures also include the operation of public dams and land management of the state’s water domain.
Change in this portfolio is explained, in 2022-2023, by an increase in expenditure for the Electrification and Climate Change Fund and a one-time increase in funding for the Plan for a Green Economy, in 2023-2024, by the non-recurrence of this funding and, in 2024-2025, by the end of RECYC-QUÉBEC’s 2019-2024 Action Plan.
| q | Other portfolios |
Expenditures in the other portfolios include expenditures in all other portfolios, which include programs in the culture, immigration, tourism and natural resources sectors, as well as the activities of the judicial system, public security, international relations, the legislative branch and central agencies.
Growth differences in other portfolios are shown in the box on the next page.
| 62 | Pre-election Report on the State of Québec’s Public Finances – August 2022 | | |
Effect of one-time factors on portfolio
expenditure growth
The change in expenditures in other portfolios is 2.9% in 2023-2024 and −6.3% in 2024-2025. The negative change in 2024-2025 is explained by a variety of items generating one-time, atypical changes, including investments to roll out high-speed Internet in all regions and municipal infrastructure funded by the federal government.
Excluding one-time factors affecting other portfolios, growth stands at 3.2% in 2023-2024 and 0.8% in 2024-2025.
One-time factors in other portfolios
| (millions of dollars) | ||||||||||||||||
| 2021-2022 | 2022-2023 | 2023-2024 | 2024-2025 | |||||||||||||
| Other portfolios | 10 646 | 13 636 | 14 025 | 13 135 | ||||||||||||
| % change | –3.4 | 28.1 | 2.9 | –6.3 | ||||||||||||
| LESS: | ||||||||||||||||
| Non-realized projected expenditure | –988 | — | — | — | ||||||||||||
| Contingency Fund reserve | — | 200 | 400 | 400 | ||||||||||||
| Provision for the francization of immigrants | — | 169 | 183 | 187 | ||||||||||||
| Provincial general election | — | 109 | — | — | ||||||||||||
| Measures to continue the digital shift (MCN and MCE)(1) | — | 85 | 115 | — | ||||||||||||
| Municipal infrastructure funded by the federal government | 656 | 984 | 1 065 | 185 | ||||||||||||
| Investment to roll out high-speed Internet in all regions | 56 | 228 | 25 | 25 | ||||||||||||
| Subtotal – Main one-time factors | –276 | 1 775 | 1 788 | 797 | ||||||||||||
| OTHER PORTFOLIOS AFTER ELIMINATING THE MAIN ONE-TIME FACTORS | 10 922 | 11 861 | 12 237 | 12 338 | ||||||||||||
| % change | 8.6 | (1) | 3.2 | 0.8 | ||||||||||||
| (1) | These acronyms stand for the Ministère de la Cybersécurité et du Numérique and the Ministère du Conseil exécutif. |
| (2) | Growth in 2022-2023 is mainly attributable to the measures in the 2022-2023 budget. |
| | | Detailed Revenue | 63 |
Expenditure associated with COVID-19 support and recovery measures
Even though the majority of the support and recovery measures in response to the public health crisis were implemented in 2020-2021, the government will continue to support Quebecers and the economy in the coming years.
Expenditure associated with COVID-19 support and recovery measures total $9.2 billion in 2021-2022, $2.4 billion in 2022-2023 and $0.5 billion in 2023-2024.
For example, in health and social services, funds have been invested to implement temporary actions to overcome the public health crisis, including the purchase of personal protective equipment and screening tests, the vaccination campaign and salary bonuses to employees in health care institutions. The measures also aim to catch up on the backlog of surgical activities due to offloading.
In education, most of the expenditure associated with COVID-19 support and recovery measures have helped to support academic success and consolidation of learning, particularly through the tutoring program. In higher education, investments are mainly aimed at easing the financial burden of students in the context of the pandemic.
Lastly, the government has provided assistance to businesses affected by the pandemic and to boost economic growth.
Expenditure associated with COVID-19 support and recovery measures
| (millions of dollars) | ||||||||||||||||||||
| 2021-2022 | 2022-2023 | 2023-2024 | 2024-2025 | Total | ||||||||||||||||
| Santé et Services sociaux | 7 320 | 1 595 | 368 | — | 9 283 | |||||||||||||||
| Éducation | 185 | 60 | — | — | 245 | |||||||||||||||
| Enseignement supérieur | 230 | 72 | — | — | 302 | |||||||||||||||
| Famille | 25 | — | — | — | 25 | |||||||||||||||
| Transports | 140 | 245 | — | — | 385 | |||||||||||||||
| Travail, Emploi et Solidarité sociale | 118 | 43 | 2 | — | 163 | |||||||||||||||
| Affaires municipales et Habitation | — | — | — | — | — | |||||||||||||||
| Économie et Innovation | 603 | 106 | 69 | — | 777 | |||||||||||||||
| Environnement et Lutte contre les changements climatiques | — | — | — | — | — | |||||||||||||||
| Other portfolios | 557 | 234 | 24 | 18 | 832 | |||||||||||||||
| TOTAL | 9 178 | 2 355 | 462 | 18 | 12 012 | |||||||||||||||
Note: Totals may not add due to rounding.
| 64 | Pre-election Report on the State of Québec’s Public Finances – August 2022 | | |
| q | Assumptions, risks and sensitivity analysis for portfolio expenditures |
| ■ | Assumptions |
The Ministère des Finances establishes the multi-year expenditure target for the time frame of the financial framework.
| — | The target is essentially established according to the government’s budgetary policy directions. |
| — | It is dependent, among other things, on program renewal costs and revenue trends, as well as on the analysis and monitoring during the year of the government’s revenue and expenditure. |
The Secrétariat du Conseil du trésor, in collaboration with government departments, estimates the cost of renewing programs.
The cost of renewing government programs represents a comprehensive assessment of the expenditures associated with the continued delivery of existing services and programs.
| — | Given the sensitivity of expenditures to certain economic and demographic parameters, the renewal cost calculation considers elements such as changes in the price of goods and services, population growth, population aging and variations in clienteles. |
| — | It also takes into account the impact of government decisions, such as the cost of past commitments and collective agreements. |
TABLE 27
Factors affecting government program renewal costs
and the multi-year expenditure target
| Government program renewal costs | Multi-year expenditure target |
– Change in clienteles – Change in prices – Population change – Past commitments | – Financing capacity that depends, in particular, on revenue trends – Fiscal and budgetary policies – Budgetary guidelines, including new measures in the budget – Monitoring during the year of revenue and expenditure |
The multi-year expenditure target is compared with the cost of renewing government programs, in order to manage potential observed gaps.
In cases where the cost of renewing government programs exceeds the multi-year expenditure target, priorities must be established and choices involving spending controls, reallocation or target increases can be made to reduce or eliminate the gap.
| — | Departments and public bodies are responsible for identifying measures that should be put in place to ensure that their expenditure target is met, under the coordination of the Secrétariat du Conseil du trésor. |
When the cost of renewing government programs falls below the multi-year expenditure target, a fiscal space is available to implement initiatives or reduce the expenditure target.
| | | Detailed Revenue | 65 |
TABLE 28
Managing gaps between the cost of renewing government programs
and the multi-year expenditure target
| Overall expenditure target | < | Renewal costs |  | Saving measures to be determined, reallocation or spending increases |
| Overall expenditure target | > | Renewal costs | | Fiscal space for new initiatives or reduction of the expenditure target |
In order to ensure full funding of existing public services, the gap between government program renewal costs and the expenditure target must be closed for the fiscal year covered by the budget.
For subsequent fiscal years, shortfalls can remain. In the next update of government program renewal costs, the existing gap for the year covered by the budget must in turn be closed.
| ■ | Assumptions with respect to demographics |
Changes in the size and structure of the population based on the various age groups comprising it affect the level and composition of public spending.
| — | Population growth drives spending upward to maintain the basket of public goods. |
| — | In addition, the type and cost of public services differ depending on the age group, particularly: |
| — | children under 5 years of age have access to daycare places; |
| — | children aged 5 to 16 receive education services at the elementary and secondary levels; |
| — | a proportion of young adults aged 17-to-24 attend higher education institutions. |
In the coming years, the number of individuals in the 17-to-24 age group will increase the most in the population under 24 years of age, by an average of 1.9% per year.
These assumptions are taken into consideration in assessing the costs of renewing programs for portfolios that provided services to specific clienteles—for example the Éducation portfolio for the clientele aged 5 to 16.
| 66 | Pre-election Report on the State of Québec’s Public Finances – August 2022 | | |
| CHART 4 Change in Québec’s population under the age of 24 from 2012 to 2027 |
| (numbers) |

| Sources: Institut de la statistique du Québec, Statistics Canada and Ministère des Finances du Québec. |
Moreover, the rise in the population aged 65 and over affects expenditure in health and social services.
| — | This factor will also influence the renewal costs of programs in this sector. |
From 2012 to 2022, the percentage of individuals aged 65 and over rose from 16.1% to 20.9% of the total population.
CHART 5 |
| (as a percentage of the total population) |

Sources: Institut de la statistique du Québec, Statistics Canada and Ministère des Finances du Québec.
| | | Detailed Revenue | 67 |
| ■ | Remuneration of government employees |
Prices for public services as a whole also take into consideration the impact of salary increases and of higher costs for pay equity maintenance and special agreements.
Remuneration agreements were entered into with most government employees, facilitating the predictability of government spending. In particular, the agreements provide for:
| — | annual increases of 2.0% as at April 1, 2020, 2021 and 2022; |
| — | higher increases in the third year for employees earning less than $50 000; |
| — | two lump-sum payments ranging from $600 and $1 200. |
The financial framework for the negotiation includes wage increases amounting to 9.2% for this three-year settlement.
TABLE 29
Negotiated salary increases for the period 2020-2023
(per cent)
| 2019-2020 | 2020-2021 | 2021-2022 | 2022-2023 | Total 3 years | ||||||||||||||||
| Salary parameters | 2.00 | 2.00 | 2.00 | 6.00 | ||||||||||||||||
| Other recurring enhancements | 0.40 | 0.40 | 0.40 | 1.20 | ||||||||||||||||
| Total recurring | 2.40 | 2.40 | 2.40 | 7.20 | ||||||||||||||||
| Non recurring lump-sum payments | 1.00 | 1.00 | — | — | 2.00 | |||||||||||||||
| TOTAL GOVERNMENT EFFORT | 9.20 | |||||||||||||||||||
Note: The wage increases represent those negotiated with the common front.
The collective agreements and arrangements also provide for enhancements to the working conditions of employees targeted by government priorities, mainly:
| — | teachers (academic success); |
| — | patient care attendants (accessibility to care for clients in long-term care or receiving home care); |
| — | nurses. |
| 68 | Pre-election Report on the State of Québec’s Public Finances – August 2022 | | |
| ■ | Risks |
Changes in target clienteles can have an impact on the expenditures of a departmental portfolio.
| — | A change in the number of last resort financial assistance recipients, for example due to an economic slowdown, could pose a risk and affect the expenditure forecasts for the Travail, Emploi et Solidarité sociale portfolio. |
| — | An unforeseen change in staffing at elementary and secondary schools, CEGEPs or universities could affect the expenditures of the Éducation and Enseignement supérieur portfolios. |
| — | Expenditure in the Famille portfolio may vary as a result of a change in the subsidized childcare services clientele. |
Technological change can also cause spending changes in certain sectors.
| — | Expenditure in health and social services, for example, is in large part tied to the cost of prescription drugs and diagnostic equipment, which are technology intensive. |
In general, expenditures can be changed, for example when new, specific needs arise in the population.
The government’s ability to achieve its objectives may be affected by the labour shortage. In the event that the workforce required to implement programs is less than expected, there is a risk that the expenditure will not be fully realized.
It should be noted that a change in the general level of prices can have an impact on public spending as a whole. The risk affects the portfolios differently.
The accuracy of the forecast of remuneration expenditure is better when the remuneration of government employees is governed by agreements. Since several collective agreements end on March 31, 2023, the change in the remuneration forecast could differ from 2023-2024 onwards.
| ■ | Sensitivity analysis |
The financial framework forecast takes into account:
| — | budgetary choices, which stem from the prioritization of certain sectors over others in the allocation of expenditures; |
| — | economic and demographic variables, which are tied to price factors (inflation) and demographic factors (population changes). |
Tables 30 and 31 show the sensitivity of portfolio expenditures according to budgetary choices and socioeconomic factors.
| — | It should be noted that such data are indications and that repercussions may vary depending on the nature and interaction of risk factors. |
| | | Detailed Revenue | 69 |
| ■ | Budgetary choices |
Expenditures may vary according to the government’s choices in allocating its available budgetary resources.
For fiscal 2022-2023, a 1% variation in the expenditures of:
| — | the Santé et Services sociaux portfolio would lead to a variation of approximately $560 million in such expenditures; |
| — | In particular, 1% growth in the cost of health care technologies would have an impact of approximately $385 million. |
| — | the Éducation portfolio would lead to a variation of approximately $190 million in such expenditures; |
| — | the Enseignement supérieur portfolio would lead to a variation of approximately $100 million in such expenditures. |
TABLE 30
Sensitivity of expenditures to a variation of 1% in each departmental portfolio
| (millions of dollars) | ||||
| Impact for fiscal 2022-2023 | ||||
| Santé et Services sociaux | 560 | |||
| Éducation | 190 | |||
| Enseignement supérieur | 100 | |||
| Famille | 80 | |||
| Transports | 70 | |||
| Travail, Emploi et Solidarité sociale | 60 | |||
| Affaires municipales et Habitation | 40 | |||
| Économie et Innovation | 40 | |||
| Environnement et Lutte contre les changements climatiques | 20 | |||
| Other portfolios | 140 | |||
| TOTAL | 1 310 | |||
Note: Totals may not add due to rounding.
| 70 | Pre-election Report on the State of Québec’s Public Finances – August 2022 | | |
| ■ | Socioeconomic factors |
The analysis conducted also made possible the estimation of the sensitivity of expenditure to certain socioeconomic factors.
| § | Demographics |
Expenditure is also affected by changes in total population and in the size of the clientele for certain services.
For example, a 1% variation in total population would change expenditure by $1.0 billion in 2022-2023, that is, 0.8 percentage points of total expenditure. Expenditure would vary by:
| — | 0.7 percentage points for the Santé et Services sociaux portfolio |
| — | 0.8 percentage points for the Éducation portfolio; and |
| — | 0.9 percentage points for the Enseignement supérieur portfolio. |
A 1% variation in the number of people aged 0-4, that is, the population that affects, in particular, the demand for childcare services, would have a $110-million impact on total expenditure.
| — | The Famille portfolio would be affected the most by such a variation. Its expenditure would change by 1.0 percentage point. |
A 1% variation in the number of people aged 65 and over would lead to a variation of $290 million in total expenditure.
| — | Expenditure for the Santé et Services sociaux portfolio would increase by 0.4 percentage points. |
| § | Prices |
Public spending is influenced by the price of services provided by the government, the change in which is closely tied to that in the general level of prices in the economy, that is, inflation.
Accordingly, a uniform variation in prices could lead to changes in portfolio expenditures.
The results show that a 1% variation in prices would lead to a variation of $570 million, or 0.4 percentage points, in total expenditure. In particular, portfolio expenditures would vary by:
| — | 0.3 percentage points for the Santé et Services sociaux portfolio; |
| — | 0.1 percentage points for the Éducation portfolio; |
| — | 0.2 percentage points for the Enseignement supérieur portfolio; |
| — | 0.9 percentage points for the Famille portfolio. |
| | | Detailed Revenue and Expenditure Forecasts | 71 |
TABLE 31
Sensitivity of portfolio expenditures to a variation of 1% in socioeconomic variables
| Impact for fiscal 2022-2023 | ||||||||||
| Socioeconomic variables | ($M) | (percentage point) | ||||||||
| Demographics | ||||||||||
| Total population | Total expenditure | 1 020 | 0.8 | |||||||
| Per portfolio: | ||||||||||
| – Santé et Services sociaux | 0.7 | |||||||||
| – Éducation | 0.8 | |||||||||
| – Enseignement supérieur | 0.9 | |||||||||
| – Famille | 1.0 | |||||||||
| – Others | 0.8 | |||||||||
| 0 to 4 years | Total expenditure | 110 | 0.1 | |||||||
| Per portfolio: | ||||||||||
| – Famille | 1.0 | |||||||||
| 5 to 16 years | Total expenditure | 210 | 0.2 | |||||||
| Per portfolio: | ||||||||||
| – Éducation | 0.8 | |||||||||
| 17 to 24 years | Total expenditure | 130 | 0.1 | |||||||
| Per portfolio: | ||||||||||
| – Enseignement supérieur | 0.9 | |||||||||
| 65 years and over | Total expenditure | 290 | 0.2 | |||||||
| Per portfolio: | ||||||||||
| – Santé et Services sociaux | 0.4 | |||||||||
| Prices | ||||||||||
| Inflation | Total expenditure | 570 | 0.4 | |||||||
| – Santé et Services sociaux | 0.3 | |||||||||
| �� | – Éducation | 0.1 | ||||||||
| – Enseignement supérieur | 0.2 | |||||||||
| – Famille | 0.9 | |||||||||
| – Others | 0.8 | |||||||||
| 72 | Pre-election Report on the State of Québec’s Public Finances – August 2022 | | |
| 3.2.2 | Debt service |
Debt service consists of interest on the direct debt as well as interest on the liability for the retirement plans and other future benefits of public and parapublic sector employees.
It will stand at $10.2 billion in 2022-2023, $9.0 billion in 2023-2024 and $9.9 billion in 2024-2025, which represents variations of 18.2%, −11.7% and 9.9% respectively.
In 2022-2023, 2023-2024 and 2024-2025, interest on the direct debt will change by 21.7%, −10.8% and 10.8% respectively, owing in particular to the anticipated change in interest rates. The rapid increase in interest rates in 2022-2023 will result, in particular, in losses on the disposal of assets as part of the management of the investment activities of the Sinking Fund for Government Borrowing. The non-recurrence of these losses explains why debt service decreases in 2023-2024.
Net interest on liabilities with regard to pension plans and other employee future benefits is decreasing due to the increase in investment income from the Retirement Plans Sinking Fund (RPSF).24 RPSF revenue is deducted from debt service. In 2021-2022, the RPSF realized a return of 9.14%, while a negative return of −4.75% is expected in 2022-2023 due to declining stock markets and rising interest rates. For subsequent years, the expected long-term RPSF return, that is, 6.35%, is used to calculate RPSF revenue. It should be noted that return differences are gradually incorporated into the financial framework in accordance with generally accepted accounting principles (GAAP).
Bond yields have risen significantly in advanced economies in recent months as financial markets raised their expectations regarding the pace of monetary policy tightening. However, these rates are expected to decline over the course of 2023 due to the anticipated moderation in market expectations regarding future changes in policy interest rates.
TABLE 32
Change in debt service
(millions of dollars)
| 2021-2022 | 2022-2023 | 2023-2024 | 2024-2025 | |||||||||||||
| Interest on direct debt(1) | 8 060 | 9 807 | 8 745 | 9 692 | ||||||||||||
| % change | 18.5 | 21.7 | –10.8 | 10.8 | ||||||||||||
| Interest on obligations relating to retirement plans and other employee future benefits(2) | 7 003 | 7 331 | 7 522 | 7 725 | ||||||||||||
| Investment income from the Retirement Plans Sinking Fund (RPSF) and individual funds(3) | –6 444 | –6 949 | –7 267 | –7 529 | ||||||||||||
| Net interest on the liability for the retirement plans and other employee future benefits | 559 | 382 | 255 | 196 | ||||||||||||
| TOTAL | 8 619 | 10 189 | 9 000 | 9 888 | ||||||||||||
| % change | 12.1 | 18.2 | –11.7 | 9.9 | ||||||||||||
| (1) | Interest on the direct debt includes the income of the Sinking Fund for Government Borrowing. This income, which is deducted from debt service, consists of interest generated on investments as well as gains and losses on disposal The forecast for this income may be adjusted upward or downward since it is closely tied to the change in interest rates and market behaviour. |
| (2) | This interest corresponds to the interest on obligations relating to the retirement plans and other future benefits of public and parapublic sector employees. The expected investment income for the Pension Plan for the Université du Québec is presented as a reduction of interest on obligations relating to retirement plans and other employee future benefits. |
| (3) | This investment income includes the investment income of the other employee future benefits funds. |
| 24 | The Retirement Plans Sinking Fund (RPSF) is an asset that was established for the payment of retirement benefits of public and parapublic sector employees. |
| | | Detailed Revenue and Expenditure Forecasts | 73 |
| q | Assumptions, risks and sensitivity analysis for debt service |
| ■ | Assumptions |
The debt service forecast is based primarily on the debt level, interest rate and RPSF return forecasts.
| ■ | Risks |
The main risks with respect to the debt service forecast are a higher-than-anticipated variation in interest rates and a different-than-expected return on the RPSF.
The RPSF is managed by the Caisse de dépôt et placement du Québec.
Revenue from the RPSF is presented as a deduction from debt service. Accordingly, a lower (higher) return than expected would drive up (down) debt service.
| ■ | Sensitivity analysis |
A greater-than-anticipated rise in interest rates of 1 percentage point over a full year would result in a change in interest expenditure of $553 million in the first year and of more than $1.8 billion in the fifth year.
A return of 1 percentage point lower (higher) than the anticipated return on the RPSF would lead to an increase (decrease) in debt service of approximately $30 million the following year and $178 million after five years.
A change in the value of the Canadian dollar compared with other currencies would have no impact on debt service, because the government’s debt has no foreign currency exposure.
| 74 | Pre-election Report on the State of Québec’s Public Finances – August 2022 | | |
| 4. | Québec’s debt |
Several concepts of debt are used to measure indebtedness. The Québec government presents information on each of these concepts in its budgetary documents.
| — | As at March 31, 2022, the gross debt is estimated at $212.6 billion, that is, 42.1% of GDP. The gross debt-to-GDP ratio is expected to decrease in the coming years to stand at 37.0% as at March 31, 2027. |
| — | The net debt burden, estimated at 38.0% of GDP as at March 31, 2022, is also expected to decrease in the next few years to stand at 32.4% of GDP as at March 31, 2027. |
| — | The burden of the debt representing accumulated deficits, estimated at 20.9% of GDP as at March 31, 2022, is expected to decrease to 14.4% of GDP as at March 31, 2027. |
TABLE 33
Debt of the Québec government as at March 31 according to various concepts
(millions of dollars)
| 2022 | 2023 | 2024 | 2025 | 2026 | 2027 | |||||||||||||||||||
| GROSS DEBT(1) | 212 620 | 219 814 | 224 556 | 227 868 | 232 097 | 235 793 | ||||||||||||||||||
| % of GDP | 42.1 | 39.7 | 39.1 | 38.3 | 37.7 | 37.0 | ||||||||||||||||||
| Less: Financial assets, net of other liabilities(2) | –20 716 | –24 237 | –25 858 | –26 389 | –27 676 | –29 101 | ||||||||||||||||||
| NET DEBT | 191 904 | 195 577 | 198 698 | 201 479 | 204 421 | 206 692 | ||||||||||||||||||
| % of GDP | 38.0 | 35.3 | 34.6 | 33.8 | 33.2 | 32.4 | ||||||||||||||||||
| Less: Non-financial assets | –86 499 | –91 944 | –97 743 | –103 657 | –109 492 | –114 982 | ||||||||||||||||||
| DEBT REPRESENTING ACCUMULATED DEFICITS | 105 405 | 103 633 | 100 955 | 97 822 | 94 929 | 91 710 | ||||||||||||||||||
| % of GDP | 20.9 | 18.7 | 17.6 | 16.4 | 15.4 | 14.4 | ||||||||||||||||||
| (1) | The gross debt excludes pre-financing and takes into account the sums accumulated in the Generations Fund. |
| (2) | Financial assets include, in particular, investments in government enterprises (e.g., Hydro-Québec) and accounts receivable, minus other liabilities (e.g., accounts payable). |
| | | Québec’s Debt | 75 |
| q | Assumptions, risks and sensitivity analysis for debt |
| ■ | Assumptions |
The main factors of gross debt growth are:
| — | change in the budgetary balance; |
| — | A budgetary deficit increases the debt. Conversely, a budgetary surplus reduces the gross debt. |
| — | capital investments, which flow from the QIP and for which borrowings must be made; |
| — | government investment in businesses, in particular government enterprises, which are called investments, loans and advances; |
| — | Such investments may be made through advances or capital outlays, or by allowing government enterprises to keep part of their net earnings. |
| — | For example, each year, Hydro-Québec pays the government a dividend that corresponds to 75% of its net earnings. Hydro-Québec uses the portion (25%) not paid to the government to fund its own investments, particularly hydroelectric dams. For the government, this constitutes an investment that creates a financial requirement and thus leads to an increase in the gross debt. |
| — | Investments, loans and advances also include the change in temporary investments made and redeemed. |
| — | deposits made annually in the Generations Fund to reduce the debt. |
It should be noted that the factors of evolution of the net debt include the budgetary balance, the investments in capital assets as well as the deposits in the Generations Fund.
The debt representing accumulated deficits is influenced by the budgetary balance and deposits in the Generations Fund.
To illustrate, over the next five years, from 2022-2023 to 2026-2027, the gross debt is expected to increase by $23.2 billion, primarily because of capital investment, investments, loans and advances, and budgetary deficits.
| — | These three factors will contribute to an increase in gross debt by $47.7 billion over five years. This increase is partially offset by deposits in the Generations Fund of $21.9 billion, which reduce the debt. |
| 76 | Pre-election Report on the State of Québec’s Public Finances – August 2022 | | |
CHART 6
Factors of gross debt growth from 2022-2023 to 2026-2027
(millions of dollars)
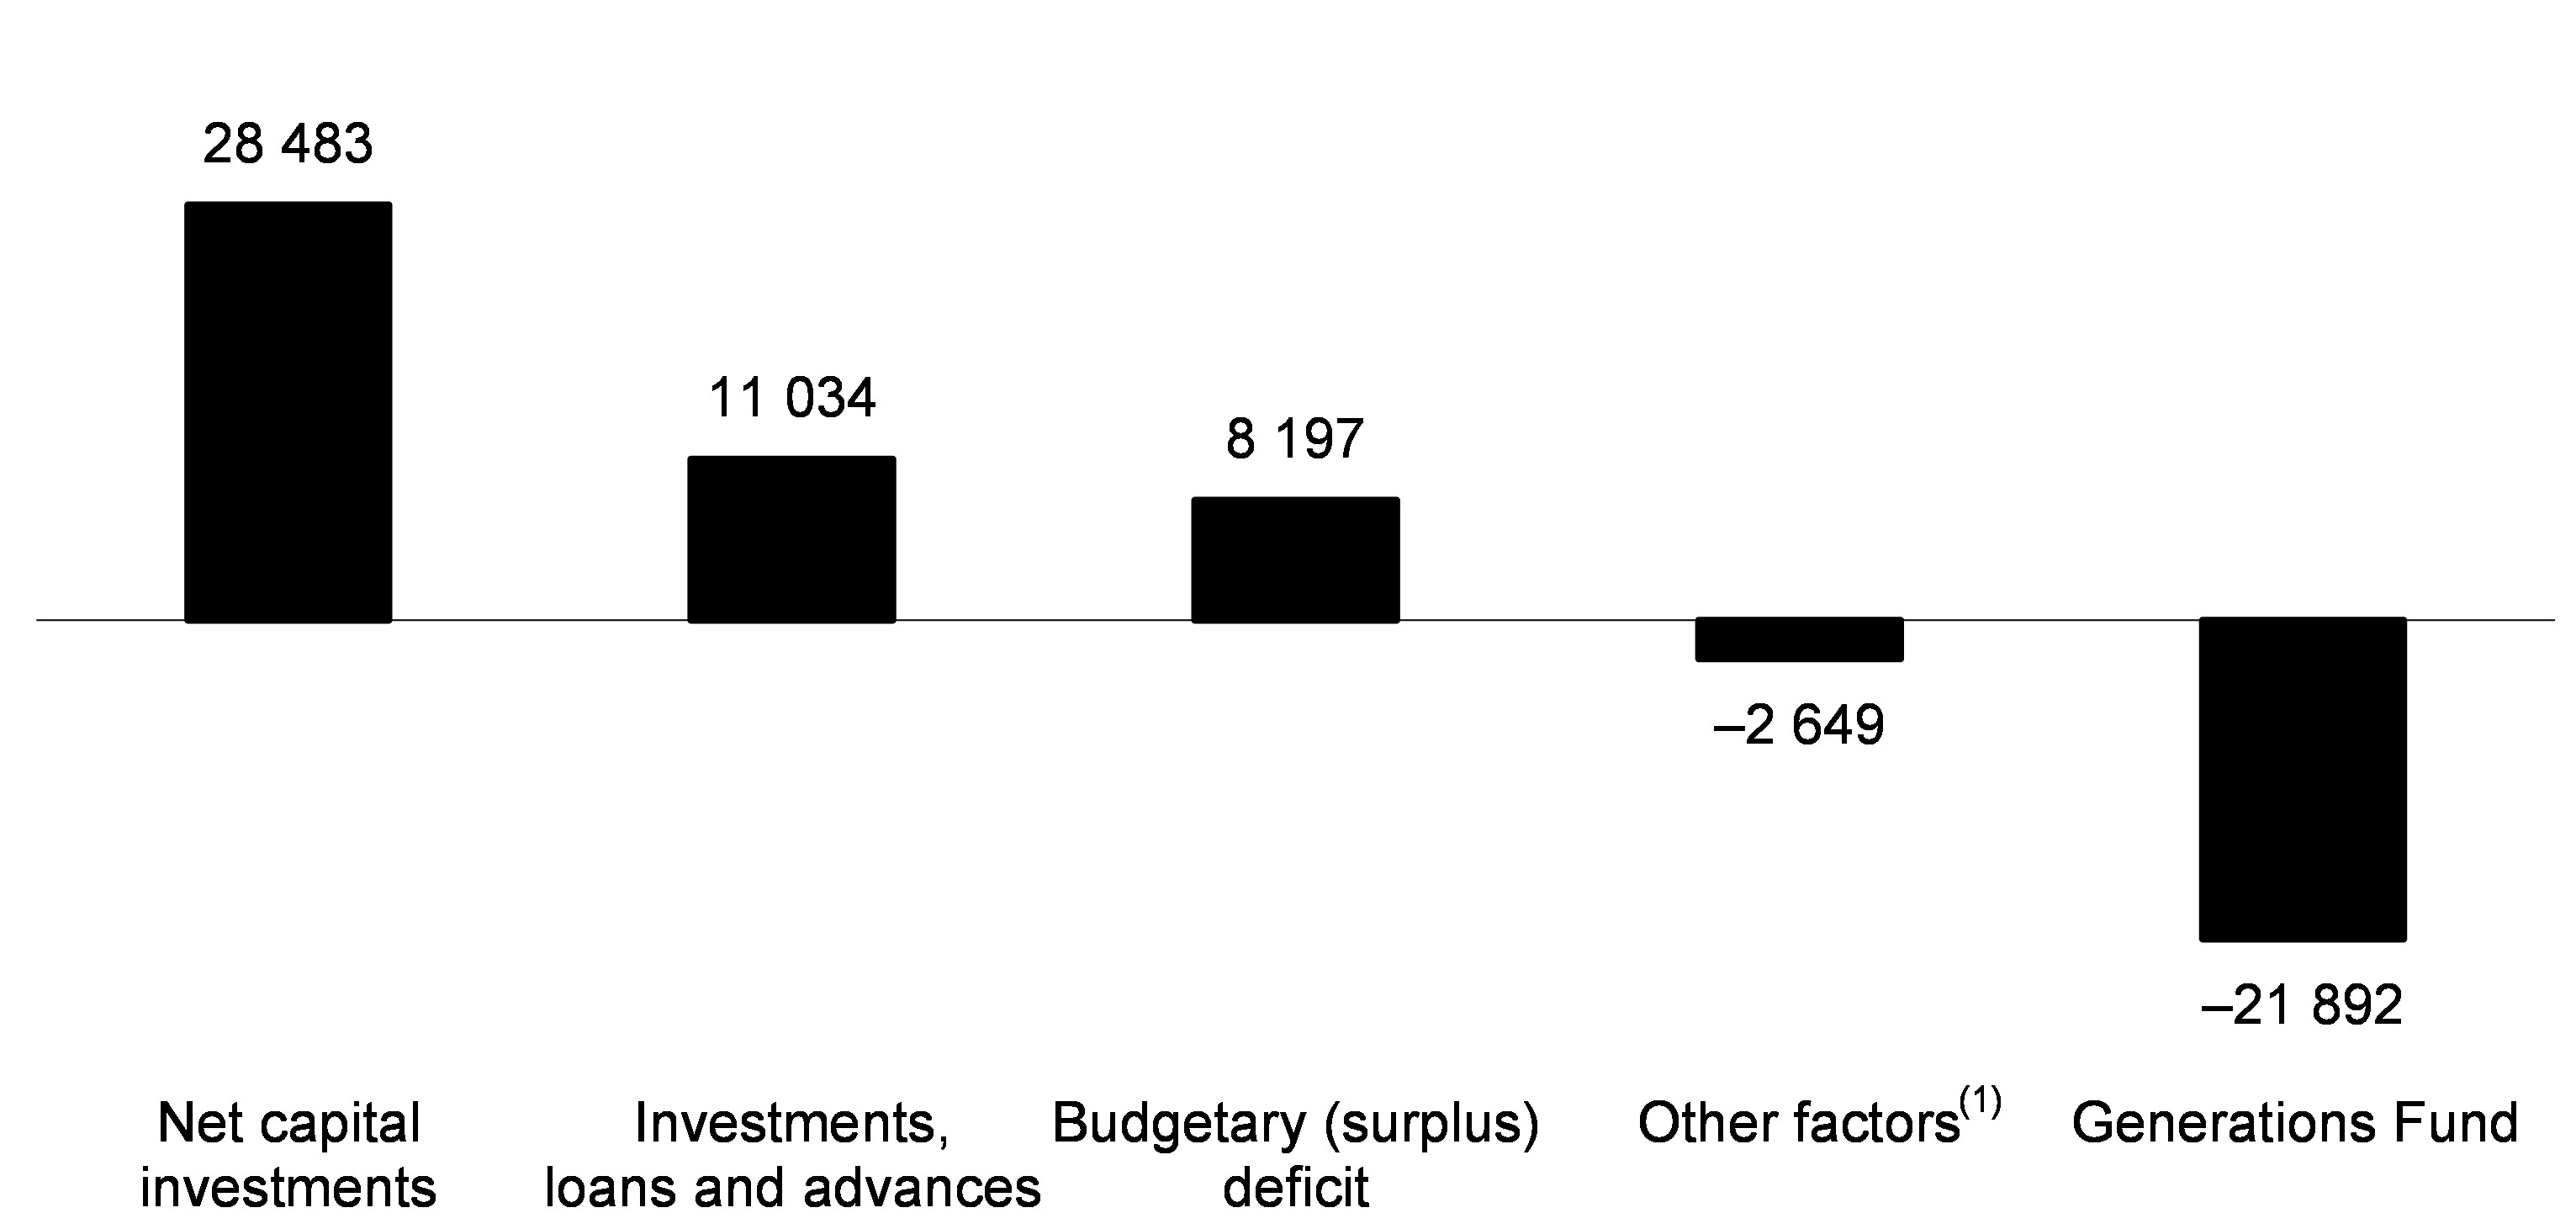
| (1) | The other factors include, in particular, the change in other accounts, such as accounts receivable and accounts payable. |
| ■ | Risks |
Several risks can affect the level of the gross debt, for example:
| — | budgetary deficits further to an economic slowdown would increase the gross debt. Conversely, a stronger economy could lead to smaller deficits or budget surpluses, which would reduce gross debt; |
| — | a potential increase in the level of QIP investments, for example to meet additional public infrastructure needs or to address rising construction costs, would result in an increase in the gross debt through an increase in: |
| — | net capital investments for government-owned infrastructure that are subject to depreciation, |
| — | transfer payments, included in portfolio expenditures, for non-government-owned infrastructure; |
| — | a lower rate of realization of QIP investments would in turn result in a smaller-than-expected increase in gross debt. |
The amounts dedicated to the Generations Fund are managed by the Caisse de dépôt et placement du Québec, in accordance with an investment policy established by the Ministère des Finances in collaboration with the Caisse.
The investment income of the Generations Fund is subject to the risk that, because of changes in the economic and financial situation, the return will be different from that anticipated.
| ■ | Sensitivity analysis |
| — | A budgetary deficit or an increase in the QIP would drive up the gross debt by the same amount. |
| — | A return achieved by the Generations Fund that is 1 percentage point different from the expected return would result in a change in the debt of $165 million in the first year. |
| | | Québec’s Debt | 77 |
| 5. | Reports on the application of the legislation respecting a balanced budget and the Generations Fund |
| 5.1 | The Balanced Budget Act |
The purpose of the Balanced Budget Act is to oblige the government to maintain a balanced budget and to table a balanced financial framework. Generally speaking, the Act sets out the applicable rules in the case of a surplus or a deficit.
| q | Budgetary balance within the meaning of the Balanced Budget Act |
The objectives of the Balanced Budget Act are achieved if the budgetary balance, calculated in accordance with the Act, is zero or positive.
| — | The budgetary balance corresponds essentially to the surplus or the deficit presented in the Québec government’s public accounts (book balance) reduced by the amount of revenues dedicated to the Generations Fund and adjusted to take certain accounting changes into consideration, if applicable. |
| — | For the purpose of calculating the attainment of fiscal balance, the balance must also take into account the use of the stabilization reserve, of which the sums available depend on the budgetary surpluses of previous years. |
From 2015-2016 to 2019-2020, a balanced budget was achieved. The surpluses recorded were entirely earmarked for the stabilization reserve, in accordance with the Act, thereby bringing the budgetary balance calculated, after the reserve was considered, to zero for each of the fiscal years.
CHART 7
Budgetary balance from 2015-2016 to 2022-2023
(millions of dollars)

| (1) | Budgetary balance within the meaning of the Balanced Budget Act, which takes into account allocations to the stabilization reserve and the uses of the reserve to maintain a balanced budget or reduce the budgetary deficit. |
| | | Reports on the Application of the Legislation Respecting a Balanced Budget and the Generations Fund | 79 |
For fiscal years 2020-2021 and 2021-2022, the budgetary balance within the meaning of the Act was maintained with the use of the stabilization reserve in the amount of $10.8 billion and $0.3��billion respectively.
For 2022-2023, the budgetary balance within the meaning of the Act shows a deficit of approximately $0.7 billion after the use of the stabilization reserve in the amount of $0.9 billion.
| — | The expected deficits for 2022-2023 is permissible, as the Act respecting the implementation of certain provisions of the Budget Speech of March 25, 2021 and amending other provisions temporarily suspended the prohibition to have an actual or estimated budgetary deficit. |
| Suspension of certain effects of the Balanced Budget Act |
The Balanced Budget Act was amended by the Act respecting the implementation of certain provisions of the Budget Speech of March 25, 2021 and amending other provisions, assented to on February 24, 2022, which suspends certain effects of the Balanced Budget Act as of fiscal 2021-2022 until the end of the fiscal year as determined by the Minister of Finance on or before the budget speech for fiscal 2023-2024.
The effects targeted by the suspension are:
– the prohibition to have an actual or estimated budgetary deficit;
– the presentation of a plan to return to a balanced budget;
– the obligation to offset budgetary overruns.
|
| 80 | Pre-election Report on the State of Québec’s Public Finances – August 2022 | | |
TABLE 34
Budgetary balance within the meaning of the Balanced Budget Act
(millions of dollars)
| Fiscal year | Surplus (deficit) presented in the public accounts | Dedicated revenues in the Generations Fund | Accounting changes and other | (1) | Budgetary balance within the meaning of the Act | Stabilization reserve | Budgetary balance within the meaning of the Act after reserve | (2) | ||||||||||||||||||||
| Allocations | Uses | |||||||||||||||||||||||||||
| 2015-2016 | 3 456 | (3) | −1 453 | 188 | 2 191 | −2 191 | — | — | ||||||||||||||||||||
| 2016-2017 | 4 147 | (3) | −2 001 | 215 | 2 361 | −2 361 | — | — | ||||||||||||||||||||
| 2017-2018 | 3 014 | (3) | −2 293 | 1 901 | 2 622 | −2 622 | — | — | ||||||||||||||||||||
| 2018-2019 | 7 890 | (3) | −3 477 | 390 | 4 803 | −4 803 | — | — | ||||||||||||||||||||
| 2019-2020 | 2 083 | (3) | −2 606 | 527 | 4 | −4 | — | — | ||||||||||||||||||||
| 2020-2021 | −4 226 | −3 313 | −3 221 | −10 760 | — | 10 760 | — | |||||||||||||||||||||
| 2021-2022 | 3 323 | −3 617 | — | -294 | — | 294 | — | |||||||||||||||||||||
| 2022-2023 | 1 772 | −3 428 | — | −1 656 | — | 927 | −729 | (4) | ||||||||||||||||||||
| 2023-2024 | 2 678 | −3 955 | — | −1 277 | — | — | −1 277 | (4) | ||||||||||||||||||||
| 2024-2025 | 3 133 | −4 546 | — | −1 413 | — | — | −1 413 | (4) | ||||||||||||||||||||
| 2025-2026 | 2 893 | −4 800 | — | −1 907 | — | — | −1 907 | (4) | ||||||||||||||||||||
| 2026-2027 | 3 219 | −5 163 | — | −1 944 | — | — | −1 944 | (4) | ||||||||||||||||||||
| (1) | In order to comply with the provisions of the Balanced Budget Act, it is necessary to make adjustments to annual surpluses and deficits restated in the Québec government’s public accounts to establish the budgetary balance. Accordingly, adjustments were made to take into account the change in application of the accounting standard respecting transfer payments and its impact on the accumulated deficit in 2020-2021. |
| (2) | Budgetary balance within the meaning of the Balanced Budget Act after reserve corresponds to the budgetary balance that takes into account the allocations to the stabilization reserve and the uses of the reserve in order to maintain a balanced budget or reduce the budgetary deficit. |
| (3) | The annual surplus (deficits) have been restated to reflect the change in application of the accounting standard respecting transfer payments. |
| (4) | Amendments have been made to the Balanced Budget Act to suspend the obligation to achieve a balanced budget from 2021-2022 to the end of the fiscal year determined by the Minister of Finance, on or before the budget speech for fiscal 2023-2024. After the end of the fiscal year determined by the Minister of Finance, deficits will be controlled by the provisions of the Balanced Budget Act for the deficit reduction plan. |
| | | Reports on the Application of the Legislation Respecting a Balanced Budget and the Generations Fund | 81 |
| 5.2 | The Act to reduce the debt and establish the Generations Fund |
| q | Debt reduction targets |
The Act to reduce the debt and establish the Generations Fund stipulates that, for fiscal 2025-2026, the gross debt must not exceed 45% of GDP while the debt representing accumulated deficits must not exceed 17% of GDP.
The achievement of these two objectives is currently planned:
| — | the gross debt-to-GDP ratio is expected to stand at 37.7% as at March 31, 2026, which is below the 45% objective; |
| — | the debt representing accumulated deficits-to-GDP ratio is expected to stand at 15.4% as at March 31, 2026, which is below the 17% objective. |
Reducing the debt burden remains a priority for the government. As indicated in the 2022-2023 budget, the government intends to propose changes to the Act to reduce the debt and establish the Generations Fund in the 2023-2024 budget. A new debt reduction objective covering the next 10 or 15 years will then be set. Like Ontario and other provinces, Québec could focus its reporting on the net debt.
| q | Amounts dedicated to the Generations Fund |
In 2022-2023, deposits of dedicated revenues in the Generations Fund will reach $3.4 billion.
For 2023-2024 and 2024-2025, $4.0 billion and $4.5 billion will respectively be deposited in the Generations Fund.
| q | Change in the Generations Fund |
The book value of the Generations Fund is expected to stand at $19.3 billion as at March 31, 2023 and at $37.7 billion as at March 31, 2027. Pursuant to the Act to reduce the debt and establish the Generations Fund, this amount can only be used to repay debt on the financial markets.
| 82 | Pre-election Report on the State of Québec’s Public Finances – August 2022 | | |
TABLE 35
Generations Fund
(millions of dollars)
| 2021- 2022- | 2022- 2023- | 2023- 2024- | 2024- 2025- | 2025- 2026- | 2026- 2027- | |||||||||||||||||||
| Book value, beginning of year | 12 212 | 15 829 | 19 257 | 23 212 | 27 758 | 32 558 | ||||||||||||||||||
| Dedicated revenues | ||||||||||||||||||||||||
| Water-power royalties | ||||||||||||||||||||||||
| Hydro-Québec | 765 | 782 | 809 | 837 | 869 | 918 | ||||||||||||||||||
| Private producers | 102 | 107 | 109 | 111 | 113 | 116 | ||||||||||||||||||
| Subtotal | 867 | 889 | 918 | 948 | 982 | 1 034 | ||||||||||||||||||
| Indexation of the price of heritage electricity | 488 | 550 | 780 | 1 125 | 1 260 | 1 385 | ||||||||||||||||||
| Additional contribution from Hydro-Québec | 215 | 215 | 215 | 215 | 215 | 215 | ||||||||||||||||||
| Mining revenues | 1 032 | 550 | 449 | 402 | 418 | 385 | ||||||||||||||||||
| Specific tax on alcoholic beverages | 500 | 500 | 500 | 500 | 500 | 500 | ||||||||||||||||||
| Unclaimed property | 31 | 55 | 171 | 249 | 111 | 109 | ||||||||||||||||||
| Investment income(1) | 484 | 669 | 922 | 1 107 | 1 314 | 1 535 | ||||||||||||||||||
| Total dedicated revenues | 3 617 | 3 428 | 3 955 | 4 546 | 4 800 | 5 163 | ||||||||||||||||||
| BOOK VALUE, END OF YEAR | 15 829 | 19 257 | 23 212 | 27 758 | 32 558 | 37 721 | ||||||||||||||||||
| (1) | The investment income of the Generations Fund corresponds to realized investment income (interest income, dividends, gains on the disposition of assets, etc.). The forecast can therefore be adjusted upward or downward depending on the time at which the gains or losses are actually realized. An annual return of 4.6% is expected based on six historical years. Moreover, the expected long-term return, including unrealized revenue, is 5.9%. |
| | | Reports on the Application of the Legislation Respecting a Balanced Budget and the Generations Fund | 83 |
| Book value and fair value of the Generations Fund |
The following table shows the book value and the fair value of the Generations Fund since 2011. The book value is used to calculate the gross debt. Contrary to the fair value, the book value only includes realized investment income (interest income, dividends, gains on the disposition of assets, etc.). The difference between the book value and the fair value represents unrealized gains.
As at March 31, 2022, the fair value of the Generations Fund was $17.6 billion, that is, $1.8 billion more than its $15.8 billion book value.
Book value and fair value of the Generations Fund as at March 31
(millions of dollars)
| Book value | Fair value(1) | Difference (unrealized gains) | ||||||||||
| 2011 | 3 437 | 3 599 | −162 | |||||||||
| 2012 | 4 277 | 4 508 | −231 | |||||||||
| 2013 | 5 238 | 5 636 | −398 | |||||||||
| 2014 | 5 659 | 6 373 | −714 | |||||||||
| 2015 | 6 938 | 8 271 | −1 333 | |||||||||
| 2016 | 8 522 | 9 717 | −1 195 | |||||||||
| 2017 | 10 523 | 12 324 | −1 801 | |||||||||
| 2018 | 12 816 | 15 101 | −2 285 | |||||||||
| 2019 | 8 293 | 9 882 | −1 589 | |||||||||
| 2020 | 8 899 | 9 776 | −877 | |||||||||
| 2021 | 12 212 | 13 687 | −1 475 | |||||||||
| 2022 | 15 829 | 17 592 | −1 763 | |||||||||
| (1) | The fair value includes the accounts receivable as at March 31, that is, dedicated revenues subsequently collected by the government and then paid to the Caisse de dépôt et placement du Québec. |
| 84 | Pre-election Report on the State of Québec’s Public Finances – August 2022 | | |
APPENDIX 1: Detail of revenues from duties and permits and miscellaneous revenue
| q | Detail of revenues from duties and permits |
Revenues from duties and permits, which will average $5.5 billion from 2022-2023 to 2024-2025, include, in particular:
| — | driver’s licence and registration revenues; |
| — | revenue from natural resources; |
| — | revenue from the carbon market.25 |
TABLE 36
Revenues from duties and permits
(millions of dollars)
| 2021-2022 | 2022-2023 | 2023-2024 | 2024-2025 | |||||||||||||
| Motor vehicles(1) | 1 539 | 1 567 | 1 670 | 1 743 | ||||||||||||
| Natural resources(2) | 2 370 | 1 833 | 1 770 | 1 748 | ||||||||||||
| Greenhouse gas emissions(3) | 1 299 | 1 302 | 1 219 | 1 216 | ||||||||||||
| Other duties and permits(4) | 840 | 816 | 835 | 838 | ||||||||||||
| TOTAL | 6 049 | 5 518 | 5 494 | 5 544 | ||||||||||||
Note: Totals may not add due to rounding.
| (1) | This revenue includes mainly driver’s licence and vehicle registration fees. |
| (2) | Corresponds primarily to revenue from royalties on the development of mining, forest and water resources. |
| (3) | These revenues are those from the carbon market (cap-and-trade system for greenhouse gas emission allowances). |
| (4) | Other duties and permits include, in particular, those of the Régie du bâtiment du Québec and the Autorité des marchés financiers (contributions, premiums, permits, licences, etc.) as well as royalties on the elimination of residual materials. |
| 25 | Cap-and-trade system for greenhouse gas emission allowances. |
| | | Appendix 1: Detail of Revenues from Duties and Permits and Miscellaneous Revenue | 85 |
| q | Detail of miscellaneous revenue |
Miscellaneous revenue, which will total on average $12.4 billion from 2022-2023 to 2024-2025, includes, in particular:
| — | revenue from the sales of goods and services, such as premiums paid by participants of the Prescription drug insurance fund; |
| — | user contributions, such as parking fees in the health and social services network; |
| — | interest related to the main tax legislation; |
| — | fines, forfeitures and recoveries, for example, for violations of the Highway Safety Code; |
| — | investment income from the Generations Fund. |
TABLE 37
Miscellaneous revenue
(millions of dollars)
| 2021-2022 | 2022-2023 | 2023-2024 | 2024-2025 | |||||||||||||
| Bodies in the health and social services network(1) | 2 853 | 2 547 | 2 660 | 2 688 | ||||||||||||
| Bodies in the education and higher education network(2) | 1 755 | 1 916 | 1 961 | 2 015 | ||||||||||||
| Prescription drug insurance fund(3) | 1 648 | 1 612 | 1 739 | 1 844 | ||||||||||||
| Interest, fines, forfeitures and recoveries of departments | 1 290 | 1 122 | 1 129 | 1 151 | ||||||||||||
| Generations Fund(4) | 515 | 724 | 1 093 | 1 356 | ||||||||||||
| Sales of goods and services by departments | 369 | 370 | 369 | 367 | ||||||||||||
| Police Services Fund(5) | 367 | 385 | 402 | 416 | ||||||||||||
| Other miscellaneous revenue(6) | 2 105 | 2 953 | 3 097 | 3 224 | ||||||||||||
| TOTAL | 10 902 | 11 629 | 12 450 | 13 061 | ||||||||||||
| (1) | This revenue includes, in particular, revenue from places in CHSLDs, as well as parking and cafeteria revenues. |
| (2) | This revenue includes, in particular, tuition fee and school transportation revenues. |
| (3) | This revenue includes revenue from premiums paid by participants and persons aged 65 and over. |
| (4) | This revenue includes mainly investment income and unclaimed property. |
| (5) | This revenue includes, in particular, revenue from the billing of municipalities. |
| (6) | This revenue includes the miscellaneous revenue of more than 90 other entities included in the government’s reporting entity. |
| 86 | Pre-election Report on the State of Québec’s Public Finances – August 2022 | | |
APPENDIX 2: Additional information on portfolio expenditure forecasts
TABLE 38
Change in expenditure by departmental portfolio – After expenditure associated with COVID-19 support and recovery measures
(millions of dollars)
| 2021-2022 | 2022-2023 | 2023-2024 | 2024-2025 | |||||||||||||
| Santé et Services sociaux | 57 736 | 55 894 | 59 121 | 61 170 | ||||||||||||
| % change | 5.2 | –3.2 | 5.8 | 3.5 | ||||||||||||
| Éducation | 17 840 | 19 272 | 20 248 | 20 947 | ||||||||||||
| % change | 5.9 | 8.0 | 5.1 | 3.5 | ||||||||||||
| Enseignement supérieur | 8 748 | 10 303 | 10 717 | 11 067 | ||||||||||||
| % change | 2.7 | 17.8 | 4.0 | 3.3 | ||||||||||||
| Famille | 7 443 | 8 060 | 8 301 | 8 417 | ||||||||||||
| % change | 9.4 | 8.3 | 3.0 | 1.4 | ||||||||||||
| Transports | 6 998 | 7 021 | 6 906 | 8 217 | ||||||||||||
| % change | 5.8 | 0.3 | –1.6 | 19.0 | ||||||||||||
| Travail, Emploi et Solidarité sociale | 8 846 | 5 710 | 5 573 | 5 525 | ||||||||||||
| % change | 74.7 | –35.5 | –2.4 | –0.9 | ||||||||||||
| Affaires municipales et Habitation | 3 609 | 4 399 | 4 417 | 4 427 | ||||||||||||
| % change | –9.5 | 21.9 | 0.4 | 0.2 | ||||||||||||
| Économie et Innovation | 3 177 | 3 747 | 3 390 | 3 267 | ||||||||||||
| % change | –7.6 | 17.9 | –9.5 | –3.6 | ||||||||||||
| Environnement et Lutte contre les changements climatiques | 1 850 | 2 233 | 2 213 | 2 198 | ||||||||||||
| % change | 60.3 | 20.7 | –0.9 | –0.7 | ||||||||||||
| Other portfolios(1) | 11 203 | 13 870 | 14 048 | 13 153 | ||||||||||||
| % change | –5.3 | 23.8 | 1.3 | –6.4 | ||||||||||||
| TOTAL | 127 450 | 130 509 | 134 934 | 138 388 | ||||||||||||
| % change | 7.0 | 2.4 | 3.4 | 2.6 | ||||||||||||
| (1) | Other portfolios include inter-portfolio eliminations resulting from the elimination of reciprocal transactions between entities in different portfolios. |
| | | Appendix 2: Additional Information on Portfolio Expenditure Forecasts | 87 |
| q | Expenditure by portfolio after inter-portfolio eliminations |
The forecasts by portfolio correspond to government investments in various activity sectors. The expenditure level presented also provides an additional budget management tool that helps hold public decision-makers accountable for their entire departmental portfolio.
However, in order to ensure that the presentation of budget forecasts is consistent with that of the Québec government’s public accounts, which is governed by accounting standards, the following table presents portfolio expenditures after inter-portfolio eliminations have been allocated.
| — | Inter-portfolio eliminations result from the elimination of reciprocal transactions between entities in different portfolios. |
| 88 | Pre-election Report on the State of Québec’s Public Finances – August 2022 | | |
TABLE 39
Expenditure by departmental portfolio after inter-portfolio eliminations in 2022-2023 – After expenditure associates with COVID-19 support and recovery measures
(millions of dollars)
| Expenditure before allocation of inter-portfolio eliminations | Inter-portfolio eliminations | Expenditure after allocation of inter-portfolio eliminations | ||||||||||
| National Assembly | 167 | –7 | 160 | |||||||||
| Officers of the National Assembly | 238 | –6 | 232 | |||||||||
| Affaires municipales et Habitation | 4 399 | –28 | 4 371 | |||||||||
| Agriculture, Pêcheries et Alimentation | 1 382 | –24 | 1 358 | |||||||||
| Conseil du trésor et Administration gouvernementale | 2 864 | –1 059 | 1 805 | |||||||||
| Conseil exécutif | 981 | –12 | 969 | |||||||||
| Culture et Communications | 1 831 | –29 | 1 802 | |||||||||
| Cybersécurité et Numérique | 663 | –454 | 209 | |||||||||
| Économie et Innovation | 3 747 | –228 | 3 519 | |||||||||
| Éducation | 19 272 | –692 | 18 580 | |||||||||
| Énergie et Ressources naturelles | 878 | –58 | 820 | |||||||||
| Enseignement supérieur | 10 303 | –173 | 10 130 | |||||||||
| Environnement et Lutte contre les changements climatiques | 2 233 | –317 | 1 916 | |||||||||
| Famille | 8 060 | –23 | 8 037 | |||||||||
| Finances | 4 066 | –311 | 3 755 | |||||||||
| Forêts, Faune et Parcs | 1 175 | –46 | 1 129 | |||||||||
| Immigration, Francisation et Intégration | 666 | –35 | 631 | |||||||||
| Justice | 1 520 | –59 | 1 461 | |||||||||
| Relations internationales et Francophonie | 140 | –10 | 130 | |||||||||
| Santé et Services sociaux | 55 894 | –1 503 | 54 391 | |||||||||
| Sécurité publique | 2 375 | –170 | 2 205 | |||||||||
| Tourisme | 513 | –9 | 504 | |||||||||
| Transports | 7 021 | –90 | 6 931 | |||||||||
| Travail, Emploi et Solidarité sociale | 5 710 | –246 | 5 464 | |||||||||
| Inter-portfolio eliminations | –5 589 | 5 589 | — | |||||||||
| TOTAL | 130 509 | — | 130 509 | |||||||||
Note: Totals may not add due to rounding.
| | | Appendix 2: Additional Information on Portfolio Expenditure Forecasts | 89 |
APPENDIX 3: List of entities by departmental portfolio
TABLE 40
Bodies included in the government’s reporting entity
| Affaires municipales et Habitation | Culture et Communications | |||
| Ministère des Affaires municipales | Ministère de la Culture | |||
| et de l’Habitation | Dept | et des Communications | Dept | |
| Commission municipale du Québec | BFB | Conseil du patrimoine culturel du Québec | BFB | |
| Administrative Housing Tribunal | BFB | Avenir Mécénat Culture Fund | SF | |
| Regions and Rurality Fund | SF | Québec Cultural Heritage Fund | SF | |
| Régie du bâtiment du Québec | NBFB | Bibliothèque et Archives nationales | ||
| Société d’habitation du Québec | NBFB | du Québec | NBFB | |
| Conseil des arts et des lettres du Québec | NBFB | |||
| Agriculture, Pêcheries et Alimentation | Conservatoire de musique et d’art | |||
| Ministère de l’Agriculture, des Pêcheries | dramatique du Québec | NBFB | ||
| et de l’Alimentation | Dept | Musée d’Art contemporain de Montréal | NBFB | |
| Commission de protection du territoire | Musée de la Civilisation | NBFB | ||
| agricole du Québec | BFB | Musée national des beaux-arts du Québec | NBFB | |
| Régie des marchés agricoles et alimentaires | Société de développement des entreprises | |||
| du Québec | BFB | culturelles | NBFB | |
| Institut de technologie agroalimentaire | Société de la Place des Arts de Montréal | NBFB | ||
| du Québec | NBFB | Société de télédiffusion du Québec | NBFB | |
| La Financière agricole du Québec | NBFB | Société du Grand Théâtre de Québec | NBFB | |
| National Assembly | Cybersécurité et Numérique | |||
| National Assembly | Other | Ministère de la Cybersécurité et du Numérique | Dept | |
| Cybersecurity and Digital Technology Fund | SF | |||
| Conseil du trésor et Administration gouvernementale | ||||
| Secrétariat du Conseil du trésor | Dept | Économie et Innovation | ||
| Commission de la fonction publique | BFB | Ministère de l’Économie et de l’Innovation | Dept | |
| Autorité des marchés publics | NBFB | Commission de l’éthique en science | ||
| Centre d’acquisitions gouvernementales | NBFB | et en technologie | BFB | |
| Société québécoise des infrastructures | NBFB | Natural Resources and Energy Capital Fund | SF | |
| Economic Development Fund | SF | |||
| Conseil exécutif | Québec Enterprise Growth Fund | SF | ||
| Ministère du Conseil exécutif | Dept | Fonds de recherche du Québec – Nature | ||
| Commission d’accès à l’information | BFB | et technologies | NBFB | |
| Centre de la francophonie des Amériques | NBFB | Fonds de recherche du Québec – Santé | NBFB | |
| Fonds de recherche du Québec – Société | ||||
| et culture | NBFB |
| Legend: | Dept: department; BFB: budget-funded body; SF: special fund; NBFB: non-budget-funded body; HSSE: body in the health and social services and education and higher education networks. |
| | | Appendix 3: List of Entities by Departmental Portfolio | 91 |
TABLE 40
Bodies included in the government’s reporting entity (cont.)
| Éducation | Environnement et Lutte contre les changements climatiques | |||
| Ministère de l’Éducation | Dept | Ministère de l’Environnement et de la Lutte | ||
| Commission consultative de l’enseignement | contre les changements climatiques | Dept | ||
| privé | BFB | Bureau d’audiences publiques | ||
| Conseil du statut de la femme | BFB | sur l’environnement | BFB | |
| Conseil supérieur de l’éducation | BFB | Fund for the Protection of the Environment | ||
| Sports and Physical Activity Development | and the Waters in the Domain of the State | SF | ||
| Fund | SF | Electrification and Climate Change Fund | SF | |
| Institut national des mines | NBFB | Société québécoise de récupération | ||
| School service centres and school boards | HSSE | et de recyclage | NBFB | |
| Énergie et Ressources naturelles | Famille | |||
| Ministère de l’Énergie et des Ressources | Ministère de la Famille | Dept | ||
| naturelles | Dept | Curateur public | BFB | |
| Territorial Information Fund | SF | Educational Childcare Services Fund | SF | |
| Energy Transition, Innovation | ||||
| and Efficiency Fund | SF | Finances | ||
| Natural Resources Fund | SF | Ministère des Finances | Dept | |
| Régie de l’énergie | NBFB | Financing Fund | SF | |
| Société de développement | Special Contracts and Financial Assistance | |||
| de la Baie-James | NBFB | for Investment Fund | SF | |
| Société du Plan Nord | NBFB | Fund to Combat Addiction | SF | |
| Generations Fund | SF | |||
| Enseignement supérieur | IFC Montréal Fund | SF | ||
| Ministère de l’Enseignement supérieur | Dept | Northern Plan Fund | SF | |
| Comité consultatif sur l’accessibilité financière | Fund of the Financial Markets | |||
| aux études | BFB | Administrative Tribunal | SF | |
| Commission d’évaluation de l’enseignement | Tax Administration Fund | SF | ||
| collégial | BFB | Agence du revenu du Québec | NBFB | |
| University Excellence and Performance Fund | SF | Autorité des marchés financiers | NBFB | |
| Institut de tourisme et d’hôtellerie | Financement-Québec | NBFB | ||
| du Québec | NBFB | Institut de la statistique du Québec | NBFB | |
| Office des professions du Québec | NBFB | Société de financement des infrastructures | ||
| General and vocational colleges (CEGEPs) | HSSE | locales du Québec | NBFB | |
| Université du Québec and its constituents | HSSE | Government enterprises(1) | Other |
| (1) | From a financial perspective, the net income of government enterprises is charged to the Finances portfolio. However, the governance of a government enterprise may fall under another portfolio. |
| 92 | Pre-election Report on the State of Québec’s Public Finances – August 2022 | | |
TABLE 40
Bodies included in the government’s reporting entity (cont.)
| Forêts, Faune et Parcs | Persons appointed by the National Assembly | |||
| Ministère des Forêts, de la Faune | The Ethics Commissioner | BFB | ||
| et des Parcs | Dept | Québec Lobbyists Commissioner | BFB | |
| Natural Resources Fund | SF | Chief Electoral Officer | BFB | |
| Fondation de la faune du Québec | NBFB | Public Protector | BFB | |
| Société des établissements de plein air | Auditor General | BFB | ||
| du Québec | NBFB | |||
| Relations internationales et Francophonie | ||||
| Immigration, Francisation et Intégration | Ministère des Relations internationales | |||
| Ministère de l’Immigration, de la Francisation | et de la Francophonie | Dept | ||
| et de l’Intégration | Dept | Office Québec-Monde pour la jeunesse | NBFB | |
| Justice | Santé et Services sociaux | |||
| Ministère de la Justice | Dept | Ministère de la Santé et des Services sociaux | Dept | |
| Committee on the Remuneration of Judges | BFB | Commissaire à la santé et au bien-être | BFB | |
| Committee on the Remuneration of Criminal | Office des personnes handicapées | |||
| and Penal Prosecuting Attorneys | BFB | du Québec | BFB | |
| Commission des droits de la personne | Cannabis Prevention and Research Fund | SF | ||
| et des droits de la jeunesse | BFB | Health and Social Services Information | ||
| Commission de toponymie(2) | BFB | Resources Fund | SF | |
| Conseil de la justice administrative | BFB | Corporation d’Urgences-santé | NBFB | |
| Conseil de la magistrature | BFB | Fonds de l’assurance médicaments | NBFB | |
| Conseil supérieur de la langue française(2) | BFB | Héma-Québec | NBFB | |
| Directeur des poursuites criminelles | Institut national de santé publique | |||
| et pénales | BFB | du Québec | NBFB | |
| Office de la protection du consommateur | BFB | Institut national d’excellence en santé | ||
| Office québécois de la langue française(2) | BFB | et en services sociaux | NBFB | |
| Human Rights Tribunal | BFB | Régie de l’assurance maladie du Québec | NBFB | |
| Access to Justice Fund | SF | Health and social services network | HSSE | |
| Crime Victims Assistance Fund | SF | |||
| Register Fund of the Ministère de la Justice | SF | |||
| Fund of the Administrative Tribunal of Québec | SF | |||
| Public Contracts Fund | SF | |||
| Commission des services juridiques | NBFB | |||
| Fonds d’aide aux actions collectives | NBFB | |||
| Société québécoise d’information juridique | NBFB |
| (2) | On June 1, 2022, the Ministère de la Langue française was created. De facto, the new department assumes the rights and obligations of the Conseil supérieur de la langue française, that body having been abolished. In addition, the Commission de toponymie and the Office québécois de la langue française now fall under the authority of the Minister of the French Language. The new Langue française portfolio is not included in the table because the 2022 pre-election report is based on the 2022-2023 budget structure and, as at March 22, 2022, this new department had not yet been created. |
| | | Appendix 3: List of Entities by Departmental Portfolio | 93 |
TABLE 40
Bodies included in the government’s reporting entity (cont.)
| Sécurité publique | Travail, Emploi et Solidarité sociale | |||
| Ministère de la Sécurité publique | Dept | Ministère du Travail, de l’Emploi | ||
| Bureau des enquêtes indépendantes | BFB | et de la Solidarité sociale | Dept | |
| Bureau du coroner | BFB | Commission des partenaires du marché | ||
| Comité de déontologie policière | BFB | du travail | BFB | |
| Commissaire à la déontologie policière | BFB | Assistance Fund for Independent | ||
| Commissaire à la lutte contre la corruption | BFB | Community Action | SF | |
| Commission québécoise des libérations conditionnelles | BFB | Labour Market Development Fund | SF | |
| Régie des alcools, des courses et des jeux | BFB | Goods and Services Fund | SF | |
| Capitale-Nationale Region Fund | SF | Information Technology Fund of the | ||
| Police Services Fund | SF | Ministère de l’Emploi et de la Solidarité sociale | SF | |
| Commission de la capitale nationale | Administrative Labour Tribunal Fund | SF | ||
| du Québec | NBFB | Québec Fund for Social Initiatives | SF | |
| École nationale de police du Québec | NBFB | Office de la sécurité économique | ||
| École nationale des pompiers du Québec | NBFB | des chasseurs cris | NBFB | |
| Tourisme | ||||
| Ministère du Tourisme | Dept | |||
| Tourism Partnership Fund | SF | |||
| Société de développement et de mise | ||||
| en valeur du Parc olympique | NBFB | |||
| Société du Centre des congrès de Québec | NBFB | |||
| Société du Palais des congrès de Montréal | NBFB | |||
| Transports | ||||
| Ministère des Transports | Dept | |||
| Commission des transports du Québec | BFB | |||
| Air Service Fund | SF | |||
| Rolling Stock Management Fund | SF | |||
| Highway Safety Fund | SF | |||
| Land Transportation Network Fund | SF | |||
| Société de l’assurance automobile du Québec | NBFB | |||
| Société des Traversiers du Québec | NBFB |
| 94 | Pre-election Report on the State of Québec’s Public Finances – August 2022 | | |
APPENDIX 4: Upcoming changes to accounting standards
The Public Sector Accounting Board (PSAB) has issued new accounting standards that will be effective for the government’s consolidated financial statements beginning in fiscal 2022-2023 and 2023-2024.
The financial impact of some of these new standards is not significant, while others cannot be reasonably estimated at this time. As a result, they have not been incorporated into the Québec government’s revenue, expenditure and debt forecasts for the budget horizon.
In accordance with the Balanced Budget Act, the retroactive effect of any new accounting standard applied directly to the accumulated deficits, that is, for the years preceding the year of its implementation as recommended by the PSAB, is excluded from the calculation of the budgetary balance of the fiscal year for the purposes of this Act.
The government is considering applying these new standards retroactively, where permitted and reasonably possible.
Standards implemented in fiscal 2022-2023:
| — | PS 3450 Financial Instruments (as well as PS 1201 Financial Statement Presentation, PS 3041 Portfolio Investments and PS 2601 Foreign Currency Translation); |
| — | PS 3280 Asset Retirement Obligations. |
Standards in effect during fiscal 2023-2024:
| — | PS 3400 Revenue; |
| — | PS 3160 Public Private Partnerships; |
| — | PSG-8 Purchased Intangibles. |
| | | Appendix 4: Upcoming Changes to Accounting Standards | 95 |
APPENDIX 5: Requirements under the Act respecting the Ministère des Finances and the Auditor General Act
| q | Act respecting the Ministère des Finances (chapter M-24.01) |
| § | Chapter III.1 Pre-election report |
23.1. The Minister shall publish a pre-election report on the third Monday of August preceding the expiry of a Legislature as provided for in section 6 of the Act respecting the National Assembly.
If a Legislature expires in February, the Minister shall publish a new pre-election report on the Monday immediately preceding the expiry.
The assurance report prepared in accordance with section 40.1 of the Auditor General Act must be attached to the pre-election report. It contains the Auditor General’s conclusion on the plausibility, as at the last working day of the sixth week preceding the date of publication of the pre-election report or as at a later date if the Auditor General considers it appropriate, as well as forecasts, projections, estimates and assumptions referred to in sections 23.2 and 23.3.
23.2. The Minister shall include the following in the pre-election report, with any necessary revisions:
1° the economic forecasts and assumptions appearing in the Budget Plan presented in the most recent Budget Speech;
2° the projected components of the Government’s financial framework appearing in the Budget Plan;
3° the estimated expenditures, established in collaboration with the Chair of the Conseil du trésor and broken down by field of State activity; and
4° the reports required under section 15 of the Balanced Budget Act and section 11 of the Act to reduce the debt and establish the Generations Fund.
23.3. The projected components of the Government’s financial framework must be presented for a period of five consecutive fiscal years, and the estimated expenditures, broken down by field of State activity, for a period of three consecutive fiscal years, beginning, in both cases, with the fiscal year that includes the date on which the report was published.
23.4. The Minister shall send the draft pre-election report to the Auditor General not later than the first working day of the ninth week preceding its publication date to enable the Auditor General to prepare the assurance report required under section 40.1 of the Auditor General Act.
23.4.1. The Minister may, until the last working day of the sixth week preceding the date of publication of the pre-election report, make changes to the draft pre-election report, especially on the basis of data available at the time of its updating.
23.4.2. A preliminary draft of the financial framework shall be sent to the Auditor General on:
1° in the case of the pre-election report referred to in the first paragraph of section 23.1, the fifth working day after the 20 June preceding the expiry of a Legislature as provided for in the first paragraph of section 6 of the Act respecting the National Assembly; or
2° in the case of the pre-election report referred to in the second paragraph of section 23.1, the first working day before 21 December preceding the expiry of a Legislature as provided for in the third paragraph of section 6 of the Act respecting the National Assembly.
| | | Appendix 5: Requirements under the Act respecting the Ministère des Finances and the Auditor General Act | 97 |
The Minister shall inform the Auditor General of any change the Minister makes to a draft pre-election report under the first paragraph on or before the last working day of the sixth week preceding the date of publication of the pre-election report.
The Minister may also, after the time provided for in the second paragraph, make any other change to the draft pre-election report that arises from the Auditor General’s work. Those changes are sent to the Auditor General without delay.
23.5. On the date the pre-election report is published, the Minister shall send it, with the Auditor General’s assurance report attached, to the President of the National Assembly, who shall table them before the National Assembly within three days after receiving it or, if the Assembly is not sitting, within three days of the opening of the next session or resumption.
As soon as the pre-election report and attached assurance report are sent to the President of the National Assembly, the Minister shall publish them by any means the Minister considers appropriate, without waiting for the President to table them.
| q | Auditor General Act (chapter V-5.01) |
| § | Division III Audit and reports |
| § | 2.1. — Assurance reports on the pre-election report |
40.1. The Auditor General shall prepare an assurance report giving his conclusion on the plausibility of the forecasts and assumptions presented in the pre-election report published by the Minister of Finance under section 23.1 of the Act respecting the Ministère des Finances. The Auditor General may include in the report any comments he considers appropriate in connection with his work involving the pre-election report.
In his report, the Auditor General shall also indicate whether he received all requested information and documents for the preparation of the report.
40.2. The assurance report must cover at least the first three fiscal years reported on in the pre-election report.
However, with regard to the forecasts presented in a pre-election report published in February, the assurance report must cover at least the three fiscal years following the fiscal year that includes the date on which the pre-election report was published.
40.3. The Auditor General shall submit the assurance report to the Minister of Finance not later than the Monday preceding the date of publication of the pre-election report required under section 23.1 of the Act respecting the Ministère des Finances.
40.4. The Auditor General may, if he considers it appropriate, prepare a report detailing his assurance work on the pre-election report.
On or before the date of publication of the pre-election report, the detailed report must be sent by the Auditor General to the President of the National Assembly, who shall table it before the National Assembly along with the pre-election report.
It is published by the Auditor General by any means he considers appropriate, following the publication of the pre-election report by the Minister of Finance, without waiting for the President of the National Assembly to table it.
| 98 | Pre-election Report on the State of Québec’s Public Finances – August 2022 | | |