Exhibit 99.8
PUBLIC ACCOUNTS | Consolidated Financial |
 |
Fiscal year ended March 31, 2023
Published in accordance with section 86
of the Financial Administration Act (CQLR, chapter A-6.001)

Public Accounts 2022-2023 – Volume 1
Legal deposit – Bibliothèque et Archives nationales du Québec
December 2023
ISSN 0706-2850 (Print version)
ISSN 1925-1823 (PDF)
© Gouvernement du Québec, 2023
His Honour the Honourable J. Michel Doyon
Lieutenant-Governor of Québec
Parliament Building
Québec
Your Honour,
I am pleased to present you with the Public Accounts of the Gouvernement du Québec for the fiscal year ended March 31, 2023. They are presented in two volumes:
Volume 1 includes the consolidated financial statements of the Gouvernement du Québec audited by the Auditor General of Québec, a financial analysis of these financial statements, the budgetary balance established in accordance with the Balanced Budget Act, the balance of the stabilization reserve as well as changes in main trends, including those of the government’s consolidated revenue and expenditure, net debt and gross debt over 10 fiscal years.
Volume 2 includes the report of excess expenditures and other costs of budgetary departments and bodies over appropriations approved by Parliament and the report of special funds’ excess expenditures and investments over amounts approved by Parliament as well as detailed information for each department, budgetary body, and special fund.
Respectfully yours,
Eric Girard
Minister of Finance
Québec, December 2023
Mr. Eric Girard
Minister of Finance
Parliament Building
Québec
Dear Minister,
In accordance with the commission entrusted to me, I have the honour of presenting the Public Accounts of the Gouvernement du Québec for the fiscal year ended March 31, 2023. These accounts have been prepared under section 86 of the Financial Administration Act (CQLR, chapter A-6.001), in accordance with the government’s accounting policies and the public sector accounting standards.
Respectfully yours,
Lucie Pageau, CPA
Comptroller of Finance
Québec, December 2023
Table of contents
Presentation of the Public Accounts
The Public Accounts 2022-2023 have been prepared by the Comptroller of Finance for the Minister of Finance in accordance with the accounting policies adopted by the Conseil du trésor and the public sector accounting standards and pursuant to the provisions of section 86 of the Financial Administration Act (CQLR, chapter A-6.001). They are published in two volumes. In addition to these volumes, further information is published on the Ministère des Finances website in the section Public Accounts 2022-2023 – In brief.
Volume 1 – Consolidated financial statements of the Gouvernement du Québec
Volume 1 presents the results and financial position of the Gouvernement du Québec. The financial operations include those of the National Assembly, of the people it appoints, of the government departments, and of all bodies, funds and enterprises controlled by the government.
Volume 1 presents a financial analysis to increase the usefulness and transparency of these consolidated financial statements. The analysis includes the highlights for the 2022-2023 fiscal year and compares the actual results with both forecast results forecast in the 2022-2023 budget and the 2021-2022 results. It also presents the government’s budget balance in compliance with the Balanced Budget Act as well as the stabilization reserve’s balance. Finally, it presents the development of main trends relating to important items in the consolidated financial statements and the outcome of the analysis of 11 indicators.
In accordance with the Auditor General Act (CQLR, chapter V-5.01), the Auditor General of Québec prepares an Independent Auditor’s Report included with the government’s consolidated financial statements and in which she expresses her opinion on the financial statements.
Volume 2 – Financial information on the Consolidated Revenue Fund: general fund and special funds
Volume 2 presents the financial information on the Consolidated Revenue Fund, which is made up of the general fund and the special funds. This volume is divided into two sections. The first section shows the revenue of government departments and budget-funded bodies, their authorized appropriations, the expenses and other costs charged to each of these appropriations and, lastly, the financial operations of the specified purpose accounts they administer. The second section presents the revenue of the special funds as well as their approved and realized expenses and investments.
Acknowledgements
Preparing the Public Accounts requires the participation and collaboration of many employees from different government departments, funds, bodies, and organizations in the health and social services, education and higher education networks as well as employees from government enterprises. We would like to thank all of them for their help in preparing these documents.
| PUBLIC ACCOUNTS 2022-2023 | 1 |
CONSOLIDATED
FINANCIAL STATEMENTS
▌ 1. Highlights of the 2022-2023 fiscal year
Summary of consolidated results
Fiscal year ended March 31, 2023
(millions of dollars)
| Budget 2022-2023 (1),(2) | Actual results as at March 31, 2023 | Change compared with Budget | Actual results as at March 31, 2022 (3) | Change compared with the 2021-2022 actual results | ||||||||||||||||||||||||
| M$ | % | (restated) | M$ | % | ||||||||||||||||||||||||
| REVENUE | ||||||||||||||||||||||||||||
| Income and property taxes | 60 506 | 64 521 | 4 015 | 6.6 | 62 328 | 2 193 | 3.5 | |||||||||||||||||||||
| Consumption taxes | 26 706 | 26 597 | (109 | ) | (0.4 | ) | 24 597 | 2 000 | 8.1 | |||||||||||||||||||
| Duties and permits | 5 171 | 5 741 | 570 | 11.0 | 6 057 | (316 | ) | (5.2 | ) | |||||||||||||||||||
| Miscellaneous revenue | 11 680 | 12 083 | 403 | 3.5 | 10 705 | 1 378 | 12.9 | |||||||||||||||||||||
| Revenue from government enterprises | 5 628 | 6 620 | 992 | 17.6 | 5 960 | 660 | 11.1 | |||||||||||||||||||||
| Own-source revenue | 109 691 | 115 562 | 5 871 | 5.4 | 109 647 | 5 915 | 5.4 | |||||||||||||||||||||
| Federal government transfers | 28 790 | 28 737 | (53 | ) | (0.2 | ) | 29 184 | (447 | ) | (1.5 | ) | |||||||||||||||||
| Total revenue | 138 481 | 144 299 | 5 818 | 4.2 | 138 831 | 5 468 | 3.9 | |||||||||||||||||||||
| EXPENDITURE | ||||||||||||||||||||||||||||
| Santé et Services sociaux | 54 459 | 59 406 | 4 947 | 9.1 | 56 668 | 2 738 | 4.8 | |||||||||||||||||||||
| Éducation | 18 689 | 19 499 | 810 | 4.3 | 17 405 | 2 094 | 12.0 | |||||||||||||||||||||
| Enseignement supérieur | 10 010 | 9 655 | (355 | ) | (3.5 | ) | 8 747 | 908 | 10.4 | |||||||||||||||||||
| Famille | 7 893 | 7 835 | (58 | ) | (0.7 | ) | 7 277 | 558 | 7.7 | |||||||||||||||||||
| Transports et Mobilité durable | 7 115 | 6 451 | (664 | ) | (9.3 | ) | 7 017 | (566 | ) | (8.1 | ) | |||||||||||||||||
| Emploi et Solidarité sociale | 5 390 | 8 983 | 3 593 | 66.7 | 8 385 | 598 | 7.1 | |||||||||||||||||||||
| Affaires municipales et Habitation | 3 929 | 4 928 | 999 | 25.4 | 3 541 | 1 387 | 39.2 | |||||||||||||||||||||
| Économie, Innovation et Énergie | 3 656 | 3 205 | (451 | ) | (12.3 | ) | 3 064 | 141 | 4.6 | |||||||||||||||||||
| Environnement, Lutte contre les changements climatiques, Faune et Parcs | 1 859 | 1 673 | (186 | ) | (10.0 | ) | 1 730 | (57 | ) | (3.3 | ) | |||||||||||||||||
| Others portfolios | 17 144 | 15 608 | (1 536 | ) | (9.0 | ) | 13 739 | 1 869 | 13.6 | |||||||||||||||||||
| Sub-total | 130 144 | 137 243 | 7 099 | 5.5 | 127 573 | 9 670 | 7.6 | |||||||||||||||||||||
| Debt service | 8 842 | 10 058 | 1 216 | 13.8 | 8 640 | 1 418 | 16.4 | |||||||||||||||||||||
| Total expenditure | 138 986 | 147 301 | 8 315 | 6.0 | 136 213 | 11 088 | 8.1 | |||||||||||||||||||||
| Provision for economic risks and other support and recovery measures | 2 500 | (2 500 | ) | (100.0 | ) | |||||||||||||||||||||||
| (DEFICIT) ANNUAL OPERATING SURPLUS | (3 005 | ) | (3 002 | ) | 3 | — | 2 618 | (5 620 | ) | — | ||||||||||||||||||
| (1) | These numbers correspond to data presented in Budget 2022-2023 of the Ministère des Finances tabled on March 22, 2022, adjusted to reflect changes in the composition of portfolios following shifts in ministers’ responsibilities in the fall of 2022. In addition, the forecast related to the change in application of the accounting standard respecting transfer payments as well as certain items that were presented differently in budget have been reclassified in the different portfolios to ensure their comparability with the actual expenditures recorded at March 31, 2023. Details of these reclassifications are presented in Note 3 of the consolidated financial statements. |
| (2) | For the purposes of establishing budget forecasts, certain factors that constitute risk and uncertainty factors do not depend directly on the government but can lead to real results that differ from those anticipated. Such factors are presented in Appendix 1, “Risks and uncertainties”. |
| (3) | Certain figures for 2021-2022 have been reclassified for consistency with the presentation adopted as at March 31, 2023. |
| ANALYSIS OF THE CONSOLIDATED FINANCIAL STATEMENTS | 5 |
1. Highlights of the 2022-2023 fiscal year (cont’d)
| 6 | PUBLIC ACCOUNTS 2022-2023 |
1. Highlights of the 2022-2023 fiscal year (cont’d)
| ANALYSIS OF THE CONSOLIDATED FINANCIAL STATEMENTS | 7 |
1. Highlights of the 2022-2023 fiscal year (cont’d)
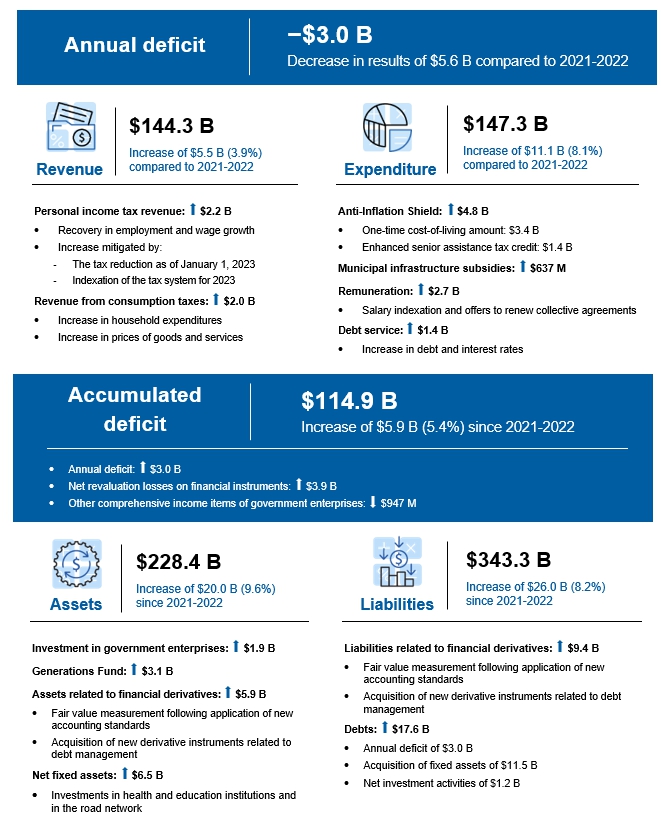
Budget balance
In Budget 2022-2023, tabled on March 22, 2022, the government forecast a deficit of $3 005 million for fiscal 2022-2023 as well as a budgetary deficit of $6 450 million within the meaning of the Balanced Budget Act (CQLR, chapter E-12.00001), taking into account the payment of $3 445 million in dedicated revenue to the Generations Fund.
The consolidated financial statements of the Gouvernement du Québec for the fiscal year ended March 31, 2023 show an annual operating deficit of $3 002 million. Taking into account deposits of revenues dedicated to the Generations Fund of $3 082 million, the budgetary balance for the fiscal year ended March 31, 2023 shows a deficit of $6 084 million. Within the meaning of the Balanced Budget Act, after using the entire stabilization reserve, the government’s budgetary balance shows a deficit of $5 635 million.
In 2021-2022, in the context of the pandemic and in order to gradually reduce the deficit without adversely affecting services to Quebecers nor the sustainable recovery of economic growth, the provisions of the Balanced Budget Act prohibiting an actual or forecast budgetary deficit, and those requiring the elimination of any deficit, were suspended. These suspensions remained in effect until 2022-2023. The lifting of these suspensions, announced in the 2023-2024 budget speech, became effective on April 1, 2023. In accordance with the provisions of the Act, the plan to restore fiscal balance that accompanied the 2023-2024 budget provides a framework for forecast deficits until a balanced budget is achieved in 2027-2028.
In accordance with the standards set out by the Public Sector Accounting Board, the financial analysis that accompanies the government’s consolidated financial statements compares real results with those in its initial budget, adjusted to take into account some reclassifications,1 as well as those of the previous fiscal year.
| 1 | The budget forecasts for expenditures by portfolios have been reclassified to ensure comparability with actual expenditures recorded as at March 31, 2023. Details of these reclassifications are presented in Note 3, “Reclassification of comparative financial information” of the consolidated financial statements. |
| 8 | PUBLIC ACCOUNTS 2022-2023 |
2. Variance analysis (cont’d)
Income and property taxes
Fiscal year ended March 31, 2023
(millions of dollars)
| Budget 2022-2023 | Actual results | Change with | Actual results | Change with 2021-2022 actual results | ||||||||||||||||||||||||
| M$ | % | M$ | % | |||||||||||||||||||||||||
| Personal income tax | 41 147 | 42 251 | 1 104 | 2.7 | 40 924 | 1 327 | 3.2 | |||||||||||||||||||||
| Contributions for health services | 7 299 | 7 914 | 615 | 8.4 | 7 402 | 512 | 6.9 | |||||||||||||||||||||
| Corporate taxes | 10 882 | 13 243 | 2 361 | 21.7 | 12 926 | 317 | 2.5 | |||||||||||||||||||||
| School property tax | 1 178 | 1 113 | (65 | ) | (5.5 | ) | 1 076 | 37 | 3.4 | |||||||||||||||||||
| TOTAL | 60 506 | 64 521 | 4 015 | 6.6 | 62 328 | 2 193 | 3.5 | |||||||||||||||||||||
The 2022-2023 forecast of $60 506 million reflected mainly the effects of increased economic activity on tax revenues, including higher personal income tax revenues. This increase was due in particular to growth in household income, which in turn was supported by the recovery in employment and growth in wages and salaries. The forecast for corporate taxes took into account a favourable trend in economic activity, but still reflected a decrease compared with actual results as at March 31, 2022, given the exceptional nature of the increase in the net operating surplus of corporations in 2021-2022, partly supported by non-recurring government support measures related to the pandemic.
The increase in nominal GDP of 8.4% in 2022, compared to the forecast of 6.4% announced in the 2022-2023 budget, essentially reflects stronger-than-expected price growth. This significant rise in prices has translated into favourable trends in tax revenues, up 6.6% compared with the forecast.
The increase in wages and salaries, supported by a strong labour market, had a direct impact on personal income tax revenue and revenue from contributions to health services, explaining a large part of the 2.7% and 8.4% variations from the budget, and the 3.2% and 6.9% increases from the actual results as at March 31, 2022.
The changes associated with personal income tax also take into account the reduction in income attributable to the 1-percentage-point reduction in the first two tax brackets as of January 1, 2023, and the 6.44% indexation of the tax system1 for 2023, linked to the increase in consumer prices.
Moreover, the net operating surplus of corporations, which is higher than in 2021-2022, and its more favourable trend than forecast, account for most of the 2.5% increase in revenues from corporate taxes compared with actual results as at March 31, 2022, and the 21.7% change in revenues from corporate taxes compared with the forecast.
| 1 | Statutory indexation of the main parameters of the personal income tax system, namely the various tax brackets, the basic amount and several deductions and tax credits. The indexation rate is determined by the increase in the Québec consumer price index, excluding alcohol, tobacco and recreational cannabis. |
| ANALYSIS OF THE CONSOLIDATED FINANCIAL STATEMENTS | 9 |
2. Variance analysis (cont’d)
2.1. Own-source revenue (cont’d)
Consumption taxes
Fiscal year ended March 31, 2023
(millions of dollars)
| Budget 2022-2023 | Actual results | Change with 2022-2023 budget | Actual results | Change with 2021-2022 actual results | ||||||||||||||||||||||||
| M$ | % | M$ | % | |||||||||||||||||||||||||
| Sales | 22 940 | 22 911 | (29 | ) | (0.1 | ) | 20 894 | 2 017 | 9.7 | |||||||||||||||||||
| Fuel | 2 141 | 2 157 | 16 | 0.7 | 2 090 | 67 | 3.2 | |||||||||||||||||||||
| Tobacco | 899 | 817 | (82 | ) | (9.1 | ) | 893 | (76 | ) | (8.5 | ) | |||||||||||||||||
| Alcoholic beverages | 637 | 635 | (2 | ) | (0.3 | ) | 638 | (3 | ) | (0.5 | ) | |||||||||||||||||
| Cannabis | 89 | 77 | (12 | ) | (13.5 | ) | 82 | (5 | ) | (6.1 | ) | |||||||||||||||||
| TOTAL | 26 706 | 26 597 | (109 | ) | (0.4 | ) | 24 597 | 2 000 | 8.1 | |||||||||||||||||||
The 2022-2023 forecast of $26 706 million reflected notably the growth in household consumption1 compared with the previous year, supported among other things by reduced uncertainty linked to the pandemic, by government initiatives to offset the rising cost of living, and by the disbursement of a portion of accumulated household savings.
As at March 31, 2023, revenue from consumption taxes, mainly the Québec sales tax, is generally comparable to forecasts, with a downward variation of 0.4%.
Compared with actual results as at March 31, 2022, revenue from consumption taxes is up 8.1%. As forecast, this change is explained by growing domestic demand, despite the mitigating effect of higher interest rates and inflation on household consumption.
Moreover, higher prices for goods and services, exacerbated in particular by supply constraints, rising energy prices, labour shortages and geopolitical tensions, also played a role in the rise in revenue from consumption taxes.
| 1 | Household consumption excluding food expenditures and shelter. |
| 10 | PUBLIC ACCOUNTS 2022-2023 |
2. Variance analysis (cont’d)
2.1. Own-source revenue (cont’d)
Duties and permits
Fiscal year ended March 31, 2023
(millions of dollars)
| Budget 2022-2023 | Actual results | Change with 2022-2023 budget | Actual results | Change with 2021-2022 actual results | ||||||||||||||||||||||||
| M$ | % | M$ | % | |||||||||||||||||||||||||
| Motor vehicles | 1 529 | 1 562 | 33 | 2.2 | 1 525 | 37 | 2.4 | |||||||||||||||||||||
| Natural resources | 1 748 | 2 014 | 266 | 15.2 | 2 371 | (357 | ) | (15.1 | ) | |||||||||||||||||||
| Greenhouse gas emissions | 1 077 | 1 267 | 190 | 17.6 | 1 299 | (32 | ) | (2.5 | ) | |||||||||||||||||||
| Other | 817 | 898 | 81 | 9.9 | 862 | 36 | 4.2 | |||||||||||||||||||||
| TOTAL | 5 171 | 5 741 | 570 | 11.0 | 6 057 | (316 | ) | (5.2 | ) | |||||||||||||||||||
The 2022-2023 forecast of $5 171 million, which was lower than actual results as at March 31, 2022, reflected the especially high level of revenue from duties and permits in 2021-2022, due in particular to non-recurring revenues from the auction of greenhouse gas (GHG) emission allowances. Additional revenues of $664 million were generated in 2021-2022 by the resale of unsold units from the May and August 2020 auctions. Moreover, this forecasted decline also took into account an expected decrease in the economic value of iron, which would affect government royalties from mining operations.
As at March 31, 2023, revenues from duties and permits of $5 741 million exceeded the forecast by 11.0%. This improvement is attributable in particular to a better-than-expected trend in revenue from mining royalties in the average unit price of units sold at the auction of GHG emission allowances.
Compared with actual results for 2021-2022, those for fiscal year 2022-2023 show a decrease of 5.2%, mainly attributable to additional revenues in 2021-2022 from the auction of GHG emission allowances and to variations in mining royalties, influenced by changes in market prices for metals. In this regard, the decrease in mining revenues between the two years can be explained both by the sustained metal prices of recent years and by the significant drop that followed in 2022-2023.
| ANALYSIS OF THE CONSOLIDATED FINANCIAL STATEMENTS | 11 |
2. Variance analysis (cont’d)
2.1. Own-source revenue (cont’d)
| Miscellaneous revenue | ||||
| Fiscal year ended March 31, 2023 | ||||
| (millions of dollars) | ||||
| Budget 2022-2023 | Actual results as at March 31, 2023 | Change with 2022-2023 budget | Actual results as at March 31, 2022 | Change with 2021-2022 actual results | ||||||||||||||||||||||||
| M$ | % | M$ | % | |||||||||||||||||||||||||
| Miscellaneous revenue | 11 680 | 12 083 | 403 | 3.5 | 10 705 | 1 378 | 12.9 | |||||||||||||||||||||
The 2022-2023 forecast of $11 680 million reflected a generalized growth in the various revenues generated by the different organizations that make up the government, particularly those of the health and social services, education and higher education networks. Among other things, the forecast took into account an increase in revenues from tuition fees, linked to an expected growth in the higher education clientele.
Actual miscellaneous revenue as at March 31, 2023 of $12 083 million exceeds the forecast by 3.5%. This variation is due in particular to higher-than-forecast growth in interest income on tax receivables administered by the Agence du revenu du Québec, growth explained in part by the rise in interest rates.
Compared to the previous fiscal year’s actual results, revenue growth can be broken down as follows (millions of dollars):
| Actual results as at March 31, 2023 | Actual results as at March 31, 2022 | Change with 2021-2022 actual results | ||||||||||||||
| M$ | % | |||||||||||||||
| Sales of goods and services | 5 741 | 5 311 | 430 | 8.1 | ||||||||||||
| User contributions | 1 977 | 1 781 | 196 | 11.0 | ||||||||||||
| Income on accounts receivable and loans | 1 052 | 541 | 511 | 94.5 | ||||||||||||
| Income on investments | 525 | 636 | (111 | ) | (17.5 | ) | ||||||||||
| Fines, forfeitures and recoveries | 1 228 | 934 | 294 | 31.5 | ||||||||||||
| Third-party donations | 1 003 | 966 | 37 | 3.8 | ||||||||||||
| Tuition fees | 451 | 410 | 41 | 10.0 | ||||||||||||
| Transfers from entities other than the federal government | 106 | 126 | (20 | ) | (15.9 | ) | ||||||||||
| TOTAL | 12 083 | 10 705 | 1 378 | 12.9 | ||||||||||||
| 12 | PUBLIC ACCOUNTS 2022-2023 |
2. Variance analysis (cont’d)
2.1. Own-source revenue (cont’d)
Miscellaneous revenue (cont’d)
The overall growth of $1 378 million is mainly the result of the increase relating to the sales of goods and services, user contributions as well as income on accounts receivable and loans.
Sales of goods and services
The variation of $430 million is due in particular to the increase in revenues collected by school service centres and school boards, notably for childcare services. This increase is due to revenue losses related to temporary school closures in 2021-2022 linked to the pandemic.
User contributions
The $196-million increase is mainly due to a $143-million increase in revenues from health and social services institutions, attributable among other things to growth in contributions from non-resident users, and to higher revenues from users of adult residential care in rehabilitation centres and residential and long-term care centres, the latter increase being explained in particular by rate increases.
Income on accounts receivable and loans
The $511-million increase is mainly due to higher interest income on tax claims administered by the Agence du revenu du Québec, due to higher interest rates on accounts receivable.
| ANALYSIS OF THE CONSOLIDATED FINANCIAL STATEMENTS | 13 |
2. Variance analysis (cont’d)
2.1. Own-source revenue (cont’d)
Revenue from government enterprises
Fiscal year ended March 31, 2023
(millions of dollars)
| Actual results | Change with | Actual results | Change with | |||||||||||||||||||||||||
| Budget | as at | 2022-2023 | as at | 2021-2022 | ||||||||||||||||||||||||
| 2022-2023 | March 31, 2023 | budget | March 31, 2022 | actual results | ||||||||||||||||||||||||
| M$ | % | M$ | % | |||||||||||||||||||||||||
| Hydro-Québec | 2 525 | 3 665 | 1 140 | 45.1 | 3 059 | 606 | 19.8 | |||||||||||||||||||||
| Société des alcools du Québec | 1 360 | 1 427 | 67 | 4.9 | 1 349 | 78 | 5.8 | |||||||||||||||||||||
| Loto-Québec | 1 383 | 1 597 | 214 | 15.5 | 1 118 | 479 | 42.8 | |||||||||||||||||||||
| Investissement Québec | 256 | (226 | ) | (482 | ) | (188.3 | ) | 341 | (567 | ) | (166.3 | ) | ||||||||||||||||
| Other | 104 | 157 | 53 | 51.0 | 93 | 64 | 68.8 | |||||||||||||||||||||
| TOTAL | 5 628 | 6 620 | 992 | 17.6 | 5 960 | 660 | 11.1 | |||||||||||||||||||||
The 2022-2023 forecast of $5 628 million reflected an increase in revenue from Loto-Québec, due to a return to full operation of its facilities, and a decrease in revenues from Hydro-Québec due to the anticipated drop in the net value of electricity exports.
Hydro-Québec
Contrary to forecasts, supported by sustained economic activity and skyrocketing world energy prices, the net value of Hydro-Québec’s electricity exports increased considerably, explaining both the 45.1% variation compared to the 2022-2023 budget and the 19.8% increase compared to actual results for 2021-2022. The increase compared with 2021-2022 is, however, partially offset by the rise in the corporation’s operating expenses, caused in particular by the growth in the business and the intensification of maintenance activities.
Investissement Québec
Revenues from Investissement Québec were 188.3% lower than forecast, and 166.3% lower than actual results as at March 31, 2022. The unfavourable return on investments in the Venture Capital and Investment Funds portfolio is mainly due to the volatility of rates on the stock markets and the uncertain economic context related to the inflationary environment, restrictive monetary policies and geopolitical risks.
Loto-Québec
The 15.5% variation from the forecast is due in particular to higher-than-expected growth in casino and gaming room customer traffic. In addition to the increase in customer traffic, the 42.8% increase over fiscal year 2022-2023 results from the negative impact of the pandemic on the corporation’s performance in 2021-2022, due in part to the closure of gaming establishments between April and June 2021.
| 14 | PUBLIC ACCOUNTS 2022-2023 |
2. Variance analysis (cont’d)
2.2. Federal government transfers
Federal government transfers
Fiscal year ended March 31, 2023
(millions of dollars)
| Actual results | Change with | Actual results | Change with | |||||||||||||||||||||||||
| Budget | as at | 2022-2023 | as at | 2021-2022 | ||||||||||||||||||||||||
| 2022-2023 | March 31, 2023 | budget | March 31, 2022 | actual results | ||||||||||||||||||||||||
| M$ | % | M$ | % | |||||||||||||||||||||||||
| Equalization | 13 666 | 13 666 | — | — | 13 119 | 547 | 4.2 | |||||||||||||||||||||
| Health transfers | 7 078 | 7 082 | 4 | 0.1 | 8 203 | (1 121 | ) | (13.7 | ) | |||||||||||||||||||
| Transfers for post-secondary education and other social programs | 1 531 | 1 294 | (237 | ) | (15.5 | ) | 1 529 | (235 | ) | (15.4 | ) | |||||||||||||||||
| Other programs | 6 515 | 6 695 | 180 | 2.8 | 6 333 | 362 | 5.7 | |||||||||||||||||||||
| TOTAL | 28 790 | 28 737 | (53 | ) | (0.2 | ) | 29 184 | (447 | ) | (1.5 | ) | |||||||||||||||||
The 2022-2023 forecast of $28 790 million assumed that certain federal government transfers resulting from agreements reached in the context of the pandemic were non-recurring.
As at March 31, 2023, federal government transfers of $28 737 million are essentially in line with the forecast, with a downward variation of $53 million, or 0.2%.
This variation is mainly attributable to a higher-than-forecast increase in the value of the Québec special abatement,1 resulting in a greater-than-forecast decrease of $361 million in transfers for health, and of $222 million in transfers for post-secondary education and other social programs.
Moreover, the following items partially offset this downward variation compared with the forecast:
| ● | a one-time transfer of $450 million in 2022-2023, under the Canada Health Transfer, to catch up on surgeries; |
| ● | higher-than-forecast revenues of $180 million from the “Other programs” category, due in particular to transfer revenues from the federal government for personal protective equipment (PPE) and other supplies received and used by March 31, 2023. |
| 1 | The Québec special abatement (16.5% of federal personal income tax collected in Québec) is subtracted from federal government transfer revenues. |
| ANALYSIS OF THE CONSOLIDATED FINANCIAL STATEMENTS | 15 |
2. Variance analysis (cont’d)
2.2. Federal government transfers (cont’d)
Compared with actual results for 2021-2022, those for 2022-2023 show a decrease of $447 million, due to the net impact of the following items:
Equalization
The growth of $547 million, or 4.2%, in equalization revenues is explained by the increase in the equalization envelope across Canada, whose growth is linked to that of Canada’s nominal GDP.
Health transfers
The $1 121-million decrease in health transfers is due in particular to:
| ● | one-time transfers in 2021-2022, including: |
| ¾ | $902 million as a supplementary Canada Health Transfer to support Québec in managing the pandemic, |
| ¾ | $226 million for Canada’s COVID-19 immunization plan, |
| ¾ | $221 million for the long-term care component of the health funding agreement; |
| ● | a $361-million decrease due to an upward revision in the value of the Québec special abatement, a portion of which is subtracted from the Canada Health Transfer. |
The decrease is partially offset by:
| ● | a one-time transfer of $450 million in 2022-2023 from the Canada Health Transfer to catch up on surgeries; |
| ● | an increase of $402 million in 2022-2023 related to the indexation of the Canada Health Transfer. |
Transfers for post-secondary education and other social programs
The $235-million decrease is mainly due to the increase of the value of the Québec special abatement,1 a portion of which is deducted from the Canada Social Transfer, reducing transfer revenues for post-secondary education and other social programs by $221 million.
Other programs
The $362-million increase in transfer revenues for other programs is explained by various changes:
| ● | a $341-million increase in revenues from the asymmetrical childcare agreement signed in 2021-2022 for a period of 5 years; |
| ● | an additional transfer of $197 million from the federal government to support public transit authorities in the wake of the pandemic; |
| ● | an increase of $152 million in transfers related to the gas tax and Québec contribution programs, mainly for the “Infrastructure and drinking water” component. |
| 16 | PUBLIC ACCOUNTS 2022-2023 |
2. Variance analysis (cont’d)
2.2. Federal government transfers (cont’d)
Other programs (cont’d)
These increases are largely offset by:
| ● | the downward variation of $235 million related to the increase in reimbursements under the youth allowance program, reimbursements which are deducted from revenues; |
| ● | a $239-million decrease in federal transfer revenues related to pandemic-related personal protective equipment (PPE) and other supplies received and used by March 31, 2023; |
| ● | the one-time transfer in 2021-2022 of $130 million related to the Safe Return to Class Fund agreement, aimed at ensuring the safety of students and staff in the context of the pandemic. |
| ANALYSIS OF THE CONSOLIDATED FINANCIAL STATEMENTS | 17 |
2. Variance analysis (cont’d)
Santé et services sociaux
Fiscal year ended March 31, 2023
(millions of dollars)
| Actual results | Change with | Actual results | Change with | |||||||||||||||||||||||||
| Budget | as at | 2022-2023 | as at | 2021-2022 | ||||||||||||||||||||||||
| 2022-2023 | March 31, 2023 | budget | March 31, 2022 | actual results | ||||||||||||||||||||||||
| M$ | % | (restated) | M$ | % | ||||||||||||||||||||||||
| Transfers | 8 168 | 6 626 | 1 542 | 23.3 | ||||||||||||||||||||||||
| Remuneration | 36 490 | 35 969 | 521 | 1.4 | ||||||||||||||||||||||||
| Operating | 14 627 | 13 996 | 631 | 4.5 | ||||||||||||||||||||||||
| Doubtful accounts and other allowances | 121 | 77 | 44 | 57.1 | ||||||||||||||||||||||||
| TOTAL | 54 459 | 59 406 | 4 947 | 9.1 | 56 668 | 2 738 | 4.8 | |||||||||||||||||||||
This portfolio includes mainly the activities of the health and social services network institutions and the programs administered by the Régie de l’assurance maladie du Québec. It also includes the expenditures of other health-related government agencies such as Héma-Québec.
Change with 2022-2023 budget
This portfolio’s expenditures for 2022-2023, at $59 406 million, exceeded forecasts by $4 947 million, a variation of 9.1%. This variance is mainly due to:
| ● | an increase in the senior assistance refundable tax credit announced in the Update on Québec’s Economic and Financial Situation – Fall 2022, resulting in an additional expenditure of $1 444 million. |
The residual variance of $3 503 million is explained in particular by:
| ● | higher-than-anticipated operating expenses, due to higher-than-anticipated inflation in the prices of goods and services; |
| ● | higher-than-expected pandemic management costs, particularly for personal protective equipment (PPE) and other supplies; |
| ● | salary provisions arising from government offers tabled in December 2022, including a lump-sum remuneration to all employees on duty during the 2022-2023 fiscal year. |
Change with 2021-2022 actual results
The growth of $2 738 million, compared with actual results for 2021-2022, is essentially due to higher expenses for transfers, remuneration and operations.
| 18 | PUBLIC ACCOUNTS 2022-2023 |
2. Variance analysis (cont’d)
2.3. Consolidated expenditure (cont’d)
Santé et services sociaux (cont’d)
Transfers
The $1 542-millions increase in transfer expenditures is primarily due to a $1 444-millions increase attributable to an increase in the amount for the senior assistance refundable tax credit starting in 2022.
Remuneration
The $521-million increase in remuneration expenses was mainly due to:
| ● | salary provisions arising from government offers tabled in December 2022 as part of the renewal of collective agreements; |
| ● | an increase in pension plan expenses due to the growth in assessable payroll contributions by plan members; |
| ● | salary indexations and increments. |
These increases are partially offset by additional one-time expenses incurred by health and social services institutions to manage the pandemic in 2021-2022, including remuneration of personnel working for the vaccination campaign and the allocation of incentive bonuses in the health sector.
Operating
The $631-million increase in operating expenses was mainly due to:
| ● | a $428-million increase in expenditures by health and social services institutions, relating in particular to the costs of drugs, food, medical and surgical supplies, as well as maintenance and repairs; |
| ● | a $355-million write-down in the value of personal protective equipment (PPE) and other supplies in inventory as at March 31, 2023, to reflect the decline in the market value of this equipment. |
| ANALYSIS OF THE CONSOLIDATED FINANCIAL STATEMENTS | 19 |
2. Variance analysis (cont’d)
2.3. Consolidated expenditure (cont’d)
Éducation
Fiscal year ended March 31, 2023
(millions of dollars)
| Actual results | Change with | Actual results | Change with | |||||||||||||||||||||||||
| Budget | as at | 2022-2023 | as at | 2021-2022 | ||||||||||||||||||||||||
| 2022-2023 | March 31, 2023 | budget | March 31, 2022 | actual results | ||||||||||||||||||||||||
| M$ | % | (restated) | M$ | % | ||||||||||||||||||||||||
| Transfers | 1 095 | 1 016 | 79 | 7.8 | ||||||||||||||||||||||||
| Remuneration | 14 194 | 12 836 | 1 358 | 10.6 | ||||||||||||||||||||||||
| Operating | 4 200 | 3 548 | 652 | 18.4 | ||||||||||||||||||||||||
| Doubtful accounts and other allowances | 10 | 5 | 5 | 100.0 | ||||||||||||||||||||||||
| TOTAL | 18 689 | 19 499 | 810 | 4.3 | 17 405 | 2 094 | 12.0 | |||||||||||||||||||||
This portfolio mainly covers the activities of preschool, primary and secondary education institutions. It also includes programs to promote leisure and sports activities, and to manage national parks.
Change with 2022-2023 budget
Expenditure in this portfolio was $810 million higher than forecast. This was mainly due to:
| ● | a faster-than-anticipated complete recovery of school service centre and school board activities, resulting in higher-than-anticipated expenditures; |
| ● | higher-than-anticipated expenses for school transportation, following the renewal of agreements with transport companies in 2022-2023; |
| ● | salary provisions arising from government offers tabled in December 2022, including a lump-sum remuneration to all employees in service during the 2022-2023 fiscal year. |
Change with 2021-2022 actual results
The $2 094-million increase in expenditures compared with actual results for 2021-2022 stems primarily from higher remuneration and operating expenses.
| 20 | PUBLIC ACCOUNTS 2022-2023 |
2. Variance analysis (cont’d)
2.3. Consolidated expenditure (cont’d)
Éducation (cont’d)
Remuneration
The $1 358-million increase in remuneration expenses was mainly due to:
| ● | salary indexations, increments and an increase in the number of teachers linked to the rise in the number of students; |
| ● | provisions arising from government offers tabled in December 2022 as part of the renewal of collective agreements; |
| ● | changes in pension plan expenses as a result of growth in assessable payroll contributions by plan members. |
Operating
The $652-million increase in operating expenses is explained in particular by the rise in the cost of school transport, due notably to the renewal of contracts, by the increase in building maintenance expenses, and by the complete post-pandemic resumption of sports, cultural and extracurricular activities.
| ANALYSIS OF THE CONSOLIDATED FINANCIAL STATEMENTS | 21 |
2. Variance analysis (cont’d)
2.3. Consolidated expenditure (cont’d)
Enseignement supérieur
Fiscal year ended March 31, 2023
(millions of dollars)
| Actual results | Change with | Actual results | Change with | |||||||||||||||||||||||||
| Budget | as at | 2022-2023 | as at | 2021-2022 | ||||||||||||||||||||||||
| 2022-2023 | March 31, 2023 | budget | March 31, 2022 | actual results | ||||||||||||||||||||||||
| M$ | % | (restated) | M$ | % | ||||||||||||||||||||||||
| Transfers | 4 597 | 4 095 | 502 | 12.3 | ||||||||||||||||||||||||
| Remuneration | 3 958 | 3 675 | 283 | 7.7 | ||||||||||||||||||||||||
| Operating | 1 119 | 981 | 138 | 14.1 | ||||||||||||||||||||||||
| Doubtful accounts and other allowances | (19 | ) | (4 | ) | (15 | ) | 375.0 | |||||||||||||||||||||
| TOTAL | 10 010 | 9 655 | (355 | ) | (3.5 | ) | 8 747 | 908 | 10.4 | |||||||||||||||||||
This portfolio mainly comprises expenditures on college and university educational institutions. It also includes student financial assistance.
Change with 2022-2023 budget
Expenditures in this portfolio were $355 million lower than forecast. This variance can be explained in particular by:
| ● | a decline in the number of students enrolled in general and vocational colleges (CEGEPs), when an increase had been forecast; |
| ● | lower-than-anticipated expenditures for the Perspective Québec bursary program, effective as of the fall 2022 college and university sessions and designed to promote access to post-secondary studies in targeted programs of study. This variation is explained by a lower-than-expected clientele. |
Change with 2021-2022 actual results
The $908-million increase in expenditures compared with actual results for 2021-2022 stems primarily from higher transfer and remuneration expenses.
| 22 | PUBLIC ACCOUNTS 2022-2023 |
2. Variance analysis (cont’d)
2.3. Consolidated expenditure (cont’d)
Enseignement supérieur (cont’d)
Transfers
The $502-million increase in transfer expenditures is mainly due to:
| ● | an increase of $220 million attributable to higher grants to private universities, notably to reflect the 2022-2023 salary indexation, as well as additional investments in higher education announced in the 2022-2023 budget to improve higher education graduation rates; |
| ● | an increase of $125 million related to the Perspectives Québec bursary program, effective as of the fall 2022 college and university sessions. |
Remuneration
The $283-million increase in remuneration expenses is mainly attributable to:
| ● | staff increments and salary indexations; |
| ● | salary provisions relating to government offers tabled in December 2022 as part of the renewal of collective agreements. |
| ANALYSIS OF THE CONSOLIDATED FINANCIAL STATEMENTS | 23 |
2. Variance analysis (cont’d)
2.3. Consolidated expenditure (cont’d)
Famille
Fiscal year ended March 31, 2023
(millions of dollars)
| Actual results | Change with | Actual results | Change with | |||||||||||||||||||||||||
| Budget | as at | 2022-2023 | as at | 2021-2022 | ||||||||||||||||||||||||
| 2022-2023 | March 31, 2023 | budget | March 31, 2022 | actual results | ||||||||||||||||||||||||
| M$ | % | M$ | % | |||||||||||||||||||||||||
| Transfers | 7 627 | 7 088 | 539 | 7.6 | ||||||||||||||||||||||||
| Remuneration | 117 | 105 | 12 | 11.4 | ||||||||||||||||||||||||
| Operating | 91 | 84 | 7 | 8.3 | ||||||||||||||||||||||||
| Doubtful accounts and other allowances | ― | — | — | — | ||||||||||||||||||||||||
| TOTAL | 7 893 | 7 835 | (58 | ) | (0.7 | ) | 7 277 | 558 | 7.7 | |||||||||||||||||||
This portfolio mainly includes expenses dedicated to the financing of educational childcare services and financial assistance for families.
Change with 2022-2023 budget
Actual results for 2022-2023, amounting to $7 835 million, are comparable to the forecast.
Change with 2021-2022 actual results
Actual results show growth of $558 million compared with 2021-2022, mainly due to higher transfer expenditures.
Transfers
The $539-million increase in transfer expenditures is mainly due to:
| ● | a $193-million increase in subsidies to childcare centres (CPEs) and daycare centres, due in particular to salary increases resulting from the new national agreement signed in December 2021, feedback for management staff resulting from the agreement in principle signed in December 2022, and the creation of new places in the network in 2022-2023; |
| ● | a $122-million increase in expenses associated with the family allowance tax credit, due to indexation of the credit by 2.64% as of January 1, 2022, and by 6.44% as of January 1, 2023. |
| 24 | PUBLIC ACCOUNTS 2022-2023 |
2. Variance analysis (cont’d)
2.3. Consolidated expenditure (cont’d)
Transport et Mobilité durable
Fiscal year ended March 31, 2023
(millions of dollars)
| Actual results | Change with | Actual results | Change with | |||||||||||||||||||||||||
| Budget | as at | 2022-2023 | as at | 2021-2022 | ||||||||||||||||||||||||
| 2022-2023 | March 31, 2023 | budget | March 31, 2022 | actual results | ||||||||||||||||||||||||
| M$ | % | (restated) | M$ | % | ||||||||||||||||||||||||
| Transfers | 2 699 | 3 500 | (801 | ) | (22.9 | ) | ||||||||||||||||||||||
| Remuneration | 708 | 677 | 31 | 4.6 | ||||||||||||||||||||||||
| Operating | 3 035 | 2 832 | 203 | 7.2 | ||||||||||||||||||||||||
| Doubtful accounts and other allowances | 9 | 8 | 1 | 12.5 | ||||||||||||||||||||||||
| TOTAL | 7 115 | 6 451 | (664 | ) | (9.3 | ) | 7 017 | (566 | ) | (8.1 | ) | |||||||||||||||||
This portfolio mainly includes expenditures for the construction, maintenance and operation of road infrastructure, as well as the financing of public transit services. Expenditures also include management of the government’s fleet of rolling stock, aircrafts and ferry services.
Change with 2022-2023 budget
Actual results for 2022-2023, in the amount of $6 451 million, were $664 million below the forecast. This difference is mainly due to:
| ● | subsidies granted for municipal infrastructure and public transit projects that were $586 million lower than forecast, mainly due to the fact that less work was carried out than anticipated; |
| ● | expenditures $373 million lower than forecast due to additional delays in the approval of certain projects under the Programme d’aide gouvernementale d’infrastructures en transport collectif (PAGITC), thus delaying the completion of work scheduled for March 31, 2023. |
This downward variation is partially offset by:
| ● | the granting of an additional $200 million subsidy to the Autorité régionale de transport métropolitain (ARTM) in March 2023, announced as part of the 2023-2024 budget, to support the revival of public transit and help maintain services despite declining ridership; |
| ● | advance payments1 of financial assistance totalling $500 million for infrastructure projects included in the Québec Infrastructure Plan (QIP) 2023-2033, generating expenditures not provided for in the 2022-2023 budget: |
| 1 | This is the financial assistance paid by the government for infrastructure projects before the work is carried out by the recipients. |
| ANALYSIS OF THE CONSOLIDATED FINANCIAL STATEMENTS | 25 |
2. Variance analysis (cont’d)
2.3. Consolidated expenditure (cont’d)
Transport et Mobilité durable (cont’d)
| ¾ | $237 million to the Réseau de transport de la Capitale (RTC) for preparatory work on Québec city’s structuring public transit network project, |
| ¾ | $146 million to the ARTM to contribute to projects aimed at integrating its operations with those of the Réseau express métropolitain (REM), |
| ¾ | $117 million paid to the Société de transport de Laval (STL) for an infrastructure expansion project to increase their capacity and accommodate electric buses. |
Change with 2021-2022 actual results
The $566-million reduction in expenditures compared with actual results for 2021-2022 is primarily due to a decrease in transfer expenditures, partially offset by an increase in operating expenditures.
Transfers
The $801-million decrease in transfer expenditures compared with 2021-2022 is mainly due to:
| ● | a $1 019-million decrease in grants for municipal infrastructure and public transit projects, due to: |
| ¾ | the advance payment1 of $1 120 million in financial assistance for infrastructure projects to the Société de transport de Montréal (STM) in 2021-2022, |
| ¾ | a $399-million decrease in the cost of work compared with the previous year; |
this decrease in partially offset by anticipated payments1 of public transit subsidies totalling $500 million in 2022-2023, namely $237 million granted to the RTC, $146 million granted to the ARTM, and $117 million granted to the STL;
| ● | the $100-million increase in 2022-2023 in subsidies to support public transit authorities faced with the repercussions of the COVID-19 pandemic, subsidies which are granted through the emergency public transit assistance program (PAUTCP) in the continuation of the Safe Restart Agreement; |
| ● | an increase of $105 million in one-time assistance allocated to the ARTM to support the recovery of public transit. |
Operating
The $203-million increase in operating expenditures is mainly due to higher spending on road snow removal, attributable to higher costs for contracts, salt and fuel.
| 1 | This is the financial assistance paid by the government for infrastructure projects before the work is carried out by the recipients. |
| 26 | PUBLIC ACCOUNTS 2022-2023 |
2. Variance analysis (cont’d)
2.3. Consolidated expenditure (cont’d)
Emploi et Solidarité sociale
Fiscal year ended March 31, 2023
(millions of dollars)
| Actual results | Change with | Actual results | Change with | |||||||||||||||||||||||||
| Budget | as at | 2022-2023 | as at | 2021-2022 | ||||||||||||||||||||||||
| 2022-2023 | March 31, 2023 | budget | March 31, 2022 | actual results | ||||||||||||||||||||||||
| M$ | % | M$ | % | |||||||||||||||||||||||||
| Transfers | 8 372 | 7 811 | 561 | 7.2 | ||||||||||||||||||||||||
| Remuneration | 442 | 410 | 32 | 7.8 | ||||||||||||||||||||||||
| Operating | 145 | 140 | 5 | 3.6 | ||||||||||||||||||||||||
| Doubtful accounts and other allowances | 24 | 24 | — | — | ||||||||||||||||||||||||
| TOTAL | 5 390 | 8 983 | 3 593 | 66.7 | 8 385 | 598 | 7.1 | |||||||||||||||||||||
This portfolio mainly includes expenditures on financial assistance programs for individuals, including last-resort assistance and employment assistance programs. Expenditures related to the activities of Services Québec, the Directeur de l’état civil and the Registraire des entreprises, as well as to the administration of the Québec Parental Insurance Plan, are also included in this portfolio.
Change with 2022-2023 budget
Actual results for 2022-2023, amounting to $8 983 million, exceeded forecasts by $3 593 million. This variation is mainly due to:
| ● | a one-time payment to cope with the rising cost of living, announced when the Update on Québec’s Economic and Financial Situation – Fall 2022 was tabled. The expenditure associated with this measure amounts to $3 367 million; |
| ● | the payment of an additional $100 million envelope in March 2023 when the 2023-2024 budget was tabled, earmarked for the short-term training program to support businesses experiencing recruitment difficulties. |
Change with 2021-2022 actual results
The $598-million increase in expenditures compared with actual results for 2021-2022 is essentially due to higher transfer expenditures.
| ANALYSIS OF THE CONSOLIDATED FINANCIAL STATEMENTS | 27 |
2. Variance analysis (cont’d)
2.3. Consolidated expenditure (cont’d)
Emploi et Solidarité sociale (cont’d)
Transfers
The $561-million increase in transfers is mainly due to:
| ● | a one-time payment to cope with the rising cost of living, announced when the Update on Québec’s Economic and Financial Situation – Fall 2022 was tabled. The expenditure associated with this measure amounts to $3 367 million; |
| ● | an increase of $287 million in costs associated with the last-resort financial assistance, due to an increase in the clientele following the significant increase in 2022-2023 from asylum seekers, and to the annual indexation of benefits. This growth is also due to the increase in benefits resulting from the Government Action Plan to Foster Economic Inclusion and Social Participation, which aims to help more than 100 000 people out of poverty and increase the income of people living in poverty; |
| ● | an increase of $215 million in participation allowances granted by the Labour Market Development Fund to support integration into the labour market. This increase is explained in particular by the revision of the policy concerning income support granted to participants; |
| ● | an increase of $155 million for various employment assistance measures, including the announcement, in the 2023-2024 budget, of an additional $100 million for the short-term training program. |
This increase is partially offset by expenditures arising from measures announced in 2021-2022 to mitigate the increase in the cost of living, namely $2 994 million for the one-time amount and $681 million for the exceptional allowance.
| 28 | PUBLIC ACCOUNTS 2022-2023 |
2. Variance analysis (cont’d)
2.3. Consolidated expenditure (cont’d)
Affaires municipales et Habitation
Fiscal year ended March 31, 2023
(millions of dollars)
| Actual results | Change with | Actual results | Change with | |||||||||||||||||||||||||
| Budget | as at | 2022-2023 | as at | 2021-2022 | ||||||||||||||||||||||||
| 2022-2023 | March 31, 2023 | budget | March 31, 2022 | actual results | ||||||||||||||||||||||||
| M$ | % | (restated) | M$ | % | ||||||||||||||||||||||||
| Transfers | 4 624 | 3 430 | 1 194 | 34.8 | ||||||||||||||||||||||||
| Remuneration | 117 | 115 | 2 | 1.7 | ||||||||||||||||||||||||
| Operating | 176 | 163 | 13 | 8.0 | ||||||||||||||||||||||||
| Doubtful accounts and other allowances | 11 | (167 | ) | 178 | (106.6 | ) | ||||||||||||||||||||||
| TOTAL | 3 929 | 4 928 | 999 | 25.4 | 3 541 | 1 387 | 39.2 | |||||||||||||||||||||
This portfolio mainly includes expenditures on financial support for municipalities, notably for infrastructure, social housing and compensation in lieu of taxes, as well as regional and metropolitan development measures.
Change with 2022-2023 budget
Actual results for 2022-2023, amounting to $4 928 million, exceed the forecast by $999 million. This variation is mainly due to:
| ● | subsidies granted for municipal infrastructure projects that were $720 million higher than forecast, a change which was due in particular to larger-than-anticipated projects, as well as subsidy adjustments relating to work carried out in previous years; |
| ● | certain measures announced after the 2022-2023 budget, including: |
| ¾ | subsidies totalling $225 million for the construction of 3 000 social and affordable housing units through a partnership with tax-advantaged funds and Desjardins, announced when the Update on Québec’s Economic and Financial Situation – Fall 2022 was tabled, |
| ¾ | expenses of $251 million announced when the 2023-2024 budget was tabled to accelerate and support the purchase and construction of social and affordable housing. |
Change with 2021-2022 actual results
The $1 387-million increase compared with actual results for 2021-2022 is mainly due to higher transfer expenditures and higher doubtful accounts and other allowances.
| ANALYSIS OF THE CONSOLIDATED FINANCIAL STATEMENTS | 29 |
2. Variance analysis (cont’d)
2.3. Consolidated expenditure (cont’d)
Affaires municipales et Habitation (cont’d)
Transfers
The $1 194-million change in transfer expenditures compared with the previous year’s results is essentially due to the following factors:
| ● | $637 million in additional subsidies granted for municipal infrastructure projects, owing in particular to more substantial work than in 2021-2022 and subsidy adjustments relating to work carried out in previous years; |
| ● | $225 million in subsidies to support the construction of 3 000 social and affordable housing units through a partnership with tax-advantaged funds and Desjardins, announced when the Update on Québec’s Economic and Financial Situation – Fall 2022 was tabled; |
| ● | $145 million to support the RCMs’ local and regional development efforts as part of the 2020-2024 partnership of the Regions and Rurality Fund. |
Doubtfoul accounts and other allowances
The change in expenses for doubtful accounts and other allowances compared with the previous year is mainly due to the introduction, in 2021-2022, of the Société d’habitation du Québec (SHQ) financial assistance program to preserve community housing stock, which has resulted in a downward revision of the provision for losses on loan guarantees by $155 million as at March 31, 2022.
| 30 | PUBLIC ACCOUNTS 2022-2023 |
2. Variance analysis (cont’d)
2.3. Consolidated expenditure (cont’d)
Économie, Innovation et Énergie
Fiscal year ended March 31, 2023
(millions of dollars)
| Actual results | Change with | Actual results | Change with | |||||||||||||||||||||||||
| Budget | as at | 2022-2023 | as at | 2021-2022 | ||||||||||||||||||||||||
| 2022-2023 | March 31, 2023 | budget | March 31, 2022 | actual results | ||||||||||||||||||||||||
| M$ | % | M$ | % | |||||||||||||||||||||||||
| Transfers | 2 744 | 2 763 | (19 | ) | (0.7 | ) | ||||||||||||||||||||||
| Remuneration | 83 | 81 | 2 | 2.5 | ||||||||||||||||||||||||
| Operating | 179 | 173 | 6 | 3.5 | ||||||||||||||||||||||||
| Doubtful accounts and other allowances | 199 | 47 | 152 | 323.4 | ||||||||||||||||||||||||
| TOTAL | 3 656 | 3 205 | (451 | ) | (12.3 | ) | 3 064 | 141 | 4.6 | |||||||||||||||||||
This portfolio mainly includes expenditures dedicated to financing economic development projects, as well as supporting research, innovation and the development of energy resources.
Change with 2022-2023 budget
Actual results for 2022-2023, amounting to $3 205 million, were lower than forecast by $451 million. This variance is notably due to the fact that investment files under the Economic Development Fund progressed differently than planned, resulting in a lower-than-expected provision for doubtful accounts.
Change with 2021-2022 actual results
The $141-million increase in expenditures compared with actual results for 2021-2022 is mainly due to the $152-million increase in the expense for doubtful accounts and other allowances which was exceptionally low as at March 31, 2022 due to the revision of the valuation allowance on certain loans as a result of the improved risk of non-recovery.
| ANALYSIS OF THE CONSOLIDATED FINANCIAL STATEMENTS | 31 |
2. Variance analysis (cont’d)
2.3. Consolidated expenditure (cont’d)
Environnement, Lutte contre les changements climatiques, Faune et Parcs
Fiscal year ended March 31, 2023
(millions of dollars)
| Actual results | Change with | Actual results | Change with | |||||||||||||||||||||||||
| Budget | as at | 2022-2023 | as at | 2021-2022 | ||||||||||||||||||||||||
| 2022-2023 | March 31, 2023 | budget | March 31, 2022 | actual results | ||||||||||||||||||||||||
| M$ | % | M$ | % | |||||||||||||||||||||||||
| Transfers | 1 083 | 1 097 | (14 | ) | (1.3 | ) | ||||||||||||||||||||||
| Remuneration | 293 | 274 | 19 | 6.9 | ||||||||||||||||||||||||
| Operating | 293 | 356 | (63 | ) | (17.7 | ) | ||||||||||||||||||||||
| Doubtful accounts and other allowances | 4 | 3 | 1 | 33.3 | ||||||||||||||||||||||||
| TOTAL | 1 859 | 1 673 | (186 | ) | (10.0 | ) | 1 730 | (57 | ) | (3.3 | ) | |||||||||||||||||
This portfolio mainly includes expenditures on measures to fight climate change, protect the environment and conserve biodiversity. These expenditures also include the operation of public dams, land management of the State’s water domain, and the conservation of wildlife resources and their habitats.
Change with 2022-2023 budget
Expenditure for the portfolio was $186 million lower than forecast. This is due to a number of variations, including lower-than-anticipated expenditures in the form of subsidies for businesses in the industrial sector to support their plans to reduce GHG emissions, and in the form of investments to maximize the efficient use of energy and replace fossil fuels with electricity and other renewable energies. The lower-than-expected subsidies are due in particular to less substantial work than anticipated.
Change with 2021-2022 actual results
Actual results for 2022-2023 are comparable to those for 2021-2022, with a slight decrease of $57 million compared with the previous year’s results.
| 32 | PUBLIC ACCOUNTS 2022-2023 |
2. Variance analysis (cont’d)
2.3. Consolidated expenditure (cont’d)
Other portfolios
Fiscal year ended March 31, 2023
(millions of dollars)
| Budget 2022-2023 | Actual results as at March 31, 2023 | Change with 2022-2023 budget | Actual results as at March 31, 2022 | Change with 2021-2022 actual results | ||||||||||||||||||||||||
| M$ | % | (restated) | M$ | % | ||||||||||||||||||||||||
| Conseil du trésor et Administration gouvernementale | ||||||||||||||||||||||||||||
| Transfers | 68 | 51 | 17 | 33.3 | ||||||||||||||||||||||||
| Remuneration | 863 | 843 | 20 | 2.4 | ||||||||||||||||||||||||
| Operating | 195 | 231 | (36 | ) | (15.6 | ) | ||||||||||||||||||||||
| Doubtful accounts and other allowances | 1 | 1 | — | — | ||||||||||||||||||||||||
| Sub-total | 2 419 | 1 127 | (1 292 | ) | (53.4 | ) | 1 126 | 1 | 0.1 | |||||||||||||||||||
| Others | ||||||||||||||||||||||||||||
| Transfers | 5 799 | 5 103 | 696 | 13.6 | ||||||||||||||||||||||||
| Remuneration | 5 131 | 4 680 | 451 | 9.6 | ||||||||||||||||||||||||
| Operating | 3 187 | 2 523 | 664 | 26.3 | ||||||||||||||||||||||||
| Doubtful accounts and other allowances | 364 | 307 | 57 | 18.6 | ||||||||||||||||||||||||
| Sub-total | 14 725 | 14 481 | (244 | ) | (1.7 | ) | 12 613 | 1 868 | 14.8 | |||||||||||||||||||
| Total | 17 144 | 15 608 | (1 536 | ) | (9.0 | ) | 13 739 | 1 869 | 13.6 | |||||||||||||||||||
This group includes expenditures from the 16 other portfolios, which comprise, in particular, programs in the cultural, immigration, tourism, and natural resources sectors, as well as the activities of the judicial system, the public safety sector, the international relations sector, the legislative branch and central agencies.1 This group also includes sums provided for in the Contingency Fund of the Conseil du trésor et Administration gouvernementale portfolio. These sums aim to cover unexpected expenses that may arise in any of the government’s programs in the various portfolios. However, actual expenses financed by the contingency fund are recognized in the portfolios that benefited from them.
1 | Ministère des Finances, Ministère du Conseil exécutif and Secrétariat du Conseil du trésor. |
| ANALYSIS OF THE CONSOLIDATED FINANCIAL STATEMENTS | 33 |
2. Variance analysis (cont’d)
2.3. Consolidated expenditure (cont’d)
Other portfolios (cont’d)
Change with 2022-2023 budget
As at March 31, 2023, other portfolio expenditures of $15 608 million were $1 536 million lower than forecast. The share attributable to the Conseil du trésor et Administration gouvernementale portfolio is due in particular to various recourses of the Contingency Fund in order to make up for insufficient resources in certain programs, including:
| ● | recourses totalling $327 million for the Emploi et Solidarité sociale portfolio, mainly due to an unplanned increase of $219 million in last-resort financial assistance and the announcement of an additional envelope of $100 million when the 2023-2024 budget was tabled, intended for the short-term training program to support businesses experiencing recruitment difficulties; |
| ● | a recourse of $200 million for the benefit of the Transport et Mobilité durable portfolio for additional financial assistance announced in the 2023-2024 budget to support the recovery of public transit, |
| ● | a recourse of $198 million for the Transport et Mobilité durable portfolio relating to advance payments of subsidies, totalling $500 million, for public transit at the RTC, ARTM and STL; |
| ● | recourses totalling $225 million for the Affaires municipales et Habitation portfolio relating to subsidies to support the construction of 3 000 social and affordable housing units through a partnership with tax-advantaged funds and Desjardins; |
| ● | a recourse of $154 million for the Affaires municipales et Habitation portfolio, relating in particular to the measures announced in the 2023-2024 budget to accelerate and support the purchase and construction of social and affordable housing. |
Change with 2021-2022 actual results
Actual results for 2022-2023 are $1 869 million higher than for 2021-2022. On the one hand, the 2022-2023 actual results of the Conseil du trésor et Administration gouvernementale portfolio are comparable to those of 2021-2022. On the other hand, the other portfolios in this group posted growth of $1 868 million in actual expenditures in 2022-2023, due to higher transfer, remuneration and operating expenses.
| 34 | PUBLIC ACCOUNTS 2022-2023 |
2. Variance analysis (cont’d)
2.3. Consolidated expenditure (cont’d)
Other portfolios (cont’d)
Transfers
The $696-million increase in transfers in 2022-2023 is the result of several variations spread across the group’s portfolios, including:
| ● | a $101 million-increase related to growth in financial assistance for infrastructure projects administered by the Société de financement des infrastructures locales du Québec (SOFIL), which falls under the Finances portfolio, particularly drinking water projects. The growth is linked to the greater volume of work eligible for subsidies than in 2021-2022; |
| ● | $114 million-increase attributable to higher spending under the measure to connect all Quebecers to high-speed Internet, a program administered by the Conseil exécutif portfolio. |
Remuneration
The $451-million increase in remuneration expenditures is attributable in particular to salary indexations and increments.
Operating
The $664-million increase in operating expenditures in 2022-2023 is the result of a number of variations across the group’s 16 portfolios, including a $210-million increase in expenditures in the Ressources naturelles et Forêts portfolio, mainly due to the reassessment of estimated costs for the remediation of contaminated sites.
| ANALYSIS OF THE CONSOLIDATED FINANCIAL STATEMENTS | 35 |
2. Variance analysis (cont’d)
2.3. Consolidated expenditure (cont’d)
Debt service
| Budget 2022-2023 | Actual results as at March 31, 2023 | Change with 2022-2023 | Actual results as at March 31, 2022 | Change with 2021-2022 actual results | |||||||||||||||||||
| M$ | % | M$ | % | ||||||||||||||||||||
| Debt service | 8 842 | 10 058 | 1 216 | 13.8 | 8 640 | 1 418 | 16.4 | ||||||||||||||||
Debt service consists mainly of interest on debt and interest on pension plans and other employee future benefits1 liabilities for the public and parapublic sectors. The composition of debt service is presented in Note 5 to the consolidated financial statements.
Debt service for 2022-2023 of $10 058 million exceeds the forecast by $1 216 million. This change is mainly due to the higher-than-expected rise in interest rates.
Compared to the 2021-2022 actual results, debt service shows a $1 418-million increase which is mainly due to the growth in the average volume of debt contracted on financial markets and higher interest rates.
This variation is partially offset by a $182-million decrease in debt service relating to pension plans and other employee future benefits, due in particular to higher investment income from the Retirement Plans Sinking Fund and the sinking funds of the plans’ special funds, income which is presented as a reduction in the expense.
| 1 | This is interests on obligations related to pension plans and other employee future benefits in the public and parapublic sectors, decreased mainly by investment income from the Retirement Plans Sinking Fund (RPSF) and specific pension funds. |
| 36 | PUBLIC ACCOUNTS 2022-2023 |
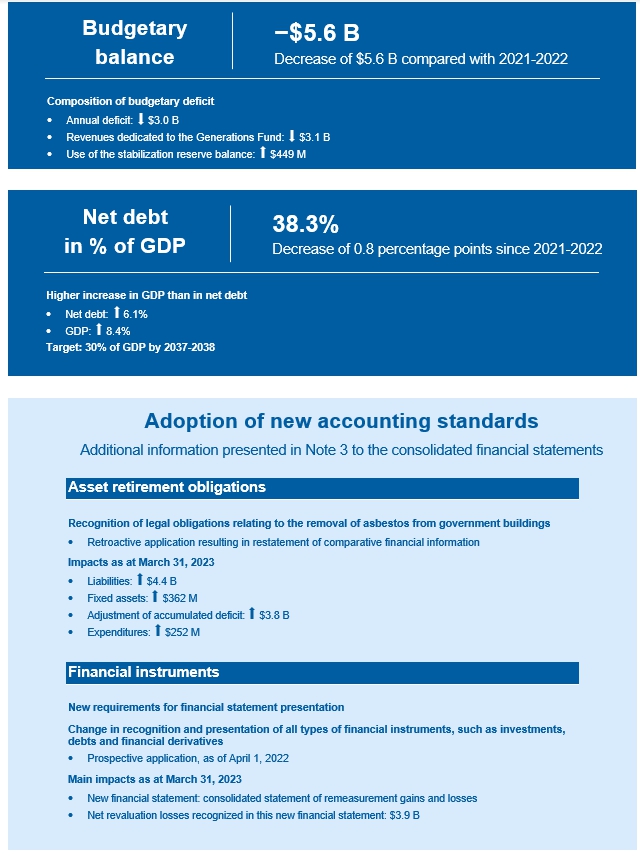
Budget balance and stabilization reserve
The purpose of the Balanced Budget Act (the Act) is to balance the budget of the government. It stipulates that the government may not incur a budgetary deficit, which corresponds to the annual operating surplus (deficit) excluding revenues dedicated to the Generations Fund after use of the stabilization reserve. The reserve is allocated to maintaining a balanced budget; its balance is reduced by the amount needed to achieve that balance.
Moreover, the government may, under the conditions it determines, use the reserve to make payments to the Generations Fund. The balance of the reserve is reduced by the amount thus paid into the fund. The amounts allocated annually to the reserve correspond to the amount of the surplus recorded for that fiscal year, that is, a budgetary balance greater than zero. The reserve has no impact on the annual accounting surplus or deficit.
As part of the implementation of the measures presented in the 2023-2024 budget, the Act has been modernized to provide greater flexibility in determining budgetary balance, replace the rules surrounding deficit reduction and abolish the stabilization reserve. This report on budgetary balance is carried out in accordance with the provisions of the Act in effect on March 31, 2023.
Fiscal year 2022-2023
In 2021-2022, in the context of the pandemic and in order to gradually reduce the deficit without adversely affecting services to Quebecers and the sustainable recovery of the economy, the provisions of the Balanced Budget Act prohibiting the recognition or forecasting of a budgetary deficit, and those requiring the elimination of any deficit, were suspended. These suspensions remained in effect until 2022-2023. The lifting of these suspensions, announced in the 2023-2024 budget speech, took effect on April 1, 2023. The budgetary balance representing operations for the fiscal year ended March 31, 2023 is a deficit of $5 635 million after taking into account the allocation of $3 082 million to the Generations Fund and the use of the balance of the stabilization reserve of $449 million.
Budget balance within the meaning of the Balanced Budget Act
Fiscal year ended March 31, 2023
(millions of dollars)
| Budget | Actual results as at | |||||||
| 2022-2023 | March 31, 2023 | |||||||
| Annual deficit | (3 005 | ) | (3 002 | ) | ||||
| Revenue of the Generations Fund | (3 445 | ) | (3 082 | ) | ||||
| Budget balance before use of the stabilization reserve | (6 450 | ) | (6 084 | ) | ||||
| Use of the stabilization reserve | — | 449 | ||||||
| Budget balance | (6 450 | ) | (5 635 | ) | ||||
| ANALYSIS OF THE CONSOLIDATED FINANCIAL STATEMENTS | 37 |
3. Balanced Budget Act (cont’d)
Stabilization reserve
(millions of dollars)
| Fiscal year ended March 31 | ||||||||
| 2023 | 2022 | |||||||
| Opening balance | 449 | 1 221 | ||||||
| Use of the reserve to maintain a balanced budget | (449 | ) | (772 | ) | ||||
| Closing balance | — | 449 | ||||||
Change in budget balance before use of the stabilization reserve and stabilization reserve balance
(millions of dollars)

| Notes: | From an accounting standpoint, this reserve has no impact on the annual surplus (deficit). In accordance with the Balanced Budget Act, the budgetary balance does not include the retroactive effect of a new CPA Canada standard for years prior to its coming into force. Thus, although the annual surpluses (deficits) were restated to reflect the application of the accounting standard relating to asset retirement obligations, these restatements had no impact on the budgetary balance. |
(1) | The provisions of the Balanced Budget Act prohibiting budgetary deficits did not apply to these years. |
The effects of the financial crisis and global recession that had held sway from 2008-2009 led to a substantial deterioration in the government’s financial balances until 2013-2014. The year 2014-2015 represents a turning point, marking the beginning of a period during which the government’s budgetary balances improved continuously until 2018-2019. Consequently, the stabilization reserve balance increased from 2015-2016 to 2019-2020.
| 38 | PUBLIC ACCOUNTS 2022-2023 |
3. Balanced Budget Act (cont’d)
On March 13, 2020, the Québec government declared a health emergency due to the global COVID-19 pandemic. Initiatives to address the crisis and stimulate the economy, combined with the impact of the lockdown and temporary institutional closures, significantly affected the government’s financial results for years 2019-2020 to 2021-20221. This situation required the use of the stabilization reserve in 2020-2021 and in 2021-2022 to achieve a balanced budget within the meaning of the Act.
In 2022-2023, the balance of the stabilization reserve of $449 million was used in full to reduce the budgetary deficit to $5 635 million. This deficit is mainly due to measures put in place to help Quebecers cope with the cost of living.
Generations Fund
The Generations Fund, created under the Act to reduce the debt and establish the Generations Fund, is used exclusively to repay the government’s gross debt. The statement of change in the balance of the Generations Fund is presented in Note 12 “Generations Fund” of the consolidated financial statements.
Budget 2022-2023 forecast that the revenue of the Generations Fund would amount to $3 445 million. The fund’s actual revenue is $3 082 million, or $363 million less than forecast. The fund’s balance is $18 911 million as at March 31, 2023.
| 1 | The change in the application of the accounting standard on government transfers also contributed to the budgetary deficit before use of the stabilization reserve for 2020-2021. |
| ANALYSIS OF THE CONSOLIDATED FINANCIAL STATEMENTS | 39 |
The main trends analysis presented in this section uses financial information from the consolidated financial statements of the Gouvernement du Québec.
The data presented put into perspective the trends observed over the past 10 years for the following main items1:
| ● | the annual surplus (deficit); |
| ● | consolidated revenue by source; |
| ● | consolidated expenditures by portfolios; |
| ● | the net book value of fixed assets; |
| ● | the government’s net debt and gross debt. |
Change in annual surplus (deficit)
(millions of dollars)
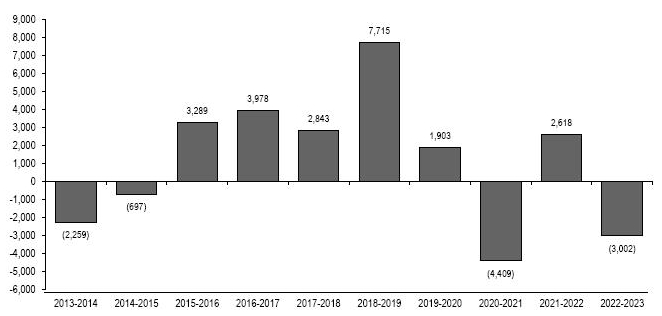
| Note: | Annual surpluses (deficits) have been restated to reflect the application of the accounting standard relating to asset retirement obligations. |
Between 2013-2014 and 2018-2019, annual results overall improved, which allowed for the return to a surplus starting in 2015-2016. This was driven by, among other things, restrained growth in program spending and a favourable economic environment. Growth in annual results ended in 2019-2020 due to targeted initiatives in the budget and the COVID-19 pandemic, which resulted in lost revenue and additional expenses for the government. However, the government’s finances were more impacted by the negative effects of the pandemic in 2020-2021, which explains the significant deficit of $4 409 million.
1 | Where financial statements have been restated in a subsequent fiscal year, the restated data has been used. |
| 40 | PUBLIC ACCOUNTS 2022-2023 |
4. Analysis of main trends (cont’d)
Despite the impact of the many measures adopted by the government to address the health emergency in 2021-2022, Québec’s finances benefited from the positive effects of the economic rebound and were particularly stimulated by the easing of the health measures, which resulted in a surplus of $2 618 million.
In 2022-2023, the government recorded a deficit of $3 002 million, mainly attributable to the introduction of the Anti-Inflation Shield to help Quebecers cope with the rising cost of living, which led to an increase in the senior assistance amount, the payment of a new one-time cost-of-living amount and the capping of indexation of several government rates at 3% for a four-year period.
| ANALYSIS OF THE CONSOLIDATED FINANCIAL STATEMENTS | 41 |
4. Analysis of main trends (cont’d)
Change in consolidated revenue
Revenue by source
(millions of dollars)
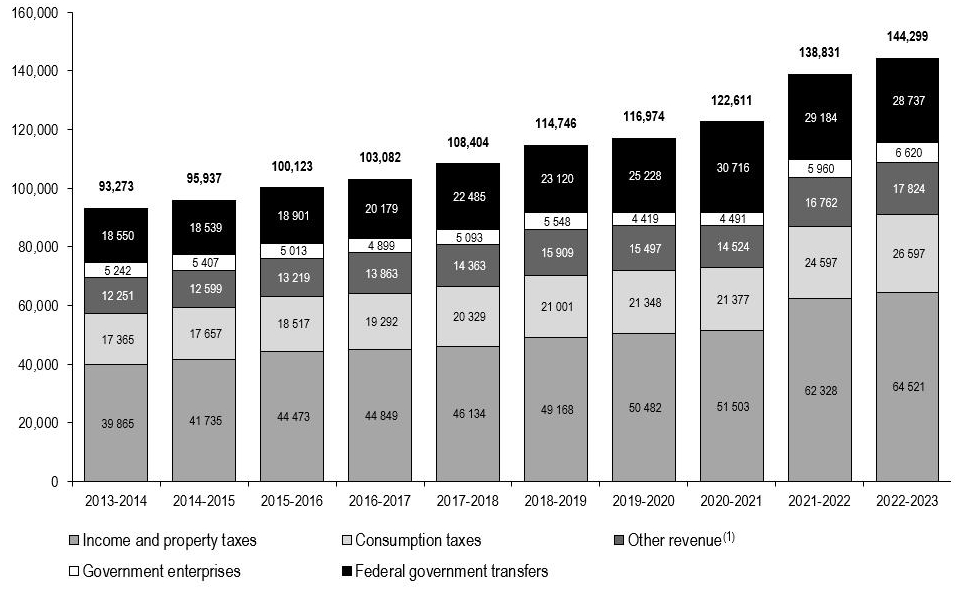
| (1) | Other revenue includes revenue from duties and permits as well as miscellaneous revenue. |
The government’s consolidated revenue rose from $93 273 million to $144 299 million from 2013-2014 to 2022-2023. Over this period, the annual average growth of this revenue was 5.0%, while that of GDP was 4.5%. Since 2013-2014, total revenue has grown constantly.
Following stronger growth of 13.2% between 2020-2021 and 2021-2022 due to the post-pandemic economic recovery, growth in total consolidated revenues slowed by 9.3 percentage points in 2022-2023 to 3.9%. This lower-than-average annual growth is explained by the economic slowdown that began during the year.
Tax revenue – Income and property taxes
Revenue from income and property taxes rose from $39 865 million in 2013-2014 to $64 521 million in 2022-2023. On average, this revenue grew by 5.5% per year over the period, owing in particular to an increase in the average wage and the number of jobs in Québec.
| 42 | PUBLIC ACCOUNTS 2022-2023 |
4. Analysis of main trends (cont’d)
Change in consolidated revenue (cont’d)
Tax revenue – Consumption taxes
Revenue from consumption taxes has grown regularly since 2013-2014, going from $17 365 million to $26 597 million in 2022-2023. The average annual growth rate for the period was 4.9% owing to sustained growth in retail sales and, particularly for 2022-2023, the high inflation that contributed to the sharp rise in prices of goods and services subject to consumption taxes.
Federal government transfers
Federal government transfer revenue rose from $18 550 million in 2013-2014 to $28 737 million in 2022-2023, which represents an average growth of 5.0% per year. With the exception of 2014-2015, when federal transfers remained relatively stable, this revenue has been growing steadily up to and including 2020-2021.
Between 2014-2015 and 2020-2021, this growth is due to the increase in all categories of federal transfers and more specifically for 2020-2021, to federal government transfers made to support the implementation by the provinces of pandemic-related measures and to partly compensate Québec’s efforts to mitigate the financial impact of the COVID-19 pandemic. The one-time nature of several of these support measures account for the decrease in transfer revenue in 2021-2022 and 2022-2023.
Government enterprises
Revenue from government enterprises, which consists mainly of the results of Hydro-Québec, Loto-Québec, the Société des alcools du Québec and Investissement Québec, went from $5 242 million in 2013-2014 to $6 620 million in 2022-2023, which corresponds to an average growth of 2.6% per year.
Revenue from government enterprises decreased significantly in 2019-2020, due in particular to the effect of the weather and given Hydro-Québec’s exceptional gain in 2018-2019 from the partial sale of the TM4 subsidiary. This revenue then remained at the same level in 2020-2021 due to the impact of the pandemic and started to grow again in 2021-2022 following the gradual resumption of activities, combined with the post-pandemic economic recovery. Lastly, growth in revenue in 2022-2023 is essentially attributable to higher energy prices, which have increased the value of Hydro-Québec’s exports.
| ANALYSIS OF THE CONSOLIDATED FINANCIAL STATEMENTS | 43 |
4. Analysis of main trends (cont’d)
Change in consolidated revenue (cont’d)
Other revenue
Other revenue increased from $12 251 million in 2013-2014 to $17 824 million in 2022-2023. The average annual growth in other revenue was 4.3% for this period. With the exception of 2019-2020 and 2020-2021, which show a decline, the change in other revenue reflects a relatively steady upward trend.
Among the factors explaining this growth since 2013-2014 are:
| ● | growth of the auction of greenhouse gas emission allowances under Québec’s cap-and-trade system for greenhouse gas emission allowances; |
| ● | growth in the income of the Generations Fund, in particular income from portfolio investments; |
| ● | growth in revenue from registration fees; |
| ● | growth in revenue from mining resources; |
| ● | an increase in revenue related to user contributions in the health and social services, education and higher education networks. |
| 44 | PUBLIC ACCOUNTS 2022-2023 |
4. Analysis of main trends (cont’d)
Change in consolidated expenditure
Expenditure by portfolios
(millions of dollars)
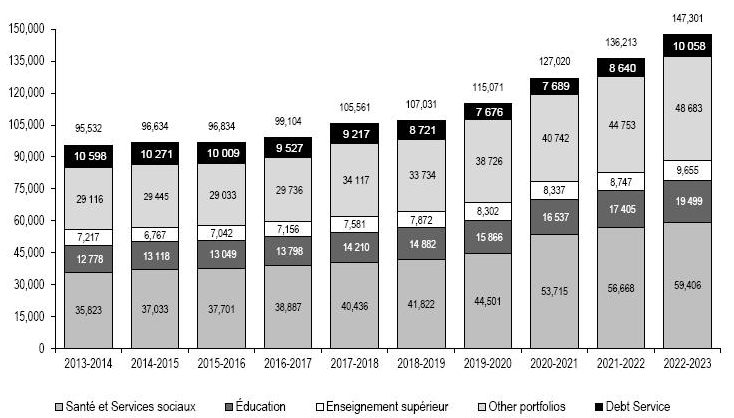
| Note: | Expenditures by portfolios have been restated to reflect the application of the accounting standard relating to asset retirement obligations. |
Expenditure by portfolios
(percentage of consolidated expenditures)
| Portfolios | 2013-2014 | 2014-2015 | 2015-2016 | 2016-2017 | 2017-2018 | 2018-2019 | 2019-2020 | 2020-2021 | 2021-2022 | 2022-2023 | ||||||||||||||||||||||||||||||
| Santé et Services sociaux | 37.5 | 38.3 | 38.9 | 39.2 | 38.3 | 39.1 | 38.7 | 42.3 | 41.6 | 40.3 | ||||||||||||||||||||||||||||||
| Éducation | 13.4 | 13.6 | 13.5 | 14.0 | 13.5 | 13.9 | 13.7 | 13.0 | 12.8 | 13.2 | ||||||||||||||||||||||||||||||
| Enseignement supérieur | 7.6 | 7.0 | 7.3 | 7.2 | 7.2 | 7.4 | 7.2 | 6.6 | 6.4 | 6.6 | ||||||||||||||||||||||||||||||
| Other portfolios | 30.4 | 30.5 | 30.0 | 30.0 | 32.3 | 31.5 | 33.7 | 32.0 | 32.9 | 33.1 | ||||||||||||||||||||||||||||||
| Debt service | 11.1 | 10.6 | 10.3 | 9.6 | 8.7 | 8.1 | 6.7 | 6.1 | 6.3 | 6.8 | ||||||||||||||||||||||||||||||
The government’s consolidated expenditure level increased by $51 769 million from 2013-2014 to 2022-2023, from $95 532 million to $147 301 million. The average annual growth was 4.9%. Moreover, the share of consolidated expenditure devoted to the Santé et Services sociaux portfolio rose by 2.8 percentage points over the reference period, while the share devoted to debt service fell by 4.3 percentage points.
| ANALYSIS OF THE CONSOLIDATED FINANCIAL STATEMENTS | 45 |
4. Analysis of main trends (cont’d)
Change in consolidated expenditure (cont’d)
Santé et Services sociaux portfolio
Expenditure in the Santé et Services sociaux portfolio has been rising steadily since 2013-2014, with average annual growth of 5.8% between 2013-2014 and 2022-2023, compared with 4.9% for consolidated expenditure. This reflects the growing importance of spending in this portfolio, which rose from 37.5% in 2013-2014 to 40.3% in 2022-2023. Growth was more pronounced in the period from 2019-2020 to 2022-2023, mainly due to additional spending on the health care system to manage the pandemic. During this period, spending grew at an average annual rate of 9.2%, compared to 8.3% for total consolidated expenditure.
Éducation and Enseignement supérieur portfolios
Expenditure in the Éducation and Enseignement supérieur portfolios shows average annual growth of 4.8% and 3.3% respectively over the reference period, which is lower than the 4.9% growth in total consolidated expenditure. Consequently, the proportion of spending devoted to these portfolios fell slightly between 2013-2014 and 2022-2023, from 13.4% to 13.2% for education and from 7.6% to 6.6% for higher education.
Nevertheless, from 2021-2022 to 2022-2023, growth in spending on these two portfolios, namely 12.0% in education and 10.4% in higher education, was more pronounced than the average annual growth in consolidated expenditure of 8.1%. In the case of the Éducation portfolio, this was due in particular to salary indexations, increments, salary provisions, an increase in the number of teachers due to the rise in the number of students, and the rising cost of school transportation. For the Enseignement supérieur portfolio, growth is attributable, among other things, to salary indexations, increments, salary provisions and an increase in subsidies to private universities to improve higher education graduation rates, and to the Perspective Québec scholarship program in effect since fall 2022.
Overall, the change in proportions shows that the level of spending on the Éducation and Enseignement supérieur portfolios has remained relatively stable over the years.
| 46 | PUBLIC ACCOUNTS 2022-2023 |
4. Analysis of main trends (cont’d)
Change in consolidated expenditure (cont’d)
Other portfolios
Expenditure in other portfolios, of which there are 22, grew at an average annual rate of 5.9% over the reference period, almost equivalent to that in the Santé et Services sociaux portfolio (5.8%), and higher than that in the Éducation and Enseignement supérieur portfolios (4.8% and 3.3%). The increase of 2.7 percentage points in expenditures in other portfolios in recent years can be explained by the following factors in particular:
| ● | the implementation, in 2021-2022 and 2022-2023, of measures to help Quebecers cope with the rising cost of living, including one-time payments and an increase in the senior assistance amount (Emploi et Solidarité sociale portfolio); |
| ● | the increase in spending related to investments in road network improvement, development and maintenance, and in transportation systems (Transports et Mobilité durable portfolio); |
| ● | growth in spending on municipal affairs and housing, particularly to improve access to housing and to contribute to the repair and construction of water supply and sewer systems and the treatment of municipal wastewater in all regions of Québec (Affaires municipals et Habitation portfolio); |
| ● | growth in financial support for childcare centres and other day care services (Famille portfolio); |
| ● | increased action on environmental protection, sustainable development and climate change (Environnement, Lutte contre les changements climatiques, Faune et Parcs portfolio). |
Debt service
Between 2013-2014 and 2019-2020, debt service has declined steadily before showing a slight increase of 0.2% in 2020-2021 followed by sharp increases of 12.4% in 2021-2022 and 16.4% in 2022-2023. These increases are primarily due to higher interest rates. Despite these increases, the average annual decline in debt service is 0.6% for the entire reference period and the share of expenditure devoted to debt service fell from 11.1% in 2013-2014 to 6.8% in 2022-2023.
| ANALYSIS OF THE CONSOLIDATED FINANCIAL STATEMENTS | 47 |
4. Analysis of main trends (cont’d)
Change in the net book value of fixed assets
(millions of dollars)
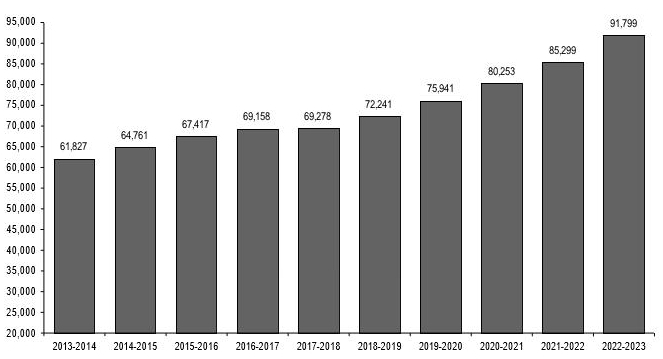
| Note: | Net book values have been restated to reflect the application of the accounting standard relating to asset retirement obligations. |
Fixed assets can be broken down into several different categories, including complex networks, which consist mainly of net investments in road infrastructure. Such investments accounted for 33.5% of the total net book value of fixed assets as at March 31, 2023.
The net book value of fixed assets increased by $6 500 million over the past year, from $85 299 million as at March 31, 2022 to $91 799 million as at March 31, 2023. This increase shows that investments in fixed assets outstrip the related depreciation of the government’s fixed assets as a whole.
| 48 | PUBLIC ACCOUNTS 2022-2023 |
4. Analysis of main trends (cont’d)
As part of the implementation of the measures presented in the 2023-2024 budget, certain provisions of the Act to reduce the debt and establish the Generations Fund have been amended in order for Québec to focus its reporting on net debt as of April 1, 2023 (see indicator 5 on page 57). This reporting on gross debt is carried out in accordance with the provisions of the law in force on March 31, 2023.
Government’s gross debt
(millions of dollars)
| As at March 31 | |||||||||
| 2023 | 2022 | ||||||||
| (reclassified data) | |||||||||
| Debts | 257 111 | 237 351 | |||||||
| Plus: | Self-held securities by the Quebec government | 15 573 | 20 841 | ||||||
| Liabilities related to derivative instruments | 10 684 | 3 831 | |||||||
| Pension plans and other employee future benefits liabilities | 6 785 | 9 457 | |||||||
| Less: | Generations Fund | (18 911 | ) | (15 829 | ) | ||||
| Sinking funds relatin g to borrowings (balance before co mpensation of self-held securities) | | | (31 735 | ) | | | (32 134 | ) | |
| Assets related to derivative instruments | (11 209 | ) | (5 418 | ) | |||||
| Gross debt including advance borrowings | 228 298 | 218 099 | |||||||
| Less: | Advance borrowings | (2 233 | ) | (7 147 | ) | ||||
| Gross debt | 226 065 | 210 952 | |||||||
| As a % of nominal GDP | 41.4 | % | 41.9 | % | |||||
| Note: | The calculation of gross debt as at March 31, 2023 takes into account the prospective application of accounting changes relating to the treatment of financial instruments (see Note 3 to the consolidated financial statements). Thus, as at March 31, 2022, the value of gross debt calculated before deferred foreign exchange gains (losses) remains unchanged, but its composition has been modified to reflect changes in the presentation in the consolidated statement of financial position. |
Change in the government’s gross debt
(millions of dollars)
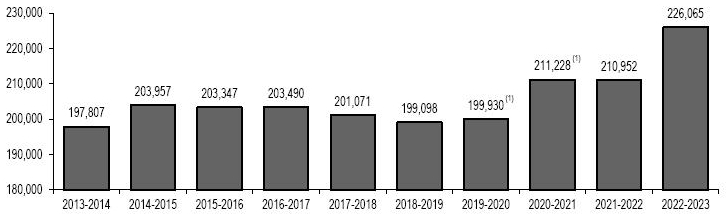
| (1) | The gross debt as at March 31, 2020 and March 31, 2021 was increased by $1 138 million and $1 156 million respectively to exclude from advance borrowings certain amounts held for entities not included in the government’s reporting entity. |
| ANALYSIS OF THE CONSOLIDATED FINANCIAL STATEMENTS | 49 |
4. Analysis of main trends (cont’d)
Increase of the gross debt from March 31, 2013 to March 31, 2023
Gross debt as at March 31, 2013 stood at $191 866 million. It amounted to $226 065 million as at March 31, 2023. Accordingly, for fiscal 2013-2014 to 2022-2023, the government’s gross debt rose by $34 199 million. This increase is due to:
| ● | investments of $35 917 million by the government in its fixed assets; |
| ● | investments, loans and advances totalling $15 413 million, some of which were made to government enterprises; |
| ● | accumulated budgetary deficits of $12 263 million. |
The increase in the gross debt is offset by:
| ● | deposits in the Generations Fund, which reduced the gross debt by $24 673 million; |
| ● | change in other factors which decreased the gross debt by $4 721 million. |
Factors responsible for growth in the government’s gross debt from March 31, 2013 to March 31, 2023
(millions of dollars)
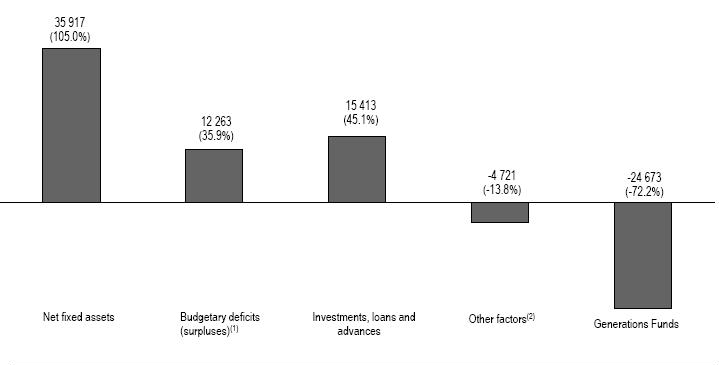
| (1) | For the purpose of establishing the factors responsible for growth in the government’s gross debt, the budget deficits (surpluses) were established based on the restated annual deficits (surpluses) established on page 40, minus the Generations Fund’s revenues. |
| (2) | Other factors include, in particular, the change in other items such as accounts receivable and accounts payable, accrued expenses and other allowances. |
| 50 | PUBLIC ACCOUNTS 2022-2023 |
4. Analysis of main trends (cont’d)
Net financial surpluses (requirements) and financing transactions
Net financial surpluses or requirements represent the gap between the government’s cash receipts and cash payments. More specifically, they mark the government’s available or required cash flow levels after it has conducted all its activities during a given fiscal year. They take into account:
| ● | changes in annual surpluses (deficits); |
| ● | resources or requirements arising from, among other things, the acquisition or disposal of fixed assets, investments, loans and advances, as well as other activities such as the payment of accounts payable and accrued expenses and the collection of accounts receivable. |
The primary objective of determining net financial surpluses or requirements is to provide the Ministère des Finances with the most accurate information so that it can make decisions about changes in government borrowing.
Generally, the impact of net financial surpluses or requirements will have a corresponding impact on gross debt, i.e. increases in net financial requirements will entail borrowing, thereby increasing gross debt, while net financial surpluses lead to loan repayments, thereby reducing gross debt.
Financing transactions show the loans contracted (repaid) and the cash flow generated (used) for all government activities during the fiscal year.
Net financial surpluses (requirements) and financing transactions
(millions of dollars)
Fiscal year ended March 31 | ||||||||
| 2023 | 2022 | |||||||
| (restated data) | ||||||||
| Cash flow provided by operating activities | (4 698 | ) | 3 487 | |||||
| Cash flow used for investments activities(1) | 5 011 | (2 892 | ) | |||||
| Cash flow used for fixed asset investment activities | (11 445 | ) | (9 584 | ) | ||||
| Net financial surplus (requirements) | (11 132 | ) | (8 989 | ) | ||||
| Cash flow provided by financing activities(1) | 11 146 | 7 161 | ||||||
| Change in cash flow during the fiscal year | (14 | ) | 1 828 | |||||
| Financing transactions | 11 132 | 8 989 | ||||||
| Note: | These financial data take into account the prospective application of accounting changes relating to the treatment of financial instruments (see Note 3 to the consolidated financial statements). Thus, some information have been modified to reflect changes in the presentation of the consolidated statement of cash flows. |
| (1) | Cash flows used for investment activities included anticipated titles repurchasings totalling $6 250 M as at March 31, 2023 (no anticipated titles repurchasings as at March 31, 2022) as well as investment activities related to cash management of $28 million as at March 31, 2023 ($1 592 million as at March 31, 2022), with maturities ranging from 3 to 12 months at acquisition. This last item has been restated as at March 31, 2022. For the purposes of the net financial surpluses (requirements) and financing transactions, those transactions are presented in the cash flows used for financing activities. |
| ANALYSIS OF THE CONSOLIDATED FINANCIAL STATEMENTS | 51 |
▌ 5. Results of the indicator analysis
The financial indicator analysis aims primarily to clarify and explain the information contained in the government’s consolidated financial statements.1
The Gouvernement du Québec presents 11 indicators based on those established by the Public Sector Accounting Board in a Statement of Recommended Practice. These indicators are intended to measure a government’s sustainability, flexibility and vulnerability.
| ● | Sustainability refers to the degree to which the government can meet its existing financial obligations without increasing, in relative terms, the debt or tax burden on the economy. |
| ● | Flexibility is the extent to which the government can change its debt burden or the tax burden of its citizens to meet its existing financial obligations without compromising its ability to meet its future obligations. |
| ● | Vulnerability is the degree to which the government is dependent on sources of funding outside its control or influence. |
| 1 | Where financial statements have been restated in a subsequent financial year, the restated data has been used. |
| 52 | PUBLIC ACCOUNTS 2022-2023 |
5. Results of the indicator analysis (cont’d)
Indicator’s evolution over the past 5 years
(percent)
| 2017-2018 | 2018-2019 | 2019-2020 | 2020-2021 | 2021-2022 | 2022-2023 | 5 years evolution(1) | |||||||||||
| Sustainability | |||||||||||||||||
| 1. | Assets / Liabilities | 57.9 | 59.2 | 61.9 | 63.8 | 65.7 | 66.5 |  |  | ||||||||
| 2. | Gross debt / Total revenue | 185.5 | 173.5 | 170.9 | 172.3 | 151.9 | 156.7 |  | | ||||||||
| 3. | Expenditures by portfolio / Consolidated expenditure | ||||||||||||||||
| 3a. | Expenditure for the Santé et Services sociaux portfolio / Consolidated expenditure | 38.3 | 39.1 | 38.7 | 42.3 | 41.6 | 40.3 | | n/a | ||||||||
| 3b. | Expenditure for the Éducation portfolio / Consolidated expenditure | 13.5 | 13.9 | 13.7 | 13.0 | 12.8 | 13.2 | | n/a | ||||||||
| 3c. | Expenditure for the Enseignement supérieur portfolio / Consolidated expenditure | 7.2 | 7.4 | 7.2 | 6.6 | 6.4 | 6.6 | | n/a | ||||||||
| 3d. | Expenditure for the Debt service / Consolidated expenditure | 8.7 | 8.1 | 6.7 | 6.1 | 6.3 | 6.8 | | n/a | ||||||||
| 3e. | Expenditure for the other portfolios / Consolidated expenditure | 32.3 | 31.5 | 33.7 | 32.0 | 32.9 | 33.1 | | n/a | ||||||||
| 4. | Gross debt / GDP | 48.0 | 45.3 | 43.5 | 46.8 | 41.9 | 41.4 | | | ||||||||
| 5. | Net debt / GDP | 45.9 | 42.9 | 40.9 | 43.1 | 39.1 | 38.3 | | | ||||||||
| 6. | Debt representing accumulated deficits / GDP | 29.2 | 26.3 | 24.2 | 24.9 | 21.6 | 21.1 | | | ||||||||
| 7. | Consolidated expenditure / GDP | 23.0 | 22.4 | 23.4 | 26.4 | 25.3 | 25.2 | |  | ||||||||
| Flexibility | |||||||||||||||||
| 8. | Debt service / Total revenue | 8.5 | 7.6 | 6.6 | 6.3 | 6.2 | 7.0 | | | ||||||||
| 9. | NBV of fixed assets / Cost of fixed assets | 56.0 | 55.9 | 55.9 | 56.3 | 56.6 | 57.1 | | | ||||||||
| 10. | Own-source revenue / GDP | 20.5 | 20.8 | 20.0 | 20.4 | 21.8 | 21.2 | | | ||||||||
| Vulnerability | |||||||||||||||||
| 11. | Federal government transfers / Total revenue | 20.7 | 20.1 | 21.6 | 25.1 | 21.0 | 19.9 | | | ||||||||
| Upward trend in the indicator | | Downward trend in the indicator | | Positive evolution | | Negative evolution |
| (1) | The trend (upward or downward) is determined by comparing the values furthest away from the reference period, namely those for 2022-2023 and those for 2017-2018. |
In this section, gross domestic products (GDP) used correspond to nominal GDPs as of November 8, 2023. Where applicable, GDPs for the reference years are adjusted for the purpose of calculating the indicators.
| ANALYSIS OF THE CONSOLIDATED FINANCIAL STATEMENTS | 53 |
5. Results of the indicator analysis (cont’d)
Indicator 1: Assets to total liabilities
This indicator illustrates the extent to which the government finances its current operations through liabilities. A ratio of over 100% indicates that a surplus was accumulated in the past and that the value of the government’s financial and non-financial assets is higher than that of its liabilities. A ratio of less than 100% indicates that a deficit was accumulated in the past and that the value of the government’s financial and non-financial assets is lower than that of its liabilities. An upward ratio illustrates a favourable trend.
Financial and non-financial assets
(percentage of total liabilities)
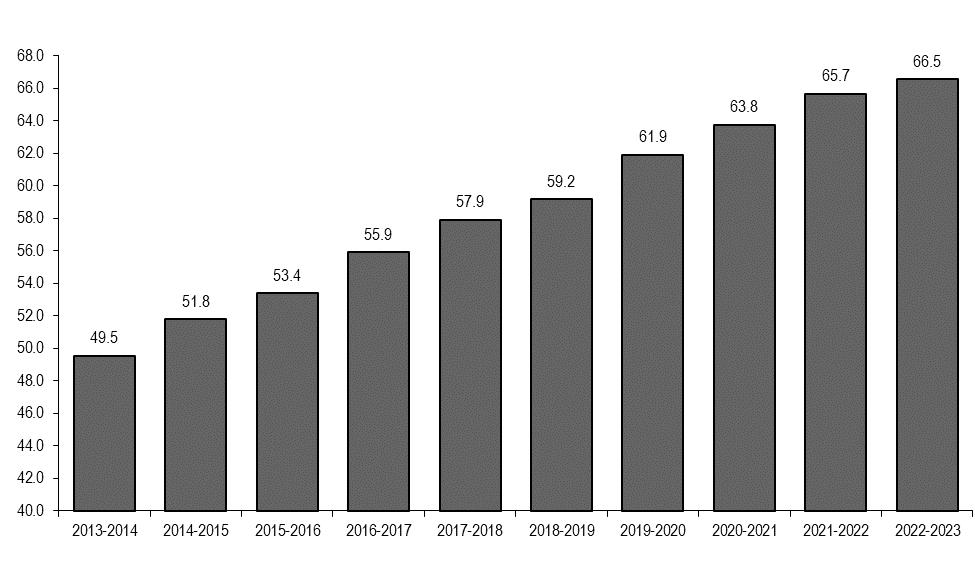
| Note: | Ratios have been restated to reflect the application of the accounting standard relating to asset retirement obligations and changes in the presentation of items in the consolidated statement of financial position following the application of the new accounting standards relating to financial instruments. |
The ratio of financial and non-financial assets to total liabilities was 49.5% in 2013-2014. The ratio stood at 66.5% as at March 31, 2023. Taking the accumulated deficit into account, the value of assets is still lower than that of liabilities. In addition, an improvement can be observed in the ratio, showing that assets have climbed at a faster rate than liabilities. Moreover, over the past years, borrowings have been used mainly to finance fixed asset acquisitions.
| 54 | PUBLIC ACCOUNTS 2022-2023 |
5. Results of the indicator analysis (cont’d)
Indicator 2: Gross debt to total revenue
This indicator is intended to put the size of the government’s gross debt into perspective by comparing it with the government’s revenue. A declining ratio indicates a decrease in the relative weight of the gross debt.
Gross debt
(percentage of total revenue)

| (1) | The gross debt as at March 31, 2020 and March 31, 2021 was increased by $1 138 million and $1 156 million respectively so that certain amounts held for entities not included in the government’s reporting entity are excluded from advance borrowings. |
Between 2013-2014 and 2022-2023, the change in the ratio shows a steady decline from 212.1% to 151.9%. This decline means that revenue is growing at a faster rate than debt. The more pronounced decline in the ratio in 2021-2022 is explained by a significant growth of 13.2% in total revenue, resulting mainly from the effects of the economic rebound, compared to a 0.1% decline in the gross debt for the same period.
In 2022-2023, the ratio rose by 4.8 percentage points, due to a 7.2% increase in gross debt, while total revenues increased less significantly over the same period, by 3.9%. This more pronounced change in gross debt can be explained in particular by the impact of the annual deficit, influenced by the measures implemented to combat inflation, and by the growth in capital investments, notably in the health and education networks.
Indicator 3: Expenditures by portfolios to consolidated expenditure
This indicator, presented in section 4, Analysis of main trends (page 45), illustrates the evolution of the distribution of consolidated government expenditure between portfolios.
| ANALYSIS OF THE CONSOLIDATED FINANCIAL STATEMENTS | 55 |
5. Results of the indicator analysis (cont’d)
Indicator 4: Gross debt to GDP
This indicator puts the government’s gross debt and its ability to pay into perspective, as measured by GDP. A downward trend in this ratio reflects a decline in the relative weight of the gross debt.
Gross debt
(percentage of GDP)
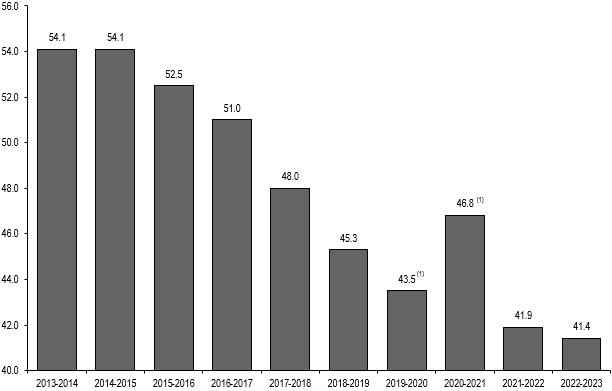
| (1) | The gross debt as at March 31, 2020 and March 31, 2021 was increased by $1 138 million and $1 156 million respectively so that certain amounts held for entities not included in the government’s reporting entity are excluded from advance borrowings. |
The ratio of gross debt to GDP was maintained for 2013-2014 and 2014-2015, and then gradually declined until 2019-2020, reaching a low of 43.5%. The 3.3-percentage-point increase in the ratio in 2020-2021, making it reach 46.8%, is attributable to an increase in the debt to confront the pandemic and a decrease in GDP stemming from the confinement measures, including the temporary closing of certain economic sectors. Then, strong GDP growth in 2021-2022, due primarily to the economic rebound following the easing of the health measures, has allowed this ratio to decline to a lower level than before the pandemic. The ratio continued to fall in 2022-2023 despite a 7.2% increase in gross debt, as GDP grew by 8.4% due to sustained economic vigour since the recovery started in 2021-2022. The ratio reached 41.4% for 2022-2023, the lowest level over the reference period.
| 56 | PUBLIC ACCOUNTS 2022-2023 |
5. Results of the indicator analysis (cont’d)
This indicator puts the government’s net debt into perspective with its ability to pay, as measured by GDP. A downward trend in this ratio means that government debt is becoming less of a burden on the economy. Conversely, an increase in the ratio may lead the government to take measures to reduce the debt burden, such as raising taxes or reducing portfolio expenditures to cover interest costs.
Net debt
(percentage of GDP)
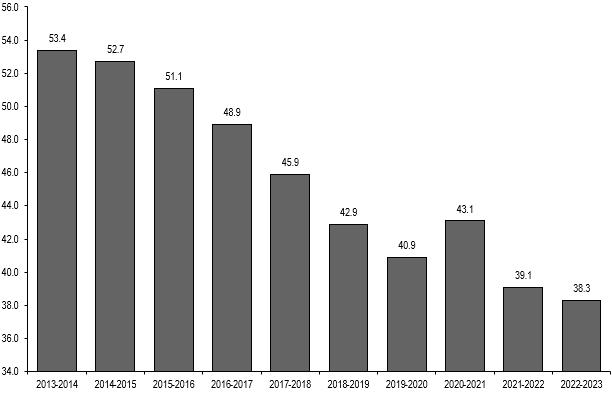
| Note: | Ratios have been restated to reflect the application of the accounting standard relating to asset retirement obligations. |
The net debt-to-GDP ratio declined between 2013-2014 and 2019-2020, reaching a low of 40.9%. The increase in the ratio of 2.2 percentage points in 2020-2021, bringing it to 43.1% is explained by an increase in debt to cope with the pandemic and a decline in GDP caused by confinement measures, including temporary closures of certain economic sectors. Strong GDP growth in 2021-2022, driven mainly by the economic recovery following the easing of health measures, has reduced this ratio to below pre-pandemic levels. The ratio continued to fall in 2022-2023, despite a 6.1% rise in net debt due to a 8.4% increase in GDP, driven by sustained economic vigour since the 2021-2022 recovery. The ratio has therefore reached 38.3% for 2022-2023, the lowest level for the reference period. Lastly, the government has set itself the target of reducing net debt to 30% of GDP by 2037-2038.
| ANALYSIS OF THE CONSOLIDATED FINANCIAL STATEMENTS | 57 |
5. Results of the indicator analysis (cont’d)
Indicator 6: Debt representing accumulated deficits to GDP
This indicator relates the debt representing accumulated deficits, or the debt not used to finance assets, with the government’s ability to pay, as measured by GDP. A downward trend in this ratio means a reduction in the relative weight of the debt representing accumulated deficits.
Debt representing accumulated deficits
(percentage of GDP)

| Note: | Debt representing accumulated deficits corresponds to accumulated deficits before taking into account the stabilization reserve. Ratios have been restated to reflect the application of the accounting standard relating to asset retirement obligations. |
The ratio of the debt representing accumulated deficits to GDP gradually declined from 2013-2014 to 2019-2020, from 36.3% to 24.2%. It then increased by 0.7-percentage-point to reach 24.9% as at March 31, 2021. This increase in the ratio in relation to 2019-2020 is attributable to the deficit in the 2020-2021 fiscal year and a downturn in GDP stemming from the confinement measures, including the temporary closing of certain economic sectors. The strong GDP growth in 2021-2022, due primarily to the economic rebound following the easing of the health measures, has allowed this ratio to decline to a lower level than before the pandemic. Lastly, in 2022-2023, strong GDP growth of 8.4% brought this ratio down to 21.1%, thus reaching the lowest level of the reference period.
| 58 | PUBLIC ACCOUNTS 2022-2023 |
5. Results of the indicator analysis (cont’d)
Indicator 7: Consolidated expenditure (excluding debt service) to GDP
This indicator makes it possible to compare the growth of government spending with that of the economy over the years. A decline (increase) in this indicator means that spending is growing less (more) rapidly than the economy. The indicator shows the change in the relative weight of the cost of public services in the economy.
Consolidated expenditures (excluding debt service)
(percentage of GDP)
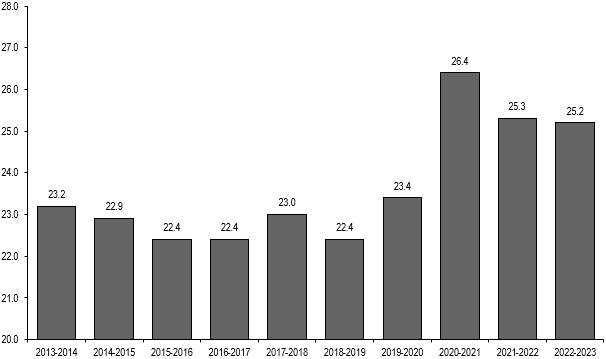
Between 2013-2014 and 2019-2020, the consolidated expenditure-to-GDP ratio was maintained, fluctuating between 22.4% and 23.4%. In 2020-2021, this ratio jumped significantly to a high of 26.4% due to high expenditure growth. This growth is primarily due to one-time costs related to the COVID-19 pandemic combined with the decline in GDP caused by confinement measures, including the temporary shutdowns of certain economic sectors.
From 2021-2022 to 2022-2023, the ratio decreased by 0.1-percentage-point, reaching 25.2%. For these two years, the decrease was due to a growth in GDP that was higher than the increase in expenditure. The growth in GDP is related to the rebound in the economy which began in 2021-2022, following the lifting of the health emergency. The increase in expenditure is explained by the one-time costs associated with the health emergency, including the costs to support the health system, and by the support measures implemented to help the population cope with to the rising cost of living.
| ANALYSIS OF THE CONSOLIDATED FINANCIAL STATEMENTS | 59 |
5. Results of the indicator analysis (cont’d)
Indicator 8: Debt service to total revenue
This indicator illustrates the share of government revenue that must be allocated to debt service. A decline in this ratio over time means that a larger share of revenue can be devoted to other portfolio expenditures.
Debt service
(percentage of total revenue)
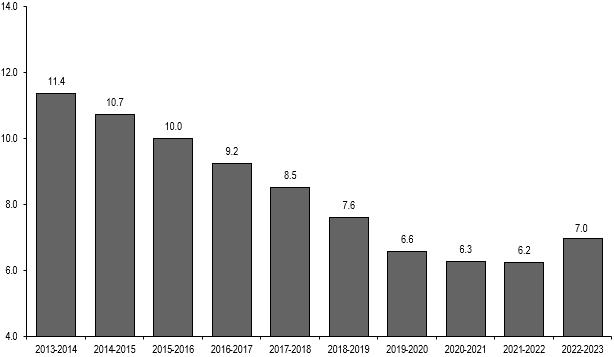
Overall, the proportion of revenue devoted to debt service has fallen since 2013-2014, from 11.4% to 6.2% in 2021-2022, but has rebounded in 2022-2023 to 7.0%. This increase is due in particular to a 16.4% growth in debt service higher than the 3.9% increase in total revenues. The growth in debt service stems from the rise in interest rates and the 7.2% increase in gross debt over the past fiscal year.
| 60 | PUBLIC ACCOUNTS 2022-2023 |
5. Results of the indicator analysis (cont’d)
Indicator 9: Net book value of fixed assets to their cost
This indicator shows the extent to which the estimated remaining useful life of tangible assets will enable the government to supply products and services in the future. An increase in this ratio indicates that on average the age of fixed assets is lower, and thus that their remaining useful life is longer. The fixed assets can thus be used for a longer period of time before they need to be replaced.
Net book value of fixed assets
(percentage of the cost of fixed assets)
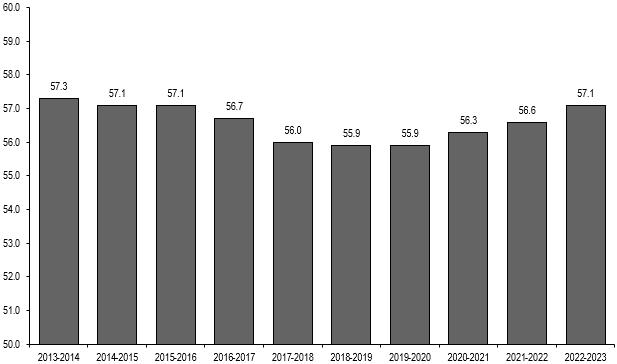
| Note: | Ratios have been restated to reflect the application of the accounting standard relating to asset retirement obligations. |
The net book value to the cost of fixed assets indicator has gradually declined between 2013-2014 and 2018-2019 to a low of 55.9% at March 31, 2019. Following this decline, the ratio remained steady in 2019-2020 then increased to reach 57.1% in 2022-2023. Despite the variations observed, this ratio remains relatively stable, fluctuating between 55.9% and 57.3% over the 10-year reference period.
| ANALYSIS OF THE CONSOLIDATED FINANCIAL STATEMENTS | 61 |
5. Results of the indicator analysis (cont’d)
Indicator 10: Own-source revenue to GDP
This indicator shows the proportion of collective wealth that the government must collect in order to fund public services. The government’s own-source revenue consists of income tax and other taxes, user fees and other revenue derived from its enterprises in particular. This revenue includes all of the government’s revenue, apart from transfers received from the federal government. A decline in this ratio over time tends to indicate that more created wealth is directly available to taxpayers, while an increase suggests reduced government flexibility regarding future revenues.
Own-source revenue
(percentage of GDP)
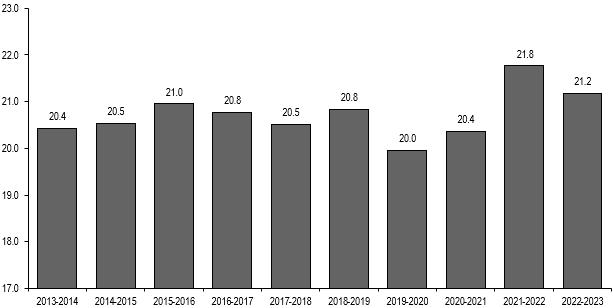
From 2013-2014 to 2015-2016, the ratio of own-source revenue to GDP has slighty increased from 20.4% to 21.0%. This increase contributed to a return to a balanced budget in 2015-2016. The ratio has trended downward over the subsequent five-year period to reach 20.0% in 2019-2020, mainly because of the measures to reduce the tax burden implemented by the government and the growth of the economy. The 2018-2019 rebound is primarily explained by income from portfolio investments of the Generations Fund resulting from withdrawals totalling $8 billion, as well as an exceptional gain in Hydro-Québec’s income related to the partial sale of a subsidiary. In 2020-2021, the ratio increased to 20.4% mainly because of the drop in GDP stemming from the confinement measures, including the temporary closing of certain economic sectors. The economic recovery has caused the ratio of own-source revenue to GDP to jump to 21.8% in 2021-2022 owing to a growth in own-source revenue exceeding that of GDP. Lastly, the ratio fell to 21.2% in 2022-2023, as the 5.4% growth in own-source revenue was less than the 8.4% increase in GDP.
| 62 | PUBLIC ACCOUNTS 2022-2023 |
5. Results of the indicator analysis (cont’d)
Indicator 11: Transfers from the federal government to total revenue
Transfers received from the federal government comprise equalization payments, payments from transfers for health care, and for post-secondary education and other social programs, and amounts transferred under various agreements. This indicator measures the proportion of the Québec government’s revenue that comes from the federal government.
Federal government transfers
(percentage of total revenue)
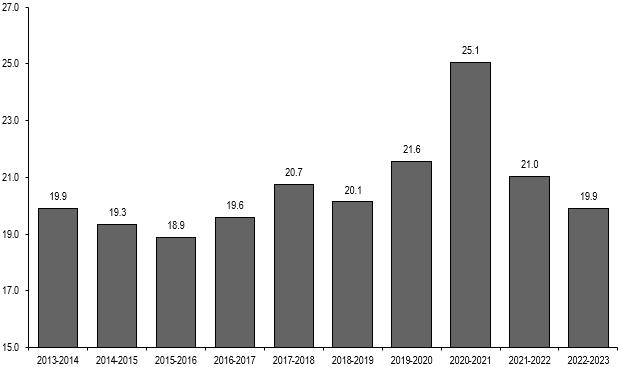
The proportion of federal government transfers in total revenue was 19.9% in 2013-2014. The proportion fell slightly in 2014-2015 to 19.3%, due to the end of payments of compensation for harmonization of the QST with the GST. Between 2015-2016 and 2020-2021, the ratio shows an upward trend, to 25.1%, which is due in particular to the continued increase in equalization revenue and health transfers. The more pronounced change in the ratio in 2020-2021 is explained by a significant increase in federal government transfers, which aimed to support the implementation by the provinces of COVID-19 pandemic-related measures. In 2021-2022, the ratio fell sharply reaching 21.0% following the decrease in federal transfers related to the management of the pandemic and significant growth in total revenues of 13.2% in the context of economic recovery. Finally, the ratio fell by 1.1 percentage point in 2022-2023 to 19.9%, due in particular to the end of certain health transfers in the context of the pandemic and a slight increase in total revenues of 3.9%.
| ANALYSIS OF THE CONSOLIDATED FINANCIAL STATEMENTS | 63 |
Financial statistics
These tables present certain financial information published in the government’s consolidated financial statements1.
Table 1.1 – Historical data for consolidated financial statement items
Fiscal year ended March 31
(millions of dollars)
| Fiscal year | Revenue | Expenditure | Surplus (deficit)(1) | Financial assets | Liabilities | Net debt | Non-Financial assets | Accumulated deficit(2) |
| 2022-2023 | 144 299 | 147 301 | (3 002) | 134 609 | (343 321) | (208 712) | 93 833 | (114 879) |
| 2021-2022 | 138 831 | 136 213 | 2 618 | 120 565 | (317 365) | (196 800) | 87 831 | (108 969) |
| 2020-2021 | 122 611 | 127 020 | (4 409) | 115 128 | (309 774) | (194 646) | 82 366 | (112 280) |
| 2019-2020 | 116 974 | 115 071 | 1 903 | 103 614 | (291 687) | (188 073) | 76 996 | (111 077) |
| 2018-2019 | 114 746 | 107 031 | 7 715 | 94 557 | (283 204) | (188 647) | 73 035 | (115 612) |
| 2017-2018 | 108 404 | 105 561 | 2 843 | 98 004 | (290 109) | (192 105) | 70 037 | (122 068) |
| 2016-2017 | 103 082 | 99 104 | 3 978 | 89 102 | (284 386) | (195 284) | 69 910 | (125 374) |
| 2015-2016 | 100 123 | 96 834 | 3 289 | 80 928 | (279 140) | (198 212) | 68 141 | (130 071) |
| 2014-2015 | 95 937 | 96 634 | (697) | 77 369 | (275 930) | (198 561) | 65 505 | (133 056) |
| 2013-2014 | 93 273 | 95 532 | (2 259) | 67 651 | (262 989) | (195 338) | 62 537 | (132 801) |
| Note: | Certain financial information has been restated to reflect the application of the accounting standard relating to asset retirement obligations and other information has been reclassified to account for changes in the presentation of items in the consolidated statement of financial position following the application of the new accounting standards relating to financial instruments. |
| (1) | The budget balance within the meaning of the Balanced Budget Act is presented in Table 1.3 (page 66). |
| (2) | Table 1.2 (page 65) presents the breakdown of the annual change in accumulated operating deficit attributable to the comprehensive income of government enterprises and to accounting changes. |
| 1 | Where financial statements have been restated in a subsequent financial year, the restated data has been used. |
| 64 | PUBLIC ACCOUNTS 2022-2023 |
6. Additional information (cont’d)
Financial statistics (cont’d)
Table 1.2 – Breakdown of the annual change in accumulated operating deficits attributable to accounting changes
Fiscal year ended March 31
(millions of dollars)
| Fiscal year | Restatements of operating accumulated deficits | Total | Details of adjustments | |
| Government enterprises | Departments and bodies | |||
| 2022-2023 | — | (3 777) | (3 777) | Application of the accounting standard relating to asset retirement obligations ($3 777 M). |
| 2021-2022 | — | — | — | |
| 2020-2021 | — | (12 504) | (12 504) | Change in the application of the accounting standard on government transfers in order to account for transfer expenditures according to the completion progress of eligible work by transfer recipients ($12 504 M). |
| 2019-2020 | — | — | — | |
| 2018-2019 | 45 | — | 45 | Hydro-Québec’s adoption of new guidance of the Financial Accounting Standards Board (FASB) on leases ($10 M).
Accounting changes made by other government enterprises to comply with new International Reporting Standards (IFRS) on financial instruments ($35 M). |
| 2017-2018 | — | — | — | |
| 2016-2017 | — | — | — | |
| 2015-2016 | (107) | — | (107) | Finalization of the adjustments made in 2014-2015 to comply with IFRS ($107 M). |
| 2014-2015 | (2 252) | 294 | (1 958) | Departments and bodies: adjustment to revenue for previous years, in respect of the sale tax, collected by Canada Revenue Agency from selected listed financial institutions ($294 M).
Government enterprises: adjustment to comply with IFRS ($2 252 M). |
| 2013-2014 | (11) | — | (11) | Accounting change to comply with IFRS IAS 19, Employee Benefits ($11 M). |
| ANALYSIS OF THE CONSOLIDATED FINANCIAL STATEMENTS | 65 |
6. Additional information (cont’d)
Financial statistics (cont’d)
Table 1.3 – Budget balance within the meaning of the Balanced Budget Act
Fiscal year ended March 31
(millions of dollars)
| Fiscal Year | Restated surplus (deficit) | Generations Fund | Sub-total | Adjustments(1) | Use of the stabilization reserve | Budget balance(2) | Allocation to the stabilization reserve |
| 2022-2023 | (3 002) | (3 082) | (6 084) | 449 | (5 635) | ||
| 2021-2022 | 2 618 | (3 617) | (999) | 227 | 772 | — | |
| 2020-2021 | (4 409) | (3 313) | (7 722) | (3 038) | 10 760 | — | |
| 2019-2020 | 1 903 | (2 606) | (703) | 707 | 4 | (4) | |
| 2018-2019 | 7 715 | (3 477) | 4 238 | 565 | 4 803 | (4 803) | |
| 2017-2018 | 2 843 | (2 293) | 550 | 2 072 | 2 622 | (2 622) | |
| 2016-2017 | 3 978 | (2 001) | 1 977 | 384 | 2 361 | (2 361) | |
| 2015-2016 | 3 289 | (1 453) | 1 836 | 355 | 2 191 | (2 191) | |
| 2014-2015 | (697) | (1 279) | (1 976) | 1 251 | (725) | ||
| 2013-2014 | (2 259) | (1 121) | (3 380) | 556 | (2 824) |
| (1) | In order to comply with the Budget Balance Act’s provisions, it is necessary to make adjustements to the adjusted annual surpluses and deficits are required to establish the budgetary balance. Among those adjustments, accounting changes that require affecting the accumulated deficits must be considered in the fiscal year in which the change is made. Thus, adjustments have notably been made to take into account the fact that restatements arising from the application of the new accounting standard relating to asset retirement obligations are not to be taken into account in establishing budget balances, and due to the fact that the change in application of the accounting standard respecting transfer payments must only affect the establishement of the 2020-2021 budget balance. |
| (2) | The budget balance shows the achievement of a balanced budget in accordance with section 6 of the Act, which stipulates that the government may not incur a budgetary deficit. This section does not apply to the years 2009-2010 to 2014-2015 nor to the years 2021-2022 and 2022-2023. |
| 66 | PUBLIC ACCOUNTS 2022-2023 |
6. Additional information (cont’d)
Financial statistics (cont’d)
Table 1.4 – Stabilization reserve
Fiscal year ended March 31
(millions of dollars)
| Fiscal Year | Opening balance | Amounts allocated to the reserve | Amounts used to maintain a balanced budget | Deposits in the Generations Fund | Closing balance |
| 2022-2023 | 449 | (449) | — | ||
| 2021-2022 | 1 221 | (772) | 449 | ||
| 2020-2021 | 11 981 | (10 760) | 1 221 | ||
| 2019-2020 | 11 977 | 4 | 11 981 | ||
| 2018-2019 | 7 174 | 4 803 | 11 977 | ||
| 2017-2018 | 4 552 | 2 622 | 7 174 | ||
| 2016-2017 | 2 191 | 2 361 | 4 552 | ||
| 2015-2016 | — | 2 191 | 2 191 | ||
| 2014-2015 | — | — | |||
| 2013-2014 | — | — |
| ANALYSIS OF THE CONSOLIDATED FINANCIAL STATEMENTS | 67 |
Risks and uncertainties
The following factors are elements of risk and uncertainty that are not directly dependent on the government but that can cause actual results to differ from forecast results, particularly:
| ● | the economic forecasts the government uses to determine its annual budgetary revenue, particularly those concerning changes in economic growth, employment and the Consumer Price Index. For example, a 1-percentage-point difference in nominal GDP has an impact of about $1 billion on own-source revenue excluding revenue from government enterprises; |
| ● | the level of spending, whose cost is related to the economic situation. For example, changes in the labour market affect the cost of employment assistance and income security programs, and inflation increases the cost of service contracts. Similarly, in the health sector, changes in the clientele raises the risk of cost overruns for medication and public services. To this must be added the public capital investment completion rate which affects expenditures related to the depreciation of fixed assets; |
| ● | revenue from government enterprises which varies according to assumptions concerning such things as weather conditions, which are hard to predict. For example, a variation of 1ºC in winter temperatures compared to normal temperatures has a nearly $85-million impact on Hydro-Québec’s net earnings; |
| ● | the economic, taxation and population data the government uses to determine revenue from federal government transfers, as well as the negotiations carried out regularly with the federal government. These data and negotiations can both affect federal government transfer revenue; |
| ● | unforeseen situations such as a pandemic, natural catastrophes or work stoppages; |
| ● | the change in interest rates and in returns of the Retirement Plans Sinking Fund (RPSF), which have an impact on debt service; |
| ● | the risk that a financial intermediary will default on its contractual obligations (credit risk); |
| ● | the settlement of certain claims and lawsuits pending against the government before the courts. |
The consolidated financial statements also set forth in its notes the uncertainties to which the estimates needed to prepare these statements are subject.
| 68 | PUBLIC ACCOUNTS 2022-2023 |
Appendix 1
Risks and uncertainties (cont’d)
To reduce its exposure to risk, the government develops management strategies for some of these variables. With the help of economic, fiscal and budgetary policies, the government can influence its revenue and expenditure, other than debt service, by:
| ● | using economic forecasts that do not anticipate overly high or overly low revenue–a situation that could lead to inappropriate policy decisions; |
| ● | monitoring economic, budgetary and financial indicators, including the monitoring of its consolidated revenue and expenditure; |
| ● | implementing economic support measures. |
A government cannot prevent a recession or an economic slowdown single-handedly. However, it has the necessary means to play a stabilizing role in order to offset the effects of an economic slowdown and speed up the recovery.
In addition, financing policies lead the government to have an impact on its debt service through various strategies.
| ANALYSIS OF THE CONSOLIDATED FINANCIAL STATEMENTS | 69 |
FINANCIAL
STATEMENTS
Fiscal year 2022-2023
The Comptroller of Finance is responsible for preparing the government’s consolidated financial statements for the Minister of Finance in accordance with the provisions of section 86 of the Financial Administration Act (CQLR, chapter A-6.001). The Comptroller of Finance is also responsible for the integrity and objectivity of the consolidated financial statements in accordance with the accounting policies disclosed in the notes and established pursuant to the public sector accounting standards.
To fulfill their accounting and financial reporting responsibilities, the Comptroller of Finance and the entities making up the government’s reporting entity maintain financial management systems and internal controls that take costs, benefits and risks into account. These systems are designed to provide reasonable assurance that transactions are duly authorized by Parliament, carried out based on the adopted regulations, and properly recognized in order to account for the use of public funds.
The Comptroller of Finance obtains all the information needed to meet the accounting requirements from government departments, bodies, enterprises and funds and implements processes to ensure that this information is reliable. The Comptroller of Finance submits the government’s consolidated financial statements for audit to the Auditor General of Québec which states the nature and scope of its audit and expresses its opinion in its independent auditor’s report to the National Assembly.
The consolidated financial statements are part of the Public Accounts and are tabled annually in the National Assembly by the Minister of Finance.
On behalf of the Gouvernement du Québec,
| Julie Gingras | Lucie Pageau, CPA |
| Deputy Minister of Finance | Comptroller of Finance |
Québec, December 11, 2023
| CONSOLIDATED FINANCIAL STATEMENTS | 73 |

To the National Assembly
Report on the Audit of the Consolidated Financial Statements
Opinion
I have audited the consolidated financial statements of the Gouvernement du Québec (the Government), which comprise the consolidated statement of financial position as at March 31, 2023, and the consolidated statement of operations and accumulated operating deficit, consolidated statement of change in net debt, consolidated statement of remeasurement gains and losses and consolidated statement of cash flow for the year then ended, and notes and appendices to the consolidated financial statements, including a summary of significant accounting policies.
In my opinion, the accompanying consolidated financial statements present fairly, in all material respects, the consolidated financial position of the Government as at March 31, 2023, and its consolidated results of operations, its consolidated remeasurement gains and losses, its consolidated changes in net debt and its consolidated cash flow for the year then ended in accordance with Canadian public sector accounting standards.
Basis for Opinion
I conducted my audit in accordance with Canadian generally accepted auditing standards. My responsibilities under those standards are further described in the Auditor’s Responsibilities for the Audit of the Consolidated Financial Statements section of my report. I am independent of the Government in accordance with the ethical requirements that are relevant to my audit of the consolidated financial statements in Canada, and I have fulfilled my other ethical responsibilities in accordance with these requirements. I believe that the audit evidence I have obtained is sufficient and appropriate to provide a basis for my opinion.
Key Audit Matters
Key audit matters are those matters that, in my professional judgment, were of most significance in my audit of the consolidated financial statements of the current period. These matters were addressed in the context of my audit of the consolidated financial statements as a whole, and in forming my opinion thereon, and I do not provide a separate opinion on these matters.
| CONSOLIDATED FINANCIAL STATEMENTS | 75 |
| Key audit matter | How the matter was addressed in the audit |
| Asset retirement obligations | |
During the current period, the government adopted the new public sector accounting standard PS 3280 – Asset retirement obligations, which became effective on April 1, 2022. It elected to use the modified retroactive approach as described in Note 3 Accounting changes and reclassifications. In addition, as mentioned in note 15 Environmental liability and asset retirement obligations of the government’s consolidated financial statements, these obligations amounted to $4,390 million as at March 31, 2023, and mainly concern the removal of asbestos from government buildings.
The government made several assumptions and exercised a significant degree of judgment in determining the discount and inflation rates, the cost of asset retirement activities, and the timetable for completing those activities. As a result, the amounts recorded in the consolidated financial statements may vary significantly over the coming years as these assumptions are revised in response to new information.
It is due to the magnitude of the amount of obligations and the significant degree of judgment exercised by the government in setting the various assumptions that the valuation of asset retirement obligations is considered a key audit matter.
| My approach to addressing this matter included the following procedures:
● validating the completeness of management’s identification of legal obligations associated with asset retirement;
● analyzing the reasonableness of management’s main assumptions, namely:
- the cost of asset retirement activities,
- the timetable for completing those activities,
- the discount rate,
- the indexation rate for estimated costs;
● assessing the competence of specialists selected by management;
● validating the discount and accretion calculations leading to asset retirement obligation balances in the consolidated financial statements;
● assessing presentation and disclosure in the consolidated financial statements, particularly the application of the transitional provisions adopted.
I used the services of an engineering firm and valuation experts to assist me in my audit.
|
| Obligations relating to accrued benefits under the pension plans | |
As mentioned in Note 16 Assets and liabilities regarding pension plans and other employee future benefits of the government’s consolidated financial statements, the obligations relating to accrued benefits under the pension plans amounted to $120,845 million as at March 31, 2023.
Obligations relating to accrued benefits under the defined-benefit pension plans are recognized using the projected benefit method prorated on years of service and the most probable assumptions set by the government. The government has exercised a significant degree of judgment in determining the discount rates and making the assumptions required to estimate these amounts. As a result, the amounts recorded in the consolidated financial statements may vary significantly as these assumptions are realized or revised.
It is due to the magnitude of the amount of obligations and the significant degree of judgment exercised by the government in setting the actuarial assumptions that the valuation of obligations relating to accrued benefits under the pension plans is considered a key audit matter.
| My approach to addressing this matter included the following procedures:
● gaining an understanding of the systems, processes and controls used to value the liability;
● assessing the reasonableness of assumptions, particularly the discount rate, salary growth rate and life expectancy, and of the method used;
● validating the completeness and accuracy of the underlying data used to establish the actuarial valuations;
● testing the calculation of obligations relating to accrued benefits under the pension plans;
● assessing the competence of specialists selected by management;
● assessing presentation and disclosure in the consolidated financial statements.
I used the services of an actuarial consulting firm to assist me in my audit.
|
| 76 | PUBLIC ACCOUNTS 2022-2023 |
| Key audit matter | How the matter was addressed in the audit |
| Personal income tax | |
The government recognized an adjustment to its personal income tax revenues as at the date of the consolidated financial statements to account for revenue not collected and refunds not issued before the end of the year. These adjustments are recorded on the basis of estimates established according to transactions that took place after the end of the fiscal year.
Moreover, the government recognizes the income taxes receivable at realizable value, that is, an amount equivalent to what the government expects to receive. These accounts receivable are then brought down to net recoverable value by means of an allowance for doubtful accounts. The realizable value of revenue is estimated based on the settlement rates of similar files in the past, while the allowance for doubtful accounts rate is calculated on the basis of a statistical sample of accounts receivable representative of the population as a whole.
It is due to the magnitude of the amounts estimated and the significant degree of judgment exercised by the government in setting the assumptions that the establishment of these estimates is considered a key audit matter.
Information on personal income tax is provided in the following notes:
● Note 4 – Revenue;
● Note 8 – Accounts receivable;
● Note 13 – Accounts payable, accrued expenses and other allowances.
| My approach to addressing this matter included the following procedures:
● auditing the adjustments related to personal income tax not collected and refunds not issued at the end of the year, and the supporting audit evidence;
● gaining an understanding of the systems, processes and controls used to establish these estimates;
● assessing the reasonableness of the methods, assumptions, data and calculations used to establish estimates to ensure that they are appropriate;
● conducting testing to audit accounts subject to an allowance for non-realization of revenue and allowance rates;
● assessing presentation and disclosure in the consolidated financial statements.
I used external statistical consulting services to assist me in my audit.
|
| Financial instruments | |
| During the current period, the government prospectively adopted the new requirements of the public sector accounting standards concerning financial instruments (PS 3450) and financial statement presentation (PS 1201). The impact of adopting these requirements, described in Note 3 Accounting changes and reclassifications of the consolidated financial statements, was to recognize derivative financial instruments at fair value. In addition, they have had several repercussions on the consolidated financial statements and accompanying notes. | My approach to addressing this matter included the following procedures:
● assessing the proper application of the new requirements, in particular the assessment of data, assumptions and models used to determine the fair value of derivative financial instruments;
● assessing presentation and disclosure in the consolidated financial statements, including the application of the transitional provisions;
● conducting testing to verify the completeness of derivative financial instruments;
|
| CONSOLIDATED FINANCIAL STATEMENTS | 77 |
| Key audit matter | How the matter was addressed in the audit |
The consolidated financial statements now include a new statement—the consolidated statement of remeasurement gains and losses—and new information on risk management.
It is due to the significance of the changes to the government’s consolidated financial statements that the adoption of these requirements is considered a key audit matter.
Information on financial instruments is presented in the following notes in particular:
● Note 6 – Financial instruments;
● Note 17 – Assets and liabilities related to derivative financial instruments.
| ● validating, on a test basis, the adjusted opening accumulated remeasurement gains and losses and new items of the year in the consolidated statement of remeasurement gains and losses.
I used the services of a valuation expert to assist me in my audit.
|
Other Information
Management is responsible for the other information. The other information comprises the information included in Volume 1 of the 2022-2023 Public Accounts, but does not include the consolidated financial statements and my auditor’s report thereon.
My opinion on the consolidated financial statements does not cover the other information and I do not express any form of assurance conclusion thereon.
In connection with my audit of the consolidated financial statements, my responsibility is to read the other information and, in doing so, consider whether the other information is materially inconsistent with the consolidated financial statements or my knowledge obtained in the audit, or otherwise appears to be materially misstated.
I obtained Volume 1 of the 2022-2023 Public Accounts prior to the date of this auditor’s report. If, based on the work I have performed, I conclude that there is a material misstatement of this other information, I am required to report that fact in this auditor’s report. I have nothing to report in this regard.
Responsibilities of Management for the Consolidated Financial Statements
Management is responsible for the preparation and fair presentation of the consolidated financial statements in accordance with Canadian public sector accounting standards, and for such internal control as management determines is necessary to enable the preparation of consolidated financial statements that are free from material misstatement, whether due to fraud or error.
In preparing the consolidated financial statements, management is responsible for assessing the Government’s ability to continue as a going concern, disclosing, as applicable, matters related to going concern and using the going concern basis of accounting. Management believes the Government has the ability to continue its operations.
| 78 | PUBLIC ACCOUNTS 2022-2023 |
Auditor’s Responsibilities for the Audit of the Consolidated Financial Statements
My objectives are to obtain reasonable assurance about whether the consolidated financial statements as a whole are free from material misstatement, whether due to fraud or error, and to issue an auditor’s report that includes my opinion. Reasonable assurance is a high level of assurance, but is not a guarantee that an audit conducted in accordance with Canadian generally accepted auditing standards will always detect a material misstatement when it exists. Misstatements can arise from fraud or error and are considered material if, individually or in the aggregate, they could reasonably be expected to influence the economic decisions of users taken on the basis of these consolidated financial statements.
As part of an audit in accordance with Canadian generally accepted auditing standards, I exercise professional judgment and maintain professional skepticism throughout the audit. I also :
| ● | Identify and assess the risks of material misstatement of the consolidated financial statements, whether due to fraud or error, design and perform audit procedures responsive to those risks, and obtain audit evidence that is sufficient and appropriate to provide a basis for my opinion. The risk of not detecting a material misstatement resulting from fraud is higher than for one resulting from error, as fraud may involve collusion, forgery, intentional omissions, misrepresentations, or the override of internal control. |
| ● | Obtain an understanding of internal control relevant to the audit in order to design audit procedures that are appropriate in the circumstances, but not for the purpose of expressing an opinion on the effectiveness of the Government’s internal control. |
| ● | Evaluate the appropriateness of accounting policies used and the reasonableness of accounting estimates and related disclosures made by management. |
| ● | Conclude on the appropriateness of management’s use of the going concern basis of accounting and, based on the audit evidence obtained, whether a material uncertainty exists related to events or conditions that may cast significant doubt on the Government’s ability to continue as a going concern. If I conclude that a material uncertainty exists, I am required to draw attention in my auditor’s report to the related disclosures in the consolidated financial statements or, if such disclosures are inadequate, to modify my opinion. My conclusions are based on the audit evidence obtained up to the date of my auditor’s report. However, future events or conditions may cause the Government to cease to continue as a going concern. |
| ● | Evaluate the overall presentation, structure and content of the consolidated financial statements, including the disclosures, and whether the consolidated financial statements represent the underlying transactions and events in a manner that achieves fair presentation. |
| ● | Obtain sufficient appropriate audit evidence regarding the financial information of the entities or activities within the Government to express an opinion on the consolidated financial statements. I am responsible for the direction, supervision and performance of the group audit. I remain solely responsible for my audit opinion. |
I communicate with management regarding, among other matters, the planned scope and timing of the audit and significant audit findings, including any significant deficiencies in internal control that I identify during my audit.
| CONSOLIDATED FINANCIAL STATEMENTS | 79 |
I also provide management with a statement that I have complied with relevant ethical requirements regarding independence, and to communicate with them all relationships and other matters that may reasonably be thought to bear on my independence, and where applicable, related safeguards.
From the matters communicated with management, I determine those matters that were of most significance in the audit of the consolidated financial statements of the current period and are therefore the key audit matters. I describe these matters in my auditor’s report unless law or regulation precludes public disclosure about the matter or when, in extremely rare circumstances, I determine that a matter should not be communicated in my report because the adverse consequences of doing so would reasonably be expected to outweigh the public interest benefits of such communication.
Report on Other Legal and Regulatory Requirements
As required by the Auditor General Act (CQLR, chapter V-5.01), I report that, in my opinion, the consolidated financial statements present fairly, in all material respects, the consolidated financial position of the Governement as at March 31, 2023, and the consolidated results of its operations and the changes in its consolidated financial position for the year then ended in accordance with the accounting policies of the Governement as stated in the notes to the consolidated financial statements.
As required by the Auditor General Act (CQLR, chapter V-5.01), I report that, in my opinion, these standards have been applied, except for the changes in accounting policies for financial instruments and after giving retroactive effect to the change in accounting policies for asset retirement obligations as explained in Note 3, on a basis consistent with that of the preceding year.
Guylaine Leclerc, FCPA auditor
Auditor General of Québec
Québec, December 11, 2023
| 80 | PUBLIC ACCOUNTS 2022-2023 |
Consolidated statement of operations and accumulated operating deficit
FISCAL YEAR ENDED MARCH 31, 2023
(millions of dollars)
| 2023 | 2022 | |||||||||||||||
| Notes | Budget | Actual results | Actual results | |||||||||||||
| (Note 3) | (restated – Note 3) | |||||||||||||||
| REVENUE | 4 | |||||||||||||||
| Income and property taxes | 60 506 | 64 521 | 62 328 | |||||||||||||
| Consumption taxes | 26 706 | 26 597 | 24 597 | |||||||||||||
| Duties and permits | 5 171 | 5 741 | 6 057 | |||||||||||||
| Miscellaneous revenue | 11 680 | 12 083 | 10 705 | |||||||||||||
| Revenue from government enterprises | 10 | 5 628 | 6 620 | 5 960 | ||||||||||||
| Own-source revenue | 109 691 | 115 562 | 109 647 | |||||||||||||
| Federal government transfers | 28 790 | 28 737 | 29 184 | |||||||||||||
| Total revenue | 138 481 | 144 299 | 138 831 | |||||||||||||
| EXPENDITURE | 5 | |||||||||||||||
| Santé et services sociaux | 54 459 | 59 406 | 56 668 | |||||||||||||
| Éducation | 18 689 | 19 499 | 17 405 | |||||||||||||
| Enseignement supérieur | 10 010 | 9 655 | 8 747 | |||||||||||||
| Famille | 7 893 | 7 835 | 7 277 | |||||||||||||
| Transports et Mobilité durable | 7 115 | 6 451 | 7 017 | |||||||||||||
| Emploi et Solidarité sociale | 5 390 | 8 983 | 8 385 | |||||||||||||
| Affaires municipales et Habitation | 3 929 | 4 928 | 3 541 | |||||||||||||
| Économie, Innovation et Énergie | 3 656 | 3 205 | 3 064 | |||||||||||||
| Environnement, Lutte contre les changements climatiques, Faune et Parcs | 1 859 | 1 673 | 1 730 | |||||||||||||
| Other portfolios | 17 144 | 15 608 | 13 739 | |||||||||||||
| Portfolio expenditure | 130 144 | 137 243 | 127 573 | |||||||||||||
| Debt service | 8 842 | 10 058 | 8 640 | |||||||||||||
| Total expenditure | 138 986 | 147 301 | 136 213 | |||||||||||||
| Provision for economic risks and other support and recovery measures |
2 500 | |||||||||||||||
| ANNUAL OPERATING (DEFICIT) SURPLUS | (3 005 | ) | (3 002 | ) | 2 618 | |||||||||||
| ACCUMULATED OPERATING DEFICIT | ||||||||||||||||
| RESTATED OPENING BALANCE | 3 | (108 969 | ) | (112 278 | ) | |||||||||||
| Reclassification to accumulated remeasurement gains (losses) | 3 |
(5 557 | ) | |||||||||||||
| ADJUSTED OPENING BALANCE | (114 526 | ) | (112 278 | ) | ||||||||||||
| Other comprehensive income items of government enterprises | 10 | 691 | ||||||||||||||
| CLOSING BALANCE | (117 528 | ) | (108 969 | ) | ||||||||||||
The notes to the financial statements and the appendices are an integral part of the consolidated financial statements.
| CONSOLIDATED FINANCIAL STATEMENTS | 81 |
Consolidated statement of financial position
AS AT MARCH 31, 2023
(millions of dollars)
| Notes | 2023 | 2022 | ||||||||||
| (restated – Note 3) | ||||||||||||
| FINANCIAL ASSETS | ||||||||||||
Cash and cash equivalents | 7 | 9 981 | 9 967 | |||||||||
| Accounts receivable | 8 | 25 114 | 23 232 | |||||||||
| Investments | 9 | 7 804 | 6 318 | |||||||||
| Investment in government enterprises | 10 | 36 815 | 34 877 | |||||||||
| Loans | 11 | 5 875 | 5 356 | |||||||||
| Generations Fund | 12 | 18 911 | 15 829 | |||||||||
| Sinking funds relating to borrowings | 18 | 18 249 | 18 355 | |||||||||
| Assets related to derivative financial instruments | 17 | 11 209 | 5 292 | |||||||||
| Assets regarding other employee future benefits | 16 | 452 | 431 | |||||||||
| Other financial assets | 199 | 908 | ||||||||||
| Total financial assets | 134 609 | 120 565 | ||||||||||
| LIABILITIES | ||||||||||||
| Accounts payable, accrued expenses and other allowances | 13 | 51 621 | 50 146 | |||||||||
| Deferred revenue | 14 | 9 151 | 9 116 | |||||||||
| Environmental liability and asset retirement obligations | 15 | 7 517 | 7 404 | |||||||||
| Liabilities regarding pension plans and other employee future benefits | 16 | 7 237 | 9 888 | |||||||||
| Liabilities related to derivative financial instruments | 17 | 10 684 | 1 274 | |||||||||
| Debts | 18 | 257 111 | 239 537 | |||||||||
| Total liabilities | 343 321 | 317 365 | ||||||||||
| NET DEBT | (208 712 | ) | (196 800 | ) | ||||||||
| NON-FINANCIAL ASSETS | ||||||||||||
Fixed assets | 19 | 91 799 | 85 299 | |||||||||
| Other non-financial assets | 20 | 2 034 | 2 532 | |||||||||
| Total non-financial assets | 93 833 | 87 831 | ||||||||||
| ACCUMULATED DEFICIT | (114 879 | ) | (108 969 | ) | ||||||||
| Accumulated operating deficit | (117 528 | ) | (108 969 | ) | ||||||||
| Accumulated remeasurement gains | 2 649 | |||||||||||
| (114 879 | ) | (108 969 | ) | |||||||||
| Contractual obligations and contractual rights | 21 | |||||||||||
| Contingencies | 22 | |||||||||||
The notes to the financial statements and the appendices are an integral part of the consolidated financial statements.
| Julie Gingras | Lucie Pageau, CPA |
| Deputy Minister of Finance | Comptroller of Finance |
| 82 | PUBLIC ACCOUNTS 2022-2023 |
Consolidated statement of change in net debt
FISCAL YEAR ENDED MARCH 31, 2023
(millions of dollars)
| 2023 | 2022 | |||||||||||||||
| Notes | Budget(1) | Actual results | Actual results | |||||||||||||
| (restated – Note 3) | ||||||||||||||||
| Annual operating (deficit) surplus | (3 005 | ) | (3 002 | ) | 2 618 | |||||||||||
| Change due to fixed assets | 19 | |||||||||||||||
| Acquisition and work in progress | (9 511 | ) | (11 869 | ) | (9 894 | ) | ||||||||||
| Depreciation | 4 832 | 4 880 | 4 617 | |||||||||||||
| Disposals, reductions in value and other | 489 | 233 | ||||||||||||||
| (4 679 | ) | (6 500 | ) | (5 044 | ) | |||||||||||
| Change due to other non-financial assets | 498 | (419 | ) | |||||||||||||
| Other comprehensive income items of government enterprises | 10 | 947 | 691 | |||||||||||||
| Net remeasurement losses | (3 150 | ) | ||||||||||||||
| Increase in the net debt | (7 684 | ) | (11 207 | ) | (2 154 | ) | ||||||||||
| NET DEBT | ||||||||||||||||
| PREVIOUSLY ESTABLISHED OPENING BALANCE | (198 988 | ) | (192 208 | ) | (190 245 | ) | ||||||||||
| Accounting changes | 3 | (5 297 | ) | (4 401 | ) | |||||||||||
| ADJUSTED OPENING BALANCE | (198 988 | ) | (197 505 | ) | (194 646 | ) | ||||||||||
| CLOSING BALANCE | (206 672 | ) | (208 712 | ) | (196 800 | ) | ||||||||||
The notes to the financial statements and the appendices are an integral part of the consolidated financial statements.
| (1) | According to data presented in Budget 2022-2023 of the Ministère des Finances tabled on March 22, 2022. |
| CONSOLIDATED FINANCIAL STATEMENTS | 83 |
Consolidated statement of remeasurement gains and losses
FISCAL YEAR ENDED MARCH 31, 2023
(millions of dollars)
| Notes | 2023 | |||||||
| ACCUMULATED REMEASUREMENT GAINS (LOSSES), BEGINNING OF YEAR | — | |||||||
| Accounting changes | 3 | |||||||
| Accumulated other comprehensive income items of government enterprises | 5 557 | |||||||
| Adjustments for accumulated unrealized remeasurement losses | (705 | ) | ||||||
| ADJUSTED ACCUMULATED REMEASUREMENT GAINS, BEGINNING OF YEAR | 4 852 | |||||||
| Unrealized gains (losses): | ||||||||
| Foreign exchange | (3 723 | ) | ||||||
| Deriative financial instruments(1) | 650 | |||||||
| Investments at fair value | (76 | ) | ||||||
| Amounts reclassified to consolidated statement of operations: | ||||||||
| Foreign exchange | 485 | |||||||
| Deriative financial instruments(2) | (508 | ) | ||||||
| Investments at fair value | 22 | |||||||
| Net remeasurement losses | (3 150 | ) | ||||||
| Other comprehensive income items of government enterprises | 10 | 947 | ||||||
| ACCUMULATED REMEASUREMENT GAINS, END OF YEAR | 2 649 | |||||||
The notes to the financial statements and the appendices are an integral part of the consolidated financial statements.
| (1) | Net unrealized gains of $650 M consist of $3 761 M in foreign exchange gains and $3 111 M in fair value losses. |
| (2) | The amounts reclassified in income of $508 M consist of $512 M in foreign exchange gains and $4 M in fair value losses. |
| 84 | PUBLIC ACCOUNTS 2022-2023 |
Consolidated statement of cash flow
FISCAL YEAR ENDED MARCH 31, 2023
(millions of dollars)
| Notes | 2023 | 2022 | ||||||||||
| (restated – Note 3) | ||||||||||||
| OPERATING ACTIVITIES | ||||||||||||
| Annual operating (deficit) surplus | (3 002 | ) | 2 618 | |||||||||
| Items not affecting cash flow | 23 | 5 968 | 3 866 | |||||||||
| Change in assets and liabilities related to operations | 23 | (35 | ) | 3 997 | ||||||||
| Benefits paid for pension plans and other employee future benefits | (7 629 | ) | (7 386 | ) | ||||||||
| Cash flow (used for) from operating activities | (4 698 | ) | 3 095 | |||||||||
| INVESTMENT ACTIVITIES | ||||||||||||
| Investments made | (6 833 | ) | (5 266 | ) | ||||||||
| Investments received | 3 782 | 3 415 | ||||||||||
| Loans made | (1 478 | ) | (1 294 | ) | ||||||||
| Loans received | 661 | 834 | ||||||||||
| Government enterprises | ||||||||||||
| Equity related operations | (163 | ) | (35 | ) | ||||||||
| Loans and advances made | (1 847 | ) | (831 | ) | ||||||||
| Loans and advances received | 1 105 | 321 | ||||||||||
| Dividends received | 6 364 | 5 193 | ||||||||||
| Investments in the Generations Fund | (2 802 | ) | (3 125 | ) | ||||||||
| Cash flow used for investment activities | (1 211 | ) | (788 | ) | ||||||||
| FIXED ASSET INVESTMENT ACTIVITIES | ||||||||||||
| Fixed assets acquired and work in progress | (11 502 | ) | (9 652 | ) | ||||||||
| Fixed assets disposed of | 57 | 68 | ||||||||||
| Cash flow used for fixed assets investment activities | (11 445 | ) | (9 584 | ) | ||||||||
| CONSOLIDATED FINANCIAL STATEMENTS | 85 |
Consolidated statement of cash flow (cont’d)
FISCAL YEAR ENDED MARCH 31, 2023
(millions of dollars)
| Notes | 2023 | 2022 | ||||||||||
| (restated – Note 3) | ||||||||||||
| FINANCING ACTIVITIES | ||||||||||||
| Debt issued | 28 861 | 25 018 | ||||||||||
| Debt repaid | (11 125 | ) | (17 747 | ) | ||||||||
| Investments in sinking funds relating to borrowings | (4 237 | ) | (4 388 | ) | ||||||||
| Withdrawals from sinking funds relating to borrowings for repayment of debts | 3 591 | 2 500 | ||||||||||
| Pension plans and other employee future benefits | ||||||||||||
| Reimbursements to depositors | 155 | 170 | ||||||||||
| Deposits to funds | (9 | ) | (244 | ) | ||||||||
| Contributions deposited net of benefits paid | 132 | 140 | ||||||||||
| Cash flow from financing activities | 17 368 | 5 449 | ||||||||||
| Increase (decrease) in cash and cash equivalents | 14 | (1 828 | ) | |||||||||
| CASH AND CASH EQUIVALENTS, BEGINNING OF YEAR | 9 967 | 11 795 | ||||||||||
| CASH AND CASH EQUIVALENTS, END OF YEAR | 9 981 | 9 967 | ||||||||||
The notes to the financial statements and the appendices are an integral part of the consolidated financial statements.
| 86 | PUBLIC ACCOUNTS 2022-2023 |
Notes to the consolidated financial statements
▌ 1. Summary of significant accounting policies
Accounting framework
The Gouvernement du Québec accounts for its financial transactions in accordance with the accounting policies adopted by the Conseil du trésor. The primary source of reference for establishing these policies are the Canadian public sector accounting standards.
Reporting entity
The government’s reporting entity encompasses the financial transactions of the National Assembly and persons appointed by the National Assembly, departments and all the bodies, funds and enterprises under the government’s control, that is, entities for which the government has the power to direct their financial and administrative policies, such that their activities will provide the government with anticipated benefits or expose it to a risk of loss.
All of the entities in the government’s reporting entity over which the government exercises control are listed in Appendix 1. Property held and fiduciary activities carried out by government departments and bodies on behalf of the designated beneficiaries mentioned in Appendix 3 are not included in the government’s reporting entity.
Consolidation methods
The assets, liabilities, revenues and expenditures of entities included in the government’s reporting entity, with the exception of government enterprises, are consolidated line by line in the financial statements. Prior to consolidation, the accounts of each entity are harmonized according to the government’s accounting policies. Inter-entity transactions and balances as well as unrealized gains and losses relating to transactions on assets and liabilities that remain within the government’s reporting entity are eliminated.
Investments in government enterprises
Investments in government enterprises represent a financial asset for the government and, given their commercial orientation, management autonomy and financial self-sufficiency, they are accounted for using the modified equity method.
According to this method, which does not require that accounting policies be harmonized with those of the government, investments and interests are accounted for at cost. Every year, the cost is adjusted based on the government’s share in the results of these enterprises, the counterpart being recognized in income. Cost is also adjusted based on the government’s share of other comprehensive income items, with an offsetting entry in accumulated remeasurement gains and losses. The value of the investments is reduced by declared dividends and adjusted by the amount of the elimination of unrealized inter-entity gains and losses pertaining to assets and liabilities that remain within the government’s reporting entity.
| CONSOLIDATED FINANCIAL STATEMENTS | 87 |
1. Summary of significant accounting policies (cont’d)
Translation of foreign currency
On the date a foreign currency transaction is entered into, all assets, liabilities and amounts reported in the statement of operations are translated into Canadian dollars at the exchange rate prevailing on that date. At the end of the fiscal year, monetary assets and liabilities denominated in foreign currencies are translated into Canadian dollars at the exchange rate in effect at that date. For certain designated financial instruments, foreign exchange gains and losses are recognized directly to results, and not through the statement of remeasurement gains and losses.
Remeasurement gains and losses
Unrealized gains and losses attributable to financial instruments recognized at fair value and due to changes in foreign exchange rates are recognized in consolidated statement of remeasurement gains and losses until the settlement date of the financial instrument. At that date, the accumulated balance of remeasurement gains and losses relating to these instruments is reclassified to results.
Government enterprises recognize some unrealized gains or losses on financial instruments and the actuarial gains or losses on future benefits among the other items of comprehensive income, in accordance with International Financial Reporting Standards (IFRS). Those other items are not included in the government’s results and are recognized in the accumulated remeasurement gains (losses). When these gains or losses on financial instruments are realized, they will be reclassified in revenue from government enterprises and recognized as such in the government’s result. Actuarial gains and losses on future benefits will never be reclassified among the government’s results.
Measurement uncertainty
Measurement uncertainty exists when there is a difference between the amount recognized or disclosed in the consolidated financial statements and another reasonably possible amount. Some uncertainties are called “material” when the range of reasonably possible amounts is wide and when the situation could influence decisions made by the users of the consolidated financial statements. The impact of the resolution of the uncertainties may be felt in the short term or in a longer term.
The government has determined that material measurement uncertainty in the short term was attributable to the assumptions used to determine the allowances for contingencies (Note 22) pertaining to lawsuits and disputes. Investment in government enterprises (Note 10), environmental liability and asset retirement obligations (Note 15), and pension plans obligations (Note 16) present a long-term material measurement uncertainty due to the assumptions used to determine their value.
| 88 | PUBLIC ACCOUNTS 2022-2023 |
1. Summary of significant accounting policies (cont’d)
Other measurement uncertainties are attributable to the estimates made in the course of the governmnent’s regular operations. New events, experience acquired or the information available to the government may lead to short-term revision of the allowances for doubtful accounts in accounts receivable (Note 8), tax revenue and the corresponding receivable and payable amounts (Notes 8 and 13), long-term declines in investments (Note 9), the fair value of derivative financial instruments (Note 17), allowances for loan declines (Note 11), grants to be paid at the rate of repayment of the loans contracted by the recipients (Note 13), transfer revenue from the federal government receivable or deferred (Notes 8 and 14), and provisions for losses on guaranteed financial initiatives (Note 13).
Moreover, the useful life of fixed assets is estimated based on the period during which they should be of use to the government. The length of some contracts presented in the contractual obligations and contractual rights is also estimated.
The estimates and assumptions the government uses to recognize or disclose some items in the consolidated financial statements are based on the most reliable data and the most likely assumptions available, and require the application of professional judgment.
It is reasonably possible that the amounts will change after the annual revision of the estimates and assumptions. Accounting estimates are revised during the estimate revision period if they concern only that period, or during that revision period and the next ones if they concern several periods. Further information about the nature and circumstances giving rise to measurement uncertainty is disclosed in the appropriate Notes.
| CONSOLIDATED FINANCIAL STATEMENTS | 89 |
1. Summary of significant accounting policies (cont’d)
Significant accounting policies by component
To increase the consolidated financial statements’ understandability, significant accounting policies by component are detailed in the following notes:
| Notes | Components | |
| Note 4 | Revenue | |
| Note 5 | Expenditure | |
| Note 6 | Financial instruments | |
| Note 7 | Cash and cash equivalents | |
| Note 8 | Accounts receivable | |
| Note 9 | Investments | |
| Note 10 | Investments in government enterprises | |
| Note 11 | Loans | |
| Note 12 | Generations Fund | |
| Note 13 | Accounts payable, accrued expenses and other allowances | |
| Note 14 | Deferred revenue | |
| Note 15 | Environmental liability and asset retirement obligations | |
| Note 16 | Assets and liabilities regarding pension plans and other employee future benefits | |
| Note 17 | Assets and liabilities related to derivative financial instruments | |
| Note 18 | Debts | |
| Note 19 | Fixed assets | |
| Note 20 | Other non-financial assets | |
| Note 21 | Contractual obligations and contractual rights | |
| Note 22 | Contingencies |
| 90 | PUBLIC ACCOUNTS 2022-2023 |
1. Summary of significant accounting policies (cont’d)
Upcoming accounting standards
The Public Sector Accounting Board has issued new accounting standards effective April 1, 2023.
Accounting standards effective April 1, 2023
PS 3400, Revenue
This standard provides guidance for the recognition, measurement and disclosure of revenue that are not dealt with in another standard. It distinguishes revenue arising from transactions that include performance obligations, which are those for which there is an enforceable promise to provide specific goods or services to a specific payor, and revenue arising from transactions that do not have performance obligations, which are referred to as non-exchange transactions.
Based on this standard, some revenues from duties and permits will no longer be available for deferral to a future year. This change will have no material impact on the consolidated financial statements. The government plans to apply the standard retroactively.
PS 3160, Public Private Partnerships
This standard provides guidance on the recognition, measurement and disclosure of infrastructure procured by the government as a public private partnership (PPP). In particular, it identifies what constitutes a PPP infrastructure asset and specifies that an asset and a liability should be recognized when the public sector entity acquires control.
This standard will result in a change in the rate used, notably to calculate interest on financial liabilities, which will correspond to the implicit rate for each contract rather than the average government borrowing rate. This change will have no material impact on the consolidated financial statements. The government plans to apply the standard retroactively.
Guideline PSG-8, Purchased intangibles
This guideline addresses purchased intangibles, other than software, that will now be recognized if they meet the definition of an asset.
The adoption of this standard will have no material impact on the consolidated financial statements. The government plans to apply this standard prospectively.
| CONSOLIDATED FINANCIAL STATEMENTS | 91 |
▌ 2. Compliance with legislative authorizations
The government must be authorized by Parliament to draw money from the Consolidated Revenue Fund. Parliament grants this authorization by annually passing laws on appropriations or by adopting specific laws authorizing appropriations, which authorize departments and budget-funded bodies to make expenditures, capital acquisitions, loans, and investments, and bear other costs out of the general fund. For special funds, the annual expenditure and investment forecasts are approved by Parliament in the context of the adoption of appropriation acts or special acts, in particular when a special fund is established.
In accordance with section 86 of the Financial Administration Act (CQLR, chapter A-6.001), Volume 2 of the public accounts reports on the annual use of legislative authorizations for investments and expenditures for each of the departmental portfolios and special funds.
For the fiscal year ended March 31, 2023, no surpluses of expenditures and other costs over annual appropriations were recognized. Surpluses of expenditures and investments of special funds over approved amounts of $446 million and $961 million respectively were recognized.
▌ 3. Accounting changes and reclassifications
Adoption of new accounting standards
Asset retirement obligations
On April 1, 2022, the government applied accounting standard PS 3280, Asset Retirement Obligations (AROs), on a modified retroactive basis1.
Under this standard, a liability must now be recognized as soon as the government acquires or constructs an asset for which it has a legal obligation to incur costs to permanently retire it. Previously, these costs were recognized in the fiscal year in which they were retired.
The legal obligations recognized as a result of the application of this standard mainly concern the removal of asbestos from government buildings. Upon initial recognition of the liability, an equivalent asset is recognized. This asset is then amortized over the useful life of the asset affected by the retirement obligation.
| 1 | A modified retroactive application means that the provisions of the standard were applied to events and transactions from the date on which the obligations arose, namely 1999 for buildings containing asbestos. It also means that the amounts recognized reflect the assumptions in effect on April 1, 2022. |
| 92 | PUBLIC ACCOUNTS 2022-2023 |
3. Accounting changes and reclassifications (cont’d)
Financial statement presentation
On April 1, 2022, the government adopted, on a prospective basis, accounting standard PS 1201, Financial Statement Presentation. A new statement of remeasurement gains and losses is presented for the fiscal year ended March 31, 2023. This financial statement shows remeasurement gains and losses arising from foreign currency transactions, derivative financial instruments, investments measured at fair value, and other revenue from government enterprises.
The accumulated deficit presented in the consolidated statement of financial position now comprises two components: the accumulated operating deficit and accumulated remeasurement gains. The cumulative other comprehensive income items of government enterprises, previously presented directly in the government’s accumulated deficit, is now presented in the component of accumulated remeasurement gains and losses.
Foreign currency translation, portfolio investments, and financial instruments
On April 1, 2022, the government applied accounting standards PS 2601, Foreign Currency Translation, PS 3041, Portfolio Investments, and PS 3450, Financial Instruments, on a prospective basis. These new standards set out requirements for the recognition, measurement, and presentation of foreign currency transactions, portfolio investments, and other financial instruments.
Recognition and measurement
The implementation of these standards has resulted in the following changes:
| ● | derivative financial instruments and investments in equity instruments quoted in an active market are now measured at fair value. Previously, they were recognized at cost. Other financial assets and liabilities are measured at cost or at amortized cost; |
| ● | unrealized gains or losses arising from fair value or currency fluctuations are presented in the new statement of remeasurement gains and losses until the financial instrument in question is derecognized. Previously, foreign exchange gains and losses on financial instruments denominated in foreign currencies were presented as deferred foreign exchange gains (losses) as a component of debt, and were amortized on a straight-line basis; |
| ● | transaction costs related to debts are now included in their book value, as well as in the determination of the effective interest rate used to recognize debts at amortized cost. Previously, these components were recognized as deferred expenses related to debts and amortized on a straight-line basis over the term of the corresponding debts. |
| CONSOLIDATED FINANCIAL STATEMENTS | 93 |
3. Accounting changes and reclassifications (cont’d)
Presentation
The implementation of these standards has resulted in the following changes:
| ● | investments previously classified as short-term investments are now presented under Investments; |
| ● | sinking funds relating to borrowings, previously presented as a deduction from debt, are now presented separately in financial assets; |
| ● | sums receivable from (payable to) counterparties as well as derivative financial instruments, previously presented with debts, are now presented separately as assets or liabilities related to derivative financial instruments; |
| ● | when the government makes an investment by acquiring its own securities (treasury securities), the investment and the corresponding debt are now offset in the consolidated statement of financial position. These offsets have reduced the balances of cash equivalents, investments, sinking funds relating to borrowings, and debts; |
| ● | additional financial information on exposure to risks associated with financial instruments, and on the management of these risks, is provided in the notes, notably in Note 6 concerning financial instruments. |
| 94 | PUBLIC ACCOUNTS 2022-2023 |
3. Accounting changes and reclassifications (cont’d)
Impacts of the adoption of new accounting standards
For the four new standards relating to financial instruments whose application is prospective, the financial information as at March 31, 2022 have not been restated. However, to enhance comparability between fiscal years, the changes listed on the previous page that have an impact on the presentation have been applied to the financial information as at March 31, 2022, that is, they have been reclassified according to the new presentation.
These accounting changes and the reclassifications have resulted in changes in the following components of the consolidated financial statements:
| Fiscal year ended | ||||
| March 31, 2022 | ||||
| ARO | ||||
| CONSOLIDATED STATEMENT OF OPERATIONS AND ACCUMULATED OPERATING DEFICIT | ||||
| (millions of dollars) | ||||
| Increase (decrease) in expenditure | ||||
| Santé et Services sociaux | 108 | |||
| Éducation | 103 | |||
| Enseignement supérieur | 9 | |||
| Affaires municipales et Habitation | 5 | |||
| Other portfolios | 2 | |||
| Increase in portfolio expenditures | 227 | |||
| Decrease in annual operating surplus | 227 | |||
| Increase in opening accumulated operating deficit | 3 550 | |||
| Increase in closing accumulated operating deficit | 3 777 | |||
| CONSOLIDATED FINANCIAL STATEMENTS | 95 |
3. Accounting changes and reclassifications (cont’d)
| As at April 1, 2022 | As at March 31, 2022 | |||||||||||
| Financial instruments | ARO | Reclassification Financial instruments | ||||||||||
| CONSOLIDATED STATEMENT OF FINANCIAL POSITION | ||||||||||||
| (millions of dollars) | ||||||||||||
| Increase (decrease) in assets and liabilities | ||||||||||||
| Cash equivalents | (390 | ) | ||||||||||
| Short-term investments | (6 391 | ) | ||||||||||
| Accounts receivable | (45 | ) | ||||||||||
| Investments | 292 | (230 | ) | |||||||||
| Loans | (10 | ) | ||||||||||
| Sinking funds relating to borrowings | (151 | ) | 18 355 | |||||||||
| Assets related to derivative financial instruments | 2 241 | 5 292 | ||||||||||
| Other financial assets | (547 | ) | ||||||||||
| Increase in financial assets | 2 372 | — | 16 044 | |||||||||
| Accounts payable, accrued expenses and other allowances | 6 | (145 | ) | |||||||||
| Environmental liability and asset retirement obligations | 4 592 | |||||||||||
| Liabilities related to derivative financial instruments | 5 805 | 1 274 | ||||||||||
| Debts | (2 734) | 14 915 | ||||||||||
| Increase in liabilities | 3 077 | 4 592 | 16 044 | |||||||||
| Increase in the net debt | 705 | 4 592 | — | |||||||||
| Fixed assets | 815 | |||||||||||
| Increase in non-financial assets | 815 | — | ||||||||||
| Increase in accumulated deficit | 3 777 | — | ||||||||||
| CONSOLIDATED STATEMENT OF CHANGE IN NET DEBT | ||||||||||||
| (millions of dollars) | ||||||||||||
| Decrease in annual operating surplus | 227 | |||||||||||
| Increase in depreciation of fixed assets | (36 | ) | ||||||||||
| Increase in the net debt, beggining of year | 705 | (1) | 4 401 | |||||||||
| Increase in the net debt, end of year | 4 592 | (1) | — | |||||||||
| (1) | The increase in net debt as at April 1, 2022 is $5 297 M, of which $4 592 M results from the application of the standard relating to AROs and $705 M results from the application of the standards relating to financial instruments. |
| 96 | PUBLIC ACCOUNTS 2022-2023 |
3. Accounting changes and reclassifications (cont’d)
Reclassification of budget forecasts
Budget forecasts for expenditures by portfolios have been reclassified to ensure comparability with actual expenditures as at March 31, 2023. Their composition has been adjusted in the fall of 2022 to reflect changes in ministers’ responsibilities. In addition, the forecast related to the change in application of the accounting standard respecting transfer payments, as well as certain components that had been presented differently when the budget was prepared, have been reclassified in the various portfolios.
Reconciliation of forecasts between the 2022-2023 budget and the consolidated financial statements
(millions of dollars)
| Budget after | ||||||||||||
| Budget (1) | Reclassifications | reclassifications | ||||||||||
| EXPENDITURE | ||||||||||||
| Santé et Services sociaux | 54 132 | 327 | 54 459 | |||||||||
| Éducation | 18 444 | 245 | 18 689 | |||||||||
| Enseignement supérieur | 9 971 | 39 | 10 010 | |||||||||
| Famille | 7 869 | 24 | 7 893 | |||||||||
| Transports et Mobilité durable | 6 311 | 804 | 7 115 | |||||||||
| Emploi et Solidarité sociale | 5 171 | 219 | 5 390 | |||||||||
| Affaires municipales et Habitation | 3 833 | 96 | 3 929 | |||||||||
| Économie, Innovation et Énergie | 3 384 | 272 | 3 656 | |||||||||
| Environnement, Lutte contre les changements climatiques, Faune et Parcs | 1 611 | 248 | 1 859 | |||||||||
| Other portfolios | 19 418 | (2 274 | ) | 17 144 | ||||||||
| Total | 130 144 | ― | 130 144 | |||||||||
| (1) | According to data presented in Budget 2022-2023 of the Ministère des finances tabled on March 22, 2022. |
Reclassification of comparative financial data
In addition to the reclassifications presented above, other 2021-2022 financial data have been reclassified to comply with the 2022-2023 presentation method.
| CONSOLIDATED FINANCIAL STATEMENTS | 97 |
| ▌ | 4. Revenue |
| Significant accounting policies |
Tax revenue (income and property taxes and consumption taxes)
Once the tax measures have been authorized by Parliament, tax revenue is recognized in the following manner:
¾ Personal income tax revenue and contributions dedicated to health services are recognized when the taxpayer earned the income subject to tax. Revenue not collected at the end of the fiscal year and refunds not yet issued are recognized on the basis of estimates established according to transactions that took place after the end of the fiscal year.
¾ Corporate income tax revenue is recognized at the time the funds are received. Receipts are primarily comprised of instalment payments the companies calculate based on estimates of their taxable earnings. These revenues are adjusted to take amounts in notices of assessment issued before the end of the fiscal year into account. The receivable or refundable amounts resulting from the variation between the estimated taxable income and the income actually earned by the companies during the fiscal year are not recognized because they cannot be accurately estimated.
¾ Revenue from school property taxes is recognized over the period in which such taxes are levied.
¾ Revenue from consumption taxes is recognized at the time of the sale of the products or the delivery of the services, after deducting tax credits.
Tax revenue does not take into account estimates concerning taxes due on unreported revenue within the time prescribed. These amounts are recognized when notices of assessments are issued or following tax check activities or after the filing of tax returns by taxpayers.
Duties and permits
Revenue from duties and permits is recognized when receivable. Where revenue is refundable on demand and is linked to clearly identifiable goods and services that must be rendered by the government to the holder of the duty or the permit, the revenue is recognized over the reference period of that duty or permit.
Miscellaneous revenue
Revenue from the sale of goods or services and from user contributions is recognized when the goods are sold or the services are provided.
Income from interest on accounts receivable and loans as well as income from portfolio investments are recognized as they are earned. They cease to be recognized when the recovery of interest or principal is not reasonably assured.
|
| 98 | PUBLIC ACCOUNTS 2022-2023 |
4. Revenue (cont’d)
| Significant accounting policies (cont’d) |
Revenue from donors other than governments is recognized in the year of its donation when such revenue is not designated for a specific purpose. When, on the contrary, such revenue is designated for a specific purpose, it is recognized in revenue according to the conditions of the designation. In the case of donations related to land, the revenue is recognized in the year of acquisition.
Revenue from tuition fees is recognized over the duration of the training in question.
Transfers from governments
Transfers from the federal government and other governments are recognized in revenue for the fiscal year in which they are authorized by the transferring government and in which the eligibility criteria are met, except if the stipulations create an obligation that meets the definition of a liability. In such situations, the transfer is recognized in revenue as the liabilitiy is paid.
|
| Measurement uncertainty |
| The measurement uncertainties that affect revenue are presented in Note 8 on accounts receivable, Note 10 on investment in government enterprises, Note 13 on accounts payable, accrued expenses and other allowances related to income taxes and other taxes refundable and Note 14 on deferred revenue. |
| CONSOLIDATED FINANCIAL STATEMENTS | 99 |
4. Revenue (cont’d)
Revenue by source
(millions of dollars)
| Fiscal year ended March 31 | ||||||||
| 2023 | 2022 | |||||||
| Own-source revenue | ||||||||
| Income and property taxes | ||||||||
| Personal income tax | 42 251 | 40 924 | ||||||
| Contributions for health services | 7 914 | 7 402 | ||||||
| Corporate taxes | 13 243 | 12 926 | ||||||
| School property tax | 1 113 | 1 076 | ||||||
| 64 521 | 62 328 | |||||||
| Consumption taxes | ||||||||
| Sales(1) | 22 911 | 20 894 | ||||||
| Fuel | 2 157 | 2 090 | ||||||
| Tobacco | 817 | 893 | ||||||
| Alcoholic beverages | 635 | 638 | ||||||
| Cannabis | 77 | 82 | ||||||
| 26 597 | 24 597 | |||||||
| Duties and permits | ||||||||
| Motor vehicles | 1 562 | 1 525 | ||||||
| Natural resources | 2 014 | 2 371 | ||||||
| Greenhouse gas emissions | 1 267 | 1 299 | ||||||
| Other | 898 | 862 | ||||||
| 5 741 | 6 057 | |||||||
| Miscellaneous revenue | ||||||||
| Sales of goods and services | 5 741 | 5 311 | ||||||
| User contributions | 1 977 | 1 781 | ||||||
| Income on accounts receivable and loans | 1 052 | 541 | ||||||
| Income on investments | 525 | 636 | ||||||
| Fines, forfeitures and recoveries | 1 228 | 934 | ||||||
| Third-party donations | 1 003 | 966 | ||||||
| Tuition fees | 451 | 410 | ||||||
| Transfers from entities other than the federal government | 106 | 126 | ||||||
| 12 083 | 10 705 | |||||||
| Revenue from government enterprises | ||||||||
| Hydro-Québec | 3 665 | 3 059 | ||||||
| Société des alcools du Québec | 1 427 | 1 349 | ||||||
| Loto-Québec | 1 597 | 1 118 | ||||||
| Investissement Québec | (226 | ) | 341 | |||||
| Other | 157 | 93 | ||||||
| 6 620 | 5 960 | |||||||
| Total own-source revenue | 115 562 | 109 647 | ||||||
| Federal government transfers | ||||||||
| Equalization | 13 666 | 13 119 | ||||||
| Health transfers | 7 082 | 8 203 | ||||||
| Transfers for post-secondary education and other social programs | 1 294 | 1 529 | ||||||
| Other programs | 6 695 | 6 333 | ||||||
| Total federal government transfers | 28 737 | 29 184 | ||||||
| Total revenue | 144 299 | 138 831 | ||||||
| (1) | The solidarity tax credit, worth $1 650 M ($1 637 M in 2021-2022), is an abatement since it is designed to refund certain taxes to low-income households. It is presented as a reduction of consumption tax revenue on sales. |
| 100 | PUBLIC ACCOUNTS 2022-2023 |
4. Revenue (cont’d)
Income and property taxes – Additional information on refundable tax credits
In accordance with the applicable tax legislation, refundable tax credits reduce related tax revenue. However, Canadian public sector accounting standards require that these credits be presented in expenditure when they represent transfers funded by the tax system, that is, when they confer on a taxpayer a financial benefit other than a reduction of the income or other taxes that the taxpayer would otherwise have had to pay the government.
The refundable tax credits of $13 115 million ($11 335 million in 2021-2022) have been reclassified in transfer expenditures meaning that revenue derived from income and property taxes amount to $64 521 million ($62 328 million in 2021-2022).
Income and property taxes – Reclassification of refundable tax credits
(millions of dollars)
| Fiscal year ended March 31 | ||||||||||||||||
| 2023 | 2022 | |||||||||||||||
| Tax revenue | ||||||||||||||||
| net of | ||||||||||||||||
| refundable | Refundable | |||||||||||||||
| tax credits | tax credits | Total | Total | |||||||||||||
| Income and property taxes | ||||||||||||||||
| Personal income tax | 31 427 | 10 824 | 42 251 | 40 924 | ||||||||||||
| Contributions for health services | 7 914 | 7 914 | 7 402 | |||||||||||||
| Corporate taxes | 10 952 | 2 291 | 13 243 | 12 926 | ||||||||||||
| School property tax | 1 113 | 1 113 | 1 076 | |||||||||||||
| 51 406 | 13 115 | 64 521 | 62 328 | |||||||||||||
| CONSOLIDATED FINANCIAL STATEMENTS | 101 |
4. Revenue (cont’d)
Additional information – Tax-funded transfer expenditures by portfolios
(millions of dollars)
| Fiscal year ended March 31 | ||||||||||||||||||||||||||||||||
| 2023 | 2022 | |||||||||||||||||||||||||||||||
| Santé et Services sociaux | Famille | Emploi et Solidarité sociale | Économie, Innovation et Énergie | Culture et Communi- cations | Other | Total | Total | |||||||||||||||||||||||||
| Income and property taxes | ||||||||||||||||||||||||||||||||
| Personal income tax | ||||||||||||||||||||||||||||||||
| Refundable tax credits | ||||||||||||||||||||||||||||||||
| Increase in the cost of living | 3 440 | 3 440 | 3 675 | |||||||||||||||||||||||||||||
| Family Allowance | 3 403 | 3 403 | 3 281 | |||||||||||||||||||||||||||||
| Senior assistance | 1 661 | 1 661 | 217 | |||||||||||||||||||||||||||||
| Childcare expenses | 936 | 936 | 854 | |||||||||||||||||||||||||||||
| Home-support services for seniors | 650 | 650 | 589 | |||||||||||||||||||||||||||||
| Work premium | 259 | 259 | 182 | |||||||||||||||||||||||||||||
| Caregivers | 187 | 187 | 162 | |||||||||||||||||||||||||||||
| Québec education savings incentive | 140 | 140 | 136 | |||||||||||||||||||||||||||||
| Other | 75 | 28 | 45 | 148 | 134 | |||||||||||||||||||||||||||
| 2 573 | 4 339 | 3 727 | — | — | 185 | 10 824 | 9 230 | |||||||||||||||||||||||||
| Corporate taxes | ||||||||||||||||||||||||||||||||
| Refundable tax credits | ||||||||||||||||||||||||||||||||
| Film production | 463 | 463 | 500 | |||||||||||||||||||||||||||||
| E-business development | 433 | 433 | 432 | |||||||||||||||||||||||||||||
| Scientific research and experimental development | 386 | 386 | 358 | |||||||||||||||||||||||||||||
| Multimedia titles | 334 | 334 | 301 | |||||||||||||||||||||||||||||
| Investments | 294 | 294 | 193 | |||||||||||||||||||||||||||||
| Resources | 113 | 113 | 75 | |||||||||||||||||||||||||||||
| Other | 27 | 86 | 45 | 110 | 268 | 246 | ||||||||||||||||||||||||||
| — | — | 27 | 1 533 | 508 | 223 | 2 291 | 2 105 | |||||||||||||||||||||||||
| 2 573 | 4 339 | 3 754 | 1 533 | 508 | 408 | 13 115 | 11 335 | |||||||||||||||||||||||||
| 102 | PUBLIC ACCOUNTS 2022-2023 |
| ▌ | 5. Expenditure |
| Significant accounting policies |
Transfer expenditures
Transfer expenditures are recognized in the fiscal year during which they are duly authorized and in which the recipients satisfied the eligibility criteria.
Remuneration and operating expenses
Remuneration and operating expenses are recognized in the fiscal year during which the goods are consumed or the services are delivered.
Debt service expenditure
Debt service expenses are comprised mainly of interest on debt recognized using the effective interest method.
|
| Measurement uncertainty |
| Measurement uncertainties that affect expenditures are presented in Note 8 on accounts receivable, Note 9 on investments, Note 11 on loans, Note 13 on accounts payable, accrued expenses and other allowances, Note 15 on environmental liability and asset retirement obligations, Note 16 on pension plans and other future benefits and Note 22 on contingencies. |
| CONSOLIDATED FINANCIAL STATEMENTS | 103 |
5. Expenditure (cont’d)
Expenditure by supercategories
(millions of dollars)
| Fiscal year ended March 31 | ||||||||
| 2023 | 2022 | |||||||
| (restated – Note 3) | ||||||||
| Portfolio expenditure | ||||||||
| Transfers | 46 876 | 42 580 | ||||||
| Remuneration | 62 396 | 59 665 | ||||||
| Operating(1) | 27 247 | 25 027 | ||||||
| Doubtful accounts and other allowances | 724 | 301 | ||||||
| Sub-total | 137 243 | 127 573 | ||||||
| Debt service(2) | 10 058 | 8 640 | ||||||
| Total expenditure | 147 301 | 136 213 | ||||||
| (1) | Operating expenditure include equipment and procurement (for example, drugs and medical and surgical supplies), professional fees, private sector services to individuals in private long-term care centres, maintenance and repairs, transportation services, advertising and communication services, as well as depreciation of fixed assets (Note 19). |
| (2) | Debt service expenditure is comprised of the following elements: |
| Fiscal year ended March 31 | ||||||||
| 2023 | 2022 | |||||||
| Interest on debts | 8 902 | 7 548 | ||||||
| Net expenditure on assets and liabilities related to deriatives financial instruments | 559 | 356 | ||||||
| Losses on investment of the sinking funds relating to borrowings | 637 | 173 | ||||||
| Revenue on cash equivalents and on investments | (428 | ) | (7 | ) | ||||
| 9 670 | (1) | 8 070 | ||||||
| Interest on obligations relating to accrued benefits under the pension plans and employee future benefits | 7 650 | 7 331 | ||||||
| Investment income of the Retirement Plans Sinking Fund, the specific pension funds and the other employee future benefits funds | (7 262 | ) | (6 761 | ) | ||||
| 388 | 570 | |||||||
| 10 058 | 8 640 | |||||||
| (1) | Expenditures of $9 670 M are presented net of revenues totalling $2 065 M, namely $812 M on assets and liabilities related to derivative financial instruments, $782 M on investments of sinking funds relating to borrowings, and $471 M on cash equivalents and on investments. |
| 104 | PUBLIC ACCOUNTS 2022-2023 |
| ▌ | 6. Financial instruments |
| Significant accounting policies |
Classification and recognition of financial instruments
On initial recognition, financial instruments are classified as either financial instruments recognized at cost or at amortized cost, or as financial instruments recognized at fair value.
Financial instruments recognized at cost or at amortized cost
After initial recognition, the government measures financial assets and liabilities at amortized cost, taking into account the following adjustments:
● repayments or receipts;
● accumulated depreciation calculated using the effective interest method. For the purposes of calculating the effective interest rate, transaction costs, discounts and premiums are included in the cash flows considered;
● reduction for impairment or uncollectibility, directly or through the use of an allowance account.
Cash and cash equivalents, accounts receivable (excluding taxes receivable and certain receivables from duties and permits and miscellaneous revenues), investments other than those made up of equity instruments quoted in an active market, loans, the Generations Fund, sinking funds relating to borrowings and sums receivable from counterparties included in assets related to derivative financial instruments are classified as financial assets recognized at cost or at amortized cost.
Accounts payable, accrued expenses and other allowances (excluding income taxes and other taxes refundable, accrued compensation benefits, advances from trust funds and clearing accounts for collected taxes), sums payable to counterparties included in derivative financial instrument liabilities, and debts (excluding public-private partnership agreements and capital leases) are classified as liabilities at cost or at amortized cost.
Financial instruments recognized at fair value
Investments in equity instruments quoted in an active market, and assets and liabilities associated with derivative financial instruments, other than sums receivable from (payable to) counterparties, are classified as financial instruments recognized at fair value.
Transaction costs
Transaction costs relating to financial instruments recognized at fair value are recognized in expenses at the transaction date, while those relating to financial instruments recognized at cost or at amortized cost are added to their book value.
Offsetting of financial instruments
Treasury securities
In the course of its operations, the government may repurchase its own debt securities on the financial markets without cancelling, extinguishing or discharging the corresponding debts. These securities constitute assets for the government, and the corresponding debts are offset in the consolidated statement of financial position. Interest income and expense relating to these shares and debts are also presented net in the consolidated statement of operations and accumulated operating deficit.
|
| CONSOLIDATED FINANCIAL STATEMENTS | 105 |
6. Financial instruments (cont’d)
| Significant accounting policies (cont’d) |
Offsetting of financial instruments (cont’d)
Other offset financial assets and financial liabilities
A financial asset and a financial liability are offset and the net balance presented in the consolidated statement of financial position only if the following conditions are met:
● there is a legally enforceable right of offset of the recognized amounts;
● the government intends to settle on a net basis, or to realize the asset and settle the liability simultaneously.
|
| 106 | PUBLIC ACCOUNTS 2022-2023 |
6. Financial instruments (cont’d)
Risk related to financial instruments
In the normal course of operations, the government is exposed to various types of risk, such as credit risk, liquidity risk and market risk. Control and management policies and procedures are in place to manage the risks inherent in financial instruments and reduce their potential impact.
For each of the components identified as financial instruments, the following table shows exposure to the various risks.
| Financial instruments | Risk exposure | Note | ||||
| Credit risk | Liquidity risk | Market risk | ||||
| Currency | Interest rate | Price | ||||
| Cash and cash equivalents |  | | 7 | |||
| Accounts receivable | | 8 | ||||
| Investments | | | 9 | |||
| Loans | | | 11 | |||
| Generations Fund | | | 12 | |||
| Accounts payable, accrued expenses and other allowances | | 13 | ||||
| Assets related to derivative financial instruments | | | | 17 | ||
| Liabilities related to derivative financial instruments | | | | 17 | ||
| Debts | | | | 18 | ||
| Sinking funds relating to borrowings | | | | | 18 | |
| CONSOLIDATED FINANCIAL STATEMENTS | 107 |
6. Financial instruments (cont’d)
Credit risk
Credit risk is the risk that the counterparty to a financial instrument will fail to meet an obligation and cause the government to incur a financial loss.
All financial instruments recognized as financial assets expose the government to credit risk, with the exception of investments in equity instruments.
At fiscal year-end, the government’s maximum exposure to credit risk corresponds to the book value of financial assets which are financial instruments, without taking into account guarantees held or any other credit enhancements. The government is also exposed to credit risk associated with guarantees totalling $16 950 million granted on financing initiatives, net of the allowance for losses on guaranteed financing initiatives (Note 13), as well as on loan pledges (Note 21).
Liquidity risk
Liquidity risk is the risk that the government will encounter difficulties in meeting its financial liabilities. At fiscal year-end, undiscounted contractual cash flows are detailed as follows:
Schedule of cash flows
(millions of dollars)
| Maturing on March 31(1) | ||||||||||||||||||||
| 2024 | 2025 and 2026 | 2027 and 2028 | 2029 and thereafter | Total | ||||||||||||||||
| Grants to be paid at the rate of repayment of the loans contracted by the recipients(2) | 800 | 1 475 | 1 281 | 4 919 | 8 475 | |||||||||||||||
| Debts contracted on financial markets | 34 931 | 52 939 | 40 833 | 247 827 | 376 530 | |||||||||||||||
| Debts arising from agreements and contracts | 298 | 596 | 598 | 5 469 | 6 961 | |||||||||||||||
| Assets related to derivative financial instruments | (7 213 | ) | (2 727 | ) | (1 118 | ) | (2 131 | ) | (13 189 | ) | ||||||||||
| Liabilities related to derivative financial instruments | 4 542 | 5 136 | 3 032 | 5 069 | 17 779 | |||||||||||||||
| 33 358 | (3) | 57 419 | 44 626 | 261 153 | 396 556 | |||||||||||||||
| (1) | Amounts shown include interest and amounts related to debt whose securities are held in treasury. |
| (2) | With the exception of liabilities arising from transfers related to subsidies payable at the same rate as the repayment of borrowings by beneficiaries, almost all accounts payable, accrued expenses and other allowances are due in the short term and settled in the following fiscal year. |
| (3) | In addition to this amount, liabilities in the sinking funds relating to borrowings totalling $7 808 M will be settled in fiscal 2023-2024. |
| 108 | PUBLIC ACCOUNTS 2022-2023 |
6. Financial instruments (cont’d)
Overall liquidity risk management
To meet its financial requirements arising from its operations and investment activities, as well as those related to repayments of borrowings that are maturing, the government has provided itself with an annual financing and debt management program based on Canadian and international financial markets.
Day-to-day cash management is based on regularly updated cash forecasts and enables the government to manage the desynchronization of cash inflows and outflows. This liquidity management relies on various tools, such as short-term borrowing programs, credit facilities and sound management of cash and short-term investments.
In addition, the government has set up sinking funds relating to borrowings (Note 18) to provide for the repayment of debts contracted on financial markets, in accordance with the Financial Administration Act (CQLR, chapter A-6.001). The government makes annual contributions to these funds.
The government has also created the Generations Fund (Note 12), whose purpose is to reduce the government’s debt. The government makes annual payments, which are deposited with the Caisse de dépôt et placement du Québec in accordance with the Act to reduce the debt and establish the Generations Fund (CQLR, chapter R 2.2.0.1). The government may withdraw sums to repay the gross debt.
Market risk
Market risk is the risk that the fair value or future cash flows of a financial instrument will fluctuate because of changes in market conditions. Market risk includes currency risk, interest rate risk and price risk. The government is exposed to all of these risks.
| CONSOLIDATED FINANCIAL STATEMENTS | 109 |
6. Financial instruments (cont’d)
Currency risk
Currency risk is the risk that the fair value or future cash flows of a financial instrument will fluctuate because of changes in foreign exchange rates. At fiscal year-end, the components in the consolidated financial statements with exposure to currency risk are as follows:
Exposure to currency risk
(millions of dollars)
| As at March 31, 2023 | ||||||||||||
| Equivalent in Canadien dollars | ||||||||||||
| US dollars | Euros | Other currencies(1) | ||||||||||
| Sinking funds relating to borrowings(2) | 2 047 | 1 480 | ||||||||||
| Assets and liabilities related to derivative financial instruments | 25 583 | 27 949 | 5 829 | |||||||||
| Debts(2) | (27 445 | ) | (29 418 | ) | (5 830 | ) | ||||||
| Net exposure | 185 | 11 | (1 | ) | ||||||||
| (1) | Other currencies include the Australian dollar, pound sterling, Swiss franc, yen, Swedish krona and New Zealand dollar. |
| (2) | Amounts shown include treasury securities. |
Overall currency risk management
The government uses several strategies to manage currency risk, including the use of derivative financial instruments and the acquisition of assets denominated in foreign currencies as part of its sinking funds relating to borrowings. The government’s objective is to achieve zero exposure to foreign currency debt.
As at March 31, 2023, a 10% rise or fall in the Canadian dollar against foreign currencies would have had a negligible impact on the government’s operating results.
| 110 | PUBLIC ACCOUNTS 2022-2023 |
6. Financial instruments (cont’d)
Intetest rate risk
Interest rate risk is the risk that the fair value or future cash flows of a financial instrument will fluctuate because of changes in market interest rates. At fiscal year-end, the components in the consolidated financial statements with exposure to interest rate risk are as follows:
Exposure to interest rate risk
(millions of dollars)
| As at March 31, 2023 | ||||
| Cash and cash equivalents | 9 981 | |||
| Loans | 1 614 | |||
| Generations Fund | 1 786 | |||
| Sinking funds relating to borrowings(1) | 16 064 | |||
| Assets and liabilities related to derivative financial instruments | (22 218 | ) | ||
| Debts(1) | (28 540 | ) | ||
| Net exposure | (21 313 | ) |
| (1) | Amounts shown include treasury securities. |
Overall interest rate risk management
The government uses several strategies to manage interest rate risk, including the use of derivative financial instruments.
As at March 31, 2023, a 1% rise or fall in interest rates would have had an impact of nearly $200 million on the government’s operating results.
Price risk
Price risk is the risk that the fair value or future cash flows of a financial instrument will fluctuate because of changes in market prices other than those arising from interest rate risk or currency risk, whether those changes are caused by factors specific to the individual instrument or its issuer, or by factors affecting all similar financial instruments traded in the market.
At fiscal year-end, the components of the consolidated financial statements with exposure to price risk are limited to investments in equity instruments quoted in an active market, with a book value of $512 million.
As at March 31, 2023, a 10% rise or fall in stock market prices would have had a negligible impact on the government’s operating results.
| CONSOLIDATED FINANCIAL STATEMENTS | 111 |
6. Financial instruments (cont’d)
Among the financial instruments recognized at cost or at amortized cost, investments in equity instruments not quoted in an active market or in the form of participation deposits in a particular fund of the Caisse de dépôt et placement du Québec are not exposed to price risk. Although their fair value may fluctuate due to changes in market prices, they affect the government’s consolidated financial statements only when they are disposed of, or in the event of an other-than-temporary decline in value.
| ▌ | 7. Cash and cash equivalents |
| Significant accounting policy |
| Cash and cash equivalents are comprised of cash and investments which are held for the purpose of meeting short-term cash commitments. These investments, highly liquid, are easily convertible into a known amount of cash and unlikely to change significantly in value. |
Cash and cash equivalents
(millions of dollars)
| As at March 31 | ||||||||
| 2023 | 2022 | |||||||
| Cash(1) | 4 555 | 6 246 | ||||||
| Cash equivalents(2) | 5 426 | 3 721 | ||||||
| 9 981 | 9 967 | |||||||
| (1) | Cash and cash equivalents are shown net of a $970 M bank overdraft arising from outstanding cheques. |
| (2) | The government did not hold any of its own securities in cash equivalents ($390 M as at March 31, 2022). As at March 31, 2022, these securities are offset against the corresponding debts. |
Credit risk management
The credit risk associated with cash and cash equivalents is low. The government has adopted a management framework that limits the risks associated with its investments, including cash equivalents. This framework sets out criteria such as the minimum credit rating required for the selection of authorized issuers, that are mainly financial institutions and governments.
Interest rate risk management
Some cash equivalents bear interest. However, the interest rate risk associated with these transactions is limited, since the maturities of these securities are very short and the government may use derivative financial instruments, in accordance with its management policies.
| 112 | PUBLIC ACCOUNTS 2022-2023 |
Significant accounting policies |
Income taxes and other taxes receivable are recognized at realizable value, that is, an amount equivalent to what the government expects to receive. These accounts receivable are subsequently brought down to the net recoverable value by means of an allowance for doubtful accounts.
Revenue from personal income tax, contributions for health services and consumption taxes uncollected at the end of the fiscal year are recognized as income taxes and other taxes receivable; the amounts are estimated based on the transactions carried out after the end of the fiscal year.
Revenue from corporate income taxes uncollected at the end of the fiscal year is recognized as taxes receivable; the amounts are based on notices of assessment issued before the end of the fiscal year.
Other accounts receivable are recognized at cost or amortized cost. The annual change in the allowance for doubtful accounts is recognized as an expense.
|
| Measurement uncertainty |
Initial assessment of income taxes and other taxes receivable
Income taxes and other taxes receivable stemming from notices of assessment issued after tax checks and contested taxpayer notices are based on estimates that may be hard to measure. The initial evaluation of the amounts the government expects to collect with regard to such notices is based on the settlement rates of similar files in the past. Adjustments resulting from new information obtained after checks or court rulings are recognized in the fiscal year when they become known.
Estimate of the allowance for doubtful accounts
The value of the allowance for doubtful accounts relating to taxes receivable is uncertain due to the fact that it is estimated on the basis of a statistical sample of accounts receivable representative of the population as a whole. The accounts receivable’s potential recoverable amount in the sample is determined primarily by considering the financial position of taxpayers.
Federal government transfers
Transfers from the federal government receivable for cost-sharing programs to provide financial assistance to third parties are subject to measurement uncertainty due to possible discrepancies between the estimate of eligible expenditures made by third parties and the work actually performed.
|
| CONSOLIDATED FINANCIAL STATEMENTS | 113 |
8. Accounts receivable (cont’d)
Details of accounts receivable
(millions of dollars)
| As at March 31 | ||||||||
| 2023 | 2022 | |||||||
| Income taxes and other taxes receivable | ||||||||
| Income and property taxes | 11 114 | 10 552 | ||||||
| Consumption taxes | 5 479 | 5 196 | ||||||
| Allowance for doubtful accounts | (1 754 | ) | (1 716 | ) | ||||
| 14 839 | 14 032 | |||||||
| Other | ||||||||
| Duties and permits | 696 | 577 | ||||||
| Miscellaneous revenue | 6 456 | 5 803 | ||||||
| Allowance for doubtful accounts | (967 | ) | (893 | ) | ||||
| 6 185 | 5 487 | |||||||
| Revenue from government enterprises – dividends | 617 | 447 | ||||||
| Federal government transfers | 3 473 | 3 266 | ||||||
| 10 275 | 9 200 | |||||||
| 25 114 | 23 232 | |||||||
Managing credit risk associated with tax receivables
The government is exposed to credit risk arising from the inability of certain receivables to settle their obligations, which could result in a financial loss for the government. These accounts mainly consist of receivables and tax revenues not collected as at March 31.
However, the credit risk associated with tax receivables is low. On the one hand, amounts receivable totalling $16 593 million were mainly received in the first months of fiscal 2023-2024. On the other hand, in order to reduce the credit risk associated with unreceived tax receivables, the government uses a legal offsetting mechanism before issuing a refund to a creditor. Moreover, it recognizes receivables at their net recoverable value through an allowance for doubtful accounts. In the government’s opinion, the allowance of $1 754 million is sufficient to considerer credit risk.
| 114 | PUBLIC ACCOUNTS 2022-2023 |
8. Accounts receivable (cont’d)
Credit risk management associated with other receivables
The government is exposed to credit risk in respect of other receivables. To protect itself against this risk, the government has established control and management policies and procedures. These policies include provisions relating to credit risk assessment, acceptable risk levels, periodic monitoring and collection measures, and the assessment of the allowance for doubtful accounts. The government periodically assesses the practices in place and, if necessary, adjusts them based on the observations and results obtained.
The aging trial balance of other accounts receivable, net of the allowance for doubtful accounts, is as follows:
Credit risk – Age of other accounts receivable
(millions of dollars)
| As at March 31, 2023 | ||||||||||||
| Financial instruments | Other | Total | ||||||||||
| Receivables not past due | 7 588 | 2 120 | 9 708 | |||||||||
| Past-due receivables | ||||||||||||
| Less than 3 months | 228 | 228 | ||||||||||
| 3 months to less than 6 months | 135 | 17 | 152 | |||||||||
| 6 months to less than 9 months | 96 | 15 | 111 | |||||||||
| 9 months to less than 12 months | 41 | 16 | 57 | |||||||||
| 12 months and more | 253 | 733 | 986 | |||||||||
| 753 | 781 | 1 534 | ||||||||||
| Allowance for doubtful accounts | (548 | ) | (419 | ) | (967 | ) | ||||||
| 7 793 | 2 482 | 10 275 | ||||||||||
The credit quality of other accounts receivable that are neither past due nor impaired is deemed adequate.
| CONSOLIDATED FINANCIAL STATEMENTS | 115 |
Significant accounting policies |
Investments are recognized at cost or amortized cost, with the exception of investments in equity instruments quoted on an active market, which are recognized at fair value.
When investments have significant concessionary terms, that is, if there is a significant difference between their nominal value and their present value using the weighted average rate for government’s debt, the investments are recognized at their present value when they take effect. This difference constitutes a grant component, which is recognized as a transfer expenditure. Subsequently, investment income is recognized and added to the book value of the investment until their maturity date, using the effective interest method.
When an investment experiences a loss in value that is other than a temporary decline, its book value is reduced to reflect the decline in value. Any reduction in the book value of an investment recognized at cost or amortized cost is recognized as an expense and cannot be reversed. Where applicable, the subsequent recovery of a written-off investment is recognized in income. When the book value of an investment recognized at fair value has been reduced to reflect an other-than-temporary decline in value, the accumulated balance of unrealized losses recognized under remeasurement gains and losses is reclassified to results.
|
| Measurement uncertainty |
| Investments in equity instruments in the form of shares and equity are subject to measurement uncertainty because assumptions are used to estimate their recoverable value. The factors the government relies on for determining whether there is a loss in value that is other than a temporary decline in these investments include their length and how sharply the fair value declined compared to cost. For investments in private equity instruments, the government estimates the recoverable value with the help of experts and approaches based on models that take into account current economic conditions, the financial situation and the profitability outlook for each issuing entity. |
| 116 | PUBLIC ACCOUNTS 2022-2023 |
9. Investments (cont’d)
Investments by nature of securities held by maturity at acquisition
(millions of dollars)
| As at March 31 | ||||||||||||||||||||
| 2023 | 2022 | |||||||||||||||||||
| 3 to 12 months | More than 12 months | No maturity | Total | Total | ||||||||||||||||
| Recorded at cost or at amortized cost | ||||||||||||||||||||
| Equity instruments not quoted in an active market | 3 799 | 3 799 | 2 842 | |||||||||||||||||
| Participation deposits(1) | 2 191 | 2 191 | 1 983 | |||||||||||||||||
| Bonds(2),(3) | ||||||||||||||||||||
| Federal and provincial governments | 7 | 442 | 449 | 472 | ||||||||||||||||
| Municipalities and municipal bodies | 39 | 408 | 447 | 456 | ||||||||||||||||
| Enterprises | 19 | 80 | 99 | 186 | ||||||||||||||||
| Other | 1 | 2 | 3 | 32 | ||||||||||||||||
| Term deposits | 106 | 58 | 164 | 25 | ||||||||||||||||
| Other(2),(3) | 121 | 19 | 140 | 92 | ||||||||||||||||
| 293 | 1 009 | 5 990 | 7 292 | 6 088 | ||||||||||||||||
| Recorded at fair value | ||||||||||||||||||||
| Equity instruments quoted in an active market(4) | 512 | 512 | 230 | |||||||||||||||||
| 293 | 1 009 | 6 502 | 7 804 | (5) | 6 318 | (5) | ||||||||||||||
| (1) | The government holds participation units in specific funds entrusted to the Caisse de dépôt et placement du Québec. |
| (2) | The government also held $2 215 M ($6 620 M as at March 31, 2022) of its own securities in bonds and Treasury bills. These securities are offset against the corresponding debts. |
| (3) | As at March 31, 2023, the quoted market value of marketable securities in active markets was $1 031 M and their book value was $1 047 M. |
| (4) | Fair value measurements for these financial instruments are based on level 1 of the fair value hierarchy, that is, on observable prices (unadjusted) in active markets available at the measurement date for identical assets. As at March 31, 2022, these financial instruments were recognized at cost. |
| (5) | The value of the investments was reduced by $141 M ($126 M as at March 31, 2022), which represents the impact of the significantly advantageous terms of some of those investments. |
Policies governing investment activities
The government has established policies governing long-term investment activities. These investment policies aim to optimize investment returns while maintaining the degree of risk at a level deemed appropriate by the government.
| CONSOLIDATED FINANCIAL STATEMENTS | 117 |
9. Investments (cont’d)
Investment deposits
Investment deposits are held in six specific funds of the Caisse de dépôt et placement du Québec (the Caisse). For each of these funds, an investment policy has been established based on a number of factors, including 10-year return forecasts, the long-term target allocation of asset classes that make up the benchmark portfolio and the permitted deviations from the target portfolio. These policies also take into account positions taken in derivative financial instruments and determine the level of exposure to market risk.
The Caisse manages all market risks on an integrated basis for all specialized portfolios. The main elements contributing to risk, such as industry sectors, geographic regions and issuers, are taken into account.
Credit risk management
All investments expose the government to credit risk, with the exception of investments in equity instruments.
With regard to investment deposits with the Caisse, the government partly manages credit risk by setting its investment policies so as to reduce its exposure to risk to a level it deems acceptable. Credit risk analyses are carried out globally by the Caisse for all the portfolios it manages. Since the net assets of the government’s special funds are invested in underlying portfolios, the funds are indirectly exposed to credit risk. The Caisse’s exposure is described in detail in its own financial statements.
Moreover, all financial instruments held directly by the special funds are traded with the Caisse, which benefits from an AAA credit rating.
With regard to other investments, credit risk is considered low, since counterparties enjoy high credit ratings from rating agencies and funds are safely invested in authorized investments, in accordance with the Financial Administration Act (CQLR, chapter A-6.001) and the Regulation respecting investments made by a body (CQLR, chapter A-6.001, r. 8).
Price risk
The government is exposed to price risk with respect to equity instruments quoted in an active market, whose fair value fluctuates due to changes in stock market prices. As a result, a decline in stock market prices could generate unrealized losses in the consolidated statement of remeasurement gains and losses, or losses in the consolidated statement of operations and accumulated operating deficit to reflect an other-than-temporary decline.
| 118 | PUBLIC ACCOUNTS 2022-2023 |
▌10. Investment in government enterprises
Significant accounting policies |
Investment in government enterprises is recognized using the modified equity method based on the government’s proportionate share of each enterprise.
The financial information from government enterprises is based on the IFRS, except for information from Hydro-Québec, which is based on generally accepted accounting principles (GAAP) in the United States. Adjustments are made to Hydro-Québec’s financial information to bring it in line with the IFRS standards; such adjustments mainly concern employee future benefits, financial instruments and asset retirement obligations.
|
| Material measurement uncertainty |
| Each government enterprise is subject to specific measurement uncertainties inherent to its own activities. These uncertainties are mainly with respect to revenue, other liabilities, including pension plans and other future benefits, fixed assets and financial instruments. |
| CONSOLIDATED FINANCIAL STATEMENTS | 119 |
10. Investment in government enterprises (cont’d)
Financial information on government enterprises
(millions of dollars)
| As at March 31 | ||||||||||||||||||||||||||||||
| 2023 | 2022 | |||||||||||||||||||||||||||||
| Investis- | Société des | |||||||||||||||||||||||||||||
| sement | Loto- | alcools du | ||||||||||||||||||||||||||||
| Hydro-Québec | Québec | Québec | Québec | Other | Total | Total | ||||||||||||||||||||||||
| (US GAAP) | (IFRS) | |||||||||||||||||||||||||||||
| Adjustments for | ||||||||||||||||||||||||||||||
| December 31, | the three-month | Adjustments – | March 31, | |||||||||||||||||||||||||||
| 2022 | periods | IFRS (1) | 2023 | |||||||||||||||||||||||||||
| STATEMENT OF OPERATIONS | ||||||||||||||||||||||||||||||
| Revenue | 16 567 | 333 | 26 | 16 926 | 934 | 3 013 | 4 133 | 757 | 25 763 | 23 575 | ||||||||||||||||||||
| Expenditure | 12 010 | 164 | 1 085 | 13 259 | 1 158 | 1 413 | 2 706 | 626 | 19 162 | 17 585 | ||||||||||||||||||||
| Annual (deficit) surplus | 4 557 | 169 | (1 059 | ) | 3 667 | (224 | ) | 1 600 | 1 427 | 131 | 6 601 | 5 990 | ||||||||||||||||||
| Consolidation adjustments | (2 | ) | (2 | ) | (3 | ) | 26 | 19 | (30 | ) | ||||||||||||||||||||
| Revenue from government enterprises | 3 665 | (226 | ) | 1 597 | 1 427 | 157 | 6 620 | 5 960 | ||||||||||||||||||||||
| Other comprehensive income items | 2 478 | 527 | (2 116 | ) | 889 | 60 | 11 | ― | (13 | ) | 947 | 691 | ||||||||||||||||||
| STATEMENT OF FINANCIAL POSITION | ||||||||||||||||||||||||||||||
| Fixed assets | 71 080 | 3 249 | 992 | 75 321 | 284 | 670 | 212 | 479 | 76 966 | 72 377 | ||||||||||||||||||||
| Other assets | 18 294 | 804 | (9 | ) | 19 089 | 10 042 | 571 | 1 105 | 449 | 31 256 | 29 861 | |||||||||||||||||||
| Total assets | 89 374 | 4 053 | 983 | 94 410 | 10 326 | 1 241 | 1 317 | 928 | 108 222 | 102 238 | ||||||||||||||||||||
| Debts and advances | 51 545 | 5 695 | 134 | 57 374 | 5 272 | 299 | 318 | 86 | 63 349 | 59 100 | ||||||||||||||||||||
| Other liabilities | 10 952 | (4 160 | ) | 1 468 | 8 260 | (2) | 488 | 675 | 961 | 442 | 10 826 | 10 261 | ||||||||||||||||||
| Total liabilities | 62 497 | 1 535 | 1 602 | 65 634 | 5 760 | 974 | 1 279 | 528 | 74 175 | 69 361 | ||||||||||||||||||||
| Accumulated other comprehensive income items | 415 | 287 | 5 598 | 6 300 | 21 | 180 | (7 | ) | (13 | ) | 6 481 | 5 545 | ||||||||||||||||||
| Other shareholders’ equity items | 26 462 | 2 231 | (6 217 | ) | 22 476 | 4 545 | 87 | 45 | 413 | 27 566 | 27 332 | |||||||||||||||||||
| Total shareholders’ equity | 26 877 | 2 518 | (619 | ) | 28 776 | 4 566 | 267 | 38 | 400 | 34 047 | 32 877 | |||||||||||||||||||
| Consolidation adjustments | 20 | 23 | 27 | 70 | 44 | |||||||||||||||||||||||||
| Equity value (modified method) | 28 796 | 4 589 | 267 | 38 | 427 | 34 117 | 32 921 | |||||||||||||||||||||||
| Loans | 2 412 | 246 | 40 | 2 698 | 1 956 | |||||||||||||||||||||||||
| Investment in government enterprises | 28 796 | 7 001 | 513 | 38 | 467 | 36 815 | 34 877 | |||||||||||||||||||||||
| Dividends and other contributions paid | 3 418 | ― | 1 600 | 1 427 | 95 | 6 540 | 5 242 | |||||||||||||||||||||||
| Main contractual obligations | 103 994 | 1 504 | 69 | ― | 25 | 105 592 | 64 545 | |||||||||||||||||||||||
| Main contingent liabilities | 6 374 | (3) | 456 | ― | 3 | ― | 6 833 | 4 573 | ||||||||||||||||||||||
| (1) | The adjustments to bring Hydro-Québec’s financial information in line with the IFRS resulted in a decrease in the government’s share in this enterprise of $3 175 M, as these adjustments led to a $1 059 M reduction in the income from government enterprises and a $2 116 M decrease in the other items of the comprehensive income. The combined adjustments to IFRS had the effect of decreasing the government’s share by $619 M (increasing it by $2 558 M as at March 31, 2022). |
| (2) | The government granted a financial guarantee of $685 M ($685 M as at March 31, 2022) for the Gentilly-2 nuclear generating station. In order to finance the costs related to long-term nuclear fuel waste management, Hydro-Québec set up a trust of $178 M ($172 M as at March 31, 2022). |
| (3) | This sum is pertaining mainly to two lawsuits for damages and interest totalling $6 200 M filed by Innu Nation inc and Innus de Uashat mak Mani-utenam. Joint lawsuits have also been instituted against Hydro-Québec and the government. Those lawsuits are disclosed in Note 22 on contingencies. |
| 120 | PUBLIC ACCOUNTS 2022-2023 |
10. Investment in government enterprises (cont’d)
Accumulated other comprehensive income items of government enterprises
(millions of dollars)
| Fiscal year ended March 31 | ||||||||||||||||||||
| 2023 | 2022 | |||||||||||||||||||
| Actuarial gains (losses) on employee future benefits | Unrealized gains (losses) on financial instruments | Other | Total | Total | ||||||||||||||||
| Opening balance | 6 517 | (1 025 | ) | 51 | 5 543 | 4 864 | ||||||||||||||
| Other comprehensive income items of government enterprises | (558 | ) | 1 418 | 87 | 947 | 691 | ||||||||||||||
| 5 959 | 393 | 138 | 6 490 | 5 555 | ||||||||||||||||
| Items reclassified in other shareholders’ equity items | (9 | ) | (9 | ) | (12 | ) | ||||||||||||||
| Closing balance | 5 950 | 393 | 138 | 6 481 | 5 543 | |||||||||||||||
Inter-entity operations and operations with third-parties not included in the reporting entity
(millions of dollars)
| As at March 31 | ||||||||||||||||||||||||
| 2023 | 2022 | |||||||||||||||||||||||
| Inter- entities | Third parties not included in the reporting entity | Total | Inter- entities | Third parties not included in the reporting entity | Total | |||||||||||||||||||
| STATEMENT OF OPERATIONS | ||||||||||||||||||||||||
| Revenue | 1 031 | 24 732 | 25 763 | 1 089 | 22 486 | 23 575 | ||||||||||||||||||
| Expenditure | 1 795 | 17 367 | 19 162 | 1 666 | 15 919 | 17 585 | ||||||||||||||||||
| Annual (deficit) surplus | (764 | ) | 7 365 | 6 601 | (577 | ) | 6 567 | 5 990 | ||||||||||||||||
| STATEMENT OF FINANCIAL POSITION | ||||||||||||||||||||||||
| Fixed assets | 76 966 | 76 966 | 72 377 | 72 377 | ||||||||||||||||||||
| Other assets | 3 383 | 27 873 | 31 256 | 4 320 | 25 541 | 29 861 | ||||||||||||||||||
| Total assets | 3 383 | 104 839 | 108 222 | 4 320 | 97 918 | 102 238 | ||||||||||||||||||
| Debts and advances | 2 729 | 60 620 | 63 349 | 1 969 | 57 131 | 59 100 | ||||||||||||||||||
| Other liabilities | 1 019 | 9 807 | 10 826 | 864 | 9 397 | 10 261 | ||||||||||||||||||
| Total liabilities | 3 748 | 70 427 | 74 175 | 2 833 | 66 528 | 69 361 | ||||||||||||||||||
| Loans granted to government enterprises | 2 698 | 1 956 | ||||||||||||||||||||||
| Dividends and other contributions paid | 6 540 | 5 242 | ||||||||||||||||||||||
| CONSOLIDATED FINANCIAL STATEMENTS | 121 |
10. Investment in government enterprises (cont’d)
Repayment schedule for debts and advances contracted with third parties and with the government
(millions of dollars)
| 2024 | 2025 | 2026 | 2027 | 2028 | 2029 and thereafter | Total | ||||||||||||||||||||||
| Hydro-Québec | ||||||||||||||||||||||||||||
| Third parties not included in the reporting entity | 4 573 | 1 547 | 453 | 733 | 67 | 49 999 | 57 372 | |||||||||||||||||||||
| Investissement Québec | ||||||||||||||||||||||||||||
| Third parties not included in the reporting entity | 1 186 | 440 | 604 | 328 | 346 | 27 | 2 931 | |||||||||||||||||||||
| Government | 1 103 | 629 | 416 | 144 | 68 | 99 | 2 459 | |||||||||||||||||||||
| 2 289 | 1 069 | 1 020 | 472 | 414 | 126 | 5 390 | ||||||||||||||||||||||
| Loto-Québec | ||||||||||||||||||||||||||||
| Third parties not included in the reporting entity | 26 | 8 | 7 | 5 | 4 | 10 | 60 | |||||||||||||||||||||
| Government | 39 | 16 | 16 | 17 | 17 | 141 | 246 | |||||||||||||||||||||
| 65 | 24 | 23 | 22 | 21 | 151 | 306 | ||||||||||||||||||||||
| Société des alcools du Québec | ||||||||||||||||||||||||||||
| Third parties not included in the reporting entity | 55 | 50 | 45 | 38 | 32 | 124 | 344 | |||||||||||||||||||||
| Other | ||||||||||||||||||||||||||||
| Third parties not included in the reporting entity | 6 | 5 | 5 | 5 | 6 | 17 | 44 | |||||||||||||||||||||
| Government | 28 | 4 | 6 | 38 | ||||||||||||||||||||||||
| 34 | 5 | 5 | 9 | 6 | 23 | 82 | ||||||||||||||||||||||
| Total debt and advances | ||||||||||||||||||||||||||||
| Third parties not included in the reporting entity | 5 846 | 2 050 | 1 114 | 1 109 | 455 | 50 177 | 60 751 | |||||||||||||||||||||
| Government | 1 170 | 645 | 432 | 165 | 85 | 246 | 2 743 | |||||||||||||||||||||
| 7 016 | 2 695 | 1 546 | 1 274 | 540 | 50 423 | 63 494 | ||||||||||||||||||||||
| Note: | The government guarantees borrowings contracted by Hydro-Québec and Investissement Québec in different currencies. The net value of these guaranteed borrowings stood at $53 782 M ($50 273 M as at March 31, 2022) for Hydro-Québec and at $2 753 M ($3 665 M as at March 31, 2022) for Investissement Québec. |
| 122 | PUBLIC ACCOUNTS 2022-2023 |
Significant accounting policies |
Loans are recognized at cost.
When loans have significant concessionary terms, that is, there is a significant difference between their nominal value and their present value using the weighted average rate for government’s debt, the loans are recognized at their present value when they take effect. This difference constitutes a grant component, which is recognized as a transfer expenditure. Subsequently, interest income is recognized and added to the book value of the loan until its maturity date, using the effective interest method.
When a direct link can be established between government transfers and the repayment of a loan, the latter is recognized as a transfer expenditure.
When the facts or circumstances point to the risk of a loss, a valuation allowance is recognized as a reduction in loans in order to reflect their net recoverable value. The annual change in this allowance is recognized as an expenditure and, where applicable, the subsequent recovery of a written-off loan is recognized in income.
|
| Measurement uncertainty |
| Loans are subject to measurement uncertainty because estimates and assumptions are used to determine the valuation allowance and the net recovery value of the loans. The valuation allowance estimate is revised regularly and adjusted to take several factors into account, including the rate of past losses, sector risks and the borrower’s financial situation. |
| CONSOLIDATED FINANCIAL STATEMENTS | 123 |
11. Loans (cont’d)
Loans granted and weighted average rate by category of borrower
| As at March 31 | ||||||||||||||||||||||||||||
| 2023 | 2022 | |||||||||||||||||||||||||||
| Weighted | Valuation | Net book | Valuation | Net book | ||||||||||||||||||||||||
| average rate | Cost | allowances | value | Cost | allowances | value | ||||||||||||||||||||||
| (percent) | (millions | (millions | ||||||||||||||||||||||||||
| of dollars) | of dollars) | |||||||||||||||||||||||||||
| Local administrations | ||||||||||||||||||||||||||||
| Municipalities | 3.07 | 432 | (41 | ) | 391 | 571 | (48 | ) | 523 | |||||||||||||||||||
| Municipal bodies | 2.91 | 1 909 | (64 | ) | 1 845 | 1 492 | (70 | ) | 1 422 | |||||||||||||||||||
| 2.94 | 2 341 | (105 | ) | 2 236 | 2 063 | (118 | ) | 1 945 | ||||||||||||||||||||
| Enterprises(1),(2) | 2.21 | 3 960 | (894 | ) | 3 066 | (3) | 3 603 | (785 | ) | 2 818 | (3) | |||||||||||||||||
| Non-profit and fiduciary organizations | 4.61 | 169 | (15 | ) | 154 | 170 | 170 | |||||||||||||||||||||
| Students | 5.39 | 576 | (206 | ) | 370 | 591 | (218 | ) | 373 | |||||||||||||||||||
| Other | 51 | (2 | ) | 49 | 50 | 50 | ||||||||||||||||||||||
| 4 756 | (1 117 | ) | 3 639 | 4 414 | (1 003 | ) | 3 411 | |||||||||||||||||||||
| 2.77 | 7 097 | (1 222 | ) | 5 875 | 6 477 | (1 121 | ) | 5 356 | ||||||||||||||||||||
| (1) | Loans with repayment clauses based on royalties are included in the loans to enterprises. The conditions associated with these loans are such that the entire amount advanced is more similar to a subsidy. Therefore, these loans have a zero value. |
| (2) | Loans to enterprises include US$61 million (US$53 million as at March 31, 2022) in loans, whose equivalent value is CAN$82 million (CAN$66 million as at March 31, 2022), and €81 million (€73 million as at March 31, 2022) in loans whose equivalent value is CAN$119 million (CAN$100 million as at March 31, 2022). |
| (3) | The value of loans has been reduced by $101 M ($106 M as at March 31, 2022), which represents the impact of the significantly advantageous terms of some of these loans. |
| 124 | PUBLIC ACCOUNTS 2022-2023 |
11. Loans (cont’d)
Schedule of loan payments receivable by category of borrower
(millions of dollars)
| Maturing on March 31 | Municipalities and municipal bodies | Enterprises | Non-profit and fiduciary organizations | Students | Other | Total | ||||||||||||||||||
| 2024 | 577 | 429 | 47 | 48 | 4 | 1 105 | ||||||||||||||||||
| 2025 | 120 | 421 | 6 | 48 | 595 | |||||||||||||||||||
| 2026 | 132 | 392 | 7 | 48 | 579 | |||||||||||||||||||
| 2027 | 125 | 385 | 5 | 48 | 563 | |||||||||||||||||||
| 2028 | 109 | 363 | 5 | 48 | 525 | |||||||||||||||||||
| 1 063 | 1 990 | 70 | 240 | 4 | 3 367 | |||||||||||||||||||
| 2029-2033 | 535 | 842 | 32 | 130 | 1 539 | |||||||||||||||||||
| 2034-2038 | 221 | 261 | 38 | 520 | ||||||||||||||||||||
| 2039-2043 | 113 | 14 | 127 | |||||||||||||||||||||
| 2044-2048 | 40 | 15 | 55 | |||||||||||||||||||||
| 2049 and thereafter | 24 | 5 | 1 | 30 | ||||||||||||||||||||
| 1 996 | 3 127 | 141 | 370 | 4 | 5 638 | |||||||||||||||||||
| No fixed maturity date | 240 | 40 | 13 | 45 | 338 | |||||||||||||||||||
| 2 236 | 3 167 | 154 | 370 | 49 | 5 976 | |||||||||||||||||||
| Reduction of the value related to loans with significant advantageous terms | (101 | ) | (101 | ) | ||||||||||||||||||||
| 2 236 | 3 066 | 154 | 370 | 49 | 5 875 | |||||||||||||||||||
Credit risk management
As part of its operations, the government grants loans and receives assets as collateral. The majority of loans are granted by the Economic Development Fund. Decisions to grant these loans are based primarily on a risk assessment that takes into account such factors as the creditworthiness of the third party, available guarantees, and the transaction’s compliance with policies, standards and procedures in effect. A systematic follow-up of interventions is then carried out.
| CONSOLIDATED FINANCIAL STATEMENTS | 125 |
11. Loans (cont’d)
The cost of the loans granted by the Economic Development Fund was $3 775 million ($3 498 million as at March 31, 2022). These loans are mainly granted to businesses operating in the secondary sector.
Proportion of Economic Development Fund loans with significant securities and sureties by loan categories
| As at March 31 | ||||||||||||||||
| 2023 | 2022 | |||||||||||||||
| Cost | Proportion of the nominal balance of loans | Cost | Proportion of the nominal balance of loans | |||||||||||||
| (millions of dollars) | (percent) | (millions of dollars) | (percent) | |||||||||||||
| Loans – fixed rate | 1 779 | 32 | 1 766 | 26 | ||||||||||||
| Loans – variable rate | 498 | 54 | 487 | 49 | ||||||||||||
| Loans – no interest | 1 498 | 43 | 1 245 | 42 | ||||||||||||
As for loans granted by other entities within the reporting entity, the cost of which was $3 322 million ($2 979 million as at March 31, 2022), the guarantees received totalled $183 million ($194 million as at March 31, 2022).
The credit quality of loans that are neither past due nor impaired is deemed adequate.
Interest rate risk management
The majority of loans are fixed-rate. For variable-rate loans, changes in interest rates lead to fluctuations in the interest income earned. However, this interest rate risk is limited by contracting debt with substantially the same terms as the loans. If necessary, financial derivative instruments may be used.
| 126 | PUBLIC ACCOUNTS 2022-2023 |
The purpose of the Generations Fund, created under the Act to reduce the debt and establish the Generations Fund (CQLR, chapter R-2.2.0.1), is to reduce the government’s debt. In accordance with this Act, the fund’s assets are used exclusively to repay the government’s gross debt.
Significant accounting policies |
Demand and participation deposits in a particular fund of the Caisse de dépôt et placement du Québec (the Caisse) are recognized at cost.
Where participation deposits suffer a loss in value that is other than a temporary decline, their book value is reduced to reflect this decline and the resulting reduction in value is recognized to expenditure. At the time of disposition of participation deposits, the difference between the amount received and the book value of these units established using the average cost method is recognized to results.
|
Statement of financial position
(millions of dollars)
| As at March 31 | ||||||||
| 2023 | 2022 | |||||||
| Sums managed by the Caisse de dépôt et placement du Québec | ||||||||
| Demand deposits | 1 786 | 1 942 | ||||||
| Income receivable on investments | 46 | 25 | ||||||
| Participation deposits(1) | 16 998 | 13 778 | ||||||
| 18 830 | 15 745 | |||||||
| Accounts receivable | 81 | 84 | ||||||
| Fund balance | 18 911 | 15 829 | ||||||
| (1) | The Generations Fund holds participation units in a specific fund at the Caisse. These units are repaid with prior notice according to the Caisse’s settlement terms and conditions at the fair value of the fund’s net equity at the end of each month. The Generations Fund had 14 108 127 participation units with a total fair value of $18 629 M (11 642 767 participation units with a total fair value of $15 541 M as at March 31, 2022). |
| CONSOLIDATED FINANCIAL STATEMENTS | 127 |
12. Generations Fund (cont’d)
Statement of change in the balance of the Generations Fund
(millions of dollars)
| Fiscal year ended March 31 | ||||||||||||
| 2023 | 2022 | |||||||||||
| Budget (1) | Actual results | Actual results | ||||||||||
| Opening balance | 15 669 | 15 829 | 12 212 | |||||||||
| Own-source revenue | ||||||||||||
| Consumption taxes | ||||||||||||
| Specific tax on alcoholic beverages | 500 | 500 | 500 | |||||||||
| Duties and permits | ||||||||||||
| Water-power royalties | 870 | 888 | 867 | |||||||||
| Mining revenues | 484 | 578 | 1 032 | |||||||||
| Miscellaneous revenue | ||||||||||||
| Unclaimed property | 55 | 74 | 31 | |||||||||
| Revenue on investments | 786 | 283 | 484 | |||||||||
| Revenue from government enterprises, taken out of dividends | ||||||||||||
| Hydro-Québec | ||||||||||||
| Indexation of the average cost of heritage pool electricity | 535 | 544 | 488 | |||||||||
| Additional contribution from Hydro-Québec(2) | 215 | 215 | 215 | |||||||||
| Total own-source revenue | 3 445 | 3 082 | 3 617 | |||||||||
| Closing balance | 19 114 | 18 911 | 15 829 | |||||||||
| (1) | According to data presented in Budget 2022-2023 of the Ministère des Finances tabled on March 22, 2022. |
| (2) | Under the Hydro-Québec Act (CQLR, chapter H-5), a sum of $215 M is taken annually out of Hydro-Québec’s dividends and will be deposited in the Generations Fund until 2043. |
Credit risk management
The government partly manages the credit risk associated with participation deposits at the Caisse by determining the composition of the benchmark portfolio, thereby reducing exposure to risk to a level deemed acceptable by the government.
Credit risk analyses are carried out globally by the Caisse for all the portfolios it manages. Since the net assets of the Generations Fund special fund are invested in underlying portfolios, the fund is indirectly exposed to credit risk. The Caisse’s exposure is detailed in its own financial statements.
Moreover, all financial instruments held directly by the special fund are transacted with the Caisse, which benefits from an AAA credit rating.
| 128 | PUBLIC ACCOUNTS 2022-2023 |
12. Generations Fund (cont’d)
Interest rate risk management
Demand deposits bear interest. However, the interest rate risk associated with this financial asset is limited, since the demand deposit account represents the equivalent of the government’s bank balance deposited with the Caisse. In general, sums deposited in this account are reinvested in the purchase of participation units (participation deposits) the following month.
Investment policy
The Generations Fund is administered according to an investment policy determined by the Ministère des Finances in collaboration with the managers of the Caisse. This investment policy aims to optimize rates of return on investments while maintaining the degree of risk at a level deemed appropriate by the government.
This policy is based on a number of factors, including 10-year return forecasts, the long-term target allocation of asset classes making up the benchmark portfolio, and permitted deviations from the target portfolio. It also takes into account positions taken in derivative financial instruments and determines the level of exposure to market risk, including the target level of currency exposure.
The investment policy for the benchmark portfolio of the specific fund is as follows:
Investment policy
(percentage of net assets of special funds)
Specialized portfolios
| Short-term equities | 1.00 | |||
| Rate | 10.00 | |||
| Credit | 28.00 | |||
| Total – Fixed revenue | 39.00 | |||
| Infrastructure | 8.00 | |||
| Real estate | 8.00 | |||
| Total – Real assets | 16.00 | |||
| Stock markets | 36.00 | |||
| Private equities | 9.00 | |||
| Total – Equities | 45.00 | |||
| Asset breakdown | — | |||
| Total | 100.00 |
The Caisse manages all market risks on an integrated basis for all specialized portfolios. The main elements contributing to risk, such as industry sectors, geographic regions and issuers, are taken into account.
| CONSOLIDATED FINANCIAL STATEMENTS | 129 |
▌13. Accounts payable, accrued expenses and other allowances
Significant accounting policies |
Refunds of income and other taxes
The amounts of refunds of income and other taxes are based on notices of assessment issued before the end of the fiscal year. Refunds of individual income taxes and consumption taxes that have not yet been made at the fiscal year end are recognized as accounts payable and accrued expenses per estimates based on transactions carried out after the end of the fiscal year.
Liabilities stemming from transfers
Liabilities stemming from transfers are recognized in the fiscal year during which the transfers were duly authorized and during which the recipients met the eligibility criteria.
Allowance for losses on guaranteed financial initiatives
Obligations resulting from financial initiatives guaranteed by the government, mainly loan guarantees, are recognized on the basis of probable losses. The allowance is established on the balance of the guaranteed financial initiatives reduced by the estimated realizable value of the security and surety obtained. The annual change in the allowance is recognized in expenditure.
Probable losses are annually estimated by grouping financial initiatives into various risk classes and applying an average loss rate to each class. In the case of enterprises whose government-guaranteed financial initiatives show an exceptionally high cumulative balance or are characterized by specific features, the estimate of probable losses relating to these initiatives is made using case-by-case analysis, regardless of risk class. The authorized guarantees in effect that are not subject to an allowance constitute a contingent liability for the government.
|
| Measurement uncertainty |
Initial valuation of income and other taxes to be refunded
Income and other tax refunds stemming from disputed taxpayer notices of assessment are based on estimates for which measurement may be uncertain. The initial valuation of the amounts the government expects to pay with regard to such disputes is based mainly on the settlement rates of similar files in the past.
Estimation of liabilities stemming from transfers
Grants to be paid at the rate of repayment of the loans contracted by the recipients are recognized as work progresses on the basis of information held by the government These liabilities are subject to measurement uncertainty due to possible differences between the estimate of the government’s expenditures or work progress and actual expenditures or work performed, as the case may be.
Allowance for losses on guaranteed financial initiatives
The allowance for losses on financial guarantees is subject to measurement uncertainty because of the assumptions used to assess the likelihood of a borrower defaulting on one of his obligations and forcing the government to make good on the financial guarantee. Financial guarantees are grouped into different hazard classes with an average rate applied for each one. The allowance rate is based on past experience, the type of guarantee and past losses. When the allowances are taken individually, the main considerations are the sector risks and the borrower’s financial situation.
|
| 130 | PUBLIC ACCOUNTS 2022-2023 |
13. Accounts payable, accrued expenses and other allowances (cont’d)
Details of accounts payable, accrued expenses and other allowances
(millions of dollars)
| As at March 31 | ||||||||
| 2023 | 2022 | |||||||
| Remuneration | 13 989 | 13 810 | ||||||
| Liabilities stemming from transfers | ||||||||
| Grants to be paid at the rate of repayment of the loans contracted by the recipients(1) | 7 078 | 6 162 | ||||||
| Other grants to be paid | 7 923 | 7 064 | ||||||
| Income taxes and other taxes refundable | ||||||||
| Income and property taxes | 6 328 | 7 746 | ||||||
| Consumption taxes | 3 060 | 2 695 | ||||||
| Suppliers | 7 405 | 6 639 | ||||||
| Accrued interest on debts | 3 232 | 3 122 | ||||||
| Advances from trust funds | 1 212 | 1 194 | ||||||
| Clearing accounts for collected taxes | 830 | 1 141 | ||||||
| Allowance for losses on guaranteed financial initiatives | 564 | 573 | ||||||
| 51 621 | 50 146 | |||||||
| (1) | In addition to the sums payable as a part of its transfer programs, the government subsidizes the interest that will be borne by the recipients in subsequent years. |
| CONSOLIDATED FINANCIAL STATEMENTS | 131 |
13. Accounts payable, accrued expenses and other allowances (cont’d)
Guaranteed loans and other guaranteed financial initiatives by third party category
(millions of dollars)
| As at March 31 | ||||||||||||||||||||||||||||||||
| 2023 | 2022 | |||||||||||||||||||||||||||||||
| Authorized limit | Authorized guarantees in effect | Allowance for losses on guaranteed financial initiatives | Net risk under guarantees | Authorized limit | Authorized guarantees in effect | Allowance for losses on guaranteed financial initiatives | Net risk under guarantees | |||||||||||||||||||||||||
| Enterprises | 532 | 472 | (1) | (129 | ) | 343 | 873 | 772 | (1) | (105 | ) | 667 | ||||||||||||||||||||
| Non-profit organizations and cooperatives | 2 613 | 2 609 | (2) | (137 | ) | 2 472 | 2 487 | 2 484 | (2) | (135 | ) | 2 349 | ||||||||||||||||||||
| Forest, farm and fisheries’ sector producer | 7 715 | 6 851 | (3) | (66 | ) | 6 785 | 7 313 | 6 437 | (3) | (62 | ) | 6 375 | ||||||||||||||||||||
| Students | ||||||||||||||||||||||||||||||||
| Borrowings for which the Government pays interest as long as the borrower is a student(4) | 1 404 | 1 404 | (5) | 1 404 | 1 468 | 1 468 | (5) | 1 468 | ||||||||||||||||||||||||
| Borrowings for which borrowers are responsible for paying principal and interest | 2 442 | 2 442 | (5) | (232 | ) | 2 210 | 2 616 | 2 616 | (5) | (271 | ) | 2 345 | ||||||||||||||||||||
| 13 778 | (564 | ) | 13 214 | 13 777 | (573 | ) | 13 204 | |||||||||||||||||||||||||
| (1) | Guarantees of $459 M ($759 M as at March 31, 2022) were granted by the government under the Act respecting Investissement Québec (CQLR, chapter I-16.0.1). In addition to loan guarantees, the guarantees include loss and payment guarantees introduced to facilitate the funding of aircraft purchasers. As at March 31, 2023, the government has received significant securities and sureties for 48% of the nominal balance of its guarantee portfolio (64% of the nominal balance as at March 31, 2022). |
| (2) | Guarantees of $2 581 M ($2 455 M as at March 31, 2022) are granted by the government under the Act respecting the Société d’habitation du Québec (CQLR, chapter S-8). The government guarantees borrowings with financial institutions contracted by non-profit organizations and cooperatives for periods of 25 or 35 years following its approval of an extension. The principal and interest associated with these borrowings are covered by the non-profit organization or the cooperative. These borrowings finance the acquiring of buildings. These guarantees totalled $2 509 M ($2 364 M as at March 31, 2022). |
| (3) | Guarantees of $6 673 M ($6 279 M as at March 31, 2022) are granted by the government under the Act respecting La Financière agricole du Québec (CQLR, chapter L-0.1). This amount corresponds to balances of principal and interest on borrowings for which La Financière agricole du Québec reimburses the lenders’ residual losses and related charges. The producers’ assets are held as securities by the lenders; they consist particularly of farm or forest production units, milk quotas and surety. |
| (4) | These borrowings bear interest at the banker’s acceptance rate plus 150 basis points. |
| (5) | The guarantees are granted by the government under the Act respecting financial assistance for education expenses (CQLR, chapter A-13.3). It guarantees the reimbursement of losses of principal and interest to lending institutions. |
| 132 | PUBLIC ACCOUNTS 2022-2023 |
| ▌ | 14. Deferred revenue |
| Significant accounting policies |
Amounts received or receivable in regard to revenue that will be earned in a subsequent year are deferred and presented as deferred revenue. More precisely:
— revenue from government transfers is deferred when the stipulations as to the use of the transferred or received resources or as to the actions to be taken in order to keep them create an obligation that meets the definition of a liability. When these stipulations are of a general nature, the actions or communications of the government that establish those stipulations up to the date of the financial statements may also create a liability. When transfer revenue is deferred, it is recognized as revenue as the liabilities are paid;
— revenue from donors other than governments that is designated for a specific purpose is deferred and recognized as revenue when the resources are used for their prescribed purposes. Donations in the form of fixed assets or cash to acquire those resources will be deferred and recognized in revenue at the same pace as fixed asset depreciation;
— revenue from duties and permits refundable on demand that is linked to clearly identifiable goods and services to be rendered by the government to the right or permit holder is deferred and recognized as revenue during the reference period of such right or permit;
— revenue from school taxes is deferred and recognized in revenue for the period during which it is levied.
|
| Measurement uncertainty |
| Deferred transfer revenue from the federal government is subject to measurement uncertainty due to possible differences between the estimate of the government’s expenditures or work progress and actual expenditures or work performed. |
| CONSOLIDATED FINANCIAL STATEMENTS | 133 |
14. Deferred revenue (cont’d)
Deferred revenue by source or by nature
(millions of dollars)
| As at March 31 | ||||||||
| 2023 | 2022 | |||||||
| Federal government transfers | 5 016 | 5 169 | ||||||
| Third-party donations(1) | 2 153 | 2 014 | ||||||
| Transfers from entities other than the federal government | 144 | 106 | ||||||
| Registration and drivers licence fees | 856 | 903 | ||||||
| School property tax | 288 | 279 | ||||||
| Guarantee fees for Hydro-Québec borrowings | 184 | 177 | ||||||
| Other | 510 | 468 | ||||||
| 9 151 | 9 116 | |||||||
| (1) | The third-party donations are mainly from non-profit organizations, including foundations that provide financial support to public institutions in the health and social services network. |
Deferred revenue – Stipulations of federal government transfers
(millions of dollars)
| As at March 31 | ||||||||
| 2023 | 2022 | |||||||
| For acquisition or construction of fixed assets | 2 892 | 2 531 | ||||||
| For other purposes | ||||||||
| Financing of municipal and local infrastructures | 1 136 | 1 425 | ||||||
| Financing of research and other projects | 988 | 1 213 | ||||||
| 2 124 | 2 638 | |||||||
| 5 016 | 5 169 | |||||||
Deferred revenue – Third-party donation restriction and variations
(millions of dollars)
| Fiscal year ended March 31, 2023 | ||||||||||||||||||||
Opening balance | New donations | Recognition in revenue | Closing balance | Balance as at March 31, 2022 | ||||||||||||||||
| For acquisition of fixed assets | 1 228 | 187 | 104 | 1 311 | 1 228 | |||||||||||||||
| For other purposes | 786 | 754 | 698 | 842 | 786 | |||||||||||||||
| 2 014 | 941 | 802 | 2 153 | 2 014 | ||||||||||||||||
| 134 | PUBLIC ACCOUNTS 2022-2023 |
| ▌ | 15. Environmental liability and asset retirement obligations |
The environmental liability represents the government’s obligation to remediate contaminated sites resulting from current or past activities of various kinds, such as mining, industrial, commercial or institutional activities carried out by the government or by third parties. These activities may have taken place on a third person’s private property that was abandoned.
Asset retirement obligations mainly concern the removal of asbestos from buildings. In accordance with current laws and regulations, the government will fulfill these obligations when these fixed assets are demolished or renovated.
| Significant accounting policies |
Environmental liability
An obligation arising from the remediation of a contaminated site is recognized as an environmental liability when all the following conditions are met:
— the contamination exceeds an existing environmental standard;
— the obligation to carry out remediation falls or is likely to fall under the direct responsibility of the government;
— it is expected that the site can be remediated;
— a reasonable estimate of the costs associated with this obligation can be made.
Sites the government does not plan to remediate are those that do not pose a danger to public health and safety or those where the contamination is hardly likely to have a significant environmental impact.
The environmental liability includes the estimated costs of contaminated sites management and remediation, which are increased to reflect the degree of precision associated with the estimation method used. This measurement represents the government’s best estimate of the costs required to settle the obligation.
The liability recognized is adjusted each year based on new contaminated sites to be remediated, actual costs incurred and revisions to estimates.
Asset retirement obligations
An asset retirement obligation is recognized when all the following conditions are met:
— there is a legally enforceable obligation for the government to perform specific activities associated with the permanent retirement of a fixed asset that requires an outflow of economic resources;
— the obligation arises from the acquisition, construction, development or normal use of the asset;
— it is expected that the specific asset retirement activities will be carried out;
— a reasonable estimate of the costs relating to this obligation can be made.
Asset retirement costs are capitalized as part of the cost of the assets concerned and amortized on a straight-line basis from the date of the legal obligation until the planned completion of the asset retirement activities.
|
| CONSOLIDATED FINANCIAL STATEMENTS | 135 |
15. Environmental liability and asset retirement obligations (cont’d)
| Significant accounting policies (cont’d) |
Asset retirement obligations (cont’d)
The initial measurement of the liability is made by discounting the estimated cash flows required to perform the asset retirement activities. Cash flows are adjusted for inflation and discounted using a discount rate that represents the government’s best estimate of the cost of funds required to settle the obligation at maturity.
The recorded liability is adjusted annually for new obligations, actual costs incurred, revised estimates and accretion expense. These adjustments are recognized as an increase or decrease in the book value of the asset concerned. The adjusted book value of the asset is amortized prospectively.
Liabilities relating to the retirement of heritage buildings are not presented in the financial statements, because the government is required to maintain the integrity of these buildings under the Cultural Heritage Act. Therefore, the probable retirement date of these buildings is so far in the future that the present value of the obligation is negligible.
|
| Material measurement uncertainty |
Environmental liability
Environmental liability is subject to measurement uncertainty and may vary because different methods are used to estimate the remediation and management costs, which are increased according to the degree of precision deployed. It is also subject to measurement uncertainty due to the constantly evolving technology used for remediation and due to the inherent limitations of measurement of the extent and nature of the remediation required.
The main assumptions used to estimate the liability are related to the contaminated areas, labour and material costs and the choice of technologies available to eliminate or control contamination. Changes to those assumptions and the regulations could entail significant changes to the recorded liabilities.
Assets retirement obligations
The liability relating to asset retirement obligations is subject to measurement uncertainty and may vary due to the continually evolving technologies used in asset retirement activities, and to differences between the assumptions used in measuring the liability and actual results. The main assumptions used include the estimated costs of asset retirement, the indexation rate for these costs, the discount rate and the discount period. In addition, the obligation to safely dispose of asbestos in buildings is subject to measurement uncertainty due to the inherent limitations in assessing the quantities of asbestos contained therein, as well as the estimated cash flow schedule to carry out the work.
Changes in the key assumptions, in the technology used or in regulations could result in significant changes to the measurement of recorded asset retirement obligations.
|
| 136 | PUBLIC ACCOUNTS 2022-2023 |
15. Environmental liability and asset retirement obligations (cont’d)
Summary
(millions of dollars)
| As at March 31 | ||||||||
| 2023 | 2022 | |||||||
| Environmental liability | 3 127 | 2 812 | ||||||
| Asset retirement obligations | 4 390 | 4 592 | ||||||
7 517 | 7 404 | |||||||
Environmental liability
Number of sites inventoried
| As at March 31 | ||||||||||||||||
| 2023 | 2022 | |||||||||||||||
| Number of sites | Liability | Number of sites | Liability | |||||||||||||
| (millions of dollars) | (millions of dollars) | |||||||||||||||
| Direct responsibility | 1 498 | 2 401 | 1 529 | 2 087 | ||||||||||||
| Likely responsibility | 192 | 726 | 145 | 725 | ||||||||||||
| 1 690 | 3 127 | (1) | 1 674 | 2 812 | (1) | |||||||||||
| (1) | The environmental liability takes into account a cost increase of $693 M, representing an average rate of 29% ($662 and 31% as at March 31, 2022). |
Changes in environmental liability
(millions of dollars)
| Fiscal year ended March 31 | ||||||||
| 2023 | 2022 | |||||||
| Opening balance | 2 812 | 2 838 | ||||||
| New contaminated sites to be remediated | 90 | 52 | ||||||
| Remediation work carried out | (48 | ) | (56 | ) | ||||
| Revision of the estimates | 273 | (22 | ) | |||||
| Closing balance | 3 127 | 2 812 | ||||||
| CONSOLIDATED FINANCIAL STATEMENTS | 137 |
15. Environmental liability and asset retirement obligations (cont’d)
Asset retirement obligations
Changes in asset retirement obligations
(millions of dollars)
| Fiscal year ended March 31 | ||||||||
| 2023 | 2022 | |||||||
| Opening balance | 4 592 | 4 401 | ||||||
| Accretion expense | 218 | 191 | ||||||
| Revision of the estimates | (420 | ) | ||||||
| Closing balance | 4 390 | 4 592 | ||||||
Main assumptions used
| As at March 31 | ||||||||
| 2023 | 2022 | |||||||
| Indexation rate for estimated costs (percent) | 2.21 to 11.17 | 2.21 to 11.17 | ||||||
| Discount rate, including inflation (percent) | 3.52 to 5.54 | 2.15 to 5.54 | ||||||
| Discount period (years)(1) | 1 to 101 | 1 to 102 | ||||||
| (1) | The discounting period shown takes into account the estimated duration of asset retirement work, which is generally less than one year. |
The estimated costs of carrying out asset retirement activities as at March 31, 2023 total $8 671 million ($7 821 million as at March 31, 2022).
Impact of a change in the main assumptions on the value of asset retirement obligations
Assumptions | Change | Impact on the value of obligations as at March 31, 2023 | |||
| (millions of dollars) | (percent) | ||||
– Estimated costs | – Increase of 10.00% | 439 | +10.00 | ||
| – Decrease of 10.00% | (439) | -10.00 | |||
– Indexation rate for estimated costs | – Increase of 0.25% | 282 | +6.42 | ||
| – Decrease of 0.25% | (258) | -5.88 | |||
– Discount rate, including inflation | – Increase of 0.25% | (242) | -5.51 | ||
| – Decrease of 0.25% | 266 | +6.06 | |||
– Discount period | – Increase of 5 years | (569) | -12.96 | ||
| – Decrease of 5 years | 597 | +13.60 | |||
| 138 | PUBLIC ACCOUNTS 2022-2023 |
| ▌ | 16. Assets and liabilities regarding pension plans and other employee future benefits |
| Significant accounting policies |
Assets and liabilities of pension plans and other employee future benefits consist of the Retirement Plans Sinking Fund (RPSF), the specific pension funds and other employee future benefit programs funds as well as the obligations relating to accrued benefits under the pension plans and other employee future benefits.
When the book value of a fund exceeds the value of the corresponding liability and the government can benefit from the excess, its net value is shown as an asset. Conversely, when the liability exceeds the book value of the established asset, its net value is shown as a liability.
Retirement Plans Sinking Fund and specific pension funds
The investments of the RPSF, specific pension funds and employee future benefit programs funds are recognized at an adjusted market value. With this valuation method, the difference between the real return based on market value and the forecast return is amortized over five years.
When the adjusted market value of a pension plan fund is higher than that of its obligations, the resulting surplus is capped through a valuation allowance so that the pension plans asset reflects only the future benefit that the government expects to derive from this surplus. The annual change in the allowance is charged to expenditure.
Actuarial gains and losses attributable to the use of the forecast rate of return are amortized using the straight-line method. The amortization period corresponds to the expected average remaining service life (EARSL) of plan or program.
The annual return of a fund is obtained by applying the rate of return stipulated in the actuarial valuations of the obligations of each pension plan or the employee future benefit program to the average balance of the plan in question.
Obligations relating to the pension plans and other employee future benefits
Obligations relating to defined-benefit pension plans and employee future benefit programs are recognized using the projected benefit method prorated on years of service and the most probable assumptions set by the government. The method used takes into account the way in which benefits payable by the government are accrued by participants. The Survivor’s Pension Plan’s obligations are recognized using an actuarial method that determines the present value of the pensions accrued by beneficiaries as a result of the eligible person’s death.
Actuarial gains and losses determined during the remeasurement of obligations stem from experience adjustments to forecasts and from changes to assumptions. They are recognized in expenditure using the straight-line method, as of the fiscal year following the year in which they are taken into account in the value of obligations relating to accrued benefits. The amortization period corresponds to the EARSL of plan or program participants. For the Survivor’s Pension Plan, the amortization period corresponds to the average remaining life expectancy of beneficiaries.
Annual interest is determined by applying the discount rate of the obligation relating to accrued benefits to each program or plan to the average value of the related obligation.
|
| CONSOLIDATED FINANCIAL STATEMENTS | 139 |
16. Assets and liabilities regarding pension plans and other employee future benefits (cont’d)
| Material measurement uncertainty |
| Obligations relating to pension plans may vary because of differences between the economic and demographic assumptions made for actuarial valuation purposes and the actual results. The impact of a change in the main assumptions on the value of obligations relating to accrued benefits under the four main pension plans is shown after the table “Main economic assumptions used”. |
Assets and liabilities regarding pension plans and other employee future benefits
(millions of dollars)
As at March 31 | ||||||||||||||||||||||||
| 2023 | 2022 | |||||||||||||||||||||||
Assets |
Liabilities | Net assets (net liabilities) |
Assets |
Liabilities | Net assets (net liabilities) | |||||||||||||||||||
| Pension plans | 113 903 | 120 845 | (6 942 | ) | 106 963 | 116 569 | (9 606 | ) | ||||||||||||||||
| Université du Québec programs | 295 | (295 | ) | 282 | (282 | ) | ||||||||||||||||||
| Accumulated Sick Leave | 1 042 | 612 | 430 | 1 106 | 699 | 407 | ||||||||||||||||||
| Survivor's Pension Plan | 459 | 437 | 22 | 459 | 435 | 24 | ||||||||||||||||||
| 115 404 | 122 189 | (6 785 | ) | 108 528 | 117 985 | (9 457 | ) | |||||||||||||||||
The government put in place employee future benefits programs that provide for the accumulation of sick leave and the payment of survivors’ pensions. These programs result in long-term obligations for the government, which assumes the full cost of these programs.
Accumulated sick leave
Certain public service employees subject to the Public Service Act (CQLR, chapter F-3.1.1) can accumulate, in a reserve, the unused sick leave days they are entitled to annually.
For non-management employees, the number of unused sick leave days that may be accumulated in a reserve is limited to 20. This reserve is convertible into cash in its entirety in the event of termination of the employment relationship and may not be used during preretirement leave. Sick leave days accumulated before those agreements limiting the reserve to 20 days come into effect, minus the days originally transferred to this reserve, can be used as preretirement leave up to the expiry date prescribed in the agreements. The balance of these unused days at the expiry date will be convertible into cash at the rate of 70% no later than 60 days following that date. In accordance with the agreements, the sick leave days accumulated prior to their coming into force, unused as at March 31, 2022, and exceeding the 20-day reserve, were paid out at 70% during the 2022-2023 fiscal year for public service employees. For other non-management employees, the unused days of leave will be payable at 70% on March 31, 2024.
| 140 | PUBLIC ACCOUNTS 2022-2023 |
16. Assets and liabilities regarding pension plans and other employee future benefits (cont’d)
Accumulated sick leave (cont’d)
For non-unionized employees who are members of the Pension Plan of Management Personnel (PPMP) and Retirement Plan for Seniors Officials (RPSO), mainly management, the days accumulated in the reserve can be utilized as fully paid leave days in certain situations provided for in the different labour agreements or for preretirement leave. In case of termination of employment, retirement or death, the employees receive in money 50% of the value of these accumulated days, up to an amount representing the equivalent of 66 days’ salary.
The Financial Administration Act (CQLR, chapter A-6.001) authorizes the Minister of Finance to deposit money with the Caisse de dépôt et placement du Québec (the Caisse), up to an amount equal to the value of its obligation relating to accumulated sick leave in order to build up the Accumulated Sick Leave Fund. The purpose of this fund is to provide for the payment of some or all of the benefits due to employees for accumulated sick leave.
Actuarial gains and losses are amortized over the EARSL, which ranges from 14 to 15 years.
Survivor’s Pension Plan
The Survivor’s Pension Plan stipulates that a pension is paid to the spouse and dependent children following the death of an eligible person. The plan chiefly covers management and similar personnel in the public and parapublic sectors. The government pays amounts into a fund at the Caisse, reserved exclusively for the payment of benefits earned by plan beneficiaries.
Actuarial gains and losses are amortized over the average remaining life expectancy of the beneficiaries, which is 18 years.
Assets regarding other employee future benefits
(millions of dollars)
| As at March 31 | ||||||||||||||||
| Accumulated | Survivor's | |||||||||||||||
| Sick Leave | Pension Plan | 2023 | 2022 | |||||||||||||
| Other employee future benefits funds | 1 160 | 477 | 1 637 | 1 714 | ||||||||||||
| Less: | ||||||||||||||||
| Obligations relating to accrued benefits | 609 | 455 | 1 064 | 1 166 | ||||||||||||
| 551 | 22 | 573 | 548 | |||||||||||||
| Plus: | ||||||||||||||||
| Unamortized actuarial gains | (121 | ) | (121 | ) | (117 | ) | ||||||||||
| 430 | 22 | 452 | 431 | |||||||||||||
| CONSOLIDATED FINANCIAL STATEMENTS | 141 |
16. Assets and liabilities regarding pension plans and other employee future benefits (cont’d)
Change in the adjusted market value of other employee future benefit funds
(millions of dollars)
| Fiscal year ended March 31 | ||||||||||||||||
| 2023 | 2022 | |||||||||||||||
| Accumulated Sick Leave Fund | Survivor's Pension Plan Fund | Total |
Total | |||||||||||||
| Adjusted market value, beginning of year | 1 236 | 478 | 1 714 | 1 776 | ||||||||||||
| Anticipated investment income(1) | 77 | 29 | 106 | 109 | ||||||||||||
| Deposits from the general fund of the Consolidated Revenue Fund | 9 | 9 | 17 | |||||||||||||
| Repayments to depositors(2) | (155 | ) | (155 | ) | (170 | ) | ||||||||||
| Benefits paid | (38 | ) | (38 | ) | (38 | ) | ||||||||||
| Actuarial gains (losses) | 2 | (1 | ) | 1 | 20 | |||||||||||
| Adjusted market value, end of year(3) | 1 160 | 477 | 1 637 | 1 714 | ||||||||||||
| (1) | The forecast returns on the assets of the Accumulated Sick Leave Fund and the Survivor’s Pension Plan Fund both amount to 6.35% (6.35% in 2021-2022); the realized returns, based on the market value of investments, were 2.18% and 2.14%, respectively (9.89% and 9.00% in 2021-2022). |
| (2) | Under the Financial Administration Act (CQLR, chapter A-6.001), the payment of any benefit that affects the liabilities of the obligation relating to accumulated sick leave may be repaid to depositors out of the Accumulated Sick Leave Fund. |
| (3) | The market values of the Accumulated Sick Leave Fund and the Survivor’s Pension Plan Fund were $1 179 M and $479 M respectively ($1 306 M and $498 M as at March 31, 2022). |
Change in obligations relating to accrued other employee future benefits
(millions of dollars)
| Fiscal year ended March 31 | ||||||||||||||||
| 2023 | 2022 | |||||||||||||||
Accumulated sick leave | Survivor's Pension Plan |
Total |
Total | |||||||||||||
| Obligations, beginning of year | 716 | 450 | 1 166 | 1 187 | ||||||||||||
| Cost of accrued benefits | 26 | 12 | 38 | 63 | ||||||||||||
| Interest on obligations | 41 | 27 | 68 | 69 | ||||||||||||
| Benefits paid | (164 | ) | (38 | ) | (202 | ) | (174 | ) | ||||||||
| Actuarial (gains) losses | (10 | ) | 4 | (6 | ) | 21 | ||||||||||
| Obligations, end of year | 609 | 455 | 1 064 | 1 166 | ||||||||||||
| 142 | PUBLIC ACCOUNTS 2022-2023 |
16. Assets and liabilities regarding pension plans and other employee future benefits (cont’d)
Actuarial valuations
Every three years, the value of obligations relating to accrued benefits of the accumulated sick leave and survivors’ pension plan is determined by actuarial valuations. The value of these obligations is extrapolated for the period between two actuarial valuations.
Date of the most recent actuarial valuations used to determine the value of obligations related to vested benefits
| March 31, 2022 | December 31, 2021 | |
| (filed in 2021-2022) | (filed in 2021-2022) | |
Accumulated sick leave | Survivor’s Pension Plan | |
| Note: | The filing year corresponds to the government’s fiscal year for which an actuarial valuation of the plan is required based on the production schedule of the valuation. |
Main long-term economic assumptions used
(per cent)
| Accumulated | Survivor's | |||||||
| sick leave | Pension Plan | |||||||
| Rate of return, net of inflation | 4.35 | 4.35 | ||||||
| Inflation rate | 2.00 | 2.00 | ||||||
| Discount rate for obligations relating to accrued benefits | 6.35 | 6.35 | ||||||
Salary growth rate, net of inflation | 0.50 | — | ||||||
Accrued benefits expense relating to other employee future benefits
(millions of dollars)
| Fiscal year ended March 31 | ||||||||||||||||
| 2023 | 2022 | |||||||||||||||
| Accumulated sick leave | Survivor's Pension Plan | Total | Total | |||||||||||||
| Cost of accrued benefits | 26 | 12 | 38 | 63 | ||||||||||||
| Amortization of actuarial losses | 11 | 11 | 4 | |||||||||||||
| 37 | 12 | 49 | 67 | |||||||||||||
| CONSOLIDATED FINANCIAL STATEMENTS | 143 |
16. Assets and liabilities regarding pension plans and other employee future benefits (cont’d)
Debt service expense (revenue) relating to other employee future benefits
(millions of dollars)
| Fiscal year ended March 31 | ||||||||||||||||
| 2023 | 2022 | |||||||||||||||
| Accumulated | Survivor’s | |||||||||||||||
| sick leave | Pension Plan | Total | Total | |||||||||||||
| Interest on obligations relating to accrued benefits | 41 | 27 | 68 | 69 | ||||||||||||
| Investment income of the funds | (92 | ) | (28 | ) | (120 | ) | (122 | ) | ||||||||
| (51 | ) | (1 | ) | (52 | ) | (53 | ) | |||||||||
Pension plans
Several defined-benefit pension plans have been put in place by the government for its employees, for the Members of the National Assembly and for the judges. The government and participants contribute to the funding of all of these plans.
The government’s defined benefits plans are divided into two categories: cost-sharing and cost-balance plans. The distinction lies in the government’s responsibility for funding vested benefits and for paying benefits.
The obligations related to vested benefits borne by the participants and the net assets available for paying those benefits are set out in Appendix 4 entitled “Fiduciary transactions conducted by the government”. Further information can be found in the financial statements of plans published by Retraite Québec.
The government’s pension plans grant a defined benefit to participants when they retire, benefit calculated on the basis of an average for their best paid years, generally five, and their number of years of service. The portion of benefits accrued after July 1, 1982 or, in the case of the Pension Plan of the Université du Québec (PPUQ), after January 1, 2005, is partially indexed to the cost of living; the portion of benefits accrued before those dates is usually indexed.
The government allows its enterprises and organizations not included in the government’s reporting entity1 to join its pension plans, with the employers making contributions to the plans.
| 1 | It is mainly organizations that conduct fiduciary transactions for the government or provide services to bodies within the government’s reporting entity. |
| 144 | PUBLIC ACCOUNTS 2022-2023 |
16. Assets and liabilities regarding pension plans and other employee future benefits (cont’d)
Funding and paying benefits
The government established the RPSF to create an asset for paying all or part of the pension plans’ benefits. The RPSF is for plans whose benefits are paid by the general fund of the Consolidated Revenue Fund.
Some pension plans have their own pension funds so that they can pay the benefits required by their provisions. If the amounts in a pension fund are insufficient to pay the benefits payable by the government, or if there is no pension fund, the benefits are paid by the general fund of the Consolidated Revenue Fund. This situation does not apply to the PPUQ.
Université du Québec programs
L’Université du Québec and its constituent universities offer their employees certain lump-sum payments upon early retirement as well as a retiree group insurance plan. These programs give rise to long-term obligations, the costs of which are borne in whole or in part by the government.
| CONSOLIDATED FINANCIAL STATEMENTS | 145 |
16. Assets and liabilities regarding pension plans and other employee future benefits (cont’d)
Characteristics of the benefit plans and the other employee future benefits
| Types of plans and programs | ||||||||||||
| Expected average | ||||||||||||
| Presence of | remaining service | |||||||||||
| Benefit plans and other | Cost- | Cost- | a specific | life (EARSL) | ||||||||
| employee future benefits | sharing(1) | balance | fund | (in years)(2) | ||||||||
| RREGOP(3) | 15 | |||||||||||
| – regular service(4) | ✓ 50.0% | (5) | ||||||||||
| – service transferred from the TPP and the CSSP | ✓ | |||||||||||
| – pension credits acquired following plan-to-plan transfers | ✓ | ✓ | ||||||||||
| PPMP | 11 | |||||||||||
| – regular service - excluding pensioners’ benefits prior to January 1, 2015(4) | ✓ 50.0% | (5) | ||||||||||
| – regular service - pensioners’ benefits prior to January 1, 2015 | ✓ | (6) | ||||||||||
| – service transferred from the TPP and the CSSP | ✓ | |||||||||||
| – RPSO | ✓ | |||||||||||
| TPP(3) | ✓ | 15 | ||||||||||
| PPCT(3) | ✓ | 15 | ||||||||||
| CSSP(3) | ✓ | 15 | ||||||||||
| PPUQ | ✓ | ✓ | 11 | |||||||||
| SPMSQ | 15 | |||||||||||
| – regular service since January 1, 2007 | ✓50.0% | (7) | ✓ | (8) | ||||||||
| – regular service prior to January 1, 2007 | ✓ | |||||||||||
| PPPOCS | ✓54.0% | (9) | 15 | |||||||||
| PPCJQ | ✓ | 11 | ||||||||||
| PPFEQ | ✓ | ✓ | 3 | |||||||||
| PPMNA | ✓ | 6 | ||||||||||
| Université du Québec programs | ✓ 50.0% | ✓ | 14 | |||||||||
| (1) | The percentage indicated represents the portion of obligations relating to accrued benefits payable by the government. |
| (2) | The EARSL is used to determine the amortization period for the plan’s actuarial gains and losses. |
| (3) | A common EARSL is used for this group of plans whose continuity is ensured by the Government and Public Employees Retirement Plan (RREGOP). |
| (4) | Contributions paid by employers required to pay contributions are deposited in a transitional fund. This fund is liquidated regularly because the sums deposited in it are used to pay benefits. |
| (5) | The government’s portion is 58.3% in the case of benefits accrued prior to July 1, 1982. |
| (6) | In accordance with the Act to foster the financial health and sustainability of the Pension Plan of Management Personnel and to amend various legislative provisions (S.Q. 2017, chapter 7), the government covers the portion of benefits payable by participants to pensioners who retired before January 1, 2015 or to their assigns. In exchange, a share of the value of the contribution fund of PPMP participants was deposited to the RPSF. |
| (7) | The government’s portion is 50.0% in the case of benefits accrued since January 1, 2022, 55.0% in the case of benefits accrued between January 1, 2021 and January 1, 2022, 61.0% in the case of benefits accrued between January 1, 2020 and January 1st, 2021 and 66.7% in the case of benefits accrued before January 1st, 2020. |
| (8) | Every three years at the latest, the government must pay its contributions into the fund, as determined by the actuarial valuation realized for that purpose. |
| (9) | The government’s portion is 46.0% in the case of benefits accrued prior to January 1, 2013. |
| 146 | PUBLIC ACCOUNTS 2022-2023 |
16. Assets and liabilities regarding pension plans and other employee future benefits (cont’d)
Liabilities regarding the pension plans and other employee future benefits
(millions of dollars)
| As at March 31 | ||||||||||||||||
Value before actuarial (losses) gains | Unamortized actuarial (losses) gains |
2023 |
2022 | |||||||||||||
| Obligations relating to accrued benefits | ||||||||||||||||
| RREGOP | ||||||||||||||||
| – regular service | 77 807 | (3 522 | ) | 74 285 | 70 540 | |||||||||||
| – transferred service | 2 413 | (222 | ) | 2 191 | 2 258 | |||||||||||
| PPMP | ||||||||||||||||
| – regular service | 18 912 | (270 | ) | 18 642 | 18 116 | |||||||||||
| – transferred service | 979 | (83 | ) | 896 | 915 | |||||||||||
| – RPSO | 2 399 | (132 | ) | 2 267 | 2 142 | |||||||||||
| TPP | 8 407 | (820 | ) | 7 587 | 7 894 | |||||||||||
| PPCT | 952 | (152 | ) | 800 | 842 | |||||||||||
| CSSP | 2 658 | (230 | ) | 2 428 | 2 556 | |||||||||||
| PPUQ | 4 723 | 97 | 4 820 | 4 613 | ||||||||||||
| SPMSQ | 5 498 | (590 | ) | 4 908 | 4 775 | |||||||||||
| PPPOCS | 694 | (37 | ) | 657 | 618 | |||||||||||
| PPCJQ | 996 | (73 | ) | 923 | 872 | |||||||||||
| PPFEQ | 219 | (14 | ) | 205 | 196 | |||||||||||
| PPMNA | 251 | (15 | ) | 236 | 232 | |||||||||||
| 126 908 | (6 063 | ) | 120 845 | 116 569 | ||||||||||||
| Less: | ||||||||||||||||
| Retirement Plans Sinking Fund | 110 948 | 3 889 | 107 059 | 100 374 | ||||||||||||
| Specific pension plan funds | ||||||||||||||||
PPUQ fund | 5 499 | 136 | 5 363 | 5 044 | ||||||||||||
| SPMSQ fund | 1 258 | 47 | 1 211 | 1 166 | ||||||||||||
| Other pension plan funds | 926 | 13 | 913 | 910 | ||||||||||||
| Valluation allowance – PPUQ | (561 | ) | (561 | ) | (449 | ) | ||||||||||
| Valluation allowance – other funds | (82 | ) | (82 | ) | (82 | ) | ||||||||||
| 7 040 | 196 | 6 844 | 6 589 | |||||||||||||
| 8 920 | (1 978 | ) | 6 942 | 9 606 | ||||||||||||
| Université du Québec programs | ||||||||||||||||
Obligations relating to accrued benefits | 271 | 24 | 295 | 282 | ||||||||||||
| 9 191 | (1 954 | ) | 7 237 | 9 888 | ||||||||||||
| CONSOLIDATED FINANCIAL STATEMENTS | 147 |
16. Assets and liabilities regarding pension plans and other employee future benefits (cont’d)
Change in obligations relating to accrued pension plan benefits and other employee future benefits
(millions of dollars)
| Fiscal year ended March 31 | ||||||||||||||||
| 2023 | 2022 | |||||||||||||||
| Pension plans | Université du Québec programs | Pension plans | Université du Québec programs | |||||||||||||
| Obligations, beginning of year | 121 942 | 294 | 116 681 | 292 | ||||||||||||
| Cost of accrued benefits | 3 267 | 21 | 2 953 | 20 | ||||||||||||
| Interest on obligations | 7 572 | 10 | 7 252 | 10 | ||||||||||||
| Compensations(1) | 96 | 146 | ||||||||||||||
| Benefits paid | (7 437 | ) | (23 | ) | (7 178 | ) | (26 | ) | ||||||||
| Plan-to-plan transfers | 33 | (8 | ) | |||||||||||||
| Changes to plans | 7 | (77 | ) | |||||||||||||
| Actuarial losses (gains) | 1 424 | (31 | ) | 2 163 | (2 | ) | ||||||||||
| Change in obligations relating to certain pension credits(2) | 4 | 10 | ||||||||||||||
| Obligations, end of year | 126 908 | 271 | 121 942 | 294 | ||||||||||||
| (1) | The government pays an annual amount of compensation into the funds of contributions by RREGOP and PPMP participants in order to finance those plans and limit contribution increases for the participants. For the PPMP, the annual compensation paid up until December 31, 2022, based on services rendered during the fiscal year, must be enough to offset the fund’s loss due to the transfer of RREGOP participants, and is capped at $100 M. |
| (2) | The government’s obligations regarding certain pension credits acquired following the transfer of supplemental pension plans to RREGOP correspond to the actuarial value of these acquired pension credits or to the actuarial value of the fund created to provide for their payment, whichever is higher. |
| 148 | PUBLIC ACCOUNTS 2022-2023 |
16. Assets and liabilities regarding pension plans and other employee future benefits (cont’d)
Actuarial valuations
Every three years, the value of obligations relating to accrued benefits of the pension plans and the Université du Québec programs is determined by actuarial valuations. The value of these obligations is extrapolated for the period between two actuarial valuations.
Date of the most recent actuarial valuations used to determine the value of obligations related to vested benefits
| December 31, 2022 | December 31, 2021 | December 31, 2020 | December 31, 2019 | |||||
| (filed in 2022-2023) | (filed in 2022-2023) | (filed in 2021-2022) | (filed in 2020-2021) | |||||
PPUQ | RREGOP | RREGOP | RPSO | |||||
| Université du Québec programs | – | pension credits related to plan-to-plan transfers | – | regular service | PPPOCS | |||
| – | redemption of years of service | – | service transferred from the CSSP and the TPP | PPCJQ PPFEQ | ||||
| PPCT | PPMP | PPMNA | ||||||
| SPMSQ | – | regular service(1) | ||||||
| – | service transferred from the CSSP and the TPP | |||||||
| TPP | ||||||||
| CSSP | ||||||||
| Note: | The filing year corresponds to the government fiscal year for which an actuarial valuation of the plan is required, based on the timetable for preparing the valuation. |
| (1) | PPMP regular service is divided into two categories, as shown previously in the table entitled “Characteristics of the benefit plans and the other employee future benefits”. |
Main economic assumptions used
(percent)
Plans administered by | PPUQ | Université | ||||||||||
2023 and | 2023 and | 2023 and | ||||||||||
| Rate of return, net of inflation | 4.35 | 4.50 | ― | |||||||||
| Inflation rate | 2.00 | 2.00 | 2.00 | |||||||||
| Discount rate for obligations relating to accrued benefits | 6.35 | 6.50 | 3.60 | |||||||||
| Salary growth rate, net of inflation | 0.50 | 0.50 | 0.50 | |||||||||
| CONSOLIDATED FINANCIAL STATEMENTS | 149 |
16. Assets and liabilities regarding pension plans and other employee future benefits (cont’d)
Impact of a change in the main assumptions on the value of obligations relating to accrued benefits under the main pension plans
| Assumptions | Change | Impact on the value of obligations as at March 31, 2022 | |||
| (millions of dollars) | (percent) | ||||
| Economic | |||||
| – Rate of return, net of inflation | - Increase of 0.05% | (710) | - 0.64 | ||
| - Decrease of 0.05% | 710 | + 0.64 | |||
| – Inflation rate | - Increase of 0.25% | (1 550) | - 1.41 | ||
| - Decrease of 0.25% | 1 650 | + 1.50 | |||
| – Salary growth rate, net of inflation | - Increase of 0.25% | 610 | + 0.55 | ||
| - Decrease of 0.25% | (590) | - 0.54 | |||
| Demographic | |||||
| – Life expectancy(1) | - Increase of 0.5 year | 820 | + 0.74 | ||
| - Decrease of 0.5 year | (830) | - 0.75 | |||
| Note: | The main pension plans are the RREGOP – regular service, the PPMP – regular service, the Teachers Pension Plan (TPP) and the Superannuation Plan for the Members of the Sûreté du Québec (SPMSQ). |
| (1) | According to current RREGOP assumptions, the life expectancy of recipients aged 60 is 26.7 years for men and 29.7 years for women. |
RPSF investment policy as at March 31 of the current year
The sums deposited in the RPSF are entrusted to the Caisse. The Caisse manages these sums according to the investment policy set by the Minister of Finance. This policy provides for investments in a diversified portfolio that includes fixed income securities (for example, bonds), inflation-sensitive investments (for example, actual assets such as real estate assets and infrastructure) and equity.
RPSF portfolio
(percent)
| As at March 31 | ||||||||
| 2023 | 2022 | |||||||
| Fixed-income securities | 33.00 | 34.00 | ||||||
| Actual assets | 23.50 | 22.50 | ||||||
| Equity | 43.50 | 43.50 | ||||||
| 100.00 | 100.00 | |||||||
| 150 | PUBLIC ACCOUNTS 2022-2023 |
16. Assets and liabilities regarding pension plans and other employee future benefits (cont’d)
Change in the adjusted market value of the RPSF and specific pension plan funds
(millions of dollars)
| Fiscal year ended March 31 | ||||||||||||||||||||||||
| 2023 | 2022 | |||||||||||||||||||||||
| RPSF | PPUQ fund | SPMSQ fund | Other pension plan funds | Total | Total | |||||||||||||||||||
| Adjusted market value, beginning of year | 104 450 | 5 208 | 1 219 | 932 | 111 809 | 104 194 | ||||||||||||||||||
| Anticipated investment income | 6 632 | (1) | 328 | 76 | 25 | 7 061 | 6 577 | |||||||||||||||||
| Deposit from the general fund of the Consolidated Revenue Fund |
— | 227 | ||||||||||||||||||||||
| Contributions paid(2) | 173 | 304 | 477 | 439 | ||||||||||||||||||||
| Benefits paid | (201 | ) | (36 | ) | (334 | ) | (571 | ) | (541 | ) | ||||||||||||||
| Actuarial (losses) gains | (134 | ) | (9 | ) | (1 | ) | (5 | ) | (149 | ) | 903 | |||||||||||||
| Change in the value of assets relating to certain pension credits(3) | 4 | 4 | 10 | |||||||||||||||||||||
| Adjusted market value, end of year(4) | 110 948 | 5 499 | 1 258 | 926 | 118 631 | 111 809 | ||||||||||||||||||
| (1) | The forecast return on the RPSF was 6.35% (6.35% in 2021-2022); the realized return, based on the market value of investments, was 2.57% (9.14% in 2021-2022). |
| (2) | This item included $231 M ($212 M in 2021-2022) in contributions from participants, government enterprises and organizations not included in the government’s reporting entity. |
| (3) | The government’s obligations regarding certain pension credits acquired following the transfer of supplemental pension plans to RREGOP correspond to the actuarial value of these acquired pension credits or to the actuarial value of the fund created to provide for their payment, whichever is higher. |
| (4) | The market value of the RPSF and the specific pension plan funds totalled $119 087 M ($116 294 M as at March 31, 2022). More precisely, the respective market values of the RPSF, the PPUQ fund, the SPMSQ fund and other specific pension funds were $111 400 M, $5 521 M, $1 260 M and $906 M, respectively ($108 608 M, $5 472 M, $1 255 M and $959 M, respectively, as at March 31, 2022). |
| CONSOLIDATED FINANCIAL STATEMENTS | 151 |
16. Assets and liabilities regarding pension plans and other employee future benefits (cont’d)
Accrued benefits expense relating to pension plans and other employee future benefits
(millions of dollars)
| Fiscal year ended March 31 | ||||||||||||||||||||||||
| 2023 | 2022 | |||||||||||||||||||||||
Pension | Université du Québec |
Pension | Université du Québec | |||||||||||||||||||||
| plans | programs | Total | plans | programs | Total | |||||||||||||||||||
| Cost of accrued benefits | 3 267 | 21 | 3 288 | 2 953 | 20 | 2 973 | ||||||||||||||||||
| Compensations(1) | 96 | 96 | 146 | 146 | ||||||||||||||||||||
| Contributions from participants and employers | (231 | ) | (231 | ) | (212 | ) | (212 | ) | ||||||||||||||||
| 3 132 | 21 | 3 153 | 2 887 | 20 | 2 907 | |||||||||||||||||||
| Changes to plans | 7 | 7 | (77 | ) | (77 | ) | ||||||||||||||||||
| Amortization of actuarial losses | 734 | 5 | 739 | 610 | 5 | 615 | ||||||||||||||||||
| Change in valuation allowances | 112 | 112 | 115 | 115 | ||||||||||||||||||||
| 3 985 | 26 | 4 011 | 3 535 | 25 | 3 560 | |||||||||||||||||||
| (1) | Information on compensations is presented previously in the notes under the table “Change in obligations relating to accrued pension plan benefits and other employee future benefits”. |
Debt service expense relating to pension plans and other employee future benefits
(millions of dollars)
| Fiscal year ended March 31 | ||||||||||||||||||||||||
| 2023 | 2022 | |||||||||||||||||||||||
Pension | Université du Québec |
Pension | Université du Québec | |||||||||||||||||||||
| plans | programs | Total | plans | programs | Total | |||||||||||||||||||
| Interest on obligations relating to accrued benefits | 7 572 | 10 | 7 582 | 7 252 | 10 | 7 262 | ||||||||||||||||||
| Investment income of the funds | (7 142 | ) | (7 142 | ) | (6 639 | ) | (6 639 | ) | ||||||||||||||||
| 430 | 10 | 440 | 613 | 10 | 623 | |||||||||||||||||||
| 152 | PUBLIC ACCOUNTS 2022-2023 |
▌ 17. Assets and liabilities related to derivative financial instruments
The government uses derivative financial instruments to manage the financial risks associated with its financial assets and liabilities. Derivative financial instruments such as currency swap contracts and foreign exchange forward contracts are used to manage the foreign exchange risk associated with the repayment of interest and principal on foreign currency debts and the related cash management, as well as for other operations carried out in foreign currencies.
Interest rate swap contracts are used to modify exposure to interest rate risk on long-term financial instruments to meet the target breakdown of fixed-rate and variable-rate debt set by the government in its risk management strategies.
| Significant accounting policies |
Derivative financial instruments are recognized at fair value. Sums receivable from (payable to) counterparties are recognized at cost or amortized cost.
The government elects to recognize directly in income foreign exchange gains and losses on sums receivable from (payable to) counterparties and on foreign exchange forward contracts to cover these amounts, as well as on foreign currency operations.
|
| Measurement uncertainty |
| Derivative financial instruments are subject to measurement uncertainty due to the use of assumptions in measuring their fair value. The measurement methods used for these instruments are presented below. |
Measurement method for derivative financial instruments
The fair value of these financial instruments is based on Level 2 of the fair value hierarchy, which means that the fair value is calculated using valuation techniques whose significant inputs are observable, either directly or indirectly.
Interest rate swaps and currency swaps are valued by converting future cash flows to present value at the current exchange rates. Variable future cash flows are determined on the basis of forward interest rate structures.
Foreign exchange forward contracts are valued by converting future cash flows to present value at the current exchange rate.
These valuations require the development and use of assumptions that take into account observable inputs such as interest rate curves, yield curves as well as foreign exchange rates. The valuation method for certain swaps and other derivatives may take into account additional observable data, such as underlying prices and volatility.
| CONSOLIDATED FINANCIAL STATEMENTS | 153 |
17. Assets and liabilities related to derivative financial instruments (cont’d)
Details of assets and liabilities related to derivative financial instruments
(millions of dollars)
| As at March 31 | ||||||||||
| 2023 | 2022 | |||||||||
| ASSETS RELATED TO DERIVATIVE FINANCIAL INSTRUMENTS | ||||||||||
| Recorded at cost or amortized cost | ||||||||||
| Sums receivable from counterparties | 5 043 | 3 570 | ||||||||
| Recorded at fair value(1) | ||||||||||
| Currency swap contracts | 2 971 | 1 461 | ||||||||
| Interest rate swap contracts | 2 817 | 368 | ||||||||
| Other | 378 | 19 | ||||||||
| 6 166 | 1 848 | |||||||||
| Sub-total | 11 209 | 5 418 | ||||||||
| Deferred foreign exchange gains | (126 | ) | ||||||||
| 11 209 | 5 292 | |||||||||
| LIABILITIES RELATED TO DERIVATIVE FINANCIAL INSTRUMENTS | ||||||||||
| Recorded at cost or amortized cost | ||||||||||
| Sums payable to counterparties | 1 446 | 384 | ||||||||
| Recorded at fair value(1) | ||||||||||
| Currency swap contracts | 2 843 | 3 444 | ||||||||
| Interest rate swap contracts | 6 043 | |||||||||
| Other | 352 | 3 | ||||||||
| 9 238 | 3 447 | |||||||||
| Sub-total | 10 684 | 3 831 | ||||||||
| Deferred foreign exchange losses | (2 557 | ) | ||||||||
| 10 684 | 1 274 | |||||||||
| (1) | As at March 31, 2022, these financial derivative financial instruments were recognized at cost (Note 3). |
| 154 | PUBLIC ACCOUNTS 2022-2023 |
17. Assets and liabilities related to derivative financial instruments (cont’d)
Credit and liquidity risks management
As part of credit risk management for transactions involving derivative financial instruments, the government has adopted a credit risk management policy that limits potential counterparty losses. In accordance with this policy, the government uses over-the-counter derivative financial instruments only with counterparties with which it has concluded framework agreements.
Under framework agreements, a credit support is provided when the fair value of the derivative financial instruments traded exceeds a certain threshold. The excess can then be covered through short-term securities or cash and recognized as sums receivable from (payable to) counterparties. This credit support helps limit the government’s liquidity risk, in addition to its credit risk, with respect to derivative financial instruments transactions. In addition, for certain derivative financial instruments, the government exchanges guarantees with its counterparties.
The government deals with major financial institutions that receive credit ratings from at least two credit rating agencies, one of which must be Standard & Poor’s or Moody’s. When a transaction agreement comes into effect, the institution must have a rating of A or higher from at least one of these agencies. As at March 31, 2023 and 2022, 100% of the transactions in effect met this criterion.
Currency risk management
Certain sums receivable from (payable to) counterparties are denominated in foreign currencies. To limit the currency risk associated with these sums, the government uses foreign exchange forward contracts.
| CONSOLIDATED FINANCIAL STATEMENTS | 155 |
| Significant accounting policies |
Debts
Debts are recognized at amortized cost using the effective interest method.
Sinking funds relating to borrowings
Financial instruments included in sinking funds relating to borrowings are recognized at cost or amortized cost using the effective interest method.
Moreover, the government conducts purchases and sales of securities, such as Treasury bills and bonds, which it agrees to resell or repurchase from a counterparty at a future date. These transactions are reverse repurchase agreements or repurchase agreements. The government disburses or receives an amount upon conclusion of these transactions.
Securities purchased under reverse repurchase agreements
Under these operations, the counterparty retains the risks and benefits associated with the securities. An amount receivable is recognized under “Securities purchased under reverse repurchase agreements” when the amount is disbursed. Moreover, the government can sell these securities, but must purchase them on terms similar to those sold, in order to deliver them to the counterparty at the time stipulated in the reverse repurchase agreement. In this case, the obligation to deliver securities with similar conditions is recognized in liabilities under “Obligations to deliver securities” until the securities are effectively delivered to the counterparty.
Securities sold under repurchase agreements
Securities sold remain recorded in the consolidated statement of financial position, as the government retains the risks and benefits associated with these securities. An amount receivable is recognized under “Securities sold under repurchase agreements” when the amount is cashed.
|
| 156 | PUBLIC ACCOUNTS 2022-2023 |
18. Debts (cont’d)
Debts by category
(millions of dollars)
| As at March 31 | ||||||||||||||||||||||||
| 2023 | 2022 | |||||||||||||||||||||||
| Equivalent in Canadian dollars | ||||||||||||||||||||||||
| Canadian dollars | US dollars | Euros | Other currencies (1) | Total | Total | |||||||||||||||||||
| Debts contracted on financial markets | ||||||||||||||||||||||||
| Bonds and notes (2),(3) | 185 066 | 25 609 | 29 418 | 5 830 | 245 923 | 235 628 | ||||||||||||||||||
| Savings products(3) | 13 645 | 13 645 | 12 388 | |||||||||||||||||||||
| Treasury bills(2) | 6 439 | 6 439 | 4 491 | |||||||||||||||||||||
| Short-term borrowings(4) | 619 | 1 836 | 2 455 | 1 007 | ||||||||||||||||||||
| Mortgage loans | 43 | 43 | 40 | |||||||||||||||||||||
| 205 812 | 27 445 | 29 418 | 5 830 | 268 505 | 253 554 | |||||||||||||||||||
| Less: | ||||||||||||||||||||||||
| Debts whose securities are held in treasury | ||||||||||||||||||||||||
| Bonds and notes | 13 397 | 2 176 | 15 573 | 20 569 | ||||||||||||||||||||
| Short-term borrowings | — | 218 | ||||||||||||||||||||||
| Treasury bills | — | 54 | ||||||||||||||||||||||
| 13 397 | 2 176 | — | — | 15 573 | 20 841 | |||||||||||||||||||
| Sub-total | 192 415 | 25 269 | 29 418 | 5 830 | 252 932 | 232 713 | ||||||||||||||||||
| Debts arising from agreements and contracts | ||||||||||||||||||||||||
| Private-public partnership agreements | 3 682 | 3 682 | 3 775 | |||||||||||||||||||||
| Capital leases | 497 | 497 | 316 | |||||||||||||||||||||
| 4 179 | — | — | — | 4 179 | 4 091 | |||||||||||||||||||
| Sub-total | 196 594 | 25 269 | 29 418 | 5 830 | 257 111 | 236 804 | ||||||||||||||||||
| Deferred foreign exchange gains | — | 2 733 | ||||||||||||||||||||||
| Total debts | 196 594 | 25 269 | 29 418 | 5 830 | 257 111 | 239 537 | ||||||||||||||||||
| (1) | Other currencies included the Australian dollar, the pound sterling, the Swiss franc, the yen, the Swedish krona and the New Zealand dollar. |
| (2) | The Government held $801 M ($746 M as at March 31, 2022) of its own securities through its investments in government enterprises. |
| (3) | These categories included securities issued with a book value of $4 212 M ($2 877 M as at March 31, 2022), the proceeds of which are allocated to specific projects with environmental benefits. |
| (4) | Short-term borrowings are mainly comprised of bank loans and short-term notes. |
| CONSOLIDATED FINANCIAL STATEMENTS | 157 |
18 Debts (cont’d)
Debts arising from private-public partnership agreements and capital leases
(millions of dollars)
| As at March 31 | ||||||||
| 2023 | 2022 | |||||||
| Equivalent in Canadian dollars | ||||||||
| Private-public partnership agreements(1) | ||||||||
| Hospital centres and residential and long-term care centres | 2 547 | 2 605 | ||||||
| Road transportation infrastructure | 1 001 | 1 030 | ||||||
| Other | 134 | 140 | ||||||
| 3 682 | 3 775 | |||||||
| Capital leases | 497 | 316 | ||||||
| 4 179 | 4 091 | |||||||
| (1) | Private-public partnership agreements are contracts that provide for the design, construction, financing and maintenance of fixed assets by a private partner and, in some cases, for the operation of those assets by the partner. The debts related to these private-public partnership agreements have a term of 25 to 39 years. |
Weighted average rate of debts
(percent)
| As at March 31 | ||||||||
| 2023 | 2022 | |||||||
| Rate by currency – before consideration of assets and liabilities related to derivative financial instruments | ||||||||
| Debts contracted on financial markets | ||||||||
| In Canadian dollars | 3.49 | 3.29 | ||||||
| In US dollars | 3.40 | 3.24 | ||||||
| In euros | 1.06 | 0.78 | ||||||
| Other currencies(1) | 2.11 | 1.88 | ||||||
| Debts arising from agreements and contracts | ||||||||
| In Canadian dollars | 4.71 | 4.74 | ||||||
| Weighted average government rate – after consideration of assets and liabilities related to derivative financial instruments | 3.67 | 3.06 | ||||||
| Note: | Weighted average rates for debt contracted on financial markets are determined on the basis of effective interest rates prevailing at March 31. |
| (1) | Other currencies included the Australian dollar, the pound sterling, the Swiss franc, the yen, the Swedish krona and the New Zealand dollar. |
| 158 | PUBLIC ACCOUNTS 2022-2023 |
18 Debts (cont’d)
Debt repayment schedule
(millions of dollars)
| Equivalent in Canadian dollars | ||||||||||||
Maturing on March 31 | Debts contracted on | Debts arising from | Total | |||||||||
| 2024 | 26 317 | 111 | 26 428 | |||||||||
| 2025 | 21 416 | 115 | 21 531 | |||||||||
| 2026 | 19 871 | 120 | 19 991 | |||||||||
| 2027 | 17 835 | 125 | 17 960 | |||||||||
| 2028 | 12 539 | 137 | 12 676 | |||||||||
| 97 978 | 608 | 98 586 | ||||||||||
| 2029-2033 | 78 332 | 750 | 79 082 | |||||||||
| 2034-2038 | 9 443 | 880 | 10 323 | |||||||||
| 2039-2043 | 15 291 | 1 032 | 16 323 | |||||||||
| 2044-2048 | 18 001 | 592 | 18 593 | |||||||||
| 2049 and thereafter | 46 759 | 317 | 47 076 | |||||||||
| Less: | 265 804 | 4 179 | 269 983 | |||||||||
| Debts whose securities are held in treasury | 15 464 | 15 464 | ||||||||||
| 250 340 | (2) | 4 179 | 254 519 | |||||||||
| (1) | This schedule provides for repayments of $2 078 M in 2024, $481 M in 2025, $348 M in 2026, $249 M in 2027, $199 M in 2028 and $541 M for the years 2029-2033 in respect of demand redeemable savings products of $3 896 M. |
| (2) | The repayment schedule for debts contracted on the financial markets is based on the nominal value of the debts stipulated in the contracts. This basis differs from the book value of debts, which, for the purposes of calculating the effective interest rate, takes into account transaction costs, and discounts and premiums with a net effect of $2 592 M. |
| CONSOLIDATED FINANCIAL STATEMENTS | 159 |
18. Debts (cont’d)
Risks management relating to debts
In order to meet its financial requirements arising from its operations and investment activities as well as those related to the repayment of borrowings that are maturing, the government has provided itself with an annual financing and debt-management program based on Canadian and international financial markets.
Participation in these markets exposes the government to liquidity risk, interest rate risk and currency risk. Therefore, the government devises risk-management strategies using the different derivative financial instruments at its disposal. Risk management is carried out on debts contracted on the markets, including debts whose securities are held in treasury.
Liquidity risk
In order to limit the liquidity risk, the government has, among other things, lines of credit notably in the general fund of the Consolidated Revenue Fund totalling CAN$1 165 million with various Canadian banking institutions. As at March 31, 2023, the balance of these lines was nil ($3 million as at March 31, 2022).
The government also has a credit agreement totalling US$3 250 million with a Canadian and international banking syndicate. To date, no transactions have been carried out under this credit agreement.
In addition, the government maintains prudential liquid assets in the sinking fund for government borrowings, invested mainly in highly liquid securities of the federal government. In the event of major disruptions in financial markets, these securities can be sold and the liquid assets recovered rapidly, thus enabling the government to honour its financial commitments. As at March 31, 2023, the book value of prudential liquid assets was CAN$13 171 million (CAN$13 215 million as at March 31, 2022).
Currency risk
To manage the currency risk, the government mainly uses derivative financial instruments aimed at exchanging cash flows from one currency to another, such as currency swap contracts and foreign exchange forward contracts. As a complementary measure to the use of derivative financial instruments, the government also acquires assets denominated in foreign currencies within its sinking funds relating to borrowings.
| 160 | PUBLIC ACCOUNTS 2022-2023 |
18. Debts (cont’d)
After taking into account the effect of the derivative financial instruments used to manage currency risk and assets in foreign currency held in sinking funds relating to borrowings, the net exposure of foreign currency debts contracted on the markets was negligible at March 31, 2023 compared with the nominal value of the debts. It amounts to $143 million, as shown in the table below:
Net exposure after currency risk management on debt in foreign currencies contracted on financial markets
(millions of dollars)
| Equivalent in Canadian dollars | ||||||||||||||||||||
| Foreign exchange risk management | ||||||||||||||||||||
| Debts (nominal value) | Derivative financial instruments (nominal value) | Sinking funds relating to borrowings | Sub-total | Net exposure | ||||||||||||||||
| In US dollars | 27 504 | (25 416 | ) | (2 047 | ) | (27 463 | ) | 41 | ||||||||||||
| In euros | 29 531 | (27 949 | ) | (1 480 | ) | (29 429 | ) | 102 | ||||||||||||
| Other currencies | 5 829 | (5 829 | ) | (5 829 | ) | — | ||||||||||||||
| 62 864 | (59 194 | ) | (3 527 | ) | (62 721 | ) | 143 | |||||||||||||
Interest rate risk
To manage its exposure to interest rate risk, the government uses interest rate swap contracts or other types of derivative financial instruments. Interest rate swap contracts make it possible to exchange payments of interest at variable rates for payments of interest at fixed rates, or vice versa, on the basis of a reference par value.
After taking into account derivative financial instruments used to manage interest rate risk and sinking funds relating to borrowings, debt contracted on financial markets consisted of 83% fixed-rate debt and 17% variable-rate debt as at March 31, 2023 (82% at fixed interest rates and 18% at variable interest rates as at March 31, 2022). Fixed-rate debt is debt that will not mature or change interest rate during the next fiscal year.
Sinking funds relating to borrowings
Payments to sinking funds relating to borrowings arise from commitments made by the government to repay its debts. These funds are attached to $106 484 million of debt ($99 266 million as at March 31, 2022).
| CONSOLIDATED FINANCIAL STATEMENTS | 161 |
18. Debts (cont’d)
Balance of sinking funds relating to borrowings
(millions of dollars)
| As at March 31 | ||||||||
| 2023 | 2022 | |||||||
| Equivalent in Canadian dollars | ||||||||
| Assets | ||||||||
| Investments(1) | ||||||||
| Treasury bills | 9 172 | 6 871 | ||||||
| Bonds and notes(2),(3) | 9 419 | 11 785 | ||||||
| Other | 8 | |||||||
| 18 591 | 18 664 | |||||||
| Securities purchased under reverse repurchase agreements | 7 407 | 8 478 | ||||||
| Accrued interest and other assets(2) | 59 | 202 | ||||||
| 26 057 | 27 344 | |||||||
| Liabilities | ||||||||
| Securities sold under repurchase agreements | 5 121 | 6 401 | ||||||
| Obligations to deliver securities | 2 623 | 2 588 | ||||||
| Other | 64 | |||||||
| 7 808 | 8 989 | |||||||
| Funds balance | 18 249 | 18 355 | ||||||
| (1) | As at March 31, 2023, the price of securities quoted in an active market was $18 351 M and their book value was $18 591 M. |
| (2) | The government also held $13 358 M ($13 831 M as at March 31, 2022) of its own securities in bonds and notes and $128 M ($99 M as at March 31, 2022) in accrued interest on these securities. These items are offset against the corresponding debts. |
| (3) | As part of its operations related to risk management, the government gives as security financial securities. The government has given investment securities whose book value was $217 M ($51 M as at March 31, 2022). |
| 162 | PUBLIC ACCOUNTS 2022-2023 |
18. Debts (cont’d)
Change in the balance of sinking funds relating to borrowings
(millions of dollars)
| Fiscal year ended March 31 | ||||||||
| 2023 | 2022 | |||||||
| Equivalent in Canadian dollars | ||||||||
| Opening balance already established before offsetting securities held in treasury | 32 285 | 31 057 | ||||||
| Accounting change (Note 3) | (151 | ) | ||||||
| Adjusted opening balance before offsetting securities held in treasury | 32 134 | 31 057 | ||||||
| Payments from the general fund of the Consolidated Revenue Fund and from other entities included in the government’s reporting entity | 3 586 | 3 901 | ||||||
| Net losses on investment | (637 | ) | (173 | ) | ||||
| Net remeasurement gains | 243 | |||||||
| 35 326 | 34 785 | |||||||
| Sums used to repay debts | (3 591 | ) | (2 500 | ) | ||||
| Balance before offsetting securities held in treasury | 31 735 | 32 285 | ||||||
| Less: | ||||||||
| Securities held in treasury | 13 486 | 13 930 | ||||||
| Closing balance | 18 249 | 18 355 | ||||||
Risks management of sinking funds relating to borrowings
Risk management is carried out on assets and liabilities held in sinking funds relating to borrowings, including those whose securities are held in treasury.
| CONSOLIDATED FINANCIAL STATEMENTS | 163 |
18. Debts (cont’d)
Credit and liquidity risks
The credit risk associated with investments held in sinking funds relating to borrowings is limited, due to compliance with the management framework that limits the risks associated with government investments. This framework includes criteria such as the minimum credit rating required for the selection of authorized issuers, which are mainly financial institutions and governments.
The credit and liquidity risks associated with reverse repurchase and repurchase agreement transactions are low, since the government has adopted a management policy specific to these financial instruments, which enables it to limit potential losses. Under this policy, agreements are signed with counterparties, providing for the exchange of guarantees based on the net position related to these transactions.
After taking into account derivative financial instruments held for currency risk management purposes and assets held in sinking funds, the debt repayment schedule is as follows:
Debt repayment schedule after effect of derivative financial instruments and amounts accumulated in sinking funds relating to borrowings
(millions of dollars)
| Equivalent in Canadian dollars | ||||||||||||||||||||||||||||
| Debts contracted on financial markets after taking into account derivative financial instruments (nominal value) | ||||||||||||||||||||||||||||
| Maturing on March 31 | Canadian dollars | US dollars | Euros | Other currencies | Sub-total | Sinking funds relating to borrowings | Total | |||||||||||||||||||||
| 2024 | 24 512 | 84 | 1 465 | 26 061 | (5 188 | ) | 20 873 | |||||||||||||||||||||
| 2025 | 20 943 | 20 943 | (6 205 | ) | 14 738 | |||||||||||||||||||||||
| 2026 | 19 610 | 377 | 19 987 | (3 034 | ) | 16 953 | ||||||||||||||||||||||
| 2027 | 17 138 | 303 | 17 441 | (3 152 | ) | 14 289 | ||||||||||||||||||||||
| 2028 | 12 424 | 138 | 12 562 | (1 355 | ) | 11 207 | ||||||||||||||||||||||
| 94 627 | 902 | 1 465 | – | 96 994 | (18 934 | ) | 78 060 | |||||||||||||||||||||
| 2029-2033 | 76 681 | 1 186 | 77 | 77 944 | (9 483 | ) | 68 461 | |||||||||||||||||||||
| 2034-2038 | 9 337 | 40 | 9 377 | – | 9 377 | |||||||||||||||||||||||
| 2039-2043 | 15 291 | 15 291 | (562 | ) | 14 729 | |||||||||||||||||||||||
| 2044-2048 | 18 002 | 18 002 | (1 399 | ) | 16 603 | |||||||||||||||||||||||
| 2049 and thereafter | 46 759 | 46 759 | (1 357 | ) | 45 402 | |||||||||||||||||||||||
| 260 697 | 2 088 | 1 582 | – | 264 367 | (1) | (31 735 | ) | 232 632 | ||||||||||||||||||||
| (1) | The repayment schedule for debt contracted on financial markets is based on the nominal value of the debt provided for in the contracts, and takes into account the effect of derivative financial instruments. This basis differs from the book value of $268 505 M, as transaction costs, discounts and premiums of $2 701 M are not included in the nominal value, while the net effect of downward derivative financial instruments of $1 437 M is not included in the book value. |
| 164 | PUBLIC ACCOUNTS 2022-2023 |
| Significant accounting policies |
Fixed assets
Fixed assets are recognized at cost and depreciated except for land—which is not depreciated—on a straight-line basis over a period corresponding to their useful life. Their cost includes financing charges capitalized during their construction, improvement, development as well as asset retirement costs, where applicable. Fixed assets under construction, development or improvement are not depreciated.
The cost of works of art and historic properties, such as paintings, sculptures, drawings, prints, photographs, films and videos is not recognized as fixed asset, but as expenditure in the fiscal year during which they are acquired.
Fixed assets acquired through government transfer or through donation, including those acquired for a nominal value, are recognized at their fair value at the time of acquisition.
Land in the public domain and natural resources, such as forests, water and mining resources, which the government holds by virtue of the fact that they were devolved to the state and not purchased, are not recorded in the government’s consolidated financial statements. Intangible items do not constitute non-financial assets for the government.
Fixed assets held under capital leases
The cost of fixed assets held under capital leases is equal to the present value of minimum payments due for the rental of such assets, without exceeding the fair value of the leased asset.
Fixed assets acquired under private-public partnership agreements
Some fixed assets are acquired under private-public partnership agreements. These agreements constitute long-term contracts by which the government involves one or more private partners in designing, building, maintaining and operating a public good, with or without funding from these partners. The fixed asset and the debt associated with it are recognized when the risks and advantages associated with the ownership of the public good are devolved to the government, for the most part, in accordance with the terms of the agreement concerned.
The cost of a fixed asset acquired under a private-public partnership agreement is equal to the lower of the present value of the cash flows associated with the fixed asset and the fixed asset’s fair value. If the cash flows associated with the fixed asset cannot be isolated from those related to its operation, the cost of the asset is determined on the basis of its fair value. The fair value of the fixed asset is estimated on the basis of the agreement’s specifications.
|
| CONSOLIDATED FINANCIAL STATEMENTS | 165 |
19. Fixed assets (cont’d)
Categories | Useful life | |
Buildings
(Institutional and operational buildings, leasehold improvements, etc.) | 10 to 50 years(1) | |
Facilities
(Organization and development of natural spaces: land, parks, forests, watercourses, etc.) | 5 to 20 years | |
Complex networks
(Road, maritime and air transportation infrastructures, natural resource development networks, dams and other large structures, etc.) | 10 to 60 years | |
Equipment
(Transport vehicles, machinery, office furniture and equipment, specialized medical, educational, scientific and industrial equipment, etc.) | 3 to 30 years | |
Data processing and office automation equipment
(Computers, printers and other peripheral devices, software, telecommunication, radiocommunication and information processing equipment, etc.) | 3 to 10 years | |
Development of data processing systems
(Design, production and implementation of data processing systems, including equipment and software acquired for this purpose) | 5 to 10 years | |
| (1) | Asset retirement costs capitalized in the buildings category are amortized over a period of up to 125 years. |
| 166 | PUBLIC ACCOUNTS 2022-2023 |
19. Fixed assets (cont’d)
Change in fixed assets by category
(millions of dollars)
| Data processing and office | Development of data | |||||||||||||||||||||||||||||||
| Complex | automation | processing | ||||||||||||||||||||||||||||||
| Land | Buildings | Facilities | networks | Equipment | equipment | systems | Total | |||||||||||||||||||||||||
| COST | ||||||||||||||||||||||||||||||||
| Previously established opening balance | 2 973 | 70 312 | 2 410 | 49 714 | 13 390 | 3 759 | 6 202 | 148 760 | ||||||||||||||||||||||||
| Accounting changes (Note 3) | 1 928 | 2 | 3 | 1 933 | ||||||||||||||||||||||||||||
| Restated opening balance | 2 973 | 72 240 | 2 412 | 49 714 | 13 393 | 3 759 | 6 202 | 150 693 | ||||||||||||||||||||||||
| Acquisitions | 163 | 774 | 22 | 34 | 862 | 483 | 86 | 2 424 | ||||||||||||||||||||||||
| Work in progress | 5 808 | 271 | 2 725 | 120 | 99 | 422 | 9 445 | |||||||||||||||||||||||||
| Impact of disposals and reductions in value | (2 | ) | (141 | ) | (7 | ) | (562 | ) | (373 | ) | (289 | ) | (118 | ) | (1 492 | ) | ||||||||||||||||
| Restatements and other adjustments | 2 | (371 | ) | (17 | ) | 8 | 13 | (365 | )(1) | |||||||||||||||||||||||
| Closing balance | 3 136 | 78 310 | 2 698 | 51 894 | 14 010 | 4 065 | 6 592 | 160 705 | ||||||||||||||||||||||||
| ACCUMULATED DEPRECIATION | ||||||||||||||||||||||||||||||||
| Previously established opening balance | — | 27 759 | 928 | 20 198 | 8 554 | 2 692 | 4 145 | 64 276 | ||||||||||||||||||||||||
| Accounting changes (Note 3) | 1 113 | 2 | 3 | 1 118 | ||||||||||||||||||||||||||||
| Restated opening balance | — | 28 872 | 930 | 20 198 | 8 557 | 2 692 | 4 145 | 65 394 | ||||||||||||||||||||||||
| Depreciation expenses | 1 717 | 113 | 1 457 | 779 | 508 | 306 | 4 880 | |||||||||||||||||||||||||
| Impact of disposals | (124 | ) | (3 | ) | (553 | ) | (350 | ) | (280 | ) | (113 | ) | (1 423 | ) | ||||||||||||||||||
| Restatements and other adjustments | 55 | 55 | ||||||||||||||||||||||||||||||
| Closing balance | — | 30 520 | 1 040 | 21 102 | 8 986 | 2 920 | 4 338 | 68 906 | ||||||||||||||||||||||||
| Net book value as at March 31, 2023 | 3 136 | 47 790 | 1 658 | 30 792 | 5 024 | 1 145 | 2 254 | 91 799 | ||||||||||||||||||||||||
| Net book value (restated – Note 3) as at March 31, 2022 | 2 973 | 43 368 | 1 482 | 29 516 | 4 836 | 1 067 | 2 057 | 85 299 | ||||||||||||||||||||||||
| (1) | Restatements and other adjustments include $420 M in downward adjustments to the cost of fixed assets arising from revised estimates of asset retirement obligations (Note 15). These adjustments mainly concern buildings. |
| CONSOLIDATED FINANCIAL STATEMENTS | 167 |
19. Fixed assets (cont’d)
Fixed assets rented under capital leases
(millions of dollars)
| Buildings | Equipment | Other | Total | |||||||||||||
| Cost | 502 | 54 | 14 | 570 | ||||||||||||
| Accumulated depreciation | 98 | 9 | 10 | 117 | ||||||||||||
| Net book value as at March 31, 2023 | 404 | 45 | 4 | 453 | ||||||||||||
| Net book value as at March 31, 2022 | 263 | 5 | 6 | 274 | ||||||||||||
Fixed assets acquired under private-public partnership agreements
(millions of dollars)
| Buildings | Facilities | Complex networks | Equipment | Total | ||||||||||||||||
| Cost | 5 411 | 197 | 2 303 | 152 | 8 063 | |||||||||||||||
| Accumulated depreciation(1) | 750 | 60 | 612 | 74 | 1 496 | |||||||||||||||
| Net book value as at March 31, 2023 | 4 661 | 137 | 1 691 | 78 | 6 567 | |||||||||||||||
| Net book value as at March 31, 2022 | 4 764 | 147 | 1 749 | 88 | 6 748 | |||||||||||||||
| (1) | The depreciation expense for these fixed assets was $189 M ($188 M in 2021-2022). |
Fixed assets under construction, development or improvements (work in progress)
(millions of dollars)
| Buildings | Facilities | Complex networks | Equipment | Data processing and office automation equipment | Development of data processing systems | Total | ||||||||||||||||||||||
| Cost as at March 31, 2023 | 9 332 | 336 | 621 | 163 | 113 | 630 | 11 195 | |||||||||||||||||||||
| Cost as at March 31, 2022 | 6 396 | 248 | 398 | 92 | 114 | 889 | 8 137 | |||||||||||||||||||||
| Note: | No depreciation expense was recorded for these fixed assets in 2022-2023 and 2021-2022. |
| 168 | PUBLIC ACCOUNTS 2022-2023 |
▌ 20. Other non-financial assets
| Significant accounting policy |
Inventories
Inventories are recognized at the lower of cost and net realizable value.
|
Detail of the other non-financial assets
(millions of dollars)
| As at March 31 | ||||||||
| 2023 | 2022 | |||||||
| Inventories | 1 422 | 2 064 | ||||||
| Prepaid expenses | 612 | 468 | ||||||
| 2 034 | 2 532 | |||||||
▌ 21. Contractual obligations and contractual rights
| Significant accounting policies |
A contractual obligation is presented when all of the following conditions are met:
¾ there is a legally enforceable written document dated March 31 giving the other party the power to take the matter to court for enforcement;
¾ this written document leads to the loss of discretionary power, that is, the government is likely to have little or no opportunity to amend the written terms and conditions or withdraw from them on its own initiative and therefore has no other realistic alternative than to settle the obligation when the transaction or event occurs;
¾ the government will have to sacrifice economic resources in the future to settle the obligation;
¾ the transaction or event giving rise to the obligation or right has not yet occurred.
A contractual right is disclosed under the same circumstances, that is, when there is a legally enforceable written document as at March 31 depriving the other party of discretionary power and will lead to an inflow of economic resources for the government when the transaction or event occurs.
Contractual obligations or rights stemming from agreements of indeterminate length are calculated and presented over a six-year period: each of the first five years of the agreements and an additional year for the balance. Contractual obligations resulting from agreements where the amounts are paid in perpetuity are spread over 30 years.
|
| CONSOLIDATED FINANCIAL STATEMENTS | 169 |
21. Contractual obligations and contractual rights (cont’d)
Contractual obligations by expenditure and investment category
(millions of dollars)
| Expenditures | Investments | |||||||||||||||||||||||||||||||
| Transfers | Operating | |||||||||||||||||||||||||||||||
| Maturing on March 31 | Capital | Agreements concerning non-capital expenditures | Operating leases | Procurement of goods and services (1) | Other | Acquisitions of fixed assets | Loan and investment pledges | Total | ||||||||||||||||||||||||
| 2024 | 2 953 | 5 889 | 723 | 6 729 | 843 | 8 248 | 2 020 | 27 405 | ||||||||||||||||||||||||
| 2025 | 1 527 | 1 862 | 574 | 3 836 | 565 | 2 512 | 796 | 11 672 | ||||||||||||||||||||||||
| 2026 | 1 867 | 860 | 474 | 2 705 | 518 | 1 409 | 485 | 8 318 | ||||||||||||||||||||||||
| 2027 | 2 024 | 676 | 406 | 2 089 | 102 | 811 | 110 | 6 218 | ||||||||||||||||||||||||
| 2028 | 979 | 456 | 350 | 1 812 | 482 | 38 | 4 117 | |||||||||||||||||||||||||
| 9 350 | 9 743 | 2 527 | 17 171 | 2 028 | 13 462 | 3 449 | 57 730 | |||||||||||||||||||||||||
| 2029 and thereafter | 11 300 | 5 325 | 1 682 | 15 836 | 389 | 187 | 34 719 | |||||||||||||||||||||||||
| 20 650 | 15 068 | 4 209 | 33 007 | 2 028 | 13 851 | 3 636 | 92 449 | |||||||||||||||||||||||||
| No fixed maturity date | 967 | 967 | ||||||||||||||||||||||||||||||
| 20 650 | 15 068 | 4 209 | 33 007 | 2 028 | 13 851 | 4 603 | 93 416 | |||||||||||||||||||||||||
| (1) | Contractual obligations related to the procurement of goods and services included an amount of $7 143 M stemming from private-public partnership agreements. |
Contractual rights by revenue source
(millions of dollars)
| Maturing on March 31 | Natural resources | Sales of goods and services | Transfers from federal government | Other | Total | |||||||||||||||
| 2024 | 369 | 402 | 7 393 | 226 | 8 390 | |||||||||||||||
| 2025 | 127 | 276 | 5 914 | 78 | 6 395 | |||||||||||||||
| 2026 | 55 | 268 | 6 921 | 51 | 7 295 | |||||||||||||||
| 2027 | 53 | 253 | 5 494 | 16 | 5 816 | |||||||||||||||
| 2028 | 53 | 257 | 4 113 | 15 | 4 438 | |||||||||||||||
| 657 | 1 456 | 29 835 | 386 | 32 334 | ||||||||||||||||
| 2029 and thereafter | 96 | 448 | 4 993 | 152 | 5 689 | |||||||||||||||
| 753 | 1 904 | 34 828 | 538 | 38 023 | ||||||||||||||||
| 170 | PUBLIC ACCOUNTS 2022-2023 |
| Significant accounting policies |
Contingent liabilities
Obligations stemming from lawsuits and disputes are recognized as liabilities when a future event is likely to confirm the existence of a liability as at the date of the financial statements and a reasonable estimate of the loss can be made. If it is impossible to determine the probability of the event occurring, or if the event is likely to occur but no reasonable estimate can be made, a contingent liability is presented in an additional note.
The accounting policies used for contingent liabilities relating to environmental liabilites and allowances for losses from guaranteed financial initiatives are presented in Note 13 on accounts payable, accrued expenses and other allowances and in Note 15 on environmental liability and asset retirement obligations, respectively.
|
| Material measurement uncertainty |
Contingent liabilities may vary based on the assumptions made to determine the likelihood that an existing situation will be resolved as at the date of the financial statements and the assumptions made to estimate the value of contingent liabilities. Among the assumptions used are past experience, current negotiations, recent settlements and court rulings.
Those forecasts may vary widely in the coming year. Since the disclosure of information could negatively affect the outcomes of lawsuits and disputes, information as to the amounts and extent of related uncertainties is not provided.
The measurement uncertainty with respect to the allowance for losses on guaranteed financial initiatives and environmental liability is presented in Note 13 on accounts payable, accrued expenses and other allowances and in Note 15 on environmental liability and asset retirement obligations, respectively.
|
| CONSOLIDATED FINANCIAL STATEMENTS | 171 |
22. Contingencies (cont’d)
Contingent liabilities
Legal proceedings and disputes
A number of claims have been instituted against the government, which is also involved in legal proceedings before the courts. These different disputes result from breaches of contract and damages suffered by individuals or property. In some cases, the amounts claimed are mentioned, in others, no mention is made of them. Claims for which an amount has been established total $4 862 million, after deducting the allowances taken by the government in this regard.
Some of Québec’s Indigenous communities have instituted legal proceedings involving $10 051 million in damages and interest against the government for land claims, the recognition of certain ancestral rights and other related questions. These proceedings are at different stages (some proceedings being currently suspended or inactive) and should eventually be resolved through negotiations, rulings or the abandonment of proceedings by applicants.
Since the outcome of these legal proceedings and disputes is uncertain, the government cannot determine its potential losses.
With regards to the application of the Pay Equity Act (CQLR, chapter E-12.001), the government makes a provision for a job class when it is likely that this job class will benefit from a salary adjustment as a result of a pay equity audit or a complaint and it can reasonably estimate the amount it will have to pay. In this regard, the government is subject to complaints by some of its employees and some of the unions representing them, particularly within the framework of pay equity audits conducted in 2010 and 2015 for the parapublic sector plan. With regards to the 2020 evaluation of pay equity maintenance, the exercise should be completed during the next fiscal year. The estimation method used to value the liability includes the assumptions deemed most probable by the government.
| 172 | PUBLIC ACCOUNTS 2022-2023 |
▌ 23. Cash flow information
Items not affecting cash flow
(millions of dollars)
| Fiscal year ended March 31 | ||||||||||||||||
| 2023 | 2022 | |||||||||||||||
| (restated – Note 3) | ||||||||||||||||
| Doubtful accounts | 534 | 419 | ||||||||||||||
| Allowances related to loans, investments and guaranteed financial initiatives | 306 | (3 | ) | |||||||||||||
| Reinvestment of the income from Generations Fund investments | (283 | ) | (484 | ) | ||||||||||||
| Revenue from government enterprises | (6 620 | ) | (5 960 | ) | ||||||||||||
| Losses (gains) on the disposal of assets | 1 457 | 604 | ||||||||||||||
| Adjustment of debts to the effective interest rate | 208 | 199 | ||||||||||||||
| Loss in value of assets other than temporary | 604 | 56 | ||||||||||||||
| Amortization of deferred revenue related to the acquisition of fixed assets | (252 | ) | (258 | ) | ||||||||||||
| Activities related to pension plans and other employee future benefits | ||||||||||||||||
| Cost of accrued benefits(1) | 3 422 | 3 182 | ||||||||||||||
| Changes to plans | 7 | (77 | ) | |||||||||||||
| Amortization of actuarial losses | 750 | 619 | ||||||||||||||
| Interest on obligations relating to accrued benefits | 7 650 | 7 331 | ||||||||||||||
| Change in valuation allowances | 112 | 115 | ||||||||||||||
| 11 941 | 11 170 | |||||||||||||||
| Reinvestment of revenue from fund’s investments | (7 262 | ) | 4 679 | (6 761 | ) | 4 409 | ||||||||||
| Depreciation of fixed assets | 4 880 | 4 617 | ||||||||||||||
| Accretion expenses and others on asset retirement obligations | 218 | 191 | ||||||||||||||
| Revision of the estimates and others related to environmental liability | 363 | 30 | ||||||||||||||
| Other items not affecting cash flow | (126 | ) | 46 | |||||||||||||
| 5 968 | 3 866 | |||||||||||||||
| (1) | This item includes compensations paid by the government into the contribution funds of participants in the government and Public Employees Retirement Plan (RREGOP) and the Pension Plan of Management Personnel (PPMP). |
| CONSOLIDATED FINANCIAL STATEMENTS | 173 |
23. Cash flow information (cont’d)
Change in assets and liabilities related to operations
(millions of dollars)
| Fiscal year ended March 31 | ||||||||
| 2023 | 2022 | |||||||
| Assets | ||||||||
| Accounts receivable | (2 246 | ) | (2 185 | ) | ||||
| Generations Fund – accounts receivable | 3 | (8 | ) | |||||
| Other financial assets | 538 | (564 | ) | |||||
| Other non-financial assets | 92 | (426 | ) | |||||
| (1 613 | ) | (3 183 | ) | |||||
| Liabilities | ||||||||
| Accounts payable, accrued expenses and other allowances | 1 339 | 5 868 | ||||||
| Deferred revenue | 287 | 1 369 | ||||||
| Environmental liabilities | (48 | ) | (57 | ) | ||||
| 1 578 | 7 180 | |||||||
| (35 | ) | 3 997 | ||||||
Additional information
(millions of dollars)
| Fiscal year ended March 31 | ||||||||
| 2023 | 2022 | |||||||
| Interest paid | 8 850 | 7 645 | ||||||
| Dividends receivable from government enterprises | 617 | 447 | ||||||
| Fixed asset acquisition included in accounts payable and accrued expenses | (1 746 | ) | (1 572 | ) | ||||
▌ 24. Related party information
The government is a related party to its key management personnel, their close relatives and entities for which one or more of those people have the power to guide financial and administrative decisions. The government’s main management personnel are ministers, deputy ministers, and presidents and executive directors or their equivalent.
The government concluded no significant transactions with related parties during fiscal 2022-2023, for amounts different from those that would have been established between non-related parties.
| 174 | PUBLIC ACCOUNTS 2022-2023 |
Reporting entity by portfolios
The government sets up programs administered directly by government entities, including departments and agencies. All entities under the responsibility of a minister constitute a portfolio. The National Assembly and persons appointed by it also constitute portfolios. This appendix reflects the changes made to the reporting entity as a result of the fall 2022 cabinet reshuffle.
National Assembly
National Assembly
Persons Appointed by the National Assembly
Auditor General
Chief Electoral Officer
French language Commissioner
Lobbyists Commissioner
Public Protector
The Ethics Commissioner
Affaires municipales et Habitation
Department and budget-funded bodies
Affaires municipales et Habitation
Administrative Housing Tribunal
Commission municipale du Québec
Non-budget-funded body
Société d’habitation du Québec
Special fund
Regions and Rurality Fund
Agriculture, Pêcheries et Alimentation
Department and budget-funded bodies
Agriculture, Pêcheries et Alimentation
Commission de protection du territoire agricole du Québec
Régie des marchés agricoles et alimentaires du Québec
Non-budget-funded bodies
Institut de technologie agroalimentaire du Québec (June 30)
La Financière agricole du Québec
Government enterprise1
Capital Financière agricole inc.
Conseil du trésor et Administration gouvernementale
Department and budget-funded body
Conseil du trésor et Administration gouvernementale
Commission de la fonction publique
| CONSOLIDATED FINANCIAL STATEMENTS | 175 |
Appendix 1
Reporting entity by portfolios (cont’d)
Conseil du trésor et Administration gouvernementale (cont’d)
Non-budget-funded bodies
Autorité des marchés publics
Centre d’acquisitions gouvernementales
Commission de la capitale nationale du Québec
Office des professions du Québec
Société québécoise des infrastructures
Special fund
Capitale-Nationale Region Fund
Conseil exécutif
Department and budget-funded body
Conseil exécutif
Commission d’accès à l’information
Non-budget-funded body
Centre de la francophonie des Amériques
Culture et Communications
Department and budget-funded body
Culture et Communications
Conseil du patrimoine culturel du Québec
Non-budget-funded bodies
Bibliothèque et Archives nationales du Québec
Conseil des arts et des lettres du Québec
Conservatoire de musique et d’art dramatique du Québec (June 30)
Musée d’art contemporain de Montréal
Musée de la Civilisation
Musée national des beaux-arts du Québec
Société de développement des entreprises culturelles
Société de la Place des Arts de Montréal
Société de télédiffusion du Québec (Télé-Québec)
Société du Grand Théâtre de Québec (August 31)
Special funds
Avenir Mécénat Culture Fund
Québec Cultural Heritage Fund
Cybersécurité et Numérique
Department
Cybersécurité et Numérique
Special fund
Cybersecurity and Digital Technology Fund
| 176 | PUBLIC ACCOUNTS 2022-2023 |
Appendix 1
Reporting entity by portfolios (cont’d)
Économie, Innovation et Énergie
Department and budget-funded body
Économie et Innovation
Commission de l’éthique en science et en technologie
Non-budget-funded bodies
Fonds de recherche du Québec–Nature et technologies – Québec Research Fund–Nature and Technology
Fonds de recherche du Québec–Santé – Québec Research Fund–Health
Fonds de recherche du Québec–Société et culture – Québec Research Fund–Society and Culture
Régie de l’énergie
Société portuaire du Bas-Saint-Laurent et de la Gaspésie inc.
Special funds
Economic Development Fund
Natural Resources and Energy Capital Fund
Natural Resources Fund (fossil energy management component)2
Québec Enterprise Growth Fund
Government enterprises1
Fonds d’investissement Eurêka S.E.C.
Hydro-Québec3 (December 31)
Investissement Québec3
Société du parc industriel et portuaire de Bécancour3
Éducation
Department and budget-funded bodies
Éducation
Commission consultative de l’enseignement privé
Conseil supérieur de l’éducation
Non-budget-funded bodies
Institut national des mines
Société des établissements de plein air du Québec
Société des parcs de sciences naturelles du Québec
Special fund
Sports and Physical Activity Development Fund
Organizations in the government’s education network – School service centres4
Centre de services scolaire au Coeur-des-Vallées
Centre de services scolaire de Charlevoix
Centre de services scolaire de Kamouraska–Rivière-du-Loup
Centre de services scolaire de la Baie-James
Centre de services scolaire de la Beauce-Etchemin
Centre de services scolaire de la Capitale
Centre de services scolaire de la Côte-du-Sud
Centre de services scolaire De La Jonquière
Centre de services scolaire de la Moyenne-Côte-Nord
| CONSOLIDATED FINANCIAL STATEMENTS | 177 |
Appendix 1
Reporting entity by portfolios (cont’d)
Éducation (cont’d)
Organizations in the government’s education network – School service centres4 (cont’d)
Centre de services scolaire de la Pointe-de-l’Île
Centre de services scolaire de la Région-de-Sherbrooke
Centre de services scolaire de la Riveraine
Centre de services scolaire de la Rivière-du-Nord
Centre de services scolaire de Laval
Centre de services scolaire de la Vallée-des-Tisserands
Centre de services scolaire de l’Énergie
Centre de services scolaire de l’Estuaire
Centre de services scolaire de l’Or-et-des-Bois
Centre de services scolaire de Montréal
Centre de services scolaire de Portneuf
Centre de services scolaire de Rouyn-Noranda
Centre de services scolaire des Affluents
Centre de services scolaire de Saint-Hyacinthe
Centre de services scolaire des Appalaches
Centre de services scolaire des Bois-Francs
Centre de services scolaire des Chênes
Centre de services scolaire des Chic-Chocs
Centre de services scolaire des Découvreurs
Centre de services scolaire des Draveurs
Centre de services scolaire des Grandes-Seigneuries
Centre de services scolaire des Hautes-Laurentides
Centre de services scolaire des Hautes-Rivières
Centre de services scolaire des Hauts-Bois-de-l’Outaouais
Centre de services scolaire des Hauts-Cantons
Centre de services scolaire des Îles
Centre de services scolaire des Laurentides
Centre de services scolaire des Mille-Îles
Centre de services scolaire des Monts-et-Marées
Centre de services scolaire des Navigateurs
Centre de services scolaire de Sorel-Tracy
Centre de services scolaire des Patriotes
Centre de services scolaire des Phares
Centre de services scolaire des Portages-de-l’Outaouais
Centre de services scolaire des Premières-Seigneuries
Centre de services scolaire des Rives-du-Saguenay
Centre de services scolaire des Samares
Centre de services scolaire des Sommets
Centre de services scolaire des Trois-Lacs
Centre de services scolaire du Chemin-du-Roy
Centre de services scolaire du Fer
Centre de services scolaire du Fleuve-et-des-Lacs
Centre de services scolaire du Lac-Abitibi
| 178 | PUBLIC ACCOUNTS 2022-2023 |
Appendix 1
Reporting entity by portfolios (cont’d)
Éducation (cont’d)
Organizations in the government’s education network – School service centres4 (cont’d)
Centre de services scolaire du Lac-Saint-Jean
Centre de services scolaire du Lac-Témiscamingue
Centre de services scolaire du Littoral
Centre de services scolaire du Pays-des-Bleuets
Centre de services scolaire du Val-des-Cerfs
Centre de services scolaire Harricana
Centre de services scolaire Marguerite-Bourgeoys
Centre de services scolaire Marie-Victorin
Centre de services scolaire René-Lévesque
Organizations in the government’s education network – School boards4
Commission scolaire Central Québec – Central Québec School Board
Commission scolaire crie – Cree School Board
Commission scolaire Eastern Shores – Eastern Shores School Board
Commission scolaire Eastern Townships – Eastern Townships School Board
Commission scolaire English-Montréal – English Montreal School Board
Commission scolaire Kativik – Kativik School Board
Commission scolaire Lester-B.-Pearson – Lester B. Pearson School Board
Commission scolaire New Frontiers – New Frontiers School Board
Commission scolaire Riverside – Riverside School Board
Commission scolaire Sir-Wilfrid-Laurier – Sir Wilfrid Laurier School Board
Commission scolaire Western Québec – Western Québec School Board
Comité de gestion de la taxe scolaire de l’île de Montréal
Emploi et Solidarité sociale
Department and budget-funded bodies
Emploi et Solidarité sociale
Commission des partenaires du marché du travail
Non-budget-funded body
Office de la sécurité économique des chasseurs cris – Cree Hunters Economic Security Board (June 30)
Special funds
Assistance Fund for Independent Community Action
Goods and Services Fund
Information Technology Fund of the Ministère de l’Emploi et de la Solidarité sociale
Labour Market Development Fund
Québec Fund for Social Initiatives
Enseignement supérieur
Department and budget-funded bodies
Enseignement supérieur
Comité consultatif sur l’accessibilité financière aux études
Commission d’évaluation de l’enseignement collégial
| CONSOLIDATED FINANCIAL STATEMENTS | 179 |
Appendix 1
Reporting entity by portfolios (cont’d)
Enseignement supérieur (cont’d)
Non-budget-funded body
Institut de tourisme et d’hôtellerie du Québec (June 30)
Special fund
University Excellence and Performance Fund
Organizations in the government’s higher education network – General and vocational colleges (CEGEPs)4
Cégep André-Laurendeau
Cégep Beauce-Appalaches
Cégep d’Ahuntsic
Cégep de Baie-Comeau
Cégep de Bois-de-Boulogne
Cégep de Chicoutimi
Cégep de Drummondville
Cégep de Granby
Cégep de Jonquière
Cégep de l’Abitibi-Témiscamingue
Cégep de la Gaspésie et des Îles
Cégep de La Pocatière
Cégep de Lévis
Cégep de l’Outaouais
Cégep de Maisonneuve
Cégep de Matane
Cégep de Rimouski
Cégep de Rivière-du-Loup
Cégep de Rosemont
Cégep de Sainte-Foy
Cégep de Saint-Félicien
Cégep de Saint-Hyacinthe
Cégep de Saint-Jérôme
Cégep de Saint-Laurent
Cégep de Sept-Îles
Cégep de Shawinigan
Cégep de Sherbrooke
Cégep de Sorel-Tracy
Cégep de Thetford
Cégep de Trois-Rivières
Cégep de Valleyfield
Cégep de Victoriaville
Cégep du Vieux Montréal
Cégep Édouard-Montpetit
Cégep François-Xavier Garneau
Cégep Gérald-Godin
Cégep Limoilou
Cégep Lionel-Groulx
| 180 | PUBLIC ACCOUNTS 2022-2023 |
Appendix 1
Reporting entity by portfolios (cont’d)
Enseignement supérieur (cont’d)
Organizations in the government’s higher education network – General and vocational colleges (CEGEPs)4 (cont’d)
Cégep Marie-Victorin
Cégep Montmorency
Cégep régional Champlain – Champlain Regional College
Cégep régional de Lanaudière
Cégep Saint-Jean-sur-Richelieu
Collège d’Alma
Dawson College
Heritage College
John Abbott College
Vanier College of General and Vocational Education
Organizations in the government’s higher education network – Université du Québec and its constituent universities5
École de technologie supérieure
École nationale d’administration publique
Institut national de la recherche scientifique
Télé-université
Université du Québec
Université du Québec à Chicoutimi
Université du Québec à Montréal
Université du Québec à Rimouski
Université du Québec à Trois-Rivières
Université du Québec en Abitibi-Témiscamingue
Université du Québec en Outaouais
Environnement, Lutte contre les changements climatiques, Faune et Parcs
Department and budget-funded body
Environnement, Lutte contre les changements climatiques, Faune et Parcs
Bureau d’audiences publiques sur l’environnement
Non-budget-funded bodies
Fondation de la faune du Québec
Société québécoise de récupération et de recyclage
Special funds
Electrification and Climate Change Fund
Energy Transition, Innovation and Efficiency Fund
Fund for the Protection of the Environment and the Waters in the Domain of the State
Natural Resources Fund (Wildlife conservation and development component)2
Famille (cont’d)
Department and budget-funded body
Famille
Curateur public
| CONSOLIDATED FINANCIAL STATEMENTS | 181 |
Appendix 1
Reporting entity by portfolios (cont’d)
Famille
Special fund
Educational Childcare Services Fund
Finances
Department and budget-funded bodies
Finances6
Non-budget-funded bodies
Agence du revenu du Québec7
Autorité des marchés financiers
Financement-Québec
Institut de la statistique du Québec
Société de financement des infrastructures locales du Québec
Société nationale de l’amiante8
Special funds
Financing Fund
Financial Markets Administrative Tribunal (Fund of the)9
Fund to Combat Addiction
Generations Fund
Health Services Fund
IFC Montréal Fund
Northern Plan Fund
Special Contracts and Financial Assistance for Investment Fund
Tax Administration Fund
Government enterprises1
Loto-Québec
Société des alcools du Québec (fiscal year ended on the last Saturday of March)
Société québécoise du cannabis (fiscal year ended on the last Saturday of March)
Immigration, Francisation et Intégration
Department
Immigration, Francisation et Intégration
Justice
Department and budget-funded bodies
Justice
Commission des droits de la personne et des droits de la jeunesse
Committee on the Remuneration of Criminal and Penal Prosecuting Attorneys
Committee on the remuneration of judges and justices of the peace
Conseil de la justice administrative
Conseil de la magistrature
Directeur des poursuites criminelles et pénales
Human Rights Tribunal
Office de la protection du consommateur
| 182 | PUBLIC ACCOUNTS 2022-2023 |
Appendix 1
Reporting entity by portfolios (cont’d)
Justice (cont’d)
Non-budget-funded bodies
Commission des services juridiques
Fonds d’aide aux actions collectives
Société québécoise d’information juridique
Special funds
Access to Justice Fund
Administrative Tribunal of Québec (Fund of the)9
Fund dedicated to assistance for persons who are victims of criminal offences
Public Contracts Fund
Register Fund of the Ministère de la Justice
Langue française
Department and budget-funded bodies
Langue française
Commission de toponymie
Office québécois de la langue française
Relations internationales et Francophonie
Department and budget-funded body
Relations internationales et Francophonie
Conseil du statut de la femme
Non-budget-funded bodies
Office Québec-Monde pour la jeunesse
Ressources naturelles et Forêts
Department
Ressources naturelles et Forêts
Non-budget-funded bodies
Société de développement de la Baie-James (December 31)
Société du Plan Nord
Special funds
Natural Resources Fund (forestry, sustainable forest development, mining heritage and mining activity management components)2
Territorial Information Fund
Government enterprises1
Société ferroviaire et portuaire de Pointe-Noire S.E.C.
Santé et Services sociaux
Department and budget-funded bodies
Santé et Services sociaux
Commissaire à la santé et au bien-être
Office des personnes handicapées du Québec
| CONSOLIDATED FINANCIAL STATEMENTS | 183 |
Appendix 1
Reporting entity by portfolios (cont’d)
Santé et Services sociaux (cont’d)
Non-budget-funded bodies
Corporation d’urgences-santé
Fonds de l’assurance médicaments – Prescription Drug Insurance Fund
Héma-Québec
Institut national de santé publique du Québec
Institut national d’excellence en santé et en services sociaux
Régie de l’assurance maladie du Québec
Special funds
Cannabis Prevention and Research Fund
Health and Social Services Information Resources Fund
Organizations in the government’s health and social services network – Integrated health and social services centres
Centre intégré de santé et de services sociaux de Chaudière-Appalaches
Centre intégré de santé et de services sociaux de l’Abitibi-Témiscamingue
Centre intégré de santé et de services sociaux de la Côte-Nord
Centre intégré de santé et de services sociaux de la Gaspésie
Centre intégré de santé et de services sociaux de la Montérégie-Centre
Centre intégré de santé et de services sociaux de la Montérégie-Est
Centre intégré de santé et de services sociaux de la Montérégie-Ouest
Centre intégré de santé et de services sociaux de Lanaudière
Centre intégré de santé et de services sociaux de Laval
Centre intégré de santé et de services sociaux de l’Outaouais
Centre intégré de santé et de services sociaux des Îles
Centre intégré de santé et de services sociaux des Laurentides
Centre intégré de santé et de services sociaux du Bas-Saint-Laurent
Centre intégré universitaire de santé et de services sociaux de la Capitale-Nationale
Centre intégré universitaire de santé et de services sociaux de la Mauricie-et-du-Centre- du-Québec
Centre intégré universitaire de santé et de services sociaux de l’Est-de-l’Île-de-Montréal
Centre intégré universitaire de santé et de services sociaux de l’Estrie – Centre hospitalier universitaire de Sherbrooke
Centre intégré universitaire de santé et de services sociaux de l’Ouest-de-l’Île-de-Montréal
Centre intégré universitaire de santé et de services sociaux du Centre-Ouest-de-l’Île-de-Montréal
Centre intégré universitaire de santé et de services sociaux du Centre-Sud-de-l’Île-de-Montréal
Centre intégré universitaire de santé et de services sociaux du Nord-de-l’Île-de-Montréal
Centre intégré universitaire de santé et de services sociaux du Saguenay–Lac-Saint-Jean
Organizations in the government’s health and social services network – other public institutions and regional authorities
Centre de santé Inuulitsivik – Inuulitsivik Health Centre
Centre de santé Tulattavik de l’Ungava – Ungava Tulattavik Health Centre
Centre hospitalier de l’Université de Montréal
Centre hospitalier universitaire Sainte-Justine
Centre régional de santé et de services sociaux de la Baie-James
| 184 | PUBLIC ACCOUNTS 2022-2023 |
Appendix 1
Reporting entity by portfolios (cont’d)
Santé et Services sociaux (cont’d)
Organizations in the government’s health and social services network – other public institutions and regional authorities (cont’d)
Centre universitaire de santé McGill – McGill University Health Centre
CHU de Québec – Université Laval
CLSC Naskapi
Conseil cri de la santé et des services sociaux de la Baie-James – Cree Board of Health and Social Services of James Bay
Institut de cardiologie de Montréal
Institut national de psychiatrie légale Philippe-Pinel
Institut universitaire de cardiologie et de pneumologie de Québec – Université Laval
Régie régionale de la santé et des services sociaux du Nunavik – Nunavik Regional Board of Health and Social Services
Sécurité publique
Department and budget-funded bodies
Sécurité publique
Bureau des enquêtes indépendantes
Bureau du coroner
Comité de déontologie policière
Commissaire à la déontologie policière
Commissaire à la lutte contre la corruption
Commission québécoise des libérations conditionnelles
Régie des alcools, des courses et des jeux
Non-budget-funded bodies
École nationale de police du Québec (June 30)
École nationale des pompiers du Québec (June 30)
Special fund
Police Services Fund
Tourisme
Department
Tourisme
Non-budget-funded bodies
Société de développement et de mise en valeur du Parc olympique
Société du Centre des congrès de Québec
Société du Palais des congrès de Montréal
Special fund
Tourism Partnership Fund
Transports et Mobilité durable
Department and budget-funded body
Transports et Mobilité durable
Commission des transports du Québec
| CONSOLIDATED FINANCIAL STATEMENTS | 185 |
Appendix 1
Reporting entity by portfolios (cont’d)
Transports et Mobilité durable (cont’d)
Non-budget-funded bodies
Société de l’assurance automobile du Québec (December 31)
Société des Traversiers du Québec
Special funds
Air Service Fund
Highway Safety Fund
Land Transportation Network Fund
Rolling Stock Management Fund
Travail
Department
Travail
Non-budget-funded body
Régie du bâtiment du Québec
Special fund
Administrative Labour Tribunal (Fund of the)9
| Note: | When an entity’s fiscal year ends on a date other than March 31, the date is indicated in parentheses. For the purposes of consolidation in the government’s financial statements, interim data are then used for the period between the end of the fiscal year and March 31. |
| 1. | The government holds a 100% share of those enterprises, except for Capitale Financière agricole inc. where it holds 90.10%. |
| 2. | The Natural Resources Fund, established under the Act respecting the Ministère des Ressources naturelles et de la Faune (CQLR, chapter M-25.2), is composed of various components. Financial information on the fossil energy management component is presented in the Économie, Innovation et Énergie portfolio. Financial information for the wildlife conservation and development component is included in the Environnement, Lutte contre les changements climatiques, Faune et Parcs portfolio. Lastly, financial information for all other components is combined and presented in the Ressources naturelles et Forêts portfolio. |
| 3. | The Minister of Economy, Innovation and Energy is responsible for the application of the incorporating acts of Hydro-Québec, Investissement Québec and the Société du parc industriel et portuaire de Bécancour. However, their revenues are recognized in the Finances portfolio, since the shares of these government enterprises are held by the Minister of Finance. |
| 4. | The fiscal year of the school service centres, school boards and colleges ends on June 30. Interim data are used for the period between the end of their fiscal year and March 31. |
| 5. | The financial data of the Université du Québec and its constituent universities that were used for consolidation purposes cover the period from May 1, 2022 to April 30, 2023, the date on which their fiscal year ends. Operations and events relating to these entities that occurred between April 1 and 30, 2023 did not have a material financial impact on the government’s financial position and consolidated results. |
| 6. | In accordance with section 9 of the Executive Power Act (CQLR, chapter E-18), Order-in-Council 1689-2022 entrusts the functions and responsibilities of the Minister of Revenue to the Minister of Finance. |
| 7. | Transactions of the general fund of the Consolidated Revenue Fund related to the enforcement or administration of any statute under the responsibility of the Minister of Revenue are administered by the Agence du revenu du Québec. |
| 8. | The Société nationale de l’amiante has ceased its operations. Since June 1, 2016, this entity has been constituted as a legal person established in the public interest governed by the provisions of the Business Corporations Act (CQLR, chapter S-3.1.1). |
| 9. | The financial data for this special fund, which were used for consolidation purposes, also include those pertaining to the body financed by this fund. |
| 186 | PUBLIC ACCOUNTS 2022-2023 |
Appendix 2
Segment disclosures
Consolidated statement of revenue
(millions of dollars)
| Fiscal year ended March 31, 2023 | ||||||||||||||||||||||||||||
| Income | Revenue | |||||||||||||||||||||||||||
| and | Duties | Miscella- | from | Federal | ||||||||||||||||||||||||
| property | Consump- | and | neous | government | government | |||||||||||||||||||||||
| taxes | tion taxes | permits | revenue | enterprises | transfers | Total | ||||||||||||||||||||||
| PORTFOLIOS | ||||||||||||||||||||||||||||
| Assemblée nationale | 7 | 7 | ||||||||||||||||||||||||||
| Personnes désignées par l’Assemblée nationale | 2 | 2 | ||||||||||||||||||||||||||
| Affaires municipales et Habitation | 6 | 285 | 596 | 887 | ||||||||||||||||||||||||
| Agriculture, Pêcheries et Alimentation | 27 | 50 | 162 | 239 | ||||||||||||||||||||||||
| Conseil du trésor et Administration gouvernementale | 1 | 142 | 143 | |||||||||||||||||||||||||
| Conseil exécutif | 5 | 39 | 44 | |||||||||||||||||||||||||
| Culture et Communications | 35 | 1 | 124 | 2 | 162 | |||||||||||||||||||||||
| Cybersécurité et Numérique | 37 | 37 | ||||||||||||||||||||||||||
| Économie, Innovation et Énergie(1) | 19 | 278 | 21 | 318 | ||||||||||||||||||||||||
| Éducation | 1 113 | 90 | 1 309 | 422 | 2 934 | |||||||||||||||||||||||
| Emploi et Solidarité sociale | 37 | 182 | 954 | 1 173 | ||||||||||||||||||||||||
| Enseignement supérieur | 948 | 243 | 1 191 | |||||||||||||||||||||||||
| Environnement, Lutte contre les changements climatiques, Faune et Parcs | 36 | 1 589 | 109 | 118 | 1 852 | |||||||||||||||||||||||
| Famille | 24 | 3 | 27 | |||||||||||||||||||||||||
| Finances | 63 408 | 24 146 | 1 840 | 2 095 | 6 581 | 24 058 | 122 128 | |||||||||||||||||||||
| Immigration, Francisation et Intégration | 62 | 17 | 794 | 873 | ||||||||||||||||||||||||
| Justice | 4 | 327 | 45 | 376 | ||||||||||||||||||||||||
| Langue française | ||||||||||||||||||||||||||||
| Relations internationales et Francophonie | 2 | 17 | 19 | |||||||||||||||||||||||||
| Ressources naturelles et Forêts | 544 | 254 | 39 | 48 | 885 | |||||||||||||||||||||||
| Santé et Services sociaux | 2 | 4 731 | 1 091 | 5 824 | ||||||||||||||||||||||||
| Sécurité publique | 28 | 454 | 35 | 517 | ||||||||||||||||||||||||
| Tourisme | 149 | 2 | 104 | 255 | ||||||||||||||||||||||||
| Transports et Mobilité durable | 2 141 | 1 467 | 533 | 92 | 4 233 | |||||||||||||||||||||||
| Travail | 88 | 85 | 173 | |||||||||||||||||||||||||
| Total revenue | 64 521 | 26 597 | 5 741 | 12 083 | 6 620 | 28 737 | 144 299 | |||||||||||||||||||||
| (1) | The Minister of Economy, Innovation and Energy is responsible for the application of the incorporating acts of Hydro-Québec, Investissement Québec and the Société du parc industriel et portuaire de Bécancour. However, their revenues are recognized in the Finances portfolio, since the shares of these government enterprises are held by the Minister of Finance. |
| CONSOLIDATED FINANCIAL STATEMENTS | 187 |
Appendix 2
Segment disclosures (cont’d)
Consolidated statement of revenue (cont’d)
(millions of dollars)
| Fiscal year ended March 31, 2022 | ||||||||||||||||||||||||||||
| Income and | Duties | Miscella- | Revenue from | Federal | ||||||||||||||||||||||||
| property | Consumption | and | neous | government | government | |||||||||||||||||||||||
| taxes | taxes | permits | revenue | enterprises | transfers | Total | ||||||||||||||||||||||
| PORTFOLIOS | ||||||||||||||||||||||||||||
| Assemblée nationale | 4 | 4 | ||||||||||||||||||||||||||
| Personnes désignées par l’Assemblée nationale | ||||||||||||||||||||||||||||
| Affaires municipales et Habitation | 5 | 266 | 619 | 890 | ||||||||||||||||||||||||
| Agriculture, Pêcheries et Alimentation | 27 | 36 | (1 | ) | 124 | 186 | ||||||||||||||||||||||
| Conseil du trésor et Administration gouvernementale | 1 | 119 | 2 | 122 | ||||||||||||||||||||||||
| Conseil exécutif | 1 | 44 | 45 | |||||||||||||||||||||||||
| Culture et Communications | 25 | 1 | 97 | 2 | 125 | |||||||||||||||||||||||
| Cybersécurité et Numérique | 28 | 28 | ||||||||||||||||||||||||||
| Économie, Innovation et Énergie(1) | 21 | 235 | 17 | 273 | ||||||||||||||||||||||||
| Éducation | 1 076 | 90 | 1 086 | 327 | 2 579 | |||||||||||||||||||||||
| Emploi et Solidarité sociale | 38 | 113 | 1 078 | 1 229 | ||||||||||||||||||||||||
| Enseignement supérieur | 787 | 214 | 1 001 | |||||||||||||||||||||||||
| Environnement, Lutte contre les changements climatiques, Faune et Parcs | 12 | 1 624 | 40 | 75 | 1 751 | |||||||||||||||||||||||
| Famille | 22 | 2 | 24 | |||||||||||||||||||||||||
| Finances | 61 252 | 22 295 | 2 264 | 1 798 | 5 950 | 24 357 | 117 916 | |||||||||||||||||||||
| Immigration, Francisation et Intégration | 44 | 9 | 697 | 750 | ||||||||||||||||||||||||
| Justice | 4 | 325 | 39 | 368 | ||||||||||||||||||||||||
| Langue française | ||||||||||||||||||||||||||||
| Relations internationales et Francophonie | 1 | 24 | 25 | |||||||||||||||||||||||||
| Ressources naturelles et Forêts | 470 | 236 | 11 | 73 | 790 | |||||||||||||||||||||||
| Santé et Services sociaux | 9 | 3 | 4 454 | 1 291 | 5 757 | |||||||||||||||||||||||
| Sécurité publique | 25 | 404 | 25 | 454 | ||||||||||||||||||||||||
| Tourisme | 91 | 32 | 123 | |||||||||||||||||||||||||
| Transports et Mobilité durable | 2 075 | 1 426 | 552 | 176 | 4 229 | |||||||||||||||||||||||
| Travail | 82 | 80 | 162 | |||||||||||||||||||||||||
| Total revenue | 62 328 | 24 597 | 6 057 | 10 705 | 5 960 | 29 184 | 138 831 | |||||||||||||||||||||
| (1) | The Minister of Economy, Innovation and Energy is responsible for the application of the incorporating acts of Hydro-Québec, Investissement Québec and the Société du parc industriel et portuaire de Bécancour. However, their revenues are recognized in the Finances portfolio, since the shares of these government enterprises are held by the Minister of Finance. |
| 188 | PUBLIC ACCOUNTS 2022-2023 |
Appendix 2
Segment disclosures (cont’d)
Consolidated statement of expenditure
(millions of dollars)
| Fiscal year ended March 31, 2023 | ||||||||||||||||||||
| Transfers | Remuneration | Operating | Doubtful accounts and other allowances | Total | ||||||||||||||||
| PORTFOLIOS | ||||||||||||||||||||
| Assemblée nationale | 119 | 47 | 166 | |||||||||||||||||
| Personnes désignées par l’Assemblée nationale | 30 | 139 | 56 | 225 | ||||||||||||||||
| Affaires municipales et Habitation | 4 624 | 117 | 176 | 11 | 4 928 | |||||||||||||||
| Agriculture, Pêcheries et Alimentation | 1 038 | 208 | 85 | 6 | 1 337 | |||||||||||||||
| Conseil du trésor et Administration gouvernementale | 68 | 863 | 195 | 1 | 1 127 | |||||||||||||||
| Conseil exécutif | 603 | 129 | 42 | 774 | ||||||||||||||||
| Culture et Communications | 1 232 | 198 | 256 | 4 | 1 690 | |||||||||||||||
| Cybersécurité et Numérique | 63 | 109 | 172 | |||||||||||||||||
| Économie, Innovation et Énergie | 2 744 | 83 | 179 | 199 | 3 205 | |||||||||||||||
| Éducation | 1 095 | 14 194 | 4 200 | 10 | 19 499 | |||||||||||||||
| Emploi et Solidarité sociale | 8 372 | 442 | 145 | 24 | 8 983 | |||||||||||||||
| Enseignement supérieur | 4 597 | 3 958 | 1 119 | (19 | ) | 9 655 | ||||||||||||||
| Environnement, Lutte contre les changements climatiques, Faune et Parcs | 1 083 | 293 | 293 | 4 | 1 673 | |||||||||||||||
| Famille | 7 627 | 117 | 91 | 7 835 | ||||||||||||||||
| Finances | 1 263 | 1 215 | 542 | 345 | 3 365 | |||||||||||||||
| Immigration, Francisation et Intégration | 226 | 145 | 74 | 445 | ||||||||||||||||
| Justice | 340 | 758 | 388 | 7 | 1 493 | |||||||||||||||
| Langue française | 12 | 28 | 6 | 46 | ||||||||||||||||
| Relations internationales et Francophonie | 59 | 81 | 37 | 177 | ||||||||||||||||
| Ressources naturelles et Forêts | 461 | 265 | 753 | 1 | 1 480 | |||||||||||||||
| Santé et Services sociaux | 8 168 | 36 490 | 14 627 | 121 | 59 406 | |||||||||||||||
| Sécurité publique | 192 | 1 584 | 614 | 2 390 | ||||||||||||||||
| Tourisme | 324 | 64 | 143 | 1 | 532 | |||||||||||||||
| Transports et Mobilité durable | 2 699 | 708 | 3 035 | 9 | 6 451 | |||||||||||||||
| Travail | 19 | 135 | 35 | 189 | ||||||||||||||||
| Expenditure by portfolio | 46 876 | 62 396 | 27 247 | 724 | 137 243 | |||||||||||||||
| Debt service | 10 058 | |||||||||||||||||||
| Total expenditure | 147 301 | |||||||||||||||||||
| CONSOLIDATED FINANCIAL STATEMENTS | 189 |
Appendix 2
Segment disclosures (cont’d)
Consolidated statement of expenditure (cont’d)
(millions of dollars)
| Fiscal year ended March 31, 2022 (restated — Note 3) | ||||||||||||||||||||
| Doubtful accounts | ||||||||||||||||||||
| and other | ||||||||||||||||||||
| Transfers | Remuneration | Operating | allowances | Total | ||||||||||||||||
| PORTFOLIOS | ||||||||||||||||||||
| Assemblée nationale | 101 | 40 | 141 | |||||||||||||||||
| Personnes désignées par l’Assemblée nationale | 13 | 80 | 24 | 117 | ||||||||||||||||
| Affaires municipales et Habitation | 3 430 | 115 | 163 | (167 | ) | 3 541 | ||||||||||||||
| Agriculture, Pêcheries et Alimentation | 969 | 199 | 80 | 5 | 1 253 | |||||||||||||||
| Conseil du trésor et Administration gouvernementale | 51 | 843 | 231 | 1 | 1 126 | |||||||||||||||
| Conseil exécutif | 452 | 122 | 28 | 602 | ||||||||||||||||
| Culture et Communications | 1 282 | 182 | 250 | (2 | ) | 1 712 | ||||||||||||||
| Cybersécurité et Numérique | 36 | 43 | 79 | |||||||||||||||||
| Économie, Innovation et Énergie | 2 763 | 81 | 173 | 47 | 3 064 | |||||||||||||||
| Éducation | 1 016 | 12 836 | 3 548 | 5 | 17 405 | |||||||||||||||
| Emploi et Solidarité sociale | 7 811 | 410 | 140 | 24 | 8 385 | |||||||||||||||
| Enseignement supérieur | 4 095 | 3 675 | 981 | (4 | ) | 8 747 | ||||||||||||||
| Environnement, Lutte contre les changements climatiques, Faune et Parcs | 1 097 | 274 | 356 | 3 | 1 730 | |||||||||||||||
| Famille | 7 088 | 105 | 84 | 7 277 | ||||||||||||||||
| Finances | 1 129 | 1 107 | 446 | 289 | 2 971 | |||||||||||||||
| Immigration, Francisation et Intégration | 146 | 132 | 61 | 339 | ||||||||||||||||
| Justice | 266 | 715 | 357 | 15 | 1 353 | |||||||||||||||
| Langue française | 15 | 27 | 7 | 49 | ||||||||||||||||
| Relations internationales et Francophonie | 94 | 72 | 28 | 194 | ||||||||||||||||
| Ressources naturelles et Forêts | 344 | 260 | 542 | (2 | ) | 1 144 | ||||||||||||||
| Santé et Services sociaux | 6 626 | 35 969 | 13 996 | 77 | 56 668 | |||||||||||||||
| Sécurité publique | 127 | 1 465 | 483 | 2 075 | ||||||||||||||||
| Tourisme | 242 | 56 | 103 | 1 | 402 | |||||||||||||||
| Transports et Mobilité durable | 3 500 | 677 | 2 832 | 8 | 7 017 | |||||||||||||||
| Travail | 24 | 126 | 31 | 1 | 182 | |||||||||||||||
| Expenditure by portfolio | 42 580 | 59 665 | 25 027 | 301 | 127 573 | |||||||||||||||
| Debt service | 8 640 | |||||||||||||||||||
| Total expenditure | 136 213 | |||||||||||||||||||
| 190 | PUBLIC ACCOUNTS 2022-2023 |
Properties and fiduciary transactions
Properties held and fiduciary activities are entrusted to a government department or body (the trustee) to administer in accordance with applicable contractual or legal provisions. The trustee holds and administers the property for the benefit of, and on behalf of, designated beneficiaries. The property entrusted to a trustee must be for a specific purpose defined by the donor. Properties held and fiduciary activities are not included in the reporting entity as they are not owned by the government.
Accounts under administration (December 31)
Under administration of the Curateur public
Account under administration of the Educational Childcare Services Fund
under administration of the Ministère de la Famille
Caisse de dépôt et placement du Québec (December 31)
Cautionnements individuels des agents de voyages
under administration of the Office de la protection du consommateur
Comité Entraide – public and parapublic sectors
under administration of the Ministère du Travail, de l’Emploi et de la Solidarité sociale
Commission de la construction du Québec (December 31)
Compensation regime for municipal bodies
under administration of the Société québécoise de récupération et de recyclage
Conseil de gestion de l’assurance parentale (December 31)
Fonds central de soutien à la réinsertion sociale (December 31)
under administration of the Ministère de la Sécurité publique
Fonds d’assurance automobile du Québec (December 31)
under administration of the Société de l’assurance automobile du Québec
Fonds d’assurance-garantie
under administration of the Régie des marchés agricoles et alimentaires du Québec
Fonds d’assurance-récolte
Fonds d’assurance-stabilisation des revenus agricoles
under administration of the La Financière agricole du Québec
Fonds des pensions alimentaires
under administration of the Agence du revenu du Québec
Fonds d’indemnisation des clients des agents de voyages
under administration of the Office de la protection du consommateur
Fonds d’indemnisation des services financiers
under administration of the Autorité des marchés financiers
| CONSOLIDATED FINANCIAL STATEMENTS | 191 |
Appendix 3
Properties and fiduciary transactions (cont’d)
Guarantee fund
under administration of the Régie du bâtiment du Québec
Parental Insurance Fund (December 31)
under administration of the Conseil de gestion de l’assurance parentale (December 31)
Retraite Québec (December 31)
Trust fund under administration of the Bureau général de dépôts pour le Québec
under administration of the Ministère des Finances
Unclaimed property (December 31)
under administration of the Agence du revenu du Québec
Workforce Skills Development and Recognition Fund
under administration of the Ministère du Travail, de l’Emploi et de la Solidarité sociale
Note: When a fiscal year ends on a date other than March 31, the date is indicated in parentheses.
| 192 | PUBLIC ACCOUNTS 2022-2023 |
Fiduciary transactions conducted by the government
Summary of properties held and fiduciary transactions administered for designated beneficiaries
(millions of dollars)
| As at March 31, 2023 | ||||||||||||
| Assets | Liabilities | Net assets (liabilities) | ||||||||||
| Account under administration of the Educational Childcare Services Fund | 3 | 3 | — | |||||||||
| Accounts under administration(1), under administration of the Curateur public | 773 | 121 | 652 | |||||||||
| Caisse de dépöt et placement du Québec(1) | 473 807 | 71 920 | 401 887 | (2),(3) | ||||||||
| Cautionnements individuels des agents de voyages | 8 | (2) | 5 | 3 | ||||||||
| Comité Entraide – public and parapublic sectors | 5 | 5 | — | |||||||||
| Commission de la construction du Québec | ||||||||||||
| General administration fund(1) | 328 | 195 | 133 | |||||||||
| Supplemental Pension Plan(1): | ||||||||||||
| general account | 3 445 | (2) | 1 816 | 1 629 | ||||||||
| complementary account | 16 136 | (2) | 16 136 | — | ||||||||
| pensioners’ account | 9 179 | (2) | 9 486 | (307 | ) | |||||||
| Other funds(1) | 2 762 | 1 821 | 941 | |||||||||
| Conseil de gestion de l’assurance parentale(1) | 10 | 10 | — | |||||||||
| Parental Insurance Fund(1) | 467 | (2) | 93 | 374 | ||||||||
| Fonds central de soutien å la réinsertion sociale(1) | 2 | 2 | — | |||||||||
| Fonds d’assurance automobile du Québec(1) | 13 455 | (2) | 9 368 | 4 087 | ||||||||
| Fonds d’assurance-garantie | 12 | (2) | 12 | |||||||||
| Fonds d’assurance-récolte | 292 | (2) | 15 | 277 | ||||||||
| Fonds d’assurance-stabilisation des revenus agricoles | 9 | 117 | (108 | ) | ||||||||
| Fonds des pensions alimentaires | 180 | 180 | — | |||||||||
| Fonds d’indemnisation des clients des agents de voyages | 144 | (2) | 6 | 138 | ||||||||
| Fonds d’indemnisation des services financiers | 117 | (2) | 30 | 87 | ||||||||
| Guaranty fund | 36 | 36 | ||||||||||
| CONSOLIDATED FINANCIAL STATEMENTS | 193 |
Appendix 4
Fiduciary transactions conducted by the government (cont’d)
Summary of properties held and fiduciary transactions administered for designated beneficiaries (cont’d)
(millions of dollars)
| As at March 31, 2023 | ||||||||||||
| Assets | Liabilities | Net assets (liabilities) | ||||||||||
| Retraite Québec(1) | ||||||||||||
| Government pension plans – share paid by participants(1): | ||||||||||||
| RREGOP | 83 441 | (2) | 72 692 | 10 749 | ||||||||
| PPMP | 11 174 | (2) | 9 383 | 1 791 | ||||||||
| PPPOCS | 791 | (2) | 711 | 80 | ||||||||
| SPMSQ | 882 | (2) | 792 | 90 | ||||||||
| Other pension plans administered by Retraite Québec(1) | 428 | (2) | 342 | 86 | ||||||||
| Québec Pension Plan Fund(1) | ||||||||||||
| Québec Pension Plan – Base plan | 102 461 | (2) | 743 | 101 718 | ||||||||
| Québec Pension Plan – Additional plan | 5 780 | (2) | 1 | 5 779 | ||||||||
| Trust fund under administration of the Bureau général de dépôts pour le Québec | 1 218 | 1 218 | — | |||||||||
| Unclaimed property(1), under administration of the Agence du revenu du Québec | 254 | 130 | 124 | |||||||||
| Workforce Skills Development and Recognition Fund | 323 | 20 | 303 | |||||||||
| (1) | The data are as at December 31, 2022, that is, the end date of the trust fund’s fiscal year. |
| (2) | The funds of certain trusts are entrusted in whole or in part to the Caisse de dépôt et placement du Québec (the Caisse). The net assets of the Caisse, shown at fair value, included $245 098 M in funds entrusted to it by these trusts. |
| (3) | The net assets of the Caisse include assets taken into account in the government’s consolidated financial statements, particularly those of the Retirement Plans Sinking Fund and the Generations Fund. The fair value of these assets was $138 633 M. |
| 194 | PUBLIC ACCOUNTS 2022-2023 |
GLOSSARY
The following terms are used in the sections “Analysis of the consolidated financial statements” and “Consolidated financial statements” contained in this volume.
Accrual basis of accounting
The accrual basis of accounting is an accounting method that involves taking into account, in determining net results of the revenues earned and the expenditures incurred during a fiscal year, without considering the moment the transactions were settled through cash receipts or disbursements or in any other manner.
Advance borrowings
Advance borrowings are borrowings made by the general fund of the Consolidated Revenue Fund in a fiscal year to meet its financial requirements in the next fiscal year.
Budget balance
The budget balance and its calculation method are defined in the Balanced Budget Act (CQLR, chapter E-12.00001).
The budget balance measures the attainment of a balanced budget. For a given fiscal year, it is the result of the difference between the revenue and expenditure determined in accordance with the government’s accounting policies and taking into account the following adjustments:
| · | items not included in the budget balance: |
| i) | the revenue and expenditure recorded in the Generations Fund, |
| ii) | certain retroactive adjustments to revenue from government enterprises, |
| iii) | for fiscal 2012-2013, the result arising from discontinued operations following the decision to close the Gentilly-2 nuclear generating station, presented in Hydro-Québec’s annual consolidated financial statements; |
| · | items included in the budget balance: |
| i) | entries charged directly to the accumulated deficit, except for those resulting from: |
| (1) | the retroactive effect of any new CPA Canada standard or the years preceding the changeover year proposed by the CPA Canada, |
| (2) | accounting changes resulting from the 2006-2007 accounting reform appearing in the public accounts. |
Consolidated Revenue Fund
The Consolidated Revenue Fund consists of all money received or collected from various sources over which the Parliament of Québec has the power of appropriation. It comprises a general fund and special funds.
| PUBLIC ACCOUNTS 2022-2023 | 197 |
Glossary (cont’d)
Contingency Fund
The Contingency Fund is a provision administered by the Conseil du trésor which is intended in particular to cover unforeseen expenses that may arise in any of the government programs during the fiscal year, as well as the cost of certain measures announced in the budget.
Cost-sharing plans
Cost-sharing pension plans are joint plans for which the government’s responsibility for payment of the benefits granted by the plan is limited to its share of the cost of benefits accrued by employees.
Cost-balance plans
Cost-balance pension plans are plans for which the government covers the total cost of accrued benefits, net of the contributions paid by employees and certain employers.
Debt representing accumulated deficits
The debt representing accumulated deficits consists of the accumulated operating deficits and accumulated remeasurement gains and losses.
Derivative financial instruments
Derivative financial instruments are instruments whose value fluctuates according to an underlying instrument (for example, an interest rate, a foreign exchange rate, an index or the price of a commodity) without requiring the holding or delivery of the underlying instrument itself.
Effective interest method
The effective interest method is used to establish the amortized cost of a financial asset or financial liability (or a group of financial assets or financial liabilities), and to allocate interest income or interest expense appropriately between the fiscal years. The effective interest rate takes into account transaction costs, discounts and premiums.
Fair value
Fair value is the amount of the consideration that would be agreed upon in an arm’s length transaction between knowledgeable, willing parties who are under no compulsion to act.
Financial assets
Financial assets represent assets that are used to repay existing debts or to finance future operations. They are not intended to be used to deliver public services.
Financial instruments
Financial instruments are any contracts that give rise to financial assets, such as investments and loans, and financial liabilities or equity instrument, such as debt, derivatives and equities.
| 198 | PUBLIC ACCOUNTS 2022-2023 |
Glossary (cont’d)
Financial liabilities
Financial liabilities are liabilities corresponding to an obligation:
| · | to deliver cash or another financial asset; |
| · | to exchange financial instruments under conditions that are potentially unfavorable to the government. |
General fund
The general fund consists of money paid into the Consolidated Revenue Fund that has not been credited to a special fund under legislative provisions.
Generations Fund
Under the Act to reduce the debt and establish the Generations Fund (CQLR, chapter R-2.2.0.1), the Minister of Finance deposits the sums that make up this fund with the Caisse de dépôt et placement du Québec. These sums are used exclusively for repaying the government’s gross debt.
Government enterprises
A government enterprise has all of the following characteristics:
| · | it is a separate legal entity that has the authority to enter into contracts in its own name and to go before a court; |
| · | it is vested with the financial and administrative power to carry out commercial activities; |
| · | its main activity is the sale of goods or the delivery of services to individuals or to organizations not included in the government’s reporting entity; |
| · | it may, during the normal course of its operations, pursue its activities and settle its debts using revenue from sources not included in the government’s reporting entity. |
Gross debt
The gross debt corresponds to the sum of debts (before offsetting treasury securities), liabilities related to derivative financial instruments and the net liability regarding the pension plans and other employee future benefits. The balances of the Generations Fund, sinking funds relating to borrowings (before offsetting treasury securities), assets related to derivative financial instruments and advance borrowings are deducted from this sum.
Gross domestic product (GDP)
GDP is the value of all goods and services produced within the geographical limits of a country or a territory during a given calendar year.
Inventories
Inventories mainly consist of supplies and personal protective equipment (PPE) that are consumed in the normal course of operations during the coming fiscal years.
| PUBLIC ACCOUNTS 2022-2023 | 199 |
Glossary (cont’d)
Liabilities
Liabilities are obligations of the government toward third parties on the consolidated financial statement date arising from past transactions or events, and whose fulfilment will give rise to an outflow of resources representative of economic benefits in the future.
Net debt
The net debt corresponds to the difference between the government’s financial assets and its liabilities. It consists of accumulated deficits and non-financial assets.
Non-budget-funded bodies
Non-budget-funded bodies depend in whole or in part on departments for their funding. However, non-budget-funded bodies have more autonomy than those funded by budgetary appropriations. Although non-budget-funded bodies also answer to a minister, the legislation grants their management more extensive funding and operating powers.
Non-financial assets
Non financial assets represent assets that are used in the normal course of the government’s activities to deliver public services.
Organizations in the government’s networks
The network bodies are part of three networks:
| · | the health and social services network includes integrated health and social services centres, as well as other public institutions and regional authorities; |
| · | the education network includes school service centres and school boards; |
| · | the higher education network includes general and vocational colleges (CEGEPs) and the Université du Québec and its constituent universities. |
All of these organizations, which are funded largely through budgetary appropriations of their responsible department, are autonomous in regard to the delivery of public services. They are legal entities that are vested with the financial and administrative powers needed to provide public services. In addition, the government’s ability to dispose of their assets is subject to major restrictions.
Own-source revenue
Own-source revenue consists of revenue from income and property taxes, consumption taxes, duties and permits, miscellaneous sources and government enterprises.
| 200 | PUBLIC ACCOUNTS 2022-2023 |
Glossary (cont’d)
Retirement Plans Sinking Fund (RPSF)
Under the Financial Administration Act (CQLR, chapter A-6.001), the Minister of Finance may make long-term investments by depositing money from the general fund of the Consolidated Revenue Fund with the Caisse de dépôt et placement du Québec, up to an amount equal to the sums recognized as the pension plans liability, in order to create a sinking fund to provide for the payment of all or part of the benefits awarded under these plans.
Revenue from duties and permits
Revenue from duties and permits arises from transactions with consideration for which the Government grants a third party, in exchange for liquid assets, a right of use or an operating permit or issues a third party a certificate.
Sinking Fund relating to government borrowings
Under the Financial Administration Act (CQLR, chapter A-6.001), the Minister of Finance may create a sinking fund to provide for the repayment of any borrowing that is part of the government’s debt. To that end, the Minister may, with the authorization of the government, take out of the general fund of the Consolidated Revenue Fund any sum the Minister pays into the sinking fund. In addition, prudential liquid assets are kept in the sinking fund to enable the government to fulfill its financial commitments in the event of major disruptions in financial markets.
Special fund
A special fund is a fund established by an Act to provide for certain financial commitments of a minister, a budget-funded body or a non-budget-funded body exercising an adjudicative function. Legislative provisions determine which sums paid into the Consolidated Revenue Fund must be credited to a special fund.
Specified purpose account
A specified purpose account is a financial management mechanism created by a government order in council under the Financial Administration Act (CQLR, chapter A-6.001). It allows a department or a budget-funded body to account in a distinct way for funds paid into the general fund of the Consolidated Revenue Fund by a third party under a contract or an agreement that provides for the allocation of the funds to a specific purpose.
Supercategories
Supercategories consist of the categories used to account for expenditures, other than that of the debt service.
Transfer
This supercategory includes expenditures that are paid out to provide beneficiaries with various forms of financial support. For the government, these expenditures do not constitute direct acquisitions of goods or services or funds granted for the purpose of obtaining a return, as in the case of an investment, or amounts for which it expects to be repaid at a later date, as in the case of loans.
| PUBLIC ACCOUNTS 2022-2023 | 201 |
Glossary (cont’d)
Supercategories (cont’d)
Remuneration
This supercategory includes expenditures incurred for ordinary remuneration, overtime and certain other indemnities paid directly by the government to permanent and part-time employees and to casual employees, including students and seasonal employees. It also includes the remuneration of health professionals as well as salaries and allowances paid to members of the National Assembly, any person appointed or designated by the National Assembly to hold a public office and the personnel directed by that person, judges and members of the Sûreté du Québec. Lastly, it includes all benefits and other contributions paid by the government in its capacity as an employer, particularly, contributions to the pension plans, the Québec Pension Plan, the Québec Parental Insurance Plan and employment insurance.
Operating
This supercategory includes expenditures incurred in the course of administrative activities, apart from remuneration expenses, transfer expenses, doubtful accounts and other allowances, and debt service. In particular, it includes the estimated cost of reassessments and of the government’s new obligations regarding the remediation of contaminated sites, as well as the depreciation of fixed assets and accretion expenses.
Doubtful accounts and other allowances
This supercategory includes expenditures resulting from changes in the allowance for doubtful accounts, the allowance for losses on financial initiatives guaranteed by the government and the valuation allowance for loans, investments and advances.
Transfer expenditures
Transfers are economic benefits granted by a government to a recipient, for no consideration in goods or services and for which the government does not expect to be reimbursed at a later date or to obtain a direct financial return.
| 202 | PUBLIC ACCOUNTS 2022-2023 |