
Exhibit 99.9
| Highlights |
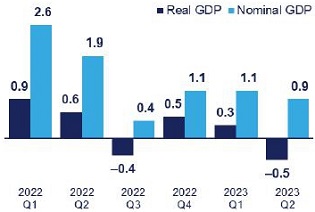
The Québec economy has been slowing down since the start of 2023. For the first two quarters, real GDP grew by just 0.5%, compared with 2.5% for the same period in 2022. Inflation continues to decelerate, but price growth remains high.
Recent developments in the economic situation have an adverse impact, in particular, on corporate tax revenues. Moreover, low precipitation in the summer of 2023 is leading to downward adjustments in revenue from government enterprises. Accordingly, a $635-million deterioration in the financial framework since the fall 2023 update is anticipated. However, the $500-million contingency reserve is used to largely offset the adjustments. As a result, the projected budgetary deficit for 2023-2024 is revised upwards by $135 million and now stands at $4.1 billion, after deposits of dedicated revenues to the Generations Fund.
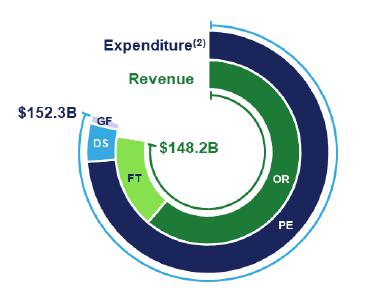
Based on April to September 2023 results and currently known factors that will affect the financial framework between now and the end of the fiscal year, revenues are expected to reach $148.2 billion for the year as a whole, while expenditures, including deposits of dedicated revenues in the Generations Fund, are expected to total $152.3 billion.
The net debt burden is expected to be 38.2% of GDP as at March 31, 2024, which is 0.3 percentage points higher than forecast in the fall 2023 update, due in part to a downward revision of nominal GDP in 2022.
Moreover, since the start of 2023-2024,(1) borrowings made amount to $21.2 billion, or 96.6% of the projected program.
Budget forecasts for fiscal year 2023-2024 (billions of dollars) | A budgetary deficit of $4.1B for 2023-2024 | ||
 |  | Own-source revenue
| |
 | Federal transfers
| ||
 | Portfolio expenditures
| ||
 | Debt service
| ||
 | Deposits of dedicated revenues in the Generations Fund $2.1B(3) | ||
Note to the reader
The Report on Québec’s Financial Situation provides an overview of the Québec government’s financial results. It is prepared with a view to increasing the transparency of public finances and regularly monitoring the achievement of the budgetary balance target for the fiscal year. The financial information presented in the report is not audited and is based on the accounting policies in the government’s annual financial statements.
The Report on Québec’s Financial Situation – Third Quarter of 2023-2024 will be published in March 2024.
Section 1: Recent Developments and Budgetary Outlook in Brief
| Recent developments in the economic situation |
Real GDP growth slowed in 2023 following a strong increase of 2.5% in 2022. For the first two quarters of 2023, compared to the corresponding period in 2022, real GDP growth was 0.5% (+0.3% in the first quarter and −0.5% in the second quarter of 2023).
| ■ | The moderation in economic activity coincides with monetary tightening by the Bank of Canada, which is intended to curb inflationary pressures. |
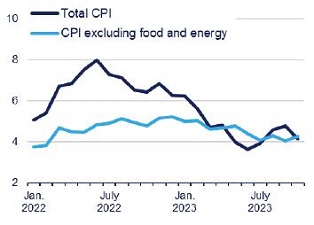
The actions taken so far by the Bank of Canada are bearing fruit. Price increases are slowing down.
| ■ | The annual change in the consumer price index (CPI) stood at 4.2% in October 2023 after peaking at 8.0% in June 2022. Despite this slowdown, price levels remain high. |
As a result, nominal GDP growth is moderating. Following an increase of 9.6% in 2022, it stood at 4.0% for the first two quarters of 2023 compared with the corresponding period in 2022.
Despite the economic slowdown, labour market conditions remained tense. The unemployment rate for the first eleven months of 2023 averaged 4.4%, close to the all-time low recorded for 2022 (4.3%). On average for January to November 2023, the employment rate for people aged 15 to 64 peaked at 78.5%. However, the monthly unemployment rate is increasing, from 3.9% in January 2023 to 5.2% in November 2023.
The tensions in the labour market are reflected in wages and salaries, which increased by 6.1% in the first three quarters of 2023 compared to the same period in 2022.
Significant wage gains and high price levels supported household spending, which increased by 8.3% in the first two quarters of 2023 compared to the same period in 2022.
As for businesses, the net operating surplus of corporations fell by 8.8% in the first two quarters of 2023 compared with the same period in 2022. This decline was due in particular to lower commodity prices, which affected the prices of natural resources exports.
Change in economic activity in Québec (real and nominal GDP, quarterly percentage change) | Consumer price index in Québec (annual percentage change) | |
 |  |
| Report on Québec’s Financial Situation – Second Quarter of 2023-2024 |
Page 2 | 23 |
Section 1: Recent Developments and Budgetary Outlook in Brief
| Summary of results and financial outlook for 2023-2024 |
► Results as at September 30, 2023
For the first six months of 2023-2024, the budgetary balance within the meaning of the Balanced Budget Act shows a deficit of $409 million. This represents a decrease of $3.8 billion in the budgetary balance compared to the same time last year.
This result is due to the following factors:
| ■ | revenues of $71.3 billion, up 1.4% compared with the same period last year. This increase was mainly due to a growth in revenues from federal transfers, because of a one-off increase in the Canada Health Transfer envelope. However, the increase in federal transfers has been attenuated by lower own-source revenues in the context of an economic slowdown; |
| ■ | expenditures of $70.8 billion, up 8.3% compared with the same period last year. This growth is mainly attributable to portfolio expenditures (9.6%), primarily in health and social services, and education; |
| ■ | deposits of dedicated revenues in the Generations Fund of $977 million. |
Summary of results as at September 30, 2023 and budgetary outlook for 2023-2024
(unaudited data, millions of dollars, year-over-year change)
| Forecast for fiscal year 2023-2024 | ||||||||||||||||||||||||||||||||||||
| April to September | Fall 2023 update | New estimate | ||||||||||||||||||||||||||||||||||
| 2022- 2023 | 2023- 2024 | Change ($M) | Change (%) | Level ($M) | Change (%) | Adjustment ($M) | Level ($M) | Change (%)(4) | ||||||||||||||||||||||||||||
| Own-source revenue | 56 455 | 56 379 | –76 | –0.1 | 117 554 | 1.7 | –842 | 116 712 | 1.0 | |||||||||||||||||||||||||||
| Federal transfers | 13 874 | 14 942 | 1 068 | 7.7 | 31 497 | 9.6 | — | 31 497 | 9.6 | (5) | ||||||||||||||||||||||||||
| Total revenue | 70 329 | 71 321 | 992 | 1.4 | 149 051 | 3.3 | –842 | 148 209 | 2.7 | |||||||||||||||||||||||||||
| Portfolio expenditures | −59 985 | −65 756 | −5 771 | 9.6 | –140 438 | 2.3 | — | −140 438 | 2.3 | (6) | ||||||||||||||||||||||||||
| Debt service | −5 344 | −4 997 | 347 | –6.5 | –9 867 | –1.9 | 85 | −9 782 | –2.7 | |||||||||||||||||||||||||||
| Total expenditure | −65 329 | −70 753 | −5 424 | 8.3 | –150 305 | 2.0 | 85 | −150 220 | 2.0 | |||||||||||||||||||||||||||
| Contingency reserve | — | — | — | — | –500 | — | 500 | — | — | |||||||||||||||||||||||||||
OPERATING SURPLUS (DEFICIT)(7) | 5 000 | 568 | −4 432 | — | –1 754 | — | –257 | −2 011 | — | |||||||||||||||||||||||||||
| BALANCED BUDGET ACT | ||||||||||||||||||||||||||||||||||||
| Deposits of dedicated revenues in the Generations Fund(3) | −1 578 | –977 | 601 | — | –2 241 | — | 122 | −2 119 | — | |||||||||||||||||||||||||||
| BUDGETARY BALANCE(8) | 3 422 | –409 | −3 831 | — | –3 995 | — | –135 | (9) | −4 130 | — | ||||||||||||||||||||||||||
| Report on Québec’s Financial Situation – Second Quarter of 2023-2024 |
Page 3 | 23 |
Section 1: Recent Developments and Budgetary Outlook in Brief
► Budgetary outlook for 2023-2024
Recent developments in economic activity and the decline in electricity exports have a negative impact on revenue and lead to a deterioration of $635 million in the financial framework in 2023-2024 since the fall 2023 update. However, the $500-million contingency reserve is used to largely offset the adjustments.
| ■ | As a result, the projected budgetary deficit for 2023-2024 is revised upwards by $135 million and now stands at $4.1 billion, after deposits of dedicated revenues to the Generations Fund. |
Based on April to September 2023 results and currently known factors that will affect the financial framework between now and the end of the fiscal year, revenues are expected to reach $148.2 billion, while expenditures, including deposits of dedicated revenues in the Generations Fund, are expected to total $152.3 billion.
| ■ | Revenues are adjusted downward by $842 million and are expected to stand at $148.2 billion, an annual growth of 2.7% compared to 2022-2023. |
| ■ | Own-source revenue excluding revenue from government enterprises is revised downwards by $472 million due to recent economic developments, which have resulted in lower tax revenues since the beginning of the fiscal year. |
| ■ | Revenue from government enterprises is revised downward by $370 million, mainly due to: |
| ■ | lower exports by Hydro-Québec, resulting from low precipitation in the geographic regions where its main reservoirs are located; |
| ■ | lower revenues from Investissement Québec, due to an increase in the provision for losses resulting from the decline in the value of certain investments. |
| ■ | Expenditures are revised downward by $85 million and are expected to total $150.2 billion, with annual growth of 2.0% compared to 2022-2023. |
| ■ | Portfolio expenditures remain unchanged from the fall 2023 update and are expected to total $140.4 billion (annual growth of 2.3%). |
| ■ | Debt service is revised downwards by $85 million, due to the recent decline in interest rates, to $9.8 billion (annual change of −2.7%). |
| ■ | Deposits of dedicated revenues in the Generations Fund are revised downwards by $122 million to $2.1 billion, due to lower revenues from water-power royalties and investment income. |
► Additional information
The net debt burden is forecast at 38.2% of GDP as at March 31, 2024, 0.3 percentage points higher than forecast in the fall 2023 update, due in part to a downward revision of nominal GDP in 2022.
| Report on Québec’s Financial Situation – Second Quarter of 2023-2024 |
Page 4 | 23 |
Section 2: Detailed Results and Budgetary Outlook |
Revenue
Own-source revenue |
| Highlights | Quarterly own-source revenue (millions of dollars) | |
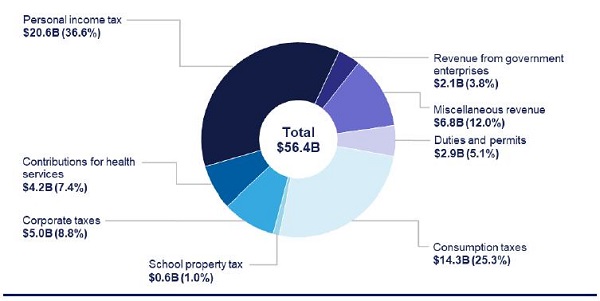
Own-source revenue of $56.4 billion as at September 30, 2023.
Cumulative change of −0.1% year over year. |  |
► Results as at September 30, 2023
As at September 30, that is, for the first six months of 2023-2024, own-source revenue amounted to $56.4 billion. This represents a year-over-year decrease of $76 million (−0.1%) compared to the same period previous year.
Tax revenue decreased by $769 million (−1.7%), to $44.6 billion. These results are essentially attributable to:
| ■ | a $393-million decrease (−1.9%) in personal income tax, due mainly to the lowering of the first two tax brackets announced in the 2023-2024 budget; |
| ■ | a $269-million increase (6.9%) in contributions for health services, due mainly to the 6.1% growth in wages and salaries in the first three quarters of 2023; |
| ■ | a $988-million decrease (−16.6%) in corporate tax revenues, due in particular to the 8.8% decline in net operating surplus of corporations for the first two quarters of 2023 and the increase in refunds for overpaid instalments; |
| ■ | a $324-million increase (2.3%) in consumption taxes, due to the 8.3% growth in household consumption for the first two quarters of 2023. Growth in household consumption was partly offset by a 20.9% decline in residential investment over the same period. |
Other own-source revenue rose by $940 million (10.8%) to $9.6 billion due to:
| ■ | a $187-million decrease (−6.1%) in duties and permits, resulting mainly from lower mining revenues; |
| ■ | a $1.1-billion increase (20.0%) in miscellaneous revenues, due in part to the favourable change in investment income from the Generations Fund in 2023, which in 2022-2023 was below its usual level, as well as higher interest income related to tax debts administered by the Agence du revenu du Québec. |
| Report on Québec’s Financial Situation – Second Quarter of 2023-2024 |
Page 5 | 23 |
Section 2: Detailed Results and Budgetary Outlook |
Revenue from government enterprises decreased by $247 million (−10.4%) to $2.1 billion.
| ■ | This change is mainly attributable to a decrease in Hydro-Québec’s results, mainly due to the lower value of its exports due to low precipitation in the geographic regions where its main reservoirs are located. |
| ■ | This decrease is offset by the improvement in Investissement Québec’s results, which had been affected in 2022-2023 by unfavourable financial market results. |
| Own-source revenue |
| (unaudited data, millions of dollars, year-over-year change) |
| Forecast for fiscal year 2023-2024 | ||||||||||||||||||||||||||||||||||
| April to September | Fall 2023 update | New estimate | ||||||||||||||||||||||||||||||||
2022- | 2023- | Change ($M) | Change (%) | Level ($M) | Change (%) | Adjustment ($M) | Level ($M) | Change (%)(4) | ||||||||||||||||||||||||||
| Income and property taxes | ||||||||||||||||||||||||||||||||||
| – Personal income tax | 20 998 | 20 605 | –393 | –1.9 | 42 677 | 1.0 | — | 42 677 | 1.0 | |||||||||||||||||||||||||
| – Contributions for health services | 3 918 | 4 187 | 269 | 6.9 | 8 310 | 5.0 | — | 8 310 | 5.0 | |||||||||||||||||||||||||
| – Corporate taxes | 5 957 | 4 969 | –988 | –16.6 | 12 563 | –5.1 | –300 | 12 263 | –7.4 | |||||||||||||||||||||||||
| – School property tax | 548 | 567 | 19 | 3.5 | 1 126 | 1.2 | — | 1 126 | 1.2 | |||||||||||||||||||||||||
| Consumption taxes | 13 955 | 14 279 | 324 | 2.3 | 27 367 | 2.9 | –50 | 27 317 | 2.7 | |||||||||||||||||||||||||
| Tax revenue | 45 376 | 44 607 | –769 | –1.7 | 92 043 | 1.0 | –350 | 91 693 | 0.6 | |||||||||||||||||||||||||
| Duties and permits | 3 057 | 2 870 | –187 | –6.1 | 5 821 | 1.4 | –38 | 5 783 | 0.7 | |||||||||||||||||||||||||
| Miscellaneous revenue | 5 648 | 6 775 | 1 127 | 20.0 | 13 714 | 13.5 | –84 | 13 630 | 12.8 | |||||||||||||||||||||||||
| Other own-source revenue | 8 705 | 9 645 | 940 | 10.8 | 19 535 | 9.6 | –122 | 19 413 | 8.9 | |||||||||||||||||||||||||
| Total own-source revenue excluding revenue from government enterprises | 54 081 | 54 252 | 171 | 0.3 | 111 578 | 2.4 | –472 | 111 106 | 2.0 | |||||||||||||||||||||||||
| Revenue from government enterprises | 2 374 | 2 127 | –247 | –10.4 | 5 976 | –9.7 | –370 | 5 606 | –15.3 | |||||||||||||||||||||||||
| TOTAL | 56 455 | 56 379 | –76 | –0.1 | 117 554 | 1.7 | –842 | 116 712 | 1.0 | |||||||||||||||||||||||||
| Report on Québec’s Financial Situation – Second Quarter of 2023-2024 |
Page 6 | 23 |
Section 2: Detailed Results and Budgetary Outlook |
► Budgetary outlook for 2023-2024
Own-source revenue is forecast at $116.7 billion in 2023-2024 (annual growth of 1.0%), a downward adjustment of $842 million from the fall 2023 update forecast.
| ■ | Recent developments in the economic situation and the decline in tax revenues should result in own-source revenue excluding revenue from government enterprises being $472 million lower for 2023-2024. |
| ■ | The $300-million decrease in corporate taxes is explained by the downward revision of 10.1 percentage points in the growth of net operating surplus of corporations in 2022, which will continue to have a negative impact on revenues in 2023-2024. Thus, projected growth goes from −5.1% to −7.4%. |
| ■ | The $50-million decrease in consumption taxes is due to higher-than-expected QST refunds, which have a negative impact on the forecast for 2023-2024. For this reason, projected growth goes from 2.9% to 2.7%. |
| ■ | The $38-million decrease in duties and permits stems from lower revenues from water-power royalties, bringing projected growth from 1.4% to 0.7%. |
| ■ | The $84-million decrease in miscellaneous revenue stems from a decrease in investment income of the Generations Fund, bringing projected growth from 13.5% to 12.8%. |
| ■ | The forecast for revenues from government enterprises has been revised downwards by $370 million, bringing projected growth from −9.7% to −15.3%. This revision is mainly due to: |
| ■ | lower exports from Hydro-Québec, due to low precipitation in the geographic regions where its main reservoirs are located; |
| ■ | lower revenues from Investissement Québec due to an increase in the provision for losses resulting from the decline in the value of certain investments, and a decrease in venture capital and investment fund portfolios. |
| Report on Québec’s Financial Situation – Second Quarter of 2023-2024 |
Page 7 | 23 |
Section 2: Detailed Results and Budgetary Outlook |
Composition of own-source revenue
Own-source revenue excluding revenue from government enterprises consists mainly of tax revenue, that is personal income tax, contributions for health services, corporate taxes, school property tax and consumption taxes.
| ■ | Changes in own-source revenue generally reflect changes in economic activity in Québec and in the tax system. |
Own-source revenue also includes other sources of revenue:
| ■ | duties and permits, in particular revenue from the carbon market; |
| ■ | miscellaneous revenue, such as tuition fees and revenues from interest, the sale of goods and services, as well as fines, forfeitures and recoveries. |
Government enterprises consist of public corporations that play a commercial role, have managerial autonomy and are financially self-sufficient.
| ■ | Revenue from government enterprises corresponds in large part to the net earnings of these enterprises. |
Own-source revenue as at September 30, 2023 (billions of dollars, percentage of total own-source revenue) |
|
| Report on Québec’s Financial Situation – Second Quarter of 2023-2024 |
Page 8 | 23 |
Section 2: Detailed Results and Budgetary Outlook |
Revenue
Federal transfers
| Highlights | Quarterly federal transfers (millions of dollars) | |
Federal transfers of $14.9 billion as at September 30, 2023.
Cumulative growth of 7.7% year over year. | 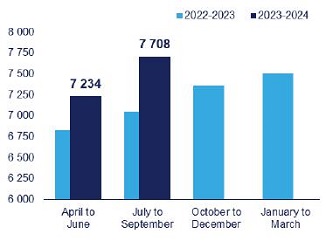 |
► Results as at September 30, 2023
As at September 30, that is, for the first six months of 2023-2024, federal transfers amount to $14.9 billion. This represents a year-over-year increase of $1.1 billion (7.7%). This change is mainly attributable to an increase in revenue from health transfers, a portion of which is non-recurring.
| ■ | Revenue from health transfers rose by $672 million (18.0%) to $4.4 billion, due in part to growth in the Canada Health Transfer (CHT), linked to changes in Canada’s nominal GDP and a one-off increase of $2.0 billion in this transfer (Québec’s share being $447 million). |
| Federal transfers |
(unaudited data, millions of dollars, year-over-year change) |
| Forecast for fiscal year 2023-2024 | ||||||||||||||||||||||||||||||||||||
| April to September | Fall 2023 update | New estimate | ||||||||||||||||||||||||||||||||||
| 2022- 2023 | 2023- 2024 | Change ($M) | Change (%) | Level ($M) | Change (%) | Adjustment ($M) | Level ($M) | Change (%)(4),(5) | ||||||||||||||||||||||||||||
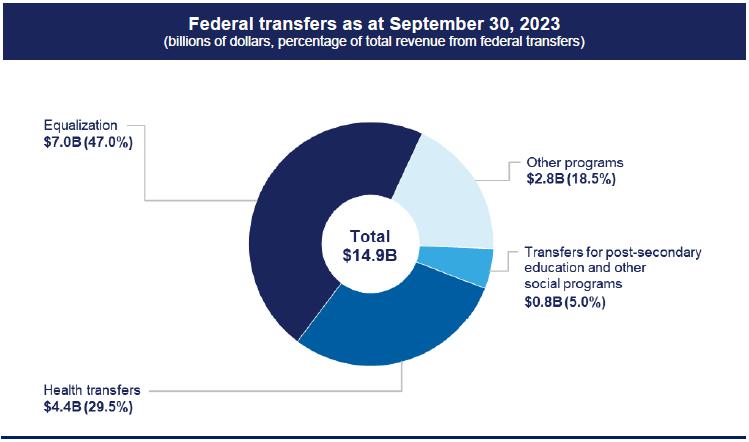
| Equalization | 6 833 | 7 019 | 186 | 2.7 | 14 037 | 2.7 | — | 14 037 | 2.7 | |||||||||||||||||||||||||||
| Health transfers | 3 733 | 4 405 | 672 | 18.0 | 8 810 | 24.4 | — | 8 810 | 24.4 | |||||||||||||||||||||||||||
| Transfers for post-secondary education and other social programs | 746 | 750 | 4 | 0.5 | 1 499 | 15.8 | — | 1 499 | 15.8 | |||||||||||||||||||||||||||
| Other programs | 2 562 | 2 768 | 206 | 8.0 | 7 151 | 6.8 | — | 7 151 | 6.8 | |||||||||||||||||||||||||||
| TOTAL | 13 874 | 14 942 | 1 068 | 7.7 | 31 497 | 9.6 | — | 31 497 | 9.6 | |||||||||||||||||||||||||||
| Report on Québec’s Financial Situation – Second Quarter of 2023-2024 |
Page 9 | 23 |
Section 2: Detailed Results and Budgetary Outlook |
► Budgetary outlook for 2023-2024
Federal transfers are expected to stand at $31.5 billion in 2023-2024 (annual growth of 9.6%), the same level that was forecast in the fall 2023 update.
Composition of federal transfers
Revenue from federal transfers consist of federal government revenues paid to Québec under the Federal-Provincial Fiscal Arrangements Act, in addition to revenues from other programs under bilateral agreements.
These revenues mainly come from:
| ■ | the equalization program; |
| ■ | the Canada Health Transfer (CHT); |
| ■ | the Canada Social Transfer (CST); |
| ■ | other programs resulting from agreements with the federal government in various fields (e.g.: immigrant integration, early learning and childcare, labour market and infrastructure). |
| Federal transfers as at September 30, 2023 |
| (billions of dollars, percentage of total revenue from federal transfers) |
 |
| Report on Québec’s Financial Situation – Second Quarter of 2023-2024 |
Page 10 | 23 |
Section 2: Detailed Results and Budgetary Outlook |
Expenditure
Portfolio expenditures and debt service
| Highlights | Quarterly expenditure (millions of dollars) | |
Expenditures
Cumulative growth of 8.3% | 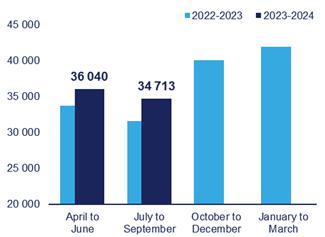 |
► Results as at September 30, 2023
As at September 30, that is, for the first six months of 2023-2024, expenditures amounted to $70.8 billion. This represents a year-over-year increase of $5.4 billion (8.3%).
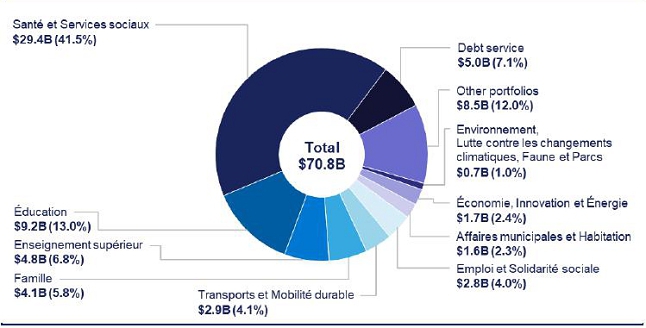
Portfolio expenditures rose by $5.8 billion (9.6%) to $65.8 billion. In addition to the expected change in costs related to the provision of public services, the growth observed as at September 30, 2023 is explained by the following factors:
| ■ | expenditure in the Santé et Services sociaux portfolio increased by $2.2 billion (8.2%) to $29.4 billion. This increase is due in part to the enhancement of the senior assistance amount announced in December 2022; |
| ■ | expenditure in the Éducation portfolio increased by $735 million (8.7%) to $9.2 billion. This increase is attributable in particular to changes in clienteles and staff remuneration in school service centres and school boards; |
| ■ | expenditure in the Enseignement supérieur portfolio increased by $397 million (9.0%) to $4.8 billion. This increase is mainly due to the Perspective Québec incentive scholarship program introduced in September 2022; |
| ■ | expenditure in the Famille portfolio increased by $214 million (5.5%) to $4.1 billion. This increase is attributable in part to the increase of the Family Allowance; |
| ■ | expenditure in the Transports et Mobilité durable portfolio rose by $361 million (13.9%) to $2.9 billion. This increase is explained in particular by the expenses related to subsidized public transit infrastructure projects; |
| ■ | expenditure in the Emploi et Solidarité sociale portfolio increased by $212 million (8.2%) to $2.8 billion. This change is mainly due to an increase in last-resort financial assistance programs; |
| Report on Québec’s Financial Situation – Second Quarter of 2023-2024 |
Page 11 | 23 |
Section 2: Detailed Results and Budgetary Outlook |
| ■ | expenditure in the Affaires municipales et Habitation portfolio decreased by $136 million (−7.9%) to $1.6 billion. This change is attributable, among other things, to grants paid in September 2022 to promote access to quality and affordable housing, which have a downward impact on growth in 2023-2024; |
| ■ | expenditure in the Économie, Innovation et Énergie portfolio increased by $389 million (29.4%) to $1.7 billion. This increase is due in particular to the increase in tax credit for investment and innovation and for research and development tax credits; |
| ■ | expenditure in the Environnement, Lutte contre les changements climatiques, Faune et Parcs portfolio increased by $155 million (29.0%), to $689 million. This change is attributable in particular to the cost of actions contributing to the reduction of greenhouse gas emissions; |
| ■ | expenditure in other portfolios rose by $1.2 billion (16.8%) to $8.5 billion. |
Debt service expenditure decreased by $347 million (−6.5%) and stood at $5.0 billion. This decrease is mainly due to the non-recurrence of losses on the disposal of assets as part of the management of the investment activities of the Sinking Fund for Government Borrowings. The rapid rise in interest rates in 2022-2023 had resulted in significant losses.
| Expenditure |
| (unaudited data, millions of dollars, year-over-year change) |
| Forecast for fiscal year 2023-2024 | ||||||||||||||||||||||||||||||||||||
| April to September | Fall 2023 update | New estimate | ||||||||||||||||||||||||||||||||||
| 2022- 2023 (10) | 2023- 2024 | Change ($M) | Change (%) | Level ($M) | Change (%) | Adjustment ($M) | Level ($M) | Change (%)(4) | ||||||||||||||||||||||||||||
| Santé et Services sociaux | 27 213 | 29 438 | 2 225 | 8.2 | 59 097 | –0.5 | — | 59 097 | –0.5 | |||||||||||||||||||||||||||
| Éducation | 8 485 | 9 220 | 735 | 8.7 | 19 930 | 1.9 | — | 19 930 | 2.2 | |||||||||||||||||||||||||||
| Enseignement supérieur | 4 394 | 4 791 | 397 | 9.0 | 10 334 | 7.0 | — | 10 334 | 7.0 | |||||||||||||||||||||||||||
| Famille | 3 870 | 4 084 | 214 | 5.5 | 8 368 | 6.8 | — | 8 368 | 6.8 | |||||||||||||||||||||||||||
| Transports et Mobilité durable | 2 588 | 2 949 | 361 | 13.9 | 6 809 | 5.5 | — | 6 809 | 5.5 | |||||||||||||||||||||||||||
| Emploi et Solidarité sociale | 2 599 | 2 811 | 212 | 8.2 | 5 478 | –39.0 | — | 5 478 | –39.0 | |||||||||||||||||||||||||||
| Affaires municipales et Habitation | 1 725 | 1 589 | –136 | –7.9 | 4 739 | –3.8 | — | 4 739 | –3.8 | |||||||||||||||||||||||||||
| Économie, Innovation et Énergie | 1 325 | 1 714 | 389 | 29.4 | 3 861 | 20.5 | — | 3 861 | 20.5 | |||||||||||||||||||||||||||
| Environnement, Lutte contre les changements climatiques, Faune et Parcs | 534 | 689 | 155 | 29.0 | 2 442 | 46.0 | — | 2 442 | 46.0 | |||||||||||||||||||||||||||
| Other portfolios | 7 252 | 8 471 | 1 219 | 16.8 | 19 380 | 24.2 | — | 19 380 | 24.2 | |||||||||||||||||||||||||||
| Portfolio expenditures | 59 985 | 65 756 | 5 771 | 9.6 | 140 438 | 2.3 | — | 140 438 | 2.3 | (6) | ||||||||||||||||||||||||||
| Debt service | 5 344 | 4 997 | –347 | –6.5 | 9 867 | –1.9 | –85 | 9 782 | –2.7 | |||||||||||||||||||||||||||
| TOTAL | 65 329 | 70 753 | 5 424 | 8.3 | 150 305 | 2.0 | –85 | 150 220 | 2.0 | |||||||||||||||||||||||||||
| Report on Québec’s Financial Situation – Second Quarter of 2023-2024 |
Page 12 | 23 |
Section 2: Detailed Results and Budgetary Outlook
► Budgetary outlook for 2023-2024
Expenditure is forecast at $150.2 billion in 2023-2024 (annual growth of 2.0%), a downward revision of $85 million from the fall 2023 update.
| ■ | Portfolio expenditures remain unchanged from the fall 2023 update and are expected to total $140.4 billion (annual growth of 2.3%). |
| ■ | While growth in the first six months of the year was higher (9.6%), a downturn in annual growth is anticipated, which is attributable to the impact of the new one-time cost of living support payment accounted for in November 2022, and the impact of the enhancement of the senior assistance amount and of the Perspective Québec Scholarship Program, accounted for starting in December 2022. |
| ■ | Debt service is revised downwards by $85 million, due to the recent decline in interest rates, to $9.8 billion (annual change of −2.7%). |
Composition of portfolio expenditures
Portfolio expenditures represent the total resources allocated to the delivery of public services. The government implements programs that are administered directly by government entities such as departments and organizations.
| ■ | Programs and entities under a minister’s responsibility constitute a portfolio. |
Portfolio expenditures are made up of:
| ■ | program expenditures; |
| ■ | expenditures incurred notably by special funds, non-budget-funded bodies, as well as bodies in the health and social services, education and higher education networks; |
| ■ | tax-funded expenditures, which consist of refundable tax credits and the expense for doubtful accounts associated with tax revenues. |
The composition and expenditure level of each portfolio vary according to the nature of the function and programs under the minister’s responsibility. As a result, some portfolios will incur more expenses than others, depending on their mission.
In 2023-2024, there are 24 ministerial portfolios. The three main ones, Santé et Services sociaux, Éducation, and Enseignement supérieur, account for nearly 65% of portfolio expenditures.
Composition of debt service
Debt service represents the sum of interest on direct debt and interest on other employee future benefits liabilities in the public and parapublic sectors.
It depends in particular on the size of the debt and interest rates on financial markets. Each year, the government must devote a portion of its revenues to making interest payments.
| Report on Québec’s Financial Situation – Second Quarter of 2023-2024 |
Page 13 | 23 |
Section 2: Detailed Results and Budgetary Outlook
Expenditure as at September 30, 2023
(billions of dollars, percentage of total expenditure)
| Report on Québec’s Financial Situation – Second Quarter of 2023-2024 |
Page 14 | 23 |
Section 3: Additional Information
Debt
As at March 31, 2024, net debt is forecast to stand at $217.1 billion, or 38.2% of GDP. Compared to the fall 2023 update, this is an upward revision of 0.3 percentage points of GDP due to a downward revision of nominal GDP in 2022, partially offset by an $826-million decrease in the level of net debt. The decrease in the level of debt results mainly from the completion of work on the valuation of asset retirement obligations as part of Public Accounts 2022-2023.
| Net debt as at March 31, 2024 |
| (millions of dollars) |
Fall 2023 | Adjustment | New estimate | ||||||||||
| NET DEBT, BEGINNING OF YEAR | 209 795 | −1 083 | 208 712 | |||||||||
| % OF GDP | 38.0 | 0.3 | 38.3 | |||||||||
| Budgetary deficit (surplus) | 3 995 | 135 | 4 130 | |||||||||
| Capital investments | 6 690 | — | 6 690 | |||||||||
Accounting adjustments | −341 | — | –341 | |||||||||
| Deposits of dedicated revenues in the Generations Fund | –2 241 | 122 | –2 119 | |||||||||
| Total change | 8 103 | 257 | 8 360 | |||||||||
| NET DEBT, END OF YEAR | 217 898 | –826 | 217 072 | |||||||||
| % OF GDP | 37.9 | 0.3 | 38.2 | |||||||||
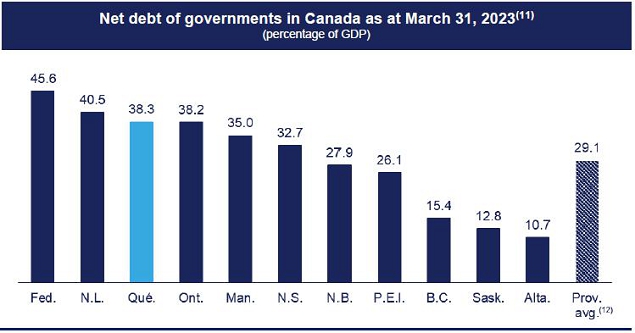
As at March 31, 2023, Québec’s net debt-to-GDP ratio stood at 38.3%, compared to 29.1% for the provincial average. The government is committed to gradually reducing Québec’s net debt to 30% of GDP by fiscal year 2037-2038.
| Net debt of governments in Canada as at March 31, 2023(11) |
| (percentage of GDP) |
| Report on Québec’s Financial Situation – Second Quarter of 2023-2024 |
Page 15 | 23 |
Section 3: Additional Information
Net Financial Surpluses or Requirements
For the period of April to September 2023, net financial requirements amount to $9.4 billion and are due to:
| ■ | the $568-million surplus resulting from the difference between government revenues and expenditures; |
| ■ | the $2.3-billion financial requirements for investments, loans and advances, which result in particular from an increase in the equity value of government enterprises;(13) |
| ■ | the $2.6-billion financial requirements related to government capital investments, mainly due to investments of $5.4 billion, notably for the refurbishment and construction of healthcare facilities, which investments were partially offset by amortization expenses of $2.7 billion;(13) |
| ■ | the $1.7-billion financial requirements related to retirement plans and other employee future benefits, resulting from the payment of government employee benefits of $3.5 billion, partially offset by the net cost of plans of $1.8 billion;(13) |
| ■ | the $2.4-billion financial requirements from other accounts,(14) arising in particular from disbursements relating to expenses recognized at the end of 2022-2023; |
| ■ | the $977-million financial requirements generated by payments to the Generations Fund. |
| Net financial surpluses or requirements |
| (unaudited data, millions of dollars) |
| April to September | ||||||||
| 2022-2023 | 2023-2024 | |||||||
| OPERATING SURPLUS (DEFICIT) | 5 000 | 568 | ||||||
| Non-budgetary transactions | ||||||||
| Investments, loans and advances | –647 | −2 283 | ||||||
| Capital investments | −1 640 | −2 631 | ||||||
| Retirement plans and other employee future benefits | −1 436 | −1 687 | ||||||
| Other accounts(14) | −5 442 | −2 438 | ||||||
| Deposits in the Generations Fund | −1 578 | –977 | ||||||
| Total non-budgetary transactions | −10 743 | −10 016 | ||||||
| NET FINANCIAL SURPLUSES (REQUIREMENTS) | −5 743 | −9 448 | ||||||
| Report on Québec’s Financial Situation – Second Quarter of 2023-2024 |
Page 16 | 23 |
Section 3: Additional Information
Composition of net financial surpluses or requirements
The government’s revenues and expenditures are established on an accrual basis of accounting.
| ■ | Revenues are recognized when earned and expenses when incurred, regardless of when receipts and disbursements occur. |
Net financial surpluses or requirements, on the other hand, consist of the difference between receipts and disbursements resulting from government activities. To meet its net financial requirements, the government uses a variety of financing sources, including cash and borrowings.
The various items for net financial requirements represent net receipts and disbursements generated by the government’s loans, interests in its enterprises, and fixed assets, by retirement plans and other employee future benefits, as well as by other accounts.
| ■ | This last item includes the payment of accounts payable and the collection of accounts receivable. Deposits in the Generations Fund also result in financial requirements. |
| Report on Québec’s Financial Situation – Second Quarter of 2023-2024 |
Page 17 | 23 |
Section 3: Additional Information
Financing program and borrowings
The financing program corresponds to long-term borrowings made, in particular, to repay maturing borrowings and to fund the government’s capital investments. For 2023-2024, the program amounts to $21.9 billion as presented in the fall 2023 update.
Since the start of 2023-2024,(1) borrowings made amount to $21.2 billion, or 96.6% of the forecast program.
| ■ | Conventional bonds in Canadian dollars are the main borrowing instrument used. |
| ■ | Borrowings on foreign markets account for 34.5% of borrowings made to date in 2023-2024. |
| Summary of long-term borrowings contracted in 2023-2024(1) | ||||||||
| Currencies | $million | % | ||||||
| CANADIAN DOLLAR | ||||||||
| Conventional bonds | 12 035 | 56.7 | ||||||
| Savings products issued by Épargne Placements Québec | 1 074 | 5.1 | ||||||
| Green bonds | 591 | 2.8 | ||||||
| Immigrant investors(15) | 184 | 0.9 | ||||||
| Subtotal | 13 884 | 65.5 | ||||||
| OTHER CURRENCIES | ||||||||
| U.S. dollar | 6 702 | 31.7 | ||||||
| Swiss franc | 586 | 2.8 | ||||||
| Subtotal | 7 288 | 34.5 | ||||||
| TOTAL | 21 172 | 100.0 | ||||||
| Summary of long-term borrowing repayments in 2023-2024(16) | ||||
| Currencies | $million | |||
| CANADIAN DOLLAR | ||||
| Conventional bonds | 3 370 | |||
| Other | 583 | |||
| Subtotal | 3 953 | |||
| OTHER CURRENCIES | ||||
| U.S. dollar | 1 180 | |||
| Euro | 1 484 | |||
| Subtotal | 2 664 | |||
| TOTAL | 6 617 | |||
| Report on Québec’s Financial Situation – Second Quarter of 2023-2024 |
Page 18 | 23 |
Appendix
Appendix 1: Results and budgetary outlook for 2023-2024
| Results and budgetary outlook for 2023-2024 – Budgetary balance |
| (level and adjustment in millions of dollars, percentage change compared to the same period last year) |
|
|
| Forecast for fiscal year 2023-2024 | |||||||||||||||||||||||||||||||||||||||||
| April to September 2023 | March 2023 budget | Fall 2023 update | New estimate | Adjustment since the | ||||||||||||||||||||||||||||||||||||||||
| Level ($M) | Change (%) | Level ($M) | Change (%) | Adjustment ($M) | Level ($M) | Change (%) | Adjustment ($M) | Level ($M) | Change (%)(4) | March 2023 budget | ||||||||||||||||||||||||||||||||||
| Revenue | ||||||||||||||||||||||||||||||||||||||||||||
| Own-source revenue | 56 379 | –0.1 | 117 989 | 1.8 | –435 | 117 554 | 1.7 | –842 | 116 712 | 1.0 | −1 277 | |||||||||||||||||||||||||||||||||
| Federal transfers | 14 942 | 7.7 | 29 742 | 1.8 | 1 755 | 31 497 | 9.6 | — | 31 497 | 9.6 | (5) | 1 755 | ||||||||||||||||||||||||||||||||
| Subtotal – Revenue | 71 321 | 1.4 | 147 731 | 1.8 | 1 320 | 149 051 | 3.3 | –842 | 148 209 | 2.7 | 478 | |||||||||||||||||||||||||||||||||
| Expenditure | ||||||||||||||||||||||||||||||||||||||||||||
| Portfolio expenditures | −65 756 | 9.6 | −138 392 | 1.2 | −2 046 | −140 438 | 2.3 | — | −140 438 | 2.3 | (6) | −2 046 | ||||||||||||||||||||||||||||||||
| Debt service | −4 997 | –6.5 | −9 464 | –5.9 | –403 | −9 867 | –1.9 | 85 | −9 782 | –2.7 | -318 | |||||||||||||||||||||||||||||||||
| Subtotal – Expenditure | −70 753 | 8.3 | −147 856 | 0.7 | −2 449 | −150 305 | 2.0 | 85 | −150 220 | 2.0 | −2 364 | |||||||||||||||||||||||||||||||||
| Contingency reserve | — | — | −1 500 | — | 1 000 | –500 | — | 500 | — | — | 1 500 | |||||||||||||||||||||||||||||||||
| OPERATING SURPLUS (DEFICIT)(7) | 568 | — | −1 625 | — | -129 | −1 754 | — | –257 | −2 011 | — | –386 | |||||||||||||||||||||||||||||||||
| BALANCED BUDGET ACT | ||||||||||||||||||||||||||||||||||||||||||||
| Deposits of dedicated revenues in the Generations Fund(3) | –977 | — | −2 373 | — | 132 | −2 241 | — | 122 | −2 119 | — | 254 | |||||||||||||||||||||||||||||||||
| BUDGETARY BALANCE(8) | –409 | — | −3 998 | — | 3 | −3 995 | — | –135 | (9) | −4 130 | — | –132 | ||||||||||||||||||||||||||||||||
| Report on Québec’s Financial Situation – Second Quarter of 2023-2024 |
Page 19 | 23 |
Appendix
Appendix 1: Results and budgetary outlook for 2023-2024 (cont.)
| Results and budgetary outlook for 2023-2024 – Revenue |
| (level and adjustment in millions of dollars, percentage change compared to the same period last year) |
|
|
| Forecast for fiscal year 2023-2024 | |||||||||||||||||||||||||||||||||||||||||
| April to September 2023 | March 2023 budget | Fall 2023 update | New estimate | Adjustment since the | ||||||||||||||||||||||||||||||||||||||||
| Level ($M) | Change (%) | Level ($M) | Change (%) | Adjustment ($M) | Level ($M) | Change (%) | Adjustment ($M) | Level ($M) | Change (%)(4) | March 2023 budget | ||||||||||||||||||||||||||||||||||
| Own-source revenue | ||||||||||||||||||||||||||||||||||||||||||||
| Income and property taxes | ||||||||||||||||||||||||||||||||||||||||||||
| – Personal income tax | 20 605 | –1.9 | 43 126 | 1.1 | –449 | 42 677 | 1.0 | — | 42 677 | 1.0 | –449 | |||||||||||||||||||||||||||||||||
| – Contributions for health services | 4 187 | 6.9 | 7 944 | 1.3 | 366 | 8 310 | 5.0 | — | 8 310 | 5.0 | 366 | |||||||||||||||||||||||||||||||||
| – Corporate taxes | 4 969 | –16.6 | 13 192 | –0.5 | –629 | 12 563 | -5.1 | –300 | 12 263 | –7.4 | –929 | |||||||||||||||||||||||||||||||||
| – School property tax | 567 | 3.5 | 1 184 | 6.5 | –58 | 1 126 | 1.2 | — | 1 126 | 1.2 | –58 | |||||||||||||||||||||||||||||||||
| Consumption taxes | 14 279 | 2.3 | 27 290 | 2.8 | 77 | 27 367 | 2.9 | –50 | 27 317 | 2.7 | 27 | |||||||||||||||||||||||||||||||||
| Subtotal – Tax revenue | 44 607 | –1.7 | 92 736 | 1.4 | –693 | 92 043 | 1.0 | –350 | 91 693 | 0.6 | −1 043 | |||||||||||||||||||||||||||||||||
| Duties and permits | 2 870 | –6.1 | 5 739 | –4.0 | 82 | 5 821 | 1.4 | –38 | 5 783 | 0.7 | 44 | |||||||||||||||||||||||||||||||||
| Miscellaneous revenue | 6 775 | 20.0 | 12 707 | 7.8 | 1 007 | 13 714 | 13.5 | –84 | 13 630 | 12.8 | 923 | |||||||||||||||||||||||||||||||||
| Subtotal – Other own-source revenue | 9 645 | 10.8 | 18 446 | 3.8 | 1 089 | 19 535 | 9.6 | –122 | 19 413 | 8.9 | 967 | |||||||||||||||||||||||||||||||||
| Total own-source revenue excluding revenue from government enterprises | 54 252 | 0.3 | 111 182 | 1.8 | 396 | 111 578 | 2.4 | –472 | 111 106 | 2.0 | –76 | |||||||||||||||||||||||||||||||||
| Revenue from government enterprises | 2 127 | –10.4 | 6 807 | 2.0 | –831 | 5 976 | –9.7 | –370 | 5 606 | –15.3 | −1 201 | |||||||||||||||||||||||||||||||||
| Total own-source revenue | 56 379 | –0.1 | 117 989 | 1.8 | –435 | 117 554 | 1.7 | –842 | 116 712 | 1.0 | −1 277 | |||||||||||||||||||||||||||||||||
| Federal transfers | ||||||||||||||||||||||||||||||||||||||||||||
| Equalization | 7 019 | 2.7 | 14 037 | 2.7 | — | 14 037 | 2.7 | — | 14 037 | 2.7 | — | |||||||||||||||||||||||||||||||||
| Health transfers | 4 405 | 18.0 | 8 660 | 21.6 | 150 | 8 810 | 24.4 | — | 8 810 | 24.4 | 150 | |||||||||||||||||||||||||||||||||
| Transfers for post-secondary education and other social programs | 750 | 0.5 | 1 366 | 5.6 | 133 | 1 499 | 15.8 | — | 1 499 | 15.8 | 133 | |||||||||||||||||||||||||||||||||
| Other programs | 2 768 | 8.0 | 5 679 | –20.5 | 1 472 | 7 151 | 6.8 | — | 7 151 | 6.8 | 1 472 | |||||||||||||||||||||||||||||||||
| Subtotal – Federal transfers | 14 942 | 7.7 | 29 742 | 1.8 | 1 755 | 31 497 | 9.6 | — | 31 497 | 9.6 | (5) | 1 755 | ||||||||||||||||||||||||||||||||
| TOTAL REVENUE | 71 321 | 1.4 | 147 731 | 1.8 | 1 320 | 149 051 | 3.3 | –842 | 148 209 | 2.7 | 478 | |||||||||||||||||||||||||||||||||
| Report on Québec’s Financial Situation – Second Quarter of 2023-2024 |
Page 20 | 23 |
Appendix
Appendix 1: Results and budgetary outlook for 2023-2024 (cont.)
Results and budgetary outlook for 2023-2024 – Expenditure
(level and adjustment in millions of dollars, percentage change compared to the same period last year)
|
|
| Forecast for fiscal year 2023-2024 | |||||||||||||||||||||||||||||||||||||||||
| April to September 2023 | March 2023 budget | Fall 2023 update | New estimate | Adjustment since the | ||||||||||||||||||||||||||||||||||||||||
| Level ($M) | Change (%) | Level ($M) | Change (%) | Adjustment ($M) | Level ($M) | Change (%) | Adjustment ($M) | Level ($M) | Change (%)(4) | March 2023 budget | ||||||||||||||||||||||||||||||||||
| Portfolio expenditures | ||||||||||||||||||||||||||||||||||||||||||||
| Santé et Services sociaux | 29 438 | 8.2 | 59 015 | 1.6 | 82 | 59 097 | –0.5 | — | 59 097 | –0.5 | 82 | |||||||||||||||||||||||||||||||||
| Éducation | 9 220 | 8.7 | 20 203 | 6.0 | –273 | 19 930 | 1.9 | — | 19 930 | 2.2 | –273 | |||||||||||||||||||||||||||||||||
| Enseignement supérieur | 4 791 | 9.0 | 10 480 | 5.0 | –146 | 10 334 | 7.0 | — | 10 334 | 7.0 | –146 | |||||||||||||||||||||||||||||||||
| Famille | 4 084 | 5.5 | 8 210 | 5.8 | 158 | 8 368 | 6.8 | — | 8 368 | 6.8 | 158 | |||||||||||||||||||||||||||||||||
| Transports et Mobilité durable | 2 949 | 13.9 | 6 957 | –1.3 | –148 | 6 809 | 5.5 | — | 6 809 | 5.5 | -148 | |||||||||||||||||||||||||||||||||
| Emploi et Solidarité sociale | 2 811 | 8.2 | 5 250 | –42.5 | 228 | 5 478 | –39.0 | — | 5 478 | –39.0 | 228 | |||||||||||||||||||||||||||||||||
| Affaires municipales et Habitation | 1 589 | –7.9 | 4 546 | –2.9 | 193 | 4 739 | –3.8 | — | 4 739 | –3.8 | 193 | |||||||||||||||||||||||||||||||||
| Économie, Innovation et Énergie | 1 714 | 29.4 | 3 680 | 12.3 | 181 | 3 861 | 20.5 | — | 3 861 | 20.5 | 181 | |||||||||||||||||||||||||||||||||
| Environnement, Lutte contre les changements climatiques, Faune et Parcs | 689 | 29.0 | 2 283 | 14.0 | 159 | 2 442 | 46.0 | — | 2 442 | 46.0 | 159 | |||||||||||||||||||||||||||||||||
| Other portfolios | 8 471 | 16.8 | 17 768 | 13.5 | 1 612 | 19 380 | 24.2 | — | 19 380 | 24.2 | 1 612 | |||||||||||||||||||||||||||||||||
| Subtotal – Portfolio expenditures | 65 756 | 9.6 | 138 392 | 1.2 | 2 046 | 140 438 | 2.3 | — | 140 438 | 2.3 | (6) | 2 046 | ||||||||||||||||||||||||||||||||
| Debt service | 4 997 | –6.5 | 9 464 | –5.9 | 403 | 9 867 | –1.9 | –85 | 9 782 | –2.7 | 318 | |||||||||||||||||||||||||||||||||
| TOTAL EXPENDITURE | 70 753 | 8.3 | 147 856 | 0.7 | 2 449 | 150 305 | 2.0 | –85 | 150 220 | 2.0 | 2 364 | |||||||||||||||||||||||||||||||||
| Report on Québec’s Financial Situation – Second Quarter of 2023-2024 |
Page 21 | 23 |
Appendix
Appendix 2: Change in certain economic variables
Recent economic indicators in Québec(17)
(year-over-year percentage change, unless otherwise indicated)
Quarters of 2023 | 2023 | |||||||||||||||||||||||||||||||||||||||
| Aug. | Sept. | Oct. | Nov. | Q1 | Q2 | Q3 | Q4 | Forec. | Obs.(18) | |||||||||||||||||||||||||||||||
| Real GDP by industry | -0.4 | — | — | — | 0.3 | -0.6 | — | — | 0.6 | 0.4 | ||||||||||||||||||||||||||||||
| Job creation (thousands) | 14.8 | 38.7 | -22.1 | -1.5 | 47.8 | 2.5 | 9.2 | — | 100.9 | 106.6 | ||||||||||||||||||||||||||||||
| Unemployment rate (per cent) | 4.3 | 4.4 | 4.9 | 5.2 | 4.1 | 4.2 | 4.4 | — | 4.3 | 4.4 | ||||||||||||||||||||||||||||||
| Retail sales (nominal terms) | -0.1 | 0.4 | — | — | 1.4 | -0.3 | 2.0 | — | 4.0 | 4.3 | ||||||||||||||||||||||||||||||
| Consumer price index(19) | 4.6 | 4.8 | 4.2 | — | 5.5 | 4.1 | 4.4 | — | 4.6 | 4.6 | ||||||||||||||||||||||||||||||
| Housing starts (thousands) | 50.8 | 52.8 | 47.1 | — | 36.1 | 35.3 | 46.0 | — | 39.5 | 42.6 | ||||||||||||||||||||||||||||||
| Real GDP | — | — | — | — | 0.3 | -0.5 | — | — | 0.6 | 0.5 | ||||||||||||||||||||||||||||||
| GDP (nominal terms) | — | — | — | — | 1.1 | 0.9 | — | — | 4.0 | 4.0 | ||||||||||||||||||||||||||||||
| Household consumption (nominal terms) | — | — | — | — | 2.0 | 0.6 | — | — | 6.9 | 8.3 | ||||||||||||||||||||||||||||||
| Wages and salaries (nominal terms) | — | — | — | — | 1.4 | 1.8 | 1.2 | — | 5.5 | 6.1 | ||||||||||||||||||||||||||||||
| Net operating surplus of corporations (nominal terms) | — | — | — | — | -2.3 | -2.5 | — | — | –6.7 | –8.8 | ||||||||||||||||||||||||||||||
| Report on Québec’s Financial Situation – Second Quarter of 2023-2024 |
Page 22 | 23 |
Notes
Consolidated financial information
Consolidated results include the results of all entities that are part of the government’s reporting entity, i.e., that are under its control. To determine consolidated results, the government eliminates transactions carried out between entities in the reporting entity. Additional information on the government’s financial organization and the funding of public services can be found on pages 14 to 19 of the document titled “Processus et documentation budgétaires : une reddition de comptes sur les finances publiques de l'État” (in French only).
Notes
| (1) | Long-term borrowings made between April 1 to December 12, 2023. |
| (2) | Deposits of dedicated revenues in the Generations Fund are presented under expenditures for illustrative purposes. |
| (3) | Revenues dedicated to the Generations Fund have been recognized in accordance with the changes announced in the March 2023 budget. Starting in 2023-2024, the three sources of revenue dedicated to the Generations Fund are the following: water-power royalties paid by Hydro-Québec and private producers of hydroelectricity; an additional contribution from Hydro-Québec, set at $650 million per year, taken from the dividend paid by Hydro-Québec to the government, and revenue from the investment of sums constituting the Generations Fund. These changes were set out in An Act respecting the implementation of certain provisions of the Budget Speech of 21 March 2023 and amending other provisions (S.Q. 2023, c. 30), which was assented to on December 7, 2023. |
| (4) | The percentage change has been updated on the basis of the 2022-2023 results published in the Public Accounts 2022-2023. |
| (5) | It is expected that federal transfer revenues will grow by 9.6% in 2023-2024, stemming from a one-off increase from the Canada Health Transfer. For the first six months of the year, growth is weaker (7.7%) because of the change in the value of the Québec special abatement, which is deducted from transfer revenues. It is anticipated that growth in transfer revenues from October 2023 to March 2024 in relation to the same period the previous year will be higher. |
| (6) | It is expected that portfolio expenditures will grow by 2.3% in 2023-2024. For the first six months of the year, the growth observed is higher (9.6%) mainly because of the more rapid accounting of certain expenditures in 2023-2024 compared to the same period the previous year. Accordingly, the anticipated downturn in annual growth is attributable, among other things, to the new one-time cost of living support payment, accounted for in November 2022, and the impact of the enhancement of the senior assistance amount and of the Perspective Québec Scholarship Program, accounted for in December 2022. |
| (7) | Balance within the meaning of the public accounts. |
| (8) | Budgetary balance within the meaning of the Balanced Budget Act. |
| (9) | The $135 million adjustment since the fall 2023 update is explained by a deterioration of $635 million in the financial framework largely offset by using the $500-million contingency reserve. |
| (10) | Certain expenditures were reclassified between portfolios to comply with the presentation adopted in 2023-2024. |
| (11) | Sources: Public accounts and Statistics Canada. |
| (12) | This average is obtained by dividing the sum of provincial debts by the sum of provincial GDP. |
| (13) | These items, which are included in the government’s budgetary surplus (deficit), are eliminated in non-budgetary transactions because they have no effect on cash flow. |
| (14) | The financial surpluses or requirements pertaining to other accounts can vary significantly from one month to the next, in particular according to the time when the government collects or disburses funds related to its activities. For example, when the last day of the month is not a business day, QST remittances are collected at the beginning of the following month, such that the equivalent of two months’ remittances can be collected in a given month. |
| (15) | These borrowings come from sums advanced by immigrant investors. These sums are loaned to the government through Investissement Québec. |
| (16) | Long-term borrowing repayments from April 1 to September 30, 2023. |
| (17) | Sources: Institut de la statistique du Québec, Statistics Canada, and Canada Mortgage and Housing Corporation. |
| (18) | Cumulative of available periods compared with the same period of the previous year. |
| (19) | Change compared with the previous year. |
For more information, contact the Direction des communications of the Ministère des Finances at info@finances.gouv.qc.ca.
The report is available on the Ministère des Finances website at: www.finances.gouv.qc.ca. |
| Report on Québec’s Financial Situation – Second Quarter of 2023-2024 |
Page 23 | 23 |