EXHIBIT 99.1

DESCRIPTION
This description of Québec is dated as of June 5, 2012 and appears as Exhibit 99.1
to Québec’s Annual Report on Form 18-K to
the U.S. Securities and Exchange Commission for the fiscal year ended
March 31, 2012
The delivery of this document at any time does not imply that the information is correct as of any time subsequent to its date. This document (other than as part of a prospectus contained in a registration statement filed under the U.S. Securities Act of 1933) does not constitute an offer to sell or the solicitation of an offer to buy any securities of Québec.
This page intentionally left blank.
- 2 -
Table of Contents
| | | | |
Foreign Exchange | | | 4 | |
| |
Summary | | | 5 | |
| |
Québec | | | 9 | |
Overview | | | 9 | |
Constitutional Framework | | | 9 | |
Government | | | 10 | |
Native Peoples | | | 10 | |
| |
Economy | | | 13 | |
Economic Developments in 2011 | | | 13 | |
Plan nord | | | 14 | |
Economic Structure | | | 16 | |
Free Trade Agreements | | | 23 | |
| |
Government Finances | | | 26 | |
Financial Administration | | | 26 | |
2011-2012 Preliminary Results | | | 30 | |
2012-2013 Budget | | | 30 | |
New Accounting Standard | | | 31 | |
General Fund Revenue | | | 33 | |
General Fund Expenditure | | | 35 | |
Government Employees and Collective Unions | | | 38 | |
Consolidated Non-Budgetary Transactions | | | 39 | |
| |
Government Enterprises and Agencies | | | 42 | |
Enterprises Included in the Government’s Reporting Entity | | | 44 | |
Agencies Which Conduct Fiduciary Transactions That Are Not Included in the Government’s | | | | |
Reporting Entity | | | 47 | |
| |
Public Sector Debt | | | 48 | |
Government Debt | | | 49 | |
Guaranteed Debt | | | 52 | |
Funded Debt of the Municipal Sector and Other Institutions | | | 53 | |
Government's Commitments | | | 54 | |
| |
Where You Can Find More Information | | | 55 | |
| |
Forward-Looking Statements | | | 56 | |
Supplementary Information | | | 57 | |
- 3 -
FOREIGN EXCHANGE
Canada maintains a floating exchange rate for the Canadian dollar in order to permit the rate to be determined by market forces without intervention except as required to maintain orderly conditions. Annual average noon spot exchange rates for the major foreign currencies in which debt of Québec is denominated, expressed in Canadian dollars, are shown below.
| | | 0000000000 | | | | 0000000000 | | | | 0000000000 | | | | 0000000000 | | | | 0000000000 | |
Foreign Currency | | | 2008 | | | | 2009 | | | | 2010 | | | | 2011 | | | | 2012 | (1) |
| | | | | |
United States Dollar | | | 1.0660 | | | | 1.1420 | | | | 1.0299 | | | | 0.9891 | | | | 1.0012 | |
| | | | | |
Japanese Yen | | | 0.0104 | | | | 0.0122 | | | | 0.0118 | | | | 0.0124 | | | | 0.0126 | |
| | | | | |
Swiss Franc | | | 0.9840 | | | | 1.0505 | | | | 0.9896 | | | | 1.1187 | | | | 1.0847 | |
| | | | | |
Pound Sterling | | | 1.9617 | | | | 1.7804 | | | | 1.5918 | | | | 1.5861 | | | | 1.5831 | |
| | | | | |
New Zealand Dollar | | | 0.7547 | | | | 0.7193 | | | | 0.7430 | | | | 0.7824 | | | | 0.8105 | |
| | | | | |
Mexican Pesos | | | 0.0959 | | | | 0.0845 | | | | 0.0816 | | | | 0.0798 | | | | 0.0764 | |
| | | | | |
Australian Dollar | | | 0.9002 | | | | 0.8969 | | | | 0.9470 | | | | 1.0206 | | | | 1.0411 | |
| | | | | |
Euro | | | 1.5603 | | | | 1.5855 | | | | 1.3661 | | | | 1.3767 | | | | 1.3074 | |
| | | | | |
Hong Kong Dollar | | | 0.1369 | | | | 0.1473 | | | | 0.1326 | | | | 0.1271 | | | | 0.1290 | |
| | |
| | (1) | Monthly average through the end of May 2012. |
Source: Bank of Canada.
In this document, unless otherwise specified or the context otherwise requires, all dollar amounts are expressed in Canadian dollars. The fiscal year of Québec ends March 31. “Fiscal 2012” and “2011-2012” refer to the fiscal year ended March 31, 2012, and, unless otherwise indicated, “2011” means the calendar year ended December 31, 2011. “Fiscal 2013” and “2012-2013” refer to the fiscal year that will end on March 31, 2013. Other fiscal and calendar years are referred to in a corresponding manner. Any discrepancies between the amounts listed and their totals in the tables included in this document are due to rounding.
- 4 -
SUMMARY
The information below is qualified in its entirety by the detailed information provided elsewhere in this document.
Economy
(dollar amounts in millions, unless otherwise specified)
| | | 0000000000 | | | | 0000000000 | | | | 0000000000 | | | | 0000000000 | | | | 0000000000 | |
| | | 2007 | | | 2008 | | | 2009 | | | 2010 | | | 2011 | |
| | | | | |
GDP at current market prices | | | 295,928 | | | | 304,479 | | | | 304,861 | | | | 319,348 | | | | 334,979 | |
| | | | | |
% change – GDP in chained 2002 dollars(1) | | | 2.1% | | | | 1.3% | | | | -0.7% | | | | 2.5% | | | | 1.7 | |
| | | | | |
Personal income | | | 249,883 | | | | 260,565 | | | | 262,079 | | | | 272,247 | | | | 281,897 | |
| | | | | |
Capital expenditures | | | 57,055 | | | | 60,118 | | | | 58,858 | | | | 63,098 | | | | 67,000 | |
| | | | | |
International exports of goods | | | 69,798 | | | | 70,760 | | | | 58,049 | | | | 59,189 | | | | 63,544 | |
| | | | | |
Population at July 1 (in thousands) | | | 7,687 | | | | 7,751 | | | | 7,827 | | | | 7,906 | | | | 7,980 | |
| | | | | |
Unemployment rate | | | 7.2% | | | | 7.2% | | | | 8.5% | | | | 8.0% | | | | 7.8% | |
| | | | | |
Consumer Price Index – % change | | | 1.6% | | | | 2.1% | | | | 0.6% | | | | 1.2% | | | | 3.0% | |
| | | | | |
Average exchange rate (US$ per C$) | | | 0.93 | | | | 0.94 | | | | 0.88 | | | | 0.97 | | | | 1.01 | |
| | |
Consolidated Financial Transactions(2)
Fiscal year ending March 31
(dollar amounts in millions)
| | | | | | | | | | | | | | | | | | | | |
| | | | 2009 | | | | 2010 | (3) | | | 2011 | (3) | |
| Preliminary
Results2012 |
(3)(4)(5) | |
| Budget
Forecast
2013 |
(3)(4) |
| | | | | |
General Fund | | | | | | | | | | | | | | | | | | | | |
| | | | | |
Own-source revenue | | | 48,773 | | | | 45,604 | | | | 48,782 | | | | 50,364 | | | | 53,598 | |
| | | | | |
Federal transfers(6) | | | 14,023 | | | | 15,161 | | | | 15,425 | | | | 15,175 | | | | 15,797 | (7) |
| | |
| | | | | |
Total revenue | | | 62,796 | | | | 60,765 | | | | 64,207 | | | | 65,539 | | | | 69,395 | |
| | |
| | | | | |
Program spending | | | (58,550) | | | | (59,864) | | | | (61,722) | | | | (61,384) | | | | (62,642) | |
| | | | | |
Debt service | | | (6,504) | | | | (6,117) | | | | (6,984) | | | | (7,452) | | | | (8,237) | |
| | |
| | | | | |
Total expenditure | | | (65,054) | | | | (65,981) | | | | (68,706) | | | | (68,836) | | | | (70,879) | |
| | |
| | | | | |
Net results of General Fund | | | (2,258) | | | | (5,216) | | | | (4,449) | | | | (3,297) | | | | (1,484) | |
| | | | | |
Net results of consolidated entities(8) | | | 1,007 | | | | 2,276 | | | | 2,109 | | | | 1,145 | | | | 1,195 | |
| | | | | |
Contingency reserve | | | – | | | | – | | | | – | | | | (300) | | | | (300) | |
| | |
Surplus (deficit) within the meaning of the public accounts | | | (1,251) | | | | (2,940) | | | | (2,390) | | | | (2,452) | | | | (589) | |
| | |
Deposits of dedicated revenues in the Generations Fund | | | (587) | | | | (725) | | | | (760) | | | | (848) | | | | (911) | |
| | | | | |
Stabilization reserve(9) | | | 1,845 | | | | 433 | | | | – | | | | – | | | | – | |
| | | | | |
Accounting modifications | | | – | | | | 58 | | | | – | | | | – | | | | – | |
| | |
- 5 -
Consolidated Financial
Transactions(2)
Fiscal year ending
March 31 (continued)
| | | 000000000 | | | | 000000000 | | | | 000000000 | | | | 000000000 | | | | 000000000 | |
Consolidated budgetary balance within the meaning of the
Balanced Budget Act | | | 7 | | | | (3,174) | | | | (3,150) | | | | (3,300) | | | | (1,500) | |
| | | | | |
Deposit of dedicated revenues in the Generations Fund(10) | | | 587 | | | | 725 | | | | 760 | | | | 848 | | | | 911 | |
| | |
| | | | | |
Consolidated budgetary balance | | | 594 | | | | (2,449) | | | | (2,390) | | | | (2,452) | | | | (589) | |
| | | | | |
Non-budgetary transactions(11) | | | (1,124) | | | | (2,269) | | | | (2,562) | | | | (4,842) | | | | (3,831) | |
| | |
| | | | | |
Net financial requirements(12) | | | (530) | | | | (4,718) | | | | (4,952) | | | | (7,294) | | | | (4,420) | |
| | |
Funded Debt of Public Sector (net of sinking fund balances) As of March 31 (dollar amounts in millions) (13) | |
| | |
| Unadjusted
2008 |
(14) | |
| Unadjusted
2009 |
(14) | | | 2010 | | | | 2011 | | |
| Preliminary
Results
2012 |
(15) |
| | | | | |
Government Funded Debt | | | | | | | | | | | | | | | | | | | | |
| | | | | |
Borrowings – Government | | | 112,507 | | | | 124,549 | | | | 126,731 | | | | 139,158 | | | | 150,357 | |
| | | | | |
Borrowings – to finance Government Enterprises | | | 25 | | | | 221 | | | | 217 | | | | 855 | | | | 1,009 | |
| | | | | |
Government Guaranteed Debt(16) | | | 32,399 | | | | 36,668 | | | | 36,385 | | | | 37,723 | | | | 38,514 | |
| | | | | |
Municipal Sector Debt | | | 17,321 | | | | 18,639 | | | | 19,538 | | | | 20,424 | | | | 21,004 | |
| | | | | |
Other Institutions(17) | | | 1,552 | | | | 931 | | | | 1,055 | | | | 1,009 | | | | 918 | |
| | |
| | | | | |
Public Sector Funded Debt(18) | | | 163,804 | | | | 181,008 | | | | 183,926 | | | | 199,169 | | | | 211,802 | |
| | |
| | | | | |
Per capita ($) | | | 21,309 | | | | 23,353 | | | | 23,499 | | | | 25,192 | | | | 26,542 | |
| | | | | |
As a percentage of(19) | | | | | | | | | | | | | | | | | | | | |
| | | | | |
GDP | | | 55.4% | | | | 59.4% | | | | 60.3% | | | | 62.4% | | | | 63.2% | |
| | | | | |
Personal income | | | 65.6% | | | | 69.5% | | | | 70.2% | | | | 73.2% | | | | 75.1% | |
| | |
| | (1) | Adjusted for the effects of inflation in the currency from year to year. | |
| | (2) | The categories set forth reflect the presentation of the 2012-2013 Budget. Adopted by the National Assembly in June 2011, Bill 10: An Act respecting mainly the implementation of certain provisions of the Budget Speech of 17 March 2011 and the enactment of the Act to establish the Northern Plan Fund (2011, c.18) stipulates that the Consolidated Revenue Fund will henceforth consist of a General Fund and special funds. (See below – “Government Finances – Financial administration”) | |
| | (3) | Since Fiscal 2010, figures incorporate the implementation of the Land Transportation Network Fund (FORT). The creation of this fund does not affect the Government’s budgetary balance. However, it modifies the level of own-source revenue, program spending and net results of consolidated entities. | |
| | (4) | Since Fiscal 2012, figures incorporate the implementation of the Tax Administration Fund (FRAF). The creation of this fund does not affect the Government’s budgetary balance. However, it modifies the level of own-source revenue, program spending and net results of consolidated entities. | |
| | (5) | The Preliminary Results 2012 are based on financial information presented as at March 31, 2012 in the 2012-2013 Budget which was tabled on March 20, 2012. These preliminary results are subject to change. | |
| | (6) | Federal transfers are presented on an accrual basis. | |
| | (7) | Includes an amount of $733 million from the Canada-Québec agreement concluded on March 28, 2012, which stipulates that the federal government will pay Québec $2.2 billion in compensation in respect of the harmonization of the Québec sales tax (QST) with the goods and services tax (GST). | |
| | (8) | The results of the consolidated entities also include those of the special funds and the Generations Fund, which became entities of the Consolidated Revenue Fund following the adoption of Bill 10. The results of the consolidated entities also include the impact of consolidation adjustments. | |
| | (9) | A negative amount indicates an allocation to the reserve and a positive amount indicates a use of the reserve. | |
| | (10) | The Generations Fund was created in June 2006 by the adoption of the Act to reduce the debt and establish the Generations Fund and | |
- 6 -
| | is a separate entity from the General Fund. This law establishes the fund as a permanent tool for reducing the debt burden. In addition, it stipulates that the sums accumulated in the Generations Fund are dedicated exclusively to repaying the debt. |
| | (11) | Since Fiscal 2012, Non-budgetary transactions exclude public-private partnership (PPP) investments. Since PPP investments are made and financed by private-sector partners, they do not entail financial requirements for the Government. |
| | (12) | Since Fiscal 2010, Net financial requirements take into account the budgetary and non-budgetary transactions of the health and social services and education networks. |
| | (13) | Canadian dollar equivalent at the dates indicated for borrowings in foreign currencies after taking into account currency swap agreements and foreign exchange forward contracts. |
| | (14) | The figures for Fiscal 2008 and Fiscal 2009 have not been restated for the line-by-line consolidation of the results of the health and social services and education network with those of the Government. |
| | (15) | The Preliminary Results 2012 are based on financial information presented as at March 31, 2012 in the 2012-2013 Budget, as revised. These preliminary results are subject to change. |
| | (16) | Represents debt of Hydro-Québec. |
| | (17) | The figures for Fiscal 2008 and Fiscal 2009 have not been restated on a line-by-line consolidated basis. Figures for Fiscal 2010 to Fiscal 2012 represent debt of the universities other than the Université du Québec and its constituents. |
| | (18) | Includes debt covered by the Government’s commitments (see “Public Sector Debt – Government’s Commitment”). |
| | (19) | Percentages are based upon the prior calendar year’s GDP and Personal income. |
- 7 -
- 8 -
QUÉBEC
Overview
Québec is the largest by area of the ten provinces in Canada (1,667,441 square kilometers or 643,803 square miles, representing 17% of the geographical area of Canada) and the second largest by population (8.0 million, representing 23.1% of the population of Canada, as of January 2012). The population of Québec increased on average by 0.9% per year since 2007. In the same period, the population of Canada increased on average by 1.1%.
Québec has a modern, developed economy, in which the service sector contributed 75.7%, the manufacturing industry 16.0%, the construction industry 6.1% and the primary sector 2.2% of real GDP at basic prices in chained 2002 dollars in 2011. The leading manufacturing industries in Québec are primary metal products (including aluminum smelting), food products, petroleum and coal products, transportation equipment products (including aircraft and motor vehicles and associated parts), chemical products, paper products and fabricated metal products. Québec also has significant hydroelectric resources, generating 33.6% of the electricity produced in Canada in 2011.
Montréal and Ville de Québec, the capital of Québec, are the main centers of economic activity. Montréal is one of the important industrial, commercial and financial centers of North America and is Canada’s second largest urban area as measured by population. Port of Montréal, situated on the St. Lawrence River, is Canada’s second largest port in terms of operating revenues and provides access to the Atlantic Ocean and the inland navigation system of the Great Lakes.
French is the official language of Québec and is spoken by approximately 95% of its population.
Constitutional Framework
Canada is a federation of ten provinces and three federal territories, with a constitutional division of responsibilities between the federal and provincial governments as set out in The Constitution Acts, 1867 to 1982 (the “Constitution”).
Under the Constitution, each provincial government has exclusive authority to raise revenue for provincial purposes through direct taxation within its territorial limits. Each provincial government also has exclusive authority to regulate education, health, social services, property and civil rights, natural resources, municipal institutions and, generally, all other matters of a purely local or private nature in its province. Additionally, each province has the exclusive authority to regulate, and raise revenue from, the exploration, development, conservation and management of natural resources.
The federal parliament is empowered to raise revenue by any method or system of taxation and generally has authority over matters or subjects not assigned exclusively to the provinces. It has exclusive authority over the regulation of trade and commerce, currency and coinage, banks and banking, national defence, naturalization and aliens, postal service, navigation and shipping and bills of exchange, interest and bankruptcy.
The Constitution Act, 1982 (the “Constitution Act”) provides, among other things, that amendments to the Constitution be effected in Canada according to an amending formula and no longer through enactments of the Parliament of the United Kingdom. The Constitution Act also includes various modifications to the Constitution. The Constitution Act came into effect in 1982 notwithstanding the opposition of the National Assembly of Québec (the “National Assembly”) and the government of Québec (the “Government”) to certain clauses relating to provincial jurisdiction and the terms of the amending formula.
- 9 -
The Parti Québécois, which has as its principal objective the sovereignty of Québec, formed the Government from September 1994 to April 2003. During its term in office, the Parti Québécois tabled in the National Assembly a Bill entitled An Act respecting the future of Québec (the “Act”), which provided that upon receipt of a favorable vote in a referendum, the Act would be enacted and Québec would proclaim its sovereignty following a formal offer to Canada of a treaty of economic and political partnership. In November 1995, a slight majority of Québec citizens (50.6%) voted against the Act.
The Supreme Court of Canada decided in August 1998, on a reference from the federal government in which Québec did not participate, that (i) under the Constitution, Québec may not secede unilaterally without negotiation with the other parties in the Canadian Confederation within the existing constitutional framework; (ii) under international law, Québec has no right to secede unilaterally from Canada; (iii) nonetheless, the clear repudiation by the people of Québec of the existing constitutional order and the clear expression of a desire to pursue secession would oblige the other provinces and the federal government to negotiate in accordance with constitutional principles, and Québec would also have to negotiate in accordance with such principles; and (iv) if Québec were to so negotiate but face unreasonable intransigence from the other parties, it would be more likely to be recognized than if it did not itself act according to constitutional principles in the negotiations.
The Québec Liberal Party, a federalist party, won a third consecutive mandate at the general election in December 2008. It currently forms the Government in the National Assembly. With regard to the constitutional issue, the Québec Liberal Party pursues a policy that emphasizes the values of Canadian federalism. In particular, its platform is focused on strengthening Québec’s place within the federation, on forming new alliances with the other provinces and on promoting intergovernmental cooperation.
Government
Legislative power in Québec is exercised by the National Assembly and the Lieutenant-Governor (the Parliament). The National Assembly consists of 125 members elected by popular vote from single member districts. According to constitutional practice, the leader of the party with the largest number of elected members becomes Prime Minister and forms the Government.
Executive power in Québec is vested in the Lieutenant-Governor acting with, or on the recommendation of, the Conseil exécutif, which consists of the Prime Minister and the Cabinet (Conseil des ministres). The Conseil exécutif is accountable to the National Assembly.
The current National Assembly consists of 63 members of the Québec Liberal Party, 46 members of the Parti québécois, 9 members of the Coalition avenir Québec, 1 member of Québec solidaire, 1 member of Option nationale, 2 independents and 3 vacants seats. Members are elected for a term of five years, subject to earlier dissolution of the National Assembly by the Lieutenant-Governor upon the recommendation of the Prime Minister or following the Government’s defeat on a vote of no confidence. The mandate of the current Government extends through the next election, which must be called no later than December 2013.
Native Peoples
Various aboriginal communities in Québec have initiated legal actions to have the existence of their ancestral rights (including aboriginal title) recognized and to obtain damages and interest as compensation for alleged infringements of their rights. The ancestral rights of aboriginal people are recognized under section 35 of the Constitution. Taken as a whole, aboriginal people are claiming $6.1 billion in damages and interest through these actions.
- 10 -
Included among these legal actions are three claims for damages and interest filed as part of efforts to contest the validity of a provision of the 1975 James Bay and Northern Québec Agreement (the “JBNQA”). The effect of that provision was to extinguish all aboriginal claims, rights, titles and interests, regardless of their nature, in respect of the territory covered by the JBNQA.
| q | In the first action (The Betsiamites Band et al. v. Attorney-General of Québec, the Attorney-General of Canada and Hydro-Quebec (Superior Court, no 500-17-018685-035)) (Betsiamites II), which was filed in December 2003, the Innu First Nation of Betsiamites (the “Betsiamites”) is claiming the invalidity of the provisions of the James Bay and Northern Quebec Native Claims Settlement Act, S.C. 1977, c. 32, and of the Act respecting the agreement concerning James Bay and Northern Québec, S.Q. 1976, c. 46 that are alleged to have infringed on the ancestral rights of the Betsiamites, by extinguishing their rights over the territory covered by the JBNQA. The Betsiamites also claim full enjoyment of their ancestral rights over this territory that they consider to be their ancestral territory and $75 million in compensation for loss of enjoyment of such rights for more than 25 years. Alternatively, they claim $250 million as fair compensation in the event the court should conclude that their ancestral rights were extinguished by the provincial and federal statutes in question. Québec and Hydro-Québec intends to contest this claim. |
| q | The second action concerns the community of Uashat-Maliotenam (The Innus of Takuikan Uashat Mak Mani-Utenam Band et al. v. Attorney-General of Québec, the Attorney-General of Canada and Hydro-Québec. (Superior Court, no 200-17-004196-036)) (Uashat II). In this action, also filed in December 2003, representatives of the Innus of Takuikan instituted an action seeking judicial recognition of their aboriginal rights and of their unextinguished Indian title over certain areas of land in Québec. Plaintiffs, who claim not to be parties to the JBNQA, allege that the JBNQA and certain federal and provincial laws are illegal, unconstitutional and not binding upon them. They seek various orders, including rendering of accounts and revenue sharing for the unlawful use and management of the lands, notably in respect of hydroelectric facilities on these lands, and damages from Canada, Québec and Hydro-Québec, jointly and severally, in an amount of up to $1,5 billion (subject to further increase by the plaintiffs). In June 2005, as requested by the parties, the Québec Superior Court suspended the legal action for five years. However, on January 27, 2009, at the request of the Attorney-General of Canada, the suspension of the proceedings was lifted and the case has been reactivated. Québec and Hydro-Québec intend to contest this claim. |
| q | The third action was filed in December 2003 by the Atikamekw (the Atikamekw Band of Opiticiwan et al. v. Attorney-General of Québec and the Attorney-General of Canada and Hydro-Québec (Superior Court, no 500-17-018678-030)). The Atikamekw are asking the Court to declare that the Native Claims Settlement Act, which implements the JBNQA, did not extinguish the “native, ancestral or aboriginal claims, rights, titles and interests” they may hold in the portion of the territory they claim and that is located on the territory covered by the JBNQA. Alternatively, the Atikamekw are claiming compensation of $300 million for the unilateral extinguishment of their claims, titles, rights and interests over the territory mentioned above. The parties are currently negotiating to find a settlement. |
Three other legal actions seeking damages and interest have been filed by aboriginal communities to obtain compensation for alleged infringements of their rights over territories not covered by the JBNQA.
| q | In the first action, filed in 1998 (The Innu Nation of Pessamit et al. v. Attorney-General of Québec , the Attorney-General of Canada and Hydro-Québec (Superior Court, no 500-05-039472-988) (Betsiamites I), the Betsiamites are seeking judicial recognition of their aboriginal title and ancestral rights over an immense territory on the Quebec North Shore, including the area where Hydro-Québec’s Manicouagan-Outardes hydro-electric facilities are located. In addition, the Betsiamites are claiming $500 million, with interest, for damages caused to the territory by the construction of |
- 11 -
| | hydroelectric facilities in the late 1960s and early 1970s. They are also demanding that Hydro-Québec be ordered to turn over to the Betsiamites a portion of the revenue from the production of electrical power by these facilities. In November 2006, the Betsiamites reinstated the legal action. By amendment, the Betsiamites attempted to increase its initial claim of $500 million to $10.8 billion and to add annual compensation payments of $657 million. The motion for amendment was denied by the Québec Superior Court in July 2010 and the Québec Court of Appeal in February 2011. Québec and Hydro-Québec intend to contest this claim. |
| q | The second action (The First Nation of Pessamit et al. v. Attorney-General of Québec, the Attorney-General of Canada (Superior Court, no 500-17-028743-055)) (Betsiamites IV) was filed by the Betsiamites in December 2005. This action covers the portion of the traditional territory they claim (50,000 km2 of 138,000 km2) on which forest development has been carried out since the mid-19th century. This legal action impleads the 27 forest products companies that hold at least one timber supply and forest management agreement (TSFMA) on the traditional territory claimed by the Betsiamites. In this lawsuit, the Betsiamites seek confirmation that: 1) they hold aboriginal title and ancestral rights over their traditional territory; 2) forest development of this territory was authorized illegally; 3) the Government was not entitled to collect revenues from such development; and 4) the Forest Act cannot apply to the traditional territory of the Betsiamites. Lastly, the Betsiamites are claiming damages and interest of $1 billion against Québec and Canada for infringement of enjoyment of their ancestral rights and $2,1 billion against Québec for breach of their right to develop the forest resource. On September 30, 2006, the Betsiamites amended this legal action, adding a claim for the payment of $50 million in damages and interest against Québec and a forest company for logging activities carried out on René-Levasseur Island. Québec intends to contest this claim. |
| q | In the third action, the Uashaunnuat filed a motion before the Superior Court of Québec in May 2010 (The Innus of Takuikan Uashat Mak Mani-Utenam Band et al. v. Attorney-General of Québec, Attorney-General of Canada and Hydro-Québec (Superior Court, no 500-17-050868-093) seeking an interlocutory injunction regarding, among other things, Hydro-Québec’s proposed construction of transmission lines to connect the Romaine River hydroelectric complex to Hydro-Québec’s grid which, according to the Uashaunnuat, is being undertaken in violation of their ancestral rights on their alleged ancestral territory. In addition, the Uashaunnuat are raising various procedural claims relating to the environmental review conducted with respect to this project. Construction of this project began in 2009 and the commissioning of the first generating station is presently scheduled for late 2014. In mid-January 2011, Hydro-Québec and the claimants entered into an agreement in principle regarding these claims. This agreement, which was likely to result in the discontinuance of proceedings, was submitted to the members of the Uashaunnuat for approval in a referendum held April 15, 2011. The members voted 59.2% against the draft agreement. During the summer of 2011, negotiations were held between Québec and the Uashaunnuat leading to a new relationship agreement stipulating, among other measures, the construction of a multi-purpose training centre funded entirely by Québec and administered by the community, as well as the creation of an economic and community development fund. On September 30, 2011, the members of the Uashaunnuat voted in the second referendum to refuse ratification of the agreement in principle with Hydro-Québec, as well as the new relationship agreement with Québec, by a majority of 54%. While discussions between the parties are ongoing to settle the dispute, Québec and Hydro-Québec intend to contest this claim. |
In December 1996, Philomène and George McKenzie, of the community of Uashat-Maliotenam near Sept-Îles, filed a motion for a declaratory judgment to have declared, in favor and on behalf of their families, an aboriginal title and ancestral rights, including for hunting, fishing and trapping on the land they claim as their traditional lands (Philomène McKenzie et al. v. Attorney-General of Québec et al. (Superior Court, no 500-05-027983-962)) (Uashat I). The territory claimed covers roughly 1,600 km2 and is located north of Sept-Îles. In addition, they are asking that any mining project be subject to their consent. They are also asking for a permanent injunction against any project located on the territory they claim and the work resulting from it. The claimants are also demanding $7 million in damages and interest. This case
- 12 -
remained inactive from 1997 until the spring of 2007, when the announcement of the Lac Bloom project (a mining project near Fermont, Québec) gave new impetus to the dispute. On April 13, 2007, the claimants served notice announcing an amendment to their petition, adding ten new claimants and raising the land area on which ancestral rights and aboriginal title are claimed from 1,600 km2 to 16,679 km2. The amount of damages claimed has also risen from $7 million to $350 million.
ECONOMY
Economic Developments in 2011
Canada. Gross domestic product (“GDP”) adjusted for inflation in chained 2002 dollars (“real GDP”), as published in the National Economic Accounts on March 2, 2012, increased at a rate of 2.4% in 2011, compared with 3.2 % in 2010. This increase was mainly attributable to business non-residential investment and international exports. Final domestic demand increased by 3.0% in 2011, compared to 4.5% in 2010. Real consumer spending increased by 2.4% in 2011, compared to 3.3% in 2010. International exports increased by 4.6% in volume and by 12.0% in value in 2011 compared with increases of 6.4% and 8.8%, respectively, in 2010. International imports increased by 7.0% in volume and by 9.5% in value in 2011 compared with increases of 13.1% and 9.3%, respectively, in 2010.
Real non-residential investment increased by 9.1% in 2011, the result of a 3.1% decrease in the government sector and a 13.1% increase in the business sector. Residential investment increased by 2.3% in 2011, due to a 2.1% increase in housing starts. Government expenditure on goods and services increased by 0.8% in 2011.
The Consumer Price Index (“CPI”) increased by 2.9% in 2011. Overall employment increased by 1.6% in 2011, while the unemployment rate decreased to 7.4% from 8.0% in 2010.
Québec. Real GDP, as published in the Québec Economic Accounts on March 26, 2012, increased at a rate of 1.7% in 2011, compared to an increase of 2.5% in 2010. Final domestic demand increased by 2.1% in real terms in 2011, compared to a 4.2% increase in 2010. Real consumer spending increased by 1.7% in 2011, compared to 3.3% in 2010. International exports increased by 2.8% in volume and by 8.3% in value in 2011, compared with increases of 0.4% and 2.1%, respectively, in 2010. International imports increased by 4.9% in volume and by 5.3% in value in 2011, compared with increases of 8.0% and 5.6%, respectively, in 2010.
The value of non-residential investment increased by 7.8% in 2011, the result of a 2.9% increase in the public sector and a 12.3% increase in the private sector. The value of residential investment increased by 3.3% in 2011.
The CPI increased by 3.0% in 2011. Overall employment increased by 1.0% in 2011 while the unemployment rate decreased to 7.8% from 8.0% in 2010.
- 13 -
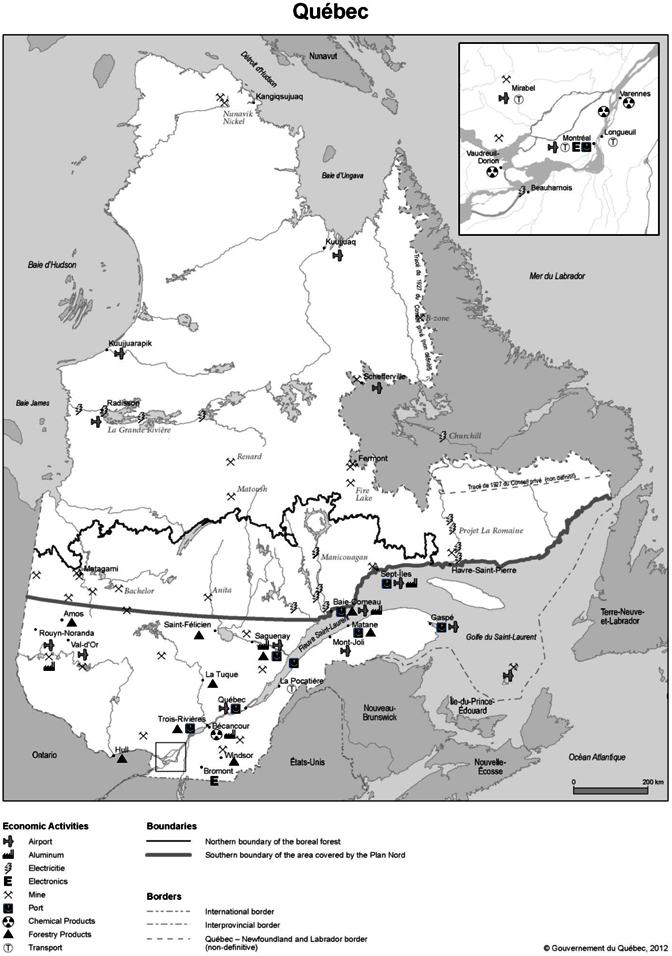
Plan Nord
On May 9, 2011, the Government launched, under its Plan Nord, a 25-year program for the long-term economic, social and environmental development of Northern Québec.
The territory covered by Plan Nord includes almost 1.2 million km2, or approximately 72% of the area of Québec, and has substantial undeveloped hydroelectric, mining and forestry potential.
For the purposes of the annual review of the five-year funding of the Fonds du Plan Nord, the investments in progress or planned on the territory are estimated at close to $30 billion. The tax spinoffs from these investments are currently expected to reach $5.5 billion over 25 years. Of that amount, $2.4 billion will be used to fund the construction of infrastructures and to develop social and community measures on the territory of the Plan Nord, under the Fonds du Plan Nord. The remaining $3.1 billion will be used to fund public services, such as health and education, through the general revenue fund and to repay the debt, through the Generations Fund. Through a new fund set up by the Government, Capital Mines Hydrocarbures, $750 million will be allocated over the next five years for the negotiation of equity interests in future projects developed exclusively on the Plan Nord territory. This sum will be administered by Ressources Québec, a new subsidiary of Investissement Québec.
- 14 -
Table 1
Main Economic Indicators of Québec(1)
(dollar amounts in millions, except for per capita amounts)
| | | | | | | | | | | | | | | | | | | | | | | | |
| | |
| | | 2007 | | | 2008 | | | 2009 | | | 2010 | | | 2011 | | | Compound Annual Rate of Growth 2007- 2011 | |
| | |
| | | | | | |
GDP | | | | | | | | | | | | | | | | | | | | | | | | |
| | | | | | |
At current market prices | | | 295,928 | | | | 304,479 | | | | 304,861 | | | | 319,348 | | | | 334,979 | | | | | |
| | | | | | |
| | | 4.8% | | | | 2.9% | | | | 0.1% | | | | 4.8% | | | | 4.9% | | | | 3.5% | |
| | | | | | |
In chained 2002 dollars | | | 265,585 | | | | 269,083 | | | | 267,290 | | | | 273,856 | | | | 278,427 | | | | | |
| | | | | | |
| | | 2.1% | | | | 1.3% | | | | -0.7% | | | | 2.5% | | | | 1.7% | | | | 1.4% | |
| | | | | | |
Per capita | | | 34,548 | | | | 34,717 | | | | 34,150 | | | | 34,640 | | | | 34,892 | | | | | |
| | | | | | |
| | | 1.4% | | | | 0.5% | | | | -1.6% | | | | 1.4% | | | | 0.7% | | | | 0.5% | |
| | | | | | |
Personal income | | | 249,883 | | | | 260,565 | | | | 262,079 | | | | 272,247 | | | | 281,897 | | | | | |
| | | | | | |
| | | 5.6% | | | | 4.3% | | | | 0.6% | | | | 3.9% | | | | 3.5% | | | | 3.6% | |
| | | | | | |
Per capita | | | 32,505 | | | | 33,618 | | | | 33,484 | | | | 34,437 | | | | 35,327 | | | | | |
| | | | | | |
| | | 4.8% | | | | 3.4% | | | | -0.4% | | | | 2.8% | | | | 2.6% | | | | 2.6% | |
| | | | | | |
Capital expenditures | | | 57,055 | | | | 60,118 | | | | 58,858 | | | | 63,098 | | | | 67,000 | | | | | |
| | | | | | |
| | | 10.1% | | | | 5.4% | | | | -2.1% | | | | 7.2% | | | | 6.2% | | | | 5.3% | |
| | | | | | |
Value of manufacturers’ shipments | | | 143,894 | | | | 147,003 | | | | 126,289 | | | | 132,116 | | | | 139,193 | | | | | |
| | | | | | |
| | | -1.2% | | | | 2.2% | | | | -14.1% | | | | 4.6% | | | | 5.4% | | | | -0.9% | |
| | | | | | |
Retail trade | | | 90,406 | | | | 94,806 | | | | 93,740 | | | | 99,509 | | | | 102,444 | | | | | |
| | | | | | |
| | | 4.5% | | | | 4.9% | | | | -1.1% | | | | 6.2% | | | | 2.9% | | | | 3.4% | |
| | |
| | | (In thousands of persons) | | | | |
| | | | | | | | |
| | | | | | |
Population (at July 1) | | | 7,687 | | | | 7,751 | | | | 7,827 | | | | 7,906 | | | | 7,980 | | | | | |
| | | | | | |
| | | 0.7% | | | | 0.8% | | | | 1.0% | | | | 1.0% | | | | 0.9% | | | | 0.9% | |
| | | | | | |
Labor Force | | | 4,133 | | | | 4,183 | | | | 4,204 | | | | 4,254 | | | | 4,286 | | | | | |
| | | | | | |
| | | 1.5% | | | | 1.2% | | | | 0.5% | | | | 1.2% | | | | 0.8% | | | | 1.0% | |
| | | | | | |
Participation rate (level in percentage) | | | 60.9% | | | | 61.0% | | | | 59.8% | | | | 60.2% | | | | 60.1% | | | | | |
| | | | | | |
Employment | | | 3,834 | | | | 3,880 | | | | 3,848 | | | | 3,915 | | | | 3,954 | | | | | |
| | | | | | |
| | | 2.4% | | | | 1.2% | | | | -0.8% | | | | 1.7% | | | | 1.0% | | | | 1.1% | |
| | | | | | |
Unemployment rate (level in percentage) | | | 7.2% | | | | 7.2% | | | | 8.5% | | | | 8.0% | | | | 7.8% | | | | | |
| | |
| | | (2002 = 100) | | | | |
| | | | | | | | |
| | | | | | |
CPI | | | 110.4 | | | | 112.7 | | | | 113.4 | | | | 114.8 | | | | 118.3 | | | | | |
| | | | | | |
| | | 1.6% | | | | 2.1% | | | | 0.6% | | | | 1.2% | | | | 3.0% | | | | 1.7% | |
| | |
| | (1) | Unless otherwise indicated, percentages are percentage changes from the previous year. |
| | Sources: Institut | de la statistique du Québec and Statistics Canada. |
- 15 -
Economic Structure
In 2011, Québec accounted for 20.5% of Canada’s real GDP. The service sector accounted for 75.7% of Québec’s real GDP, compared with 22.1% for the secondary sector and 2.2% for the primary sector. Québec’s economy is influenced by developments in the economies of its major trading partners, especially the United States, which is Québec’s largest export market. In 2011, the value of exports (including to other Canadian provinces) represented 45.4% of Québec’s GDP.
The following table shows the contribution of each sector to real GDP, which includes net taxes (taxes less subsidies) paid on factors of production. GDP is a measure of value added (the total value of goods delivered and services rendered less the cost of materials and supplies, fuel and electricity).
Table 2
Real Gross Domestic Product by Sector at Basic Prices in Chained 2002 Dollars(1)
(dollar amounts in millions)
| | | | | | | | | | | | | | | | | | | | | | | | | | | | | | | | | | | | |
| | |
| | | | | | | | | | | | % of Total 2010 | | | | | | % of Total 2011 | |
| | | 2007 | | | 2008 | | | 2009 | | | 2010 | | | Québec | | | Canada | | | 2011 | | | Québec | | | Canada | |
| | |
| | | | | | | | | |
Primary Sector | | | | | | | | | | | | | | | | | | | | | | | | | | | | | | | | | | | | |
| | | | | | | | | |
Agriculture, forestry, fishing and hunting | | | 4,606 | | | | 4,687 | | | | 4,412 | | | | 4,720 | | | | 1.9 | | | | 2.3 | | | | 4,710 | | | | 1.8 | | | | 2.3 | |
| | | | | | | | | |
Mining and oil and gas extraction | | | 1,006 | | | | 1,004 | | | | 1,000 | | | | 1,047 | | | | 0.4 | | | | 4.5 | | | | 1,040 | | | | 0.4 | | | | 4.5 | |
| | |
| | | 5,612 | | | | 5,691 | | | | 5,412 | | | | 5,767 | | | | 2.3 | | | | 6.8 | | | | 5,750 | | | | 2.2 | | | | 6.8 | |
| | |
| | | | | | | | | |
Secondary Sector | | | | | | | | | | | | | | | | | | | | | | | | | | | | | | | | | | | | |
| | | | | | | | | |
Manufacturing | | | 45,391 | | | | 44,365 | | | | 40,483 | | | | 41,154 | | | | 16.3 | | | | 12.8 | | | | 41,159 | | | | 16.0 | | | | 12.8 | |
| | | | | | | | | |
Construction | | | 13,338 | | | | 14,236 | | | | 13,890 | | | | 14,943 | | | | 5.9 | | | | 6.0 | | | | 15,562 | | | | 6.1 | | | | 6.0 | |
| | |
| | | 58,729 | | | | 58,601 | | | | 54,373 | | | | 56,097 | | | | 22.2 | | | | 18.8 | | | | 56,721 | | | | 22.1 | | | | 18.8 | |
| | |
| | | | | | | | | |
Service Sector | | | | | | | | | | | | | | | | | | | | | | | | | | | | | | | | | | | | |
| | | | | | | | | |
Community, business and personal services | | | 62,203 | | | | 63,532 | | | | 64,508 | | | | 65,444 | | | | 25.9 | | | | 24.7 | | | | 66,602 | | | | 26.0 | | | | 24.8 | |
| | | | | | | | | |
Finance, insurance and real estate | | | 42,344 | | | | 43,115 | | | | 44,438 | | | | 45,735 | | | | 18.1 | | | | 20.9 | | | | 46,792 | | | | 18.2 | | | | 20.9 | |
| | | | | | | | | |
Wholesale and retail trade | | | 29,676 | | | | 29,923 | | | | 29,641 | | | | 30,578 | | | | 12.1 | | | | 11.7 | | | | 30,888 | | | | 12.0 | | | | 11.7 | |
| | | | | | | | | |
Governmental services | | | 15,942 | | | | 16,389 | | | | 17,073 | | | | 17,444 | | | | 6.9 | | | | 6.1 | | | | 17,689 | | | | 6.9 | | | | 6.0 | |
| | | | | | | | | |
Transportation and warehousing | | | 10,877 | | | | 10,923 | | | | 10,736 | | | | 11,125 | | | | 4.4 | | | | 4.7 | | | | 11,384 | | | | 4.4 | | | | 4.7 | |
| | | | | | | | | |
Other utility services | | | 10,072 | | | | 10,803 | | | | 10,783 | | | | 10,924 | | | | 4.3 | | | | 2.6 | | | | 11,306 | | | | 4.4 | | | | 2.7 | |
| | | | | | | | | |
Information and cultural services | | | 9,474 | | | | 9,515 | | | | 9,524 | | | | 9,641 | | | | 3.8 | | | | 3.7 | | | | 9,829 | | | | 3.8 | | | | 3.6 | |
| | |
| | | | | | | | | |
| | | 180,588 | | | | 184,200 | | | | 186,703 | | | | 190,891 | | | | 75.5 | | | | 74.4 | | | | 194,490 | | | | 75.7 | | | | 74.4 | |
| | |
| | | | | | | | | |
Real GDP | | | 244,929 | | | | 248,492 | | | | 246,488 | | | | 252,755 | | | | 100.0 | | | | 100.0 | | | | 256,961 | | | | 100.0 | | | | 100.0 | |
| | |
| | (1) | North American Industrial Classification System (NAICS) in chained 2002 dollars. For the chained 2002 dollars, the aggregate amounts are not equal to the sums of their components. |
| | Source: | Statistics Canada. |
- 16 -
Primary Sector. In 2011, the primary sector, which includes agriculture, forestry, fishing and hunting and mining and oil and gas extraction, contributed 2.2% of real GDP and accounted for 2.3% of employment in Québec. Québec’s forests, covering 761,000 square kilometers, or 294,000 square miles, are among its most important natural resources. Québec’s logging operations were estimated to have produced approximately 0.830 billion cubic feet of timber in 2011, generating revenue of $1.494 billion from sales to domestic and foreign customers. In 2011, prices were higher than in 2010, but a reduction in timber production translated into lower revenues (the value of shipments decreased by 7.3% and the value of exports by 2.9%).
In mining and oil and gas extraction, which represented 18.1% of the primary sector in 2011, production is concentrated mainly in iron ore, gold, nickel, zinc, stone, cement and copper. In 2011, the value of mineral production amounted to $7.7 billion.
Secondary Sector. In 2011, the secondary sector, which consists of the manufacturing and construction industries, contributed 22.1% of real GDP and accounted for 18.3% of employment in Québec. In terms of real GDP, the construction industry recorded a 4.1% increase in 2011 over 2010, with a strong increase in business non-residential construction. Real GDP in manufacturing remained stable in 2011, although employment decreased by 2.7% in that industry. A strong Canadian dollar and weak demand from Québec’s trading partners, particularly the United States, explain the absence of growth in manufacturing real GDP. The manufacturing industries that showed the strongest growth are computers and electronic products (13.5% in real GDP and -2.3% in employment), machinery (9.3% in real GDP and 5.5% in employment), transportation equipment (5.8% in real GDP and -3.9% in employment), textiles (3.3% in real GDP and -6.5% in employment). In some other manufacturing industries, the demand decreased. The manufacturing industries that showed the greatest declines are chemical products (-14.6% in real GDP and 1.5% in employment), leather and allied products (-14.2% in real GDP and -15.2% in employment) and petroleum and coal products (-13.1% in real GDP and 15.8% in employment). The value of shipments of primary metals increased by 14.0% in 2011 due to higher world demand. Durable goods accounted for 56.5% of manufacturing real GDP and 56.2% of manufacturing employment. The leading manufacturing industries in Québec are primary metal products (including aluminum smelting), food products, petroleum and coal products, transportation equipment products (including aircraft and motor vehicles and associated parts), chemical products, paper products and fabricated metal products. As a result of its competitive advantage in low-cost electricity production, Québec is one of the world’s leading producers of aluminum.
| | | | | | | | | | | | | | | | | | | | | | | | | | | | |
Table 3 Value of Manufacturers’ Shipments(1) (dollar amounts in millions) | | | | | | | | | | | | | | | | |
| | |
| | | 2007 | | | 2008 | | | 2009 | | | 2010 | | | % of Total 2010 | | | 2011 | | | % of Total 2011 | |
| | |
| | | | | | | |
Primary metals | | | 21,472 | | | | 21,877 | | | | 15,121 | | | | 19,283 | | | | 14.6 | | | | 21,982 | | | | 15.8 | |
| | | | | | | |
Food | | | 16,496 | | | | 17,839 | | | | 18,991 | | | | 19,467 | | | | 14.7 | | | | 20,217 | | | | 14.5 | |
| | | | | | | |
Petroleum and coal | | | 14,651 | | | | 17,552 | | | | 13,890 | | | | 14,839 | | | | 11.2 | | | | 15,741 | | | | 11.3 | |
| | | | | | | |
Transportation equipment | | | 16,168 | | | | 17,758 | | | | 14,554 | | | | 12,585 | | | | 9.5 | | | | 15,006 | | | | 10.8 | |
| | | | | | | |
Chemicals | | | 10,086 | | | | 9,233 | | | | 8,614 | | | | 9,635 | | | | 7.3 | | | | 8,911 | | | | 6.4 | |
| | | | | | | |
Paper | | | 9,857 | | | | 9,989 | | | | 8,851 | | | | 8,758 | | | | 6.6 | | | | 8,638 | | | | 6.2 | |
| | | | | | | |
Fabricated metals | | | 8,068 | | | | 8,389 | | | | 7,005 | | | | 7,060 | | | | 5.3 | | | | 7,378 | | | | 5.3 | |
- 17 -
| | | | | | | | | | | | | | | | | | | | | | | | | | | | |
Table 3 (continued) Value of Manufacturers’ Shipments(1) | | | | | | | | | | | | | | | | | | | | | |
| | |
| | | | | | | |
Machinery | | | 6,025 | | | | 6,081 | | | | 5,493 | | | | 5,475 | | | | 4.1 | | | | 6,150 | | | | 4.4 | |
| | |
| | | | | | | |
Plastics and rubber | | | 6,502 | | | | 6,015 | | | | 4,940 | | | | 5,485 | | | | 4.2 | | | | 5,791 | | | | 4.2 | |
| | | | | | | |
Wood | | | 6,730 | | | | 6,114 | | | | 5,072 | | | | 5,555 | | | | 4.2 | | | | 5,149 | | | | 3.7 | |
| | | | | | | |
Beverage and tobacco | | | 3,499 | | | | 3,387 | | | | 3,421 | | | | 3,478 | | | | 2.6 | | | | 3,558 | | | | 2.6 | |
| | | | | | | |
Non-metallic mineral | | | 3,151 | | | | 3,187 | | | | 3,065 | | | | 3,303 | | | | 2.5 | | | | 3,393 | | | | 2.4 | |
| | | | | | | |
Others(2) | | | 21,190 | | | | 19,582 | | | | 17,270 | | | | 17,194 | | | | 13.0 | | | | 17,278 | | | | 12.4 | |
| | |
| | | 143,894 | | | | 147,003 | | | | 126,289 | | | | 132,116 | | | | 100.0 | | | | 139,193 | | | | 100.0 | |
| | |
| | (1) | North American Industrial Classification System (NAICS). |
| | (2) | Including notably, electrical equipment, appliance and component, computer and electronic and furniture and printing. |
| | Source: | Statistics Canada. |
Service Sector. The service sector includes a wide range of activities such as community, business and personal services, finance, insurance and real estate, wholesale and retail trade, governmental services, transportation and warehousing, other utility services and information and cultural services. In 2011, the service sector contributed 75.7% of real GDP and accounted for 78.7% of employment in Québec.
In terms of real GDP, there were increases in all industries in the service sector in 2011: other utility services by 3.5%, transportation and warehousing by 2.3%, finance, insurance and real estate by 2.3%, information and cultural services by 2.0%, community, business and personal services by 1.8%, governmental services by 1.4% and wholesale and retail trade increased by 1.0%.
Due to Québec’s large territory, transportation facilities are essential to the development of its economy. Water transportation is provided mainly through the St. Lawrence River Seaway. Approximately 28.0% of all international tonnage handled in Canadian ports in 2010 (the most recent year for which information is available) passed through Québec’s shipping facilities. Highway, rail and air transportation systems service the populated areas, with higher concentrations in the metropolitan areas of Montréal and Ville de Québec.
The financial sector includes large Canadian and foreign financial institutions, Québec’s cooperative institutions and Government financial intermediary enterprises and fiduciary agencies, including the Caisse de dépôt et placement du Québec (the “Caisse”), which is one of the largest institutional fund managers in North America.
Capital Expenditures. In 2011, the value of capital expenditures by the private and public sectors increased by 6.2% in Québec. Total capital expenditures increased as a result of a 3.3% increase in residential investment and a 7.8% increase in non-residential investment. Non-residential investment increased by 2.9% in the public sector and by 12.3% in the private sector.
The increase in non-residential investment resulted in large part from increases in manufacturing (54.7%), business services, accommodation and other services (25.1%), transportation and warehousing (24.2%), wholesale and retail trade (6.4%), mining and oil and gas extraction (5.6%) and governmental, educational, health and social services (4.6%). These increases were partially offset by decreases in finance, insurance and real estate operators (-6.5%), information, cultural and other utilities (-5.1%), agriculture, forestry, fishing and hunting (-4.2%) and construction (-3.5%).
- 18 -
| | | | | | | | | | | | | | | | | | | | | | | | | | | | |
Table 4 Private and Public Sectors Capital Expenditures in Québec(1) (dollar amounts in millions) | | | | | | | | | |
| | |
| | | 2007 | | | 2008 | | | 2009 | | | 2010 | | | % of Total
2010 | | | 2011 | | | % of Total 2011 | |
| | |
| | | | | | | |
Non-residential Investment: | | | | | | | | | | | | | | | | | | | | | | | | | | | | |
| | | | | | | |
Governmental, educational, health and social services | | | 9,672 | | | | 11,863 | | | | 13,277 | | | | 13,316 | | | | 21.1 | | | | 13,929 | | | | 20.8 | |
| | | | | | | |
Information, cultural and other utilities | | | 6,303 | | | | 6,743 | | | | 7,299 | | | | 6,990 | | | | 11.1 | | | | 6,636 | | | | 9.9 | |
| | | | | | | |
Finance, insurance and real estate operators | | | 6,877 | | | | 5,331 | | | | 4,125 | | | | 4,751 | | | | 7.5 | | | | 4,442 | | | | 6.6 | |
| | | | | | | |
Transportation and warehousing | | | 2,533 | | | | 2,501 | | | | 2,904 | | | | 2,059 | | | | 3.3 | | | | 2,559 | | | | 3.8 | |
| | | | | | | |
Manufacturing | | | 3,878 | | | | 4,123 | | | | 3,094 | | | | 3,333 | | | | 5.3 | | | | 5,155 | | | | 7.7 | |
| | | | | | | |
Business services, accommodation and other services | | | 2,309 | | | | 2,757 | | | | 2,677 | | | | 2,505 | | | | 4.0 | | | | 3,134 | | | | 4.7 | |
| | | | | | | |
Wholesale and retail trade | | | 3,018 | | | | 3,369 | | | | 2,635 | | | | 2,783 | | | | 4.4 | | | | 2,961 | | | | 4.4 | |
| | | | | | | |
Mining and oil and gas extraction | | | 1,505 | | | | 1,754 | | | | 1,790 | | | | 2,598 | | | | 4.1 | | | | 2,743 | | | | 4.1 | |
| | | | | | | |
Construction | | | 884 | | | | 889 | | | | 945 | | | | 1,190 | | | | 1.9 | | | | 1,149 | | | | 1.7 | |
| | | | | | | |
Agriculture, forestry, fishing and hunting | | | 804 | | | | 858 | | | | 758 | | | | 774 | | | | 1.2 | | | | 741 | | | | 1.1 | |
| | |
| | | | | | | |
| | | 37,780 | | | | 40,188 | | | | 39,504 | | | | 40,298 | | | | 63.9 | | | | 43,449 | | | | 64.8 | |
| | |
| | | | | | | |
Residential Investment | | | 19,274 | | | | 19,930 | | | | 19,354 | | | | 22,800 | | | | 36.1 | | | | 23,551 | | | | 35.2 | |
| | |
| | | | | | | |
| | | 57,054 | | | | 60,118 | | | | 58,858 | | | | 63,098 | | | | 100.0 | | | | 67,000 | | | | 100.0 | |
| | |
| | | | | | | |
Private sector | | | 43,015 | | | | 43,204 | | | | 39,709 | | | | 43,971 | | | | 69.7 | | | | 47,319 | | | | 70.6 | |
| | | | | | | |
Public sector | | | 14,039 | | | | 16,914 | | | | 19,149 | | | | 19,127 | | | | 30.3 | | | | 19,681 | | | | 29.4 | |
| | |
| | | | | | | |
| | | 57,054 | | | | 60,118 | | | | 58,858 | | | | 63,098 | | | | 100.0 | | | | 67,000 | | | | 100.0 | |
| | |
| | (1) | North American Industrial Classification System (NAICS). |
| | Source: | Statistics Canada. |
Labor Force. In 2011, the labor force was estimated at 4.3 million persons, an increase of 0.8% from 2010. The labor force participation rate for 2011 was estimated at 65.2% in Québec, compared with 66.8% in Canada. Total employment increased by 1.0% in 2011 in Québec, compared to a 1.6% increase in Canada. The unemployment rate in Québec decreased from 8.0% in 2010 to 7.8% in 2011, compared with a decrease from 8.0% to 7.4% in Canada for the same period.
Energy. Of the total energy consumed in Québec in 2009 (the most recent year for which information is available), energy derived from electricity accounted for 40.1%, oil for 39.1%, natural gas for 12.6%, biomass for 7.4% and coal for 1.0%.
Québec generates approximately one-third of all electricity produced in Canada and is one of the largest producers of hydroelectricity in the world. In 2011, approximately 97.2% of all electricity produced in
- 19 -
Québec was from hydroelectric installations. More than 38,000 megawatts (“MW”) of hydroelectric capacity (including the capacity of independent producers but excluding the firm capacity currently available from Churchill Falls (Labrador) Corporation Limited) have been or are in the process of being developed. Of the total electricity produced in Québec in 2011, 13.1% (based on sales volume) was exported to the United States and to other Canadian provinces, compared with 13.5% in 2010.
Exports and Imports. In 2011, Québec’s exports of goods and services totaled $152.1 billion, of which $88.4 billion (58.1%) were international exports and $63.7 billion (41.9%) were interprovincial exports. Québec’s international exports represented 16.5% of Canada’s total exports. Québec’s imports of goods and services totaled $175.3 billion, of which $111.4 billion (63.6%) were international imports and $63.9 billion (36.4%) were interprovincial imports. Québec’s international imports represented 20.0% of Canada’s total imports. In 2011, Québec’s external sector (as defined by the Provincial Economic Accounts of Statistics Canada) registered an overall deficit of $23.3 billion, including $23.1 billion on international trade and $0.2 billion on interprovincial trade. In 2010, Québec registered an overall deficit of $25.1 billion, including $24.3 billion on international trade and $0.8 billion on interprovincial trade. The deficit in 2011 reflects mainly the impact of a strong Canadian dollar on international trade and a surge in oil prices. The value of exports increased as a result of higher volume and prices. The value of imports was supported by strong domestic demand and slightly higher prices. The volume of imports was also stimulated by slower growth in import prices relative to domestic prices resulting from a strong Canadian dollar.
Québec’s international exports of goods are diversified: aircraft and associated parts have the largest export share, accounting for 12.1% of the total. Aluminum and alloys exports rank second with 10.6%, and chemical products are next with 5.1%. International exports of goods originating from Québec, calculated by the Institut de la statistique du Québec from data on Canada’s total exports of goods, were $63.5 billion for 2011 compared with $59.2 billion in 2010, an increase of 7.4%. Increases occurred in the value of exports of motor vehicles and associated parts (29.7%), scientific equipment (13.0%), copper and alloys (12.2%), plastics (11.9%), electronic products (10.9%), aluminum and alloys (9.7%), aircraft and associated parts (3.0%) and machinery (2.9%). These increases were partially offset by decreases in the value of exports of newsprint and printing paper (-2.4%), tools and other equipment (-1.2%) and chemical products (-0.3%).
The United States is Québec’s principal international export market, accounting for 67.6% of international exports of goods in 2011. The balance of international exports is broadly distributed: Europe (14.6%), Asia excluding Middle-East (8.6%), Middle-East (2.9%), and the rest of world (6.3%). From 2001 to 2011, the share of international exports to destinations other than the United States more than doubled, rising from 15.5% to 32.4%.
- 20 -
| | | | | | | | | | | | | | | | | | | | | | | | | | | | |
Table 5 Québec’s International Exports of Goods (dollar amounts in millions) | | | | | | | | | | | | | | | | | |
| | |
| | | 2007 | | | 2008 | | | 2009 | | | 2010 | | | % of Total 2010 | | | 2011 | | | % of Total 2011 | |
| | |
| | | | | | | |
Aircraft and associated parts | | | 9,350 | | | | 8,824 | | | | 8,889 | | | | 7,477 | | | | 12.6 | | | | 7,699 | | | | 12.1 | |
| | | | | | | |
Aluminum and alloys | | | 8,034 | | | | 7,615 | | | | 4,860 | | | | 6,156 | | | | 10.4 | | | | 6,755 | | | | 10.6 | |
| | | | | | | |
Chemical products | | | 3,293 | | | | 3,182 | | | | 3,205 | | | | 3,220 | | | | 5.4 | | | | 3,211 | | | | 5.1 | |
| | | | | | | |
Machinery | | | 2,597 | | | | 2,825 | | | | 2,531 | | | | 2,485 | | | | 4.2 | | | | 2,556 | | | | 4.0 | |
| | | | | | | |
Newsprint and printing paper | | | 3,543 | | | | 3,809 | | | | 2,810 | | | | 2,616 | | | | 4.4 | | | | 2,553 | | | | 4.0 | |
| | | | | | | |
Copper and alloys | | | 2,286 | | | | 2,463 | | | | 1,459 | | | | 1,940 | | | | 3.3 | | | | 2,176 | | | | 3.4 | |
| | | | | | | |
Scientific equipment | | | 1,852 | | | | 2,408 | | | | 1,840 | | | | 1,755 | | | | 3.0 | | | | 1,983 | | | | 3.1 | |
| | | | | | | |
Motor vehicles and associated parts | | | 1,814 | | | | 1,547 | | | | 1,229 | | | | 1,220 | | | | 2.1 | | | | 1,579 | | | | 2.5 | |
| | | | | | | |
Electronic products | | | 2,468 | | | | 2,057 | | | | 1,421 | | | | 1,288 | | | | 2.2 | | | | 1,429 | | | | 2.2 | |
| | | | | | | |
Tools and other equipment | | | 2,094 | | | | 2,007 | | | | 1,488 | | | | 1,398 | | | | 2.4 | | | | 1,381 | | | | 2.2 | |
| | |
| | | | | | | |
Plastics | | | 1,668 | | | | 1,614 | | | | 1,087 | | | | 1,162 | | | | 2.0 | | | | 1,301 | | | | 2.0 | |
| | | | | | | |
Other goods(1) | | | 30,800 | | | | 32,409 | | | | 27,231 | | | | 28,472 | | | | 48.1 | | | | 30,921 | | | | 48.7 | |
| | |
| | | | | | | |
Total | | | 69,798 | | | | 70,760 | | | | 58,049 | | | | 59,189 | | | | 100.0 | | | | 63,543 | | | | 100.0 | |
| | |
(1) The other goods category represents diverse products or product groups from a broad range of industrial and manufacturing sectors, such as iron and steel products, lumber and wood products, paperboard and other paper.
Source: Institut de la statistique du Québec.
- 21 -
| | | | | | | | | | | | | | | | | | | | | | | | | | | | |
Table 6 Québec’s International Imports of Goods (dollar amounts in millions) | | | | | | | | | | | | | | | | | |
| | |
| | | 2007 | | | 2008 | | | 2009 | | | 2010 | | | % of Total 2010 | | | 2011 | | | % of Total 2011 | |
| | |
| | | | | | | |
Mineral fuels, mineral oils, bituminous substances and mineral waxes | | | 18,143 | | | | 22,237 | | | | 13,964 | | | | 16,683 | | | | 21.8 | | | | 18,743 | | | | 22.5 | |
| | | | | | | |
Motor vehicles, trailers, bicycles, motorcycles and other similar vehicles | | | 11,786 | | | | 11,424 | | | | 9,173 | | | | 10,931 | | | | 14.3 | | | | 11,233 | | | | 13.5 | |
| | | | | | | |
Nuclear reactors, boilers, machinery and mechanical appliances | | | 7,627 | | | | 8,202 | | | | 7,311 | | | | 6,971 | | | | 9.1 | | | | 7,776 | | | | 9.3 | |
| | | | | | | |
Electrical or electronic machinery and equipment | | | 5,984 | | | | 5,758 | | | | 5,265 | | | | 5,670 | | | | 7.4 | | | | 5,939 | | | | 7.1 | |
| | | | | | | |
Pearls, precious stones or metals, coins and jewelry | | | 1,826 | | | | 1,936 | | | | 1,377 | | | | 2,161 | | | | 2.8 | | | | 3,008 | | | | 3.6 | |
| | | | | | | |
Aircraft and spacecraft | | | 3,894 | | | | 3,612 | | | | 2,514 | | | | 2,174 | | | | 2.8 | | | | 2,353 | | | | 2.8 | |
| | | | | | | |
Inorganic chemicals and compounds or precious metals and radioactive elements | | | 2,011 | | | | 2,562 | | | | 1,822 | | | | 2,027 | | | | 2.6 | | | | 2,303 | | | | 2.8 | |
| | | | | | | |
Pharmaceutical products | | | 2,139 | | | | 2,179 | | | | 3,420 | | | | 2,842 | | | | 3.7 | | | | 2,243 | | | | 2.7 | |
| | | | | | | |
Optical, medical, photographic, scientific and technical instrumentation | | | 1,750 | | | | 1,951 | | | | 1,860 | | | | 1,838 | | | | 2.4 | | | | 2,100 | | | | 2.5 | |
| | | | | | | |
Plastics and articles thereof | | | 1,736 | | | | 1,934 | | | | 1,734 | | | | 1,903 | | | | 2.5 | | | | 2,070 | | | | 2.5 | |
| | | | | | | |
Rubber and articles thereof | | | 822 | | | | 1,388 | | | | 1,396 | | | | 1,530 | | | | 2.0 | | | | 1,810 | | | | 2.2 | |
| | | | | | | |
Other goods(1) | | | 23,148 | | | | 24,409 | | | | 21,508 | | | | 21,929 | | | | 28.6 | | | | 23,732 | | | | 28.5 | |
| | |
Total | | | 80,866 | | | | 87,592 | | | | 71,344 | | | | 76,659 | | | | 100.0 | | | | 83,309 | | | | 100.0 | |
| | |
| | (1) | The other goods category represents diverse products or product groups from a broad range of industrial and manufacturing sectors, such as beverages, spirits and vinegar, knitted or crocheted clothing, articles of apparel, furniture, stuffed furnishings, lamps and illuminated signs and prefabricated buildings. | |
Source: Institut de la statistique du Québec.
- 22 -
Table 7
Selected Trade Indicators for Québec
(dollar amounts in millions)
| | | | | | | | | | | | | | | | | | | | |
| | |
| | | 2007 | | | 2008 | | | 2009 | | | 2010 | | | 2011 | |
| | |
| | | | | |
Exports of Goods and Services | | | 154,174 | | | | 157,091 | | | | 139,391 | | | | 142,793 | | | | 152,137 | |
| | | | | |
Exports to other countries | | | 94,224 | | | | 96,244 | | | | 79,912 | | | | 81,587 | | | | 88,392 | |
| | | | | |
Exports of goods to other countries | | | 81,424 | | | | 82,882 | | | | 67,541 | | | | 68,634 | | | | 74,589 | |
| | | | | |
Exports of services to other countries | | | 12,799 | | | | 13,362 | | | | 12,371 | | | | 12,953 | | | | 13,803 | |
| | | | | |
Exports to other provinces | | | 59,951 | | | | 60,847 | | | | 59,479 | | | | 61,206 | | | | 63,745 | |
| | | | | |
Exports of goods to other provinces | | | 34,644 | | | | 33,573 | | | | 32,433 | | | | 32,716 | | | | 33,508 | |
| | | | | |
Exports of services to other provinces | | | 25,308 | | | | 27,274 | | | | 27,046 | | | | 28,490 | | | | 30,236 | |
| | | | | |
Ratio of Exports to Nominal GDP | | | 52.1% | | | | 51.6% | | | | 45.7% | | | | 44.7% | | | | 45.4% | |
| | | | | |
Imports of Goods and Services | | | 165,107 | | | | 175,747 | | | | 160,269 | | | | 167,838 | | | | 175,359 | |
| | | | | |
Imports from other countries | | | 103,175 | | | | 113,345 | | | | 100,263 | | | | 105,845 | | | | 111,447 | |
| | | | | |
Imports of goods from other countries | | | 89,538 | | | | 99,071 | | | | 85,590 | | | | 91,000 | | | | 96,257 | |
| | | | | |
Imports of services from other countries | | | 13,637 | | | | 14,274 | | | | 14,673 | | | | 14,845 | | | | 15,190 | |
| | | | | |
Imports from other provinces | | | 61,931 | | | | 62,402 | | | | 60,006 | | | | 61,993 | | | | 63,912 | |
| | | | | |
Imports of goods from other provinces | | | 32,030 | | | | 31,695 | | | | 29,237 | | | | 29,897 | | | | 30,632 | |
| | | | | |
Imports of services from other provinces | | | 29,901 | | | | 30,707 | | | | 30,769 | | | | 32,096 | | | | 33,281 | |
| | | | | |
Balance of Goods and Services | | | -10,932 | | | | -18,656 | | | | -20,878 | | | | -25,045 | | | | -23,223 | |
| | | | | |
Balance with other countries | | | -8,952 | | | | -17,101 | | | | -20,351 | | | | -24,258 | | | | -23,055 | |
| | | | | |
Balance with other provinces | | | -1,980 | | | | -1,555 | | | | -527 | | | | -787 | | | | -167 | |
| | |
| | Sources: | Institut de la statistique du Québec and Statistics Canada. |
Free Trade Agreements
Canada is a member of the World Trade Organization (“WTO”) and has also signed other trade agreements in order to promote commerce with economic partners. In 1989, the United States and Canada entered into a free trade agreement (“FTA”), which has led to the gradual elimination of tariffs on goods and services between the two countries and to the liberalization of trade in several sectors including the energy sector. The FTA provides for a binding binational review of domestic determinations in anti-dumping and countervailing duty cases and for binational arbitration of disputes between Canada and the United States as to either’s compliance with the FTA or with the rules of the WTO. In 1994, Canada, the United States and Mexico signed a similar free trade agreement, the North American Free Trade Agreement (“NAFTA”), which resulted, with a few exceptions, in the gradual elimination by 2003 of tariffs on goods and services among Canada, the United States and Mexico.
In April 1998, negotiations were undertaken between countries of the Americas (North, Central and South) to reach a new trade agreement by January 1, 2005 (Free Trade Area of the Americas or “FTAA”). Although the January 1, 2005 deadline was not met, parties to the negotiations of the FTAA have reaffirmed their commitment to pursue such negotiations in the future. Canada and the European Union began negotiations regarding a free trade agreement in 2010, with the aim of reaching an agreement in 2012.
- 23 -
Canada has effective free trade agreements with Chile, Israel, Costa Rica, Peru, the member states of the European Free Trade Association (Norway, Switzerland, Iceland and Liechtenstein) and Colombia and has signed agreements which are currently in process of approval with Jordan, Panama and Honduras. It has also initiated free trade negotiations with India, Ukraine, Turkey, Morocco and Japan.
On February 12, 2010, Canada and the United States signed the Agreement on Government Procurement which, notably, provides Canadians with permanent access to U.S. state and local government procurement commitments in exchange for permanent U.S. access to Canadian provincial and territorial procurement contracts in accordance with the WTO Government Procurement Agreement.
Softwood Lumber Dispute For many years, U.S. forest products interests including lumber producers and various labor unions have pursued allegations that softwood lumber imports from Canada were subsidized by the federal and provincial governments. In 2006, the U.S. and Canada entered into the Softwood Lumber Agreement (“SLA”). Under the terms of the SLA, Canadian lumber exports from provinces covered by the dispute are subject to an export charge only (Option A) or an export charge plus volume restraint (Option B) if the prevailing monthly price of lumber (as defined in the SLA) drops below US$355 per thousand board feet. The total volume of permitted exports, which takes into account anticipated demand in the United States, is allocated to the provinces in question. Provincial quotas are calculated on the basis of the share of lumber exports over the period from April 1, 2001 to December 31, 2005.
Québec chose Option B, which involves:
| q | no charge and no volume restraint, if the prevailing monthly price of lumber is over US$355; |
| q | a 2.5% export charge and Québec’s volume cannot exceed a share of 4.86% of expected U.S. consumption for the month, if the prevailing monthly price of lumber is between US$336 and US$355; |
| q | a 3% export charge and Québec’s volume cannot exceed a share of 4.57% of expected U.S. consumption for the month, if the prevailing monthly price of lumber is between US$316 and US$335; |
| q | a 5% export charge and Québec’s volume cannot exceed a share of 4.29% of expected U.S. consumption for the month, if the prevailing monthly price of lumber is US$315 or below. |
With the exception of the months of May, June and July 2010, the prevailing monthly price (based on the Random Lengths Framing Lumber Composite) has remained below US$315 since July 2006. During the months of May, June and July 2010, the prevailing monthly prices were US$325, US$361 and US$316, respectively.
Unless terminated by either party, the SLA is to remain in force through 2015 and may be renewed for an additional 2 year period. In accordance with the dispute resolution mechanism of the SLA, the United States initiated arbitration proceedings in the London Court of International Arbitration (“LCIA”) in August 2007. The United States alleged Canada’s breach of the SLA due to its failure to: (1) adequately calculate the export measures based on the adjusted expected U.S. consumption of lumber; and (2) impose the agreed-upon export measures beginning in January 2007.
In a March 2008 decision, the LCIA concluded that Canada did not breach the SLA with respect to the calculation of the export measures, but did breach the SLA by failing to impose such export measures as of January 1, 2007. In February 2009, following remedy hearings, the LCIA issued its decision on the cure of
- 24 -
the breach which required Canada to collect an additional 10% ad valorem export charge on softwood lumber shipments from the concerned regions (Québec, Ontario, Manitoba and Saskatchewan) for a total remedy amount of $68.26 million. All other claims raised in the arbitration were dismissed.
In response to this decision, the United States imposed a compensatory import charge of 10% that went into effect on April 15, 2009. On August 31, 2010, the U.S. ceased collecting the 10% compensatory import charge and, by agreement, Canada began collecting a similar compensatory export charge. Canada ceased collecting this compensatory export charge on June 30, 2011, when it was agreed that the combined amounts collected by the United States and Canada had exceeded $68.26 million.
In January 2008, the United States initiated arbitration proceedings in the LCIA, alleging that Canada, through the provincial governments of Québec and Ontario, had breached the SLA by providing grants and other benefits which had the effect of circumventing Canada’s commitments under the SLA. In a January 2011 decision, the Tribunal found that, out of the eight Québec programs alleged by the U.S. to have breached the SLA, five were in compliance and three were in breach. The Tribunal ordered Canada to impose an additional compensatory export charge of 2.6% on softwood lumber exports from Québec to the U.S. This charge will continue to be collected until the end of the SLA.
In January 2011, the United States again initiated arbitration proceedings in the LCIA, alleging that Canada, through the provincial government of British Columbia, had breached the SLA by underpricing lumber cut from government owned forests in British Columbia and sold to Canadian lumber producers. Canada denies the allegations. The proceedings are ongoing.
- 25 -
GOVERNMENT FINANCES
Financial Administration
The Minister of Finance is responsible for the general administration of the Government’s finances. The Financial Administration Act and the Balanced Budget Act govern the management of public monies of Québec and the Public Administration Act governs the management of financial, human, physical and information resources of the Administration.
Since January 2007, the Minister of Finance also manages the Generations Fund. This fund was established in June 2006 pursuant to the Act to reduce the debt and establish the Generations Fund, in order to reduce the Government’s debt burden.
The Conseil exécutif issues Orders in Council that authorize the Minister of Finance to enter into financial contracts, including those related to borrowings by the Government. The Conseil du trésor determines the accounting policies.
The accounts of the Government are kept on an accrual basis, in accordance with the Canadian public sector accounting standards of the Canadian Institute of Chartered Accountants (CICA). The fiscal year of the Government ends March 31. The Auditor General of Québec is responsible for auditing the consolidated financial statements of the Government and reporting annually to the National Assembly. All monies received or collected from any source over which the Parliament has power of appropriation form the Consolidated Revenue Fund of Québec. The Budget and appropriations from the Consolidated Revenue Fund and consolidated entities are published at the beginning of each fiscal year.
Adopted by the National Assembly in June 2011, Bill 10 stipulates that the Consolidated Revenue Fund will henceforth be comprised of a General Fund and the special funds. The General Fund groups all of the transactions that used to be considered transactions of the Consolidated Revenue Fund prior to the adoption of Bill 10.
A special fund is a fund established by an Act of Parliament to provide for certain financial commitments of a minister, a budget-funded body or a body exercising an adjudicative function other than a budget-funded body. As a general rule, a sum taken out of or paid into the Consolidated Revenue Fund is debited from or credited to the General Fund. There are currently 34 special funds whose missions are to deliver services and sell goods to fund government programs.
The accounts of the General Fund and the other entities included in the Government’s reporting entity, with the exception of Government enterprises, are consolidated line-by-line in the financial statements. Consolidated entities are presented in five separate groups: the non-budget-funded bodies, the special funds, the health and social services and education networks, the Generations Fund and the consolidation adjustments.
Transactions are classified as “budgetary”, “non-budgetary” or “financing”:
| q | budgetary transactions include: |
with respect to the General Fund:
- 26 -
- revenue consisting of taxes, duties and permits, net results from Government enterprises1, transfers from the federal government and miscellaneous sources; and
- expenditures consisting of operating expenditures for goods and services which include, among other things, transfer payments, remuneration and debt service;
with respect to consolidated entities2:
- the net result of their self-generated revenues less their expenditures offset by transfers from the General Fund.
| q | non-budgetary transactions include changes in the balances of investments, loans and advances made by the Government, particularly to its own enterprises, changes in net fixed assets made by the Government, changes in the retirement plans’liability and changes in other accounts. Since Fiscal 2010, non-budgetary transactions related to the health and social services and education networks are consolidated line-by-line; in previous years they were shown separately under the item “net investment in the networks; |
| q | financing transactions include changes in cash position, changes in net borrowings, changes in the retirement plans sinking fund and funds dedicated to employee’s future benefits and changes in the Generations Fund. |
The Balanced Budget Act is designed to ensure that, on multi-year basis, the Government maintains a balanced budget. The Act provides that if there were any short fall in achieving the budgetary deficit objectives for Fiscal 2012 and Fiscal 2013 or a budgetary deficit in any other fiscal year (an “Overrun”) which is less than $1 billion, then the Overrun must be offset in the next fiscal year. However, if the Overrun stems from exceptional circumstances defined in the Act and is at least $1 billion, the Overrun may be offset over a maximum period of five years.
This Act also provides for a stabilization reserve fund that facilitates the Government’s multi-year budget planning. The stabilization reserve fund consists of the surplus for any fiscal year and its purpose is to enable multi-year planning of the Government’s financial framework. It is used primarily to maintain a balanced budget and, secondarily, for payment of sums into the Generations Fund.
The budgetary deficits for Fiscal 2010 through Fiscal 2013 are authorized under the Balanced Budget Act, as amended, pursuant to the Act to amend the Balanced Budget Act and various legislative provisions concerning the implementation of the accounting reform, which came into force on September 21, 2009. The main objective of the amendments was to ensure an expedient return to economic growth by implementing economic measures that supported the economy and promoted employment during the recession which affected Québec as a result of the 2008 international financial crisis.
The amended Balanced Budget Act further provides that:
1 Government enterprises are separate legal entities that have the authority to enter into contracts in their own name and to act before the courts. Their main activity is the sale of goods or the delivery of services to individuals or to organizations not included in the Government’s reporting entity.
2 Consolidated entities are those entities required to report to the National Assembly for the management of their operations and for the use of their financial resources. They include non-budget-funded bodies and special funds that pursue objectives complementary to governmental programs but exclude Government enterprises. They include also the vast majority of organizations of the Government’s health and social services and education networks and the Generations Fund. From an administrative and accounting point of view, consolidated entities are under the direct control of the Government and form entities which are not part of the General Fund.
- 27 -
| q | the Government must meet definitive objectives for decreasing budgetary deficits for Fiscal 2012 ($3.8 billion) and Fiscal 2013 ($1.5 billion); the objectives were established in the 2011-2012 Budget; |
| q | the revenue and expenditures established in accordance with the Government’s accounting policies must be balanced for Fiscal 2014. |
In Fiscal 2011, final figures showed that expenditures exceeded revenues by $2.4 billion and the budgetary balance, within the meaning of the Balanced Budget Act, amounted to a deficit of $3.2 billion. According to the 2012-2013 Budget, the budgetary balance within the meaning of the Balanced Budget Act is expected to be in deficit by $3.3 billion for Fiscal 2012 and by $1.5 billion for Fiscal 2013.
The following table summarizes the consolidated financial transactions of the Government for the three years ended March 31, 2011, the preliminary results for Fiscal 2012 and the budget forecast for Fiscal 2013.
Table 8
Summary of Consolidated Financial Transactions(1)
Year ending March 31
(dollar amounts in millions)
| | | | | | | | | | | | | | | | | | | | |
| | | | 2009 | | | | 2010 | (2) | | | 2011 | (2) | |
| Preliminary
Results 2012 | (2)(3)(4)
| |
| Budget
Forecast 2013 | (2)(3)
|
Budgetary transactions of the General Fund | | | | | | | | | | | | | | | | | | | | |
| | | | | |
Own-source revenue | | | 48,773 | | | | 45,604 | | | | 48,782 | | | | 50,364 | | | | 53,598 | |
| | | | | |
Federal transfers | | | 14,023 | | | | 15,161 | | | | 15,425 | | | | 15,175 | | | | 15,797 | (5) |
| | | | | |
Total revenue | | | 62,796 | | | | 60,765 | | | | 64,207 | | | | 65,539 | | | | 69,395 | |
| | | | | |
Program spending | | | (58,550) | | | | (59,864) | | | | (61,722) | | | | (61,384) | | | | (62,642) | |
| | | | | |
Debt service | | | (6,504) | | | | (6,117) | | | | (6,984) | | | | (7,452) | | | | (8,237) | |
| | | | | |
Total expenditure | | | (65,054) | | | | (65,981) | | | | (68,706) | | | | (68,836) | | | | (70,879) | |
| | | | | |
Net results of General Fund | | | (2,258) | | | | (5,216) | | | | (4,499) | | | | (3,597) | | | | (1,784) | |
| | | | | |
Net results of consolidated entities | | | 1,007 | | | | 2,276 | | | | 2,109 | | | | 1,145 | | | | 1,195 | |
| | | | | |
Contingency reserve | | | - | | | | - | | | | - | | | | (300) | | | | (300) | |
| | | | | |
Surplus for the purposes of the public accounts | | | (1,251) | | | | (2,940) | | | | (2,390) | | | | (2,452) | | | | (589) | |
| | | | | |
Deposits of dedicated revenues in the Generations Fund | | | (587) | | | | (725) | | | | (760) | | | | (848) | | | | (911) | |
| | | | | |
Stabilization reserve (6) | | | 1,845 | | | | 433 | | | | - | | | | - | | | | - | |
| | | | | |
Accounting modifications | | | - | | | | 58 | | | | - | | | | - | | | | - | |
| | | | | |
Consolidated budgetary balance for the purposes of the Balanced Budget Act | | | 7 | | | | (3,174) | | | | (3,150) | | | | (3,300) | | | | (1,500) | |
| | | | | |
Deposit of dedicated revenues in the Generations Fund(7) | | | 587 | | | | 725 | | | | 760 | | | | 848 | | | | 911 | |
| | | | | |
Consolidated budgetary balance | | | 594 | | | | (2,449) | | | | (2,390) | | | | (2,452) | | | | (589) | |
Consolidated non-budgetary transactions(8) | | | | | | | | | | | | | | | | | | | | |
| | | | | |
Investments, loans and advances | | | (966) | | | | (2,009) | | | | (3,066) | | | | (1,928) | | | | (1,038) | |
- 28 -
Table 8 (continued)
Summary of Consolidated
Financial Transaction(1)
Year ending March 31
| | | 0000000000 | | | | 0000000000 | | | | 0000000000 | | | | 0000000000 | | | | 0000000000 | |
| | | | | |
Fixed Assets(9) | | | (2,448) | | | | (4,226) | | | | (4,923) | | | | (4,802) | | | | (5,036) | |
| | | | | |
Net investments in the networks | | | (622) | | | | - | | | | - | | | | - | | | | - | |
| | | | | |
Retirement plans | | | 2,274 | | | | 2,612 | | | | 3,526 | | | | 2,877 | | | | 2,628 | |
| | | | | |
Other accounts (10) | | | 638 | | | | 1,354 | | | | 1,901 | | | | (989) | | | | (385) | |
| | | | | |
Consolidated non-budgetary
requirements | | | (1,124) | | | | (2,269) | | | | (2,562) | | | | (4,842) | | | | (3,831) | |
| | | | | |
Consolidated net financial
requirements | | | (530) | | | | (4,718) | | | | (4,952) | | | | (7,294) | | | | (4,420) | |
| | | | | |
Consolidated financing transactions | | | | | | | | | | | | | | | | | | | | |
| | | | | |
Change in cash position (11) | | | (4,639) | | | | 3,702 | | | | (1,995) | | | | 1,090 | | | | 4,401 | |
| | | | | |
Net borrowings (12) | | | 10,806 | | | | 4,335 | | | | 12,029 | | | | 10,307 | | | | 3,212 | |
| | | | | |
Retirement plans sinking fund (13)
and funds dedicated to employee
future benefits (14) | | | (4,918) | | | | (2,594) | | | | (4,322) | | | | (3,255) | | | | (1,982) | |
| | | | | |
Generations Fund | | | (719) | | | | (725) | | | | (760) | | | | (848) | | | | (1,211) | |
| | | | | |
Total consolidated financing
transactions | | | 530 | | | | 4,718 | | | | 4,952 | | | | 7,294 | | | | 4,420 | |
| | (1) | The categories set forth reflect the presentation of the 2012-2013 Budget. Beginning in Fiscal 2012, following the adoption of Bill 10, the General Fund groups all the transactions that, in prior fiscal years, used to be considered transactions of the Consolidated Revenue Fund. The net results of the consolidated entities still include those of the special funds, including the Generations Fund, the non-budget-funded bodies, the health and social services and education networks and the consolidation adjustments. Therefore, Bill 10 does not impact the financial presentation. |
| | (2) | Since Fiscal 2010, figures incorporate the implementation of the Land Transportation Network Fund (FORT). The creation of this fund does not affect the Government’s budgetary balance. However, it modifies the level of own-source revenue, program spending and net results of consolidated entities. |
| | (3) | Since Fiscal 2012, figures incorporate the implementation of the Tax Administration Fund (FRAF). The creation of this fund does not affect the Government’s budgetary balance. However, it modifies the level of own-source revenue, program spending and net results of consolidated entities. |
| | (4) | The Preliminary Results 2012 are based on financial information presented as at March 31, 2012 in the 2012-2013 Budget which was tabled on March 20, 2012. These preliminary results are subject to change. |
| | (5) | Includes an amount of $733 million from the Canada-Québec agreement dated on March 28, 2012, which stipulates that the federal government will pay Québec $2.2 billion in compensation in respect of the harmonization of the Québec sales tax (QST) with the goods and services tax (GST). |
| | (6) | A negative amount indicates an allocation to the reserve and a positive amount indicates a use of the reserve. |
| | (7) | The Generations Fund was created in June 2006 by the adoption of the Act to reduce the debt and establish the Generations Fund and is a separate entity from the General Fund. This law establishes the fund as a permanent tool for reducing the debt burden. In addition, it stipulates that the sums accumulated in the Generations Fund are dedicated exclusively to repaying the debt. |
| | (8) | Since Fiscal 2010, with line-by-line consolidation of the health and social services and education networks, their non-budgetary transactions are consolidated in these activities. Therefore, the item “net investment in the networks” no longer exists because it is now part of transactions between related entities. |
| | (9) | Since Fiscal 2012, Fixed assets exclude public-private partnership (PPP) investments. As PPP investments are made and financed by private-sector partners, they do not entail financial requirements for the Government. |
| | (10) | Reflects notably year-to-year changes in accounts payable and receivable, cash on hand and outstanding bank deposits and checks. |
| | (11) | A positive number indicates a net decrease in cash. |
| | (12) | Represents mainly new borrowings of $17,351 million, $14,664 million, $20,420 million, $20,762 million and $14,542 for each of Fiscal 2009 through 2013, respectively, less repayment of borrowings. |
| | (13) | This sinking fund receives amounts to be used to cover retirement benefits payable by the Government under the public and parapublic sector retirement plans. (see “Consolidated Non-Budgetary Transactions Relating to Retirement Plans”). |
| | (14) | These funds receive amounts used to cover employee’s future benefits (accumulated sick leave and surviving spouse’s pensions) payable to the Government’s employees. |
- 29 -
2011-2012 Preliminary Results
Preliminary results for the Government’s financial transactions in Fiscal 2012 indicate a deficit of $3.3 billion, an improvement of $500 million compared with the forecasts in the March 2011 budget.
The revenue of the General Fund for Fiscal 2012 is expected to be $164 million higher than forecasted in the 2011-2012 Budget. Excluding Government enterprises, the upward adjustment to own-source revenue amounts to $54 million. This adjustment reflects mainly the higher-than-expected revenue from personal income tax and corporate taxes and higher contributions to the health services fund. This increase is partially offset by a decline in revenue from consumption taxes compared with the forecast in the 2011-2012 Budget. The aggregate profits of Government enterprises were revised downward by $26 million, notably as a result of the downward adjustment of Loto-Québec’s revenues. This decrease is primarily due to the impact of the deterioration of the economic situation in Europe, which affected the value of Loto-Québec’s investment in JOAGROUPE, a French company that operates casinos. The $136 million increase in federal transfers stems mainly from the renewal for two years of the Canada-Québec Agreement Regarding the Participation of Handicapped Persons in the Labour Market, which entails a $46-million increase in revenue in 2011-2012, a $25-million upward revision in revenue in respect of the special tax on dividends from preferred shares and an upward adjustment of $15 million in respect of the reduction of the reimbursement to be made to the federal government under the discontinued Youth Allowance Program.
General Fund expenditures were revised downward by $242 million compared with the forecasts of the 2011-2012 Budget. The level of program spending (expenditures excluding debt service) set for Fiscal 2012 was revised upward by $100 million, due mainly to a greater number of students in the education network. Debt service was revised downward by $342 million.
The net results of consolidated entities are expected to total $1,145 million in Fiscal 2012, an upward revision of $2 million compared with the forecasts of the 2011-2012 Budget. These net results are mainly explained by the surpluses of the Generations Fund and the other special funds, which are expected to amount to $848 million and $555 million, respectively, and by the deficit of the non-budget-funded bodies, which is expected to be at $127 million.
2012-2013 Budget
With its 2012-2013 Budget, tabled on March 20, 2012, the Government has confirmed the expected return to fiscal balance as of 2013-2014 and also seeks to ensure the funding of public services, continue efforts to reduce the debt for future generations and secure the economic development of Québec.
The Government expects a deficit of approximately $1,500 million and net financial requirements of $7,294 million in 2012-2013.
In 2012-2013, total revenue of the General Fund is budgeted at $69,395 million, an increase of 5.9% compared with the preliminary results for 2011-2012. Excluding Government enterprises, own-source revenue is budgeted at $48,703 million, a 6.8% increase compared with 2011-2012 due essentially to the implementation of the revenue measures provided for in the plan to restore fiscal balance. The profits of Government enterprises are budgeted at $4,895 million, an increase of 2.7%. Nearly 77% of total revenue comes from own-source revenue. Federal transfers are expected to increase by 4.1% ($15,797 million) in 2012-2013.
The Government’s expenditures are expected to total $70,879 million in Fiscal 2013, 3.0% higher than the preliminary results for Fiscal 2012. Program spending will increase by 2.0% to $62,642 million. The growth
- 30 -
in program spending is allocated mainly to the health and social services sector, the education sector and the family and seniors sector. The spending growth for other sectors will decrease by 0.9%. The Government’s program spending to GDP ratio is budgeted at 18.1% in 2012-2013. General Fund debt service is expected to increase by 10.5 % to 8,237 million. This increase can be explained by growth in the debt, by the impact of the returns of the Caisse de dépôt et placement du Québec on the income of the Retirement Plans Sinking Fund (which is applied against the interest ascribed to the retirement plans) and by lower gains on the disposal of securities of the sinking fund for government borrowings (income of this fund is applied against direct debt service). The portion of consolidated revenue allocated to debt service is budgeted to represent 11.4% in 2012-2013, a rise from 11.0% in 2011-2012.
The net results of consolidated entities are expected to total $1,195 million in Fiscal 2012, an increase of $50 million compared with the preliminary results of Fiscal 2012.
New Accounting Standard
A revised accounting standard for transfer payments has come into force on April 1, 2012 and applies to Fiscal 2013. The Minister of Finance, who is responsible for the preparation of the Government’s public accounts, and the Auditor General of Québec, who audits such accounts, have different opinions as to the interpretation of the revised standard.
The Government’s transfer payments are made mainly in respect of financial aid to municipalities (to fund infrastructure projects) and to certain universities (to fund capital expenditure projects), entities not included in the Government reporting entity, and are tailored to match periodic repayments by those entities of long-term debt incurred by them to finance such projects. In accordance with the applicable law and as set forth in the financial aid agreement entered into with each beneficiary, the payments are conditional upon annual authorizations by the Parliament through appropriation acts. Generally, the financial aid is paid to municipalities over twenty years and to universities over twenty five years.
In prior fiscal years, the Government’s practice has been to account for such financial aid as contractual obligations (disclosed in notes and appendices to the Government’s public accounts) until transfer payments in respect of such aid were authorized in a given fiscal year by appropriation acts. Such payments were then recorded as expenditures. This allowed the Government to match its spending to infrastructure use.
The Minister of Finance believes that the revised standard allows the same accounting treatment as before for such financial aid, except in the case of financial aid granted by two governmental entities, Société d’habitation du Québec (SHQ) and Société d’infrastructures locales (SOFIL), that administer infrastructure programs for the Government and whose transfer payments do not require prior appropriation authorized by the Parliament. This interpretation has been confirmed by three major firms of chartered accountants.
The Auditor General is of the opinion that the contractual obligations for financial aid in respect of a project should be recorded as expenditures, even if transfer payments in respect thereof are not yet authorized by appropriation acts, when and as admissible work is carried out or a capital expenditure is made for such project, i.e. over the period required to complete the project. Generally, the completion of a project takes up to three years.
By way of illustration, the Auditor General estimated the impact of his interpretation by applying the revised standard to the data for Fiscal 2011. He thus estimated that the accumulated deficits would have increased by at least $7.5 billion at March 31, 2011 and the expenditures and deficit in that fiscal year would have increased by $567 million.
Under either interpretation, the revised standard has no impact on the Government’s gross debt.
- 31 -
On the other hand, in the Government’s 2012-2013 Budget, the Minister of Finance made changes in accounting for the transfer payments in respect of capital expenditures by Société d’habitation du Québec (SHQ) and Société de financement des infrastructures locales (SOFIL) referred to earlier to conform to the revised standard. The debt representing accumulated deficits was therefore increased by $1.2 billion at April 1, 2012 and the impact of such changes on the expenditures and deficit was taken into account in the Government’s financial forecast.
The projections in the 2012-2013 Budget reflect the following assumptions regarding the economy of Québec for 2012.
Table 9
Economic Assumptions included in the 2012-2013 Budget for the Year 2012
(in percentage)
| | | | |
| | | Percentage
Change over
2011 | |
| |
GDP | | | | |
| |
At current market prices | | | 3.8 | |
| |
In chained 2002 dollars | | | 1.5 | |
| |
Personal income | | | 3.1 | |
| |
Business non-residential capital expenditures (2002 prices) | | | 4.6 | |
| |
International exports (2002 prices) | | | 4.6 | |
| |
Consumer expenditures (2002 prices) | | | 1.4 | |
| |
Labor force | | | 0.8 | |
| |
Employment | | | 0.5 | |
| |
| | | | Average Rate | |
| |
Unemployment rate | | | 8.0 | |
| | Note: | Economic assumptions, such as those included in the table above in this report and in all amendments to this report, are developed by Québec and are a necessary part of the budget process. Actual results may differ materially from these assumptions. | |
Source: Ministère des Finances du Québec.
- 32 -
General Fund Revenue
The following table shows own-source revenue and federal transfers by source for the General Fund.
Table 10
General Fund Revenue
Year ending March 31
| | | | | | | | | | | | | | | | | | | | | | | | |
| | | | 2009 | | | | 2010 | (1) | | | 2011 | (1) | |
| Preliminary
Results 2012 |
(1)(2)(3) | |
| Budget
Forecast 2013 |
(1)(2) | |
| % of
Total
2013 |
|
| | | | | | |
Income and property taxes | | | | | | | | | | | | | | | | | | | | | | | | |
| | | | | | |
Personal income tax(4) | | | 17,949 | | | | 17,352 | | | | 18,834 | | | | 18,897 | | | | 19,547 | | | | 28.2% | |
| | | | | | |
Contributions to the Health Services Fund | | | 5,631 | | | | 5,796 | | | | 5,974 | | | | 6,162 | | | | 6,386 | | | | 9.2% | |
| | | | | | |
Corporate taxes(4) | | | 4,176 | | | | 3,878 | | | | 3,926 | | | | 4,078 | | | | 4,324 | | | | 6.2% | |
| | | | | | |
| | | 27,756 | | | | 27,026 | | | | 28,734 | | | | 29,137 | | | | 30,257 | | | | 43.6% | |
| | | | | | |
Consumption taxes | | | | | | | | | | | | | | | | | | | | | | | | |
| | | | | | |
Retail sales | | | 10,743 | | | | 10,780 | | | | 11,785 | | | | 13,318 | | | | 15,229 | | | | 21.9% | |
| | | | | | |
Fuel(5) | | | 1,636 | | | | 16 | | | �� | (9) | | | | 33 | | | | 18 | | | | 0.0% | |
| | | | | | |
Tobacco | | | 594 | | | | 663 | | | | 764 | | | | 752 | | | | 746 | | | | 1.1% | |
| | | | | | |
Alcoholic beverages | | | 430 | | | | 433 | | | | 446 | | | | 445 | | | | 457 | | | | 0.7% | |
| | | | | | |
| | | 13,403 | | | | 11,892 | | | | 12,986 | | | | 14,548 | | | | 16,450 | | | | 23.7% | |
| | | | | | |
Duties and permits | | | | | | | | | | | | | | | | | | | | | | | | |
| | | | | | |
Motor vehicles(5) | | | 772 | | | | 40 | | | | 40 | | | | - | | | | - | | | | 0,0% | |
| | | | | | |
Natural resources | | | 8 | | | | 105 | | | | 310 | | | | 366 | | | | 357 | | | | 0.5% | |
| | | | | | |
Other | | | 202 | | | | 209 | | | | 242 | | | | 277 | | | | 287 | | | | 0.4% | |
| | | | | | |
| | | 982 | | | | 354 | | | | 592 | | | | 643 | | | | 644 | | | | 0.9% | |
| | | | | | |
Miscellaneous | | | | | | | | | | | | | | | | | | | | | | | | |
| | | | | | |
Sales of goods and services(5) | | | 443 | | | | 448 | | | | 462 | | | | 334 | | | | 340 | | | | 0.5% | |
| | | | | | |
Interest | | | 635 | | | | 387 | | | | 439 | | | | 433 | | | | 472 | | | | 0.7% | |
| | | | | | |
Fines, forfeitures and recoveries | | | 661 | | | | 619 | | | | 731 | | | | 505 | | | | 540 | | | | 0.8% | |
| | | | | | |
| | | 1,739 | | | | 1,454 | | | | 1,632 | | | | 1,272 | | | | 1,352 | | | | 1.9% | |
| | | | | | |
Revenue from government enterprises (6) | | | | | | | | | | | | | | | | | | | | | | | | |
| | | | | | |
Société des alcools du Québec | | | 808 | | | | 867 | | | | 915 | | | | 962 | | | | 990 | | | | 1.4% | |
| | | | | | |
Loto-Québec | | | 1,375 | | | | 1,252 | | | | 1,247 | | | | 1,167 | | | | 1,221 | | | | 1.8% | |
| | | | | | |
Hydro-Québec | | | 2,978 | | | | 2,943 | | | | 2,478 | | | | 2,586 | | | | 2,625 | | | | 3.8% | |
| | | | | | |
Other | | | (268) | | | | (184) | | | | 198 | | | | 49 | | | | 59 | | | | 0.1% | |
| | | | | | |
| | | | 4,893 | | | | 4,878 | | | | 4,838 | | | | 4,764 | | | | 4,895 | | | | 7.1% | |
| | | | | | |
Total own-source revenue | | | 48,773 | | | | 45,604 | | | | 48,782 | | | | 50,364 | | | | 53,598 | | | | 77.2% | |
| | | | | | |
Federal transfers | | | | | | | | | | | | | | | | | | | | | | | | |
| | | | | | |
Equalization | | | 8,028 | | | | 8,355 | | | | 8,552 | | | | 7,815 | | | | 7,391 | | | | 10.7% | |
- 33 -
Table 10 (continued)
General Fund Revenue
Year ending March 31
| | | | | | | | | | | | | | | | | | | | | | | | |
| | | | | | |
Protection payment(7) | | | | | | | | | | | | | | | 369 | | | | 362 | | | | 0.5% | |
| | | | | | |
Health transfers | | | 3,740 | | | | 4,148 | | | | 4,309 | | | | 4,511 | | | | 4,821 | | | | 6.9% | |
| | | | | | |
Transfers for post-secondary
education and other social programs | | | 1,267 | | | | 1,461 | | | | 1,455 | | | | 1,488 | | | | 1,515 | | | | 2.2% | |
| | | | | | |
Other programs | | | 988 | | | | 1,197 | | | | 1,109 | | | | 992 | | | | 975 | | | | 1.4% | |
| | | | | | |
Harmonization of the QST with the GST-Compensation | | | | | | | | | | | | | | | | | | | 733 | | | | 1.1% | |
| | | | | | |
Total federal transfers | | | 14,023 | | | | 15,161 | | | | 15,425 | | | | 15,175 | | | | 15,797 | | | | 22.8% | |
| | | | | | |
Total revenue | | | 62,796 | | | | 60,765 | | | | 64,207 | | | | 65,539 | | | | 69,395 | | | | 100.0% | |
| | (1) | Since Fiscal 2010, figures incorporate the implementation of the Land Transportation Network Fund (FORT). The creation of this fund does not affect the Government’s budgetary balance. However, it modifies the level of own-source revenue, program spending and net results of consolidated entities. | |
| | (2) | Since Fiscal 2012, figures incorporate the implementation of the Tax Administration Fund (FRAF). The creation of this fund does not affect the Government’s budgetary balance. However, it modifies the level of own-source revenue, program spending and net results of consolidated entities. | |
| | (3) | The Preliminary Results 2012 are based on financial information presented as at March 31, 2012 in the 2012-2013 Budget, which was tabled on March 20, 2012. These preliminary results are subject to change. | |
| | (4) | Beginning in Fiscal 2013, figures exclude the activities of the FRAF. | |
| | (5) | Since Fiscal 2011, figures exclude the activities of the FORT. | |
| | (6) | Includes the dividends declared and the changes in surpluses or deficits accumulated by Government enterprises, which are consolidated with a corresponding revaluation of the investment held by the Government. The declared dividends were $4,435 million, $4,287 million, $4,048 million and $4,087 million for each of Fiscal 2009 through 2012, respectively, and are expected to be $4,180 million for Fiscal 2013. | |
| | (7) | Protection payments are discretionary spending of the federal government intended to ensure that total major transfers to provinces do not decrease compared to the prior year. | |
Taxes. The Government and the federal government share the power to levy personal income taxes in Québec. The Government levies and collects its own personal income tax at rates ranging from 16% to 24% in three brackets.
In Québec, businesses are subject to a tax on profits and a tax on payroll. A tax rate of 11.9% is applied to the profits of corporations. Small and medium-size enterprises (“SME”) are taxed at a reduced rate of 8% that applies to the first $500,000 of income from an eligible business.
Québec’s corporate tax system provides incentives for scientific research and experimental development activities, like the 37.5 % tax credit calculated on wages paid by SME on such activities. Measures also exist to stimulate investment and improve productivity, like the 5% investment tax credit on manufacturing and processing equipment (the rate rises to 10 %, 20%, 30% or 40%, depending on the region).
A payroll tax is applied to finance the Health Services Fund. The tax rate is 2.7% for payrolls of $1 million or less. The rate increases proportionally from 2.7% to 4.26% for payrolls between $1 million and $5 million. For payrolls of $5 million or more, the tax rate is 4.26%.
The Québec Sales Tax (“QST”) is a multi-stage value-added tax that applies uniformly at each stage of the production and marketing of goods and services. A mechanism provides rebates of the tax paid on inputs at various stages of production in order to avoid double taxation. For large businesses, QST rebates are not allowed on energy (unless used to produce movable property), telecommunications, road vehicles, fuel and meals and entertainment. The QST rate increased from 7.5% to 8.5% on January 1, 2011 and to 9.5% on January 1, 2012. The impact of this last increase will be reduced substantially for the most disadvantaged households by a new solidarity tax credit. New home buyers will also be protected.
- 34 -
Following the Comprehensive integrated tax coordination agreement of March 28, 2012 on sales tax harmonization with the Federal government, beginning January 2013, the QST will cease to apply on the federal goods and services tax (“GST”). In order to maintain the same level of revenue for the government and avoid any additional cost on consumers, the QST rate will be set at 9.975%. Furthermore, the agreement provides that beginning in 2018, Québec will gradually allow businesses in sectors other than financial institutions to obtain a rebate of the QST on the few goods and services to which restrictions currently apply. The federal government has agreed to compensate Québec for harmonizing the QST with the GST for an amount of $2.2 billion. This financial compensation will be paid in two consecutive payments: $733 million in January 2013 and the remainder a year later.
The 2010-2011 Budget announced the introduction of a health contribution levied on individuals at the time they file their income tax return each spring. Its implementation has been gradual and the individual contribution will reach $200 in 2012. Households whose family income is below the exemption thresholds provided for under the Québec public prescription drug insurance plan (these income thresholds correspond to the income of seniors receiving the maximum guaranteed income supplement paid by the federal government) and seniors who are receiving at least 94 % of the maximum guaranteed income supplement paid by the federal government will be exempted from paying the health contribution.
On June 30, 2003, the Grand Chief of the Assembly of First Nations of Québec and Labrador filed a motion in Québec Superior Court for authorization to file a class action on behalf of all status Indians (except for James Bay Crees) who have paid Québec fuel tax since July 1, 1973 (the date on which this tax came into force) on purchases of fuel on a reserve in Québec. An out-of-court settlement in the aggregate amount of $27 million was reached on June 30, 2011 and approved by the court on December 9, 2011.
Federal Transfers. Equalization revenues amount to about half of the federal transfers. Equalization is designed to enable provincial governments to offer reasonably comparable levels of public services without having to impose unduly high taxation. In its March 2007 Budget, the federal government announced a thorough reform of the equalization program on the basis of the recommendations made by the Expert Panel on Equalization and Territorial Formula Financing. However, on November 3, 2008, the federal government announced the introduction of new caps on equalization. These caps place limits on the equalization entitlements of recipient provinces.
The federal government contributes to the financing of provincial health programs by means of the Canada Health Transfer (“CHT”) and post-secondary education and other social programs by means of the Canada Social Transfer (“CST”).
Since 2007-2008, the CST is allocated on a purely per capita basis. The prior formula, which has been replaced, took into account the value of the tax points transferred to the provinces in 1977.
The federal government has undertaken in its 2012 Budget to change the CHT to a purely per capita basis as of 2014-2015, once the health agreement signed by the First Ministers in September 2004 expires.
For Canada as a whole, the CHT is indexed by 6% per year until 2016-2017. By 2017-2018, the CHT will grow in line with nominal GDP with a 3% floor provision. The CST is indexed by 3% per year until 2023-2024.
Other federal transfers generally represent cost-sharing agreements for different provincial programs that relate to, among other things, the labour market, immigration and education.
General Fund Expenditure
The following table shows program spending and debt service by mission for the General Fund.
- 35 -
Table 11
General Fund Expenditure
Year ending March 31
(dollar amounts in millions)
| | | | | | | | | | | | | | | | | | | | | | | | |
| | | | 2009 | | | | 2010 | (1) | | | 2011 | (1) | |
| Preliminary
Results
2012 |
(1)(2)(3) | |
| Budget
Forecast
2013 |
(1)(2) | |
| % of
Total
2013 |
|
| | | | | | |
Economy and Environment: | | | | | | | | | | | | | | | | | | | | | | | | |
| | | | | | |
Transports(4) | | | 2,435 | | | | 738 | | | | 746 | | | | 767 | | | | 752 | | | | 1.1% | |
| | | | | | |
Affaires municipales et Régions | | | 1,148 | | | | 1,146 | | | | 1,172 | | | | 1,084 | | | | 1,033 | | | | 1.5% | |
| | | | | | |
Emploi et Solidarité sociale | | | 964 | | | | 955 | | | | 944 | | | | 890 | | | | 846 | | | | 1.2% | |
| | | | | | |
Développement économique, Innovation et Exportation | | | 972 | | | | 901 | | | | 793 | | | | 934 | | | | 960 | | | | 1.4% | |
| | | | | | |
Agriculture, Pêcheries et Alimentation | | | 706 | | | | 1,100 | | | | 1,057 | | | | 1,054 | | | | 1,068 | | | | 1.5% | |
| | | | | | |
Other | | | 1,074 | | | | 1,176 | | | | 1,171 | | | | 1,010 | | | | 1,010 | | | | 1.4% | |
| | | | | | |
| | | 7,299 | | | | 6,016 | | | | 5,883 | | | | 5,739 | | | | 5,669 | | | | 8.0% | |
| |
| | | | |
| | | | | | |
Education and Culture: | | | | | | | | | | | | | | | | | | | | | | | | |
| | | | | | |
Éducation, Loisir et Sport | | | 13,485 | | | | 13,808 | | | | 14,189 | | | | 14,624 | | | | 14,967 | | | | 21.1% | |
| | | | | | |
Teachers Pension Plan | | | 836 | | | | 845 | | | | 1,005 | | | | 1,009 | | | | 1,009 | | | | 1.4% | |
| | | | | | |
Culture, Communications et Condition féminine | | | 642 | | | | 653 | | | | 647 | | | | 677 | | | | 654 | | | | 0.9% | |
| | | | | | |
Other | | | 157 | | | | 166 | | | | 175 | | | | 169 | | | | 299 | | | | 0.4% | |
| | | | | | |
| | | 15,120 | | | | 15,472 | | | | 16,016 | | | | 16,479 | | | | 16,929 | | | | 23.9% | |
| |
| | | | |
| | | | | | |
Health and Social Services: | | | | | | | | | | | | | | | | | | | | | | | | |
| | | | | | |
Santé et Services sociaux (5) | | | 19,018 | | | | 20,320 | | | | 21,038 | | | | 21,289 | | | | 21,796 | | | | 30.8% | |
| | | | | | |
Régie de l’assurance maladie du Québec (6) | | | 6,603 | | | | 7,147 | | | | 7,476 | | | | 7,832 | | | | 8,325 | | | | 11.7% | |
| | | | | | |
| | | 25,621 | | | | 27,467 | | | | 28,514 | | | | 29,121 | | | | 30,121 | | | | 42.5% | |
| | | | |
| | | | | | |
Support for Individuals and Families: | | | | | | | | | | | | | | | | | | | | | | | | |
| | | | | | |
Emploi et Solidarité sociale | | | 3,287 | | | | 3,412 | | | | 3,408 | | | | 3,482 | | | | 3,432 | | | | 4.8% | |
| | | | | | |
Famille et Aînés | | | 1,960 | | | | 2,066 | | | | 2,262 | | | | 2,411 | | | | 2,451 | | | | 3.5% | |
| | | | | | |
Other | | | 243 | | | | 243 | | | | 253 | | | | 153 | | | | 150 | | | | 0.2% | |
| | | | | | |
| | | 5,490 | | | | 5,721 | | | | 5,923 | | | | 6,046 | | | | 6,033 | | | | 8.5% | |
| | | | |
| | | | | | |
Administration and Justice: | | | | | | | | | | | | | | | | | | | | | | | | |
| | | | | | |
Sécurité publique | | | 1,119 | | | | 1,157 | | | | 1,172 | | | | 1,290 | | | | 1,201 | | | | 1.7% | |
| | | | | | |
Revenu (7) | | | 1,374 | | | | 1,471 | | | | 1,557 | | | | - | | | | - | | | | 0.0% | |
| | | | | | |
Affaires municipales et Régions | | | 664 | | | | 669 | | | | 670 | | | | 684 | | | | 693 | | | | 1.0% | |
- 36 -
Table 11 (continued)
General Fund Expenditure
Year ending March 31
| | | 0000000000 | | | | 0000000000 | | | | 0000000000 | | | | 0000000000 | | | | 0000000000 | | | | 0000000000 | |
| |
| | | | | | |
Justice | | | 467 | | | | 474 | | | | 240 | | | | 602 | | | | 611 | | | | 0.9% | |
| | | | | | |
Pension and insurance plans | | | 332 | | | | 333 | | | | 404 | | | | 352 | | | | 347 | | | | 0.5% | |
| | | | | | |
Other | | | 1,064 | | | | 1,084 | | | | 1,343 | | | | 1,071 | | | | 1,413 | | | | 2.0% | |
| |
| | | | | | |
| | | 5,020 | | | | 5,188 | | | | 5,386 | | | | 3,999 | | | | 4,265 | | | | 6.0% | |
| | | | |
| | | | | | |
Anticipated lapsed appropriations | | | - | | | | - | | | | - | | | | - | | | | (375) | | | | -0.5% | |
| | | | | | |
Total program spending | | | 58,550 | | | | 59,864 | | | | 61,722 | | | | 61,384 | | | | 62,642 | | | | 88.4% | |
| |
| | | | | | |
Debt service: | | | | | | | | | | | | | | | | | | | | | | | | |
| | | | | | |
Direct debt service | | | 4,372 | | | | 3,755 | | | | 4,329 | | | | 4,695 | | | | 5,217 | | | | 7.3% | |
| | | | | | |
Interest ascribed to the retirement plans | | | 2,116 | | | | 2,371 | | | | 2,662 | | | | 2,766 | | | | 3,032 | | | | 4.3% | |
| | | | | | |
Interest ascribed to employee future benefits | | | 16 | | | | (9) | | | | (7) | | | | (9) | | | | (12) | | | | 0.0% | |
| | | | | | |
Total debt service | | | 6,504 | | | | 6,117 | | | | 6,984 | | | | 7,452 | | | | 8,237 | | | | 11.6% | |
| | | | | | |
Total expenditure | | | 65,054 | | | | 65,981 | | | | 68,706 | | | | 68,836 | | | | 70,879 | | | | 100.0% | |
| | (1) | Since Fiscal 2010, figures incorporate the implementation of the Land Transportation Network Fund (FORT). The creation of this fund does not affect the Government’s budgetary balance. However, it modifies the level of own-source revenue, program spending and net results of consolidated entities. | |
| | (2) | Since Fiscal 2012, figures incorporate the implementation of the Tax Administration Fund (FRAF). The creation of this fund does not affect the Government’s budgetary balance. However, it modifies the level of own-source revenue, program spending and net results of consolidated entities. | |
| | (3) | The Preliminary Results 2012 are based on financial information presented as at March 31, 2012 in the 2012-2013 Budget, which was tabled on March 20, 2012. These preliminary results are subject to change. | |
| | (4) | Since Fiscal 2011, the “Transports” portfolio excludes the activities of the FORT. | |
| | (5) | Includes the cost of benefits vested during the year for the retirement plans. | |
| | (6) | Québec’s health insurance plan. | |
| | (7) | Since Fiscal 2012, the “Revenu” portfolio was withdrawn to account for the establishment of the Agence du revenue du Québec, which replaces the Ministère du Revenu. This entity is compensated for its services via the FRAF. | |
Economy and Environment. Spending is budgeted to decrease by 1.2% for Fiscal 2013 compared to Fiscal 2012. This decrease is attributable mainly to a decrease of the budget for the Ministère de l’Emploi et de la Solidarité sociale, primarily due to the end of a program to enhance the qualifications of Montreal’s workforce and as a result of Québec’s achieving a positive job-related performance.
The budget of the Ministère des Affaires municipales, des Régions et de l’Occupation du territoire also decreases, due to program revisions made under the 2010-2014 Action Plan to Reduce and Control Expenditures and to lower debt service-related costs.
The budget of the Ministère du Développement économique, de l’Innovation et de l’Exportation increases, mainly due to increased appropriations allocated to the Economic Development Fund for encouraging the realization of investment projects for the introduction or expansion of businesses in Québec and for carrying out mandates from the Government to Investissement Québec.
- 37 -
Education and Culture. Spending is budgeted to increase by 2.7% for Fiscal 2013 compared to Fiscal 2012. This increase is attributable to an increase in the budget for the Ministère de l’Éducation, du Loisir et du Sport. Additional amounts will be used in particular to maintain and improve the quality of services; and to allow funding of the different growth factors in the education networks, specifically relating to wage increases, students numbers and subsidized debt. In addition, amounts will be used to act on government commitments, mainly to ensure the ongoing implementation of the measures announced in the Action Strategy on Student retention and Student Success, to implement intensive English teaching in Grade 6 and to add professional resources in secondary schools.
Health and Social Services. Spending is budgeted to increase by 3.4% for Fiscal 2013 compared to Fiscal 2012. The growth allocated to the Ministère de la Santé et des Services sociaux will be used in particular to fund the forecast salary increases in remuneration for health and social services network staff and for health professionals and the variation in employer’s contributions. Additional amounts will be used to cover the specific system costs of health related to population aging, indexation of non-salary network expenditures, revision of budget bases of institutions and an increase in the funding of certain institutions.
Support for Individuals and Families. Spending is budgeted to decrease by 0.2% for Fiscal 2013 compared to Fiscal 2012. This decrease is attributable to the decrease of the budget for the Ministère de l’Emploi et de la Solidarité sociale, mainly due to a decrease in the number of people expected to draw last-resort financial assistance, which will be partially offset by indexation of the payments.
The budget for the Ministère de la Famille et des Aînés increases, in order to fund the costs resulting from agreements negotiated with childcare providers and to fund the new childcare places needed to make 223,000 places available by the end of 2012-2013.
Administration and Justice. Spending is budgeted to increase by 6.6% for Fiscal 2013 compared to Fiscal 2012. Excluding the $312.5 million forecast for the Contingency Fund of the Conseil du trésor et de l’Administration gouvernementale, spending is budgeted to decrease by 1.2%. This decrease is attributable mainly to a decrease of the budget for the Ministère de la Sécurité publique, due in particular to payments made in 2011-2012 to flood victims in Gaspésie and Montérégie and to the extraordinary operations of the Sûreté du Québec in Aboriginal communities in 2011-2012.
Debt Service. Spending is budgeted to increase by 10.5% for Fiscal 2013 compared to Fiscal 2012. This increase can be explained by growth in the debt, by the impact of the returns of the Caisse de dépôt et placement du Québec on the income of the Retirement Plans Sinking Fund (which is applied against the interest ascribed to the retirement plans) and by lower gains on the disposal of securities of the sinking fund for government borrowings (income of this fund is applied against direct debt service).
Government Employees and Collective Unions
In its 2012-2013 Budget, the Government plans to spend $36 billion for the remuneration of its employees, including health and education workers.
The Government has signed with a vast majority of its unionized employees new collective agreements which will expire on March 31, 2015. These agreements include a 6% wage increase over five years, plus an additional adjustment of up to 1%, depending on inflation, that would apply on March 31, 2015, the last day of the collective agreements. The wage parameters are 0.5% in 2010-2011, 0.75% in 2011-2012, 1.0% in 2012-2013, 1.75% in 2013-2014 and 2.0% in 2014-2015. Additionally, this agreement is subject to an adjustment mechanism, which could increase the wages in 2012-2013, 2013-2014 and 2014-2015 by a maximum of 3.5% overall if economic growth exceeds expectations for the years 2010 to 2013.
- 38 -
A reserve of $142 million as of 2012-2013 was set aside for anticipated upward wage adjustments linked to GDP which are due to better than forecasted economic performance in 2010. This reserve will be reviewed in the light of the economic data for 2010 and 2011, to be published in fall 2012.
The suspension of performance premium payments which applies to all executives of the public service and to office staff, as well as management staff in the health and social services network and the education networks will be maintained in 2012-2013. The wage increase negotiated with unionized employees will apply to all employees in public and parapublic sectors.
The Government is maintaining a total labour cost freeze for departments and budget-funded organizations until 2013-2014. Pay increases will thus be offset by a reduction in staff numbers and by productivity gains.
Consolidated Non-Budgetary Transactions
The following table shows the distribution of the consolidated non-budgetary transactions.
Table 12
Non-Budgetary Transactions(1)(2)
Year ending March 31
(dollar amounts in millions)
| | | 0000000 | | | | 0000000 | | | | 0000000 | | | | 0000000 | | | | 0000000 | |
| | | | 2009 | | | | 2010 | | | | 2011 | | |
| Preliminary
Results 2012 | (3)
| |
| Budget
Forecast
2013 |
|
| | | | | |
Investments, loans and advances | | | | | | | | | | | | | | | | | | | | |
| | | | | |
Government enterprises | | | | | | | | | | | | | | | | | | | | |
| | | | | |
Shares and investments | | | (250) | | | | (250) | | | | 2 | | | | (402) | | | | - | |
| | | | | |
Change in the equity value of
investments(4) | | | (460) | | | | (591) | | | | (790) | | | | (677) | | | | (715) | |
| | | | | |
Loans and advances | | | (318) | | | | (197) | | | | (149) | | | | (45) | | | | (86) | |
| |
| | | | |
| | | | | |
Total Government enterprises | | | (1,028) | | | | (1,038) | | | | (937) | | | | (1,124) | | | | (801) | |
| | | | | |
Investment with the Caisse de dépôt et placement du Québec(5) | | | 804 | | | | 296 | | | | - | | | | - | | | | - | |
| | | | | |
Other | | | (742) | | | | (1,267) | | | | (2,129) | | | | (804) | | | | (237) | |
| | | | | |
Total investments, loans and advances | | | (966) | | | | (2,009) | | | | (3,066) | | | | (1,928) | | | | (1,038) | |
| | | | | |
Fixed assets | | | | | | | | | | | | | | | | | | | | |
| | | | | |
Net investments(6) | | | (3,754) | | | | (6,889) | | | | (7,801) | | | | (7,836) | | | | (8,429) | |
| | | | | |
Depreciation | | | 1,306 | | | | 2,663 | | | | 2,878 | | | | 3,034 | | | | 3,393 | |
| | | | | |
Total fixed assets | | | (2,448) | | | | (4,226) | | | | (4,923) | | | | (4,802) | | | | (5,036) | |
| | | | | |
Net investments in the networks(7) | | | | | | | | | | | | | | | | | | | | |
| | | | | |
Annual deficit | | | (31) | | | | - | | | | - | | | | - | | | | - | |
| | | | | |
Loans and advances to the networks | | | (591) | | | | - | | | | - | | | | - | | | | - | |
- 39 -
| | | 00000000 | | | | 00000000 | | | | 00000000 | | | | 00000000 | | | | 00000000 | |
Table 12 (continued) Non-Budgetary Transactions(1)(2) Year ending March 31 | | | | | | | | | | | | | | | | | | | | |
| |
| | | | | |
Total net investments in the networks | | | (622) | | | | - | | | | - | | | | - | | | | - | |
| |
| | | | | |
Retirement plans | | | | | | | | | �� | | | | | | | | | | | |
| | | | | |
Cost of vested benefits, amortizations and contributions(8) | | | 2,071 | | | | 2,122 | | | | 2,638 | | | | 2,333 | | | | 2,316 | |
| | | | | |
Interest on the actuarial obligation(9) | | | 4,383 | | | | 4,627 | | | | 4,832 | | | | 4,853 | | | | 4,977 | |
| | | | | |
Benefits, repayments and
administrative expenses(10) | | | (4,180) | | | | (4,294) | | | | (4,123) | | | | (4,498) | | | | (4,665) | |
| | | | | |
Consolidated entities | | | | | | | 157 | | | | 179 | | | | 189 | | | | - | |
| |
| | | | | |
Total retirement plans | | | 2,274 | | | | 2,612 | | | | 3,526 | | | | 2,877 | | | | 2,628 | |
| |
| | | | | |
Other accounts | | | 638 | | | | 1,354 | | | | 1,901 | | | | (989) | | | | (385) | |
| |
| | | | | |
Total non-budgetary transactions | | | (1,124) | | | | (2,269) | | | | (2,562) | | | | (4,842) | | | | (3,831) | |
| |
| | (1) | A negative entry indicates a financial requirement and a positive entry indicates a source of financing. | |
| | (2) | Since Fiscal 2010, line-by-line consolidation of transactions of the health and social services and education networks requires taking into account the change in the various balance sheet items, including capital expenditures and debts. Therefore, the Government’s net financial requirements include the network’s assets funded through organizations outside the Government’s reporting entity. | |
| | (3) | The Preliminary Results 2012 are based on financial information presented as at March 31, 2012 in the 2012-2013 Budget which was tabled on March 20, 2012. These preliminary results are subject to change. | |
| | (4) | Change in accumulated surpluses or deficits (i.e., change in net income (loss) after declared dividends to the Government). | |
| | (5) | A negative entry represents a deposit and a positive entry represents a withdrawal from the stabilization reserve fund. | |
| | (6) | Since Fiscal 2010, Net investments exclude public-private partnership (PPP) investments. Since PPP investments are made and financed by private-sector partners, they do not entail financial requirements for the Government. | |
| | (7) | Since Fiscal 2010, with line-by-line consolidation of the health and social services and education networks, the item “net investment in the networks” no longer applies because all of these entities are now part of the consolidated entities | |
| | (8) | The Government covers costs at a rate of 50% for years of service since July 1, 1982 for the RREGOP and since January 1, 2001 for RRPE (See below - “ Retirement Plans”). For most of the other plans, the Government covers the difference between the cost of each plan and the contributions paid by participants (cost-balance pension plans). For years of service accumulated as of January 1, 2000, pension benefits will be adjusted based on the higher result of the following two calculations: inflation less 3% or half the inflation rate. Previously, pension benefits for years of service accumulated between 1982 and 1999 inclusive were adjusted by the inflation rate less 3%. Benefits for years of service accumulated before 1982 were adjusted by the inflation rate. | |
| | (9) | Excludes impact of the income from the retirement plans sinking fund of $2,176 million, $2,175, $2,065 million and $2,087 million for each of Fiscal 2009 through 2012, respectively. The income for Fiscal 2013 is expected to be $1,944 million. | |
| | (10) | The retirement plans’ liability, excluding the retirement plans sinking fund estimated at $45,4 billion, is estimated at $74,1 billion for Fiscal 2012, consisting of $53,3 billion in respect of RREGOP and RRPE and $20,8 billion in respect of the other public sector plans. These liabilities are estimated in accordance with the method recommended by the Public Sector Accounting and Auditing Board of the CICA. | |
Investments, Loans and Advances. Investments, loans and advances represent capital contributions, loans or advances made to Government enterprises and agencies, municipalities, private corporations and individuals. Investments represent mainly equity transactions by the Government in its enterprises and also reflect the Government’s share in profits and losses of enterprises in which the Government holds capital stock. Loans and advances are repayable to the Government, although not all repayment schedules have been set (see “Government Enterprises and Agencies”).
Fixed Assets. The Government records fixed assets and depreciates them over their useful life. Fixed assets consist of acquisitions and dispositions and the cost of depreciation of the recorded value of these fixed assets.
Retirement Plans. Retirement plans include transactions relating to the public sector retirement plans administered by the Government. The Government and Public Employees Retirement Plan (Régime de retraite des employés du gouvernement et des organismes publics or “RREGOP”) was established by the Government in 1973 for civil servants, teachers and employees in health and social services who opted to join the plan and all those who were hired after June 30, 1973. The Pension Plan for Management Personnel (Régime de retraite du personnel d’encadrement or “RRPE”) covers management and comparable personnel since January 1, 2001. Until then, those employees had participated in the RREGOP.
- 40 -
RREGOP and RRPE cover 543,350 employees and other plans cover 18,186 employees as of December 31, 2010.
The Government accounts for its contributions (including those for current services and interest on the actuarial obligation for the plans) as a budgetary expenditure. This expenditure takes the form of provisions and is not generally a cash expenditure in the year. Accordingly, the impact of these contributions is to increase the budgetary deficit without affecting net financial requirements, since they are offset by an equal amount in non-budgetary transactions. The portion of benefits and other payments that are the responsibility of the Government are a claim on, and are payable out of, the Consolidated Revenue Fund.
In Fiscal 1994, the Government created the Retirement Plans Sinking Fund (“RPSF”) managed by the Caisse de dépôt et placement du Québec, which consists of a cash reserve that may eventually be used for paying the retirement benefits of public sector employees. In December 1999, the Government announced that it would accelerate its deposits to the RPSF to ensure that by 2020 the sums accumulated in this fund would be equal to 70% of the Government’s actuarial obligations, as shown in the Public accounts, through that date with respect to the retirement plans of public sector employees.
On December 19, 2001, several associations of executives participating in public and parapublic retirement plans filed in the Québec Superior Court a motion for a declaratory judgement on three issues, two of which were subsequently withdrawn. The remaining issue is a request for a declaration that the Government’s share of the cost in the funding of these plans creates a financial obligation for the Government as an employer, the value of which corresponds to the fund the Government would have accumulated had it paid its contributions since 1973 on the same basis used to determine the participants’ fund.
On July 15, 2004, the Québec Superior Court decided the motion, concluding that (i) the Government adequately disclosed its financial commitments in accordance with the Guidelines of the CICA regarding the share of the cost of the RREGOP, the RRPE and the Pension Plan of Peace Officers in Correctional Services (Régime de retraite des agents de la paix en services correctionnels or “RRAPSC”), and (ii) the Government has no obligation to apply the same actuarial basis as the one used to fund the participants’ pension account. The Court further concluded that, from the evidence presented, the pension patrimony of each participant did not suffer any harm from the use of another actuarial basis. On August 13, 2004, the plaintiffs filed an appeal with the Québec Court of Appeal, which was suspended pending a decision on the following motion described in the paragraph below.
On April 7, 2006, various union organizations representing participants in the RREGOP filed a motion for a declaratory judgement with the Québec Superior Court to determine that (i) the RREGOP fund is constituted of the participants’ payroll contributions and contributions by the Government, (ii) the RREGOP fund constitutes a patrimony distinct from the Government, and (iii) the Government has a commitment in regards to the sharing of the cost of the RREGOP whose value corresponds to the fund it would have constituted had it paid its contributions since 1973 on the same bases as those used to determine the participants’ funds. In July 2010, the union organizations abandoned this motion for a declaratory judgment.
In March 2012, the associations of executives abandoned the appeal filed with the Québec Court of Appeal on August 13, 2004, which put an end to the remaining lawsuit.
Other Accounts. The transactions related to other non-budgetary accounts reflect, notably, year-to-year changes in accounts payable and receivable, cash on hand and outstanding bank deposits and checks. These accounts normally fluctuate according to the overall volume of financial transactions. They may be subject to significant variations from year to year since they depend on the coordination of collection and disbursement transactions.
- 41 -
The following table shows Québec’s financial assets and liabilities
Table 13
Québec’s Financial Assets and Liabilities
Fiscal year ending March 31
(dollar amounts in millions)
| | | | | | | | |
| | | 2010 | | | 2011 | |
| | |
Financial Assets(1) | | | 49,140 | | | | 56,345 | |
| | |
Liabilities(2) | | | 200,748 | | | | 215,634 | |
| | |
Government Guaranteed Debt(3) | | | 36,385 | | | | 37,723 | |
| | (1) | Financial assets include short-term investments, accounts receivable, inventories intended for sales, investment in Government enterprises, long-term investments, the Generations Fund and deferred expenses related to debts. Short-term investments, which include Treasury bills, notes, deposit certificates, banker’s acceptances, bonds, commercial paper and other similar instruments equaled, as at March 31, 2011, $5,664 billion compared to $3,929 billion as at March 31, 2010. | |
| | (2) | Liabilities are comprised of bank overdraft, accounts payable and accrued expenses, deferred revenue, transfers from the federal government to be repaid, pension plans and other future social benefits, debt before deferred foreign exchange gain (loss) and deferred foreign exchange gain (loss). | |
| | (3) | See “Public Sector Debt – Guaranteed Debt”. | |
GOVERNMENT ENTERPRISESAND AGENCIES
Government enterprises and agencies can be divided into three categories: enterprises included in the Government’s reporting entity, agencies whose reporting entities are included in the Government’s reporting entity and agencies which conduct fiduciary transactions that are not included in the Government’s reporting entity.
Most of the enterprises included in the Government’s reporting entity are stock companies that are owned exclusively by the Government and operate on a commercial basis. The Government may guarantee the debt of some of these enterprises. Some of them pay dividends to the Government. Société des alcools du Québec and Loto-Québec transfer as dividends all of their net earnings to the Government. In the 2008-2009 Budget Speech, the Government changed the dividend payment policy so that Hydro-Québec now pays as dividends up to 75% of its net income calculated in accordance with the provisions of the Hydro-Québec Act.
Agencies whose reporting entities are included in the Government’s reporting entity are budgetary corporations whose expenditures are funded in part or in whole through funds appropriated by the National Assembly. These enterprises may benefit from loans and advances from the Government. The debt service of some of these corporations may be guaranteed in part by the Government.
Agencies that conduct fiduciary transactions play an important economic role in Québec. As an investment manager, Caisse de dépôt et placement du Québec invests funds on behalf of public retirement plans, insurance plans and other public enterprises.
The Government emphasizes the strategic role of its enterprises and agencies by initiating investment projects that are profitable and creating jobs in partnership with the private sector.
The Government manages an extensive portfolio of assets through Government enterprises. Those assets may be sold to the private sector when the timing is deemed appropriate.
- 42 -
Table 14
Major Enterprises and Agencies
| | |
| | | Area of Activity |
Enterprises included in the Government’s reporting entity | | |
| |
Hydro-Québec | | Energy production, transmission and distribution |
| |
Loto-Québec | | Gaming |
| |
Société des alcools du Québec (“SAQ”) | | Wholesale and retail sale of alcoholic beverages |
| |
Investissement Québec | | Economic development |
| |
Société Innovatech (Grand Montréal, Québec et Chaudière-Appalaches, Sud du Québec et Régions ressources) | | Venture Capital (High technology sector) |
| |
Agencies whose reporting entity is included in the Government’s reporting entity | | |
| |
Financement-Québec | | Financing public sector organizations |
| |
Société d’habitation du Québec (“SHQ”) | | Development and management of public housing |
| |
Société immobilière du Québec (“SIQ”) | | Construction, development and management of public buildings |
| |
Agencies which conduct fiduciary transactions that are not included in the Government’s reporting entity | | |
| |
Caisse de dépôt et placement du Québec (“Caisse”) | | Investment management |
| |
Commission administrative des régimes de retraite et d’assurances (“CARRA”) | | Public sector pension funds management |
| |
Régie des rentes du Québec (“RRQ”) | | Pension funds management |
The following table shows total Government investment in and guaranteed debt of certain Government enterprises as well as certain financial information as of the most recent fiscal year for which this information is publicly available.
- 43 -
Table 15
Financial Information on Certain Government Enterprises(1)
(dollar amounts in millions)
| | | | | | | | | | | | | | | | | | | | | | | | | | | | | | | | |
| | |
| Share
Capital |
| |
| Loans
and Advances |
(2) | |
| Accumulated
Surplus (Deficit |
) (3) | |
| Total
Government Investment |
(4) | |
| Debt
Guaranteed by the Government |
| | | Assets | | | | Revenue | | |
| Net
Income (Loss |
) |
| | | | | | | | | | | | | | | | | | | | | | | | | | | | | | | | |
Enterprises included
(See below - “Retirement Plans”)in the Government’s reporting entity | | | | | | | | | | | | | | | | | | | | | | | | | | | | | | | | |
Hydro-Québec
(12-31-2011) | | | 4,374 | | | | — | | | | 14,460 | | | | 18,834 | | | | 39,643 | | | | 69,637 | | | | 12,392 | | | | 2,611 | |
Loto-Québec
(03-31-2011) | | | — | | | | — | | | | 134 | | | | 134 | | | | — | | | | 1,217 | | | | 3,675 | | | | 1,338 | |
SAQ (03-26-2011) | | | 30 | | | | — | | | | 15 | | | | 45 | | | | — | | | | 641 | | | | 2,660 | | | | 915 | |
| | (1) | All financial information is as of the fiscal year-end indicated for each enterprise or for the fiscal year then ended. | |
| | (2) | Does not include loans from the Financing Fund. (The Financing Fund offers financing services only to consolidated organizations and other Government enterprises). | |
| | (3) | Includes accumulated other comprehensive income. | |
| | (4) | Total Government Investment is the sum of Share Capital, Loans and Advances and Accumulated Surplus (Deficit). (See discussion of individual enterprises below). | |
Enterprises Included in the Government’s Reporting Entity
Hydro-Québec. Hydro-Québec operates one of the major systems in Canada for the generation, transmission and distribution of electric power. Hydro-Québec supplies virtually all electric power distributed in Québec.
Under the provisions of the Hydro-Québec Act, Hydro-Québec is mandated to supply power and to pursue endeavors in energy-related research and promotion, energy conversion and conservation, and any field connected with or related to power or energy. Under the Hydro-Québec Act, the Government is entitled to declare a dividend from Hydro-Québec when certain financial criteria are met. In Fiscal 2012, the Government received a dividend of $1.958 billion from Hydro-Québec, compared with $1.886 billion in Fiscal 2011.
As of December 31, 2011, Hydro-Québec operates 60 hydroelectric plants with a combined installed capacity of 35,285 MW, 27 thermal plants totaling 1,011 MW and one nuclear plant with a capacity of 675 MW. Hydro-Québec also has access to almost all the output from the Churchill Falls generating station (which has a total capacity of 5,428 MW) under a contract with Churchill Falls (Labrador) Corporation Limited (CF(L)Co) that will remain in effect until 2041 (the “1969 Power Contract”). In 2011, Hydro-Québec purchased all the output from 12 wind farms with a total installed capacity of 919 MW and 3 small hydropower plants with a total installed capacity of 23 MW operated by independent power producers. An additional 1,215 MW is available under long-term contracts with other suppliers. Hydro-Québec maintains approximately 20,900 miles of transmission lines.
- 44 -
Table 16
Hydro-Québec’s Operations
Year ended December 31
(dollars in millions unless stated otherwise)
| | | | | | | | | | | | | | | | | | | | |
| | | 2007 | | | 2008 | | | 2009 | | | 2010 | | | 2011 | |
| | | | | |
Total revenue from electricity sales(1) | | | 11,985 | | | | 12,364 | | | | 12,055 | | | | 12,019 | | | | 12,119 | |
| | | | | |
Revenue from electricity sales outside Québec | | | 1,617 | | | | 1,919 | | | | 1,506 | | | | 1,513 | | | | 1,399 | |
| | | | | |
Capital investments affecting cash | | | 3,590 | | | | 3,954 | | | | 4,307 | | | | 4,220 | | | | 3,814 | |
| | | | | |
Net income | | | 2,798 | | | | 3,015 | | | | 2,871 | | | | 2,515 | | | | 2,611 | |
| | | | | |
Debt guaranteed by Government (at end of period) | | | 33,402 | | | | 34,881 | | | | 36,518 | | | | 36,932 | | | | 39,643 | |
| | | | | |
Total electricity sales (terawatthours) | | | 192.8 | | | | 191.7 | | | | 188.7 | | | | 192.8 | | | | 196.7 | |
| | | | | |
Interest coverage(2) | | | 2.09 | | | | 2.07 | | | | 2.11 | | | | 1.92 | | | | 1.99 | |
| | | | | |
Capitalization ratio(3) | | | 33.1% | | | | 33.4% | | | | 32.6% | | | | 32.1% | | | | 31.0% | |
| | (1) | Prior years were restated in order to conform with current accounting principles. | |
| | (2) | Sum of operating income and net investment income divided by gross interest expense. | |
| | (3) | Equity divided by the sum of equity, long-term debt (including current portion), perpetual debt, borrowings and derivative instrument liabilities, less derivative instrument assets. | |
The Act respecting the Régie de l’énergie (the “Energy Board Act”), enacted in 1996, grants the Régie de l’énergie (the “Energy Board”) exclusive authority to determine or modify Hydro-Québec’s rates and conditions under which electricity is transmitted and distributed by Hydro-Québec. Under this legislation, rates are set by reasoned decision of three commissioners after public hearings. Moreover, the Energy Board Act stipulates that rates are determined on a basis that allows for recovery of the cost of service plus a reasonable return on the rate base. The Energy Board consists of seven full-time members appointed by the Government . The Energy Board is charged with reconciling the public interest, consumer protection and the fair treatment of the electric power carriers and distributors.
Under the Energy Board Act, Hydro-Québec has been granted exclusive rights for the distribution of electric power throughout Québec, excluding the territories served by distributors operating a municipal or private electric system as of May 13, 1997. The Energy Board has the authority to: fix, or modify, after holding public hearings, Hydro-Québec’s rates and conditions for the transmission and distribution of electric power; approve its electric power supply plan; designate a reliability coordinator for Québec and adopt the standards of reliability proposed by the designated reliability coordinator; authorize its transmission and distribution investment projects; approve its distribution commercial programs and rule upon complaints from customers concerning rates or services.
Hydro-Québec’s 2009-2013 Strategic Plan sets forth three main priorities: (i) energy efficiency; (ii) renewable energies and (iii) technological innovation. More specifically, Hydro-Québec plans to: (a) promote the conservation of energy by investing in energy efficiency programs; (b) begin a new phase of large-scale hydroelectric development in order to finish carrying out Québec’s energy strategy (4,500 MW) and to implement an additional planned expansion in northern Québec (3,500 MW) under Québec’s Plan Nord; (c) continue integrating wind farm capacity resulting from Hydro-Québec’s tender calls of recent years, for a total of nearly 4,000 MW by 2016-2017; (d) rely on technological innovation to remain on the leading edge of the power industry, improve customer services and further enhance Hydro-Québec’s performance and (e) develop energy-efficiency technologies.
- 45 -
Hydro-Québec is a co-defendant with Québec and others in certain legal actions undertaken by various aboriginal communities concerning alleged infringements of their ancestral rights over their claimed traditional territories. (See “Québec – Native Peoples” above).
On February 23, 2010, CF(L)Co instituted proceedings against Hydro-Québec seeking the modification, as of November 30, 2009, of the pricing terms of the 1969 Power Contract. Alternatively, CF(L)Co is seeking the cancellation of this contract with effect six months from the date of judgment. Hydro-Québec intends to contest this claim.
Loto-Québec. Loto-Québec operates and administers lottery systems and gaming houses, including casinos, a video lottery network and bingo products. It offers lottery products in more than 8,670 points of sale. Loto-Québec currently operates four government-owned casinos located in Montréal, Charlevoix, Lac-Leamy and Mont-Tremblant. It also operates a network of video lottery terminals, limited in number to 12,000 by the Government.
On July 7, 2010, the government authorized Loto-Québec to operate an online gaming site, which it has done since December 1, 2010. Loto-Québec offers a full range of online gaming products including poker games in collaboration with the British Columbia Lottery Corporation. During fiscal year 2013, Loto-Québec plans to offer bingo games in common with the British Columbia Lottery Corporation and the Atlantic Lottery Corporation. According to the agreement among these three corporations, other Canadian lottery corporations could join them to offer these games.
Loto-Québec pays all of its net earnings to the Government as dividends, after deducting its contributions to the Fonds d’aide à l’action communautaire autonome and various government defined-purpose funds. The 2012-2013 Budget forecasts dividends of $1,167 million for Fiscal 2012 and $1,221 million for Fiscal 2013, compared with $1,247 million received in Fiscal 2011.
Société des alcools du Québec (“SAQ”). The SAQ sells alcoholic beverages and pays all of its net earnings to the Government as a dividend. As part of the 2012-2013 Budget, the SAQ is budgeted to pay dividends of $962 million in Fiscal 2012 and $990 million in Fiscal 2013 compared with $915 million in Fiscal 2011.
Investissement Québec. Investissement Québec is a public corporation whose mission is to contribute to Québec’s economic development in accordance with Government of Québec economic policy by stimulating investment and fostering employment in every region.
To that end, the Corporation supports the creation and development of businesses of all sizes through customized financial solutions and investments complementary to partner offers. Pursuant to its government mandate, the Corporation also carries out foreign investment prospecting and strategic financing operations.
To support Investissement Québec in its mandates, in 2011-2012, the Government subscribed $400 million of its share capital.
Moreover, in the budget 2012-2013, the government established a new subsidiary of Investissement Québec, Ressources Québec, which will be responsible for administering, on behalf of the Government, an endowment of more than $1 billion dedicated to acquisitions of equity interests in strategic projects related to mining and hydrocarbons sectors in Québec, notably on the Plan Nord territory. The major part of this endowment will come from the new fund Capital Mines Hydrocarbures, which will be $750 million. In 2012-2013, the Government subscribed $250 million in the share capital of Ressources Québec.
- 46 -
Sociétés Innovatech. There are four Innovatech corporations (Innovatech du Grand Montréal, Innovatech Régions ressources, Innovatech du sud du Québec and Innovatech Québec et Chaudière-Appalaches). They are venture capital corporations that fund technology innovations at the start up or technical research stage in their respective territories. On March 31, 2011, the total assets of the four Innovatech corporations amounted to $92 million.
In 2005, the Government privatized Innovatech du Grand Montréal and its investment portfolio has been sold to a subsidiary of Coller Capital. Respectively in 2005 and 2008, Innovatech Régions ressources and Innovatech du sud du Québec were converted into mixed public-private capital corporations. Innovatech Québec et Chaudière-Appalaches was recently converted into a mixed public-private capital corporation.
Agencies Which Conduct Fiduciary Transactions That Are Not Included in the Government’s Reporting Entity
Caisse de dépôt et placement du Québec (“Caisse”). The Caisse invests the funds entrusted to it by several public pension plans, insurance plans and various public bodies. As of December 31, 2011, the net assets of the Caisse (at market value) totaled $159,0 billion. The main depositors and their respective assets on deposit (at market value) were as follows: CARRA, $50,0 billion; RRQ, $34,9 billion; Retirement Plan Sinking Fund, $36,4 billion; Commission de la construction du Québec, $13,2 billion; Commission de la santé et sécurité du travail, $9,9 billion and SAAQ, $7,4 billion.
The Caisse’s overall return is the average weighted return on the funds of all its depositors. Individual returns for the seven main depositors varied from 2.8% to 8.1%, depending on their specific asset allocations. The overall return for the year ended December 31, 2011 was 4.0%. The overall average return of the Caisse over the past 4 years was -0.6%.
As stated by law, the mission of the Caisse is to receive monies on deposit as provided by law and manage them with a view to achieving optimal return within the framework of depositors’ investment policies while at the same time contributing to Québec’s economic development. The Caisse invests its depositors’ funds in various asset classes, including fixed income, equities, hedge funds, commodity financial instruments, private equity, infrastructures, real estate and real estate debt. The Caisse is permitted, subject to certain exceptions, to invest in up to 30% of the common shares of any corporation or invest up to 5% of its total assets in shares of any corporation.
As of December 31, 2011, the Caisse’s investments were distributed as follows: 30.9% in bonds, 41.3% in equity and convertible securities, 11.8% in deposits and short-term investments and 15.9% in real estate holdings and mortgages. Investments by the Caisse in bonds of the Government of Canada, of Québec’s public sector, other Canadian provinces, municipalities and other Canadian bodies totaled $41,7 billion (at market value). As at December 31, 2011, the Caisse held investments in Canadian third-party and bank-sponsored ABTNs or asset-backed term notes received in exchange for asset-backed commercial paper that has a fair market value totaling $7,9 billion.
The Caisse’s constituting statutes establish the mission and governance rules, particularly the composition and functioning of the board of directors and the criteria for selecting its members. In this regard, at least two-thirds of the members of the board of directors, including the chair, must meet the requirements of an independent director.
The Caisse’s constituting statutes provide for the creation of three committees by the board of directors — an audit committee, a governance and ethics committee and a human resources committee —and defines the role of each. It also establishes that the offices of chair of the board and president and chief
- 47 -
executive officer are to be two separate functions. It requires that the Caisse adopt an investment policy for each specialized portfolio it holds and provides rules of ethics for the Caisse, its officers and employees, and its wholly-owned subsidiaries.
Commission administrative des régimes de retraite et d’assurances (“CARRA”). CARRA administers public sector retirement plans including RREGOP and RRPE. As of December 31, 2011, assets in these plans, deposited with the Caisse, are estimated at $50,0 billion (at market value).
Régie des rentes du Québec (“RRQ”). RRQ administers the Régime de rentes du Québec (“Québec Pension Plan”, the “Plan” or “QPP”), a compulsory public insurance plan. Its purpose is to provide persons who work in Québec and their families with basic financial protection in the event of retirement, death or disability. The Plan is financed by contributions from Québec workers and employers. As of December 31, 2011, RRQ entrusted $34,9 billion of funds to the Caisse (at market value).
For a number of years, the QPP has faced increased financial pressure stemming chiefly from the aging of the population and the continuing improvement in life expectancy. Accordingly, based on the Second actuarial update published on November 2011 to the Actuarial Report of the Québec Pension Plan as at 31 December, 2009, the steady-state contribution rate, i.e., the rate needed to secure the Plan’s long-term financial stability, would be 10.81%.
To maintain the Québec Pension Plan’s reserve in the long run, the 2011-2012 Budget stipulates that the Plan contribution rate will be raised gradually from 9.9% to 10.8% over six years in increments of 0.15 percentage point per year starting January 1, 2012 and continuing until January 1, 2017.
Also, to encourage later retirement, the monthly increase in the QPP pension applied for after age 65 will rise from 0.5% to 0.7% as of January 1, 2013 and the monthly reduction in a pension applied for prior to age 65 will be raised, in proportion to the amount of the QPP pension, from 0.5% to 0.6% in the case of a maximum pension. The adjustment will be phased in over three years beginning January 1, 2014.
Accordingly, as of 2017, the Plan’s contribution rate is forecast to be equivalent to its steady-state contribution rate, which will stabilize its financial situation.
PUBLIC SECTOR DEBT
Public sector debt includes debt incurred and guaranteed by the Government and debt of public institutions under Government jurisdiction, including local administrations. Public sector debt consists of funded and unfunded debt. Unfunded debt includes indebtedness for a maturity of one year or less.
The following table shows information on the funded debt, net of sinking fund balances, of the Québec public sector which includes the funded debt of the Government (including the debt of consolidated organizations), debt guaranteed by the Government, debt of the municipal sector and debt of other institutions as of the dates indicated. In a number of these instances, notably that of Hydro-Québec, debt service is provided by operating revenues and other internally generated sources rather than from taxes. As of March 31, 2011 and March 31, 2012, funded debt of the public sector, net of sinking fund balances, was estimated to amount to $199.2 billion and $211.8 billion, respectively, of which 5.7% and 6.5% was held by the Caisse.
- 48 -
Table 17
Funded Debt of Public Sector (net of sinking fund balances)
As of March 31
(dollar amounts in millions) (1)
| | | | | | | | | | | | | | | | | | | | | | |
| | |
| Unadjusted
2008 |
(2) | |
| Unadjusted
2009 |
(2) | | | 2010 | | | | 2011 | | |
| Preliminary
Results 2012 |
(3) | | |
| | | | | | |
Government Funded Debt | | | | | | | | | | | | | | | | | | | | | | |
| | | | | | |
Borrowings – Government | | | 112,507 | | | | 124,549 | | | | 126,731 | | | | 139,158 | | | | 150,357 | | | |
| | | | | | |
Borrowings – to finance Government Enterprises | | | 25 | | | | 221 | | | | 217 | | | | 855 | | | | 1,009 | | | |
| | | | | | |
Government Guaranteed Debt(4) | | | 32,399 | | | | 36,668 | | | | 36,385 | | | | 37,723 | | | | 38,514 | | | |
| | | | | | |
Municipal Sector Debt | | | 17,321 | | | | 18,639 | | | | 19,538 | | | | 20,424 | | | | 21,004 | | | |
| | | | | | |
Other Institutions(5) | | | 1,552 | | | | 931 | | | | 1,055 | | | | 1,009 | | | | 918 | | | |
Public Sector Funded Debt(6) | | | 163,804 | | | | 181,008 | | | | 183,926 | | | | 199,169 | | | | 211,802 | | | |
| | | | | | |
Per capita ($) | | | 21,309 | | | | 23,353 | | | | 23,499 | | | | 25,192 | | | | 26,542 | | | |
| | | | | | |
As percentage of(7) | | | | | | | | | | | | | | | | | | | | | | |
| | | | | | |
GDP | | | 55.4% | | | | 59.4% | | | | 60.3% | | | | 62.4% | | | | 63.2% | | | |
| | | | | | |
Personal income | | | 65.6% | | | | 69.5% | | | | 70.2% | | | | 73.2% | | | | 75.1% | | | |
| | (1) | Canadian dollar equivalent at the dates indicated for borrowings in foreign currencies after taking into account currency swap agreements and foreign exchange forward contracts. | |
| | (2) | The figures for Fiscal 2008 and Fiscal 2009 have not been restated for the line-by-line consolidation of the results of the health and social services and education network with those of the Government. | |
| | (3) | The Preliminary Results 2012 are based on financial information presented as at March 31, 2012 in the 2012-2013 Budget, as revised. These preliminary results are subject to change. | |
| | (4) | Represents debt of Hydro-Québec. | |
| | (5) | The figures for Fiscal 2008 and Fiscal 2009 have not been restated on a line-by-line consolidated basis. Figures for Fiscal 2010 to Fiscal 2012 represent debt of the universities other than the Université du Québec and its constituents. | |
| | (6) | Includes debt covered by the Government’s commitments (see “Government’s Commitments”). | |
| | (7) | Percentages are based upon the prior calendar year’s GDP and Personal income. | |
Government Debt
Government debt consists of funded and unfunded debt. Unfunded debt includes indebtedness with a maturity of one year or less. As of March 31, 2011, unfunded debt of the Government was $17.2 billion consisting of Treasury Bills for $3.3 billion plus $13.9 billion representing the excess of short-term liabilities over short-term assets. On March 31, 2012, unfunded debt of the Government was estimated, on a preliminary basis, at $17.5 billion consisting of Treasury Bills for $3.3 billion plus $14.2 billion representing the excess of short-term liabilities over short-term assets.
- 49 -
Table 18
Government Funded Debt
As of March 31
(dollar amounts in millions)(1)
| | | | | | | | | | | | | | | | | | | | | | | | | | | | |
| | |
| Unadjusted
2008 |
(2) | |
| Unadjusted
2009 |
(2) | | | 2010 | | | | 2011 | | |
| Preliminary
Results2012 |
(3) | |
| Average
Interest
Rate
2012
(%) |
| |
| Average
Term to
Maturity
2012
(years) |
|
| | | | | | | |
Borrowings – Government | | | | | | | | | | | | | | | | | | | | | | | | | | | | |
| | | | | | | |
Payable in Canadian Dollars | | | | | | | | | | | | | | | | | | | | | | | | | | | | |
| | | | | | | |
Debentures and Other Loans | | | 100,470 | | | | 112,030 | | | | 119,528 | | | | 136,145 | | | | 147,481 | | | | 4.7 | | | | 13.4 | |
| | | | | | | |
Savings Products | | | 5,290 | | | | 5,895 | | | | 6,473 | | | | 6,744 | | | | 7,390 | | | | 3.8 | | | | - | |
| | | | | | | |
Payable in Foreign Currencies | | | | | | | | | | | | | | | | | | | | | | | | | | | | |
| | | | | | | |
United States Dollars | | | 2,081 | | | | 2,413 | | | | 837 | | | | 1,028 | | | | 1,122 | | | | 5.5 | | | | 8.7 | |
| | | | | | | |
Japanese Yen | | | 2,341 | | | | 2,350 | | | | 2,183 | | | | 379 | | | | 392 | | | | 3.4 | | | | 4.2 | |
| | | | | | | |
Swiss Francs | | | 3,518 | | | | 3,197 | | | | 2,162 | | | | 644 | | | | 218 | | | | 2.9 | | | | 4.9 | |
| | | | | | | |
Euros | | | 3,450 | | | | 3,639 | | | | 1,142 | | | | 126 | | | | 163 | | | | 4.2 | | | | 4.7 | |
| | | | | | | |
Australian Dollars | | | | | | | | | | | | | | | | | | | 1 | | | | - | | | | - | |
| | | | | | | |
Pounds Sterling | | | (2) | | | | (1) | | | | - | | | | (1) | | | | - | | | | - | | | | - | |
| | | | |
| | | | | | | |
Funded Debt | | | 117,148 | | | | 129,523 | | | | 132,325 | | | | 145,065 | | | | 156,767 | | | | | | | | | |
| | | | | | | |
Less: Sinking Funds(4) | | | 4,641 | | | | 4,974 | | | | 5,594 | | | | 5,907 | | | | 6,410 | | | | | | | | | |
Net borrowings –
Government(5) | | | 112,507 | | | | 124,549 | | | | 126,731 | | | | 139,158 | | | | 150,357 | | | | 4.5 | | | | 11.4 | |
Borrowings – to finance
Government Enterprises | | | | | | | | | | | | | | | | | | | | | | | | | | | | |
Payable in Canadian Dollars | | | | | | | | | | | | | | | | | | | | | | | | | | | | |
| | | | | | | |
Debentures and Other Loans | | | 25 | | | | 221 | | | | 217 | | | | 855 | | | | 1,009 | | | | 3.2 | | | | 5.2 | |
Borrowings – to finance
Government Enterprises | | | 25 | | | | 221 | | | | 217 | | | | 855 | | | | 1,009 | | | | 3.2 | | | | 5.2 | |
| | (1) | Canadian dollar equivalent at the dates indicated for borrowings in foreign currencies after taking into account currency swap agreements and foreign exchange forward contracts. |
| | (2) | The figures for Fiscal 2008 and Fiscal 2009 have not been restated for the line-by-line consolidation of the results of the health and social services and education network with those of the Government. |
| | (3) | The Preliminary Results 2012 are based on financial information presented as at March 31, 2012 in the 2012-2013 Budget, as revised. These preliminary results are subject to change. |
| | (4) | Consists of funds withdrawn annually from the General Fund and consolidated organizations. Foreign securities held in sinking funds are valued at the Canadian dollar equivalent at the dates indicated. |
| | (5) | Subsequent to March 31, 2012, the Government has issued or agreed to issue debentures and other funded indebtedness which total approximately $3.6 billion. The Government currently has credit agreements with various banks and financial institutions for a total of US$3.5 billion. |
The following table shows the maturities of the Government’s funded debt outstanding as of March 31, 2012, net of a sinking fund balance of $6,410 million ($5,907 million as of March 31, 2011) valued at exchange rates at that date. It also takes into account future required contributions to sinking funds for all outstanding loans and debentures. The results shown in the
- 50 -
following tables are based on financial information presented in the 2012-2013 Budget, as revised. These results are subject to change.
Table 19
Maturities of Government Funded Debt for Borrowings – Government
(dollar amounts in millions)(1)
| | | | | | | | | | | | | | | | | | | | | | | | | | | | | | | | |
Fiscal Year Payable | |
| Canadian
Dollars |
| |
| U.S.
Dollars |
| |
| Japanese
Yen |
| |
| Australian
Dollars |
| |
| Swiss
Francs |
| | | Euros | | |
| Total
2011-2012 |
| |
| Total
2010-2011 |
|
| | | | | | | | |
Year 1 | | | 9,280 | | | | 20 | | | | - | | | | - | | | | - | | | | (1 | ) | | | 9,299 | | | | 9,704 | |
| | | | | | | | |
Year 2 | | | 10,469 | | | | 20 | | | | - | | | | - | | | | - | | | | - | | | | 10,489 | | | | 8,526 | |
| | | | | | | | |
Year 3 | | | 12,897 | | | | 19 | | | | 36 | | | | - | | | | - | | | | (4 | ) | | | 12,948 | | | | 10,310 | |
| | | | | | | | |
Year 4 | | | 9,909 | | | | 16 | | | | 12 | | | | - | | | | (1 | ) | | | - | | | | 9,936 | | | | 12,872 | |
| | | | | | | | |
Year 5 | | | 13,455 | | | | 17 | | | | 102 | | | | - | | | | - | | | | (9 | ) | | | 13,565 | | | | 9,793 | |
1 – 5 years | | | 56,010 | | | | 92 | | | | 150 | | | | - | | | | (1 | ) | | | (14 | ) | | | 56,237 | | | | 51,205 | |
| | | | | | | | |
6 – 10 years | | | 44,435 | | | | 639 | | | | 48 | | | | 1 | | | | 219 | | | | (6 | ) | | | 45,336 | | | | 43,897 | |
| | | | | | | | |
11 – 15 years | | | 11,792 | | | | (636) | | | | - | | | | - | | | | - | | | | - | | | | 11,156 | | | | 8,028 | |
| | | | | | | | |
16 – 20 years | | | 3,088 | | | | (4) | | | | 194 | | | | - | | | | - | | | | 183 | | | | 3,461 | | | | 5,538 | |
| | | | | | | | |
21 – 25 years | | | 12,157 | | | | - | | | | - | | | | - | | | | - | | | | - | | | | 12,157 | | | | 7,882 | |
| | | | | | | | |
26 – 67 years | | | 22,010 | | | | - | | | | - | | | | - | | | | - | | | | - | | | | 22,010 | | | | 22,608 | |
| | | | | | | | | |
| | | | 149,492 | | | | 91 | | | | 392 | | | | 1 | | | | 218 | | | | 163 | | | | 150,357 | | | | 139,158 | |
| | (1) | Amounts denominated in foreign currencies are shown at the Canadian dollar equivalent at March 31, 2012, after taking into account currency swap agreements and foreign exchange forward contracts, including unrealized currency gains of $782 million which will be amortized over the remaining term of this debt. |
The information relating to debt retirement set out above includes amounts to be withdrawn annually from the General Fund for the creation of sinking funds for the redemption of debentures of the Government in connection with contractual obligations incurred in certain debt issues. On March 31, 2011, the amount set aside for sinking fund purposes was $137 million and, at that date, the aggregate value of sinking funds was $5,907 million, of which $4,995 million was invested in debentures issued or guaranteed by the Government. For the year ended March 31, 2012, the amount set aside for sinking fund purposes was $119 million and, at that date, the aggregate value of sinking funds was $6,410 million, of which $5,312 million was invested in debentures issued or guaranteed by the Government.
- 51 -
Table 20
Maturities of Government Funded Debt for Borrowings –
to finance Government Enterprises
(dollar amounts in millions)(1)
| | | | |
Fiscal Year Payable | | Total 2011-2012 | | Total 2010-2011 |
Year 1 | | — | | — |
Year 2 | | 2 | | — |
Year 3 | | 100 | | 4 |
Year 4 | | 520 | | 100 |
Year 5 | | 58 | | 531 |
1 – 5 years | | 680 | | 635 |
6 – 10 years | | 329 | | 220 |
11 – 15 years | | — | | — |
16 – 20 years | | — | | — |
21 – 25 years | | — | | — |
26 – 30 years | | — | | — |
| | | 1,009 | | 855 |
| | (1) | As of March 31, 2012, all Government Funded Debt for Borrowings to finance Government Enterprise debts were either denominated in Canadian dollars or were fully swapped in Canadian dollars. | |
Guaranteed Debt
The following table summarizes funded debt guaranteed by the Government (net of sinking fund balances).
Table 21
Guaranteed Funded Debt (net of sinking fund balances)
As of March 31
(dollar amounts in millions)(1)
| | | | | | | | | | | | | | | | | | | | | | | | | | | | |
| | | | 2008 | | | | 2009 | | | | 2010 | | | | 2011 | | |
| Preliminary
Results
2012 |
(2) | |
| Average
Interest Rate
2012
(%) |
| |
| Average
Term to
Maturity
2012
(years) |
|
Hydro-Québec | | | 32,399 | | | | 36,668 | | | | 36,385 | | | | 37,723 | | | | 38,514 | | | | 5.7 | | | | 19.4 | |
| | | | 32,399 | | | | 36,668 | | | | 36,385 | | | | 37,723 | | | | 38,514 | | | | | | | | | |
| | (1) | Canadian dollar equivalent at dates indicated for borrowings in foreign currencies issues after taking into account currency exchange agreements and foreign exchange forward contracts. | |
| | (2) | The Preliminary Results 2012 are based on financial information presented as at March 31, 2012 in the 2012-2013 Budget, as revised. These preliminary results are subject to change. | |
As of March 31, 2012, unfunded debt guaranteed by the Government, on a preliminary basis, amounted to $4,421 million, including $3,307 million borrowed from financial institutions under a student loan program and $1,114 million of short-term debt of Hydro-Québec.
- 52 -
Funded Debt of the Municipal Sector and Other Institutions
The funded debt of the Québec public sector also includes indebtedness of public institutions under the Government’s jurisdiction. These institutions include the municipal sector (municipal corporations, urban communities and transportation commissions), educational institutions (school corporations, universities and colleges), health and social services establishments and other Government enterprises (Government agencies, boards and commissions).
The following table shows information on the funded debt of these institutions, net of debt held or guaranteed by the Government, as of the dates indicated.
Table 22
Funded Debt of the Municipal Sector and Other Institutions
As of March 31
(dollar amounts in millions)(1)
| | | | | | | | | | | | | | | | | | | | |
| | |
| Unadjusted
2008 |
(2) | |
| Unadjusted
2009 |
(2) | | | 2010 | | | | 2011 | | |
| Preliminary
Results
2012 |
(3) |
Municipal Sector | | | 17,321 | | | | 18,639 | | | | 19,538 | | | | 20,424 | | | | 21,004 | |
Educational Institutions(4) | | | 1,411 | | | | 877 | | | | 1,055 | | | | 1,009 | | | | 918 | |
Health and Social Services Establishments | | | 141 | | | | 54 | | | | | | | | | | | | | |
| | | | 18,873 | | | | 19,570 | | | | 20,593 | | | | 21,433 | | | | 21,922 | |
| | (1) | Canadian dollar equivalent at the dates indicated for loans in foreign currencies after taking into account currency exchange agreements and foreign exchange forward contracts. The amounts shown do not include loans from borrowings made by the Government on behalf of these entities. | |
| | (2) | The figures for Fiscal 2008 and Fiscal 2009 have not been restated for the line-by-line consolidation of the results of the health and social services and education network with those of the Government. | |
| | (3) | The Preliminary Results 2012 are based on financial information presented as at March 31, 2012 in the 2012-2013, as revised. These preliminary results are subject to change. | |
| | (4) | Figures for Fiscal 2010 to Fiscal 2012 represent debt of the universities other than the Université du Québec and its constituents. | |
The funded debt of these institutions consists mainly of the funded debt of the municipal sector which benefits from a large degree of autonomy since approximately 87% of the total revenue is derived from local sources. The relative magnitude of capital investment and borrowing by local governments in Québec is attributable, to a large extent, to the responsibilities assumed by Québec municipal corporations with respect to major projects related to the development of new residential and industrial areas. Approximately one-third of the debt of municipal corporations and urban communities has been incurred for these projects which in several other parts of Canada are financed directly by the private sector. The Ministère des Affaires municipales et des Régions et de l’Occupation du territoire supervises and controls the borrowings of all Québec municipal corporations and urban communities.
In 2010 (the most recent year for which information is available), local sector expenditure including school corporations totalled $28.3 billion, representing 28.7% of consolidated expenditure of the Québec public sector. The net accumulated surplus from current operations of Québec municipal corporations, including reserves, increased from $1,755.8 million in 2009 to $1,875.1 million in 2010. Net long-term debt of the municipal sector supported by local taxpayers increased from $16.6 billion as of December 31, 2009 to $18.4 billion as of December 31, 2010. This debt, as a percentage of real estate valuation, has remained stable at 2.7% in 2010.
- 53 -
Government’s Commitments
The following table shows information on the Government’s commitments for the repayment of the principal on borrowings made for capital expenditures by the educational institutions as well as by the municipal sector. The amounts for Fiscal 2012 are not yet publicly available.
Table 23
Government’s Commitments(1)
As of March 31
(dollar amounts in millions)(2)
| | | 000000000 | | | | 000000000 | | | | 000000000 | | | | 000000000 | |
| | | | 2008 | | | | 2009 | | | | 2010 | | | | 2011 | |
Educational Institutions | | | 1,987 | | | | 2,206 | | | | 2,297 | | | | 2,446 | |
| | | | |
Municipal Sector | | | 2,726 | | | | 2,846 | | | | 3,084 | | | | 3,509 | |
| | | | |
Others Beneficiaries | | | 1,323 | | | | 1,455 | | | | 1,566 | | | | 1,559 | |
| | | | 6,036 | | | | 6,507 | | | | 6,947 | | | | 7,514 | |
| | (1) | Including commitments to repay loans from borrowings made by the Government on behalf of these entities. | |
The debt covered by these commitments is included in the Funded Debt of Public Sector (see “Funded Debt of Public Sector”).
| | (2) | Canadian dollar equivalent at the dates indicated for loans in foreign currencies after taking into account currency swap agreements and foreign exchange forward contracts. | |
- 54 -
WHERE YOU CAN FIND MORE INFORMATION
This document appears as an exhibit to the annual report of Québec on Form 18-K for the fiscal year ended March 31, 2012 filed with the U.S. Securities and Exchange Commission (the “Commission”) on EDGAR through the Commission Internet web site at http://www.sec.gov. Additional information with respect to Québec is available in the annual report or in other exhibits or amendments to the annual report. You may read and copy any document Québec files with the Commission at the Commission’s public reference room at 100 F Street, N.E., Room 1580, Washington, D.C., 20549. Please call the Commission’s toll free number at 1-800-SEC-0330 if you need further information about the operation of the Commission’s public reference room. In addition, you may request a copy of these filings at no cost from Ministère des Finances du Québec, Direction du financement des organismes publics et documentation financière, 12, rue Saint-Louis, Québec, Québec, G1R 5L3, Canada. This document is also available on the Ministère des Finances du Québec Internet web site at http://www.finances.gouv.qc.ca. This web site is an inactive textual reference only and any information available on this web site shall not be deemed to form a part of this document or the annual report to which it appears as an exhibit.
- 55 -
FORWARD-LOOKING STATEMENTS
Various statements made throughout this document are forward looking and contain information about financial results. The words “forecast”, “preliminary estimate”, “preliminary results” and similar expressions identify forward-looking statements. You are cautioned that any such forward-looking statements are not guarantees of future performance. Forward-looking statements involve risks and uncertainties, and actual results may differ materially from those in the forward-looking statements as a result of various factors. You are cautioned not to place undue reliance on these forward-looking statements which speak only as of the date of this document. We undertake no obligation to publicly release the result of any revisions to these forward-looking statements which may be made to reflect events or circumstances after the date hereof or to reflect the occurrence of unanticipated events.
- 56 -
SUPPLEMENTARY INFORMATION
The following tables indicate present or future characteristics of the funded debt of Borrowings-Government outstanding as of March 31, 2012. Previous characteristics are not indicated.
Table 24
Borrowings-Government outstanding as of March 31, 2012
| | | | | | | | | | | | | | | | | | | | | | |
Maturity
Date | | Issue
Date(1) | | | Interest Payment
Date(s) | | | Coupon (%) | | Canadian Dollars | | | CUSIP Number
or ISIN Code | | References |
| | | | | Nominal Value | | | Book Value | | | |
| |
|
A) Payable in Canadian Dollars |
| | | | | | | |
| 2012-06-04 | | | 1987-06-04 | | | | 06-04 & 12-04 | | | 10.50 | | | 200,000,000 | | | | 199,975,170 | | | CA748148LQ48 | | |
| | | | | | | |
| 2012-10-01 | | | 2002-04-08 | | | | 04-01 & 10-01 | | | 6.00 | | | 2,341,500,000 | | | | 2,347,971,506 | | | CA748148BG75 | | |
| | | | | | | |
| 2012-10-09 | | | 1987-10-09 | | | | 04-09 & 10-09 | | | 11.875 | | | 100,000,000 | | | | 99,995,855 | | | CA748148MJ95 | | |
| | | | | | | |
| 2013-10-01 | | | 2003-07-21 | | | | 04-01 & 10-01 | | | 5.25 | | | 2,152,000,000 | | | | 2,157,597,300 | | | CA748148RK14 | | |
| | | | | | | |
| 2013-12-01 | | | 2003-01-15 | | | | 06-01 & 12-01 | | | 3.30 | | | 837,576,842 | | | | 837,990,248 | | | CA748148RH84 | | Real Return Bonds. Yields linked to the CPI for Canada. |
| | | | | | | |
| 2014-06-01 | | | 1989-06-01 | | | | 06-01 & 12-01 | | | 10.50 | | | 125,000,000 | | | | 124,869,349 | | | CA748148KJ14 | | SFP (1):1990-06-01 |
| | | | | | | |
| 2014-12-01 | | | 2004-08-03 | | | | 06-01 & 12-01 | | | 5.50 | | | 2,500,000,000 | | | | 2,529,260,415 | | | CA748148RN52 | | |
| | | | | | | |
| 2015-07-27 | | | 1990-07-27 | | | | 01-27 & 07-27 | | | 11.00 | | | 50,000,000 | | | | 49,886,282 | | | CA748148KN26 | | SFP (1):1991-07-27 |
| | | | | | | |
| 2015-12-01 | | | 2005-06-03 | | | | 06-01 & 12-01 | | | 5.00 | | | 2,500,000,000 | | | | 2,539,930,325 | | | CA748148RP01 | | |
| | | | | | | |
| 2021-12-01 | | | 2001-02-13 | | | | 06-01 & 12-01 | | | 4.50 | | | 744,993,345 | | | | 830,464,573 | | | CA748148QY2 | | Real Return Bonds. Yields linked to the CPI for Canada. |
| | | | | | | |
| 2023-01-16 | | | 1993-03-04 | | | | 01-16 & 07-16 | | | 9.375 | | | 2,202,200,000 | | | | 2,257,327,813 | | | CA748148NX70 | | SFP (1):1994-01-16 |
| | | | | | | |
| 2023-03-30 | | | 1992-12-29 | | | | 03-30 & 09-30 | | | 9.50 | | | 375,000,000 | | | | 373,447,659 | | | CA748148PA59 | | |
| | | | | | | |
| 2026-04-01 | | | 1996-07-19 | | | | 04-01 & 10-01 | | | 8.50 | | | 2,176,100,000 | | | | 2,348,523,732 | | | CA748148PZ01 | | SFP (1):1997-04-01 |
| | | | | | | |
| 2026-12-01 | | | 1998-02-27 | | | | 06-01 & 12-01 | | | 4.50 | | | 1,157,581,308 | | | | 1,200,718,116 | | | CA748148QG11 | | Real Return Bonds. Yields linked to the CPI for Canada. |
| | | | | | | |
| 2029-10-01 | | | 1998-05-01 | | | | 04-01 & 10-01 | | | 6.00 | | | 2,737,300,000 | | | | 2,683,184,429 | | | CA748148QJ59 | | SFP (1):1999-10-01 |
| | | | | | | |
| 2031-12-01 | | | 2001-02-13 | | | | 06-01 & 12-01 | | | 4.25 | | | 1,193,248,218 | | | | 1,431,376,367 | | | CA748148QZ9 | | Real Return Bonds. Yields linked to the CPI for Canada. |
| | | | | | | |
| 2031-12-01 | | | 2002-11-13 | | | | 06-01 & 12-01 | | | 3.441 | | | 50,829,425 | | | | 50,828,810 | | | CA748148RF29 | | Real Return Bonds. Yields linked to the CPI for Canada. |
| | | | | | | |
| 2032-06-01 | | | 2000-06-27 | | | | 06-01 & 12-01 | | | 6.25 | | | 4,200,200,000 | | | | 4,147,920,074 | | | CA748148QT3 | | |
| | | | | | | |
| 2036-12-01 | | | 2003-07-28 | | | | 06-01 & 12-01 | | | 5.75 | | | 4,082,900,000 | | | | 4,213,137,926 | | | CA748148RL9 | | |
- 57 -
| | | | | | | | | | | | | | | | | | |
Maturity Date | | Issue
Date(1) | | Interest Payment
Date(s) | | Coupon (%) | | Canadian Dollars | | | CUSIP Number
or ISIN Code | | References |
| | | | | Nominal Value | | | Book Value | | | |
| |
|
Medium-Term Notes |
| | | | | | | |
| 2013-02-04 | | 2005-02-04 | | 02-04 | | 4.375 | | | 400,000,000 | | | | 399,691,909 | | | XS0211709844 | | |
| | | | | | | |
| 2013-12-10 | | 2006-12-21 | | 03-10 & 06-10 &
09-10 & 12-10 | | Floating | | | 1,282,000,000 | | | | 1,282,109,293 | | | CA74814ZDQ33 | | CAD-BA (3 months) - 0.01% |
| | | | | | | |
| 2014-05-10 | | 2004-05-10 | | 02-10 & 05-10 &
08-10 & 11-10 | | Floating | | | 250,000,000 | | | | 250,000,000 | | | XS0192344280 | | CAD-BA (3 months) + 0.085% |
| | | | | | | |
| 2014-06-03 | | 2004-07-26 | | 06-03 | | 5.125 | | | 250,000,000 | | | | 249,190,983 | | | XS0197261935 | | |
| | | | | | | |
| 2014-06-30 | | 2004-12-06 | | 12-30 & 03-30 &
06-30 & 09-30 | | Floating | | | 249,999,998 | | | | 249,999,998 | | | XS0207384487 | | CAD-BA (3 months) + 0.12% |
| | | | | | | |
| 2014-07-16 | | 1995-09-05 | | 01-16 & 07-16 | | 9.05 | | | 10,000,000 | | | | 9,997,036 | | | CA74814ZAY93 | | |
| | | | | | | |
| 2015-05-18 | | 2005-05-18 | | 05-18 | | 4.65 | | | 100,000,000 | | | | 99,920,190 | | | XS0219854659 | | |
| | | | | | | |
| 2015-06-30 | | 1995-04-03 | | 06-30 & 12-30 | | 9.65 | | | 4,664,000 | | | | 4,674,459 | | | CA74814ZAP86 | | |
| | | | | | | |
| 2016-06-30 | | 1995-04-03 | | 06-30 & 12-30 | | 9.65 | | | 7,739,000 | | | | 7,760,998 | | | CA74814ZAQ69 | | |
| | | | | | | |
| 2016-10-11 | | 2006-10-11 | | 10-11 & 01-11 &
04-11 & 07-11 | | Floating | | | 200,000,000 | | | | 200,000,000 | | | XS0270863060 | | CAD-BA (3 months) + 0.03% |
| | | | | | | |
| 2016-12-01 | | 2006-01-30 | | 06-01 & 12-01 | | 4.50 | | | 3,000,000,000 | | | | 2,978,498,595 | | | CA74814ZDH34 | | |
| | | | | | | |
| 2017-05-14 | | 2006-12-14 | | 02-14 & 05-14 &
08-14 & 11-14 | | Floating | | | 200,000,000 | | | | 200,000,000 | | | XS0279291172 | | CAD-BA (3 months) + 0.07% |
| | | | | | | |
| 2017-06-30 | | 1995-04-03 | | 06-30 & 12-30 | | 9.65 | | | 7,744,000 | | | | 7,770,333 | | | CA74814ZAR43 | | |
| | | | | | | |
| 2017-12-01 | | 2007-01-29 | | 06-01 & 12-01 | | 4.50 | | | 4,000,000,000 | | | | 3,951,374,587 | | | CA74814ZDR16 | | |
| | | | | | | |
| 2018-12-01 | | 2008-01-22 | | 06-01 & 12-01 | | 4.50 | | | 4,000,000,000 | | | | 3,980,835,011 | | | CA74814ZDU45 | | |
| | | | | | | |
| 2019-12-01 | | 2009-05-08 | | 06-01 & 12-01 | | 4.50 | | | 5,000,000,000 | | | | 5,058,730,942 | | | CA74814ZEE93 | | |
| | | | | | | |
| 2020-12-01 | | 2004-12-07 | | 06-01 & 12-01 | | 5.00 | | | 100,000,000 | | | | 98,977,208 | | | CA74814ZDC47 | | |
| | | | | | | |
| 2020-12-01 | | 2010-04-09 | | 06-01 & 12-01 | | 4.50 | | | 5,900,000,000 | | | | 6,162,479,581 | | | CA74814ZEG42 | | |
| | | | | | | |
| 2021-12-01 | | 2011-02-08 | | 06-01 & 12-01 | | 4.25 | | | 6,000,000,000 | | | | 6,233,838,916 | | | CA74814ZEH25 | | |
| | | | | | | |
| 2022-12-01 | | 2011-12-02 | | 06-01 & 12-01 | | 3.50 | | | 3,000,000,000 | | | | 3,084,621,820 | | | CA74814ZEL37 | | |
| | | | | | | |
| 2023-03-30 | | 1995-08-09 | | 03-30 & 09-30 | | 9.50 | | | 194,500,000 | | | | 196,491,729 | | | CA74814ZAX11 | | |
| | | | | | | |
| 2025-06-01 | | 2004-12-08 | | 06-01 & 12-01 | | 5.35 | | | 652,000,000 | | | | 671,287,376 | | | CA74814ZDE03 | | |
| | | | | | | |
| 2026-04-01 | | 1996-12-27 | | 04-01 & 10-01 | | 8.50 | | | 100,000,000 | | | | 104,875,202 | | | CA74814ZBH51 | | SFP (1): 1997-04-01 |
- 58 -
| | | | | | | | | | | | | | | | | | | | | | |
Maturity Date | | Issue
Date(1) | | | Interest Payment
Date(s) | | | Coupon (%) | | Canadian Dollars | | | CUSIP Number
or ISIN Code | | References |
| | | | | Nominal Value | | | Book Value | | | |
|
| | | | | | | |
| 2026-04-01 | | | 1999-01-12 | | | | 04-01 & 10-01 | | | 8.50 | | | 90,000,000 | | | | 106,739,958 | | | CA74814ZCA99 | | |
| | | | | | | |
| 2026-04-01 | | | 2003-07-22 | | | | 04-01 & 10-01 | | | 5.50 | | | 74,332,000 | | | | 73,729,854 | | | CA74814ZCX9 | | |
| | | | | | | |
| 2026-04-01 | | | 2002-06-25 | | | | 04-01 & 10-01 | | | 7.50 | | | 165,850,000 | | | | 165,850,000 | | | CA74814ZDS98 | | |
| | | | | | | |
| 2026-04-01 | | | 2003-09-16 | | | | 04-01 & 10-01 | | | 6.40 | | | 90,000,000 | | | | 90,000,000 | | | CA74814ZCY75 | | |
| | | | | | | |
| 2028-01-01 | | | 2008-06-20 | | |
| 04-01 & 07-01 &
10-01 & 01-01 |
| | 1.797 | | | 508,725,415 | | | | 508,725,415 | | | CA74814ZDV28 | | Real return medium-term notes. Yields linked to the CPI for Canada |
| | | | | | | |
| 2028-04-01 | | | 1999-02-19 | | | | 04-01 & 10-01 | | | 6.10 | | | 5,000,000 | | | | 5,000,000 | | | CA74814ZCD3 | | |
| | | | | | | |
| 2035-04-01 | | | 1995-01-31 | | | | 04-01 | | | - | | | 150,000,000 | | | | 81,704,850 | | | CA74814ZAH60 | | Others (1) |
| | | | | | | |
| 2035-04-01 | | | 1995-04-11 | | | | 04-01 & 10-01 | | | - | | | 150,000,000 | | | | 65,689,387 | | | CA74814ZAS26 | | From 1999-04-01 to 2006-10-01: $2,000,000 each Interest Payment Date |
| | | | | | | |
| 2035-04-01 | | | 1995-04-13 | | | | 04-01 & 10-01 | | | - | | | 100,000,000 | | | | 43,985,456 | | | CA74814ZAT09 | | Others (2) |
| | | | | | | |
| 2035-04-01 | | | 1997-12-15 | | | | 04-01 & 10-01 | | | 6.50 | | | 300,000,000 | | | | 296,948,275 | | | CA74814ZBP7 | | |
| | | | | | | |
| 2035-04-01 | | | 1999-02-02 | | | | - | | | - | | | 456,000,000 | | | | 172,900,642 | | | CA74814ZCB72 | | Zero-coupon Note |
| | | | | | | |
| 2036-12-01 | | | 2008-11-04 | | | | 06-01 & 12-01 | | | 3.25 | | | 762,356,119 | | | | 835,979,418 | | | CA74814ZDW01 | | Real return medium-term notes. Yields linked to the CPI for Canada |
| | | | | | | |
| 2038-12-01 | | | 2006-08-29 | | | | 06-01 & 12-01 | | | 5.00 | | | 5,000,000,000 | | | | 5,059,800,626 | | | CA74814ZDK62 | | |
| | | | | | | |
| 2039-10-01 | | | 1999-02-05 | | | | - | | | - | | | 525,000,000 | | | | 171,991,924 | | | CA74814ZCC5 | | Zero-coupon note |
| | | | | | | |
| 2040-04-01 | | | 2000-05-25 | | | | 04-01 & 10-01 | | | 6.43 | | | 463,000,000 | | | | 478,484,405 | | | CA74814ZCJ0 | | Others (3) |
| | | | | | | |
| 2041-12-01 | | | 2009-09-22 | | | | 06-01 & 12-01 | | | 5.00 | | | 8,000,000,000 | | | | 8,454,561,404 | | | CA74814ZEF68 | | |
| | | | | | | |
| 2043-07-08 | | | 2003-07-08 | | | | 01-08 & 07-08 | | | 5.60 | | | 80,000,000 | | | | 80,319,719 | | | CA74814ZCW1 | | |
| | | | | | | |
| 2043-12-01 | | | 2011-08-17 | | | | 06-01 & 12-01 | | | 4.25 | | | 3,000,000,000 | | | | 3,205,799,494 | | | CA74814ZEK53 | | |
| | | | | | | |
| 2049-09-21 | | | 2008-12-01 | | | | 09-21 & 03-21 | | | 5.10 | | | 13,440,000 | | | | 13,531,801 | | | CA74814ZDX83 | | |
| | | | | | | |
| 2051-09-21 | | | 2006-11-23 | | | | 09-21 & 03-21 | | | 5.00 | | | 420,000,000 | | | | 449,677,561 | | | CA74814ZDN02 | | |
| | | | | | | |
| 2053-09-21 | | | 2008-12-01 | | | | 09-21 & 03-21 | | | 5.10 | | | 37,192,000 | | | | 38,230,627 | | | CA74814ZDY66 | | |
| | | | | | | |
| 2056-12-01 | | | 2006-04-07 | | | | 06-01 & 12-01 | | | Various | | | 1,500,000,000 | | | | 1,488,694,244 | | | CA74814ZDJ99 | | Others (4) |
| | | | | | | |
| 2057-09-21 | | | 2008-12-01 | | | | 09-21 & 03-21 | | | 5.10 | | | 9,857,000 | | | | 9,841,478 | | | CA74814ZDZ32 | | |
| | | | | | | |
| 2058-09-21 | | | 2008-12-01 | | | | 09-21 & 03-21 | | | 5.10 | | | 38,326,000 | | | | 40,538,231 | | | CA74814ZEA71 | | |
| | | | | | | |
| 2059-09-21 | | | 2008-12-01 | | | | 09-21 & 03-21 | | | 5.10 | | | 6,294,000 | | | | 6,296,764 | | | CA74814ZEB54 | | |
- 59 -
| | | | | | | | | | | | | | | | | | |
Maturity Date | | Issue
Date(1) | | Interest Payment
Date(s) | | Coupon (%) | | Canadian Dollars | | | CUSIP Number
or ISIN Code | | References |
| | | | | Nominal Value | | | Book Value | | | |
|
| | | | | | | |
| 2061-09-21 | | 2009-02-11 | | 09-21 & 03-21 | | 5.00 | | | 25,000,000 | | | | 25,143,204 | | | CA74814ZEC38 | | |
| | | | | | | |
| 2062-09-21 | | 2006-11-23 | | 09-21 & 03-21 | | 6.70 | | | 150,000,000 | | | | 209,413,585 | | | CA74814ZDP59 | | |
| | | | | | | |
| 2065-06-01 | | 2009-03-02 | | 06-01 & 12-01 | | Various | | | 385,000,000 | | | | 369,179,685 | | | CA74814ZED11 | | Others (5) |
| | | | | | | |
| 2065-09-21 | | 2006-09-21 | | 09-21 & 03-21 | | 6.35 | | | 940,000,000 | | | | 1,216,697,998 | | | CA74814ZDM29 | | |
| | | | | | | |
| 2076-12-01 | | 2007-06-29 | | 06-01 & 12-01 | | Various | | | 500,000,000 | | | | 489,864,405 | | | CA74814ZDT71 | | Others (6) |
| | | | |
Savings Products | | | | | | | | | | | | |
| | |
Savings Bonds | | | | | |
| | | | | | | |
| 2012-2022 | | | | 06-01 | | 1.50 - 1.75 | | | 404,533,049 | | | | 404,533,049 | | | | | Put (1) |
| | |
Other Savings Products | | | | | |
| | | | | | | |
| 2012-2022 | | | | Various | | Various | | | 6,985,347,454 | | | | 6,985,347,454 | | | | | |
| | | | |
Receiver General of Canada | | | | | | | | | | | | |
| | | | | | | |
| 2012-2038 | | 1992-2011 | | 02-01 & 08-01 | | 4.32 - 9.45 | | | 95,747,049 | | | | 95,747,049 | | | | | Put (2) |
| | | | |
Assumed Debt | | | | | | | | | | | | |
| | | | | | | |
| 2013-2017 | | 1963-1967 | | | | 5.125 - 5.75 | | | 6,928,777 | | | | 6,928,777 | | | | | Payable in semi-annual installments, including principal and interest |
| | | | |
Immigrant Investor Program | | | | | | | | | | | | |
| | | | | | | |
| 2012-2017 | | 2007-2012 | | - | | 1.77 - 4.94 | | | 3,827,200,000 | | | | 3,559,289,004 | | | | | |
| | | | |
Société immobilière du Québec | | | | | | | | | | | | |
| | | | | | | |
| 2013-03-28 | | 1988-03-28 | | 03-28 & 09-28 | | 10.10 | | | 59,427,570 | | | | 59,427,570 | | | | | |
| | | | | | | |
| 2014-06-16 | | 1989-06-16 | | 06-16 & 12-16 | | 10.50 | | | 150,000,000 | | | | 150,000,000 | | | | | |
| | |
Société québécoise d’assainissement des eaux | | | | | |
| | | | | | | |
| 2014-07-31 | | 1989-07-31 | | 01-31 & 07-31 | | 10.20 | | | 50,000,000 | | | | 50,000,000 | | | | | |
- 60 -
| | | | | | | | | | | | | | | | | | | | |
Maturity
Date | |
| Issue
Date(1) |
| | Interest Payment
Date(s) | | Coupon (%) | | | Canadian Dollars | | | CUSIP Number
or ISIN Code | | References |
| | | | | | Nominal Value | | | | Book Value | | | |
|
| |
Société d’habitation du Québec | | Others (7) |
| | | | | | | |
| 2012-12-01 | | | 2011-12-01 | | | 1st of each month | | 1.640 | | | 88,172 | | | | 66,263 | | | | | |
| | | | | | | |
| 2013-01-01 | | | 2012-01-01 | | | 1st of each month | | 1.490 | | | 1,147,958 | | | | 957,772 | | | | | |
| | | | | | | |
| 2013-05-13 | | | 1993-05-13 | | | 05-13 & 11-13 | | 8.950 | | | 199,931,661 | | | | 138,621,000 | | | | | |
| | | | | | | |
| 2013-11-01 | | | 2008-11-01 | | | 1st of each month | | 3.010 | | | 111,950,281 | | | | 75,170,901 | | | | | |
| | | | | | | |
| 2013-12-01 | | | 2011-12-01 | | | 1st of each month | | 1.640 | | | 1,077,835 | | | | 945,008 | | | | | |
| | | | | | | |
| 2014-01-01 | | | 2012-01-01 | | | 1st of each month | | 1.490 | | | 4,058,382 | | | | 3,724,612 | | | | | |
| | | | | | | |
| 2014-02-01 | | | 2009-01-19 | | | 1st of each month | | 1.820 | | | 26,304,395 | | | | 20,258,470 | | | | | |
| | | | | | | |
| 2014-04-01 | | | 1999-04-01 | | | 04-01 | | 5.944 | | | 1,535,744 | | | | 423,309 | | | | | |
| | | | | | | |
| 2014-05-04 | | | 2009-05-04 | | | 1st of each month | | 1.990 | | | 54,886,026 | | | | 42,032,621 | | | | | |
| | | | | | | |
| 2014-12-01 | | | 2011-12-01 | | | 1st of each month | | 1.640 | | | 9,852,218 | | | | 9,049,361 | | | | | |
| | | | | | | |
| 2015-01-01 | | | 2012-01-01 | | | 1st of each month | | 1.490 | | | 1,624,093 | | | | 1,535,687 | | | | | |
| | | | | | | |
| 2015-03-01 | | | 2010-03-01 | | | 1st of each month | | 2.510 | | | 54,817,941 | | | | 42,533,323 | | | | | |
| | | | | | | |
| 2015-04-01 | | | 2005-04-01 | | | 1st of each month | | 4.810 | | | 257,972,087 | | | | 195,157,340 | | | | | |
| | | | | | | |
| 2015-12-01 | | | 2011-12-01 | | | 1st of each month | | 1.640 | | | 12,104,369 | | | | 11,370,597 | | | | | |
| | | | | | | |
| 2016-06-01 | | | 2011-05-01 | | | 1st of each month | | 2.750 | | | 59,996,659 | | | | 53,898,270 | | | | | |
| | | | | | | |
| 2016-06-01 | | | 2011-05-01 | | | 1st of each month | | 2.590 | | | 300,850 | | | | 240,717 | | | | | |
| | | | | | | |
| 2016-06-01 | | | 2011-05-01 | | | 1st of each month | | 4.280 | | | 497,205 | | | | 411,201 | | | | | |
| | | | | | | |
| 2016-12-01 | | | 2011-12-01 | | | 1st of each month | | 1.640 | | | 40,784,646 | | | | 40,241,260 | | | | | |
| | | | | | | |
| 2017-01-01 | | | 2012-01-01 | | | 1st of each month | | 1.490 | | | 114,802,955 | | | | 113,393,690 | | | | | |
| | | | | | | |
| 2017-02-01 | | | 2007-02-01 | | | 1st of each month | | 4.480 | | | 64,558,765 | | | | 49,363,685 | | | | | |
| | | | | | | |
| 2017-04-01 | | | 2012-03-01 | | | 1st of each month | | 1.670 | | | 38,660,983 | | | | 38,660,983 | | | | | |
| | | | | | | |
| 2019-07-01 | | | 1999-07-01 | | | 07-01 | | 6.875 | | | 391,579 | | | | 220,654 | | | | | |
| | | | | | | |
| 2020-06-01 | | | 2010-06-01 | | | 1st of each month | | 3.430 | | | 56,624,229 | | | | 52,335,857 | | | | | |
| | | | | | | |
| 2020-07-01 | | | 1999-07-01 | | | 07-01 | | Various | | | 6,492,063 | | | | 3,905,093 | | | | | |
| | | | | | | |
| 2020-07-01 | | | 2010-07-01 | | | 07-01 | | 6.875 | | | 10,204,090 | | | | 8,128,246 | | | | | |
| | | | | | | |
| 2020-10-01 | | | 2010-10-01 | | | 1st of each month | | 3.130 | | | 94,942,095 | | | | 85,829,278 | | | | | |
| | | | | | | |
| 2021-07-01 | | | 1999-07-01 | | | 07-01 | | Various | | | 30,860,513 | | | | 19,995,041 | | | | | |
- 61 -
| | | | | | | | | | | | | | | | | | | | |
Maturity Date | | Issue
Date(1) | | | Interest Payment
Date(s) | | Coupon (%) | | Canadian Dollars | | | CUSIP Number
or ISIN Code | | References |
| | | | | Nominal Value | | | Nominal Value | | | |
|
| | | | | | | |
| 2021-07-01 | | | 2005-07-01 | | | 07-01 | | 6.875 | | | 18,937,434 | | | | 14,078,050 | | | | | |
| | | | | | | |
| 2021-07-01 | | | 2006-07-01 | | | 07-01 | | 7.875 | | | 4,869,822 | | | | 3,819,456 | | | | | |
| | | | | | | |
| 2022-07-01 | | | 1999-07-01 | | | 01-01 & 07-01 | | 7.875 | | | 715,719 | | | | 478,649 | | | | | |
| | | | | | | |
| 2022-07-01 | | | 1999-07-01 | | | 07-01 | | Various | | | 36,627,982 | | | | 27,671,386 | | | | | |
| | | | | | | |
| 2022-07-01 | | | 2007-07-01 | | | 07-01 | | 6.875 | | | 5,637,667 | | | | 4,641,147 | | | | | |
| | | | | | | |
| 2023-07-01 | | | 1973-07-01 | | | 07-01 | | 7.625 | | | 466,925 | | | | 283,427 | | | | | |
| | | | | | | |
| 2023-07-01 | | | 1998-07-01 | | | 07-01 | | 7.750 | | | 367,558 | | | | 258,612 | | | | | |
| | | | | | | |
| 2023-07-01 | | | 1999-07-01 | | | 07-01 | | Various | | | 42,661,703 | | | | 28,278,700 | | | | | |
| | | | | | | |
| 2023-07-01 | | | 2009-07-01 | | | 07-01 | | 7.250 | | | 2,474,465 | | | | 2,252,986 | | | | | |
| | | | | | | |
| 2023-12-01 | | | 1984-12-01 | | | 1st of each month | | 7.875 | | | 698,907 | | | | 438,456 | | | | | |
| | | | | | | |
| 2024-07-01 | | | 1974-07-01 | | | 07-01 | | 8.000 | | | 1,382,326 | | | | 901,587 | | | | | |
| | | | | | | |
| 2024-07-01 | | | 1975-07-01 | | | 07-01 | | 7.875 | | | 638,433 | | | | 413,932 | | | | | |
| | | | | | | |
| 2024-07-01 | | | 1999-07-01 | | | 07-01 | | Various | | | 75,367,578 | | | | 54,052,970 | | | | | |
| | | | | | | |
| 2024-07-01 | | | 2002-07-01 | | | 07-01 | | 7.875 | | | 4,787,256 | | | | 3,711,960 | | | | | |
| | | | | | | |
| 2024-07-01 | | | 2008-07-01 | | | 07-01 | | 7.750 | | | 805,552 | | | | 718,670 | | | | | |
| | | | | | | |
| 2025-07-01 | | | 1975-07-01 | | | 07-01 | | 7.875 | | | 6,034,832 | | | | 4,073,851 | | | | | |
| | | | | | | |
| 2025-07-01 | | | 1976-07-01 | | | 07-01 | | 7.875 | | | 153,278 | | | | 103,650 | | | | | |
| | | | | | | |
| 2025-07-01 | | | 1999-07-01 | | | 01-01 & 07-01 | | 7.875 | | | 1,185,435 | | | | 886,583 | | | | | |
| | | | | | | |
| 2025-07-01 | | | 1999-07-01 | | | 07-01 | | Various | | | 44,857,660 | | | | 34,167,235 | | | | | |
| | | | | | | |
| 2026-04-01 | | | 1999-04-01 | | | 04-01 | | 5.944 | | | 53,464,692 | | | | 39,350,723 | | | | | |
| | | | | | | |
| 2026-07-01 | | | 1999-07-01 | | | 07-01 | | Various | | | 35,431,394 | | | | 27,795,204 | | | | | |
| | | | | | | |
| 2027-04-01 | | | 1999-04-01 | | | 04-01 | | 5.944 | | | 11,531,559 | | | | 8,702,245 | | | | | |
| | | | | | | |
| 2027-07-01 | | | 1999-07-01 | | | 07-01 | | 8.000 | | | 1,349,826 | | | | 1,085,796 | | | | | |
| | | | | | | |
| 2028-04-01 | | | 1999-04-01 | | | 04-01 | | 5.944 | | | 77,583,667 | | | | 59,873,617 | | | | | |
| | | | | | | |
| 2028-07-01 | | | 1999-07-01 | | | 07-01 | | Various | | | 7,283,852 | | | | 5,946,053 | | | | | |
| | | | | | | |
| 2029-01-01 | | | 1981-01-01 | | | 01-01 & 07-01 | | Various | | | 1,674,410 | | | | 1,392,135 | | | | | |
| | | | | | | |
| 2029-04-01 | | | 1999-04-01 | | | 04-01 | | 5.944 | | | 100,148,082 | | | | 78,858,996 | | | | | |
| | | | | | | |
| 2029-07-01 | | | 1981-07-01 | | | 01-01 & 07-01 | | 11.000 | | | 2,213,100 | | | | 1,884,387 | | | | | |
- 62 -
| | | | | | | | | | | | | | | | | | |
Maturity Date | | Issue
Date(1) | | Interest Payment
Date(s) | | Coupon (%) | | Canadian Dollars | | | CUSIP Number or | | References |
| | | | | Nominal Value | | | Book Value | | | ISIN Code | |
|
| | | | | | | |
| 2029-07-01 | | 1999-07-01 | | 07-01 | | Various | | | 12,255,097 | | | | 10,264,887 | | | | | |
| 2030-01-01 | | 2000-01-01 | | 01-01 | | Various | | | 9,836,195 | | | | 8,184,557 | | | | | |
| 2030-04-01 | | 1999-04-01 | | 04-01 | | 5.944 | | | 76,170,974 | | | | 61,079,054 | | | | | |
| 2030-07-01 | | 1981-07-01 | | 01-01 & 07-01 | | 11.000 | | | 1,671,870 | | | | 1,448,893 | | | | | |
| 2030-07-01 | | 1999-07-01 | | 07-01 | | 7.875 | | | 2,124,532 | | | | 1,798,959 | | | | | |
| 2031-04-01 | | 1999-04-01 | | 04-01 | | 5.944 | | | 14,075,637 | | | | 11,474,222 | | | | | |
| 2032-04-01 | | 1999-04-01 | | 04-01 | | 5.944 | | | 318,317 | | | | 263,400 | | | | | |
| 2032-07-01 | | 1999-07-01 | | 07-01 | | 8.000 | | | 2,601,373 | | | | 2,271,031 | | | | | |
| | | | |
Other Consolidated Organizations | | | | | | | | | | | | |
| Various | | Various | | Various | | | | | 1,332,840,272 | | | | 1,332,840,272 | | | | | |
| |
Financement-Québec | | Others (8) |
| 2012-04-25 | | 2006-06-09 | | 01-25, 04-25,
07-25 & 10-25 | | Floating | | | 820,000,000 | | | | 819,999,311 | | | 31739ZAF23 | | |
| 2012-11-01 | | 2004-09-02 | | 11-01 | | 5.00 | | | 200,000,000 | | | | 199,939,437 | | | XS0200124120 | | |
| 2013-09-16 | | 2007-02-16 | | 03-16, 06-16,
09-16 & 12-16 | | Floating | | | 1,556,000,000 | | | | 1,557,150,628 | | | 31739ZAH88 | | |
| 2013-09-23 | | 2008-10-06 | | 03-23 & 09-23 | | 4.09 | | | 600,000,000 | | | | 600,001,790 | | | 31739ZAL90 | | |
| 2014-03-01 | | 2006-01-23 | | 03-01 & 09-01 | | 4.25 | | | 1,500,000,000 | �� | | | 1,496,600,770 | | | 31739ZAC91 | | |
| 2014-06-01 | | 2009-02-17 | | 06-01 & 12-01 | | 3.25 | | | 1,500,000,000 | | | | 1,503,642,151 | | | 31739ZAM73 | | |
| 2014-06-09 | | 2007-02-09 | | 03-09, 06-09,
09-09 & 12-09 | | Floating | | | 200,000,000 | | | | 200,000,000 | | | XS0286907547 | | |
| 2014-12-01 | | 2007-12-03 | | 03-01,06-01,
09-01 & 12-01 | | Floating | | | 1,542,000,000 | | | | 1,519,275,293 | | | 31739ZAJ45 | | |
| 2015-03-10 | | 2005-03-10 | | 06-10, 09-10,
12-10 & 03-10 | | Floating | | | 200,000,000 | | | | 200,000,000 | | | XS0214474636 | | |
| 2015-10-14 | | 2005-10-14 | | 01-14, 04-14,
07-14 & 10-14 | | Floating | | | 200,000,000 | | | | 200,000,000 | | | XS0232639715 | | |
| 2015-12-01 | | 2000-09-01 | | 06-01 & 12-01 | | 6.25 | | | 309,400,000 | | | | 308,673,008 | | | 317385AD4 | | |
| 2015-12-01 | | 2008-05-26 | | 06-01 & 12-01 | | 4.25 | | | 1,300,000,000 | | | | 1,315,685,463 | | | 31739ZAK18 | | |
- 63 -
| | | | | | | | | | | | | | | | | | | | |
Maturity
Date | |
| Issue
Date(1) |
| | Interest Payment
Date(s) | | Coupon (%) | | | Canadian Dollars | | | CUSIP Number
or ISIN Code | | References |
| | | | | | Nominal Value | | | | Book Value | | | |
|
| | | | | | | |
| 2016-06-02 | | | 2010-03-02 | | | 03-02, 06-02,
09-02 & 12-02 | | Floating | | | 1,534,000,000 | | | | 1,527,987,479 | | | 31739ZAP05 | | |
| 2016-12-01 | | | 2010-02-23 | | | 06-01 & 12-01 | | 3.50 | | | 1,500,000,000 | | | | 1,502,588,041 | | | 31739ZAN56 | | |
| 2017-04-25 | | | 2011-07-25 | | | 01-25, 04-25,
07-25 & 10-25 | | Floating | | | 1,370,000,000 | | | | 1,361,642,832 | | | 317392ZAR60 | | |
| 2017-12-01 | | | 2011-01-21 | | | 06-01 & 12-01 | | 3.50 | | | 1,600,000,000 | | | | 1,626,120,761 | | | 31739ZAQ87 | | |
| 2018-12-01 | | | 2012-01-24 | | | 06-01 & 12-01 | | 2.40 | | | 1,000,000,000 | | | | 998,946,494 | | | 31739ZAS44 | | |
| 2020-07-01 | | | 2010-07-01 | | | 07-01 | | 3.46 | | | 132,883,809 | | | | 121,535,655 | | | | | Others (9) |
| 2020-10-01 | | | 2010-10-01 | | | 10-01 | | 2.87 | | | 1,237,230 | | | | 1,128,658 | | | | | Others (9) |
| 2020-11-01 | | | 2010-11-01 | | | 11-01 | | 2.77 | | | 7,771,505 | | | | 7,086,380 | | | | | Others (9) |
| 2021-03-01 | | | 2011-03-01 | | | 03-01 | | 3.54 | | | 8,468,601 | | | | 7,748,060 | | | | | Others (9) |
| 2021-03-29 | | | 2011-03-29 | | | 03-29 | | 3.23 | | | 122,531,060 | | | | 111,955,322 | | | | | Others (9) |
| 2025-07-01 | | | 2010-07-01 | | | 07-01 | | 3.83 | | | 3,465,730 | | | | 3,290,450 | | | | | Others (9) |
| 2025-08-01 | | | 2010-08-01 | | | 08-01 | | 3.59 | | | 980,300 | | | | 929,832 | | | | | Others (9) |
| 2025-10-01 | | | 2010-10-01 | | | 10-01 | | 3.35 | | | 1,063,800 | | | | 1,008,055 | | | | | Others (9) |
| 2025-11-01 | | | 2010-11-01 | | | 11-01 | | 3.28 | | | 218,431,000 | | | | 206,925,760 | | | | | Others (9) |
| 2025-12-01 | | | 2010-12-01 | | | 12-01 | | 3.59 | | | 36,000,000 | | | | 34,146,658 | | | | | Others (9) |
| 2026-03-01 | | | 2011-03-01 | | | 03-01 | | 3.92 | | | 110,500,163 | | | | 104,948,778 | | | | | Others (9) |
| 2026-03-29 | | | 2011-03-29 | | | 03-29 | | 3.65 | | | 5,981,834 | | | | 5,675,242 | | | | | Others (9) |
| 2030-07-01 | | | 2010-07-01 | | | 07-01 | | 4.04 | | | 279,650,462 | | | | 270,298,220 | | | | | Others (9) |
| 2030-11-01 | | | 2010-11-01 | | | 11-01 | | 3.50 | | | 21,360,569 | | | | 20,605,236 | | | | | Others (9) |
| 2031-02-01 | | | 2011-02-01 | | | 02-01 | | 3.95 | | | 42,858,800 | | | | 41,412,044 | | | | | Others (9) |
| 2031-03-01 | | | 2011-03-01 | | | 03-01 | | 4.12 | | | 21,464,580 | | | | 20,752,692 | | | | | Others (9) |
| 2031-03-29 | | | 2011-03-29 | | | 03-29 | | 3.89 | | | 193,460,374 | | | | 186,889,140 | | | | | Others (9) |
| 2034-06-01 | | | 2006-07-26 | | | 06-01 & 12-01 | | 5.25 | | | 1,522,350,000 | | | | 1,558,748,510 | | | 31739ZAG06 | | |
| | | | | | | | | | | 123,069,205,563 | | | | 123,961,679,555 | | | | | |
Adjustments relating to swap agreements | | | 31,919,533,997 | | | | 31,919,533,997 | | | | | |
Total-Payable in Canadian Dollars | | | 154,988,739,560 | | | | 155,881,213,552 | | | | | |
- 64 -
| | | | | | | | | | | | | | | | | | | | | | |
Maturity Date | | Issue
Date(1) | | Interest Payment
Date(s) | | Coupon (%) | | Foreign Currency Units | | | Equivalent in
Canadian
Dollars | | | CUSIP Number or
ISIN Code | | References |
| | | | | Nominal Value | | | Book Value | | | | |
|
|
B) Payable in foreign currency |
|
Payable in United States Dollars |
| | | | | | | | |
| 2014-05-05 | | 2004-05-05 | | 05-05 & 11-05 | | 4.875 | | | 1,000,000,000 | | | | 998,324,637 | | | | 997,426,144 | | | US748148RM77 | | |
| | | | | | | | |
| 2015-05-26 | | 2005-05-26 | | 05-26 & 11-26 | | 4.60 | | | 1,000,000,000 | | | | 999,717,146 | | | | 998,817,400 | | | US748148RQ8 | | |
| | | | | | | | |
| 2016-03-01 | | 2006-03-01 | | 03-01 & 09-01 | | 5.00 | | | 1,250,000,000 | | | | 1,246,302,521 | | | | 1,245,180,849 | | | US748148RR64 | | |
| | | | | | | | |
| 2016-04-01 | | 1986-04-01 | | 04-01 | | 9.00 | | | 250,000,000 | | | | 249,817,358 | | | | 249,592,522 | | | LU002143534 | | |
| | | | | | | | |
| 2016-11-14 | | 2006-11-14 | | 05-14 & 11-14 | | 5.125 | | | 1,500,000,000 | | | | 1,497,164,438 | | | | 1,495,816,990 | | | US748148RS4 | | |
| | | | | | | | |
| 2018-05-14 | | 2008-05-14 | | 05-14 & 11-14 | | 4.625 | | | 1,000,000,000 | | | | 996,284,794 | | | | 995,388,137 | | | US748148RT21 | | |
| | | | | | | | |
| 2020-07-29 | | 2010-07-29 | | 01-29 & 07-29 | | 3.50 | | | 1,500,000,000 | | | | 1,495,074,887 | | | | 1,493,729,320 | | | US748148RU93 | | |
| | | | | | | | |
| 2021-08-25 | | 2011-08-25 | | 02-25 & 08-25 | | 2.75 | | | 1,400,000,000 | | | | 1,394,862,257 | | | | 1,393,606,881 | | | US748149AF82 | | |
| | | | | | | | |
| 2023-07-15 | | 1993-07-15 | | 01-15 & 07-15 | | 7.50 | | | 1,000,000,000 | | | | 998,801,573 | | | | 997,902,652 | | | US748148PB31 | | SFP (1):1994-07-15 |
| | | | | | | | |
| 2024-02-09 | | 1994-02-09 | | 02-09 & 08-09 | | 7.125 | | | 1,000,000,000 | | | | 997,917,047 | | | | 997,018,923 | | | US748148PD96 | | SFP (1):2004-02-09 |
| | | | | | | | |
| 2026-12-01 | | 1986-12-01 | | 06-01 & 12-01 | | 8.625 | | | 300,000,000 | | | | 299,548,466 | | | | 299,278,872 | | | US748148KA05 | | SFP (2):1987-12-01 then SFP (1): 1997-12-01 |
| | | | | | | | |
| 2029-09-15 | | 1999-09-24 | | 03-15 & 09-15 | | 7.50 | | | 1,500,000,000 | | | | 1,495,998,384 | | | | 1,494,651,986 | | | US748148QR73 | | Global Issue |
| | | | | | | |
Medium-Term Notes | | | | | | | | | | | | | | | | | | | | |
| | | | | | | | |
| 2013-02-07 | | 2003-02-07 | | 02-07 & 08-07 | | Floating | | | 50,000,000 | | | | 50,000,000 | | | | 49,955,000 | | | - | | USD-LIBOR-LIBO (6 months) + 0.20% |
| | | | | | | | |
| 2016-08-31 | | 2006-08-31 | | 08-31 & last day of
February | | 5.30 | | | 100,000,000 | | | | 99,883,050 | | | | 99,793,155 | | | CA74814ZDL46 | | |
| | | | | | | | |
| 2018-08-07 | | 1998-08-07 | | 02-07 & 08-07 | | 6.54 | | | 250,000,000 | | | | 250,000,000 | | | | 249,775,000 | | | XS0089070485 | | |
| | | | | | | | |
| 2019-06-01 | | 2006-01-30 | | 06-01 & 12-01 | | 4.937 | | | 5,000,000 | | | | 5,000,000 | | | | 4,995,500 | | | CA74814ZDF77 | | |
| | | | | | | | |
| 2020-12-01 | | 2006-01-30 | | 06-01 & 12-01 | | 4.962 | | | 5,000,000 | | | | 5,000,000 | | | | 4,995,500 | | | CA74814ZDG50 | | |
| | | | | | | | |
| 2026-01-30 | | 1996-01-30 | | 01-30 & 07-30 | | 6.35 | | | 149,875,000 | | | | 149,856,731 | | | | 145,721,860 | | | US74815HBZ47 | | Put (3): January 30, 2016 & 2021 |
| | | | | | | | |
| 2026-02-27 | | 1996-02-29 | | 02-27 & 08-27 | | 7.14 | | | 99,770,000 | | | | 99,770,000 | | | | 99,680,207 | | | US74815HCB69 | | Put (3): 2016-02-27 |
| | | | | | | | |
| 2026-03-02 | | 1996-02-29 | | 03-02 & 09-02 | | 7.485 | | | 150,000,000 | | | | 150,000,000 | | | | 149,865,000 | | | US74815HCA86 | | |
| | | | | | | | |
| 2026-03-06 | | 1996-03-06 | | 03-06 & 09-06 | | 7.365 | | | 99,850,000 | | | | 99,850,000 | | | | 99,760,135 | | | US74815HCC43 | | |
| | | | | | | | |
| 2026-03-10 | | 1996-03-08 | | 03-10 & 09-10 | | 7.035 | | | 50,000,000 | | | | 50,000,000 | | | | 49,955,000 | | | US74815HCD26 | | |
| | | | | | | | |
| 2026-04-09 | | 1996-04-09 | | 04-09 & 10-09 | | 7.38 | | | 100,000,000 | | | | 100,000,000 | | | | 99,910,000 | | | US74815HCE09 | | |
- 65 -
| | | | | | | | | | | | | | | | | | | | | | | | | | |
Maturity Date | | Issue
Date(1) | | | Interest Payment
Date(s) | | | Coupon (%) | | Foreign Currency Units | | | Equivalent in
Canadian Dollars | | | CUSIP Number or ISIN Code | | References |
| | | | | Nominal Value | | | Book Value | | | | |
|
| | | | | | | | |
| 2026-04-15 | | | 1996-04-11 | | | | 04-15 & 10-15 | | | 7.50 | | | 50,000,000 | | | | 50,000,000 | | | | 49,955,000 | | | US74815HCG56 | | Put (3): 2016-04-15 & 2021-04-15 |
| | | | | | | | |
| 2026-04-15 | | | 1996-04-11 | | | | 04-15 & 10-15 | | | 7.50 | | | 50,000,000 | | | | 50,000,000 | | | | 49,955,000 | | | US74815HCF73 | | |
| | | | | | | | |
| 2026-07-22 | | | 1996-07-22 | | | | 01-22 & 07-22 | | | 7.295 | | | 99,965,000 | | | | 99,965,000 | | | | 99,875,032 | | | US74815HCJ95 | | Put (4): 2006-07-22 |
| | | | | | | | |
| 2035-11-17 | | | 2005-11-17 | | | | 05-07 & 11-17 | | | 5.40 | | | 75,000,000 | | | | 74,816,118 | | | | 74,748,783 | | | US74815HCP5 | | |
| | | | | | | | |
| 2036-07-22 | | | 1996-07-22 | | | | 01-22 & 07-22 | | | 7.97 | | | 160,000,000 | | | | 160,000,000 | | | | 159,856,000 | | | US74815HCH30 | | Put (3): 2016-07-22 |
| | | | | | | |
Financement-Québec | | | | | | | | | | | | | | | | | | | | | | | |
| | | | | | | | |
| 2012-10-25 | | | 2002-10-25 | | | | 04-25 & 10-25 | | | 5.00 | | | 500,000,000 | | | | 499,781,352 | | | | 782,000,000 | | | US317385AF97 | | |
| | | | | | | | | | | | | 14,694,460,000 | | | | 14,663,735,759 | | | | 14,933,206,848 | | | | | |
| | | | | |
Adjustments relating to swap agreements | | | (13,541,869,196) | | | | (13,541,221,066) | | | | (13,811,702,418) | | | | | |
| | | | | |
Total-Payable in United States Dollars | | | U.S.$ 1,152,590,804 | | | | U.S.$ 1,122,514,693 | | | | 1,121,504,430 | | | | | |
- 66 -
| | | | | | | | | | | | | | | | | | | | | | | | |
Maturity Date | | Issue
Date(1) | | | Interest Payment
Date(s) | | Coupon (%) | | Foreign Currency Units | | | Equivalent in
Canadian
Dollars | | | CUSIP Number or
ISIN Code | | References |
| | | | | Nominal Value | | | Book Value | | | | |
|
|
Payable in Japanese Yen |
| | | | | | | | |
| 2013-05-09 | | | 2001-05-09 | | | 05-09 & 11-09 | | 1.60 | | | 50,000,000,000 | | | | 49,960,216,596 | | | | 605,517,777 | | | XS0129013305 | | |
| | | | | | | | |
| 2017-02-15 | | | 2007-02-15 | | | 02-15 & 08-15 | | 1.92 | | | 5,000,000,000 | | | | 5,000,000,000 | | | | 60,599,995 | | | - | | |
| | | | | | | |
Medium-Term Notes | | | | | | | | | | | | | | | | | | | | | |
| | | | | | | | |
| 2012-09-25 | | | 1997-09-25 | | | 03-25 & at Maturity | | 3.00 | | | 11,000,000,000 | | | | 10,999,745,988 | | | | 133,316,911 | | | XS0080441396 | | |
| | | | | | | | |
| 2012-09-29 | | | 1997-09-29 | | | 03-29 & at Maturity | | 3.00 | | | 10,000,000,000 | | | | 10,000,000,000 | | | | 121,199,990 | | | XS0082098143 | | |
| | | | | | | | |
| 2014-07-07 | | | 1994-07-07 | | | 01-07 & 07-07 | | 5.50 | | | 30,000,000,000 | | | | 29,996,216,175 | | | | 363,554,111 | | | XS0051759412 | | |
| | | | | | | | |
| 2015-02-02 | | | 1995-02-02 | | | 02-02 | | 5.60 | | | 6,000,000,000 | | | | 6,000,000,000 | | | | 72,719,994 | | | XS0055430374 | | |
| | | | | | | | |
| 2016-02-15 | | | 1996-02-15 | | | 02-15 | | 4.23 | | | 1,000,000,000 | | | | 999,229,412 | | | | 12,110,660 | | | XS0063440035 | | |
| | | | | | | | |
| 2016-06-27 | | | 1996-07-10 | | | 06-27 & 12-27 | | 4.305 | | | 8,000,000,000 | | | | 8,000,000,000 | | | | 96,959,992 | | | XS0067851310 | | |
| | | | | | | | |
| 2016-07-11 | | | 1996-07-11 | | | 01-11 & 07-11 | | 4.50 | | | 5,000,000,000 | | | | 5,016,754,114 | | | | 60,803,055 | | | XS0067208974 | | |
| | | | | | | | |
| 2016-09-26 | | | 1996-09-26 | | | 03-26 & at Maturity | | 4.125 | | | 5,000,000,000 | | | | 5,000,000,000 | | | | 60,599,995 | | | XS0069585320 | | |
| | | | | | | | |
| 2016-10-24 | | | 1996-10-24 | | | 10-24 | | 4.00 | | | 500,000,000 | | | | 499,400,697 | | | | 6,052,736 | | | XS0070580047 | | |
| | | | | | | | |
| 2016-10-28 | | | 1996-10-28 | | | 03-22 & at Maturity | | 4.00 | | | 5,000,000,000 | | | | 4,994,715,213 | | | | 60,535,944 | | | XS0070775647 | | |
| | | | | | | | |
| 2016-11-07 | | | 1996-11-07 | | | 05-07 & 11-05 | | 3.95 | | | 9,600,000,000 | | | | 9,594,904,595 | | | | 116,290,234 | | | XS0070684252 | | |
| | | | | | | | |
| 2016-11-14 | | | 1996-11-14 | | | 11-14 | | 3.80 | | | 20,000,000,000 | | | | 19,924,064,349 | | | | 241,479,641 | | | XS0070920243 | | |
| | | | | | | | |
| 2016-11-21 | | | 1996-11-21 | | | 11-21 | | 4.00 | | | 1,000,000,000 | | | | 1,000,000,000 | | | | 12,119,999 | | | XS0071482599 | | |
| | | | | | | | |
| 2016-11-29 | | | 1996-11-29 | | | 11-29 | | 3.75 | | | 1,000,000,000 | | | | 1,000,000,000 | | | | 12,119,999 | | | XS0071205248 | | |
| | | | | | | | |
| 2016-12-16 | | | 1996-11-22 | | | 12-16 | | 3.96 | | | 1,000,000,000 | | | | 1,000,000,000 | | | | 12,119,999 | | | XS0071476864 | | |
| | | | | | | | |
| 2016-12-19 | | | 1996-12-18 | | | 12-19 | | 3.76 | | | 3,000,000,000 | | | | 3,000,000,000 | | | | 36,359,997 | | | XS0071934755 | | |
| | | | | | | | |
| 2016-12-19 | | | 1996-12-18 | | | 12-19 | | 3.82 | | | 5,000,000,000 | | | | 5,000,000,000 | | | | 60,599,995 | | | XS0071823925 | | |
| | | | | | | | |
| 2016-12-19 | | | 1996-12-19 | | | 12-19 | | 3.80 | | | 5,000,000,000 | | | | 5,000,000,000 | | | | 60,599,995 | | | XS0072031106 | | |
| | | | | | | | |
| 2016-12-19 | | | 1996-12-19 | | | 12-19 | | 4.90 | | | 2,000,000,000 | | | | 2,000,000,000 | | | | 24,239,998 | | | XS0071771512 | | Interest payable $A1,072,210 per year |
| | | | | | | | |
| 2016-12-19 | | | 1996-12-24 | | | 12-19 | | 3.80 | | | 5,000,000,000 | | | | 4,996,414,966 | | | | 60,556,545 | | | XS0072105157 | | |
| | | | | | | | |
| 2017-01-09 | | | 1997-01-09 | | | 01-09 | | 4.70 | | | 3,000,000,000 | | | | 2,997,850,050 | | | | 36,333,940 | | | XS0072223604 | | Interest payable in U.S.$ (U.S.$1,252,218 per year) |
| | | | | | | | |
| 2017-01-23 | | | 1997-01-23 | | | 01-23 | | 3.71 | | | 5,000,000,000 | | | | 4,969,566,549 | | | | 60,231,142 | | | XS0073055328 | | |
- 67 -
| | | | | | | | | | | | | | | | | | | | | | | | |
Maturity Date | | Issue
Date(1) | | | Interest Payment
Date(s) | | Coupon (%) | | Foreign Currency Units | | | Equivalent in
Canadian Dollars | | | CUSIP Number or
ISIN Code | | References |
| | | | | Nominal Value | | | Book Value | | | | |
|
| | | | | | | | |
2017-02-28 | | | 1997-02-28 | | | 02-28 | | 3.74 | | | 4,000,000,000 | | | | 4,000,000,000 | | | | 48,479,996 | | | XS0074014779 | | |
| | | | | | | | |
2017-07-24 | | | 1997-07-24 | | | 07-24 | | 3.50 | | | 5,000,000,000 | | | | 4,990,196,765 | | | | 60,481,180 | | | XS0078225884 | | |
| | | | | | | | |
2017-07-28 | | | 1997-07-28 | | | 07-28 | | 3.50 | | | 3,000,000,000 | | | | 2,996,174,109 | | | | 36,313,627 | | | XS0078671236 | | |
| | | | | | | | |
2017-07-30 | | | 1997-07-30 | | | 07-30 | | 3.45 | | | 1,000,000,000 | | | | 996,745,158 | | | | 12,080,550 | | | XS0078670857 | | |
| | | | | | | | |
2017-08-11 | | | 1997-07-24 | | | 02-11 & 08-11 | | 3.526 | | | 1,300,000,000 | | | | 1,300,000,000 | | | | 15,755,999 | | | XS0078704003 | | |
| | | | | | | | |
2017-10-25 | | | 1996-10-25 | | | 04-25 & 10-25 | | 4.02 | | | 6,000,000,000 | | | | 6,000,000,000 | | | | 72,719,994 | | | XS0070689996 | | |
| | | | | | | | |
2017-10-30 | | | 1996-10-30 | | | 04-30 & 10-30 | | 3.97 | | | 1,700,000,000 | | | | 1,698,589,548 | | | | 20,586,904 | | | US74815HCK68 | | |
| | | | | | | | |
2017-10-31 | | | 1997-10-30 | | | 10-31 | | 3.01 | | | 5,000,000,000 | | | | 5,000,000,000 | | | | 60,599,995 | | | XS0081272048 | | |
| | | | | | | | |
2018-08-20 | | | 2008-08-20 | | | 02-20 & 08-20 | | 1.80 | | | 5,000,000,000 | | | | 5,000,000,000 | | | | 60,599,995 | | | XS0382878345 | | |
| | | | | | | | |
2018-10-30 | | | 1996-10-30 | | | 04-30 & 10-30 | | 3.97 | | | 1,700,000,000 | | | | 1,698,421,769 | | | | 20,584,870 | | | US74815HCL42 | | |
| | | | | | | | |
2029-04-03 | | | 2009-04-03 | | | 04-03 & 10-03 | | 2.73 | | | 13,000,000,000 | | | | 13,000,000,000 | | | | 157,559,987 | | | XS0420287897 | | |
| | | | | | | | |
2029-04-27 | | | 2009-04-30 | | | 04-27 & 10-27 | | 2.90 | | | 3,000,000,000 | | | | 3,000,000,000 | | | | 36,359,997 | | | XS0425476891 | | |
| | | | | | | | |
| | | | | | | | | | | 246,800,000,000 | | | | 246,629,206,053 | | | | 2,989,145,738 | | | | | |
| | | | | |
Adjustments relating to swap agreements | | | (214,300,000,000) | | | | (214,300,000,000) | | | | (2,597,315,792) | | | | | |
| | | | | | |
Total-Payable in Japanese Yen | | | | | ¥32,500,000,000 | | | | ¥32,329,206,053 | | | | 391,829,946 | | | | | |
- 68 -
| | | | | | | | | | | | | | | | | | | | | | | | | | |
Maturity Date | | Issue
Date(1) | | | Interest Payment
Date(s) | | | Coupon (%) | | Foreign Currency Units | | | Equivalent in Canadian Dollars | | | CUSIP Number or
ISIN Code | | References |
| | | | | Nominal Value | | | Book Value | | | | |
| |
|
Payable in Swiss Francs |
|
Medium-Term Notes |
| | | | | | | | |
2014-11-21 | | | 2008-11-21 | | | | 11-21 | | | 3.50 | | | 250,000,000 | | | | 249,921,630 | | | | 276,580,307 | | | CH0047234684 | | |
| | | | | | | | |
2015-10-05 | | | 2005-10-05 | | | | 10-05 | | | 2.25 | | | 500,000,000 | | | | 499,656,431 | | | | 552,953,854 | | | CH0022651902 | | |
| | | | | | | | |
2015-12-11 | | | 2009-02-11 | | | | 12-11 | | | 3.125 | | | 350,000,000 | | | | 349,898,084 | | | | 387,221,063 | | | CH0049484600 | | |
| | | | | | | | |
2017-06-21 | | | 2006-12-21 | | | | 06-21 | | | 2.625 | | | 500,000,000 | | | | 497,219,459 | | | | 550,256,935 | | | CH0027984514 | | |
| | | | | | | | |
2018-01-19 | | | 2008-05-19 | | | | 01-19 | | | 3.375 | | | 250,000,000 | | | | 249,015,704 | | | | 275,577,747 | | | CH0039621724 | | |
| | | | | | | | |
2018-12-11 | | | 2009-02-11 | | | | 12-11 | | | 3.875 | | | 200,000,000 | | | | 200,363,326 | | | | 221,735,710 | | | CH0049484618 | | |
| | | | | | | | |
2021-12-17 | | | 2009-12-17 | | | | 12-17 | | | 2.875 | | | 200,000,000 | | | | 201,013,967 | | | | 222,455,754 | | | CH0107559392 | | |
| |
| | | | | | | | |
| | | | | | | | | | | | | 2,250,000,000 | | | | 2,247,088,601 | | | | 2,486,781,370 | | | | | |
| | | | | |
Adjustments relating to swap agreements | | | (2,050,000,000) | | | | (2,050,000,000) | | | | (2,268,669,694) | | | | | |
| |
Total-Payable in Swiss Francs | | | SF 200,000,000 | | | | SF 197,088,601 | | | | 218,111,676 | | | | | |
| |
| | | | | |
Payable in Australian Dollars | | | | | | | | | | | | | | | | |
| | | | | |
Medium-Term Notes | | | | | | | | | | | | | | | | |
| | | | | | | | |
2015-07-15 | | | 2005-07-15 | | | | 01-15 & 07-15 | | | 5.75 | | | 450,000,000 | | | | 448,770,731 | | | | 464,821,901 | | | AU0000QBCHE8 | | |
| | | | | | | | |
2021-07-12 | | | 2011-07-12 | | | | 01-12 & 07-12 | | | 6.50 | | | 225,000,000 | | | | 224,847,616 | | | | 232,889,734 | | | AU0000QBCHF5 | | |
| |
| | | | | | | | |
| | | | | | | | | | | | | 675,000,000 | | | | 673,618,347 | | | | 697,711,635 | | | | | |
| | | | | |
Adjustments relating to swap agreements | | | (675,000,000) | | | | (673,119,533) | | | | (697,194,980) | | | | | |
| |
| | | | | |
Total-Payable in Australian Dollars | | | $A - | | | | $A 498,814 | | | | 516,655 | | | | | |
| |
- 69 -
| | | | | | | | | | | | | | | | | | | | | | | | | | |
Maturity Date | | Issue
Date(1) | | | Interest Payment
Date(s) | | Coupon (%) | | | Foreign Currency Units | | | Equivalent in
Canadian
Dollars | | | CUSIP Number or
ISIN Code | | References |
| | | | | Nominal Value | | | Book Value | | | | |
| |
|
Payable in Pounds Sterling |
| | | | | | | | |
2020-03-15 | | | 1984-02-15 | | | 03-15 & 09-15 | | | 12.25 | | | | 50,000,000 | | | | 49,755,452 | | | | 79,457,538 | | | - | | |
| | | | | |
Adjustments relating to swap agreements | | | | (50,000,000) | | | | (50,000,000) | | | | (79,848,072) | | | | | |
| |
| | | | | | |
Total-Payable in Pounds Sterling | | | | | | | £ - | | | | £ (244,548) | | | | (390,534) | | | | | |
| |
| | | | | |
Payable in Mexican Pesos | | | | | | | | | | | | | | | | | |
| | | | | |
Medium-Term Notes | | | | | | | | | | | | | | | | | |
| | | | | | | | |
2016-01-19 | | | 2006-01-31 | | | Payable every
182 days after
August 1st, 2006 | | | 8.27 | | | | 1,500,000,000 | | | | 1,500,000,000 | | | | 116,969,631 | | | XS0242849486 | | |
| | | | | |
Adjustments relating to swap agreements | | | | (1,500,000,000) | | | | (1,500,000,000) | | | | (116,969,631) | | | | | |
| |
| | | | | | |
Total-Payable in Mexican Pesos | | | | | | | MXN - | | | | MXN - | | | | - | | | | | |
| |
| | | | | |
Payable in New Zealand Dollars | | | | | | | | | | | | | | | | | |
| | | | | | | | |
2015-11-09 | | | 2005-11-09 | | | 05-09 & 11-09 | | | 6.75 | | | | 300,000,000 | | | | 299,534,156 | | | | 245,367,026 | | | C4108FAC0 | | |
| | | | | |
Adjustments relating to swap agreements | | | | (300,000,000) | | | | (299,513,007) | | | | (245,349,701) | | | | | |
| |
| | | | | | |
Total-Payable in New Zealand Dollars | | | | | | | NZ$ - | | | | NZ$ 21,149 | | | | 17,325 | | | | | |
| |
| | | | | |
Payable in Hong Kong Dollars | | | | | | | | | | | | | | | | | |
| | | | | | | | |
2014-01-13 | | | 2009-01-13 | | | 01-13 | | | 3.35 | | | | 240,000,000 | | | | 240,000,000 | | | | 30,883,285 | | | XS0407737203 | | |
| | | | | | | | |
2014-02-11 | | | 2009-02-11 | | | 02-11 | | | 3.00 | | | | 472,000,000 | | | | 472,000,000 | | | | 60,737,127 | | | XS0412851411 | | |
| |
| | | | | | | | |
| | | | | | | | | | | | | 712,000,000 | | | | 712,000,000 | | | | 91,620,412 | | | | | |
| | | | | |
Adjustments relating to swap agreements | | | | (712,000,000) | | | | (712,000,000) | | | | (91,620,412) | | | | | |
| |
| | | | | |
Total-Payable in Hong Kong Dollars | | | | HK$ - | | | | HK$ - | | | | - | | | | | |
| |
- 70 -
| | | | | | | | | | | | | | | | | | | | | | | | |
Maturity Date | | Issue
Date(1) | | | Interest Payment
Date(s) | | Coupon (%) | | Foreign Currency Units | | | Equivalent in
Canadian Dollars | | | CUSIP Number or
ISIN Code | | References |
| | | | | Nominal Value | | | Book Value | | | | |
| |
|
Payable in Euros |
| | | | | | | | |
2013-02-27 | | | 2003-02-27 | | | 02-27 | | 4.25 | | | 1,000,000,000 | | | | 999,381,910 | | | | 1,331,376,521 | | | XS0163254062 | | |
| | | | | | | | |
2030-03-12 | | | 2010-03-12 | | | 03-12 | | 4.14 | | | 75,000,000 | | | | 75,000,000 | | | | 99,914,996 | | | - | | |
| | | | | | | | |
2030-04-29 | | | 2010-04-29 | | | 04-29 | | 4.02 | | | 35,000,000 | | | | 35,000,000 | | | | 46,626,998 | | | - | | |
| | | | | | | | |
2031-12-15 | | | 2011-12-15 | | | 12-15 | | 3.50 | | | 27,000,000 | | | | 27,000,000 | | | | 35,969,398 | | | - | | |
| | | | | |
Medium-Term Notes | | | | | | | | | | | | | | | | |
| | | | | | | | |
2015-02-10 | | | 2005-02-10 | | | 02-10 | | 3.625 | | | 1,500,000,000 | | | | 1,496,918,977 | | | | 1,994,195,372 | | | XS0212274046 | | |
| | | | | | | | |
2016-06-20 | | | 2005-10-20 | | | 06-20 | | 3.375 | | | 1,500,000,000 | | | | 1,493,702,904 | | | | 1,989,910,918 | | | XS0233031326 | | |
| | | | | | | | |
2017-01-22 | | | 1996-11-29 | | | 01-22 | | 7.08 | | | 51,129,188 | | | | 51,010,096 | | | | 67,955,647 | | | XS0071659949 | | |
| | | | | | | | |
2018-04-03 | | | 2006-04-03 | | | 04-03 | | 4.22 | | | 100,000,000 | | | | 100,000,000 | | | | 133,219,994 | | | XS0248732264 | | |
| | | | | | | | |
2018-04-29 | | | 2008-04-29 | | | 04-29 | | 4.75 | | | 1,250,000,000 | | | | 1,249,407,487 | | | | 1,664,460,580 | | | XS0360897689 | | |
| | | | | | | | |
2019-01-11 | | | 1999-01-11 | | | 01-11 | | 4/5/6/7.10 | | | 22,000,000 | | | | 21,962,655 | | | | 29,258,647 | | | XS0092871242 | | Others (10) |
| | | | | | | | |
2019-04-29 | | | 2009-04-29 | | | 04-29 | | 5.00 | | | 1,500,000,000 | | | | 1,495,911,560 | | | | 1,992,853,291 | | | XS0425413209 | | |
| |
| | | | | | | | |
| | | | | | | | | | | 7,060,129,188 | | | | 7,045,295,589 | | | | 9,385,742,362 | | | | | |
| | | | | |
Adjustments relating to swap agreements | | | (6,923,129,188) | | | | (6,923,129,188) | | | | (9,222,992,289) | | | | | |
| |
| | | | | | |
Total-Payable in Euros | | | | | € 137,000,000 | | | | € 122,166,401 | | | | 162,750,073 | | | | | |
| |
| | | | | |
Total-Payable in foreign currencies | | | | | | | | | | | 1,894,339,571 | | | | | |
| |
| | | | |
Total - Funded Debt of Borrowings-Government | | | | | | | | $ 157,775,553,123 | | | | | |
| |
| (1) | If more than one issue date, the date of the first issue is indicated. |
In case of disparity between the terms and conditions of each issue and this table, the terms and conditions of each issue will prevail.
- 71 -
Sinking Fund Provisions (“SFP”):
| (1) | As an invested sinking fund, Québec has agreed to withdraw from the Consolidated Revenue Fund, each year from the date indicated, a sum equal to at least 1% of the principal amount of the issue then outstanding. The issue is not redeemable for sinking fund purposes. |
| (2) | As an invested sinking fund, Québec has agreed to withdraw from the Consolidated Revenue Fund, each year from the date indicated, a sum equal to at least 2% of the principal amount of the issue then outstanding. The issue is not redeemable for sinking fund purposes. |
Puttable (“Put”):
| (1) | Payable at par at the option of the holder at any time prior to maturity. |
| (2) | Held and callable in whole or in part, at par at the option of the Minister of Finance of Québec on six days notice subject to the requirements of the Canada Pension Plan. |
| (3) | Redeemable prior to maturity at the option of the holder in whole or in part, on the date indicated at par upon prior notice. |
| (4) | Redeemable prior to Maturity at the option of the holder in whole or in part, from the date indicated and on any subsequent Interest Payment Date at par upon prior notice. |
Others:
| (1) | $6,000,000 annually for 1998-04-01 & 1999-04-01; $5,000,000 annually from 2000-04-01 to 2004-04-01; $35,000,000 for 2005-04-01; $5,000,000 for 2006-04-01; $55,000,000 for 2026-04-01 and $110,000,000 annually for 2034-04-01 & 2035-04-01. |
| (2) | $2,000,000 for each Interest Payment Date from 1999-04-01 to 2000-10-01 and from 2004-10-01 to 2007-10-01 (with the exception of 2006-04-01: $4,000,000). |
| (3) | Coupon rate represents the effective yield on the borrowing. |
| (4) | Interest of 10% payable first day of June and December from June 1, 2006 to December 1, 2015 and 5 % from June 1, 2037 to December 1, 2056. |
| (5) | Interest of 14% payable first day of June and December from June 1, 2009 to December 1, 2013 and 9 % from June 1, 2042 to June 1, 2065. |
| (6) | Interest of 8% payable first day of June and December from December 1, 2007 to December 1, 2017 and from June 1, 2039 to December 1, 2076. |
| (7) | Payable in installments including principal and interest. |
| (8) | Data differ slightly from those provided in the Financement-Québec 18K due to the accounting treatment of the amortization of premiums and discounts. |
| (9) | Borrowings contracted with the CMHC under the municipal infrastructure low-cost loans program. Payable in annual installments, including principal and interest. |
| (10) | The Coupon will be 4.00% for the first five years, 5.00% for the years 6 to 10, 6.00% for the years 11 to 15, and 7.10% for the next years. |
- 72 -