QuickLinks -- Click here to rapidly navigate through this document
EXHIBIT 13
ELEVEN YEAR FINANCIAL SUMMARY
(In thousands except per share and percentage data)
Years Ended May 31
| | 1992
| | 1993
| | 1994
| | 1995
| | 1996
| | 1997
| | 1998
| | 1999
| | 2000
| | 2001
| | 2002
| | 10-Year
Compd
Growth
| |
|---|
| Revenue | | $ | 621,041 | | 711,663 | | 803,009 | | 929,534 | | 1,103,492 | | 1,261,899 | | 1,476,945 | | 1,751,568 | | 1,901,991 | | 2,160,700 | | 2,271,052 | | 13.8 | %(3) |
| Net Income | | $ | 45,744 | | 54,956 | | 67,141 | | 85,413 | | 98,956 | | 118,557 | | 133,654 | | 138,939 | | 193,387 | | 222,451 | | 234,251 | | 17.7 | % |
| Pro Forma Net Income(1) | | $ | 45,151 | | 53,374 | | 64,459 | | 80,752 | | 94,151 | | 112,763 | | 128,704 | | 138,939 | | 193,387 | | 222,451 | | 234,251 | | 17.9 | % |
| Basic EPS | | $ | 0.31 | | 0.36 | | 0.44 | | 0.55 | | 0.64 | | 0.75 | | 0.83 | | 0.84 | | 1.16 | | 1.32 | | 1.38 | | 16.1 | % |
| Diluted EPS | | $ | 0.31 | | 0.35 | | 0.43 | | 0.55 | | 0.63 | | 0.75 | | 0.82 | | 0.82 | | 1.14 | | 1.30 | | 1.36 | | 15.9 | % |
| Pro Forma Basic EPS(1) | | $ | 0.30 | | 0.35 | | 0.42 | | 0.52 | | 0.61 | | 0.72 | | 0.80 | | 0.84 | | 1.16 | | 1.32 | | 1.38 | | 16.5 | % |
| Pro Forma Diluted EPS(1) | | $ | 0.30 | | 0.35 | | 0.41 | | 0.51 | | 0.60 | | 0.71 | | 0.79 | | 0.82 | | 1.14 | | 1.30 | | 1.36 | | 16.3 | % |
| Dividends Per Share | | $ | 0.04 | | 0.05 | | 0.06 | | 0.07 | | 0.09 | | 0.10 | | 0.12 | | 0.15 | | 0.19 | | 0.22 | | 0.25 | | 20.1 | % |
| Total Assets | | $ | 501,769 | | 634,197 | | 700,872 | | 816,508 | | 996,046 | | 1,101,182 | | 1,305,400 | | 1,407,818 | | 1,581,342 | | 1,752,224 | | 2,519,234 | | 17.5 | % |
| Shareholders' Equity | | $ | 273,501 | | 324,562 | | 409,053 | | 481,654 | | 553,701 | | 650,603 | | 756,795 | | 871,423 | | 1,042,876 | | 1,231,315 | | 1,423,759 | | 17.9 | % |
| Return on Average Equity | | | 17.8 | % | 17.8 | % | 17.6 | % | 18.1 | % | 18.2 | % | 18.7 | % | 18.8 | %(2) | 20.1 | %(2) | 20.2 | % | 19.6 | % | 17.6 | % | | |
| Long-Term Debt | | $ | 122,372 | | 158,311 | | 132,929 | | 164,332 | | 237,550 | | 227,799 | | 307,633 | | 283,581 | | 254,378 | | 220,940 | | 703,250 | | | |
- Note:
- Results prior to March 24, 1999, have been restated to include Unitog Company.
Results prior to April 8, 1998, have also been restated to include Uniforms To You Companies.
- (1)
- Results for 1998 and prior years were adjusted on a pro forma basis to reflect the true tax impact of Uniforms To You as if it had been reported as a C Corporation prior to the merger with Cintas.
- (2)
- Return on average equity before one-time items.
- (3)
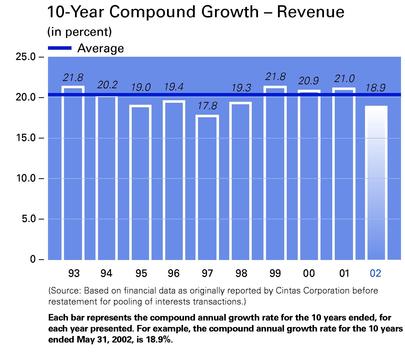
- Represents the 10-year compound annual growth rate based on revenue as restated for pooling of interests transactions noted above. Please refer to the graph below for the 10-year compound annual growth rates in revenue based on financial data, as originally reported by Cintas Corporation, before restatement for pooling of interests transactions.
1
CONSOLIDATED STATEMENTS OF INCOME
(In thousands except per share data)
Years Ended May 31
| | 2002
| | 2001
| | 2000
| |
|---|
| Revenue: | | | | | | | | | | |
| | Rentals | | $ | 1,753,368 | | $ | 1,610,606 | | $ | 1,424,892 | |
| | Other services | | | 517,684 | | | 550,094 | | | 477,099 | |
| | |
| |
| |
| |
| | | | 2,271,052 | | | 2,160,700 | | | 1,901,991 | |
| Costs and expenses (income): | | | | | | | | | | |
| | Cost of rentals | | | 953,352 | | | 896,539 | | | 807,301 | |
| | Cost of other services | | | 360,330 | | | 367,894 | | | 315,138 | |
| | Selling and administrative expenses | | | 580,469 | | | 529,063 | | | 456,628 | |
| | Interest income | | | (5,636 | ) | | (4,369 | ) | | (4,742 | ) |
| | Interest expense | | | 10,952 | | | 15,119 | | | 15,907 | |
| | |
| |
| |
| |
| | | | 1,899,467 | | | 1,804,246 | | | 1,590,232 | |
| | |
| |
| |
| |
| Income before income taxes | | | 371,585 | | | 356,454 | | | 311,759 | |
| Income taxes | | | 137,334 | | | 134,003 | | | 118,372 | |
| | |
| |
| |
| |
| Net income | | $ | 234,251 | | $ | 222,451 | | $ | 193,387 | |
| | |
| |
| |
| |
| Basic earnings per share | | $ | 1.38 | | $ | 1.32 | | $ | 1.16 | |
| | |
| |
| |
| |
| Diluted earnings per share | | $ | 1.36 | | $ | 1.30 | | $ | 1.14 | |
| | |
| |
| |
| |
| Dividends declared and paid per share | | $ | .25 | | $ | .22 | | $ | .19 | |
| | |
| |
| |
| |
See accompanying notes.
2
CONSOLIDATED BALANCE SHEETS
(In thousands except share data)
As of May 31
| | 2002
| | 2001
| |
|---|
| Assets | | | | | | | |
| Current assets: | | | | | | | |
| | Cash and cash equivalents | | $ | 40,628 | | $ | 73,724 | |
| | Marketable securities | | | 44,458 | | | 36,505 | |
| | Accounts receivable, principally trade, less allowance of $9,229 and $8,765, respectively | | | 283,234 | | | 244,450 | |
| | Inventories | | | 193,821 | | | 214,349 | |
| | Uniforms and other rental items in service | | | 280,936 | | | 242,172 | |
| | Prepaid expenses | | | 10,173 | | | 8,470 | |
| | |
| |
| |
| Total current assets | | | 853,250 | | | 819,670 | |
| Property and equipment, at cost, net | | | 778,402 | | | 702,132 | |
| Goodwill | | | 678,598 | | | 123,753 | |
| Other assets | | | 208,984 | | | 106,669 | |
| | |
| |
| |
| | | $ | 2,519,234 | | $ | 1,752,224 | |
| | |
| |
| |
| Liabilities and Shareholders' Equity | | | | | | | |
| Current liabilities: | | | | | | | |
| | Accounts payable | | $ | 60,393 | | $ | 42,495 | |
| | Accrued compensation and related liabilities | | | 29,004 | | | 35,140 | |
| | Accrued liabilities | | | 131,705 | | | 81,548 | |
| | Income taxes: | | | | | | | |
| | | Current | | | 11,791 | | | 13,412 | |
| | | Deferred | | | 61,372 | | | 57,703 | |
| | Long-term debt due within one year | | | 18,369 | | | 20,605 | |
| | |
| |
| |
| Total current liabilities | | | 312,634 | | | 250,903 | |
| Long-term debt due after one year | | | 703,250 | | | 220,940 | |
| Deferred income taxes | | | 79,591 | | | 49,066 | |
| Shareholders' equity: | | | | | | | |
| | Preferred stock, no par value: 100,000 shares authorized, none outstanding | | | — | | | — | |
| | Common stock, no par value: 425,000,000 shares authorized, 169,930,290 and 169,370,563 shares issued and outstanding, respectively | | | 66,508 | | | 62,409 | |
| | Retained earnings | | | 1,365,136 | | | 1,174,330 | |
| | Other accumulated comprehensive loss: | | | | | | | |
| | | Foreign currency translation | | | (4,863 | ) | | (5,424 | ) |
| | | Unrealized loss on derivatives | | | (3,022 | ) | | — | |
| | |
| |
| |
| Total shareholders' equity | | | 1,423,759 | | | 1,231,315 | |
| | |
| |
| |
| | | $ | 2,519,234 | | $ | 1,752,224 | |
| | |
| |
| |
See accompanying notes.
3
CONSOLIDATED STATEMENTS OF SHAREHOLDERS' EQUITY
(In thousands)
| | Common Stock
| |
| | Other
Accumulated
Comprehensive
Income (Loss)
| |
| |
|---|
| | Retained
Earnings
| | Total
Shareholders'
Equity
| |
|---|
| | Shares
| | Amount
| |
|---|
| Balance at May 31, 1999 | | 166,424 | | $ | 49,974 | | $ | 825,268 | | $ | (3,819 | ) | $ | 871,423 | |
| Net income | | — | | | — | | | 193,387 | | | — | | | 193,387 | |
| Equity adjustment for foreign currency translation | | — | | | — | | | — | | | (493 | ) | | (493 | ) |
| | | | | | | | | | | | | |
| |
| Comprehensive income | | | | | | | | | | | | | | 192,894 | |
| | | | | | | | | | | | | |
| |
| Dividends | | — | | | — | | | (31,249 | ) | | — | | | (31,249 | ) |
| Effects of acquisitions | | 1,419 | | | 825 | | | 5,044 | | | — | | | 5,869 | |
| Stock options exercised net of shares surrendered | | 439 | | | 3,399 | | | — | | | — | | | 3,399 | |
| Tax benefit resulting from exercise of employee stock options | | — | | | 540 | | | — | | | — | | | 540 | |
| | |
| |
| |
| |
| |
| |
| Balance at May 31, 2000 | | 168,282 | | | 54,738 | | | 992,450 | | | (4,312 | ) | | 1,042,876 | |
| | |
| |
| |
| |
| |
| |
| Net income | | — | | | — | | | 222,451 | | | — | | | 222,451 | |
| Equity adjustment for foreign currency translation | | — | | | — | | | — | | | (1,112 | ) | | (1,112 | ) |
| | | | | | | | | | | | | |
| |
| Comprehensive income | | | | | | | | | | | | | | 221,339 | |
| | | | | | | | | | | | | |
| |
| Dividends | | — | | | — | | | (37,173 | ) | | — | | | (37,173 | ) |
| Effects of acquisitions | | 459 | | | (11 | ) | | (3,398 | ) | | — | | | (3,409 | ) |
| Stock options exercised net of shares surrendered | | 630 | | | 5,992 | | | — | | | — | | | 5,992 | |
| Tax benefit resulting from exercise of employee stock options | | — | | | 1,690 | | | — | | | — | | | 1,690 | |
| | |
| |
| |
| |
| |
| |
| Balance at May 31, 2001 | | 169,371 | | | 62,409 | | | 1,174,330 | | | (5,424 | ) | | 1,231,315 | |
| | |
| |
| |
| |
| |
| |
| Cumulative effect of accounting change for SFAS 133, net of tax | | — | | | — | | | — | | | (44 | ) | | (44 | ) |
| Net income | | — | | | — | | | 234,251 | | | — | | | 234,251 | |
| Equity adjustment for foreign currency translation | | — | | | — | | | — | | | 561 | | | 561 | |
| Change in fair value of derivatives | | — | | | — | | | — | | | (2,978 | ) | | (2,978 | ) |
| | | | | | | | | | | | | |
| |
| Comprehensive income | | | | | | | | | | | | | | 231,834 | |
| | | | | | | | | | | | | |
| |
| Dividends | | — | | | — | | | (42,454 | ) | | — | | | (42,454 | ) |
| Effects of acquisitions | | 137 | | | — | | | (991 | ) | | — | | | (991 | ) |
| Stock options exercised net of shares surrendered | | 422 | | | 3,247 | | | — | | | — | | | 3,247 | |
| Tax benefit resulting from exercise of employee stock options | | — | | | 852 | | | — | | | — | | | 852 | |
| | |
| |
| |
| |
| |
| |
| Balance at May 31, 2002 | | 169,930 | | $ | 66,508 | | $ | 1,365,136 | | $ | (7,885 | ) | $ | 1,423,759 | |
| | |
| |
| |
| |
| |
| |
See accompanying notes.
4
CONSOLIDATED STATEMENTS OF CASH FLOWS
(In thousands)
Years Ended May 31
| | 2002
| | 2001
| | 2000
| |
|---|
| Cash flows from operating activities: | | | | | | | | | | |
| | Net income | | $ | 234,251 | | $ | 222,451 | | $ | 193,387 | |
| | Adjustments to reconcile net income to net cash provided by (used in) operating activities: | | | | | | | | | | |
| | | Depreciation | | | 101,215 | | | 90,239 | | | 78,516 | |
| | | Amortization of deferred charges | | | 18,810 | | | 21,850 | | | 20,997 | |
| | | Deferred income taxes | | | 20,629 | | | 8,459 | | | 17,379 | |
| | | Change in current assets and liabilities, net of acquisitions of businesses: | | | | | | | | | | |
| | | | Accounts receivable | | | 3,162 | | | (16,486 | ) | | (19,259 | ) |
| | | | Inventories | | | 31,731 | | | (48,693 | ) | | (22,976 | ) |
| | | | Uniforms and other rental items in service | | | (27,257 | ) | | (28,471 | ) | | (14,425 | ) |
| | | | Prepaid expenses | | | 1,330 | | | (1,160 | ) | | (938 | ) |
| | | | Accounts payable | | | 3,345 | | | (10,107 | ) | | (600 | ) |
| | | | Accrued compensation and related liabilities | | | (12,696 | ) | | 6,666 | | | 2,270 | |
| | | | Accrued liabilities | | | 4,534 | | | (4,011 | ) | | (8,889 | ) |
| | | | Income taxes payable | | | (1,621 | ) | | 6,221 | | | 12,570 | |
| | |
| |
| |
| |
| Net cash provided by operating activities | | | 377,433 | | | 246,958 | | | 258,032 | |
| Cash flows from investing activities: | | | | | | | | | | |
| | Capital expenditures | | | (107,284 | ) | | (147,444 | ) | | (161,432 | ) |
| | Proceeds from sale or redemption of marketable securities | | | 157,419 | | | 61,609 | | | 112,908 | |
| | Purchase of marketable securities | | | (165,372 | ) | | (40,474 | ) | | (98,233 | ) |
| | Acquisitions of businesses, net of cash acquired | | | (732,227 | ) | | (30,535 | ) | | (24,982 | ) |
| | Proceeds from divestiture of certain facilities | | | — | | | 1,400 | | | 25,722 | |
| | Other | | | (1,882 | ) | | (5,965 | ) | | (10,921 | ) |
| | |
| |
| |
| |
| Net cash used in investing activities | | | (849,346 | ) | | (161,409 | ) | | (156,938 | ) |
| Cash flows from financing activities: | | | | | | | | | | |
| | Proceeds from issuance of long-term debt | | | 640,245 | | | 230 | | | 140,739 | |
| | Repayment of long-term debt | | | (160,612 | ) | | (33,634 | ) | | (177,651 | ) |
| | Stock options exercised | | | 3,247 | | | 5,992 | | | 3,399 | |
| | Dividends paid | | | (42,454 | ) | | (37,173 | ) | | (31,249 | ) |
| | Other | | | (1,609 | ) | | 578 | | | 47 | |
| | |
| |
| |
| |
| Net cash provided by (used in) financing activities | | | 438,817 | | | (64,007 | ) | | (64,715 | ) |
| Net (decrease) increase in cash and cash equivalents | | | (33,096 | ) | | 21,542 | | | 36,379 | |
| Cash and cash equivalents at beginning of year | | | 73,724 | | | 52,182 | | | 15,803 | |
| | |
| |
| |
| |
| Cash and cash equivalents at end of year | | $ | 40,628 | | $ | 73,724 | | $ | 52,182 | |
| | |
| |
| |
| |
See accompanying notes.
5
NOTES TO CONSOLIDATED FINANCIAL STATEMENTS
(Amounts in thousands except per share and share data)
1. SIGNIFICANT ACCOUNTING POLICIES
Business description.Cintas Corporation (Cintas) classifies its businesses into two operating segments: Rentals and Other Services. The Rentals operating segment designs and manufactures corporate identity uniforms which it rents, along with other items, to its customers. The Other Services operating segment involves the design, manufacture and direct sale of uniforms to its customers, as well as the sale of ancillary services including sanitation supplies, first aid products and services and cleanroom supplies. All of these services are provided throughout the United States and Canada to businesses of all types—from small service and manufacturing companies to major corporations that employ thousands of people.
Principles of consolidation.The consolidated financial statements include the accounts of Cintas and its subsidiaries. Intercompany balances and transactions have been eliminated.
Use of estimates.The preparation of financial statements in conformity with accounting principles generally accepted in the United States requires management to make estimates and assumptions that affect the amounts reported in the financial statements and accompanying notes. Financial results could differ from those estimates.
Cash and cash equivalents.Cintas considers all highly liquid investments with a maturity of three months or less, at date of purchase, to be cash equivalents.
Inventories.Inventories are valued at the lower of cost (first-in, first-out) or market. Substantially all inventories represent finished goods.
Uniforms and other rental items in service.These items are valued at cost less amortization, calculated using the straight-line method. Uniforms in service (other than cleanroom and flame resistant garments) are amortized over their useful life of eighteen months. Other rental items including shop towels, mats, cleanroom garments, flame resistant garments, linens and hygiene dispensers are amortized over their useful lives of eight to forty-eight months.
Property and equipment.Depreciation is calculated using the straight-line method over the following estimated useful lives, in years:
| Buildings and Improvements | | 5 to 40 |
| Equipment | | 3 to 10 |
| Leasehold Improvements | | 2 to 5 |
Long-lived assets.When events or circumstances indicate that the carrying amount of long-lived assets may not be recoverable, the estimated future cash flows (undiscounted) are compared to the carrying amount of the assets. If the estimated future cash flows are less than the carrying amount of the assets, an impairment loss is recorded. The impairment loss is measured by comparing the fair value of the assets with their carrying amounts. Fair value is determined by discounted cash flows or appraised values, as appropriate. Long-lived assets that are held for disposal are reported at the lower of the carrying amount or the fair value, less estimated costs related to disposition.
Other assets.Other assets consist primarily of service contracts and noncompete and consulting agreements obtained through the acquisition of businesses, which are amortized by use of the straight-line method over the estimated lives of the agreements, which are generally three to twelve years.
Accrued liabilities.Accrued liabilities consist primarily of insurance, medical and profit sharing obligations and legal and environmental contingencies. These are recorded when it is probable that a liability has occurred and the amount of the liability can be reasonably estimated.
Stock options.Cintas applies the provisions of Accounting Principles Board Opinion No. 25,Accounting for Stock Issued to Employees. Accordingly, no compensation expense has been reflected in the financial statements as the exercise price of options granted to employees is equal to the fair market value of Cintas' common stock on the date of grant. Cintas has adopted the disclosure-only provisions of Statement of Financial Accounting Standards No. 123 (SFAS 123),Accounting for Stock Based Compensation.
6
Derivatives and hedging activities.Effective June 1, 2001, Cintas adopted Statement of Financial Accounting Standards No. 133 (SFAS 133),Accounting for Derivatives and Hedging Activities, as amended. This standard requires the recognition of all derivatives on the balance sheet at fair value and recognition of the resulting gains or losses as adjustments to earnings or other comprehensive income. The adoption of this new standard resulted in a cumulative effect of change in accounting principle of $44 recorded in other comprehensive loss to reflect the interest rate swaps described in Note 5.
Cintas formally documents all relationships between hedging instruments and hedged items, as well as its risk management objective and strategy for undertaking various hedge transactions. Cintas' hedging activities are transacted only with highly-rated institutions, reducing the exposure to credit risk in the event of nonperformance.
Cintas uses derivatives for both cash flow hedging and fair value hedging purposes. For derivative instruments that hedge the exposure of variability in short-term interest rates, designated as cash flow hedges, the effective portion of the net gain or loss on the derivative instrument is reported as a component of other comprehensive income and reclassified into earnings in the same period or periods during which the hedged transaction affects earnings. For the ineffective portion of the hedge, gains or losses are charged to earnings in the current period. For derivative instrumentsthat hedge the exposure to changes in the fair value of certain fixed rate debt, designated as fair value hedges, the effective portion of the net gain or loss on the derivative instrument, as well as the offsetting gain or loss on the fixed rate debt attributable to the hedged risk, are recorded in current period earnings.
Cintas uses interest rate swap and lock agreements as hedges against variability in short-term interest rates. These agreements effectively convert a portion of the floating rate debt to a fixed rate basis, thus reducing the impact of interest rate changes on future interest expense. Cintas uses the Hypothetical Derivative Method for assessing the effectiveness of these swaps. The effectiveness of these swaps is reviewed at least every fiscal quarter. Cintas will also periodically use reverse interest rate swap agreements to convert a portion of fixed rate debt to a floating rate basis, thus hedging for changes in the fair value of the fixed rate debt being hedged. Cintas has determined that the interest rate swap agreement referenced in Note 5, designated as a fair value hedge, qualifies for treatment under the short-cut method of measuring effectiveness. Under the provisions of SFAS 133, this hedge is determined to be perfectly effective and there is no requirement to periodically evaluate effectiveness.
Revenue recognition.Rental revenue is recognized when services are performed and other services revenue is recognized when products are shipped and the title and risks of ownership pass to the customer. Cintas also establishes an estimate of allowances for uncollectible accounts when revenue is recorded.
Fair value of financial instruments.The following methods and assumptions were used by Cintas in estimating the fair value of financial instruments:
Cash and cash equivalents. The amounts reported approximate market value.
Marketable securities. The amounts reported are at cost, which approximates market value. Market values are based on quoted market prices.
Long-term debt. The amounts reported are at a carrying value which approximates market value. Market values are determined using similar debt instruments currently available to Cintas that are consistent with the terms, interest rates and maturities.
Reclassification.Certain prior year amounts have been reclassified to conform with current year presentation.
Other accounting pronouncements.In August 2001, the Financial Accounting Standards Board issued Statement of Financial Accounting Standards No. 144 (SFAS 144),Accounting for the Impairment or Disposal of Long-Lived Assets. SFAS 144 addresses significant issues relating to the implementation of Statement of Financial Accounting Standards No. 121 (SFAS 121),Accounting for the Impairment of Long-Lived Assets and for Long-Lived Assets to Be Disposed Of, and develops a single accounting model, based on the framework established in SFAS 121 for long-lived assets to be disposed of by sale, whether such assets are or are not deemed to be a business. SFAS 144 also modifies the accounting and disclosure rules for discontinued operations. Effective June 1, 2002, Cintas adopted SFAS 144 and it did not have a material effect on the financial statements.
7
2. MARKETABLE SECURITIES
All marketable securities are comprised of debt securities and classified as available-for-sale. Realized gains and losses and declines in value determined to be other than temporary on available-for-sale securities are included in interest income. The cost of the securities sold is based on the specific identification method. Interest on securities classified as available-for-sale is included in interest income.
The following is a summary of marketable securities:
| | 2002
| | 2001
|
|---|
| | Cost
| | Estimated
Fair Value
| | Cost
| | Estimated
Fair Value
|
|---|
| Obligations of state and political subdivisions | | $ | 41,447 | | $ | 41,540 | | $ | 32,171 | | $ | 32,468 |
| U.S. Treasury securities and obligations of U.S. government agencies | | | 881 | | | 851 | | | 600 | | | 600 |
| Other debt securities | | | 2,130 | | | 2,130 | | | 3,734 | | | 3,794 |
| | |
| |
| |
| |
|
| | | $ | 44,458 | | $ | 44,521 | | $ | 36,505 | | $ | 36,862 |
| | |
| |
| |
| |
|
The gross realized gains on sales of available-for-sale securities totaled $585, $64 and $54 for the years ended May 31, 2002, 2001 and 2000, and the gross realized losses totaled $95, $21 and $130, respectively. Net unrealized gains are $63 and $357 at May 31, 2002 and 2001, respectively.
The cost and estimated fair value of debt securities at May 31, 2002, by contractual maturity, are shown below. Expected maturities will differ from contractual maturities because the issuers of the securities may have the right to prepay the obligations without prepayment penalties.
| | Cost
| | Estimated
Fair Value
|
|---|
| Due in one year or less | | $ | 17,703 | | $ | 17,798 |
| Due after one year through three years | | | 24,453 | | | 24,454 |
| Due after three years | | | 2,302 | | | 2,269 |
| | |
| |
|
| | | $ | 44,458 | | $ | 44,521 |
| | |
| |
|
3. PROPERTY AND EQUIPMENT
| | 2002
| | 2001
|
|---|
| Land | | $ | 64,823 | | $ | 54,743 |
| Buildings and improvements | | | 388,695 | | | 326,512 |
| Equipment | | | 674,969 | | | 589,945 |
| Leasehold improvements | | | 10,653 | | | 12,124 |
| Construction in progress | | | 72,523 | | | 74,609 |
| | |
| |
|
| | | | 1,211,663 | | | 1,057,933 |
| Less: accumulated depreciation | | | 433,261 | | | 355,801 |
| | |
| |
|
| | | $ | 778,402 | | $ | 702,132 |
| | |
| |
|
4. GOODWILL AND OTHER ASSETS
As of June 1, 2001, Cintas adopted Statement of Financial Accounting Standards No. 142 (SFAS 142),Goodwill and Other Intangible Assets, which addresses the financial accounting and reporting standards for the acquisition of intangible assets outside of a business combination and for goodwill and other intangible assets subsequent to their acquisition. This accounting standard requires that goodwill be separately disclosed from other intangible assets in the balance sheet, and no longer be amortized, but tested for impairment on a periodic basis. The provisions of this accounting standard also require the completion of a transitional impairment test within six months of adoption, with any impairments identified treated as a cumulative effect of a change in accounting principle.
8
Cintas completed the transitional and the annual goodwill impairment tests as required by SFAS 142. Based on the results of the impairment tests, Cintas was not required to recognize an impairment of goodwill. Cintas will continue to perform future impairment tests as required by SFAS 142.
In accordance with SFAS 142, Cintas discontinued the amortization of goodwill effective June 1, 2001. A reconciliation of previously reported net income and earnings per share to the amounts adjusted for the exclusion of goodwill amortization, net of the related income tax effect, follows:
| | 2002
| | 2001
| | 2000
|
|---|
| Reported net income | | $ | 234,251 | | $ | 222,451 | | $ | 193,387 |
| Add: goodwill amortization, net of tax | | | — | | | 3,328 | | | 2,362 |
| | |
| |
| |
|
| Adjusted net income | | $ | 234,251 | | $ | 225,779 | | $ | 195,749 |
| | |
| |
| |
|
| Reported basic earnings per share | | $ | 1.38 | | $ | 1.32 | | $ | 1.16 |
| Add: goodwill amortization, net of tax per basic share | | | — | | | .02 | | | .01 |
| | |
| |
| |
|
| Adjusted basic earnings per share | | $ | 1.38 | | $ | 1.34 | | $ | 1.17 |
| | |
| |
| |
|
| Reported diluted earnings per share | | $ | 1.36 | | $ | 1.30 | | $ | 1.14 |
| Add: goodwill amortization, net of tax per diluted share | | | — | | | .02 | | | .01 |
| | |
| |
| |
|
| Adjusted diluted earnings per share | | $ | 1.36 | | $ | 1.32 | | $ | 1.15 |
| | |
| |
| |
|
Changes in the carrying amount of goodwill for the year ended May 31, 2002, by operating segment, are as follows:
| | Rentals
| | Other
Services
| | Total
|
|---|
| Balance as of June 1, 2001 | | $ | 110,030 | | $ | 13,723 | | $ | 123,753 |
| Goodwill acquired during the period | | | 535,415 | | | 19,430 | | | 554,845 |
| | |
| |
| |
|
| Balance as of May 31, 2002 | | $ | 645,445 | | $ | 33,153 | | $ | 678,598 |
| | |
| |
| |
|
As required by Statement of Financial Accounting Standards No.141 (SFAS 141), Business Combinations, (see Note 8), intangible assets that do not meet the criteria for recognition apart from goodwill must be reclassified. As a result of Cintas' analysis, no reclassifications to goodwill were required as of June 1, 2001.
Information regarding Cintas' other assets follows:
As of May 31, 2002
| | Carrying
Amount
| | Accumulated
Amortization
| | Net
|
|---|
| Service contracts | | $ | 226,023 | | $ | 67,494 | | $ | 158,529 |
| Noncompete and consulting agreements | | | 61,742 | | | 41,792 | | | 19,950 |
| Other | | | 31,111 | | | 606 | | | 30,505 |
| | |
| |
| |
|
| Total | | $ | 318,876 | | $ | 109,892 | | $ | 208,984 |
| | |
| |
| |
|
As of May 31, 2001
| | Carrying
Amount
| | Accumulated
Amortization
| | Net
|
|---|
| Service contracts | | $ | 118,241 | | $ | 61,810 | | $ | 56,431 |
| Noncompete and consulting agreements | | | 63,519 | | | 42,334 | | | 21,185 |
| Other | | | 29,887 | | | 834 | | | 29,053 |
| | |
| |
| |
|
| Total | | $ | 211,647 | | $ | 104,978 | | $ | 106,669 |
| | |
| |
| |
|
9
Amortization expense was $18,810, $21,850 and $20,997 for the years ended May 31, 2002, 2001 and 2000, respectively. Estimated amortization expense, excluding any future acquisitions, for each of the next five years is $27,528, $23,925, $21,722, $20,854 and $19,579, respectively.
5. LONG-TERM DEBT
| | 2002
| | 2001
|
|---|
| Secured and unsecured term notes due through 2003 at an average rate of 9.98% | | $ | 5,500 | | $ | 7,500 |
| Unsecured term notes due through 2026 at an average rate of 5.59% | | | 492,697 | | | 54,348 |
| Unsecured notes due through 2009 at an average rate of 2.44% | | | 207,272 | | | 160,156 |
| Industrial development revenue bonds due through 2026 at an average rate of 3.24% | | | 11,691 | | | 14,489 |
| Other | | | 4,459 | | | 5,052 |
| | |
| |
|
| | | | 721,619 | | | 241,545 |
| Less: amounts due within one year | | | 18,369 | | | 20,605 |
| | |
| |
|
| | | $ | 703,250 | | $ | 220,940 |
| | |
| |
|
Debt in the amount of $21,650 is secured by assets with a carrying value of $26,297 at May 31, 2002. Cintas has letters of credit outstanding at May 31, 2002 approximating $39,603. Maturities of long-term debt during each of the next five years are $18,369, $218,853, $10,401, $7,347 and $4,056, respectively.
Interest expense is net of capitalized interest of $594, $1,468 and $1,257 for the years ended May 31, 2002, 2001 and 2000, respectively. Interest paid, net of amount capitalized, was $11,017, $15,194 and $16,773 for the years ended May 31, 2002, 2001 and 2000, respectively.
Cintas has a commercial paper program supported by a $300 million long-term credit facility. As of May 31, 2002, $190 million in commercial paper was outstanding.
Cintas uses interest rate swap and lock agreements as hedges against variability in short-term interest rates. These agreements effectively convert a portion of our floating rate debt to a fixed rate basis, thus reducing the impact of interest rate changes on future interest expense. During fiscal 2001, and again in the second quarter of fiscal 2002, Cintas entered into interest rate swap agreements that effectively converted a portion of our floating rate debt to a fixed rate basis for a period of two years. Approximately 20%, or $50 million, of outstanding floating rate debt was designated as the hedged items covered by interest rate swap agreements at May 31, 2002. Cintas has entered into two interest rate swap agreements. The first agreement totals $10 million, expires in March 2003 and allows Cintas to pay an effective interest rate of approximately 4.76%. The second agreement totals $40 million, expires in September 2003 and allows Cintas to pay an effective interest rate of approximately 4.02%.
Cintas has also entered into a reverse interest rate swap agreement to protect the debt against changes in the fair value due to changes in the benchmark interest rate. The reverse interest rate swap agreement utilized by Cintas effectively modifies Cintas' exposure to interest risk by converting Cintas' fixed rate debt to floating rate. This agreement involves the receipt of fixed rate amounts in exchange for floating rate interest payments over the life of the agreementwithout an exchange of underlying principal amount. The mark-to-market values of both the fair value hedging instruments and the underlying debt obligations are equal and recorded as offsetting gains and losses in other comprehensive income. The fair value hedge is 100% effective. As a result, there is no impact to earnings due to hedge ineffectiveness.The reverse interest rate swap agreement totals $125 million, expires in June 2007 and allows Cintas to receive an effective interest rate of approximately 5.13% and pay an interest rate based on LIBOR.
10
6. LEASES
Cintas conducts certain operations from leased facilities and leases certain equipment. Most leases contain renewal options for periods from one to ten years. The lease agreements provide for increases in rentals if the options are exercised based on increases in certain price level factors or prearranged increases. It is anticipated that expiring leases will be renewed or replaced. The minimum rental payments under noncancelable lease arrangements for each of the next five years and thereafter are $14,923, $12,039, $9,603, $8,201, $6,426 and $10,674, respectively. Rent expense under operating leases during the years ended May 31, 2002, 2001 and 2000 was $18,377, $17,063 and $16,949, respectively.
7. INCOME TAXES
| | 2002
| | 2001
| | 2000
|
|---|
| Income taxes consist of the following components: | | | | | | | | | |
| | Current: | | | | | | | | | |
| | | Federal | | $ | 105,027 | | $ | 111,408 | | $ | 88,842 |
| | | State and local | | | 11,849 | | | 14,135 | | | 12,151 |
| | |
| |
| |
|
| | | | 116,876 | | | 125,543 | | | 100,993 |
| | Deferred | | | 20,458 | | | 8,460 | | | 17,379 |
| | |
| |
| |
|
| | | $ | 137,334 | | $ | 134,003 | | $ | 118,372 |
| | |
| |
| |
|
| | 2002
| | 2001
| | 2000
| |
|---|
| Reconciliation of income tax expense using the statutory rate and actual income tax expense is as follows: | | | | | | | | | | |
| | | Income taxes at the U.S. federal statutory rate | | $ | 129,979 | | $ | 124,760 | | $ | 109,109 | |
| | | State and local income taxes, net of federal benefit | | | 8,786 | | | 9,710 | | | 9,727 | |
| | | Other | | | (1,431 | ) | | (467 | ) | | (464 | ) |
| | |
| |
| |
| |
| | | $ | 137,334 | | $ | 134,003 | | $ | 118,372 | |
| | |
| |
| |
| |
The components of deferred income taxes included on the balance sheets are as follows:
| | 2002
| | 2001
| |
|---|
| Deferred tax assets: | | | | | | | |
| | Employee benefits | | $ | 4,411 | | $ | 4,177 | |
| | Allowance for bad debts | | | 3,180 | | | 2,519 | |
| | Inventory obsolescence | | | 10,757 | | | 10,064 | |
| | Insurance and contingencies | | | 8,476 | | | 7,397 | |
| | Other | | | 10,727 | | | 4,214 | |
| | |
| |
| |
| | | | 37,551 | | | 28,371 | |
Deferred tax liabilities: |
|
|
|
|
|
|
|
| | In service inventory | | | 96,843 | | | 84,579 | |
| | Property | | | 53,362 | | | 50,078 | |
| | Intangibles | | | 21,973 | | | (6,123 | ) |
| | Other | | | 6,336 | | | 6,606 | |
| | |
| |
| |
| | | | 178,514 | | | 135,140 | |
| | |
| |
| |
| Net deferred tax liability | | $ | 140,963 | | $ | 106,769 | |
| | |
| |
| |
Income taxes paid were $120,553, $112,307 and $85,509 for the years ended May 31, 2002, 2001 and 2000, respectively.
U.S. income taxes of $1,750, net of foreign tax credits, have not been provided for on a cumulative total of approximately $28,500 of undistributed earnings for certain non-U.S. subsidiaries as of May 31, 2002. Cintas intends to reinvest these earnings indefinitely in operations outside the United States.
11
8. ACQUISITIONS
In June 2001, the Financial Accounting Standards Board issued Statement of Financial Accounting Standards No. 141 (SFAS 141),Business Combinations, which eliminates the pooling of interests method of accounting for all business combinations initiated after June 30, 2001, and addresses the initial recognition and measurement of goodwill and other intangible assets acquired in a business combination. Cintas adopted this accounting standard for business combinations initiated after June 30, 2001.
During the years ended May 31, 2002, 2001 and 2000, Cintas completed numerous acquisitions, one of which was significant. On May 13, 2002, Cintas acquired 100% of Omni Services, Inc. (Omni) from Filuxel S.A. for a price of $660,000 (less a $3,000 adjustment for environmental issues and $929 in assumed debt). Certain Omni locations and all corporate functions will be integrated into existing Cintas operations, allowing Cintas to service the Omni customer base more cost effectively. This additional customer base will also allow for additional cross-selling opportunities among other Cintas products. Omni's operating results for the period from May 13, 2002 through May 31, 2002 have been included in Cintas' consolidated results.
The total cash paid to acquire Omni was $656,071. Per the terms of the agreement, this price will be adjusted slightly for changes in working capital as reflected in the final closing balance sheet. Following is the preliminary purchase price allocation for the Omni acquisition:
| | Preliminary Purchase Price Allocation
|
|---|
| Assets: | | | |
| Current assets | | $ | 58,923 |
| Property and equipment | | | 62,529 |
| Goodwill | | | 501,534 |
| Other assets | | | 103,961 |
| | |
|
| | | $ | 726,947 |
| | |
|
| Liabilities: | | | |
| Current liabilities | | $ | 51,822 |
| Deferred taxes | | | 18,737 |
| Long-term debt due after one year | | | 317 |
| | |
|
| | | $ | 70,876 |
| | |
|
| Total purchase price | | $ | 656,071 |
| | |
|
At the time of acquisition, management approved a plan to integrate certain Omni facilities into existing Cintas operations. Included in the purchase price allocation is a restructuring charge of approximately $36 million, which includes approximately $6 million in severance-related costs for corporate and field employees and $30 million in asset write-downs and lease cancellation costs. Cintas expects to incur these costs within the first year of acquisition.
The pro forma information presented below assumes that Omni had been acquired at the beginning of fiscal 2001 and includes the effect of intangible amortization and the impact on interest expense due to the significant change in Cintas' capital structure. This is presented for informational purposes only, and is not necessarily indicative of the financial position or financial results which may be attained in the future, including synergies that may be achieved.
| | 2002
| | 2001
|
|---|
| Net revenues | | $ | 2,575,331 | | $ | 2,489,786 |
| Net income | | $ | 237,966 | | $ | 226,009 |
| Basic earnings per share | | $ | 1.40 | | $ | 1.34 |
| Diluted earnings per share | | $ | 1.38 | | $ | 1.32 |
For all acquisitions accounted for as purchases, including insignificant acquisitions (33 businesses), the purchase price paid for each has been allocated to the fair value of the assets acquired and liabilities assumed. The following summarizes the aggregate purchase price for all businesses acquired, with the exception of Omni, which have been accounted for as purchases:
12
| | 2002
| | 2001
|
|---|
| Fair value of assets acquired | | $ | 92,627 | | $ | 32,286 |
| Liabilities assumed and incurred | | | 8,630 | | | 2,379 |
| | |
| |
|
| Total cash paid for acquisitions | | $ | 83,997 | | $ | 29,907 |
| | |
| |
|
The results of operations for the acquired businesses are included in the consolidated statements of income from the dates of acquisition. The pro forma revenue, net income and earnings per share information relating to acquired businesses, with the exception of Omni, are not presented because they are not significant.
9. DEFINED CONTRIBUTION PLANS
Cintas' Partners' Plan is a non-contributory profit sharing plan and ESOP for the benefit of substantially all U.S. Cintas employees who have completed one year of service. The plan also includes a 401(k) savings feature covering substantially all employees. The amount of contributions to the profit sharing plan and ESOP, as well as the matching contribution to the 401(k), are made at the discretion of Cintas. Total contributions, including Cintas' matching contributions, were $19,283, $18,385 and $15,600 for the years ended May 31, 2002, 2001 and 2000, respectively.
Cintas also has a non-contributory deferred profit sharing plan (DPSP), which covers substantially all Canadian employees. In addition, a registered retirement savings plan (RRSP) is offered to those employees. The amount of contributions to the DPSP, as well as the matching contribution to the RRSP, are made at the discretion of Cintas. Total contributions were $786, $577 and $480 for the years ended May 31, 2002, 2001 and 2000, respectively.
As a result of previous mergers and acquisitions, Cintas also sponsored contributory thrift plans covering certain salaried and clerical employees and certain employees subject to collective bargaining agreements. Under the provisions of these thrift plans, employees are permitted to contribute a maximum of 6% of their earnings and Cintas makes matching contributions of 25% to 50%. Employees may make additional unmatched contributions to these plans of up to 9% of their earnings. Cintas' contributions to these thrift plans were $0, $355 and $596 for the years ended May 31, 2002, 2001 and 2000, respectively.
10. EARNINGS PER SHARE
Earnings per share are computed in accordance with Statement of Financial Accounting Standards No. 128,Earnings per Share. The basic computations are computed based on the weighted average number of common shares outstanding during each period. The diluted computations reflect the potential dilution that could occur if stock options were exercised into common stock, under certain circumstances, that then would share in the earnings of Cintas.
The following table represents a reconciliation of the shares used to calculate basic and diluted earnings per share for the respective years:
| | 2002
| | 2001
| | 2000
|
|---|
| Numerator: | | | | | | | | | |
| | Net income | | $ | 234,251 | | $ | 222,451 | | $ | 193,387 |
| | |
| |
| |
|
| Denominator: | | | | | | | | | |
| | Denominator for basic earnings per share—
weighted average shares (000's) | | | 169,713 | | | 168,779 | | | 167,067 |
| | Effect of dilutive securities—
employee stock options (000's) | | | 2,531 | | | 2,850 | | | 2,920 |
| | |
| |
| |
|
| | Denominator for diluted earnings per share—
adjusted weighted average shares and assumed conversions (000's) | | | 172,244 | | | 171,629 | | | 169,987 |
| | |
| |
| |
|
| Basic earnings per share | | $ | 1.38 | | $ | 1.32 | | $ | 1.16 |
| | |
| |
| |
|
| Diluted earnings per share | | $ | 1.36 | | $ | 1.30 | | $ | 1.14 |
| | |
| |
| |
|
On January 18, 2000, the Board of Directors approved a three-for-two common stock split effective March 7, 2000. All share and per share information have been adjusted to retroactively reflect the effect of this stock split for all periods presented.
13
11. STOCK BASED COMPENSATION
Under the stock option plan adopted by Cintas in fiscal 2000, Cintas may grant officers and key employees incentive stock options and/or non-qualified stock options to purchase an aggregate of 9,000,000 shares of Cintas' common stock. Options are granted at the fair market value of the underlying common stock on the date of grant and generally vest and become exercisable at the rate of 20% per year commencing five years after grant, so long as the holder remains an employee of Cintas.
As part of the Unitog acquisition in March 1999, Cintas retained a non-qualified stock option plan for certain Unitog employees. The exercise price of the options granted under this plan is the fair market value at date of grant and the options vest ratably over four years and expire ten years after the date of grant. Certain provisions of the plan required immediate vesting and a cash settlement, as opposed to the issuance of common stock, upon termination of the option holders' employment prior to March 24, 2000.
The information presented in the following table relates primarily to stock options granted and outstanding under either the plan adopted in fiscal 2000 or under similar plans:
| | Shares
| | Weighted Average
Exercise Price
|
|---|
| Outstanding May 31, 1999 (623,280 shares exercisable) | | 5,921,177 | | $ | 17.46 |
| | Granted | | 760,825 | | | 41.39 |
| | Cancelled | | (249,575 | ) | | 25.72 |
| | Exercised | | (493,736 | ) | | 10.71 |
| | |
| |
|
| Outstanding May 31, 2000 (671,391 shares exercisable) | | 5,938,691 | | | 20.74 |
| | Granted | | 691,500 | | | 42.88 |
| | Cancelled | | (241,175 | ) | | 30.87 |
| | Exercised | | (662,823 | ) | | 11.03 |
| | |
| |
|
| Outstanding May 31, 2001 (555,544 shares exercisable) | | 5,726,193 | | | 24.11 |
| | Granted | | 823,750 | | | 47.32 |
| | Cancelled | | (171,600 | ) | | 30.64 |
| | Exercised | | (517,246 | ) | | 11.93 |
| | |
| |
|
| Outstanding May 31, 2002 (674,595 shares exercisable) | | 5,861,097 | | $ | 28.31 |
| | |
| |
|
The following table summarizes the information related to stock options outstanding at May 31, 2002:
| |
| | Outstanding Options
| | Exercisable Options
|
|---|
Range of
Exercise Prices
| | Number
Outstanding
| | Average
Remaining
Option
Life
| | Weighted
Average
Exercise
Price
| | Number
Exercisable
| | Weighted
Average
Exercise
Price
|
|---|
| $ | 8.42—$16.83 | | 1,888,729 | | 2.98 | | $ | 13.24 | | 573,469 | | $ | 11.58 |
| | 17.25— 23.54 | | 1,258,225 | | 5.09 | | | 22.90 | | 63,595 | | | 18.36 |
| | 24.38— 41.96 | | 1,236,993 | | 6.70 | | | 36.32 | | 35,968 | | | 28.98 |
| | 42.19— 53.19 | | 1,477,150 | | 8.72 | | | 45.46 | | 1,563 | | | 42.24 |
| | | |
| |
| |
| |
| |
|
| $ | 8.42—$53.19 | | 5,861,097 | | 5.67 | | $ | 28.31 | | 674,595 | | $ | 13.22 |
| | | |
| |
| |
| |
| |
|
At May 31, 2002, 7,528,050 shares of common stock are reserved for future issuance under the 2000 plan.
14
Pro forma information regarding earnings and earnings per share is required by SFAS 123 and has been determined as if Cintas had accounted for its stock options granted subsequent to May 31, 1995, under the fair value method of SFAS 123. The weighted average fair value of stock options granted during fiscal 2002, 2001 and 2000 was $22.65, $21.40 and $21.29, respectively. The fair value of these options was estimated at the date of grant using a Black-Scholes option-pricing model with the following weighted-average assumptions:
| | 2002
| | 2001
| | 2000
| |
|---|
| Risk free interest rate | | 4.75 | % | 5.50 | % | 6.25 | % |
| Dividend yield | | .50 | % | .50 | % | .50 | % |
| Expected volatility of Cintas' common stock | | 34 | % | 34 | % | 32 | % |
| Expected life of the option in years | | 9 | | 9 | | 9 | |
The Black-Scholes option-pricing model was developed for use in estimating the fair value of traded options which have no vesting restrictions and are freely transferable. In addition, option valuation models require the input of highly subjective assumptions including the expected stock price volatility. Because Cintas' options have characteristics significantly different from those of traded options and because changes in the subjective input assumptions can materially affect the fair value estimate, in Cintas' opinion existing models do not necessarily provide a reliable single measure of the fair value of its stock options.
For purposes of pro forma disclosure, the estimated fair value of the options is amortized to expense over the options' vesting period. Cintas' pro forma information is as follows:
| | 2002
| | 2001
| | 2000
|
|---|
| Net income: | | | | | | | | | |
| | As reported | | $ | 234,251 | | $ | 222,451 | | $ | 193,387 |
| | Pro forma for SFAS 123 | | $ | 229,466 | | $ | 218,665 | | $ | 190,386 |
Earnings per share: |
|
|
|
|
|
|
|
|
|
| | Pro forma basic earnings per share for SFAS 123 | | $ | 1.35 | | $ | 1.30 | | $ | 1.14 |
| | Pro forma diluted earnings per share for SFAS 123 | | $ | 1.33 | | $ | 1.27 | | $ | 1.12 |
The effects of providing pro forma disclosure are not representative of earnings to be reported for future years.
12. LITIGATION AND ENVIRONMENTAL MATTERS
Cintas is subject to legal proceedings and claims arising from the ordinary course of its business, including personal injury, customer contract and employment claims. In the opinion of management, the aggregate liability, if any, with respect to such actions will not have a material adverse effect on the financial position or results of operations of Cintas.
In acquiring Unitog in March 1999, Cintas became a potentially responsible party, and thus faces the possibility of joint and several liability under the Comprehensive Environmental Response, Compensation and Liability Act (CERCLA) in connection with alleged environmental contamination in an area near a rental facility in Tempe, Arizona. This facility, located near the South Indian Bend Wash (SIBW) Federal Superfund site, has been tested for soil and groundwater contamination. Soil testing at Cintas' facility detected volatile organic compounds, and Cintas promptly took steps to remediate the contamination. Groundwater testing in the area of Cintas' property has detected a very low level of volatile organic compound contamination. The United States Environmental Protection Agency (EPA) in March 1999 issued a Record of Decision to the effect that groundwater contamination in the vicinity of Cintas' plant does not warrant remediation at this time. Instead, the low levels of groundwater contamination near Cintas' facility will be monitored and allowed to attenuate naturally. The Record of Decision requires active groundwater remediation in other parts of the SIBW site, which are believed to be unrelated to Cintas. According to the Record of Decision, the EPA estimates that the 30 year net present value of costs to be incurred to remediate and monitor groundwater contamination at the SIBW site is $22,000. It is possible that the EPA will attempt to recover from the potentially responsible parties the costs it has incurred to date with respect to the SIBW site as well as the costs it expects to incur going forward. To date, no specific claim has been asserted against Cintas. Thus it is not possible at this time to estimate Cintas' loss exposure, if any, with respect to this matter.
15
As part of the Agreement and Plan of Merger dated January 9, 1999 between Unitog and Cintas, Cintas performed environmental testing at nine previously untested Unitog laundry facilities. The testing resulted in the discovery of soil and groundwater contamination at certain of these sites. As a result of all of the environmental matters noted above, Cintas recorded a charge to operating expense of $5,000 during the third quarter of fiscal 1999 to reflect its current estimate of the additional costs to be incurred relative to these sites. At May 31, 2002, Cintas has an undiscounted liability of $3,970 for these environmental matters.
As part of the acquisition of Omni, Cintas performed environmental testing at ten previously untested Omni laundry facilities. The testing resulted in the discovery of soil and groundwater contamination at certain of these sites. Cintas estimated that remedial action would cost approximately $9 million to clean up these sites, which Cintas has accrued as a liability as of the date of the acquisition of Omni. Under its agreement to acquire Omni, Cintas has agreed to pay for any remedial action, up to the first $5 million, and the parties agreed that remedial costs of $3 million would be treated as a purchase price adjustment and credited to Cintas.
Cintas is party to additional litigation, none of which is expected to have a material impact on operating results. This litigation includes lawsuits challenging the legality of certain ancillary charges on invoices. The estimated liability, if any, relating to these lawsuits has not been determined, but is not expected to have a material adverse effect on results. In addition, a class action suit was filed in the State of California alleging that Cintas violated the California overtime pay laws applicable to its service sales representatives, which Cintas believed to be exempt employees. Management of Cintas has established estimated accruals to the extent that liabilities exist for such matters and believes that any liability in excess of amounts accrued will not have a material impact on the financial statements.
13. SEGMENT INFORMATION
Cintas classifies its businesses into two operating segments: Rentals and Other Services. The Rentals operating segment designs and manufactures corporate identity uniforms which it rents, along with other items, to its customers. The Other Services operating segment involves the design, manufacture and direct sale of uniforms to its customers, as well as the sale of ancillary services including sanitation supplies, first aid products and services and cleanroom supplies. All of these services are provided throughout the United States and Canada to businesses of all types—from small service and manufacturing companies to major corporations that employ thousands of people.
Information as to the operations of Cintas' different business segments is set forth below based on the distribution of products and services offered. Cintas evaluates performance based on several factors of which the primary financial measures are business segment revenue and income before income taxes. The accounting policies of the business segments are the same as those described in the Significant Accounting Policies (Note 1).
May 31, 2002
| | Rentals
| | Other
Services
| | Corporate
| | Total
| |
|---|
| Revenue | | $ | 1,753,368 | | $ | 517,684 | | $ | — | | $ | 2,271,052 | |
| | |
| |
| |
| |
| |
| Gross margin | | $ | 800,016 | | $ | 157,354 | | $ | — | | $ | 957,370 | |
| Selling and administrative expenses | | | 450,276 | | | 129,132 | | | 1,061 | | | 580,469 | |
| Interest income | | | — | | | — | | | (5,636 | ) | | (5,636 | ) |
| Interest expense | | | — | | | — | | | 10,952 | | | 10,952 | |
| | |
| |
| |
| |
| |
| Income before income taxes | | $ | 349,740 | | $ | 28,222 | | $ | (6,377 | ) | $ | 371,585 | |
| | |
| |
| |
| |
| |
| Depreciation and amortization | | $ | 103,586 | | $ | 16,439 | | $ | — | | $ | 120,025 | |
| | |
| |
| |
| |
| |
| Capital expenditures | | $ | 98,938 | | $ | 8,346 | | $ | — | | $ | 107,284 | |
| | |
| |
| |
| |
| |
| Total assets | | $ | 2,144,544 | | $ | 289,604 | | $ | 85,086 | | $ | 2,519,234 | |
| | |
| |
| |
| |
| |
16
May 31, 2001
| | Rentals
| | Other
Services
| | Corporate
| | Total
| |
|---|
| Revenue | | $ | 1,610,606 | | $ | 550,094 | | $ | — | | $ | 2,160,700 | |
| | |
| |
| |
| |
| |
| Gross margin | | $ | 714,067 | | $ | 182,200 | | $ | — | | $ | 896,267 | |
| Selling and administrative expenses | | | 390,992 | | | 137,362 | | | 709 | | | 529,063 | |
| Interest income | | | — | | | — | | | (4,369 | ) | | (4,369 | ) |
| Interest expense | | | — | | | — | | | 15,119 | | | 15,119 | |
| | |
| |
| |
| |
| |
| Income before income taxes | | $ | 323,075 | | $ | 44,838 | | $ | (11,459 | ) | $ | 356,454 | |
| | |
| |
| |
| |
| |
| Depreciation and amortization | | $ | 95,957 | | $ | 16,132 | | $ | — | | $ | 112,089 | |
| | |
| |
| |
| |
| |
| Capital expenditures | | $ | 133,786 | | $ | 13,658 | | $ | — | | $ | 147,444 | |
| | |
| |
| |
| |
| |
| Total assets | | $ | 1,362,298 | | $ | 279,697 | | $ | 110,229 | | $ | 1,752,224 | |
| | |
| |
| |
| |
| |
May 31, 2000
| | Rentals
| | Other
Services
| | Corporate
| | Total
| |
|---|
| Revenue | | $ | 1,424,892 | | $ | 477,099 | | $ | — | | $ | 1,901,991 | |
| | |
| |
| |
| |
| |
| Gross margin | | $ | 617,591 | | $ | 161,961 | | $ | — | | $ | 779,552 | |
| Selling and administrative expenses | | | 338,887 | | | 116,907 | | | 834 | | | 456,628 | |
| Interest income | | | — | | | — | | | (4,742 | ) | | (4,742 | ) |
| Interest expense | | | — | | | — | | | 15,907 | | | 15,907 | |
| | |
| |
| |
| |
| |
| Income before income taxes | | $ | 278,704 | | $ | 45,054 | | $ | (11,999 | ) | $ | 311,759 | |
| | |
| |
| |
| |
| |
| Depreciation and amortization | | $ | 86,270 | | $ | 13,243 | | $ | — | | $ | 99,513 | |
| | |
| |
| |
| |
| |
| Capital expenditures | | $ | 129,838 | | $ | 31,594 | | $ | — | | $ | 161,432 | |
| | |
| |
| |
| |
| |
| Total assets | | $ | 1,214,318 | | $ | 257,202 | | $ | 109,822 | | $ | 1,581,342 | |
| | |
| |
| |
| |
| |
14. QUARTERLY FINANCIAL DATA (UNAUDITED)
The following is a summary of the results of operations for each of the quarters within the years ended May 31, 2002 and 2001:
May 31, 2002
| | First
Quarter
| | Second
Quarter
| | Third
Quarter
| | Fourth
Quarter
|
|---|
| Revenue | | $ | 564,600 | | $ | 557,148 | | $ | 545,491 | | $ | 603,813 |
| Gross margin | | $ | 237,277 | | $ | 235,198 | | $ | 229,340 | | $ | 255,555 |
| Net income | | $ | 56,540 | | $ | 57,985 | | $ | 55,584 | | $ | 64,142 |
| Basic earnings per share | | $ | .33 | | $ | .34 | | $ | .33 | | $ | .38 |
| Diluted earnings per share | | $ | .33 | | $ | .34 | | $ | .32 | | $ | .37 |
| Weighted average number of shares outstanding (000's) | | | 169,528 | | | 169,726 | | | 169,786 | | | 169,876 |
May 31, 2001
| | First
Quarter
| | Second
Quarter
| | Third
Quarter
| | Fourth
Quarter
|
|---|
| Revenue | | $ | 521,959 | | $ | 539,052 | | $ | 536,723 | | $ | 562,966 |
| Gross margin | | $ | 217,265 | | $ | 223,377 | | $ | 219,916 | | $ | 235,709 |
| Net income | | $ | 50,849 | | $ | 56,533 | | $ | 54,910 | | $ | 60,159 |
| Basic earnings per share | | $ | .30 | | $ | .34 | | $ | .32 | | $ | .36 |
| Diluted earnings per share | | $ | .30 | | $ | .33 | | $ | .32 | | $ | .35 |
| Weighted average number of shares outstanding (000's) | | | 168,366 | | | 168,660 | | | 168,890 | | | 169,206 |
17
15. SUPPLEMENTAL GUARANTOR INFORMATION
On May 13, 2002, Cintas completed the acquisition of Omni for approximately $656,000. For the twelve months ended January 31, 2002, Omni had total revenue of approximately $300,000. The purchase price for Omni was funded with $450,000 in long-term notes, $100,000 of borrowings under a commercial paper program and approximately $106,000 in cash. The $450,000 in long-term notes consist of $225,000 with five-year maturities at an interest rate of 51/8% and $225,000 with ten-year maturities at an interest rate of 6%.
Effective June 1, 2000, Cintas reorganized its legal structure and created Cintas Corporation No. 2 (Corp. 2) as its indirectly, wholly-owned principal operating subsidiary. Cintas and its wholly-owned, direct and indirect domestic subsidiaries, other than Corp. 2, will unconditionally guarantee, jointly and severally, debt of Corp. 2. As allowed by SEC rules, the following condensed consolidating financial statements are provided as an alternative to filing separate financial statements of the guarantors. Each of the subsidiaries presented in the condensed consolidating financial statements has been fully consolidated in Cintas' financial statements. The condensed consolidating financial statements should be read in conjunction with the financial statements of Cintas and notes thereto of which this note is an integral part.
Condensed consolidating financial statements for Cintas, Corp. 2, the subsidiary guarantors and non-guarantors are presented below:
CONDENSED CONSOLIDATING INCOME STATEMENT
Year Ended May 31, 2002
| | Cintas
Corporation
| | Corp. 2
| | Subsidiary
Guarantors
| | Non -
Guarantors
| | Eliminations
| | Cintas
Corporation
Consolidated
| |
|---|
| Revenue: | | | | | | | | | | | | | | | | | | | |
| | Rentals | | $ | — | | $ | 1,289,261 | | $ | 382,184 | | $ | 82,096 | | $ | (173 | ) | $ | 1,753,368 | |
| | Other services | | | — | | | 896,807 | | | 181,217 | | | 22,434 | | | (582,774 | ) | | 517,684 | |
| | Equity in net income of affiliates | | | 234,251 | | | — | | | — | | | — | | | (234,251 | ) | | — | |
| | |
| |
| |
| |
| |
| |
| |
| | | | 234,251 | | | 2,186,068 | | | 563,401 | | | 104,530 | | | (817,198 | ) | | 2,271,052 | |
| Costs and expenses (income): | | | | | | | | | | | | | | | | | | | |
| | Cost of rentals | | | — | | | 789,092 | | | 226,452 | | | 48,024 | | | (110,216 | ) | | 953,352 | |
| | Cost of other services | | | — | | | 680,366 | | | 129,561 | | | 16,919 | | | (466,516 | ) | | 360,330 | |
| | Selling and administrative expenses | | | — | | | 596,112 | | | (38,864 | ) | | 27,034 | | | (3,813 | ) | | 580,469 | |
| | Interest income | | | — | | | (5,042 | ) | | (385 | ) | | (209 | ) | | — | | | (5,636 | ) |
| | Interest expense | | | — | | | 48,616 | | | (37,617 | ) | | (47 | ) | | — | | | 10,952 | |
| | |
| |
| |
| |
| |
| |
| |
| | | | — | | | 2,109,144 | | | 279,147 | | | 91,721 | | | (580,545 | ) | | 1,899,467 | |
| Income before income taxes | | | 234,251 | | | 76,924 | | | 284,254 | | | 12,809 | | | (236,653 | ) | | 371,585 | |
| Income taxes | | | — | | | 12,319 | | | 120,452 | | | 4,563 | | | — | | | 137,334 | |
| | |
| |
| |
| |
| |
| |
| |
| Net income | | $ | 234,251 | | $ | 64,605 | | $ | 163,802 | | $ | 8,246 | | $ | (236,653 | ) | $ | 234,251 | |
| | |
| |
| |
| |
| |
| |
| |
18
CONDENSED CONSOLIDATING INCOME STATEMENT
Year Ended May 31, 2001
| | Cintas
Corporation
| | Corp. 2
| | Subsidiary
Guarantors
| | Non -
Guarantors
| | Eliminations
| | Cintas
Corporation
Consolidated
| |
|---|
| Revenue: | | | | | | | | | | | | | | | | | | | |
| | Rentals | | $ | — | | $ | 1,188,257 | | $ | 356,184 | | $ | 66,308 | | $ | (143 | ) | $ | 1,610,606 | |
| | Other services | | | — | | | 961,260 | | | 172,736 | | | 8,997 | | | (592,899 | ) | | 550,094 | |
| | Equity in net income of affiliates | | | 222,451 | | | — | | | — | | | — | | | (222,451 | ) | | — | |
| | |
| |
| |
| |
| |
| |
| |
| | | | 222,451 | | | 2,149,517 | | | 528,920 | | | 75,305 | | | (815,493 | ) | | 2,160,700 | |
| Costs and expenses (income): | | | | | | | | | | | | | | | | | | | |
| | Cost of rentals | | | — | | | 751,096 | | | 217,907 | | | 40,288 | | | (112,752 | ) | | 896,539 | |
| | Cost of other services | | | — | | | 718,262 | | | 120,694 | | | 5,693 | | | (476,755 | ) | | 367,894 | |
| | Selling and administrative expenses | | | — | | | 588,237 | | | (71,151 | ) | | 20,469 | | | (8,492 | ) | | 529,063 | |
| | Interest income | | | — | | | (3,619 | ) | | (2,585 | ) | | (337 | ) | | 2,172 | | | (4,369 | ) |
| | Interest expense | | | — | | | 15,211 | | | (505 | ) | | 413 | | | — | | | 15,119 | |
| | |
| |
| |
| |
| |
| |
| |
| | | | — | | | 2,069,187 | | | 264,360 | | | 66,526 | | | (595,827 | ) | | 1,804,246 | |
| Income before income taxes | | | 222,451 | | | 80,330 | | | 264,560 | | | 8,779 | | | (219,666 | ) | | 356,454 | |
| Income taxes | | | — | | | 30,760 | | | 100,532 | | | 2,711 | | | — | | | 134,003 | |
| | |
| |
| |
| |
| |
| |
| |
| Net income | | $ | 222,451 | | $ | 49,570 | | $ | 164,028 | | $ | 6,068 | | $ | (219,666 | ) | $ | 222,451 | |
| | |
| |
| |
| |
| |
| |
| |
CONDENSED CONSOLIDATING INCOME STATEMENT
Year Ended May 31, 2000
| | Cintas
Corporation
| | Corp. 2
| | Subsidiary
Guarantors
| | Non -
Guarantors
| | Eliminations
| | Cintas
Corporation
Consolidated
| |
|---|
| Revenue: | | | | | | | | | | | | | | | | | | | |
| | Rentals | | $ | — | | $ | — | | $ | 1,366,660 | | $ | 58,261 | | $ | (29 | ) | $ | 1,424,892 | |
| Other services | | | — | | | — | | | 986,699 | | | 4,387 | | | (513,987 | ) | | 477,099 | |
| | Equity in net income of affiliates | | | 193,387 | | | — | | | — | | | — | | | (193,387 | ) | | — | |
| | |
| |
| |
| |
| |
| |
| |
| | | | 193,387 | | | — | | | 2,353,359 | | | 62,648 | | | (707,403 | ) | | 1,901,991 | |
| Costs and expenses (income): | | | | | | | | | | | | | | | | | | | |
| | Cost of rentals | | | — | | | — | | | 869,879 | | | 36,453 | | | (99,031 | ) | | 807,301 | |
| | Cost of other services | | | — | | | — | | | 717,390 | | | 2,047 | | | (404,299 | ) | | 315,138 | |
| | Selling and administrative expenses | | | — | | | — | | | 443,657 | | | 22,883 | | | (9,912 | ) | | 456,628 | |
| | Interest income | | | — | | | — | | | (6,689 | ) | | (283 | ) | | 2,230 | | | (4,742 | ) |
| | Interest expense | | | — | | | — | | | 15,032 | | | 876 | | | (1 | ) | | 15,907 | |
| | |
| |
| |
| |
| |
| |
| |
| | | | — | | | — | | | 2,039,269 | | | 61,976 | | | (511,013 | ) | | 1,590,232 | |
| Income before income taxes | | | 193,387 | | | — | | | 314,090 | | | 672 | | | (196,390 | ) | | 311,759 | |
| Income taxes | | | — | | | — | | | 116,007 | | | 2,365 | | | — | | | 118,372 | |
| | |
| |
| |
| |
| |
| |
| |
| Net income | | $ | 193,387 | | $ | — | | $ | 198,083 | | $ | (1,693 | ) | $ | (196,390 | ) | $ | 193,387 | |
| | |
| |
| |
| |
| |
| |
| |
19
CONDENSED CONSOLIDATING BALANCE SHEET
Year Ended May 31, 2002
| | Cintas
Corporation
| | Corp. 2
| | Subsidiary
Guarantors
| | Non -
Guarantors
| | Eliminations
| | Cintas
Corporation
Consolidated
|
|---|
| Assets | | | | | | | | | | | | | | | | | | |
| Current assets: | | | | | | | | | | | | | | | | | | |
| | Cash and cash equivalents | | $ | — | | $ | 22,440 | | $ | 5,011 | | $ | 13,177 | | $ | — | | $ | 40,628 |
| | Marketable securities | | | — | | | 42,472 | | | — | | | 1,986 | | | — | | | 44,458 |
| | Accounts receivable, net | | | — | | | 225,364 | | | 70,720 | | | 782 | | | (13,632 | ) | | 283,234 |
| | Inventories | | | — | | | 182,858 | | | 14,899 | | | 5,539 | | | (9,475 | ) | | 193,821 |
| | Uniforms and other rental items in service | | | — | | | 210,409 | | | 71,251 | | | 13,101 | | | (13,825 | ) | | 280,936 |
| | Prepaid expenses | | | — | | | 7,421 | | | 1,995 | | | 760 | | | (3 | ) | | 10,173 |
| | |
| |
| |
| |
| |
| |
|
| Total current assets | | | — | | | 690,964 | | | 163,876 | | | 35,345 | | | (36,935 | ) | | 853,250 |
| Property and equipment, at cost, net | | | — | | | 637,882 | | | 108,258 | | | 32,262 | | | — | | | 778,402 |
| Goodwill | | | — | | | 104,140 | | | 566,748 | | | 7,710 | | | — | | | 678,598 |
| Other assets | | | 966,397 | | | 55,571 | | | 905,353 | | | 106,180 | | | (1,824,517 | ) | | 208,984 |
| | |
| |
| |
| |
| |
| |
|
| | | $ | 966,397 | | $ | 1,488,557 | | $ | 1,744,235 | | $ | 181,497 | | $ | (1,861,452 | ) | $ | 2,519,234 |
| | |
| |
| |
| |
| |
| |
|
| Liabilities and Shareholders' Equity | | | | | | | | | | | | | | | | | | |
| Current liabilities: | | | | | | | | | | | | | | | | | | |
| | Accounts payable | | $ | (465,247 | ) | $ | (58,727 | ) | $ | 531,544 | | $ | 14,842 | | $ | 37,981 | | $ | 60,393 |
| | Accrued compensation and related liabilities | | | — | | | 23,441 | | | 4,508 | | | 1,055 | | | — | | | 29,004 |
| | Accrued liabilities | | | — | | | 137,236 | | | 476 | | | 6,820 | | | (1,036 | ) | | 143,496 |
| | Deferred income taxes | | | — | | | 1,737 | | | 58,020 | | | 1,615 | | | — | | | 61,372 |
| | Long-term debt due within one year | | | — | | | 16,315 | | | 2,126 | | | 117 | | | (189 | ) | | 18,369 |
| | |
| |
| |
| |
| |
| |
|
| Total current liabilities | | | (465,247 | ) | | 120,002 | | | 596,674 | | | 24,449 | | | 36,756 | | | 312,634 |
| Long-term debt due after one year | | | — | | | 710,728 | | | (23,499 | ) | | 48,111 | | | (32,090 | ) | | 703,250 |
| Deferred income taxes | | | — | | | 7,251 | | | 70,239 | | | 2,101 | | | — | | | 79,591 |
| Total shareholders' equity | | | 1,431,644 | | | 650,576 | | | 1,100,821 | | | 106,836 | | | (1,866,118 | ) | | 1,423,759 |
| | |
| |
| |
| |
| |
| |
|
| | | $ | 966,397 | | $ | 1,488,557 | | $ | 1,744,235 | | $ | 181,497 | | $ | (1,861,452 | ) | $ | 2,519,234 |
| | |
| |
| |
| |
| |
| |
|
20
CONDENSED CONSOLIDATING BALANCE SHEET
Year Ended May 31, 2001
| | Cintas
Corporation
| | Corp. 2
| | Subsidiary
Guarantors
| | Non -
Guarantors
| | Eliminations
| | Cintas
Corporation
Consolidated
|
|---|
| Assets | | | | | | | | | | | | | | | | | | |
| Current assets: | | | | | | | | | | | | | | | | | | |
| | Cash and cash equivalents | | $ | — | | $ | 57,629 | | $ | 8,792 | | $ | 7,303 | | $ | — | | $ | 73,724 |
| | Marketable securities | | | — | | | 35,055 | | | — | | | 1,450 | | | — | | | 36,505 |
| | Accounts receivable, net | | | — | | | 157,895 | | | 89,082 | | | 10,343 | | | (12,870 | ) | | 244,450 |
| | Inventories | | | — | | | 202,773 | | | 14,564 | | | 3,088 | | | (6,076 | ) | | 214,349 |
| | Uniforms and other rental items in service | | | — | | | 189,026 | | | 57,800 | | | 10,168 | | | (14,822 | ) | | 242,172 |
| | Prepaid expenses | | | — | | | 6,170 | | | 1,827 | | | 476 | | | (3 | ) | | 8,470 |
| | |
| |
| |
| |
| |
| |
|
| Total current assets | | | — | | | 648,548 | | | 172,065 | | | 32,828 | | | (33,771 | ) | | 819,670 |
| Property and equipment, at cost, net | | | — | | | 546,578 | | | 127,148 | | | 28,406 | | | — | | | 702,132 |
| Goodwill | | | — | | | 71,913 | | | 51,550 | | | 290 | | | — | | | 123,753 |
| Other assets | | | 1,427,562 | | | 245,980 | | | 713,033 | | | 39,492 | | | (2,319,398 | ) | | 106,669 |
| | |
| |
| |
| |
| |
| |
|
| | | $ | 1,427,562 | | $ | 1,513,019 | | $ | 1,063,796 | | $ | 101,016 | | $ | (2,353,169 | ) | $ | 1,752,224 |
| | |
| |
| |
| |
| |
| |
|
| Liabilities and Shareholders' Equity | | | | | | | | | | | | | | | | | | |
| Current liabilities: | | | | | | | | | | | | | | | | | | |
| | Accounts payable | | $ | 190,823 | | $ | 89,451 | | $ | (294,324 | ) | $ | 17,296 | | $ | 39,249 | | $ | 42,495 |
| | Accrued compensation and related liabilities | | | — | | | 27,055 | | | 6,907 | | | 1,178 | | | — | | | 35,140 |
| | Accrued liabilities | | | — | | | 129,144 | | | (35,578 | ) | | 2,694 | | | (1,300 | ) | | 94,960 |
| | Deferred income taxes | | | — | | | 50,748 | | | 5,350 | | | 1,605 | | | — | | | 57,703 |
| | Long-term debt due within one year | | | — | | | 17,328 | | | 3,450 | | | 1 | | | (174 | ) | | 20,605 |
| | |
| |
| |
| |
| |
| |
|
| Total current liabilities | | | 190,823 | | | 313,726 | | | (314,195 | ) | | 22,774 | | | 37,775 | | | 250,903 |
| Long-term debt due after one year | | | — | | | 227,231 | | | 5,733 | | | 20,286 | | | (32,310 | ) | | 220,940 |
| Deferred income taxes | | | — | | | 41,444 | | | 6,714 | | | 908 | | | — | | | 49,066 |
| Total shareholders' equity | | | 1,236,739 | | | 930,618 | | | 1,365,544 | | | 57,048 | | | (2,358,634 | ) | | 1,231,315 |
| | |
| |
| |
| |
| |
| |
|
| | | $ | 1,427,562 | | $ | 1,513,019 | | $ | 1,063,796 | | $ | 101,016 | | $ | (2,353,169 | ) | $ | 1,752,224 |
| | |
| |
| |
| |
| |
| |
|
21
CONDENSED CONSOLIDATING STATEMENT OF CASH FLOWS
Year Ended May 31, 2002
| | Cintas
Corporation
| | Corp. 2
| | Subsidiary
Guarantors
| | Non -
Guarantors
| | Eliminations
| | Cintas
Corporation
Consolidated
| |
|---|
| Cash flows from operating activities: | | | | | | | | | | | | | | | | | | | |
| Net income | | $ | 234,251 | | $ | 64,605 | | $ | 163,802 | | $ | 8,246 | | $ | (236,653 | ) | $ | 234,251 | |
| Adjustments to reconcile net income to net cash provided by (used in) operating activities: | | | | | | | | | | | | | | | | | | | |
| | Depreciation | | | — | | | 66,885 | | | 29,789 | | | 4,541 | | | — | | | 101,215 | |
| | Amortization of deferred charges | | | — | | | 10,795 | | | 6,267 | | | 1,748 | | | — | | | 18,810 | |
| | Deferred income taxes | | | — | | | (96,769 | ) | | 116,195 | | | 1,203 | | | — | | | 20,629 | |
| | Changes in current assets and liabilities, net of acquisitions of businesses: | | | | | | | | | | | | | | | | | | | |
| | | Accounts receivable | | | — | | | (28,735 | ) | | 18,906 | | | 12,229 | | | 762 | | | 3,162 | |
| | | Inventories | | | — | | | 30,105 | | | 59 | | | (1,832 | ) | | 3,399 | | | 31,731 | |
| | | Uniforms and other rental items in service | | | — | | | (10,463 | ) | | (13,189 | ) | | (2,608 | ) | | (997 | ) | | (27,257 | ) |
| | | Prepaid expenses | | | — | | | 1,730 | | | (167 | ) | | (233 | ) | | — | | | 1,330 | |
| | | Accounts payable | | | — | | | (160,208 | ) | | 169,662 | | | (4,841 | ) | | (1,268 | ) | | 3,345 | |
| | | Accrued compensation and related liabilities | | | — | | | (10,153 | ) | | (2,420 | ) | | (123 | ) | | — | | | (12,696 | ) |
| | | Accrued liabilities | | | — | | | (32,381 | ) | | 31,819 | | | 3,211 | | | 264 | | | 2,913 | |
| | |
| |
| |
| |
| |
| |
| |
| Net cash provided by (used in) operating activities | | | 234,251 | | | (164,589 | ) | | 520,723 | | | 21,541 | | | (234,493 | ) | | 377,433 | |
| Cash flows from investing activities: | | | | | | | | | | | | | | | | | | | |
| | Capital expenditures | | | — | | | (89,806 | ) | | (10,175 | ) | | (7,303 | ) | | — | | | (107,284 | ) |
| | Proceeds from sale or redemption of marketable securities | | | — | | | 152,128 | | | — | | | 5,291 | | | — | | | 157,419 | |
| | Purchase of marketable securities | | | — | | | (159,545 | ) | | — | | | (5,827 | ) | | — | | | (165,372 | ) |
| | Acquisitions of businesses, net of cash acquired | | | (656,070 | ) | | (49,071 | ) | | (14,059 | ) | | (13,027 | ) | | — | | | (732,227 | ) |
| | Proceeds from divestiture of certain facilities | | | — | | | — | | | — | | | — | | | — | | | — | |
| | Other | | | 213,445 | | | 42,842 | | | (469,714 | ) | | (22,743 | ) | | 234,288 | | | (1,882 | ) |
| | |
| |
| |
| |
| |
| |
| |
| Net cash (used in) provided by investing activities | | | (442,625 | ) | | (103,452 | ) | | (493,948 | ) | | (43,609 | ) | | 234,288 | | | (849,346 | ) |
| Cash flows from financing activities: | | | | | | | | | | | | | | | | | | | |
| | Proceeds from issuance of long-term debt | | | — | | | 639,383 | | | (27,112 | ) | | 27,974 | | | — | | | 640,245 | |
| | Repayment of long-term debt | | | — | | | (157,341 | ) | | (3,444 | ) | | (32 | ) | | 205 | | | (160,612 | ) |
| | Stock options exercised | | | 3,247 | | | — | | | — | | | — | | | — | | | 3,247 | |
| | Dividends paid | | | 203,714 | | | (246,168 | ) | | — | | | — | | | — | | | (42,454 | ) |
| | Other | | | 1,413 | | | (3,022 | ) | | — | | | — | | | — | | | (1,609 | ) |
| | |
| |
| |
| |
| |
| |
| |
| Net cash provided by (used in) financing activities | | | 208,374 | | | 232,852 | | | (30,556 | ) | | 27,942 | | | 205 | | | 438,817 | |
| | |
| |
| |
| |
| |
| |
| |
| Net (decrease) increase in cash and cash equivalents | | | — | | | (35,189 | ) | | (3,781 | ) | | 5,874 | | | — | | | (33,096 | ) |
| Cash and cash equivalents at beginning of period | | | — | | | 57,629 | | | 8,792 | | | 7,303 | | | — | | | 73,724 | |
| | |
| |
| |
| |
| |
| |
| |
| Cash and cash equivalents at end of period | | $ | — | | $ | 22,440 | | $ | 5,011 | | $ | 13,177 | | $ | — | | $ | 40,628 | |
| | |
| |
| |
| |
| |
| |
| |
22
CONDENSED CONSOLIDATING STATEMENT OF CASH FLOWS
Year Ended May 31, 2001
| | Cintas
Corporation
| | Corp. 2
| | Subsidiary
Guarantors
| | Non -
Guarantors
| | Eliminations
| | Cintas
Corporation
Consolidated
| |
|---|
| Cash flows from operating activities: | | | | | | | | | | | | | | | | | | | |
| Net income | | $ | 222,451 | | $ | 49,570 | | $ | 164,028 | | $ | 6,068 | | $ | (219,666 | ) | $ | 222,451 | |
| Adjustments to reconcile net income to net cash provided by (used in) operating activities: | | | | | | | | | | | | | | | | | | | |
| | Depreciation | | | — | | | 71,082 | | | 15,832 | | | 3,325 | | | — | | | 90,239 | |
| | Amortization of deferred charges | | | — | | | 12,528 | | | 3,152 | | | 6,170 | | | — | | | 21,850 | |
| | Deferred income taxes | | | — | | | 92,192 | | | (84,362 | ) | | 629 | | | — | | | 8,459 | |
| | Changes in current assets and liabilities, net of acquisitions of businesses: | | | | | | | | | | | | | | | | | | | |
| | | Accounts receivable | | | — | | | (156,917 | ) | | 150,343 | | | (7,246 | ) | | (2,666 | ) | | (16,486 | ) |
| | | Inventories | | | — | | | (202,704 | ) | | 156,790 | | | (2,601 | ) | | (178 | ) | | (48,693 | ) |
| | | Uniforms and other rental items in service | | | — | | | (189,095 | ) | | 165,792 | | | (390 | ) | | (4,778 | ) | | (28,471 | ) |
| | | Prepaid expenses | | | — | | | (6,173 | ) | | 5,055 | | | (42 | ) | | — | | | (1,160 | ) |
| | | Accounts payable | | | 409,903 | | | 88,845 | | | (539,607 | ) | | 15,783 | | | 14,969 | | | (10,107 | ) |
| | | Accrued compensation and related liabilities | | | — | | | 26,765 | | | (20,503 | ) | | 404 | | | — | | | 6,666 | |
| | | Accrued liabilities | | | — | | | 128,231 | | | (123,212 | ) | | (1,938 | ) | | (871 | ) | | 2,210 | |
| | |
| |
| |
| |
| |
| |
| |
| Net cash provided by (used in) operating activities | | | 632,354 | | | (85,676 | ) | | (106,692 | ) | | 20,162 | | | (213,190 | ) | | 246,958 | |
| Cash flows from investing activities: | | | | | | | | | | | | | | | | | | | |
| | Capital expenditures | | | — | | | (616,834 | ) | | 475,467 | | | (6,077 | ) | | — | | | (147,444 | ) |
| | Proceeds from sale or redemption of marketable securities | | | — | | | 59,021 | | | — | | | 2,588 | | | — | | | 61,609 | |
| | Purchase of marketable securities | | | — | | | (94,076 | ) | | 55,285 | | | (1,683 | ) | | — | | | (40,474 | ) |
| | Acquisitions of businesses, net of cash acquired | | | — | | | (18,709 | ) | | (11,348 | ) | | (478 | ) | | — | | | (30,535 | ) |
| | Proceeds from divestiture of certain facilities | | | — | | | 1,400 | | | — | | | — | | | — | | | 1,400 | |
| | Other | | | (601,751 | ) | | 608,550 | | | (236,609 | ) | | (231 | ) | | 224,076 | | | (5,965 | ) |
| | |
| |
| |
| |
| |
| |
| |
| Net cash (used in) provided by investing activities | | | (601,751 | ) | | (60,648 | ) | | 282,795 | | | (5,881 | ) | | 224,076 | | | (161,409 | ) |
| Cash flows from financing activities: | | | | | | | | | | | | | | | | | | | |
| | Proceeds from issuance of long-term debt | | | — | | | 257,982 | | | (247,032 | ) | | 786 | | | (11,506 | ) | | 230 | |
| | Repayment of long-term debt | | | — | | | (14,029 | ) | | (6,557 | ) | | (13,668 | ) | | 620 | | | (33,634 | ) |
| | Stock options exercised | | | 5,992 | | | — | | | — | | | — | | | — | | | 5,992 | |
| | Dividends paid | | | (37,173 | ) | | (40,000 | ) | | 40,000 | | | — | | | — | | | (37,173 | ) |
| | Other | | | 578 | | | — | | | — | | | — | | | — | | | 578 | |
| | |
| |
| |
| |
| |
| |
| |
| Net cash (used in) provided by financing activities | | | (30,603 | ) | | 203,953 | | | (213,589 | ) | | (12,882 | ) | | (10,886 | ) | | (64,007 | ) |
| | |
| |
| |
| |
| |
| |
| |
| Net increase (decrease) in cash and cash equivalents | | | — | | | 57,629 | | | (37,486 | ) | | 1,399 | | | — | | | 21,542 | |
| Cash and cash equivalents at beginning of period | | | — | | | — | | | 46,278 | | | 5,904 | | | — | | | 52,182 | |
| | |
| |
| |
| |
| |
| |
| |
| Cash and cash equivalents at end of period | | $ | — | | $ | 57,629 | | $ | 8,792 | | $ | 7,303 | | $ | — | | $ | 73,724 | |
| | |
| |
| |
| |
| |
| |
| |
23
CONDENSED CONSOLIDATING STATEMENT OF CASH FLOWS
Year Ended May 31, 2000
| | Cintas
Corporation
| | Corp. 2
| | Subsidiary
Guarantors
| | Non -
Guarantors
| | Eliminations
| | Cintas
Corporation
Consolidated
| |
|---|
| Cash flows from operating activities: | | | | | | | | | | | | | | | | | | | |
| Net income | | $ | 193,387 | | $ | — | | $ | 198,083 | | $ | (1,693 | ) | $ | (196,390 | ) | $ | 193,387 | |
| Adjustments to reconcile net income to net cash (used in) provided by operating activities: | | | | | | | | | | | | | | | | | | | |
| | Depreciation | | | — | | | — | | | 76,302 | | | 2,214 | | | — | | | 78,516 | |
| | Amortization of deferred charges | | | — | | | — | | | 13,031 | | | 7,966 | | | — | | | 20,997 | |
| | Deferred income taxes | | | — | | | — | | | 17,831 | | | (452 | ) | | — | | | 17,379 | |
| | Changes in current assets and liabilities, net of acquisitions of businesses: | | | | | | | | | | | | | | | | | | | |
| | | Accounts receivable | | | — | | | — | | | (25,172 | ) | | 5,188 | | | 725 | | | (19,259 | ) |
| | | Inventories | | | — | | | — | | | (25,436 | ) | | 3 | | | 2,457 | | | (22,976 | ) |
| | | Uniforms and other rental items in service | | | — | | | — | | | (13,325 | ) | | 585 | | | (1,685 | ) | | (14,425 | ) |
| | | Prepaid expenses | | | — | | | — | | | (951 | ) | | 10 | | | 3 | | | (938 | ) |
| | | Accounts payable | | | (409,903 | ) | | — | | | 404,862 | | | 4,784 | | | (343 | ) | | (600 | ) |
| | | Accrued compensation and related liabilities | | | — | | | — | | | 2,113 | | | 157 | | | — | | | 2,270 | |
| | | Accrued liabilities | | | — | | | — | | | 3,577 | | | 207 | | | (103 | ) | | 3,681 | |
| | |
| |
| |
| |
| |
| |
| |
| Net cash (used in) provided by operating activities | | | (216,516 | ) | | — | | | 650,915 | | | 18,969 | | | (195,336 | ) | | 258,032 | |
| Cash flows from investing activities: | | | | | | | | | | | | | | | | | | | |
| | Capital expenditures | | | — | | | — | | | (153,180 | ) | | (8,252 | ) | | — | | | (161,432 | ) |
| | Proceeds from sale or redemption of marketable securities | | | — | | | — | | | 100,558 | | | 12,350 | | | — | | | 112,908 | |
| | Purchase of marketable securities | | | — | | | — | | | (88,260 | ) | | (9,973 | ) | | — | | | (98,233 | ) |
| | Acquisitions of businesses, net of cash acquired | | | — | | | — | | | (24,561 | ) | | (421 | ) | | — | | | (24,982 | ) |
| | Proceeds from divestiture of certain facilities | | | — | | | — | | | 25,722 | | | — | | | — | | | 25,722 | |
| | Other | | | 244,319 | | | — | | | (451,665 | ) | | 684 | | | 195,741 | | | (10,921 | ) |
| | |
| |
| |
| |
| |
| |
| |
| Net cash provided by (used in) investing activities | | | 244,319 | | | — | | | (591,386 | ) | | (5,612 | ) | | 195,741 | | | (156,938 | ) |
| Cash flows from financing activities: | | | | | | | | | | | | | | | | | | | |
| | Proceeds from issuance of long-term debt | | | — | | | — | | | 147,946 | | | (6,428 | ) | | (779 | ) | | 140,739 | |
| | Repayment of long-term debt | | | — | | | — | | | (171,708 | ) | | (6,317 | ) | | 374 | | | (177,651 | ) |
| | Stock options exercised | | | 3,399 | | | — | | | — | | | — | | | — | | | 3,399 | |
| | Dividends paid | | | (31,249 | ) | | — | | | — | | | — | | | — | | | (31,249 | ) |
| | Other | | | 47 | | | — | | | — | | | — | | | — | | | 47 | |
| | |
| |
| |
| |
| |
| |
| |
| Net cash used in financing activities | | | (27,803 | ) | | — | | | (23,762 | ) | | (12,745 | ) | | (405 | ) | | (64,715 | ) |
| | |
| |
| |
| |
| |
| |
| |
| Net increase in cash and cash equivalents | | | — | | | — | | | 35,767 | | | 612 | | | — | | | 36,379 | |
| Cash and cash equivalents at beginning of period | | | — | | | — | | | 10,511 | | | 5,292 | | | — | | | 15,803 | |
| | |
| |
| |
| |
| |
| |
| |
| Cash and cash equivalents at end of period | | $ | — | | $ | — | | $ | 46,278 | | $ | 5,904 | | $ | — | | $ | 52,182 | |
| | |
| |
| |
| |
| |
| |
| |
24
REPORT OF ERNST & YOUNG LLP, INDEPENDENT AUDITORS
The Board of Directors
Cintas Corporation
We have audited the accompanying consolidated balance sheets of Cintas Corporation as of May 31, 2002 and 2001, and the related consolidated statements of income, shareholders' equity, and cash flows for each of the three years in the period ended May 31, 2002. These financial statements are the responsibility of the Company's management. Our responsibility is to express an opinion on these financial statements based on our audits.
We conducted our audits in accordance with auditing standards generally accepted in the United States. Those standards require that we plan and perform the audit to obtain reasonable assurance about whether the financial statements are free of material misstatement. An audit includes examining, on a test basis, evidence supporting the amounts and disclosures in the financial statements. An audit also includes assessing the accounting principles used and significant estimates made by management, as well as evaluating the overall financial statement presentation. We believe that our audits provide a reasonable basis for our opinion.
In our opinion, the financial statements referred to above present fairly, in all material respects, the consolidated financial position of Cintas Corporation at May 31, 2002 and 2001, and the consolidated results of its operations and its cash flows for each of the three years in the period ended May 31, 2002, in conformity with accounting principles generally accepted in the United States.
Cincinnati, Ohio
July 5, 2002
25
MANAGEMENT'S DISCUSSION AND ANALYSIS OF FINANCIAL CONDITION
AND RESULTS OF OPERATIONS
Fiscal 2002 Compared to Fiscal 2001
Fiscal 2002 marked the 33rd year of uninterrupted growth for Cintas. Total revenue was $2.3 billion, an increase of 5% over fiscal 2001. Revenue from the Rentals segment increased 9%, primarily due to a combination of acquisitions and growth in the customer base. Other Services revenue decreased 6%, primarily due to a delay in customer purchases driven by slow economic conditions and a decline in the hospitality and airline industries resulting from the events of September 11. Despite slow economic growth, internal growth in the Rentals segment averaged over 4% for the year.
Pre-tax income was $372 million, a 4% increase over fiscal 2001. Pre-tax income from the Rentals segment increased 8% over the prior year, primarily due to higher rental revenue. Pre-tax income for the Other Services segment decreased 37% from the prior year, due to lower sales volume and excess capacity costs.
Net interest expense decreased $5.4 million from the prior year due to lower interest rates, a lower average level of debt and a higher average level of cash and marketable securities in fiscal 2002. Cintas' effective tax rate was 37% for fiscal 2002 compared to 38% for fiscal 2001, primarily due to tax planning efforts.
Net income for fiscal 2002 of $234 million and diluted earnings per share of $1.36, both represent a 5% increase over fiscal 2001. Return on average equity was 18% in fiscal 2002 and 20% in fiscal 2001.
Cash, cash equivalents and marketable securities decreased by $25 million in 2002, or 23%, primarily due to the acquisition of Omni. The cash, cash equivalents and marketable securities will be used to finance future acquisitions and capital expenditures. Marketable securities consist primarily of municipal bonds and federal government securities.
Accounts receivable increased $39 million due to sales growth and acquisitions made during the year. Inventories decreased $21 million due to focused efforts to improve inventory turns. Net property and equipment increased by $76 million. In fiscal 2002, Cintas completed construction of seven new uniform rental facilities and had another five uniform rental facilities in various stages of construction to accommodate growth in rental operations.
Fiscal 2001 Compared to Fiscal 2000
Total revenue for fiscal 2001 was $2.2 billion, an increase of 14% over fiscal 2000. Revenue from the Rentals segment increased 13% and Other Services revenue increased 15%, primarily due to growth in the customer base. Despite a slowing economy, internal growth in the Rentals segment averaged approximately 11% for the year.
Pre-tax income for fiscal 2001 was $356 million, a 14% increase over fiscal 2000. Pre-tax income from the Rentals segment increased 16% over the prior year, while pre-tax income for the Other Services segment remained flat.
Net interest expense decreased $0.4 million from the prior year due to lower interest rates and a lower level of average debt in fiscal 2001. Cintas' effective tax rate was 38% for fiscal 2001 and fiscal 2000.
Net income for fiscal 2001 of $222 million and diluted earnings per share of $1.30 represent a 15% and 14% increase, respectively, over fiscal 2000. Return on average equity was 20% for both fiscal 2001 and fiscal 2000.
Cash, cash equivalents and marketable securities remained relatively consistent year over year. The cash, cash equivalents and marketable securities were used to finance acquisitions and capital expenditures. Marketable securities consisted primarily of municipal bonds and federal government securities.
Accounts receivable increased $19 million due to sales growth and acquisitions made during the year. Inventories increased $49 million due to the expansion of outside contract manufacturing capacity, the stocking of new distribution centers, an effort to reduce lead times on direct sale products and sales growth in both business segments. Net property and equipment increased by $60 million. In fiscal 2001, Cintas completed construction of eight new uniform rental facilities and had another ten uniform rental facilities in various stages of construction to accommodate growth in rental operations.
26
Liquidity and Capital Resources
At May 31, 2002, Cintas had $85 million in cash, cash equivalents and marketable securities, a decrease of $25 million from May 31, 2001. This decrease is primarily due to cash paid for acquisitions of $732 million, partially offset by strong operating cash flows and proceeds from debt to finance acquisitions. Cintas' investment policy pertaining to marketable securities is conservative. Preservation of principal, while earning an attractive yield, is the criteria used in making investment decisions.
Working capital decreased $28 million to $541 million in fiscal 2002. This decrease is primarily the result of lower direct sale inventories, a lower level of cash due to acquisitions and higher accrued liabilities due primarily to the acquisition of Omni.
Capital expenditures for fiscal 2002 totaled $107 million, including $99 million for the Rentals segment and $8 million for Other Services. Cintas continues to reinvest in land, buildings and equipment in an effort to expand capacity for future growth. Cintas anticipates that capital expenditures for fiscal 2003 will approximate $150 million.
On May 13, 2002, Cintas completed the acquisition of Omni for approximately $656 million. This acquisition, coupled with smaller acquisitions in both the Rentals and Other Services segments, were financed with a combination of approximately $182 million in cash, $450 million in long-term notes, and approximately $100 million in commercial paper. As a result of this additional debt, the total debt to total capitalization ratio increased to 34% at May 31, 2002, versus 16% at May 31, 2001.
The $450 million in long-term notes consist of $225 million with five-year maturities at a rate of 51/8%, and $225 million with ten-year maturities at a rate of 6%. Cintas has earned credit ratings on these notes of "A" from Standard & Poor's and "A2" from Moody's. Cintas also utilizes a $300 million commercial paper program, on which it has earned credit ratings of "A-1" from Standard & Poor's and "Prime-1" from Moody's. These ratings reflect Cintas' commitment to conservative financial policies, strong financial management and a disciplined integration strategy for acquisitions. The commercial paper program is fully supported by a long-term credit facility that matures in 2005. As of May 31, 2002, $190 million in commercial paper was outstanding, which is included in the $207 million of unsecured notes detailed in Note 5.
During the year, Cintas paid dividends of $42 million, or $.25 per share. On a per share basis, this dividend is an increase of 14% over that paid in fiscal 2001.
Following is information regarding Cintas' long-term contractual obligations and other commitments outstanding as of May 31, 2002:
| | Payments Due by Period
|
|---|
Long-term contractual obligations
| | Total
| | One year
or less
| | Two to
three years
| | Four to
five years
| | After five
years
|
|---|
| | (In thousands)
|
|---|
| Long-term debt(1) | | $ | 717,160 | | $ | 17,828 | | $ | 228,259 | | $ | 10,240 | | $ | 460,833 |
| Capital lease obligations(2) | | | 4,459 | | | 541 | | | 995 | | | 1,163 | | | 1,760 |
| Operating leases(3) | | | 61,866 | | | 14,923 | | | 21,642 | | | 14,627 | | | 10,674 |
| Unconditional purchase obligations | | | — | | | — | | | — | | | — | | | — |
| | |
| |
| |
| |
| |
|
| Total contractual cash obligations | | $ | 783,485 | | $ | 33,292 | | $ | 250,896 | | $ | 26,030 | | $ | 473,267 |
- (1)
- Reference Note 5 for a detailed discussion of long-term debt.
- (2)
- Capital lease obligations are included in long-term debt detailed in Note 5.
- (3)
- Operating leases consist primarily of building leases and synthetic leases on the two corporate jets.
27
| | Amount of Commitment Expiration Per Period
|
|---|
Other commercial commitments
| | Total
| | One year
or less
| | Two to
three years
| | Four to
five years
| | After five
years
|
|---|
| | (In thousands)
|
|---|
| Lines of credit(1) | | $ | 300,000 | | $ | 150,000 | | $ | 150,000 | | $ | — | | $ | — |
| Standby letters of credit(2) | | | 40,000 | | | 40,000 | | | — | | | — | | | — |
| Guarantees | | | — | | | — | | | — | | | — | | | — |
| Standby repurchase obligations | | | — | | | — | | | — | | | — | | | — |
| Other commercial commitments | | | — | | | — | | | — | | | — | | | — |
| | |
| |
| |
| |
| |
|
| Total commercial commitments | | $ | 340,000 | | $ | 190,000 | | $ | 150,000 | | $ | — | | $ | — |
- (1)
- Back-up facility for the commercial paper program (reference Note 5 for further discussion).
- (2)
- Support certain outstanding debt (reference Note 5) and self-insured workers' compensation and general liability insurance programs.
Market Risk
Cintas manages interest rate risk by using a combination of variable and fixed rate debt, marketable securities and interest rate swap agreements. Earnings are affected by changes in short-term interest rates due to the use of variable rate notes and revolving credit facilities amounting to approximately $275 million, with an average interest rate of 2.23%. This exposure is limited by the purchase of marketable securities and interest rate swap agreements as a hedge against variability in short-term rates. If short-term rates change by one-half percent (or 50 basis points), Cintas' income before taxes would change by approximately $2.0 million. This estimated exposure considers the mitigating effects of marketable securities and swap agreements on the change in the cost of variable rate debt. This analysis does not consider the effects of a change in economic activity or a change in Cintas' capital structure.
Inflation and Changing Prices
Management believes inflation has not had a material impact on Cintas' financial condition or a negative impact on operations.
Environmental
Cintas is subject to various environmental laws and regulations, as are other companies in the industry. While costs related to environmental compliance are not a material component of the cost of rentals, Cintas must incur capital expenditures and associated operating costs for water treatment and waste removal on a regular basis. Environmental spending amounted to approximately $8.0 million in fiscal 2002 and $7.0 million in fiscal 2001. This spending includes labor and chemical costs for water treatment, as well as costs for waste removal. Capital expenditures to limit or monitor hazardous substances were $5.0 million in fiscal 2002 and $2.5 million in fiscal 2001. These expenditures were primarily related to the purchase of water treatment systems.
Cintas is subject to legal proceedings and claims related to environmental matters arising from the ordinary course of business. Cintas does not believe that these actions will result in a material adverse effect on its financial position or results of operations. A detailed discussion of litigation and environmental matters is included in Note 12.
28
New Accounting Standards
In compliance with Statement of Financial Accounting Standards No. 142 (SFAS 142),Goodwill and Other Intangible Assets, Cintas discontinued the amortization of goodwill effective June 1, 2001. Cintas completed the transitional goodwill impairment test as required by SFAS 142 using a measurement date of June 1, 2001. Based on the results of the transitional impairment test, Cintas was not required to recognize an impairment of goodwill. A periodic test of goodwill impairment was conducted in the fourth quarter of fiscal 2002, as required by SFAS 142. As a result of this test, there was no impairment of goodwill.
In August 2001, the Financial Accounting Standards Board issued Statement of Financial Accounting Standards No. 144 (SFAS 144),Accounting for the Impairment or Disposal of Long-Lived Assets. The standard is effective for years beginning after December 15, 2001. This standard supercedes previous guidance related to impairment or disposal of long-lived assets. For long-lived assets to be held and used, it retains the basic recognition and measurement requirements of Statement of Financial Accounting Standards No. 121 (SFAS 121),Accounting for the Impairment of Long-Lived Assets and for Long-Lived Assets to Be Disposed Of, but addresses certain implementation issues. For long-lived assets to be disposed of by sale, it broadens the definition of disposals that should be reported separately as discontinued operations. Cintas adopted SFAS 144 on June 1, 2002, and it is not expected to have a material effect on the financial statements.
Please reference Note 1 for more information on recent accounting pronouncements adopted by Cintas.
Critical Accounting Policies
The preparation of Cintas' consolidated financial statements in conformity with accounting principles generally accepted in the United States requires management to make estimates and judgments that have a significant effect on the amounts reported in the financial statements and accompanying notes. These critical accounting policies should be read in conjunction with Note 1 to the financial statements. Significant changes, estimates or assumptions related to any of the following critical accounting policies could possibly have a material impact on the financial statements.
Revenue recognition
Rental revenue is recognized when services are performed and Other Services revenue is recognized when products are shipped and the title and risks of ownership pass to the customer. Cintas also establishes an allowance for uncollectible accounts. This allowance is an estimate based on historical rates of collectibility. An uncollectible accounts provision is recorded for overdue amounts, beginning with a nominal percentage and increasing substantially as the account ages. The amount provided as the account ages will differ slightly between the Rentals and Other Services segments, because of differences in customers served and the nature of each business segment.
Inventories
Inventories are valued at the lower of cost (first-in, first-out) or market. Substantially all inventories represent finished goods. Cintas applies a commonly accepted practice of using inventory turns to apply variances between actual to standard costs to the inventory balances. The judgments and estimates used to calculate inventory turns will have an impact on the valuation of inventory at the lower of cost or market. Inventory obsolescence is determined by specific identification, as well as historical information.
29
Uniforms and other rental items in service
These items are valued at cost less amortization, calculated using the straight-line method. Uniforms in service (other than cleanroom and flame resistant garments) are amortized over their useful life of eighteen months. Other rental items including shop towels, mats, cleanroom garments, flame resistant garments, linens and hygiene dispensers are amortized over their useful lives of eight to forty-eight months. The amortization rates used are based on industry experience, Cintas' experience and wear tests performed by Cintas. These factors are critical to determining the amount of in service inventory that is presented in the financial statements.
Property, plant and equipment
Depreciation is calculated using the straight-line method over the estimated useful lives of the assets. When events or circumstances indicate that the carrying amount of long-lived assets may not be recoverable, the estimated future cash flows (undiscounted) are compared to the carrying amount of the assets. If the estimated future cash flows are less than the carrying amount of the assets, an impairment loss is recorded. The impairment loss is measured by comparing the fair value of the assets with their carrying amounts. Fair value is determined by discounted cash flows or appraised values, as appropriate. Long-lived assets that are held for disposal are reported at the lower of the carrying amount or the fair value, less estimated costs related to disposition.
Other assets
Other assets consist primarily of service contracts and noncompete and consulting agreements obtained through the acquisition of businesses, which are amortized by use of the straight-line method over the estimated lives of the agreements, which are generally three to twelve years. Noncompete and consulting agreements are usually determined through negotiation with the seller of the acquired business. Certain noncompete agreements, as well as all service contracts, require that a valuation be determined using a discounted cash flow model. The assumptions and judgments used in these models involve estimates of cash flows and discount rates, among other factors. Because of the assumptions used to value these intangible assets, actual results over time could vary from original estimates.
Environmental and litigation
Cintas is subject to legal proceedings and claims related to environmental matters arising from the ordinary course of business. Accounting principles generally accepted in the United States require that a liability for contingencies be recorded when it is probable that a liability has occurred and the amount of the liability can be reasonably estimated. Significant judgment is required to determine the existence of a liability, as well as the amount to be recorded. Cintas regularly consults with attorneys to ensure that all of the relevant facts and circumstances are considered, before a contingent liability is recorded. While a significant change in assumptions and judgments could have a material impact on the amounts recorded for contingent liabilities, Cintas does not believe that they will result in a material adverse effect on financial statements. A detailed discussion of litigation and environmental matters is included in Note 12.
30
Deferred tax liability
Deferred tax assets and liabilities are determined by the differences between the financial statement carrying amounts and the tax basis of assets and liabilities. Please reference Note 7 for the types of items that give rise to significant deferred income tax assets and liabilities. Deferred income taxes are classified as assets or liabilities based on the classification of the related asset or liability for financial reporting purposes. Deferred income taxes that are not related to an asset or liability for financial reporting are classified according to the expected reversal date. Cintas regularly reviews deferred tax assets for recoverability based upon projected future taxable income and the expected timing of the reversals of existing temporary differences. As a result of this review, Cintas has not established a valuation allowance against the deferred tax assets.
Cintas is periodically reviewed by domestic and foreign tax authorities regarding the amount of taxes due. These reviews include questions regarding the timing and amount of deductions and the allocation of income among various tax jurisdictions. In evaluating the exposure associated with various filing positions, Cintas records reserves for probable exposures. Based on Cintas' evaluation of current tax positions, Cintas believes they have appropriately accrued for probable exposures.
Forward-Looking Statements
The Private Securities Litigation Reform Act of 1995 provides a safe harbor from civil litigation for forward-looking statements. This Annual Report contains forward-looking statements that reflect Cintas' current views as to future events and financial performance with respect to its operations. These statements are subject to risks and uncertainties that could cause actual results to differ materially from those set forth in this Annual Report. Factors that might cause such a difference include the possibility of greater than anticipated operating costs, lower sales volumes, the performance and costs of integration of acquisitions, fluctuations in costs of materials and labor, the outcome of pending environmental matters, the initiation or outcome of litigation, higher assumed sourcing or distribution costs of products and the reactions of competitors in terms of price and service. Forward-looking statements speak only as of the date made. Cintas undertakes no obligation under the Act to update any forward-looking statements to reflect the events or circumstances arising after the date on which they are made.
31
DIRECTORS AND OFFICERS
Board of Directors
Paul R. Carter
President of Wal-Mart Realty Company
Gerald V. Dirvin
Retired Executive Vice President
and Director of
The Procter & Gamble Company
Richard T. Farmer
Chairman of the Board
of the Corporation
Scott D. Farmer
President & Chief Operating Officer
of the Corporation
James J. Gardner
Retired Vice President
of the Corporation
Robert J. Herbold
Retired Executive Vice President
and Chief Operating Officer of
Microsoft Corporation
Roger L. Howe
Retired Chairman of the Board
of U.S. Precision Lens, Inc.
Donald P. Klekamp
Associated with
Keating, Muething & Klekamp
Robert J. Kohlhepp
Chief Executive Officer
of the Corporation
Corporate Officers
Robert R. Buck
Senior Vice President &
President—Uniform Rental Division
Karen L. Carnahan
Vice President & Treasurer
Richard T. Farmer
Chairman of the Board
Scott D. Farmer
President & Chief Operating Officer | | Thomas E. Frooman
Vice President & Secretary,
General Counsel
William C. Gale
Vice President & Chief Financial Officer
Robert J. Kohlhepp
Chief Executive Officer
Operating and Staff Officers
David B. Armbrester
Vice President
Great Lakes Rental Group
James J. Case
Vice President
Southwest Rental Group
James V. Critchfield
Vice President
Northcentral Rental Group
William L. Cronin
President—National Account
Sales Division
Gregory J. Eling
Vice President
Central Rental Group
Larry L. Fultz
Vice President
Human Resources
Michael P. Gaburo
Vice President
Cleanroom Division
Arnold Gedmintas
Vice President
Northern Rental Group
William W. Goetz
Vice President
Marketing & Merchandising
J. Todd Gregory
Vice President
Southcentral Rental Group
Larry A. Harmon
Vice President
Western Rental Group | | J. Phillip Holloman
Vice President
Distribution
Jeffry E. Jones
Vice President
Northwest Rental Group
James J. Krupansky
Vice President
Glenn W. Larsen
Vice President
Logistics & Manufacturing
John W. Milligan
Vice President
Midwest Rental Group
John E. Myers
Vice President
MidAtlantic Rental Group
Robert A. Oswald
Vice President
David Pollak, Jr.
Vice President
First Aid & Safety Division
Rodger V. Reed
Vice President
Northeast Rental Group
Bruce E. Rotte
Vice President
Southeast Rental Group
Michael E. Schneider
Vice President
Research & Development
Richard B. Surdykowski, Jr.
Vice President
MidSouth Rental Group
G. Thomas Thornley
Vice President &
Chief Information Officer |
32
QuickLinks
ELEVEN YEAR FINANCIAL SUMMARY (In thousands except per share and percentage data)CONSOLIDATED STATEMENTS OF INCOME (In thousands except per share data)CONSOLIDATED BALANCE SHEETS (In thousands except share data)CONSOLIDATED STATEMENTS OF SHAREHOLDERS' EQUITY (In thousands)CONSOLIDATED STATEMENTS OF CASH FLOWS (In thousands)NOTES TO CONSOLIDATED FINANCIAL STATEMENTS (Amounts in thousands except per share and share data)REPORT OF ERNST & YOUNG LLP, INDEPENDENT AUDITORSMANAGEMENT'S DISCUSSION AND ANALYSIS OF FINANCIAL CONDITION AND RESULTS OF OPERATIONSDIRECTORS AND OFFICERS