OMB APPROVAL | ||
OMB Number: | 3235-0570 | |
Expires: | Nov. 30, 2005 | |
Estimated average burden | ||
hours per response: | 5.0 | |
UNITED STATES
SECURITIES AND EXCHANGE COMMISSION
Washington, D.C. 20549
FORM N-CSR
CERTIFIED SHAREHOLDER REPORT OF REGISTERED MANAGEMENT
INVESTMENT COMPANIES
Investment Company Act file number: 811-3793
Strong Opportunity Fund, Inc., on behalf of Strong Advisor Select Fund, Strong Advisor U.S. Small/Mid Cap Growth Fund, Strong Endeavor Fund and Strong Opportunity Fund
(Exact name of registrant as specified in charter)
| P.O. Box 2936 Milwaukee, WI | 53201 | |
| (Address of principal executive offices) | (Zip code) |
Richard Smirl, Strong Capital Management, Inc.
P.O. Box 2936 Milwaukee, WI 53201
(Name and address of agent for service)
Registrant’s telephone number, including area code: (414) 359-3400
Date of fiscal year end: December 31
Date of reporting period: June 30, 2004
Form N-CSR is to be used by management investment companies to file reports with the Commission not later than 10 days after the transmission to stockholders of any report that is required to be transmitted to stockholders under Rule 30e-1 under the Investment Company Act of 1940 (17 CFR 270.30e-1). The Commission may use the information provided on Form N-CSR in its regulatory, disclosure review, inspection, and policymaking roles.
A registrant is required to disclose the information specified by Form N-CSR, and the Commission will make this information public. A registrant is not required to respond to the collection of information contained in Form N-CSR unless the Form displays a currently valid Office of Management and Budget (“OMB”) control number. Please direct comments concerning the accuracy of the information collection burden estimate and any suggestions for reducing the burden to Secretary, Securities and Exchange Commission, 450 Fifth Street, NW, Washington, DC 20549-0609. The OMB has reviewed this collection of information under the clearance requirements of 44 U.S.C. (S) 3507.
Item 1. Reports to Shareholders
Semiannual Report | June 30, 2004
Strong
Advisor Equity
Funds

| Strong Advisor Common Stock Fund | ||
| Strong Advisor Mid Cap Growth Fund | ||
| Strong Advisor Small Cap Value Fund | ||
| Strong Advisor U.S. Value Fund | ||
| Strong Advisor Endeavor Large Cap Fund | ||
| Strong Advisor Focus Fund | ||
| Strong Advisor International Core Fund | ||
| Strong Advisor Select Fund | ||
| Strong Advisor Technology Fund | ||
| Strong Advisor U.S. Small/Mid Cap Growth Fund | ||
| Strong Advisor Utilities and Energy Fund | ||
| Strong Advisor Large Company Core Fund | ||

Semiannual Report | June 30, 2004
Strong
Advisor Equity
Funds
Investment Reviews | ||
| 2 | ||
| 4 | ||
| 6 | ||
| 8 | ||
| 10 | ||
| 12 | ||
| 14 | ||
| 16 | ||
| 18 | ||
| 20 | ||
| 22 | ||
| 24 | ||
Financial Information | ||
Schedules of Investments in Securities | ||
| 26 | ||
| 27 | ||
| 29 | ||
| 33 | ||
| 35 | ||
| 37 | ||
| 37 | ||
| 39 | ||
| 40 | ||
| 41 | ||
| 42 | ||
| 43 | ||
| 45 | ||
| 53 | ||
| 59 | ||
| 64 | ||
| 85 | ||
| 108 | ||
Market Update From Dick Weiss
January 1, 2004, to June 30, 2004

Uncertainty is the Enemy
In our last report back in January, the overall U.S. economy displayed definite signs of strengthening — job growth was gaining momentum, and consumer confidence was on the rise. There was some muffled muttering about deflation, but it lacked enough conviction to cause alarm. All in all, it looked like a relatively promising picture.
Six months out, things seem not quite so sanguine. Fears of inflation have replaced the whispers of deflation, and the Federal Reserve has begun what doubtless will be a series of rate hikes well into 2005. While the overall economy has exceeded expectations, the good news on that front has not been sufficient to overshadow a host of uncertainties in the military and political worlds.
Before we address those uncertainties, let’s devote a moment to the topic of inflation. In the history of markets, there seems to be a point at which a rising rate of inflation causes the market’s price-to-earnings ratios to contract. Historically, that point would be around seven percent. While it seems highly unlikely that the inflation rate is going to get anywhere near that mark in the foreseeable future, there is some suggestion that nowadays, because of the way the Consumer Price Index is calculated, that number could be closer to five percent. If that is indeed a more realistic calculation, it’s possible that we could hit five percent inflation and a negative impact on stock valuations.
In my estimation though, the prospect for serious inflation pales in comparison to other uncertainties currently plaguing the market (e.g., the outcome of the U.S. presidential race this fall and the continuing political fallout surrounding Iraq).
With regard to the War on Terrorism and the issue of Iraq, investors are faced every day with news that can give them pause. While the war seems to be on track, the outcome in Iraq is dependent on how rapidly that nation can defeat the insurgents and restore the rule of law now that the Iraqis themselves have taken charge. We believe that expectations may be too low in that regard.
On the political front, the market seemed to peak around the moment when Democratic candidate Senator John Kerry pulled even with President George W. Bush in the polls. Nothing makes the prospects for economic prosperity harder to decipher than a presidential race featuring two candidates with widely differing views on virtually every issue domestically and internationally. For the stock market, that spells uncertainty with a capital U.
We believe stock valuations today are neither cheap, nor particularly overvalued based upon earnings projections for 2005. They are, rather, sort of stuck somewhere in the middle. In order for stocks to start moving in a positive direction, the market needs an injection of confidence. So the relevant question becomes, in short: What needs to happen in order to inspire that sense of confidence?
The answer? In a word — clarity.
On the inflation front, we anticipate clarity will not come for some time. We expect the Federal Reserve will continue to raise rates until it gets ahead of the inflation curve. It’s unclear just how many hikes and of what magnitude will accomplish that. Nonetheless, if inflationary fears were the single biggest element of uncertainty out there today, we would feel confident that the problem could be contained.
The fate of Iraq and the outcome of the presidential election loom larger and seem far more complicated. If the public perceives that progress is being made in Iraq and democracy will indeed triumph, the market will likely anticipate the reelection of President Bush. If the daily diagnosis on Iraq is less favorable, the political uncertainty weighing on the market will continue for the next several months.
Notwithstanding all the ambiguity, we are beginning to see corners of the market where good values are emerging. Energy has been one of the more promising areas and should continue to benefit from strong fundamentals. Even in the areas of the technology sector, where we believe stocks have been chronically overvalued, values have begun to return to earth. There are even some computer software companies that look attractive to us.
In order for stocks to start moving in a positive direction, the market needs an injection of confidence.
In stock-picker parlance, what we have today is a market of individual stocks rather than — as we saw in 2003 — a rising stock market. In the former, money is a lot harder to make; in the latter, the rising tide seems to lift all issues almost indiscriminately.
We believe the market should continue this year’s trend, which is a much more value- and fundamentals-oriented market. Make no mistake: this is not a “story” market where people dream about distant possibilities and, on the strength of those illusions, stocks soar to 100 times earnings. This is a market where, if you do your homework and stick to what is real rather than imagined, we think you can discover common stocks worth owning.
Given all the uncertainty that exists in the world, there are practical limits to just how high the market can go. But with an economy that continues to show strength and interest rates still on the low side, there are also practical limits to how low the market can go. That environment should favor professional investors who exhibit good discipline in both their buy and sell decisions.
One final piece of practical advice: when uncertainty is the order of the day, resist doing anything dramatic with your money. Sometimes the “muddle-through” approach proves best.
…if you do your homework and stick to what is real rather than imagined, we think you can uncover common stocks worth owning.

Richard T. Weiss |
Vice Chairman |
Strong Financial Corporation |
Strong Advisor Common Stock Fund
We entered 2004 hopeful that the equity market would benefit from an improving economy and that the companies the Strong Advisor Common Stock Fund holds would outperform the broader market. Although we are disappointed that the Fund is lagging the market through the first half of the year, we remain confident in our private market value (PMV) process and the Fund’s ability to outperform over the long term. For the six months ended June 30, 2004, the Fund’s Class Z shares returned 2.26%, compared with a 6.67% return for our broad-based benchmark, the Russell Midcap Index.
Uncertain environment hurt results
The market has been clouded with uncertainty throughout the first part of the year. There are many signs that the economy continues to be strong, yet the conflict in Iraq, rising interest rates, and high fuel prices have caused the equity markets to trade in a narrow range. We had a sizable overweighting, relative to the benchmark, in the energy sector, which posted strong returns over the period.
The Fund was hurt over the period by its overweighting in the media and technology sectors. These are two areas in which there have been mixed signals, rather than clear signs of growth. Within media, our long-standing positions in cable television stocks had a disappointing first half due to market concerns of increasing competition from satellite and telecom companies. Weakness among our technology positions resulted from concerns over the viability of the tech upturn, which impacted even some of our niche companies in the space.
An intensive research process
The Fund’s over- and under-weightings relative to the benchmark are the result of where our investment process finds value in the market. A key step in this process is determining a PMV for a company we are considering — that is, determining the price we would be willing to pay if we were acquiring the whole company. We look for companies whose current stock valuations are between 50% and 60% of their PMV.
We spend much of our time talking to and visiting with the management teams of the companies we own or in which we are interested in investing. These conversations help us to understand the company, its management strategy, and the industry in which it competes.
An example of private market value at work
American Eagle Outfitters is one example of a stock that we bought late in 2003 based on our PMV approach. This teen apparel retailer had experienced mediocre financial performance for the past several years in the face of a crowded field chasing the same fickle teen customer. Through a comprehensive qualitative and quantitative analysis of the company, we established a PMV in the mid 20’s for the stock. In November 2003, the company announced a management reorganization and communicated a new product strategy that appeared to offer a catalyst for future growth. At that time, the stock was near $15, or 60% of our PMV. Given the combination of a future catalyst and appropriate stock price, we made an investment. Sales for Christmas 2003 were less disappointing than had been expected, and spring 2004 sales were quite strong.
As it appeared the company’s new strategy was working, earnings estimates for American Eagle rose. Our estimate of the company’s PMV also increased as its financial results improved. By early April, the company reported strong March sales and our PMV for the company’s stock had risen to over $30 for 2005. The actual stock price had risen to $28, a gain of 71% for the year — and 90% of our new PMV. Given that the stock’s price was very close to our estimate of its full value, we decided to sell the stock at that time. Three months later, at the end of the second quarter, the stock’s price was still below $29. Thus, we would have gained very little by continuing to hold the stock, and by selling it we gave the Fund the benefit of three months in which we were able to redirect those assets toward more advantageous opportunities.
Optimism tempered by uncertainty
We remain optimistic about the economy and the equity market in general, though one certainty we have is that the uncertain environment will continue throughout 2004. There are many questions on the economic, international, and political front, but unfortunately, no quick answers.
While we wait, we will remain focused on the factors we can control: sticking to our time-tested investment style, diversifying the Fund within industry groups to manage our risk, and striving to bring you investment results that we will be proud of.
We thank you for your continued investment and confidence in the Strong Advisor Common Stock Fund.
Richard T. Weiss | Ann M. Miletti | |
Portfolio Co-Manager | Portfolio Co-Manager |
2
Fund Highlights
Average Annual Total Returns
As of 6-30-04
Class A1 | |||
1-year | 14.25 | % | |
5-year | 3.91 | % | |
10-year | 11.92 | % | |
Since Fund Inception (12-29-89) | 14.42 | % | |
Class A, excluding sales load | |||
1-year | 21.22 | % | |
5-year | 5.15 | % | |
10-year | 12.59 | % | |
Since Fund Inception (12-29-89) | 14.89 | % | |
Class B1 | |||
1-year | 15.25 | % | |
5-year | 4.15 | % | |
10-year | 12.16 | % | |
Since Fund Inception (12-29-89) | 14.60 | % | |
Class C1 | |||
1-year | 19.25 | % | |
5-year | 4.49 | % | |
10-year | 11.98 | % | |
Since Fund Inception (12-29-89) | 14.30 | % | |
Class Z2 | |||
1-year | 21.45 | % | |
5-year | 5.45 | % | |
10-year | 12.95 | % | |
Since Fund Inception (12-29-89) | 15.28 | % | |
Performance is historical and does not guarantee future results. Investment returns and principal value will fluctuate, and you may have a gain or loss when you sell shares. Current performance may be lower or higher than the quoted performance. Call us or visit www.Strong.com for the most recent month-end performance.
Risks: Stock funds should only be considered for long-term goals as values fluctuate in response to the activities of individual companies and general market and economic conditions.
Because smaller companies often have narrower markets and limited financial resources, investments in these stocks present more risk than investments in those of larger, more established companies.
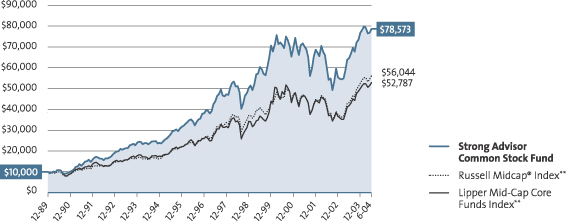
Growth of an Assumed $10,000 Investment†
from 12-29-89 to 6-30-04
Mention of specific securities in this report is not indicative of whether the Fund may make additional purchases of, sell all or a portion of, or continue to hold those securities.
| * | The Morningstar Style BoxTM reveals a fund’s investment strategy. For equity funds, the vertical axis shows the market capitalization of the stocks owned and the horizontal axis shows investment style (value, blend, or growth). |
| † | This graph, provided in accordance with SEC regulations, compares a $10,000 investment in the Fund, made at its inception, with the performance of the Russell Midcap® Index and the Lipper Mid-Cap Core Funds Index. Results include the reinvestment of all dividends and capital gains distributions. The graph and the Average Annual Total Returns table do not reflect the deduction of taxes, if any, that a shareholder would pay on Fund distributions or the redemption of Fund shares. This graph is based on Class Z shares only; performance for other classes will vary due to differences in fee structures. |
Performance Information: 1Load-adjusted performance reflects the effect of the maximum sales charge of 5.75% for Class A, the applicable contingent deferred sales charge of 5.00% in year 1 and eliminated after year 6 for Class B, and the applicable contingent deferred sales charge of 1.00% and eliminated after 12 months for Class C. The performance of the Class A, B, and C shares is based on the performance of the Fund’s Class Z shares (formerly Retail Class shares) prior to 11-30-00. The performance of the Class A shares is restated to reflect the load and the different expenses of the Class A shares, as applicable. The performance of the Class B shares is restated to reflect the contingent deferred sales charge, the different expenses of the Class B shares, and the conversion to Class A shares after eight years, as applicable. The performance of the Class C shares is restated to reflect the contingent deferred sales charge and the different expenses of the Class C shares, as applicable. Please consult a prospectus for information about all share classes.
From time to time, the Fund’s performance was significantly enhanced through investments in initial public offerings (IPOs). In addition, the effect of IPOs purchased when the Fund’s asset base was small may have been magnified. Given these circumstances, you should not expect that such enhanced returns can be consistently achieved. Please consider this before investing.
Fee Waivers: From time to time, the Fund’s advisor and/or administrator has waived fees and/or absorbed Fund expenses, which has resulted in higher returns. As of 6-30-04, there are waivers and/or absorptions in effect.
Percentage Restrictions: The Fund’s prospectus and statement of additional information may describe restrictions on the percentage of a particular type or quality of security in which the Fund may invest (“Percentage Restrictions”). Percentage Restrictions apply at the time the Fund purchases a security. Circumstances subsequent to the purchase of the security, such as a change in: (1) the Fund’s assets (e.g., due to cash inflows and redemptions); (2) the market value of the security; or (3) the pricing, liquidity, or rating of the security, may cause the Fund to exceed or fall short of the Percentage Restriction. If this happens, the Fund’s continued holding of the security will not constitute a violation of the Percentage Restriction.
General: 2The Class Z shares are closed to new accounts, though the Fund may continue to offer its shares to certain company-sponsored retirement plans, institutional investors meeting specific eligibility requirements, and other limited groups as described in the prospectus.
Definitions: **The Russell Midcap® Index measures the performance of the 800 smallest companies in the Russell 1000 Index, which represent approximately 26% of the total market capitalization of the Russell 1000 Index. The Lipper Mid-Cap Core Funds Index is the average of the 30 largest funds in the Lipper Mid-Cap Core Funds Category. Source of the Russell Index data is Standard & Poor’s Micropal. Source of the Lipper Index data is Lipper. It is not possible to invest directly in an index.
3
Strong Advisor Mid Cap Growth Fund
For the first six months of 2004, growth stocks participated in the stock market’s modest upward move. The Strong Advisor Mid Cap Growth Fund was no exception, with the Class Z shares recording a return of 5.31% for the six months ended June 30, 2004. This figure did, however, lag the return of the Fund’s broad-based benchmark, the Russell Midcap Index, which returned 6.67% over the same period. For the six months, the value style of investing slightly outperformed the Fund’s growth style.
Sectors driving performance
Positive contributors to the Fund’s performance came from the energy and consumer sectors of the market. Energy stocks benefited from a strong pricing environment in the face of rising fuel costs. Performance within the consumer area was particularly strong among the Internet, education, and retail industries.
Holdings that were weaker for the Fund came primarily from the health care and technology sectors. Within health care, generic drug stocks were particularly hit hard; over the course of the six months, the environment for some of these companies held by the Fund became more competitive. Weakness among technology stocks was most notable within the software and communications industries.
Studying companies closely
We believe that earnings and revenue growth are key factors in determining stock prices. Therefore, we focus a great deal of our stock-selection process on finding stocks that are experiencing — or have solid potential to experience — above-average growth in revenue and earnings. While identifying stocks that are experiencing this growth is essential, what matters even more in our investment strategy is determining which companies have growth trends that are sustainable versus those which will only be short-lived.
To sort out the long-term winners from the disappointments, we employ thorough, hands-on research. We specifically focus on a company’s history of success in executing its strategy and the potential profitability of its business model. We also carefully consider whether the company’s strategy and operations mesh well with our overall economic view and if it is being helped or hurt by any broader secular trends.
eResearch is a company that met the previously mentioned criteria — and it proved to be an excellent holding for the Fund during the first six months of the year. eResearch sells technology that digitizes clinical data for pharmaceutical, biotechnology, and medical device companies looking to get government approval for their products. We were attracted to eResearch because we recognized its element of sustainable, above average growth, driven mostly by government guidance to digitize certain types of clinical data. We met with management on several occasions and were impressed with their positioning within the industry as well as their outstanding execution history.
When we decide to sell a stock, our decision-making criteria are essentially the opposite of our buying criteria. We may sell a stock when we see deterioration in its fundamental qualities that may threaten the sustainability of a company’s existing or prospective growth. Conditions that could give us grounds for concern may include, but are not limited to, changes we see in the economy, a new competitive threat, or a change in management personnel or direction.
Our approach to the second half
Our outlook for the next few months remains upbeat. We anticipate that interest rates and inflation will both remain relatively low and that growth in jobs and corporate earnings are likely to remain at healthy levels. We will, however, expect to be carefully monitoring these factors. The outcome of the presidential election in November could have important investment implications, so we anticipate closely watching developments on that front. In the meantime, we intend to continue to seek out the fastest-growing companies that we believe fit within the framework of our investment process.
We thank you for your continued investment in the Strong Advisor Mid Cap Growth Fund.
Brandon Nelson |
Portfolio Manager |
4
Fund Highlights
Average Annual Total Returns
As of 6-30-04
Class A1 | |||
1-year | 10.56 | % | |
5-year | –4.55 | % | |
Since Fund Inception (12-31-96) | 3.58 | % | |
Class A, excluding sales load | |||
1-year | 17.28 | % | |
5-year | –3.42 | % | |
Since Fund Inception (12-31-96) | 4.41 | % | |
Class B1 | |||
1-year | 11.34 | % | |
5-year | –4.51 | % | |
Since Fund Inception (12-31-96) | 3.82 | % | |
Class C1 | |||
1-year | 15.34 | % | |
5-year | –4.04 | % | |
Since Fund Inception (12-31-96) | 3.82 | % | |
Class Z2 | |||
1-year | 17.14 | % | |
5-year | –3.40 | % | |
Since Fund Inception (12-31-96) | 4.54 | % | |
Performance is historical and does not guarantee future results. Investment returns and principal value will fluctuate, and you may have a gain or loss when you sell shares. Current performance may be lower or higher than the quoted performance. Call us or visit www.Strong.com for the most recent month-end performance.
Risks: Stock funds should only be considered for long-term goals as values fluctuate in response to the activities of individual companies and general market and economic conditions.
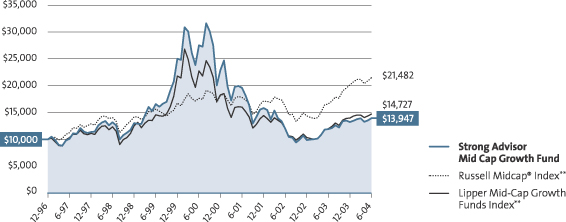
Growth of an Assumed $10,000 Investment†
from 12-31-96 to 6-30-04
Mention of specific securities in this report is not indicative of whether the Fund may make additional purchases of, sell all or a portion of, or continue to hold those securities.
| * | The Morningstar Style BoxTM reveals a fund’s investment strategy. For equity funds, the vertical axis shows the market capitalization of the stocks owned and the horizontal axis shows investment style (value, blend, or growth). |
| † | This graph, provided in accordance with SEC regulations, compares a $10,000 investment in the Fund, made at its inception, with the performance of the Russell Midcap® Index and the Lipper Mid-Cap Growth Funds Index. Results include the reinvestment of all dividends and capital gains distributions. The graph and the Average Annual Total Returns table do not reflect the deduction of taxes, if any, that a shareholder would pay on Fund distributions or the redemption of Fund shares. This graph is based on Class Z shares only; performance for other classes will vary due to differences in fee structures. |
Performance Information: 1Load-adjusted performance reflects the effect of the maximum sales charge of 5.75% for Class A, the applicable contingent deferred sales charge of 5.00% in year 1 and eliminated after year 6 for Class B, and the applicable contingent deferred sales charge of 1.00% and eliminated after 12 months for Class C. The performance of the Class A, B, and C shares is based on the performance of the Fund’s Class Z shares (formerly Retail Class shares) prior to 11-30-00. The performance of Class A shares is restated to reflect the load and the different expenses of the Class A shares, as applicable. The performance of the Class B and Class C shares are restated to reflect the contingent deferred sales charge and the different expenses of the Class B and Class C shares, as applicable. Please consult a prospectus for information about all share classes.
From time to time, the Fund’s performance was significantly enhanced through investments in initial public offerings (IPOs). In addition, the effect of IPOs purchased when the Fund’s asset base was small may have been magnified. Given these circumstances, you should not expect that such enhanced returns can be consistently achieved. Please consider this before investing.
Fee Waivers: From time to time, the Fund’s advisor and/or administrator has waived fees and/or absorbed Fund expenses, which has resulted in higher returns. As of 6-30-04, there are waivers and/or absorptions in effect.
Percentage Restrictions: The Fund’s prospectus and statement of additional information may describe restrictions on the percentage of a particular type or quality of security in which the Fund may invest (“Percentage Restrictions”). Percentage Restrictions apply at the time the Fund purchases a security. Circumstances subsequent to the purchase of the security, such as a change in: (1) the Fund’s assets (e.g., due to cash inflows and redemptions); (2) the market value of the security; or (3) the pricing, liquidity, or rating of the security, may cause the Fund to exceed or fall short of the Percentage Restriction. If this happens, the Fund’s continued holding of the security will not constitute a violation of the Percentage Restriction.
General: 2The Class Z shares are closed to new accounts, though the Fund may continue to offer its shares to certain company-sponsored retirement plans, institutional investors meeting specific eligibility requirements, and other limited groups as described in the prospectus.
Definitions: **The Russell Midcap® Index measures the performance of the 800 smallest companies in the Russell 1000 Index, which represent approximately 26% of the total market capitalization of the Russell 1000 Index. The Lipper Mid-Cap Growth Funds Index is the average of the 30 largest funds in the Lipper Mid-Cap Growth Funds Category. Source of the Russell Index data is Standard & Poor’s Micropal. Source of the Lipper Index data is Lipper. It is not possible to invest directly in an index.
5
Strong Advisor Small Cap Value Fund
The Strong Advisor Small Cap Value Fund Class Z rose 6.01% during the six months ending June 30, 2004. The performance fell short of the Fund’s broad-based benchmark, the Russell 2000 Index, which had a return of 6.76% during the same time span.
Stock selection in sectors such as health care, industrials, and energy helped lead to the Fund’s year-to-date performance. In health care, two particularly strong contributors to results were US Oncology, which delivers cancer-treatment services to health care providers, and Beverly Enterprises, an elder care company that owns and operates 373 facilities in the U.S. and has been aggressively reorganizing its business by shedding unprofitable properties.
An overweighted position in energy stocks also helped returns, with companies such as Range Resources Corporation benefiting from rising prices and increased production. The oil and gas explorer, primarily located in the southwest and Gulf Coast, reported improved net income. Our investment team believes the portfolio’s energy stocks are undervalued, and therefore, anticipate improved performance in the latter half of 2004.
The less-successful performance from certain names in the materials and financials sectors counterbalanced those positive results. Much of the Fund’s underperformance in materials happened in the second quarter of 2004, when we saw particularly sluggish results from metals and mining stocks. We believe, however, that many of our metals and mining holdings are undervalued and could rebound in the second half of the year.
In the processing sector, despite excellent end-market demand, shares of GrafTech International underperformed because sharply higher costs for energy and petroleum-based raw materials caused some moderation in 2004 earnings expectations. However, supply for GrafTech’s graphite electrodes remains tight and the prospects for further price increases in 2005 are good. Also, shares of Apex Silver Mines and other metals-related companies faltered, in response to news that China was increasing interest rates and, therefore, throttling back demand for resources and raw materials. Contrary to this, we believe that China’s action should help to maintain more sustainable growth in demand for raw material inputs, for a longer period of time than might otherwise be the case.
At the end of the period, we remained significantly underweighted in the financials area because we believed that many of these stocks, especially banks, could face a difficult business environment if interest rates continue to rise. The interest rate hike at the end of June caused pressure on financial firms with interest rate exposure. In a rising rate environment, traditional banks and mortgage companies tend to experience reduced profitability.
Quantitative and fundamental analysis
In managing the Fund, we follow a multidimensional screening process. We use quantitative analysis to narrow the field but spend most of our time on fundamental research. In particular, we try to identify some dynamics for change that are not already reflected in the price of the stocks. This can be a new management team, new business plan, a new product, industry consolidation, or any number of other developments that could favorably influence a company’s prospects.
Future challenges
Equity markets are likely to be challenged by a variety of factors, including geopolitics and the continued threat of terrorism, the prospect of further interest-rate hikes from the Federal Reserve Board, and the November presidential election. We do, however, believe the Fund is well positioned to perform favorably in this type of market climate. Many of the sectors that have added value to the Fund in the past, such as energy and materials, could be poised to perform well in the upcoming market environment because of their low valuations relative to their peers. We also are looking for small caps to continue to outperform, as we believe that they remain underrepresented in most investors’ portfolios.
Thank you for your investment in the Strong Advisor Small Cap Value Fund.
I. Charles Rinaldi |
Portfolio Manager |
6
Fund Highlights
Average Annual Total Returns
As of 6-30-04
Class A1 | |||
1-year | 29.74 | % | |
5-year | 17.99 | % | |
Since Fund Inception (12-31-97) | 17.08 | % | |
Class A, excluding sales load | |||
1-year | 37.66 | % | |
5-year | 19.40 | % | |
Since Fund Inception (12-31-97) | 18.15 | % | |
Class B1 | |||
1-year | 31.64 | % | |
5-year | 18.45 | % | |
Since Fund Inception (12-31-97) | 17.47 | % | |
Class C1 | |||
1-year | 35.57 | % | |
5-year | 18.68 | % | |
Since Fund Inception (12-31-97) | 17.49 | % | |
Class Z2 | |||
1-year | 37.88 | % | |
5-year | 19.64 | % | |
Since Fund Inception (12-31-97) | 18.41 | % | |
Performance is historical and does not guarantee future results. Investment returns and principal value will fluctuate, and you may have a gain or loss when you sell shares. Current performance may be lower or higher than the quoted performance. Call us or visit www.Strong.com for the most recent month-end performance.
Risks: Stock funds should only be considered for long-term goals as values fluctuate in response to the activities of individual companies and general market and economic conditions.
Because smaller companies often have narrower markets and limited financial resources, investments in these stocks present more risk than investments in those of larger, more established companies.
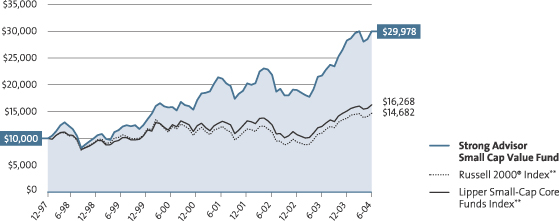
Growth of an Assumed $10,000 Investment†
from 12-31-97 to 6-30-04
Mention of specific securities in this report is not indicative of whether the Fund may make additional purchases of, sell all or a portion of, or continue to hold those securities.
| * | The Morningstar Style BoxTM reveals a fund’s investment strategy. For equity funds, the vertical axis shows the market capitalization of the stocks owned and the horizontal axis shows investment style (value, blend, or growth). |
| † | This graph, provided in accordance with SEC regulations, compares a $10,000 investment in the Fund, made at its inception, with the performance of the Russell 2000® Index and the Lipper Small-Cap Core Funds Index. Results include the reinvestment of all dividends and capital gains distributions. The graph and the Average Annual Total Returns table do not reflect the deduction of taxes, if any, that a shareholder would pay on Fund distributions or the redemption of Fund shares. This graph is based on Class Z shares only; performance for other classes will vary due to differences in fee structures. |
Performance Information: 1Load-adjusted performance reflects the effect of the maximum sales charge of 5.75% for Class A, the applicable contingent deferred sales charge of 5.00% in year 1 and eliminated after year 6 for Class B, and the applicable contingent deferred sales charge of 1.00% and eliminated after 12 months for Class C. The performance of the Class A, B, and C shares is based on the performance of the Fund’s Class Z shares (formerly Retail Class shares) prior to 11-30-00. The performance of the Class A shares is restated to reflect the load and the different expenses of the Class A shares, as applicable. The performance of the Class B and Class C shares are restated to reflect the contingent deferred sales charge and the different expenses of the Class B and Class C shares, as applicable. Please consult a prospectus for information about all share classes.
From time to time, the Fund’s performance was significantly enhanced through investments in initial public offerings (IPOs). In addition, the effect of IPOs purchased when the Fund’s asset base was small may have been magnified. Given these circumstances, you should not expect that such enhanced returns can be consistently achieved. Please consider this before investing.
Fee Waivers: From time to time, the Fund’s advisor and/or administrator has waived fees and/or absorbed Fund expenses, which has resulted in higher returns. As of 6-30-04, there are waivers and/or absorptions in effect.
Percentage Restrictions: The Fund’s prospectus and statement of additional information may describe restrictions on the percentage of a particular type or quality of security in which the Fund may invest (“Percentage Restrictions”). Percentage Restrictions apply at the time the Fund purchases a security. Circumstances subsequent to the purchase of the security, such as a change in: (1) the Fund’s assets (e.g., due to cash inflows and redemptions); (2) the market value of the security; or (3) the pricing, liquidity, or rating of the security, may cause the Fund to exceed or fall short of the Percentage Restriction. If this happens, the Fund’s continued holding of the security will not constitute a violation of the Percentage Restriction.
General: 2The Class Z shares are closed to new accounts, though the Fund may continue to offer its shares to certain company-sponsored retirement plans, institutional investors meeting specific eligibility requirements, and other limited groups as described in the prospectus.
Definitions: **The Russell 2000® Index measures the performance of the 2,000 smallest companies in the Russell 3000 Index, which represents approximately 8% of the total market capitalization of the Russell 3000 Index. The Lipper Small-Cap Core Funds Index is the average of the 30 largest funds in the Lipper Small-Cap Core Funds Category. Source of the Russell Index data is Standard & Poor’s Micropal. Source of the Lipper Index data is Lipper. It is not possible to invest directly in an index.
7
Strong Advisor U.S. Value Fund
The Strong Advisor U.S. Value Fund was able to outperform its broad-based index, the S&P 500 Index, during the past six months. The Fund’s Class Z shares returned 4.57%, while the S&P 500 Index returned 3.44%.
For the first half of 2004, most sectors of the stock market performed positively, thanks to an improving economy and better company fundamentals. Both trends proved more influential than the negative influences of higher interest rates, higher oil prices, and continued terrorist threats. Against this backdrop, small-cap stocks outperformed mid-cap stocks, and mid caps outperformed large caps. Also, value stocks outperformed their growth counterparts during the past six months. Because the market tended to favor value stocks, and because we were willing to own mid-cap stocks not generally found in the S&P 500, the Fund was able to beat its benchmark.
“At the right price and at the right time”
In managing the Strong Advisor U.S. Value Fund, our philosophy is to buy “the right company at the right price and at the right time.” Using this philosophy, we spend the majority of our management time and effort conducting thorough company-by-company research. Such a process served us well during the past six months, as a significant portion of the Fund’s gains could be attributed to the strength of our individual stock selection — especially in the financial sector and, more specifically, the insurance industry.
Although the Fund’s sector weightings are generated not by design, but as a direct result of the individual companies we choose for the portfolio, in hindsight we can detect some interesting trends from the past six months. For example, we see that the Fund was most significantly underweighted in the information technology and financial sectors. We pared back our technology weighting starting in 2003, when we believed that investors were becoming excessively optimistic about the sector’s growth potential and bidding up valuations to unwarranted levels. This underweighting helped the Fund’s performance during the first half of 2004 after tech stocks significantly underperformed the broad market during the year.
Meanwhile, we de-emphasized the companies in the financial sector because of our belief that very few investments in this area of the market offered compelling valuations. For example, regional banks enjoyed strong performance during the bear market of 2001 and 2002 and kept pace during the 2003 bull market. As a result, it has become more difficult to find attractively valued companies in this space. In addition, Fund holdings Bank One, Charter One Financial, and Provident Financial Group all were acquired or agreed to be acquired during the past six months. These acquisitions helped performance, as well as caused our weighting in bank stocks to decline further.
Value in utilities
Our bottom-up stock selection approach also generated an increased emphasis on utility stocks during the past six months. We saw the utility sector as one of the few attractively valued parts of the market. Furthermore, the sector was currently unpopular with many investors, who were concerned about rising interest rates — a concern we believe is overstated — and generally more interested in chasing higher-risk, higher-reward-potential names.
We also decreased the Fund’s weighting in energy stocks. As the period progressed and many of the energy holdings in the portfolio approached intrinsic value, we trimmed our position in the sector. Also contributing to this decision was our belief that oil and natural gas prices had risen faster than their long-term fundamentals warranted.
Focused on value
After the stock market’s impressive performance in 2003, it has become increasingly difficult to find companies available at attractive valuations. In keeping with our management philosophy, we will continue to conduct rigorous research to attempt to find the right companies at the right price and the right time. We believe that our emphasis on attractively valued stocks, as well as our focus on managing the portfolio’s risk, will continue to serve our shareholders well in 2004 and beyond.
Thank you for your investment in the Strong Advisor U.S. Value Fund.
| Robert J. Costomiris |
Portfolio Manager |
8
Fund Highlights
Average Annual Total Returns
As of 6-30-04
Class A1 | |||
1-year | 15.11 | % | |
5-year | –0.29 | % | |
Since Fund Inception (12-29-95) | 9.50 | % | |
Class A, excluding sales load | |||
1-year | 22.17 | % | |
5-year | 0.90 | % | |
Since Fund Inception (12-29-95) | 10.27 | % | |
Class B1 | |||
1-year | 16.14 | % | |
5-year | –0.19 | % | |
Since Fund Inception (12-29-95) | 9.60 | % | |
Class C1 | |||
1-year | 20.12 | % | |
5-year | 0.22 | % | |
Since Fund Inception (12-29-95) | 9.55 | % | |
Class K1 | |||
1-year | 22.60 | % | |
5-year | 1.32 | % | |
Since Fund Inception (12-29-95) | 10.70 | % | |
Class Z2 | |||
1-year | 22.13 | % | |
5-year | 0.96 | % | |
Since Fund Inception (12-29-95) | 10.47 | % | |
Performance is historical and does not guarantee future results. Investment returns and principal value will fluctuate, and you may have a gain or loss when you sell shares. Current performance may be lower or higher than the quoted performance. Call us or visit www.Strong.com for the most recent month-end performance.
Risks: Stock funds should only be considered for long-term goals as values fluctuate in response to the activities of individual companies and general market and economic conditions.
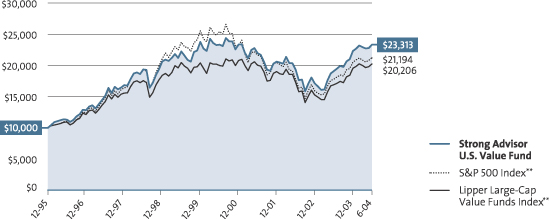
Growth of an Assumed $10,000 Investment†
from 12-29-95 to 6-30-04
Mention of specific securities in this report is not indicative of whether the Fund may make additional purchases of, sell all or a portion of, or continue to hold those securities.
| * | The Morningstar Style BoxTM reveals a fund’s investment strategy. For equity funds, the vertical axis shows the market capitalization of the stocks owned and the horizontal axis shows investment style (value, blend, or growth). |
| † | This graph, provided in accordance with SEC regulations, compares a $10,000 investment in the Fund, made at its inception, with the performance of the S&P 500 Index (“S&P 500”) and the Lipper Large-Cap Value Funds Index. Results include the reinvestment of all dividends and capital gains distributions. The graph and the Average Annual Total Returns table do not reflect the deduction of taxes, if any, that a shareholder would pay on Fund distributions or the redemption of Fund shares. This graph is based on Class Z shares only; performance for other classes will vary due to differences in fee structures. |
Performance Information: 1Load-adjusted performance reflects the effect of the maximum sales charge of 5.75% for Class A, the applicable contingent deferred sales charge of 5.00% in year 1 and eliminated after year 6 for Class B, and the applicable contingent deferred sales charge of 1.00% and eliminated after 12 months for Class C. The performance of the Class A, B, and C shares is based on the performance of the Fund’s Class Z shares (formerly Retail Class shares) prior to 11-30-00. The performance of the Class A shares is restated to reflect the load and the different expenses of the Class A shares. The performance of the Class B and Class C shares are restated to reflect the contingent deferred sales charge and the different expenses of the Class B and Class C shares, as applicable. The performance of Class K shares prior to December 31, 2001, is based on the Fund’s Class Z shares’ performance.
Please consult a prospectus for information about all share classes.
Fee Waivers: From time to time, the Fund’s advisor and/or administrator has waived fees and/or absorbed Fund expenses, which has resulted in higher returns. As of 6-30-04, there are waivers and/or absorptions in effect.
Percentage Restrictions: The Fund’s prospectus and statement of additional information may describe restrictions on the percentage of a particular type or quality of security in which the Fund may invest (“Percentage Restrictions”). Percentage Restrictions apply at the time the Fund purchases a security. Circumstances subsequent to the purchase of the security, such as a change in: (1) the Fund’s assets (e.g., due to cash inflows and redemptions); (2) the market value of the security; or (3) the pricing, liquidity, or rating of the security, may cause the Fund to exceed or fall short of the Percentage Restriction. If this happens, the Fund’s continued holding of the security will not constitute a violation of the Percentage Restriction.
General: 2The Class Z shares are closed to new accounts, though the Fund may continue to offer its shares to certain company-sponsored retirement plans, institutional investors meeting specific eligibility requirements, and other limited groups as described in the prospectus.
Definitions: **The S&P 500 Index consists of 500 stocks chosen for market size, liquidity, and industry group representation. It is a market value weighted index (stock price times number of shares outstanding), with each stock’s weight in the Index proportionate to its market value. The Lipper Large-Cap Value Funds Index is the average of the 30 largest funds in the Lipper Large-Cap Value Funds Category. Source of the S&P Index data is Standard & Poor’s Micropal. Source of the Lipper Index data is Lipper.
It is not possible to invest directly in an index.
9
Strong Advisor Endeavor Large Cap Fund
During the first half of 2004, the Strong Advisor Endeavor Large Cap Fund Class A gained 5.56%, outpacing its broad-based benchmark, the S&P 500 Index, which rose 3.44%. The Fund was positioned to take advantage of the continued strength in economic and corporate profit growth. As a result, the Fund’s return was heavily influenced by solid stock picking among health care, industrial, and information technology sectors.
“Surrounding” our investments
Our approach to portfolio management relies on the careful selection of individual securities through collaborative research. We strive to “surround” each company that we consider for investment. In other words, our team of portfolio managers and analysts interviews not only the companies’ management, but also its competitors, suppliers, and customers. We want to acquire unique insights to support — or reject, in the cases of companies that do not meet our strict requirements — our investment thesis for each individual stock.
Our investment process also emphasizes financial analysis, including a careful review of corporate income statements, as well as the assets on corporate balance sheets. We believe that a company’s balance sheet provides the best way to forecast that business’s future results. We are especially interested in determining the sources of revenue and earnings. We also pay close attention to cash flow and how much investment will be required to generate future cash flow and earnings growth.
Opportunities in Teva and Tyco
Applying our approach, we reviewed a number of potential investment opportunities in the health care sector during the period. As our research progressed, we became concerned about the lack of new products forthcoming by many large-cap pharmaceutical companies, as well as about the considerable number of drugs due to lose their patent protection in the near future. Accordingly, we maintained little exposure to these “name-brand” pharmaceutical businesses. Instead we built a position in Teva Pharmaceutical, the world’s leading developer and manufacturer of generic drugs as well as a supplier of a growing line of branded drugs.
We believe Teva has an outstanding competitive position, as the company dominates the generic drug market in the United States. In addition, Teva’s management team has shown a consistent ability to execute its business strategy, made evident by the company’s track record of stable and diversified earnings. Furthermore, Teva has an impressive pipeline of upcoming products, with over 80 applications for new drugs pending regulatory approval in the U.S. alone. The company also has shown success with its branded drug offerings, such as Copaxone, well on its way to becoming the leading treatment for multiple sclerosis in the United States. Thanks to these strong business trends, Teva has been able to produce solid revenue and earnings growth, and the stock was a significant contributor to the Fund’s performance during the past six months.
We used a similarly careful analysis to increase our position in Tyco International, a company recently beset by a number of questions about its accounting and corporate governance practices. As we started evaluating Tyco after the company installed a new senior management team, we began to see evidence of a significant cultural and financial transformation. Thanks to its new leadership, Tyco has moved from a struggling organization into a company that is increasingly recognized for its impressive cash-flow-generation potential. We grew confident in Tyco’s ability to generate growth through its market-leading positions in health care, fire and security products, and electronics. During the past six months, our position in this stock provided a strong contribution to the Fund’s returns.
Market shift ahead?
We are looking for the second half of 2004 to be a more challenging environment for the market than the first half was. As corporate profits continue to grow, the rate of growth will eventually slow down as companies find it more difficult to surpass prior results. Also, the expectation for further increases in interest rates will place a cap on equity valuations — leaving only limited additional upside potential, in our view. In this environment, we expect the market to begin to reward higher-quality companies with highly predictable earnings and recurring revenues.
Thank you for your investment in the Strong Advisor Endeavor Large Cap Fund. We sincerely appreciate the trust you have placed in us.
| Thomas J. Pence |
Portfolio Manager |
10
Fund Highlights
Average Annual Total Returns
As of 6-30-04
Class A1 | |||
1-year | 16.41 | % | |
Since Fund Inception (9-28-01) | 0.97 | % | |
Class A, excluding sales load | |||
1-year | 23.58 | % | |
Since Fund Inception (9-28-01) | 3.17 | % | |
Class B1 | |||
1-year | 17.86 | % | |
Since Fund Inception (9-28-01) | 1.20 | % | |
Class C1 | |||
1-year | 21.86 | % | |
Since Fund Inception (9-28-01) | 2.60 | % | |
Performance is historical and does not guarantee future results. Investment returns and principal value will fluctuate, and you may have a gain or loss when you sell shares. Current performance may be lower or higher than the quoted performance. Call us or visit www.Strong.com for the most recent month-end performance.
Risks: Stock funds should only be considered for long-term goals as values fluctuate in response to the activities of individual companies and general market and economic conditions.
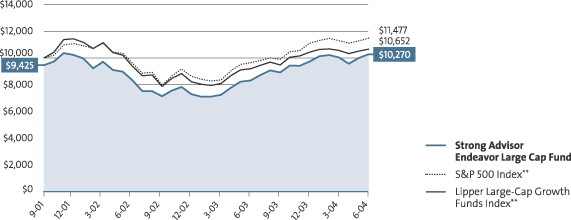
Growth of an Assumed $10,000 Investment†
from 9-28-01 to 6-30-04
Mention of specific securities in this report is not indicative of whether the Fund may make additional purchases of, sell all or a portion of, or continue to hold those securities.
| * | The Morningstar Style BoxTM reveals a fund’s investment strategy. For equity funds, the vertical axis shows the market capitalization of the stocks owned and the horizontal axis shows investment style (value, blend, or growth). |
| † | This graph, provided in accordance with SEC regulations, compares a $10,000 investment in the Fund, made at its inception, with the performance of the S&P 500 Index (“S&P 500”) and the Lipper Large-Cap Growth Funds Index. Results include the reinvestment of all dividends and capital gains distributions. The graph and the Average Annual Total Returns table do not reflect the deduction of taxes, if any, that a shareholder would pay on Fund distributions or the redemption of Fund shares. This graph is based on Class A shares only and reflects the effect of the maximum sales charge of 5.75%; performance for other share classes will vary due to differences in fee structures and sales charges. |
Performance Information: 1Load-adjusted performance reflects the effect of the maximum sales charge of 5.75% for Class A, the applicable contingent sales charge of 5.00% in year 1 and eliminated after year 6 for Class B, and the applicable contingent deferred sales charge of 1.00% and eliminated after 12 months for Class C. Please consult a prospectus for information about all share classes.
Fee Waivers: From time to time, the Fund’s advisor and/or administrator has waived fees and/or absorbed Fund expenses, which has resulted in higher returns. As of 6-30-04, there are waivers and/or absorptions in effect.
Percentage Restrictions: The Fund’s prospectus and statement of additional information may describe restrictions on the percentage of a particular type or quality of security in which the Fund may invest (“Percentage Restrictions”). Percentage Restrictions apply at the time the Fund purchases a security. Circumstances subsequent to the purchase of the security, such as a change in: (1) the Fund’s assets (e.g., due to cash inflows and redemptions); (2) the market value of the security; or (3) the pricing, liquidity, or rating of the security, may cause the Fund to exceed or fall short of the Percentage Restriction. If this happens, the Fund’s continued holding of the security will not constitute a violation of the Percentage Restriction.
Definitions: **The S&P 500 Index consists of 500 stocks chosen for market size, liquidity, and industry group representation. It is a market value weighted index (stock price times number of shares outstanding), with each stock’s weight in the Index proportionate to its market value. The Lipper Large-Cap Growth Funds Index is the average of the 30 largest funds in the Lipper Large-Cap Growth Funds Category. Source of the S&P 500 Index data is Standard & Poor’s Micropal. Source of the Lipper Index data is Lipper.
It is not possible to invest directly in an index.
11
The Strong Advisor Focus Fund Class A has had a very good start to 2004, returning 8.85% versus 3.44% for the S&P 500 Index, its broad-based benchmark.
Taking advantage of a dynamic market
��
The strongest impact on the market during the first half of the year was continued greater-than-anticipated corporate earnings growth. The other main variable influencing the market during the first half of the year was the anticipation of the Federal Reserve’s reversal of its current accommodative short-term interest rate stance. We feel the portfolio is positioned for this occurrence.
The Fund continued to have allocations in economically sensitive sectors such as technology and in specific long-term growth opportunities tied to the consumer. Moreover, as a hybrid of these two sectors, we have positions in stocks with dynamic growth prospects based on business models tied to the Internet. Within the health care sector, we have found some exciting individual stocks, but have found many of the larger-capitalization stocks to have lackluster growth prospects.
While value styles did outperform growth in the period, we were able to benefit from opportunistic investments in equities of high-quality, fast-growing growth stocks.
Research nets new stocks
Stock-specific, proprietary research continues to be at the heart of our portfolio process. We devote many hours to screening for the fastest growing public companies in the economy that also seem to have the best chances for sustained growth. Once we identify these companies on paper, we hit the phones and the road to accumulate data from meetings and conversations with the companies themselves, their customers, their suppliers, and their competitors.
Sometimes a better investment idea comes from this confirmatory research than the original stock idea that generated the analysis. Once a stock makes it into the portfolio this process doesn’t halt, it is dynamic. We constantly research to recheck our theses, while taking into account the opportunity cost of not owning other growth stocks. We do not ignore the macros as they can provide strong headwinds or tailwinds to company specific growth. We also monitor our portfolio risk on many levels including sector allocations.
PETsMART is a good example of the fruits of this process. The company is addressing a growth area in the economy; consumer expenditures on pets. It is also taking market share within its category and its growth opportunities have been continually underestimated. Furthermore, while doing research on PETsMART’s growth potential and the duration of that growth, we have found other exciting growth stocks to add to the portfolio, including Tractor Supply Company.
Looking ahead
Our near-term outlook can be described as optimistic. While we expect short-term interest rates to rise to a more historic level, we are encouraged that the yield curve remains steep, signaling the market’s expectations for continued economic growth. Within this pretext, there are plenty of exciting opportunities to invest in growth stocks. We thank you for your continued support and investment.
| Thomas C. Ognar |
Portfolio Manager |
12
Fund Highlights
Average Annual Total Returns
As of 6-30-04
Class A1 | |||
1-year | 18.12 | % | |
3-year | –7.62 | % | |
Since Fund Inception (11-30-00) | –12.71 | % | |
Class A, excluding sales load | |||
1-year | 25.38 | % | |
3-year | –5.76 | % | |
Since Fund Inception (11-30-00) | –11.26 | % | |
Class B1 | |||
1-year | 19.85 | % | |
3-year | –7.78 | % | |
Since Fund Inception (11-30-00) | –12.97 | % | |
Class C1 | |||
1-year | 23.85 | % | |
3-year | –6.24 | % | |
Since Fund Inception (11-30-00) | –11.80 | % | |
Performance is historical and does not guarantee future results. Investment returns and principal value will fluctuate, and you may have a gain or loss when you sell shares. Current performance may be lower or higher than the quoted performance. Call us or visit www.Strong.com for the most recent month-end performance.
Risks: Stock funds should only be considered for long-term goals as values fluctuate in response to the activities of individual companies and general market and economic conditions.
The Fund is nondiversified, meaning it may concentrate its assets in fewer individual holdings than a diversified fund. Therefore, the Fund is more exposed to individual stock volatility and market pressure than a fully diversified fund.
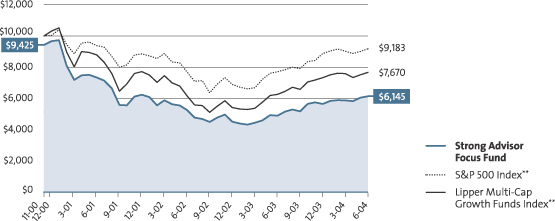
Growth of an Assumed $10,000 Investment†
from 11-30-00 to 6-30-04
Mention of specific securities in this report is not indicative of whether the Fund may make additional purchases of, sell all or a portion of, or continue to hold those securities.
| * | The Morningstar Style BoxTM reveals a fund’s investment strategy. For equity funds, the vertical axis shows the market capitalization of the stocks owned and the horizontal axis shows investment style (value, blend, or growth). |
| † | This graph, provided in accordance with SEC regulations, compares a $10,000 investment in the Fund, made at its inception, with the performance of the S&P 500 Index (“S&P 500”) and the Lipper Multi-Cap Growth Funds Index. Results include the reinvestment of all dividends and capital gains distributions. The graph and the Average Annual Total Returns table do not reflect the deduction of taxes, if any, that a shareholder would pay on Fund distributions or the redemption of Fund shares. This graph is based on Class A shares only and reflects the effect of the maximum sales charge of 5.75%; performance for other classes will vary due to differences in fee structures and sales charges. |
Performance Information: 1Load-adjusted performance reflects the effect of the maximum sales charge of 5.75% for Class A, the applicable contingent deferred sales charge of 5.00% in year 1 and eliminated after year 6 for Class B, and the applicable contingent deferred sales charge of 1.00% and eliminated after 12 months for Class C. Please consult a prospectus for information about all share classes.
Fee Waivers: From time to time, the Fund’s advisor and/or administrator has waived fees and/or absorbed Fund expenses, which has resulted in higher returns. As of 6-30-04, there are waivers and/or absorptions in effect.
Percentage Restrictions: The Fund’s prospectus and statement of additional information may describe restrictions on the percentage of a particular type or quality of security in which the Fund may invest (“Percentage Restrictions”). Percentage Restrictions apply at the time the Fund purchases a security. Circumstances subsequent to the purchase of the security, such as a change in: (1) the Fund’s assets (e.g., due to cash inflows and redemptions); (2) the market value of the security; or (3) the pricing, liquidity, or rating of the security, may cause the Fund to exceed or fall short of the Percentage Restriction. If this happens, the Fund’s continued holding of the security will not constitute a violation of the Percentage Restriction.
Definitions: **The S&P 500 Index consists of 500 stocks chosen for market size, liquidity, and industry group representation. It is a market value weighted index (stock price times number of shares outstanding), with each stock’s weight in the Index proportionate to its market value. The Lipper Multi-Cap Growth Funds Index is the average of the 30 largest funds in the Lipper Multi-Cap Growth Funds Category. Source of the S&P Index data is Standard & Poor’s Micropal. Source of the Lipper Index data is Lipper. It is not possible to invest directly in an index.
13
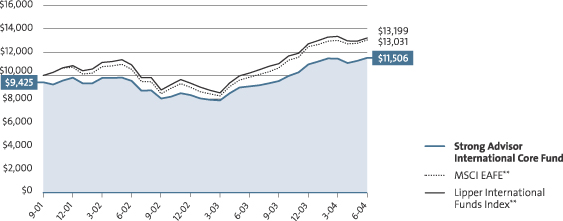
Strong Advisor International Core Fund
The Strong Advisor International Core Fund Class A returned 5.11% during the six months ended June 30, 2004. This result modestly beat the Fund’s benchmark, the MSCI EAFE Index, which returned 4.56% during the same time frame.
This relative outperformance can primarily be attributed to strong results from some of the Fund’s large holdings. As global investors became more risk-averse in the first half of 2004, they increasingly favored high-quality, defensive growth stocks. Those investments that did best tended to have consistent sales and earnings growth, strong balance sheets, and strong leadership — the same types of qualities we favor for the portfolio. Among the names that met these criteria and helped our performance during the past six months were Tesco, the United Kingdom-based food retailer; Essilor, a French optical-supplies manufacturer; Canon, the Japanese imaging solutions giant; and Autoliv, a Swedish maker of automotive-safety equipment.
These positive results were partially counterbalanced by weakness in the Fund’s country allocation. In particular, the Fund was hurt by exposure to Brazilian and South African metals and mining stocks, which fell sharply in response to commodity prices correcting from recent peaks. Overweight positions in Hong Kong and Singapore also detracted from performance, although the underweight exposure to the U.K. market did help results.
Change in investor sentiment
World stock market performance was mixed during the past six months, reflecting a shift from the “risk seeking” investor attitude in 2003. The first quarter of 2004 was characterized by continued optimism surrounding global economic expansion and corporate earnings growth. Asia — especially China and Japan — was the prime beneficiary of this sentiment.
During the second quarter, however, investors grew increasingly sensitive to geopolitical and economic risks. Continued tensions in the Middle East, high oil prices, and early signs of a slowdown in China dampened stock investors’ enthusiasm. Against this backdrop, Europe’s markets posted the stronger returns, while Asian stock markets tumbled as investors sold securities to lock in profits.
Asian opportunities
During the past year, Asia, especially China, has been a key region for global investors. China’s fast-growing economy has led to strong demand for goods and services, and the country’s low-cost manufacturing base and growing “middle class” of consumers has generated strong export growth from such countries as Japan and Germany. It also has generated new sources of demand for the world’s major multinational companies.
Although the Fund had no direct investment in China, it did benefit from its economic growth by owning companies such as Japan’s Komatsu, a construction-equipment firm that supplies heavy machinery for China’s infrastructure development needs. We also had previously identified the metals and mining sector as a beneficiary of China’s demand for raw materials, leading to positions in companies including Australia-based BHP Billiton and Brazil-based Companhia Vale do Rio Doce (CVRD).
China’s high growth potential, however, comes with a high degree of risk. It was reasonable to assume that China’s economy would eventually slow down — as it did late in the period — and that companies and markets supplying the country would feel an eventual negative impact. In response to this concern, we reduced our holdings in Komatsu and eliminated our U.K.-based Anglo American position.
Japan was an important factor for the Fund’s performance during the past six months. Among the world’s largest stock markets, Japan’s turned in the best performance during the period, even after a second quarter correction. After a decade-long recession, the country’s economy has been enjoying a strong recovery as consumer and business spending, along with export growth, have increased. The Fund’s holdings in Japan were balanced among large exporters such as Toyota Motor and Hitachi, companies tied to increases in consumer spending such as department stores Hankyu and Daimaru, and economically sensitive industrials including Kansai Paint and East Japan Railway.
Moderate returns ahead?
Stocks are expected to deliver moderate returns in 2004, against a backdrop of continued economic expansion and moderate inflation. At current levels, global equities appear reasonably valued. Further gains are likely to come if corporate earnings can meet or exceed realistic investor expectations. In this environment, we continue to favor companies showing improved profitability and with the best prospects for increased sales growth. We also are favoring those companies offering investors an attractive valuation relative to their history and their competitors.
Thank you for your investment in the Strong Advisor International Core Fund.
| Stacey Ho | Katherine Schapiro | |
Portfolio Co-Manager | Portfolio Co-Manager |
14
Fund Highlights
Average Annual Total Returns
As of 6-30-04
Class A1,2 | |||
1-year | 19.56 | % | |
Since Fund Inception (9-28-01) | 5.23 | % | |
Class A, excluding sales load | |||
1-year | 26.90 | % | |
Since Fund Inception (9-28-01) | –11.26 | % | |
Class B1,2 | |||
1-year | 22.08 | % | |
Since Fund Inception (9-28-01) | 6.19 | % | |
Class C1,2 | |||
1-year | 26.27 | % | |
Since Fund Inception (9-28-01) | 7.50 | % | |
Performance is historical and does not guarantee future results. Investment returns and principal value will fluctuate, and you may have a gain or loss when you sell shares. Current performance may be lower or higher than the quoted performance. Call us or visit www.Strong.com for the most recent month-end performance.
Risks: Stock funds should only be considered for long-term goals as values fluctuate in response to the activities of individual companies and general market and economic conditions.
An investment in this Fund entails the special risks of international investing, including currency exchange fluctuation, government regulations, and the potential for political and economic instability. The Fund’s share price is expected to be more volatile than that of a U.S.-only fund. These risks are generally intensified for investments in emerging markets.
Growth of an Assumed $10,000 Investment†
from 9-28-01 to 6-30-04
Mention of specific securities in this report is not indicative of whether the Fund may make additional purchases of, sell all or a portion of, or continue to hold those securities.
| * | The Morningstar Style BoxTM reveals a fund’s investment strategy. For equity funds, the vertical axis shows the market capitalization of the stocks owned and the horizontal axis shows investment style (value, blend, or growth). |
| † | This graph, provided in accordance with SEC regulations, compares a $10,000 investment in the Fund, made at its inception, with the performance of the Morgan Stanley Capital International Europe, Australasia, and Far East Index (“MSCI EAFE”) and the Lipper International Funds Index. Results include the reinvestment of all dividends and capital gains distributions. The graph and the Average Annual Total Returns table do not reflect the deduction of taxes, if any, that a shareholder would pay on Fund distributions or the redemption of Fund shares. This graph is based on Class A shares only and reflects the effect of the maximum sales charge of 5.75%; performance for other share classes will vary due to differences in fee structures and sales charges. |
Performance Information: 1Load-adjusted performance reflects the effect of the maximum sales charge of 5.75% for Class A, the applicable contingent sales charge of 5.00% in year 1 and eliminated after year 6 for Class B, and the applicable contingent deferred sales charge of 1.00% and eliminated after 12 months for Class C.
2 The Fund’s Class A, B, and C shares have a redemption fee of 1.00% against shares that are held 30 calendar days or fewer after purchase. Performance data does not reflect the deduction of this fee, which, if reflected, would reduce the performance.
Please consult a prospectus for information about all share classes.
Fee Waivers: From time to time, the Fund’s advisor and/or administrator has waived fees and/or absorbed Fund expenses, which has resulted in higher returns. As of 6-30-04, there are waivers and/or absorptions in effect.
Percentage Restrictions: The Fund’s prospectus and statement of additional information may describe restrictions on the percentage of a particular type or quality of security in which the Fund may invest (“Percentage Restrictions”). Percentage Restrictions apply at the time the Fund purchases a security. Circumstances subsequent to the purchase of the security, such as a change in: (1) the Fund’s assets (e.g., due to cash inflows and redemptions); (2) the market value of the security; or (3) the pricing, liquidity, or rating of the security, may cause the Fund to exceed or fall short of the Percentage Restriction. If this happens, the Fund’s continued holding of the security will not constitute a violation of the Percentage Restriction.
Definitions: **The MSCI EAFE® Index (Europe, Australasia, Far East) is a free float-adjusted market capitalization index that is designed to measure developed market equity performance, excluding the U.S. and Canada. The Lipper International Funds Index is the average of the 30 largest funds in the Lipper International Funds Category. These funds invest assets in securities with primary trading markets outside of the United States. Source of the MSCI EAFE Index data is Standard & Poor’s Micropal. Source of the Lipper Index data is Lipper. It is not possible to invest directly in an index.
15
During the first half of 2004, the Strong Advisor Select Fund Class A gained 9.45%, decisively outpacing its broad-based benchmark, the S&P 500 Index, which rose 3.44%. As the profit recovery continued, the Fund was positioned in holdings that delivered strong earnings growth relative to the broad market. Specifically, the Fund benefited from very strong security selection within health care, consumer discretionary, and information technology sectors.
Careful research and financial analysis
Our approach to portfolio management relies on the careful selection of individual securities through collaborative research. We strive to “surround” each company that we consider for investment. In other words, our team of portfolio managers and analysts interviews not only the companies’ management, but also their competitors, suppliers, and customers. We want to acquire unique insights to support — or reject, in the cases of companies that fail to meet our strict requirements — our investment thesis for each individual stock. The Fund takes particular advantage of this process, as we limit the number of portfolio holdings to what we believe are our best 30 to 40 investment ideas.
Our investment process also emphasizes financial analysis, including a careful review of corporate income statements, as well as the assets on corporate balance sheets. We believe that analyzing a company’s balance sheet provides the best way to forecast the business’s future results. We are especially interested in determining the sources of a company’s revenue and earnings. We also pay close attention to cash flow and how much investment will be required to generate future cash flow and earnings growth.
Opportunities in Yahoo! and Tyco
Applying our approach, we built a position in Yahoo!, a provider of Internet consumer and business services. Yahoo!’s business strength is driven by branded advertising. Our research led us to conclude that many companies plan to increase advertising spending in the near future. Furthermore, corporations appear to be particularly attracted to Internet advertising, especially since consumers now view 15% of their media content online. More and more advertisers, in fact, have been looking to the Internet as an effective alternative to traditional television advertising, which has been hurt by declining ratings and the proliferation of digital video recorders.
At the time of our research, we saw Yahoo! as very well positioned to take advantage of this shift in advertising spending. With 40% of Internet users using Yahoo!’s search function, the company enjoys strong brand recognition and a large user base. Yahoo! also is beginning to realize the benefit of offering a full suite of advertising products, including increasingly lucrative “paid search” advertising. Finally, we believed Yahoo! could continue to benefit from growth opportunities overseas; the company has been investing heavily to enter and take market share from less-sophisticated, regional Internet portals.
We used a similarly careful analysis to increase our position in Tyco International, which was recently beset by a number of questions about its accounting and corporate governance practices. As we started evaluating Tyco after the company installed a new senior management team, we began to see evidence of a significant cultural and financial transformation. Thanks to its new leadership, Tyco has moved from a struggling organization into a company that is increasingly recognized for its impressive cash-flow-generation potential. We grew confident in Tyco’s ability to generate growth through its market-leading positions in health care, fire and security products, and electronics. During the past six months, our position in this stock provided a strong contribution to the Fund’s returns.
A tougher market ahead?
Although corporate earnings and profitability are expected to continue to rise, we believe that stock valuations are already reflecting these likely trends. Thus, we are looking for gains from this point to be produced by a select group of high-quality stocks with predictable earnings. Against this backdrop, we plan to focus on companies with promising opportunities to reinvest in their business to produce stable revenue and profit growth, and the ability to keep prices high in a competitive business environment.
Thank you for your investment in the Strong Advisor Select Fund. We sincerely appreciate the trust you have placed in us.
| Thomas J. Pence | Erik J. Voss | |
Portfolio Co-Manager | Portfolio Co-Manager |
16
Fund Highlights
Average Annual Total Returns
As of 6-30-04
Class A1 | |||
1-year | 26.03 | % | |
3-year | –1.25 | % | |
Since Fund Inception (12-29-00) | –4.09 | % | |
Class A, excluding sales load | |||
1-year | 33.77 | % | |
3-year | 0.72 | % | |
Since Fund Inception (12-29-00) | –2.46 | % | |
Class B1 | |||
1-year | 27.94 | % | |
3-year | –1.37 | % | |
Since Fund Inception (12-29-00) | –4.10 | % | |
Class C1 | |||
1-year | 31.74 | % | |
3-year | –0.01 | % | |
Since Fund Inception (12-29-00) | –3.16 | % | |
Performance is historical and does not guarantee future results. Investment returns and principal value will fluctuate, and you may have a gain or loss when you sell shares. Current performance may be lower or higher than the quoted performance. Call us or visit www.Strong.com for the most recent month-end performance.
Risks: Stock funds should only be considered for long-term goals as values fluctuate in response to the activities of individual companies and general market and economic conditions.
The Fund is nondiversified, meaning it may concentrate its assets in fewer individual holdings than a diversified fund. Therefore, the Fund is more exposed to individual stock volatility and market pressure than a fully diversified fund.
Growth of an Assumed $10,000 Investment†
from 12-29-00 to 6-30-04
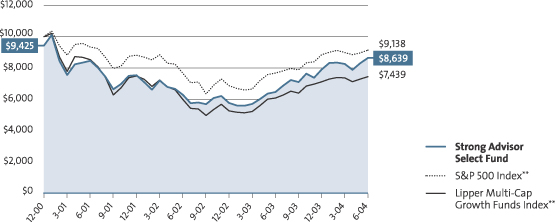
Mention of specific securities in this report is not indicative of whether the Fund may make additional purchases of, sell all or a portion of, or continue to hold those securities.
| * | The Morningstar Style BoxTM reveals a fund’s investment strategy. For equity funds, the vertical axis shows the market capitalization of the stocks owned and the horizontal axis shows investment style (value, blend, or growth). |
| † | This graph, provided in accordance with SEC regulations, compares a $10,000 investment in the Fund, made at its inception, with a similar investment in the S&P 500 Index (“S&P 500”) and the Lipper Multi-Cap Growth Funds Index. Results include the reinvestment of all dividends and capital gains distributions. The graph and the Average Annual Total Returns table do not reflect the deduction of taxes, if any, that a shareholder would pay on Fund distributions or the redemption of Fund shares. This graph is based on Class A shares only and reflects the effect of the maximum sales charge of 5.75%; performance for other classes will vary due to differences in fee structures and sales charges. |
Performance Information: 1Load-adjusted performance reflects the effect of the maximum sales charge of 5.75% for Class A, the applicable contingent deferred sales charge of 5.00% in year 1 and eliminated after year 6 for Class B, and the applicable contingent deferred sales charge of 1.00% and eliminated after 12 months for Class C. Please consult a prospectus for information about all share classes.
Fee Waivers: From time to time, the Fund’s advisor and/or administrator has waived fees and/or absorbed Fund expenses, which has resulted in higher returns. As of 6-30-04, there are waivers and/or absorptions in effect.
Performance Restrictions: The Fund’s prospectus and statement of additional information may describe restrictions on the percentage of a particular type or quality of security in which the Fund may invest (“Percentage Restrictions”). Percentage Restrictions apply at the time the Fund purchases a security. Circumstances subsequent to the purchase of the security, such as a change in: (1) the Fund’s assets (e.g., due to cash inflows and redemptions); (2) the market value of the security; or (3) the pricing, liquidity, or rating of the security, may cause the Fund to exceed or fall short of the Percentage Restriction. If this happens, the Fund’s continued holding of the security will not constitute a violation of the Percentage Restriction.
Definitions: **The S&P 500 Index consists of 500 stocks chosen for market size, liquidity, and industry group representation. It is a market value weighted index (stock price times number of shares outstanding), with each stock’s weight in the Index proportionate to its market value. The Lipper Multi-Cap Growth Funds Index is the average of the 30 largest funds in the Lipper Multi-Cap Growth Funds Category. Source of the S&P Index data is Standard & Poor’s Micropal. Source of the Lipper Index data is Lipper.
It is not possible to invest directly in an index.
17
Strong Advisor Technology Fund
After a strong year for technology stocks in 2003, the sector fell into the doldrums in the first half of 2004. Primarily for this reason, the Strong Advisor Technology Fund underperformed its broad-based benchmark, the S&P 500 Index. The Fund’s Class A shares posted a return of -7.40% for the six months ended June 30, 2004, while the Index returned 3.44% for the same period.
A weaker environment for technology
The overall market climate started the year with a strong tone, but soon moved into what was essentially a sideways trading pattern that persisted for the remainder of the first half. Concerns about the continued conflict in Iraq, the uncertainty surrounding a presidential election, higher than expected inflation rates (especially with respect to oil prices), and a sentiment that world economic growth may be slowing all weighed on the equity markets.
Technology stocks, which are cyclical in nature, typically perform best when macroeconomic political factors are positive, so the change in market temperament was especially difficult for stocks in the sector to weather. Semiconductor and software stocks were particularly weak toward the end of the six months.
Our larger emphasis on smaller-cap technology stocks during the first half of the year also contributed to the Fund’s underperformance. The fund was structured this way to benefit from a continuation of the strong economic environment we experienced in the second half of 2003. Our outlook continues to be positive for this area of the market as we believe smaller-caps currently present more attractive investment opportunities than large-caps in the tech sector.
Our approach to the tech sector
In the Fund, we seek to maintain a balance among the various subsectors that make up the technology universe: semiconductors and related equipment, software, computer hardware and storage, business services, and biotechnology. We seek to identify the companies within each subsector that we believe have the best fundamental qualities and are positioned to outperform. To this end, we look for companies with above-average growth prospects, strong intellectual property, excellent management teams, and achievable financing plans.
Although we do seek to keep a balanced representation of all major subsectors, our bottom-up, stock selection process, rather than a rigid, top-down asset allocation program, primarily drives the portfolio’s makeup. At this point, the software subsector is somewhat underrepresented in the portfolio, primarily because a severe downturn in that industry has left few companies that meet our rigorous fundamental criteria.
In choosing stocks for the portfolio, we employ a relative valuation technique. The key element of this strategy is looking at a stock’s PEG ratio. This figure represents the relationship of a company’s price/earnings ratio — a key measure that indicates how expensive a stock is relative to the earnings the company generates — to its projected five-year compound annual growth rate. We are interested in finding companies with favorable PEG ratios — that is, those that are positioned to deliver attractive levels of growth and offer reasonable valuations.
One example of the type of company that meets our selection criteria is eBay, which was one of the best-performing stocks in the portfolio for the first half of the year. Since the company’s formation, eBay has been able to successfully execute its business plan and has now become the U.S. standard for online merchandise trading. Its management team is outstanding.
The company’s business model not only scales across different markets (for example, it is now the largest online wholesaler of cars), but also expands geographically — with similar success around the globe. The company continues to gain market share and has become a legitimate threat to conventional store-based retailers. The company is self-financed (which, among other things, should help to insulate it from rising interest rates). This array of strong fundamental qualities should, we believe, position the company for further success.
Our outlook for the coming months
In our view, the outlook for technology stocks for the remainder of the year is positive, assuming that the economic recovery continues into 2005. The outlook for the main technology end markets — PCs, wireless telephony, and the Internet — continues to be good with respect to the number of units sold.
The main technology supertrend that we see is the convergence of the personal computer and consumer electronics industries. The companies that master this climate of change should be able to dominate technology spending over the next five years. We believe we have already identified many of these companies. Given the rapidity of change in the technology realm, however, we will continue to vigilantly monitor the market and be prepared to make shifts as conditions warrant.
Thank you for your investment in the Strong Advisor Technology Fund.
James B. Burkart |
Portfolio Manager |
18
Fund Highlights
Average Annual Total Returns
As of 6-30-04
Class A1 | |||
1-year | 15.63 | % | |
3-year | –9.15 | % | |
Since Fund Inception (11-30-00) | –11.35 | % | |
Class A, excluding sales load | |||
1-year | 22.64 | % | |
3-year | –7.33 | % | |
Since Fund Inception (11-30-00) | –9.87 | % | |
Class B1 | |||
1-year | 17.60 | % | |
3-year | –9.08 | % | |
Since Fund Inception (11-30-00) | –11.37 | % | |
Class C1 | |||
1-year | 21.28 | % | |
3-year | –7.52 | % | |
Since Fund Inception (11-30-00) | –10.35 | % | |
Performance is historical and does not guarantee future results. Investment returns and principal value will fluctuate, and you may have a gain or loss when you sell shares. Current performance may be lower or higher than the quoted performance. Call us or visit www.Strong.com for the most recent month-end performance.
Risks: Stock funds should only be considered for long-term goals as values fluctuate in response to the activities of individual companies and general market and economic conditions.
The Fund concentrates its assets in the technology market sector. As a result, the Fund’s shares are likely to fluctuate in value more than those of a fund investing in a broader range of securities.
Growth of an Assumed $10,000 Investment†
from 11-30-00 to 6-30-04
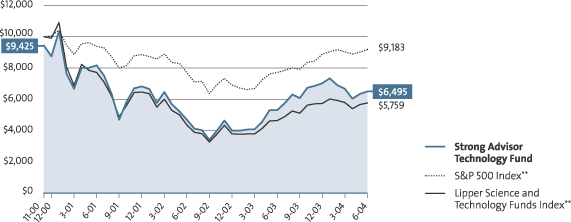
Mention of specific securities in this report is not indicative of whether the Fund may make additional purchases of, sell all or a portion of, or continue to hold those securities.
| * | The Morningstar Style BoxTM reveals a fund’s investment strategy. For equity funds, the vertical axis shows the market capitalization of the stocks owned and the horizontal axis shows investment style (value, blend, or growth). |
| † | This graph, provided in accordance with SEC regulations, compares a $10,000 investment in the Fund, made at its inception, with the performance of the S&P 500 Index (“S&P 500”) and the Lipper Science and Technology Funds Index. Results include the reinvestment of all dividends and capital gains distributions. The graph and the Average Annual Total Returns table do not reflect the deduction of taxes, if any, that a shareholder would pay on Fund distributions or the redemption of Fund shares. This graph is based on Class A shares only and reflects the effect of the maximum sales charge of 5.75%; performance for other classes will vary due to differences in fee structures and sales charges. |
Performance Information: 1Load-adjusted performance reflects the effect of the maximum sales charge of 5.75% for Class A, the applicable contingent deferred sales charge of 5.00% in year 1 and eliminated after year 6 for Class B, and the applicable contingent deferred sales charge of 1.00% and eliminated after 12 months for Class C. Please consult a prospectus for information about all share classes.
Fee Waivers: From time to time, the Fund’s advisor and/or administrator has waived fees and/or absorbed Fund expenses, which has resulted in higher returns. As of 6-30-04, there are waivers and/or absorptions in effect.
Percentage Restrictions: The Fund’s prospectus and statement of additional information may describe restrictions on the percentage of a particular type or quality of security in which the Fund may invest (“Percentage Restrictions”). Percentage Restrictions apply at the time the Fund purchases a security. Circumstances subsequent to the purchase of the security, such as a change in: (1) the Fund’s assets (e.g., due to cash inflows and redemptions); (2) the market value of the security; or (3) the pricing, liquidity, or rating of the security, may cause the Fund to exceed or fall short of the Percentage Restriction. If this happens, the Fund’s continued holding of the security will not constitute a violation of the Percentage Restriction.
Definitions: **The S&P 500 Index consists of 500 stocks chosen for market size, liquidity, and industry group representation. It is a market value weighted index (stock price times number of shares outstanding), with each stock’s weight in the Index proportionate to its market value. The Lipper Science and Technology Funds Index is the average of the 30 largest funds in the Lipper Science and Technology Funds Category. Source of the S&P Index data is Standard & Poor’s Micropal. Source of the Lipper Index data is Lipper. It is not possible to invest directly in an index.
19
Strong Advisor U.S. Small/Mid Cap Growth Fund
After a very strong year for the Fund in 2003, the first half of 2004 was more difficult. For the six months ended June 30, 2004, the Strong Advisor U.S. Small/Mid Cap Growth Fund Class A returned -0.80%, placing it behind its broad-based benchmark, the Russell Midcap Index, which returned 6.67% for the same period. The Fund’s underperformance occurred primarily in the year’s first quarter. During the second quarter, the Fund’s performance was more closely in line with the benchmark.
Factors in our performance
There were two primary factors driving the Fund’s underperformance. The first reason was tied to the overall state of the economy. There was a general contraction of stock valuations that took place in January and February, as weak economic data caused many investors to question the strength of the recovery, and thus to lose some confidence in stocks’ growth prospects. Then, in the second quarter, the economy began to pick up steam. In response, the Federal Reserve signaled that it was ready to raise short-term interest rates to help keep the economy from overheating and to help keep inflation in check. Higher interest rates have traditionally hurt the fastest-growing companies — the type we favor for this portfolio — the most.
The other reason for the Fund’s underperformance was a result of certain stock selections we made with respect to the hospice services area, which accounted for two of our largest positions. One company that provided tremendous returns last year, Odyssey HealthCare, unexpectedly lowered its guidance on its fourth-quarter earnings. This event hurt not only this company’s stock price, but also those of other companies in the industry. The cost to our overall returns was over one percentage point. We have subsequently sold both of our holdings in this area, as the outlook remains uncertain.
On a broader note, the highest-growth areas of the market, such as technology, significantly underperformed more defensive sectors, such as energy. On the whole, value style stocks outperformed growth stocks.
Positioned for a stronger economy
Entering 2004, we did not make any substantial changes to our overall positioning from 2003; the portfolio remained poised to benefit from an improving business environment and increasing consumer confidence. This positioning appears to still be appropriate, as we are now seeing an American economy that continues to gain strength. Despite sluggish job growth early in 2004, recent data indicated the economy added more than 300,000 jobs in March alone. This continued into the second quarter.
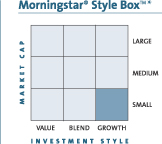
Manufacturing orders and retail spending have also been strong so far this year. The vast majority of companies we speak with are expressing solid optimism about their businesses. Although the potential for further interest-rate increases during the year remains, we believe this trend presents limited risk to the companies in the portfolio. This is because we look for companies with little debt, and we have also significantly underweighted stocks from the financial sector, which could face the most volatility from rising rates. In the short term, it is true that some stocks may fluctuate in value due to interest-rate concerns. In the longer view, however, we believe profit growth ultimately drives stock performance and that this Fund’s portfolio of high-quality, fast-growing companies should be able to do well in this environment.
Our outlook
Now that the Federal Reserve has raised short-term rates, we think the worst of the resulting volatility is behind us. Normally, small-cap growth stocks appreciate in value after one or two Federal Reserve rate hikes — and we anticipate that is all it will take to cool down the economy. We expect to see strong corporate earnings in the upcoming quarters as well. Given that we believe many stocks have been taken down to reasonable valuations, we believe such earnings improvements could help to drive prices higher, which could help the small-cap growth sector to perform well in the second half of the year.
Thank you for your investment in the Strong Advisor U.S. Small/Mid Cap Growth Fund.
| Thomas L. Press |
Portfolio Manager |
20
Fund Highlights
Average Annual Total Returns
As of 6-30-04
Class A1 | |||
1-year | 15.50 | % | |
Since Fund Inception (3-28-02) | 2.02 | % | |
Class A, excluding sales load | |||
1-year | 22.52 | % | |
Since Fund Inception (3-28-02) | 4.73 | % | |
Class B1 | |||
1-year | 17.41 | % | |
Since Fund Inception (3-28-02) | 3.00 | % | |
Class C1 | |||
1-year | 21.38 | % | |
Since Fund Inception (3-28-02) | 4.73 | % | |
Performance is historical and does not guarantee future results. Investment returns and principal value will fluctuate, and you may have a gain or loss when you sell shares. Current performance may be lower or higher than the quoted performance. Call us or visit www.Strong.com for the most recent month-end performance.
Risks: Stock funds should only be considered for long-term goals as values fluctuate in response to the activities of individual companies and general market and economic conditions.
Because smaller companies often have narrower markets and limited financial resources, investments in these stocks present more risk than investments in those of larger, more established companies.
Growth of an Assumed $10,000 Investment†
from 3-28-02 to 6-30-04
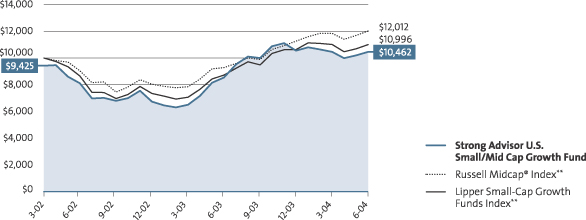
Mention of specific securities in this report is not indicative of whether the Fund may make additional purchases of, sell all or a portion of, or continue to hold those securities.
| * | The Morningstar Style BoxTM reveals a fund’s investment strategy. For equity funds, the vertical axis shows the market capitalization of the stocks owned and the horizontal axis shows investment style (value, blend, or growth). |
| † | This graph, provided in accordance with SEC regulations, compares a $10,000 investment in the Fund, made at its inception, with the performance of the Russell Midcap® Index and the Lipper Small-Cap Growth Funds Index. Results include the reinvestment of all dividends and capital gains distributions. The graph and the Average Annual Total Returns table do not reflect the deduction of taxes, if any, that a shareholder would pay on Fund distributions or the redemption of Fund shares. This graph is based on Class A shares only and reflects the effect of the maximum sales charge of 5.75%; performance for other classes will vary due to differences in fee structures and sales charges. |
Performance Information: 1Load-adjusted performance reflects the effect of the maximum sales charge of 5.75% for Class A, the applicable contingent deferred sales charge of 5.00% in year 1 and eliminated after year 6 for Class B, and the applicable contingent deferred sales charge of 1.00% and eliminated after 12 months for Class C. Please consult a prospectus for information about all share classes.
Fee Waivers: From time to time, the Fund’s advisor and/or administrator has waived fees and/or absorbed Fund expenses, which has resulted in higher returns. As of 6-30-04, there are waivers and/or absorptions in effect.
Percentage Restrictions: The Fund’s prospectus and statement of additional information may describe restrictions on the percentage of a particular type or quality of security in which the Fund may invest (“Percentage Restrictions”). Percentage Restrictions apply at the time the Fund purchases a security. Circumstances subsequent to the purchase of the security, such as a change in: (1) the Fund’s assets (e.g., due to cash inflows and redemptions); (2) the market value of the security; or (3) the pricing, liquidity, or rating of the security, may cause the Fund to exceed or fall short of the Percentage Restriction. If this happens, the Fund’s continued holding of the security will not constitute a violation of the Percentage Restriction.
Definitions: **The Russell Midcap® Index measures the performance of the 800 smallest companies in the Russell 1000 Index, which represent approximately 26% of the total market capitalization of the Russell 1000 Index. The Lipper Small-Cap Growth Funds Index is the average of the 30 largest funds in the Lipper Small-Cap Growth Funds Category. Source of the Russell Index data is Standard & Poor’s Micropal. Source of the Lipper Index data is Lipper. It is not possible to invest directly in an index.
21
Strong Advisor Utilities and Energy Fund
The Strong Advisor Utilities and Energy Fund Class A returned 5.05% for the six months ended June 30, 2004. That placed slightly ahead of its broad-based benchmark, the S&P 500 Index, which returned 3.44% for the same period.
A mix of positives and negatives
Several market factors drove the Fund’s performance during the first half of the year. Positive investor sentiment was fueled by relatively attractive dividends paid by stocks that were among our portfolio holdings. We also benefited from holding stocks that were able to capitalize on rising natural gas and crude oil prices. Increasing demand for fuel in Asia, political instability in Venezuela and Nigeria, and Iraqi instability all contributed to the high price of oil.
With changes to the tax treatment of certain dividends paid by utility and energy companies, these stocks gained after-tax appeal to investors that helped to support their share prices.
Although there were many positive factors supporting the performance of stocks in the portfolio, stocks were overwhelmed by many forces. Robust economic news, especially favorable employment data, sparked fears accompanying interest-rate hikes. Four years of abnormally low rates were ushered out with a vengeance in April, which saw a sharp sell-off of bonds and stocks from interest-rate sensitive sectors, particularly utilities. The Fund was able to weather this interest-rate storm, however, as a consequence of having allocated more than half of its assets to cash and sectors that are less sensitive to rising interest rates, including energy and gas utilities.
A look at sectors
Our allocation of assets to various market sectors is based on fundamental research and remains crucial to the performance of this Fund. We adjusted the portfolio’s sector weightings to reflect what we believe are currently four important investment themes: rising interest rates, commodity price inflation, global terrorism, and proposed federal energy legislation. All of these themes influenced the market in the first half of 2004, though we anticipate that they will be less active in the remainder of the year.
A brief overview of these themes may be helpful. The widely anticipated quarter percentage point interest-rate increase by the Federal Reserve Board was, as we have noted, preceded by a reflexive sell-off in interest-rate sensitive sectors, including utilities. This somewhat emotional, but predictable market reaction gave us the opportunity to add to our holdings among financially strong companies at lower prices than we could have found earlier. It also allowed us to increase our holdings in the electric utility sector at reasonable valuations.
Commodity price inflation was most evident in the oil and natural-gas sectors. The major integrated oil companies such as ExxonMobil and BP, exploration and production companies Devon Energy and Anadarko Petroleum, and particularly refiner Ashland, all contributed significantly to the Fund’s performance. Global crude oil prices exceeded $40 per barrel, with analysts estimating that $10 of that figure represents a premium attributable to fear of terrorist activity interrupting supply. The portfolio was overweighted, relative to the benchmark, in energy and gas utilities throughout the first half of the year; performance benefited accordingly.
The fourth theme, energy legislation — specifically the prospect of repeal of the Public Utility Holding Company Act — was not a factor over the period. The energy bill remained stalled in Congress.
We have encountered these types of unfavorable market forces in previous market cycles throughout our 44-year investment history. We do not allow our research focus to be distracted by the daily market concerns that make headlines. Rather, we keep our eye on dividends and dividend policy, which enables our analysts and portfolio managers to identify financially strong companies that are growing earnings with good positive cash flows and capable, shareholder-oriented management. These qualities will, in our opinion, continue to enhance investment performance over the coming quarters and the foreseeable future.
Looking ahead to the second half
With the market volatility and the initial Federal Reserve interest rate increase of the second quarter having passed, we may selectively increase the Fund’s exposure to downtrodden electric utilities and reduce our exposure to the high-flying energy sector. High-quality utilities, given their ability to improve their earnings and dividends, historically recover after adjusting to new interest-rate environments.
We thank you for your continued investment in the Strong Advisor Utilities and Energy Fund.
| William A. Ferer | Mark D. Luftig | |
Portfolio Co-Manager | Portfolio Co-Manager | |
| William H. Reaves | Ronald J. Sorenson | |
Portfolio Co-Manager | Portfolio Co-Manager | |
22
Fund Highlights
Average Annual Total Returns
As of 6-30-04
Class A1 | |||
1-year | 7.87 | % | |
Since Fund Inception (7-31-02) | 3.86 | % | |
Class A, excluding sales load | |||
1-year | 14.45 | % | |
Since Fund Inception (7-31-02) | 7.12 | % | |
Class B1 | |||
1-year | 8.99 | % | |
Since Fund Inception (7-31-02) | 4.63 | % | |
Class C1 | |||
1-year | 13.02 | % | |
Since Fund Inception (7-31-02) | 6.62 | % | |
Performance is historical and does not guarantee future results. Investment returns and principal value will fluctuate, and you may have a gain or loss when you sell shares. Current performance may be lower or higher than the quoted performance. Call us or visit www.Strong.com for the most recent month-end performance.
Risks: Stock funds should only be considered for long-term goals as values fluctuate in response to the activities of individual companies and general market and economic conditions.
The Fund concentrates its assets in the utilities and energy sectors. As a result, the Fund’s shares are likely to fluctuate in value more than those of a Fund investing in a broader range of securities.
Growth of an Assumed $10,000 Investment†
from 7-31-02 to 6-30-04
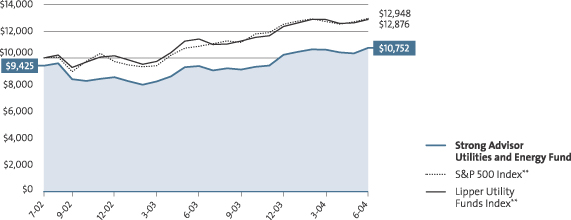
Mention of specific securities in this report is not indicative of whether the Fund may make additional purchases of, sell all or a portion of, or continue to hold those securities.
| * | The Morningstar Style BoxTM reveals a fund’s investment strategy. For equity funds, the vertical axis shows the market capitalization of the stocks owned and the horizontal axis shows investment style (value, blend, or growth). |
| † | This graph, provided in accordance with SEC regulations, compares a $10,000 investment in the Fund, made at its inception, with the performance of the S&P 500 Index (“S&P 500”) and the Lipper Utility Funds Index. Results include the reinvestment of all dividends and capital gains distributions. The graph and the Average Annual Total Returns table do not reflect the deduction of taxes, if any, that a shareholder would pay on Fund distributions or the redemption of Fund shares. This graph is based on Class A shares only and reflects the effect of the maximum sales charge of 5.75%; performance for other classes will vary due to differences in fee structures and sales charges. |
Performance Information: 1Load-adjusted performance reflects the effect of the maximum sales charge of 5.75% for Class A, the applicable contingent deferred sales charge of 5.00% in year 1 and eliminated after year 6 for Class B, and the applicable contingent deferred sales charge of 1.00% and eliminated after 12 months for Class C. Please consult a prospectus for information about all share classes.
Fee Waivers: From time to time, the Fund’s advisor and/or administrator has waived fees and/or absorbed Fund expenses, which has resulted in higher returns. As of 6-30-04, there are waivers and/or absorptions in effect.
Percentage Restrictions: The Fund’s prospectus and statement of additional information may describe restrictions on the percentage of a particular type or quality of security in which the Fund may invest (“Percentage Restrictions”). Percentage Restrictions apply at the time the Fund purchases a security. Circumstances subsequent to the purchase of the security, such as a change in: (1) the Fund’s assets (e.g., due to cash inflows and redemptions); (2) the market value of the security; or (3) the pricing, liquidity, or rating of the security, may cause the Fund to exceed or fall short of the Percentage Restriction. If this happens, the Fund’s continued holding of the security will not constitute a violation of the Percentage Restriction.
Definitions: **The S&P 500 Index consists of 500 stocks chosen for market size, liquidity, and industry group representation. It is a market value weighted index (stock price times number of shares outstanding), with each stock’s weight in the Index proportionate to its market value. The Lipper Utility Funds Index is the average of the 30 largest funds in the Lipper Utility Funds Category. The funds invest primarily in utility shares. Source of the S&P 500 Index data is Standard & Poor’s Micropal. Source of the Lipper Index data is Lipper. It is not possible to invest directly in an index.
23
Strong Advisor Large Company Core Fund
The S&P 500 generally marked time in the first half of 2004, trading in a fairly tight range. Various groups within the market also seemed aimless as value and growth stocks performed basically in-line with one another while small-cap stocks only slightly bested their large- and mid-cap counterparts. The Strong Advisor Large Company Core Fund Class A produced a year-to-date gain of 2.78% in this environment, moderately below the 3.44% return of its broad-based benchmark, the S&P 500 Index.
A three-step investment process
We believe that the foundation for long-term performance is best built one stock at a time from the bottom up. Our process evaluates each individual candidate for inclusion in the portfolio and emphasizes three main attributes. First, we look for improving company fundamentals and earnings quality, which we define as the proportion of earnings that are based on cash flow and not on management’s estimations and forecasts. Next, we look for a strategy that is trying to maximize the long-term value of the business, which we characterize as the present value of the future net cash flows available to the owners of the corporation. Finally, we want to buy securities at a discount to what we feel they are worth. In order to determine this fair value, we use multiple valuation tools, including both absolute and relative value metrics. After building the portfolio in this manner — from the ground up — we apply a suite of risk controls to better understand the portfolio exposures in order to reduce risk for our shareholders.
Applying this process, the Fund owned a position in Alcon, the world’s largest eye-care company and a stock that contributed to results during the past six months. Alcon makes and markets a wide variety of ophthalmic products, including pharmaceuticals, surgical equipment, and contact lens solutions. Since the company’s 2002 spin-off from food giant Nestlé, Alcon has taken advantage of its impressive research-and-development program and vast marketing presence in over 180 countries to earn a worldwide market share of more than 25%. The strength of the firm’s economic model has allowed for this growth while generating over $1 billion in free cash flow after research investments. Furthermore, the company plans to spend over $2 billion on new-product development over the next five years — cause for further optimism, we believe.
A stock we favored but that did not perform well during the past six months was Amdocs, a leading provider of billing and customer-relationship-management software and services to telecommunications companies. The market has punished this stock over short-term concerns that we feel are immaterial to the long-term value of the underlying business. In our view, industry fundamentals appear to be improving, and we believe Amdocs, given its market-leading technology and strong industry relationships, is well positioned to benefit. Also, the firm’s high profitability and low capital intensity allows it to kick off more than $300 million annually — free cash flow that should add to Amdocs value and help limit downside risk. Given these factors, we believe the stock offers a favorable risk-reward profile and thus, we have continued to hold this investment.
Questions and opportunities
Many questions in the broad equity market remain unanswered. Will the new Iraqi government be able to establish order and strike a blow against organized terrorism? Can the Federal Reserve balance the need to subdue inflation without slowing the economy too much? What uncertainties will the election bring? What impact will higher energy prices have on consumers?
The good news is that uncertainties lower the multiple that must be paid to purchase Corporate America and can set the stage for better returns in the future. The fact of the matter remains that the economy is growing and corporate cash flow has been surging, strengthening balance sheets and possibly financing a coming capital spending cycle.
Whatever the future holds, the Fund will stand ready, searching for unappreciated opportunities, one company at a time. We thank you for your continued investment in the Strong Advisor Large Company Core Fund.
| Eric F. Crigler |
Portfolio Manager |
24
Fund Highlights
Average Annual Total Returns
As of 6-30-04
Class A1,2 | |||
1-year | 8.50 | % | |
5-year | 0.48 | % | |
Since Fund Inception (11-3-97) | 3.89 | % | |
Class A, excluding sales load | |||
1-year | 15.13 | % | |
5-year | 1.67 | % | |
Since Fund Inception (11-3-97) | 4.82 | % | |
Class B1 | |||
1-year | 9.07 | % | |
5-year | 0.35 | % | |
Since Fund Inception (11-3-97) | 3.84 | % | |
Class C1 | |||
1-year | 13.07 | % | |
5-year | 0.74 | % | |
Since Fund Inception (11-3-97) | 3.84 | % | |
Class K1 | |||
1-year | 15.63 | % | |
5-year | 1.92 | % | |
Since Fund Inception (11-3-97) | 5.01 | % | |
Performance is historical and does not guarantee future results. Investment returns and principal value will fluctuate, and you may have a gain or loss when you sell shares. Current performance may be lower or higher than the quoted performance. Call us or visit www.Strong.com for the most recent month-end performance.
Risks: Stock funds should only be considered for long-term goals as values fluctuate in response to the activities of individual companies and general market and economic conditions.
Growth of an Assumed $10,000 Investment†
from 11-3-97 to 6-30-04
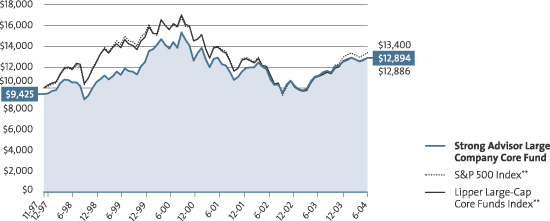
Mention of specific securities in this report is not indicative of whether the Fund may make additional purchases of, sell all or a portion of, or continue to hold those securities.
| * | The Morningstar Style BoxTM reveals a fund’s investment strategy. For equity funds, the vertical axis shows the market capitalization of the stocks owned and the horizontal axis shows investment style (value, blend, or growth). |
| † | This graph, provided in accordance with SEC regulations, compares a $10,000 investment in the Fund, made at its inception, with the performance of the S&P 500 Index (“S&P 500”) and the Lipper Large-Cap Core Funds Index. Results include the reinvestment of all dividends and capital gains distributions. The graph and the Average Annual Total Returns table do not reflect the deduction of taxes, if any, that a shareholder would pay on Fund distributions or the redemption of Fund shares. This graph is based on Class A shares only and reflects the effect of the maximum sales charge of 5.75%; performance for other classes will vary due to differences in fee structures and sales charges. |
| To equalize time periods, the indices’ performances were prorated for the month of November 1997. |
Performance Information: 1Average annual total returns for Class A shares include the effect of the maximum sales charge of 5.75%, which was first charged on 9-17-99 and are based on the performance of the Rockhaven Fund’s Class A shares (the predecessor Fund) prior to 9-16-02. Average annual total returns for Class B shares include the effect of the applicable contingent deferred sales charge, which is 5.00% in year 1 and is eliminated after year 6, and are based on the performance of the Rockhaven Fund’s Class A shares from inception through 9-15-02, restated to reflect the contingent deferred sales charge and the different expenses of the Class B shares, as applicable, and the historical performance of the Fund’s Class A shares from 9-16-02 to 9-30-02. Average annual total returns for Class C shares include the effect of the applicable contingent deferred sales charge, which is 1.00%, and is eliminated after 12 months and are based on the performance of the Rockhaven Fund’s Class A shares from inception through 9-15-02, restated to reflect the contingent deferred sales charge and the different expenses of the Class C shares, as applicable, and the historical performance of the Fund’s Class A shares from 9-16-02 to 9-30-02. The performance of the Class K shares is based on the performance of the Rockhaven Fund’s Class A shares from inception through 9-15-02, and the historical performance of the Fund’s Class A shares from 9-16-02 to 9-30-02, and does not reflect the Fund’s maximum sales charge of 5.75%, which was charged from 9-17-99 through 9-30-02.
2 The Fund’s Class A shares have a redemption fee of 1.00% against shares that are held 360 calendar days or fewer after purchase. Performance data does not reflect the deduction of this fee, which, if reflected, would reduce the performance.
Please consult a prospectus for information about all share classes.
Fee Waivers: From time to time, the Fund’s advisor and/or administrator has waived fees and/or absorbed Fund expenses, which has resulted in higher returns. As of 6-30-04, there are waivers and/or absorptions in effect.
Percentage Restrictions: The Fund’s prospectus and statement of additional information may describe restrictions on the percentage of a particular type or quality of security in which the Fund may invest (“Percentage Restrictions”). Percentage Restrictions apply at the time the Fund purchases a security. Circumstances subsequent to the purchase of the security, such as a change in: (1) the Fund’s assets (e.g., due to cash inflows and redemptions); (2) the market value of the security; or (3) the pricing, liquidity, or rating of the security, may cause the Fund to exceed or fall short of the Percentage Restriction. If this happens, the Fund’s continued holding of the security will not constitute a violation of the Percentage Restriction.
Definitions: **The S&P 500 Index consists of 500 stocks chosen for market size, liquidity, and industry group representation. It is a market value weighted index (stock price times number of shares outstanding), with each stock’s weight in the Index proportionate to its market value. The Lipper Large-Cap Core Funds Index is the average of the 30 largest funds in the Lipper Large-Cap Core Funds Category. Source of the S&P 500 Index data is Standard & Poor’s Micropal. Source of the Lipper Index data is Lipper. It is not possible to invest directly in an index.
25
SCHEDULES OF INVESTMENTS IN SECURITIES | June 30, 2004 (Unaudited) |
STRONG ADVISOR COMMON STOCK FUND
| Shares or Principal Amount | Value (Note 2) | ||||
Common Stocks 95.0% | |||||
Apparel - Shoes & Related Manufacturing 1.3% | |||||
Reebok International, Ltd. | 540,000 | $ | 19,429,200 | ||
Banks - Super Regional 2.0% | |||||
Fifth Third Bancorp | 325,000 | 17,478,500 | |||
Marshall & Ilsley Corporation | 300,000 | 11,727,000 | |||
| 29,205,500 | |||||
Banks - West/Southwest 1.6% | |||||
City National Corporation | 350,000 | 22,995,000 | |||
Building - Heavy Construction 1.1% | |||||
Jacobs Engineering Group, Inc. (b) (f) | 395,000 | 15,555,100 | |||
Chemicals - Specialty 1.5% | |||||
Lonza Group AG (CHF) (h) | 425,000 | 21,625,031 | |||
Commercial Services - Leasing 1.6% | |||||
Ryder Systems, Inc. | 570,000 | 22,839,900 | |||
Computer - Data Storage 1.4% | |||||
Seagate Technology (b) (f) | 1,400,000 | 20,202,000 | |||
Computer - Integrated Systems 1.2% | |||||
Symbol Technologies, Inc. (f) | 1,225,000 | 18,056,500 | |||
Computer - IT Services 4.0% | |||||
Affiliated Computer Services, Inc. Class A (b) | 405,000 | 21,440,700 | |||
BearingPoint, Inc. (b) | 1,940,000 | 17,207,800 | |||
Unisys Corporation (b) | 1,400,000 | 19,432,000 | |||
| 58,080,500 | |||||
Computer - Software Design 1.8% | |||||
Mentor Graphics Corporation (b) (f) | 1,675,000 | 25,912,250 | |||
Computer Software - Enterprise 2.2% | |||||
Business Objects SA Sponsored ADR (b) (f) | 900,000 | 20,367,000 | |||
Citrix Systems, Inc. (b) | 550,000 | 11,198,000 | |||
| 31,565,000 | |||||
Computer Software - Medical 1.1% | |||||
WebMD Corporation (b) (f) | 1,685,000 | 15,704,200 | |||
Containers 1.8% | |||||
Pactiv Corporation (b) | 1,040,000 | 25,937,600 | |||
Cosmetics - Personal Care 1.6% | |||||
International Flavors & Fragrances, Inc. | 630,000 | 23,562,000 | |||
LIFE TIME FITNESS, Inc. (b) | 2,700 | 56,700 | |||
| 23,618,700 | |||||
Diversified Operations 2.7% | |||||
Carlisle Companies, Inc. (f) | 390,600 | 24,314,850 | |||
SPX Corporation (f) | 325,000 | 15,093,000 | |||
| 39,407,850 | |||||
Electronics - Contract Manufacturing 1.6% | |||||
Solectron Corporation (b) | 3,565,000 | 23,065,550 | |||
Electronics - Miscellaneous Components 0.7% | |||||
Rockwell Automation, Inc. | 276,000 | 10,352,760 | |||
Electronics - Semiconductor Manufacturing 3.8% | |||||
Advanced Micro Devices, Inc. (b) (f) | 1,175,000 | 18,682,500 | |||
Fairchild Semiconductor Corporation Class A (b) | 1,080,000 | 17,679,600 | |||
SanDisk Corporation (b) (f) | 920,000 | 19,954,800 | |||
| 56,316,900 | |||||
Finance - Equity REIT 0.8% | |||||
Apartment Investment & Management Company Class A | 380,000 | 11,829,400 | |||
Finance - Publicly Traded Investment Funds - Equity (Non 40 Act) 1.4% | |||||
Biotech HOLDRs Trust (f) | 145,000 | 21,235,250 | |||
Financial Services - Miscellaneous 0.2% | |||||
The Bisys Group, Inc. (b) | 199,600 | 2,806,376 | |||
Household - Appliances 1.2% | |||||
Maytag Corporation (f) | 710,000 | 17,402,100 | |||
Insurance - Brokers 1.3% | |||||
Arthur J. Gallagher & Company | 630,000 | 19,183,500 | |||
Insurance - Diversified 1.3% | |||||
Genworth Financial, Inc. Class A (b) (f) | 835,000 | 19,163,250 | |||
Insurance - Property/Casualty/Title 3.7% | |||||
MBIA, Inc. | 290,000 | 16,564,800 | |||
RenaissanceRe Holdings, Ltd. (f) | 370,000 | 19,961,500 | |||
The St. Paul Travelers Companies, Inc. | 442,000 | 17,918,680 | |||
| 54,444,980 | |||||
Internet - E*Commerce 1.2% | |||||
InterActiveCorp (b) (f) | 575,000 | 17,330,500 | |||
Internet - Software 1.1% | |||||
DoubleClick, Inc. (b) (f) | 2,130,000 | 16,550,100 | |||
Leisure - Toys/Games/Hobby 1.5% | |||||
Mattel, Inc. | 1,185,000 | 21,626,250 | |||
Machinery - General Industrial 1.5% | |||||
Roper Industries, Inc. (f) | 375,000 | 21,337,500 | |||
Media - Cable TV 4.4% | |||||
Cablevision Systems New York Group Class A (b) | 1,150,000 | 22,597,500 | |||
Cox Communications, Inc. Class A (b) | 735,000 | 20,425,650 | |||
The DIRECTV Group, Inc. (b) | 1,218,083 | 20,829,219 | |||
| 63,852,369 | |||||
Media - Newspapers 1.0% | |||||
Dow Jones & Company, Inc. (f) | 340,000 | 15,334,000 | |||
Media - Radio/TV 1.3% | |||||
Liberty Media Corporation Class A (b) | 2,105,000 | 18,923,950 | |||
Medical - Biomedical/Biotechnology 3.2% | |||||
Celgene Corporation (b) (f) | 435,000 | 24,908,100 | |||
Medimmune, Inc. (b) | 965,000 | 22,581,000 | |||
| 47,489,100 | |||||
Medical - Ethical Drugs 1.2% | |||||
Biovail Corporation International (b) (f) | 935,000 | 17,746,300 | |||
Medical - Products 1.1% | |||||
Valeant Pharmaceuticals International (f) | 775,000 | 15,500,000 | |||
26
STRONG ADVISOR COMMON STOCK FUND (continued)
27
SCHEDULES OF INVESTMENTS IN SECURITIES (continued) | June 30, 2004 (Unaudited) |
STRONG ADVISOR MID CAP GROWTH FUND (continued)
| Shares or Principal Amount | Value (Note 2) | ||||
Computer - Peripheral Equipment 2.1% | |||||
Silicon Storage Technology, Inc. (b) | 18,000 | $ | 185,400 | ||
Zebra Technologies Corporation (b) | 13,500 | 1,174,500 | |||
| 1,359,900 | |||||
Computer Software - Desktop 0.7% | |||||
Adobe Systems, Inc. | 10,000 | 465,000 | |||
Computer Software - Education/Entertainment 2.0% | |||||
Electronic Arts, Inc. (b) | 24,000 | 1,309,200 | |||
Computer Software - Medical 2.4% | |||||
eResearch Technology, Inc. (b) | 55,500 | 1,554,000 | |||
Computer Software - Security 0.5% | |||||
Symantec Corporation (b) | 7,000 | 306,460 | |||
Cosmetics - Personal Care 0.0% | |||||
LIFE TIME FITNESS, Inc. (b) | 100 | 2,100 | |||
Electronics - Contract Manufacturing 0.4% | |||||
Flextronics International, Ltd. (b) | 16,000 | 255,200 | |||
Electronics - Military Systems 0.8% | |||||
L-3 Communications Corporation | 8,000 | 534,400 | |||
Electronics - Scientific Measuring 4.0% | |||||
PerkinElmer, Inc. | 62,600 | 1,254,504 | |||
Waters Corporation (b) | 28,000 | 1,337,840 | |||
| 2,592,344 | |||||
Electronics - Semiconductor Manufacturing 2.8% | |||||
Broadcom Corporation Class A (b) | 19,000 | 888,630 | |||
Marvell Technology Group, Ltd. (b) | 32,800 | 875,760 | |||
| 1,764,390 | |||||
Energy - Other 3.1% | |||||
Arch Coal, Inc. | 22,400 | 819,616 | |||
Massey Energy Company | 41,000 | 1,156,610 | |||
| 1,976,226 | |||||
Finance - Consumer/Commercial Loans 2.1% | |||||
AmeriCredit Corporation (b) | 53,000 | 1,035,090 | |||
Providian Financial Corporation (b) | 19,000 | 278,730 | |||
| 1,313,820 | |||||
Finance - Investment Brokers 1.7% | |||||
Legg Mason, Inc. | 12,000 | 1,092,120 | |||
Finance - Mortgage & Related Services 2.1% | |||||
Doral Financial Corporation | 39,000 | 1,345,500 | |||
Finance - Savings & Loan 1.4% | |||||
Westcorp | 20,000 | 909,000 | |||
Financial Services - Miscellaneous 2.1% | |||||
Alliance Data Systems Corporation (b) | 8,000 | 338,000 | |||
CheckFree Corporation (b) | 14,000 | 420,000 | |||
First Marblehead Corporation (b) | 15,000 | 603,900 | |||
| 1,361,900 | |||||
Household - Consumer Electronics 1.5% | |||||
Harman International Industries, Inc. | 10,200 | 928,200 | |||
Internet - E*Commerce 1.1% | |||||
University of Phoenix Online (b) | 7,700 | 674,443 | |||
Internet - Internet Content 2.2% | |||||
Ask Jeeves, Inc. (b) | 19,000 | 741,570 | |||
FindWhat.com (b) | 5,000 | 115,700 | |||
InfoSpace, Inc. (b) | 15,000 | 570,600 | |||
| 1,427,870 | |||||
Internet - Network Security/Solutions 0.8% | |||||
Digital River, Inc. (b) | 15,000 | 489,450 | |||
Leisure - Gaming/Equipment 3.3% | |||||
International Game Technology | 29,000 | 1,119,400 | |||
Station Casinos, Inc. | 20,000 | 968,000 | |||
| 2,087,400 | |||||
Leisure - Hotels & Motels 0.7% | |||||
Marriott International, Inc. Class A | 9,000 | 448,920 | |||
Machinery - General Industrial 1.0% | |||||
IDEX Corporation | 19,500 | 669,825 | |||
Medical - Biomedical/Biotechnology 1.5% | |||||
Biogen Idec, Inc. (b) | 15,000 | 948,750 | |||
Medical - Ethical Drugs 1.1% | |||||
Allergan, Inc. | 6,000 | 537,120 | |||
Eyetech Pharmaceuticals, Inc. (b) | 4,100 | 175,972 | |||
| 713,092 | |||||
Medical - Generic Drugs 1.4% | |||||
Impax Laboratories, Inc. (b) | 12,000 | 232,560 | |||
Teva Pharmaceutical Industries, Ltd. ADR (f) | 10,000 | 672,900 | |||
| 905,460 | |||||
Medical - Health Maintenance Organizations 4.9% | |||||
Coventry Health Care, Inc. (b) | 13,000 | 635,700 | |||
Molina Healthcare, Inc. (b) | 10,000 | 381,800 | |||
Sierra Health Services, Inc. (b) | 29,000 | 1,296,300 | |||
WellChoice, Inc. (b) | 20,500 | 848,700 | |||
| 3,162,500 | |||||
Medical - Products 4.2% | |||||
C.R. Bard, Inc. | 6,000 | 339,900 | |||
INAMED Corporation (b) | 15,000 | 942,750 | |||
Zimmer Holdings, Inc. (b) | 16,000 | 1,411,200 | |||
| 2,693,850 | |||||
Medical/Dental - Services 4.9% | |||||
Caremark Rx, Inc. (b) | 31,000 | 1,021,140 | |||
Inveresk Research Group, Inc. (b) | 40,500 | 1,249,020 | |||
Quest Diagnostics, Inc. | 10,000 | 849,500 | |||
| 3,119,660 | |||||
Medical/Dental - Supplies 1.8% | |||||
Kinetic Concepts, Inc. (b) | 13,100 | 653,690 | |||
Mentor Corporation | 14,000 | 480,060 | |||
| 1,133,750 | |||||
Oil & Gas - Drilling 0.8% | |||||
Precision Drilling Corporation (b) | 11,300 | 542,513 | |||
Oil & Gas - Field Services 1.0% | |||||
BJ Services Company (b) | 14,000 | 641,760 | |||
Oil & Gas - Machinery/Equipment 2.1% | |||||
Input/Output, Inc. (b) | 42,400 | 351,496 | |||
Smith International, Inc. (b) | 18,100 | 1,009,256 | |||
| 1,360,752 | |||||
28
STRONG ADVISOR MID CAP GROWTH FUND (continued)
29
SCHEDULES OF INVESTMENTS IN SECURITIES (continued) | June 30, 2004 (Unaudited) |
STRONG ADVISOR SMALL CAP VALUE FUND (continued)
| Shares or Principal Amount | Value (Note 2) | ||||
Commercial Services - Security/Safety 2.4% | |||||
Armor Holdings, Inc. (b) | 301,900 | $ | 10,264,600 | ||
DHB Industries, Inc. (b) (e) | 376,600 | 5,716,788 | |||
The Geo Group, Inc. (b) (d) | 990,210 | 20,200,284 | |||
OSI Systems, Inc. (b) | 616,510 | 12,287,044 | |||
| 48,468,716 | |||||
Commercial Services - Staffing 2.6% | |||||
CDI Corporation | 220,445 | 7,627,397 | |||
Cross Country Healthcare, Inc. (b) | 443,100 | 8,042,265 | |||
Kforce.com, Inc. (b) (d) | 1,921,685 | 18,140,706 | |||
MPS Group, Inc. (b) | 1,561,815 | 18,929,198 | |||
| 52,739,566 | |||||
Computer - Data Storage 0.1% | |||||
Iomega Corporation | 397,710 | 2,219,222 | |||
Computer - Manufacturers 0.3% | |||||
Cray, Inc. (b) (e) | 849,900 | 5,626,338 | |||
Computer Software - Enterprise 2.2% | |||||
JDA Software Group, Inc. (b) (e) | 1,119,500 | 14,743,815 | |||
Lightbridge, Inc. (b) (d) | 2,380,200 | 13,329,120 | |||
TIBCO Software, Inc. (b) | 2,101,300 | 17,755,985 | |||
| 45,828,920 | |||||
Computer Software - Medical 1.4% | |||||
IDX Systems Corporation (b) | 887,300 | 28,295,997 | |||
Containers 0.8% | |||||
Chesapeake Corporation | 530,880 | 14,163,878 | |||
Constar International, Inc. (b) | 542,300 | 2,521,695 | |||
| 16,685,573 | |||||
Cosmetics - Personal Care 0.0% | |||||
LIFE TIME FITNESS, Inc. (b) | 3,800 | 79,800 | |||
Electrical - Equipment 0.2% | |||||
Encore Wire Corporation (b) | 153,200 | 4,223,724 | |||
Electronics - Contract Manufacturing 0.5% | |||||
Celestica, Inc. (b) | 560,600 | 11,183,970 | |||
Electronics - Miscellaneous Components 0.7% | |||||
Coherent, Inc. (b) (e) | 512,300 | 15,292,155 | |||
Electronics - Parts Distributors 0.4% | |||||
Richardson Electronics, Ltd. (d) | 662,700 | 7,342,716 | |||
Electronics - Scientific Measuring 0.5% | |||||
Newport Corporation (b) | 594,100 | 9,606,597 | |||
Electronics - Semiconductor Manufacturing 2.5% | |||||
ChipPAC, Inc. Class A (b) | 1,588,000 | 9,956,760 | |||
Cirrus Logic, Inc. (b) | 2,162,400 | 12,996,024 | |||
Credence Systems Corporation (b) | 899,225 | 12,409,305 | |||
TriQuint Semiconductor, Inc. (b) | 1,471,820 | 8,036,137 | |||
Zoran Corporation (b) | 451,000 | 8,275,850 | |||
| 51,674,076 | |||||
Energy - Other 0.2% | |||||
Headwaters, Inc. (b) | 137,800 | 3,573,154 | |||
Finance - Consumer/Commercial Loans 0.3% | |||||
World Acceptance Corporation (b) | 346,200 | 6,345,846 | |||
Finance - Equity REIT 0.6% | |||||
American Financial Realty Trust | 530,900 | 7,586,561 | |||
Government Properties Trust, Inc. | 350,200 | 3,659,590 | |||
| 11,246,151 | |||||
Finance - Investment Brokers 0.3% | |||||
Labranche & Company, Inc. | 755,000 | 6,357,100 | |||
Food - Miscellaneous Preparation 1.5% | |||||
Del Monte Foods Company (b) | 2,909,185 | 29,557,320 | |||
Insurance - Accident & Health 0.0% | |||||
UnumProvident Corporation | 19,100 | 303,690 | |||
Insurance - Diversified 0.2% | |||||
Assurant, Inc. | 165,600 | 4,368,528 | |||
Insurance - Life 0.2% | |||||
Phoenix Companies, Inc. | 277,400 | 3,398,150 | |||
Insurance - Property/Casualty/Title 3.5% | |||||
Argonaut Group, Inc. (b) | 370,400 | 6,826,472 | |||
Bristol West Holdings, Inc. | 443,200 | 8,061,808 | |||
Donegal Group, Inc. Class A | 231,000 | 4,629,240 | |||
Endurance Specialty Holdings, Ltd. | 455,710 | 15,858,708 | |||
Mercury General Corporation | 598,610 | 29,720,987 | |||
Montpelier Re Holdings, Ltd. | 194,200 | 6,787,290 | |||
| 71,884,505 | |||||
Internet - E*Commerce 0.4% | |||||
Stamps.com, Inc. (b) | 705,800 | 7,192,102 | |||
Internet - Internet Service Provider 1.7% | |||||
EarthLink, Inc. (b) | 2,549,800 | 26,390,430 | |||
Net2Phone, Inc. (b) | 1,992,900 | 9,027,837 | |||
| 35,418,267 | |||||
Leisure - Services 0.3% | |||||
Pegasus Solutions, Inc. (b) (e) | 483,800 | 6,352,294 | |||
Machinery - General Industrial 1.9% | |||||
Robbins & Myers, Inc. | 359,800 | 8,077,510 | |||
UNOVA, Inc. (b) | 1,459,500 | 29,554,875 | |||
| 37,632,385 | |||||
Medical - Biomedical/Biotechnology 0.3% | |||||
CV Therapeutics, Inc. (b) | 380,500 | 6,377,180 | |||
Medical - Generic Drugs 0.9% | |||||
Andrx Group (b) (e) | 686,600 | 19,176,738 | |||
Medical - Nursing Homes 2.7% | |||||
Beverly Enterprises, Inc. (b) | 3,961,500 | 34,068,900 | |||
Manor Care, Inc. | 617,000 | 20,163,560 | |||
| 54,232,460 | |||||
Medical - Outpatient/Home Care 0.6% | |||||
Gentiva Health Services, Inc. (b) | 756,100 | 12,294,186 | |||
Medical - Products 1.7% | |||||
Allied Healthcare Products, Inc. (b) (d) | 926,840 | 4,643,468 | |||
Discovery Partners International, Inc. (b) (d) | 1,872,600 | 9,550,260 | |||
OraSure Technologies, Inc. (b) (e) | 2,093,850 | 20,373,161 | |||
| 34,566,889 | |||||
Medical - Systems/Equipment 0.9% | |||||
Applera Corporation-Applied Biosystems Group (e) | 831,300 | 18,080,775 | |||
30
STRONG ADVISOR SMALL CAP VALUE FUND (continued)
| Shares or Principal Amount | Value (Note 2) | |||||
Medical/Dental - Services 0.6% | ||||||
Covalent Group, Inc. (b) | 184,533 | $ | 706,761 | |||
Omnicare, Inc. | 263,000 | 11,259,030 | ||||
| 11,965,791 | ||||||
Metal Ores - Gold/Silver 7.8% | ||||||
Apex Silver Mines, Ltd. (b) (e) | 2,334,500 | 39,803,225 | ||||
Glamis Gold, Ltd. (b) | 3,110,600 | 54,528,818 | ||||
Goldcorp, Inc. | 1,852,000 | 21,612,840 | ||||
Harmony Gold Mining Company, Ltd. Sponsored ADR | 2,260,500 | 23,938,695 | ||||
Meridian Gold, Inc. (b) (e) | 1,478,400 | 19,174,848 | ||||
| 159,058,426 | ||||||
Metal Ores - Miscellaneous 0.1% | ||||||
Cleveland-Cliffs, Inc. (b) (e) | 27,300 | 1,539,447 | ||||
Metal Processing & Fabrication 0.1% | ||||||
Webco Industries, Inc. (b) (d) | 446,260 | 1,682,400 | ||||
Mining - Gems 0.1% | ||||||
Quadra Mining, Ltd. (CAD) (b) (h) | 269,000 | 998,987 | ||||
Oil & Gas - Drilling 3.4% | ||||||
Grey Wolf, Inc. (b) | 1,729,600 | 7,333,504 | ||||
Helmerich & Payne, Inc. | 599,480 | 15,676,402 | ||||
Parker Drilling Company (b) | 1,257,000 | 4,801,740 | ||||
Pride International, Inc. (b) | 1,334,000 | 22,824,740 | ||||
Transocean, Inc. (b) | 625,600 | 18,104,864 | ||||
| 68,741,250 | ||||||
Oil & Gas - Field Services 7.7% | ||||||
BJ Services Company (b) (e) | 249,200 | 11,423,328 | ||||
Global Industries, Ltd. (b) | 4,496,700 | 25,721,124 | ||||
Key Energy Services, Inc. (b) | 2,188,000 | 20,654,720 | ||||
Layne Christensen Company (b) (d) | 1,408,998 | 23,318,917 | ||||
Matrix Service Company (b) (d) | 1,536,400 | 14,058,060 | ||||
Newpark Resources, Inc. (b) | 3,098,460 | 19,210,452 | ||||
Oceaneering International, Inc. (b) (e) | 722,160 | 24,733,980 | ||||
Petroleum Helicopters, Inc. (b) | 115,245 | 2,218,466 | ||||
Petroleum Helicopters, Inc. (non-voting) (b) (d) | 178,172 | 3,458,319 | ||||
Willbros Group, Inc. (b) | 826,500 | 12,455,355 | ||||
| 157,252,721 | ||||||
Oil & Gas - Machinery/Equipment 1.0% | ||||||
Input/Output, Inc. (b) | 1,049,390 | 8,699,443 | ||||
Smith International, Inc. (b) | 206,400 | 11,508,864 | ||||
| 20,208,307 | ||||||
Oil & Gas - Refining/Marketing 0.1% | ||||||
Frontier Oil Corporation | 69,100 | 1,464,229 | ||||
Oil & Gas - United States Exploration & Production 10.1% | ||||||
Forest Oil Corporation (b) (e) | 1,932,000 | 52,782,240 | ||||
McMoRan Exploration Company (b) (d) (e) | 970,300 | 15,117,274 | ||||
Newfield Exploration Company (b) | 239,800 | 13,366,452 | ||||
Noble Energy, Inc. | 485,600 | 24,765,600 | ||||
PetroQuest Energy, Inc. (b) | 467,300 | 1,995,371 | ||||
Pioneer Natural Resources Company | 374,200 | 13,126,936 | ||||
Range Resources Corporation (d) | 4,262,000 | 62,225,200 | ||||
Remington Oil & Gas Corporation (b) | 407,300 | 9,612,280 | ||||
Stone Energy Corporation (b) | 282,300 | 12,895,464 | ||||
| 205,886,817 | ||||||
Paper & Paper Products 1.4% | ||||||
Wausau-Mosinee Paper Corporation | 1,677,700 | 29,024,210 | ||||
Pollution Control - Services 0.9% | ||||||
Calgon Carbon Corporation (d) | 2,621,300 | 17,562,710 | ||||
Retail - Clothing/Shoe 1.8% | ||||||
Foot Locker, Inc. | 522,800 | 12,724,952 | ||||
Payless ShoeSource, Inc. (b) | 290,900 | 4,337,319 | ||||
Too, Inc. (b) | 803,800 | 13,423,460 | ||||
The Wet Seal, Inc. Class A (b) (d) | 1,304,420 | 6,822,117 | ||||
| 37,307,848 | ||||||
Retail - Consumer Electronics 0.4% | ||||||
Circuit City Stores, Inc. | 664,500 | 8,605,275 | ||||
Retail - Home Furnishings 0.0% | ||||||
Design Within Reach, Inc. (b) | 3,900 | 64,077 | ||||
Retail - Major Discount Chains 0.3% | ||||||
Shopko Stores, Inc. (b) | 489,180 | 6,917,005 | ||||
Retail - Miscellaneous 0.8% | ||||||
Barbeques Galore, Ltd. Sponsored ADR (d) | 419,931 | 3,632,403 | ||||
Sharper Image Corporation (b) | 414,200 | 13,001,738 | ||||
| 16,634,141 | ||||||
Steel - Producers 4.4% | ||||||
IPSCO, Inc. | 897,500 | 20,220,675 | ||||
Roanoke Electric Steel Corporation | 527,550 | 7,174,680 | ||||
Steel Dynamics, Inc. (b) (e) | 1,016,410 | 29,099,818 | ||||
United States Steel Corporation (e) | 944,600 | 33,174,352 | ||||
| 89,669,525 | ||||||
Steel - Specialty Alloys 2.1% | ||||||
Carpenter Technology Corporation | 556,950 | 18,964,148 | ||||
GrafTech International, Ltd. (b) (e) | 2,368,100 | 24,770,326 | ||||
| 43,734,474 | ||||||
Telecommunications - Equipment 0.3% | ||||||
ADC Telecommunications, Inc. (b) | 2,072,600 | 5,886,184 | ||||
Telecommunications - Services 0.6% | ||||||
Cincinnati Bell, Inc. (b) | 2,671,200 | 11,860,128 | ||||
Transportation - Airline 1.1% | ||||||
Linea Aerea Nacional Chile SA Sponsored ADR | 1,119,200 | 21,600,560 | ||||
Transportation - Services 0.3% | ||||||
EGL, Inc. (b) | 266,360 | 7,085,176 | ||||
Transportation - Truck 0.8% | ||||||
Covenant Transport, Inc. Class A (b) (d) | 887,700 | 15,170,793 | ||||
Overnite Corporation | 61,000 | 1,793,400 | ||||
| 16,964,193 | ||||||
Total Common Stocks ($1,353,925,760) | 1,908,399,852 | |||||
Short-Term Investments (a) 6.3% | ||||||
Repurchase Agreements (c) | ||||||
ABN AMRO Inc. (Dated 6/30/04), 1.40%, Due 7/01/04 (Repurchase proceeds $126,104,904); Collateralized by: United States Government & Agency Issues | $ | 126,100,000 | 126,100,000 | |||
State Street Bank (Dated 6/30/04), 0.75%, Due 7/01/04 (Repurchase proceeds $2,192,446); Collateralized by: United States Government & Agency Issues | 2,192,400 | 2,192,400 | ||||
Total Short-Term Investments (Cost $128,292,400) | 128,292,400 | |||||
Total Investments in Securities (Cost $1,482,218,160) 99.9% | 2,036,692,252 | |||||
Other Assets and Liabilities, Net 0.1% | 2,956,755 | |||||
Net Assets 100.0% | $ | 2,039,649,007 | ||||
31
SCHEDULES OF INVESTMENTS IN SECURITIES (continued) | June 30, 2004 (Unaudited) |
STRONG ADVISOR SMALL CAP VALUE FUND (continued)
WRITTEN OPTIONS ACTIVITY
| Contracts | Premiums | ||||||
Options outstanding at beginning of period | 23,272 | $ | 7,981,388 | ||||
Options written during the period | 35,209 | 10,557,723 | |||||
Options closed | (48,234 | ) | (16,316,559 | ) | |||
Options expired | (1,600 | ) | (276,258 | ) | |||
Options exercised | (1,772 | ) | (689,115 | ) | |||
Options outstanding at end of period | 6,875 | $ | 1,257,179 | ||||
WRITTEN CALL OPTIONS DETAIL
| Contracts (100 shares per contract) | Value (Note 2) | |||||
Andrx Group | ||||||
(Strike Price is $30.00. Expiration date is 8/20/04. Premium received is $13,700.) | 100 | $ | (7,000 | ) | ||
(Strike Price is $25.00. Expiration date is 9/17/04. Premium received is $40,699.) | 100 | (37,000 | ) | |||
Apex Silver Mines, Ltd. | ||||||
(Strike Price is $17.50. Expiration date is 8/20/04. Premium received is $18,300.) | 150 | (16,875 | ) | |||
(Strike Price is $17.50. Expiration date is 10/15/04. Premium received is $9,100.) | 50 | (9,125 | ) | |||
(Strike Price is $20.00. Expiration date is 10/15/04. Premium received is $21,899.) | 150 | (12,375 | ) | |||
(Strike Price is $22.50. Expiration date is 10/15/04. Premium received is $10,200.) | 100 | (3,500 | ) | |||
Applera Corporation-Applied Biosystems Group | ||||||
(Strike Price is $20.00. Expiration date is 9/17/04. Premium received is $9,400.) | 100 | (23,250 | ) | |||
BJ Services Company | ||||||
(Strike Price is $47.50. Expiration date is 10/15/04. Premium received is $93,198.) | 350 | (92,750 | ) | |||
Cleveland-Cliffs, Inc. | ||||||
(Strike Price is $55.00. Expiration date is 7/16/04. Premium received is $10,950.) | 50 | (13,000 | ) | |||
Coherent, Inc. | ||||||
(Strike Price is $30.00. Expiration date is 8/20/04. Premium received is $17,861.) | 200 | (29,500 | ) | |||
Cray, Inc. | ||||||
(Strike Price is $7.50. Expiration date is 9/17/04. Premium received is $45,499.) | 500 | (16,250 | ) | |||
DHB Industries, Inc. | ||||||
(Strike Price is $12.50. Expiration date is 7/16/04. Premium received is $96,798.) | 400 | (109,000 | ) | |||
(Strike Price is $15.00. Expiration date is 7/16/04. Premium received is $33,599.) | 400 | (39,000 | ) | |||
FMC Corporation | ||||||
(Strike Price is $35.00. Expiration date is 7/16/04. Premium received is $109,396.) | 200 | (163,000 | ) | |||
(Strike Price is $30.00. Expiration date is 10/15/04. Premium received is $102,696.) | 100 | (132,500 | ) | |||
Forest Oil Corporation | ||||||
(Strike Price is $25.00. Expiration date is 8/20/04. Premium received is $38,548.) | 150 | (39,750 | ) | |||
GrafTech International, Ltd. | ||||||
(Strike Price is $10.00. Expiration date is 9/17/04. Premium received is $16,800.) | 200 | (26,500 | ) | |||
JDA Software Group, Inc. | ||||||
(Strike Price is $12.50. Expiration date is 8/20/04. Premium received is $11,700.) | 100 | (12,250 | ) | |||
McMoRan Exploration Company | ||||||
(Strike Price is $15.00. Expiration date is 8/20/04. Premium received is $30,517.) | 200 | (27,500 | ) | |||
(Strike Price is $17.50. Expiration date is 11/19/04. Premium received is $11,248.) | 100 | (9,250 | ) | |||
Meridian Gold, Inc. | ||||||
(Strike Price is $15.00. Expiration date is 10/15/04. Premium received is $11,100.) | 150 | (7,125 | ) | |||
OM Group, Inc. | ||||||
(Strike Price is $35.00. Expiration date is 10/15/04. Premium received is $25,199.) | 225 | (55,125 | ) | |||
Oceaneering International, Inc. | ||||||
(Strike Price is $30.00. Expiration date is 10/15/04. Premium received is $31,699.) | 100 | (52,000 | ) | |||
(Strike Price is $35.00. Expiration date is 10/15/04. Premium received is $11,200.) | 100 | (22,250 | ) | |||
OraSure Technologies, Inc. | ||||||
(Strike Price is $10.00. Expiration date is 8/20/04. Premium received is $16,800.) | 200 | (13,500 | ) | |||
(Strike Price is $10.00. Expiration date is 10/15/04. Premium received is $85,784.) | 850 | (89,250 | ) | |||
Pegasus Solutions, Inc. | ||||||
(Strike Price is $10.00. Expiration date is 7/16/04. Premium received is $15,247.) | 100 | (31,000 | ) | |||
R.H. Donnelley Corporation | ||||||
(Strike Price is $45.00. Expiration date is 11/19/04. Premium received is $63,398.) | 200 | (47,500 | ) | |||
(Strike Price is $50.00. Expiration date is 11/19/04. Premium received is $37,550.) | 300 | (20,250 | ) | |||
Steel Dynamics, Inc. | ||||||
(Strike Price is $22.50. Expiration date is 8/20/04. Premium received is $84,248.) | 250 | (152,500 | ) | |||
(Strike Price is $25.00. Expiration date is 8/20/04. Premium received is $48,399.) | 200 | (79,000 | ) | |||
(Strike Price is $30.00. Expiration date is 8/20/04. Premium received is $22,099.) | 200 | (18,500 | ) | |||
United States Steel Corporation | ||||||
(Strike Price is $30.00. Expiration date is 7/16/04. Premium received is $13,350.) | 50 | (26,250 | ) | |||
(Strike Price is $35.00. Expiration date is 8/20/04. Premium received is $22,699.) | 100 | (22,500 | ) | |||
(Strike Price is $35.00. Expiration date is 10/15/04. Premium received is $26,299.) | 150 | (50,250 | ) | |||
| 6,875 | $ | (1,506,375 | ) | |||
32
STRONG ADVISOR U.S. VALUE FUND
| Shares or Principal Amount | Value (Note 2) | ||||
Common Stocks 99.2% | |||||
Aerospace - Defense 3.0% | |||||
General Dynamics Corporation | 9,000 | $ | 893,700 | ||
Lockheed Martin Corporation | 24,400 | 1,270,752 | |||
Raytheon Company | 225,000 | 8,048,250 | |||
| 10,212,702 | |||||
Auto Manufacturer 0.5% | |||||
General Motors Corporation (f) | 38,100 | 1,775,079 | |||
Banks - Midwest 0.3% | |||||
Provident Financial Group, Inc. | 27,000 | 1,065,420 | |||
Banks - Money Center 4.3% | |||||
Bank of America Corporation | 80,000 | 6,769,600 | |||
The Bank of New York Company, Inc. | 35,000 | 1,031,800 | |||
Citigroup, Inc. | 148,500 | 6,905,250 | |||
| 14,706,650 | |||||
Banks - Northeast 0.7% | |||||
Banknorth Group, Inc. | 55,000 | 1,786,400 | |||
Peoples Bank (f) | 17,100 | 532,665 | |||
| 2,319,065 | |||||
Banks - Southeast 0.5% | |||||
Compass Bancshares, Inc. | 37,000 | 1,591,000 | |||
Banks - Super Regional 5.8% | |||||
Bank One Corporation | 57,000 | 2,907,000 | |||
KeyCorp (f) | 41,600 | 1,243,424 | |||
Mellon Financial Corporation | 28,000 | 821,240 | |||
National City Corporation | 36,500 | 1,277,865 | |||
Regions Financial Corporation (b) | 46,000 | 1,681,300 | |||
SouthTrust Corporation | 39,600 | 1,536,876 | |||
U.S. Bancorp | 92,800 | 2,557,568 | |||
Wachovia Corporation | 67,100 | 2,985,950 | |||
Wells Fargo & Company | 81,000 | 4,635,630 | |||
| 19,646,853 | |||||
Beverages - Alcoholic 0.2% | |||||
Anheuser-Busch Companies, Inc. | 13,000 | 702,000 | |||
Beverages - Soft Drinks 0.4% | |||||
Coca-Cola Enterprises, Inc. | 43,000 | 1,246,570 | |||
Building - Maintenance & Services 1.8% | |||||
The ServiceMaster Company (f) | 490,000 | 6,036,800 | |||
Building Products - Wood 0.7% | |||||
Georgia-Pacific Corporation | 13,000 | 480,740 | |||
Weyerhaeuser Company | 31,200 | 1,969,344 | |||
| 2,450,084 | |||||
Chemicals - Basic 0.8% | |||||
The Dow Chemical Company | 40,000 | 1,628,000 | |||
PPG Industries, Inc. | 15,300 | 956,097 | |||
| 2,584,097 | |||||
Commercial Services - Miscellaneous 0.5% | |||||
ARAMARK Corporation Class B | 48,000 | 1,380,480 | |||
Automatic Data Processing, Inc. | 9,000 | 376,920 | |||
| 1,757,400 | |||||
Computer - IT Services 1.5% | |||||
International Business Machines Corporation | 48,400 | 4,266,460 | |||
Unisys Corporation (b) | 70,100 | 972,988 | |||
| 5,239,448 | |||||
Computer - Manufacturers 0.9% | |||||
Hewlett-Packard Company | 150,000 | 3,165,000 | |||
Computer Software - Desktop 1.5% | |||||
Microsoft Corporation | 180,000 | 5,140,800 | |||
Computer Software - Enterprise 0.1% | |||||
Oracle Systems Corporation (b) | 27,000 | 322,110 | |||
Cosmetics - Personal Care 1.0% | |||||
Kimberly-Clark Corporation | 11,000 | 724,680 | |||
The Procter & Gamble Company | 46,000 | 2,504,240 | |||
| 3,228,920 | |||||
Diversified Operations 5.6% | |||||
E.I. Du Pont de Nemours & Company | 50,631 | 2,249,029 | |||
Emerson Electric Company | 27,900 | 1,773,045 | |||
General Electric Company | 260,000 | 8,424,000 | |||
ITT Industries, Inc. | 16,000 | 1,328,000 | |||
Loews Corporation | 40,000 | 2,398,400 | |||
SPX Corporation | 25,000 | 1,161,000 | |||
United Technologies Corporation | 17,200 | 1,573,456 | |||
| 18,906,930 | |||||
Finance - Equity REIT 1.2% | |||||
Apartment Investment & Management Company Class A | 77,000 | 2,397,010 | |||
Equity Office Properties Trust | 30,000 | 816,000 | |||
Equity Residential Properties Trust | 27,000 | 802,710 | |||
| 4,015,720 | |||||
Finance - Investment Brokers 0.0% | |||||
Piper Jaffray Companies, Inc. (b) (f) | 928 | 41,973 | |||
Finance - Savings & Loan 0.6% | |||||
Washington Mutual, Inc. | 50,000 | 1,932,000 | |||
Financial Services - Miscellaneous 0.6% | |||||
American Express Company | 38,000 | 1,952,440 | |||
Food - Meat Products 0.1% | |||||
Tyson Foods, Inc. Class A (f) | 18,000 | 377,100 | |||
Food - Miscellaneous Preparation 5.7% | |||||
Campbell Soup Company | 20,000 | 537,600 | |||
ConAgra, Inc. | 60,000 | 1,624,800 | |||
Del Monte Foods Company (b) | 733,000 | 7,447,280 | |||
Kraft Foods, Inc. Class A | 221,900 | 7,029,792 | |||
Sara Lee Corporation | 115,000 | 2,643,850 | |||
| 19,283,322 | |||||
Household - Housewares 0.1% | |||||
Newell Rubbermaid, Inc. | 17,000 | 399,500 | |||
Insurance - Accident & Health 0.8% | |||||
AFLAC, Inc. | 65,000 | 2,652,650 | |||
Insurance - Brokers 0.2% | |||||
Marsh & McLennan Companies, Inc. | 12,600 | 571,788 | |||
Insurance - Diversified 2.3% | |||||
American International Group, Inc. | 58,500 | 4,169,880 | |||
Manulife Financial Corporation (f) | 29,039 | 1,176,080 | |||
Principal Financial Group, Inc. | 25,300 | 879,934 | |||
Prudential Financial, Inc. | 34,100 | 1,584,627 | |||
| 7,810,521 | |||||
Insurance - Life 0.3% | |||||
Lincoln National Corporation | 25,000 | 1,181,250 | |||
33
SCHEDULES OF INVESTMENTS IN SECURITIES (continued) | June 30, 2004 (Unaudited) |
STRONG ADVISOR U.S. VALUE FUND (continued)
| Shares or Principal Amount | Value (Note 2) | ||||
Insurance - Property/Casualty/Title 3.8% | |||||
The Allstate Corporation | 32,000 | $ | 1,489,600 | ||
Chubb Corporation | 16,500 | 1,124,970 | |||
Hartford Financial Services Group, Inc. | 21,800 | 1,498,532 | |||
Old Republic International Corporation | 37,000 | 877,640 | |||
SAFECO Corporation | 71,000 | 3,124,000 | |||
The St. Paul Travelers Companies, Inc. | 114,525 | 4,642,844 | |||
| 12,757,586 | |||||
Leisure - Hotels & Motels 0.3% | |||||
Marriott International, Inc. Class A | 23,000 | 1,147,240 | |||
Leisure - Photo Equipment/Related 0.2% | |||||
Eastman Kodak Company (f) | 24,200 | 652,916 | |||
Machinery - Construction/Mining 0.4% | |||||
Caterpillar, Inc. | 16,000 | 1,271,040 | |||
Machinery - Farm 0.5% | |||||
Deere & Company | 26,000 | 1,823,640 | |||
Media - Cable TV 1.1% | |||||
Comcast Corporation Class A (b) | 102,300 | 2,867,469 | |||
Cox Communications, Inc. Class A (b) | 25,400 | 705,866 | |||
| 3,573,335 | |||||
Media - Diversified 1.7% | |||||
Time Warner, Inc. (b) | 325,000 | 5,713,500 | |||
Media - Newspapers 0.7% | |||||
Gannett Company, Inc. | 26,200 | 2,223,070 | |||
Media - Periodicals 2.3% | |||||
The Readers Digest Association, Inc. (non-voting) | 480,800 | 7,687,992 | |||
Media - Radio/TV 3.2% | |||||
Clear Channel Communications, Inc. | 84,000 | 3,103,800 | |||
The Walt Disney Company | 48,000 | 1,223,520 | |||
Liberty Media Corporation Class A (b) | 374,000 | 3,362,260 | |||
Liberty Media International, Inc. Class A (b) | 18,700 | 693,770 | |||
Viacom, Inc. Class B | 69,400 | 2,478,968 | |||
| 10,862,318 | |||||
Medical - Biomedical/Biotechnology 0.8% | |||||
Serono SA ADR (f) | 175,000 | 2,756,250 | |||
Medical - Ethical Drugs 4.7% | |||||
Bristol-Myers Squibb Company | 340,000 | 8,330,000 | |||
Merck & Company, Inc. | 76,000 | 3,610,000 | |||
Schering-Plough Corporation | 220,000 | 4,065,600 | |||
| 16,005,600 | |||||
Medical - Hospitals 1.7% | |||||
HCA, Inc. | 140,000 | 5,822,600 | |||
Medical/Dental - Services 0.1% | |||||
Medco Health Solutions, Inc. (b) | 7,839 | 293,962 | |||
Medical/Dental - Supplies 0.9% | |||||
Sola International, Inc. (b) | 170,000 | 2,929,100 | |||
Metal Ores - Gold/Silver 0.4% | |||||
Newmont Mining Corporation Holding Company | 35,000 | 1,356,600 | |||
Metal Ores - Miscellaneous 0.5% | |||||
Alcoa, Inc. | 52,100 | 1,720,863 | |||
Oil & Gas - Drilling 0.2% | |||||
Pride International, Inc. (b) (f) | 45,000 | 769,950 | |||
Oil & Gas - International Integrated 8.0% | |||||
Amerada Hess Corporation | 6,000 | 475,140 | |||
ChevronTexaco Corporation | 48,000 | 4,517,280 | |||
ConocoPhillips | 49,000 | 3,738,210 | |||
Exxon Mobil Corporation | 395,000 | 17,541,950 | |||
Royal Dutch Petroleum Company - New York Shares | 20,000 | 1,033,400 | |||
| 27,305,980 | |||||
Oil & Gas - United States Exploration & Production 0.9% | |||||
Devon Energy Corporation | 16,000 | 1,056,000 | |||
Kerr McGee Corporation | 7,000 | 376,390 | |||
Unocal Corporation | 40,200 | 1,527,600 | |||
| 2,959,990 | |||||
Paper & Paper Products 0.8% | |||||
Boise Cascade Corporation (f) | 10,000 | 376,400 | |||
MeadWestvaco Corporation | 70,000 | 2,057,300 | |||
Smurfit-Stone Container Corporation (b) (f) | 20,000 | 399,000 | |||
| 2,832,700 | |||||
Pollution Control - Services 1.3% | |||||
Waste Management, Inc. | 147,000 | 4,505,550 | |||
Retail - Consumer Electronics 0.2% | |||||
Circuit City Stores, Inc. | 61,000 | 789,950 | |||
Retail - Department Stores 0.7% | |||||
Federated Department Stores, Inc. | 25,000 | 1,227,500 | |||
May Department Stores Company | 44,793 | 1,231,360 | |||
| 2,458,860 | |||||
Retail - Drug Stores 0.3% | |||||
CVS Corporation | 28,200 | 1,184,964 | |||
Retail - Leisure Product 0.3% | |||||
Toys ‘R’ Us, Inc. (b) (f) | 67,000 | 1,067,310 | |||
Retail - Restaurants 1.2% | |||||
McDonald’s Corporation | 163,000 | 4,238,000 | |||
Retail - Super/Mini Markets 2.5% | |||||
Albertson’s, Inc. (f) | 20,000 | 530,800 | |||
The Kroger Company (b) | 403,000 | 7,334,600 | |||
Safeway, Inc. (b) | 27,000 | 684,180 | |||
| 8,549,580 | |||||
Retail/Wholesale - Office Supplies 0.1% | |||||
Office Depot, Inc. (b) | 17,000 | 304,470 | |||
Telecommunications - Services 4.6% | |||||
ALLTEL Corporation | 19,000 | 961,780 | |||
AT&T Corporation | 47,000 | 687,610 | |||
BellSouth Corporation | 98,000 | 2,569,560 | |||
CenturyTel, Inc. | 9,000 | 270,360 | |||
Commonwealth Telephone Enterprises, Inc. (b) (f) | 5,000 | 223,850 | |||
Qwest Communications International, Inc. (b) | 60,000 | 215,400 | |||
SBC Communications, Inc. | 174,000 | 4,219,500 | |||
Sprint Corporation | 51,000 | 897,600 | |||
Verizon Communications, Inc. | 155,000 | 5,609,450 | |||
| 15,655,110 | |||||
Telecommunications - Wireless Equipment 1.4% | |||||
Nokia Corporation Sponsored ADR | 330,000 | 4,798,200 | |||
34
STRONG ADVISOR U.S. VALUE FUND (continued)
| Shares or Principal Amount | Value (Note 2) | ||||||
Telecommunications - Wireless Services 0.1% | |||||||
AT&T Wireless Services, Inc. (b) | 34,000 | $ | 486,880 | ||||
Tobacco 1.3% | |||||||
Altria Group, Inc. | 55,000 | 2,752,750 | |||||
Loews Corp - Carolina Group (f) | 67,700 | 1,662,035 | |||||
| 4,414,785 | |||||||
Transportation - Air Freight 0.3% | |||||||
FedEx Corporation | 12,000 | 980,280 | |||||
Transportation - Rail 0.6% | |||||||
Burlington Northern Santa Fe Corporation | 24,800 | 869,736 | |||||
Norfolk Southern Corporation | 50,000 | 1,326,000 | |||||
| 2,195,736 | |||||||
Utility - Electric Power 6.9% | |||||||
Consolidated Edison, Inc. | 27,000 | 1,073,520 | |||||
DTE Energy Company | 51,000 | 2,067,540 | |||||
Dominion Resources, Inc. | 28,000 | 1,766,240 | |||||
Duke Energy Corporation | 70,000 | 1,420,300 | |||||
Entergy Corporation | 23,500 | 1,316,235 | |||||
Exelon Corporation | 52,400 | 1,744,396 | |||||
FPL Group, Inc. | 26,600 | 1,701,070 | |||||
FirstEnergy Corporation | 169,500 | 6,340,995 | |||||
Progress Energy, Inc. | 14,000 | 616,700 | |||||
Public Service Enterprise Group, Inc. (f) | 31,000 | 1,240,930 | |||||
SCANA Corporation | 17,000 | 618,290 | |||||
The Southern Company | 42,000 | 1,224,300 | |||||
TXU Corporation | 60,000 | 2,430,600 | |||||
| 23,561,116 | |||||||
Utility - Gas Distribution 2.2% | |||||||
CenterPoint Energy, Inc. | 299,400 | 3,443,100 | |||||
KeySpan Corporation | 25,600 | 939,520 | |||||
NiSource, Inc. | 27,000 | 556,740 | |||||
Sempra Energy | 31,500 | 1,084,545 | |||||
Vectren Corporation (f) | 56,700 | 1,422,603 | |||||
| 7,446,508 | |||||||
Total Common Stocks (Cost $286,811,271) | 337,418,723 | ||||||
Short-Term Investments (a) 3.2% | |||||||
Collateral Received for Securities Lending 2.2% | |||||||
Navigator Prime Portfolio | 7,404,288 | 7,404,288 | |||||
Repurchase Agreements (c) 1.0% | |||||||
ABN AMRO Inc. (Dated 6/30/04), 1.40%, Due 7/01/04 (Repurchase proceeds $700,027); Collateralized by: United States Government & Agency Issues | $ | 700,000 | 700,000 | ||||
State Street Bank (Dated 6/30/04), 0.75%, Due 7/01/04 (Repurchase proceeds $2,719,557); Collateralized by: United States Government & Agency Issues | 2,719,500 | 2,719,500 | |||||
| 3,419,500 | |||||||
Total Short-Term Investments (Cost $10,823,788) | 10,823,788 | ||||||
Total Investments in Securities (Cost $297,635,059) 102.4% | 348,242,511 | ||||||
Other Assets and Liabilities, Net (2.4%) | (8,232,026 | ) | |||||
Net Assets 100.0% | $ | 340,010,485 | |||||
WRITTEN OPTIONS ACTIVITY
| Contracts | Premiums | ||||||
Options outstanding at beginning of period | — | $ | — | ||||
Options written during the period | 850 | 188,691 | |||||
Options closed | (850 | ) | (188,691 | ) | |||
Options expired | — | — | |||||
Options exercised | — | — | |||||
Options outstanding at end of period | — | $ | — | ||||
STRONG ADVISOR ENDEAVOR LARGE CAP FUND
| Shares or Principal Amount | Value (Note 2) | ||||
Common Stocks 98.5% | |||||
Apparel - Shoes & Related Manufacturing 1.0% | |||||
NIKE, Inc. Class B | 5,420 | $ | 410,565 | ||
Beverages - Alcoholic 2.0% | |||||
Anheuser-Busch Companies, Inc. | 15,140 | 817,560 | |||
Commercial Services - Schools 1.6% | |||||
Corinthian Colleges, Inc. (b) | 26,120 | 646,209 | |||
Computer - Data Storage 2.9% | |||||
EMC Corporation (b) | 106,810 | 1,217,634 | |||
Computer - Local Networks 2.8% | |||||
Cisco Systems, Inc. (b) | 35,705 | 846,208 | |||
Polycom, Inc. (b) | 14,765 | 330,884 | |||
| 1,177,092 | |||||
Computer - Manufacturers 4.7% | |||||
Apple Computer, Inc. (b) | 12,410 | 403,821 | |||
Dell, Inc. (b) | 43,490 | 1,557,812 | |||
| 1,961,633 | |||||
Computer Software - Desktop 1.6% | |||||
Microsoft Corporation | 22,510 | 642,886 | |||
Computer Software - Enterprise 4.0% | |||||
Mercury Interactive Corporation (b) | 8,240 | 410,599 | |||
SAP AG Sponsored ADR | 30,230 | 1,263,916 | |||
| 1,674,515 | |||||
Computer Software - Financial 0.8% | |||||
DST Systems, Inc. (b) | 6,520 | 313,547 | |||
Diversified Operations 10.9% | |||||
General Electric Company | 53,030 | 1,718,172 | |||
Honeywell International, Inc. | 23,700 | 868,131 | |||
Tyco International, Ltd. | 58,445 | 1,936,867 | |||
| 4,523,170 | |||||
Electronics - Semiconductor Manufacturing 2.9% | |||||
Intel Corporation | 43,300 | 1,195,080 | |||
Finance - Mortgage & Related Services 1.8% | |||||
Countrywide Financial Corporation | 10,530 | 739,733 | |||
Household - Consumer Electronics 1.7% | |||||
Harman International Industries, Inc. | 7,570 | 688,870 | |||
35
SCHEDULES OF INVESTMENTS IN SECURITIES (continued) | June 30, 2004 (Unaudited) |
STRONG ADVISOR ENDEAVOR LARGE CAP FUND (continued)
| Shares or Principal Amount | Value (Note 2) | |||||
Insurance - Diversified 0.7% | ||||||
American International Group, Inc. | 3,870 | $ | 275,854 | |||
Insurance - Property/Casualty/Title 3.2% | ||||||
The Allstate Corporation | 28,310 | 1,317,830 | ||||
Internet - E*Commerce 0.8% | ||||||
eBay, Inc. (b) | 3,760 | 345,732 | ||||
Internet - Internet Content 5.4% | ||||||
Yahoo! Inc. (b) | 61,280 | 2,226,302 | ||||
Leisure - Toys/Games/Hobby 2.2% | ||||||
Marvel Enterprises, Inc. (b) | 46,912 | 915,722 | ||||
Machinery - Farm 1.0% | ||||||
Deere & Company | 5,800 | 406,812 | ||||
Media - Cable TV 0.7% | ||||||
EchoStar Communications Corporation Class A (b) | 9,740 | 299,505 | ||||
Medical - Biomedical/Biotechnology 1.1% | ||||||
Genzyme Corporation (b) | 9,590 | 453,895 | ||||
Medical - Ethical Drugs 3.0% | ||||||
Medicis Pharmaceutical Corporation Class A | 10,120 | 404,294 | ||||
Pfizer, Inc. | 24,294 | 832,798 | ||||
| 1,237,092 | ||||||
Medical - Generic Drugs 4.1% | ||||||
Teva Pharmaceutical Industries, Ltd. ADR | 24,890 | 1,674,848 | ||||
Medical - Health Maintenance Organizations 2.9% | ||||||
Anthem, Inc. (b) | 13,415 | 1,201,447 | ||||
Medical - Products 6.7% | ||||||
Alcon, Inc. | 7,950 | 625,268 | ||||
Boston Scientific Corporation (b) | 17,500 | 749,000 | ||||
Medtronic, Inc. | 15,570 | 758,570 | ||||
Zimmer Holdings, Inc. (b) | 7,290 | 642,978 | ||||
| 2,775,816 | ||||||
Medical - Systems/Equipment 2.2% | ||||||
Fisher Scientific International, Inc. (b) | 15,440 | 891,660 | ||||
Medical - Wholesale Drugs/Sundries 2.0% | ||||||
McKesson Corporation | 23,800 | 817,054 | ||||
Metal Ores - Gold/Silver 1.7% | ||||||
Newmont Mining Corporation Holding Company | 18,130 | 702,719 | ||||
Metal Ores - Miscellaneous 2.3% | ||||||
Phelps Dodge Corporation (b) | 12,140 | 940,971 | ||||
Oil & Gas - Canadian Exploration & Production 0.4% | ||||||
Canadian Natural Resources, Ltd. | 5,950 | 177,905 | ||||
Oil & Gas - Canadian Integrated 1.3% | ||||||
Suncor Energy, Inc. | 21,060 | 539,347 | ||||
Oil & Gas - Drilling 1.0% | ||||||
Nabors Industries, Ltd. (b) | 9,040 | 408,789 | ||||
Oil & Gas - Field Services 2.1% | ||||||
Schlumberger, Ltd. | 13,880 | 881,519 | ||||
Oil & Gas - Production/Pipeline 1.0% | ||||||
The Williams Companies, Inc. | 36,180 | 430,542 | ||||
Oil & Gas - United States Exploration & Production 1.5% | ||||||
Anadarko Petroleum Corporation | 10,860 | 636,396 | ||||
Retail - Drug Stores 1.0% | ||||||
CVS Corporation | 9,850 | 413,897 | ||||
Retail - Major Discount Chains 2.0% | ||||||
Target Corporation | 9,240 | 392,423 | ||||
Wal-Mart Stores, Inc. | 8,520 | 449,515 | ||||
| 841,938 | ||||||
Retail/Wholesale - Office Supplies 1.5% | ||||||
Staples, Inc. | 21,470 | 629,286 | ||||
Telecommunications - Fiber Optics 2.2% | ||||||
Corning, Inc. (b) | 69,050 | 901,793 | ||||
Telecommunications - Wireless Equipment 3.6% | ||||||
Research in Motion, Ltd. (b) | 21,920 | 1,500,205 | ||||
Telecommunications - Wireless Services 2.2% | ||||||
Crown Castle International Corporation (b) | 36,060 | 531,885 | ||||
NII Holdings, Inc. Class B (b) | 10,860 | 365,873 | ||||
| 897,758 | ||||||
Total Common Stocks (Cost $34,274,486) | 40,751,128 | |||||
Short-Term Investments (a) 1.2% | ||||||
Repurchase Agreements (c) | ||||||
ABN AMRO Inc. (Dated 6/30/04), 1.40%, Due 7/01/04 (Repurchase proceeds $200,008); Collateralized by: United States Government & Agency Issues | $ | 200,000 | 200,000 | |||
State Street Bank (Dated 6/30/04), 0.75%, Due 7/01/04 (Repurchase proceeds $293,706); Collateralized by: United States Government & Agency Issues | 293,700 | 293,700 | ||||
Total Short-Term Investments (Cost $493,700) | 493,700 | |||||
Total Investments in Securities (Cost $34,768,186) 99.7% | 41,244,828 | |||||
Other Assets and Liabilities, Net 0.3% | 142,921 | |||||
Net Assets 100.0% | $ | 41,387,749 | ||||
36
| Shares or Principal Amount | Value (Note 2) | |||||
Common Stocks 96.2% | ||||||
Commercial Services - Miscellaneous 4.3% | ||||||
Jackson Hewitt Tax Service, Inc. (b) | 600 | $ | 10,500 | |||
Paychex, Inc. | 2,900 | 98,252 | ||||
| 108,752 | ||||||
Commercial Services - Schools 7.7% | ||||||
Apollo Group, Inc. Class A (b) | 1,500 | 132,435 | ||||
Corinthian Colleges, Inc. (b) | 2,600 | 64,324 | ||||
| 196,759 | ||||||
Computer - Local Networks 7.0% | ||||||
Cisco Systems, Inc. (b) | 3,100 | 73,470 | ||||
Polycom, Inc. (b) | 4,700 | 105,327 | ||||
| 178,797 | ||||||
Computer - Manufacturers 5.6% | ||||||
Dell, Inc. (b) | 4,000 | 143,280 | ||||
Computer Software - Education/Entertainment 3.2% | ||||||
Electronic Arts, Inc. (b) | 1,500 | 81,825 | ||||
Computer Software - Enterprise 2.1% | ||||||
Mercury Interactive Corporation (b) | 1,100 | 54,813 | ||||
Cosmetics - Personal Care 0.1% | ||||||
LIFE TIME FITNESS, Inc. (b) | 100 | 2,100 | ||||
Electronics - Contract Manufacturing 2.8% | ||||||
Flextronics International, Ltd. (b) | 4,500 | 71,775 | ||||
Electronics - Semiconductor Manufacturing 6.6% | ||||||
Analog Devices, Inc. | 1,400 | 65,912 | ||||
Microchip Technology, Inc. | 1,700 | 53,618 | ||||
Silicon Laboratories, Inc. (b) | 300 | 13,905 | ||||
SiRF Technology Holdings, Inc. (b) | 2,600 | 33,982 | ||||
| 167,417 | ||||||
Finance - Mortgage & Related Services 2.4% | ||||||
Countrywide Financial Corporation | 875 | 61,469 | ||||
Financial Services - Miscellaneous 4.9% | ||||||
First Marblehead Corporation (b) | 3,100 | 124,806 | ||||
Internet - E*Commerce 10.1% | ||||||
Amazon.com, Inc. (b) | 1,200 | 65,280 | ||||
eBay, Inc. (b) | 2,100 | 193,095 | ||||
| 258,375 | ||||||
Internet - Network Security/Solutions 2.0% | ||||||
Digital River, Inc. (b) | 1,600 | 52,208 | ||||
Medical - Biomedical/Biotechnology 7.9% | ||||||
Digene Corporation (b) | 2,200 | 80,366 | ||||
Gilead Sciences, Inc. (b) | 1,800 | 120,600 | ||||
| 200,966 | ||||||
Medical - Products 2.3% | ||||||
Boston Scientific Corporation (b) | 600 | 25,680 | ||||
C.R. Bard, Inc. | 600 | 33,990 | ||||
| 59,670 | ||||||
Medical/Dental - Services 2.8% | ||||||
Inveresk Research Group, Inc. (b) | 2,300 | 70,932 | ||||
Oil & Gas - Machinery/Equipment 3.1% | ||||||
Smith International, Inc. (b) | 1,400 | 78,064 | ||||
Oil & Gas - United States Exploration & Production 2.6% | ||||||
XTO Energy, Inc. | 2,250 | 67,027 | ||||
Retail - Clothing/Shoes 6.8% | ||||||
Chicos FAS, Inc. (b) | 1,000 | 45,160 | ||||
Coach, Inc. (b) | 1,800 | 81,342 | ||||
Ross Stores, Inc. | 1,800 | 48,168 | ||||
| 174,670 | ||||||
Retail - Home Furnishings 0.1% | ||||||
Design Within Reach, Inc. (b) | 100 | 1,643 | ||||
Retail - Leisure 1.8% | ||||||
Dick’s Sporting Goods, Inc. (b) | 1,400 | 46,690 | ||||
Retail - Miscellaneous 9.3% | ||||||
Cabela’s, Inc. (b) | 100 | 2,695 | ||||
PETCO Animal Supplies, Inc. (b) | 2,800 | 90,188 | ||||
PETsMART, Inc. | 4,500 | 146,025 | ||||
| 238,908 | ||||||
Retail/Wholesale - Building Products 0.7% | ||||||
Tractor Supply Company (b) | 400 | 16,728 | ||||
Total Common Stocks (Cost $1,780,862) | 2,457,674 | |||||
Short-Term Investments (a) 2.9% | ||||||
Repurchase Agreements (c) | ||||||
State Street Bank (Dated 6/30/04), 0.75%, Due 7/01/04 (Repurchase Proceeds $74,002); Collateralized by: United States Government & Agency Issues | $ | 74,000 | 74,000 | |||
Total Short-Term Investments (Cost $74,000) | 74,000 | |||||
Total Investments in Securities (Cost $1,854,862) 99.1% | 2,531,674 | |||||
Other Assets and Liabilities, Net 0.9% | 23,611 | |||||
Net Assets 100.0% | $ | 2,555,285 | ||||
STRONG ADVISOR INTERNATIONAL CORE FUND
| Shares or Principal Amount | Value (Note 2) | ||||
Common Stocks 94.6% | |||||
Australia 1.8% | |||||
BHP Billiton, Ltd. | 2,600 | $ | 22,783 | ||
BlueScope Steel, Ltd. | 1,800 | 8,553 | |||
| 31,336 | |||||
Belgium 0.9% | |||||
Fortis | 700 | 15,604 | |||
Bermuda 0.5% | |||||
Jardine Matheson Holdings, Ltd. | 765 | 8,425 | |||
Brazil 1.9% | |||||
Companhia Vale do Rio Doce Sponsored ADR | 400 | 19,020 | |||
Petroleo Brasileiro SA Petrobras Sponsored ADR | 500 | 14,035 | |||
| 33,055 | |||||
Canada 2.9% | |||||
Bank of Nova Scotia | 600 | 16,124 | |||
Encana Corporation | 800 | 34,583 | |||
| 50,707 | |||||
Finland 0.9% | |||||
UPM-Kymmene Oyj | 800 | 15,253 | |||
37
SCHEDULES OF INVESTMENTS IN SECURITIES (continued) | June 30, 2004 (Unaudited) |
STRONG ADVISOR INTERNATIONAL CORE FUND (continued)
| Shares or Principal Amount | Value (Note 2) | |||||
France 10.2% | ||||||
Aventis SA | 300 | $ | 22,783 | |||
BNP Paribas SA | 400 | 24,800 | ||||
Business Objects SA Sponsored ADR (b) | 900 | 20,367 | ||||
Essilor International SA | 500 | 32,807 | ||||
Groupe Danone Sponsored ADR | 2,000 | 35,080 | ||||
L’Oreal SA | 300 | 24,129 | ||||
Total SA Sponsored ADR | 200 | 19,216 | ||||
| 179,182 | ||||||
Germany 5.7% | ||||||
E.On AG | 300 | 21,825 | ||||
Fresenius Medical Care AG | 250 | 18,717 | ||||
Puma AG | 70 | 17,941 | ||||
Schering AG | 280 | 16,589 | ||||
Siemens AG | 350 | 25,427 | ||||
| 100,499 | ||||||
Hong Kong 2.1% | ||||||
Hutchison Whampoa, Ltd. | 2,100 | 14,417 | ||||
Swire Pacific, Ltd. A Shares | 3,400 | 22,119 | ||||
| 36,536 | ||||||
Ireland 1.9% | ||||||
Bank of Ireland | 1,800 | 24,116 | ||||
Ryanair Holdings PLC ADR (b) | 300 | 9,834 | ||||
| 33,950 | ||||||
Italy 4.1% | ||||||
Credito Italiano SA | 3,400 | 16,872 | ||||
ENI Spa | 1,800 | 36,077 | ||||
Telecom Italia Spa | 5,951 | 18,609 | ||||
| 71,558 | ||||||
Japan 20.9% | ||||||
Canon, Inc. ADR | 600 | 32,040 | ||||
The Daimaru, Inc. | 2,000 | 18,283 | ||||
Disco Corporation | 500 | 21,397 | ||||
East Japan Railway Company | 3 | 16,907 | ||||
Hankyu Department Stores, Inc. | 2,000 | 17,539 | ||||
Hitachi, Ltd. | 3,500 | 24,431 | ||||
House Foods Corporation | 1,300 | 18,462 | ||||
iShares MSCI Japan Index Fund | 1,500 | 15,930 | ||||
Kansai Paint Company, Ltd. | 3,000 | 18,449 | ||||
Komatsu, Ltd. | 2,700 | 16,514 | ||||
Lawson, Inc. | 200 | 8,305 | ||||
Matsumotokiyoshi Company, Ltd. | 500 | 15,203 | ||||
Mitsubishi Heavy Industries, Ltd. | 6,100 | 16,679 | ||||
Mitsui Marine and Fire Insurance Company, Ltd. | 3,000 | 28,490 | ||||
Nippon Telegraph and Telephone Corporation Sponsored ADR | 1,000 | 26,840 | ||||
Tokyo Gas Company, Ltd. | 7,000 | 24,944 | ||||
Toyota Motor Corporation | 600 | 24,511 | ||||
Uni-Charm Corporation | 400 | 20,051 | ||||
| 364,975 | ||||||
Mexico 2.4% | ||||||
America Movil ADR Series L | 400 | 14,548 | ||||
Cemex SA de CV Sponsored ADR | 500 | 14,550 | ||||
Wal-Mart de Mexico SA de CV | 4,400 | 13,111 | ||||
| 42,209 | ||||||
Netherlands 4.9% | ||||||
ING Groep NV | 1,200 | 28,535 | ||||
Koninklijke Ahold NV (b) | 1,100 | 8,700 | ||||
Koninklijke Philips Electronics NV Sponsored ADR - New York Registry Shares | 700 | 19,040 | ||||
Royal Dutch Petroleum Company - New York Shares | 300 | 15,501 | ||||
STMicroelectronics NV | 600 | 13,285 | ||||
| 85,061 | ||||||
Singapore 3.9% | ||||||
DBS Group Holdings, Ltd. | 2,600 | 21,865 | ||||
Flextronics International, Ltd. (b) | 1,500 | 23,925 | ||||
Singapore Technologies Engineering, Ltd. | 18,000 | 21,840 | ||||
| 67,630 | ||||||
South Africa 1.3% | ||||||
Gold Fields, Ltd. Sponsored ADR | 2,100 | 22,071 | ||||
South Korea 0.6% | ||||||
Samsung Electronics | 25 | 10,403 | ||||
Spain 2.3% | ||||||
Banco Santander Central Hispano SA | 1,700 | 17,793 | ||||
Telefonica SA Sponsored ADR | 514 | 22,940 | ||||
| 40,733 | ||||||
Sweden 2.5% | ||||||
Autoliv, Inc. | 700 | 29,456 | ||||
Sandvik AB | 400 | 13,763 | ||||
| 43,219 | ||||||
Switzerland 5.6% | ||||||
Nestle SA | 115 | 30,792 | ||||
Novartis AG Sponsored ADR | 600 | 26,700 | ||||
UBS AG Registered | 320 | 22,709 | ||||
Zurich Financial Services AG (b) | 110 | 17,474 | ||||
| 97,675 | ||||||
United Kingdom 17.3% | ||||||
BP PLC Sponsored ADR | 450 | 24,107 | ||||
Boots Group PLC | 1,050 | 13,195 | ||||
Diageo PLC | 1,600 | 21,688 | ||||
GlaxoSmithKline PLC Sponsored ADR | 500 | 20,730 | ||||
HBOS PLC | 700 | 8,735 | ||||
HSBC Holdings PLC | 500 | 7,482 | ||||
HSBC Holdings PLC (Hong Kong Regulated) | 1,200 | 18,035 | ||||
iShares Trust MSCI United Kingdom Index Fund | 500 | 8,075 | ||||
Kingfisher PLC | 3,200 | 16,753 | ||||
Lloyds TSB Group PLC | 2,100 | 16,545 | ||||
Reed Elsevier PLC | 1,800 | 17,585 | ||||
Royal Bank of Scotland PLC | 1,000 | 29,022 | ||||
Tesco PLC | 7,900 | 38,413 | ||||
United Utilities PLC | 2,200 | 20,734 | ||||
Vodafone Group PLC | 18,700 | 41,230 | ||||
| 302,329 | ||||||
Total Common Stocks (Cost $1,323,823) | 1,652,410 | |||||
Short-Term Investments (a) 5.2% | ||||||
Repurchase Agreements (c) | ||||||
United States | ||||||
State Street Bank (Dated 6/30/04), 0.75%, Due 7/01/04 (Repurchase proceeds $91,202); Collateralized by: United States Government & Agency Issues | $ | 91,200 | 91,200 | |||
Total Short-Term Investments (Cost $91,200) | 91,200 | |||||
Total Investments in Securities (Cost $1,415,023) 99.8% | 1,743,610 | |||||
Other Assets and Liabilities, Net 0.2% | 3,873 | |||||
Net Assets 100.0% | $ | 1,747,483 | ||||
38
| Shares or Principal Amount | Value (Note 2) | ||||
Common Stocks 97.9% | |||||
Commercial Services - Schools 3.9% | |||||
Career Education Corporation (b) | 9,650 | $ | 439,654 | ||
Corinthian Colleges, Inc. (b) | 105,900 | 2,619,966 | |||
| 3,059,620 | |||||
Computer - Data Storage 2.9% | |||||
EMC Corporation (b) | 197,000 | 2,245,800 | |||
Computer - Local Networks 4.2% | |||||
Cisco Systems, Inc. (b) | 64,760 | 1,534,812 | |||
Polycom, Inc. (b) | 76,519 | 1,714,791 | |||
| 3,249,603 | |||||
Computer - Manufacturers 4.0% | |||||
Dell, Inc. (b) | 86,465 | 3,097,176 | |||
Computer Software - Education/Entertainment 2.3% | |||||
Electronic Arts, Inc. (b) | 32,410 | 1,767,965 | |||
Computer Software - Enterprise 5.3% | |||||
Mercury Interactive Corporation (b) | 31,700 | 1,579,611 | |||
SAP AG Sponsored ADR | 61,630 | 2,576,750 | |||
| 4,156,361 | |||||
Diversified Operations 5.3% | |||||
General Electric Company | 24,300 | 787,320 | |||
Tyco International, Ltd. | 100,930 | 3,344,820 | |||
| 4,132,140 | |||||
Electronics - Semiconductor Manufacturing 2.8% | |||||
Intel Corporation | 79,430 | 2,192,268 | |||
Household - Consumer Electronics 4.5% | |||||
Harman International Industries, Inc. | 38,420 | 3,496,220 | |||
Insurance - Property/Casualty/Title 1.5% | |||||
The Allstate Corporation | 25,410 | 1,182,836 | |||
Internet - Internet Content 7.2% | |||||
Yahoo! Inc. (b) | 153,540 | 5,578,108 | |||
Leisure - Toys/Games/Hobby 5.3% | |||||
Marvel Enterprises, Inc. (b) | 213,755 | 4,172,498 | |||
Media - Cable TV 1.4% | |||||
EchoStar Communications Corporation Class A (b) | 34,290 | 1,054,417 | |||
Medical - Biomedical/Biotechnology 1.3% | |||||
Genzyme Corporation (b) | 21,640 | 1,024,221 | |||
Medical - Ethical Drugs 1.7% | |||||
Medicis Pharmaceutical Corporation Class A | 33,830 | 1,351,509 | |||
Medical - Generic Drugs 3.7% | |||||
Teva Pharmaceutical Industries, Ltd. ADR | 42,580 | 2,865,208 | |||
Medical - Health Maintenance Organizations 4.3% | |||||
Anthem, Inc. (b) | 37,300 | 3,340,588 | |||
Medical - Products 5.0% | |||||
Alcon, Inc. | 9,600 | 755,040 | |||
Cyberonics, Inc. (b) | 29,650 | 989,124 | |||
Medtronic, Inc. | 28,300 | 1,378,776 | |||
Zimmer Holdings, Inc. (b) | 8,800 | 776,160 | |||
| 3,899,100 | |||||
Medical - Systems/Equipment 3.6% | |||||
Fisher Scientific International, Inc. (b) | 28,700 | 1,657,425 | |||
Varian Medical Systems, Inc. (b) | 14,315 | 1,135,895 | |||
| 2,793,320 | |||||
Metal Ores - Gold/Silver 1.9% | |||||
Newmont Mining Corporation Holding Company | 37,500 | 1,453,500 | |||
Metal Ores - Miscellaneous 3.3% | |||||
Phelps Dodge Corporation (b) | 33,560 | 2,601,236 | |||
Oil & Gas - Canadian Exploration & Production 0.9% | |||||
Canadian Natural Resources, Ltd. | 22,300 | 666,770 | |||
Oil & Gas - Canadian Integrated 1.4% | |||||
Suncor Energy, Inc. | 43,850 | 1,122,999 | |||
Oil & Gas - Drilling 1.9% | |||||
Nabors Industries, Ltd. (b) | 32,185 | 1,455,406 | |||
Oil & Gas - Field Services 0.5% | |||||
Schlumberger, Ltd. | 6,100 | 387,411 | |||
Oil & Gas - Machinery/Equipment 2.2% | |||||
Grant Prideco, Inc. (b) | 94,500 | 1,744,470 | |||
Oil & Gas - United States Exploration & Production 0.7% | |||||
Chesapeake Energy Corporation | 39,700 | 584,384 | |||
Retail/Wholesale - Office Supplies 1.5% | |||||
Staples, Inc. | 39,400 | 1,154,814 | |||
Telecommunications - Fiber Optics 3.9% | |||||
Corning, Inc. (b) | 235,600 | 3,076,936 | |||
Telecommunications - Wireless Equipment 5.8% | |||||
Research in Motion, Ltd. (b) | 65,840 | 4,506,090 | |||
Telecommunications - Wireless Services 3.7% | |||||
Crown Castle International Corporation (b) | 107,800 | 1,590,050 | |||
NII Holdings, Inc. Class B (b) | 39,690 | 1,337,156 | |||
| 2,927,206 | |||||
Total Common Stocks (Cost $61,393,848) | 76,340,180 | ||||
39
SCHEDULES OF INVESTMENTS IN SECURITIES (continued) | June 30, 2004 (Unaudited) |
STRONG ADVISOR SELECT FUND (continued)
40
STRONG ADVISOR TECHNOLOGY FUND (continued)
41
SCHEDULES OF INVESTMENTS IN SECURITIES (continued) | June 30, 2004 (Unaudited) |
STRONG ADVISOR U.S. SMALL/MID CAP GROWTH FUND (continued)
| Shares or Principal Amount | Value (Note 2) | |||||
Retail - Home Furnishings 1.0% | ||||||
Select Comfort Corporation (b) | 1,885 | $ | 53,534 | |||
Retail - Miscellaneous 3.6% | ||||||
Gander Mountain Company (b) | 3,730 | 85,603 | ||||
Sharper Image Corporation (b) | 3,790 | 118,968 | ||||
| 204,571 | ||||||
Retail - Restaurants 3.7% | ||||||
The Cheesecake Factory, Inc. (b) | 1,990 | 79,182 | ||||
Chicago Pizza & Brewery, Inc. (b) | 5,660 | 86,089 | ||||
P.F. Chang’s China Bistro, Inc. (b) | 1,060 | 43,619 | ||||
| 208,890 | ||||||
Retail/Wholesale - Building Products 2.8% | ||||||
Tractor Supply Company (b) | 3,750 | 156,825 | ||||
Telecommunications - Wireless Equipment 0.9% | ||||||
Sierra Wireless, Inc. (b) | 1,320 | 48,880 | ||||
Telecommunications - Wireless Services 5.1% | ||||||
@Road, Inc. (b) | 7,305 | 55,883 | ||||
Alamosa Holdings, Inc. (b) | 20,110 | 147,808 | ||||
Nextel Communications, Inc. Class A (b) | 3,160 | 84,246 | ||||
| 287,937 | ||||||
Transportation - Truck 3.3% | ||||||
J.B. Hunt Transport Services, Inc. | 3,250 | 125,385 | ||||
Landstar Systems, Inc. (b) | 1,115 | 58,950 | ||||
| 184,335 | ||||||
Total Common Stocks (Cost $4,770,633) | 5,599,304 | |||||
Short-Term Investments (a) 0.7% | ||||||
Repurchase Agreements (c) | ||||||
State Street Bank (Dated 6/30/04), 0.75%, Due 7/01/04 (Repurchase proceeds $36,001); Collateralized by: United States Government & Agency Issues | $ | 36,000 | 36,000 | |||
Total Short-Term Investments (Cost $36,000) | 36,000 | |||||
Total Investments in Securities (Cost $4,806,633) 99.6% | 5,635,304 | |||||
Other Assets and Liabilities, Net 0.4% | 24,909 | |||||
Net Assets 100.0% | $ | 5,660,213 | ||||
STRONG ADVISOR UTILITIES AND ENERGY FUND
| Shares or Principal Amount | Value (Note 2) | ||||
Common Stocks 95.6% | |||||
Building Products - Wood 0.7% | |||||
Whiting Petroleum Corporation (b) | 2,000 | $ | 50,300 | ||
Chemicals - Specialty 2.8% | |||||
Ashland, Inc. | 4,000 | 211,240 | |||
Diversified Operations 1.6% | |||||
MDU Resources Group, Inc. | 5,000 | 120,150 | |||
Oil & Gas - Canadian Integrated 0.3% | |||||
Suncor Energy, Inc. | 1,000 | 25,610 | |||
Oil & Gas - Drilling 4.2% | |||||
Nabors Industries, Ltd. (b) | 7,000 | 316,540 | |||
Oil & Gas - Field Services 1.7% | |||||
Schlumberger, Ltd. | 2,000 | 127,020 | |||
Oil & Gas - International Integrated 10.0% | |||||
BP PLC Sponsored ADR | 6,000 | 321,420 | |||
ChevronTexaco Corporation | 1,000 | 94,110 | |||
ConocoPhillips | 3,000 | 228,870 | |||
Exxon Mobil Corporation | 1,500 | 66,615 | |||
Royal Dutch Petroleum Company - New York Shares | 1,000 | 51,670 | |||
| 762,685 | |||||
Oil & Gas - United States Exploration & Production 8.6% | |||||
Anadarko Petroleum Corporation | 2,500 | 146,500 | |||
Devon Energy Corporation | 2,500 | 165,000 | |||
Occidental Petroleum Corporation | 7,000 | 338,870 | |||
| 650,370 | |||||
Oil & Gas - United States Integrated 2.0% | |||||
Questar Corporation | 4,000 | 154,560 | |||
Telecommunications - Services 2.1% | |||||
BellSouth Corporation | 2,500 | 65,550 | |||
SBC Communications, Inc. | 1,000 | 24,250 | |||
Verizon Communications, Inc. | 2,000 | 72,380 | |||
| 162,180 | |||||
Telecommunications - Services Foreign 2.6% | |||||
BCE, Inc. | 10,000 | 200,400 | |||
Telecommunications - Wireless Services 0.4% | |||||
Vodafone Group PLC Sponsored ADR | 1,500 | 33,150 | |||
Transportation - Ship 2.0% | |||||
Teekay Shipping Corporation | 4,000 | 149,520 | |||
Utility - Electric Power 42.1% | |||||
The AES Corporation (b) | 2,000 | 19,860 | |||
CMS Energy Corporation (b) | 2,000 | 18,260 | |||
Calpine Corporation (b) | 60,000 | 259,200 | |||
Constellation Energy Group, Inc. | 20,000 | 758,000 | |||
Dominion Resources, Inc. | 4,000 | 252,320 | |||
Duke Energy Corporation | 11,000 | 223,190 | |||
Exelon Corporation | 10,000 | 332,900 | |||
FPL Group, Inc. | 4,000 | 255,800 | |||
Great Plains Energy, Inc. | 10,000 | 297,000 | |||
Public Service Enterprise Group, Inc. | 3,000 | 120,090 | |||
TXU Corporation | 7,000 | 283,570 | |||
WPS Resources Corporation | 4,000 | 185,400 | |||
Wisconsin Energy Corporation | 6,000 | 195,660 | |||
| 3,201,250 | |||||
Utility - Gas Distribution 14.5% | |||||
Energen Corporation | 1,000 | 47,990 | |||
ONEOK, Inc. | 24,000 | 527,760 | |||
Sempra Energy | 10,000 | 344,300 | |||
South Jersey Industries, Inc. | 2,000 | 88,000 | |||
Southwest Gas Corporation | 4,000 | 96,520 | |||
| 1,104,570 | |||||
Total Common Stocks (Cost $6,267,060) | 7,269,545 | ||||
42
STRONG ADVISOR UTILITIES AND ENERGY FUND (continued)
| Shares or Principal Amount | Value (Note 2) | ||||||
Short-Term Investments (a) 5.1% | |||||||
Repurchase Agreements (c) | |||||||
State Street Bank (Dated 6/30/04), 0.75%, Due 7/01/04 (Repurchase proceeds $389,308); Collateralized by: United States Government & Agency Issues | $ | 389,300 | $ | 389,300 | |||
Total Short-Term Investments (Cost $389,300) | 389,300 | ||||||
Total Investments in Securities (Cost $6,656,360) 100.7% | 7,658,845 | ||||||
Other Assets and Liabilities, Net (0.7%) | (57,402 | ) | |||||
Net Assets 100.0% | $ | 7,601,443 | |||||
STRONG ADVISOR LARGE COMPANY CORE FUND
| Shares or Principal Amount | Value (Note 2) | ||||
Common Stocks 96.8% | |||||
Aerospace - Defense 0.8% | |||||
The Boeing Company | 17,750 | $ | 906,847 | ||
Apparel - Shoes & Related Manufacturing 2.1% | |||||
NIKE, Inc. Class B | 31,850 | 2,412,638 | |||
Auto Manufacturer 2.5% | |||||
Ford Motor Company | 184,500 | 2,887,425 | |||
Auto/Truck - Original Equipment 2.2% | |||||
Eaton Corporation | 39,400 | 2,550,756 | |||
Banks - Money Center 3.9% | |||||
Bank of America Corporation | 32,300 | 2,733,226 | |||
Citigroup, Inc. | 39,300 | 1,827,450 | |||
| 4,560,676 | |||||
Banks - Super Regional 2.1% | |||||
Wachovia Corporation | 56,050 | 2,494,225 | |||
Beverages - Soft Drinks 2.4% | |||||
The Pepsi Bottling Group, Inc. | 92,700 | 2,831,058 | |||
Building - Paint & Allied Products 2.4% | |||||
Sherwin Williams Company | 68,700 | 2,854,485 | |||
Building Products - Wood 2.6% | |||||
Georgia-Pacific Corporation | 82,000 | 3,032,360 | |||
Computer - IT Services 2.3% | |||||
Amdocs, Ltd. (b) | 116,300 | 2,724,909 | |||
Computer - Local Networks 2.2% | |||||
Cisco Systems, Inc. (b) | 109,000 | 2,583,300 | |||
Diversified Operations 1.2% | |||||
General Electric Company | 5,010 | 162,324 | |||
3M Co. | 13,850 | 1,246,639 | |||
| 1,408,963 | |||||
Electronics - Contract Manufacturing 1.9% | |||||
Sanmina-SCI Corporation (b) | 251,300 | 2,286,830 | |||
Electronics - Military Systems 1.1% | |||||
L-3 Communications Corporation | 19,300 | 1,289,240 | |||
Electronics - Semiconductor Manufacturing 3.5% | |||||
Intel Corporation | 72,500 | 2,001,000 | |||
Texas Instruments, Inc. | 86,100 | 2,081,898 | |||
| 4,082,898 | |||||
Finance - Consumer/Commercial Loans 4.5% | |||||
CIT Group, Inc. | 73,200 | 2,802,828 | |||
MBNA Corporation | 94,100 | 2,426,839 | |||
| 5,229,667 | |||||
Finance - Savings & Loan 2.5% | |||||
Golden West Financial Corporation | 14,750 | 1,568,662 | |||
Washington Mutual, Inc. | 34,750 | 1,342,740 | |||
| 2,911,402 | |||||
Financial Services - Miscellaneous 1.2% | |||||
American Express Company | 28,100 | 1,443,778 | |||
Food - Flour & Grain 2.3% | |||||
Archer Daniels Midland Company | 160,700 | 2,696,546 | |||
Food - Meat Products 2.5% | |||||
Tyson Foods, Inc. Class A | 141,500 | 2,964,425 | |||
Insurance - Diversified 3.0% | |||||
American International Group, Inc. | 24,450 | 1,742,796 | |||
Prudential Financial, Inc. | 39,750 | 1,847,183 | |||
| 3,589,979 | |||||
Insurance - Life 1.3% | |||||
Lincoln National Corporation | 32,000 | 1,512,000 | |||
Insurance - Property/Casualty/Title 1.6% | |||||
The Allstate Corporation | 41,000 | 1,908,550 | |||
Leisure - Services 2.5% | |||||
Cendant Corporation | 120,150 | 2,941,272 | |||
Media - Radio/TV 2.3% | |||||
The Walt Disney Company | 106,200 | 2,707,038 | |||
Medical - Generic Drugs 1.0% | |||||
Teva Pharmaceutical Industries, Ltd. ADR | 17,250 | 1,160,753 | |||
Medical - Health Maintenance Organizations 4.4% | |||||
Aetna, Inc. | 30,900 | 2,626,500 | |||
UnitedHealth Group, Inc. | 41,350 | 2,574,038 | |||
| 5,200,538 | |||||
Medical - Products 3.3% | |||||
Alcon, Inc. | 33,750 | 2,654,437 | |||
Boston Scientific Corporation (b) | 27,100 | 1,159,880 | |||
| 3,814,317 | |||||
Medical/Dental - Supplies 2.4% | |||||
Becton, Dickinson & Company | 54,400 | 2,817,920 | |||
Metal Products - Fasteners 1.0% | |||||
Illinois Tool Works, Inc. | 12,800 | 1,227,392 | |||
Oil & Gas - International Integrated 4.5% | |||||
ConocoPhillips | 31,050 | 2,368,804 | |||
Exxon Mobil Corporation | 64,648 | 2,871,018 | |||
| 5,239,822 | |||||
43
SCHEDULES OF INVESTMENTS IN SECURITIES (continued) | June 30, 2004 (Unaudited) |
STRONG ADVISOR LARGE COMPANY CORE FUND (continued)
| Shares or Principal Amount | Value (Note 2) | ||||||
Oil & Gas - United States Exploration & Production 4.6% | |||||||
Burlington Resources, Inc. | 66,200 | $ | 2,395,116 | ||||
Devon Energy Corporation | 29,308 | 1,934,328 | |||||
EOG Resources, Inc. | 17,450 | 1,041,939 | |||||
| 5,371,383 | |||||||
Oil & Gas - United States Integrated 2.4% | |||||||
Marathon Oil Corporation | 74,700 | 2,826,648 | |||||
Retail - Clothing/Shoes 1.8% | |||||||
The Gap, Inc. | 86,000 | 2,085,500 | |||||
Retail - Department Stores 2.7% | |||||||
Federated Department Stores, Inc. | 64,250 | 3,154,675 | |||||
Retail - Restaurants 2.1% | |||||||
McDonald’s Corporation | 94,200 | 2,449,200 | |||||
Retail/Wholesale - Auto Parts 1.4% | |||||||
AutoZone, Inc. (b) | 20,600 | 1,650,060 | |||||
Retail/Wholesale - Building Products 3.4% | |||||||
The Home Depot, Inc. | 78,100 | 2,749,120 | |||||
Lowe’s Companies, Inc. | 22,850 | 1,200,767 | |||||
| 3,949,887 | |||||||
Telecommunications - Wireless Equipment 2.5% | |||||||
Motorola, Inc. | 161,350 | 2,944,638 | |||||
Utility - Electric Power 2.4% | |||||||
Edison International | 111,800 | 2,858,726 | |||||
Total Common Stocks (Cost $105,010,878) | 113,562,726 | ||||||
Short-Term Investments (a) 5.2% | |||||||
Repurchase Agreements (c) | |||||||
State Street Bank (Dated 6/30/04), 0.75%, Due 7/01/04 (Repurchase proceeds $6,129,728); Collateralized by: United States Government & Agency Issues | $ | 6,129,600 | 6,129,600 | ||||
Total Short-Term Investments (Cost $6,129,600) | 6,129,600 | ||||||
Total Investments in Securities (Cost $111,140,478) 102.0% | 119,692,326 | ||||||
Other Assets and Liabilities, Net (2.0%) | (2,368,050 | ) | |||||
Net Assets 100.0% | $ | 117,324,276 | |||||
CURRENCY ABBREVIATIONS
| CAD | — Canadian Dollars |
| CHF | — Swiss Franc |
LEGEND
| (a) | Short-term investments include any security which has a remaining maturity of less than one year and investments in money market funds. |
| (b) | Non-income producing security. |
| (c) | See Note 2(J) of Notes to Financial Statements. |
| (d) | Affiliated Issuer (See Note 9 of Notes to Financial Statements.) |
| (e) | All or a portion of these securities are held in conjunction with open written option contracts. |
| (f) | All or a portion of security is on loan. See Note 2(K) of Notes to Financial Statements. |
| (g) | Restricted and Illiquid security. |
| (h) | Security trades in foreign currency and is converted to U.S. dollars daily using current exchange rates. |
Percentages are stated as a percent of net assets.
See Notes to Financial Statements.
44
STATEMENTS OF ASSETS AND LIABILITIES
June 30, 2004 (Unaudited)
| (In Thousands) | ||||||||||||
| Strong Advisor Common Stock Fund | Strong Advisor Mid Cap Growth Fund | Strong Advisor Small Cap Value Fund | ||||||||||
Assets: | ||||||||||||
Investments in Securities, at Value | ||||||||||||
Unaffiliated Issuers (Cost of $1,207,364, $48,828, and $1,292,385, respectively) | $ | 1,547,712 | $ | 62,989 | $ | 1,775,966 | ||||||
Affiliated Issuers (Cost of $0, $0, and $189,833, respectively) | — | — | 260,726 | |||||||||
Receivable for Securities Sold | 11,547 | 1,249 | 6,431 | |||||||||
Receivable for Fund Shares Sold | 144 | 27 | 313 | |||||||||
Dividends and Interest Receivable | 731 | 13 | 295 | |||||||||
Other Assets | 255 | 28 | 297 | |||||||||
Total Assets | 1,560,389 | 64,306 | 2,044,028 | |||||||||
Liabilities: | ||||||||||||
Payable for Securities Purchased | 3,950 | 170 | 1,019 | |||||||||
Written Options, at Value (Premiums Received of $0, $0, and $1,257, respectively) | — | — | 1,506 | |||||||||
Payable for Fund Shares Redeemed | 538 | 62 | 1,285 | |||||||||
Payable Upon Return of Securities on Loan | 91,631 | 112 | — | |||||||||
Cash Overdraft Liability | — | — | 16 | |||||||||
Accrued Operating Expenses and Other Liabilities | 399 | 39 | 553 | |||||||||
Total Liabilities | 96,518 | 383 | 4,379 | |||||||||
Net Assets | $ | 1,463,871 | $ | 63,923 | $ | 2,039,649 | ||||||
Net Assets Consist of: | ||||||||||||
Capital Stock (Par Value and Paid-in Capital) | $ | 1,100,041 | $ | 162,650 | $ | 1,318,043 | ||||||
Undistributed Net Investment Income (Loss) | (1,821 | ) | (510 | ) | (11,341 | ) | ||||||
Undistributed Net Realized Gain (Loss) | 25,299 | (112,378 | ) | 178,722 | ||||||||
Net Unrealized Appreciation (Depreciation) | 340,352 | 14,161 | 554,225 | |||||||||
Net Assets | $ | 1,463,871 | $ | 63,923 | $ | 2,039,649 | ||||||
See Notes to Financial Statements.
45
STATEMENTS OF ASSETS AND LIABILITIES (continued)
June 30, 2004 (Unaudited)
| Strong Advisor Common Stock Fund | Strong Advisor Mid Cap Growth Fund | Strong Advisor Small Cap Value Fund | |||||||
Class A | |||||||||
Net Assets | $ | 78,738,247 | $ | 9,315,412 | $ | 562,316,104 | |||
Capital Shares Outstanding (Unlimited Number Authorized) | 3,507,252 | 754,550 | 19,582,915 | ||||||
Net Asset Value Per Share | $ | 22.45 | $ | 12.35 | $ | 28.71 | |||
Public Offering Price Per Share | $ | 23.82 | $ | 13.10 | $ | 30.46 | |||
Class B | |||||||||
Net Assets | $ | 38,308,402 | $ | 2,851,598 | $ | 126,240,126 | |||
Capital Shares Outstanding (Unlimited Number Authorized) | 1,748,369 | 237,006 | 4,515,476 | ||||||
Net Asset Value Per Share | $ | 21.91 | $ | 12.03 | $ | 27.96 | |||
Class C | |||||||||
Net Assets | $ | 30,086,438 | $ | 631,259 | $ | 151,023,244 | |||
Capital Shares Outstanding (Unlimited Number Authorized) | 1,373,064 | 52,474 | 5,392,873 | ||||||
Net Asset Value Per Share | $ | 21.91 | $ | 12.03 | $ | 28.00 | |||
Class Z | |||||||||
Net Assets | $ | 1,316,738,133 | $ | 51,124,631 | $ | 1,200,069,533 | |||
Capital Shares Outstanding (Unlimited Number Authorized) | 58,122,183 | 4,155,742 | 41,554,883 | ||||||
Net Asset Value Per Share | $ | 22.65 | $ | 12.30 | $ | 28.88 | |||
See Notes to Financial Statements.
46
STATEMENTS OF ASSETS AND LIABILITIES (continued)
June 30, 2004 (Unaudited)
| (In Thousands) | |||
| Strong Advisor U.S. Value Fund | |||
Assets: | |||
Investments in Securities, at Value (Cost of $297,635) | $ | 348,243 | |
Receivable for Fund Shares Sold | 8 | ||
Dividends and Interest Receivable | 574 | ||
Other Assets | 62 | ||
Total Assets | 348,887 | ||
Liabilities: | |||
Payable for Securities Purchased | 1,321 | ||
Payable for Fund Shares Redeemed | 13 | ||
Payable Upon Return of Securities on Loan | 7,404 | ||
Accrued Operating Expenses and Other Liabilities | 139 | ||
Total Liabilities | 8,877 | ||
Net Assets | $ | 340,010 | |
Net Assets Consist of: | |||
Capital Stock (Par Value and Paid-in Capital) | $ | 283,298 | |
Undistributed Net Investment Income (Loss) | 190 | ||
Undistributed Net Realized Gain (Loss) | 5,915 | ||
Net Unrealized Appreciation (Depreciation) | 50,607 | ||
Net Assets | $ | 340,010 | |
See Notes to Financial Statements.
47
STATEMENTS OF ASSETS AND LIABILITIES (continued)
June 30, 2004 (Unaudited)
| Strong Advisor U.S. Value Fund | |||
Class A | |||
Net Assets | $ | 4,037,820 | |
Capital Shares Outstanding (Unlimited Number Authorized) | 219,664 | ||
Net Asset Value Per Share | $ | 18.38 | |
Public Offering Price Per Share | $ | 19.50 | |
Class B | |||
Net Assets | $ | 5,907,996 | |
Capital Shares Outstanding (Unlimited Number Authorized) | 321,709 | ||
Net Asset Value Per Share | $ | 18.36 | |
Class C | |||
Net Assets | $ | 4,352,581 | |
Capital Shares Outstanding (Unlimited Number Authorized) | 238,064 | ||
Net Asset Value Per Share | $ | 18.28 | |
Class K | |||
Net Assets | $ | 83,200,795 | |
Capital Shares Outstanding (Unlimited Number Authorized) | 4,561,078 | ||
Net Asset Value Per Share | $ | 18.24 | |
Class Z | |||
Net Assets | $ | 242,511,293 | |
Capital Shares Outstanding (Unlimited Number Authorized) | 13,106,036 | ||
Net Asset Value Per Share | $ | 18.50 | |
See Notes to Financial Statements.
48
STATEMENTS OF ASSETS AND LIABILITIES (continued)
June 30, 2004 (Unaudited)
| (In Thousands, Except As Noted) | |||||||||||
| Strong Advisor Endeavor Large Cap Fund | Strong Advisor Focus Fund | Strong Advisor International Core Fund | |||||||||
Assets: | |||||||||||
Investments in Securities, at Value (Cost of $34,768, $1,855, and $1,415, respectively) | $ | 41,245 | $ | 2,532 | $ | 1,744 | |||||
Receivable for Securities Sold | 814 | 34 | — | ||||||||
Dividends and Interest Receivable | 28 | — | 5 | ||||||||
Other Assets | 18 | 16 | 8 | ||||||||
Total Assets | 42,105 | 2,582 | 1,757 | ||||||||
Liabilities: | |||||||||||
Payable for Securities Purchased | 699 | 16 | — | ||||||||
Accrued Operating Expenses and Other Liabilities | 18 | 11 | 10 | ||||||||
Total Liabilities | 717 | 27 | 10 | ||||||||
Net Assets | $ | 41,388 | $ | 2,555 | $ | 1,747 | |||||
Net Assets Consist of: | |||||||||||
Capital Stock (Par Value and Paid-in Capital) | $ | 38,373 | $ | 6,156 | $ | 1,383 | |||||
Undistributed Net Investment Income (Loss) | (210 | ) | (23 | ) | 25 | ||||||
Undistributed Net Realized Gain (Loss) | (3,252 | ) | (4,255 | ) | 10 | ||||||
Net Unrealized Appreciation (Depreciation) | 6,477 | 677 | 329 | ||||||||
Net Assets | $ | 41,388 | $ | 2,555 | $ | 1,747 | |||||
Class A ($ and shares in full) | |||||||||||
Net Assets | $ | 40,111,543 | $ | 1,184,795 | $ | 622,282 | |||||
Capital Shares Outstanding (Unlimited Number Authorized) | 3,770,754 | 181,681 | 51,675 | ||||||||
Net Asset Value Per Share | $ | 10.64 | $ | 6.52 | $ | 12.04 | |||||
Public Offering Price Per Share | $ | 11.29 | $ | 6.92 | $ | 12.77 | |||||
Class B ($ and shares in full) | |||||||||||
Net Assets | $ | 849,649 | $ | 1,087,296 | $ | 891,363 | |||||
Capital Shares Outstanding (Unlimited Number Authorized) | 81,052 | 170,319 | 74,156 | ||||||||
Net Asset Value Per Share | $ | 10.48 | $ | 6.38 | $ | 12.02 | |||||
Class C ($ and shares in full) | |||||||||||
Net Assets | $ | 426,557 | $ | 283,194 | $ | 233,838 | |||||
Capital Shares Outstanding (Unlimited Number Authorized) | 40,707 | 44,383 | 19,476 | ||||||||
Net Asset Value Per Share | $ | 10.48 | $ | 6.38 | $ | 12.01 | |||||
See Notes to Financial Statements.
49
STATEMENTS OF ASSETS AND LIABILITIES (continued)
June 30, 2004 (Unaudited)
| (In Thousands, Except As Noted) | ||||||||||||
| Strong Advisor Select Fund | Strong Advisor Technology Fund | Strong Advisor U.S. Small/Mid Cap Growth Fund | ||||||||||
Assets: | ||||||||||||
Investments in Securities, at Value (Cost of $64,238, $1,519, and $4,807, respectively) | $ | 79,184 | $ | 1,620 | $ | 5,635 | ||||||
Receivable for Securities Sold | 798 | — | — | |||||||||
Receivable for Fund Shares Sold | 181 | — | 19 | |||||||||
Dividends and Interest Receivable | 19 | — | — | |||||||||
Other Assets | 26 | 15 | 15 | |||||||||
Total Assets | 80,208 | 1,635 | 5,669 | |||||||||
Liabilities: | ||||||||||||
Payable for Securities Purchased | 2,221 | — | — | |||||||||
Payable for Fund Shares Redeemed | 7 | 39 | 2 | |||||||||
Accrued Operating Expenses and Other Liabilities | 27 | 8 | 7 | |||||||||
Total Liabilities | 2,255 | 47 | 9 | |||||||||
Net Assets | $ | 77,953 | $ | 1,588 | $ | 5,660 | ||||||
Net Assets Consist of: | ||||||||||||
Capital Stock (Par Value and Paid-in Capital) | $ | 61,115 | $ | 2,114 | $ | 5,074 | ||||||
Undistributed Net Investment Income (Loss) | (499 | ) | (16 | ) | (67 | ) | ||||||
Undistributed Net Realized Gain (Loss) | 2,391 | (611 | ) | (176 | ) | |||||||
Net Unrealized Appreciation (Depreciation) | 14,946 | 101 | 829 | |||||||||
Net Assets | $ | 77,953 | $ | 1,588 | $ | 5,660 | ||||||
Class A ($ and shares in full) | ||||||||||||
Net Assets | $ | 76,037,056 | $ | 836,897 | $ | 2,532,381 | ||||||
Capital Shares Outstanding (Unlimited Number Authorized) | 8,311,832 | 121,687 | 228,188 | |||||||||
Net Asset Value Per Share | $ | 9.15 | $ | 6.88 | $ | 11.10 | ||||||
Public Offering Price Per Share | $ | 9.71 | $ | 7.30 | $ | 11.78 | ||||||
Class B ($ and shares in full) | ||||||||||||
Net Assets | $ | 931,630 | $ | 538,825 | $ | 1,585,555 | ||||||
Capital Shares Outstanding (Unlimited Number Authorized) | 104,498 | 79,494 | 142,922 | |||||||||
Net Asset Value Per Share | $ | 8.92 | $ | 6.78 | $ | 11.09 | ||||||
Class C ($ and shares in full) | ||||||||||||
Net Assets | $ | 984,394 | $ | 212,695 | $ | 1,542,277 | ||||||
Capital Shares Outstanding (Unlimited Number Authorized) | 110,413 | 31,487 | 138,907 | |||||||||
Net Asset Value Per Share | $ | 8.92 | $ | 6.75 | $ | 11.10 | ||||||
See Notes to Financial Statements.
50
STATEMENTS OF ASSETS AND LIABILITIES (continued)
June 30, 2004 (Unaudited)
(In Thousands, Except As Noted) | |||
Strong Advisor Utilities and Energy Fund | |||
Assets: | |||
Investments in Securities, at Value (Cost of $6,656) | $ | 7,659 | |
Dividends and Interest Receivable | 19 | ||
Other Assets | 19 | ||
Total Assets | 7,697 | ||
Liabilities: | |||
Payable for Securities Purchased | 79 | ||
Payable for Fund Shares Redeemed | 7 | ||
Accrued Operating Expenses and Other Liabilities | 10 | ||
Total Liabilities | 96 | ||
Net Assets | $ | 7,601 | |
Net Assets Consist of: | |||
Capital Stock (Par Value and Paid-in Capital) | $ | 6,118 | |
Undistributed Net Investment Income (Loss) | 6 | ||
Undistributed Net Realized Gain (Loss) | 475 | ||
Net Unrealized Appreciation (Depreciation) | 1,002 | ||
Net Assets | $ | 7,601 | |
Class A ($ and shares in full) | |||
Net Assets | $ | 7,120,589 | |
Capital Shares Outstanding (Unlimited Number Authorized) | 640,316 | ||
Net Asset Value Per Share | $ | 11.12 | |
Public Offering Price Per Share | $ | 11.80 | |
Class B ($ and shares in full) | |||
Net Assets | $ | 283,523 | |
Capital Shares Outstanding (Unlimited Number Authorized) | 25,496 | ||
Net Asset Value Per Share | $ | 11.12 | |
Class C ($ and shares in full) | |||
Net Assets | $ | 197,331 | |
Capital Shares Outstanding (Unlimited Number Authorized) | 17,765 | ||
Net Asset Value Per Share | $ | 11.11 | |
See Notes to Financial Statements.
51
STATEMENTS OF ASSETS AND LIABILITIES (continued)
June 30, 2004 (Unaudited)
(In Thousands, Except As Noted) | ||||
Strong Advisor Large Company Core Fund | ||||
Assets: | ||||
Investments in Securities, at Value (Cost of $111,140) | $ | 119,692 | ||
Receivable for Securities Sold | 2,211 | |||
Receivable for Fund Shares Sold | 46 | |||
Dividends and Interest Receivable | 81 | |||
Other Assets | 38 | |||
Total Assets | 122,068 | |||
Liabilities: | ||||
Payable for Securities Purchased | 4,520 | |||
Payable for Fund Shares Redeemed | 194 | |||
Accrued Operating Expenses and Other Liabilities | 30 | |||
Total Liabilities | 4,744 | |||
Net Assets | $ | 117,324 | ||
Net Assets Consist of: | ||||
Capital Stock (Par Value and Paid-in Capital) | $ | 102,303 | ||
Undistributed Net Investment Income (Loss) | (97 | ) | ||
Undistributed Net Realized Gain (Loss) | 6,566 | |||
Net Unrealized Appreciation (Depreciation) | 8,552 | |||
Net Assets | $ | 117,324 | ||
Class A ($ and shares in full) | ||||
Net Assets | $ | 61,404,932 | ||
Capital Shares Outstanding (Unlimited Number Authorized) | 5,619,631 | |||
Net Asset Value Per Share | $ | 10.93 | ||
Public Offering Price Per Share | $ | 11.60 | ||
Class B ($ and shares in full) | ||||
Net Assets | $ | 8,845,769 | ||
Capital Shares Outstanding (Unlimited Number Authorized) | 822,108 | |||
Net Asset Value Per Share | $ | 10.76 | ||
Class C ($ and shares in full) | ||||
Net Assets | $ | 7,872,013 | ||
Capital Shares Outstanding (Unlimited Number Authorized) | 731,899 | |||
Net Asset Value Per Share | $ | 10.76 | ||
Class K ($ and shares in full) | ||||
Net Assets | $ | 39,201,562 | ||
Capital Shares Outstanding (Unlimited Number Authorized) | 3,567,043 | |||
Net Asset Value Per Share | $ | 10.99 | ||
See Notes to Financial Statements.
52
For the Six Months Ended June 30, 2004 (Unaudited)
| (In Thousands) | ||||||||||||
| Strong Advisor Common Stock Fund | Strong Advisor Mid Cap Growth Fund | Strong Advisor Small Cap Value Fund | ||||||||||
Income: | ||||||||||||
Dividends – Unaffiliated Issuers (net of foreign withholding taxes of $74, $2, and $127, respectively) | $ | 8,247 | $ | 99 | $ | 4,206 | ||||||
Dividends – Affiliated Issuers | — | — | 291 | |||||||||
Interest | 427 | 8 | 516 | |||||||||
Total Income | 8,674 | 107 | 5,013 | |||||||||
Expenses (Note 4): | ||||||||||||
Investment Advisory Fees | 5,739 | 248 | 7,913 | |||||||||
Administrative Fees | 2,296 | 99 | 3,165 | |||||||||
Custodian Fees | 46 | 8 | 78 | |||||||||
Shareholder Servicing Costs | 1,681 | 156 | 2,698 | |||||||||
Reports to Shareholders | 256 | 53 | 396 | |||||||||
12b-1 Fees | 453 | 30 | 2,179 | |||||||||
Other | 237 | 46 | 295 | |||||||||
Total Expenses before Expense Offsets | 10,708 | 640 | 16,724 | |||||||||
Expense Offsets | (213 | ) | (23 | ) | (370 | ) | ||||||
Expenses, Net | 10,495 | 617 | 16,354 | |||||||||
Net Investment Income (Loss) | (1,821 | ) | (510 | ) | (11,341 | ) | ||||||
Realized and Unrealized Gain (Loss): | ||||||||||||
Net Realized Gain (Loss) on: | ||||||||||||
Investments | 139,387 | 6,397 | 190,792 | |||||||||
Foreign Currencies | 8 | — | — | |||||||||
Written Options | — | — | (2,475 | ) | ||||||||
Net Realized Gain (Loss) | 139,395 | 6,397 | 188,317 | |||||||||
Net Change in Unrealized Appreciation/Depreciation on: | ||||||||||||
Investments | (103,948 | ) | (2,329 | ) | (65,258 | ) | ||||||
Foreign Currencies | (5 | ) | — | — | ||||||||
Written Options | — | — | 1,635 | |||||||||
Net Change in Unrealized Appreciation/Depreciation | (103,953 | ) | (2,329 | ) | (63,623 | ) | ||||||
Net Gain (Loss) on Investments | 35,442 | 4,068 | 124,694 | |||||||||
Net Increase (Decrease) in Net Assets Resulting from Operations | $ | 33,621 | $ | 3,558 | $ | 113,353 | ||||||
See Notes to Financial Statements.
53
STATEMENTS OF OPERATIONS (continued)
For the Six Months Ended June 30, 2004 (Unaudited)
| (In Thousands) | ||||
| Strong Advisor U.S. Value Fund | ||||
Income: | ||||
Dividends (net of foreign withholding taxes of $6) | $ | 3,771 | ||
Interest | 28 | |||
Total Income | 3,799 | |||
Expenses (Note 4): | ||||
Investment Advisory Fees | 883 | |||
Administrative Fees | 461 | |||
Custodian Fees | 12 | |||
Shareholder Servicing Costs | 492 | |||
Reports to Shareholders | 128 | |||
12b-1 Fees | 55 | |||
Other | 92 | |||
Total Expenses before Expense Offsets | 2,123 | |||
Expense Offsets | (68 | ) | ||
Expenses, Net | 2,055 | |||
Net Investment Income (Loss) | 1,744 | |||
Realized and Unrealized Gain (Loss): | ||||
Net Realized Gain (Loss) on: | ||||
Investments | 11,160 | |||
Futures Contracts | (15 | ) | ||
Written Options | 33 | |||
Net Realized Gain (Loss) | 11,178 | |||
Net Change in Unrealized Appreciation/Depreciation on Investments | 1,885 | |||
Net Gain (Loss) on Investments | 13,063 | |||
Net Increase (Decrease) in Net Assets Resulting from Operations | $ | 14,807 | ||
See Notes to Financial Statements.
54
STATEMENTS OF OPERATIONS (continued)
For the Six Months Ended June 30, 2004 (Unaudited)
| (In Thousands) | ||||||||||||
| Strong Advisor Endeavor Large Cap Fund | Strong Advisor Focus Fund | Strong Advisor International Core Fund | ||||||||||
Income: | ||||||||||||
Dividends (net of foreign withholding taxes of $3, $0, and $3, respectively) | $ | 113 | $ | 3 | $ | 25 | ||||||
Interest | 3 | — | — | |||||||||
Total Income | 116 | 3 | 25 | |||||||||
Expenses (Note 4): | ||||||||||||
Investment Advisory Fees | 145 | 10 | 6 | |||||||||
Administrative Fees | 58 | 4 | 2 | |||||||||
Custodian Fees | 5 | 3 | 6 | |||||||||
Shareholder Servicing Costs | 39 | 3 | 2 | |||||||||
Reports to Shareholders | 3 | 4 | 1 | |||||||||
12b-1 Fees | 53 | 9 | 6 | |||||||||
Professional Fees | 9 | 7 | 7 | |||||||||
Federal and State Registration Fees | 19 | 18 | 17 | |||||||||
Other | 4 | 1 | 1 | |||||||||
Total Expenses before Expense Offsets | 335 | 59 | 48 | |||||||||
Expense Offsets | (9 | ) | (33 | ) | (48 | ) | ||||||
Expenses, Net | 326 | 26 | — | |||||||||
Net Investment Income (Loss) | (210 | ) | (23 | ) | 25 | |||||||
Realized and Unrealized Gain (Loss): | ||||||||||||
Net Realized Gain (Loss) on Investments | 2,611 | 320 | 50 | |||||||||
Net Change in Unrealized Appreciation/Depreciation on Investments | 3 | (63 | ) | 2 | ||||||||
Net Gain (Loss) on Investments | 2,614 | 257 | 52 | |||||||||
Net Increase (Decrease) in Net Assets Resulting from Operations | $ | 2,404 | $ | 234 | $ | 77 | ||||||
See Notes to Financial Statements.
55
STATEMENTS OF OPERATIONS (continued)
For the Six Months Ended June 30, 2004 (Unaudited)
| (In Thousands) | ||||||||||||
| Strong Advisor Select Fund | Strong Advisor Technology Fund | Strong Advisor U.S. Small/Mid Cap Growth Fund | ||||||||||
Income: | ||||||||||||
Dividends (net of foreign withholding taxes of $4, $0, and $0, respectively) | $ | 95 | $ | 1 | $ | 3 | ||||||
Interest | 6 | — | — | |||||||||
Total Income | 101 | 1 | 3 | |||||||||
Expenses (Note 4): | ||||||||||||
Investment Advisory Fees | 284 | 6 | 21 | |||||||||
Administrative Fees | 114 | 2 | 9 | |||||||||
Custodian Fees | 6 | 1 | 2 | |||||||||
Shareholder Servicing Costs | 76 | 2 | 6 | |||||||||
12b-1 Fees | 100 | 5 | 18 | |||||||||
Professional Fees | 12 | 6 | 7 | |||||||||
Federal and State Registration Fees | 18 | 18 | 19 | |||||||||
Other | 6 | 2 | 3 | |||||||||
Total Expenses before Expense Offsets | 616 | 42 | 85 | |||||||||
Expenses Offsets | (16 | ) | (25 | ) | (15 | ) | ||||||
Expenses, Net | 600 | 17 | 70 | |||||||||
Net Investment Income (Loss) | (499 | ) | (16 | ) | (67 | ) | ||||||
Realized and Unrealized Gain (Loss): | ||||||||||||
Net Realized Gain (Loss) on Investments | 8,364 | 153 | 71 | |||||||||
Net Change in Unrealized Appreciation/Depreciation on Investments | (791 | ) | (222 | ) | (69 | ) | ||||||
Net Gain (Loss) on Investments | 7,573 | (69 | ) | 2 | ||||||||
Net Increase (Decrease) in Net Assets Resulting from Operations | $ | 7,074 | $ | (85 | ) | $ | (65 | ) | ||||
See Notes to Financial Statements.
56
STATEMENTS OF OPERATIONS (continued)
For the Six Months Ended June 30, 2004 (Unaudited)
| (In Thousands) | ||||
| Strong Advisor Utilities and Energy Fund | ||||
Income: | ||||
Dividends (net of foreign withholding taxes of $4) | $ | 145 | ||
Interest | 2 | |||
Total Income | 147 | |||
Expenses (Note 4): | ||||
Investment Advisory Fees | 38 | |||
Administrative Fees | 15 | |||
Custodian Fees | 4 | |||
Shareholder Servicing Costs | 10 | |||
12b-1 Fees | 14 | |||
Professional Fees | 7 | |||
Federal and State Registration Fees | 20 | |||
Other | 1 | |||
Total Expenses before Expense Offsets | 109 | |||
Expense Offsets | (2 | ) | ||
Expenses, Net | 107 | |||
Net Investment Income (Loss) | 40 | |||
Realized and Unrealized Gain (Loss): | ||||
Net Realized Gain (Loss) on Investments | 921 | |||
Net Change in Unrealized Appreciation/Depreciation on Investments | (536 | ) | ||
Net Gain (Loss) on Investments | 385 | |||
Net Increase (Decrease) in Net Assets Resulting from Operations | $ | 425 | ||
See Notes to Financial Statements.
57
STATEMENTS OF OPERATIONS (continued)
For the Six Months Ended June 30, 2004 (Unaudited)
| (In Thousands) | ||||
| Strong Advisor Large Company Core Fund | ||||
Income: | ||||
Dividends (net of foreign withholding taxes of $7) | $ | 689 | ||
Interest | 57 | |||
Total Income | 746 | |||
Expenses (Note 4): | ||||
Investment Advisory Fees | 437 | |||
Administrative Fees | 166 | |||
Custodian Fees | 7 | |||
Shareholder Servicing Costs | 118 | |||
12b-1 Fees | 160 | |||
Other | 54 | |||
Total Expenses before Expense Offsets | 942 | |||
Expense Offsets | (99 | ) | ||
Expenses, Net | 843 | |||
Net Investment Income (Loss) | (97 | ) | ||
Realized and Unrealized Gain (Loss): | ||||
Net Realized Gain (Loss) on Investments | 7,747 | |||
Net Change in Unrealized Appreciation/Depreciation on Investments | (4,505 | ) | ||
Net Gain (Loss) on Investments | 3,242 | |||
Net Increase (Decrease) in Net Assets Resulting from Operations | $ | 3,145 | ||
See Notes to Financial Statements.
58
STATEMENTS OF CHANGES IN NET ASSETS
| (In Thousands) | ||||||||||||||||
Strong Advisor Common Stock Fund | Strong Advisor Mid Cap Growth Fund | |||||||||||||||
| Six Months Ended June 30, 2004 | Year Ended Dec. 31, 2003 | Six Months Ended June 30, 2004 | Year Ended Dec. 31, 2003 | |||||||||||||
| (Unaudited) | (Unaudited) | |||||||||||||||
Operations: | ||||||||||||||||
Net Investment Income (Loss) | $ | (1,821 | ) | $ | (7,290 | ) | $ | (510 | ) | $ | (1,218 | ) | ||||
Net Realized Gain (Loss) | 139,395 | 76,043 | 6,397 | 11,159 | ||||||||||||
Net Change in Unrealized Appreciation/Depreciation | (103,953 | ) | 450,650 | (2,329 | ) | 16,288 | ||||||||||
Net Increase (Decrease) in Net Assets Resulting from Operations | 33,621 | 519,403 | 3,558 | 26,229 | ||||||||||||
Distributions From Net Investment Income | — | — | — | — | ||||||||||||
Capital Share Transactions (Note 8): | ||||||||||||||||
Net Increase (Decrease) in Net Assets from Capital Share Transactions | (160,728 | ) | (384,712 | ) | (10,952 | ) | (29,181 | ) | ||||||||
Total Increase (Decrease) in Net Assets | (127,107 | ) | 134,691 | (7,394 | ) | (2,952 | ) | |||||||||
Net Assets: | ||||||||||||||||
Beginning of Period | 1,590,978 | 1,456,287 | 71,317 | 74,269 | ||||||||||||
End of Period | $ | 1,463,871 | $ | 1,590,978 | $ | 63,923 | $ | 71,317 | ||||||||
Undistributed Net Investment Income (Loss) | $ | (1,821 | ) | $ | — | $ | (510 | ) | $ | — | ||||||
Strong Advisor Small Cap Value Fund | ||||||||
| Six Months Ended June 30, 2004 | Year Ended Dec. 31, 2003 | |||||||
| (Unaudited) | ||||||||
Operations: | ||||||||
Net Investment Income (Loss) | $ | (11,341 | ) | $ | (9,098 | ) | ||
Net Realized Gain (Loss) | 188,317 | 82,632 | ||||||
Net Change in Unrealized Appreciation/Depreciation | (63,623 | ) | 595,643 | |||||
Net Increase (Decrease) in Net Assets Resulting from Operations | 113,353 | 669,177 | ||||||
Distributions: | ||||||||
From Net Investment Income: | ||||||||
Class A | — | (248 | ) | |||||
Class B | — | (48 | ) | |||||
Class C | — | (61 | ) | |||||
Class Z | — | (436 | ) | |||||
From Net Realized Gains: | ||||||||
Class A | (6,781 | ) | (15,533 | ) | ||||
Class B | (1,326 | ) | (2,975 | ) | ||||
Class C | (1,615 | ) | (3,815 | ) | ||||
Class Z | (12,667 | ) | (27,278 | ) | ||||
Total Distributions | (22,389 | ) | (50,394 | ) | ||||
Capital Share Transactions (Note 8): | ||||||||
Net Increase (Decrease) in Net Assets from Capital Share Transactions | (177,084 | ) | 339,695 | |||||
Total Increase (Decrease) in Net Assets | (86,120 | ) | 958,478 | |||||
Net Assets: | ||||||||
Beginning of Period | 2,125,769 | 1,167,291 | ||||||
End of Period | $ | 2,039,649 | $ | 2,125,769 | ||||
Undistributed Net Investment Income (Loss) | $ | (11,341 | ) | $ | — | |||
See Notes to Financial Statements.
59
STATEMENTS OF CHANGES IN NET ASSETS (continued)
| (In Thousands) | ||||||||
Strong Advisor U.S. Value Fund | ||||||||
| Six Months Ended June 30, 2004 | Year Ended Dec. 31, 2003 | |||||||
| (Unaudited) | ||||||||
Operations: | ||||||||
Net Investment Income (Loss) | $ | 1,744 | $ | 1,864 | ||||
Net Realized Gain (Loss) | 11,178 | 11,073 | ||||||
Net Change in Unrealized Appreciation/Depreciation | 1,885 | 49,990 | ||||||
Net Increase (Decrease) in Net Assets Resulting from Operations | 14,807 | 62,927 | ||||||
Distributions: | ||||||||
From Net Investment Income: | ||||||||
Class A | (15 | ) | (36 | ) | ||||
Class B | (4 | ) | (11 | ) | ||||
Class C | (1 | ) | (9 | ) | ||||
Class K | (479 | ) | (523 | ) | ||||
Class Z | (1,074 | ) | (1,255 | ) | ||||
Total Distributions | (1,573 | ) | (1,834 | ) | ||||
Capital Share Transactions (Note 8): | ||||||||
Net Increase (Decrease) in Net Assets from Capital Share Transactions | 66,505 | (16,592 | ) | |||||
Total Increase (Decrease) in Net Assets | 79,739 | 44,501 | ||||||
Net Assets: | ||||||||
Beginning of Period | 260,271 | 215,770 | ||||||
End of Period | $ | 340,010 | $ | 260,271 | ||||
Undistributed Net Investment Income (Loss) | $ | 190 | $ | 19 | ||||
See Notes to Financial Statements.
60
STATEMENTS OF CHANGES IN NET ASSETS (continued)
| (In Thousands) | ||||||||||||||||
Strong Advisor Endeavor Large Cap Fund | Strong Advisor Focus Fund | |||||||||||||||
| Six Months Ended June 30, 2004 | Year Ended Dec. 31, 2003 | Six Months Ended June 30, 2004 | Year Ended Dec. 31, 2003 | |||||||||||||
| (Unaudited) | (Unaudited) | |||||||||||||||
Operations: | ||||||||||||||||
Net Investment Income (Loss) | $ | (210 | ) | $ | (305 | ) | $ | (23 | ) | $ | (47 | ) | ||||
Net Realized Gain (Loss) | 2,611 | 3,624 | 320 | 225 | ||||||||||||
Net Change in Unrealized Appreciation/Depreciation | 3 | 6,766 | (63 | ) | 615 | |||||||||||
Net Increase (Decrease) in Net Assets Resulting from Operations | 2,404 | 10,085 | 234 | 793 | ||||||||||||
Distributions From Net Investment Income | — | — | — | — | ||||||||||||
Capital Share Transactions (Note 8): | ||||||||||||||||
Net Increase (Decrease) in Net Assets from Capital Share Transactions | 1,234 | (1,142 | ) | (799 | ) | (1,326 | ) | |||||||||
Total Increase (Decrease) in Net Assets | 3,638 | 8,943 | (565 | ) | (533 | ) | ||||||||||
Net Assets: | ||||||||||||||||
Beginning of Period | 37,750 | 28,807 | 3,120 | 3,653 | ||||||||||||
End of Period | $ | 41,388 | $ | 37,750 | $ | 2,555 | $ | 3,120 | ||||||||
Undistributed Net Investment Income (Loss) | $ | (210 | ) | $ | — | $ | (23 | ) | $ | — | ||||||
| Strong Advisor International Core Fund | Strong Advisor Select Fund | |||||||||||||||
| Six Months Ended June 30, 2004 | Year Ended Dec. 31, 2003 | Six Months Ended June 30, 2004 | Year Ended Dec. 31, 2003 | |||||||||||||
| (Unaudited) | (Unaudited) | |||||||||||||||
Operations: | ||||||||||||||||
Net Investment Income (Loss) | $ | 25 | $ | 22 | $ | (499 | ) | $ | (745 | ) | ||||||
Net Realized Gain (Loss) | 50 | (12 | ) | 8,364 | 8,935 | |||||||||||
Net Change in Unrealized Appreciation/Depreciation | 2 | 342 | (791 | ) | 15,584 | |||||||||||
Net Increase (Decrease) in Net Assets Resulting from Operations | 77 | 352 | 7,074 | 23,774 | ||||||||||||
Distributions: | ||||||||||||||||
From Net Investment Income: | ||||||||||||||||
Class A | (1 | ) | (7 | ) | — | — | ||||||||||
Class B | (1 | ) | (10 | ) | — | — | ||||||||||
Class C | — | (3 | ) | — | — | |||||||||||
Total Distributions | (2 | ) | (20 | ) | — | — | ||||||||||
Capital Share Transactions (Note 8): | ||||||||||||||||
Net Increase (Decrease) in Net Assets from Capital Share Transactions | 177 | 562 | (11,378 | ) | 2,173 | |||||||||||
Total Increase (Decrease) in Net Assets | 252 | 894 | (4,304 | ) | 25,947 | |||||||||||
Net Assets: | ||||||||||||||||
Beginning of Period | 1,495 | 601 | 82,257 | 56,310 | ||||||||||||
End of Period | $ | 1,747 | $ | 1,495 | $ | 77,953 | $ | 82,257 | ||||||||
Undistributed Net Investment Income (Loss) | $ | 25 | $ | 2 | $ | (499 | ) | $ | — | |||||||
See Notes to Financial Statements.
61
STATEMENTS OF CHANGES IN NET ASSETS (continued)
| (In Thousands) | ||||||||||||||||
Strong Advisor Technology Fund | Strong Advisor U.S. Small/Mid Cap Growth Fund | |||||||||||||||
| Six Months Ended June 30, 2004 | Year Ended Dec. 31, 2003 | Six Months Ended June 30, 2004 | Year Ended Dec. 31, 2003 | |||||||||||||
| (Unaudited) | (Unaudited) | |||||||||||||||
Operations: | ||||||||||||||||
Net Investment Income (Loss) | $ | (16 | ) | $ | (39 | ) | $ | (67 | ) | $ | (58 | ) | ||||
Net Realized Gain (Loss) | 153 | 435 | 71 | (68 | ) | |||||||||||
Net Change in Unrealized Appreciation/Depreciation | (222 | ) | 787 | (69 | ) | 890 | ||||||||||
Net Increase (Decrease) in Net Assets Resulting from Operations | (85 | ) | 1,183 | (65 | ) | 764 | ||||||||||
Distributions From Net Investment Income | — | — | — | — | ||||||||||||
Capital Share Transactions (Note 8): | ||||||||||||||||
Net Increase (Decrease) in Net Assets from Capital Share Transactions | (520 | ) | (479 | ) | 188 | 4,011 | ||||||||||
Total Increase (Decrease) in Net Assets | (605 | ) | 704 | 123 | 4,775 | |||||||||||
Net Assets: | ||||||||||||||||
Beginning of Period | 2,193 | 1,489 | 5,537 | 762 | ||||||||||||
End of Period | $ | 1,588 | $ | 2,193 | $ | 5,660 | $ | 5,537 | ||||||||
Undistributed Net Investment Income (Loss) | $ | (16 | ) | $ | — | $ | (67 | ) | $ | — | ||||||
Strong Advisor Utilities and Energy Fund | ||||||||
| Six Months Ended June 30, 2004 | Year Ended Dec. 31, 2003 | |||||||
| (Unaudited) | ||||||||
Operations: | ||||||||
Net Investment Income (Loss) | $ | 40 | $ | 185 | ||||
Net Realized Gain (Loss) | 921 | 134 | ||||||
Net Change in Unrealized Appreciation/Depreciation | (536 | ) | 1,523 | |||||
Net Increase (Decrease) in Net Assets Resulting from Operations | 425 | 1,842 | ||||||
Distributions: | ||||||||
From Net Investment Income: | ||||||||
Class A | (33 | ) | (180 | ) | ||||
Class B | (1 | ) | (2 | ) | ||||
Class C | (1 | ) | (2 | ) | ||||
Total Distributions | (35 | ) | (184 | ) | ||||
Capital Share Transactions (Note 8): | ||||||||
Net Increase (Decrease) in Net Assets from Capital Share Transactions | (3,104 | ) | 2,271 | |||||
Total Increase (Decrease) in Net Assets | (2,714 | ) | 3,929 | |||||
Net Assets: | ||||||||
Beginning of Period | 10,315 | 6,386 | ||||||
End of Period | $ | 7,601 | $ | 10,315 | ||||
Undistributed Net Investment Income (Loss) | $ | 6 | $ | 1 | ||||
See Notes to Financial Statements.
62
STATEMENTS OF CHANGES IN NET ASSETS (continued)
| (In Thousands) | ||||||||
Strong Advisor Large Company Core Fund | ||||||||
| Six Months Ended June 30, 2004 | Year Ended Dec. 31, 2003 | |||||||
| (Unaudited) | ||||||||
Operations: | ||||||||
Net Investment Income (Loss) | $ | (97 | ) | $ | 23 | |||
Net Realized Gain (Loss) | 7,747 | 2,100 | ||||||
Net Change in Unrealized Appreciation/Depreciation | (4,505 | ) | 13,076 | |||||
Net Increase (Decrease) in Net Assets Resulting from Operations | 3,145 | 15,199 | ||||||
Distributions: | ||||||||
From Net Investment Income: | ||||||||
Class A | — | (20 | ) | |||||
Class K | — | (46 | ) | |||||
From Net Realized Gains: | ||||||||
Class A | (1,059 | ) | (62 | ) | ||||
Class B | (136 | ) | (7 | ) | ||||
Class C | (118 | ) | (6 | ) | ||||
Class K | (544 | ) | (33 | ) | ||||
Total Distributions | (1,857 | ) | (174 | ) | ||||
Capital Share Transactions (Note 8): | ||||||||
Net Increase (Decrease) in Net Assets from Capital Share Transactions | (669 | ) | 92,004 | |||||
Total Increase (Decrease) in Net Assets | 619 | 107,029 | ||||||
Net Assets: | ||||||||
Beginning of Period | 116,705 | 9,676 | ||||||
End of Period | $ | 117,324 | $ | 116,705 | ||||
Undistributed Net Investment Income (Loss) | $ | (97 | ) | $ | — | |||
See Notes to Financial Statements.
63
STRONG ADVISOR COMMON STOCK FUND — CLASS A
| Period Ended | ||||||||||||||||||||
| June 30, 2004(b) | Dec. 31, 2003 | Dec. 31, 2002 | Dec. 31, 2001 | Dec. 31, 2000(c)(d) | ||||||||||||||||
Selected Per-Share Data(a) | ||||||||||||||||||||
Net Asset Value, Beginning of Period | $ | 21.98 | $ | 15.87 | $ | 19.71 | $ | 20.15 | $ | 18.90 | ||||||||||
Income From Investment Operations: | ||||||||||||||||||||
Net Investment Income (Loss) | (0.05 | ) | (0.10 | ) | (0.08 | )(e) | (0.04 | ) | (0.00 | )(f) | ||||||||||
Net Realized and Unrealized Gains (Losses) on Investments | 0.52 | 6.21 | (3.76 | ) | (0.36 | ) | 1.28 | |||||||||||||
Total from Investment Operations | 0.47 | 6.11 | (3.84 | ) | (0.40 | ) | 1.28 | |||||||||||||
Less Distributions: | ||||||||||||||||||||
From Net Investment Income | — | — | — | — | (0.03 | ) | ||||||||||||||
From Net Realized Gains | — | — | — | (0.04 | ) | — | ||||||||||||||
Total Distributions | — | — | — | (0.04 | ) | (0.03 | ) | |||||||||||||
Net Asset Value, End of Period | $ | 22.45 | $ | 21.98 | $ | 15.87 | $ | 19.71 | $ | 20.15 | ||||||||||
Ratios and Supplemental Data | ||||||||||||||||||||
Total Return | +2.14 | % | +38.50 | % | –19.48 | % | –1.99 | % | +6.78 | % | ||||||||||
Net Assets, End of Period (In Millions) | $ | 79 | $ | 81 | $ | 46 | $ | 28 | $ | 0 | (g) | |||||||||
Ratio of Expenses to Average Net Assets before Expense Offsets | 1.6 | %* | 1.6 | % | 1.6 | % | 1.6 | % | 1.6 | %* | ||||||||||
Ratio of Expenses to Average Net Assets | 1.5 | %* | 1.5 | % | 1.6 | % | 1.6 | % | 1.6 | %* | ||||||||||
Ratio of Net Investment Income (Loss) to Average Net Assets | (0.4 | )%* | (0.6 | )% | (0.5 | )% | (0.5 | )% | (0.2 | )%* | ||||||||||
Portfolio Turnover Rate(h) | 26.8 | % | 41.8 | % | 64.9 | % | 89.3 | % | 95.4 | % | ||||||||||
STRONG ADVISOR COMMON STOCK FUND — CLASS B
| Period Ended | ||||||||||||||||||||
| June 30, 2004(b) | Dec. 31, 2003 | Dec. 31, 2002 | Dec. 31, 2001 | Dec. 31, 2000(c)(d) | ||||||||||||||||
Selected Per-Share Data(a) | ||||||||||||||||||||
Net Asset Value, Beginning of Period | $ | 21.53 | $ | 15.67 | $ | 19.62 | $ | 20.16 | $ | 18.90 | ||||||||||
Income From Investment Operations: | ||||||||||||||||||||
Net Investment Income (Loss) | (0.13 | ) | (0.24 | ) | (0.22 | )(e) | (0.09 | ) | (0.01 | ) | ||||||||||
Net Realized and Unrealized Gains (Losses) on Investments | 0.51 | 6.10 | (3.73 | ) | (0.41 | ) | 1.28 | |||||||||||||
Total from Investment Operations | 0.38 | 5.86 | (3.95 | ) | (0.50 | ) | 1.27 | |||||||||||||
Less Distributions: | ||||||||||||||||||||
From Net Investment Income | — | — | — | — | (0.01 | ) | ||||||||||||||
From Net Realized Gains | — | — | — | (0.04 | ) | — | ||||||||||||||
Total Distributions | — | — | — | (0.04 | ) | (0.01 | ) | |||||||||||||
Net Asset Value, End of Period | $ | 21.91 | $ | 21.53 | $ | 15.67 | $ | 19.62 | $ | 20.16 | ||||||||||
Ratios and Supplemental Data | ||||||||||||||||||||
Total Return | +1.76 | % | +37.40 | % | –20.13 | % | –2.48 | % | +6.76 | % | ||||||||||
Net Assets, End of Period (In Millions) | $ | 38 | $ | 39 | $ | 24 | $ | 16 | $ | 0 | (g) | |||||||||
Ratio of Expenses to Average Net Assets before Expense Offsets | 2.3 | %* | 2.4 | % | 2.4 | % | 2.5 | % | 2.0 | %* | ||||||||||
Ratio of Expenses to Average Net Assets | 2.3 | %* | 2.3 | % | 2.4 | % | 2.3 | % | 2.0 | %* | ||||||||||
Ratio of Net Investment Income (Loss) to Average Net Assets | (1.2 | )%* | (1.4 | )% | (1.3 | )% | (1.1 | )% | (0.6 | )%* | ||||||||||
Portfolio Turnover Rate(h) | 26.8 | % | 41.8 | % | 64.9 | % | 89.3 | % | 95.4 | % | ||||||||||
| * | Calculated on an annualized basis. |
| (a) | Information presented relates to a share of capital stock of the Fund outstanding for the entire period. |
| (b) | For the six months ended June 30, 2004 (Unaudited). |
| (c) | For the period from November 30, 2000 (commencement of class) to December 31, 2000. |
| (d) | Per share data reflects a 1.233 for 1.000 share split which occurred on March 8, 2001. |
| (e) | Net investment income (loss) per share represents net investment income (loss) divided by average shares outstanding throughout the year. |
| (f) | Amount calculated is less than $0.005. |
| (g) | Amount is less than $500,000. |
| (h) | Calculated on the basis of the Fund as a whole without distinguishing between the classes of shares issued. |
See Notes to Financial Statements.
64
FINANCIAL HIGHLIGHTS (continued)
STRONG ADVISOR COMMON STOCK FUND — CLASS C
| Period Ended | ||||||||||||||||||||
| June 30, 2004(b) | Dec. 31, 2003 | Dec. 31, 2002 | Dec. 31, 2001 | Dec. 31, 2000(c)(d) | ||||||||||||||||
Selected Per-Share Data(a) | ||||||||||||||||||||
Net Asset Value, Beginning of Period | $ | 21.53 | $ | 15.68 | $ | 19.62 | $ | 20.16 | $ | 18.90 | ||||||||||
Income From Investment Operations: | ||||||||||||||||||||
Net Investment Income (Loss) | (0.14 | ) | (0.25 | ) | (0.22 | )(e) | (0.09 | ) | (0.01 | ) | ||||||||||
Net Realized and Unrealized Gains (Losses) on Investments | 0.52 | 6.10 | (3.72 | ) | (0.41 | ) | 1.28 | |||||||||||||
Total from Investment Operations | 0.38 | 5.85 | (3.94 | ) | (0.50 | ) | 1.27 | |||||||||||||
Less Distributions: | ||||||||||||||||||||
From Net Investment Income | — | — | — | — | (0.01 | ) | ||||||||||||||
From Net Realized Gains | — | — | — | (0.04 | ) | — | ||||||||||||||
Total Distributions | — | — | — | (0.04 | ) | (0.01 | ) | |||||||||||||
Net Asset Value, End of Period | $ | 21.91 | $ | 21.53 | $ | 15.68 | $ | 19.62 | $ | 20.16 | ||||||||||
Ratios and Supplemental Data | ||||||||||||||||||||
Total Return | +1.76 | % | +37.31 | % | –20.08 | % | –2.48 | % | +6.76 | % | ||||||||||
Net Assets, End of Period (In Millions) | $ | 30 | $ | 34 | $ | 23 | $ | 15 | $ | 0 | (f) | |||||||||
Ratio of Expenses to Average Net Assets before Expense Offsets | 2.4 | %* | 2.4 | % | 2.4 | % | 2.4 | % | 2.0 | %* | ||||||||||
Ratio of Expenses to Average Net Assets | 2.3 | %* | 2.3 | % | 2.4 | % | 2.2 | % | 2.0 | %* | ||||||||||
Ratio of Net Investment Income (Loss) to Average Net Assets | (1.2 | )%* | (1.4 | )% | (1.3 | )% | (1.1 | )% | (0.6 | )%* | ||||||||||
Portfolio Turnover Rate(g) | 26.8 | % | 41.8 | % | 64.9 | % | 89.3 | % | 95.4 | % | ||||||||||
STRONG ADVISOR COMMON STOCK FUND — CLASS Z
| Period Ended | ||||||||||||||||||||||||
| June 30, 2004(b) | Dec. 31, 2003 | Dec. 31, 2002 | Dec. 31, 2001 | Dec. 31, 2000 | Dec. 31, 1999 | |||||||||||||||||||
Selected Per-Share Data(a) | ||||||||||||||||||||||||
Net Asset Value, Beginning of Period | $ | 22.15 | $ | 15.97 | $ | 19.78 | $ | 20.16 | $ | 25.21 | $ | 21.06 | ||||||||||||
Income From Investment Operations: | ||||||||||||||||||||||||
Net Investment Income (Loss) | (0.02 | ) | (0.09 | ) | (0.05 | )(e) | (0.02 | ) | 0.04 | (0.01 | ) | |||||||||||||
Net Realized and Unrealized Gains (Losses) on Investments | 0.52 | 6.27 | (3.76 | ) | (0.32 | ) | (0.59 | ) | 8.19 | |||||||||||||||
Total from Investment Operations | 0.50 | 6.18 | (3.81 | ) | (0.34 | ) | (0.55 | ) | 8.18 | |||||||||||||||
Less Distributions: | ||||||||||||||||||||||||
From Net Investment Income | — | — | — | — | (0.04 | ) | — | |||||||||||||||||
From Net Realized Gains | — | — | — | (0.04 | ) | (4.46 | ) | (4.03 | ) | |||||||||||||||
Total Distributions | — | — | — | (0.04 | ) | (4.50 | ) | (4.03 | ) | |||||||||||||||
Net Asset Value, End of Period | $ | 22.65 | $ | 22.15 | $ | 15.97 | $ | 19.78 | $ | 20.16 | $ | 25.21 | ||||||||||||
Ratios and Supplemental Data | ||||||||||||||||||||||||
Total Return | +2.26 | % | +38.70 | % | –19.26 | % | –1.70 | % | –1.20 | % | +40.35 | % | ||||||||||||
Net Assets, End of Period (In Millions) | $ | 1,317 | $ | 1,437 | $ | 1,363 | $ | 1,703 | $ | 1,719 | $ | 1,733 | ||||||||||||
Ratio of Expenses to Average Net Assets before Expense Offsets | 1.3 | %* | 1.4 | % | 1.3 | % | 1.3 | % | 1.2 | % | 1.2 | % | ||||||||||||
Ratio of Expenses to Average Net Assets | 1.3 | %* | 1.4 | % | 1.3 | % | 1.3 | % | 1.2 | % | 1.2 | % | ||||||||||||
Ratio of Net Investment Income (Loss) to Average Net Assets | (0.2 | )%* | (0.4 | )% | (0.3 | )% | (0.1 | )% | 0.2 | % | (0.1 | )% | ||||||||||||
Portfolio Turnover Rate(g) | 26.8 | % | 41.8 | % | 64.9 | % | 89.3 | % | 95.4 | % | 80.1 | % | ||||||||||||
| * | Calculated on an annualized basis. |
| (a) | Information presented relates to a share of capital stock of the Fund outstanding for the entire period. |
| (b) | For the six months ended June 30, 2004 (Unaudited). |
| (c) | For the period from November 30, 2000 (commencement of class) to December 31, 2000. |
| (d) | Per share data reflects a 1.233 for 1.000 share split which occurred on March 8, 2001. |
| (e) | Net investment income (loss) per share represents net investment income (loss) divided by average shares outstanding throughout the year. |
| (f) | Amount is less than $500,000. |
| (g) | Calculated on the basis of the Fund as a whole without distinguishing between the classes of shares issued. |
See Notes to Financial Statements.
65
FINANCIAL HIGHLIGHTS (continued)
STRONG ADVISOR MID CAP GROWTH FUND — CLASS A
| Period Ended | ||||||||||||||||||||
| June 30, 2004(b) | Dec. 31, 2003 | Dec. 31, 2002 | Dec. 31, 2001 | Dec. 31, 2000(c)(d) | ||||||||||||||||
Selected Per-Share Data(a) | ||||||||||||||||||||
Net Asset Value, Beginning of Period | $ | 11.72 | $ | 8.71 | $ | 13.95 | $ | 20.22 | $ | 17.71 | ||||||||||
Income From Investment Operations: | ||||||||||||||||||||
Net Investment Income (Loss) | (0.09 | ) | (0.13 | )(e) | (0.14 | )(e) | (0.22 | )(e) | (0.01 | ) | ||||||||||
Net Realized and Unrealized Gains (Losses) on Investments | 0.72 | 3.14 | (5.10 | ) | (6.05 | ) | 2.52 | |||||||||||||
Total from Investment Operations | 0.63 | 3.01 | (5.24 | ) | (6.27 | ) | 2.51 | |||||||||||||
Less Distributions: | ||||||||||||||||||||
From Net Realized Gains | — | — | — | (0.00 | )(f) | — | ||||||||||||||
Total Distributions | — | — | — | (0.00 | )(f) | — | ||||||||||||||
Net Asset Value, End of Period | $ | 12.35 | $ | 11.72 | $ | 8.71 | $ | 13.95 | $ | 20.22 | ||||||||||
Ratios and Supplemental Data | ||||||||||||||||||||
Total Return | +5.38 | % | +34.56 | % | –37.56 | % | –30.98 | % | +14.16 | % | ||||||||||
Net Assets, End of Period (In Millions) | $ | 9 | $ | 10 | $ | 6 | $ | 7 | $ | 1 | ||||||||||
Ratio of Expenses to Average Net Assets before Expense Offsets | 1.8 | %* | 1.7 | % | 1.6 | % | 1.8 | % | 1.7 | %* | ||||||||||
Ratio of Expenses to Average Net Assets | 1.7 | %* | 1.6 | % | 1.6 | % | 1.8 | % | 1.7 | %* | ||||||||||
Ratio of Net Investment Income (Loss) to Average Net Assets | (1.4 | )%* | (1.3 | )% | (1.3 | )% | (1.4 | )% | (1.3 | )%* | ||||||||||
Portfolio Turnover Rate(g) | 95.6 | % | 249.6 | % | 526.6 | % | 650.0 | % | 683.7 | % | ||||||||||
STRONG ADVISOR MID CAP GROWTH FUND — CLASS B
| Period Ended | ||||||||||||||||||||
| June 30, 2004(b) | Dec. 31, 2003 | Dec. 31, 2002 | Dec. 31, 2001 | Dec. 31, 2000(c)(d) | ||||||||||||||||
Selected Per-Share Data(a) | ||||||||||||||||||||
Net Asset Value, Beginning of Period | $ | 11.46 | $ | 8.59 | $ | 13.89 | $ | 20.21 | $ | 17.71 | ||||||||||
Income From Investment Operations: | ||||||||||||||||||||
Net Investment Income (Loss) | (0.13 | ) | (0.22 | )(e) | (0.23 | )(e) | (0.28 | )(e) | (0.02 | ) | ||||||||||
Net Realized and Unrealized Gains (Losses) on Investments | 0.70 | 3.09 | (5.07 | ) | (6.04 | ) | 2.52 | |||||||||||||
Total from Investment Operations | 0.57 | 2.87 | (5.30 | ) | (6.32 | ) | 2.50 | |||||||||||||
Less Distributions: | ||||||||||||||||||||
From Net Realized Gains | — | — | — | (0.00 | )(f) | — | ||||||||||||||
Total Distributions | — | — | — | (0.00 | )(f) | — | ||||||||||||||
Net Asset Value, End of Period | $ | 12.03 | $ | 11.46 | $ | 8.59 | $ | 13.89 | $ | 20.21 | ||||||||||
Ratios and Supplemental Data | ||||||||||||||||||||
Total Return | +4.97 | % | +33.41 | % | –38.16 | % | –31.25 | % | +14.11 | % | ||||||||||
Net Assets, End of Period (In Millions) | $ | 3 | $ | 3 | $ | 2 | $ | 3 | $ | 0 | (h) | |||||||||
Ratio of Expenses to Average Net Assets before Expense Offsets | 2.6 | %* | 2.6 | % | 2.6 | % | 2.9 | % | 2.0 | %* | ||||||||||
Ratio of Expenses to Average Net Assets | 2.5 | %* | 2.4 | % | 2.5 | % | 2.3 | % | 2.0 | %* | ||||||||||
Ratio of Net Investment Income (Loss) to Average Net Assets | (2.1 | )%* | (2.1 | )% | (2.2 | )% | (1.9 | )% | (1.6 | )%* | ||||||||||
Portfolio Turnover Rate(g) | 95.6 | % | 249.6 | % | 526.6 | % | 650.0 | % | 683.7 | % | ||||||||||
| * | Calculated on an annualized basis. |
| (a) | Information presented relates to a share of capital stock of the Fund outstanding for the entire period. |
| (b) | For the six months ended June 30, 2004 (Unaudited). |
| (c) | For the period from November 30, 2000 (commencement of class) to December 31, 2000. |
| (d) | Per share data reflects a 1.053 for 1.000 share split which occurred on March 8, 2001. |
| (e) | Net investment income (loss) per share represents net investment income (loss) divided by average shares outstanding throughout the year. |
| (f) | Amount calculated is less than $0.005. |
| (g) | Calculated on the basis of the Fund as a whole without distinguishing between the classes of shares issued. |
| (h) | Amount is less than $500,000. |
See Notes to Financial Statements.
66
FINANCIAL HIGHLIGHTS (continued)
STRONG ADVISOR MID CAP GROWTH FUND — CLASS C
| Period Ended | ||||||||||||||||||||
| June 30, 2004(b) | Dec. 31, 2003 | Dec. 31, 2002 | Dec. 31, 2001 | Dec. 31, 2000(c)(d) | ||||||||||||||||
Selected Per-Share Data(a) | ||||||||||||||||||||
Net Asset Value, Beginning of Period | $ | 11.46 | $ | 8.59 | $ | 13.88 | $ | 20.20 | $ | 17.71 | ||||||||||
Income From Investment Operations: | ||||||||||||||||||||
Net Investment Income (Loss) | (0.14 | ) | (0.21 | )(e) | (0.23 | )(e) | (0.28 | )(e) | (0.02 | ) | ||||||||||
Net Realized and Unrealized Gains (Losses) on Investments | 0.71 | 3.08 | (5.06 | ) | (6.04 | ) | 2.51 | |||||||||||||
Total from Investment Operations | 0.57 | 2.87 | (5.29 | ) | (6.32 | ) | 2.49 | |||||||||||||
Less Distributions: | ||||||||||||||||||||
From Net Realized Gains | — | — | — | (0.00 | )(f) | — | ||||||||||||||
Total Distributions | — | — | — | (0.00 | )(f) | — | ||||||||||||||
Net Asset Value, End of Period | $ | 12.03 | $ | 11.46 | $ | 8.59 | $ | 13.88 | $ | 20.20 | ||||||||||
Ratios and Supplemental Data | ||||||||||||||||||||
Total Return | +4.97 | % | +33.41 | % | –38.11 | % | –31.27 | % | +14.06 | % | ||||||||||
Net Assets, End of Period (In Millions) | $ | 1 | $ | 1 | $ | 1 | $ | 1 | $ | 0 | (g) | |||||||||
Ratio of Expenses to Average Net Assets before Expense Offsets | 2.7 | %* | 2.6 | % | 2.5 | % | 2.8 | % | 2.0 | %* | ||||||||||
Ratio of Expenses to Average Net Assets | 2.5 | %* | 2.4 | % | 2.4 | % | 2.3 | % | 2.0 | %* | ||||||||||
Ratio of Net Investment Income (Loss) to Average Net Assets | (2.1 | )%* | (2.1 | )% | (2.2 | )% | (1.9 | )% | (1.6 | )%* | ||||||||||
Portfolio Turnover Rate(h) | 95.6 | % | 249.6 | % | 526.6 | % | 650.0 | % | 683.7 | % | ||||||||||
STRONG ADVISOR MID CAP GROWTH FUND — CLASS Z
| Period Ended | ||||||||||||||||||||||||
| June 30, 2004(b) | Dec. 31, 2003 | Dec. 31, 2002 | Dec. 31, 2001 | Dec. 31, 2000 | Dec. 31, 1999 | |||||||||||||||||||
Selected Per-Share Data(a) | ||||||||||||||||||||||||
Net Asset Value, Beginning of Period | $ | 11.68 | $ | 8.70 | $ | 13.97 | $ | 20.21 | $ | 23.25 | $ | 13.03 | ||||||||||||
Income From Investment Operations: | ||||||||||||||||||||||||
Net Investment Income (Loss) | (0.10 | ) | (0.14 | )(e) | (0.16 | )(e) | (0.19 | ) | (0.15 | ) | (0.12 | ) | ||||||||||||
Net Realized and Unrealized Gains (Losses) on Investments | 0.72 | 3.12 | (5.11 | ) | (6.05 | ) | (1.90 | ) | 12.08 | |||||||||||||||
Total from Investment Operations | 0.62 | 2.98 | (5.27 | ) | (6.24 | ) | (2.05 | ) | 11.96 | |||||||||||||||
Less Distributions: | ||||||||||||||||||||||||
From Net Realized Gains | — | — | — | (0.00 | )(f) | (0.99 | ) | (1.74 | ) | |||||||||||||||
Total Distributions | — | — | — | (0.00 | )(f) | (0.99 | ) | (1.74 | ) | |||||||||||||||
Net Asset Value, End of Period | $ | 12.30 | $ | 11.68 | $ | 8.70 | $ | 13.97 | $ | 20.21 | $ | 23.25 | ||||||||||||
Ratios and Supplemental Data | ||||||||||||||||||||||||
Total Return | +5.31 | % | +34.25 | % | –37.72 | % | –30.86 | % | –8.47 | % | +92.02 | % | ||||||||||||
Net Assets, End of Period (In Millions) | $ | 51 | $ | 58 | $ | 65 | $ | 128 | $ | 185 | $ | 65 | ||||||||||||
Ratio of Expenses to Average Net Assets before Expense Offsets | 1.9 | %* | 1.8 | % | 1.8 | % | 1.6 | % | 1.4 | % | 1.6 | % | ||||||||||||
Ratio of Expenses to Average Net Assets | 1.9 | %* | 1.7 | % | 1.8 | % | 1.6 | % | 1.3 | % | 1.6 | % | ||||||||||||
Ratio of Net Investment Income (Loss) to Average Net Assets | (1.5 | )%* | (1.4 | )% | (1.5 | )% | (1.2 | )% | (0.9 | )% | (1.1 | )% | ||||||||||||
Portfolio Turnover Rate(h) | 95.6 | % | 249.6 | % | 526.6 | % | 650.0 | % | 683.7 | % | 681.0 | % | ||||||||||||
| * | Calculated on an annualized basis. |
| (a) | Information presented relates to a share of capital stock of the Fund outstanding for the entire period. |
| (b) | For the six months ended June 30, 2004 (Unaudited). |
| (c) | For the period from November 30, 2000 (commencement of class) to December 31, 2000. |
| (d) | Per share data reflects a 1.053 for 1.000 share split which occurred on March 8, 2001. |
| (e) | Net investment income (loss) per share represents net investment income (loss) divided by average shares outstanding throughout the year. |
| (f) | Amount calculated is less than $0.005. |
| (g) | Amount is less than $500,000. |
| (h) | Calculated on the basis of the Fund as a whole without distinguishing between the classes of shares issued. |
See Notes to Financial Statements.
67
FINANCIAL HIGHLIGHTS (continued)
STRONG ADVISOR SMALL CAP VALUE FUND — CLASS A
| Period Ended | ||||||||||||||||||||
| June 30, 2004(b) | Dec. 31, 2003 | Dec. 31, 2002 | Dec. 31, 2001 | Dec. 31, 2000(c) | ||||||||||||||||
Selected Per-Share Data(a) | ||||||||||||||||||||
Net Asset Value, Beginning of Period | $ | 27.40 | $ | 18.92 | $ | 20.17 | $ | 17.17 | $ | 15.36 | ||||||||||
Income From Investment Operations: | ||||||||||||||||||||
Net Investment Income (Loss) | (0.17 | ) | (0.12 | )(d) | 0.03 | (d) | (0.14 | )(d) | (0.00 | )(e) | ||||||||||
Net Realized and Unrealized Gains (Losses) on Investments | 1.77 | 9.26 | (1.28 | ) | 3.18 | 1.81 | ||||||||||||||
Total from Investment Operations | 1.60 | 9.14 | (1.25 | ) | 3.04 | 1.81 | ||||||||||||||
Less Distributions: | ||||||||||||||||||||
From Net Investment Income | — | (0.01 | ) | — | — | — | ||||||||||||||
From Net Realized Gains | (0.29 | ) | (0.65 | ) | — | (0.04 | ) | — | ||||||||||||
Total Distributions | (0.29 | ) | (0.66 | ) | — | (0.04 | ) | — | ||||||||||||
Net Asset Value, End of Period | $ | 28.71 | $ | 27.40 | $ | 18.92 | $ | 20.17 | $ | 17.17 | ||||||||||
Ratios and Supplemental Data | ||||||||||||||||||||
Total Return | +5.89 | % | +48.49 | % | –6.20 | % | +17.70 | % | +11.78 | % | ||||||||||
Net Assets, End of Period (In Millions) | $ | 562 | $ | 674 | $ | 335 | $ | 169 | $ | 1 | ||||||||||
Ratio of Expenses to Average Net Assets before Expense Offsets | 1.6 | %* | 1.6 | % | 1.6 | % | 1.6 | % | 1.6 | %* | ||||||||||
Ratio of Expenses to Average Net Assets | 1.5 | %* | 1.5 | % | 1.6 | % | 1.6 | % | 1.6 | %* | ||||||||||
Ratio of Net Investment Income (Loss) to Average Net Assets | (1.1 | )%* | (0.5 | )% | 0.1 | % | (0.7 | )% | (0.8 | )%* | ||||||||||
Portfolio Turnover Rate(f) | 18.3 | % | 30.2 | % | 28.2 | % | 42.0 | % | 60.3 | % | ||||||||||
STRONG ADVISOR SMALL CAP VALUE FUND — CLASS B
| Period Ended | ||||||||||||||||||||
| June 30, 2004(b) | Dec. 31, 2003 | Dec. 31, 2002 | Dec. 31, 2001 | Dec. 31, 2000(c) | ||||||||||||||||
Selected Per-Share Data(a) | ||||||||||||||||||||
Net Asset Value, Beginning of Period | $ | 26.79 | $ | 18.66 | $ | 20.05 | $ | 17.16 | $ | 15.36 | ||||||||||
Income From Investment Operations: | ||||||||||||||||||||
Net Investment Income (Loss) | (0.25 | ) | (0.29 | )(d) | (0.14 | )(d) | (0.25 | )(d) | (0.01 | ) | ||||||||||
Net Realized and Unrealized Gains (Losses) on Investments | 1.71 | 9.08 | (1.25 | ) | 3.18 | 1.81 | ||||||||||||||
Total from Investment Operations | 1.46 | 8.79 | (1.39 | ) | 2.93 | 1.80 | ||||||||||||||
Less Distributions: | ||||||||||||||||||||
From Net Investment Income | — | (0.01 | ) | — | — | — | ||||||||||||||
From Net Realized Gains | (0.29 | ) | (0.65 | ) | — | (0.04 | ) | — | ||||||||||||
Total Distributions | (0.29 | ) | (0.66 | ) | — | (0.04 | ) | — | ||||||||||||
Net Asset Value, End of Period | $ | 27.96 | $ | 26.79 | $ | 18.66 | $ | 20.05 | $ | 17.16 | ||||||||||
Ratios and Supplemental Data | ||||||||||||||||||||
Total Return | +5.50 | % | +47.28 | % | –6.93 | % | +17.07 | % | +11.72 | % | ||||||||||
Net Assets, End of Period (In Millions) | $ | 126 | $ | 126 | $ | 76 | $ | 40 | $ | 0 | (g) | |||||||||
Ratio of Expenses to Average Net Assets before Expense Offsets | 2.4 | %* | 2.4 | % | 2.4 | % | 2.5 | % | 2.0 | %* | ||||||||||
Ratio of Expenses to Average Net Assets | 2.3 | %* | 2.4 | % | 2.4 | % | 2.3 | % | 1.8 | %* | ||||||||||
Ratio of Net Investment Income (Loss) to Average Net Assets | (1.8 | )%* | (1.4 | )% | (0.7 | )% | (1.4 | )% | (0.8 | )%* | ||||||||||
Portfolio Turnover Rate(f) | 18.3 | % | 30.2 | % | 28.2 | % | 42.0 | % | 60.3 | % | ||||||||||
| * | Calculated on an annualized basis. |
| (a) | Information presented relates to a share of capital stock of the Fund outstanding for the entire period. |
| (b) | For the six months ended June 30, 2004 (Unaudited). |
| (c) | For the period from November 30, 2000 (commencement of class) to December 31, 2000. |
| (d) | Net investment income (loss) per share represents net investment income (loss) divided by average shares outstanding throughout the year. |
| (e) | Amount calculated is less than $0.005. |
| (f) | Calculated on the basis of the Fund as a whole without distinguishing between the classes of shares issued. |
| (g) | Amount is less than $500,000. |
See Notes to Financial Statements.
68
FINANCIAL HIGHLIGHTS (continued)
STRONG ADVISOR SMALL CAP VALUE FUND — CLASS C
| Period Ended | ||||||||||||||||||||
| June 30, 2004(b) | Dec. 31, 2003 | Dec. 31, 2002 | Dec. 31, 2001 | Dec. 31, 2000(c) | ||||||||||||||||
Selected Per-Share Data(a) | ||||||||||||||||||||
Net Asset Value, Beginning of Period | $ | 26.83 | $ | 18.68 | $ | 20.07 | $ | 17.17 | $ | 15.36 | ||||||||||
Income From Investment Operations: | ||||||||||||||||||||
Net Investment Income (Loss) | (0.26 | ) | (0.28 | )(d) | (0.13 | )(d) | (0.24 | )(d) | (0.01 | ) | ||||||||||
Net Realized and Unrealized Gains (Losses) on Investments | 1.72 | 9.09 | (1.26 | ) | 3.18 | 1.82 | ||||||||||||||
Total from Investment Operations | 1.46 | 8.81 | (1.39 | ) | 2.94 | 1.81 | ||||||||||||||
Less Distributions: | ||||||||||||||||||||
From Net Investment Income | — | (0.01 | ) | — | — | — | ||||||||||||||
From Net Realized Gains | (0.29 | ) | (0.65 | ) | — | (0.04 | ) | — | ||||||||||||
Total Distributions | (0.29 | ) | (0.66 | ) | — | (0.04 | ) | — | ||||||||||||
Net Asset Value, End of Period | $ | 28.00 | $ | 26.83 | $ | 18.68 | $ | 20.07 | $ | 17.17 | ||||||||||
Ratios and Supplemental Data | ||||||||||||||||||||
Total Return | +5.49 | % | +47.34 | % | –6.93 | % | +17.12 | % | +11.78 | % | ||||||||||
Net Assets, End of Period (In Millions) | $ | 151 | $ | 159 | $ | 98 | $ | 38 | $ | 0 | (e) | |||||||||
Ratio of Expenses to Average Net Assets before Expense Offsets | 2.4 | %* | 2.3 | % | 2.4 | % | 2.4 | % | 2.0 | %* | ||||||||||
Ratio of Expenses to Average Net Assets | 2.3 | %* | 2.3 | % | 2.4 | % | 2.2 | % | 1.8 | %* | ||||||||||
Ratio of Net Investment Income (Loss) to Average Net Assets | (1.8 | )%* | (1.3 | )% | (0.6 | )% | (1.4 | )% | (0.7 | )%* | ||||||||||
Portfolio Turnover Rate(f) | 18.3 | % | 30.2 | % | 28.2 | % | 42.0 | % | 60.3 | % | ||||||||||
STRONG ADVISOR SMALL CAP VALUE FUND — CLASS Z
| Period Ended | ||||||||||||||||||||||||
| June 30, 2004(b) | Dec. 31, 2003 | Dec. 31, 2002 | Dec. 31, 2001 | Dec. 31, 2000 | Dec. 31, 1999 | |||||||||||||||||||
Selected Per-Share Data(a) | ||||||||||||||||||||||||
Net Asset Value, Beginning of Period | $ | 27.53 | $ | 18.98 | $ | 20.22 | $ | 17.17 | $ | 13.59 | $ | 10.61 | ||||||||||||
Income From Investment Operations: | ||||||||||||||||||||||||
Net Investment Income (Loss) | (0.13 | ) | (0.09 | )(d) | 0.04 | (d) | (0.08 | ) | 0.00 | (g) | (0.08 | ) | ||||||||||||
Net Realized and Unrealized Gains (Losses) on Investments | 1.77 | 9.30 | (1.28 | ) | 3.17 | 3.58 | 3.06 | |||||||||||||||||
Total from Investment Operations | 1.64 | 9.21 | (1.24 | ) | 3.09 | 3.58 | 2.98 | |||||||||||||||||
Less Distributions: | ||||||||||||||||||||||||
From Net Investment Income | — | (0.01 | ) | — | — | — | — | |||||||||||||||||
From Net Realized Gains | (0.29 | ) | (0.65 | ) | — | (0.04 | ) | — | (0.00 | )(g) | ||||||||||||||
Total Distributions | (0.29 | ) | (0.66 | ) | — | (0.04 | ) | — | (0.00 | )(g) | ||||||||||||||
Net Asset Value, End of Period | $ | 28.88 | $ | 27.53 | $ | 18.98 | $ | 20.22 | $ | 17.17 | $ | 13.59 | ||||||||||||
Ratios and Supplemental Data | ||||||||||||||||||||||||
Total Return | +6.01 | % | +48.70 | % | –6.13 | % | +17.99 | % | +26.34 | % | +28.09 | % | ||||||||||||
Net Assets, End of Period (In Millions) | $ | 1,200 | $ | 1,167 | $ | 659 | $ | 541 | $ | 249 | $ | 45 | ||||||||||||
Ratio of Expenses to Average Net Assets before Expense Offsets | 1.4 | %* | 1.4 | % | 1.5 | % | 1.4 | % | 1.4 | % | 1.7 | % | ||||||||||||
Ratio of Expenses to Average Net Assets | 1.4 | %* | 1.4 | % | 1.5 | % | 1.4 | % | 1.4 | % | 1.7 | % | ||||||||||||
Ratio of Net Investment Income (Loss) to Average Net Assets | (0.9 | )%* | (0.4 | )% | 0.2 | % | (0.5 | )% | 0.0 | %(g) | (1.0 | )% | ||||||||||||
Portfolio Turnover Rate(f) | 18.3 | % | 30.2 | % | 28.2 | % | 42.0 | % | 60.3 | % | 95.5 | % | ||||||||||||
| * | Calculated on an annualized basis. |
| (a) | Information presented relates to a share of capital stock of the Fund outstanding for the entire period. |
| (b) | For the six months ended June 30, 2004 (Unaudited). |
| (c) | For the period from November 30, 2000 (commencement of class) to December 31, 2000. |
| (d) | Net investment income (loss) per share represents net investment income (loss) divided by average shares outstanding throughout the year. |
| (e) | Amount is less than $500,000. |
| (f) | Calculated on the basis of the Fund as a whole without distinguishing between the classes of shares issued. |
| (g) | Amount calculated is less than $0.005 or 0.05%. |
See Notes to Financial Statements.
69
FINANCIAL HIGHLIGHTS (continued)
STRONG ADVISOR U.S. VALUE FUND — CLASS A
| Period Ended | ||||||||||||||||||||
| June 30, 2004(b) | Dec. 31, 2003 | Dec. 31, 2002 | Dec. 31, 2001 | Dec. 31, 2000(c)(d) | ||||||||||||||||
Selected Per-Share Data(a) | ||||||||||||||||||||
Net Asset Value, Beginning of Period | $ | 17.65 | $ | 13.66 | $ | 17.83 | $ | 20.65 | $ | 19.99 | ||||||||||
Income From Investment Operations: | ||||||||||||||||||||
Net Investment Income (Loss) | 0.10 | 0.14 | 0.12 | (e) | 0.05 | 0.00 | (f) | |||||||||||||
Net Realized and Unrealized Gains (Losses) on Investments | 0.70 | 4.00 | (2.77 | ) | (2.56 | ) | 0.68 | |||||||||||||
Total from Investment Operations | 0.80 | 4.14 | (2.65 | ) | (2.51 | ) | 0.68 | |||||||||||||
Less Distributions: | ||||||||||||||||||||
From Net Investment Income | (0.07 | ) | (0.15 | ) | (0.16 | ) | (0.06 | ) | (0.02 | ) | ||||||||||
From Net Realized Gains | — | — | (1.36 | ) | (0.25 | ) | — | |||||||||||||
Total Distributions | (0.07 | ) | (0.15 | ) | (1.52 | ) | (0.31 | ) | (0.02 | ) | ||||||||||
Net Asset Value, End of Period | $ | 18.38 | $ | 17.65 | $ | 13.66 | $ | 17.83 | $ | 20.65 | ||||||||||
Ratios and Supplemental Data | ||||||||||||||||||||
Total Return | +4.53 | % | +30.48 | % | –16.34 | % | –12.17 | % | +3.45 | % | ||||||||||
Net Assets, End of Period (In Millions) | $ | 4 | $ | 5 | $ | 3 | $ | 3 | $ | 0 | (g) | |||||||||
Ratio of Expenses to Average Net Assets before Expense Offsets | 1.4 | %* | 1.4 | % | 1.3 | % | 1.8 | % | 1.3 | %* | ||||||||||
Ratio of Expenses to Average Net Assets | 1.4 | %* | 1.4 | % | 1.3 | % | 1.8 | % | 1.3 | %* | ||||||||||
Ratio of Net Investment Income (Loss) to Average Net Assets | 1.0 | %* | 1.0 | % | 0.9 | % | 0.1 | % | 0.1 | %* | ||||||||||
Portfolio Turnover Rate(h) | 14.0 | % | 53.4 | % | 89.8 | % | 116.1 | % | 14.4 | % | ||||||||||
STRONG ADVISOR U.S. VALUE FUND — CLASS B
| Period Ended | ||||||||||||||||||||
| June 30, 2004(b) | Dec. 31, 2003 | Dec. 31, 2002 | Dec. 31, 2001 | Dec. 31, 2000(c)(d) | ||||||||||||||||
Selected Per-Share Data(a) | ||||||||||||||||||||
Net Asset Value, Beginning of Period | $ | 17.64 | $ | 13.67 | $ | 17.81 | $ | 20.66 | $ | 19.99 | ||||||||||
Income From Investment Operations: | ||||||||||||||||||||
Net Investment Income (Loss) | 0.02 | 0.03 | 0.02 | (e) | (0.00 | )(f) | (0.01 | ) | ||||||||||||
Net Realized and Unrealized Gains (Losses) on Investments | 0.71 | 3.98 | (2.78 | ) | (2.60 | ) | 0.69 | |||||||||||||
Total from Investment Operations | 0.73 | 4.01 | (2.76 | ) | (2.60 | ) | 0.68 | |||||||||||||
Less Distributions: | ||||||||||||||||||||
From Net Investment Income | (0.01 | ) | (0.04 | ) | (0.02 | ) | — | (0.01 | ) | |||||||||||
From Net Realized Gains | — | — | (1.36 | ) | (0.25 | ) | — | |||||||||||||
Total Distributions | (0.01 | ) | (0.04 | ) | (1.38 | ) | (0.25 | ) | (0.01 | ) | ||||||||||
Net Asset Value, End of Period | $ | 18.36 | $ | 17.64 | $ | 13.67 | $ | 17.81 | $ | 20.66 | ||||||||||
Ratios and Supplemental Data | ||||||||||||||||||||
Total Return | +4.15 | % | +29.37 | % | –17.01 | % | –12.60 | % | +3.43 | % | ||||||||||
Net Assets, End of Period (In Millions) | $ | 6 | $ | 5 | $ | 3 | $ | 2 | $ | 0 | (g) | |||||||||
Ratio of Expenses to Average Net Assets before Expense Offsets | 2.2 | %* | 2.2 | % | 2.2 | % | 2.9 | % | 2.0 | %* | ||||||||||
Ratio of Expenses to Average Net Assets | 2.1 | %* | 2.2 | % | 2.1 | % | 2.3 | % | 2.0 | %* | ||||||||||
Ratio of Net Investment Income (Loss) to Average Net Assets | 0.2 | %* | 0.2 | % | 0.1 | % | (0.4 | )% | (0.5 | )%* | ||||||||||
Portfolio Turnover Rate(h) | 14.0 | % | 53.4 | % | 89.8 | % | 116.1 | % | 14.4 | % | ||||||||||
| * | Calculated on an annualized basis. |
| (a) | Information presented relates to a share of capital stock of the Fund outstanding for the entire period. |
| (b) | For the six months ended June 30, 2004 (Unaudited). |
| (c) | For the period from November 30, 2000 (commencement of class) to December 31, 2000. |
| (d) | Per share data reflects a 1.023 for 1.000 share split which occurred on March 8, 2001. |
| (e) | Net investment income (loss) per share represents net investment income (loss) divided by average shares outstanding throughout the year. |
| (f) | Amount calculated is less than $0.005. |
| (g) | Amount is less than $500,000. |
| (h) | Calculated on the basis of the Fund as a whole without distinguishing between the classes of shares issued. |
See Notes to Financial Statements.
70
FINANCIAL HIGHLIGHTS (continued)
STRONG ADVISOR U.S. VALUE FUND — CLASS C
| Period Ended | ||||||||||||||||||||
| June 30, 2004(b) | Dec. 31, 2003 | Dec. 31, 2002 | Dec. 31, 2001 | Dec. 31, 2000(c)(d) | ||||||||||||||||
Selected Per-Share Data(a) | ||||||||||||||||||||
Net Asset Value, Beginning of Period | $ | 17.56 | $ | 13.61 | $ | 17.82 | $ | 20.66 | $ | 19.99 | ||||||||||
Income From Investment Operations: | ||||||||||||||||||||
Net Investment Income (Loss) | 0.02 | 0.03 | 0.02 | (e) | (0.00 | )(f) | (0.01 | ) | ||||||||||||
Net Realized and Unrealized Gains (Losses) on Investments | 0.71 | 3.97 | (2.78 | ) | (2.59 | ) | 0.69 | |||||||||||||
Total from Investment Operations | 0.73 | 4.00 | (2.76 | ) | (2.59 | ) | 0.68 | |||||||||||||
Less Distributions: | ||||||||||||||||||||
From Net Investment Income | (0.01 | ) | (0.05 | ) | (0.09 | ) | — | (0.01 | ) | |||||||||||
From Net Realized Gains | — | — | (1.36 | ) | (0.25 | ) | — | |||||||||||||
Total Distributions | (0.01 | ) | (0.05 | ) | (1.45 | ) | (0.25 | ) | (0.01 | ) | ||||||||||
Net Asset Value, End of Period | $ | 18.28 | $ | 17.56 | $ | 13.61 | $ | 17.82 | $ | 20.66 | ||||||||||
Ratios and Supplemental Data | ||||||||||||||||||||
Total Return | +4.13 | % | +29.42 | % | –17.05 | % | –12.55 | % | +3.42 | % | ||||||||||
Net Assets, End of Period (In Millions) | $ | 4 | $ | 4 | $ | 1 | $ | 1 | $ | 0 | (g) | |||||||||
Ratio of Expenses to Average Net Assets before Expense Offsets | 2.2 | %* | 2.2 | % | 2.2 | % | 2.4 | % | 2.0 | %* | ||||||||||
Ratio of Expenses to Average Net Assets | 2.2 | %* | 2.2 | % | 2.2 | % | 2.2 | % | 2.0 | %* | ||||||||||
Ratio of Net Investment Income (Loss) to Average Net Assets | 0.2 | %* | 0.2 | % | 0.2 | % | (0.3 | )% | (0.5 | )%* | ||||||||||
Portfolio Turnover Rate(h) | 14.0 | % | 53.4 | % | 89.8 | % | 116.1 | % | 14.4 | % | ||||||||||
STRONG ADVISOR U.S. VALUE FUND — CLASS K
| Period Ended | ||||||||||||
| June 30, 2004(b) | Dec. 31, 2003 | Dec. 31, 2002 | ||||||||||
Selected Per-Share Data(a) | ||||||||||||
Net Asset Value, Beginning of Period | $ | 17.52 | $ | 13.56 | $ | 17.87 | ||||||
Income From Investment Operations: | ||||||||||||
Net Investment Income (Loss) | 0.13 | 0.16 | 0.22 | (e) | ||||||||
Net Realized and Unrealized Gains (Losses) on Investments | 0.70 | 4.02 | (2.81 | ) | ||||||||
Total from Investment Operations | 0.83 | 4.18 | (2.59 | ) | ||||||||
Less Distributions: | ||||||||||||
From Net Investment Income | (0.11 | ) | (0.22 | ) | (0.36 | ) | ||||||
From Net Realized Gains | — | — | (1.36 | ) | ||||||||
Total Distributions | (0.11 | ) | (0.22 | ) | (1.72 | ) | ||||||
Net Asset Value, End of Period | $ | 18.24 | $ | 17.52 | $ | 13.56 | ||||||
Ratios and Supplemental Data | ||||||||||||
Total Return | +4.73 | % | +31.03 | % | –15.98 | % | ||||||
Net Assets, End of Period (In Millions) | $ | 83 | $ | 87 | $ | 11 | ||||||
Ratio of Expenses to Average Net Assets before Expense Offsets | 1.1 | %* | 1.1 | % | 1.1 | % | ||||||
Ratio of Expenses to Average Net Assets | 1.0 | %* | 1.0 | % | 1.0 | % | ||||||
Ratio of Net Investment Income (Loss) to Average Net Assets | 1.4 | %* | 1.3 | % | 1.6 | % | ||||||
Portfolio Turnover Rate(h) | 14.0 | % | 53.4 | % | 89.8 | % | ||||||
| * | Calculated on an annualized basis. |
| (a) | Information presented relates to a share of capital stock of the Fund outstanding for the entire period. |
| (b) | For the six months ended June 30, 2004 (Unaudited). |
| (c) | For the period from November 30, 2000 (commencement of class) to December 31, 2000. |
| (d) | Per share data reflects a 1.023 for 1.000 share split which occurred on March 8, 2001. |
| (e) | Net investment income (loss) per share represents new investment income (loss) divided by average shares outstanding throughout the year. |
| (f) | Amount calculated is less than $0.005. |
| (g) | Amount is less than $500,000. |
| (h) | Calculated on the basis of the Fund as a whole without distinguishing between the classes of shares issued. |
See Notes to Financial Statements.
71
FINANCIAL HIGHLIGHTS (continued)
STRONG ADVISOR U.S. VALUE FUND — CLASS Z
| Period Ended | ||||||||||||||||||||||||||||
| June 30, 2004(b) | Dec. 31, 2003 | Dec. 31, 2002 | Dec. 31, 2001 | Dec. 31, 2000(c) | Oct. 31, 2000 | Oct. 31, 1999 | ||||||||||||||||||||||
Selected Per-Share Data(a) | ||||||||||||||||||||||||||||
Net Asset Value, Beginning of Period | $ | 17.77 | $ | 13.74 | $ | 17.87 | $ | 20.65 | $ | 21.63 | $ | 20.58 | $ | 17.20 | ||||||||||||||
Income From Investment Operations: | ||||||||||||||||||||||||||||
Net Investment Income (Loss) | 0.08 | 0.15 | 0.05 | (d) | 0.11 | 0.03 | 0.05 | 0.06 | ||||||||||||||||||||
Net Realized and Unrealized Gains (Losses) on Investments | 0.73 | 3.99 | (2.79 | ) | (2.53 | ) | (0.52 | ) | 1.53 | 3.39 | ||||||||||||||||||
Total from Investment Operations | 0.81 | 4.14 | (2.74 | ) | (2.42 | ) | (0.49 | ) | 1.58 | 3.45 | ||||||||||||||||||
Less Distributions: | ||||||||||||||||||||||||||||
From Net Investment Income | (0.08 | ) | (0.11 | ) | (0.03 | ) | (0.11 | ) | (0.03 | ) | (0.05 | ) | (0.07 | ) | ||||||||||||||
From Net Realized Gains | — | — | (1.36 | ) | (0.25 | ) | (0.46 | ) | (0.48 | ) | (0.00 | )(h) | ||||||||||||||||
Total Distributions | (0.08 | ) | (0.11 | ) | (1.39 | ) | (0.36 | ) | (0.49 | ) | (0.53 | ) | (0.07 | ) | ||||||||||||||
Net Asset Value, End of Period | $ | 18.50 | $ | 17.77 | $ | 13.74 | $ | 17.87 | $ | 20.65 | $ | 21.63 | $ | 20.58 | ||||||||||||||
Ratios and Supplemental Data | ||||||||||||||||||||||||||||
Total Return | +4.57 | % | +30.23 | % | –16.86 | % | –11.72 | % | –2.17 | % | +7.72 | % | +20.07 | % | ||||||||||||||
Net Assets, End of Period (In Millions) | $ | 243 | $ | 159 | $ | 197 | $ | 186 | $ | 251 | $ | 252 | $ | 182 | ||||||||||||||
Ratio of Expenses to Average Net Assets before Expense Offsets | 1.4 | %* | 1.6 | % | 1.9 | % | 1.2 | % | 1.1 | %* | 1.0 | % | 1.1 | % | ||||||||||||||
Ratio of Expenses to Average Net Assets | 1.3 | %* | 1.6 | % | 1.9 | % | 1.2 | % | 1.1 | %* | 1.0 | % | 1.1 | % | ||||||||||||||
Ratio of Net Investment Income (Loss) to Average Net Assets | 1.0 | %* | 0.8 | % | 0.3 | % | 0.6 | % | 0.8 | %* | 0.3 | % | 0.3 | % | ||||||||||||||
Portfolio Turnover Rate(e) | 14.0 | % | 53.4 | % | 89.8 | % | 116.1 | % | 14.4 | % | 46.5 | % | 32.3 | % | ||||||||||||||
STRONG ADVISOR ENDEAVOR LARGE CAP FUND — CLASS A
| Period Ended | ||||||||||||||||
| June 30, 2004(b) | Dec. 31, 2003 | Dec. 31, 2002 | Dec. 31, 2001(f) | |||||||||||||
Selected Per-Share Data(a) | ||||||||||||||||
Net Asset Value, Beginning of Period | $ | 10.08 | $ | 7.55 | $ | 10.59 | $ | 10.00 | ||||||||
Income From Investment Operations: | ||||||||||||||||
Net Investment Income (Loss) | (0.05 | ) | (0.07 | )(d) | (0.10 | )(d) | (0.01 | ) | ||||||||
Net Realized and Unrealized Gains (Losses) on Investments | 0.61 | 2.60 | (2.94 | ) | 0.86 | (g) | ||||||||||
Total from Investment Operations | 0.56 | 2.53 | (3.04 | ) | 0.85 | |||||||||||
Less Distributions: | ||||||||||||||||
From Net Realized Gains | — | — | — | (0.26 | ) | |||||||||||
Total Distributions | — | — | — | (0.26 | ) | |||||||||||
Net Asset Value, End of Period | $ | 10.64 | $ | 10.08 | $ | 7.55 | $ | 10.59 | ||||||||
Ratios and Supplemental Data | ||||||||||||||||
Total Return | +5.56 | % | +33.51 | % | –28.71 | % | +8.45 | % | ||||||||
Net Assets, End of Period (In Millions) | $ | 40 | $ | 37 | $ | 28 | $ | 28 | ||||||||
Ratio of Expenses to Average Net Assets before Expense Offsets | 1.7 | %* | 1.7 | % | 2.0 | % | 2.4 | %* | ||||||||
Ratio of Expenses to Average Net Assets | 1.7 | %* | 1.6 | % | 2.0 | % | 2.4 | %* | ||||||||
Ratio of Net Investment Income (Loss) to Average Net Assets | (1.1 | )%* | (0.9 | )% | (1.2 | )% | (1.1 | )%* | ||||||||
Portfolio Turnover Rate(e) | 84.2 | % | 234.1 | % | 420.4 | % | 54.0 | % | ||||||||
| * | Calculated on an annualized basis. |
| (a) | Information presented relates to a share of capital stock of the Fund outstanding for the entire period. |
| (b) | For the six months ended June 30, 2004 (Unaudited). |
| (c) | In 2000, the Fund changed its fiscal year-end from October to December. |
| (d) | Net investment income (loss) per share represents net investment income (loss) divided by average shares outstanding throughout the year. |
| (e) | Calculated on the basis of the Fund as a whole without distinguishing between the classes of shares issued. |
| (f) | For the period from September 28, 2001 (commencement of class) to December 31, 2001. |
| (g) | The amount shown may not correlate with the aggregate gains and losses of portfolio securities due to the timing of subscriptions and redemptions of fund shares. |
| (h) | Amount calculated is less than $0.005. |
See Notes to Financial Statements.
72
FINANCIAL HIGHLIGHTS (continued)
STRONG ADVISOR ENDEAVOR LARGE CAP FUND — CLASS B
| Period Ended | ||||||||||||||||
| June 30, 2004(b) | Dec. 31, 2003 | Dec. 31, 2002 | Dec. 31, 2001(c) | |||||||||||||
Selected Per-Share Data(a) | ||||||||||||||||
Net Asset Value, Beginning of Period | $ | 9.97 | $ | 7.51 | $ | 10.57 | $ | 10.00 | ||||||||
Income From Investment Operations: | ||||||||||||||||
Net Investment Income (Loss) | (0.09 | ) | (0.12 | )(d) | (0.12 | )(d) | (0.04 | ) | ||||||||
Net Realized and Unrealized Gains (Losses) on Investments | 0.60 | 2.58 | (2.94 | ) | 0.87 | (e) | ||||||||||
Total from Investment Operations | 0.51 | 2.46 | (3.06 | ) | 0.83 | |||||||||||
Less Distributions: | ||||||||||||||||
From Net Realized Gains | — | — | — | (0.26 | ) | |||||||||||
Total Distributions | — | — | — | (0.26 | ) | |||||||||||
Net Asset Value, End of Period | $ | 10.48 | $ | 9.97 | $ | 7.51 | $ | 10.57 | ||||||||
Ratios and Supplemental Data | ||||||||||||||||
Total Return | +5.12 | % | +32.76 | % | –28.95 | % | +8.25 | % | ||||||||
Net Assets, End of Period (In Millions) | $ | 1 | $ | 1 | $ | 0 | (f) | $ | 0 | (f) | ||||||
Ratio of Expenses to Average Net Assets before Expense Offsets | 2.5 | %* | 2.5 | % | 4.7 | % | 2.7 | %* | ||||||||
Ratio of Expenses to Average Net Assets | 2.4 | %* | 2.1 | % | 2.2 | % | 2.6 | %* | ||||||||
Ratio of Net Investment Income (Loss) to Average Net Assets | (1.8 | )%* | (1.3 | )% | (1.4 | )% | (1.6 | )%* | ||||||||
Portfolio Turnover Rate(g) | 84.2 | % | 234.1 | % | 420.4 | % | 54.0 | % | ||||||||
STRONG ADVISOR ENDEAVOR LARGE CAP FUND — CLASS C
| Period Ended | ||||||||||||||||
| June 30, 2004(b) | Dec. 31, 2003 | Dec. 31, 2002 | Dec. 31, 2001(c) | |||||||||||||
Selected Per-Share Data(a) | ||||||||||||||||
Net Asset Value, Beginning of Period | $ | 9.97 | $ | 7.51 | $ | 10.57 | $ | 10.00 | ||||||||
Income From Investment Operations: | ||||||||||||||||
Net Investment Income (Loss) | (0.10 | ) | (0.12 | )(d) | (0.13 | )(d) | (0.04 | ) | ||||||||
Net Realized and Unrealized Gains (Losses) on Investments | 0.61 | 2.58 | (2.93 | ) | 0.87 | (e) | ||||||||||
Total from Investment Operations | 0.51 | 2.46 | (3.06 | ) | 0.83 | |||||||||||
Less Distributions: | ||||||||||||||||
From Net Realized Gains | — | — | — | (0.26 | ) | |||||||||||
Total Distributions | — | — | — | (0.26 | ) | |||||||||||
Net Asset Value, End of Period | $ | 10.48 | $ | 9.97 | $ | 7.51 | $ | 10.57 | ||||||||
Ratios and Supplemental Data | ||||||||||||||||
Total Return | +5.12 | % | +32.76 | % | –28.95 | % | +8.25 | % | ||||||||
Net Assets, End of Period (In Millions) | $ | 0 | (f) | $ | 0 | (f) | $ | 0 | (f) | $ | 0 | (f) | ||||
Ratio of Expenses to Average Net Assets before Expense Offsets | 2.5 | %* | 2.6 | % | 4.2 | % | 2.7 | %* | ||||||||
Ratio of Expenses to Average Net Assets | 2.5 | %* | 2.1 | % | 2.3 | % | 2.6 | %* | ||||||||
Ratio of Net Investment Income (Loss) to Average Net Assets | (1.9 | )%* | (1.4 | )% | (1.5 | )% | (1.6 | )%* | ||||||||
Portfolio Turnover Rate(g) | 84.2 | % | 234.1 | % | 420.4 | % | 54.0 | % | ||||||||
| * | Calculated on an annualized basis. |
| (a) | Information presented relates to a share of capital stock of the Fund outstanding for the entire period. |
| (b) | For the six months ended June 30, 2004 (Unaudited). |
| (c) | For the period from September 28, 2001 (commencement of class) to December 31, 2001. |
| (d) | Net investment income (loss) per share represents net investment income (loss) divided by average shares outstanding throughout the year. |
| (e) | The amount shown may not correlate with the aggregate gains and losses of portfolio securities due to the timing of subscriptions and redemptions of fund shares. |
| (f) | Amount is less than $500,000. |
| (g) | Calculated on the basis of the Fund as a whole without distinguishing between the classes of shares issued. |
See Notes to Financial Statements.
73
FINANCIAL HIGHLIGHTS (continued)
STRONG ADVISOR FOCUS FUND — CLASS A
| Period Ended | ||||||||||||||||||||
| June 30, 2004(b) | Dec. 31, 2003 | Dec. 31, 2002 | Dec. 31, 2001 | Dec. 31, 2000(c) | ||||||||||||||||
Selected Per-Share Data(a) | ||||||||||||||||||||
Net Asset Value, Beginning of Period | $ | 5.99 | $ | 4.79 | $ | 6.62 | $ | 10.26 | $ | 10.00 | ||||||||||
Income From Investment Operations: | ||||||||||||||||||||
Net Investment Income (Loss) | (0.05 | ) | (0.05 | )(d) | (0.10 | )(d) | (0.07 | ) | (0.01 | ) | ||||||||||
Net Realized and Unrealized Gains (Losses) on Investments | 0.58 | 1.25 | (1.73 | ) | (3.57 | ) | 0.27 | |||||||||||||
Total from Investment Operations | 0.53 | 1.20 | (1.83 | ) | (3.64 | ) | 0.26 | |||||||||||||
Less Distributions: | ||||||||||||||||||||
From Net Investment Income | — | — | — | — | — | |||||||||||||||
Total Distributions | — | — | — | — | — | |||||||||||||||
Net Asset Value, End of Period | $ | 6.52 | $ | 5.99 | $ | 4.79 | $ | 6.62 | $ | 10.26 | ||||||||||
Ratios and Supplemental Data | ||||||||||||||||||||
Total Return | +8.85 | % | +25.05 | % | –27.64 | % | –35.48 | % | +2.60 | % | ||||||||||
Net Assets, End of Period (In Millions) | $ | 1 | $ | 2 | $ | 2 | $ | 5 | $ | 1 | ||||||||||
Ratio of Expenses to Average Net Assets before Expense Offsets | 3.7 | %* | 3.0 | % | 2.9 | % | 3.4 | % | 7.3 | %* | ||||||||||
Ratio of Expenses to Average Net Assets | 1.6 | %* | 1.3 | % | 2.1 | % | 1.5 | % | 2.4 | %* | ||||||||||
Ratio of Net Investment Income (Loss) to Average Net Assets | (1.4 | )%* | (1.0 | )% | (1.7 | )% | (0.9 | )% | (1.0 | )%* | ||||||||||
Portfolio Turnover Rate(e) | 43.8 | % | 248.9 | % | 350.1 | % | 605.7 | % | 45.1 | % | ||||||||||
STRONG ADVISOR FOCUS FUND — CLASS B
| Period Ended | ||||||||||||||||||||
| June 30, 2004(b) | Dec. 31, 2003 | Dec. 31, 2002 | Dec. 31, 2001 | Dec. 31, 2000(c) | ||||||||||||||||
Selected Per-Share Data(a) | ||||||||||||||||||||
Net Asset Value, Beginning of Period | $ | 5.87 | $ | 4.73 | $ | 6.55 | $ | 10.23 | $ | 10.00 | ||||||||||
Income From Investment Operations: | ||||||||||||||||||||
Net Investment Income (Loss) | (0.07 | ) | (0.09 | )(d) | (0.11 | )(d) | (0.08 | ) | (0.01 | ) | ||||||||||
Net Realized and Unrealized Gains (Losses) on Investments | 0.58 | 1.23 | (1.71 | ) | (3.60 | ) | 0.24 | |||||||||||||
Total from Investment Operations | 0.51 | 1.14 | (1.82 | ) | (3.68 | ) | 0.23 | |||||||||||||
Less Distributions: | ||||||||||||||||||||
From Net Investment Income | — | — | — | — | — | |||||||||||||||
Total Distributions | — | — | — | — | — | |||||||||||||||
Net Asset Value, End of Period | $ | 6.38 | $ | 5.87 | $ | 4.73 | $ | 6.55 | $ | 10.23 | ||||||||||
Ratios and Supplemental Data | ||||||||||||||||||||
Total Return | +8.69 | % | +24.10 | % | –27.79 | % | –35.97 | % | +2.30 | % | ||||||||||
Net Assets, End of Period (In Millions) | $ | 1 | $ | 1 | $ | 1 | $ | 2 | $ | 0 | (f) | |||||||||
Ratio of Expenses to Average Net Assets before Expense Offsets | 4.5 | %* | 3.9 | % | 4.1 | % | 4.6 | % | 8.1 | %* | ||||||||||
Ratio of Expenses to Average Net Assets | 2.1 | %* | 2.0 | % | 2.4 | % | 2.4 | % | 3.1 | %* | ||||||||||
Ratio of Net Investment Income (Loss) to Average Net Assets | (1.9 | )%* | (1.7 | )% | (2.0 | )% | (1.7 | )% | (1.6 | )%* | ||||||||||
Portfolio Turnover Rate(e) | 43.8 | % | 248.9 | % | 350.1 | % | 605.7 | % | 45.1 | % | ||||||||||
| * | Calculated on an annualized basis. |
| (a) | Information presented relates to a share of capital stock of the Fund outstanding for the entire period. |
| (b) | For the six months ended June 30, 2004 (Unaudited). |
| (c) | For the period from November 30, 2000 (commencement of class) to December 31, 2000. |
| (d) | Net investment income (loss) per share represents new investment income (loss) divided by average shares outstanding throughout the year. |
| (e) | Calculated on the basis of the Fund as a whole without distinguishing between the classes of shares issued. |
| (f) | Amount is less than $500,000. |
See Notes to Financial Statements.
74
FINANCIAL HIGHLIGHTS (continued)
STRONG ADVISOR FOCUS FUND — CLASS C
| Period Ended | ||||||||||||||||||||
| June 30, 2004(b) | Dec. 31, 2003 | Dec. 31, 2002 | Dec. 31, 2001 | Dec. 31, 2000(c) | ||||||||||||||||
Selected Per-Share Data(a) | ||||||||||||||||||||
Net Asset Value, Beginning of Period | $ | 5.87 | $ | 4.73 | $ | 6.55 | $ | 10.23 | $ | 10.00 | ||||||||||
Income From Investment Operations: | ||||||||||||||||||||
Net Investment Income (Loss) | (0.07 | ) | (0.09 | )(d) | (0.11 | )(d) | (0.09 | ) | (0.02 | ) | ||||||||||
Net Realized and Unrealized Gains (Losses) on Investments | 0.58 | 1.23 | (1.71 | ) | (3.59 | ) | 0.25 | |||||||||||||
Total from Investment Operations | 0.51 | 1.14 | (1.82 | ) | (3.68 | ) | 0.23 | |||||||||||||
Less Distributions: | ||||||||||||||||||||
From Net Investment Income | — | — | — | — | — | |||||||||||||||
Total Distributions | — | — | — | — | — | |||||||||||||||
Net Asset Value, End of Period | $ | 6.38 | $ | 5.87 | $ | 4.73 | $ | 6.55 | $ | 10.23 | ||||||||||
Ratios and Supplemental Data | ||||||||||||||||||||
Total Return | +8.69 | % | +24.10 | % | –27.79 | % | –35.97 | % | +2.30 | % | ||||||||||
Net Assets, End of Period (In Millions) | $ | 0 | (e) | $ | 0 | (e) | $ | 0 | (e) | $ | 1 | $ | 0 | (e) | ||||||
Ratio of Expenses to Average Net Assets before Expense Offsets | 6.1 | %* | 3.8 | % | 3.9 | % | 4.3 | % | 8.1 | %* | ||||||||||
Ratio of Expenses to Average Net Assets | 2.1 | %* | 1.9 | % | 2.4 | % | 2.4 | % | 4.5 | %* | ||||||||||
Ratio of Net Investment Income (Loss) to Average Net Assets | (1.9 | )%* | (1.6 | )% | (2.0 | )% | (1.7 | )% | (2.7 | )%* | ||||||||||
Portfolio Turnover Rate(f) | 43.8 | % | 248.9 | % | 350.1 | % | 605.7 | % | 45.1 | % | ||||||||||
STRONG ADVISOR INTERNATIONAL CORE FUND — CLASS A
| Period Ended | ||||||||||||||||
| June 30, 2004(b) | Dec. 31, 2003 | Dec. 31, 2002 | Dec. 31, 2001(g) | |||||||||||||
Selected Per-Share Data(a) | ||||||||||||||||
Net Asset Value, Beginning of Period | $ | 11.47 | $ | 8.84 | $ | 10.41 | $ | 10.00 | ||||||||
Income From Investment Operations: | ||||||||||||||||
Net Investment Income (Loss) | 0.18 | 0.18 | (d) | (0.06 | )(d) | (0.03 | ) | |||||||||
Net Realized and Unrealized Gains (Losses) on Investments | 0.41 | 2.59 | (1.51 | ) | 0.44 | |||||||||||
Total from Investment Operations | 0.59 | 2.77 | (1.57 | ) | 0.41 | |||||||||||
Less Distributions: | ||||||||||||||||
From Net Investment Income | (0.02 | ) | (0.14 | ) | — | — | ||||||||||
Total Distributions | (0.02 | ) | (0.14 | ) | — | — | ||||||||||
Net Asset Value, End of Period | $ | 12.04 | $ | 11.47 | $ | 8.84 | $ | 10.41 | ||||||||
Ratios and Supplemental Data | ||||||||||||||||
Total Return | +5.11 | % | +31.38 | % | –15.08 | % | +4.10 | % | ||||||||
Net Assets, End of Period (In Millions) | $ | 1 | $ | 1 | $ | 0 | (e) | $ | 0 | (e) | ||||||
Ratio of Expenses to Average Net Assets before Expense Offsets | 5.4 | %* | 7.7 | % | 52.4 | % | 2.2 | %* | ||||||||
Ratio of Expenses to Average Net Assets | 0.0 | %*(h) | 0.0 | %(h) | 2.2 | % | 2.2 | %* | ||||||||
Ratio of Net Investment Income (Loss) to Average Net Assets | 3.1 | %* | 1.8 | % | (0.6 | )% | (1.1 | )%* | ||||||||
Portfolio Turnover Rate(f) | 17.1 | % | 88.1 | % | 46.9 | % | 4.0 | % | ||||||||
| * | Calculated on an annualized basis. |
| (a) | Information presented relates to a share of capital stock of the Fund outstanding for the entire period. |
| (b) | For the six months ended June 30, 2004 (Unaudited). |
| (c) | For the period from November 30, 2000 (commencement of class) to December 31, 2000. |
| (d) | Net investment income (loss) per share represents net investment income (loss) divided by average shares outstanding throughout the year. |
| (e) | Amount is less than $500,000. |
| (f) | Calculated on the basis of the Fund as a whole without distinguishing between the classes of shares issued. |
| (g) | For the period from September 28, 2001 (commencement of class) to December 31, 2001. |
| (h) | Amount calculated is less than 0.05%. |
See Notes to Financial Statements.
75
FINANCIAL HIGHLIGHTS (continued)
STRONG ADVISOR INTERNATIONAL CORE FUND — CLASS B
| Period Ended | ||||||||||||||||
| June 30, 2004(b) | Dec. 31, 2003 | Dec. 31, 2002 | Dec. 31, 2001(c) | |||||||||||||
Selected Per-Share Data(a) | ||||||||||||||||
Net Asset Value, Beginning of Period | $ | 11.45 | $ | 8.82 | $ | 10.40 | $ | 10.00 | ||||||||
Income From Investment Operations: | ||||||||||||||||
Net Investment Income (Loss) | 0.17 | 0.20 | (d) | (0.08 | )(d) | (0.04 | ) | |||||||||
Net Realized and Unrealized Gains (Losses) on Investments | 0.42 | 2.58 | (1.50 | ) | 0.44 | |||||||||||
Total from Investment Operations | 0.59 | 2.78 | (1.58 | ) | 0.40 | |||||||||||
Less Distributions: | ||||||||||||||||
From Net Investment Income | (0.02 | ) | (0.15 | ) | — | — | ||||||||||
Total Distributions | (0.02 | ) | (0.15 | ) | — | — | ||||||||||
Net Asset Value, End of Period | $ | 12.02 | $ | 11.45 | $ | 8.82 | $ | 10.40 | ||||||||
Ratios and Supplemental Data | ||||||||||||||||
Total Return | +5.12 | % | +31.58 | % | –15.19 | % | +4.00 | % | ||||||||
Net Assets, End of Period (In Millions) | $ | 1 | $ | 1 | $ | 0 | (e) | $ | 0 | (e) | ||||||
Ratio of Expenses to Average Net Assets before Expense Offsets | 6.2 | %* | 8.6 | % | 52.0 | % | 3.0 | %* | ||||||||
Ratio of Expenses to Average Net Assets | 0.0 | %*(f) | 0.0 | %(f) | 2.4 | % | 2.7 | %* | ||||||||
Ratio of Net Investment Income (Loss) to Average Net Assets | 3.1 | %* | 2.0 | % | (0.8 | )% | (1.6 | )%* | ||||||||
Portfolio Turnover Rate(g) | 17.1 | % | 88.1 | % | 46.9 | % | 4.0 | % | ||||||||
STRONG ADVISOR INTERNATIONAL CORE FUND — CLASS C
| Period Ended | ||||||||||||||||
| June 30, 2004(b) | Dec. 31, 2003 | Dec. 31, 2002 | Dec. 31, 2001(c) | |||||||||||||
Selected Per-Share Data(a) | ||||||||||||||||
Net Asset Value, Beginning of Period | $ | 11.43 | $ | 8.82 | $ | 10.40 | $ | 10.00 | ||||||||
Income From Investment Operations: | ||||||||||||||||
Net Investment Income (Loss) | 0.17 | 0.21 | (d) | (0.06 | )(d) | (0.04 | ) | |||||||||
Net Realized and Unrealized Gains (Losses) on Investments | 0.43 | 2.57 | (1.52 | ) | 0.44 | |||||||||||
Total from Investment Operations | 0.60 | 2.78 | (1.58 | ) | 0.40 | |||||||||||
Less Distributions: | ||||||||||||||||
From Net Investment Income | (0.02 | ) | (0.17 | ) | — | — | ||||||||||
Total Distributions | (0.02 | ) | (0.17 | ) | — | — | ||||||||||
Net Asset Value, End of Period | $ | 12.01 | $ | 11.43 | $ | 8.82 | $ | 10.40 | ||||||||
Ratios and Supplemental Data | ||||||||||||||||
Total Return | +5.22 | % | +31.52 | % | –15.19 | % | +4.00 | % | ||||||||
Net Assets, End of Period (In Millions) | $ | 0 | (e) | $ | 0 | (e) | $ | 0 | (e) | $ | 0 | (e) | ||||
Ratio of Expenses to Average Net Assets before Expense Offsets | 6.2 | %* | 8.4 | % | 52.5 | % | 3.0 | %* | ||||||||
Ratio of Expenses to Average Net Assets | 0.0 | %*(f) | 0.0 | %(f) | 2.4 | % | 2.7 | %* | ||||||||
Ratio of Net Investment Income (Loss) to Average Net Assets | 3.2 | %* | 2.1 | % | (0.7 | )% | (1.6 | )%* | ||||||||
Portfolio Turnover Rate(g) | 17.1 | % | 88.1 | % | 46.9 | % | 4.0 | % | ||||||||
| * | Calculated on an annualized basis. |
| (a) | Information presented relates to a share of capital stock of the Fund outstanding for the entire period. |
| (b) | For the six months ended June 30, 2004 (Unaudited). |
| (c) | For the period from September 28, 2001 (commencement of class) to December 31, 2001. |
| (d) | Net investment income (loss) per share represents net investment income (loss) divided by average shares outstanding throughout the year. |
| (e) | Amount is less than $500,000. |
| (f) | Amount calculated is less than 0.05%. |
| (g) | Calculated on the basis of the Fund as a whole without distinguishing between the classes of shares issued. |
See Notes to Financial Statements.
76
FINANCIAL HIGHLIGHTS (continued)
STRONG ADVISOR SELECT FUND — CLASS A
| Period Ended | ||||||||||||||||
| June 30, 2004(b) | Dec. 31, 2003 | Dec. 31, 2002 | Dec. 31, 2001 | |||||||||||||
Selected Per-Share Data(a) | ||||||||||||||||
Net Asset Value, Beginning of Period | $ | 8.36 | $ | 6.10 | $ | 7.99 | $ | 10.00 | ||||||||
Income From Investment Operations: | ||||||||||||||||
Net Investment Income (Loss) | (0.06 | )(c) | (0.07 | )(c) | (0.07 | )(c) | (0.01 | ) | ||||||||
Net Realized and Unrealized Gains (Losses) on Investments | 0.85 | 2.33 | (1.81 | ) | (2.00 | )(d) | ||||||||||
Total from Investment Operations | 0.79 | 2.26 | (1.88 | ) | (2.01 | ) | ||||||||||
Less Distributions: | ||||||||||||||||
From Net Realized Gains | — | — | (0.01 | ) | — | |||||||||||
Total Distributions | — | — | (0.01 | ) | — | |||||||||||
Net Asset Value, End of Period | $ | 9.15 | $ | 8.36 | $ | 6.10 | $ | 7.99 | ||||||||
Ratios and Supplemental Data | ||||||||||||||||
Total Return | +9.45 | % | +37.05 | % | –23.52 | % | –20.10 | % | ||||||||
Net Assets, End of Period (In Millions) | $ | 76 | $ | 81 | $ | 56 | $ | 57 | ||||||||
Ratio of Expenses to Average Net Assets before Expense Offsets | 1.6 | %* | 1.6 | % | 1.6 | % | 4.4 | % | ||||||||
Ratio of Expenses to Average Net Assets | 1.6 | %* | 1.6 | % | 1.6 | % | 1.7 | % | ||||||||
Ratio of Net Investment Income (Loss) to Average Net Assets | (1.3 | )%* | (1.0 | )% | (1.1 | )% | (0.8 | )% | ||||||||
Portfolio Turnover Rate(e) | 64.6 | % | 243.6 | % | 437.3 | % | 359.7 | % | ||||||||
STRONG ADVISOR SELECT FUND — CLASS B
| Period Ended | ||||||||||||||||
| June 30, 2004(b) | Dec. 31, 2003 | Dec. 31, 2002 | Dec. 31, 2001 | |||||||||||||
Selected Per-Share Data(a) | ||||||||||||||||
Net Asset Value, Beginning of Period | $ | 8.18 | $ | 6.02 | $ | 7.94 | $ | 10.00 | ||||||||
Income From Investment Operations: | ||||||||||||||||
Net Investment Income (Loss) | (0.09 | )(c) | (0.12 | )(c) | (0.12 | )(c) | (0.09 | ) | ||||||||
Net Realized and Unrealized Gains (Losses) on Investments | 0.83 | 2.28 | (1.79 | ) | (1.97 | )(d) | ||||||||||
Total from Investment Operations | 0.74 | 2.16 | (1.91 | ) | (2.06 | ) | ||||||||||
Less Distributions: | ||||||||||||||||
From Net Realized Gains | — | — | (0.01 | ) | — | |||||||||||
Total Distributions | — | — | (0.01 | ) | — | |||||||||||
Net Asset Value, End of Period | $ | 8.92 | $ | 8.18 | $ | 6.02 | $ | 7.94 | ||||||||
Ratios and Supplemental Data | ||||||||||||||||
Total Return | +9.05 | % | +35.88 | % | –24.04 | % | –20.60 | % | ||||||||
Net Assets, End of Period (In Millions) | $ | 1 | $ | 1 | $ | 0 | (f) | $ | 0 | (f) | ||||||
Ratio of Expenses to Average Net Assets before Expense Offsets | 2.4 | %* | 2.4 | % | 2.4 | % | 12.4 | % | ||||||||
Ratio of Expenses to Average Net Assets | 2.4 | %* | 2.3 | % | 2.4 | % | 2.5 | % | ||||||||
Ratio of Net Investment Income (Loss) to Average Net Assets | (2.1 | )%* | (1.8 | )% | (1.9 | )% | (1.7 | )% | ||||||||
Portfolio Turnover Rate(e) | 64.6 | % | 243.6 | % | 437.3 | % | 359.7 | % | ||||||||
| * | Calculated on an annualized basis. |
| (a) | Information presented relates to a share of capital stock of the Fund outstanding for the entire period. |
| (b) | For the six months ended June 30, 2004 (Unaudited). |
| (c) | Net investment income (loss) per share represents net investment income (loss) divided by average shares outstanding throughout the year. |
| (d) | The amount shown may not correlate with the aggregate gains and losses of portfolio securities due to the timing of subscriptions and redemptions of fund shares. |
| (e) | Calculated on the basis of the Fund as a while without distinguishing between the classes of shares issued. |
| (f) | Amount is less than $500,000. |
See Notes to Financial Statements.
77
FINANCIAL HIGHLIGHTS (continued)
STRONG ADVISOR SELECT FUND — CLASS C
| Period Ended | ||||||||||||||||
| June 30, 2004(b) | Dec. 31, 2003 | Dec. 31, 2002 | Dec. 31, 2001 | |||||||||||||
Selected Per-Share Data(a) | ||||||||||||||||
Net Asset Value, Beginning of Period | $ | 8.18 | $ | 6.02 | $ | 7.93 | $ | 10.00 | ||||||||
Income From Investment Operations: | ||||||||||||||||
Net Investment Income (Loss) | (0.09 | )(c) | (0.13 | )(c) | (0.12 | )(c) | (0.10 | ) | ||||||||
Net Realized and Unrealized Gains (Losses) on Investments | 0.83 | 2.29 | (1.78 | ) | (1.97 | )(d) | ||||||||||
Total from Investment Operations | 0.74 | 2.16 | (1.90 | ) | (2.07 | ) | ||||||||||
Less Distributions: | ||||||||||||||||
From Net Realized Gains | — | — | (0.01 | ) | — | |||||||||||
Total Distributions | — | — | (0.01 | ) | — | |||||||||||
Net Asset Value, End of Period | $ | 8.92 | $ | 8.18 | $ | 6.02 | $ | 7.93 | ||||||||
Ratios and Supplemental Data | ||||||||||||||||
Total Return | +9.05 | % | +35.88 | % | –23.95 | % | –20.70 | % | ||||||||
Net Assets, End of Period (In Millions) | $ | 1 | $ | 0 | (e) | $ | 0 | (e) | $ | 0 | (e) | |||||
Ratio of Expenses to Average Net Assets before Expense Offsets | 2.4 | %* | 2.5 | % | 2.3 | % | 12.8 | % | ||||||||
Ratio of Expenses to Average Net Assets | 2.4 | %* | 2.4 | % | 2.3 | % | 2.5 | % | ||||||||
Ratio of Net Investment Income (Loss) to Average Net Assets | (2.1 | )%* | (1.8 | )% | (1.8 | )% | (1.7 | )% | ||||||||
Portfolio Turnover Rate(f) | 64.6 | % | 243.6 | % | 437.3 | % | 359.7 | % | ||||||||
STRONG ADVISOR TECHNOLOGY FUND — CLASS A
| Period Ended | ||||||||||||||||||||
| June 30, 2004(b) | Dec. 31, 2003 | Dec. 31, 2002 | Dec. 31, 2001 | Dec. 31, 2000(g) | ||||||||||||||||
Selected Per-Share Data(a) | ||||||||||||||||||||
Net Asset Value, Beginning of Period | $ | 7.43 | $ | 4.24 | $ | 7.22 | $ | 9.27 | $ | 10.00 | ||||||||||
Income From Investment Operations: | ||||||||||||||||||||
Net Investment Income (Loss) | (0.07 | ) | (0.10 | )(c) | (0.11 | )(c) | (0.05 | ) | (0.05 | ) | ||||||||||
Net Realized and Unrealized Gains (Losses) on Investments | (0.48 | ) | 3.29 | (2.87 | ) | (1.99 | ) | (0.68 | ) | |||||||||||
Total from Investment Operations | (0.55 | ) | 3.19 | (2.98 | ) | (2.04 | ) | (0.73 | ) | |||||||||||
Less Distributions: | ||||||||||||||||||||
From Net Realized Gains | — | — | — | (0.01 | ) | — | ||||||||||||||
Total Distributions | — | — | — | (0.01 | ) | — | ||||||||||||||
Net Asset Value, End of Period | $ | 6.88 | $ | 7.43 | $ | 4.24 | $ | 7.22 | $ | 9.27 | ||||||||||
Ratios and Supplemental Data | ||||||||||||||||||||
Total Return | –7.40 | % | +75.24 | % | –41.27 | % | –21.98 | % | –7.30 | % | ||||||||||
Net Assets, End of Period (In Millions) | $ | 1 | $ | 1 | $ | 1 | $ | 2 | $ | 0 | (e) | |||||||||
Ratio of Expenses to Average Net Assets before Expense Offsets | 4.7 | %* | 3.6 | % | 3.3 | % | 7.0 | % | 17.2 | %* | ||||||||||
Ratio of Expenses to Average Net Assets | 2.0 | %* | 2.2 | % | 2.3 | % | 1.6 | % | 9.5 | %* | ||||||||||
Ratio of Net Investment Income (Loss) to Average Net Assets | (1.9 | )%* | (1.8 | )% | (2.1 | )% | (1.0 | )% | (8.2 | )%* | ||||||||||
Portfolio Turnover Rate(f) | 73.3 | % | 184.5 | % | 136.5 | % | 157.9 | % | 49.3 | % | ||||||||||
| * | Calculated on an annualized basis. |
| (a) | Information presented relates to a share of capital stock of the Fund outstanding for the entire period. |
| (b) | For the six months ended June 30, 2004 (Unaudited). |
| (c) | Net investment income (loss) per share represents new investment income (loss) divided by average shares outstanding throughout the year. |
| (d) | The amount shown may not correlate with the aggregate gains and losses of portfolio securities due to the timing of subscriptions and redemptions of fund shares. |
| (e) | Amount is less than $500,000. |
| (f) | Calculated on the basis of the Fund as a whole without distinguishing between the classes of shares issued. |
| (g) | For the period from November 30, 2000 (commencement of class) to December 31, 2000. |
See Notes to Financial Statements.
78
FINANCIAL HIGHLIGHTS (continued)
STRONG ADVISOR TECHNOLOGY FUND — CLASS B
| Period Ended | ||||||||||||||||||||
| June 30, 2004(b) | Dec. 31, 2003 | Dec. 31, 2002 | Dec. 31, 2001 | Dec. 31, 2000(c) | ||||||||||||||||
Selected Per-Share Data(a) | ||||||||||||||||||||
Net Asset Value, Beginning of Period | $ | 7.32 | $ | 4.17 | $ | 7.13 | $ | 9.26 | $ | 10.00 | ||||||||||
Income From Investment Operations: | ||||||||||||||||||||
Net Investment Income (Loss) | (0.07 | ) | (0.11 | )(d) | (0.11 | )(d) | (0.09 | ) | (0.08 | ) | ||||||||||
Net Realized and Unrealized Gains (Losses) on Investments | (0.47 | ) | 3.26 | (2.85 | ) | (2.03 | ) | (0.66 | ) | |||||||||||
Total from Investment Operations | (0.54 | ) | 3.15 | (2.96 | ) | (2.12 | ) | (0.74 | ) | |||||||||||
Less Distributions: | ||||||||||||||||||||
From Net Realized Gains | — | — | — | (0.01 | ) | — | ||||||||||||||
Total Distributions | — | — | — | (0.01 | ) | — | ||||||||||||||
Net Asset Value, End of Period | $ | 6.78 | $ | 7.32 | $ | 4.17 | $ | 7.13 | $ | 9.26 | ||||||||||
Ratios and Supplemental Data | ||||||||||||||||||||
Total Return | –7.38 | % | +75.54 | % | –41.51 | % | –22.87 | % | –7.40 | % | ||||||||||
Net Assets, End of Period (In Millions) | $ | 1 | $ | 1 | $ | 0 | (e) | $ | 0 | (e) | $ | 0 | (e) | |||||||
Ratio of Expenses to Average Net Assets before Expense Offsets | 5.5 | %* | 4.5 | % | 4.5 | % | 9.3 | % | 17.3 | %* | ||||||||||
Ratio of Expenses to Average Net Assets | 2.0 | %* | 2.2 | % | 2.4 | % | 2.5 | % | 11.1 | %* | ||||||||||
Ratio of Net Investment Income (Loss) to Average Net Assets | (1.9 | )%* | (1.7 | )% | (2.2 | )% | (1.9 | )% | (9.7 | )%* | ||||||||||
Portfolio Turnover Rate(f) | 73.3 | % | 184.5 | % | 136.5 | % | 157.9 | % | 49.3 | % | ||||||||||
STRONG ADVISOR TECHNOLOGY FUND — CLASS C
| Period Ended | ||||||||||||||||||||
| June 30, 2004(b) | Dec. 31, 2003 | Dec. 31, 2002 | Dec. 31, 2001 | Dec. 31, 2000(c) | ||||||||||||||||
Selected Per-Share Data(a) | ||||||||||||||||||||
Net Asset Value, Beginning of Period | $ | 7.30 | $ | 4.16 | $ | 7.11 | $ | 9.26 | $ | 10.00 | ||||||||||
Income From Investment Operations: | ||||||||||||||||||||
Net Investment Income (Loss) | (0.07 | ) | (0.10 | )(d) | (0.12 | )(d) | (0.09 | ) | (0.08 | ) | ||||||||||
Net Realized and Unrealized Gains (Losses) on Investments | (0.48 | ) | 3.24 | (2.83 | ) | (2.05 | ) | (0.66 | ) | |||||||||||
Total from Investment Operations | (0.55 | ) | 3.14 | (2.95 | ) | (2.14 | ) | (0.74 | ) | |||||||||||
Less Distributions: | ||||||||||||||||||||
From Net Realized Gains | — | — | — | (0.01 | ) | — | ||||||||||||||
Total Distributions | — | — | — | (0.01 | ) | — | ||||||||||||||
Net Asset Value, End of Period | $ | 6.75 | $ | 7.30 | $ | 4.16 | $ | 7.11 | $ | 9.26 | ||||||||||
Ratios and Supplemental Data | ||||||||||||||||||||
Total Return | –7.53 | % | +75.48 | % | –41.49 | % | –23.09 | % | –7.40 | % | ||||||||||
Net Assets, End of Period (In Millions) | $ | 0 | (e) | $ | 0 | (e) | $ | 0 | (e) | $ | 1 | $ | 0 | (e) | ||||||
Ratio of Expenses to Average Net Assets before Expense Offsets | 5.6 | %* | 4.5 | % | 4.2 | % | 8.9 | % | 17.3 | %* | ||||||||||
Ratio of Expenses to Average Net Assets | 2.0 | %* | 2.2 | % | 2.5 | % | 2.4 | % | 11.1 | %* | ||||||||||
Ratio of Net Investment Income (Loss) to Average Net Assets | (1.9 | )%* | (1.8 | )% | (2.2 | )% | (1.8 | )% | (9.7 | )%* | ||||||||||
Portfolio Turnover Rate(f) | 73.3 | % | 184.5 | % | 136.5 | % | 157.9 | % | 49.3 | % | ||||||||||
| * | Calculated on an annualized basis. |
| (a) | Information presented relates to a share of capital stock of the Fund outstanding for the entire period. |
| (b) | For the six months ended June 30, 2004 (Unaudited). |
| (c) | For the period from November 30, 2000 (commencement of class) to December 31, 2000. |
| (d) | Net investment income (loss) per share represents net investment income (loss) divided by average shares outstanding throughout the year. |
| (e) | Amount is less than $500,000. |
| (f) | Calculated on the basis of the Fund as a whole without distinguishing between the classes of shares issued. |
See Notes to Financial Statements.
79
FINANCIAL HIGHLIGHTS (continued)
STRONG ADVISOR U.S. SMALL/MID CAP GROWTH FUND — CLASS A
| Period Ended | ||||||||||||
| June 30, 2004(b) | Dec. 31, 2003 | Dec. 31, 2002(c) | ||||||||||
Selected Per-Share Data(a) | ||||||||||||
Net Asset Value, Beginning of Period | $ | 11.19 | $ | 7.14 | $ | 10.00 | ||||||
Income From Investment Operations: | ||||||||||||
Net Investment Income (Loss) | (0.13 | )(d) | (0.24 | )(d) | (0.14 | )(d) | ||||||
Net Realized and Unrealized Gains (Losses) on Investments | 0.04 | 4.29 | (2.72 | ) | ||||||||
Total from Investment Operations | (0.09 | ) | 4.05 | (2.86 | ) | |||||||
Less Distributions: | ||||||||||||
From Net Investment Income | — | — | — | |||||||||
Total Distributions | — | — | — | |||||||||
Net Asset Value, End of Period | $ | 11.10 | $ | 11.19 | $ | 7.14 | ||||||
Ratios and Supplemental Data | ||||||||||||
Total Return | –0.80 | % | +56.72 | % | –28.60 | % | ||||||
Net Assets, End of Period (In Millions) | $ | 3 | $ | 3 | $ | 0 | (e) | |||||
Ratio of Expenses to Average Net Assets before Expense Offsets | 2.6 | %* | 3.8 | % | 14.1 | %* | ||||||
Ratio of Expenses to Average Net Assets | 2.4 | %* | 2.4 | % | 2.5 | %* | ||||||
Ratio of Net Investment Income (Loss) to Average Net Assets | (2.3 | )%* | (2.4 | )% | (2.4 | )%* | ||||||
Portfolio Turnover Rate(f) | 57.6 | % | 114.0 | % | 98.1 | % | ||||||
STRONG ADVISOR U.S. SMALL/MID CAP GROWTH FUND — CLASS B
| Period Ended | ||||||||||||
| June 30, 2004(b) | Dec. 31, 2003 | Dec. 31, 2002(c) | ||||||||||
Selected Per-Share Data(a) | ||||||||||||
Net Asset Value, Beginning of Period | $ | 11.18 | $ | 7.14 | $ | 10.00 | ||||||
Income From Investment Operations: | ||||||||||||
Net Investment Income (Loss) | (0.13 | )(d) | (0.23 | )(d) | (0.14 | )(d) | ||||||
Net Realized and Unrealized Gains (Losses) on Investments | 0.04 | 4.27 | (2.72 | ) | ||||||||
Total from Investment Operations | (0.09 | ) | 4.04 | (2.86 | ) | |||||||
Less Distributions: | ||||||||||||
From Net Investment Income | — | — | — | |||||||||
Total Distributions | — | — | — | |||||||||
Net Asset Value, End of Period | $ | 11.09 | $ | 11.18 | $ | 7.14 | ||||||
Ratios and Supplemental Data | ||||||||||||
Total Return | –0.81 | % | +56.58 | % | –28.60 | % | ||||||
Net Assets, End of Period (In Millions) | $ | 2 | $ | 1 | $ | 0 | (e) | |||||
Ratio of Expenses to Average Net Assets before Expense Offsets | 3.3 | %* | 4.7 | % | 14.9 | %* | ||||||
Ratio of Expenses to Average Net Assets | 2.4 | %* | 2.4 | % | 2.5 | %* | ||||||
Ratio of Net Investment Income (Loss) to Average Net Assets | (2.3 | )%* | (2.4 | )% | (2.4 | )%* | ||||||
Portfolio Turnover Rate(f) | 57.6 | % | 114.0 | % | 98.1 | % | ||||||
| * | Calculated on an annualized basis. |
| (a) | Information presented relates to a share of capital stock of the Fund outstanding for the entire period. |
| (b) | For the six months ended June 30, 2004 (Unaudited). |
| (c) | For the period from March 28, 2002 (commencement of class) to December 31, 2002. |
| (d) | Net investment income (loss) per share represents net investment income (loss) divided by average shares outstanding throughout the year. |
| (e) | Amount is less than $500,000. |
| (f) | Calculated on the basis of the Fund as a whole without distinguishing between the classes of shares issued. |
See Notes to Financial Statements.
80
FINANCIAL HIGHLIGHTS (continued)
STRONG ADVISOR U.S. SMALL/MID CAP GROWTH FUND — CLASS C
| Period Ended | ||||||||||||
| June 30, 2004(b) | Dec. 31, 2003 | Dec. 31, 2002(c) | ||||||||||
Selected Per-Share Data(a) | ||||||||||||
Net Asset Value, Beginning of Period | $ | 11.19 | $ | 7.14 | $ | 10.00 | ||||||
Income From Investment Operations: | ||||||||||||
Net Investment Income (Loss) | (0.13 | )(d) | (0.23 | )(d) | (0.13 | )(d) | ||||||
Net Realized and Unrealized Gains (Losses) on Investments | 0.04 | 4.28 | (2.73 | ) | ||||||||
Total from Investment Operations | (0.09 | ) | 4.05 | (2.86 | ) | |||||||
Less Distributions: | ||||||||||||
From Net Investment Income | — | — | — | |||||||||
Total Distributions | — | — | — | |||||||||
Net Asset Value, End of Period | $ | 11.10 | $ | 11.19 | $ | 7.14 | ||||||
Ratios and Supplemental Data | ||||||||||||
Total Return | –0.80 | % | +56.72 | % | –28.60 | % | ||||||
Net Assets, End of Period (In Millions) | $ | 2 | $ | 2 | $ | 0 | (e) | |||||
Ratio of Expenses to Average Net Assets before Expense Offsets | 3.4 | %* | 4.7 | % | 15.3 | %* | ||||||
Ratio of Expenses to Average Net Assets | 2.4 | %* | 2.4 | % | 2.5 | %* | ||||||
Ratio of Net Investment Income (Loss) to Average Net Assets | (2.3 | )%* | (2.3 | )% | (2.4 | )%* | ||||||
Portfolio Turnover Rate(f) | 57.6 | % | 114.0 | % | 98.1 | % | ||||||
STRONG ADVISOR UTILITIES AND ENERGY FUND — CLASS A
| Period Ended | ||||||||||||
| June 30, 2004(b) | Dec. 31, 2003 | Dec. 31, 2002(g) | ||||||||||
Selected Per-Share Data(a) | ||||||||||||
Net Asset Value, Beginning of Period | $ | 10.63 | $ | 9.02 | $ | 10.00 | ||||||
Income From Investment Operations: | ||||||||||||
Net Investment Income | 0.06 | 0.14 | 0.08 | (d) | ||||||||
Net Realized and Unrealized Gains (Losses) on Investments | 0.48 | 1.61 | (1.00 | ) | ||||||||
Total from Investment Operations | 0.54 | 1.75 | (0.92 | ) | ||||||||
Less Distributions: | ||||||||||||
From Net Investment Income | (0.05 | ) | (0.14 | ) | (0.06 | ) | ||||||
Total Distributions | (0.05 | ) | (0.14 | ) | (0.06 | ) | ||||||
Net Asset Value, End of Period | $ | 11.12 | $ | 10.63 | $ | 9.02 | ||||||
Ratios and Supplemental Data | ||||||||||||
Total Return | +5.05 | % | +19.61 | % | –9.21 | % | ||||||
Net Assets, End of Period (In Millions) | $ | 7 | $ | 10 | $ | 6 | ||||||
Ratio of Expenses to Average Net Assets before Expense Offsets | 2.2 | %* | 1.9 | % | 2.2 | %* | ||||||
Ratio of Expenses to Average Net Assets | 2.1 | %* | 1.9 | % | 2.2 | %* | ||||||
Ratio of Net Investment Income to Average Net Assets | 0.8 | %* | 1.5 | % | 2.0 | %* | ||||||
Portfolio Turnover Rate(f) | 60.7 | % | 174.2 | % | 46.2 | % | ||||||
| * | Calculated on an annualized basis. |
| (a) | Information presented relates to a share of capital stock of the Fund outstanding for the entire period. |
| (b) | For the six months ended June 30, 2004 (Unaudited). |
| (c) | For the period from March 28, 2002 (commencement of class) to December 31, 2002. |
| (d) | Net investment income (loss) per share represents net investment income (loss) divided by average shares outstanding throughout the year. |
| (e) | Amount is less than $500,000. |
| (f) | Calculated on the basis of the Fund as a whole without distinguishing between the classes of shares issued. |
| (g) | For the period from July 31, 2002 (commencement of class) to December 31, 2002. |
See Notes to Financial Statements.
81
FINANCIAL HIGHLIGHTS (continued)
STRONG ADVISOR UTILITIES AND ENERGY FUND — CLASS B
| Period Ended | ||||||||||||
| June 30, 2004(b) | Dec. 31, 2003 | Dec. 31, 2002(c) | ||||||||||
Selected Per-Share Data(a) | ||||||||||||
Net Asset Value, Beginning of Period | $ | 10.64 | $ | 9.04 | $ | 10.00 | ||||||
Income From Investment Operations: | ||||||||||||
Net Investment Income | 0.02 | 0.09 | 0.06 | (d) | ||||||||
Net Realized and Unrealized Gains on Investments | 0.50 | 1.62 | (1.00 | ) | ||||||||
Total from Investment Operations | 0.52 | 1.71 | (0.94 | ) | ||||||||
Less Distributions: | ||||||||||||
From Net Investment Income | (0.04 | ) | (0.11 | ) | (0.02 | ) | ||||||
Total Distributions | (0.04 | ) | (0.11 | ) | (0.02 | ) | ||||||
Net Asset Value, End of Period | $ | 11.12 | $ | 10.64 | $ | 9.04 | ||||||
Ratios and Supplemental Data | ||||||||||||
Total Return | +4.88 | % | +18.97 | % | –9.39 | % | ||||||
Net Assets, End of Period (In Millions) | $ | 0 | (e) | $ | 0 | (e) | $ | 0 | (e) | |||
Ratio of Expenses to Average Net Assets before Expense Offsets | 2.9 | %* | 2.7 | % | 5.1 | %* | ||||||
Ratio of Expenses to Average Net Assets | 2.5 | %* | 2.4 | % | 2.5 | %* | ||||||
Ratio of Net Investment Income to Average Net Assets | 0.4 | %* | 1.0 | % | 1.6 | %* | ||||||
Portfolio Turnover Rate(f) | 60.7 | % | 174.2 | % | 46.2 | % | ||||||
STRONG ADVISOR UTILITIES AND ENERGY FUND — CLASS C
| Period Ended | ||||||||||||
| June 30, 2004(b) | Dec. 31, 2003 | Dec. 31, 2002(c) | ||||||||||
Selected Per-Share Data(a) | ||||||||||||
Net Asset Value, Beginning of Period | $ | 10.62 | $ | 9.02 | $ | 10.00 | ||||||
Income From Investment Operations: | ||||||||||||
Net Investment Income (Loss) | 0.02 | 0.09 | 0.05 | (d) | ||||||||
Net Realized and Unrealized Gains (Losses) on Investments | 0.51 | 1.61 | (0.99 | ) | ||||||||
Total from Investment Operations | 0.53 | 1.70 | (0.94 | ) | ||||||||
Less Distributions: | ||||||||||||
From Net Investment Income | (0.04 | ) | (0.10 | ) | (0.04 | ) | ||||||
Total Distributions | (0.04 | ) | (0.10 | ) | (0.04 | ) | ||||||
Net Asset Value, End of Period | $ | 11.11 | $ | 10.62 | $ | 9.02 | ||||||
Ratios and Supplemental Data | ||||||||||||
Total Return | +4.94 | % | +18.97 | % | –9.45 | % | ||||||
Net Assets, End of Period (In Millions) | $ | 0 | (e) | $ | 0 | (e) | $ | 0 | (e) | |||
Ratio of Expenses to Average Net Assets before Expense Offsets | 3.0 | %* | 2.7 | % | 5.3 | %* | ||||||
Ratio of Expenses to Average Net Assets | 2.5 | %* | 2.4 | % | 2.5 | %* | ||||||
Ratio of Net Investment Income to Average Net Assets | 0.4 | %* | 0.9 | % | 1.3 | %* | ||||||
Portfolio Turnover Rate(f) | 60.7 | % | 174.2 | % | 46.2 | % | ||||||
| * | Calculated on an annualized basis. |
| (a) | Information presented relates to a share of capital stock of the Fund outstanding for the entire period. |
| (b) | For the six months ended June 30, 2004 (Unaudited). |
| (c) | For the period from July 31, 2002 (commencement of class) to December 31, 2002. |
| (d) | Net investment income (loss) per share represents net investment income (loss) divided by average shares outstanding throughout the year. |
| (e) | Amount is less than $500,000. |
| (f) | Calculated on the basis of the Fund as a whole without distinguishing between the classes of shares issued. |
See Notes to Financial Statements.
82
FINANCIAL HIGHLIGHTS (continued)
STRONG ADVISOR LARGE COMPANY CORE FUND — CLASS A
| Period Ended | ||||||||||||||||||||||||||||
| June 30, 2004(b) | Dec. 31, 2003 | Dec. 31, 2002(c) | Sep. 30, 2002(d) | Sep. 30, 2001 | Sep. 30, 2000 | Sep. 30, 1999 | ||||||||||||||||||||||
Selected Per-Share Data(a) | ||||||||||||||||||||||||||||
Net Asset Value, Beginning of Period | $ | 10.81 | $ | 8.81 | $ | 8.24 | $ | 9.65 | $ | 14.67 | $ | 11.72 | $ | 9.71 | ||||||||||||||
Income From Investment Operations: | ||||||||||||||||||||||||||||
Net Investment Income | (0.01 | ) | (0.00 | )(e)(f) | 0.01 | (f) | 0.07 | 0.12 | 0.14 | 0.09 | ||||||||||||||||||
Net Realized and Unrealized Gains (Losses) on Investments | 0.30 | 2.02 | 0.57 | (1.10 | ) | (3.79 | ) | 3.26 | 2.03 | |||||||||||||||||||
Total from Investment Operations | 0.29 | 2.02 | 0.58 | (1.03 | ) | (3.67 | ) | 3.40 | 2.12 | |||||||||||||||||||
Less Distributions: | ||||||||||||||||||||||||||||
From Net Investment Income | — | (0.01 | ) | (0.01 | ) | (0.05 | ) | (0.12 | ) | (0.14 | ) | (0.11 | ) | |||||||||||||||
From Net Realized Gains | (0.17 | ) | (0.01 | ) | — | (0.33 | ) | (1.23 | ) | (0.31 | ) | — | ||||||||||||||||
Total Distributions | (0.17 | ) | (0.02 | ) | (0.01 | ) | (0.38 | ) | (1.35 | ) | (0.45 | ) | (0.11 | ) | ||||||||||||||
Net Asset Value, End of Period | $ | 10.93 | $ | 10.81 | $ | 8.81 | $ | 8.24 | $ | 9.65 | $ | 14.67 | $ | 11.72 | ||||||||||||||
Ratios and Supplemental Data | ||||||||||||||||||||||||||||
Total Return | +2.78 | % | +22.93 | % | +6.99 | % | –11.47 | % | –26.39 | % | +29.48 | % | +21.88 | % | ||||||||||||||
Net Assets, End of Period (In Millions) | $ | 61 | $ | 67 | $ | 9 | $ | 6 | $ | 4 | $ | 5 | $ | 3 | ||||||||||||||
Ratio of Expenses to Average Net Assets before Expense Offsets | 1.6 | %* | 1.7 | % | 3.1 | %* | 3.7 | % | 4.7 | % | 3.8 | % | 4.6 | % | ||||||||||||||
Ratio of Expenses to Average Net Assets | 1.5 | %* | 1.5 | % | 1.5 | %* | 1.5 | % | 1.5 | % | 1.5 | % | 1.5 | % | ||||||||||||||
Ratio of Net Investment Income to Average Net Assets | (0.2 | )%* | (0.0 | )%(e) | 0.1 | %* | 0.8 | % | 1.0 | % | 1.1 | % | 0.8 | % | ||||||||||||||
Portfolio Turnover Rate(g) | 143.5 | % | 148.2 | % | 36.4 | % | 190.4 | % | 221.6 | % | 142.7 | % | 113.4 | % | ||||||||||||||
STRONG ADVISOR LARGE COMPANY CORE FUND — CLASS B
| Period Ended | ||||||||||||
| June 30, 2004(b) | Dec. 31, 2003 | Dec. 31, 2002(h) | ||||||||||
Selected Per-Share Data(a) | ||||||||||||
Net Asset Value, Beginning of Period | $ | 10.69 | $ | 8.79 | $ | 8.21 | ||||||
Income From Investment Operations: | ||||||||||||
Net Investment Income | (0.05 | ) | (0.10 | )(f) | (0.02 | )(f) | ||||||
Net Realized and Unrealized Gains on Investments | 0.29 | 2.01 | 0.60 | |||||||||
Total from Investment Operations | 0.24 | 1.91 | 0.58 | |||||||||
Less Distributions: | ||||||||||||
From Net Investment Income | — | (0.00 | )(e) | — | ||||||||
From Net Realized Gains | (0.17 | ) | (0.01 | ) | — | |||||||
Total Distributions | (0.17 | ) | (0.01 | ) | — | |||||||
Net Asset Value, End of Period | $ | 10.76 | $ | 10.69 | $ | 8.79 | ||||||
Ratios and Supplemental Data | ||||||||||||
Total Return | +2.34 | % | +21.74 | % | +7.06 | % | ||||||
Net Assets, End of Period (In Millions) | $ | 9 | $ | 8 | $ | 0 | (i) | |||||
Ratio of Expenses to Average Net Assets before Expense Offsets | 2.4 | %* | 2.5 | % | 4.2 | %* | ||||||
Ratio of Expenses to Average Net Assets | 2.3 | %* | 2.4 | % | 2.5 | %* | ||||||
Ratio of Net Investment Income to Average Net Assets | (1.0 | )%* | (1.0 | )% | (0.2 | )%* | ||||||
Portfolio Turnover Rate(g) | 143.5 | % | 148.2 | % | 36.4 | % | ||||||
| * | Calculated on an annualized basis. |
| (a) | Information presented relates to a share of capital stock of the Fund outstanding for the entire period. |
| (b) | For the six months ended June 30, 2004 (Unaudited). |
| (c) | In 2002, the Fund changed its fiscal year-end from September to December. |
| (d) | Effective September 5, 2002 Strong Capital Management, Inc. assumed the investment advisory responsibilities from Rockhaven Asset Management, LLC. |
| (e) | Amount calculated is less than $0.005 or 0.05%. |
| (f) | Net investment income (loss) per share represents net investment income (loss) divided by average shares outstanding throughout the year. |
| (g) | Calculated on the basis of the Fund as a whole without distinguishing between the classes of shares issued. |
| (h) | For the period from September 30, 2002 (commencement of class) to December 31, 2002. |
| (i) | Amount is less than $500,000. |
See Notes to Financial Statements.
83
FINANCIAL HIGHLIGHTS (continued)
STRONG ADVISOR LARGE COMPANY CORE FUND — CLASS C
| Period Ended | ||||||||||||
| June 30, 2004(b) | Dec. 31, 2003 | Dec. 31, 2002(c) | ||||||||||
Selected Per-Share Data(a) | ||||||||||||
Net Asset Value, Beginning of Period | $ | 10.69 | $ | 8.79 | $ | 8.21 | ||||||
Income From Investment Operations: | ||||||||||||
Net Investment Income (Loss) | (0.05 | ) | (0.10 | )(d) | (0.02 | )(d) | ||||||
Net Realized and Unrealized Gains (Losses) on Investments | 0.29 | 2.01 | 0.60 | |||||||||
Total from Investment Operations | 0.24 | 1.91 | 0.58 | |||||||||
Less Distributions: | ||||||||||||
From Net Investment Income | — | — | (0.00 | )(e) | ||||||||
From Net Realized Gains (Losses) | (0.17 | ) | (0.01 | ) | — | |||||||
Total Distributions | (0.17 | ) | (0.01 | ) | (0.00 | )(e) | ||||||
Net Asset Value, End of Period | $ | 10.76 | $ | 10.69 | $ | 8.79 | ||||||
Ratios and Supplemental Data | ||||||||||||
Total Return | +2.34 | % | +21.73 | % | +7.09 | % | ||||||
Net Assets, End of Period (In Millions) | $ | 8 | $ | 6 | $ | 0 | (f) | |||||
Ratio of Expenses to Average Net Assets before Expense Offsets | 2.5 | %* | 2.5 | % | 4.2 | %* | ||||||
Ratio of Expenses to Average Net Assets | 2.4 | %* | 2.4 | % | 2.5 | %* | ||||||
Ratio of Net Investment Income to Average Net Assets | (1.1 | )%* | (1.0 | )% | (0.2 | )%* | ||||||
Portfolio Turnover Rate(g) | 143.5 | % | 148.2 | % | 36.4 | % | ||||||
STRONG ADVISOR LARGE COMPANY CORE FUND — CLASS K
| Period Ended | ||||||||||||
| June 30, 2004(b) | Dec. 31, 2003 | Dec. 31, 2002(c) | ||||||||||
Selected Per-Share Data(a) | ||||||||||||
Net Asset Value, Beginning of Period | $ | 10.84 | $ | 8.80 | $ | 8.21 | ||||||
Income From Investment Operations: | ||||||||||||
Net Investment Income | 0.01 | 0.05 | (d) | 0.02 | (d) | |||||||
Net Realized and Unrealized Losses on Investments | 0.31 | 2.03 | 0.59 | |||||||||
Total from Investment Operations | 0.32 | 2.08 | 0.61 | |||||||||
Less Distributions: | ||||||||||||
From Net Investment Income | — | (0.03 | ) | (0.02 | ) | |||||||
From Net Realized Gains | (0.17 | ) | (0.01 | ) | — | |||||||
Total Distributions | (0.17 | ) | (0.04 | ) | (0.02 | ) | ||||||
Net Asset Value, End of Period | $ | 10.99 | $ | 10.84 | $ | 8.80 | ||||||
Ratios and Supplemental Data | ||||||||||||
Total Return | +3.05 | % | +23.66 | % | +7.38 | % | ||||||
Net Assets, End of Period (In Millions) | $ | 39 | $ | 35 | $ | 0 | (f) | |||||
Ratio of Expenses to Average Net Assets before Expense Offsets | 1.3 | %* | 1.4 | % | 2.9 | %* | ||||||
Ratio of Expenses to Average Net Assets | 1.0 | %* | 1.0 | % | 1.0 | %* | ||||||
Ratio of Net Investment Income to Average Net Assets | 0.3 | % | 0.5 | % | 1.1 | %* | ||||||
Portfolio Turnover Rate(g) | 143.5 | % | 148.2 | % | 36.4 | % | ||||||
| * | Calculated on an annualized basis. |
| (a) | Information presented relates to a share of capital stock of the Fund outstanding for the entire period. |
| (b) | For the six months ended June 30, 2004 (Unaudited). |
| (c) | For the period from September 30, 2002 (commencement of class) to December 31, 2002. |
| (d) | Net investment income (loss) per share represents net investment income (loss) divided by average shares outstanding throughout the year. |
| (e) | Amount calculated is less than $0.005. |
| (f) | Amount is less than $500,000. |
| (g) | Calculated on the basis of the Fund as a whole without distinguishing between the classes of shares issued. |
See Notes to Financial Statements.
84
June 30, 2004 (Unaudited)
| 1. | Organization |
The accompanying financial statements represent the following Strong Advisor Equity Funds (the “Funds”), each with its own investment objectives and policies:
| • | Strong Advisor Common Stock Fund(1) (a series fund of Strong Common Stock Fund, Inc.) |
| • | Strong Advisor Mid Cap Growth Fund(1) (a series fund of Strong Equity Funds, Inc.) |
| • | Strong Advisor Small Cap Value Fund(1) (a series fund of Strong Equity Funds, Inc.) |
| • | Strong Advisor U.S. Value Fund(1) (a series fund of Strong Conservative Equity Funds, Inc.) |
| • | Strong Advisor Endeavor Large Cap Fund(1) (a series fund of Strong Common Stock Fund, Inc.) |
| • | Strong Advisor Focus Fund(2) (a series fund of Strong Common Stock Fund, Inc.) |
| • | Strong Advisor International Core Fund(1) (a series fund of Strong International Equity Funds, Inc.) |
| • | Strong Advisor Select Fund(2) (a series fund of Strong Opportunity Fund, Inc.) |
| • | Strong Advisor Technology Fund(1) (a series fund of Strong Common Stock Fund, Inc.) |
| • | Strong Advisor U.S. Small/Mid Cap Growth Fund(1) (a series fund of Strong Opportunity Fund, Inc.) |
| • | Strong Advisor Utilities and Energy Fund(1) (a series fund of Strong Equity Funds, Inc.) |
| • | Strong Advisor Large Company Core Fund(1) (a series fund of Strong Equity Funds, Inc.) |
| (1) | Diversified Fund. |
| (2) | Non-diversified Fund. |
Each Fund is an open-end management investment company registered under the Investment Company Act of 1940, as amended (“1940 Act”).
Strong Advisor Common Stock Fund, Strong Advisor Mid Cap Growth Fund, and Strong Advisor Small Cap Value Fund offer Class A, B, C, and Z shares. Strong Advisor U.S. Value Fund offers Class A, B, C, K, and Z shares. Strong Advisor Endeavor Large Cap Fund, Strong Advisor Focus Fund, Strong Advisor International Core Fund, Strong Advisor Select Fund, Strong Advisor Technology Fund, Strong Advisor U.S. Small/Mid Cap Growth Fund, and Strong Advisor Utilities and Energy Fund offer Class A, B, and C shares. Strong Advisor Large Company Core Fund offers Class A, B, C, and K shares. All classes of shares differ principally in their respective administration, transfer agent, and distribution expenses and sales charges, if any. All classes of shares have identical rights to earnings, assets, and voting privileges, except for class-specific expenses and exclusive rights to vote on matters affecting only individual classes.
Class A, B, and C shares are available only through financial professionals. Class K shares are primarily available through retirement plans. Class Z shares are available to certain investors and investment professionals who owned Investor Class shares of the Fund on November 30, 2000 and to certain other investors as set forth in the Funds’ prospectuses.
| 2. | Significant Accounting Policies |
The following is a summary of significant accounting policies followed by the Funds in the preparation of their financial statements.
| (A) | Security Valuation — Securities of the Funds traded on a national securities exchange are valued each business day at the last sales price. Securities traded on the NASDAQ Stock Market are valued each business day using the NASDAQ Official Closing Price (“NOCP”). Exchange-traded securities for which there were no transactions and NASDAQ-traded securities for which there is no NOCP are valued at the mean of the bid and ask prices. Securities for which market quotations are not readily available are fair valued as determined in good faith under the general supervision of the Board of Directors. Some of the Fund’s portfolio securities may be listed on foreign exchanges that close before the U.S. markets and that trade on days when the U.S. markets are closed. As a result, management, under the supervision of the Strong Funds’ Board of Directors, will consider significant events affecting foreign securities and the movements of the domestic markets that occur after the close of the foreign markets and before the time a Fund’s net asset value (“NAV”) is calculated in valuing such foreign securities. Securities that are purchased within 60 days of their stated maturity are valued at amortized cost, which approximates fair value. |
The Funds may own certain securities that are restricted as to resale. Restricted securities include Section 4(2) commercial paper, securities issued in a private placement, or securities eligible for resale pursuant to Rule 144A under the Securities Act of 1933. Restricted securities may be determined to be liquid or illiquid. Securities are deemed illiquid based upon guidelines established by the Funds’ Board of Directors. Illiquid securities are valued after giving due consideration to pertinent factors, such as recent private sales, market conditions, and the issuer’s financial performance. The aggregate cost and fair value of restricted securities held at June 30, 2004, that are deemed illiquid, are as follows:
| Aggregate Cost | Aggregate Fair Value | Percent of Net Assets | |||||||
Strong Advisor Small Cap Value Fund | $ | 680,073 | $ | 717,263 | 0.0 | % | |||
85
NOTES TO FINANCIAL STATEMENTS (continued)
June 30, 2004 (Unaudited)
| (B) | Federal Income and Excise Taxes and Distributions to Shareholders — The Funds intend to comply with the requirements of the Internal Revenue Code of 1986, as amended, applicable to regulated investment companies and to distribute substantially all of their taxable income to their shareholders in a manner which results in no tax cost to the Funds. Therefore, no federal income or excise tax provision is recorded. |
Undistributed income or net realized gains for financial statement purposes may differ from what is determined for federal income tax purposes due to differences in the timing, recognition, and characterization of income, expense, and capital gain items for financial statement and tax purposes. Where appropriate, reclassifications between net asset accounts are made for such differences that are permanent in nature. The Funds may utilize earnings and profits distributed to shareholders on redemptions of shares as part of the dividends paid deduction.
Each Fund, other than Strong Advisor U.S. Value Fund and Strong Advisor Utilities and Energy Fund, generally pays dividends from net investment income and distributes net realized capital gains, if any, at least annually. Strong Advisor U.S. Value Fund and Strong Advisor Utilities and Energy Fund generally pay dividends from net investment income quarterly and distribute net realized capital gains, if any, at least annually.
| (C) | Realized Gains and Losses on Investment Transactions — Investment security transactions are recorded as of the trade date. Gains or losses realized on investment transactions are determined by comparing the identified cost of the security lot sold with the net sales proceeds. |
| (D) | Certain Investment Risks — The Funds may utilize derivative instruments including options, futures, and other instruments with similar characteristics to the extent that they are consistent with the Funds’ investment objectives and limitations. The Funds intend to use such derivative instruments primarily to hedge or protect itself from adverse movements in securities’ prices, foreign currencies, or interest rates. The use of these instruments involves certain risks, including the possibility that the future value of the underlying assets or indices fluctuate (in the case of futures and options), the derivative becomes illiquid, an imperfect correlation arises between the value of the derivative and the underlying assets or indices, or that the counterparty fails to perform its obligations when due. |
Investments in foreign-denominated assets or forward foreign currency contracts may involve greater risks than domestic investments such as foreign-related risks created by currency rate fluctuations, foreign political and economic instability, foreign financial reporting standards and taxes, and foreign securities markets and issuer regulation. Foreign securities may be less liquid than domestic securities.
| (E) | Futures — Upon entering into a futures contract, the Funds segregate cash and/or other liquid investments equal to the minimum “initial margin” requirements of the exchange and the futures commission merchant or broker. Each Fund designates liquid securities as collateral on open futures contracts. During the term of the futures contract, the Funds also receive credit from, or pay to, the futures commission merchant or broker an amount of cash or liquid assets equal to the daily fluctuation in the value of the futures contract. Such receipts or payments are known as “variation margin” and are recorded as unrealized gains or losses by the Funds. When the futures contract is closed, a realized gain or loss is recorded equal to the difference between the value of the futures contract at the time it was opened and the value at the time it was closed. |
| (F) | Written Options — The Funds may write put or call options. Premiums received by the Funds upon writing put or call options are recorded as an asset with a corresponding liability that is subsequently adjusted daily to the current market value of the option. Changes between the initial premiums received and the current market value of the options are recorded as unrealized gains or losses by the Funds. When a written option is closed, expired, or exercised, the Funds realize a gain or loss and the liability is eliminated. The Funds continue to bear the risk of adverse movements in the price of the underlying asset during the period of the written option, although any potential loss during the period would be reduced by the amount of the option premium received by the Funds. Each Fund designates liquid securities or cash on its books to cover its financial exposure on open written options contracts. |
| (G) | Foreign Currency Conversion — Securities and other assets and liabilities initially expressed in foreign currencies are converted daily into U.S. dollars based upon current exchange rates. Purchases and sales of foreign securities and foreign income are converted into U.S. dollars based upon currency exchange rates prevailing on the respective dates of such transactions. The effect of changes in foreign exchange rates on realized and unrealized security gains or losses is reflected as a component of such gains or losses. |
| (H) | Forward Foreign Currency Exchange Contracts — Forward foreign currency exchange contracts are valued at the forward rate and are marked-to-market daily. The change in market value is recorded as an unrealized gain or loss. When the contract is closed, the Funds record an exchange gain or loss equal to the difference between the value of the contract at the time it was opened and the value at the time it was closed. |
86
| (I) | Short Positions — The Funds may engage in short sale transactions. For financial statement purposes, an amount equal to the settlement amount is included in the Statements of Assets and Liabilities as an asset and an equivalent liability. The amount of the liability is subsequently marked-to-market to reflect the current value of the short position. Changes between the amount of the liability and the current market value of the short positions are recorded as unrealized gains or losses. The Funds are liable to the buyer for any dividends payable on securities while those securities are in a short position. These dividends are an expense of the Fund and are included in Other Expenses in the Statement of Operations. If the Funds sell securities short while also holding the long position in the security, they may protect unrealized gains but will lose the opportunity to profit on such securities if the price rises. If the Funds sell securities short when not holding the long position in the security, they will experience a loss if the market price of the security increases between the date of the short sale and the date the security is replaced. |
| (J) | Repurchase Agreements — The Funds may enter into repurchase agreements with institutions that the Funds’ investment advisor, Strong Capital Management, Inc. (the “Advisor”), has determined are creditworthy. Each repurchase transaction is recorded at cost, which approximates fair value. The Funds require that the collateral, represented by cash and/or securities (primarily U.S. government securities), in a repurchase transaction be maintained in a segregated account under the control of the Funds’ custodial bank in a manner sufficient to enable the Funds to liquidate those securities in the event of a default of the counterparty. On a daily basis, the Funds’ custodial bank monitors the value of the collateral, including accrued interest, to ensure it is at least equal to the amounts owed to the Funds under each repurchase agreement. |
| (K) | Securities Lending — The Funds, except Strong Advisor Utilities and Energy Fund and Strong Advisor Large Company Core Fund, have entered into a Securities Lending Agreement (the “Agreement”) with Deutsche Bank, which was subsequently assumed by State Street Bank and Trust Company. Under the terms of the Agreement, the Funds may lend portfolio securities to qualified institutional borrowers in order to earn additional income. The Agreement requires that loans are collateralized at all times by cash and cash equivalents equal to at least 102% of the market value of the aggregate loaned securities, plus accrued interest, and the collateral is marked-to-market daily. Cash collateral received is invested in repurchase agreements, investment funds, government obligations, and/or bank obligations. |
At June 30, 2004, Strong Advisor Common Stock Fund, Strong Advisor Mid Cap Growth Fund, and Strong Advisor U.S. Value Fund had securities with a market value of $89,071,410, $110,533, and $7,175,925, respectively, on loan and had received $91,631,247, $112,131, and $7,404,288, respectively, in collateral (both are included within Investments in the Statements of Assets and Liabilities). Amounts earned as interest on investments of cash collateral, net of rebates and other securities lending expenses, are included in Interest Income in the Statements of Operations. For the six months ended June 30, 2004, the securities lending income totaled, $64,154, $1,321, and $4,210 for Strong Advisor Common Stock Fund, Strong Advisor Mid Cap Growth Fund, and Strong Advisor U.S. Value Fund, respectively.
The three primary risks associated with securities lending are: a borrower defaulting on its obligation to return the securities loaned resulting in a shortfall on the posted collateral; a principal loss arising from the lending agent’s investment of cash collateral; and the inability of the lending Fund to recall a security in time to exercise valuable voting rights or sell the security. In each case, the lending agent has indemnified the Funds for these types of losses.
| (L) | Directed Brokerage — The Funds direct certain portfolio trades to brokers who, in turn, pay a portion of the Funds’ expenses not attributable to the Advisor or its affiliates. Such amounts are included in Expense Offsets reported in the Funds’ Statements of Operations and in Note 4. |
| (M) | Earnings Credit Arrangements — Credits are earned on positive cash balances maintained in custodian accounts. These credits serve to reduce the custodian’s fees incurred by certain Funds and are included in Expense Offsets reported in the Funds’ Statements of Operations and in Note 4. |
| (N) | Expenses — The Funds and other affiliated Strong Funds contract for certain services on a collective basis. The majority of the expenses are directly identifiable to an individual Fund. Expenses that are not readily identifiable to a specific Fund will be allocated in such a manner as deemed equitable, taking into consideration, among other things, the nature and type of expense and the relative sizes of the Strong Funds. |
| (O) | Use of Estimates — The preparation of financial statements in conformity with accounting principles generally accepted in the United States of America requires management to make estimates and assumptions that affect the reported amounts in these financial statements. Actual results could differ from those estimates. |
| (P) | Guarantees and Indemnifications — In the normal course of business, the Funds enter into contracts with service providers that contain general indemnification clauses. The Funds’ maximum exposure under these arrangements is unknown, as this would involve future claims that may be made against the Funds that have not yet occurred. However, based on experience, the Funds expect the risk of loss to be remote. |
87
NOTES TO FINANCIAL STATEMENTS (continued)
June 30, 2004 (Unaudited)
| (Q) | Other — Dividend income and distributions to shareholders are recorded on the ex-dividend date. Interest income is recorded on the accrual basis and includes amortization of premiums and discounts on the interest method. Income, expenses (other than expenses attributable to a specific class), and realized and unrealized gains or losses on investments are allocated to each class of shares based on its relative shares outstanding. |
| (R) | Redemption Fees — Class A shares of Strong Advisor Large Company Core Fund held for 360 calendar days or less after purchase are subject to a redemption fee of 1.00%, based on the redeemed share’s market value. Class A, B, and C shares of Strong Advisor International Core Fund held for thirty calendar days or less after purchase are subject to a redemption fee of 1.00%, based on the redeemed share’s market value. Redemption fees are paid directly to the Funds. The amount collected for the period is included in Capital Stock reported in the Statements of Assets and Liabilities and in Note 8. Strong Advisor International Core Fund did not collect any redemption fees during the period. |
| 3. | Related Party Transactions |
The Advisor provides investment advisory and related services to the Funds. Strong Investor Services, Inc. (the “Administrator”), an affiliate of the Advisor, provides administrative, transfer agent, and related services to the Funds. Certain officers and, until December 2, 2003, certain directors of the Funds are or were affiliated with the Advisor and the Administrator. Investment advisory and administration fees, which are established by terms of the advisory and administration agreements, are based on the following annualized rates of the average daily net assets of the respective Fund:
| Administrative Fees | ||||||||||||||||||
| Advisory Fees(1) | Class A | Class B | Class C | Class K | Class Z | |||||||||||||
Strong Advisor Common Stock Fund | 0.75 | % | 0.30 | % | 0.30 | % | 0.30 | % | * | 0.30 | % | |||||||
Strong Advisor Mid Cap Growth Fund | 0.75 | % | 0.30 | % | 0.30 | % | 0.30 | % | * | 0.30 | % | |||||||
Strong Advisor Small Cap Value Fund | 0.75 | % | 0.30 | % | 0.30 | % | 0.30 | % | * | 0.30 | % | |||||||
Strong Advisor U.S. Value Fund | 0.55 | % | 0.30 | % | 0.30 | % | 0.30 | % | 0.25 | % | 0.30 | % | ||||||
Strong Advisor Endeavor Large Cap Fund | 0.75 | % | 0.30 | % | 0.30 | % | 0.30 | % | * | * | ||||||||
Strong Advisor Focus Fund | 0.75 | % | 0.30 | % | 0.30 | % | 0.30 | % | * | * | ||||||||
Strong Advisor International Core Fund | 0.75 | % | 0.30 | % | 0.30 | % | 0.30 | % | * | * | ||||||||
Strong Advisor Select Fund | 0.75 | % | 0.30 | % | 0.30 | % | 0.30 | % | * | * | ||||||||
Strong Advisor Technology Fund | 0.75 | % | 0.30 | % | 0.30 | % | 0.30 | % | * | * | ||||||||
Strong Advisor U.S. Small/Mid Cap Growth Fund | 0.75 | % | 0.30 | % | 0.30 | % | 0.30 | % | * | * | ||||||||
Strong Advisor Utilities and Energy Fund | 0.75 | % | 0.30 | % | 0.30 | % | 0.30 | % | * | * | ||||||||
Strong Advisor Large Company Core Fund | 0.75 | % | 0.30 | % | 0.30 | % | 0.30 | % | 0.25 | % | * | |||||||
| * | Does not offer share class. |
| (1) | The investment advisory fees are 0.75% for assets under $4 billion, 0.725% for the next $2 billion assets, and 0.70% for assets $6 billion and above. Strong Advisor U.S. Value Fund does not have a breakpoint schedule. |
The Funds’ Advisor and/or Administrator may voluntarily waive or absorb certain expenses at their discretion. The Advisor and/or Administrator has contractually agreed to waive and/or absorb expenses for the following Funds until May 1, 2005, to keep Net Annual Operating Expenses at or below the following percentages:
| Class A | Class B | Class C | Class K | Class Z | |||||||||||
Strong Advisor Common Stock Fund | * | 2.50 | % | * | * | * | * | ||||||||
Strong Advisor Mid Cap Growth Fund | * | 2.50 | % | 2.50 | % | * | * | * | |||||||
Strong Advisor Small Cap Value Fund | * | * | * | * | * | * | |||||||||
Strong Advisor U.S. Value Fund | 2.50 | % | 2.50 | % | 2.50 | % | 0.99 | % | * | ||||||
Strong Advisor Endeavor Large Cap Fund | * | 2.50 | % | 2.50 | % | * | * | * | * | ||||||
Strong Advisor Focus Fund | 2.50 | % | 2.50 | % | 2.50 | % | * | * | * | * | |||||
Strong Advisor International Core Fund | 2.50 | % | 2.50 | % | 2.50 | % | * | * | * | * | |||||
Strong Advisor Select Fund | 2.50 | % | 2.50 | % | 2.50 | % | * | * | * | * | |||||
Strong Advisor Technology Fund | 2.50 | % | 2.50 | % | 2.50 | % | * | * | * | * | |||||
Strong Advisor U.S. Small/Mid Cap Growth Fund | 2.50 | % | 2.50 | % | 2.50 | % | * | * | * | * | |||||
Strong Advisor Utilities and Energy Fund | * | * | * | * | * | * | * | ||||||||
Strong Advisor Large Company Core Fund | 1.50 | %(1) | 2.50 | % | 2.50 | % | 0.99 | % | * | * |
| * | Contractual rate not applicable to Class. |
| ** | Does not offer share class. |
| (1) | The contractual rate is indefinite and may only be terminated by the Board of Directors of the Funds, but not before May 1, 2005. |
88
Transfer agent and related service fees for Class Z shares are paid at an annual rate of $27.00 for each open shareholder account and $4.20 for each closed shareholder account. Transfer agent and related service fees for each of the Funds’ Class A, B, C, and K shares are paid at an annual rate of 0.20% of the average daily net assets of each respective class. Transfer agent fees are recorded in Shareholder Servicing Costs in the Funds’ Statements of Operations and in Note 4. The Administrator also allocates to each Fund certain charges or credits resulting from transfer agency banking activities based on each Class’ level of subscription and redemption activity. Transfer Agency Banking Charges allocated to the Funds by the Administrator, if any, are included in Other Expenses in the Funds’ Statements of Operations and in Note 4. Transfer Agency Banking Credits allocated by the Administrator, if any, serve to reduce the transfer agency expenses incurred by the Funds and are included in Expense Offsets in the Funds’ Statements of Operations and in Note 4. The Administrator is also compensated for certain other out-of-pocket expenses related to transfer agent services.
The Funds have adopted a Rule 12b-1 distribution and service plan under the 1940 Act on behalf of each of the Funds’ Class A, B, and C shares. Under the plan, Strong Investments, Inc. (the “Distributor” and an affiliate of the Advisor) is paid an annual rate of 0.25%, 1.00%, and 1.00% of the average daily net assets of the Class A, B, and C shares, respectively, as compensation for services provided and expenses incurred, including amounts paid to brokers or dealers, in connection with the sale of each Fund’s Class A, B, and C shares. See Note 4.
The Funds’ Class A, B, and C shares have sales charges (loads) charged to shareholders. The Funds’ Class A shares have a maximum 5.75% front-end sales charge. The Funds’ Class A shares, except Strong Advisor Large Company Core Fund, may be subject to a 1.00% contingent deferred sales charge if shares are purchased without an initial sales charge and are redeemed within one year of purchase (usually on purchases of $1,000,000 or more). The Funds’ Class B shares have a maximum 5.00% contingent deferred sales charge. The Funds’ Class C shares have a maximum 1.00% contingent deferred sales charge if the shares are sold within one year of their original purchase date. Sales charges are not an expense of the Funds and are not reflected in the financial statements of the Funds. Certain of these sales charges may be waived in limited circumstances.
For the six months ended June 30, 2004, the Distributor received aggregate sales charges from the sale of Class A shares as follows: Strong Advisor Common Stock Fund $3,971, Strong Advisor Mid Cap Growth Fund $339, Strong Advisor Small Cap Value Fund $7,087, Strong Advisor U.S. Value Fund $326, Strong Advisor Endeavor Large Cap Fund $697, Strong Advisor Focus Fund $4, Strong Advisor International Core Fund $202, Strong Advisor Select Fund $1,004, Strong Advisor Technology Fund $0, Strong Advisor U.S. Small/Mid Cap Growth Fund $1,195, Strong Advisor Utilities and Energy Fund $80, and Strong Advisor Large Company Core Fund $7,612.
For the six months ended June 30, 2004, the Distributor received aggregate contingent deferred sales charges from the redemption of Class A, B, and C shares as follows: Strong Advisor Common Stock Fund $61,659, Strong Advisor Mid Cap Growth Fund $7,693, Strong Advisor Small Cap Value Fund $192,786, Strong Advisor U.S. Value Fund $13,302, Strong Advisor Endeavor Large Cap Fund $6,731, Strong Advisor Focus Fund $8,527, Strong Advisor International Core Fund $189, Strong Advisor Select Fund $1,011, Strong Advisor Technology Fund $1,276, Strong Advisor U.S. Small/Mid Cap Growth Fund $2,548, Strong Advisor Utilities and Energy Fund $0, and Strong Advisor Large Company Core Fund $13,846.
Next Century Growth Investors, LLC (“Next Century Growth”), an affiliate of the Advisor, manages the investments of Strong Advisor U.S. Small/Mid Cap Growth Fund under a subadvisory agreement with the Advisor. Next Century Growth is compensated by the Advisor (not the Fund) and bears all of its own expenses in providing subadvisory services.
W.H. Reaves & Co., Inc. (“Reaves”) manages the investments of Strong Advisor Utilities and Energy Fund under a subadvisory agreement with the Advisor. Reaves is compensated by the Advisor (not the Fund) and bears all of its own expenses in providing subadvisory services. The investment subadvisory fees are based on breakpoints ranging from net asset values of $200 million to $2.5 billion. The investment subadvisory fees are also subject to adjustment upward or downward depending on the Fund’s performance measured against a benchmark. The benchmark is 90% of the performance of a blend of utilities and energy indices. In addition, Reaves directly affects purchases and sales of securities for the Fund. In conjunction therewith, brokerage commissions paid to Reaves by the Fund for the six months ended June 30, 2004, totaled $14,652.
The Funds may invest cash in money market funds managed by the Advisor, subject to certain limitations set by the Fund’s Board of Directors and applicable law.
89
NOTES TO FINANCIAL STATEMENTS (continued)
June 30, 2004 (Unaudited)
Certain information regarding related party transactions, excluding the effects of waivers and absorptions, for the six months ended June 30, 2004, is as follows:
| Payable to/ (Receivable from) Advisor or Administrator at June 30, 2004 | Shareholder Servicing Related Expenses | Transfer Agency Banking Charges/(Credits) | Unaffiliated Directors’ and Independent Officers’ Fees | ||||||||||
Strong Advisor Common Stock Fund | $ | 273,856 | $ | 1,683,617 | $ | 4,327 | $ | 43,361 | |||||
Strong Advisor Mid Cap Growth Fund | 23,877 | 156,709 | 991 | 2,290 | |||||||||
Strong Advisor Small Cap Value Fund | 432,176 | 2,699,980 | 8,888 | 48,739 | |||||||||
Strong Advisor U.S. Value Fund | 81,130 | 493,221 | 16,402 | 7,127 | |||||||||
Strong Advisor Endeavor Large Cap Fund | 9,813 | 38,854 | 925 | 1,228 | |||||||||
Strong Advisor Focus Fund | 360 | 2,996 | 8 | 454 | |||||||||
Strong Advisor International Core Fund | (93 | ) | 1,719 | 9 | 404 | ||||||||
Strong Advisor Select Fund | 14,620 | 75,853 | 873 | 2,117 | |||||||||
Strong Advisor Technology Fund | 86 | 1,745 | 7 | 423 | |||||||||
Strong Advisor U.S. Small/Mid Cap Growth Fund | 2,301 | 6,028 | 24 | 453 | |||||||||
Strong Advisor Utilities and Energy Fund | 1,419 | 10,074 | 4 | 663 | |||||||||
Strong Advisor Large Company Core Fund | 18,453 | 117,972 | 329 | 2,370 | |||||||||
At June 30, 2004, the Distributor owned 21% of the outstanding shares of Strong Advisor International Core Fund.
| 4. | Expenses and Expense Offsets |
For the six months ended June 30, 2004, the class specific expenses are as follows:
| Administrative Fees | Shareholder Servicing Costs | Reports to Shareholders | 12b-1 Fees | Other | |||||||||||
Strong Advisor Common Stock Fund | |||||||||||||||
Class A | $ | 119,578 | $ | 80,469 | $ | 12,549 | $ | 99,649 | $ | 5 | |||||
Class B | 57,425 | 39,773 | 7,649 | 191,415 | 78 | ||||||||||
Class C | 48,483 | 33,361 | 7,832 | 161,610 | 919 | ||||||||||
Class Z | 2,070,152 | 1,527,427 | 227,517 | — | 5,912 | ||||||||||
Strong Advisor Mid Cap Growth Fund | |||||||||||||||
Class A | 14,018 | 9,492 | 4,422 | 11,681 | 59 | ||||||||||
Class B | 4,292 | 3,167 | 2,588 | 14,306 | 13 | ||||||||||
Class C | 1,054 | 770 | 888 | 3,513 | 17 | ||||||||||
Class Z | 79,663 | 142,546 | 44,872 | — | 1,635 | ||||||||||
Strong Advisor Small Cap Value Fund | |||||||||||||||
Class A | 958,583 | 650,173 | 102,906 | 798,819 | 1,500 | ||||||||||
Class B | 186,353 | 134,226 | 37,650 | 621,178 | 666 | ||||||||||
Class C | 227,804 | 160,071 | 47,644 | 759,348 | 1,172 | ||||||||||
Class Z | 1,792,277 | 1,753,406 | 207,661 | — | 7,655 | ||||||||||
Strong Advisor U.S. Value Fund | |||||||||||||||
Class A | 6,560 | 4,503 | 1,255 | 5,466 | 92 | ||||||||||
Class B | 8,250 | 5,856 | 1,887 | 27,500 | 21 | ||||||||||
Class C | 6,465 | 4,735 | 1,938 | 21,550 | 441 | ||||||||||
Class K | 102,549 | 82,040 | 905 | — | 4,456 | ||||||||||
Class Z | 337,432 | 395,359 | 122,239 | — | 12,120 | ||||||||||
Strong Advisor Endeavor Large Cap Fund | |||||||||||||||
Class A | 56,250 | 37,513 | 2,906 | 46,875 | 934 | ||||||||||
Class B | 1,183 | 821 | 167 | 3,945 | 2 | ||||||||||
Class C | 645 | 466 | 154 | 2,149 | 44 | ||||||||||
Strong Advisor Focus Fund | |||||||||||||||
Class A | 1,855 | 1,299 | 738 | 1,546 | 11 | ||||||||||
Class B | 1,739 | 1,321 | 988 | 5,795 | 4 | ||||||||||
Class C | 466 | 350 | 2,730 | 1,555 | 18 | ||||||||||
Strong Advisor International Core Fund | |||||||||||||||
Class A | 896 | 618 | 164 | 746 | 4 | ||||||||||
Class B | 1,232 | 885 | 293 | 4,107 | 4 | ||||||||||
Class C | 304 | 214 | 63 | 1,015 | 4 | ||||||||||
Strong Advisor Select Fund | |||||||||||||||
Class A | 111,383 | 74,294 | 3,471 | 92,819 | 891 | ||||||||||
Class B | 1,099 | 778 | 221 | 3,680 | 1 | ||||||||||
Class C | 1,028 | 739 | 188 | 3,452 | 25 | ||||||||||
90
| Administrative Fees | Shareholder Servicing Costs | Reports to Shareholders | 12b-1 Fees | Other | |||||||||||
Strong Advisor Technology Fund | |||||||||||||||
Class A | $ | 1,315 | $ | 892 | $ | 338 | $ | 1,096 | $ | 15 | |||||
Class B | 817 | 571 | 193 | 2,723 | 2 | ||||||||||
Class C | 364 | 264 | 237 | 1,209 | 8 | ||||||||||
Strong Advisor U.S. Small/Mid Cap Growth Fund | |||||||||||||||
Class A | 4,255 | 2,885 | 403 | 3,546 | 18 | ||||||||||
Class B | 2,003 | 1,378 | 214 | 6,675 | 5 | ||||||||||
Class C | 2,312 | 1,578 | 668 | 7,706 | 189 | ||||||||||
Strong Advisor Utilities and Energy Fund | |||||||||||||||
Class A | 14,367 | 9,589 | 271 | 11,973 | 11 | ||||||||||
Class B | 358 | 249 | 53 | 1,194 | 3 | ||||||||||
Class C | 325 | 224 | 53 | 1,082 | 2 | ||||||||||
Strong Advisor Large Company Core Fund | |||||||||||||||
Class A | 98,530 | 66,236 | 3,020 | 82,109 | 118 | ||||||||||
Class B | 12,491 | 8,691 | 1,642 | 41,637 | 32 | ||||||||||
Class C | 10,793 | 7,455 | 5,799 | 35,977 | 312 | ||||||||||
Class K | 44,106 | 35,285 | 3,739 | — | 172 | ||||||||||
For the six months ended June 30, 2004, the class specific expense offsets are as follows:
| Expense Waivers and Absorptions | Transfer Agency Banking Credits | Directed Brokerage Credits | Earnings Credits | |||||||||||||
Strong Advisor Common Stock Fund | ||||||||||||||||
Class A | $ | (4,645 | ) | $ | (22 | ) | $ | — | $ | — | ||||||
Class B | (3,426 | ) | — | — | — | |||||||||||
Class C | (3,307 | ) | — | — | — | |||||||||||
Class Z | (24,643 | ) | — | — | — | |||||||||||
Fund Level | (139,041 | ) | — | (38,113 | ) | (212 | ) | |||||||||
Strong Advisor Mid Cap Growth Fund | ||||||||||||||||
Class A | (742 | ) | — | — | — | |||||||||||
Class B | (1,407 | ) | — | — | — | |||||||||||
Class C | (609 | ) | — | — | — | |||||||||||
Class Z | (6,439 | ) | — | — | — | |||||||||||
Fund Level | (6,036 | ) | — | (7,691 | ) | (14 | ) | |||||||||
Strong Advisor Small Cap Value Fund | ||||||||||||||||
Class A | (46,646 | ) | — | — | — | |||||||||||
Class B | (14,965 | ) | — | — | — | |||||||||||
Class C | (16,490 | ) | — | — | — | |||||||||||
Class Z | (42,604 | ) | — | — | — | |||||||||||
Fund Level | (193,256 | ) | — | (55,185 | ) | (513 | ) | |||||||||
Strong Advisor U.S. Value Fund | ||||||||||||||||
Class A | (594 | ) | — | — | — | |||||||||||
Class B | (763 | ) | — | — | — | |||||||||||
Class C | (875 | ) | — | — | — | |||||||||||
Class K | (23,151 | ) | — | — | — | |||||||||||
Class Z | (7,319 | ) | — | — | — | |||||||||||
Fund Level | (30,531 | ) | — | (4,968 | ) | (30 | ) | |||||||||
Strong Advisor Endeavor Large Cap Fund | ||||||||||||||||
Class A | (57 | ) | — | — | — | |||||||||||
Class B | (44 | ) | — | — | — | |||||||||||
Class C | (47 | ) | — | — | — | |||||||||||
Fund Level | (3,746 | ) | — | (5,077 | ) | (11 | ) | |||||||||
Strong Advisor Focus Fund | ||||||||||||||||
Class A | (5,277 | ) | — | — | — | |||||||||||
Class B | (6,823 | ) | — | — | — | |||||||||||
Class C | (4,276 | ) | — | — | — | |||||||||||
Fund Level | (13,943 | ) | — | (2,570 | ) | (1 | ) | |||||||||
91
NOTES TO FINANCIAL STATEMENTS (continued)
June 30, 2004 (Unaudited)
| Expense Waivers and Absorptions | Transfer Agency Banking Credits | Directed Brokerage Credits | Earnings Credits | ||||||||||||
Strong Advisor International Core Fund | |||||||||||||||
Class A | $ | (2,428 | ) | $ | — | $ | — | $ | — | ||||||
Class B | (6,521 | ) | — | — | — | ||||||||||
Class C | (1,599 | ) | — | — | — | ||||||||||
Fund Level | (37,458 | ) | — | (111 | ) | (1 | ) | ||||||||
Strong Advisor Select Fund | |||||||||||||||
Class A | (350 | ) | — | — | — | ||||||||||
Class B | (78 | ) | — | — | — | ||||||||||
Class C | (63 | ) | — | — | — | ||||||||||
Fund Level | (6,927 | ) | — | (8,343 | ) | (89 | ) | ||||||||
Strong Advisor Technology Fund | |||||||||||||||
Class A | (3,663 | ) | — | — | — | ||||||||||
Class B | (4,287 | ) | — | — | — | ||||||||||
Class C | (2,066 | ) | — | — | — | ||||||||||
Fund Level | (11,495 | ) | — | (3,842 | ) | (1 | ) | ||||||||
Strong Advisor U.S. Small/Mid Cap Fund | |||||||||||||||
Class A | (414 | ) | — | — | — | ||||||||||
Class B | (5,299 | ) | — | — | — | ||||||||||
Class C | (6,660 | ) | — | — | — | ||||||||||
Fund Level | (640 | ) | — | (1,929 | ) | (3 | ) | ||||||||
Strong Advisor Utilities and Energy Fund | |||||||||||||||
Class A | (47 | ) | — | — | — | ||||||||||
Class B | (485 | ) | — | — | — | ||||||||||
Class C | (467 | ) | — | — | — | ||||||||||
Fund Level | (1,026 | ) | — | — | (1 | ) | |||||||||
Strong Advisor Large Company Core Fund | |||||||||||||||
Class A | (24,241 | ) | — | — | — | ||||||||||
Class B | (700 | ) | — | — | — | ||||||||||
Class C | (2,862 | ) | — | — | — | ||||||||||
Class K | (52,092 | ) | — | — | — | ||||||||||
Fund Level | (10,707 | ) | — | (8,306 | ) | (187 | ) | ||||||||
| 5. | Line of Credit |
The Strong Funds have established a line of credit agreement (“LOC”) with certain financial institutions, which expires October 8, 2004, to be used for temporary or emergency purposes. Combined borrowings among all participating Strong Funds are subject to a $350 million cap on the total LOC. For an individual Fund, borrowings under the LOC are limited to either the lesser of 15% of the market value of the Fund’s total assets or any explicit borrowing limits in the Fund’s registration statement. The principal amount of each borrowing under the LOC is due not more than 45 days after the date of the borrowing. Borrowings under the LOC bear interest based on prevailing market rates as defined in the LOC. A commitment fee of 0.09% per annum is incurred on the unused portion of the LOC and is allocated to all participating Strong Funds based on their net asset values. For the six months ended June 30, 2004, there were no borrowings by Strong Advisor Common Stock Fund, Strong Advisor Mid Cap Growth Fund, Strong Advisor Small Cap Value Fund, Strong Advisor Focus Fund, Strong Advisor International Core Fund, Strong Advisor Select Fund, Strong Advisor U.S. Small/Mid Cap Growth Fund, and Strong Advisor Utilities and Energy Fund under the LOC. Strong Advisor U.S. Value Fund, Strong Advisor Endeavor Large Cap Fund, and Strong Advisor Large Company Core Fund had minimal borrowings under the LOC during the period. During the six months ended June 30, 2004, Strong Advisor Technology Fund had an outstanding average daily balance of $2,198 under the LOC. The maximum amount outstanding during the period was $100,000. Interest expense amounted to $17 for the six months ended June 30, 2004. At June 30, 2004, there were no outstanding borrowings by the Funds under the LOC.
92
| 6. | Investment Transactions |
The aggregate purchases and sales of long-term securities during the six months ended June 30, 2004, are as follows:
| Purchases | Sales | |||||
Strong Advisor Common Stock Fund | $ | 393,717,183 | $ | 508,552,628 | ||
Strong Advisor Mid Cap Growth Fund | 62,190,038 | 73,534,095 | ||||
Strong Advisor Small Cap Value Fund | 370,745,993 | 619,233,238 | ||||
Strong Advisor U.S. Value Fund | 110,961,083 | 44,464,677 | ||||
Strong Advisor Endeavor Large Cap Fund | 32,999,519 | 32,700,839 | ||||
Strong Advisor Focus Fund | 1,156,232 | 2,003,273 | ||||
Strong Advisor International Core Fund | 422,361 | 262,319 | ||||
Strong Advisor Select Fund | 48,733,629 | 61,551,316 | ||||
Strong Advisor Technology Fund | 1,188,855 | 1,602,406 | ||||
Strong Advisor U.S. Small/Mid Cap Growth Fund | 3,373,074 | 3,238,829 | ||||
Strong Advisor Utilities and Energy Fund | 5,710,150 | 8,315,298 | ||||
Strong Advisor Large Company Core Fund | 164,884,980 | 170,676,357 | ||||
There were no purchases or sales of long-term U.S. government securities during the six months ended June 30, 2004.
| 7. | Income Tax Information |
The following information for the Funds is presented on an income tax basis as of June 30, 2004:
| Cost of Investments | Gross Unrealized Appreciation | Gross Unrealized (Depreciation) | Net Unrealized Appreciation/ (Depreciation) on Investments | ||||||||||
Strong Advisor Common Stock Fund | $ | 1,218,571,148 | $ | 368,950,391 | $ | (39,809,706 | ) | $ | 329,140,685 | ||||
Strong Advisor Mid Cap Growth Fund | 49,139,840 | 14,056,715 | (207,910 | ) | 13,848,805 | ||||||||
Strong Advisor Small Cap Value Fund | 1,492,559,126 | 581,101,457 | (36,968,331 | ) | 544,133,126 | ||||||||
Strong Advisor U.S. Value Fund | 298,751,454 | 54,742,537 | (5,251,480 | ) | 49,491,057 | ||||||||
Strong Advisor Endeavor Large Cap Fund | 34,810,876 | 6,761,172 | (327,220 | ) | 6,433,952 | ||||||||
Strong Advisor Focus Fund | 1,891,181 | 663,245 | (22,752 | ) | 640,493 | ||||||||
Strong Advisor International Core Fund | 1,417,534 | 336,399 | (10,323 | ) | 326,076 | ||||||||
Strong Advisor Select Fund | 64,282,748 | 15,462,995 | (561,663 | ) | 14,901,332 | ||||||||
Strong Advisor Technology Fund | 1,520,776 | 237,817 | (138,770 | ) | 99,047 | ||||||||
Strong Advisor U.S. Small/Mid Cap Growth Fund | 4,834,977 | 1,078,866 | (278,539 | ) | 800,327 | ||||||||
Strong Advisor Utilities and Energy Fund | 6,774,559 | 967,382 | (83,096 | ) | 884,286 | ||||||||
Strong Advisor Large Company Core Fund | 111,394,754 | 9,806,394 | (1,508,822 | ) | 8,297,572 | ||||||||
The difference between cost amounts for financial statement and federal income tax purposes is due primarily to timing differences in recognizing certain gains and losses on security transactions.
The capital loss carryovers (expiring in varying amounts through 2011) as of December 31, 2003, and tax basis post-October losses as of December 31, 2003, which are not recognized for tax purposes until the first day of the following fiscal year, are:
| Net Capital Loss Carryovers | Post-October Losses | |||||
Strong Advisor Common Stock Fund | $ | 98,586,817 | $ | — | ||
Strong Advisor Mid Cap Growth Fund | 118,085,651 | — | ||||
Strong Advisor Small Cap Value Fund | — | — | ||||
Strong Advisor U.S. Value Fund | 3,963,290 | 29,798 | ||||
Strong Advisor Endeavor Large Cap Fund | 5,636,377 | 31,201 | ||||
Strong Advisor Focus Fund | 4,503,261 | — | ||||
Strong Advisor International Core Fund | 30,211 | — | ||||
Strong Advisor Select Fund | 5,730,250 | — | ||||
Strong Advisor Technology Fund | 763,150 | — | ||||
Strong Advisor U.S. Small/Mid Cap Growth Fund | 107,537 | 136,043 | ||||
Strong Advisor Utilities and Energy Fund | 313,921 | — | ||||
Strong Advisor Large Company Core Fund | — | 13,372 | ||||
93
NOTES TO FINANCIAL STATEMENTS (continued)
June 30, 2004 (Unaudited)
| 8. | Capital Share Transactions |
Strong Advisor Common Stock Fund | Strong Advisor Mid Cap Growth Fund | |||||||||||||||
| Six Months Ended June 30, 2004 | Year Ended Dec. 31, 2003 | Six Months Ended June 30, 2004 | Year Ended Dec. 31, 2003 | |||||||||||||
| (Unaudited) | (Unaudited) | |||||||||||||||
Capital Share Transactions of Each Class of Shares of the Funds Were as Follows: | ||||||||||||||||
CLASS A | ||||||||||||||||
Proceeds from Shares Sold | $ | 9,793,853 | $ | 62,389,061 | $ | 942,481 | $ | 29,891,257 | ||||||||
Proceeds from Reinvestment of Distributions | — | — | — | — | ||||||||||||
Payment for Shares Redeemed | (13,793,509 | ) | (48,584,158 | ) | (1,978,715 | ) | (29,161,740 | ) | ||||||||
Net Increase (Decrease) in Net Assets from Capital Share Transactions | (3,999,656 | ) | 13,804,903 | (1,036,234 | ) | 729,517 | ||||||||||
CLASS B | ||||||||||||||||
Proceeds from Shares Sold | 1,274,204 | 8,099,013 | 48,677 | 490,452 | ||||||||||||
Proceeds from Reinvestment of Distributions | — | — | — | — | ||||||||||||
Payment for Shares Redeemed | (2,475,271 | ) | (3,494,374 | ) | (250,605 | ) | (720,050 | ) | ||||||||
Net Increase (Decrease) in Net Assets from Capital Share Transactions | (1,201,067 | ) | 4,604,639 | (201,928 | ) | (229,598 | ) | |||||||||
CLASS C | ||||||||||||||||
Proceeds from Shares Sold | 2,987,481 | 9,917,355 | 16,197 | 326,442 | ||||||||||||
Proceeds from Reinvestment of Distributions | — | — | — | — | ||||||||||||
Payment for Shares Redeemed | (7,447,100 | ) | (8,090,361 | ) | (202,450 | ) | (698,172 | ) | ||||||||
Net Increase (Decrease) in Net Assets from Capital Share Transactions | (4,459,619 | ) | 1,826,994 | (186,253 | ) | (371,730 | ) | |||||||||
CLASS Z | ||||||||||||||||
Proceeds from Shares Sold | 82,838,619 | 203,644,369 | 4,046,896 | 31,734,000 | ||||||||||||
Proceeds from Reinvestment of Distributions | — | — | — | — | ||||||||||||
Payment for Shares Redeemed | (233,906,408 | ) | (608,593,067 | ) | (13,574,621 | ) | (61,043,159 | ) | ||||||||
Net Increase (Decrease) in Net Assets from Capital Share Transactions | (151,067,789 | ) | (404,948,698 | ) | (9,527,725 | ) | (29,309,159 | ) | ||||||||
Net Increase (Decrease) in Net Assets from Capital Share Transactions | $ | (160,728,131 | ) | $ | (384,712,162 | ) | $ | (10,952,140 | ) | $ | (29,180,970 | ) | ||||
94
Strong Advisor Common Stock Fund | Strong Advisor Mid Cap Growth Fund | |||||||||||
| Six Months Ended June 30, 2004 | Year Ended Dec. 31, 2003 | Six Months Ended June 30, 2004 | Year Ended Dec. 31, 2003 | |||||||||
| (Unaudited) | (Unaudited) | |||||||||||
Transactions in Shares of Each Class of the Funds Were as Follows: | ||||||||||||
CLASS A | ||||||||||||
Sold | 438,547 | 3,431,779 | 77,784 | 3,106,763 | ||||||||
Issued in Reinvestment of Distributions | — | — | — | — | ||||||||
Redeemed | (619,938 | ) | (2,666,367 | ) | (165,418 | ) | (2,955,165 | ) | ||||
Net Increase (Decrease) in Shares | (181,391 | ) | 765,412 | (87,634 | ) | 151,598 | ||||||
CLASS B | ||||||||||||
Sold | 58,235 | 457,112 | 4,094 | 50,542 | ||||||||
Issued in Reinvestment of Distributions | — | — | — | — | ||||||||
Redeemed | (113,298 | ) | (198,050 | ) | (21,344 | ) | (70,959 | ) | ||||
Net Increase (Decrease) in Shares | (55,063 | ) | 259,062 | (17,250 | ) | (20,417 | ) | |||||
CLASS C | ||||||||||||
Sold | 136,476 | 546,220 | 1,379 | 34,377 | ||||||||
Issued in Reinvestment of Distributions | — | — | — | — | ||||||||
Redeemed | (343,574 | ) | (442,002 | ) | (17,360 | ) | (69,097 | ) | ||||
Net Increase (Decrease) in Shares | (207,098 | ) | 104,218 | (15,981 | ) | (34,720 | ) | |||||
CLASS Z | ||||||||||||
Sold | 3,694,725 | 11,182,299 | 336,892 | 3,193,498 | ||||||||
Issued in Reinvestment of Distributions | — | — | — | — | ||||||||
Redeemed | (10,437,771 | ) | (31,635,485 | ) | (1,124,324 | ) | (5,725,809 | ) | ||||
Net Increase (Decrease) in Shares | (6,743,046 | ) | (20,453,186 | ) | (787,432 | ) | (2,532,311 | ) | ||||
95
NOTES TO FINANCIAL STATEMENTS (continued)
June 30, 2004 (Unaudited)
Strong Advisor Small Cap Value Fund | ||||||||
| Six Months Ended June 30, 2004 | Year Ended Dec. 31, 2003 | |||||||
| (Unaudited) | ||||||||
Capital Share Transactions of Each Class of Shares of the Fund Were as Follows: | ||||||||
CLASS A | ||||||||
Proceeds from Shares Sold | $ | 74,829,422 | $ | 320,685,110 | ||||
Proceeds from Reinvestment of Distributions | 6,570,799 | 15,265,206 | ||||||
Payment for Shares Redeemed | (217,853,363 | ) | (184,534,476 | ) | ||||
Net Increase (Decrease) in Net Assets from Capital Share Transactions | (136,453,142 | ) | 151,415,840 | |||||
CLASS B | ||||||||
Proceeds from Shares Sold | 1,738,164 | 23,520,790 | ||||||
Proceeds from Reinvestment of Distributions | 1,213,568 | 2,765,426 | ||||||
Payment for Shares Redeemed | (8,256,373 | ) | (12,814,273 | ) | ||||
Net Increase (Decrease) in Net Assets from Capital Share Transactions | (5,304,641 | ) | 13,471,943 | |||||
CLASS C | ||||||||
Proceeds from Shares Sold | 3,711,818 | 50,717,429 | ||||||
Proceeds from Reinvestment of Distributions | 1,352,062 | 3,207,242 | ||||||
Payment for Shares Redeemed | (19,612,661 | ) | (42,529,352 | ) | ||||
Net Increase (Decrease) in Net Assets from Capital Share Transactions | (14,548,781 | ) | 11,395,319 | |||||
CLASS Z | ||||||||
Proceeds from Shares Sold | 306,271,817 | 568,392,266 | ||||||
Proceeds from Reinvestment of Distributions | 12,489,901 | 27,317,931 | ||||||
Payment for Shares Redeemed | (339,538,979 | ) | (432,298,660 | ) | ||||
Net Increase (Decrease) in Net Assets from Capital Share Transactions | (20,777,261 | ) | 163,411,537 | |||||
Net Increase (Decrease) in Net Assets from Capital Share Transactions | $ | (177,083,825 | ) | $ | 339,694,639 | |||
96
Strong Advisor Small Cap Value Fund | ||||||
| Six Months Ended June 30, 2004 | Year Ended Dec. 31, 2003 | |||||
| (Unaudited) | ||||||
Transactions in Shares of Each Class of the Fund Were as Follows: | ||||||
CLASS A | ||||||
Sold | 2,657,941 | 14,585,227 | ||||
Issued in Reinvestment of Distributions | 241,751 | 588,254 | ||||
Redeemed | (7,901,315 | ) | (8,277,317 | ) | ||
Net Increase (Decrease) in Shares | (5,001,623 | ) | 6,896,164 | |||
CLASS B | ||||||
Sold | 63,493 | 1,128,906 | ||||
Issued in Reinvestment of Distributions | 45,778 | 108,960 | ||||
Redeemed | (303,509 | ) | (590,325 | ) | ||
Net Increase (Decrease) in Shares | (194,238 | ) | 647,541 | |||
CLASS C | ||||||
Sold | 135,753 | 2,388,522 | ||||
Issued in Reinvestment of Distributions | 50,906 | 126,120 | ||||
Redeemed | (718,038 | ) | (1,842,815 | ) | ||
Net Increase (Decrease) in Shares | (531,379 | ) | 671,827 | |||
CLASS Z | ||||||
Sold | 10,794,698 | 25,560,482 | ||||
Issued in Reinvestment of Distributions | 457,171 | 1,047,467 | ||||
Redeemed | (12,085,262 | ) | (18,917,370 | ) | ||
Net Increase (Decrease) in Shares | (833,393 | ) | 7,690,579 | |||
97
NOTES TO FINANCIAL STATEMENTS (continued)
June 30, 2004 (Unaudited)
| Strong Advisor U.S. Value Fund | ||||||||
| Six Months Ended June 30, 2004 | Year Ended Dec. 31, 2003 | |||||||
| (Unaudited) | ||||||||
Capital Share Transactions of Each Class of Shares of the Fund Were as Follows: | ||||||||
CLASS A | ||||||||
Proceeds from Shares Sold | $ | 483,037 | $ | 2,442,595 | ||||
Proceeds from Reinvestment of Distributions | 14,430 | 33,629 | ||||||
Payment for Shares Redeemed | (1,388,544 | ) | (1,164,555 | ) | ||||
Net Increase (Decrease) in Net Assets from Capital Share Transactions | (891,077 | ) | 1,311,669 | |||||
CLASS B | ||||||||
Proceeds from Shares Sold | 947,974 | 1,532,091 | ||||||
Proceeds from Reinvestment of Distributions | 3,300 | 9,048 | ||||||
Payment for Shares Redeemed | (218,596 | ) | (708,664 | ) | ||||
Net Increase (Decrease) in Net Assets from Capital Share Transactions | 732,678 | 832,475 | ||||||
CLASS C | ||||||||
Proceeds from Shares Sold | 471,314 | 2,936,148 | ||||||
Proceeds from Reinvestment of Distributions | 1,205 | 7,949 | ||||||
Payment for Shares Redeemed | (524,805 | ) | (802,924 | ) | ||||
Net Increase (Decrease) in Net Assets from Capital Share Transactions | (52,286 | ) | 2,141,173 | |||||
CLASS K | ||||||||
Proceeds from Shares Sold | 5,109,520 | 75,594,336 | ||||||
Proceeds from Reinvestment of Distributions | 6,665 | 26,245 | ||||||
Payment for Shares Redeemed | (12,750,607 | ) | (5,956,750 | ) | ||||
Net Increase (Decrease) in Net Assets from Capital Share Transactions | (7,634,422 | ) | 69,663,831 | |||||
CLASS Z | ||||||||
Proceeds from Shares Sold | 110,052,658 | 65,563,705 | ||||||
Proceeds from Reinvestment of Distributions | 649,674 | 421,710 | ||||||
Payment for Shares Redeemed | (36,351,969 | ) | (156,527,039 | ) | ||||
Net Increase (Decrease) in Net Assets from Capital Share Transactions | 74,350,363 | (90,541,624 | ) | |||||
Net Increase (Decrease) in Net Assets from Capital Share Transactions | $ | 66,505,256 | $ | (16,592,476 | ) | |||
98
| Strong Advisor U.S. Value Fund | ||||||
| Six Months Ended June 30, 2004 | Year Ended Dec. 31, 2003 | |||||
| (Unaudited) | ||||||
Transactions in Shares of Each Class of the Fund Were as Follows: | ||||||
CLASS A | ||||||
Sold | 26,861 | 158,971 | ||||
Issued in Reinvestment of Distributions | 800 | 2,133 | ||||
Redeemed | (77,267 | ) | (76,619 | ) | ||
Net Increase (Decrease) in Shares | (49,606 | ) | 84,485 | |||
CLASS B | ||||||
Sold | 52,676 | 101,156 | ||||
Issued in Reinvestment of Distributions | 182 | 558 | ||||
Redeemed | (12,189 | ) | (49,252 | ) | ||
Net Increase (Decrease) in Shares | 40,669 | 52,462 | ||||
CLASS C | ||||||
Sold | 26,359 | 187,092 | ||||
Issued in Reinvestment of Distributions | 66 | 485 | ||||
Redeemed | (29,220 | ) | (51,438 | ) | ||
Net Increase (Decrease) in Shares | (2,795 | ) | 136,139 | |||
CLASS K | ||||||
Sold | 285,371 | 4,541,506 | ||||
Issued in Reinvestment of Distributions | 372 | 1,657 | ||||
Redeemed | (712,464 | ) | (382,792 | ) | ||
Net Increase (Decrease) in Shares | (426,721 | ) | 4,160,371 | |||
CLASS Z | ||||||
Sold | 6,125,805 | 4,464,350 | ||||
Issued in Reinvestment of Distributions | 35,916 | 26,615 | ||||
Redeemed | (1,999,500 | ) | (9,915,698 | ) | ||
Net Increase (Decrease) in Shares | 4,162,221 | (5,424,733 | ) | |||
99
NOTES TO FINANCIAL STATEMENTS (continued)
June 30, 2004 (Unaudited)
Strong Advisor Endeavor Large Cap Fund | Strong Advisor Focus Fund | |||||||||||||||
| Six Months Ended June 30, 2004 | Year Ended Dec. 31, 2003 | Six Months Ended June 30, 2004 | Year Ended Dec. 31, 2003 | |||||||||||||
| (Unaudited) | (Unaudited) | |||||||||||||||
Capital Share Transactions of Each Class of Shares of the Funds Were as Follows: | ||||||||||||||||
CLASS A | ||||||||||||||||
Proceeds from Shares Sold | $ | 9,636,271 | $ | 11,550,715 | $ | 44,453 | $ | 133,502 | ||||||||
Proceeds from Reinvestment of Distributions | — | — | — | — | ||||||||||||
Payment for Shares Redeemed | (8,468,552 | ) | (13,087,873 | ) | (559,606 | ) | (1,033,507 | ) | ||||||||
Net Increase (Decrease) in Net Assets from Capital Share Transactions | 1,167,719 | (1,537,158 | ) | (515,153 | ) | (900,005 | ) | |||||||||
CLASS B | ||||||||||||||||
Proceeds from Shares Sold | 98,424 | 545,692 | 20,301 | 33,725 | ||||||||||||
Proceeds from Reinvestment of Distributions | — | — | — | — | ||||||||||||
Payment for Shares Redeemed | (7,130 | ) | (294,637 | ) | (231,204 | ) | (391,552 | ) | ||||||||
Net Increase (Decrease) in Net Assets from Capital Share Transactions | 91,294 | 251,055 | (210,903 | ) | (357,827 | ) | ||||||||||
CLASS C | ||||||||||||||||
Proceeds from Shares Sold | 70,485 | 236,667 | 964 | 128,342 | ||||||||||||
Proceeds from Reinvestment of Distributions | — | — | — | — | ||||||||||||
Payment for Shares Redeemed | (95,346 | ) | (92,284 | ) | (74,237 | ) | (196,335 | ) | ||||||||
Net Increase (Decrease) in Net Assets from Capital Share Transactions | (24,861 | ) | 144,383 | (73,273 | ) | (67,993 | ) | |||||||||
Net Increase (Decrease) in Net Assets from Capital Share Transactions | $ | 1,234,152 | $ | (1,141,720 | ) | $ | (799,329 | ) | $ | (1,325,825 | ) | |||||
Transactions in Shares of Each Class of the Funds Were as Follows: | ||||||||||||||||
CLASS A | ||||||||||||||||
Sold | 955,672 | 1,382,830 | 6,864 | 26,782 | ||||||||||||
Issued in Reinvestment of Distributions | — | — | — | — | ||||||||||||
Redeemed | (815,989 | ) | (1,497,908 | ) | (89,886 | ) | (189,152 | ) | ||||||||
Net Increase (Decrease) in Shares | 139,683 | (115,078 | ) | (83,022 | ) | (162,370 | ) | |||||||||
CLASS B | ||||||||||||||||
Sold | 9,598 | 66,016 | 3,392 | 6,628 | ||||||||||||
Issued in Reinvestment of Distributions | — | — | — | — | ||||||||||||
Redeemed | (686 | ) | (36,913 | ) | (38,160 | ) | (74,150 | ) | ||||||||
Net Increase (Decrease) in Shares | 8,912 | 29,103 | (34,768 | ) | (67,522 | ) | ||||||||||
CLASS C | ||||||||||||||||
Sold | 6,939 | 27,852 | 160 | 25,997 | ||||||||||||
Issued in Reinvestment of Distributions | — | — | — | — | ||||||||||||
Redeemed | (9,373 | ) | (10,494 | ) | (12,036 | ) | (37,048 | ) | ||||||||
Net Increase (Decrease) in Shares | (2,434 | ) | 17,358 | (11,876 | ) | (11,051 | ) | |||||||||
100
Strong Advisor International Core Fund | Strong Advisor Select Fund | |||||||||||||||
| Six Months Ended June 30, 2004 | Year Ended Dec. 31, 2003 | Six Months Ended June 30, 2004 | Year Ended Dec. 31, 2003 | |||||||||||||
| (Unaudited) | (Unaudited) | |||||||||||||||
Capital Share Transactions of Each Class of Shares of the Funds Were as Follows: | ||||||||||||||||
CLASS A | ||||||||||||||||
Proceeds from Shares Sold | $ | 52,952 | $ | 451,750 | $ | 11,157,071 | $ | 28,987,396 | ||||||||
Proceeds from Reinvestment of Distributions | 696 | 6,485 | — | — | ||||||||||||
Payment for Shares Redeemed | (45,126 | ) | (163,951 | ) | (23,255,843 | ) | (27,068,354 | ) | ||||||||
Net Increase (Decrease) in Net Assets from Capital Share Transactions | 8,522 | 294,284 | (12,098,772 | ) | 1,919,042 | |||||||||||
CLASS B | ||||||||||||||||
Proceeds from Shares Sold | 156,725 | 346,867 | 266,207 | 257,127 | ||||||||||||
Proceeds from Reinvestment of Distributions | 826 | 6,923 | — | — | ||||||||||||
Payment for Shares Redeemed | (30,147 | ) | (65,208 | ) | (22,480 | ) | (103,058 | ) | ||||||||
Net Increase (Decrease) in Net Assets from Capital Share Transactions | 127,404 | 288,582 | 243,727 | 154,069 | ||||||||||||
CLASS C | ||||||||||||||||
Proceeds from Shares Sold | 40,647 | 562,293 | 501,599 | 204,823 | ||||||||||||
Proceeds from Reinvestment of Distributions | 228 | 2,436 | — | — | ||||||||||||
Payment for Shares Redeemed | — | (585,411 | ) | (24,126 | ) | (104,606 | ) | |||||||||
Net Increase (Decrease) in Net Assets from Capital Share Transactions | 40,875 | (20,682 | ) | 477,473 | 100,217 | |||||||||||
Net Increase (Decrease) in Net Assets from Capital Share Transactions | $ | 176,801 | $ | 562,184 | $ | (11,377,572 | ) | $ | 2,173,328 | |||||||
Transactions in Shares of Each Class of the Funds Were as Follows: | ||||||||||||||||
CLASS A | ||||||||||||||||
Sold | 4,468 | 47,151 | 1,269,829 | 4,305,907 | ||||||||||||
Issued in Reinvestment of Distributions | 60 | 570 | — | — | ||||||||||||
Redeemed | (3,845 | ) | (14,929 | ) | (2,673,646 | ) | (3,730,994 | ) | ||||||||
Net Increase (Decrease) in Shares | 683 | 32,792 | (1,403,817 | ) | 574,913 | |||||||||||
CLASS B | ||||||||||||||||
Sold | 13,262 | 36,895 | 31,022 | 37,614 | ||||||||||||
Issued in Reinvestment of Distributions | 72 | 609 | — | — | ||||||||||||
Redeemed | (2,656 | ) | (6,823 | ) | (2,632 | ) | (14,269 | ) | ||||||||
Net Increase (Decrease) in Shares | 10,678 | 30,681 | 28,390 | 23,345 | ||||||||||||
CLASS C | ||||||||||||||||
Sold | 3,443 | 58,481 | 58,866 | 29,859 | ||||||||||||
Issued in Reinvestment of Distributions | 20 | 215 | — | — | ||||||||||||
Redeemed | — | (59,716 | ) | (2,799 | ) | (13,880 | ) | |||||||||
Net Increase (Decrease) in Shares | 3,463 | (1,020 | ) | 56,067 | 15,979 | |||||||||||
101
NOTES TO FINANCIAL STATEMENTS (continued)
June 30, 2004 (Unaudited)
Strong Advisor Technology Fund | Strong Advisor U.S. Small/Mid Cap Growth Fund | |||||||||||||||
| Six Months Ended June 30, 2004 | Year Ended Dec. 31, 2003 | Six Months Ended June 30, 2004 | Year Ended Dec. 31, 2003 | |||||||||||||
| (Unaudited) | (Unaudited) | |||||||||||||||
Capital Share Transactions of Each Class of Shares of the Funds Were as Follows: | ||||||||||||||||
CLASS A | ||||||||||||||||
Proceeds from Shares Sold | $ | 429,034 | $ | 475,649 | $ | 846,538 | $ | 2,506,870 | ||||||||
Proceeds from Reinvestment of Distributions | — | — | — | — | ||||||||||||
Payment for Shares Redeemed | (886,089 | ) | (1,132,211 | ) | (1,184,734 | ) | (182,320 | ) | ||||||||
Net Increase (Decrease) in Net Assets from Capital Share Transactions | (457,055 | ) | (656,562 | ) | (338,196 | ) | 2,324,550 | |||||||||
CLASS B | ||||||||||||||||
Proceeds from Shares Sold | 35,985 | 285,676 | 520,298 | 711,067 | ||||||||||||
Proceeds from Reinvestment of Distributions | — | — | — | — | ||||||||||||
Payment for Shares Redeemed | (19,556 | ) | (18,271 | ) | (50,459 | ) | (132,452 | ) | ||||||||
Net Increase (Decrease) in Net Assets from Capital Share Transactions | 16,429 | 267,405 | 469,839 | 578,615 | ||||||||||||
CLASS C | ||||||||||||||||
Proceeds from Shares Sold | 4,510 | 38,794 | 152,724 | 1,161,876 | ||||||||||||
Proceeds from Reinvestment of Distributions | — | — | — | — | ||||||||||||
Payment for Shares Redeemed | (83,604 | ) | (128,137 | ) | (96,111 | ) | (53,800 | ) | ||||||||
Net Increase (Decrease) in Net Assets from Capital Share Transactions | (79,094 | ) | (89,343 | ) | 56,613 | 1,108,076 | ||||||||||
Net Increase (Decrease) in Net Assets from Capital Share Transactions | $ | (519,720 | ) | $ | (478,500 | ) | $ | 188,256 | $ | 4,011,241 | ||||||
Transactions in Shares of Each Class of the Funds Were as Follows: | ||||||||||||||||
CLASS A | ||||||||||||||||
Sold | 57,767 | 83,030 | 75,175 | 237,549 | ||||||||||||
Issued in Reinvestment of Distributions | — | — | — | — | ||||||||||||
Redeemed | (113,487 | ) | (168,601 | ) | (107,282 | ) | (16,651 | ) | ||||||||
Net Increase (Decrease) in Shares | (55,720 | ) | (85,571 | ) | (32,107 | ) | 220,898 | |||||||||
CLASS B | ||||||||||||||||
Sold | 4,868 | 47,464 | 47,192 | 69,682 | ||||||||||||
Issued in Reinvestment of Distributions | — | — | — | — | ||||||||||||
Redeemed | (2,801 | ) | (2,590 | ) | (4,542 | ) | (11,990 | ) | ||||||||
Net Increase (Decrease) in Shares | 2,067 | 44,874 | 42,650 | 57,692 | ||||||||||||
CLASS C | ||||||||||||||||
Sold | 623 | 5,992 | 13,066 | 114,610 | ||||||||||||
Issued in Reinvestment of Distributions | — | — | — | — | ||||||||||||
Redeemed | (11,389 | ) | (21,193 | ) | (8,539 | ) | (4,922 | ) | ||||||||
Net Increase (Decrease) in Shares | (10,766 | ) | (15,201 | ) | 4,527 | 109,688 | ||||||||||
102
Strong Advisor Utilities and Energy Fund | ||||||||
| Six Months Ended June 30, 2004 | Year Ended Dec. 31, 2003 | |||||||
| (Unaudited) | ||||||||
Capital Share Transactions of Each Class of Shares of the Fund Were as Follows: | ||||||||
CLASS A | ||||||||
Proceeds from Shares Sold | $ | 102,892 | $ | 10,745,467 | ||||
Proceeds from Reinvestment of Distributions | 2,165 | 57,522 | ||||||
Payment for Shares Redeemed | (3,232,296 | ) | (8,634,471 | ) | ||||
Net Increase (Decrease) in Net Assets from Capital Share Transactions | (3,127,239 | ) | 2,168,518 | |||||
CLASS B | ||||||||
Proceeds from Shares Sold | 98,378 | 50,393 | ||||||
Proceeds from Reinvestment of Distributions | 204 | 232 | ||||||
Payment for Shares Redeemed | (2,330 | ) | — | |||||
Net Increase (Decrease) in Net Assets from Capital Share Transactions | 96,252 | 50,625 | ||||||
CLASS C | ||||||||
Proceeds from Shares Sold | 12,152 | 61,694 | ||||||
Proceeds from Reinvestment of Distributions | 239 | 1,418 | ||||||
Payment for Shares Redeemed | (85,522 | ) | (11,717 | ) | ||||
Net Increase (Decrease) in Net Assets from Capital Share Transactions | (73,131 | ) | 51,395 | |||||
Net Increase (Decrease) in Net Assets from Capital Share Transactions | $ | (3,104,118 | ) | $ | 2,270,538 | |||
Transactions in Shares of Each Class of the Fund Were as Follows: | ||||||||
CLASS A | ||||||||
Sold | 9,520 | 1,122,369 | ||||||
Issued in Reinvestment of Distributions | 195 | 5,985 | ||||||
Redeemed | (299,088 | ) | (876,335 | ) | ||||
Net Increase (Decrease) in Shares | (289,373 | ) | 252,019 | |||||
CLASS B | ||||||||
Sold | 8,953 | 5,210 | ||||||
Issued in Reinvestment of Distributions | 19 | 24 | ||||||
Redeemed | (212 | ) | — | |||||
Net Increase (Decrease) in Shares | 8,760 | 5,234 | ||||||
CLASS C | ||||||||
Sold | 1,133 | 6,587 | ||||||
Issued in Reinvestment of Distributions | 21 | 145 | ||||||
Redeemed | (7,747 | ) | (1,155 | ) | ||||
Net Increase (Decrease) in Shares | (6,593 | ) | 5,577 | |||||
103
NOTES TO FINANCIAL STATEMENTS (continued)
June 30, 2004 (Unaudited)
| Strong Advisor Large Company Core Fund | ||||||||
| Six Months Ended June 30, 2004 | Year Ended Dec. 31, 2003 | |||||||
| (Unaudited) | ||||||||
Capital Share Transactions of Each Class of Shares of the Fund Were as Follows: | ||||||||
CLASS A | ||||||||
Proceeds from Shares Sold | $ | 6,461,432 | $ | 59,864,417 | ||||
Proceeds from Reinvestment of Distributions | 1,022,423 | 78,573 | ||||||
Proceeds from Redemption Fees * | 11,754 | — | ||||||
Payment for Shares Redeemed | (14,204,568 | ) | (9,871,639 | ) | ||||
Net Increase (Decrease) in Net Assets from Capital Share Transactions | (6,708,959 | ) | 50,071,351 | |||||
CLASS B | ||||||||
Proceeds from Shares Sold | 1,400,645 | 6,531,413 | ||||||
Proceeds from Reinvestment of Distributions | 108,220 | 5,649 | ||||||
Proceeds from Redemption Fees * | 1,454 | — | ||||||
Payment for Shares Redeemed | (268,238 | ) | (411,263 | ) | ||||
Net Increase (Decrease) in Net Assets from Capital Share Transactions | 1,242,081 | 6,125,799 | ||||||
CLASS C | ||||||||
Proceeds from Shares Sold | 2,714,475 | 5,690,544 | ||||||
Proceeds from Reinvestment of Distributions | 110,458 | 5,296 | ||||||
Proceeds from Redemption Fees * | 1,198 | — | ||||||
Payment for Shares Redeemed | (1,294,356 | ) | (624,699 | ) | ||||
Net Increase (Decrease) in Net Assets from Capital Share Transactions | 1,531,775 | 5,071,141 | ||||||
CLASS K | ||||||||
Proceeds from Shares Sold | 8,053,192 | 33,605,594 | ||||||
Proceeds from Reinvestment of Distributions | 544,060 | 78,412 | ||||||
Proceeds from Redemption Fees * | 6,231 | — | ||||||
Payment for Shares Redeemed | (5,337,836 | ) | (2,948,367 | ) | ||||
Net Increase (Decrease) in Net Assets from Capital Share Transactions | 3,265,647 | 30,735,639 | ||||||
Net Increase (Decrease) in Net Assets from Capital Share Transactions | $ | (669,456 | ) | $ | 92,003,930 | |||
| * | The amount of redemption fees collected for the year ended December 31, 2003 was $12,110 and was paid to the Fund in 2004. |
104
| Strong Advisor Large Company Core Fund | ||||||
| Six Months Ended June 30, 2004 | Year Ended Dec. 31, 2003 | |||||
| (Unaudited) | ||||||
Transactions in Shares of Each Class of the Fund Were as Follows: | ||||||
CLASS A | ||||||
Sold | 590,239 | 6,235,824 | ||||
Issued in Reinvestment of Distributions | 97,933 | 7,791 | ||||
Redeemed | (1,311,161 | ) | (976,959 | ) | ||
Net Increase (Decrease) in Shares | (622,989 | ) | 5,266,656 | |||
CLASS B | ||||||
Sold | 129,436 | 691,767 | ||||
Issued in Reinvestment of Distributions | 10,507 | 549 | ||||
Redeemed | (25,024 | ) | (40,925 | ) | ||
Net Increase (Decrease) in Shares | 114,919 | 651,391 | ||||
CLASS C | ||||||
Sold | 251,329 | 596,467 | ||||
Issued in Reinvestment of Distributions | 10,724 | 512 | ||||
Redeemed | (120,713 | ) | (61,554 | ) | ||
Net Increase (Decrease) in Shares | 141,340 | 535,425 | ||||
CLASS K | ||||||
Sold | 739,391 | 3,545,081 | ||||
Issued in Reinvestment of Distributions | 51,865 | 8,183 | ||||
Redeemed | (487,081 | ) | (302,576 | ) | ||
Net Increase (Decrease) in Shares | 304,175 | 3,250,688 | ||||
105
NOTES TO FINANCIAL STATEMENTS (continued)
June 30, 2004 (Unaudited)
| 9. | Investments in Affiliates |
Affiliated issuers, as defined under the 1940 Act, include any Fund of the Strong Funds and any issuer in which the Fund’s holdings of an issuer represent 5% or more of the outstanding voting securities of the issuer. A summary of transactions in the securities of these issuers during the six months ended June 30, 2004, is as follows:
| Balance of Shares Held Jan. 1, 2004 | Gross Purchases and Additions | Gross Sales and Reductions | Balance of Shares Held June 30, 2004 | Value June 30, 2004 | Investment June 30, 2004 | Realized on Sales | |||||||||||||
Strong Advisor Small Cap Value Fund | |||||||||||||||||||
Allied Healthcare Products, Inc. | 848,200 | 158,420 | (79,780 | ) | 926,840 | $ | 4,643,468 | $ | — | $ | 203,924 | ||||||||
Apex Silver Mines, Ltd. * | 2,115,100 | 440,400 | (221,000 | ) | 2,334,500 | 39,803,225 | — | (331,967 | ) | ||||||||||
Barbeques Galore, Ltd. Sponsored ADR | 434,231 | 700 | (15,000 | ) | 419,931 | 3,632,403 | — | 77,745 | |||||||||||
Calgon Carbon Corporation | 2,584,600 | 106,300 | (69,600 | ) | 2,621,300 | 17,562,710 | 157,512 | (34,696 | ) | ||||||||||
Covenant Transport, Inc. Class A | 783,000 | 110,700 | (6,000 | ) | 887,700 | 15,170,793 | — | 39,394 | |||||||||||
Discovery Partners International, Inc. | 1,503,400 | 404,100 | (34,900 | ) | 1,872,600 | 9,550,260 | — | (72,430 | ) | ||||||||||
Dura Automotive Systems, Inc. * | 1,120,900 | 92,500 | (406,400 | ) | 807,000 | 7,384,050 | — | 1,159,153 | |||||||||||
Encore Wire Corporation * | 1,163,900 | 14,700 | (1,025,400 | ) | 153,200 | 4,223,724 | — | 21,801,894 | |||||||||||
Evans & Sutherland Computer Corporation | 700,200 | 230,543 | — | 930,743 | 4,374,492 | — | — | ||||||||||||
The Geo Group, Inc. (Formerly Wackenhut Corrections Corporation) | 781,910 | 219,100 | (10,800 | ) | 990,210 | 20,200,284 | — | 168,159 | |||||||||||
Intertape Polymer Group, Inc. | 2,426,100 | 214,700 | — | 2,640,800 | 20,096,488 | — | — | ||||||||||||
Kforce.com, Inc. | 1,862,485 | 209,800 | (150,600 | ) | 1,921,685 | 18,140,706 | — | 1,205,243 | |||||||||||
Layne Christensen Company | 1,514,300 | 14,600 | (119,902 | ) | 1,408,998 | 23,318,917 | — | 828,355 | |||||||||||
Lightbridge, Inc. | 1,523,100 | 867,100 | (10,000 | ) | 2,380,200 | 13,329,120 | — | (63,514 | ) | ||||||||||
Matrix Service Company | 841,900 | 699,500 | (5,000 | ) | 1,536,400 | 14,058,060 | — | (33,366 | ) | ||||||||||
McMoRan Exploration Company | 837,500 | 177,800 | (45,000 | ) | 970,300 | 15,117,274 | — | (39,044 | ) | ||||||||||
Petroleum Helicopters, Inc. (non-voting) | 174,260 | 3,912 | — | 178,172 | 3,458,319 | — | — | ||||||||||||
Range Resources Corporation | 4,132,300 | 334,600 | (204,900 | ) | 4,262,000 | 62,225,200 | 83,855 | 260,115 | |||||||||||
Richardson Electronics, Ltd. | 536,700 | 139,100 | (13,100 | ) | 662,700 | 7,342,716 | 49,684 | (14,157 | ) | ||||||||||
Webco Industries, Inc. | 285,460 | 160,800 | — | 446,260 | 1,682,400 | — | — | ||||||||||||
The Wet Seal, Inc. Class A | — | 1,324,020 | (19,600 | ) | 1,304,420 | 6,822,117 | — | (72,727 | ) | ||||||||||
| * | Issuer was not an affiliate as of June 30, 2004. |
| 10. | Legal and Regulatory Matters |
On or about May 20, 2004, the Advisor, the Administrator, and the Distributor (collectively, “Strong”), former chairman Richard S. Strong, and two employees of Strong entered into agreements with the Securities and Exchange Commission (“SEC”), the New York Attorney General (“NYAG”), the State of Wisconsin Department of Justice (the Wisconsin Attorney General), and the Wisconsin Department of Financial Institutions representing a settlement of all the market-timing investigations of Strong and certain affiliates by these agencies. In the settlements, Strong, without admitting or denying the findings in any of the orders, consented to entries of cease and desist orders and injunctive relief relating to breaches of their fiduciary duties and violations of state and federal securities laws, including anti-fraud provisions. The settlements require the Advisor to pay $40 million in investor restoration and $40 million in civil penalties. The settlements require Mr. Strong to pay $30 million in investor restoration and $30 million in civil penalties. The NYAG settlement also requires Strong to reduce fees for all Funds (except money market funds and certain very short-term income funds) by an aggregate of at least $7 million a year for five years. Separately, the Board of Directors of the Strong Funds and the Advisor have agreed that the Advisor may allocate such fee and/or expense reductions in a manner it deems reasonable, provided that (i) each applicable Fund shall participate in such fee reduction, (ii) each Fund that was impacted by market timing related to the settlements shall receive a fee reduction of at least 0.025% each year, (iii) such fee reduction shall be taken after giving effect to all waivers and reimbursements currently in effect, and (iv) fees and expenses shall not subsequently be increased without prior Board approval. Additionally, the settlements require, among other things: 1) retention of an independent consultant to develop a payment plan for the amount of investor restoration; 2) the services of an independent compliance consultant to conduct a periodic review of Strong’s compliance policies and procedures; and 3) enhanced corporate governance policies for the Strong Funds. The NYAG settlement also requires: 1) the retention of a senior officer to assist the Board in monitoring compliance and reviewing fee arrangements; and 2) additional fee disclosure to investors in the Funds. Strong and Mr. Strong, and not the investors in any Strong Fund, will bear all the costs of complying with the settlements, including restoration, civil penalties, and associated legal fees stemming from these regulatory proceedings. Strong has not yet determined if the investor restoration or civil penalties will create any financial benefit to the Strong Funds.
106
Strong has received one or more subpoenas or requests for information from the West Virginia Attorney General and other regulatory agencies requesting documents, if any, related to market timing and late trading practices. Strong is aware of multiple outstanding class and derivative actions (“Actions”) filed since September 4, 2003, against Strong, Strong Funds, Strong Financial Corporation, Strong Investments, Inc., Strong affiliates, and certain of their officers and directors as defendants in certain federal and state courts with respect to factual matters referenced in the NYAG settlement. On February 20, 2004 and June 15, 2004, the United States Judicial Panel for Multi District Litigation (“MDL”) ordered the transfer of all but one of the Actions to the District of Maryland so those cases involving Strong could be coordinated and consolidated into one or two actions covered by a single complaint (“MDL Consolidated Actions”). A single Wisconsin state court Action involving Strong was not removed to the District of Maryland court. The District of Maryland court has since appointed co-chairs/chief administrative counsel for the plaintiffs in the actions involving all of the fund families before it. It has also appointed a lead plaintiff and lead plaintiff’s counsel for the actions involving each individual fund family, including Strong. The Actions generally allege, among other things, that the defendants violated their fiduciary duty to fund shareholders and certain retirement plan participants, and made false and misleading statements in the funds’ prospectuses in violation of federal and state securities laws. The Actions generally seek one or more of the following: compensatory damages, punitive damages, special damages, exemplary damages, rescission, restitution, payment of plaintiffs’ attorneys’ fees and experts’ fees, and/or replacement of the Board of Directors of the Strong Funds. Strong expects that the MDL Consolidated Actions will allege the same types of violations of law and seek the same forms of damages and remedies as did the numerous prior Actions. Certain state Actions will not be consolidated into the MDL Consolidated Actions and proceedings in these state court Actions may be stayed or proceed independently of the MDL Consolidated Actions.
The Strong Funds will not bear any costs incurred in connection with these Actions. Based on currently available information, Strong believes that the Actions will not have a material adverse financial impact on the Strong Funds, and are not likely to materially affect Strong’s ability to provide investment management services to its clients, including the Strong Funds. The Funds may experience increased redemptions or a decrease in new sales of shares as a result of the regulatory settlements and the ongoing Actions, which could result in increased transaction costs and operating expenses, or otherwise negatively impact the Strong Funds.
| 11. | Pending Acquisition |
On May 26, 2004, Strong Financial Corporation (“SFC”) announced that it reached a definitive agreement with Wells Fargo & Company (“Wells Fargo”) to acquire assets of SFC and certain of its affiliates, including the Advisor. As part of the proposed transaction, SFC will be seeking approval from the Board of Directors of the Strong Funds (“Board”) on various matters including appointing Wells Fargo Funds Management, LLC, a wholly owned subsidiary of Wells Fargo, as a new investment advisor for the Strong Funds and a merger of those funds into the Wells Fargo Funds family of mutual funds.
The mergers, which are anticipated to close in the first quarter of 2005, are subject to a number of conditions, including approval by the Board and shareholders of the Strong Funds.
107
Each officer and director holds the same position with the 27 registered open-end management investment companies consisting of 71 mutual funds (“Strong Funds”).
Willie D. Davis (DOB 7-24-34), Director of the Strong Funds since July 1994.
Mr. Davis has been President and Chief Executive Officer of All Pro Broadcasting, Inc., since 1977; Director of Wisconsin Energy Corporation (formerly WICOR, Inc., a utility company) since 1990, Metro-Goldwyn-Mayer, Inc. (an entertainment company) since 1998, Bassett Furniture Industries, Inc. since 1997, Checker’s Drive-In Restaurants, Inc. (formerly Rally’s Hamburgers, Inc.) since 1994, Johnson Controls, Inc. (an automotive systems and facility management company) since 1992, MGM Mirage (formerly MGM Grand, Inc., an entertainment/hotel company) since 1990, Dow Chemical Company since 1988, Sara Lee Corporation (a food/consumer products company) since 1983, Alliance Bank since 1980, Manpower, Inc. (a worldwide provider of staffing services) since 2001, and Kmart Corporation (a discount consumer products company) from 1985 to 2003; and Trustee of the University of Chicago since 1980 and Marquette University since 1988.
Gordon B. Greer (DOB 2-17-32), Director of the Strong Funds since March 2002.
Mr. Greer was Of Counsel for Bingham McCutchen LLP (a law firm previously known as Bingham Dana LLP) from 1997 to February 2002 and Partner of Bingham McCutchen LLP from 1967 to 1997. On behalf of Bingham McCutchen LLP, Mr. Greer provided representation to the disinterested directors of the Strong Funds from 1991 to February 2002. Bingham McCutchen LLP has provided representation to the Independent Directors of the Strong Funds since 1991.
Stanley Kritzik (DOB 1-9-30), Director of the Strong Funds since January 1995 and Chairman of the Audit Committee of the Strong Funds since July 2000.
Mr. Kritzik has been Partner of Metropolitan Associates (a real estate firm) since 1962; Director of Wisconsin Health Information Network since November 1997, Health Network Ventures, Inc. from 1992 to April 2000, and Aurora Health Care from September 1987 to September 2002; and Member of the Board of Governors of Snowmass Village Resort Association from October 1999 to October 2002.
Neal Malicky (DOB 9-14-34), Director of the Strong Funds since December 1999.
Mr. Malicky has been President Emeritus of Baldwin-Wallace College since July 2000; Chancellor of Baldwin-Wallace College from July 1999 to June 2000; President of Baldwin-Wallace College from July 1981 to June 1999; Director of Aspire Learning Corporation since June 2000; Trustee of Southwest Community Health Systems, Cleveland Scholarship Program, and The National Conference for Community and Justice until 2001; President of the National Association of Schools and Colleges of the United Methodist Church, Chairperson of the Association of Independent Colleges and Universities of Ohio, and Secretary of the National Association of Independent Colleges and Universities until 2001.
William F. Vogt (DOB 7-19-47), Director and Chairman of the Independent Directors Committee of the Strong Funds since January 1995.
Mr. Vogt has been Senior Vice President of IDX Systems Corporation (a management consulting firm) since June 2001; President of Vogt Management Consulting, Inc. from July 1990 to June 2001; and former Fellow of the American College of Medical Practice Executives.
108
Ane K. Ohm (DOB 10-16-69), Anti-Money Laundering Compliance Officer of the Strong Funds since November 2002.
Ms. Ohm has been Anti-Money Laundering Compliance Officer of Strong Financial Corporation since February 2003; Assistant Executive Vice President of Strong Financial Corporation since November 2003; Assistant Executive Vice President of Strong Capital Management, Inc. (the “Advisor”) since December 2001; Director of Mutual Fund Administration of Strong Investor Services, Inc. since April 2001; Vice President of Strong Investor Services, Inc. since December 2001; and Marketing Services Manager of Strong Investments, Inc. (the “Distributor”) from November 1998 to April 2001.
Phillip O. Peterson (DOB 12-5-44), Independent President of the Strong Funds since January 2004.
Mr. Peterson was a mutual fund industry consultant from August 1999 to December 2003; Partner of KPMG LLP from 1981 to July 1999; Director of The Hartford Group of Mutual Funds (71 funds) since 2002; and Director of the Fortis Mutual Fund Group (38 funds) from 2000 to 2002.
Richard W. Smirl (DOB 4-18-67), Vice President of the Strong Funds since February 2002 and Secretary of the Strong Funds since November 2001.
Mr. Smirl has been Senior Counsel of Strong Financial Corporation since December 2001; Assistant Secretary of Strong Financial Corporation from December 2001 to February 2003; Secretary of Strong Financial Corporation since February 2003; Assistant Executive Vice President of the Advisor since December 2001; Chief Legal Officer of the Advisor since February 2003; Secretary of the Advisor since November 2002; Assistant Secretary of the Advisor from December 2001 to November 2002; Senior Counsel of the Advisor from July 2000 to December 2001; General Counsel of the Distributor since November 2001; Secretary of the Distributor since July 2000; Vice President and Chief Compliance Officer of the Distributor from July 2000 to December 2003; Lead Counsel of the Distributor from July 2000 to November 2001; Vice President of Strong Investor Services, Inc. since December 2001; Assistant Secretary of Strong Investor Services, Inc. from December 2001 to May 2003; Secretary of Strong Investor Services, Inc. since May 2003; Partner at Keesal, Young & Logan LLP (a law firm) from September 1999 to July 2000; and Associate at Keesal, Young & Logan LLP from September 1992 to September 1999.
Gilbert L. Southwell III (DOB 4-13-54), Assistant Secretary of the Strong Funds since July 2001.
Mr. Southwell has been Associate Counsel of Strong Financial Corporation since December 2001; Assistant Secretary of the Advisor since December 2002; Associate Counsel of the Advisor from April 2001 to December 2001; Partner at Michael, Best & Friedrich, LLP (a law firm) from October 1999 to March 2001; and Assistant General Counsel of U.S. Bank, National Association (formerly Firstar Bank, N.A.) and/or certain of its subsidiaries from November 1984 to September 1999.
John W. Widmer (DOB 1-19-65), Treasurer of the Strong Funds since April 1999.
Mr. Widmer has been Treasurer of the Advisor since April 1999; Assistant Treasurer of Strong Financial Corporation since December 2001; Assistant Secretary of Strong Financial Corporation from December 2001 to January 2003; Treasurer of Strong Service Corporation since April 1999; Treasurer and Assistant Secretary of Strong Investor Services, Inc. since July 2001; and Manager of the Financial Management and Sales Reporting Systems department of the Advisor from May 1997 to April 1999.
Thomas M. Zoeller (DOB 2-21-64), Vice President of the Strong Funds since October 1999.
Mr. Zoeller has been Executive Vice President of the Advisor since April 2001; Chief Financial Officer of the Advisor since February 1998; Secretary of the Advisor from December 2001 to November 2002; Member of the Office of the Chief Executive of Strong Financial Corporation since May 2001; Chief Financial Officer and Treasurer of Strong Investments, Inc. since October 1993; Executive Vice President of Strong Investor Services, Inc. since July 2001; Secretary of Strong Investor Services, Inc. from July 2001 to May 2003; Executive Vice President, Chief Financial Officer, and Secretary of Strong Service Corporation since December 2001; Treasurer of Strong Service Corporation from September 1996 to April 1999; Vice President of Strong Service Corporation from April 1999 to December 2001; Member of the Office of the Chief Executive of the Advisor from November 1998 until May 2001; and Senior Vice President of the Advisor from February 1998 to April 2001.
Except for Messrs. Davis, Kritzik, Malicky, and Vogt, the address of all of the Directors and Officers is P.O. Box 2936, Milwaukee, WI 53201. Mr. Davis’s address is 161 North La Brea, Inglewood, CA 90301. Mr. Kritzik’s address is 1123 North Astor Street, Milwaukee, WI 53202. Mr. Malicky’s address is 4608 Turnberry Drive, Lawrence, KS 66047. Mr. Vogt’s address is P.O. Box 7657, Avon, CO 81620.
The statement of additional information contains additional information about fund directors and officers and is available without charge, upon request, by calling 1-800-368-3863.
109
NOTES
110
Directors
Willie D. Davis
Gordon B. Greer
Stanley Kritzik
Neal Malicky
William F. Vogt
Officers
Phillip O. Peterson, Independent President
Thomas M. Zoeller, Vice President
Richard W. Smirl, Vice President and Secretary
Gilbert L. Southwell III, Assistant Secretary
John W. Widmer, Treasurer
Ane K. Ohm, Anti-Money Laundering Compliance Officer
Investment Advisor
Strong Capital Management, Inc.
P.O. Box 2936, Milwaukee, Wisconsin 53201
Distributor
Strong Investments, Inc.
P.O. Box 2936, Milwaukee, Wisconsin 53201
Custodian
State Street Bank and Trust Company
801 Pennsylvania Avenue, Kansas City, Missouri 64105
Transfer Agent and Dividend-Disbursing Agent
Strong Investor Services, Inc.
P.O. Box 2936, Milwaukee, Wisconsin 53201
Independent Accountants
PricewaterhouseCoopers LLP
100 East Wisconsin Avenue, Milwaukee, Wisconsin 53202
Legal Counsel
Godfrey & Kahn, S.C.
780 North Water Street, Milwaukee, Wisconsin 53202
Strong Investments
P.O. Box 2936 | Milwaukee, WI 53201
To learn more about our funds, discuss an existing
account, or conduct a transaction, call 1-800-368-3863
or visit www.Strong.com.
Please carefully consider a fund’s investment objectives,
risks, charges, and expenses before investing. For this
and other information, call us or visit our web site for
a free prospectus. Please read it carefully before you
invest or send money.
To receive a free copy of the policies and procedures
the funds use to determine how to vote proxies relating
to portfolio securities, or to receive a free copy of a fund’s
proxy voting record for the most recent 12-month period
ending on June 30, call 1-800-368-3863, or visit the
Securities and Exchange Commission’s web site
at www.sec.gov.
If you are a Financial Professional, call 1-800-368-1683.
This report does not constitute an offer for the sale of securities. Strong Funds are offered for sale by prospectus only. Securities are offered through Strong Investments, Inc. RT45334 08-04
SADVEQY/WH2006 06-04
Item 1. Reports to Shareholders
Semiannual Report | June 30, 2004
Strong
Growth
Funds

| Strong Blue Chip Fund | ||
| Strong Discovery Fund | ||
| Strong Endeavor Fund | ||
Strong Large Cap Growth Fund | ||
Strong U.S. Emerging Growth Fund | ||
Strong Enterprise Fund | ||
Strong Growth 20 Fund | ||
Strong Growth Fund | ||
Strong Large Company Growth Fund |

| SEMIANNUAL REPORT | June 30, 2004 |
Strong
Growth
Funds
Investment Reviews | ||
| 2 | ||
| 4 | ||
| 6 | ||
| 8 | ||
| 10 | ||
| 12 | ||
| 14 | ||
| 16 | ||
| 18 | ||
Financial Information | ||
Schedules of Investments in Securities | ||
| 20 | ||
| 20 | ||
| 22 | ||
| 23 | ||
| 25 | ||
| 27 | ||
| 28 | ||
| 29 | ||
| 31 | ||
| 34 | ||
| 41 | ||
| 44 | ||
| 47 | ||
| 56 | ||
| 71 | ||
Market Update From Dick Weiss January 1, 2004, to June 30, 2004 | ||
 | ||
Uncertainty is the Enemy
In our last report back in January, the overall U.S. economy displayed definite signs of strengthening — job growth was gaining momentum, and consumer confidence was on the rise. There was some muffled muttering about deflation, but it lacked enough conviction to cause alarm. All in all, it looked like a relatively promising picture.
Six months out, things seem not quite so sanguine. Fears of inflation have replaced the whispers of deflation, and the Federal Reserve has begun what doubtless will be a series of rate hikes well into 2005. While the overall economy has exceeded expectations, the good news on that front has not been sufficient to overshadow a host of uncertainties in the military and political worlds.
Before we address those uncertainties, let’s devote a moment to the topic of inflation. In the history of markets, there seems to be a point at which a rising rate of inflation causes the market’s price-to-earnings ratios to contract. Historically, that point would be around seven percent. While it seems highly unlikely that the inflation rate is going to get anywhere near that mark in the foreseeable future, there is some suggestion that nowadays, because of the way the Consumer Price Index is calculated, that number could be closer to five percent. If that is indeed a more realistic calculation, it’s possible that we could hit five percent inflation and a negative impact on stock valuations.
In my estimation though, the prospect for serious inflation pales in comparison to other uncertainties currently plaguing the market (e.g., the outcome of the U.S. presidential race this fall and the continuing political fallout surrounding Iraq).
With regard to the War on Terrorism and the issue of Iraq, investors are faced every day with news that can give them pause. While the war seems to be on track, the outcome in Iraq is dependent on how rapidly that nation can defeat the insurgents and restore the rule of law now that the Iraqis themselves have taken charge. We believe that expectations may be too low in that regard.
On the political front, the market seemed to peak around the moment when Democratic candidate Senator John Kerry pulled even with President George W. Bush in the polls. Nothing makes the prospects for economic prosperity harder to decipher than a presidential race featuring two candidates with widely differing views on virtually every issue domestically and internationally. For the stock market, that spells uncertainty with a capital U.
We believe stock valuations today are neither cheap, nor particularly overvalued based upon earnings projections for 2005. They are, rather, sort of stuck somewhere in the middle. In order for stocks to start moving in a positive direction, the market needs an injection of confidence. So the relevant question becomes, in short: What needs to happen in order to inspire that sense of confidence?
The answer? In a word — clarity.
On the inflation front, we anticipate clarity will not come for some time. We expect the Federal Reserve will continue to raise rates until it gets ahead of the inflation curve. It’s unclear just how many hikes and of what magnitude will accomplish that. Nonetheless, if inflationary fears were the single biggest element of uncertainty out there today, we would feel confident that the problem could be contained.
The fate of Iraq and the outcome of the presidential election loom larger and seem far more complicated. If the public perceives that progress is being made in Iraq and democracy will indeed triumph, the market will likely anticipate the reelection of President Bush. If the daily diagnosis on Iraq is less favorable, the political uncertainty weighing on the market will continue for the next several months.
Notwithstanding all the ambiguity, we are beginning to see corners of the market where good values are emerging. Energy has been one of the more promising areas and should continue to benefit from strong fundamentals. Even in the areas of the technology sector, where we believe stocks have been chronically overvalued, values have begun to return to earth. There are even some computer software companies that look attractive to us.
In order for stocks to start moving in a positive direction, the market needs an injection of confidence.
In stock-picker parlance, what we have today is a market of individual stocks rather than — as we saw in 2003 — a rising stock market. In the former, money is a lot harder to make; in the latter, the rising tide seems to lift all issues almost indiscriminately.
We believe the market should continue this year’s trend, which is a much more value- and fundamentals-oriented market. Make no mistake: this is not a “story” market where people dream about distant possibilities and, on the strength of those illusions, stocks soar to 100 times earnings. This is a market where, if you do your homework and stick to what is real rather than imagined, we think you can discover common stocks worth owning.
Given all the uncertainty that exists in the world, there are practical limits to just how high the market can go. But with an economy that continues to show strength and interest rates still on the low side, there are also practical limits to how low the market can go. That environment should favor professional investors who exhibit good discipline in both their buy and sell decisions.
One final piece of practical advice: when uncertainty is the order of the day, resist doing anything dramatic with your money. Sometimes the “muddle-through” approach proves best.
... if you do your homework and stick to what is real rather than imagined, we think you can uncover common stocks worth owning.

Richard T. Weiss |
Vice Chairman |
Strong Financial Corporation |
After a strong 2003, equity markets cooled somewhat in the first half of 2004, though economic growth continued. Against this backdrop, the Strong Blue Chip Fund posted a return of 3.96% for the six months ended June 30, 2004. This placed it slightly ahead of its broad-based benchmark, the S&P 500 Index, which returned 3.44% for the same period.
Stocks moved in a narrow range
While equity markets have at times been volatile during the first half of 2004, for the most part the S&P 500 has been caught in a trading range, with stocks fluctuating within a relatively narrow band. While it is not unusual for stocks to take a breather following the type of large gains they saw last year, other factors have played a role in muting equity returns. These factors included the continuing situation in Iraq, impending Federal Reserve interest-rate hikes, high energy prices, and worries about the impact of slowing Chinese growth on the Asian regional and global economies.
April was a particularly challenging month for the markets and the Fund. At that point, a sharp improvement in employment data sparked fears that the economic recovery would spark a new round of inflation and lead to substantially higher interest rates. These concerns were aggravated by the fact that it was not clear when, and to what extent, the Federal Reserve might raise rates. This turn in market sentiment was exaggerated, in our view, driven more by emotion than by any true need for concern. Because the Fund had significant positions in stocks most likely to be negatively affected by such concerns, our performance suffered during this time.
Investor sentiment began to improve somewhat near the end of May, as the market once again focused its attention on the good news regarding strong corporate profits and new job creation. Equities in the portfolio that had been hurt by investors’ concerns in April had largely stabilized and recovered by the end of the period.
Stocks that helped performance
Two of the Fund’s stronger performers came from the Internet sector: Yahoo! and eBay. Yahoo! benefited from continued gains in market share for its Internet search feature, as well as growth in its online advertising. eBay benefited from good growth in its core business, online auction listings. Although they have already performed quite well, we believed the strong fundamentals of these companies justified continuing to own them in the Fund.
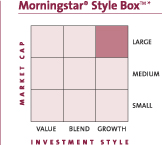
Holdings in the energy sector also made a positive contribution to the Fund’s performance. Within this arena, we made our largest investments in large, integrated oil companies, which benefited from higher demand for oil, strong margins on refining operations, and low debt levels that helped to mute the impact of rising interest rates. In our assessment, these companies remain reasonably priced. Many projections of their earnings — and thus estimates of appropriate valuations — are based on an assumption that oil prices may decline significantly in coming months; we are not convinced that prices will in fact drop soon. Should they stay at more elevated levels, these companies’ earnings could rise further. We are confident that even at these higher levels, oil prices are not so high as to put a severe crimp in economic growth. Energy consumption per unit of Gross Domestic Product (GDP) is dramatically lower than it was in the 1970s, indicating a level of efficiency that allows the economy to absorb higher prices.
Our investment outlook
We anticipate that investor sentiment should continue to improve in coming months, in keeping with the generally positive economic environment we see. GDP has been growing steadily for ten consecutive quarters, and we believe there is plenty of reason to expect the recovery to be sustained for some time to come. Corporate earnings are also strong. Including the fourth quarter of 2003, the S&P 500 companies have experienced two consecutive quarters of year-over-year earnings growth well in excess of 20%, with another similar gain expected for the second quarter of 2004.
We anticipate that the positive data surrounding corporate profits, job creation, and economic activity should in time be sufficient to help the equity markets break out of their trading range.
Thank you for your investment in the Strong Blue Chip Fund.
| Karen E. McGrath |
| Portfolio Manager |
2
Fund Highlights
Average Annual Total Returns
As of 6-30-04
Investor Class | |||
1-year | 22.07 | % | |
5-year | –6.87 | % | |
Since Fund Inception (6-30-97) | 3.06 | % |
Performance is historical and does not guarantee future results. Investment returns and principal value will fluctuate, and you may have a gain or loss when you sell shares. Current performance may be lower or higher than the quoted performance. Call us or visit www.Strong.com for the most recent month-end performance.
Risks: Stock funds should only be considered for long-term goals as values fluctuate in response to the activities of individual companies and general market and economic conditions.
Growth of an Assumed $10,000 Investment†
from 6-30-97 to 6-30-04
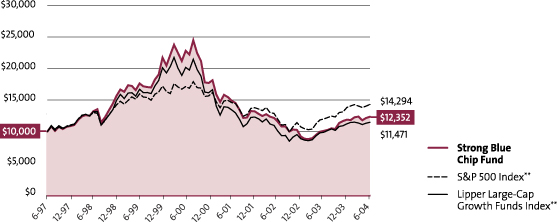
Mention of specific securities in this report is not indicative of whether the Fund may make additional purchases of, sell all or a portion of, or continue to hold those securities.
| * | The Morningstar Style Box™ reveals a fund’s investment strategy. For equity funds, the vertical axis shows the market capitalization of the stocks owned and the horizontal axis shows investment style (value, blend, or growth). |
| † | This graph, provided in accordance with SEC regulations, compares a $10,000 investment in the Fund, made at its inception, with the performance of the S&P 500 Index and the Lipper Large-Cap Growth Funds Index. Results include the reinvestment of all dividends and capital gains distributions. The graph and the Average Annual Total Returns table do not reflect the deduction of taxes, if any, that a shareholder would pay on Fund distributions or the redemption of Fund shares. |
Fee Waivers: From time to time, the Fund’s advisor and/or administrator has waived fees and/or absorbed Fund expenses, which has resulted in higher returns. As of 6-30-04, there are waivers and/or absorptions in effect.
Percentage Restrictions: The Fund’s prospectus and statement of additional information may describe restrictions on the percentage of a particular type or quality of security in which the Fund may invest (“Percentage Restrictions”). Percentage Restrictions apply at the time the Fund purchases a security. Circumstances subsequent to the purchase of the security, such as a change in: (1) the Fund’s assets (e.g., due to cash inflows and redemptions); (2) the market value of the security; or (3) the pricing, liquidity, or rating of the security, may cause the Fund to exceed or fall short of the Percentage Restriction. If this happens, the Fund’s continued holding of the security will not constitute a violation of the Percentage Restriction.
Definitions: **The S&P 500 Index consists of 500 stocks chosen for market size, liquidity, and industry group representation. It is a market value weighted index (stock price times number of shares outstanding), with each stock’s weight in the Index proportionate to its market value. The Lipper Large-Cap Growth Funds Index is the average of the 30 largest funds in the Lipper Large-Cap Growth Funds Category. Source of the S&P Index data is Standard & Poor’s Micropal. Source of the Lipper Index data is Lipper.
It is not possible to invest directly in an index.
3
During the first half of 2004, the Strong Discovery Fund gained 5.47%. This return fell short of the Fund’s broad-based benchmark, the Russell 2000 Index, which rose 6.76% during the same time frame.
The underperformance can be partly attributed to disappointing results from Select Medical Corporation, a health-care equipment company. The stock fell after the government proposed some changes to how health-care providers would be reimbursed for Medicare claims. In response to the decline, we sold our position in Select Medical during the period — though, unfortunately, not soon enough to avoid a negative impact on the portfolio. A tendency of growth investments to lag their value counterparts during the past six months also hurt relative performance. These negative influences were counterbalanced by positive performance from the Fund’s consumer discretionary and telecommunications holdings.
Concern about interest rates and inflation
Continued growth in corporate profits and operating margins helped support further increases in stock prices during the first six months of 2004, although these gains were much less robust than those realized in 2003. As the stock recovery continued to take hold, investors began to look ahead to the potential for higher interest rates, more inflation, and continued high energy prices — all factors that could limit equity returns in the future. Interest rates were a particular concern; the threat of further rate hikes from the Federal Reserve Board kept a ceiling on corporate valuations, even as the companies reported solid first-quarter profits.
Supporting our investment thesis
Our approach to portfolio management relies on the careful selection of individual securities through collaborative research. We strive to “surround” each company that we consider for investment. In other words, our team of portfolio managers and analysts interviews not only the companies’ management, but also their competitors, suppliers, and customers. We want to acquire unique insights to support — or reject, in the cases of companies that fail to meet our strict requirements — our investment thesis for each individual stock.
Applying this research approach, the Fund held a position in PETsMART, the country’s largest retailer of pet supplies and services. We believed that PETsMART, with more than 650 stores in 59 of the nation’s top 60 markets and with new sales initiatives underway, would continue to produce strong revenue growth. We were attracted to PETsMART’s strategy to further expand revenue by offering grooming, training, and veterinary services at more of its retail locations. These services are highly profitable for the company and have been increasing revenues at an annual pace of 25%. Furthermore, these services have been well received by customers and have helped generate more store visits. Thanks in part to PETsMART’s impressive revenue growth during the period, the company’s stock contributed positively to the Fund’s performance.
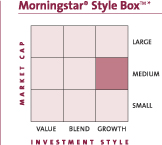
Another important holding for the Fund was Crown Castle International, which owns and leases towers and transmission networks for wireless communications systems. Our industry research revealed that wireless carriers have two top priorities: 1) improving the voice quality on their communications networks; and 2) rolling out next-generation networks to enable subscribers to access online services at high speeds. Competition between carriers has become increasingly fierce, however, and as the companies acquire ever more customers, they must continue to upgrade and expand their networks to meet the increased demand. We believed that Crown Castle was in a strong position to capitalize on these trends. As the nation’s second largest wireless tower operator, the company has a presence in nearly three-quarters of the 100 largest markets in the United States. During the period, Crown Castle’s strong competitive position led to impressive growth in the company’s free-cash flow (cash flow after expenses).
A market shift ahead?
Although corporate earnings and profitability are expected to continue to rise, we believe that stock valuations are already reflecting these likely trends. Thus, we are looking for gains from this point to be produced by a select group of high-quality stocks with predictable earnings. Against this backdrop, we plan to focus on companies with promising opportunities to reinvest in their core business to generate stable revenue and profit growth, and the ability to keep prices high in a competitive business environment. We believe the Fund is well positioned for an environment that rewards quality, as the Fund generally invests in high-quality, small- and mid-cap names.
Thank you for your investment in the Strong Discovery Fund. We appreciate the trust you have placed in our team.
| Thomas J. Pence | James M. Leach | |
Portfolio Co-Manager | Portfolio Co-Manager |
4
Fund Highlights
Average Annual Total Returns
As of 6-30-04
Investor Class | |||
1-year | 29.56 | % | |
5-year | 9.00 | % | |
10-year | 9.65 | % | |
Since Fund Inception (12-31-87) | 12.53 | % |
Performance is historical and does not guarantee future results. Investment returns and principal value will fluctuate, and you may have a gain or loss when you sell shares. Current performance may be lower or higher than the quoted performance. Call us or visit www.Strong.com for the most recent month-end performance.
Risks: Stock funds should only be considered for long-term goals as values fluctuate in response to the activities of individual companies and general market and economic conditions.
Because smaller companies often have narrower markets and limited financial resources, investments in these stocks present more risk than investments in those of larger, more established companies.
Growth of an Assumed $10,000 Investment†
from 12-31-87 to 6-30-04
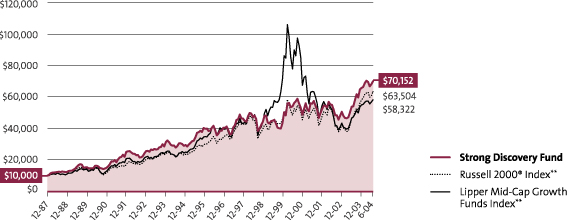
Mention of specific securities in this report is not indicative of whether the Fund may make additional purchases of, sell all or a portion of, or continue to hold those securities.
| * | The Morningstar Style Box™ reveals a fund’s investment strategy. For equity funds, the vertical axis shows the market capitalization of the stocks owned and the horizontal axis shows investment style (value, blend, or growth). |
| † | This graph, provided in accordance with SEC regulations, compares a $10,000 investment in the Fund, made at its inception, with the performance of the Russell 2000® Index and the Lipper Mid-Cap Growth Funds Index. Results include the reinvestment of all dividends and capital gains distributions. The graph and the Average Annual Total Returns table do not reflect the deduction of taxes, if any, that a shareholder would pay on Fund distributions or the redemption of Fund shares. |
Fee Waivers: From time to time, the Fund’s advisor and/or administrator has waived fees and/or absorbed Fund expenses, which has resulted in higher returns. As of 6-30-04, there are waivers and/or absorptions in effect.
Percentage Restrictions: The Fund’s prospectus and statement of additional information may describe restrictions on the percentage of a particular type or quality of security in which the Fund may invest (“Percentage Restrictions”). Percentage Restrictions apply at the time the Fund purchases a security. Circumstances subsequent to the purchase of the security, such as a change in: (1) the Fund’s assets (e.g., due to cash inflows and redemptions); (2) the market value of the security; or (3) the pricing, liquidity, or rating of the security, may cause the Fund to exceed or fall short of the Percentage Restriction. If this happens, the Fund’s continued holding of the security will not constitute a violation of the Percentage Restriction.
Definitions: **The Russell 2000® Index measures the performance of the 2,000 smallest companies in the Russell 3000® Index, which represents approximately 8% of the total market capitalization of the Russell 3000® Index. The Lipper Mid-Cap Growth Funds Index is the average of the 30 largest funds in the Lipper Mid-Cap Growth Funds Category. Source of the Russell Index data is Standard & Poor’s Micropal. Source of the Lipper Index data is Lipper. It is not possible to invest directly in an index.
5
During the first half of 2004, the Strong Endeavor Fund gained 4.72%, outpacing its broad-based benchmark, the S&P 500 Index, which rose 3.44%. During the year, the Endeavor Fund was positioned in companies that were poised to deliver strong profit growth relative to the broad market. Specifically, the Fund’s strong returns were driven by holdings in the industrial, health care, and information technology sectors.
“Surrounding” our investments
Our approach to portfolio management relies on the careful selection of individual securities through collaborative research. We strive to “surround” each company that we consider for investment. In other words, our team of portfolio managers and analysts interviews not only the company’s management, but also its competitors, suppliers, and customers. We want to acquire unique insights to support — or reject, in the cases of companies that do not meet our strict requirements — our investment thesis for each individual stock.
Our investment process also emphasizes financial analysis, including a careful review of corporate income statements as well as the assets on corporate balance sheets. We believe that a company’s balance sheet provides the best way to forecast that business’s future results. We are especially interested in determining the sources of revenue and earnings. We also pay close attention to cash flow and how much investment will be required to generate future cash flow and earnings growth.
Opportunities in Teva and Tyco
Applying our approach, we reviewed a number of potential investment opportunities in the health care sector during the period. As our research progressed, we became concerned about the lack of new products forthcoming by many large-cap pharmaceutical companies, as well as the considerable number of drugs due to lose their patent protection in the near future. Accordingly, we maintained little exposure to these “name-brand” pharmaceutical businesses. Instead we built a position in Teva Pharmaceutical, the world’s leading developer and manufacturer of generic drugs as well as a supplier of a growing line of branded drugs.
We believed Teva had an outstanding competitive position, as the company dominated the generic drug market in the United States. In addition, Teva’s management team has shown a consistent ability to execute its business strategy, made evident by the company’s track record of stable and diversified earnings. Furthermore, Teva has an impressive pipeline of upcoming products, with over 80 applications for new drugs pending regulatory approval in the U.S. alone. The company also has shown success with its branded drug offerings, such as Copaxone, well on its way to becoming the leading treatment for multiple sclerosis in the United States. Thanks to these strong business trends, Teva has been able to produce solid revenue and earnings growth, and the stock was a significant contributor to the Fund’s performance during the past six months.
We used a similarly careful analysis to increase our position in Tyco International, a company recently beset by a number of questions about its accounting and corporate governance practices. We started evaluating Tyco after the company installed a new senior management team. Soon, we began to see evidence of a significant cultural and financial transformation. Thanks to its new leadership, Tyco has moved from a struggling organization into a company that is increasingly recognized for its impressive cash-flow-generation potential. We grew confident in Tyco’s ability to generate growth through its market-leading positions in health care, fire and security products, and electronics. During the past six months, our position in this stock provided a strong contribution to the Fund’s returns.
Market shift ahead?
We are looking for the second half of 2004 to be a more challenging environment for the market than the first half was. As corporate profits continue to grow, the rate of growth will eventually slow down as companies find it more difficult to surpass prior results. Also, the expectation for further increases in interest rates will place a cap on equity valuations — leaving only limited additional upside potential, in our view. In this environment, we expect the market to begin to reward higher-quality companies with highly predictable earnings and recurring revenues.
Thank you for your investment in the Strong Endeavor Fund. We sincerely appreciate the trust you have placed in us.
Thomas J. Pence
Portfolio Manager
6
Fund Highlights
Average Annual Total Returns
As of 6-30-04
Investor Class | |||
1-year | 22.00 | % | |
Since Fund Inception (4-6-01) | –0.75 | % |
Performance is historical and does not guarantee future results. Investment returns and principal value will fluctuate, and you may have a gain or loss when you sell shares. Current performance may be lower or higher than the quoted performance. Call us or visit www.Strong.com for the most recent month-end performance.
Risks: Stock funds should only be considered for long-term goals as values fluctuate in response to the activities of individual companies and general market and economic conditions.
Growth of an Assumed $10,000 Investment†
from 4-6-01 to 6-30-04
Mention of specific securities in this report is not indicative of whether the Fund may make additional purchases of, sell all or a portion of, or continue to hold those securities.
| * | The Morningstar Style BoxTM reveals a fund’s investment strategy. For equity funds, the vertical axis shows the market capitalization of the stocks owned and the horizontal axis shows investment style (value, blend, or growth). |
| † | This graph, provided in accordance with SEC regulations, compares a $10,000 investment in the Fund, made at its inception, with a similar investment in the S&P 500 Index and the Lipper Large-Cap Growth Funds Index. Results include the reinvestment of all dividends and capital gains distributions. The graph and the Average Annual Total Returns table do not reflect the deduction of taxes, if any, that a shareholder would pay on Fund distributions or the redemption of Fund shares. To equalize time periods, the indices’ performances were prorated for the month of April 2001. |
Fee Waivers: From time to time, the Fund’s advisor and/or administrator has waived fees and/or absorbed Fund expenses, which has resulted in higher returns. As of 6-30-04, there are waivers and/or absorptions in effect.
Percentage Restrictions: The Fund’s prospectus and statement of additional information may describe restrictions on the percentage of a particular type or quality of security in which the Fund may invest (“Percentage Restrictions”). Percentage Restrictions apply at the time the Fund purchases a security. Circumstances subsequent to the purchase of the security, such as a change in: (1) the Fund’s assets (e.g., due to cash inflows and redemptions); (2) the market value of the security; or (3) the pricing, liquidity, or rating of the security, may cause the Fund to exceed or fall short of the Percentage Restriction. If this happens, the Fund’s continued holding of the security will not constitute a violation of the Percentage Restriction.
Definitions: **The S&P 500 Index consists of 500 stocks chosen for market size, liquidity, and industry group representation. It is a market value weighted index (stock price times number of shares outstanding), with each stock’s weight in the Index proportionate to its market value. The Lipper Large-Cap Growth Funds Index is the average of the 30 largest funds in the Lipper Large-Cap Growth Funds Category. Source of the S&P Index data is Standard & Poor’s Micropal. Source of the Lipper Index data is Lipper.
It is not possible to invest directly in an index.
7
The first half of 2004 ended on a positive note for investors in the Strong Large Cap Growth Fund. The Fund performed in line with its broad-based benchmark, the S&P 500 Index. For the six months ended June 30, 2004, the Fund posted a return of 3.34%, while the Index returned 3.44%.
Gains were moderate
Larger cap stocks traded in a narrow range over the past six months as the market digested its healthy gains from 2003. Concerns about higher interest rates, rising energy prices, and the Iraqi conflict have kept a lid on stock returns this year, despite the positive backdrop of rising corporate profits and the continued strength of the U.S. economy.
Large-capitalization growth stocks, which have lagged other segments of the market for the past few years, started to show some relative performance improvement versus smaller and more value-oriented stocks in the last few months of the period, though smaller stocks still outperformed for the period overall.
Investment criteria focus on fundamentals
Our investment philosophy in managing the Fund is to focus on large-capitalization growth companies that are dominant or gaining share in their respective industries, are in a sector where business conditions are strong, and have the management talent to sustain their earnings growth for the foreseeable future. We research these companies through traditional fundamental analysis of corporate financial statements and industry statistics, as well as with face-to-face meetings with management. On a similar note, decisions to sell a stock are usually based on indications of deteriorating business fundamentals, changes in management, or both.
We believe dynamic and visionary CEOs are critical to the success of large companies. Without them, it is too easy for bureaucracy and the “law of large numbers” to create significant growth barriers for organizations as they can be hampered by their sheer size. We also try to invest in those areas of the economy that have the benefit of broad, secular tailwinds that can help companies to grow their earnings at faster rates than the overall economy. Four companies from very different industries — Internet leader Yahoo!, retailer Target, consumer products giant Procter and Gamble, and orthopedic products maker Zimmer Holdings — all exemplify the attributes that we seek. These dominant, well-managed growth companies were among the Fund’s stronger-performing stocks for the first half of 2004.
A positive economic backdrop
We anticipate that, in the coming months, the U. S. economy will be able to maintain its ocean liner-like momentum. Although interest rates and inflation are rising, they should remain moderately low by historical standards. We also believe employment figures should continue to improve, as companies gain further confidence in the sustainability of the current economic expansion and add more workers to their payrolls.
Against that backdrop, we would expect that stock performance should be in line with earnings-growth rates. We continue to favor those companies that can benefit most from economic expansion, particularly those in the technology, industrial, and consumer discretionary sectors. We also have a modest emphasis on energy-related companies that we believe can show strong earnings growth due to higher oil and gas prices.
As always, we will continue to stay true to our investment process and discipline. Thank you for the trust and confidence you have placed in the Strong Large Cap Growth Fund.
Bruce C. Olson
Portfolio Manager
8
Fund Highlights
Average Annual Total Returns
As of 6-30-04
Investor Class | |||
1-year | 15.35 | % | |
5-year | –5.73 | % | |
10-year | 7.82 | % | |
Since Fund Inception (12-30-81) | 11.71 | % |
Performance is historical and does not guarantee future results. Investment returns and principal value will fluctuate, and you may have a gain or loss when you sell shares. Current performance may be lower or higher than the quoted performance. Call us or visit www.Strong.com for the most recent month-end performance.
Risks: Stock funds should only be considered for long-term goals as values fluctuate in response to the activities of individual companies and general market and economic conditions.
Growth of an Assumed $10,000 Investment†
from 12-30-81 to 6-30-04
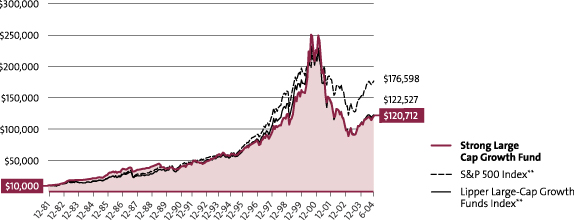
Mention of specific securities in this report is not indicative of whether the Fund may make additional purchases of, sell all or a portion of, or continue to hold those securities.
| * | The Morningstar Style BoxTM reveals a fund’s investment strategy. For equity funds, the vertical axis shows the market capitalization of the stocks owned and the horizontal axis shows investment style (value, blend, or growth). |
| † | This graph, provided in accordance with SEC regulations, compares a $10,000 investment in the Fund, made at its inception, with the performance of the S&P 500 Index and the Lipper Large-Cap Growth Funds Index. Results include the reinvestment of all dividends and capital gains distributions. The graph and the Average Annual Total Returns table do not reflect the deduction of taxes, if any, that a shareholder would pay on Fund distributions or the redemption of Fund shares. |
Fee Waivers: From time to time, the Fund’s advisor and/or administrator has waived fees and/or absorbed Fund expenses, which has resulted in higher returns. As of 6-30-04, there are waivers and/or absorptions in effect.
Percentage Restrictions: The Fund’s prospectus and statement of additional information may describe restrictions on the percentage of a particular type or quality of security in which the Fund may invest (“Percentage Restrictions”). Percentage Restrictions apply at the time the Fund purchases a security. Circumstances subsequent to the purchase of the security, such as a change in: (1) the Fund’s assets (e.g., due to cash inflows and redemptions); (2) the market value of the security; or (3) the pricing, liquidity, or rating of the security, may cause the Fund to exceed or fall short of the Percentage Restriction. If this happens, the Fund’s continued holding of the security will not constitute a violation of the Percentage Restriction.
Definitions: **The S&P 500 Index consists of 500 stocks chosen for market size, liquidity, and industry group representation. It is a market value weighted index (stock price times number of shares outstanding), with each stock’s weight in the Index proportionate to its market value. The Lipper Large-Cap Growth Funds Index is the average of the 30 largest funds in the Lipper Large-Cap Growth Funds Category. Source of the S&P Index data is Standard & Poor’s Micropal. Source of the Lipper Index data is Lipper.
It is not possible to invest directly in an index.
9
Strong U.S. Emerging Growth Fund
After a very strong year for the Fund in 2003, the first half of 2004 was more difficult. For the six months ended June 30, 2004, the Strong U.S. Emerging Growth Fund returned 1.01%, placing it behind its broad-based benchmark, the Russell 2000 Index, which returned 6.76% for the same period. The Fund’s underperformance occurred primarily in the year’s first quarter. During the second quarter, the Fund’s performance was more closely in line with the benchmark’s.
Factors in our performance
There were two primary factors driving the Fund’s under-performance. The first reason was tied to the overall state of the economy. There was a general contraction of stock valuations that took place in January and February, as weak economic data caused many investors to question the strength of the recovery and thus, to lose some confidence in stocks’ growth prospects. Then, in the second quarter, the economy began to pick up steam. In response, the Federal Reserve signaled that it was ready to raise short-term interest rates to help keep the economy from overheating and to help keep inflation in check. Higher interest rates have traditionally hurt the fastest-growing companies — the type we favor for this portfolio — the most.
The other reason for the Fund’s underperformance was a result of certain stock selections we made with respect to our investment in the hospice services area, which accounted for two of our largest positions. One company that provided tremendous returns last year, Odyssey HealthCare, unexpectedly lowered its guidance on its fourth-quarter earnings. This event hurt not only this company’s stock price, but also those of other companies in the industry. The cost to our overall returns was almost two full percentage points. We have subsequently sold both of our holdings in this area, as the outlook remains uncertain.
On a broader note, the highest-growth areas of the market, such as technology, significantly underperformed more defensive sectors, such as energy. On the whole, value style stocks outperformed growth stocks.
Positioned for a stronger economy
Entering 2004, we did not make any substantial changes to our overall positioning from 2003; the portfolio remained poised to benefit from an improving business environment and increasing consumer confidence. This positioning appears to still be appropriate, as we are now seeing an American economy that continues to gain strength. Despite sluggish job growth early in 2004, recent data indicated the economy added more than 300,000 jobs in March alone. This continued into the second quarter.

Manufacturing orders and retail spending have also been strong so far this year. The vast majority of companies with which we spoke expressed solid optimism about their businesses. Although the potential for further interest-rate increases during the year remains, we believe this trend presents limited risk to the companies in the portfolio. This is because we look for companies with little debt, and we have also significantly underweighted stocks from the financial sector compared to the Russell 2000 index, which could face the most volatility from rising rates. In the short term, it is true that some stocks may fluctuate in value due to interest-rate concerns. In the longer view, however, we believe profit growth ultimately drives stock performance, and that this Fund’s portfolio of high-quality, fast-growing companies should be able to do well in this environment.
Our outlook for the second half
Now that the Federal Reserve has raised short-term rates, we think the worst of the resulting volatility is behind us. Normally, small-cap growth stocks appreciate in value after one or two Federal Reserve rate hikes — and we think that is all it will take to cool down the economy. We expect to see strong corporate earnings in the upcoming quarters as well. Given that we believe many stocks have been taken down to reasonable valuations, such earnings improvements could help to drive their prices higher, which may help the small-cap growth sector to perform well in the second half of the year.
Thank you for your investment in the Strong U.S. Emerging Growth Fund.
| Thomas L. Press |
| Portfolio Co-Manager |
| Donald M. Longlet |
| Portfolio Co-Manager |
| Robert E. Scott |
| Portfolio Co-Manager |
10
Fund Highlights
Average Annual Total Returns
As of 6-30-04
Investor Class | |||
1-year | 25.63 | % | |
5-year | 4.89 | % | |
Since Fund Inception (12-31-98) | 8.50 | % |
Performance is historical and does not guarantee future results. Investment returns and principal value will fluctuate, and you may have a gain or loss when you sell shares. Current performance may be lower or higher than the quoted performance. Call us or visit www.Strong.com for the most recent month-end performance.
Risks: Stock funds should only be considered for long-term goals as values fluctuate in response to the activities of individual companies and general market and economic conditions.
Because smaller companies often have narrower markets and limited financial resources, investments in these stocks present more risk than investments in those of larger, more established companies.
Growth of an Assumed $10,000 Investment†
from 12-31-98 to 6-30-04
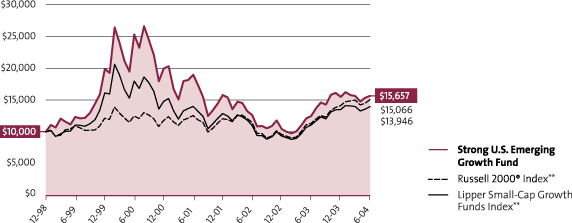
Mention of specific securities in this report is not indicative of whether the Fund may make additional purchases of, sell all or a portion of, or continue to hold those securities.
| * | The Morningstar Style Box™ reveals a fund’s investment strategy. For equity funds, the vertical axis shows the market capitalization of the stocks owned and the horizontal axis shows investment style (value, blend, or growth). |
| † | This graph, provided in accordance with SEC regulations, compares a $10,000 investment in the Fund, made at its inception, with the performance of the Russell 2000® Index and the Lipper Small-Cap Growth Funds Index. Results include the reinvestment of all dividends and capital gains distributions. The graph and the Average Annual Total Returns table do not reflect the deduction of taxes, if any, that a shareholder would pay on Fund distributions or the redemption of Fund shares. |
Performance Information: From time to time, the Fund’s performance was significantly enhanced through investments in initial public offerings (IPOs). In addition, the effect of IPOs purchased when the Fund’s asset base was small may have been magnified. Given these circumstances, you should not expect that such enhanced returns can be consistently achieved. Please consider this before investing.
Fee Waivers: From time to time, the Fund’s advisor and/or administrator has waived fees and/or absorbed Fund expenses, which has resulted in higher returns. As of 6-30-04, there are waivers and/or absorptions in effect.
Percentage Restrictions: The Fund’s prospectus and statement of additional information may describe restrictions on the percentage of a particular type or quality of security in which the Fund may invest (“Percentage Restrictions”). Percentage Restrictions apply at the time the Fund purchases a security. Circumstances subsequent to the purchase of the security, such as a change in: (1) the Fund’s assets (e.g., due to cash inflows and redemptions); (2) the market value of the security; or (3) the pricing, liquidity, or rating of the security, may cause the Fund to exceed or fall short of the Percentage Restriction. If this happens, the Fund’s continued holding of the security will not constitute a violation of the Percentage Restriction.
Definitions: **The Russell 2000® Index measures the performance of the 2,000 smallest companies in the Russell 3000® Index, which represents approximately 8% of the total market capitalization of the Russell 3000® Index. The Lipper Small-Cap Growth Funds Index is the average of the 30 largest funds in the Lipper Small-Cap Growth Funds Category. Source of the Russell Index data is Standard & Poor’s Micropal. Source of the Lipper Index data is Lipper. It is not possible to invest directly in an index.
11
During the first half of 2004, the Strong Enterprise Fund Investor Class gained 5.28%. This return fell short of the Fund’s broad-based benchmark, the Russell Midcap Index, which advanced 6.67% during the same time frame.
The underperformance can be partly attributed to disappointing results from Select Medical, a health-care equipment company. The stock fell after the government proposed some changes to how health-care providers would be reimbursed for Medicare claims. In response to the decline, we sold our position in Select Medical during the period — though, unfortunately, not soon enough to avoid a negative impact on the portfolio. This negative influence was counterbalanced by positive performance from the Fund’s consumer discretionary holdings, which benefited from continued strength in consumer spending.
Reduced gains in 2004
Continued growth in corporate profits and operating margins helped support further increases in stock prices during the first six months of 2004, although these gains were much less robust than those realized in 2003. As the stock recovery continued to take hold, investors began to look ahead to the potential for higher interest rates, more inflation, and continued high energy prices — all factors that could limit equity returns in the future. Interest rates were a particular concern; the threat of further rate hikes from the Federal Reserve Board kept a ceiling on corporate valuations, even as the companies reported solid first-quarter profits.
Thorough company research
Our approach to portfolio management relies on the careful selection of individual securities through collaborative research. We strive to “surround” each company that we consider for investment. In other words, our team of portfolio managers and analysts interviews not only the companies’ management, but also their competitors, suppliers, and customers. We want to acquire unique insights to support — or reject, in the cases of companies that fail to meet our strict requirements — our investment thesis for each individual stock.
Applying this approach, the Fund continued to benefit from a position in Harman International, which develops high-fidelity audio products and electronic systems for consumers and businesses. Our research led us to Harman almost two years ago, as the company was delivering multimedia and “infotainment” systems to BMW and other auto manufacturers. In recent years, automakers have responded to consumer demand by incorporating an increasing number of multimedia applications in vehicles. Since our original identification of Harman as a solid growth business, the company has continued to expand its product lineup and serve a growing roster of impressive clients — including Mercedes, BMW, Audi, Porsche, and Chrysler — with highly profitable infotainment systems.
Another important holding for the Fund was Crown Castle International, which owns and leases towers and transmission networks for wireless communications systems. Our industry research revealed that wireless carriers have two top priorities: 1) improving the voice quality on their communications networks; and 2) rolling out next-generation networks to enable subscribers to access online services at high speeds. Competition between carriers has become increasingly fierce, however, and as the companies acquire more customers, they must continue to upgrade and expand their networks to meet the increased demand. We believed that Crown Castle was in a strong position to capitalize on these trends. As the nation’s second largest wireless tower operator, the company has a presence in nearly three-quarters of the 100 largest markets in the United States. During the period, Crown Castle’s strong competitive position led to impressive growth in the company’s free-cash flow (cash flow after expenses).
Future challenges
Although corporate earnings and profitability are expected to continue to rise, we believe that stock valuations are already reflecting these likely trends. Thus, we are looking for gains from this point to be produced by a select group of high-quality stocks with predictable earnings. Against this backdrop, we plan to focus on companies with opportunities to reinvest in their core business, which will drive stable revenue and profit growth, and show the ability to keep prices high in a competitive business environment.
Thank you for your investment in the Strong Enterprise Fund. We appreciate the trust you have placed in our team.
Thomas J. Pence |
Portfolio Manager |
12
Fund Highlights
Average Annual Total Returns
As of 6-30-04
Investor Class | |||
1-year | 25.03 | % | |
5-year | 3.05 | % | |
Since Fund Inception (9-30-98) | 16.53 | % | |
Institutional Class1 | |||
1-year | 26.12 | % | |
5-year | 3.22 | % | |
Since Fund Inception (9-30-98) | 16.70 | % | |
Advisor Class2 | |||
1-year | 25.38 | % | |
5-year | 3.04 | % | |
Since Fund Inception (9-30-98) | 16.47 | % | |
Class K3 | |||
1-year | 25.80 | % | |
5-year | 3.30 | % | |
Since Fund Inception (9-30-98) | 16.77 | % | |
Performance is historical and does not guarantee future results. Investment returns and principal value will fluctuate, and you may have a gain or loss when you sell shares. Current performance may be lower or higher than the quoted performance. Call us or visit www.Strong.com for the most recent month-end performance.
Risks: Stock funds should only be considered for long-term goals as values fluctuate in response to the activities of individual companies and general market and economic conditions.
Because smaller companies often have narrower markets and limited financial resources, investments in these stocks present more risk than investments in those of larger, more established companies.
Growth of an Assumed $10,000 Investment
from 9-30-98 to 6-30-04
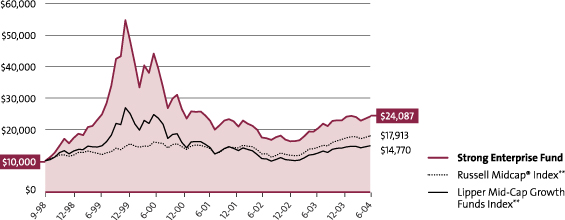
Mention of specific securities in this report is not indicative of whether the Fund may make additional purchases of, sell all or a portion of, or continue to hold those securities.
| * | The Morningstar Style Box™ reveals a fund’s investment strategy. For equity funds, the vertical axis shows the market capitalization of the stocks owned and the horizontal axis shows investment style (value, blend, or growth). |
| † | This graph, provided in accordance with SEC regulations, compares a $10,000 investment in the Fund, made at its inception, with the performance of the Russell Midcap® Index and the Lipper Mid-Cap Growth Funds Index. Results include the reinvestment of all dividends and capital gains distributions. The graph and the Average Annual Total Returns table do not reflect the deduction of taxes, if any, that a shareholder would pay on Fund distributions or the redemption of Fund shares. This graph is based on Investor Class shares only; performance for other classes will vary due to differences in fee structures. |
Performance Information: 1The performance of the Institutional Class shares prior to 6-30-03 is based on the Fund’s Investor Class shares’ performance.
2The performance of the Advisor Class shares prior to 2-24-00 is based on the Fund’s Investor Class shares’ performance, restated for the higher expense ratio of the Advisor Class shares.
3The performance of the Class K shares prior to 8-30-02 is based on the Fund’s Investor Class shares’ performance, and has not been restated for the lower expense ratio of the Class K shares.
Please consult a prospectus for information about all share classes.
Fee Waivers: From time to time, the Fund’s advisor and/or administrator has waived fees and/or absorbed Fund expenses, which has resulted in higher returns. As of 6-30-04, there are waivers and/or absorptions in effect.
Percentage Restrictions: The Fund’s prospectus and statement of additional information may describe restrictions on the percentage of a particular type or quality of security in which the Fund may invest (“Percentage Restrictions”). Percentage Restrictions apply at the time the Fund purchases a security. Circumstances subsequent to the purchase of the security, such as a change in: (1) the Fund’s assets (e.g., due to cash inflows and redemptions); (2) the market value of the security; or (3) the pricing, liquidity, or rating of the security, may cause the Fund to exceed or fall short of the Percentage Restriction. If this happens, the Fund’s continued holding of the security will not constitute a violation of the Percentage Restriction.
Definitions: **The Russell Midcap® Index measures the performance of the 800 smallest companies in the Russell 1000® Index, which represent approximately 26% of the total market capitalization of the Russell 1000® Index. The Lipper Mid-Cap Growth Funds Index is the average of the 30 largest funds in the Lipper Mid-Cap Growth Funds Category. Source of the Russell Index data is Standard & Poor’s Micropal. Source of the Lipper Index data is Lipper. It is not possible to invest directly in an index.
13
The Strong Growth 20 Fund recorded positive performance for the first half of 2004, outperforming its broad-based benchmark, the S&P 500 Index. For the six months ended June 30, 2004, the Fund’s Investor Class shares returned 4.86%, while the S&P 500 Index returned 3.44% for the same period. The Fund was able to achieve this performance even though the value style of investing slightly outperformed the Fund’s growth style over the six months.
Internet and energy played a large role
The outperformance of the Strong Growth 20 Fund was driven primarily by its exposure to Internet-related companies, which represent one of the fastest-growing segments of the economy. During the period, the Fund held positions in such high-quality, fast-growing Internet-related stocks including eBay, Yahoo!, and Ask Jeeves.
Energy stocks also made a meaningful, positive contribution to the Fund’s performance. Such holdings as Ultra Petroleum and BJ Services Company were positioned to benefit from the high energy prices we saw during the first half of 2004. Ultra Petroleum, an exploration and production company, also benefited from its industry-leading natural gas production growth rate. Importantly, we expect their powerful volume growth to continue for several more quarters, driven by the strength of its drilling prospects and management’s solid track record of execution.
Among the areas of investment that were weaker for the Fund for the six months were homebuilding, generic drugs, software, and communications.
Studying companies closely
We believe that earnings and revenue growth are key factors in determining stock prices. We, therefore, focus a great deal of our stock-selection process on finding stocks that are experiencing — or have solid potential to experience — above-average growth in revenue and earnings. While identifying stocks that are experiencing this growth is essential, what matters even more in our investment strategy is determining which companies have growth trends that are sustainable, and which will only be short-lived.
To sort out the long-term winners from the disappointments, we employ thorough, hands-on research. We specifically focus on a company’s history of success in executing its strategy and the potential profitability of its business model. We also carefully consider whether the company’s strategy and operations mesh well with our overall economic view, and if it is being helped or hurt by any broader secular trends.
When we decide to sell a stock, our decision-making criteria are essentially the opposite of our buying criteria. We may sell a stock when we see deterioration in its fundamental qualities that may threaten the sustainability of a company’s existing or prospective growth. Conditions that could give us grounds for concern may include, but are not limited to, changes we see in the economy, a new competitive threat, or a change in management personnel or direction.
Our approach to the second half
Our outlook for the next few months remains upbeat. We anticipate that interest rates and inflation will both remain relatively low, and that growth in jobs and corporate earnings are likely to remain at healthy levels. We expect to carefully monitor these factors. The outcome of the presidential election in November could have important investment implications, so we anticipate closely watching developments on that front. In the meantime, we intend to continue to seek out the fastest-growing companies we can identify that we believe fit within the framework of our investment process.
We thank you for your continued investment in the Strong Growth 20 Fund.
Brandon M. Nelson |
Portfolio Manager |
14
Fund Highlights
Average Annual Total Returns
As of 6-30-04
Investor Class | |||
1-year | 19.95 | % | |
5-year | –3.52 | % | |
Since Fund Inception (6-30-97) | 6.74 | % | |
Advisor Class1 | |||
1-year | 20.28 | % | |
5-year | – 3.48 | % | |
Since Fund Inception (6-30-97) | 6.70 | % | |
Performance is historical and does not guarantee future results. Investment returns and principal value will fluctuate, and you may have a gain or loss when you sell shares. Current performance may be lower or higher than the quoted performance. Call us or visit www.Strong.com for the most recent month-end performance.
Risks: Stock funds should only be considered for long-term goals as values fluctuate in response to the activities of individual companies and general market and economic conditions.
The Fund is nondiversified, meaning it may concentrate its assets in fewer individual holdings than a diversified fund. Therefore, the Fund is more exposed to individual stock volatility and market pressure than a fully diversified fund.
Growth of an Assumed $10,000 Investment†
from 6-30-97 to 6-30-04
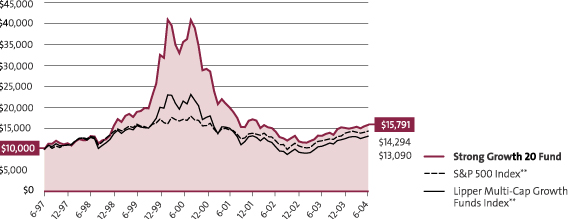
Mention of specific securities in this report is not indicative of whether the Fund may make additional purchases of, sell all or a portion of, or continue to hold those securities.
| * | The Morningstar Style BoxTM reveals a fund’s investment strategy. For equity funds, the vertical axis shows the market capitalization of the stocks owned and the horizontal axis shows investment style (value, blend, or growth). |
| † | This graph, provided in accordance with SEC regulations, compares a $10,000 investment in the Fund, made at its inception, with the performance of the S&P 500 Index and the Lipper Multi-Cap Growth Funds Index. Results include the reinvestment of all dividends and capital gains distributions. The graph and the Average Annual Total Returns table do not reflect the deduction of taxes, if any, that a shareholder would pay on Fund distributions or the redemption of Fund shares. This graph is based on Investor Class shares only; performance for other classes will vary, due to differences in fee structures. |
Performance Information: 1The performance of the Advisor Class shares prior to 2-24-00 is based on the Fund’s Investor Class shares’ performance, restated for the higher expense ratio of the Advisor Class shares.
Please consult a prospectus for information about all share classes.
From time to time, the Fund’s performance was significantly enhanced through investments in initial public offerings (IPOs). In addition, the effect of IPOs purchased when the Fund’s asset base was small may have been magnified. Given these circumstances, you should not expect that such enhanced returns can be consistently achieved. Please consider this before investing.
Fee Waivers: From time to time, the Fund’s advisor and/or administrator has waived fees and/or absorbed Fund expenses, which has resulted in higher returns. As of 6-30-04, there are waivers and/or absorptions in effect.
Percentage Restrictions: The Fund’s prospectus and statement of additional information may describe restrictions on the percentage of a particular type or quality of security in which the Fund may invest (“Percentage Restrictions”). Percentage Restrictions apply at the time the Fund purchases a security. Circumstances subsequent to the purchase of the security, such as a change in: (1) the Fund’s assets (e.g., due to cash inflows and redemptions); (2) the market value of the security; or (3) the pricing, liquidity, or rating of the security, may cause the Fund to exceed or fall short of the Percentage Restriction. If this happens, the Fund’s continued holding of the security will not constitute a violation of the Percentage Restriction.
Definitions: **The S&P 500 Index consists of 500 stocks chosen for market size, liquidity, and industry group representation. It is a market value weighted index (stock price times number of shares outstanding), with each stock’s weight in the Index proportionate to its market value. The Lipper Multi-Cap Growth Funds Index is the average of the 30 largest funds in the Lipper Multi-Cap Growth Funds Category. Source of the S&P Index data is Standard & Poor’s Micropal. Source of the Lipper Index data is Lipper. It is not possible to invest directly in an index.
15
The Strong Growth Fund had a good start to the year, with the Investor Class shares posting a return of 6.40% for the six months ended June 30, 2004. For the same period, its broad-based benchmark, the S&P 500 Index, returned 3.44%.
Taking advantage of a dynamic market
The strongest impact on the market during the first half of the period was continued greater than anticipated corporate earnings growth. Fortunately, the Fund was positioned to benefit from this occurrence. The other main variable influencing the market during the first half was the anticipation of the Federal Reserve’s reversal of its current accommodative short-term, interest-rate stance. We feel the portfolio was positioned for this occurrence.
The Fund continued to have strong allocations in economically sensitive sectors such as technology and in specific long-term growth opportunities tied to the consumer. We continued to research and explore opportunities in the health care sector, but have found many of the larger capitalization stocks to have lackluster growth prospects.
While value styles did outperform growth in the period, we were able to benefit from opportunistic investments in equities of high-quality, fast-growing growth stocks.
Research nets Yahoo!
Stock specific proprietary research continues to be at the heart of our portfolio process. We devote many hours to screening for the fastest growing public companies in the economy that also provide for the best chances for sustained growth. Once we identify these companies on paper, we hit the phones and the road to accumulate data from meetings and conversations with the companies themselves, their customers, their suppliers, and their competitors.
Sometimes a better investment idea comes from this confirmatory research than the original stock idea that generated the analysis. Once a stock makes it into the portfolio this process doesn’t halt, it is dynamic. We constantly research to recheck our theses, while taking into account the opportunity cost of not owning other growth stocks. We do not ignore the macros as they can provide strong headwinds or tailwinds to company-specific growth. We also monitor our portfolio risk on many levels, including sector allocations.
Yahoo! is a good example of the fruits of this process. It addresses a growth area in the economy. It is taking market share within its industry. Moreover, its growth prospects have been continually underestimated. While doing research on Yahoo!’s growth opportunities and the duration of that growth, we have found other exciting growth stocks to add to the portfolio.
Looking ahead to the second half
Our near-term outlook can be described as opportunistically optimistic. While we expect short-term interest rates to rise to a more historic level, we are encouraged that the yield curve remains steep, signaling the market’s expectations for continued economic growth. Within this pretext there are plenty of exciting opportunities to invest in growth stocks. We thank you for your continued support and investment.
Thomas C. Ognar
Portfolio Manager
16
Fund Highlights
Average Annual Total Returns
As of 6-30-04
Investor Class | |||
1-year | 20.89 | % | |
5-year | –1.43 | % | |
10-year | 11.72 | % | |
Since Fund Inception (12-31-93) | 11.79 | % | |
Institutional Class1 | |||
1-year | 21.56 | % | |
5-year | – 0.87 | % | |
10-year | 12.04 | % | |
Since Fund Inception (12-31-93) | 12.10 | % | |
Advisor Class2 | |||
1-year | 20.73 | % | |
5-year | –1.59 | % | |
10-year | 11.46 | % | |
Since Fund Inception (12-31-93) | 11.53 | % | |
Class C3 | |||
1-year | 18.64 | % | |
5-year | –2.46 | % | |
10-year | 10.47 | % | |
Since Fund Inception (12-31-93) | 10.53 | % | |
Class K4 | |||
1-year | 21.41 | % | |
5-year | –1.16 | % | |
10-year | 11.87 | % | |
Since Fund Inception (12-31-93) | 11.94 | % | |
Performance is historical and does not guarantee future results. Investment returns and principal value will fluctuate, and you may have a gain or loss when you sell shares. Current performance may be lower or higher than the quoted performance. Call us or visit www.Strong.com for the most recent month-end performance.
Risks: Stock funds should only be considered for long-term goals as values fluctuate in response to the activities of individual companies and general market and economic conditions.
Growth of an Assumed $10,000 Investment†
from 12-31-93 to 6-30-04
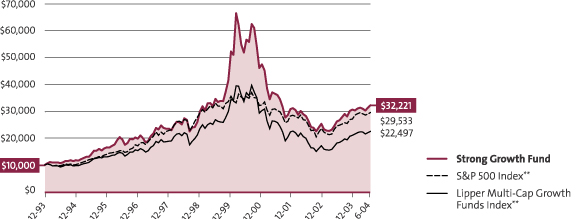
Mention of specific securities in this report is not indicative of whether the Fund may make additional purchases of, sell all or a portion of, or continue to hold those securities.
| * | The Morningstar Style BoxTM reveals a fund’s investment strategy. For equity funds, the vertical axis shows the market capitalization of the stocks owned and the horizontal axis shows investment style (value, blend, or growth). |
| † | This graph, provided in accordance with SEC regulations, compares a $10,000 investment in the Fund, made at its inception, with the performance of the S&P 500 Index and the Lipper Multi-Cap Growth Funds Index. Results include the reinvestment of all dividends and capital gains distributions. The graph and the Average Annual Total Returns table do not reflect the deduction of taxes, if any, that a shareholder would pay on Fund distributions or the redemption of Fund shares. This graph is based on Investor Class shares only; performance for other classes will vary due to differences in fee structures. |
Performance Information: 1The performance of the Institutional Class shares prior to 2-24-00 is based on the Fund’s Investor Class shares’ performance, and has not been restated for the lower expense ratio of the Institutional Class shares.
2The performance of the Advisor Class shares prior to 2-24-00 is based on the Fund’s Investor Class shares’ performance, restated for the higher expense ratio of the Advisor Class shares.
3The performance of Class C shares prior to 12-26-02 is based on the Fund’s Investor Class shares’ performance, restated for the higher expense ratio of the Class C shares. Average annual total returns include a 1.00% contingent deferred sales charge imposed on redemptions made within 12 months of purchase.
4The performance of the Class K shares prior to 8-30-02 is based on the Fund’s Investor Class shares’ performance and has not been restated for the lower expense ratio of the Class K shares.
Please consult a prospectus for information about all share classes.
Fee Waivers: From time to time, the Fund’s advisor and/or administrator has waived fees and/or absorbed Fund expenses, which has resulted in higher returns. As of 6-30-04, there are waivers and/or absorptions in effect.
Percentage Restrictions: The Fund’s prospectus and statement of additional information may describe restrictions on the percentage of a particular type or quality of security in which the Fund may invest (“Percentage Restrictions”). Percentage Restrictions apply at the time the Fund purchases a security. Circumstances subsequent to the purchase of the security, such as a change in: (1) the Fund’s assets (e.g., due to cash inflows and redemptions); (2) the market value of the security; or (3) the pricing, liquidity, or rating of the security, may cause the Fund to exceed or fall short of the Percentage Restriction. If this happens, the Fund’s continued holding of the security will not constitute a violation of the Percentage Restriction.
Definitions: **The S&P 500 Index consists of 500 stocks chosen for market size, liquidity, and industry group representation. It is a market value weighted index (stock price times number of shares outstanding), with each stock’s weight in the Index proportionate to its market value. The Lipper Multi-Cap Growth Funds Index is the average of the 30 largest funds in the Lipper Multi-Cap Growth Funds Category. Source of the S&P Index data is Standard & Poor’s Micropal. Source of the Lipper Index data is Lipper.
It is not possible to invest directly in an index.
17
Strong Large Company Growth Fund
During the first half of 2004, the Strong Large Company Growth Fund gained 7.19%, decisively outpacing the Fund’s broad-based benchmark, the S&P 500 Index, which rose 3.44%. The Fund was invested in companies poised to deliver stronger earnings and cash flow growth than the broad stock market. The Fund’s returns were driven by strong stock selection within health care and information technology.
Uncovering investment opportunities
Our approach to portfolio management relies on the careful selection of individual securities through collaborative research. We strive to “surround” each company that we consider for investment. In other words, our team of portfolio managers and analysts interviews not only the company’s management, but also their competitors, suppliers, and customers. We want to acquire unique insights to support — or reject, in the cases of companies that fail to meet our strict requirements — our investment thesis for each individual stock.
Opportunities in Teva and Yahoo!
Applying our approach, we reviewed a number of potential investment opportunities in the health care sector during the period. As our research progressed, we became concerned about the lack of new products forthcoming by many large-cap pharmaceutical companies, as well as the considerable number of drugs due to lose their patent protection in the near future. Accordingly, we maintained little exposure to these “name-brand” pharmaceutical businesses. Instead we built a position in Teva Pharmaceutical, the world’s leading developer and manufacturer of generic drugs as well as a supplier of a growing line of branded drugs.
We believe Teva has an outstanding competitive position, as the company dominates the generic drug market in the United States. In addition, Teva’s management team has shown a consistent ability to execute its business strategy, made evident by the company’s track record of stable and diversified earnings. Furthermore, Teva has an impressive pipeline of upcoming products, with over 80 applications for new drugs pending regulatory approval in the U.S. alone. The company also has shown success with its branded drug offerings, such as Copaxone, well on its way to becoming the nation’s leading treatment for multiple sclerosis. Thanks to these strong business trends, Teva has been able to produce solid revenue and earnings growth, and the stock was a significant contributor to the Fund’s performance during the past six months.
We also built a position in Yahoo!, a provider of Internet consumer and business services. Yahoo!’s business strength is driven by branded advertising. Our research led us to conclude that many companies plan to increase advertising spending in the near future. In addition, corporations appear to be particularly attracted to Internet advertising, especially since consumers now view 15% of their media content online. More and more advertisers, in fact, have been looking to the Internet as an effective alternative to traditional television advertising, which has been hurt by declining ratings and the proliferation of digital video recorders.
At the time of our research, we saw Yahoo! as very well positioned to take advantage of this shift in advertising spending. With 40% of Internet users using Yahoo!’s search function, the company enjoys strong brand recognition and a large user base. Yahoo! also is beginning to realize the benefit of offering a full suite of advertising products, including increasingly lucrative “paid search” advertising. Finally, we believed Yahoo! could continue to benefit from growth opportunities overseas; the company has been investing heavily to enter and take market share from less-sophisticated, regional Internet portals.
High-quality companies may benefit
For the rest of 2004, we expect corporate profits to continue to grow, but at a slower pace than investors have been experiencing in recent quarters. We believe the expectation for higher interest rates is likely to put a cap on stock valuations. One potentially positive factor for continued earnings growth would be a return to high levels of business spending, which lagged far behind consumer spending during the recent economic downturn. Should growth overseas outpace that in the United States, and if foreign currencies continue to outpace the U.S. dollar, domestic companies with significant international sales should benefit. Against the current economic and market backdrop, we expect stock investors to begin to reward higher-quality companies with relatively predictable earnings and recurring revenues.
Thank you for your investment in the Strong Large Company Growth Fund. We sincerely appreciate the trust you have placed in us.
Thomas J. Pence
Portfolio Manager
18
Fund Highlights
Average Annual Total Returns
As of 6-30-04
Investor Class1 | |||
1-year | 19.73 | % | |
5-year | 5.81 | % | |
Since Inception (11-3-97) | 9.50 | % | |
Class K2 | |||
1-year | 20.32 | % | |
5-year | 5.91 | % | |
Since Inception (11-3-97) | 9.58 | % | |
Performance is historical and does not guarantee future results. Investment returns and principal value will fluctuate, and you may have a gain or loss when you sell shares. Current performance may be lower or higher than the quoted performance. Call us or visit www.Strong.com for the most recent month-end performance.
Risks: Stock funds should only be considered for long-term goals as values fluctuate in response to the activities of individual companies and general market and economic conditions.
Growth of an Assumed $10,000 Investment†
from 11-3-97 to 6-30-04
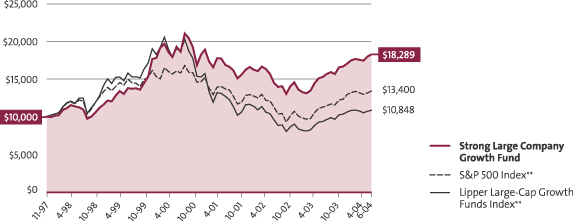
The Fund’s Investor Class has a redemption fee of 1.00% against shares that are held 360 calendar days or fewer after purchase. Performance data does not reflect the deduction of this fee, which, if reflected, would reduce performance.
Mention of specific securities in this report is not indicative of whether the Fund may make additional purchases of, sell all or a portion of, or continue to hold those securities.
| * | The Morningstar Style BoxTM reveals a fund’s investment strategy. For equity funds, the vertical axis shows the market capitalization of the stocks owned and the horizontal axis shows investment style (value, blend, or growth). |
| † | This graph, provided in accordance with SEC regulations, compares a $10,000 investment in the Fund, made at its inception, with the performance of the S&P 500 Index and the Lipper Large-Cap Growth Funds Index. Results include the reinvestment of all dividends and capital gains distributions. The graph and the Average Annual Total Returns table do not reflect the deduction of taxes, if any, that a shareholder would pay on Fund distributions or the redemption of Fund shares. This graph is based on the Investor Class shares only; performance for other classes will vary, due to differences in fee structures. To equalize time periods, the indices’ performances were prorated for the month of November 1997. |
Performance Information: 1The performance of the Investor Class prior to 9-16-02 is based on the performance of the Rockhaven Premier Dividend Fund (the predecessor Fund), and does not reflect the Fund’s maximum sales charge of 5.75%, which was charged from 9-17-99 through 9-13-02.
2The performance of the Class K shares prior to 6-30-03 is based on the performance of the Fund’s Investor Class or the Fund’s predecessor, the Rockhaven Premier Dividend Fund. The prior performance has not been restated for the lower expense ratio of the Class K shares and does not reflect the Fund’s maximum sales charge of 5.75% (charged from 9-17-99 through 9-13-02) or the Investor Class redemption fee.
The predecessor Fund’s investment strategy emphasized investments in convertible securities.
Please consult a prospectus for information about all share classes.
Fee Waivers: From time to time, the Fund’s advisor and/or administrator has waived fees and/or absorbed Fund expenses, which has resulted in higher returns. As of 6-30-04, there are waivers and/or absorptions in effect.
We have contractually agreed to waive fees and/or absorb expenses for an indefinite period of time to keep Total Annual Operating Expenses of the Large Company Growth Fund at no more than 1.50% for the Investor Class shares and 0.99% for the Class K shares. This contract may only be terminated by the Board of Directors of the Fund, but not before May 1, 2005.
Percentage Restrictions: The Fund’s prospectus and statement of additional information may describe restrictions on the percentage of a particular type or quality of security in which the Fund may invest (“Percentage Restrictions”). Percentage Restrictions apply at the time the Fund purchases a security. Circumstances subsequent to the purchase of the security, such as a change in: (1) the Fund’s assets (e.g., due to cash inflows and redemptions); (2) the market value of the security; or (3) the pricing, liquidity, or rating of the security, may cause the Fund to exceed or fall short of the Percentage Restriction. If this happens, the Fund’s continued holding of the security will not constitute a violation of the Percentage Restriction.
Definitions: **The S&P 500 Index consists of 500 stocks chosen for market size, liquidity, and industry group representation. It is a market value weighted index (stock price times number of shares outstanding), with each stock’s weight in the Index proportionate to its market value. The Lipper Large-Cap Growth Funds Index is the average of the 30 largest funds in the Lipper Large-Cap Growth Funds Category. Source of the S&P 500 Index data is Standard & Poor’s Micropal. Source of the Lipper Index data is Lipper.
It is not possible to invest directly in an index.
19
| SCHEDULES OF INVESTMENTS IN SECURITIES | June 30, 2004 (Unaudited) |
Shares or Amount | Value (Note 2) | |||||
Common Stocks 97.7% | ||||||
Aerospace - Defense 3.0% | ||||||
General Dynamics Corporation | 45,200 | $ | 4,488,360 | |||
Apparel - Shoes & Related Manufacturing 2.1% | ||||||
NIKE, Inc. Class B | 42,700 | 3,234,525 | ||||
Auto Manufacturer 2.1% | ||||||
Toyota Motor Corporation Sponsored ADR | 38,400 | 3,134,208 | ||||
Banks - Money Center 4.5% | ||||||
Bank of America Corporation | 53,800 | 4,552,556 | ||||
Citigroup, Inc. | 49,100 | 2,283,150 | ||||
| 6,835,706 | ||||||
Building - Resident/Commercial 10.9% | ||||||
Centex Corporation | 66,300 | 3,033,225 | ||||
D.R. Horton, Inc. | 160,550 | 4,559,620 | ||||
Lennar Corporation Class A | 68,600 | 3,067,792 | ||||
Pulte Homes, Inc. | 114,100 | 5,936,623 | ||||
| 16,597,260 | ||||||
Computer - Local Networks 3.2% | ||||||
Cisco Systems, Inc. (b) | 203,900 | 4,832,430 | ||||
Computer Software - Desktop 3.0% | ||||||
Microsoft Corporation | 161,100 | 4,601,016 | ||||
Cosmetics - Personal Care 6.1% | ||||||
Avon Products, Inc. | 70,000 | 3,229,800 | ||||
LIFE TIME FITNESS, Inc. (b) | 300 | 6,300 | ||||
The Procter & Gamble Company | 109,600 | 5,966,624 | ||||
| 9,202,724 | ||||||
Diversified Operations 10.4% | ||||||
General Electric Company | 152,000 | 4,924,800 | ||||
3M Co. | 46,300 | 4,167,463 | ||||
Tyco International, Ltd. | 200,700 | 6,651,198 | ||||
| 15,743,461 | ||||||
Electronics - Semiconductor | ||||||
Manufacturing 2.9% | ||||||
Analog Devices, Inc. | 94,700 | 4,458,476 | ||||
Finance - Investment Brokers 2.8% | ||||||
The Goldman Sachs Group, Inc. | 45,500 | 4,284,280 | ||||
Food - Miscellaneous Preparation 2.2% | ||||||
PepsiCo, Inc. | 60,800 | 3,275,904 | ||||
Internet - E*Commerce 5.1% | ||||||
eBay, Inc. (b) | 84,700 | 7,788,165 | ||||
Internet - Internet Content 5.1% | ||||||
Yahoo! Inc. (b) | 213,800 | 7,767,354 | ||||
Medical - Biomedical/Biotechnology 2.3% | ||||||
Biogen Idec, Inc. (b) | 54,000 | 3,415,500 | ||||
Medical - Ethical Drugs 3.2% | ||||||
Pfizer, Inc. | 142,200 | 4,874,616 | ||||
Medical - Products 4.2% | ||||||
St. Jude Medical, Inc. (b) | 40,400 | 3,056,260 | ||||
Stryker Corporation | 59,000 | 3,245,000 | ||||
| 6,301,260 | ||||||
Medical/Dental - Supplies 2.2% | ||||||
Becton, Dickinson & Company | 63,700 | 3,299,660 | ||||
Metal Ores - Miscellaneous 2.2% | ||||||
Phelps Dodge Corporation (b) | 43,400 | 3,363,934 | ||||
Oil & Gas - International Integrated 4.1% | ||||||
ConocoPhillips | 81,900 | 6,248,151 | ||||
Oil & Gas - Refining/Marketing 3.4% | ||||||
Valero Energy Corporation | 69,300 | 5,111,568 | ||||
Oil & Gas - United States Exploration & | ||||||
Production 3.0% | ||||||
Burlington Resources, Inc. | 126,000 | 4,558,680 | ||||
Retail - Drug Stores 2.2% | ||||||
Walgreen Company | 93,000 | 3,367,530 | ||||
Retail - Home Furnishings 0.0% | ||||||
Design Within Reach, Inc. (b) | 300 | 4,929 | ||||
Retail/Wholesale - Building Products 1.8% | ||||||
Lowe’s Companies, Inc. | 53,000 | 2,785,150 | ||||
Telecommunications - Wireless | ||||||
Equipment 3.2% | ||||||
QUALCOMM, Inc. | 65,700 | 4,794,786 | ||||
Telecommunications - Wireless | ||||||
Services 2.5% | ||||||
Mobile Telesystems Sponsored ADR | 31,000 | 3,782,000 | ||||
Total Common Stocks (Cost $ 125,243,723) | 148,151,633 | |||||
Short-Term Investments (a) 0.6% | ||||||
Repurchase Agreements (c) | ||||||
State Street Bank (Dated 6/30/04), 0.75%, Due 7/01/04 (Repurchase proceeds $952,820); Collateralized by: United States Government & Agency Issues | $ | 952,800 | 952,800 | |||
Total Short-Term Investments (Cost $ 952,800) | 952,800 | |||||
Total Investments in Securities (Cost $126,196,523) 98.3% | 149,104,433 | |||||
Other Assets and Liabilities, Net 1.7% | 2,509,841 | |||||
Net Assets 100.0% | $ | 151,614,274 | ||||
| Shares or Principal Amount | Value (Note 2) | ||||
Common Stocks 95.4% | |||||
Apparel - Shoes & Related Manufacturing 1.2% | |||||
Genesco, Inc. (b) (d) | 85,800 | $ | 2,027,454 | ||
Auto/Truck - Original Equipment 0.9% | |||||
Eaton Corporation | 25,040 | 1,621,090 | |||
Building - Mobile/Manufacturers & RV 0.0% | |||||
Champion Enterprises, Inc. (b) (d) | 40 | 367 | |||
Commercial Services - Market Research 1.2% | |||||
Corporate Executive Board Company | 37,470 | 2,165,391 | |||
20
STRONG DISCOVERY FUND (continued)
| Shares or Principal Amount | Value (Note 2) | ||||
Commercial Services - Schools 2.2% | |||||
Career Education Corporation (b) | 13,440 | $ | 612,326 | ||
Corinthian Colleges, Inc. (b) | 76,600 | 1,895,084 | |||
Strayer Education, Inc. | 11,930 | 1,331,030 | |||
| 3,838,440 | |||||
Commercial Services - Security/Safety 0.6% | |||||
Armor Holdings, Inc. (b) (d) | 33,600 | 1,142,400 | |||
Commercial Services - Staffing 1.1% | |||||
Kforce.com, Inc. (b) | 206,842 | 1,952,589 | |||
Computer - Local Networks 2.3% | |||||
Polycom, Inc. (b) | 177,170 | 3,970,380 | |||
Computer - Manufacturers 1.7% | |||||
Apple Computer, Inc. (b) | 92,400 | 3,006,696 | |||
Computer Software - | |||||
Education/Entertainment 1.9% | |||||
Activision, Inc. (b) | 204,873 | 3,257,481 | |||
Computer Software - Enterprise 5.2% | |||||
Hyperion Solutions Corporation (b) | 40,900 | 1,788,148 | |||
Mercury Interactive Corporation (b) | 81,500 | 4,061,145 | |||
TIBCO Software, Inc. (b) (d) | 386,600 | 3,266,770 | |||
| 9,116,063 | |||||
Computer Software - Financial 0.8% | |||||
DST Systems, Inc. (b) | 27,600 | 1,327,284 | |||
Electronics - Semiconductor | |||||
Manufacturing 5.7% | |||||
Broadcom Corporation Class A (b) | 57,500 | 2,689,275 | |||
KLA - Tencor Corporation (b) | 29,400 | 1,451,772 | |||
Marvell Technology Group, Ltd. (b) | 138,200 | 3,689,940 | |||
Silicon Laboratories, Inc. (b) (d) | 45,000 | 2,085,750 | |||
| 9,916,737 | |||||
Financial Services - Miscellaneous 0.7% | |||||
Euronet Services, Inc. (b) (d) | 56,200 | 1,299,906 | |||
Household - Consumer Electronics 2.8% | |||||
Harman International Industries, Inc. | 53,870 | 4,902,170 | |||
Insurance - Property/Casualty/Title 2.6% | |||||
Endurance Specialty Holdings, Ltd. (d) | 77,900 | 2,710,920 | |||
ProAssurance Corporation (b) (d) | 52,030 | 1,774,743 | |||
| 4,485,663 | |||||
Internet-E*Commerce 2.4% | |||||
Getty Images, Inc. (b) | 21,800 | 1,308,000 | |||
Netflix, Inc. (b) (d) | 81,800 | 2,940,710 | |||
| 4,248,710 | |||||
Internet - Software 1.0% | |||||
OpenTV Corporation (b) (e) | 72,105 | 149,978 | |||
ValueClick, Inc. (b) | 133,100 | 1,594,538 | |||
| 1,744,516 | |||||
Leisure - Movies & Related 3.4% | |||||
Lions Gate Entertainment Corporation (b) | 852,270 | 5,948,845 | |||
Leisure - Products 1.9% | |||||
Multimedia Games, Inc. (b) (d) | 122,511 | 3,285,745 | |||
Leisure - Toys/Games/Hobby 2.0% | |||||
Marvel Enterprises, Inc. (b) (d) | 181,764 | 3,548,033 | |||
Media - Radio/TV 1.1% | |||||
The E.W. Scripps Company Class A | 19,125 | 2,008,125 | |||
Medical - Biomedical/Biotechnology 4.4% | |||||
Digene Corporation (b) | 84,523 | 3,087,625 | |||
Genzyme Corporation (b) | 39,600 | 1,874,268 | |||
Northfield Laboratories, Inc. (b) | 94,900 | 1,353,274 | |||
Sepracor, Inc. (b) (d) | 25,400 | 1,343,660 | |||
| 7,658,827 | |||||
Medical - Ethical Drugs 3.0% | |||||
Inspire Pharmaceuticals, Inc. (b) (d) | 160,190 | 2,678,377 | |||
Medicis Pharmaceutical Corporation Class A (d) | 65,600 | 2,620,720 | |||
| 5,299,097 | |||||
Medical - Genetics 0.6% | |||||
Millennium Pharmaceuticals, Inc. (b) | 78,490 | 1,083,162 | |||
Medical - Hospitals 1.5% | |||||
Community Health Systems, Inc. (b) | 96,890 | 2,593,745 | |||
Medical - Products 4.1% | |||||
American Medical Systems Holdings, Inc. (b) (d) | 80,500 | 2,712,850 | |||
Cyberonics, Inc. (b) (d) | 37,430 | 1,248,665 | |||
EPIX Medical, Inc. (b) | 50,800 | 1,071,880 | |||
Zimmer Holdings, Inc. (b) | 24,940 | 2,199,708 | |||
| 7,233,103 | |||||
Medical - Systems/Equipment 3.0% | |||||
Fisher Scientific International, Inc. (b) (d) | 65,300 | 3,771,075 | |||
Varian Medical Systems, Inc. (b) | 18,450 | 1,464,008 | |||
| 5,235,083 | |||||
Medical - Wholesale Drugs/Sundries 0.9% | |||||
McKesson Corporation | 48,800 | 1,675,304 | |||
Medical/Dental - Services 1.7% | |||||
Caremark Rx, Inc. (b) | 28,600 | 942,084 | |||
LabOne, Inc. (b) (d) | 66,800 | 2,122,904 | |||
| 3,064,988 | |||||
Medical/Dental - Supplies 0.8% | |||||
Dentsply International, Inc. | 25,730 | 1,340,533 | |||
Metal Ores - Miscellaneous 1.2% | |||||
Phelps Dodge Corporation (b) (d) | 26,700 | 2,069,517 | |||
Mining - Gems 1.2% | |||||
Pan American Silver Corporation (b) (d) | 166,700 | 2,192,105 | |||
Oil & Gas - Canadian Exploration & | |||||
Production 0.4% | |||||
Canadian Natural Resources, Ltd. | 25,400 | 759,460 | |||
Oil & Gas - Drilling 2.2% | |||||
ENSCO International, Inc. | 66,700 | 1,940,970 | |||
Nabors Industries, Ltd. (b) | 41,970 | 1,897,883 | |||
| 3,838,853 | |||||
Oil & Gas - Field Services 0.5% | |||||
BJ Services Company (b) | 19,030 | 872,335 | |||
Oil & Gas - Machinery/Equipment 2.5% | |||||
Grant Prideco, Inc. (b) | 137,800 | 2,543,788 | |||
Smith International, Inc. (b) | 32,900 | 1,834,504 | |||
| 4,378,292 | |||||
Oil & Gas - Production/Pipeline 0.8% | |||||
The Williams Companies, Inc. | 112,100 | 1,333,990 | |||
21
| SCHEDULES OF INVESTMENTS IN SECURITIES (continued) | June 30, 2004 (Unaudited) |
STRONG DISCOVERY FUND (continued)
Shares or Principal Amount | Value (Note 2) | ||||||
Oil & Gas - United States Exploration & Production 2.3% | |||||||
Chesapeake Energy Corporation (d) | 176,500 | $ | 2,598,080 | ||||
XTO Energy, Inc. (d) | 46,100 | 1,373,319 | |||||
| 3,971,399 | |||||||
Pollution Control - Services 1.5% | |||||||
Stericycle, Inc. (b) | 51,470 | 2,663,058 | |||||
Retail - Clothing/Shoe 1.7% | |||||||
Coach, Inc. (b) | 36,750 | 1,660,733 | |||||
Urban Outfitters, Inc. (b) (d) | 22,010 | 1,340,629 | |||||
| 3,001,362 | |||||||
Retail - Home Furnishings 2.1% | |||||||
Select Comfort Corporation (b) | 129,050 | 3,665,020 | |||||
Retail - Miscellaneous 1.7% | |||||||
PETsMART, Inc. | 92,639 | 3,006,136 | |||||
Retail - Restaurants 0.8% | |||||||
Panera Bread Company Class A (b) (d) | 41,675 | 1,495,299 | |||||
Steel - Specialty Alloys 0.7% | |||||||
GrafTech International, Ltd. (b) | 110,340 | 1,154,156 | |||||
Telecommunications - Equipment 1.3% | |||||||
American Tower Corporation Class A (b) | 58,900 | 895,280 | |||||
Avaya, Inc. (b) | 84,510 | 1,334,413 | |||||
| 2,229,693 | |||||||
Telecommunications - Wireless Equipment 3.3% | |||||||
Research in Motion, Ltd. (b) | 84,200 | 5,762,648 | |||||
Telecommunications - Wireless Services 6.6% | |||||||
Crown Castle International Corporation (b) | 271,240 | 4,000,790 | |||||
NII Holdings, Inc. Class B (b) (d) | 133,202 | 4,487,575 | |||||
Nextel Partners, Inc. (b) (d) | 198,400 | 3,158,528 | |||||
| 11,646,893 | |||||||
Transportation - Airline 1.9% | |||||||
AirTran Holdings, Inc. (b) (d) | 231,290 | 3,270,441 | |||||
Total Common Stocks (Cost $ 135,244,271) | 167,308,584 | ||||||
Short - Term Investments (a) 14.0% | |||||||
Collateral Received for Securities Lending 9.6% | |||||||
Navigator Prime Portfolio | 16,953,906 | 16,953,906 | |||||
Repurchase Agreements (c) 4.4% | |||||||
ABN AMRO Inc. (Dated 6/30/04), 1.40%, Due 7/01/04 (Repurchase proceeds $5,600,218); Collateralized by: | |||||||
United States Government & Agency Issues | $ | 5,600,000 | 5,600,000 | ||||
State Street Bank (Dated 6/30/04), 0.75%, Due 7/01/04 (Repurchase proceeds $2,050,143); Collateralized by: | |||||||
United States Government & Agency Issues | 2,050,100 | 2,050,100 | |||||
| 7,650,100 | |||||||
Total Short-Term Investments (Cost $ 24,604,006) | 24,604,006 | ||||||
Total Investments in Securities (Cost $ 159,848,277) 109.4% | 191,912,590 | ||||||
Other Assets and Liabilities, Net (9.4%) | (16,606,810 | ) | |||||
Net Assets 100.0% | $ | 175,305,780 | |||||
| Shares or Principal Amount | Value (Note 2) | ||||
Common Stocks 98.1% | |||||
Apparel - Shoes & Related Manufacturing 1.0% | |||||
NIKE, Inc. Class B | 3,290 | $ | 249,218 | ||
Beverages - Alcoholic 2.0% | |||||
Anheuser-Busch Companies, Inc. | 9,190 | 496,260 | |||
Commercial Services - Schools 1.6% | |||||
Corinthian Colleges, Inc. (b) | 15,810 | 391,139 | |||
Computer - Data Storage 2.9% | |||||
EMC Corporation (b) | 64,100 | 730,740 | |||
Computer - Local Networks 2.8% | |||||
Cisco Systems, Inc. (b) | 21,565 | 511,090 | |||
Polycom, Inc. (b) | 8,996 | 201,600 | |||
| 712,690 | |||||
Computer - Manufacturers 4.7% | |||||
Apple Computer, Inc. (b) | 7,490 | 243,725 | |||
Dell, Inc. (b) | 26,250 | 940,275 | |||
| 1,184,000 | |||||
Computer Software - Desktop 1.5% | |||||
Microsoft Corporation | 13,510 | 385,846 | |||
Computer Software - Enterprise 4.0% | |||||
Mercury Interactive Corporation (b) | 4,970 | 247,655 | |||
SAP AG Sponsored ADR | 18,425 | 770,349 | |||
| 1,018,004 | |||||
Computer Software - Financial 0.8% | |||||
DST Systems, Inc. (b) | 3,940 | 189,475 | |||
Diversified Operations 10.8% | |||||
General Electric Company | 32,000 | 1,036,800 | |||
Honeywell International, Inc. | 14,250 | 521,978 | |||
Tyco International, Ltd. | 35,145 | 1,164,705 | |||
| 2,723,483 | |||||
Electronics - Semiconductor Manufacturing 2.9% | |||||
Intel Corporation | 26,270 | 725,052 | |||
Finance - Mortgage & Related Services 1.8% | |||||
Countrywide Financial Corporation | 6,334 | 444,963 | |||
Household - Consumer Electronics 1.8% | |||||
Harman International Industries, Inc. | 4,980 | 453,180 | |||
Insurance - Diversified 0.6% | |||||
American International Group, Inc. | 2,170 | 154,678 | |||
Insurance - Property/Casualty/Title 3.1% | |||||
The Allstate Corporation | 16,480 | 767,144 | |||
Internet - E*Commerce 0.7% | |||||
eBay, Inc. (b) | 1,960 | 180,222 | |||
Internet - Internet Content 5.3% | |||||
Yahoo! Inc. (b) | 36,880 | 1,339,850 | |||
Leisure - Toys/Games/Hobby 2.4% | |||||
Marvel Enterprises, Inc. (b) | 31,530 | 615,466 | |||
22
STRONG ENDEAVOR FUND (continued)
| Shares or Principal Amount | Value (Note 2) | |||||
Machinery - Farm 1.0% | ||||||
Deere & Company | 3,480 | $ | 244,087 | |||
Media - Cable TV 0.7% | ||||||
EchoStar Communications Corporation Class A (b) | 5,910 | 181,732 | ||||
Medical - Biomedical/Biotechnology 1.1% | ||||||
Genzyme Corporation (b) | 5,770 | 273,094 | ||||
Medical - Ethical Drugs 3.0% | ||||||
Medicis Pharmaceutical Corporation Class A | 6,460 | 258,077 | ||||
Pfizer, Inc. | 14,704 | 504,053 | ||||
| 762,130 | ||||||
Medical - Generic Drugs 3.9% | ||||||
Teva Pharmaceutical Industries, Ltd. ADR | 14,740 | 991,855 | ||||
Medical - Health Maintenance Organizations 3.2% | ||||||
Anthem, Inc. (b) | 9,010 | 806,936 | ||||
Medical - Products 6.7% | ||||||
Alcon, Inc. | 4,800 | 377,520 | ||||
Boston Scientific Corporation (b) | 10,560 | 451,968 | ||||
Medtronic, Inc. | 9,400 | 457,968 | ||||
Zimmer Holdings, Inc. (b) | 4,400 | 388,080 | ||||
| 1,675,536 | ||||||
Medical - Systems/Equipment 2.1% | ||||||
Fisher Scientific International, Inc. (b) | 9,290 | 536,497 | ||||
Medical - Wholesale Drugs/Sundries 2.0% | ||||||
McKesson Corporation | 14,290 | 490,576 | ||||
Metal Ores - Gold/Silver 1.7% | ||||||
Newmont Mining Corporation Holding Company | 10,880 | 421,709 | ||||
Metal Ores - Miscellaneous 2.2% | ||||||
Phelps Dodge Corporation (b) | 7,310 | 566,598 | ||||
Oil & Gas - Canadian Exploration & Production 0.4% | ||||||
Canadian Natural Resources, Ltd. | 3,610 | 107,939 | ||||
Oil & Gas - Canadian Integrated 1.3% | ||||||
Suncor Energy, Inc. | 12,720 | 325,759 | ||||
Oil & Gas - Drilling 1.0% | ||||||
Nabors Industries, Ltd. (b) | 5,470 | 247,353 | ||||
Oil & Gas - Field Services 2.1% | ||||||
Schlumberger, Ltd. | 8,330 | 529,038 | ||||
Oil & Gas - Production/Pipeline 1.0% | ||||||
The Williams Companies, Inc. | 21,710 | 258,349 | ||||
Oil & Gas - United States Exploration & Production 1.5% | ||||||
Anadarko Petroleum Corporation | 6,550 | 383,830 | ||||
Retail - Drug Stores 1.0% | ||||||
CVS Corporation | 5,980 | 251,280 | ||||
Retail - Major Discount Chains 1.9% | ||||||
Target Corporation | 5,375 | 228,276 | ||||
Wal-Mart Stores, Inc. | 4,710 | 248,500 | ||||
| 476,776 | ||||||
Retail/Wholesale - Office Supplies 1.5% | ||||||
Staples, Inc. | 13,070 | 383,082 | ||||
Telecommunications - Fiber Optics 2.2% | ||||||
Corning, Inc. (b) | 41,700 | 544,602 | ||||
Telecommunications - Wireless Equipment 3.6% | ||||||
Research in Motion, Ltd. (b) | 13,230 | 905,461 | ||||
Telecommunications - Wireless Services 2.3% | ||||||
Crown Castle International Corporation (b) | 21,860 | 322,435 | ||||
NII Holdings, Inc. Class B (b) | 7,710 | 259,750 | ||||
| 582,185 | ||||||
Total Common Stocks (Cost $ 22,772,495) | 24,707,814 | |||||
Short-Term Investments (a) 1.6% | ||||||
Repurchase Agreements (c) | ||||||
ABN AMRO Inc. (Dated 6/30/04), 1.40%, Due 7/01/04 (Repurchase proceeds $300,012); Collateralized by: United States Government & Agency Issues | $ | 300,000 | 300,000 | |||
State Street Bank (Dated 6/30/04), 0.75%, Due 7/01/04 (Repurchase proceeds $117,202); Collateralized by: United States Government & Agency Issues | 117,200 | 117,200 | ||||
Total Short-Term Investments (Cost $ 417,200) | 417,200 | |||||
Total Investments in Securities (Cost $ 23,189,695) 99.7% | 25,125,014 | |||||
Other Assets and Liabilities, Net 0.3% | 68,027 | |||||
Net Assets 100.0% | $ | 25,193,041 | ||||
| Shares or Principal Amount | Value (Note 2) | ||||
Common Stocks 97.6% | |||||
Aerospace - Defense 1.0% | |||||
Northrop Grumman Corporation | 100,000 | $ | 5,370,000 | ||
Banks - Money Center 0.5% | |||||
Citigroup, Inc. | 60,000 | 2,790,000 | |||
Beverages - Alcoholic 0.5% | |||||
Anheuser-Busch Companies, Inc. | 50,000 | 2,700,000 | |||
Chemicals - Specialty 0.6% | |||||
Praxair, Inc. | 90,000 | 3,591,900 | |||
Commercial Services - Advertising 0.8% | |||||
Omnicom Group, Inc. | 60,000 | 4,553,400 | |||
Commercial Services - Miscellaneous 0.7% | |||||
Paychex, Inc. | 115,000 | 3,896,200 | |||
23
| SCHEDULES OF INVESTMENTS IN SECURITIES (continued) | June 30, 2004 (Unaudited) |
STRONG LARGE CAP GROWTH FUND (continued)
| Shares or Principal Amount | Value (Note 2) | ||||
Commercial Services - Schools 1.6% | |||||
Apollo Group, Inc. Class A (b) | 105,000 | $ | 9,270,450 | ||
Commercial Services - Staffing 1.3% | |||||
Manpower, Inc. | 145,000 | 7,361,650 | |||
Computer - Local Networks 5.8% | |||||
Cisco Systems, Inc. (b) | 720,000 | 17,064,000 | |||
Juniper Networks, Inc. (b) | 485,000 | 11,916,450 | |||
Polycom, Inc. (b) | 150,000 | 3,361,500 | |||
| 32,341,950 | |||||
Computer - Manufacturers 2.9% | |||||
Dell, Inc. (b) | 450,000 | 16,119,000 | |||
Computer Software - | |||||
Education/Entertainment 1.5% | |||||
Electronic Arts, Inc. (b) | 150,000 | 8,182,500 | |||
Computer Software - Enterprise 2.1% | |||||
Mercury Interactive Corporation (b) | 130,000 | 6,477,900 | |||
SAP AG Sponsored ADR | 125,000 | 5,226,250 | |||
| 11,704,150 | |||||
Computer Software - Security 1.1% | |||||
Symantec Corporation (b) | 140,000 | 6,129,200 | |||
Cosmetics - Personal Care 4.3% | |||||
Colgate Palmolive Company | 100,000 | 5,845,000 | |||
Kimberly-Clark Corporation | 85,000 | 5,599,800 | |||
LIFE TIME FITNESS, Inc. (b) | 1,000 | 21,000 | |||
The Procter & Gamble Company | 230,000 | 12,521,200 | |||
| 23,987,000 | |||||
Diversified Operations 2.7% | |||||
General Electric Company | 470,000 | 15,228,000 | |||
Electronics - Contract Manufacturing 1.2% | |||||
Flextronics International, Ltd. (b) | 435,000 | 6,938,250 | |||
Electronics - Scientific Measuring 1.8% | |||||
Danaher Corporation | 190,000 | 9,851,500 | |||
Electronics - Semiconductor | |||||
Manufacturing 10.3% | |||||
Analog Devices, Inc. | 185,000 | 8,709,800 | |||
Broadcom Corporation Class A (b) (d) | 120,000 | 5,612,400 | |||
Intel Corporation | 725,000 | 20,010,000 | |||
KLA-Tencor Corporation (b) | 50,000 | 2,469,000 | |||
Marvell Technology Group, Ltd. (b) | 130,000 | 3,471,000 | |||
Maxim Integrated Products, Inc. | 130,000 | 6,814,600 | |||
Microchip Technology, Inc. | 175,000 | 5,519,500 | |||
Xilinx, Inc. | 145,000 | 4,829,950 | |||
| 57,436,250 | |||||
Finance - Consumer/Commercial Loans 1.0% | |||||
SLM Corporation | 140,000 | 5,663,000 | |||
Finance - Investment Brokers 1.0% | |||||
The Goldman Sachs Group, Inc. | 60,000 | 5,649,600 | |||
Finance - Mortgage & Related Services 1.5% | |||||
Countrywide Financial Corporation | 120,000 | 8,430,000 | |||
Food - Flour & Grain 1.0% | |||||
Archer Daniels Midland Company | 340,000 | 5,705,200 | |||
Food - Miscellaneous Preparation 1.6% | |||||
PepsiCo, Inc. | 170,000 | 9,159,600 | |||
Household - Consumer Electronics 1.0% | |||||
Harman International Industries, Inc. | 60,000 | 5,460,000 | |||
Insurance - Diversified 2.2% | |||||
American International Group, Inc. | 175,000 | 12,474,000 | |||
Insurance - Property/Casualty/Title 0.9% | |||||
The PMI Group, Inc. | 120,000 | 5,222,400 | |||
Internet - E*Commerce 2.4% | |||||
Amazon.com, Inc. (b) | 100,000 | 5,440,000 | |||
eBay, Inc. (b) | 90,000 | 8,275,500 | |||
| 13,715,500 | |||||
Internet - Internet Content 2.1% | |||||
Yahoo! Inc. (b) | 330,000 | 11,988,900 | |||
Leisure - Gaming/Equipment 2.1% | |||||
International Game Technology | 185,000 | 7,141,000 | |||
Wynn Resorts, Ltd. (b) | 113,200 | 4,372,916 | |||
| 11,513,916 | |||||
Media - Radio/TV 3.2% | |||||
News Corporation, Ltd. Sponsored ADR (d) | 200,000 | 7,084,000 | |||
Univision Communications, Inc. Class A (b) | 130,000 | 4,150,900 | |||
XM Satellite Radio Holdings, Inc. Class A (b) | 240,000 | 6,549,600 | |||
| 17,784,500 | |||||
Medical - Biomedical/Biotechnology 4.4% | |||||
Amgen, Inc. (b) | 80,000 | 4,365,600 | |||
Biogen Idec, Inc. (b) | 80,000 | 5,060,000 | |||
Genzyme Corporation (b) | 85,000 | 4,023,050 | |||
Gilead Sciences, Inc. (b) | 115,000 | 7,705,000 | |||
Medimmune, Inc. (b) | 160,000 | 3,744,000 | |||
| 24,897,650 | |||||
Medical - Ethical Drugs 2.6% | |||||
Eli Lilly & Company | 85,000 | 5,942,350 | |||
Pfizer, Inc. | 250,000 | 8,570,000 | |||
| 14,512,350 | |||||
Medical - Generic Drugs 1.3% | |||||
Teva Pharmaceutical Industries, Ltd. ADR | 110,000 | 7,401,900 | |||
Medical - Genetics 0.9% | |||||
Genentech, Inc. (b) | 90,000 | 5,058,000 | |||
Medical - Health Maintenance | |||||
Organizations 1.0% | |||||
Anthem, Inc. (b) (d) | 65,000 | 5,821,400 | |||
Medical - Hospitals 0.6% | |||||
HCA, Inc. | 75,000 | 3,119,250 | |||
Medical - Products 4.1% | |||||
Boston Scientific Corporation (b) | 65,000 | 2,782,000 | |||
Guidant Corporation | 30,000 | 1,676,400 | |||
Medtronic, Inc. | 60,000 | 2,923,200 | |||
St. Jude Medical, Inc. (b) | 75,000 | 5,673,750 | |||
Zimmer Holdings, Inc. (b) | 115,000 | 10,143,000 | |||
| 23,198,350 | |||||
Medical/Dental - Supplies 0.5% | |||||
Kinetic Concepts, Inc. (b) | 57,600 | 2,874,240 | |||
Oil & Gas - Field Services 0.9% | |||||
BJ Services Company (b) | 110,000 | 5,042,400 | |||
24
STRONG LARGE CAP GROWTH FUND (continued)
| Shares or Principal Amount | Value (Note 2) | ||||||
Oil & Gas - International Integrated 1.1% | |||||||
Exxon Mobil Corporation | 135,000 | $ | 5,995,350 | ||||
Oil & Gas - Machinery/Equipment 1.5% | |||||||
Smith International, Inc. (b) | 150,000 | 8,364,000 | |||||
Oil & Gas - United States Exploration & Production 2.5% | |||||||
Apache Corporation | 125,000 | 5,443,750 | |||||
Occidental Petroleum Corporation | 115,000 | 5,567,150 | |||||
XTO Energy, Inc. (d) | 100,000 | 2,979,000 | |||||
| 13,989,900 | |||||||
Retail - Consumer Electronics 0.5% | |||||||
Best Buy Company, Inc. | 55,000 | 2,790,700 | |||||
Retail - Department Stores 0.6% | |||||||
Kohl’s Corporation (b) | 75,000 | 3,171,000 | |||||
Retail - Discount & Variety 1.3% | |||||||
Dollar Tree Stores, Inc. (b) | 275,000 | 7,543,250 | |||||
Retail - Drug Stores 1.1% | |||||||
Walgreen Company | 165,000 | 5,974,650 | |||||
Retail - Home Furnishings 0.0% | |||||||
Design Within Reach, Inc. (b) | 1,000 | 16,430 | |||||
Retail - Major Discount Chains 2.3% | |||||||
Target Corporation | 300,000 | 12,741,000 | |||||
Retail - Miscellaneous 1.0% | |||||||
Cabela’s, Inc. (b) | 62,400 | 1,681,680 | |||||
PETCO Animal Supplies, Inc. (b) | 120,000 | 3,865,200 | |||||
| 5,546,880 | |||||||
Retail - Restaurants 0.7% | |||||||
Starbucks Corporation (b) | 90,000 | 3,913,200 | |||||
Retail - Super/Mini Markets 1.0% | |||||||
Whole Foods Marketing, Inc. (d) | 60,000 | 5,727,000 | |||||
Retail/Wholesale - Building Products 2.7% | |||||||
The Home Depot, Inc. | 280,000 | 9,856,000 | |||||
Lowe’s Companies, Inc. | 105,000 | 5,517,750 | |||||
| 15,373,750 | |||||||
Retail/Wholesale - Office Supplies 0.8% | |||||||
Staples, Inc. | 150,000 | 4,396,500 | |||||
Telecommunications - Fiber Optics 1.2% | |||||||
Corning, Inc. (b) | 500,000 | 6,530,000 | |||||
Telecommunications - Wireless Equipment 1.8% | |||||||
QUALCOMM, Inc. | 135,000 | 9,852,300 | |||||
Telecommunications - Wireless | |||||||
Services 0.5% | |||||||
Nextel Communications, Inc. Class A (b) | 100,000 | 2,666,000 | |||||
Total Common Stocks (Cost $ 429,678,211) | 546,735,466 | ||||||
Short-Term Investments (a) 3.4% | |||||||
Collateral Received for Securities Lending 1.2% | |||||||
Navigator Prime Portfolio | 6,651,057 | 6,651,057 | |||||
Repurchase Agreements (c) 2.2% | |||||||
ABN AMRO Inc. (Dated 6/30/04), 1.40%, Due 7/01/04 (Repurchase proceeds $8,300,323); Collateralized by: United States Government & Agency Issues | $ | 8,300,000 | 8,300,000 | ||||
State Street Bank (Dated 6/30/04), 0.75%, Due 7/01/04 (Repurchase proceeds $4,159,287); Collateralized by: United States Government & Agency Issues | 4,159,200 | 4,159,200 | |||||
| 12,459,200 | |||||||
Total Short-Term Investments (Cost $ 19,110,257) | 19,110,257 | ||||||
Total Investments in Securities (Cost $448,788,468) 101.0% | 565,845,723 | ||||||
Other Assets and Liabilities, Net (1.0%) | (5,755,342 | ) | |||||
Net Assets 100.0% | $ | 560,090,381 | |||||
STRONG U.S. EMERGING GROWTH FUND
| Shares or Principal Amount | Value (Note 2) | ||||
Common Stocks 98.2% | |||||
Commercial Services - Advertising 1.4% | |||||
aQuantive, Inc. (b) | 125,250 | $ | 1,237,470 | ||
Commercial Services - Market Research 3.0% | |||||
Corporate Executive Board Company | 17,445 | 1,008,147 | |||
CoStar Group, Inc. (b) | 35,155 | 1,614,669 | |||
| 2,622,816 | |||||
Commercial Services - Schools 3.5% | |||||
Career Education Corporation (b) | 15,285 | 696,385 | |||
Corinthian Colleges, Inc. (b) | 95,740 | 2,368,608 | |||
| 3,064,993 | |||||
Commercial Services - Staffing 1.6% | |||||
Gevity HR, Inc. | 52,235 | 1,368,035 | |||
Computer - IT Services 1.7% | |||||
Cognizant Technology Solutions Corporation (b) | 57,150 | 1,452,181 | |||
Computer Software - Desktop 1.2% | |||||
Sonic Solutions (b) | 49,200 | 1,045,500 | |||
Computer Software - Medical 4.1% | |||||
eResearch Technology, Inc. (b) | 126,217 | 3,534,076 | |||
Electronics - Semiconductor Manufacturing 15.3% | |||||
Cree, Inc. (b) | 52,660 | 1,225,925 | |||
Cymer, Inc. (b) | 23,945 | 896,501 | |||
DSP Group, Inc. (b) | 48,945 | 1,333,262 | |||
Genesis Microchip, Inc. (b) | 80,205 | 1,104,423 | |||
Integrated Silicon Solution, Inc. (b) | 131,150 | 1,601,341 | |||
OmniVision Technologies, Inc. (b) | 78,445 | 1,251,198 | |||
Rudolph Technologies, Inc. (b) | 48,120 | 875,303 | |||
Silicon Laboratories, Inc. (b) | 46,390 | 2,150,176 | |||
25
| SCHEDULES OF INVESTMENTS IN SECURITIES (continued) | June 30, 2004 (Unaudited) |
STRONG U.S. EMERGING GROWTH FUND (continued)
| Shares or Principal Amount | Value (Note 2) | |||||
Trident Microsystems, Inc. (b) | 164,417 | $ | 1,843,115 | |||
Varian Semiconductor Equipment Associates, Inc. (b) | 23,335 | 899,798 | ||||
| 13,181,042 | ||||||
Finance - Consumer/Commercial Loans 2.2% | ||||||
WFS Financial, Inc. (b) | 38,005 | 1,881,627 | ||||
Financial Services - Miscellaneous 3.8% | ||||||
Investors Financial Services Corporation | 56,660 | 2,469,243 | ||||
iPayment, Inc. (b) | 20,095 | 823,895 | ||||
| 3,293,138 | ||||||
Insurance - Property/Casualty/Title 0.9% | ||||||
ProAssurance Corporation (b) | 22,285 | 760,141 | ||||
Internet - E*Commerce 4.3% | ||||||
Getty Images, Inc. (b) | 17,450 | 1,047,000 | ||||
Netflix, Inc. (b) | 38,835 | 1,396,118 | ||||
University of Phoenix Online (b) | 14,095 | 1,234,581 | ||||
| 3,677,699 | ||||||
Internet - Internet Content 1.3% | ||||||
Ask Jeeves, Inc. (b) | 28,995 | 1,131,675 | ||||
Internet - Internet Service Provider 2.1% | ||||||
United Online, Inc. (b) | 100,790 | 1,774,912 | ||||
Internet - Network Security/Solutions 2.0% | ||||||
Akamai Technologies, Inc. (b) | 67,270 | 1,207,496 | ||||
Blue Coat Systems, Inc. (b) | 16,140 | 540,529 | ||||
| 1,748,025 | ||||||
Leisure - Gaming/Equipment 1.5% | ||||||
Shuffle Master, Inc. (b) | 35,290 | 1,281,380 | ||||
Machinery - Construction/Mining 3.4% | ||||||
JLG Industries, Inc. | 113,700 | 1,579,293 | ||||
Joy Global, Inc. | 46,335 | 1,387,270 | ||||
| 2,966,563 | ||||||
Medical - Biomedical/Biotechnology 2.8% | ||||||
Immunicon Corporation (b) | 89,950 | 707,007 | ||||
Martek Biosciences Corporation (b) | 30,225 | 1,697,738 | ||||
| 2,404,745 | ||||||
Medical - Ethical Drugs 2.2% | ||||||
Salix Pharmaceuticals, Ltd. (b) | 56,775 | 1,870,736 | ||||
Medical - Generic Drugs 1.9% | ||||||
American Pharmaceutical Partners, Inc. (b) | 20,307 | 616,927 | ||||
Andrx Group (b) | 35,895 | 1,002,547 | ||||
| 1,619,474 | ||||||
Medical - Outpatient/Home Care 1.1% | ||||||
AmSurg Corporation (b) | 38,332 | 963,283 | ||||
Medical - Systems/Equipment 2.1% | ||||||
Kyphon, Inc. (b) | 63,100 | 1,778,158 | ||||
Medical/Dental - Services 2.7% | ||||||
American Healthways, Inc. (b) | 86,230 | 2,295,443 | ||||
Oil & Gas - Field Services 1.0% | ||||||
Oceaneering International, Inc. (b) | 24,320 | 832,960 | ||||
Oil & Gas - United States Exploration & Production 5.6% | ||||||
KCS Energy, Inc. (b) | 65,980 | 878,854 | ||||
Quicksilver Resources, Inc. (b) | 23,665 | 1,587,211 | ||||
Range Resources Corporation | 66,035 | 964,111 | ||||
Ultra Petroleum Corporation (b) | 37,665 | 1,406,034 | ||||
| 4,836,210 | ||||||
Retail - Clothing/Shoe 5.1% | ||||||
Chicos FAS, Inc. (b) | 31,384 | 1,417,301 | ||||
Hot Topic, Inc. (b) | 39,455 | 808,433 | ||||
Urban Outfitters, Inc. (b) | 35,955 | 2,190,019 | ||||
| 4,415,753 | ||||||
Retail - Home Furnishings 1.3% | ||||||
Design Within Reach, Inc. (b) | 7,705 | 126,593 | ||||
Select Comfort Corporation (b) | 33,905 | 962,902 | ||||
| 1,089,495 | ||||||
Retail - Miscellaneous 3.6% | ||||||
Gander Mountain Company (b) | 56,193 | 1,289,629 | ||||
Sharper Image Corporation (b) | 58,120 | 1,824,387 | ||||
| 3,114,016 | ||||||
Retail - Restaurants 3.3% | ||||||
The Cheesecake Factory, Inc. (b) | 29,915 | 1,190,318 | ||||
P.F. Chang’s China Bistro, Inc. (b) | 39,395 | 1,621,104 | ||||
| 2,811,422 | ||||||
Telecommunications - Wireless Services 4.9% | ||||||
@Road, Inc. (b) | 107,995 | 826,162 | ||||
Alamosa Holdings, Inc. (b) | 187,340 | 1,376,949 | ||||
LCC International, Inc. Class A (b) | 180,775 | 885,797 | ||||
Nextel Partners, Inc. (b) | 74,205 | 1,181,344 | ||||
| 4,270,252 | ||||||
Transportation - Services 1.8% | ||||||
C.H. Robinson Worldwide, Inc. | 33,365 | 1,529,452 | ||||
Transportation - Truck 5.5% | ||||||
J.B. Hunt Transport Services, Inc. | 73,195 | 2,823,863 | ||||
Knight Transportation, Inc. (b) | 33,990 | 976,533 | ||||
Landstar Systems, Inc. (b) | 17,375 | 918,616 | ||||
| 4,719,012 | ||||||
Total Common Stocks (Cost $ 61,757,158) | 84,571,684 | |||||
Short-Term Investments (a) 1.5% | ||||||
Repurchase Agreements (c) | ||||||
State Street Bank (Dated 6/30/04), 0.75%, Due 7/01/04 (Repurchase proceeds $1,253,226); Collateralized by: United States Government & Agency Issues | $ | 1,253,200 | 1,253,200 | |||
Total Short-Term Investments (Cost $ 1,253,200) | 1,253,200 | |||||
Total Investments in Securities (Cost $63,010,358) 99.7% | 85,824,884 | |||||
Other Assets and Liabilities, Net 0.3% | 264,839 | |||||
Net Assets 100.0% | $ | 86,089,723 | ||||
26
| Shares or Principal Amount | Value (Note 2) | ||||
Common Stocks 99.5% | |||||
Auto/Truck - Original Equipment 0.9% | |||||
Eaton Corporation | 42,140 | $ | 2,728,144 | ||
Commercial Services - Market Research 1.2% | |||||
Corporate Executive Board Company | 62,130 | 3,590,493 | |||
Commercial Services - Schools 1.0% | |||||
Career Education Corporation (b) | 22,750 | 1,036,490 | |||
Corinthian Colleges, Inc. (b) (d) | 78,690 | 1,946,791 | |||
| 2,983,281 | |||||
Commercial Services - Security/Safety 0.7% | |||||
Armor Holdings, Inc. (b) (d) | 55,700 | 1,893,800 | |||
Computer - Local Networks 3.4% | |||||
Juniper Networks, Inc. (b) | 135,290 | 3,324,075 | |||
Polycom, Inc. (b) | 287,410 | 6,440,858 | |||
| 9,764,933 | |||||
Computer - Manufacturers 1.7% | |||||
Apple Computer, Inc. (b) | 152,270 | 4,954,866 | |||
Computer Software - Education/Entertainment 3.1% | |||||
Activision, Inc. (b) | 270,166 | 4,295,639 | |||
Electronic Arts, Inc. (b) | 83,760 | 4,569,108 | |||
| 8,864,747 | |||||
Computer Software - Enterprise 4.6% | |||||
Hyperion Solutions Corporation (b) | 33,600 | 1,468,992 | |||
Mercury Interactive Corporation (b) | 128,210 | 6,388,704 | |||
TIBCO Software, Inc. (b) (d) | 635,530 | 5,370,228 | |||
| 13,227,924 | |||||
Computer Software - Financial 0.8% | |||||
DST Systems, Inc. (b) | 45,300 | 2,178,477 | |||
Computer Software - Security 0.5% | |||||
Symantec Corporation (b) | 35,100 | 1,536,678 | |||
Electronics - Semiconductor Manufacturing 7.3% | |||||
Broadcom Corporation Class A (b) | 126,000 | 5,893,020 | |||
KLA-Tencor Corporation (b) | 46,660 | 2,304,071 | |||
Linear Technology Corporation | 52,840 | 2,085,595 | |||
Marvell Technology Group, Ltd. (b) | 198,800 | 5,307,960 | |||
Maxim Integrated Products, Inc. | 41,000 | 2,149,220 | |||
Silicon Laboratories, Inc. (b) (d) | 74,400 | 3,448,440 | |||
| 21,188,306 | |||||
Finance - Mortgage & Related Services 1.8% | |||||
Countrywide Financial Corporation | 74,000 | 5,198,500 | |||
Financial Services - Miscellaneous 0.7% | |||||
Euronet Services, Inc. (b) (d) | 92,500 | 2,139,525 | |||
Household - Consumer Electronics 2.7% | |||||
Harman International Industries, Inc. | 85,390 | 7,770,490 | |||
Insurance - Property/Casualty/Title 1.6% | |||||
Endurance Specialty Holdings, Ltd. (d) | 129,570 | 4,509,036 | |||
Internet - E*Commerce 2.4% | |||||
Getty Images, Inc. (b) | 35,800 | 2,148,000 | |||
Netflix, Inc. (b) (d) | 132,300 | 4,756,185 | |||
| 6,904,185 | |||||
Internet - Software 0.9% | |||||
ValueClick, Inc. (b) | 218,300 | 2,615,234 | |||
Leisure - Products 1.9% | |||||
Multimedia Games, Inc. (b) (d) | 200,716 | 5,383,203 | |||
Leisure - Toys/Games/Hobby 1.8% | |||||
Marvel Enterprises, Inc. (b) (d) | 268,957 | 5,250,041 | |||
Media - Radio/TV 1.4% | |||||
The E.W. Scripps Company Class A | 37,225 | 3,908,625 | |||
Medical - Biomedical/Biotechnology 3.8% | |||||
Digene Corporation (b) | 138,449 | 5,057,542 | |||
Genzyme Corporation (b) | 80,555 | 3,812,668 | |||
Sepracor, Inc. (b) (d) | 41,600 | 2,200,640 | |||
| 11,070,850 | |||||
Medical - Ethical Drugs 1.5% | |||||
Medicis Pharmaceutical Corporation Class A | 105,250 | 4,204,737 | |||
Medical - Generic Drugs 2.1% | |||||
Teva Pharmaceutical Industries, Ltd. ADR (d) | 89,500 | 6,022,455 | |||
Medical - Health Maintenance Organizations 1.5% | |||||
Anthem, Inc. (b) (d) | 49,705 | 4,451,580 | |||
Medical - Hospitals 1.5% | |||||
Community Health Systems, Inc. (b) | 160,050 | 4,284,539 | |||
Medical - Products 3.0% | |||||
American Medical Systems Holdings, Inc. (b) (d) | 119,200 | 4,017,040 | |||
Zimmer Holdings, Inc. (b) | 53,965 | 4,759,713 | |||
| 8,776,753 | |||||
Medical - Systems/Equipment 3.1% | |||||
Fisher Scientific International, Inc. (b) (d) | 100,070 | 5,779,042 | |||
Varian Medical Systems, Inc. (b) | 41,165 | 3,266,443 | |||
| 9,045,485 | |||||
Medical - Wholesale Drugs/Sundries 2.1% | |||||
McKesson Corporation | 179,300 | 6,155,369 | |||
Medical/Dental - Services 1.0% | |||||
Quest Diagnostics, Inc. | 32,400 | 2,752,380 | |||
Medical/Dental - Supplies 0.8% | |||||
Dentsply International, Inc. | 44,070 | 2,296,047 | |||
Metal Ores - Gold/Silver 1.9% | |||||
Placer Dome, Inc. | 335,590 | 5,584,218 | |||
Metal Ores - Miscellaneous 1.9% | |||||
Phelps Dodge Corporation (b) (d) | 70,400 | 5,456,704 | |||
Oil & Gas - Canadian Exploration & Production 0.4% | |||||
Canadian Natural Resources, Ltd. | 41,800 | 1,249,820 | |||
Oil & Gas - Canadian Integrated 1.5% | |||||
Suncor Energy, Inc. | 164,210 | 4,205,418 | |||
Oil & Gas - Drilling 1.5% | |||||
ENSCO International, Inc. (d) | 89,890 | 2,615,799 | |||
Nabors Industries, Ltd. (b) | 34,805 | 1,573,882 | |||
| 4,189,681 | |||||
27
| SCHEDULES OF INVESTMENTS IN SECURITIES (continued) | June 30, 2004 (Unaudited) |
STRONG ENTERPRISE FUND (continued)
| Shares or Principal Amount | Value (Note 2) | ||||||
Oil & Gas - Machinery/Equipment 2.6% | |||||||
Grant Prideco, Inc. (b) (d) | 256,000 | $ | 4,725,760 | ||||
Smith International, Inc. (b) | 51,570 | 2,875,543 | |||||
| 7,601,303 | |||||||
Oil & Gas - Production/Pipeline 1.0% | |||||||
The Williams Companies, Inc. (d) | 238,800 | 2,841,720 | |||||
Oil & Gas - United States Exploration & Production 4.0% | |||||||
Anadarko Petroleum Corporation (d) | 75,500 | 4,424,300 | |||||
Chesapeake Energy Corporation (d) | 264,810 | 3,898,003 | |||||
Devon Energy Corporation | 49,920 | 3,294,720 | |||||
| 11,617,023 | |||||||
Pollution Control - Services 1.5% | |||||||
Stericycle, Inc. (b) | 84,390 | 4,366,339 | |||||
Retail - Clothing/Shoe 1.9% | |||||||
Coach, Inc. (b) | 72,720 | 3,286,217 | |||||
Urban Outfitters, Inc. (b) (d) | 36,260 | 2,208,597 | |||||
| 5,494,814 | |||||||
Retail - Home Furnishings 2.0% | |||||||
Select Comfort Corporation (b) | 204,510 | 5,808,084 | |||||
Retail - Miscellaneous 1.8% | |||||||
PETsMART, Inc. | 155,562 | 5,047,987 | |||||
Retail - Restaurants 0.8% | |||||||
Panera Bread Company Class A (b) (d) | 68,080 | 2,442,710 | |||||
Retail/Wholesale - Office Supplies 1.3% | |||||||
Staples, Inc. | 123,600 | 3,622,716 | |||||
Telecommunications - Equipment 1.3% | |||||||
American Tower Corporation Class A (b) | 96,400 | 1,465,280 | |||||
Avaya, Inc. (b) | 141,930 | 2,241,075 | |||||
| 3,706,355 | |||||||
Telecommunications - Fiber Optics 2.3% | |||||||
Corning, Inc. (b) | 518,390 | 6,770,173 | |||||
Telecommunications - Wireless Equipment 3.2% | |||||||
Research in Motion, Ltd. (b) | 133,440 | 9,132,634 | |||||
Telecommunications - Wireless Services 5.8% | |||||||
Crown Castle International Corporation (b) (d) | 449,800 | 6,634,550 | |||||
NII Holdings, Inc. Class B (b) (d) | 170,980 | 5,760,316 | |||||
Nextel Partners, Inc. (b) (d) | 278,660 | 4,436,267 | |||||
| 16,831,133 | |||||||
Transportation - Airline 2.0% | |||||||
AirTran Holdings, Inc. (b) (d) | 397,450 | 5,619,943 | |||||
Total Common Stocks (Cost $ 233,942,195) | 287,239,458 | ||||||
Short-Term Investments (a) 11.4% | |||||||
Collateral Received for Securities Lending 10.7% | |||||||
Navigator Prime Portfolio | 30,900,750 | $ | 30,900,750 | ||||
Repurchase Agreements (c) 0.7% | |||||||
ABN AMRO Inc. (Dated 6/30/04), 1.40%, Due 7/01/04 (Repurchase proceeds $100,004); Collateralized by: United States Government & Agency Issues | $ | 100,000 | 100,000 | ||||
State Street Bank (Dated 6/30/04), 0.75%, Due 7/01/04 (Repurchase proceeds $1,962,441); Collateralized by: United States Government & Agency Issues | 1,962,400 | 1,962,400 | |||||
| 2,062,400 | |||||||
Total Short-Term Investments (Cost $ 32,963,150) | 32,963,150 | ||||||
Total Investments in Securities (Cost $266,905,345) 110.9% | 320,202,608 | ||||||
Other Assets and Liabilities, Net (10.9%) | (31,511,690 | ) | |||||
Net Assets 100.0% | $ | 288,690,918 | |||||
| Shares or Principal Amount | Value (Note 2) | ||||
Common Stocks 97.4% | |||||
Building - Resident/Commercial 1.9% | |||||
Centex Corporation | 65,000 | $ | 2,973,750 | ||
Commercial Services - Miscellaneous 1.3% | |||||
Jackson Hewitt Tax Service, Inc. (b) | 115,500 | 2,021,250 | |||
Commercial Services - Schools 4.7% | |||||
Apollo Group, Inc. Class A (b) | 45,000 | 3,973,050 | |||
Career Education Corporation (b) | 75,000 | 3,417,000 | |||
| 7,390,050 | |||||
Computer - Local Networks 5.3% | |||||
Cisco Systems, Inc. (b) | 195,000 | 4,621,500 | |||
Polycom, Inc. (b) | 168,000 | 3,764,880 | |||
| 8,386,380 | |||||
Computer - Peripheral Equipment 1.9% | |||||
Zebra Technologies Corporation (b) | 35,000 | 3,045,000 | |||
Computer Software - Education/Entertainment 2.1% | |||||
Electronic Arts, Inc. (b) | 60,000 | 3,273,000 | |||
Computer Software - Medical 2.8% | |||||
eResearch Technology, Inc. (b) | 155,000 | 4,340,000 | |||
Cosmetics - Personal Care 0.0% | |||||
LIFE TIME FITNESS, Inc. (b) | 300 | 6,300 | |||
Diversified Operations 1.9% | |||||
General Electric Company | 95,000 | 3,078,000 | |||
Electronics - Scientific Measuring 4.3% | �� | ||||
Danaher Corporation | 130,000 | 6,740,500 | |||
28
STRONG GROWTH 20 FUND (continued)
| Shares or Principal Amount | Value (Note 2) | ||||||
Electronics - Semiconductor Manufacturing 3.3% | |||||||
Marvell Technology Group, Ltd. (b) | 197,600 | $ | 5,275,920 | ||||
Energy - Other 2.8% | |||||||
Massey Energy Company | 155,000 | 4,372,550 | |||||
Finance - Mortgage & Related Services 4.5% | |||||||
Doral Financial Corporation | 205,000 | 7,072,500 | |||||
Finance - Savings & Loan 2.6% | |||||||
Westcorp | 90,000 | 4,090,500 | |||||
Household - Consumer Electronics 3.5% | |||||||
Harman International Industries, Inc. | 60,000 | 5,460,000 | |||||
Insurance - Diversified 2.0% | |||||||
American International Group, Inc. | 45,000 | 3,207,600 | |||||
Internet - E*Commerce 5.0% | |||||||
eBay, Inc. (b) | 85,000 | 7,815,750 | |||||
Internet - Internet Content 9.9% | |||||||
Ask Jeeves, Inc. (b) | 130,000 | 5,073,900 | |||||
Yahoo! Inc. (b) | 290,000 | 10,535,700 | |||||
| 15,609,600 | |||||||
Internet - Network Security/Solutions 0.8% | |||||||
Digital River, Inc. (b) | 40,000 | 1,305,200 | |||||
Leisure - Gaming/Equipment 5.5% | |||||||
International Game Technology | 110,000 | 4,246,000 | |||||
Station Casinos, Inc. | 90,000 | 4,356,000 | |||||
| 8,602,000 | |||||||
Medical - Generic Drugs 6.2% | |||||||
Teva Pharmaceutical Industries, Ltd. ADR | 145,000 | 9,757,050 | |||||
Medical - Genetics 4.1% | |||||||
Genentech, Inc. (b) | 115,000 | 6,463,000 | |||||
Medical - Products 2.6% | |||||||
Boston Scientific Corporation (b) | 95,000 | 4,066,000 | |||||
Oil & Gas - Field Services 3.9% | |||||||
BJ Services Company (b) | 135,000 | 6,188,400 | |||||
Oil & Gas - United States Exploration & Production 6.5% | |||||||
Ultra Petroleum Corporation (b) | 275,000 | 10,265,750 | |||||
Retail - Clothing/Shoe 4.4% | |||||||
Coach, Inc. (b) | 155,000 | 7,004,450 | |||||
Retail - Home Furnishings 0.0% | |||||||
Design Within Reach, Inc. (b) | 300 | 4,929 | |||||
Telecommunications - Fiber Optics 3.6% | |||||||
Corning, Inc. (b) | 435,000 | 5,681,100 | |||||
Total Common Stocks (Cost $ 117,308,520) | 153,496,529 | ||||||
Short-Term Investments (a) 4.3% | |||||||
Repurchase Agreements (c) | |||||||
ABN AMRO Inc. (Dated 6/30/04), 1.40%, Due 7/01/04 (Repurchase proceeds $5,100,198); Collateralized by: United States Government & Agency Issues | $ | 5,100,000 | 5,100,000 | ||||
State Street Bank (Dated 6/30/04), 0.75%, Due 7/01/04 (Repurchase proceeds $1,612,734); Collateralized by: United States Government & Agency Issues | 1,612,700 | 1,612,700 | |||||
Total Short-Term Investments (Cost $ 6,712,700) | 6,712,700 | ||||||
Total Investments in Securities (Cost $ 124,021,220) 101.7% | 160,209,229 | ||||||
Other Assets and Liabilities, Net (1.7%) | (2,685,414 | ) | |||||
Net Assets 100.0% | $ | 157,523,815 | |||||
| Shares or Principal Amount | Value (Note 2) | ||||
Common Stocks 99.5% | |||||
Auto/Truck - Original Equipment 0.4% | |||||
Eaton Corporation | 105,000 | $ | 6,797,700 | ||
Banks - Midwest 0.5% | |||||
TCF Financial Corporation | 145,000 | 8,417,250 | |||
Banks - Super Regional 1.1% | |||||
Wells Fargo & Company | 310,000 | 17,741,300 | |||
Beverages - Soft Drinks 0.6% | |||||
Cott Corporation (b) | 325,000 | 10,530,000 | |||
Chemicals - Specialty 0.8% | |||||
Praxair, Inc. | 335,000 | 13,369,850 | |||
Commercial Services - Market Research 0.1% | |||||
Corporate Executive Board Company | 32,300 | 1,866,617 | |||
Commercial Services - Miscellaneous 1.7% | |||||
Jackson Hewitt Tax Service, Inc. (b) | 209,000 | 3,657,500 | |||
Paychex, Inc. | 725,000 | 24,563,000 | |||
| 28,220,500 | |||||
Commercial Services - Schools 4.7% | |||||
Apollo Group, Inc. Class A (b) | 395,000 | 34,874,550 | |||
Corinthian Colleges, Inc. (b) | 900,000 | 22,266,000 | |||
Strayer Education, Inc. | 175,000 | 19,524,750 | |||
| 76,665,300 | |||||
Computer - Data Storage 0.6% | |||||
EMC Corporation (b) | 500,000 | 5,700,000 | |||
Xyratex, Ltd. (b) | 322,600 | 4,129,280 | |||
| 9,829,280 | |||||
Computer - IT Services 1.6% | |||||
Accenture, Ltd. Class A (b) | 75,000 | 2,061,000 | |||
Cognizant Technology Solutions Corporation (b) | 965,000 | 24,520,650 | |||
| 26,581,650 | |||||
29
SCHEDULES OF INVESTMENTS IN SECURITIES (continued) | June 30, 2004 (Unaudited) |
STRONG GROWTH FUND (continued)
| Shares or Principal Amount | Value (Note 2) | ||||
Computer - Local Networks 4.9% | |||||
Cisco Systems, Inc. (b) | 1,560,000 | $ | 36,972,000 | ||
Juniper Networks, Inc. (b) | 945,000 | 23,218,650 | |||
Polycom, Inc. (b) | 897,000 | 20,101,770 | |||
| 80,292,420 | |||||
Computer - Manufacturers 3.2% | |||||
Dell, Inc. (b) | 1,450,000 | 51,939,000 | |||
Computer Software - Desktop 2.2% | |||||
Microsoft Corporation | 1,110,000 | 31,701,600 | |||
Red Hat, Inc. (b) | 160,000 | 3,675,200 | |||
| 35,376,800 | |||||
Computer Software - Education/Entertainment 1.6% | |||||
Blackboard, Inc. (b) | 15,500 | 310,775 | |||
Electronic Arts, Inc. (b) | 460,000 | 25,093,000 | |||
| 25,403,775 | |||||
Computer Software - Enterprise 3.3% | |||||
Cognos, Inc. (b) | 470,000 | 16,995,200 | |||
Mercury Interactive Corporation (b) | 650,000 | 32,389,500 | |||
Oracle Systems Corporation (b) | 375,000 | 4,473,750 | |||
| 53,858,450 | |||||
Computer Software - Medical 0.1% | |||||
Cerner Corporation (b) | 55,000 | 2,451,900 | |||
Computer Software - Security 0.1% | |||||
Symantec Corporation (b) | 55,000 | 2,407,900 | |||
Cosmetics - Personal Care 1.4% | |||||
Colgate Palmolive Company | 170,000 | 9,936,500 | |||
LIFE TIME FITNESS, Inc. (b) | 3,200 | 67,200 | |||
The Procter & Gamble Company | 225,000 | 12,249,000 | |||
| 22,252,700 | |||||
Diversified Operations 3.1% | |||||
Agilent Technologies, Inc. (b) | 160,000 | 4,684,800 | |||
General Electric Company | 1,275,000 | 41,310,000 | |||
ITT Industries, Inc. | 50,000 | 4,150,000 | |||
| 50,144,800 | |||||
Electronics - Contract Manufacturing 1.9% | |||||
Flextronics International, Ltd. (b) | 2,000,000 | 31,900,000 | |||
Electronics - Scientific Measuring 0.5% | |||||
PerkinElmer, Inc. | 445,000 | 8,917,800 | |||
Electronics - Semiconductor Manufacturing 7.5% | |||||
Altera Corporation (b) | 355,000 | 7,888,100 | |||
Analog Devices, Inc. | 425,000 | 20,009,000 | |||
Intel Corporation | 635,000 | 17,526,000 | |||
Linear Technology Corporation | 285,000 | 11,248,950 | |||
Marvell Technology Group, Ltd. (b) (d) | 140,000 | 3,738,000 | |||
Maxim Integrated Products, Inc. | 135,000 | 7,076,700 | |||
Microchip Technology, Inc. | 1,050,000 | 33,117,000 | |||
SiRF Technology Holdings, Inc. (b) | 370,000 | 4,835,900 | |||
Xilinx, Inc. | 505,000 | 16,821,550 | |||
| 122,261,200 | |||||
Finance - Consumer/Commercial Loans 1.1% | |||||
SLM Corporation | 450,000 | 18,202,500 | |||
Finance - Investment Brokers 0.8% | |||||
Ameritrade Holding Corporation (b) | 175,000 | 1,986,250 | |||
The Goldman Sachs Group, Inc. | 115,000 | 10,828,400 | |||
| 12,814,650 | |||||
Finance - Mortgage & Related Services 1.5% | |||||
Countrywide Financial Corporation (d) | 250,000 | 17,562,500 | |||
FNMA | 95,000 | 6,779,200 | |||
| 24,341,700 | |||||
Financial Services - Miscellaneous 3.5% | |||||
Alliance Data Systems Corporation (b) | 600,000 | 25,350,000 | |||
American Express Company | 155,000 | 7,963,900 | |||
First Marblehead Corporation (b) | 596,800 | 24,027,168 | |||
| 57,341,068 | |||||
Food - Miscellaneous Preparation 0.6% | |||||
PepsiCo, Inc. | 190,000 | 10,237,200 | |||
Household - Consumer Electronics 1.1% | |||||
Harman International Industries, Inc. | 200,000 | 18,200,000 | |||
Insurance - Diversified 1.4% | |||||
American International Group, Inc. | 315,000 | 22,453,200 | |||
Insurance - Property/Casualty/Title 0.4% | |||||
RenaissanceRe Holdings, Ltd. | 135,000 | 7,283,250 | |||
Internet - E*Commerce 5.1% | |||||
Amazon.com, Inc. (b) | 460,000 | 25,024,000 | |||
eBay, Inc. (b) | 455,000 | 41,837,250 | |||
eCollege.com (b) | 500,000 | 8,000,000 | |||
University of Phoenix Online (b) | 105,000 | 9,196,950 | |||
| 84,058,200 | |||||
Internet - Internet Content 2.4% | |||||
FindWhat.com (b) | 300,000 | 6,942,000 | |||
Yahoo! Inc. (b) | 890,000 | 32,333,700 | |||
| 39,275,700 | |||||
Internet - Network Security/Solutions 0.8% | |||||
Digital River, Inc. (b) | 425,000 | 13,867,750 | |||
Internet - Software 0.3% | |||||
ValueClick, Inc. (b) | 377,300 | 4,520,054 | |||
Leisure - Gaming/Equipment 0.4% | |||||
International Game Technology | 170,000 | 6,562,000 | |||
Machinery - General Industrial 0.6% | |||||
Dover Corporation | 250,000 | 10,525,000 | |||
Media - Radio/TV 2.0% | |||||
News Corporation, Ltd. Sponsored ADR (d) | 225,000 | 7,969,500 | |||
Univision Communications, Inc. Class A (b) | 525,000 | 16,763,250 | |||
XM Satellite Radio Holdings, Inc. Class A (b) | 320,000 | 8,732,800 | |||
| 33,465,550 | |||||
Medical - Biomedical/Biotechnology 3.8% | |||||
Amylin Pharmaceuticals, Inc. (b) | 195,000 | 4,446,000 | |||
Biogen Idec, Inc. (b) | 40,000 | 2,530,000 | |||
Digene Corporation (b) | 555,000 | 20,274,150 | |||
Gilead Sciences, Inc. (b) | 515,000 | 34,505,000 | |||
| 61,755,150 | |||||
Medical - Drug/Diversified 0.5% | |||||
Bone Care International, Inc. (b) | 200,000 | 4,684,000 | |||
MGI Pharma, Inc. (b) | 110,000 | 2,971,100 | |||
| 7,655,100 | |||||
Medical - Ethical Drugs 3.8% | |||||
Allergan, Inc. | 45,000 | 4,028,400 | |||
Eli Lilly & Company | 205,000 | 14,331,550 | |||
Pfizer, Inc. | 1,260,000 | 43,192,800 | |||
| 61,552,750 | |||||
30
STRONG GROWTH FUND (continued)
| Shares or Principal Amount | Value (Note 2) | ||||||
Medical - Generic Drugs 0.7% | |||||||
Teva Pharmaceutical Industries, Ltd. ADR (d) | 175,000 | $ | 11,775,750 | ||||
Medical - Health Maintenance Organizations 0.8% | |||||||
Molina Healthcare, Inc. (b) | 355,000 | 13,553,900 | |||||
Medical - Outpatient/Home Care 0.7% | |||||||
Psychiatric Solutions, Inc. (b) | 455,000 | 11,343,150 | |||||
Medical - Products 4.7% | |||||||
Advanced Neuromodulation Systems, Inc. (b) | 115,000 | 3,772,000 | |||||
Boston Scientific Corporation (b) | 365,000 | 15,622,000 | |||||
Charles River Laboratories International, Inc. (b) | 170,000 | 8,307,900 | |||||
Guidant Corporation | 50,000 | 2,794,000 | |||||
INAMED Corporation (b) | 220,000 | 13,827,000 | |||||
Medtronic, Inc. | 50,000 | 2,436,000 | |||||
Respironics, Inc. (b) | 140,000 | 8,225,000 | |||||
St. Jude Medical, Inc. (b) | 180,000 | 13,617,000 | |||||
Zimmer Holdings, Inc. (b) | 90,000 | 7,938,000 | |||||
| 76,538,900 | |||||||
Medical - Systems/Equipment 0.2% | |||||||
Kyphon, Inc. (b) | 100,000 | 2,818,000 | |||||
Medical/Dental - Services 1.4% | |||||||
Covance, Inc. (b) | 305,000 | 11,766,900 | |||||
VCA Antech, Inc. (b) | 250,000 | 11,205,000 | |||||
| 22,971,900 | |||||||
Medical/Dental - Supplies 1.3% | |||||||
Kinetic Concepts, Inc. (b) | 300,000 | 14,970,000 | |||||
Mentor Corporation | 170,000 | 5,829,300 | |||||
| 20,799,300 | |||||||
Oil & Gas - Drilling 0.2% | |||||||
ENSCO International, Inc. | 135,000 | 3,928,500 | |||||
Oil & Gas - Field Services 0.2% | |||||||
BJ Services Company (b) | 70,000 | 3,208,800 | |||||
Oil & Gas - Machinery/Equipment 1.4% | |||||||
Smith International, Inc. (b) (d) | 420,000 | 23,419,200 | |||||
Oil & Gas - United States Exploration & Production 1.0% | |||||||
XTO Energy, Inc. (d) | 560,000 | 16,682,400 | |||||
Retail - Clothing/Shoe 1.9% | |||||||
Chicos FAS, Inc. (b) | 200,000 | 9,032,000 | |||||
Coach, Inc. (b) | 175,000 | 7,908,250 | |||||
Ross Stores, Inc. | 525,000 | 14,049,000 | |||||
| 30,989,250 | |||||||
Retail - Home Furnishings 0.6% | |||||||
Design Within Reach, Inc. (b) | 3,200 | 52,576 | |||||
Select Comfort Corporation (b) | 350,000 | 9,940,000 | |||||
| 9,992,576 | |||||||
Retail - Leisure Product 2.2% | |||||||
Dick’s Sporting Goods, Inc. (b) | 750,000 | 25,012,500 | |||||
Guitar Center, Inc. (b) | 235,000 | 10,450,450 | |||||
| 35,462,950 | |||||||
Retail - Miscellaneous 4.4% | |||||||
Cabela’s, Inc. (b) | 7,300 | 196,735 | |||||
PETCO Animal Supplies, Inc. (b) | 885,000 | 28,505,850 | |||||
PETsMART, Inc. | 1,325,000 | 42,996,250 | |||||
| 71,698,835 | |||||||
Retail - Restaurants 0.9% | |||||||
P.F. Chang’s China Bistro, Inc. (b) | 155,000 | 6,378,250 | |||||
Red Robin Gourmet Burgers, Inc. (b) | 333,500 | 9,127,895 | |||||
| 15,506,145 | |||||||
Retail - Super/Mini Markets 1.5% | |||||||
Whole Foods Marketing, Inc. (d) | 265,000 | 25,294,250 | |||||
Retail/Wholesale - Building Products 1.9% | |||||||
Fastenal Company | 75,000 | 4,262,250 | |||||
The Home Depot, Inc. | 180,000 | 6,336,000 | |||||
Hughes Supply, Inc. | 215,000 | 12,669,950 | |||||
Lowe’s Companies, Inc. | 150,000 | 7,882,500 | |||||
| 31,150,700 | |||||||
Telecommunications - Fiber Optics 0.5% | |||||||
Corning, Inc. (b) | 600,000 | 7,836,000 | |||||
Transportation - Airline 0.3% | |||||||
JetBlue Airways Corporation (b) | 170,000 | 4,994,600 | |||||
Transportation - Services 0.7% | |||||||
Expeditors International of Washington, Inc. | 225,000 | 11,117,250 | |||||
Total Common Stocks (Cost $ 1,223,631,692) | 1,632,419,370 | ||||||
Short-Term Investments (a) 1.6% | |||||||
Collateral Received for Securities Lending 1.1% | |||||||
Navigator Prime Portfolio | 18,012,000 | 18,012,000 | |||||
Repurchase Agreements (c) 0.5% | |||||||
ABN AMRO Inc. (Dated 6/30/04), 1.40%, Due 7/01/04 (Repurchase proceeds $4,900,191); Collateralized by: United States Government & Agency Issues | $ | 4,900,000 | 4,900,000 | ||||
State Street Bank (Dated 6/30/04), 0.75%, Due 7/01/04 (Repurchase proceeds $2,598,254); Collateralized by: United States Government & Agency Issues | 2,598,200 | 2,598,200 | |||||
| 7,498,200 | |||||||
Total Short-Term Investments (Cost $ 25,510,200) | 25,510,200 | ||||||
Total Investments in Securities (Cost $1,249,141,892) 101.1% | 1,657,929,570 | ||||||
Other Assets and Liabilities, Net (1.1%) | (17,792,793 | ) | |||||
Net Assets 100.0% | $ | 1,640,136,777 | |||||
STRONG LARGE COMPANY GROWTH FUND
| Shares or Principal Amount | Value (Note 2) | ||||
Common Stocks 96.6% | |||||
Apparel - Shoes & Related Manufacturing 1.4% | |||||
NIKE, Inc. Class B | 13,790 | $ | 1,044,592 | ||
Beverages - Alcoholic 2.0% | |||||
Anheuser-Busch Companies, Inc. | 27,590 | 1,489,860 | |||
Commercial Services - Schools 1.6% | |||||
Corinthian Colleges, Inc. (b) | 46,200 | 1,142,988 | |||
Computer - Data Storage 3.0% | |||||
EMC Corporation (b) | 192,900 | 2,199,060 | |||
31
SCHEDULES OF INVESTMENTS IN SECURITIES (continued) | June 30, 2004 (Unaudited) |
STRONG LARGE COMPANY GROWTH FUND (continued)
| Shares or Principal Amount | Value (Note 2) | ||||
Computer - Local Networks 3.2% | |||||
Cisco Systems, Inc. (b) | 64,850 | $ | 1,536,945 | ||
Polycom, Inc. (b) | 36,750 | 823,567 | |||
| 2,360,512 | |||||
Computer - Manufacturers 3.2% | |||||
Dell, Inc. (b) | 66,190 | 2,370,926 | |||
Computer Software - Desktop 1.5% | |||||
Microsoft Corporation | 38,300 | 1,093,848 | |||
Computer Software - Enterprise 3.0% | |||||
SAP AG Sponsored ADR | 53,260 | 2,226,801 | |||
Computer Software - Financial 0.8% | |||||
DST Systems, Inc. (b) | 11,550 | 555,439 | |||
Cosmetics - Personal Care 1.3% | |||||
The Procter & Gamble Company | 17,840 | 971,210 | |||
Diversified Operations 10.7% | |||||
General Electric Company | 88,850 | 2,878,740 | |||
Honeywell International, Inc. | 41,600 | 1,523,808 | |||
Tyco International, Ltd. | 105,350 | 3,491,299 | |||
| 7,893,847 | |||||
Electronics - Semiconductor Manufacturing 3.7% | |||||
Intel Corporation | 98,030 | 2,705,628 | |||
Finance - Mortgage & Related Services 2.1% | |||||
Countrywide Financial Corporation | 22,000 | 1,545,500 | |||
Food - Miscellaneous Preparation 1.4% | |||||
PepsiCo, Inc. | 19,620 | 1,057,126 | |||
Household - Consumer Electronics 1.7% | |||||
Harman International Industries, Inc. | 13,400 | 1,219,400 | |||
Insurance - Diversified 0.7% | |||||
American International Group, Inc. | 6,700 | 477,576 | |||
Insurance - Property/Casualty/Title 3.4% | |||||
The Allstate Corporation | 53,250 | 2,478,787 | |||
Internet - E*Commerce 0.8% | |||||
eBay, Inc. (b) | 6,250 | 574,687 | |||
Internet - Internet Content 2.1% | |||||
Yahoo! Inc. (b) | 43,300 | 1,573,089 | |||
Leisure - Toys/Games/Hobby 2.3% | |||||
Marvel Enterprises, Inc. (b) | 85,350 | 1,666,032 | |||
Machinery - Farm 1.0% | |||||
Deere & Company | 10,750 | 754,005 | |||
Media - Cable TV 0.2% | |||||
EchoStar Communications Corporation Class A (b) | 5,500 | 169,125 | |||
Medical - Biomedical/Biotechnology 1.1% | |||||
Genzyme Corporation (b) | 17,000 | 804,610 | |||
Medical - Ethical Drugs 2.9% | |||||
Medicis Pharmaceutical Corporation Class A | 17,350 | 693,132 | |||
Pfizer, Inc. | 43,000 | 1,474,040 | |||
| 2,167,172 | |||||
Medical - Generic Drugs 3.9% | |||||
Teva Pharmaceutical Industries, Ltd. ADR | 42,950 | 2,890,106 | |||
Medical - Health Maintenance Organizations 3.0% | |||||
Anthem, Inc. (b) | 24,150 | 2,162,874 | |||
Medical - Products 7.5% | |||||
Alcon, Inc. | 22,560 | 1,774,344 | |||
Boston Scientific Corporation (b) | 30,900 | 1,322,520 | |||
Medtronic, Inc. | 26,850 | 1,308,132 | |||
Zimmer Holdings, Inc. (b) | 12,600 | 1,111,320 | |||
| 5,516,316 | |||||
Medical - Systems/Equipment 2.1% | |||||
Fisher Scientific International, Inc. (b) | 27,100 | 1,565,025 | |||
Medical - Wholesale Drugs/Sundries 2.0% | |||||
McKesson Corporation | 42,700 | 1,465,891 | |||
Metal Ores - Gold/Silver 1.7% | |||||
Newmont Mining Corporation Holding Company | 31,450 | 1,219,002 | |||
Metal Ores - Miscellaneous 2.3% | |||||
Phelps Dodge Corporation (b) | 21,400 | 1,658,714 | |||
Oil & Gas - Canadian Exploration & Production 0.4% | |||||
Canadian Natural Resources, Ltd. | 10,550 | 315,445 | |||
Oil & Gas - Canadian Integrated 1.3% | |||||
Suncor Energy, Inc. | 38,500 | 985,985 | |||
Oil & Gas - Drilling 1.0% | |||||
Nabors Industries, Ltd. (b) | 16,000 | 723,520 | |||
Oil & Gas - Field Services 2.0% | |||||
Schlumberger, Ltd. | 23,400 | 1,486,134 | |||
Oil & Gas - Production/Pipeline 1.0% | |||||
The Williams Companies, Inc. | 62,600 | 744,940 | |||
Oil & Gas - United States Exploration & Production 1.6% | |||||
Anadarko Petroleum Corporation | 19,800 | 1,160,280 | |||
Retail - Drug Stores 0.7% | |||||
CVS Corporation | 12,950 | 544,159 | |||
Retail - Major Discount Chains 1.9% | |||||
Wal-Mart Stores, Inc. | 26,400 | 1,392,864 | |||
Retail/Wholesale - Office Supplies 1.5% | |||||
Staples, Inc. | 37,000 | 1,084,470 | |||
Telecommunications - Fiber Optics 2.0% | |||||
Corning, Inc. (b) | 115,300 | 1,505,818 | |||
32
STRONG LARGE COMPANY GROWTH FUND (continued)
| Shares or Principal Amount | Value (Note 2) | |||||
Telecommunications - Wireless Equipment 3.6% | ||||||
Research in Motion, Ltd. (b) | 38,750 | $ | 2,652,050 | |||
Telecommunications - Wireless Services 2.0% | ||||||
Crown Castle International Corporation (b) | 63,950 | 943,263 | ||||
NII Holdings, Inc. Class B (b) | 15,450 | 520,511 | ||||
| 1,463,774 | ||||||
Total Common Stocks (Cost $ 63,662,078) | 71,079,187 | |||||
Short-Term Investments (a) 2.4% | ||||||
Repurchase Agreements (c) | ||||||
State Street Bank (Dated 6/30/04), 0.75%, Due 7/01/04 (Repurchase proceeds $1,726,036); Collateralized by: United States Government & Agency Issues | $ | 1,726,000 | 1,726,000 | |||
Total Short-Term Investments (Cost $1,726,000) | 1,726,000 | |||||
Total Investments in Securities (Cost $65,388,078) 99.0% | 72,805,187 | |||||
Other Assets and Liabilities, Net 1.0% | 742,083 | |||||
Net Assets 100.0% | $ | 73,547,270 | ||||
LEGEND
| (a) | Short-term investments include any security which has a remaining maturity of less than one year and investments in money market funds. |
| (b) | Non-income producing security. |
| (c) | See Note 2(J) of Notes to Financial Statements. |
| (d) | All or a portion of security is on loan. See Note 2(K) of Notes to Financial Statements. |
| (e) | Restricted security. |
Percentages are stated as a percent of net assets.
See Notes to Financial Statements.
33
STATEMENTS OF ASSETS AND LIABILITIES
June 30, 2004 (Unaudited)
(In Thousands, Except Per Share Amounts) | ||||||||||||
Strong Blue Chip | Strong Discovery Fund | Strong Endeavor Fund | ||||||||||
Assets: | ||||||||||||
Investments in Securities, at Value (Cost of $126,197, $159,848 and $23,190, respectively) | $ | 149,104 | $ | 191,913 | $ | 25,125 | ||||||
Receivable for Securities Sold | 4,960 | 3,176 | 483 | |||||||||
Receivable for Fund Shares Sold | — | 53 | — | |||||||||
Dividends and Interest Receivable | 64 | 15 | 17 | |||||||||
Other Assets | 68 | 40 | 11 | |||||||||
Total Assets | 154,196 | 195,197 | 25,636 | |||||||||
Liabilities: | ||||||||||||
Payable for Securities Purchased | 2,372 | 2,819 | 426 | |||||||||
Payable for Fund Shares Redeemed | 73 | 57 | — | |||||||||
Payable Upon Return of Securities on Loan | — | 16,954 | — | |||||||||
Accrued Operating Expenses and Other Liabilities | 137 | 61 | 17 | |||||||||
Total Liabilities | 2,582 | 19,891 | 443 | |||||||||
Net Assets | $ | 151,614 | $ | 175,306 | $ | 25,193 | ||||||
Net Assets Consist of: | ||||||||||||
Capital Stock (Par Value and Paid-in Capital) | $ | 297,681 | $ | 138,447 | $ | 25,933 | ||||||
Undistributed Net Investment Income (Loss) | (577 | ) | (1,042 | ) | (140 | ) | ||||||
Undistributed Net Realized Gain (Loss) | (168,398 | ) | 5,837 | (2,535 | ) | |||||||
Net Unrealized Appreciation (Depreciation) | 22,908 | 32,064 | 1,935 | |||||||||
Net Assets | $ | 151,614 | $ | 175,306 | $ | 25,193 | ||||||
Capital Shares Outstanding (Unlimited Number Authorized) | 13,114 | 8,423 | 2,582 | |||||||||
Net Asset Value Per Share | $ | 11.56 | $ | 20.81 | $ | 9.76 | ||||||
See Notes to Financial Statements.
34
STATEMENTS OF ASSETS AND LIABILITIES (continued)
June 30, 2004 (Unaudited)
(In Thousands, Except Per Share Amounts) | ||||||||
Strong Large Cap | Strong U.S. Emerging Growth Fund | |||||||
Assets: | ||||||||
Investments in Securities, at Value (Cost of $448,788 and $63,010, respectively) | $ | 565,846 | $ | 85,825 | ||||
Receivable for Securities Sold | 2,586 | 386 | ||||||
Receivable for Fund Shares Sold | 20 | — | ||||||
Dividends and Interest Receivable | 238 | 4 | ||||||
Other Assets | 74 | 20 | ||||||
Total Assets | 568,764 | 86,235 | ||||||
Liabilities: | ||||||||
Payable for Securities Purchased | 1,730 | 92 | ||||||
Payable for Fund Shares Redeemed | 111 | 18 | ||||||
Payable Upon Return of Securities on Loan | 6,651 | — | ||||||
Accrued Operating Expenses and Other Liabilities | 182 | 35 | ||||||
Total Liabilities | 8,674 | 145 | ||||||
Net Assets | $ | 560,090 | $ | 86,090 | ||||
Net Assets Consist of: | ||||||||
Capital Stock (Par Value and Paid-in Capital) | $ | 957,857 | $ | 113,273 | ||||
Undistributed Net Investment Income (Loss) | (1,380 | ) | (704 | ) | ||||
Undistributed Net Realized Gain (Loss) | (513,444 | ) | (49,294 | ) | ||||
Net Unrealized Appreciation (Depreciation) | 117,057 | 22,815 | ||||||
Net Assets | $ | 560,090 | $ | 86,090 | ||||
Capital Shares Outstanding (Unlimited Number Authorized) | 25,883 | 5,719 | ||||||
Net Asset Value Per Share | $ | 21.64 | $ | 15.05 | ||||
See Notes to Financial Statements.
35
STATEMENTS OF ASSETS AND LIABILITIES (continued)
June 30, 2004 (Unaudited)
| (In Thousands, Except As Noted) | ||||
Strong Fund | ||||
Assets: | ||||
Investments in Securities, at Value (Cost of $ 266,905) | $ | 320,203 | ||
Receivable for Securities Sold | 4,547 | |||
Receivable for Fund Shares Sold | 62 | |||
Dividends and Interest Receivable | 28 | |||
Other Assets | 61 | |||
Total Assets | 324,901 | |||
Liabilities: | ||||
Payable for Securities Purchased | 5,064 | |||
Payable for Fund Shares Redeemed | 41 | |||
Payable Upon Return of Securities on Loan | 30,901 | |||
Accrued Operating Expenses and Other Liabilities | 204 | |||
Total Liabilities | 36,210 | |||
Net Assets | $ | 288,691 | ||
Net Assets Consist of: | ||||
Capital Stock (Par Value and Paid-in Capital) | $ | 557,517 | ||
Undistributed Net Investment Income (Loss) | (2,218 | ) | ||
Undistributed Net Realized Gain (Loss) | (319,905 | ) | ||
Net Unrealized Appreciation (Depreciation) | 53,297 | |||
Net Assets | $ | 288,691 | ||
Investor Class ($ and shares in full) | ||||
Net Assets | $ | 268,028,226 | ||
Capital Shares Outstanding (Unlimited Number Authorized) | 11,689,875 | |||
Net Asset Value Per Share | $ | 22.93 | ||
Institutional Class ($ and shares in full) | ||||
Net Assets | $ | 3,983,445 | ||
Capital Shares Outstanding (Unlimited Number Authorized) | 172,256 | |||
Net Asset Value Per Share | $ | 23.13 | ||
Advisor Class ($ and shares in full) | ||||
Net Assets | $ | 1,744,120 | ||
Capital Shares Outstanding (Unlimited Number Authorized) | 75,937 | |||
Net Asset Value Per Share | $ | 22.97 | ||
Class K ($ and shares in full) | ||||
Net Assets | $ | 14,935,127 | ||
Capital Shares Outstanding (Unlimited Number Authorized) | 643,436 | |||
Net Asset Value Per Share | $ | 23.21 | ||
See Notes to Financial Statements.
36
STATEMENTS OF ASSETS AND LIABILITIES (continued)
June 30, 2004 (Unaudited)
| (In Thousands, Except As Noted) | ||||
Strong Growth 20 Fund | ||||
Assets: | ||||
Investments in Securities, at Value (Cost of $ 124,021) | $ | 160,209 | ||
Receivable for Securities Sold | 1,486 | |||
Dividends and Interest Receivable | 43 | |||
Other Assets | 31 | |||
Total Assets | 161,769 | |||
Liabilities: | ||||
Payable for Securities Purchased | 4,010 | |||
Payable for Fund Shares Redeemed | 58 | |||
Accrued Operating Expenses and Other Liabilities | 177 | |||
Total Liabilities | 4,245 | |||
Net Assets | $ | 157,524 | ||
Net Assets Consist of: | ||||
Capital Stock (Par Value and Paid-in Capital) | $ | 487,788 | ||
Undistributed Net Investment Income (Loss) | (1,462 | ) | ||
Undistributed Net Realized Gain (Loss) | (364,990 | ) | ||
Net Unrealized Appreciation (Depreciation) | 36,188 | |||
Net Assets | $ | 157,524 | ||
Investor Class ($ and shares in full) | ||||
Net Assets | $ | 152,974,567 | ||
Capital Shares Outstanding (Unlimited Number Authorized) | 11,254,513 | |||
Net Asset Value Per Share | $ | 13.59 | ||
Advisor Class ($ and shares in full) | ||||
Net Assets | $ | 4,549,248 | ||
Capital Shares Outstanding (Unlimited Number Authorized) | 333,615 | |||
Net Asset Value Per Share | $ | 13.64 | ||
See Notes to Financial Statements.
37
STATEMENTS OF ASSETS AND LIABILITIES (continued)
June 30, 2004 (Unaudited)
| (In Thousands) | ||||
Strong Growth Fund | ||||
Assets: | ||||
Investments in Securities, at Value (Cost of $1,249,142) | $ | 1,657,930 | ||
Receivable for Securities Sold | 12,060 | |||
Receivable for Fund Shares Sold | 25 | |||
Dividends and Interest Receivable | 368 | |||
Other Assets | 218 | |||
Total Assets | 1,670,601 | |||
Liabilities: | ||||
Payable for Securities Purchased | 11,556 | |||
Payable for Fund Shares Redeemed | 330 | |||
Payable Upon Return of Securities on Loan | 18,012 | |||
Accrued Operating Expenses and Other Liabilities | 566 | |||
Total Liabilities | 30,464 | |||
Net Assets | $ | 1,640,137 | ||
Net Assets Consist of: | ||||
Capital Stock (Par Value and Paid-in Capital) | $ | 2,047,073 | ||
Undistributed Net Investment Income (Loss) | (7,258 | ) | ||
Undistributed Net Realized Gain (Loss) | (808,466 | ) | ||
Net Unrealized Appreciation (Depreciation) | 408,788 | |||
Net Assets | $ | 1,640,137 | ||
See Notes to Financial Statements.
38
STATEMENTS OF ASSETS AND LIABILITIES (continued)
June 30, 2004 (Unaudited)
Strong Growth Fund | |||
Investor Class | |||
Net Assets | $ | 1,266,735,212 | |
Capital Shares Outstanding (Unlimited Number Authorized) | 69,271,173 | ||
Net Asset Value Per Share | $ | 18.29 | |
Institutional Class | |||
Net Assets | $ | 300,397,151 | |
Capital Shares Outstanding (Unlimited Number Authorized) | 15,953,861 | ||
Net Asset Value Per Share | $ | 18.83 | |
Advisor Class | |||
Net Assets | $ | 7,804,959 | |
Capital Shares Outstanding (Unlimited Number Authorized) | 429,555 | ||
Net Asset Value Per Share | $ | 18.17 | |
Class C | |||
Net Assets | $ | 429,329 | |
Capital Shares Outstanding (Unlimited Number Authorized) | 23,808 | ||
Net Asset Value Per Share | $ | 18.03 | |
Class K | |||
Net Assets | $ | 64,770,126 | |
Capital Shares Outstanding (Unlimited Number Authorized) | 3,493,624 | ||
Net Asset Value Per Share | $ | 18.54 | |
See Notes to Financial Statements.
39
STATEMENTS OF ASSETS AND LIABILITIES (continued)
June 30, 2004 (Unaudited)
| (In Thousands, Except As Noted) | ||||
| Strong Large Company Growth Fund | ||||
Assets: | ||||
Investments in Securities, at Value (Cost of $ 65,388) | $ | 72,805 | ||
Receivable for Securities Sold | 1,476 | |||
Receivable for Fund Shares Sold | 96 | |||
Dividends and Interest Receivable | 53 | |||
Other Assets | 23 | |||
Total Assets | 74,453 | |||
Liabilities: | ||||
Payable for Securities Purchased | 851 | |||
Payable for Fund Shares Redeemed | 18 | |||
Accrued Operating Expenses and Other Liabilities | 37 | |||
Total Liabilities | 906 | |||
Net Assets | $ | 73,547 | ||
Net Assets Consist of: | ||||
Capital Stock (Par Value and Paid-in Capital) | $ | 69,578 | ||
Undistributed Net Investment Income (Loss) | (216 | ) | ||
Undistributed Net Realized Gain (Loss) | (3,232 | ) | ||
Net Unrealized Appreciation (Depreciation) | 7,417 | |||
Net Assets | $ | 73,547 | ||
Investor Class ($ and shares in full) | ||||
Net Assets | $ | 69,510,634 | ||
Capital Shares Outstanding (Unlimited Number Authorized) | 4,854,920 | |||
Net Asset Value Per Share | $ | 14.32 | ||
Class K ($ and shares in full) | ||||
Net Assets | $ | 4,036,636 | ||
Capital Shares Outstanding (Unlimited Number Authorized) | 280,433 | |||
Net Asset Value Per Share | $ | 14.39 | ||
See Notes to Financial Statements.
40
For the Six Months Ended June 30, 2004 (Unaudited)
| (In Thousands) | ||||||||||||
| Strong Blue Chip Fund | Strong Discovery Fund | Strong Endeavor Fund | ||||||||||
Income: | ||||||||||||
Dividends (net of foreign withholding taxes of $2, $2 and $2, respectively) | $ | 685 | $ | 139 | $ | 66 | ||||||
Interest | 20 | 31 | 3 | |||||||||
Total Income | 705 | 170 | 69 | |||||||||
Expenses: | ||||||||||||
Investment Advisory Fees | 390 | 649 | 79 | |||||||||
Administrative Fees | 234 | 216 | 32 | |||||||||
Custodian Fees | 7 | 12 | 3 | |||||||||
Shareholder Servicing Costs | 516 | 264 | 66 | |||||||||
Reports to Shareholders | 113 | 56 | 2 | |||||||||
12b-1 Fees | — | — | 26 | |||||||||
Other | 43 | 47 | 16 | |||||||||
Total Expenses before Expense Offsets | 1,303 | 1,244 | 224 | |||||||||
Expense Offsets (Note 4) | (21 | ) | (32 | ) | (15 | ) | ||||||
Expenses, Net | 1,282 | 1,212 | 209 | |||||||||
Net Investment Income (Loss) | (577 | ) | (1,042 | ) | (140 | ) | ||||||
Realized and Unrealized Gain (Loss): | ||||||||||||
Net Realized Gain (Loss) on Investments | 23,595 | 6,959 | (672 | ) | ||||||||
Net Change in Unrealized Appreciation/Depreciation on Investments | (16,948 | ) | 2,718 | 1,162 | ||||||||
Net Gain (Loss) on Investments | 6,647 | 9,677 | 490 | |||||||||
Net Increase (Decrease) in Net Assets Resulting from Operations | $ | 6,070 | $ | 8,635 | $ | 350 | ||||||
See Notes to Financial Statements.
41
STATEMENTS OF OPERATIONS (continued)
For the Six Months Ended June 30, 2004 (Unaudited)
| (In Thousands) | ||||||||
Strong Large Cap Growth Fund | Strong Emerging | |||||||
Income: | ||||||||
Dividends (net of foreign withholding taxes of $7 and $0, respectively) | $ | 2,179 | $ | 28 | ||||
Interest | 30 | 6 | ||||||
Total Income | 2,209 | 34 | ||||||
Expenses: | ||||||||
Investment Advisory Fees | 1,632 | 349 | ||||||
Administrative Fees | 887 | 139 | ||||||
Custodian Fees | 19 | 7 | ||||||
Shareholder Servicing Costs | 865 | 192 | ||||||
Reports to Shareholders | 152 | 37 | ||||||
12b-1 Fees | — | — | ||||||
Other | 124 | 31 | ||||||
Total Expenses before Expense Offsets | 3,679 | 755 | ||||||
Expense Offsets (Note 4) | (90 | ) | (17 | ) | ||||
Expenses, Net | 3,589 | 738 | ||||||
Net Investment Income (Loss) | (1,380 | ) | (704 | ) | ||||
Realized and Unrealized Gain (Loss): | ||||||||
Net Realized Gain (Loss) on Investments | 38,192 | 12,923 | ||||||
Net Change in Unrealized Appreciation/Depreciation on Investments | (17,700 | ) | (11,448 | ) | ||||
Net Gain (Loss) on Investments | 20,492 | 1,475 | ||||||
Net Increase (Decrease) in Net Assets Resulting from Operations | $ | 19,112 | $ | 771 | ||||
See Notes to Financial Statements.
42
STATEMENTS OF OPERATIONS (continued)
For the Six Months Ended June 30, 2004 (Unaudited)
| (In Thousands) | ||||||||||||||||
| Strong Enterprise Fund | Strong Fund | Strong Growth Fund | Strong Large Company Growth Fund | |||||||||||||
Income: | ||||||||||||||||
Dividends (net of foreign withholding taxes of $7, $15, $24 and $7, respectively) | $ | 338 | $ | 273 | $ | 3,921 | $ | 311 | ||||||||
Interest | 38 | 30 | 89 | 27 | ||||||||||||
Total Income | 376 | 303 | 4,010 | 338 | ||||||||||||
Expenses (Note 4): | ||||||||||||||||
Investment Advisory Fees | 1,079 | 720 | 6,180 | 284 | ||||||||||||
Administrative Fees | 422 | 289 | 2,037 | 113 | ||||||||||||
Custodian Fees | 16 | 11 | 65 | 8 | ||||||||||||
Shareholder Servicing Costs | 850 | 589 | 2,372 | 125 | ||||||||||||
Reports to Shareholders | 201 | 121 | 612 | 19 | ||||||||||||
12b-1 Fees | 2 | 6 | 13 | 92 | ||||||||||||
Other | 86 | 66 | 312 | 37 | ||||||||||||
Total Expenses before Expense Offsets | 2,656 | 1,802 | 11,591 | 678 | ||||||||||||
Expense Offsets | (62 | ) | (37 | ) | (323 | ) | (124 | ) | ||||||||
Expenses, Net | 2,594 | 1,765 | 11,268 | 554 | ||||||||||||
Net Investment Income (Loss) | (2,218 | ) | (1,462 | ) | (7,258 | ) | (216 | ) | ||||||||
Realized and Unrealized Gain (Loss): | ||||||||||||||||
Net Realized Gain (Loss) on: | ||||||||||||||||
Investments | 11,937 | 24,035 | 152,682 | 6,268 | ||||||||||||
Futures Contracts | — | 298 | — | 1 | ||||||||||||
Net Realized Gain (Loss) | 11,937 | 24,333 | 152,682 | 6,269 | ||||||||||||
Net Change in Unrealized Appreciation/Depreciation on Investments | 6,671 | (14,712 | ) | (40,158 | ) | (1,001 | ) | |||||||||
Net Gain (Loss) on Investments | 18,608 | 9,621 | 112,524 | 5,268 | ||||||||||||
Net Increase (Decrease) in Net Assets Resulting from Operations | $ | 16,390 | $ | 8,159 | $ | 105,266 | $ | 5,052 | ||||||||
See Notes to Financial Statements.
43
STATEMENTS OF CHANGES IN NET ASSETS
| (In Thousands) | ||||||||||||||||
| Strong Blue Chip Fund | Strong Discovery Fund | |||||||||||||||
| Six Months Ended June 30, 2004 | Year Ended Dec. 31, 2003 | Six Months Ended June 30, 2004 | Year Ended Dec. 31, 2003 | |||||||||||||
| (Unaudited) | (Unaudited) | |||||||||||||||
Operations: | ||||||||||||||||
Net Investment Income (Loss) | $ | (577 | ) | $ | (1,371 | ) | $ | (1,042 | ) | $ | (1,012 | ) | ||||
Net Realized Gain (Loss) | 23,595 | (20,202 | ) | 6,959 | 19,126 | |||||||||||
Net Change in Unrealized Appreciation/Depreciation | (16,948 | ) | 67,883 | 2,718 | 30,925 | |||||||||||
Net Increase (Decrease) in Net Assets Resulting | ||||||||||||||||
from Operations | 6,070 | 46,310 | 8,635 | 49,039 | ||||||||||||
Distributions: | ||||||||||||||||
From Net Investment Income | — | — | — | (7 | ) | |||||||||||
From Net Realized Gains | — | — | — | (1,805 | ) | |||||||||||
Total Distributions | — | — | — | (1,812 | ) | |||||||||||
Capital Share Transactions (Note 8): | ||||||||||||||||
Net Increase (Decrease) in Net Assets from Capital Share Transactions | (30,766 | ) | (73,292 | ) | (122 | ) | (13,795 | ) | ||||||||
Total Increase (Decrease) in Net Assets | (24,696 | ) | (26,982 | ) | 8,513 | 33,432 | ||||||||||
Net Assets: | ||||||||||||||||
Beginning of Period | 176,310 | 203,292 | 166,793 | 133,361 | ||||||||||||
End of Period | $ | 151,614 | $ | 176,310 | $ | 175,306 | $ | 166,793 | ||||||||
Undistributed Net Investment Income (Loss) | $ | (577 | ) | $ | — | $ | (1,042 | ) | $ | — | ||||||
| Strong Endeavor Fund | Strong Large Cap Growth Fund | |||||||||||||||
| Six Months Ended June 30, 2004 | Year Ended Dec. 31, 2003 | Six Months Ended June 30, 2004 | Year Ended Dec. 31, 2003 | |||||||||||||
| (Unaudited) | (Unaudited) | |||||||||||||||
Operations: | ||||||||||||||||
Net Investment Income (Loss) | $ | (140 | ) | $ | (50 | ) | $ | (1,380 | ) | $ | (3,032 | ) | ||||
Net Realized Gain (Loss) | (672 | ) | 521 | 38,192 | 36,332 | |||||||||||
Net Change in Unrealized Appreciation/Depreciation | 1,162 | 801 | (17,700 | ) | 117,845 | |||||||||||
Net Increase (Decrease) in Net Assets Resulting from Operations | 350 | 1,272 | 19,112 | 151,145 | ||||||||||||
Distributions From Net Investment Income | — | — | — | — | ||||||||||||
Capital Share Transactions (Note 8): | ||||||||||||||||
Net Increase (Decrease) in Net Assets from | ||||||||||||||||
Capital Share Transactions | 20,343 | (447 | ) | (103,153 | ) | (95,908 | ) | |||||||||
Total Increase (Decrease) in Net Assets | 20,693 | 825 | (84,041 | ) | 55,237 | |||||||||||
Net Assets: | ||||||||||||||||
Beginning of Period | 4,500 | 3,675 | 644,131 | 588,894 | ||||||||||||
End of Period | $ | 25,193 | $ | 4,500 | $ | 560,090 | $ | 644,131 | ||||||||
Undistributed Net Investment Income (Loss) | $ | (140 | ) | $ | — | $ | (1,380 | ) | $ | — | ||||||
See Notes to Financial Statements.
44
STATEMENTS OF CHANGES IN NET ASSETS (continued)
| (In Thousands) | ||||||||||||||||
Strong U.S. Emerging Growth Fund | Strong Enterprise Fund | |||||||||||||||
| Six Months Ended June 30, 2004 | Year Ended Dec. 31, 2003 | Six Months Ended June 30, 2004 | Year Ended Dec. 31, 2003 | |||||||||||||
| (Unaudited) | (Unaudited) | |||||||||||||||
Operations: | ||||||||||||||||
Net Investment Income (Loss) | $ | (704 | ) | $ | (1,325 | ) | $ | (2,218 | ) | $ | (3,606 | ) | ||||
Net Realized Gain (Loss) | 12,923 | 7,047 | 11,937 | 41,662 | ||||||||||||
Net Change in Unrealized Appreciation/Depreciation | (11,448 | ) | 26,088 | 6,671 | 43,963 | |||||||||||
Net Increase (Decrease) in Net Assets Resulting from Operations | 771 | 31,810 | 16,390 | 82,019 | ||||||||||||
Distributions From Net Investment Income | — | — | — | — | ||||||||||||
Capital Share Transactions (Note 8): | ||||||||||||||||
Net Increase (Decrease) in Net Assets from Capital Share Transactions | (14,796 | ) | 9,891 | (14,927 | ) | (24,147 | ) | |||||||||
Total Increase (Decrease) in Net Assets | (14,025 | ) | 41,701 | 1,463 | 57,872 | |||||||||||
Net Assets: | ||||||||||||||||
Beginning of Period | 100,115 | 58,414 | 287,228 | 229,356 | ||||||||||||
End of Period | $ | 86,090 | $ | 100,115 | $ | 288,691 | $ | 287,228 | ||||||||
Undistributed Net Investment Income (Loss) | $ | (704 | ) | $ | — | $ | (2,218 | ) | $ | — | ||||||
| Strong Growth 20 Fund | Strong Growth Fund | |||||||||||||||
| Six Months Ended June 30, 2004 | Year Ended Dec. 31, 2003 | Six Months Ended June 30, 2004 | Year Ended Dec. 31, 2003 | |||||||||||||
| (Unaudited) | (Unaudited) | |||||||||||||||
Operations: | ||||||||||||||||
Net Investment Income (Loss) | $ | (1,462 | ) | $ | (3,998 | ) | $ | (7,258 | ) | $ | (16,286 | ) | ||||
Net Realized Gain (Loss) | 24,333 | 24,865 | 152,682 | 145,925 | ||||||||||||
Net Change in Unrealized Appreciation/Depreciation | (14,712 | ) | 43,224 | (40,158 | ) | 320,600 | ||||||||||
Net Increase (Decrease) in Net Assets Resulting from Operations | 8,159 | 64,091 | 105,266 | 450,239 | ||||||||||||
Distributions From Net Investment Income | — | — | — | — | ||||||||||||
Capital Share Transactions (Note 8): | ||||||||||||||||
Net Increase (Decrease) in Net Assets from Capital Share Transactions | (109,527 | ) | 4,591 | (208,044 | ) | (181,638 | ) | |||||||||
Total Increase (Decrease) in Net Assets | (101,368 | ) | 68,682 | (102,778 | ) | 268,601 | ||||||||||
Net Assets: | ||||||||||||||||
Beginning of Period | 258,892 | 190,210 | 1,742,915 | 1,474,314 | ||||||||||||
End of Period | $ | 157,524 | $ | 258,892 | $ | 1,640,137 | $ | 1,742,915 | ||||||||
Undistributed Net Investment Income (Loss) | $ | (1,462 | ) | $ | — | $ | (7,258 | ) | $ | — | ||||||
See Notes to Financial Statements.
45
STATEMENTS OF CHANGES IN NET ASSETS (continued)
| (In Thousands) | ||||||||
| Strong Large Company Growth Fund | ||||||||
| Six Months Ended June 30, 2004 | Year Ended Dec. 31, 2003 | |||||||
| (Unaudited) | ||||||||
Operations: | ||||||||
Net Investment Income (Loss) | $ | (216 | ) | $ | (202 | ) | ||
Net Realized Gain (Loss) | 6,269 | 1,276 | ||||||
Net Change in Unrealized Appreciation/Depreciation | (1,001 | ) | 8,628 | |||||
Net Increase (Decrease) in Net Assets Resulting from Operations | 5,052 | 9,702 | ||||||
Distributions: | ||||||||
From Net Investment Income | ||||||||
Investor Class | — | (14 | ) | |||||
Capital Share Transactions (Note 8): | ||||||||
Net Increase (Decrease) in Net Assets from Capital Share Transactions | (3,280 | ) | 40,712 | |||||
Total Increase (Decrease) in Net Assets | 1,772 | 50,400 | ||||||
Net Assets: | ||||||||
Beginning of Period | 71,775 | 21,375 | ||||||
End of Period | $ | 73,547 | $ | 71,775 | ||||
Undistributed Net Investment Income (Loss) | $ | (216 | ) | $ | — | |||
See Notes to Financial Statements.
46
STRONG BLUE CHIP FUND
| Period Ended | ||||||||||||||||||||||||||||
| June 30, 2004(b) | Dec. 31, 2003 | Dec. 31, 2002 | Dec. 31, 2001 | Dec. 31, 2000(c) | Oct. 31, 2000 | Oct. 31, 1999 | ||||||||||||||||||||||
Selected Per-Share Data(a) | ||||||||||||||||||||||||||||
Net Asset Value, Beginning of Period | $ | 11.12 | $ | 8.62 | $ | 12.36 | $ | 16.56 | $ | 20.99 | $ | 18.10 | $ | 13.24 | ||||||||||||||
Income From Investment Operations: | ||||||||||||||||||||||||||||
Net Investment Income (Loss) | (0.04 | ) | (0.09 | ) | (0.08 | ) | (0.06 | ) | (0.01 | ) | (0.09 | ) | (0.04 | ) | ||||||||||||||
Net Realized and Unrealized Gains (Losses) on Investments | 0.48 | 2.59 | (3.66 | ) | (4.14 | ) | (3.42 | ) | 2.98 | 4.90 | ||||||||||||||||||
Total from Investment Operations | 0.44 | 2.50 | (3.74 | ) | (4.20 | ) | (3.43 | ) | 2.89 | 4.86 | ||||||||||||||||||
Less Distributions: | ||||||||||||||||||||||||||||
From Net Investment Income | — | — | — | — | — | — | (0.00 | )(d) | ||||||||||||||||||||
From Net Realized Gains | — | — | — | — | (1.00 | ) | — | — | ||||||||||||||||||||
Total Distributions | — | — | — | — | (1.00 | ) | — | (0.00 | )(d) | |||||||||||||||||||
Net Asset Value, End of Period | $ | 11.56 | $ | 11.12 | $ | 8.62 | $ | 12.36 | $ | 16.56 | $ | 20.99 | $ | 18.10 | ||||||||||||||
Ratios and Supplemental Data | ||||||||||||||||||||||||||||
Total Return | +3.96 | % | +29.00 | % | –30.26 | % | –25.36 | % | –16.43 | % | +15.97 | % | +36.71 | % | ||||||||||||||
Net Assets, End of Period (In Millions) | $ | 152 | $ | 176 | $ | 203 | $ | 339 | $ | 499 | $ | 616 | $ | 485 | ||||||||||||||
Ratio of Expenses to Average Net Assets before Expense Offsets | 1.7 | %* | 1.7 | % | 1.6 | % | 1.4 | % | 1.1 | %* | 1.1 | % | 1.2 | % | ||||||||||||||
Ratio of Expenses to Average Net Assets | 1.6 | %* | 1.7 | % | 1.6 | % | 1.4 | % | 1.1 | %* | 1.1 | % | 1.2 | % | ||||||||||||||
Ratio of Net Investment Income (Loss) to Average Net Assets | (0.7 | )%* | (0.8 | )% | (0.7 | )% | (0.4 | )% | (0.2 | )%* | (0.5 | )% | (0.3 | )% | ||||||||||||||
Portfolio Turnover Rate | 127.8 | % | 268.5 | % | 214.0 | % | 203.9 | % | 21.2 | % | 67.9 | % | 75.4 | % | ||||||||||||||
STRONG DISCOVERY FUND
| Period Ended | ||||||||||||||||||||||||
| June 30, 2004(b) | Dec. 31 2003 | Dec. 31, 2002 | Dec. 31, 2001 | Dec. 31, 2000 | Dec. 31, 1999 | |||||||||||||||||||
Selected Per-Share Data(a) | ||||||||||||||||||||||||
Net Asset Value, Beginning of Period | $ | 19.73 | $ | 14.42 | $ | 16.84 | $ | 16.39 | $ | 18.64 | $ | 17.95 | ||||||||||||
Income From Investment Operations: | ||||||||||||||||||||||||
Net Investment Income (Loss) | (0.12 | ) | (0.12 | ) | (0.06 | ) | (0.08 | ) | 0.06 | (0.17 | ) | |||||||||||||
Net Realized and Unrealized Gains (Losses) on Investments | 1.20 | 5.64 | (1.91 | ) | 0.76 | 0.51 | 1.08 | |||||||||||||||||
Total from Investment Operations | 1.08 | 5.52 | (1.97 | ) | 0.68 | 0.57 | 0.91 | |||||||||||||||||
Less Distributions: | ||||||||||||||||||||||||
From Net Investment Income | — | (0.00 | )(d) | — | — | (0.04 | ) | — | ||||||||||||||||
From Net Realized Gains | — | (0.21 | ) | (0.45 | ) | (0.23 | ) | (2.78 | ) | (0.22 | ) | |||||||||||||
Total Distributions | — | (0.21 | ) | (0.45 | ) | (0.23 | ) | (2.82 | ) | (0.22 | ) | |||||||||||||
Net Asset Value, End of Period | $ | 20.81 | $ | 19.73 | $ | 14.42 | $ | 16.84 | $ | 16.39 | $ | 18.64 | ||||||||||||
Ratios and Supplemental Data | ||||||||||||||||||||||||
Total Return | +5.47 | % | +38.34 | % | –12.12 | % | +4.17 | % | +3.97 | % | +5.28 | % | ||||||||||||
Net Assets, End of Period (In Millions) | $ | 175 | $ | 167 | $ | 133 | $ | 158 | $ | 165 | $ | 187 | ||||||||||||
Ratio of Expenses to Average Net Assets before Expense Offsets | 1.4 | %* | 1.5 | % | 1.5 | % | 1.5 | % | 1.5 | % | 1.4 | % | ||||||||||||
Ratio of Expenses to Average Net Assets | 1.4 | %* | 1.4 | % | 1.5 | % | 1.5 | % | 1.5 | % | 1.4 | % | ||||||||||||
Ratio of Net Investment Income (Loss) to Average Net Assets | (1.2 | )%* | (0.7 | )% | (0.4 | )% | (0.5 | )% | 0.3 | % | (0.7 | )% | ||||||||||||
Portfolio Turnover Rate | 69.4 | % | 302.2 | % | 420.0 | % | 501.7 | % | 481.8 | % | 214.0 | % | ||||||||||||
| * | Calculated on an annualized basis |
| (a) | Information presented relates to a share of capital stock of the Fund outstanding for the entire period. |
| (b) | For the six months ended June 30, 2004 (Unaudited). |
| (c) | In 2000, the Fund changed its fiscal year-end from October to December. |
| (d) | Amount calculated is less than $0.005. |
See Notes to Financial Statements.
47
FINANCIAL HIGHLIGHTS (continued)
STRONG ENDEAVOR FUND
| Period Ended | ||||||||||||||||
| June 30, 2004(b) | Dec. 31, 2003 | Dec. 31, 2002 | Dec. 31, 2001(c) | |||||||||||||
Selected Per-Share Data(a) | ||||||||||||||||
Net Asset Value, Beginning of Period | $ | 9.32 | $ | 7.03 | $ | 9.94 | $ | 10.00 | ||||||||
Income From Investment Operations: | ||||||||||||||||
Net Investment Income (Loss) | (0.05 | ) | (0.10 | ) | (0.11 | ) | (0.06 | )(d) | ||||||||
Net Realized and Unrealized Gains (Losses) on Investments | 0.49 | 2.39 | (2.80 | ) | 0.00 | (e) | ||||||||||
Total from Investment Operations | 0.44 | 2.29 | (2.91 | ) | (0.06 | ) | ||||||||||
Less Distributions: | ||||||||||||||||
From Net Investment Income | — | �� | — | — | — | |||||||||||
Total Distributions | — | — | — | — | ||||||||||||
Net Asset Value, End of Period | $ | 9.76 | $ | 9.32 | $ | 7.03 | $ | 9.94 | ||||||||
Ratios and Supplemental Data | ||||||||||||||||
Total Return | +4.72 | % | +32.57 | % | –29.28 | % | –0.60 | % | ||||||||
Net Assets, End of Period (In Millions) | $ | 25 | $ | 5 | $ | 4 | $ | 6 | ||||||||
Ratio of Expenses to Average Net Assets before Expense Offsets | 2.1 | %* | 2.8 | % | 2.7 | % | 3.1 | %* | ||||||||
Ratio of Expenses to Average Net Assets | 2.0 | %* | 1.9 | % | 1.9 | % | 2.2 | %* | ||||||||
Ratio of Net Investment Income (Loss) to Average Net Assets | (1.3 | )%* | (1.1 | )% | (1.2 | )% | (1.2 | )%* | ||||||||
Portfolio Turnover Rate | 93.2 | % | 243.0 | % | 416.8 | % | 391.8 | % | ||||||||
STRONG LARGE CAP GROWTH FUND
| Period Ended | ||||||||||||||||||||||||||||
| June 30, 2004(b) | Dec. 31, 2003 | Dec. 31, 2002 | Dec. 31, 2001 | Dec. 31, 2000(f) | Oct. 31, 2000 | Oct. 31, 1999 | ||||||||||||||||||||||
Selected Per-Share Data(a) | ||||||||||||||||||||||||||||
Net Asset Value, Beginning of Period | $ | 20.94 | $ | 16.51 | $ | 23.55 | $ | 34.77 | $ | 45.49 | $ | 41.52 | $ | 29.10 | ||||||||||||||
Income From Investment Operations: | ||||||||||||||||||||||||||||
Net Investment Income (Loss) | (0.05 | ) | (0.10 | ) | (0.08 | ) | (0.02 | ) | 0.01 | (0.16 | ) | (0.03 | ) | |||||||||||||||
Net Realized and Unrealized Gains (Losses) on Investments | 0.75 | 4.53 | (6.96 | ) | (11.20 | ) | (4.81 | ) | 12.01 | 12.84 | ||||||||||||||||||
Total from Investment Operations | 0.70 | 4.43 | (7.04 | ) | (11.22 | ) | (4.80 | ) | 11.85 | 12.81 | ||||||||||||||||||
Less Distributions: | ||||||||||||||||||||||||||||
From Net Investment Income | — | — | — | (0.00 | )(e) | — | — | (0.01 | ) | |||||||||||||||||||
From Net Realized Gains | — | — | — | — | (5.92 | ) | (7.88 | ) | (0.38 | ) | ||||||||||||||||||
Total Distributions | — | — | — | (0.00 | )(e) | (5.92 | ) | (7.88 | ) | (0.39 | ) | |||||||||||||||||
Net Asset Value, End of Period | $ | 21.64 | $ | 20.94 | $ | 16.51 | $ | 23.55 | $ | 34.77 | $ | 45.49 | $ | 41.52 | ||||||||||||||
Ratios and Supplemental Data | ||||||||||||||||||||||||||||
Total Return | +3.34 | % | +26.83 | % | –29.89 | % | –32.27 | % | –10.34 | % | +28.12 | % | +44.26 | % | ||||||||||||||
Net Assets, End of Period (In Millions) | $ | 560 | $ | 644 | $ | 589 | $ | 976 | $ | 1,574 | $ | 1,769 | $ | 1,253 | ||||||||||||||
Ratio of Expenses to Average Net Assets before Expense Offsets | 1.2 | %* | 1.3 | % | 1.2 | % | 1.1 | % | 1.0 | %* | 1.0 | % | 1.0 | % | ||||||||||||||
Ratio of Expenses to Average Net Assets | 1.2 | %* | 1.3 | % | 1.2 | % | 1.1 | % | 1.0 | %* | 1.0 | % | 1.0 | % | ||||||||||||||
Ratio of Net Investment Income (Loss) to Average Net Assets | (0.5 | )%* | (0.5 | )% | (0.4 | )% | (0.1 | )% | 0.1 | %* | (0.4 | )% | (0.1 | )% | ||||||||||||||
Portfolio Turnover Rate | 41.5 | % | 253.4 | % | 443.2 | % | 468.7 | % | 68.6 | % | 455.0 | % | 402.3 | % | ||||||||||||||
| * | Calculated on an annualized basis |
| (a) | Information presented relates to a share of capital stock of the Fund outstanding for the entire period. (b) For the six months ended June 30, 2004 (Unaudited). |
| (c) | For the period from April 6, 2001 (inception date) to December 31, 2001. |
| (d) | Net investment loss per share represents net investment loss divided by the average shares outstanding throughout the period. |
| (e) | Amount calculated is less than $0.005. |
| (f) | In 2000, the Fund changed its fiscal year-end from October to December. |
See Notes to Financial Statements.
48
FINANCIAL HIGHLIGHTS (continued)
STRONG U.S. EMERGING GROWTH FUND
| Period Ended | ||||||||||||||||||||||||
| June 30, 2004(b) | Dec. 31, 2003 | Dec. 31, 2002 | Dec. 31, 2001 | Dec. 31, 2000 | Dec. 31, 1999 | |||||||||||||||||||
Selected Per-Share Data(a) | ||||||||||||||||||||||||
Net Asset Value, Beginning of Period | $ | 14.90 | $ | 10.02 | $ | 15.17 | $ | 19.17 | $ | 19.59 | $ | 10.00 | ||||||||||||
Income From Investment Operations: | ||||||||||||||||||||||||
Net Investment Income (Loss) | (0.12 | ) | (0.20 | ) | (0.24 | ) | (0.23 | ) | (0.19 | ) | (0.11 | ) | ||||||||||||
Net Realized and Unrealized Gains (Losses) on Investments | 0.27 | 5.08 | (4.91 | ) | (3.77 | ) | 0.22 | 9.99 | ||||||||||||||||
Total from Investment Operations | 0.15 | 4.88 | (5.15 | ) | (4.00 | ) | 0.03 | 9.88 | ||||||||||||||||
Less Distributions: | ||||||||||||||||||||||||
From Net Realized Gains | — | — | — | — | (0.45 | ) | (0.29 | ) | ||||||||||||||||
Total Distributions | — | — | — | — | (0.45 | ) | (0.29 | ) | ||||||||||||||||
Net Asset Value, End of Period | $ | 15.05 | $ | 14.90 | $ | 10.02 | $ | 15.17 | $ | 19.17 | $ | 19.59 | ||||||||||||
Ratios and Supplemental Data | ||||||||||||||||||||||||
Total Return | +1.01 | % | +48.70 | % | –33.95 | % | –20.87 | % | +0.29 | % | +98.86 | % | ||||||||||||
Net Assets, End of Period (In Millions) | $ | 86 | $ | 100 | $ | 58 | $ | 86 | $ | 112 | $ | 36 | ||||||||||||
Ratio of Expenses to Average Net Assets before Expense Offsets | 1.6 | %* | 1.8 | % | 1.9 | % | 1.6 | % | 1.4 | % | 1.9 | % | ||||||||||||
Ratio of Expenses to Average Net Assets | 1.6 | %* | 1.7 | % | 1.9 | % | 1.6 | % | 1.4 | % | 1.8 | % | ||||||||||||
Ratio of Net Investment Income (Loss) to Average Net Assets | (1.5 | )%* | (1.6 | )% | (1.8 | )% | (1.5 | )% | (1.2 | )% | (1.5 | )% | ||||||||||||
Portfolio Turnover Rate | 56.3 | % | 100.3 | % | 171.5 | % | 168.2 | % | 186.8 | % | 281.1 | % | ||||||||||||
STRONG ENTERPRISE FUND — INVESTOR CLASS
| Period Ended | ||||||||||||||||||||||||
| June 30, 2004(b) | Dec. 31, 2003 | Dec. 31, 2002 | Dec. 31, 2001 | Dec. 31, 2000 | Dec. 31, 1999 | |||||||||||||||||||
Selected Per-Share Data(a) | ||||||||||||||||||||||||
Net Asset Value, Beginning of Period | $ | 21.78 | $ | 15.90 | $ | 22.14 | $ | 28.37 | $ | 41.24 | $ | 14.74 | ||||||||||||
Income From Investment Operations: | ||||||||||||||||||||||||
Net Investment Income (Loss) | (0.18 | )(c) | (0.30 | ) | (0.28 | )(c) | (0.31 | ) | (0.28 | ) | (0.09 | ) | ||||||||||||
Net Realized and Unrealized Gains (Losses) on Investments | 1.33 | 6.18 | (5.96 | ) | (5.92 | ) | (12.04 | ) | 27.43 | |||||||||||||||
Total from Investment Operations | 1.15 | 5.88 | (6.24 | ) | (6.23 | ) | (12.32 | ) | 27.34 | |||||||||||||||
Less Distributions: | ||||||||||||||||||||||||
From Net Realized Gains | — | — | — | — | (0.55 | ) | (0.84 | ) | ||||||||||||||||
Total Distributions | — | — | — | — | (0.55 | ) | (0.84 | ) | ||||||||||||||||
Net Asset Value, End of Period | $ | 22.93 | $ | 21.78 | $ | 15.90 | $ | 22.14 | $ | 28.37 | $ | 41.24 | ||||||||||||
Ratios and Supplemental Data | ||||||||||||||||||||||||
Total Return | +5.28 | % | +36.98 | % | –28.18 | % | –21.96 | % | –29.77 | % | +187.83 | % | ||||||||||||
Net Assets, End of Period (In Millions) | $ | 268 | $ | 249 | $ | 224 | $ | 372 | $ | 575 | $ | 571 | ||||||||||||
Ratio of Expenses to Average Net Assets before Expense Offsets | 1.9 | %* | 2.0 | % | 2.0 | % | 1.8 | % | 1.4 | % | 1.4 | % | ||||||||||||
Ratio of Expenses to Average Net Assets | 1.9 | %* | 1.8 | % | 2.0 | % | 1.8 | % | 1.4 | % | 1.4 | % | ||||||||||||
Ratio of Net Investment Income (Loss) to Average Net Assets | (1.6 | )%* | (1.4 | )% | (1.5 | )% | (1.2 | )% | (0.7 | )% | (1.0 | )% | ||||||||||||
Portfolio Turnover Rate(d) | 82.6 | % | 261.2 | % | 376.8 | % | 629.8 | % | 473.7 | % | 178.1 | % | ||||||||||||
| * | Calculated on an annualized basis. |
| (a) | Information presented relates to a share of capital stock of the Fund outstanding for the entire period. |
| (b) | For the six months ended June 30, 2004 (Unaudited). |
| (c) | Net investment income (loss) per share represents net investment income (loss) divided by the average shares outstanding throughout the period. |
| (d) | Calculated on the basis of the Fund as a whole without distinguishing between classes of shares issued. |
See Notes to Financial Statements.
49
FINANCIAL HIGHLIGHTS (continued)
STRONG ENTERPRISE FUND — INSTITUTIONAL CLASS
| Period Ended | ||||||||
| June 30, 2004(b) | Dec. 31, 2003(c) | |||||||
Selected Per-Share Data(a) | ||||||||
Net Asset Value, Beginning of Period | $ | 21.87 | $ | 18.34 | ||||
Income From Investment Operations: | ||||||||
Net Investment Income (Loss) | (0.07 | )(f) | (0.06 | ) | ||||
Net Realized and Unrealized Gains (Losses) on Investments | 1.33 | 3.59 | ||||||
Total from Investment Operations | 1.26 | 3.53 | ||||||
Less Distributions: | ||||||||
From Net Investment Income | — | — | ||||||
Total Distributions | — | — | ||||||
Net Asset Value, End of Period | $ | 23.13 | $ | 21.87 | ||||
Ratios and Supplemental Data | ||||||||
Total Return | +5.76 | % | +19.25 | % | ||||
Net Assets, End of Period (In Millions) | $ | 4 | $ | 2 | ||||
Ratio of Expenses to Average Net Assets before Expense Offsets | 1.0 | %* | 1.2 | %* | ||||
Ratio of Expenses to Average Net Assets | 0.9 | %* | 1.0 | %* | ||||
Ratio of Net Investment Income (Loss) to Average Net Assets | (0.7 | )* | (0.7 | )%* | ||||
Portfolio Turnover Rate(d) | 82.6 | % | 261.2 | % | ||||
STRONG ENTERPRISE FUND — ADVISOR CLASS
| Period Ended | ||||||||||||||||||||
| June 30, 2004(b) | Dec. 31, 2003 | Dec. 31, 2002 | Dec. 31, 2001 | Dec. 31, 2000(e) | ||||||||||||||||
Selected Per-Share Data(a) | ||||||||||||||||||||
Net Asset Value, Beginning of Period | $ | 21.79 | $ | 15.86 | $ | 22.04 | $ | 28.31 | $ | 51.32 | ||||||||||
Income From Investment Operations: | ||||||||||||||||||||
Net Investment Income (Loss) | (0.15 | )(f) | (0.23 | ) | (0.24 | )(f) | (0.21 | ) | (0.03 | ) | ||||||||||
Net Realized and Unrealized Gains (Losses) on Investments | 1.33 | 6.16 | (5.94 | ) | (6.06 | ) | (22.43 | ) | ||||||||||||
Total from Investment Operations | 1.18 | 5.93 | (6.18 | ) | (6.27 | ) | (22.46 | ) | ||||||||||||
Less Distributions: | ||||||||||||||||||||
From Net Realized Gains | — | — | — | — | (0.55 | ) | ||||||||||||||
Total Distributions | — | — | — | — | (0.55 | ) | ||||||||||||||
Net Asset Value, End of Period | $ | 22.97 | $ | 21.79 | $ | 15.86 | $ | 22.04 | $ | 28.31 | ||||||||||
Ratios and Supplemental Data | ||||||||||||||||||||
Total Return | +5.42 | % | +37.39 | % | –28.04 | % | –22.15 | % | –43.68 | % | ||||||||||
Net Assets, End of Period (In Millions) | $ | 2 | $ | 2 | $ | 1 | $ | 1 | $ | 0 | (g) | |||||||||
Ratio of Expenses to Average Net Assets before Expense Offsets | 1.7 | %* | 1.5 | % | 1.8 | % | 2.1 | % | 2.0 | %* | ||||||||||
Ratio of Expenses to Average Net Assets | 1.6 | %* | 1.5 | % | 1.8 | % | 2.1 | % | 1.9 | %* | ||||||||||
Ratio of Net Investment Income (Loss) to Average Net Assets | (1.3 | )%* | (1.1 | )% | (1.3 | )% | (1.6 | )% | (1.2 | )%* | ||||||||||
Portfolio Turnover Rate(d) | 82.6 | % | 261.2 | % | 376.8 | % | 629.8 | % | 473.7 | % | ||||||||||
| * | Calculated on an annualized basis. |
| (a) | Information presented relates to a share of capital stock of the Fund outstanding for the entire period. |
| (b) | For the six months ended June 30, 2004 (Unaudited). |
| (c) | For the period from June 30, 2003 (commencement of class) to December 31, 2003. |
| (d) | Calculated on the basis of the Fund as a whole without distinguishing between classes of shares issued. |
| (e) | For the period from February 24, 2000 (commencement of class) to December 31, 2000. |
| (f) | Net investment income (loss) per share represents net investment income (loss) divided by the average shares outstanding throughout the period. |
| (g) | Amount is less than $500,000. |
See Notes to Financial Statements.
50
FINANCIAL HIGHLIGHTS (continued)
STRONG ENTERPRISE FUND — CLASS K
| Period Ended | ||||||||||||
| June 30, 2004(b) | Dec. 31, 2003 | Dec. 31, 2002(c) | ||||||||||
Selected Per-Share Data(a) | ||||||||||||
Net Asset Value, Beginning of Period | $ | 21.98 | $ | 15.94 | $ | 16.32 | ||||||
Income From Investment Operations: | ||||||||||||
Net Investment Income (Loss) | (0.11 | )(d) | (0.10 | ) | (0.04 | )(d) | ||||||
Net Realized and Unrealized Gains (Losses) on Investments | 1.34 | 6.14 | (0.34 | ) | ||||||||
Total from Investment Operations | 1.23 | 6.04 | (0.38 | ) | ||||||||
Less Distributions: | ||||||||||||
From Net Investment Income | — | — | — | |||||||||
Total Distributions | — | — | — | |||||||||
Net Asset Value, End of Period | $ | 23.21 | $ | 21.98 | $ | 15.94 | ||||||
Ratios and Supplemental Data | ||||||||||||
Total Return | +5.60 | % | +37.89 | % | –2.33 | % | ||||||
Net Assets, End of Period (In Millions) | $ | 15 | $ | 34 | $ | 4 | ||||||
Ratio of Expenses to Average Net Assets before Expense Offsets | 1.3 | %* | 1.3 | % | 1.3 | %* | ||||||
Ratio of Expenses to Average Net Assets | 1.2 | %* | 1.2 | % | 1.1 | %* | ||||||
Ratio of Net Investment Income (Loss) to Average Net Assets | (0.9 | )%* | (0.8 | )% | (0.6 | )%* | ||||||
Portfolio Turnover Rate(e) | 82.6 | % | 261.2 | % | 376.8 | % | ||||||
STRONG GROWTH 20 FUND — INVESTOR CLASS
| Period Ended | ||||||||||||||||||||||||
| June 30, 2004(b) | Dec. 31, 2003 | Dec. 31, 2002 | Dec. 31, 2001 | Dec. 31, 2000 | Dec. 31, 1999 | |||||||||||||||||||
Selected Per-Share Data(a) | ||||||||||||||||||||||||
Net Asset Value, Beginning of Period | $ | 12.96 | $ | 10.19 | $ | 14.74 | $ | 25.13 | $ | 30.63 | $ | 15.44 | ||||||||||||
Income From Investment Operations: | ||||||||||||||||||||||||
Net Investment Income (Loss) | (0.13 | ) | (0.17 | )(d) | (0.21 | ) | (0.15 | ) | (0.10 | ) | (0.08 | ) | ||||||||||||
Net Realized and Unrealized Gains (Losses) on Investments | 0.76 | 2.94 | (4.34 | ) | (10.24 | ) | (3.05 | ) | 16.60 | |||||||||||||||
Total from Investment Operations | 0.63 | 2.77 | (4.55 | ) | (10.39 | ) | (3.15 | ) | 16.52 | |||||||||||||||
Less Distributions: | ||||||||||||||||||||||||
From Net Realized Gains | — | — | — | — | (2.35 | ) | (1.33 | ) | ||||||||||||||||
Total Distributions | — | — | — | — | (2.35 | ) | (1.33 | ) | ||||||||||||||||
Net Asset Value, End of Period | $ | 13.59 | $ | 12.96 | $ | 10.19 | $ | 14.74 | $ | 25.13 | $ | 30.63 | ||||||||||||
Ratios and Supplemental Data | ||||||||||||||||||||||||
Total Return | +4.86 | % | +27.18 | % | –30.87 | % | –41.35 | % | –10.33 | % | +109.48 | % | ||||||||||||
Net Assets, End of Period (In Millions) | $ | 153 | $ | 253 | $ | 184 | $ | 361 | $ | 766 | $ | 466 | ||||||||||||
Ratio of Expenses to Average Net Assets before Expense Offsets | 1.9 | %* | 1.8 | % | 1.9 | % | 1.5 | % | 1.3 | % | 1.4 | % | ||||||||||||
Ratio of Expenses to Average Net Assets | 1.8 | %* | 1.7 | % | 1.9 | % | 1.5 | % | 1.3 | % | 1.4 | % | ||||||||||||
Ratio of Net Investment Income (Loss) to Average Net Assets | (1.5 | )%* | (1.5 | )% | (1.5 | )% | (0.8 | )% | (0.4 | )% | (0.6 | )% | ||||||||||||
Portfolio Turnover Rate(e) | 101.0 | % | 318.1 | % | 460.8 | % | 658.7 | % | 521.0 | % | 432.3 | % | ||||||||||||
| * | Calculated on an annualized basis. |
| (a) | Information presented relates to a share of capital stock of the Fund outstanding for the entire period. |
| (b) | For the six months ended June 30, 2004 (Unaudited). |
| (c) | For the period from August 30, 2002 (commencement of class) to December 31, 2002. |
| (d) | Net investment income (loss) per share represents net investment income (loss) divided by the average shares outstanding throughout the period. |
| (e) | Calculated on the basis of the Fund as a whole without distinguishing between classes of shares issued. |
See Notes to Financial Statements.
51
FINANCIAL HIGHLIGHTS (continued)
STRONG GROWTH 20 FUND — ADVISOR CLASS
| Period Ended | ||||||||||||||||||||
| June 30, 2004(b) | Dec. 31, 2003 | Dec. 31, 2002 | Dec. 31, 2001 | Dec. 31, 2000(c) | ||||||||||||||||
Selected Per-Share Data(a) | ||||||||||||||||||||
Net Asset Value, Beginning of Period | $ | 12.99 | $ | 10.19 | $ | 14.69 | $ | 25.06 | $ | 36.61 | ||||||||||
Income From Investment Operations: | ||||||||||||||||||||
Net Investment Income (Loss) | (0.09 | ) | (0.15 | )(d) | (0.15 | ) | (0.12 | ) | (0.02 | ) | ||||||||||
Net Realized and Unrealized Gains (Losses) on Investments | 0.74 | 2.95 | (4.35 | ) | (10.25 | ) | (9.18 | ) | ||||||||||||
Total from Investment Operations | 0.65 | 2.80 | (4.50 | ) | (10.37 | ) | (9.20 | ) | ||||||||||||
Less Distributions: | ||||||||||||||||||||
From Net Realized Gains | — | — | — | — | (2.35 | ) | ||||||||||||||
Total Distributions | — | — | — | — | (2.35 | ) | ||||||||||||||
Net Asset Value, End of Period | $ | 13.64 | $ | 12.99 | $ | 10.19 | $ | 14.69 | $ | 25.06 | ||||||||||
Ratios and Supplemental Data | ||||||||||||||||||||
Total Return | +5.00 | % | +27.48 | % | –30.63 | % | –41.38 | % | –25.17 | % | ||||||||||
Net Assets, End of Period (In Millions) | $ | 5 | $ | 6 | $ | 7 | $ | 10 | $ | 5 | ||||||||||
Ratio of Expenses to Average Net Assets before Expense Offsets | 1.7 | %* | 1.6 | % | 1.6 | % | 1.6 | % | 2.0 | %* | ||||||||||
Ratio of Expenses to Average Net Assets | 1.6 | %* | 1.5 | % | 1.6 | % | 1.6 | % | 1.9 | %* | ||||||||||
Ratio of Net Investment Income (Loss) to Average Net Assets | (1.3 | )%* | (1.3 | )% | (1.2 | )% | (0.9 | )% | (1.0 | )%* | ||||||||||
Portfolio Turnover Rate(e) | 101.0 | % | 318.1 | % | 460.8 | % | 658.7 | % | 521.0 | % | ||||||||||
STRONG GROWTH FUND — INVESTOR CLASS
| Period Ended | ||||||||||||||||||||||||
| June 30, 2004(b) | Dec. 31, 2003 | Dec. 31, 2002 | Dec. 31, 2001 | Dec. 31, 2000 | Dec. 31, 1999 | |||||||||||||||||||
Selected Per-Share Data(a) | ||||||||||||||||||||||||
Net Asset Value, Beginning of Period | $ | 17.19 | $ | 13.21 | $ | 17.68 | $ | 27.05 | $ | 35.66 | $ | 23.25 | ||||||||||||
Income From Investment Operations: | ||||||||||||||||||||||||
Net Investment Income (Loss) | (0.09 | ) | (0.16 | )(d) | (0.18 | )(d) | (0.15 | ) | (0.17 | ) | (0.18 | ) | ||||||||||||
Net Realized and Unrealized Gains (Losses) on Investments | 1.19 | 4.14 | (4.29 | ) | (9.15 | ) | (3.21 | ) | 17.08 | |||||||||||||||
Total from Investment Operations | 1.10 | 3.98 | (4.47 | ) | (9.30 | ) | (3.38 | ) | 16.90 | |||||||||||||||
Less Distributions: | ||||||||||||||||||||||||
From Net Realized Gains | — | — | — | (0.07 | ) | (5.23 | ) | (4.49 | ) | |||||||||||||||
Total Distributions | — | — | — | (0.07 | ) | (5.23 | ) | (4.49 | ) | |||||||||||||||
Net Asset Value, End of Period | $ | 18.29 | $ | 17.19 | $ | 13.21 | $ | 17.68 | $ | 27.05 | $ | 35.66 | ||||||||||||
Ratios and Supplemental Data | ||||||||||||||||||||||||
Total Return | +6.40 | % | +30.13 | % | –25.28 | % | –34.39 | % | –9.23 | % | +75.06 | % | ||||||||||||
Net Assets, End of Period (In Millions) | $ | 1,267 | $ | 1,366 | $ | 1,256 | $ | 2,022 | $ | 3,411 | $ | 3,354 | ||||||||||||
Ratio of Expenses to Average Net Assets before Expense Offsets | 1.5 | %* | 1.5 | % | 1.6 | % | 1.4 | % | 1.2 | % | 1.2 | % | ||||||||||||
Ratio of Expenses to Average Net Assets | 1.5 | %* | 1.5 | % | 1.6 | % | 1.4 | % | 1.2 | % | 1.2 | % | ||||||||||||
Ratio of Net Investment Income (Loss) to Average Net Assets | (1.0 | )%* | (1.1 | )% | (1.2 | )% | (0.7 | )% | (0.6 | )% | (0.8 | )% | ||||||||||||
Portfolio Turnover Rate(e) | 43.0 | % | 138.8 | % | 248.5 | % | 399.8 | % | 366.3 | % | 324.0 | % | ||||||||||||
| * | Calculated on an annualized basis. |
| (a) | Information presented relates to a share of capital stock of the Fund outstanding for the entire period. |
| (b) | For the six months ended June 30, 2004 (Unaudited). |
| (c) | For the period from February 24, 2000 (commencement of class) to December 31, 2000. |
| (d) | Net investment income (loss) per share represents net investment income (loss) divided by average shares outstanding throughout the year. |
| (e) | Calculated on the basis of the Fund as a whole without distinguishing between the classes of shares issued. |
See Notes to Financial Statements.
52
FINANCIAL HIGHLIGHTS (continued)
STRONG GROWTH FUND — INSTITUTIONAL CLASS
Period Ended | ||||||||||||||||||||
| June 30, 2004(b) | Dec. 31, 2003 | Dec. 31, 2002 | Dec. 31, 2001 | Dec. 31, 2000(c) | ||||||||||||||||
Selected Per-Share Data(a) | ||||||||||||||||||||
Net Asset Value, Beginning of Period | $ | 17.65 | $ | 13.48 | $ | 17.91 | $ | 27.17 | $ | 43.74 | ||||||||||
Income From Investment Operations: | ||||||||||||||||||||
Net Investment Income (Loss) | (0.04 | ) | (0.07 | )(d) | (0.08 | )(d) | (0.02 | ) | (0.01 | ) | ||||||||||
Net Realized and Unrealized Gains (Losses) on Investments | 1.22 | 4.24 | (4.35 | ) | (9.17 | ) | (11.33 | ) | ||||||||||||
Total from Investment Operations | 1.18 | 4.17 | (4.43 | ) | (9.19 | ) | (11.34 | ) | ||||||||||||
Less Distributions: | ||||||||||||||||||||
From Net Realized Gains | — | — | — | (0.07 | ) | (5.23 | ) | |||||||||||||
Total Distributions | — | — | — | (0.07 | ) | (5.23 | ) | |||||||||||||
Net Asset Value, End of Period | $ | 18.83 | $ | 17.65 | $ | 13.48 | $ | 17.91 | $ | 27.17 | ||||||||||
Ratios and Supplemental Data | ||||||||||||||||||||
Total Return | +6.69 | % | +30.93 | % | –24.73 | % | –33.84 | % | –25.72 | % | ||||||||||
Net Assets, End of Period (In Millions) | $ | 300 | $ | 311 | $ | 195 | $ | 73 | $ | 18 | ||||||||||
Ratio of Expenses to Average Net Assets before Expense Offsets | 0.9 | %* | 0.9 | % | 0.9 | % | 0.9 | % | 0.8 | %* | ||||||||||
Ratio of Expenses to Average Net Assets | 0.9 | %* | 0.9 | % | 0.9 | % | 0.9 | % | 0.8 | %* | ||||||||||
Ratio of Net Investment Income (Loss) to Average Net Assets | (0.4 | )%* | (0.5 | )% | (0.5 | )% | (0.3 | )% | (0.1 | )%* | ||||||||||
Portfolio Turnover Rate(e) | 43.0 | % | 138.8 | % | 248.5 | % | 399.8 | % | 366.3 | % | ||||||||||
STRONG GROWTH FUND — ADVISOR CLASS
Period Ended | ||||||||||||||||||||
| June 30, 2004(b) | Dec. 31, 2003 | Dec. 31, 2002 | Dec. 31, 2001 | Dec. 31, 2000(c) | ||||||||||||||||
Selected Per-Share Data(a) | ||||||||||||||||||||
Net Asset Value, Beginning of Period | $ | 17.09 | $ | 13.14 | $ | 17.58 | $ | 26.96 | $ | 43.74 | ||||||||||
Income From Investment Operations: | ||||||||||||||||||||
Net Investment Income (Loss) | (0.11 | ) | (0.16 | )(d) | (0.17 | )(d) | (0.15 | ) | (0.02 | ) | ||||||||||
Net Realized and Unrealized Gains (Losses) on Investments | 1.19 | 4.11 | (4.27 | ) | (9.16 | ) | (11.53 | ) | ||||||||||||
Total from Investment Operations | 1.08 | 3.95 | (4.44 | ) | (9.31 | ) | (11.55 | ) | ||||||||||||
Less Distributions: | ||||||||||||||||||||
From Net Realized Gains | — | — | — | (0.07 | ) | (5.23 | ) | |||||||||||||
Total Distributions | — | — | — | (0.07 | ) | (5.23 | ) | |||||||||||||
Net Asset Value, End of Period | $ | 18.17 | $ | 17.09 | $ | 13.14 | $ | 17.58 | $ | 26.96 | ||||||||||
Ratios and Supplemental Data | ||||||||||||||||||||
Total Return | +6.32 | % | +30.06 | % | –25.26 | % | –34.54 | % | –26.21 | % | ||||||||||
Net Assets, End of Period (In Millions) | $ | 8 | $ | 9 | $ | 10 | $ | 14 | $ | 4 | ||||||||||
Ratio of Expenses to Average Net Assets before Expense Offsets | 1.6 | %* | 1.6 | % | 1.6 | % | 1.6 | % | 2.0 | %* | ||||||||||
Ratio of Expenses to Average Net Assets | 1.6 | %* | 1.6 | % | 1.6 | % | 1.6 | % | 1.9 | %* | ||||||||||
Ratio of Net Investment Income (Loss) to Average Net Assets | (1.1 | )%* | (1.1 | )% | (1.2 | )% | (1.0 | )% | (0.9 | )%* | ||||||||||
Portfolio Turnover Rate(e) | 43.0 | % | 138.8 | % | 248.5 | % | 399.8 | % | 366.3 | % | ||||||||||
| * | Calculated on an annualized basis. |
| (a) | Information presented relates to a share of capital stock of the Fund outstanding for the entire period. |
| (b) | For the six months ended June 30, 2004 (Unaudited). |
| (c) | For the period from February 24, 2000 (commencement of class) to December 31, 2000. |
| (d) | Net investment income (loss) per share represents net investment income (loss) divided by average shares outstanding throughout the year. |
| (e) | Calculated on the basis of the Fund as a whole without distinguishing between the classes of shares issued. |
See Notes to Financial Statements.
53
FINANCIAL HIGHLIGHTS (continued)
STRONG GROWTH FUND — CLASS C
| Period Ended | ||||||||||||
| June 30, 2004(b) | Dec. 31, 2003 | Dec. 31, 2002(c) | ||||||||||
Selected Per-Share Data(a) | ||||||||||||
Net Asset Value, Beginning of Period | $ | 17.03 | $ | 13.21 | $ | 13.44 | ||||||
Income From Investment Operations: | ||||||||||||
Net Investment Income (Loss) | (0.20 | ) | (0.32 | )(d) | 0.00 | (d)(e) | ||||||
Net Realized and Unrealized Gains (Losses) on Investments | 1.20 | 4.14 | (0.23 | ) | ||||||||
Total from Investment Operations | 1.00 | 3.82 | (0.23 | ) | ||||||||
Less Distributions: | ||||||||||||
From Net Investment Income | — | — | — | |||||||||
Total Distributions | — | — | — | |||||||||
Net Asset Value, End of Period | $ | 18.03 | $ | 17.03 | $ | 13.21 | ||||||
Ratios and Supplemental Data | ||||||||||||
Total Return | +5.87 | % | +28.92 | % | –1.71 | % | ||||||
Net Assets, End of Period (In Millions) | $ | 0 | (f) | $ | 1 | $ | 0 | (f) | ||||
Ratio of Expenses to Average Net Assets before Expense Offsets | 3.6 | %* | 4.3 | % | 2.3 | %* | ||||||
Ratio of Expenses to Average Net Assets | 2.5 | %* | 2.5 | % | 2.3 | %* | ||||||
Ratio of Net Investment Income (Loss) to Average Net Assets | (2.0 | )%* | (2.0 | )% | 0.0 | %*(e) | ||||||
Portfolio Turnover Rate(g) | 43.0 | % | 138.8 | % | 248.5 | % | ||||||
STRONG GROWTH FUND — CLASS K
| Period Ended | ||||||||||||
| June 30, 2004(b) | Dec. 31, 2003 | Dec. 31, 2002(h) | ||||||||||
Selected Per-Share Data(a) | ||||||||||||
Net Asset Value, Beginning of Period | $ | 17.38 | $ | 13.29 | $ | 13.53 | ||||||
Income From Investment Operations: | ||||||||||||
Net Investment Income (Loss) | (0.04 | ) | (0.08 | )(d) | (0.01 | )(d) | ||||||
Net Realized and Unrealized Gains (Losses) on Investments | 1.20 | 4.17 | (0.23 | ) | ||||||||
Total from Investment Operations | 1.16 | 4.09 | (0.24 | ) | ||||||||
Less Distributions: | ||||||||||||
From Net Investment Income | — | — | — | |||||||||
Total Distributions | — | — | — | |||||||||
Net Asset Value, End of Period | $ | 18.54 | $ | 17.38 | $ | 13.29 | ||||||
Ratios and Supplemental Data | ||||||||||||
Total Return | +6.67 | % | +30.78 | % | –1.77 | % | ||||||
Net Assets, End of Period (In Millions) | $ | 65 | $ | 56 | $ | 13 | ||||||
Ratio of Expenses to Average Net Assets before Expense Offsets | 1.3 | %* | 1.2 | % | 1.3 | %* | ||||||
Ratio of Expenses to Average Net Assets | 1.0 | %* | 1.0 | % | 1.0 | %* | ||||||
Ratio of Net Investment Income (Loss) to Average Net Assets | (0.5 | )%* | (0.5 | )% | (0.7 | )%* | ||||||
Portfolio Turnover Rate(g) | 43.0 | % | 138.8 | % | 248.5 | % | ||||||
| * | Calculated on an annualized basis. |
| (a) | Information presented relates to a share of capital stock of the Fund outstanding for the entire period. |
| (b) | For the six months ended June 30, 2004 (Unaudited). |
| (c) | For the period from December 26, 2002 (commencement of class) to December 31, 2002. |
| (d) | Net investment income (loss) per share represents net investment income (loss) divided by average shares outstanding throughout the year. |
| (e) | Amount calculated is less than $0.005 or 0.05%. |
| (f) | Amount is less than $500,000. |
| (g) | Calculated on the basis of the Fund as a whole without distinguishing between the classes of shares issued. |
| (h) | For the period from August 30, 2002 (commencement of class) to December 31, 2002. |
See Notes to Financial Statements.
54
FINANCIAL HIGHLIGHTS (continued)
STRONG LARGE COMPANY GROWTH FUND — INVESTOR CLASS
| Period Ended | ||||||||||||||||||||||||||||
| June 30, 2004(b) | Dec. 31, 2003 | Dec. 31, 2002(c) | Sept. 30, 2002(d) | Sept. 30, 2001 | Sept. 30, 2000 | Sept. 30, 1999 | ||||||||||||||||||||||
Selected Per-Share Data(a) | ||||||||||||||||||||||||||||
Net Asset Value, Beginning of Period | $ | 13.36 | $ | 10.66 | $ | 10.25 | $ | 12.17 | $ | 19.15 | $ | 13.12 | $ | 9.80 | ||||||||||||||
Income From Investment Operations: | ||||||||||||||||||||||||||||
Net Investment Income | (0.04 | ) | (0.04 | ) | (0.00 | )(e) | 0.31 | 0.32 | 0.29 | 0.18 | ||||||||||||||||||
Net Realized and Unrealized Gains (Losses) on Investments | 1.00 | (f) | 2.75 | (f) | 0.45 | (1.93 | ) | (5.09 | ) | 6.26 | 3.33 | |||||||||||||||||
Total from Investment Operations | 0.96 | 2.71 | 0.45 | (1.62 | ) | (4.77 | ) | 6.55 | 3.51 | |||||||||||||||||||
Less Distributions: | ||||||||||||||||||||||||||||
From Net Investment Income | — | (0.01 | ) | (0.04 | ) | (0.27 | ) | (0.32 | ) | (0.27 | ) | (0.19 | ) | |||||||||||||||
From Net Realized Gains | — | — | — | (0.03 | ) | (1.89 | ) | (0.25 | ) | — | ||||||||||||||||||
Total Distributions | — | (0.01 | ) | (0.04 | ) | (0.30 | ) | (2.21 | ) | (0.52 | ) | (0.19 | ) | |||||||||||||||
Net Asset Value, End of Period | $ | 14.32 | $ | 13.36 | $ | 10.66 | $ | 10.25 | $ | 12.17 | $ | 19.15 | $ | 13.12 | ||||||||||||||
Ratios and Supplemental Data | ||||||||||||||||||||||||||||
Total Return | +7.19 | % | +25.41 | % | +4.38 | % | –13.69 | % | –26.22 | % | +50.67 | % | +35.98 | % | ||||||||||||||
Net Assets, End of Period | $ | 70 | $ | 71 | $ | 21 | $ | 18 | $ | 33 | $ | 37 | $ | 9 | ||||||||||||||
Ratio of Expenses to Average Net Assets before Expense Offsets | 1.8 | %* | 1.8 | % | 1.9 | %* | 1.7 | % | 1.6 | % | 1.6 | % | 3.1 | % | ||||||||||||||
Ratio of Expenses to Average Net Assets | 1.5 | %* | 1.5 | % | 1.3 | %* | 1.5 | % | 1.5 | % | 1.5 | % | 1.5 | % | ||||||||||||||
Ratio of Net Investment Income (Loss) to Average Net Assets | (0.6 | )%* | (0.5 | )% | 0.2 | %* | 2.3 | % | 2.2 | % | 1.8 | % | 1.5 | % | ||||||||||||||
Portfolio Turnover Rate(g) | 151.0 | % | 229.0 | % | 71.8 | % | 311.3 | % | 285.3 | % | 180.8 | % | 120.2 | % | ||||||||||||||
STRONG LARGE COMPANY GROWTH FUND — CLASS K
| Period Ended | ||||||||
| June 30, 2004(b) | Dec. 31, 2003(h) | |||||||
Selected Per-Share Data(a) | ||||||||
Net Asset Value, Beginning of Period | $ | 13.40 | $ | 11.96 | ||||
Income From Investment Operations: | ||||||||
Net Investment Income | (0.00 | )(e) | (0.00 | )(e) | ||||
Net Realized and Unrealized Gains (Losses) on Investments | 0.99 | (f) | 1.44 | (i) | ||||
Total from Investment Operations | 0.99 | 1.44 | ||||||
Less Distributions: | ||||||||
From Net Investment Income | — | — | ||||||
Total Distributions | — | — | ||||||
Net Asset Value, End of Period | $ | 14.39 | $ | 13.40 | ||||
Ratios and Supplemental Data | ||||||||
Total Return | +7.39 | % | +12.04 | % | ||||
Net Assets, End of Period (In Millions) | $ | 4 | $ | 1 | ||||
Ratio of Expenses to Average Net Assets before Expense Offsets | 1.4 | %* | 2.1 | %* | ||||
Ratio of Expenses to Average Net Assets | 1.0 | %* | 0.9 | %* | ||||
Ratio of Net Investment Income (Loss) to Average Net Assets | (0.2 | )%* | (0.0 | )%*(e) | ||||
Portfolio Turnover Rate(g) | 151.0 | % | 229.0 | % | ||||
| * | Calculated on an annualized basis. |
| (a) | Information presented relates to a share of capital stock of the Fund outstanding for the entire period. |
| (b) | For the six months ended June 30, 2004 (Unaudited). |
| (c) | In 2002, the Fund changed its fiscal year-end from September to December. |
| (d) | Effective September 5, 2002, Strong Capital Management, Inc. assumed the investment advisory responsibilities from Rockhaven Asset Management, LLC. |
| (e) | Amount calculated is less than $0.005 or 0.05%. |
| (f) | Includes $0.01 in redemption fees (Note 2R). |
| (g) | Calculated on the basis of the Fund as a whole without distinguishing between the classes of shares issued. |
| (h) | For the period from June 30, 2003 (commencement of class) through December 31, 2003. |
| (i) | Includes $0.02 in redemption fees (Note 2R). |
See Notes to Financial Statements.
55
June 30, 2004 (Unaudited)
| 1. | Organization |
The accompanying financial statements represent the following Strong Growth Funds (the “Funds”), each with its own investment objectives and policies:
| • | Strong Blue Chip Fund(1) (a series fund of Strong Conservative Equity Funds, Inc.) |
| • | Strong Discovery Fund(1) (a series fund of Strong Discovery Fund, Inc.) |
| • | Strong Endeavor Fund(1) (a series fund of Strong Opportunity Fund, Inc.) |
| • | Strong Large Cap Growth Fund(1) (a series fund of Strong Large Cap Growth Fund, Inc.) |
| • | Strong U.S. Emerging Growth Fund(1) (a series fund of Strong Equity Funds, Inc.) |
| • | Strong Enterprise Fund(1) (a series fund of Strong Equity Funds, Inc.) |
| • | Strong Growth 20 Fund(2) (a series fund of Strong Equity Funds, Inc.) |
| • | Strong Large Company Growth Fund(1) (a series fund of Strong Equity Funds, Inc.) |
| (1) | Diversified Fund. |
| (2) | Non-diversified Fund. |
Each Fund is an open-end management investment company registered under the Investment Company Act of 1940, as amended (“1940 Act”).
Strong Blue Chip Fund, Strong Discovery Fund, Strong Endeavor Fund, Strong Large Cap Growth Fund, and Strong U.S. Emerging Growth Fund offer Investor Class shares. Strong Enterprise Fund offers Investor Class, Institutional Class, Advisor Class, and Class K shares. Strong Growth 20 Fund offers Investor Class and Advisor Class shares. Strong Growth Fund offers Investor Class, Institutional Class, Advisor Class, Class C, and Class K shares. Strong Large Company Growth Fund offers Investor Class and Class K shares. All classes of shares differ principally in their respective administration, transfer agent, and distribution expenses and sales charges, if any. All classes of shares have identical rights to earnings, assets, and voting privileges, except for class-specific expenses and exclusive rights to vote on matters affecting only individual classes.
Investor Class shares are available to the general public, Institutional Class shares are generally available to investors that meet certain higher initial investment minimums, Advisor Class shares and Class C shares are available only through financial professionals, and Class K shares are primarily available through retirement plans.
Effective June 30, 2003 (public launch July 1, 2003), Strong Enterprise Fund issued an additional class of shares: Institutional Class shares.
Effective June 30, 2003 (public launch July 1, 2003), Strong Large Company Growth Fund issued an additional class of shares: Class K shares.
| 2. | Significant Accounting Policies |
The following is a summary of significant accounting policies followed by the Funds in the preparation of their financial statements.
| (A) | Security Valuation — Securities of the Funds traded on a national securities exchange are valued each business day at the last sales price. Securities traded on the NASDAQ Stock Market are valued each business day using the NASDAQ Official Closing Price (“NOCP”). Exchange-traded securities for which there were no transactions and NASDAQ-traded securities for which there is no NOCP are valued at the mean of the bid and ask prices. Securities for which market quotations are not readily available are fair valued as determined in good faith under the general supervision of the Board of Directors. Occasionally, events affecting the value of foreign investments and exchange rates occur between the time at which those items are determined and the close of trading on the New York Stock Exchange. Such events would not normally be reflected in a calculation of the Funds’ net asset values on that day. If events that materially affect the value of the Funds’ foreign investments or the foreign currency exchange rates occur during such period, the investments will be fair valued as determined in good faith under the general supervision of the Board of Directors. Securities that are purchased within 60 days of their stated maturity are valued at amortized cost, which approximates fair value. |
The Funds may own certain securities that are restricted as to resale. Restricted securities include Section 4(2) commercial paper, securities issued in a private placement, or securities eligible for resale pursuant to Rule 144A under the Securities Act of 1933. Restricted securities may be determined to be liquid or illiquid. Securities are deemed illiquid based upon guidelines established by the Funds’ Board of Directors. Illiquid securities are valued after giving due consideration to pertinent factors, such as recent private sales, market conditions, and the issuer’s financial performance. The Funds held no restricted and illiquid securities at June 30, 2004.
56
| (B) | Federal Income and Excise Taxes and Distributions to Shareholders — The Funds intend to comply with the requirements of the Internal Revenue Code of 1986, as amended, applicable to regulated investment companies and to distribute substantially all of their taxable income to their shareholders in a manner which results in no tax cost to the Funds. Therefore, no federal income or excise tax provision is recorded. |
Undistributed income or net realized gains for financial statement purposes may differ from what is determined for federal income tax purposes due to differences in the timing, recognition, and characterization of income, expense, and capital gain items for financial statement and tax purposes. Where appropriate, reclassifications between net asset accounts are made for such differences that are permanent in nature. The Funds may utilize earnings and profits distributed to shareholders on redemptions of shares as part of the dividends paid deduction.
Strong Discovery Fund, Strong Endeavor Fund, Strong Large Cap Growth Fund, Strong U.S. Emerging Growth Fund, Strong Enterprise Fund, Strong Growth 20 Fund, Strong Growth Fund, and Strong Large Company Growth Fund generally pay dividends from net investment income and distribute net realized capital gains, if any, at least annually. Strong Blue Chip Fund generally pays dividends from net investment income quarterly and distributes net realized capital gains, if any, at least annually.
| (C) | Realized Gains and Losses on Investment Transactions — Investment security transactions are recorded as of the trade date. Gains or losses realized on investment transactions are determined by comparing the identified cost of the security lot sold with the net sales proceeds. |
| (D) | Certain Investment Risks — The Funds may utilize derivative instruments including options, futures, and other instruments with similar characteristics to the extent that they are consistent with the Funds’ investment objectives and limitations. The Funds intend to use such derivative instruments primarily to hedge or protect itself from adverse movements in securities’ prices, foreign currencies, or interest rates. The use of these instruments involves certain risks, including the possibility that the future value of the underlying assets or indices fluctuate (in the case of futures and options), the derivative becomes illiquid, an imperfect correlation arises between the value of the derivative and the underlying assets or indices, or that the counterparty fails to perform its obligations when due. |
Investments in foreign-denominated assets or forward foreign currency contracts may involve greater risks than domestic investments such as foreign-related risks created by currency rate fluctuations, foreign political and economic instability, foreign financial reporting standards and taxes, and foreign securities markets and issuer regulation. Foreign securities may be less liquid than domestic securities.
| (E) | Futures — Upon entering into a futures contract, the Funds segregate cash and/or other liquid investments equal to the minimum “initial margin” requirements of the exchange and the futures commission merchant or broker. Each Fund designates liquid securities as collateral on open futures contracts. During the term of the futures contract, the Funds also receive credit from, or pay to, the futures commission merchant or broker an amount of cash or liquid assets equal to the daily fluctuation in the value of the futures contract. Such receipts or payments are known as “variation margin” and are recorded as unrealized gains or losses by the Funds. When the futures contract is closed, a realized gain or loss is recorded equal to the difference between the value of the futures contract at the time it was opened and the value at the time it was closed. |
| (F) | Written Options — The Funds may write put or call options. Premiums received by the Funds upon writing put or call options are recorded as an asset with a corresponding liability that is subsequently adjusted daily to the current market value of the option. Changes between the initial premiums received and the current market value of the options are recorded as unrealized gains or losses by the Funds. When a written option is closed, expired, or exercised, the Funds realize a gain or loss and the liability is eliminated. The Funds continue to bear the risk of adverse movements in the price of the underlying asset during the period of the written option, although any potential loss during the period would be reduced by the amount of the option premium received by the Funds. Each Fund designates liquid securities or cash on its books to cover its financial exposure on open written options contracts. |
| (G) | Foreign Currency Conversion — Securities and other assets and liabilities initially expressed in foreign currencies are converted daily into U.S. dollars based upon current exchange rates. Purchases and sales of foreign securities and foreign income are converted into U.S. dollars based upon currency exchange rates prevailing on the respective dates of such transactions. The effect of changes in foreign exchange rates on realized and unrealized security gains or losses is reflected as a component of such gains or losses. |
| (H) | Forward Foreign Currency Exchange Contracts — Forward foreign currency exchange contracts are valued at the forward rate and are marked-to-market daily. The change in market value is recorded as an unrealized gain or loss. When the contract is closed, the Funds record an exchange gain or loss equal to the difference between the value of the contract at the time it was opened and the value at the time it was closed. |
57
NOTES TO FINANCIAL STATEMENTS (continued)
June 30, 2004 (Unaudited)
| (I) | Short Positions — The Funds may engage in short sale transactions. For financial statement purposes, an amount equal to the settlement amount is included in the Statements of Assets and Liabilities as an asset and an equivalent liability. The amount of the liability is subsequently marked-to-market to reflect the current value of the short position. Changes between the amount of the liability and the current market value of the short positions are recorded as unrealized gains or losses. The Funds are liable to the buyer for any dividends payable on securities while those securities are in a short position. These dividends are an expense of the Fund and are included in Other Expenses in the Statement of Operations. If the Funds sell securities short while also holding the long position in the security, they may protect unrealized gains, but will lose the opportunity to profit on such securities if the price rises. If the Funds sell securities short when not holding the long position in the security, they will experience a loss if the market price of the security increases between the date of the short sale and the date the security is replaced. |
| (J) | Repurchase Agreements — The Funds may enter into repurchase agreements with institutions that the Funds’ investment advisor, Strong Capital Management, Inc. (the “Advisor”), has determined are creditworthy. Each repurchase transaction is recorded at cost, which approximates fair value. The Funds require that the collateral, represented by cash and/or securities (primarily U.S. government securities), in a repurchase transaction be maintained in a segregated account under the control of the Funds’ custodial bank in a manner sufficient to enable the Funds to liquidate those securities in the event of a default of the counterparty. On a daily basis, the Funds’ custodial bank monitors the value of the collateral, including accrued interest, to ensure it is at least equal to the amounts owed to the Funds under each repurchase agreement. |
| (K) | Securities Lending — The Funds have entered into a Securities Lending Agreement (the “Agreement”) with Deutsche Bank, which was subsequently assumed by State Street Bank and Trust Company. Under the terms of the Agreement, the Funds may lend portfolio securities to qualified institutional borrowers in order to earn additional income. The Agreement requires that loans are collateralized at all times by cash and cash equivalents equal to at least 102% of the market value of the aggregate loaned securities, plus accrued interest, and the collateral is marked-to-market daily. Cash collateral received is invested in repurchase agreements, investment funds, government obligations, and/or bank obligations. |
At June 30, 2004, Strong Discovery Fund, Strong Large Cap Growth Fund, Strong Enterprise Fund, and Strong Growth Fund had securities with a market value of $16,398,623, $6,442,867, $29,817,784, and $17,480,782, respectively, on loan and had received $16,953,906, $6,651,057, $30,900,750, and $18,012,000, respectively, in collateral (both are included within Investments in the Statements of Assets and Liabilities). Amounts earned as interest on investments of cash collateral, net of rebates and other securities lending expenses, are included in Interest Income in the Statements of Operations. For the six months ended June 30, 2004, the securities lending income totaled $12,951, $6,022, $17,254, and $12,085 for Strong Discovery Fund, Strong Large Cap Growth Fund, Strong Enterprise Fund, and Strong Growth Fund, respectively.
The three primary risks associated with securities lending are: a borrower defaulting on its obligation to return the securities loaned resulting in a shortfall on the posted collateral; a principal loss arising from the lending agent’s investment of cash collateral; and the inability of the lending Fund to recall a security in time to exercise valuable voting rights or sell the security. In each case, the lending agent has indemnified the Funds for these types of losses.
| (L) | Directed Brokerage — The Funds direct certain portfolio trades to brokers who, in turn, pay a portion of the Funds’ expenses not attributable to the Advisor or its affiliates. Such amounts are included in Expense Offsets reported in the Funds’ Statements of Operations and in Note 4. |
| (M) | Earnings Credit Arrangements — Credits are earned on positive cash balances maintained in custodian accounts. These credits serve to reduce the custodian’s fees incurred by certain Funds and are included in Expense Offsets reported in the Funds’ Statements of Operations and in Note 4. |
| (N) | Expenses — The Funds and other affiliated Strong Funds contract for certain services on a collective basis. The majority of the expenses are directly identifiable to an individual Fund. Expenses that are not readily identifiable to a specific Fund will be allocated in such a manner as deemed equitable, taking into consideration, among other things, the nature and type of expense and the relative sizes of the Strong Funds. |
| (O) | Use of Estimates — The preparation of financial statements in conformity with accounting principles generally accepted in the United States of America requires management to make estimates and assumptions that affect the reported amounts in these financial statements. Actual results could differ from those estimates. |
| (P) | Guarantees and Indemnifications — In the normal course of business, the Funds enter into contracts with service providers that contain general indemnification clauses. The Funds’ maximum exposure under these arrangements is unknown, as this would involve future claims that may be made against the Funds that have not yet occurred. However, based on experience, the Funds expect the risk of loss to be remote. |
58
| (Q) | Other — Dividend income and distributions to shareholders are recorded on the ex-dividend date. Interest income is recorded on the accrual basis and includes amortization of premiums and discounts on the interest method. Income, expenses (other than expenses attributable to a specific class), and realized and unrealized gains or losses on investments are allocated to each class of shares based on its relative shares outstanding. |
| (R) | Redemption Fees — Investor Class shares of Strong Large Company Growth Fund held for 360 calendar days or less after purchase are subject to a redemption fee of 1.00%, based on the redeemed share’s market value. Redemption fees are paid directly to the Fund. The amount collected for the period is included in Capital Stock reported in the Statements of Assets and Liabilities and in Note 8. |
| 3. | Related Party Transactions |
The Advisor provides investment advisory and related services to the Funds. Strong Investor Services, Inc. (the “Administrator”), an affiliate of the Advisor, provides administrative, transfer agent, and related services to the Funds. Certain officers and, until December 2, 2003, certain directors of the Funds are or were affiliated with the Advisor and the Administrator. Investment advisory and administration fees, which are established by terms of the advisory and administration agreements, are based on the following annualized rates of the average daily net assets of the respective Fund:
| Administrative Fees | ||||||||||||||||||
| Advisory Fees | Investor Class | Institutional Class | Advisor Class | Class C | Class K | |||||||||||||
Strong Blue Chip Fund | 0.50 | % | 0.30 | % | * | * | * | * | ||||||||||
Strong Discovery Fund | 0.75 | % | 0.25 | % | * | * | * | * | ||||||||||
Strong Endeavor Fund | 0.75 | %(1) | 0.30 | % | * | * | * | * | ||||||||||
Strong Large Cap Growth Fund | 0.60 | %(2) | 0.30 | % | * | * | * | * | ||||||||||
Strong U.S. Emerging Growth Fund | 0.75 | %(1) | 0.30 | % | * | * | * | * | ||||||||||
Strong Enterprise Fund | 0.75 | %(1) | 0.30 | % | 0.02 | % | 0.30 | % | * | 0.25 | % | |||||||
Strong Growth 20 Fund | 0.75 | %(1) | 0.30 | % | * | 0.30 | % | * | * | |||||||||
Strong Growth Fund | 0.75 | %(1) | 0.30 | % | 0.02 | % | 0.30 | % | 0.30 | % | 0.25 | % | ||||||
Strong Large Company Growth Fund | 0.75 | %(1) | 0.30 | % | * | * | * | 0.25 | % | |||||||||
| * | Does not offer share class. |
| (1) | The investment advisory fees are 0.75% for assets under $4 billion, 0.725% for the next $2 billion assets, and 0.70% for assets $6 billion and above. |
| (2) | The investment advisory fees are 0.60% for first $35 million assets and 0.55% for assets over $35 million. |
The Funds’ Advisor and/or Administrator may voluntarily waive or absorb certain expenses at their discretion. The Advisor and/or Administrator has contractually agreed to waive its fees and/or absorb expenses for the Investor Class shares of the Strong Large Company Growth Fund to keep Net Annual Operating Expenses at no more than 1.50%. This agreement may only be terminated by the Board of Directors of the Funds, but not before May 1, 2005. The Advisor and/or Administrator has contractually agreed to waive and/or absorb expenses until May 1, 2005, to keep Net Annual Operating Expenses of the Investor Class of Strong Endeavor Fund and Strong Enterprise Fund at no more than 2.00%, Class C of Strong Growth Fund at no more than 2.50%, Class K of Strong Enterprise Fund at no more than 1.20% and Class K of Strong Growth Fund and Strong Large Company Growth Fund at no more than 0.99%.
Transfer agent and related service fees for the Investor Class shares are paid at an annual rate of $27.00 for each open shareholder account and $4.20 for each closed shareholder account. Transfer agent and related service fees for the Institutional Class, Advisor Class, Class C, and Class K shares are paid at an annual rate of 0.015%, 0.20%, 0.20%, and 0.20%, respectively, of the average daily net assets of each respective class. Transfer agent fees are recorded in Shareholder Servicing Costs in the Funds’ Statements of Operations. The Administrator also allocates to each Fund certain charges or credits resulting from transfer agency banking activities based on each Class’ level of subscription and redemption activity. Transfer Agency Banking Charges allocated to the Funds by the Administrator, if any, are included in Other Expenses in the Funds’ Statements of Operations. Transfer Agency Banking Credits allocated by the Administrator, if any, serve to reduce the transfer agent expenses incurred by the Funds and are included in Expense Offsets in the Funds’ Statements of Operations and in Note 4. The Administrator is also compensated for certain other out-of-pocket expenses related to transfer agent services.
Strong Endeavor Fund, Strong Large Company Growth Fund, Strong Enterprise Fund, Strong Growth 20 Fund, and Strong Growth Fund have adopted a Rule 12b-1 distribution and service plan under the 1940 Act on behalf of the Investor Class shares of Strong Endeavor Fund and Strong Large Company Growth Fund, the Advisor Class shares of Strong Enterprise Fund, Strong Growth 20 Fund, and Strong Growth Fund and the Class C shares of Strong Growth Fund. Under the plan, Strong Investments, Inc. (the “Distributor,” and an affiliate of the Advisor) is paid an annual rate of 0.25% of the average daily net assets of the
59
NOTES TO FINANCIAL STATEMENTS (continued)
June 30, 2004 (Unaudited)
Investor Class shares and the Advisor Class shares and 1.00% for Class C shares as compensation for services provided and expenses incurred, including amounts paid to brokers or dealers, in connection with the sale of each Class’ shares. See Note 4.
Strong Growth Fund’s Class C shares have a maximum 1.00% contingent deferred sales charge if shares are sold within one year of their original purchase date. For the six months ended June 30, 2004, the Distributor received no aggregate contingent deferred sales charges from the redemption of Class C shares for Strong Growth Fund. Sales charges are not an expense of the Funds and are not reflected in the financial statements of the Funds. Sales charges may be waived in limited circumstances.
Next Century Growth Investors, LLC (“Next Century Growth”), an affiliate of the Advisor, manages the investments of Strong U.S. Emerging Growth Fund under a subadvisory agreement with the Advisor. Next Century Growth is compensated by the Advisor (not the Fund) and bears all of its own expenses in providing subadvisory services.
The Funds may invest cash in money market funds managed by the Advisor, subject to certain limitations set by the Fund’s Board of Directors and applicable law.
Certain information regarding related party transactions, excluding the effects of waivers and absorptions, for the six months ended June 30, 2004, is as follows:
| Payable to/ (Receivable From) Advisor or Administrator at June 30, 2004 | Shareholder Servicing and Other Related Expenses Paid to Administrator | Transfer Agency Banking Charges/(Credits) | Unaffiliated Directors’ and Independent Officers’ Fees | |||||||||
Strong Blue Chip Fund | $ | 91,790 | $ | 517,270 | $ | 4,895 | $ | 4,716 | ||||
Strong Discovery Fund | 37,817 | 265,135 | 1,652 | 4,404 | ||||||||
Strong Endeavor Fund | 12,589 | 66,067 | 258 | 585 | ||||||||
Strong Large Cap Growth Fund | 145,798 | 866,304 | 8,180 | 17,266 | ||||||||
Strong U.S. Emerging Growth Fund | 28,829 | 193,371 | 1,670 | 3,122 | ||||||||
Strong Enterprise Fund | 101,700 | 852,361 | 8,503 | 7,533 | ||||||||
Strong Growth 20 Fund | 115,145 | 590,918 | 5,025 | 6,650 | ||||||||
Strong Growth Fund | 364,592 | 2,377,947 | 24,934 | 46,582 | ||||||||
Strong Large Company Growth Fund | 22,934 | 125,640 | 2,691 | 1,607 | ||||||||
| 4. | Expenses and Expense Offsets |
For the six months ended June 30, 2004, the class specific expenses are as follows:
| Administrative Fees | Shareholder Servicing Costs | Reports to Shareholders | 12b-1 Fees | Other | |||||||||||
Strong Enterprise Fund | |||||||||||||||
Investor Class | $ | 389,678 | $ | 824,831 | $ | 193,928 | $ | — | $ | 9,372 | |||||
Institutional Class | 283 | 216 | 1,782 | — | 1 | ||||||||||
Advisor Class | 2,570 | 1,761 | 759 | 2,142 | 28 | ||||||||||
Class K | 29,360 | 23,502 | 4,456 | — | 1,153 | ||||||||||
Strong Growth 20 Fund | |||||||||||||||
Investor Class | 282,051 | 583,829 | 119,505 | — | 6,786 | ||||||||||
Advisor Class | 7,329 | 4,901 | 1,518 | 6,108 | 427 | ||||||||||
Strong Growth Fund | |||||||||||||||
Investor Class | 1,924,924 | 2,285,560 | 464,557 | — | 15,696 | ||||||||||
Institutional Class | 30,081 | 22,669 | 127,046 | — | 14,428 | ||||||||||
Advisor Class | 12,725 | 8,551 | 2,163 | 10,605 | 80 | ||||||||||
Class C | 714 | 492 | 2,947 | 2,374 | 17 | ||||||||||
Class K | 68,849 | 55,079 | 14,821 | — | 309 | ||||||||||
Strong Large Company Growth Fund | |||||||||||||||
Investor Class | 110,926 | 122,984 | 18,043 | 92,438 | 3,521 | ||||||||||
Class K | 2,128 | 1,710 | 982 | — | 115 | ||||||||||
60
For the six months ended June 30, 2004, the expense offsets are as follows:
| Expense Waivers and Absorptions | Transfer Agency Banking Credits | Directed Brokerage Credits | Earnings Credits | ||||||||||||
Strong Blue Chip Fund | $ | (20,946 | ) | $ | — | $ | — | $ | (24 | ) | |||||
Strong Discovery Fund | (21,245 | ) | — | (10,263 | ) | (68 | ) | ||||||||
Strong Endeavor Fund | (13,358 | ) | — | (1,886 | ) | (32 | ) | ||||||||
Strong Large Cap Growth Fund | (67,289 | ) | — | (22,121 | ) | (355 | ) | ||||||||
Strong U.S. Emerging Growth Fund | (12,152 | ) | — | (4,791 | ) | (86 | ) | ||||||||
Strong Enterprise Fund | |||||||||||||||
Investor Class | (14,749 | ) | — | — | — | ||||||||||
Institutional Class | (367 | ) | — | — | — | ||||||||||
Advisor Class | (170 | ) | — | — | — | ||||||||||
Class K | (10,875 | ) | — | — | — | ||||||||||
Fund Level | (26,647 | ) | — | (8,987 | ) | (98 | ) | ||||||||
Strong Growth 20 Fund | |||||||||||||||
Investor Class | (12,540 | ) | — | — | — | ||||||||||
Advisor Class | (566 | ) | — | — | — | ||||||||||
Fund Level | (16,515 | ) | — | (6,924 | ) | (116 | ) | ||||||||
Strong Growth Fund | |||||||||||||||
Investor Class | (45,067 | ) | — | — | — | ||||||||||
Institutional Class | (1,063 | ) | — | — | — | ||||||||||
Advisor Class | (710 | ) | — | — | — | ||||||||||
Class C | (2,462 | ) | — | — | — | ||||||||||
Class K | (79,810 | ) | — | — | — | ||||||||||
Fund Level | (150,035 | ) | — | (43,487 | ) | (355 | ) | ||||||||
Strong Large Company Growth Fund | |||||||||||||||
Investor Class | (106,538 | ) | — | — | — | ||||||||||
Class K | (3,383 | ) | — | — | — | ||||||||||
Fund Level | (7,059 | ) | — | (7,296 | ) | (17 | ) | ||||||||
| 5. | Line of Credit |
The Strong Funds have established a line of credit agreement (“LOC”) with certain financial institutions, which expires October 8, 2004, to be used for temporary or emergency purposes. Combined borrowings among all participating Strong Funds are subject to a $350 million cap on the total LOC. For an individual Fund, borrowings under the LOC are limited to either the lesser of 15% of the market value of the Fund’s total assets or any explicit borrowing limits in the Fund’s registration statement. The principal amount of each borrowing under the LOC is due not more than 45 days after the date of the borrowing. Borrowings under the LOC bear interest based on prevailing market rates as defined in the LOC. A commitment fee of 0.09% per annum is incurred on the unused portion of the LOC and is allocated to all participating Strong Funds based on their net asset values. Strong Blue Chip Fund, Strong Discovery Fund, Strong Endeavor Fund, Strong Large Cap Growth Fund, Strong Enterprise Fund, Strong Growth 20 Fund, Strong Growth Fund, and Strong Large Company Growth Fund had no borrowings under the LOC during the period. Strong U.S. Emerging Growth Fund had minimal borrowings during the period. At June 30, 2004, there were no outstanding borrowings by the Funds under the LOC.
| 6. | Investment Transactions |
The aggregate purchases and sales of long-term securities during the six months ended June 30, 2004, are as follows:
| Purchases | Sales | |||||
Strong Blue Chip Fund | $ | 196,841,301 | $ | 230,589,990 | ||
Strong Discovery Fund | 117,513,808 | 125,092,588 | ||||
Strong Endeavor Fund | 37,444,555 | 17,686,551 | ||||
Strong Large Cap Growth Fund | 244,715,739 | 359,326,903 | ||||
Strong U.S. Emerging Growth Fund | 52,422,443 | 69,312,983 | ||||
Strong Enterprise Fund | 237,099,076 | 248,552,235 | ||||
Strong Growth 20 Fund | 191,725,213 | 302,937,635 | ||||
Strong Growth Fund | 707,643,429 | 901,766,077 | ||||
Strong Large Company Growth Fund | 111,943,187 | 117,463,976 | ||||
There were no purchases or sales of long-term U.S. government securities during the six months ended June 30, 2004.
61
NOTES TO FINANCIAL STATEMENTS (continued)
June 30, 2004 (Unaudited)
| 7. | Income Tax Information |
The following information for the Funds is presented on an income tax basis as of June 20, 2004:
| Cost of Investments | Gross Unrealized Appreciation | Gross Unrealized (Depreciation) | Net Unrealized Appreciation/ (Depreciation) on Investments | ||||||||||
Strong Blue Chip Fund | $ | 126,226,140 | $ | 23,500,380 | $ | (622,087 | ) | $ | 22,878,293 | ||||
Strong Discovery Fund | 160,522,961 | 32,431,064 | (1,041,435 | ) | 31,389,629 | ||||||||
Strong Endeavor Fund | 23,236,986 | 2,196,594 | (308,566 | ) | 1,888,028 | ||||||||
Strong Large Cap Growth Fund | 474,118,923 | 93,651,302 | (1,924,502 | ) | 91,726,800 | ||||||||
Strong U.S. Emerging Growth Fund | 63,526,651 | 24,067,602 | (1,769,369 | ) | 22,298,233 | ||||||||
Strong Enterprise Fund | 268,459,392 | 52,456,800 | (713,584 | ) | 51,743,216 | ||||||||
Strong Growth 20 Fund | 125,263,317 | 37,387,072 | (2,441,160 | ) | 34,945,912 | ||||||||
Strong Growth Fund | 1,284,615,657 | 380,777,575 | (7,463,662 | ) | 373,313,913 | ||||||||
Strong Large Company Growth Fund | 66,066,089 | 7,161,836 | (422,738 | ) | 6,739,098 | ||||||||
The difference between cost amounts for financial statement and federal income tax purposes is due primarily to timing differences in recognizing certain gains and losses on security transactions.
The capital loss carryovers (expiring in varying amounts through 2011) as of December 31, 2003, and tax basis post-October losses as of December 31, 2003, which are not recognized for tax purposes until the first day of the following fiscal year, are:
| Net Capital Loss Carryovers | Post-October Losses | |||||
Strong Blue Chip Fund | $ | 191,484,823 | $ | — | ||
Strong Discovery Fund | — | 682,734 | ||||
Strong Endeavor Fund | 1,843,685 | 1,311 | ||||
Strong Large Cap Growth Fund | 523,964,290 | 5,676,937 | ||||
Strong U.S. Emerging Growth Fund | 61,877,628 | — | ||||
Strong Enterprise Fund | 329,347,329 | 398,910 | ||||
Strong Growth 20 Fund | 386,580,002 | — | ||||
Strong Growth Fund | 911,084,232 | — | ||||
Strong Large Company Growth Fund | 7,696,647 | — | ||||
| 8. | Capital Share Transactions |
| Strong Blue Chip Fund | Strong Discovery Fund | |||||||||||||||
| Six Months Ended June 30, 2004 | Year Ended Dec. 31, 2003 | Six Months Ended June 30, 2004 | Year Ended Dec. 31, 2003 | |||||||||||||
| (Unaudited) | (Unaudited) | |||||||||||||||
Capital Share Transactions of Each of the Funds Were as Follows: | ||||||||||||||||
Proceeds from Shares Sold | $ | 8,614,606 | $ | 38,554,582 | $ | 38,251,608 | $ | 72,860,267 | ||||||||
Proceeds from Reinvestment of Distributions | — | — | — | 1,765,655 | ||||||||||||
Payment for Shares Redeemed | (39,380,407 | ) | (111,846,495 | ) | (38,373,846 | ) | (88,420,497 | ) | ||||||||
Net Increase (Decrease) in Net Assets from Capital Share Transactions | $ | (30,765,801 | ) | $ | (73,291,913 | ) | $ | (122,238 | ) | $ | (13,794,575 | ) | ||||
Transactions in Shares of Each of the Funds Were as Follows: | ||||||||||||||||
Sold | 762,352 | 4,237,712 | 1,857,501 | 4,453,708 | ||||||||||||
Issued in Reinvestment of Distributions | — | — | — | 93,470 | ||||||||||||
Redeemed | (3,510,607 | ) | (11,971,115 | ) | (1,886,469 | ) | (5,340,622 | ) | ||||||||
Net Increase (Decrease) in Shares | (2,748,255 | ) | (7,733,403 | ) | (28,968 | ) | (793,444 | ) | ||||||||
62
| Strong Endeavor Fund | Strong Large Cap Growth Fund | |||||||||||||||
| Six Months Ended June 30, 2004 | Year Ended Dec. 31, 2003 | Six Months Ended June 30, 2004 | Year Ended Dec. 31, 2003 | |||||||||||||
| (Unaudited) | (Unaudited) | |||||||||||||||
Capital Share Transactions of Each of the Funds Were as Follows: | ||||||||||||||||
Proceeds from Shares Sold | $ | 24,035,440 | $ | 2,761,167 | $ | 14,509,132 | $ | 119,300,083 | ||||||||
Proceeds from Reinvestment of Distributions | — | — | — | — | ||||||||||||
Payment for Shares Redeemed | (3,692,167 | ) | (3,208,236 | ) | (117,661,765 | ) | (215,208,135 | ) | ||||||||
Net Increase (Decrease) in Net Assets from Capital Share Transactions | $ | 20,343,273 | $ | (447,069 | ) | $ | (103,152,633 | ) | $ | (95,908,052 | ) | |||||
Transactions in Shares of Each of the Funds Were as Follows: | ||||||||||||||||
Sold | 2,484,197 | 352,819 | 683,207 | 6,748,415 | ||||||||||||
Issued in Reinvestment of Distributions | — | — | — | — | ||||||||||||
Redeemed | (385,018 | ) | (392,692 | ) | (5,559,338 | ) | (11,659,100 | ) | ||||||||
Net Increase (Decrease) in Shares of the Fund | 2,099,179 | (39,873 | ) | (4,876,131 | ) | (4,910,685 | ) | |||||||||
| Strong U.S. Emerging Growth Fund | ||||||||
| Six Months Ended June 30, 2004 | Year Ended Dec. 31, 2003 | |||||||
| (Unaudited) | ||||||||
Capital Share Transactions of the Fund Were as Follows: | ||||||||
Proceeds from Shares Sold | $ | 23,807,206 | $ | 80,614,500 | ||||
Proceeds from Reinvestment of Distributions | — | — | ||||||
Payment for Shares Redeemed | (38,602,972 | ) | (70,723,291 | ) | ||||
Net Increase (Decrease) in Net Assets from Capital Share Transactions | $ | (14,795,766 | ) | $ | 9,891,209 | |||
Transactions in Shares of the Fund Were as Follows: | ||||||||
Sold | 1,548,817 | 6,579,270 | ||||||
Issued in Reinvestment of Distributions | — | — | ||||||
Redeemed | (2,550,536 | ) | (5,686,579 | ) | ||||
Net Increase (Decrease) in Shares of the Fund | (1,001,719 | ) | 892,691 | |||||
63
NOTES TO FINANCIAL STATEMENTS (continued)
June 30, 2004 (Unaudited)
| Strong Enterprise Fund | ||||||||
| Six Months Ended June 30, 2004 | Year Ended Dec. 31, 2003 | |||||||
| (Unaudited) | (Note 1) | |||||||
Capital Share Transactions of Each Class of Shares of the Fund Were as Follows: | ||||||||
INVESTOR CLASS | ||||||||
Proceeds from Shares Sold | $ | 45,462,458 | $ | 57,913,922 | ||||
Proceeds from Reinvestment of Distributions | — | — | ||||||
Payment for Shares Redeemed | (40,911,038 | ) | (108,083,036 | ) | ||||
Net Increase (Decrease) in Net Assets from Capital Share Transactions | 4,551,420 | (50,169,114 | ) | |||||
INSTITUTIONAL CLASS | ||||||||
Proceeds from Shares Sold | 2,169,214 | 2,440,911 | ||||||
Proceeds from Reinvestment of Distributions | — | — | ||||||
Payment for Shares Redeemed | (469,348 | ) | (571,699 | ) | ||||
Net Increase (Decrease) in Net Assets from Capital Share Transactions | 1,699,866 | 1,869,212 | ||||||
ADVISOR CLASS | ||||||||
Proceeds from Shares Sold | 276,543 | 794,357 | ||||||
Proceeds from Reinvestment of Distributions | — | — | ||||||
Payment for Shares Redeemed | (305,963 | ) | (860,789 | ) | ||||
Net Increase (Decrease) in Net Assets from Capital Share Transactions | (29,420 | ) | (66,432 | ) | ||||
CLASS K | ||||||||
Proceeds from Shares Sold | 4,719,061 | 27,685,600 | ||||||
Proceeds from Reinvestment of Distributions | — | — | ||||||
Payment for Shares Redeemed | (25,868,345 | ) | (3,466,148 | ) | ||||
Net Increase (Decrease) in Net Assets from Capital Share Transactions | (21,149,284 | ) | 24,219,452 | |||||
Net Increase (Decrease) in Net Assets from Capital Share Transactions | $ | (14,927,418 | ) | $ | (24,146,882 | ) | ||
64
| Strong Enterprise Fund | ||||||
| Six Months Ended June 30, 2004 | Year Ended Dec. 31, 2003 | |||||
| (Unaudited) | (Note 1) | |||||
Transactions in Shares of Each Class of the Fund Were as Follows: | ||||||
INVESTOR CLASS | ||||||
Sold | 2,063,831 | 3,153,308 | ||||
Issued in Reinvestment of Distributions | — | — | ||||
Redeemed | (1,814,990 | ) | (5,809,732 | ) | ||
Net Increase (Decrease) in Shares | 248,841 | (2,656,424 | ) | |||
INSTITUTIONAL CLASS | ||||||
Sold | 95,826 | 124,525 | ||||
Issued in Reinvestment of Distributions | — | — | ||||
Redeemed | (20,227 | ) | (27,868 | ) | ||
Net Increase (Decrease) in Shares | 75,599 | 96,657 | ||||
ADVISOR CLASS | ||||||
Sold | 12,048 | 41,765 | ||||
Issued in Reinvestment of Distributions | — | — | ||||
Redeemed | (13,639 | ) | (42,658 | ) | ||
Net Increase (Decrease) in Shares | (1,591 | ) | (893 | ) | ||
CLASS K | ||||||
Sold | 205,342 | 1,484,422 | ||||
Issued in Reinvestment of Distributions | — | — | ||||
Redeemed | (1,118,121 | ) | (174,720 | ) | ||
Net Increase (Decrease) in Shares | (912,779 | ) | 1,309,702 | |||
65
NOTES TO FINANCIAL STATEMENTS (continued)
June 30, 2004 (Unaudited)
| Strong Growth 20 Fund | ||||||||
| Six Months Ended June 30, 2004 | Year Ended Dec. 31, 2003 | |||||||
| (Unaudited) | ||||||||
Capital Share Transactions of Each Class of Shares of the Fund Were as Follows: | ||||||||
INVESTOR CLASS | ||||||||
Proceeds from Shares Sold | $ | 10,835,009 | $ | 215,730,444 | ||||
Proceeds from Reinvestment of Distributions | — | — | ||||||
Payment for Shares Redeemed | (118,943,301 | ) | (208,651,373 | ) | ||||
Net Increase (Decrease) in Net Assets from Capital Share Transactions | (108,108,292 | ) | 7,079,071 | |||||
ADVISOR CLASS | ||||||||
Proceeds from Shares Sold | 328,416 | 1,330,952 | ||||||
Proceeds from Reinvestment of Distributions | — | — | ||||||
Payment for Shares Redeemed | (1,746,979 | ) | (3,819,394 | ) | ||||
Net Increase (Decrease) in Net Assets from Capital Share Transactions | (1,418,563 | ) | (2,488,442 | ) | ||||
Net Increase (Decrease) in Net Assets from Capital Share Transactions | $ | (109,526,855 | ) | $ | 4,590,629 | |||
Transactions in Shares of Each Class of the Fund Were as Follows: | ||||||||
INVESTOR CLASS | ||||||||
Sold | 822,774 | 20,382,621 | ||||||
Issued in Reinvestment of Distributions | — | — | ||||||
Redeemed | (9,101,501 | ) | (18,867,469 | ) | ||||
Net Increase (Decrease) in Shares | (8,278,727 | ) | 1,515,152 | |||||
ADVISOR CLASS | ||||||||
Sold | 24,919 | 116,482 | ||||||
Issued in Reinvestment of Distributions | — | — | ||||||
Redeemed | (133,541 | ) | (323,340 | ) | ||||
Net Increase (Decrease) in Shares | (108,622 | ) | (206,858 | ) | ||||
66
| Strong Growth Fund | ||||||||
| Six Months Ended June 30, 2004 | Year Ended Dec. 31, 2003 | |||||||
| (Unaudited) | ||||||||
Capital Share Transactions of Each Class of Shares of the Fund Were as Follows: | ||||||||
INVESTOR CLASS | ||||||||
Proceeds from Shares Sold | $ | 56,742,109 | $ | 195,543,770 | ||||
Proceeds from Reinvestment of Distributions | — | — | ||||||
Payment for Shares Redeemed | (236,525,549 | ) | (449,810,001 | ) | ||||
Net Increase (Decrease) in Net Assets from Capital Share Transactions | (179,783,440 | ) | (254,266,231 | ) | ||||
INSTITUTIONAL CLASS | ||||||||
Proceeds from Shares Sold | 22,091,129 | 97,951,922 | ||||||
Proceeds from Reinvestment of Distributions | — | — | ||||||
Payment for Shares Redeemed | (53,111,151 | ) | (53,916,690 | ) | ||||
Net Increase (Decrease) in Net Assets from Capital Share Transactions | (31,020,022 | ) | 44,035,232 | |||||
ADVISOR CLASS | ||||||||
Proceeds from Shares Sold | 733,051 | 4,568,184 | ||||||
Proceeds from Reinvestment of Distributions | — | — | ||||||
Payment for Shares Redeemed | (2,759,747 | ) | (7,899,492 | ) | ||||
Net Increase (Decrease) in Net Assets from Capital Share Transactions | (2,026,696 | ) | (3,331,308 | ) | ||||
CLASS C | ||||||||
Proceeds from Shares Sold | 450 | 385,777 | ||||||
Proceeds from Reinvestment of Distributions | — | — | ||||||
Payment for Shares Redeemed | (108,600 | ) | (48,846 | ) | ||||
Net Increase (Decrease) in Net Assets from Capital Share Transactions | (108,150 | ) | 336,931 | |||||
CLASS K | ||||||||
Proceeds from Shares Sold | 19,376,390 | 51,582,602 | ||||||
Proceeds from Reinvestment of Distributions | — | — | ||||||
Payment for Shares Redeemed | (14,481,619 | ) | (19,995,565 | ) | ||||
Net Increase (Decrease) in Net Assets from Capital Share Transactions | 4,894,771 | 31,587,037 | ||||||
Net Increase (Decrease) in Net Assets from Capital Share Transactions | $ | (208,043,537 | ) | $ | (181,638,339 | ) | ||
67
NOTES TO FINANCIAL STATEMENTS (continued)
June 30, 2004 (Unaudited)
| Strong Growth Fund | ||||||
| Six Months Ended June 30, 2004 | Year Ended Dec. 31, 2003 | |||||
| (Unaudited) | ||||||
Transactions in Shares of Each Class of the Fund Were as Follows: | ||||||
INVESTOR CLASS | ||||||
Sold | 3,212,000 | 13,337,882 | ||||
Issued in Reinvestment of Distributions | — | — | ||||
Redeemed | (13,402,364 | ) | (28,947,288 | ) | ||
Net Increase (Decrease) in Shares | (10,190,364 | ) | (15,609,406 | ) | ||
INSTITUTIONAL CLASS | ||||||
Sold | 1,216,818 | 6,457,458 | ||||
Issued in Reinvestment of Distributions | — | — | ||||
Redeemed | (2,902,941 | ) | (3,285,692 | ) | ||
Net Increase (Decrease) in Shares | (1,686,123 | ) | 3,171,766 | |||
ADVISOR CLASS | ||||||
Sold | 41,717 | 304,356 | ||||
Issue | — | — | ||||
Redeemed | (156,144 | ) | (503,466 | ) | ||
Net Increase (Decrease) in Shares | (114,427 | ) | (199,110 | ) | ||
CLASS C | ||||||
Sold | 26 | 25,570 | ||||
Issue | — | — | ||||
Redeemed | (6,270 | ) | (2,959 | ) | ||
Net Increase (Decrease) in Shares | (6,244 | ) | 22,611 | |||
CLASS K | ||||||
Sold | 1,085,486 | 3,430,845 | ||||
Issue | — | — | ||||
Redeemed | (804,689 | ) | (1,204,449 | ) | ||
Net Increase (Decrease) in Shares | 280,797 | 2,226,396 | ||||
68
Strong Large Company Growth Fund | ||||||||
| Six Months Ended June 30, 2004 | Year Ended Dec. 31, 2003 | |||||||
| (Unaudited) | (Note 1) | |||||||
Capital Share Transactions of Each Class of Shares of the Fund Were as Follows: | ||||||||
INVESTOR CLASS | ||||||||
Proceeds from Shares Sold | $ | 25,746,097 | $ | 71,224,694 | ||||
Proceeds from Reinvestment of Distributions | — | 12,085 | ||||||
Proceeds from Redemption Fees | 34,733 | 30,740 | ||||||
Payment for Shares Redeemed | (31,943,658 | ) | (31,528,112 | ) | ||||
Net Increase (Decrease) in Net Assets from Capital Share Transactions | (6,162,828 | ) | 39,739,407 | |||||
CLASS K | ||||||||
Proceeds from Shares Sold | 3,111,092 | 1,000,551 | ||||||
Proceeds from Reinvestment of Distributions | — | — | ||||||
Proceeds from Redemption Fees | 847 | 626 | ||||||
Payment for Shares Redeemed | (229,016 | ) | (28,718 | ) | ||||
Net Increase (Decrease) in Net Assets from Capital Share Transactions | 2,882,923 | 972,459 | ||||||
Net Increase (Decrease) in Net Assets from Capital Share Transactions | $ | (3,279,905 | ) | $ | 40,711,866 | |||
Transactions in Shares of Each Class of the Fund Were as Follows: | ||||||||
INVESTOR CLASS | ||||||||
Sold | 1,865,814 | 5,804,010 | ||||||
Issued in Reinvestment of Distributions | — | 1,118 | ||||||
Redeemed | (2,307,476 | ) | (2,514,076 | ) | ||||
Net Increase (Decrease) in Shares of the Fund | (441,662 | ) | 3,291,052 | |||||
CLASS K | ||||||||
Sold | 220,452 | 78,792 | ||||||
Issued in Reinvestment of Distributions | — | — | ||||||
Redeemed | (16,621 | ) | (2,190 | ) | ||||
Net Increase (Decrease) in Shares of the Fund | 203,831 | 76,602 | ||||||
| 9. | Legal and Regulatory Matters |
On or about May 20, 2004, the Advisor, the Administrator, and the Distributor (collectively, “Strong”), former chairman Richard S. Strong, and two employees of Strong entered into agreements with the Securities and Exchange Commission (“SEC”), the New York Attorney General (“NYAG”), the State of Wisconsin Department of Justice (the Wisconsin Attorney General), and the Wisconsin Department of Financial Institutions representing a settlement of all the market-timing investigations of Strong and certain affiliates by these agencies. In the settlements, Strong, without admitting or denying the findings in any of the orders, consented to entries of cease and desist orders and injunctive relief relating to breaches of their fiduciary duties and violations of state and federal securities laws, including anti-fraud provisions. The settlements require the Advisor to pay $40 million in investor restoration and $40 million in civil penalties. The settlements require Mr. Strong to pay $30 million in investor restoration and $30 million in civil penalties. The NYAG settlement also requires Strong to reduce fees for all Funds (except money market funds and certain very short-term income funds) by an aggregate of at least $7 million a year for five years. Separately, the Board of Directors of the Strong Funds and the Advisor have agreed that the Advisor may
69
NOTES TO FINANCIAL STATEMENTS (continued)
June 30, 2004 (Unaudited)
allocate such fee and/or expense reductions in a manner it deems reasonable, provided that (i) each applicable Fund shall participate in such fee reduction, (ii) each Fund that was impacted by market timing related to the settlements shall receive a fee reduction of at least 0.025% each year, (iii) such fee reduction shall be taken after giving effect to all waivers and reimbursements currently in effect, and (iv) fees and expenses shall not subsequently be increased without prior Board approval. Additionally, the settlements require, among other things: 1) retention of an independent consultant to develop a payment plan for the amount of investor restoration; 2) the services of an independent compliance consultant to conduct a periodic review of Strong’s compliance policies and procedures; and 3) enhanced corporate governance policies for the Strong Funds. The NYAG settlement also requires: 1) the retention of a senior officer to assist the Board in monitoring compliance and reviewing fee arrangements; and 2) additional fee disclosure to investors in the Funds. Strong and Mr. Strong, and not the investors in any Strong Fund, will bear all the costs of complying with the settlements, including restoration, civil penalties, and associated legal fees stemming from these regulatory proceedings. Strong has not yet determined if the investor restoration or civil penalties will create any financial benefit to the Strong Funds.
Strong has received one or more subpoenas or requests for information from the West Virginia Attorney General and other regulatory agencies requesting documents, if any, related to market timing and late trading practices. Strong is aware of multiple outstanding class and derivative actions (“Actions”) filed since September 4, 2003, against Strong, Strong Funds, Strong Financial Corporation, Strong Investments, Inc., Strong affiliates, and certain of their officers and directors as defendants in certain federal and state courts with respect to factual matters referenced in the NYAG settlement.
On February 20, 2004 and June 15, 2004, the United States Judicial Panel for Multi District Litigation (“MDL”) ordered the transfer of all but one of the Actions to the District of Maryland so those cases involving Strong could be coordinated and consolidated into one or two actions covered by a single complaint (“MDL Consolidated Actions”). A single Wisconsin state court Action involving Strong was not removed to the District of Maryland court. The District of Maryland court has since appointed co-chairs/chief administrative counsel for the plaintiffs in the actions involving all of the fund families before it. It has also appointed a lead plaintiff and lead plaintiff’s counsel for the actions involving each individual fund family, including Strong. The Actions generally allege, among other things, that the defendants violated their fiduciary duty to fund shareholders and certain retirement plan participants, and made false and misleading statements in the funds’ prospectuses in violation of federal and state securities laws. The Actions generally seek one or more of the following: compensatory damages, punitive damages, special damages, exemplary damages, rescission, restitution, payment of plaintiffs’ attorneys’ fees and experts’ fees, and/or replacement of the Board of Directors of the Strong Funds. Strong expects that the MDL Consolidated Actions will allege the same types of violations of law and seek the same forms of damages and remedies as did the numerous prior Actions. Certain state Actions will not be consolidated into the MDL Consolidated Actions and proceedings in these state court Actions may be stayed or proceed independently of the MDL Consolidated Actions.
The Strong Funds will not bear any costs incurred in connection with these Actions. Based on currently available information, Strong believes that the Actions will not have a material adverse financial impact on the Strong Funds, and are not likely to materially affect Strong’s ability to provide investment management services to its clients, including the Strong Funds. The Funds may experience increased redemptions or a decrease in new sales of shares as a result of the regulatory settlements and the ongoing Actions, which could result in increased transaction costs and operating expenses, or otherwise negatively impact the Strong Funds.
| 10. | Pending Acquisition |
On May 26, 2004, Strong Financial Corporation (“SFC”) announced that it reached a definitive agreement with Wells Fargo & Company (“Wells Fargo”) to acquire assets of SFC and certain of its affiliates, including the Advisor. As part of the proposed transaction, SFC will be seeking approval from the Board of Directors of the Strong Funds (“Board”) on various matters including appointing Wells Fargo Funds Management, LLC, a wholly owned subsidiary of Wells Fargo, as a new investment advisor for the Strong Funds and a merger of those funds into the Wells Fargo Funds family of mutual funds.
The mergers, which are anticipated to close in the first quarter of 2005, are subject to a number of conditions, including approval by the Board and shareholders of the Strong Funds.
70
Each officer and director holds the same position with the 27 registered open-end management investment companies consisting of 71 mutual funds (“Strong Funds”).
Willie D. Davis (DOB 7-24-34), Director of the Strong Funds since July 1994.
Mr. Davis has been President and Chief Executive Officer of All Pro Broadcasting, Inc., since 1977; Director of Wisconsin Energy Corporation (formerly WICOR, Inc., a utility company) since 1990, Metro-Goldwyn-Mayer, Inc. (an entertainment company) since 1998, Bassett Furniture Industries, Inc. since 1997, Checker’s Drive-In Restaurants, Inc. (formerly Rally’s Hamburgers, Inc.) since 1994, Johnson Controls, Inc. (an automotive systems and facility management company) since 1992, MGM Mirage (formerly MGM Grand, Inc., an entertainment/hotel company) since 1990, Dow Chemical Company since 1988, Sara Lee Corporation (a food/consumer products company) since 1983, Alliance Bank since 1980, Manpower, Inc. (a worldwide provider of staffing services) since 2001, and Kmart Corporation (a discount consumer products company) from 1985 to 2003; and Trustee of the University of Chicago since 1980 and Marquette University since 1988.
Gordon B. Greer (DOB 2-17-32), Director of the Strong Funds since March 2002.
Mr. Greer was Of Counsel for Bingham McCutchen LLP (a law firm previously known as Bingham Dana LLP) from 1997 to February 2002 and Partner of Bingham McCutchen LLP from 1967 to 1997. On behalf of Bingham McCutchen LLP, Mr. Greer provided representation to the disinterested directors of the Strong Funds from 1991 to February 2002. Bingham McCutchen LLP has provided representation to the Independent Directors of the Strong Funds since 1991.
Stanley Kritzik (DOB 1-9-30), Director of the Strong Funds since January 1995 and Chairman of the Audit Committee of the Strong Funds since July 2000.
Mr. Kritzik has been Partner of Metropolitan Associates (a real estate firm) since 1962; Director of Wisconsin Health Information Network since November 1997, Health Network Ventures, Inc. from 1992 to April 2000, and Aurora Health Care from September 1987 to September 2002; and Member of the Board of Governors of Snowmass Village Resort Association from October 1999 to October 2002.
Neal Malicky (DOB 9-14-34), Director of the Strong Funds since December 1999.
Mr. Malicky has been President Emeritus of Baldwin-Wallace College since July 2000; Chancellor of Baldwin-Wallace College from July 1999 to June 2000; President of Baldwin-Wallace College from July 1981 to June 1999; Director of Aspire Learning Corporation since June 2000; Trustee of Southwest Community Health Systems, Cleveland Scholarship Program, and The National Conference for Community and Justice until 2001; President of the National Association of Schools and Colleges of the United Methodist Church, Chairperson of the Association of Independent Colleges and Universities of Ohio, and Secretary of the National Association of Independent Colleges and Universities until 2001.
William F. Vogt (DOB 7-19-47), Director and Chairman of the Independent Directors Committee of the Strong Funds since January 1995.
Mr. Vogt has been Senior Vice President of IDX Systems Corporation (a management consulting firm) since June 2001; President of Vogt Management Consulting, Inc. from July 1990 to June 2001; and former Fellow of the American College of Medical Practice Executives.
71
DIRECTORS AND OFFICERS (continued)
Ane K. Ohm (DOB 10-16-69), Anti-Money Laundering Compliance Officer of the Strong Funds since November 2002.
Ms. Ohm has been Anti-Money Laundering Compliance Officer of Strong Financial Corporation since February 2003; Assistant Executive Vice President of Strong Financial Corporation since November 2003; Assistant Executive Vice President of Strong Capital Management, Inc. (the “Advisor”) since December 2001; Director of Mutual Fund Administration of Strong Investor Services, Inc. since April 2001; Vice President of Strong Investor Services, Inc. since December 2001; and Marketing Services Manager of Strong Investments, Inc. (the “Distributor”) from November 1998 to April 2001.
Phillip O. Peterson (DOB 12-5-44), Independent President of the Strong Funds since January 2004.
Mr. Peterson was a mutual fund industry consultant from August 1999 to December 2003; Partner of KPMG LLP from 1981 to July 1999; Director of The Hartford Group of Mutual Funds (71 funds) since 2002; and Director of the Fortis Mutual Fund Group (38 funds) from 2000 to 2002.
Richard W. Smirl (DOB 4-18-67), Vice President of the Strong Funds since February 2002 and Secretary of the Strong Funds since November 2001.
Mr. Smirl has been Senior Counsel of Strong Financial Corporation since December 2001; Assistant Secretary of Strong Financial Corporation from December 2001 to February 2003; Secretary of Strong Financial Corporation since February 2003; Assistant Executive Vice President of the Advisor since December 2001; Chief Legal Officer of the Advisor since February 2003; Secretary of the Advisor since November 2002; Assistant Secretary of the Advisor from December 2001 to November 2002; Senior Counsel of the Advisor from July 2000 to December 2001; General Counsel of the Distributor since November 2001; Secretary of the Distributor since July 2000; Vice President and Chief Compliance Officer of the Distributor from July 2000 to December 2003; Lead Counsel of the Distributor from July 2000 to November 2001; Vice President of Strong Investor Services, Inc. since December 2001; Assistant Secretary of Strong Investor Services, Inc. from December 2001 to May 2003; Secretary of Strong Investor Services, Inc. since May 2003; Partner at Keesal, Young & Logan LLP (a law firm) from September 1999 to July 2000; and Associate at Keesal, Young & Logan LLP from September 1992 to September 1999.
Gilbert L. Southwell III (DOB 4-13-54), Assistant Secretary of the Strong Funds since July 2001.
Mr. Southwell has been Associate Counsel of Strong Financial Corporation since December 2001; Assistant Secretary of the Advisor since December 2002; Associate Counsel of the Advisor from April 2001 to December 2001; Partner at Michael, Best & Friedrich, LLP (a law firm) from October 1999 to March 2001; and Assistant General Counsel of U.S. Bank, National Association (formerly Firstar Bank, N.A.) and/or certain of its subsidiaries from November 1984 to September 1999.
John W. Widmer (DOB 1-19-65), Treasurer of the Strong Funds since April 1999.
Mr. Widmer has been Treasurer of the Advisor since April 1999; Assistant Treasurer of Strong Financial Corporation since December 2001; Assistant Secretary of Strong Financial Corporation from December 2001 to January 2003; Treasurer of Strong Service Corporation since April 1999; Treasurer and Assistant Secretary of Strong Investor Services, Inc. since July 2001; and Manager of the Financial Management and Sales Reporting Systems department of the Advisor from May 1997 to April 1999.
Thomas M. Zoeller (DOB 2-21-64), Vice President of the Strong Funds since October 1999.
Mr. Zoeller has been Executive Vice President of the Advisor since April 2001; Chief Financial Officer of the Advisor since February 1998; Secretary of the Advisor from December 2001 to November 2002; Member of the Office of the Chief Executive of Strong Financial Corporation since May 2001; Chief Financial Officer and Treasurer of Strong Investments, Inc. since October 1993; Executive Vice President of Strong Investor Services, Inc. since July 2001; Secretary of Strong Investor Services, Inc. from July 2001 to May 2003; Executive Vice President, Chief Financial Officer, and Secretary of Strong Service Corporation since December 2001; Treasurer of Strong Service Corporation from September 1996 to April 1999; Vice President of Strong Service Corporation from April 1999 to December 2001; Member of the Office of the Chief Executive of the Advisor from November 1998 until May 2001; and Senior Vice President of the Advisor from February 1998 to April 2001.
Except for Messrs. Davis, Kritzik, Malicky, and Vogt, the address of all of the Directors and Officers is P.O. Box 2936, Milwaukee, WI 53201. Mr. Davis’s address is 161 North La Brea, Inglewood, CA 90301. Mr. Kritzik’s address is 1123 North Astor Street, Milwaukee, WI 53202. Mr. Malicky’s address is 4608 Turnberry Drive, Lawrence, KS 66047. Mr. Vogt’s address is P.O. Box 7657, Avon, CO 81620.
The statement of additional information contains additional information about fund directors and officers and is available without charge, upon request, by calling 1-800-368-3863.
72
NOTES
73
NOTES
74
Directors
Willie D. Davis
Gordon B. Greer
Stanley Kritzik
Neal Malicky
William F. Vogt
Officers
Phillip O. Peterson, Independent President
Thomas M. Zoeller, Vice President
Richard W. Smirl, Vice President and Secretary
Gilbert L. Southwell III, Assistant Secretary
John W. Widmer, Treasurer
Ane K. Ohm, Anti-Money Laundering Compliance Officer
Investment Advisor
Strong Capital Management, Inc.
P.O. Box 2936, Milwaukee,Wisconsin 53201
Distributor
Strong Investments, Inc.
P.O. Box 2936, Milwaukee,Wisconsin 53201
Custodian
State Street Bank and Trust Company
801 Pennsylvania Avenue, Kansas City, Missouri 64105
Transfer Agent and Dividend-Disbursing Agent
Strong Investor Services, Inc.
P.O. Box 2936, Milwaukee,Wisconsin 53201
Independent Accountants
PricewaterhouseCoopers LLP
100 East Wisconsin Avenue, Milwaukee,Wisconsin 53202
Legal Counsel
Godfrey & Kahn, S.C.
780 North Water Street, Milwaukee,Wisconsin 53202
Strong Investments
P.O. Box 2936 | Milwaukee, WI 53201
To learn more about our funds, discuss an existing
account, or conduct a transaction, call 1-800-368-3863
or visit www.Strong.com.
Please carefully consider a fund’s investment objectives,
risks, charges, and expenses before investing. For this
and other information, call us or visit our web site for
a free prospectus. Please read it carefully before you
invest or send money.
To receive a free copy of the policies and procedures
the funds use to determine how to vote proxies relating
to portfolio securities, or to receive a free copy of a fund’s
proxy voting record for the most recent 12-month period
ending on June 30, call 1-800-368-3863, or visit the
Securities and Exchange Commission’s web site
at www.sec.gov.
If you are a Financial Professional, call 1-800-368-1683.
This report does not constitute an offer for the sale of securities. Strong Funds are offered for sale by prospectus only. Securities are offered through Strong Investments, Inc. RT45366 08-04
SGRO/WH2150 06-04
Item 1. Reports to Shareholders
Semiannual Report | June 30, 2004
Strong
Core
Funds

| Strong Balanced Fund | ||
| Strong Large Cap Core Fund | ||
| Strong Growth and Income Fund | ||
| Strong Opportunity Fund | ||

Semiannual Report | June 30, 2004
Core
Funds
Table of Contents
Investment Reviews | ||
| 2 | ||
| 4 | ||
| 6 | ||
| 8 | ||
Financial Information | ||
Schedules of Investments in Securities | ||
| 10 | ||
| 14 | ||
| 15 | ||
| 17 | ||
| 20 | ||
| 23 | ||
| 26 | ||
| 28 | ||
| 33 | ||
| 45 | ||
Market Update From Dick Weiss January 1, 2004, to June 30, 2004 |

Uncertainty is the Enemy
In our last report back in January, the overall U.S. economy displayed definite signs of strengthening — job growth was gaining momentum, and consumer confidence was on the rise. There was some muffled muttering about deflation, but it lacked enough conviction to cause alarm. All in all, it looked like a relatively promising picture.
Six months out, things seem not quite so sanguine. Fears of inflation have replaced the whispers of deflation, and the Federal Reserve has begun what doubtless will be a series of rate hikes well into 2005. While the overall economy has exceeded expectations, the good news on that front has not been sufficient to overshadow a host of uncertainties in the military and political worlds.
Before we address those uncertainties, let’s devote a moment to the topic of inflation. In the history of markets, there seems to be a point at which a rising rate of inflation causes the market’s price-to-earnings ratios to contract. Historically, that point would be around seven percent. While it seems highly unlikely that the inflation rate is going to get anywhere near that mark in the foreseeable future, there is some suggestion that nowadays, because of the way the Consumer Price Index is calculated, that number could be closer to five percent. If that is indeed a more realistic calculation, it’s possible that we could hit five percent inflation and a negative impact on stock valuations.
In my estimation though, the prospect for serious inflation pales in comparison to other uncertainties currently plaguing the market (e.g., the outcome of the U.S. presidential race this fall and the continuing political fallout surrounding Iraq).
With regard to the War on Terrorism and the issue of Iraq, investors are faced every day with news that can give them pause. While the war seems to be on track, the outcome in Iraq is dependent on how rapidly that nation can defeat the insurgents and restore the rule of law now that the Iraqis themselves have taken charge. We believe that expectations may be too low in that regard.
On the political front, the market seemed to peak around the moment when Democratic candidate Senator John Kerry pulled even with President George W. Bush in the polls. Nothing makes the prospects for economic prosperity harder to decipher than a presidential race featuring two candidates with widely differing views on virtually every issue domestically and internationally. For the stock market, that spells uncertainty with a capital U.
We believe stock valuations today are neither cheap, nor particularly overvalued based upon earnings projections for 2005. They are, rather, sort of stuck somewhere in the middle. In order for stocks to start moving in a positive direction, the market needs an injection of confidence. So the relevant question becomes, in short: What needs to happen in order to inspire that sense of confidence?
The answer? In a word — clarity.
On the inflation front, we anticipate clarity will not come for some time. We expect the Federal Reserve will continue to raise rates until it gets ahead of the inflation curve. It’s unclear just how many hikes and of what magnitude will accomplish that. Nonetheless, if inflationary fears were the single biggest element of uncertainty out there today, we would feel confident that the problem could be contained.
The fate of Iraq and the outcome of the presidential election loom larger and seem far more complicated. If the public perceives that progress is being made in Iraq and democracy will indeed triumph, the market will likely anticipate the reelection of President Bush. If the daily diagnosis on Iraq is less favorable, the political uncertainty weighing on the market will continue for the next several months.
Notwithstanding all the ambiguity, we are beginning to see corners of the market where good values are emerging. Energy has been one of the more promising areas and should continue to benefit from strong fundamentals. Even in the areas of the technology sector, where we believe stocks have been chronically overvalued, values have begun to return to earth. There are even some computer software companies that look attractive to us.
In order for stocks to start moving in a positive direction, the market needs an injection of confidence.
In stock-picker parlance, what we have today is a market of individual stocks rather than — as we saw in 2003 — a rising stock market. In the former, money is a lot harder to make; in the latter, the rising tide seems to lift all issues almost indiscriminately.
We believe the market should continue this year’s trend, which is a much more value- and fundamentals-oriented market. Make no mistake: this is not a “story” market where people dream about distant possibilities and, on the strength of those illusions, stocks soar to 100 times earnings. This is a market where, if you do your homework and stick to what is real rather than imagined, we think you can discover common stocks worth owning.
Given all the uncertainty that exists in the world, there are practical limits to just how high the market can go. But with an economy that continues to show strength and interest rates still on the low side, there are also practical limits to how low the market can go. That environment should favor professional investors who exhibit good discipline in both their buy and sell decisions.
One final piece of practical advice: when uncertainty is the order of the day, resist doing anything dramatic with your money. Sometimes the “muddle-through” approach proves best.
. . .if you do your homework and stick to what is real rather than imagined, we think you can uncover common stocks worth owning.

Richard T.Weiss
Vice Chairman
Strong Financial Corporation
The Strong Balanced Fund underperformed its broad-based benchmark during the first half of 2004. For the six months ended June 30, 2004, the Fund returned 1.49% compared with a return of 3.44% for the S&P 500 Index. A balanced benchmark, the 60/40 Balanced Fund Index (which blends a 60% weighting in the S&P 500 Index with a 40% weighting in the Lehman Brothers Intermediate U.S. Government/Credit Bond Index), returned 2.03% for the same period.
In its equity position, the Fund focuses on the largest-capitalization stocks in the market, which hurt performance as the smaller stocks within the index outperformed their larger counterparts. The Fund’s fixed-income allocation hurt its returns relative to the S&P 500 Index, as returns in the fixed-income market generally trailed those of the index.
Many factors drove performance
Performance was mixed during the period. The Fund was stronger in the second quarter than in the first, primarily because larger, higher-quality stocks that are this Fund’s focus performed better at that time.
Throughout the period, there were many signs of continued economic and corporate profit growth. We, therefore, positioned the Fund with a cyclical orientation; that is, we emphasized sectors and companies that could benefit most from this macroeconomic tailwind. With this approach, we had larger weightings in capital goods, technology, and advertising-related companies.
Our capital goods stocks made a positive contribution to the Fund’s performance. While there were some signs of increased corporate spending on technology, this trend was not as pronounced as many had hoped. In spite of what was a difficult period for the tech area, our stock picking contributed positively to our returns. Stocks like Broadcom Corporation, a semiconductor company involved in many of the new high growth areas of broadband and wireless communication, had a positive return for the period. Within the advertising arena, stock performance was mixed; while some companies were able to capitalize on the economic strength that bolstered ad spending and even gain additional market share, others, such as media giant Viacom, simply were not able to keep up with changing industry dynamics.
We positioned the fixed-income portion of the portfolio with a slightly shorter duration than its benchmark for much of the period. This means that the Fund’s fixed-income position was somewhat less vulnerable to the negative impact of rising interest rates. As interest rates rose in anticipation of further economic growth and action from the Federal Reserve, this part of the Fund was able to be somewhat resilient; the positioning had a modestly positive impact on the Fund’s performance relative to the balanced benchmark.
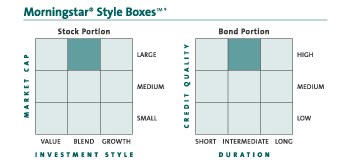
Our approach to equities
Beyond positioning the Fund in sectors that we believed would benefit from the stronger economy, we also employed screening techniques that focused on earnings growth and valuation. We used these techniques to identify companies that had solid potential, but were not yet fully exploiting it. This process, which is part of our ongoing investment strategy, includes an analysis of a company’s end market, its competitive environment, and its ability to meet or exceed stated financial goals.
One of the companies that made it through this evaluation was Internet-based leader Yahoo!. Yahoo! was a major beneficiary of the increased use of high-speed data access, as well as the popularity of its on-line search and marketing services. Traditional advertisers have begun to take note of the Internet’s ability to deliver potential customers from the right demographic groups to providers of appropriate products and services. Yahoo!’s share of the corporate advertising budget is still currently in the low single digits; as advertisers seek out distinctive advertising channels, we believe that share should continue to grow.
A moderately positive outlook
At this point, our outlook is one of cautious optimism. While this Fund’s focus on high-quality, large-capitalization stocks put it at a disadvantage during the period, we do not intend to move away from this approach. The economy continues to grow, as do corporate profits. The presidential election, interest-rate hikes from the Federal Reserve, and turmoil in the Middle East could all hurt equity performance in the coming months.
The fixed-income portion of the portfolio could come under continued pressure if the Fed raises short-term interest rates further, as many anticipate they may. The Fed’s stated willingness to move at a measured pace suggests that drastic hikes are not on the horizon, however.
It is impossible to ignore that the economy has continued to expand and drive corporate earnings growth. So while the environment may not be as positive as it was at this point last year, we are confident the opportunity for attractive returns remains.
Thank you for your investment in the Strong Balanced Fund.
Rimas Milaitis | Bradley D. Doyle | |
Portfolio Co-Manager | Portfolio Co-Manager |
2
Fund Highlights
Average Annual Total Returns
As of 6-30-04
Investor Class | |||
1-year | 10.19 | % | |
5-year | –1.43 | % | |
10-year | 6.95 | % | |
Since Fund Inception (12-30-81) | 10.71 | % |
Performance is historical and does not guarantee future results. Investment returns and principal value will fluctuate, and you may have a gain or loss when you sell shares. Current performance may be lower or higher than the quoted performance. Call us or visit www.Strong.com for the most recent month-end performance.
Risks: Stock funds should only be considered for long-term goals as values fluctuate in response to the activities of individual companies and general market and economic conditions.
Bond fund values fluctuate in response to the financial condition of individual issuers, changes in interest rates, and general market and economic conditions.
The Fund invests a portion of its assets in lower-quality securities that present a significant risk for loss of principal and interest. Please consider this before investing.
Growth of an Assumed $10,000 Investment†
from 12-30-81 to 6-30-04
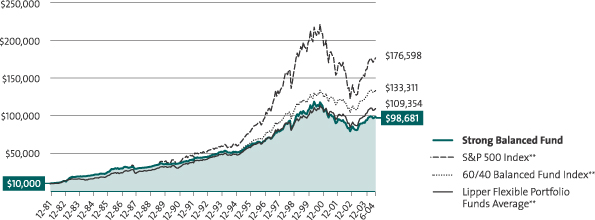
| Mention of specific securities in this report is not indicative of whether the Fund may make additional purchases of, sell all or a portion of, or continue to hold those securities. |
| * | The Morningstar Style Box™ reveals a fund’s investment strategy. For equity funds, the vertical axis shows the market capitalization of the stocks owned and the horizontal axis shows investment style (value, blend, or growth). For fixed-income funds, the vertical axis shows the average credit quality of the bonds owned, and the horizontal axis shows interest rate sensitivity as measured by a bond’s duration (short, intermediate, or long). |
| † | This graph, provided in accordance with SEC regulations, compares a $10,000 investment in the Fund, made at its inception, with the performance of the S&P 500 Index (“S&P 500”), the 60/40 Balanced Fund Index, and the Lipper Flexible Portfolio Funds Average. Results include the reinvestment of all dividends and capital gains distributions. The graph and the Average Annual Total Returns table do not reflect the deduction of taxes, if any, that a shareholder would pay on Fund distributions or the redemption of Fund shares. |
Fee Waivers: From time to time, the Fund’s advisor and/or administrator has waived fees and/or absorbed Fund expenses, which has resulted in higher returns. As of 6-30-04, there are waivers and/or absorptions in effect.
Percentage Restrictions: The Fund’s prospectus and statement of additional information may describe restrictions on the percentage of a particular type or quality of security in which the Fund may invest (“Percentage Restrictions”). Percentage Restrictions apply at the time the Fund purchases a security. Circumstances subsequent to the purchase of the security, such as a change in: (1) the Fund’s assets (e.g., due to cash inflows and redemptions); (2) the market value of the security; or (3) the pricing, liquidity, or rating of the security, may cause the Fund to exceed or fall short of the Percentage Restriction. If this happens, the Fund’s continued holding of the security will not constitute a violation of the Percentage Restriction.
Definitions: **The S&P 500 Index consists of 500 stocks chosen for market size, liquidity, and industry group representation. It is a market value weighted index (stock price times number of shares outstanding), with each stock’s weight in the Index proportionate to its market value. The 60/40 Balanced Fund Index is comprised of 60% S&P 500 Index and 40% Lehman Brothers Intermediate U.S. Government/Credit Bond Index. The Lipper Flexible Portfolio Funds Average is the average of all funds in the Lipper Flexible Portfolio Funds Category. These funds allocate their investments across various asset classes, including domestic common stocks, bonds, and money market instruments with a focus on total return. Source of the S&P Index and 60/40 Balanced Fund Index data is Standard & Poor’s Micropal. Source of the Lipper Index data is Lipper. It is not possible to invest directly in an index.
3
Equity markets posted moderate returns in the first half of 2004, after their strong performance in 2003. In a climate of continued economic growth, the Strong Large Cap Core Fund posted a return of 2.60% for the six months ended June 30, 2004. This placed it behind its broad-based benchmark, the S&P 500 Index, which returned 3.44% for the same period.
Moderate returns prevailed
It is not unusual for stocks to take a breather following the type of large gains they saw in 2003. But that has not been the only factor that has kept equity returns moderate in the first half of this year. Questions about the resolution of the situation in Iraq, rising market interest rates and impending short-term rate hikes from the Federal Reserve, high energy prices, and the Chinese government’s actions to slow the growth of that far-reaching economy all weighed on the U.S. markets.
April was a particularly challenging month for the markets and the Fund. A sharp improvement in employment data sparked fears that the economic recovery would spark a new round of inflation and lead to substantially higher interest rates. At that point, it was not clear when, and by how much, the Federal Reserve might raise rates, which exacerbated our concerns. Because this Fund has significant positions in financial stocks — the largest sector in the S&P 500 — it was particularly susceptible to interest-rate concerns. Investors’ fears were overblown, we believe, driven more by emotion than by any truly serious problems in the economy.
Investor sentiment began to improve somewhat near the end of May, as the market once again focused its attention on the good news regarding strong corporate profits and new job creation. Equities in the portfolio that had been hurt by investors’ concerns in April had largely stabilized and recovered by the end of the period. When the Fed acted to raise short-term rates by a quarter percentage point at the end of June, the modest move was widely anticipated.
Factors in our performance
The Fund’s positions in energy stocks contributed positively to our performance for the period. Our emphasis in this sector was on the large integrated oil companies, which benefited from higher demand for oil, strong margins on refining operations, and low debt levels that helped to mute the impact of rising interest rates.
In our assessment, energy companies remain reasonably priced. Many projections of their earnings — and thus estimates of appropriate valuations — are based on an assumption that oil prices may decline significantly in coming months; we are not convinced that prices will in fact drop soon. Should they stay at more elevated levels, these companies’ earnings could rise further. We are confident that even at these higher levels, oil prices are not so high as to put a severe crimp in economic growth. Energy consumption per unit of Gross Domestic Product (GDP) is dramatically lower than it was in the 1970s, indicating a level of efficiency that allows the economy to absorb higher prices.
As its name suggests, this Fund focuses on large-capitalization stocks; its median market capitalization typically exceeds that of the S&P 500. That orientation hurt performance in the period, as smaller companies generally outperformed larger-cap stocks.
Looking ahead
We anticipate that economic growth will continue at a healthy, sustainable pace in the coming months, helping to foster more positive investor sentiment as well. Corporate earnings have been strong, and we believe there is every reason they will continue to be so. Including the fourth quarter of 2003, the S&P 500 companies have experienced two consecutive quarters of year-over-year earnings growth well in excess of 20%, with another similar gain expected for the second quarter of 2004.
Although equity markets have been moving in a narrow trading range for most of the year to date, we anticipate that this may change in the second half. Among the factors that could help to bump stocks higher are positive news regarding corporate earnings, job creation, and economic activity.
Thank you for your investment in the Strong Large Cap Core Fund.
| Karen E. McGrath | ||
| Portfolio Manager |
4
Fund Highlights
Average Annual Total Returns
as of 6-30-04
Investor Class | |||
1-year | 16.05 | % | |
5-year | –3.01 | % | |
Since Fund Inception (6-30-98) | 1.52 | % |
Performance is historical and does not guarantee future results. Investment returns and principal value will fluctuate, and you may have a gain or loss when you sell shares. Current performance may be lower or higher than the quoted performance. Call us or visit www.Strong.com for the most recent month-end performance.
Risks: Stock funds should only be considered for long-term goals as values fluctuate in response to the activities of individual companies and general market and economic conditions.
Growth of an Assumed $10,000 Investment†
from 6-30-98 to 6-30-04
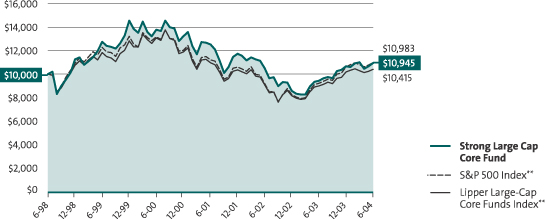
Mention of specific securities in this report is not indicative of whether the Fund may make additional purchases of, sell all or a portion of, or continue to hold those securities.
| * | The Morningstar Style Box™ reveals a fund’s investment strategy. For equity funds, the vertical axis shows the market capitalization of the stocks owned and the horizontal axis shows investment style (value, blend, or growth). |
| † | This graph, provided in accordance with SEC regulations, compares a $10,000 investment in the Fund, made at its inception, with the performance of the S&P 500 Index (“S&P 500”) and the Lipper Large-Cap Core Funds Index. Results include the reinvestment of all dividends and capital gains distributions. The graph and the Average Annual Total Returns table do not reflect the deduction of taxes, if any, that a shareholder would pay on Fund distributions or the redemption of Fund shares. |
Performance Information: From time to time, the Fund’s performance was significantly enhanced through investments in initial public offerings (IPOs). In addition, the effect of IPOs purchased when the Fund’s asset base was small may have been magnified. Given these circumstances, you should not expect that such enhanced returns can be consistently achieved. Please consider this before investing.
Fee Waivers: From time to time, the Fund’s advisor and/or administrator has waived fees and/or absorbed Fund expenses, which has resulted in higher returns. As of 6-30-04, there are waivers and/or absorptions in effect.
Percentage Restrictions: The Fund’s prospectus and statement of additional information may describe restrictions on the percentage of a particular type or quality of security in which the Fund may invest (“Percentage Restrictions”). Percentage Restrictions apply at the time the Fund purchases a security. Circumstances subsequent to the purchase of the security, such as a change in: (1) the Fund’s assets (e.g., due to cash inflows and redemptions); (2) the market value of the security; or (3) the pricing, liquidity, or rating of the security, may cause the Fund to exceed or fall short of the Percentage Restriction. If this happens, the Fund’s continued holding of the security will not constitute a violation of the Percentage Restriction.
Definitions: **The S&P 500 Index consists of 500 stocks chosen for market size, liquidity, and industry group representation. It is a market value weighted index (stock price times number of shares outstanding), with each stock’s weight in the Index proportionate to its market value. The Lipper Large-Cap Core Funds Index is the average of the 30 largest funds in the Lipper Large-Cap Core Funds Category. Source of the S&P Index data is Standard & Poor’s Micropal. Source of the Lipper Index data is Lipper. It is not possible to invest directly in an index.
5
The Strong Growth and Income Fund Investor Class posted positive results for the first half of 2004, though it somewhat underperformed its broad-based benchmark, the S&P 500 Index. For the six months ended June 30, 2004, the Fund produced a return of 2.45%, while the S&P 500 returned 3.44% for the same period. The Fund’s focus on the largest-capitalization stocks available in the marketplace contributed to this underperformance, as the smaller companies within the index continued to outperform.
Positioning for a stronger economy
Performance was mixed during the period. The Fund was stronger in the second quarter than in the first, primarily because the larger, higher-quality stocks that are this Fund’s focus performed better at that time.
Throughout the period, there were many signs of continued economic and corporate profit growth. We, therefore, positioned the Fund with a cyclical orientation; that is, we emphasized sectors and companies that could benefit most from this macroeconomic tailwind. With this approach, we had larger weightings in capital goods, technology, and advertising-related companies.
Our capital goods stocks made a positive contribution to the Fund’s performance. Holdings in this area included Danaher Corporation, Tyco International, and 3M. While there were some signs of increased corporate spending on technology, this trend was not as pronounced as many had hoped. In spite of what was a difficult period for the tech area, our stock picking contributed positively to our returns. Stocks like Broadcom Corporation, a semiconductor company involved in many of the new high growth areas of broadband and wireless communication, had a positive return for the period. Within the advertising arena, stock performance was mixed; while some companies were able to capitalize on the economic strength that bolstered ad spending and even gain additional market share, others, such as media giant Viacom, simply were not able to keep up with changing industry dynamics.
Screening for stronger stocks
Beyond positioning the Fund in sectors that we believed would benefit from the stronger economy, we also employed screening techniques that focused on earnings growth and valuation. We used these techniques to identify companies that had solid potential but were not yet fully exploiting it. This process, which is part of our ongoing investment strategy, includes an analysis of a company’s end market, its competitive environment, and its ability to meet or exceed stated financial goals.
Companies that made it through this evaluation included Internet-based leader Yahoo! and industrial company Tyco International. These stocks both benefited from the strength in the economy, but their financial returns were influenced by very different factors.
Yahoo! was a major beneficiary of the increased use of high-speed data access, as well as the popularity of its on-line search and marketing services. Traditional advertisers have begun to take note of the Internet’s ability to deliver potential customers from the right demographic groups to providers of appropriate products and services. Yahoo!’s share of the corporate advertising budget is still currently in the low single digits; as advertisers seek out distinctive advertising channels, we believe that share should continue to grow.
Tyco International was a turnaround story. The company was and still is involved in a highly publicized legal battle. What can be lost in the controversy is that it appears previous management brought together a collection of well-positioned businesses that simply weren’t being managed to their best advantage. New management came in and cleaned up the balance sheet, modified overly aggressive financial targets, and began to rebuild investor confidence in the company. We now believe management has put the company on a clear growth path. By recognizing the capability of the new management, taking note of the intrinsic value of the company’s varied operations, and identifying its underutilization of assets, we were able to purchase this stock in a timely fashion, with positive results for the portfolio.
Our outlook for the second half of 2004
At this point, our outlook is one of cautious optimism. While this Fund’s focus on high-quality, large-capitalization stocks put it at a disadvantage during the period, we do not intend to move away from this approach. The economy continues to grow, as do corporate profits. The Presidential election, interest-rate hikes from the Federal Reserve, and turmoil in the Middle East could all hurt equity performance in the coming months. Nonetheless, it is impossible to ignore that the economy has continued to expand and spur on earnings growth, which in turn can drive stock prices upward. So while the environment may not be as positive as it was at this point last year, we are confident the opportunity for attractive returns remains.
Thank you for your investment in the Strong Growth and Income Fund.
Rimas Milaitis | ||
Portfolio Manager |
6
Fund Highlights
Average Annual Total Returns
As of 6-30-04
Investor Class | |||
1-year | 16.02 | % | |
5-year | –3.51 | % | |
Since Fund Inception (12-29-95) | 9.49 | % | |
Institutional Class1 | |||
1-year | 16.78 | % | |
5-year | –2.96 | % | |
Since Fund Inception (12-29-95) | 9.85 | % | |
Advisor Class2 | |||
1-year | 16.01 | % | |
5-year | –3.58 | % | |
Since Fund Inception (12-29-95) | 9.33 | % | |
Class K3 | |||
1-year | 16.41 | % | |
5-year | –3.31 | % | |
Since Fund Inception (12-29-95) | 9.62 | % | |
Performance is historical and does not guarantee future results. Investment returns and principal value will fluctuate, and you may have a gain or loss when you sell shares. Current performance may be lower or higher than the quoted performance. Call us or visit www.Strong.com for the most recent month-end performance.
Risks: Stock funds should only be considered for long-term goals as values fluctuate in response to the activities of individual companies and general market and economic conditions.
Growth of an Assumed $10,000 Investment†
from 12-29-95 to 6-30-04
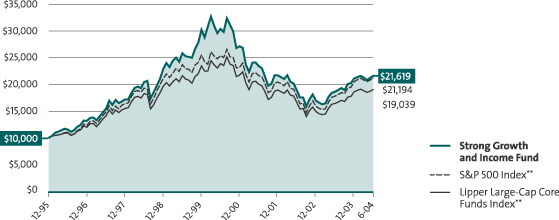
| Mention of specific securities in this report is not indicative of whether the Fund may make additional purchases of, sell all or a portion of, or continue to hold those securities. |
| * | The Morningstar Style BoxTM reveals a fund’s investment strategy. For equity funds, the vertical axis shows the market capitalization of the stocks owned and the horizontal axis shows investment style (value, blend, or growth). |
| † | This graph, provided in accordance with SEC regulations, compares a $10,000 investment in the Fund, made at its inception, with the performance of the S&P 500 Index (“S&P 500”) and the Lipper Large-Cap Core Funds Index. Results include the reinvestment of all dividends and capital gains distributions. The graph and the Average Annual Total Returns table do not reflect the deduction of taxes, if any, that a shareholder would pay on Fund distributions or the redemption of Fund shares. This graph is based on Investor Class shares only; performance for other classes will vary due to differences in fee structures. |
Performance Information: 1The performance of the Institutional Class shares prior to 2-29-00 is based on the Fund’s Investor Class shares’ performance and has not been restated for the lower expense ratio of the Institutional Class shares.
| 2 | The performance of the Advisor Class shares prior to 2-29-00 is based on the Fund’s Investor Class shares’ performance, restated for the higher expense ratio of the Advisor Class shares. |
| 3 | The performance of the Class K shares prior to 12-31-01 is based on the Fund’s Investor Class shares’ performance and has not been restated for the lower expense ratio of the Class K shares. |
| Please consult a prospectus for information about all share classes. |
Fee Waivers: From time to time, the Fund’s advisor and/or administrator has waived fees and/or absorbed Fund expenses, which has resulted in higher returns. As of 6-30-04, there are waivers and/or absorptions in effect.
Percentage Restrictions: The Fund’s prospectus and statement of additional information may describe restrictions on the percentage of a particular type or quality of security in which the Fund may invest (“Percentage Restrictions”). Percentage Restrictions apply at the time the Fund purchases a security. Circumstances subsequent to the purchase of the security, such as a change in: (1) the Fund’s assets (e.g., due to cash inflows and redemptions); (2) the market value of the security; or (3) the pricing, liquidity, or rating of the security, may cause the Fund to exceed or fall short of the Percentage Restriction. If this happens, the Fund’s continued holding of the security will not constitute a violation of the Percentage Restriction.
Definitions: **The S&P 500 Index consists of 500 stocks chosen for market size, liquidity, and industry group representation. It is a market value weighted index (stock price times number of shares outstanding), with each stock’s weight in the Index proportionate to its market value. The Lipper Large-Cap Core Funds Index is the average of the 30 largest funds in the Lipper Large-Cap Core Funds Category. Source of the S&P index data is Standard & Poor’s Micropal. Source of the Lipper index data is Lipper Inc. It is not possible to invest directly in an index.
7
The Strong Opportunity Fund offered solid performance for the first half of 2004. The Fund’s Investor Class shares posted a return of 8.14% for the six months ended June 30, 2004, while its broad-based benchmark, the Russell Midcap Index, returned 6.67% for the same period.
An uncertain environment
The consensus opinion at the start of the year was that equities would be strong in the first half of the year and flat in the second half due to the uncertainty that a presidential election normally brings. But we know from history that things rarely go according to plan, and we did not need to wait for the second half for the uncertainty to take hold. However, we continue to be optimistic, as there are many factors pointing to a positive economic environment.
An improving economy is favorable for equities in general and our style of investing in particular. Over the first half of the year, we continued to find reasonably priced companies in many sectors that are experiencing good rates of growth.
During the first half of 2004, the Fund benefited from our holdings in the energy and distribution sectors, which we had overweighted relative to the benchmark. Our health care holdings, which were skewed toward the biotechnology and medical technology areas, also contributed positively to performance. One area of disappointment was our overweighting in media, an industry that came under a number of pressures that hurt stock valuations.
An intensive research process
The Fund’s over- and under-weightings relative to the benchmark were the result of where our investment process finds value in the market. A key step in this process is determining a private market value (PMV) for a company we are considering — that is, determining the price we would be willing to pay if we were acquiring the whole company. We look for companies whose current stock valuations are between 50% and 60% of their private market value.
This process is research-intensive. We spend much of our time talking to and visiting with the management teams of the companies we own or in which we are interested in investing. These conversations help us to understand the company, its management strategy, and the industry in which it competes.
An example of private market value at work
Biogen Idec is a biotech company that we added to the Fund in mid-2003 (when it was known as Biogen). At the time, it had an approved Multiple Sclerosis (MS) drug, Avonex, and was also developing new drugs. The market was fearful that Avonex sales would lose ground to new competition and was not giving the company credit for the drugs it had in the developmental stage. In November 2003, Biogen merged with IDEC Pharmaceuticals, a company we knew well but didn’t own. We were able to meet with the management shortly after the merger and saw potential for greater cost-cutting than the market anticipated; more important, the research we had done on Antegren (a new class of drug the company has in development for MS) appeared positive. From this work, we determined that the merged company was trading at 50% to 55% of its PMV.
Our work paid off. On June 28, the Food and Drug Administration granted Biogen Idec a priority review of Antegren. This move does not ensure approval of the drug, but it does accelerate the timeline and means the drug is likely to be approved and on the market sooner then our model expects. The stock’s price neared 90% of our PMV by the end of the second quarter, and we began taking profits.
Optimism tempered by uncertainty
Although uncertainties remain, we are optimistic as we look ahead to the rest of 2004 with respect to both the economy and the equity market. We continue to find new names that fit within our investment style and that we believe can help the Fund to outperform over the longer term.
We intend to continue to focus on those factors that are within our control: sticking to our time-tested investment style, diversifying the Fund within industry groups to manage our risk, and striving to bring you investment results of which we will be proud.
We thank you for your continued investment and confidence in the Strong Opportunity Fund.
| Richard T. Weiss | Ann M. Miletti | |
Portfolio Co-Manager | Portfolio Co-Manager |
8
Fund Highlights
Average Annual Total Returns
As of 6-30-04
Investor Class | |||
1-year | 27.95 | % | |
5-year | 4.71 | % | |
10-year | 12.69 | % | |
Since Fund Inception (12-31-85) | 15.15 | % | |
Advisor Class1 | |||
1-year | 27.72 | % | |
5-year | 4.46 | % | |
10-year | 12.37 | % | |
Since Fund Inception (12-31-85) | 14.81 | % | |
Class K2 | |||
1-year | 28.19 | % | |
5-year | 4.80 | % | |
10-year | 12.73 | % | |
Since Fund Inception (12-31-85) | 15.17 | % | |
Performance is historical and does not guarantee future results. Investment returns and principal value will fluctuate, and you may have a gain or loss when you sell shares. Current performance may be lower or higher than the quoted performance. Call us or visit www.Strong.com for the most recent month-end performance.
Risks: Stock funds should only be considered for long-term goals as values fluctuate in response to the activities of individual companies and general market and economic conditions.
Growth of an Assumed $10,000 Investment†
from 12-31-85 to 6-30-04
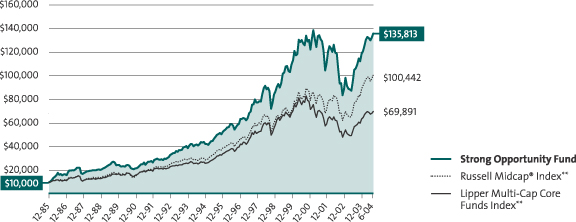
| Mention of specific securities in this report is not indicative of whether the Fund may make additional purchases of, sell all or a portion of, or continue to hold those securities. |
| * | The Morningstar Style BoxTM reveals a fund’s investment strategy. For equity funds, the vertical axis shows the market capitalization of the stocks owned and the horizontal axis shows investment style (value, blend, or growth). |
| † | This graph, provided in accordance with SEC regulations, compares a $10,000 investment in the Fund, made at its inception, with the performance of the Russell Midcap® Index and the Lipper Multi-Cap Core Funds Index. Results include the reinvestment of all dividends and capital gains distributions. The graph and the Average Annual Total Returns table do not reflect the deduction of taxes, if any, that a shareholder would pay on Fund distributions or the redemption of Fund shares. This graph is based on Investor Class shares only; performance for other classes will vary due to differences in fee structures. |
Performance Information: 1The performance of the Advisor Class shares prior to 02-24-00, is based on the Fund’s Investor Class shares’ performance, restated for the higher expense ratio of the Advisor Class shares.
| 2 | The performance of the Class K shares prior to 8-30-02 is based on the Fund’s Investor Class shares’ performance, and has not been restated for the lower expense ratio of the Class K shares. |
| Please consult a prospectus for information about all share classes. |
Fee Waivers: From time to time, the Fund’s advisor and/or administrator has waived fees and/or absorbed Fund expenses, which has resulted in higher returns. As of 6-30-04, there are waivers and/or absorptions in effect.
Percentage Restrictions: The Fund’s prospectus and statement of additional information may describe restrictions on the percentage of a particular type or quality of security in which the Fund may invest (“Percentage Restrictions”). Percentage Restrictions apply at the time the Fund purchases a security. Circumstances subsequent to the purchase of the security, such as a change in: (1) the Fund’s assets (e.g., due to cash inflows and redemptions); (2) the market value of the security; or (3) the pricing, liquidity, or rating of the security, may cause the Fund to exceed or fall short of the Percentage Restriction. If this happens, the Fund’s continued holding of the security will not constitute a violation of the Percentage Restriction.
Definitions: **The Russell Midcap® Index measures the performance of the 800 smallest companies in the Russell 1000 Index, which represent approximately 26% of the total market capitalization of the Russell 1000 Index. The Lipper Multi-Cap Core Funds Index is the average of the 30 largest funds in the Lipper Multi-Cap Core Funds Category. Source of the Russell Index data is Standard & Poor’s Micropal. Source of the Lipper Index data is Lipper. It is not possible to invest directly in an index.
9
| SCHEDULES OF INVESTMENTS IN SECURITIES | June 30, 2004 (Unaudited) |
STRONG BALANCED FUND
Shares or Principal Amount | Value (Note 2) | ||||
Common Stocks 65.3% | |||||
Aerospace - Defense 1.4% | |||||
The Boeing Company | 11,100 | $ | 567,099 | ||
General Dynamics Corporation | 9,300 | 923,490 | |||
Northrop Grumman Corporation | 15,000 | 805,500 | |||
| 2,296,089 | |||||
Aerospace - Defense Equipment 0.3% | |||||
Goodrich Corporation (h) | 15,500 | 501,115 | |||
Banks - Money Center 4.1% | |||||
Bank of America Corporation | 26,350 | 2,229,737 | |||
The Bank of New York Company, Inc. | 20,900 | 616,132 | |||
Citigroup, Inc. | 54,000 | 2,511,000 | |||
J.P. Morgan Chase & Company | 29,700 | 1,151,469 | |||
| 6,508,338 | |||||
Banks - Super Regional 2.0% | |||||
Bank One Corporation | 11,300 | 576,300 | |||
Mellon Financial Corporation | 10,600 | 310,898 | |||
U.S. Bancorp | 31,100 | 857,116 | |||
Wells Fargo & Company | 25,400 | 1,453,642 | |||
| 3,197,956 | |||||
Beverages - Alcoholic 0.5% | |||||
Anheuser-Busch Companies, Inc. | 15,000 | 810,000 | |||
Chemicals - Basic 0.3% | |||||
The Dow Chemical Company | 10,900 | 443,630 | |||
Commercial Services - Miscellaneous 0.9% | |||||
Automatic Data Processing, Inc. | 16,300 | 682,644 | |||
Paychex, Inc. | 20,100 | 680,988 | |||
| 1,363,632 | |||||
Commercial Services - Staffing 0.5% | |||||
Manpower, Inc. | 16,500 | 837,705 | |||
Computer - Data Storage 0.2% | |||||
EMC Corporation (b) | 28,000 | 319,200 | |||
Computer - IT Services 1.0% | |||||
Accenture, Ltd. Class A (b) | 16,600 | 456,168 | |||
International Business Machines Corporation | 12,400 | 1,093,060 | |||
| 1,549,228 | |||||
Computer - Local Networks 1.4% | |||||
Cisco Systems, Inc. (b) | 94,800 | 2,246,760 | |||
Computer - Manufacturers 0.6% | |||||
Dell, Inc. (b) | 25,800 | 924,156 | |||
Computer - Peripheral Equipment 0.6% | |||||
Lexmark International, Inc. Class A (b) | 10,600 | 1,023,218 | |||
Computer - Software Design 0.4% | |||||
Autodesk, Inc.(h) | 13,400 | 573,654 | |||
Computer Software - Desktop 2.1% | |||||
Microsoft Corporation | 118,900 | 3,395,784 | |||
Computer Software - Enterprise 1.0% | |||||
Mercury Interactive Corporation (b) (h) | 11,100 | 553,113 | |||
SAP AG Sponsored ADR | 25,400 | 1,061,974 | |||
| 1,615,087 | |||||
Computer Software - Security 0.2% | |||||
Symantec Corporation (b) | 7,800 | 341,484 | |||
Cosmetics - Personal Care 2.6% | |||||
Avon Products, Inc. | 23,900 | $ | 1,102,746 | ||
The Gillette Company | 23,100 | 979,440 | |||
LIFE TIME FITNESS, Inc. (b) | 200 | 4,200 | |||
The Procter & Gamble Company | 38,000 | 2,068,720 | |||
| 4,155,106 | |||||
Diversified Operations 5.6% | |||||
E.I. Du Pont de Nemours & Company | 9,100 | 404,222 | |||
General Electric Company | 124,200 | 4,024,080 | |||
Honeywell International, Inc. | 23,200 | 849,816 | |||
3M Co. | 12,300 | 1,107,123 | |||
Tyco International, Ltd. (h) | 65,100 | 2,157,414 | |||
United Technologies Corporation | 4,900 | 448,252 | |||
| 8,990,907 | |||||
Electronics - Contract Manufacturing 0.4% | |||||
Flextronics International, Ltd. (b) | 37,000 | 590,150 | |||
Electronics - Scientific Measuring 1.0% | |||||
Danaher Corporation | 21,100 | 1,094,035 | |||
PerkinElmer, Inc. | 27,200 | 545,088 | |||
| 1,639,123 | |||||
Electronics - Semiconductor Manufacturing 2.5% | |||||
Analog Devices, Inc. | 8,500 | 400,180 | |||
Broadcom Corporation Class A (b) (h) | 25,100 | 1,173,927 | |||
Intel Corporation | 71,600 | 1,976,160 | |||
National Semiconductor Corporation (b) (h) | 17,300 | 380,427 | |||
| 3,930,694 | |||||
Finance - Consumer/Commercial Loans 0.2% | |||||
MBNA Corporation | 14,200 | 366,218 | |||
Finance - Investment Brokers 1.3% | |||||
The Goldman Sachs Group, Inc. | 8,100 | 762,696 | |||
Merrill Lynch & Company, Inc. | 13,100 | 707,138 | |||
Morgan Stanley | 11,800 | 622,686 | |||
| 2,092,520 | |||||
Finance - Investment Management 0.3% | |||||
Franklin Resources, Inc. | 10,000 | 500,800 | |||
Finance - Mortgage & Related Services 0.6% | |||||
FNMA | 14,300 | 1,020,448 | |||
Finance - Savings & Loan 0.3% | |||||
Golden West Financial Corporation | 4,700 | 499,845 | |||
Financial Services - Miscellaneous 1.0% | |||||
American Express Company | 18,400 | 945,392 | |||
First Data Corporation | 13,300 | 592,116 | |||
| 1,537,508 | |||||
Food - Miscellaneous Preparation 1.7% | |||||
H.J. Heinz Company | 17,600 | 689,920 | |||
Kellogg Company | 14,100 | 590,085 | |||
PepsiCo, Inc. | 27,300 | 1,470,924 | |||
| 2,750,929 | |||||
Insurance - Diversified 1.8% | |||||
American International Group, Inc. | 28,700 | 2,045,736 | |||
Prudential Financial, Inc. | 17,300 | 803,931 | |||
| 2,849,667 | |||||
Insurance - Property/Casualty/Title 1.7% | |||||
The Allstate Corporation | 20,400 | 949,620 | |||
Hartford Financial Services Group, Inc. | 11,900 | 818,006 | |||
MGIC Investment Corporation | 7,000 | 531,020 | |||
The PMI Group, Inc. | 8,300 | 361,216 | |||
| 2,659,862 | |||||
10
STRONG BALANCED FUND (continued)
| Shares or Principal Amount | Value (Note 2) | ||||
Internet - E*Commerce 0.7% | |||||
eBay, Inc. (b) | 12,400 | $ | 1,140,180 | ||
Internet - Internet Content 0.8% | |||||
Yahoo! Inc. (b) | 36,900 | 1,340,577 | |||
Leisure - Gaming/Equipment 0.6% | |||||
Station Casinos, Inc. (h) | 20,900 | 1,011,560 | |||
Leisure - Hotels & Motels 1.0% | |||||
Marriott International, Inc. Class A | 16,200 | 808,056 | |||
Starwood Hotels & Resorts Worldwide, Inc. | 19,300 | 865,605 | |||
| 1,673,661 | |||||
Machinery - General Industrial 0.4% | |||||
Ingersoll-Rand Company Class A | 8,100 | 553,311 | |||
Media - Books 0.3% | |||||
McGraw-Hill, Inc. | 5,500 | 421,135 | |||
Media - Radio/TV 0.9% | |||||
The E.W. Scripps Company Class A | 6,400 | 672,000 | |||
The Walt Disney Company | 31,800 | 810,582 | |||
| 1,482,582 | |||||
Medical - Biomed/Biotech 0.5% | |||||
Biogen Idec, Inc. (b) | 13,400 | 847,550 | |||
Medical - Drug/Diversified 1.0% | |||||
Johnson & Johnson | 28,500 | 1,587,450 | |||
Medical - Ethical Drugs 3.1% | |||||
Elan Corporation PLC Sponsored ADR (b) | 21,300 | 526,962 | |||
Eli Lilly & Company | 6,800 | 475,388 | |||
Merck & Company, Inc. | 22,400 | 1,064,000 | |||
Pfizer, Inc. | 82,780 | 2,837,698 | |||
| 4,904,048 | |||||
Medical - Genetics 0.4% | |||||
Genentech, Inc. (b) | 11,200 | 629,440 | |||
Medical - Health Maintenance Organizations 0.7% | |||||
UnitedHealth Group, Inc. | 16,600 | 1,033,350 | |||
Medical - Products 1.6% | |||||
Biomet, Inc. | 11,500 | 511,060 | |||
Boston Scientific Corporation (b) | 20,500 | 877,400 | |||
St. Jude Medical, Inc. (b) | 5,500 | 416,075 | |||
Zimmer Holdings, Inc. (b) | 9,000 | 793,800 | |||
| 2,598,335 | |||||
Medical - Wholesale Drugs/Sundries 0.3% | |||||
Cardinal Health, Inc. | 7,600 | 532,380 | |||
Medical/Dental - Services 0.5% | |||||
Quest Diagnostics, Inc. (h) | 9,700 | 824,015 | |||
Medical/Dental - Supplies 0.3% | |||||
Becton, Dickinson & Company | 9,300 | 481,740 | |||
Oil & Gas - Field Services 0.8% | |||||
Schlumberger, Ltd. | 19,100 | 1,213,041 | |||
Oil & Gas - International Integrated 3.7% | |||||
ChevronTexaco Corporation | 13,600 | 1,279,896 | |||
ConocoPhillips | 13,300 | 1,014,657 | |||
Exxon Mobil Corporation | 82,100 | 3,646,061 | |||
| 5,940,614 | |||||
Oil & Gas - Machinery/Equipment 0.4% | |||||
Baker Hughes, Inc. | 17,400 | 655,110 | |||
Oil & Gas - United States Exploration & Production 0.4% | |||||
Anadarko Petroleum Corporation | 9,700 | 568,420 | |||
Paper & Paper Products 0.6% | |||||
Temple-Inland, Inc. (h) | 13,900 | 962,575 | |||
Retail - Clothing/Shoe 0.3% | |||||
The Gap, Inc. | 21,800 | 528,650 | |||
Retail - Department Stores 0.3% | |||||
Kohl’s Corporation (b) | 10,100 | 427,028 | |||
Retail - Drug Stores 0.4% | |||||
CVS Corporation | 15,100 | 634,502 | |||
Retail - Home Furnishings 0.0% | |||||
Design Within Reach, Inc. (b) | 200 | 3,286 | |||
Retail - Major Discount Chains 2.0% | |||||
Target Corporation | 30,600 | 1,299,582 | |||
Wal-Mart Stores, Inc. | 36,800 | 1,941,568 | |||
| 3,241,150 | |||||
Retail/Wholesale - Building Products 0.9% | |||||
The Home Depot, Inc. | 40,300 | 1,418,560 | |||
Retail/Wholesale - Office Supplies 0.4% | |||||
Staples, Inc. | 22,700 | 665,337 | |||
Soap & Cleaning Preparations 0.2% | |||||
Clorox Company | 6,100 | 328,058 | |||
Telecom - Fiber Optics 0.4% | |||||
Corning, Inc. (b) | 43,200 | 564,192 | |||
Telecom - Wireless Equipment 0.7% | |||||
QUALCOMM, Inc. | 14,700 | 1,072,806 | |||
Telecommunications - Equipment 0.2% | |||||
Avaya, Inc. (b) | 6,600 | 104,214 | |||
Lucent Technologies, Inc. (b) | 70,500 | 266,490 | |||
| 370,704 | |||||
Telecommunications - Services 1.0% | |||||
SBC Communications, Inc. | 32,400 | 785,700 | |||
Verizon Communications, Inc. | 23,600 | 854,084 | |||
| 1,639,784 | |||||
Transportation - Air Freight 0.2% | |||||
FedEx Corporation | 3,900 | 318,591 | |||
Utility - Electric Power 0.8% | |||||
Exelon Corporation | 36,300 | 1,208,427 | |||
Total Common Stocks (Cost $92,646,174) | 104,352,962 | ||||
11
| SCHEDULES OF INVESTMENTS IN SECURITIES (continued) | June 30, 2004 (Unaudited) |
STRONG BALANCED FUND (continued)
| Shares or Principal Amount | Value (Note 2) | |||||
Corporate Bonds 13.6% | ||||||
AT&T Corporation Senior Notes, 8.05%, Due 11/15/11 | $ | 150,000 | $ | 154,221 | ||
AT&T Wireless Services, Inc. Notes, 8.125%, Due 5/01/12 | 250,000 | 289,466 | ||||
Aladdin Gaming Holdings LLC/Aladdin Capital Corporation Senior Discount Notes, 13.50%, Due 3/01/10 (b) (g) | 3,700,000 | 37,000 | ||||
America Movil SA de CV Guaranteed Senior Yankee Notes, 5.50%, Due 3/01/14 (d) | 250,000 | 230,922 | ||||
Bank of America Corporation Subordinated Notes, 7.40%, Due 1/15/11 | 400,000 | 453,922 | ||||
Capital One Bank Medium-Term Notes, 6.50%, Due 6/13/13 | 210,000 | 216,893 | ||||
Cendant Corporation Notes, 6.25%, Due 3/15/10 | 100,000 | 106,519 | ||||
CenterPoint Energy Resources Corporation Senior Notes, Series B, 7.875%, Due 4/01/13 | 100,000 | 112,071 | ||||
Citigroup, Inc. Notes, 5.50%, Due 8/09/06 | 575,000 | 600,966 | ||||
Citizens Communications Company Senior Notes, 8.50%, Due 5/15/06 | 200,000 | 213,174 | ||||
Comcast Corporation Senior Notes, 5.85%, Due 1/15/10 | 250,000 | 261,174 | ||||
Core Investment Grade Trust Pass-Thru Certificates, 4.727%, Due 11/30/07 | 1,000,000 | 1,019,959 | ||||
Countrywide Home Loans, Inc. Notes, Series L, 4.00%, Due 3/22/11 | 520,000 | 485,704 | ||||
Cox Communications, Inc. Notes, 4.625%, Due 6/01/13 | 285,000 | 263,543 | ||||
Credit Suisse First Boston USA, Inc. Notes: | ||||||
4.625%, Due 1/15/08 | 200,000 | 203,890 | ||||
6.50%, Due 1/15/12 | 250,000 | 269,049 | ||||
DaimlerChrysler North America Holding Corporation Guaranteed Notes, 4.05%, Due 6/04/08 | 100,000 | 98,140 | ||||
DaimlerChrysler North America Holding Corporation Notes, 7.75%, Due 1/18/11 | 200,000 | 223,810 | ||||
EOP Operating LP Notes, 6.75%, Due 2/15/12 | 350,000 | 376,366 | ||||
European Investment Bank Yankee Notes: | ||||||
3.00%, Due 6/16/08 (h) | 290,000 | 283,461 | ||||
4.625%, Due 3/01/07 | 500,000 | 516,869 | ||||
FedEx Corporation Notes, 2.65%, Due 4/01/07 (d) | 245,000 | 238,073 | ||||
FirstEnergy Corporation Notes, 6.45%, Due 11/15/11 | 150,000 | 155,741 | ||||
Florida Power & Light Company First Mortgage Notes, 6.875%, Due 12/01/05 | 110,000 | 116,356 | ||||
Ford Motor Credit Company Notes: | ||||||
6.50%, Due 1/25/07 | 250,000 | 262,836 | ||||
7.00%, Due 10/01/13 (h) | 300,000 | 303,351 | ||||
7.60%, Due 8/01/05 | 160,000 | 167,541 | ||||
France Telecom SA Yankee Notes, 9.00%, Due 3/01/11 | 350,000 | 406,114 | ||||
General Electric Capital Corporation Notes: | ||||||
2.75%, Due 9/25/06 | 530,000 | 524,977 | ||||
6.50%, Due 12/10/07 | 250,000 | 271,947 | ||||
General Motors Acceptance Corporation Notes, 6.875%, Due 9/15/11 | 370,000 | 379,895 | ||||
Goldman Sachs Group, Inc. Senior Notes, 5.15%, Due 1/15/14 (h) | 275,000 | 264,576 | ||||
Goodrich Corporation Senior Notes, 7.625%, Due 12/15/12 | 100,000 | 112,717 | ||||
Harrah’s Operating Company, Inc. Senior Notes, 5.50%, Due 7/01/10 (d) | 220,000 | 221,381 | ||||
Highwoods Realty LP Notes, 7.00%, Due 12/01/06 | 400,000 | 422,238 | ||||
Household Finance Corporation Senior Notes, 5.875%, Due 2/01/09 | 580,000 | 612,872 | ||||
Hutchison Whampoa International, Ltd. Guaranteed Yankee Notes, 6.25%, Due 1/24/14 (d) | 200,000 | 194,305 | ||||
Intelsat, Ltd. Senior Notes, 5.25%, Due 11/01/08 | 240,000 | 229,399 | ||||
J.P. Morgan Chase & Company Subordinated Notes, 6.625%, Due 3/15/12 | 300,000 | 324,884 | ||||
Kraft Foods, Inc. Notes, 5.25%, Due 10/01/13 | 605,000 | 590,475 | ||||
Kroger Company Notes, 6.75%, Due 4/15/12 | 100,000 | 108,498 | ||||
Liberty Media Corporation Senior Notes, 5.70%, Due 5/15/13 | 300,000 | 296,044 | ||||
M&T Bank Corporation, Floating Rate Subordinated Notes, 3.85%, Due 4/01/13 | 250,000 | 245,432 | ||||
Merrill Lynch & Company, Inc. Medium-Term Notes, Tranche #312, 4.00%, Due 11/15/07 | 200,000 | 200,675 | ||||
MidAmerican Energy Holdings Company Senior Notes, 7.23%, Due 9/15/05 | 345,000 | 362,624 | ||||
Morgan Stanley Notes: | ||||||
5.30%, Due 3/01/13 | 200,000 | 197,146 | ||||
5.80%, Due 4/01/07 | 500,000 | 529,052 | ||||
National Rural Utilities Cooperative Finance Corporation Notes, 6.50%, Due 3/01/07 (h) | 300,000 | 322,019 | ||||
NiSource Finance Corporation Notes, 7.625%, Due 11/15/05 | 305,000 | 323,649 | ||||
Norfolk Southern Corporation Senior Notes, 6.00%, Due 4/30/08 | 250,000 | 264,995 | ||||
Normandy Finance, Ltd. Yankee Notes, 7.625%, Due 7/15/08 (d) | 200,000 | 221,205 | ||||
PNC Funding Corporation Subordinated Notes, 6.125%, Due 2/15/09 | 450,000 | 480,393 | ||||
Principal Life Global Funding I Medium-Term Notes, Tranche #23, 3.625%, Due 4/30/08 (d) | 250,000 | 249,083 | ||||
Province of Quebec Notes, 5.00%, Due 7/17/09 | 335,000 | 344,678 | ||||
Public Service Company of Colorado Corporate Notes, 7.875%, Due 10/01/12 | 175,000 | 206,893 | ||||
Republic of Italy Yankee Notes, 3.625%, Due 9/14/07 | 300,000 | 299,818 | ||||
Republic of South Africa Yankee Notes, 6.50%, Due 6/02/14 | 180,000 | 182,250 | ||||
Rogers Cable, Inc. Senior Secured Second Priority Yankee Notes, 6.25%, Due 6/15/13 | 145,000 | 137,231 | ||||
Safeway, Inc. Notes, 4.80%, Due 7/16/07 | 200,000 | 204,579 | ||||
Salomon Smith Barney Holdings, Inc. Senior Notes, 5.875%, Due 3/15/06 | 510,000 | 535,059 | ||||
Shaw Communications, Inc. Senior Yankee Notes, 7.20%, Due 12/15/11 | 315,000 | 327,586 | ||||
Sovereign Bancorp Senior Notes, 10.50%, Due 11/15/06 | 150,000 | 171,943 | ||||
12
STRONG BALANCED FUND (continued)
| Shares or Principal Amount | Value (Note 2) | |||||
Sprint Capital Corporation Notes, 8.375%, Due 3/15/12 | $ | 250,000 | $ | 287,749 | ||
Texas Eastern Transmission Corporation Notes, 5.25%, Due 7/15/07 | 200,000 | 206,652 | ||||
Time Warner Entertainment Company LP Senior Notes, 8.875%, Due 10/01/12 | 250,000 | 301,524 | ||||
Travelers Property and Casualty Corporation Senior Notes, 5.00%, Due 3/15/13 | 150,000 | 145,545 | ||||
Tyco International Group SA Yankee Notes, 6.00%, Due 11/15/13 | 120,000 | 123,582 | ||||
UFJ Finance Aruba AEC Yankee Notes, 6.75%, Due 7/15/13 | 200,000 | 207,162 | ||||
Union Pacific Corporation Notes, 5.75%, Due 10/15/07 | 305,000 | 321,081 | ||||
United Mexican States Yankee Notes, 7.50%, Due 1/14/12 | 200,000 | 216,000 | ||||
Valero Energy Corporation Notes, 6.875%, Due 4/15/12 | 215,000 | 234,140 | ||||
Verizon Global Funding Corporation Notes, 4.375%, Due 6/01/13 | 300,000 | 275,842 | ||||
Wal-Mart Stores, Inc. Notes, 4.125%, Due 2/15/11 | 260,000 | 251,301 | ||||
Waste Management, Inc. Senior Notes, 6.50%, Due 11/15/08 | 200,000 | 216,355 | ||||
Wells Fargo & Company Senior Notes, 5.25%, Due 12/01/07 | 415,000 | 433,342 | ||||
XTO Energy, Inc. Senior Notes, 6.25%, Due 4/15/13 | 165,000 | 171,932 | ||||
Total Corporate Bonds (Cost $ 22,619,833) | 21,819,856 | |||||
Municipal Bonds 0.6% | ||||||
California GO, 6.30%, Due 10/01/07 | 400,000 | 443,000 | ||||
Racine, Wisconsin Solid Waste Disposal Revenue Refunding - Republic Services Project, 3.25%, Due 12/01/37 (Mandatory Put at $100 on 4/01/09) | 500,000 | 482,500 | ||||
Total Municipal Bonds (Cost $ 931,046) | 925,500 | |||||
Non-Agency Mortgage & Asset-Backed Securities 2.4% | ||||||
ABN AMRO Mortgage Corporation Variable Rate Pass-Thru Certificates, Series 2002-1A, Class IIA-3, 5.35%, Due 6/25/32 | 76,634 | 77,527 | ||||
Asset Securitization Corporation Commercial Mortgage Pass-Thru Certificates, Series 1995-MD4, Class A-1, 7.10%, Due 8/13/29 | 558,160 | 584,908 | ||||
Community Program Loan Trust Bonds, Series 1987, Class A-4, 4.50%, Due 10/01/18 | 1,088,955 | 1,087,891 | ||||
FHLMC Adjustable Rate Guaranteed Mortgage Participation Certificates, 4.23%, Due 10/25/43 | 557,209 | 568,577 | ||||
JP Morgan Chase Commercial Mortgage Securities Corporation Variable Rate Pass-Thru Certificates, Series 2004-C2, Class A2, 5.26%, Due 5/15/41 | 475,000 | 476,938 | ||||
Residential Asset Securities Corporation Variable Rate Home Equity Mortgage Asset-Backed Pass-Thru Certificates, Series 2004-KS1, Class AI1, 1.45%, Due 9/25/20 | 665,795 | 665,915 | ||||
Washington Mutual Mortgage Pass-Thru Certificates, Series 2002-AR7, Class A-6, 5.53%, Due 7/25/32 | 314,261 | 316,905 | ||||
Total Non-Agency Mortgage & Asset-Backed Securities (Cost $ 3,738,675) | 3,778,661 | |||||
United States Government & Agency Issues 16.1% | ||||||
FHLMC Adjustable Rate Guaranteed Mortgage Participation Certificates, 4.30%, Due 7/25/43 | 527,050 | 535,862 | ||||
FHLMC Adjustable Rate Participation Certificates, Pool #865469, 6.114%, Due 8/01/25 | 191,206 | 195,318 | ||||
FHLMC Notes: | ||||||
5.50%, Due 7/15/06 (c) | 150,000 | 157,048 | ||||
5.75%, Due 3/15/09 (c) | 1,115,000 | 1,190,593 | ||||
6.00%, Due 6/15/11 (h) | 800,000 | 860,230 | ||||
FHLMC Participation Certificates: | ||||||
8.00%, Due 3/01/16 | 391,261 | 418,160 | ||||
10.25%, Due 3/01/15 | 24,153 | 26,804 | ||||
10.50%, Due 1/01/16 | 3,912 | 4,438 | ||||
FNMA Guaranteed Mortgage Adjustable Rate Pass-Thru Certificates, 6.96%, Due 1/01/07 | 2,055,654 | 2,190,563 | ||||
FNMA Guaranteed Real Estate Mortgage Investment Conduit Pass-Thru Trust, 9.50%, Due 11/25/31 | 726,647 | 814,526 | ||||
FNMA Guaranteed Real Estate Mortgage Investment Conduit Variable Rate Pass - Thru Certificates, Series G92-61, Class FJ, 2.902%, Due 10/25/22 | 78,974 | 79,638 | ||||
FNMA Notes: | ||||||
2.875%, Due 5/19/08 (h) | 575,000 | 554,054 | ||||
3.25%, Due 8/15/08 (h) | 925,000 | 901,108 | ||||
4.375%, Due 10/15/06 (c) (h) | 200,000 | 205,180 | ||||
4.625%, Due 10/15/13 | 955,000 | 921,295 | ||||
5.25%, Due 6/15/06 (h) | 1,500,000 | 1,564,142 | ||||
5.50%, Due 2/15/06 (h) | 2,560,000 | 2,671,875 | ||||
5.75%, Due 2/15/08 | 1,000,000 | 1,066,462 | ||||
6.00%, Due 5/15/08 | 1,350,000 | 1,455,326 | ||||
FNMA TBA, 5.50%, Due 7/15/34 | 1,200,000 | 1,194,374 | ||||
GNMA Guaranteed Pass-Thru Certificates, 7.50%, Due 12/15/07 | 193,438 | 201,048 | ||||
United States Treasury Bonds, 11.25%, Due 2/15/15 (h) | 145,000 | 223,742 | ||||
United States Treasury Notes: | ||||||
2.25%, Due 2/15/07 (h) | 250,000 | 245,205 | ||||
2.625%, Due 3/15/09 (h) | 980,000 | 932,761 | ||||
3.00%, Due 2/15/09 (h) | 170,000 | 164,780 | ||||
3.125%, Due 4/15/09 (h) | 555,000 | 539,413 | ||||
3.875%, Due 5/15/09 (h) | 350,000 | 351,285 | ||||
4.25%, Due 11/15/13 (h) | 1,055,000 | 1,027,183 | ||||
4.75%, Due 5/15/14 (h) | 1,389,000 | 1,403,922 | ||||
5.75%, Due 11/15/05 | 1,025,000 | 1,072,046 | ||||
5.75%, Due 8/15/10 (h) | 100,000 | 109,063 | ||||
6.50%, Due 2/15/10 (h) | 90,000 | 101,440 | ||||
10.375%, Due 11/15/12 (h) | 1,985,000 | 2,424,493 | ||||
Total United States Government & Agency Issues (Cost $ 25,988,239) | 25,803,377 | |||||
13
SCHEDULES OF INVESTMENTS IN SECURITIES (continued) | June 30, 2004 (Unaudited) |
STRONG BALANCED FUND (continued)
| Shares or Principal Amount | Value (Note 2) | ||||||
Short-Term Investments (a)13.8% | |||||||
Collateral Received for Securities Lending 11.4% | |||||||
Navigator Prime Portfolio | 18,181,603 | $ | 18,181,603 | ||||
Corporate Bonds 0.9% | |||||||
AOL Time Warner, Inc. Notes, 5.625%, Due 5/01/05 | $ | 300,000 | 307,409 | ||||
KN Energy, Inc. Senior Notes, 6.65%, Due 3/01/05 | 250,000 | 256,989 | |||||
Kroger Company Guaranteed Notes, 7.375%, Due 3/01/05 | 205,000 | 211,507 | |||||
MetLife, Inc. Debentures, 3.911%, Due 5/15/05 | 205,000 | 207,775 | |||||
Pioneer National Resources Company Senior Notes, 8.875%, Due 4/15/05 | 200,000 | 209,236 | |||||
Tyson Foods, Inc. Notes, 6.625%, Due 10/01/04 | 210,000 | 211,779 | |||||
| 1,404,695 | |||||||
Repurchase Agreements (e) 0.6% | |||||||
State Street Bank (Dated 6/30/04), 0.75%, Due 7/01/04 (Repurchase proceeds $984,821); Collateralized by: United States Government & Agency Issues | 984,800 | 984,800 | |||||
United States Government & Agency Issues 0.9% | |||||||
United States Treasury Bills, Due 8/26/04 (c) | 100,000 | 99,837 | |||||
United States Treasury Notes, 1.25%, Due 5/31/05 | 1,300,000 | 1,291,368 | |||||
| 1,391,205 | |||||||
Total Short-Term Investments (Cost $21,962,716) | 21,962,303 | ||||||
Total Investments in Securities (Cost $167,886,683) 111.8% | 178,642,659 | ||||||
Other Assets and Liabilities, Net (11.8%) | (18,784,322 | ) | |||||
Net Assets 100.0% | $ | 159,858,337 | |||||
FUTURES
| Expiration Date | Underlying Face Amount at Value | Unrealized Appreciation/ (Depreciation) | ||||||||
Sold: | ||||||||||
18 Five-Year U.S. Treasury Notes | 9/04 | ($ | 1,956,375 | ) | ($ | 10,717 | ) | |||
3 Ten-Year U.S. Treasury Notes | 9/04 | (327,984 | ) | (3,716 | ) | |||||
Shares or Amount | Value (Note 2) | ||||
Common Stocks 95.1% | |||||
Apparel - Shoes & Related Manufacturing 2.2% | |||||
NIKE, Inc. Class B | 1,100 | $ | 83,325 | ||
Auto Manufacturer 2.1% | |||||
Toyota Motor Corporation Sponsored ADR | 1,000 | 81,620 | |||
Banks - Money Center 9.4% | |||||
Bank of America Corporation | 1,400 | 118,468 | |||
Citigroup, Inc. | 3,200 | $ | 148,800 | ||
J.P. Morgan Chase & Company | 2,500 | 96,925 | |||
| 364,193 | |||||
Building - Resident/Commercial 9.7% | |||||
D.R. Horton, Inc. | 2,850 | 80,940 | |||
Lennar Corporation Class A | 1,800 | 80,496 | |||
Pulte Homes, Inc. | 2,600 | 135,278 | |||
Standard Pacific Corporation | 1,600 | 78,880 | |||
| 375,594 | |||||
Computer - Local Networks 2.8% | |||||
Cisco Systems, Inc. (b) | 4,600 | 109,020 | |||
Computer Software - Desktop 3.0% | |||||
Microsoft Corporation | 4,100 | 117,096 | |||
Cosmetics - Personal Care 5.5% | |||||
Avon Products, Inc. | 1,700 | 78,438 | |||
LIFE TIME FITNESS, Inc. (b) | 100 | 2,100 | |||
The Procter & Gamble Company | 2,400 | 130,656 | |||
| 211,194 | |||||
Diversified Operations 10.0% | |||||
General Electric Company | 3,200 | 103,680 | |||
3M Co. | 1,600 | 144,016 | |||
Tyco International, Ltd. | 4,200 | 139,188 | |||
| 386,884 | |||||
Electronics - Semiconductor Manufacturing 3.8% | |||||
Analog Devices, Inc. | 1,500 | 70,620 | |||
National Semiconductor Corporation (b) | 3,400 | 74,766 | |||
| 145,386 | |||||
Finance - Consumer/Commercial Loans 2.8% | |||||
Capital One Financial Corporation | 1,600 | 109,408 | |||
Finance - Investment Brokers 5.1% | |||||
The Goldman Sachs Group, Inc. | 1,000 | 94,160 | |||
Merrill Lynch & Company, Inc. | 1,900 | 102,562 | |||
| 196,722 | |||||
Finance - Mortgage & Related Services 2.0% | |||||
Countrywide Financial Corporation | 1,100 | 77,275 | |||
Internet - E*Commerce 2.9% | |||||
eBay, Inc. (b) | 1,200 | 110,340 | |||
Internet - Internet Content 3.9% | |||||
Yahoo! Inc. (b) | 4,200 | 152,586 | |||
Medical - Ethical Drugs 6.1% | |||||
Merck & Company, Inc. | 2,400 | 114,000 | |||
Pfizer, Inc. | 3,500 | 119,980 | |||
| 233,980 | |||||
Medical/Dental - Supplies 2.1% | |||||
Becton, Dickinson & Company | 1,600 | 82,880 | |||
Metal Ores - Miscellaneous 2.0% | |||||
Phelps Dodge Corporation (b) | 1,000 | 77,510 | |||
Oil & Gas - International Integrated 10.2% | |||||
Amerada Hess Corporation | 1,600 | 126,704 | |||
ConocoPhillips | 2,000 | 152,580 | |||
Exxon Mobil Corporation | 2,600 | 115,466 | |||
| 394,750 | |||||
Oil & Gas - Refining/Marketing 2.7% | |||||
Valero Energy Corporation | 1,400 | 103,264 | |||
14
STRONG LARGE CAP CORE FUND (continued)
| Shares or Principal Amount | Value (Note 2) | |||||
Retail - Drug Stores 2.2% | ||||||
Walgreen Company | 2,300 | $ | 83,283 | |||
Retail - Home Furnishings 0.0% | ||||||
Design Within Reach, Inc. (b) | 100 | 1,643 | ||||
Retail/Wholesale - Building Products 2.3% | ||||||
Lowe’s Companies, Inc. | 1,700 | 89,335 | ||||
Telecommunications - Wireless Equipment 2.3% | ||||||
QUALCOMM, Inc. | 1,200 | 87,576 | ||||
Total Common Stocks (Cost $3,102,281) | 3,674,864 | |||||
Short-Term Investments (a) 4.8% | ||||||
Repurchase Agreements (e) | ||||||
State Street Bank (Dated 6/30/04), 0.75%, Due 7/01/04 (Repurchase proceeds $185,404); Collateralized by: United States Government & Agency Issues | $ | 185,400 | 185,400 | |||
Total Short-Term Investments (Cost $185,400) | 185,400 | |||||
Total Investments in Securities (Cost $3,287,681) 99.9% | 3,860,264 | |||||
Other Assets and Liabilities, Net 0.1% | 2,230 | |||||
Net Assets 100.0% | $ | 3,862,494 | ||||
| Shares or Principal Amount | Value (Note 2) | ||||
Common Stocks 99.8% | |||||
Aerospace - Defense 2.2% | |||||
The Boeing Company | 66,600 | $ | 3,402,594 | ||
General Dynamics Corporation | 56,100 | 5,570,730 | |||
Northrop Grumman Corporation | 90,800 | 4,875,960 | |||
| 13,849,284 | |||||
Aerospace - Defense Equipment 0.5% | |||||
Goodrich Corporation | 93,100 | 3,009,923 | |||
Banks - Money Center 6.2% | |||||
Bank of America Corporation | 158,600 | 13,420,732 | |||
The Bank of New York Company, Inc. | 126,100 | 3,717,428 | |||
Citigroup, Inc. | 325,600 | 15,140,400 | |||
J.P. Morgan Chase & Company | 178,300 | 6,912,691 | |||
| 39,191,251 | |||||
Banks - Super Regional 3.1% | |||||
Bank One Corporation | 68,200 | 3,478,200 | |||
Mellon Financial Corporation | 64,300 | 1,885,919 | |||
U.S. Bancorp | 187,600 | 5,170,256 | |||
Wells Fargo & Company | 153,100 | 8,761,913 | |||
| 19,296,288 | |||||
Beverages - Alcoholic 0.8% | |||||
Anheuser-Busch Companies, Inc. | 90,300 | 4,876,200 | |||
Chemicals - Basic 0.4% | |||||
The Dow Chemical Company | 66,100 | 2,690,270 | |||
Commercial Services - Miscellaneous 1.3% | |||||
Automatic Data Processing, Inc. | 97,900 | 4,100,052 | |||
Paychex, Inc. | 121,700 | 4,123,196 | |||
| 8,223,248 | |||||
Commercial Services - Staffing 0.8% | |||||
Manpower, Inc. | 99,600 | 5,056,692 | |||
Computer - Data Storage 0.3% | |||||
EMC Corporation (b) | 169,000 | 1,926,600 | |||
Computer - IT Services 1.5% | |||||
Accenture, Ltd. Class A (b) | 99,400 | 2,731,512 | |||
International Business Machines Corporation | 75,000 | 6,611,250 | |||
| 9,342,762 | |||||
Computer - Local Networks 2.2% | |||||
Cisco Systems, Inc. (b) | 572,000 | 13,556,400 | |||
Computer - Manufacturers 0.9% | |||||
Dell, Inc. (b) | 155,800 | 5,580,756 | |||
Computer - Peripheral Equipment 1.0% | |||||
Lexmark International, Inc. Class A (b) | 63,400 | 6,120,002 | |||
Computer - Software Design 0.5% | |||||
Autodesk, Inc. | 80,600 | 3,450,486 | |||
Computer Software - Desktop 3.2% | |||||
Microsoft Corporation | 712,900 | 20,360,424 | |||
Computer Software - Enterprise 1.5% | |||||
Mercury Interactive Corporation (b) | 67,200 | 3,348,576 | |||
SAP AG Sponsored ADR | 152,300 | 6,367,663 | |||
| 9,716,239 | |||||
Computer Software - Security 0.3% | |||||
Symantec Corporation (b) | 46,900 | 2,053,282 | |||
Cosmetics - Personal Care 4.0% | |||||
Avon Products, Inc. | 144,000 | 6,644,160 | |||
The Gillette Company | 139,300 | 5,906,320 | |||
LIFE TIME FITNESS, Inc. (b) | 1,200 | 25,200 | |||
The Procter & Gamble Company | 228,800 | 12,455,872 | |||
| 25,031,552 | |||||
Diversified Operations 8.6% | |||||
E.I. Du Pont de Nemours & Company | 55,100 | 2,447,542 | |||
General Electric Company | 749,500 | 24,283,800 | |||
Honeywell International, Inc. | 140,300 | 5,139,189 | |||
3M Co. | 74,300 | 6,687,743 | |||
Tyco International, Ltd. | 390,600 | 12,944,484 | |||
United Technologies Corporation | 29,400 | 2,689,512 | |||
| 54,192,270 | |||||
Electronics - Contract Manufacturing 0.6% | |||||
Flextronics International, Ltd. (b) | 223,000 | 3,556,850 | |||
Electronics - Scientific Measuring 1.6% | |||||
Danaher Corporation | 126,700 | 6,569,395 | |||
PerkinElmer, Inc. | 163,900 | 3,284,556 | |||
| 9,853,951 | |||||
Electronics - Semiconductor | |||||
Analog Devices, Inc. | 50,900 | 2,396,372 | |||
Broadcom Corporation Class A (b) | 150,000 | 7,015,500 | |||
Intel Corporation | 431,900 | 11,920,440 | |||
National Semiconductor Corporation (b) | 103,600 | 2,278,164 | |||
| 23,610,476 | |||||
15
SCHEDULES OF INVESTMENTS IN SECURITIES (continued) | June 30, 2004 (Unaudited) |
STRONG GROWTH & INCOME FUND (continued)
| Shares or Principal Amount | Value (Note 2) | ||||
Finance - Consumer/Commercial Loans 0.3% | |||||
MBNA Corporation | 85,400 | $ | 2,202,466 | ||
Finance - Investment Brokers 2.0% | |||||
The Goldman Sachs Group, Inc. | 48,467 | 4,563,653 | |||
Merrill Lynch & Company, Inc. | 78,400 | 4,232,032 | |||
Morgan Stanley | 71,000 | 3,746,670 | |||
| 12,542,355 | |||||
Finance - Investment Management 0.5% | |||||
Franklin Resources, Inc. | 60,700 | 3,039,856 | |||
Finance - Mortgage & Related Services 1.0% | |||||
FNMA | 86,000 | 6,136,960 | |||
Finance - Savings & Loan 0.5% | |||||
Golden West Financial Corporation | 27,900 | 2,967,165 | |||
Financial Services - Miscellaneous 1.5% | |||||
American Express Company | 111,000 | 5,703,180 | |||
First Data Corporation | 80,000 | 3,561,600 | |||
| 9,264,780 | |||||
Food - Miscellaneous Preparation 2.6% | |||||
H.J. Heinz Company | 105,700 | 4,143,440 | |||
Kellogg Company | 84,700 | 3,544,695 | |||
PepsiCo, Inc. | 163,800 | 8,825,544 | |||
| 16,513,679 | |||||
Insurance - Diversified 2.7% | |||||
American International Group, Inc. | 172,800 | 12,317,184 | |||
Prudential Financial, Inc. | 103,900 | 4,828,233 | |||
| 17,145,417 | |||||
Insurance - Property/Casualty/Title 2.5% | |||||
The Allstate Corporation | 122,300 | 5,693,065 | |||
Hartford Financial Services Group, Inc. | 72,000 | 4,949,280 | |||
MGIC Investment Corporation | 42,200 | 3,201,292 | |||
The PMI Group, Inc. | 50,500 | 2,197,760 | |||
| 16,041,397 | |||||
Internet - E*Commerce 1.1% | |||||
eBay, Inc. (b) | 74,800 | 6,877,860 | |||
Internet - Internet Content 1.3% | |||||
Yahoo! Inc. (b) | 222,600 | 8,087,058 | |||
Leisure - Gaming/Equipment 1.0% | |||||
Station Casinos, Inc. | 126,100 | 6,103,240 | |||
Leisure - Hotels & Motels 1.6% | |||||
Marriott International, Inc. Class A | 94,000 | 4,688,720 | |||
Starwood Hotels & Resorts Worldwide, Inc. | 116,900 | 5,242,965 | |||
| 9,931,685 | |||||
Machinery - General Industrial 0.5% | |||||
Ingersoll-Rand Company Class A | 48,800 | 3,333,528 | |||
Media - Books 0.4% | |||||
McGraw-Hill, Inc. | 32,700 | 2,503,839 | |||
Media - Radio/TV 1.4% | |||||
The E.W. Scripps Company Class A | 39,100 | 4,105,500 | |||
The Walt Disney Company | 192,200 | 4,899,178 | |||
| 9,004,678 | |||||
Medical - Biomedical/Biotechnology 0.8% | |||||
Biogen Idec, Inc. (b) | 80,300 | 5,078,975 | |||
Medical - Drug/Diversified 1.5% | |||||
Johnson & Johnson | 171,500 | 9,552,550 | |||
Medical - Ethical Drugs 4.7% | |||||
Elan Corporation PLC Sponsored ADR (b) | 128,100 | 3,169,194 | |||
Eli Lilly & Company | 41,600 | 2,908,256 | |||
Merck & Company, Inc. | 135,400 | 6,431,500 | |||
Pfizer, Inc. | 499,600 | 17,126,288 | |||
| 29,635,238 | |||||
Medical - Genetics 0.6% | |||||
Genentech, Inc. (b) | 67,400 | 3,787,880 | |||
Medical - Health Maintenance Organizations 1.0% | |||||
UnitedHealth Group, Inc. | 99,800 | 6,212,550 | |||
Medical - Products 2.5% | |||||
Biomet, Inc. | 69,270 | 3,078,359 | |||
Boston Scientific Corporation (b) | 124,100 | 5,311,480 | |||
St. Jude Medical, Inc. (b) | 32,900 | 2,488,885 | |||
Zimmer Holdings, Inc. (b) | 54,400 | 4,798,080 | |||
| 15,676,804 | |||||
Medical - Wholesale Drugs/Sundries 0.5% | |||||
Cardinal Health, Inc. | 45,700 | 3,201,285 | |||
Medical/Dental - Services 0.8% | |||||
Quest Diagnostics, Inc. | 58,000 | 4,927,100 | |||
Medical/Dental - Supplies 0.5% | |||||
Becton, Dickinson & Company | 56,300 | 2,916,340 | |||
Oil & Gas - Field Services 1.2% | |||||
Schlumberger, Ltd. | 115,500 | 7,335,405 | |||
Oil & Gas - International Integrated 5.7% | |||||
ChevronTexaco Corporation | 82,000 | 7,717,020 | |||
ConocoPhillips | 80,100 | 6,110,829 | |||
Exxon Mobil Corporation | 495,200 | 21,991,832 | |||
| 35,819,681 | |||||
Oil & Gas - Machinery/Equipment 0.6% | |||||
Baker Hughes, Inc. | 104,200 | 3,923,130 | |||
Oil & Gas - United States Exploration & Production 0.5% | |||||
Anadarko Petroleum Corporation | 58,600 | 3,433,960 | |||
Paper & Paper Products 0.9% | |||||
Temple-Inland, Inc. | 83,600 | 5,789,300 | |||
Retail - Clothing/Shoe 0.5% | |||||
The Gap, Inc. | 131,700 | 3,193,725 | |||
Retail - Department Stores 0.4% | |||||
Kohl’s Corporation (b) | 60,800 | 2,570,624 | |||
Retail - Drug Stores 0.6% | |||||
CVS Corporation | 90,900 | 3,819,618 | |||
Retail - Home Furnishings 0.0% | |||||
Design Within Reach, Inc. (b) | 1,200 | 19,716 | |||
16
STRONG GROWTH & INCOME FUND (continued)
| Shares or Principal Amount | Value (Note 2) | ||||
Retail - Major Discount Chains 3.1% | |||||
Target Corporation | 183,300 | $ | 7,784,751 | ||
Wal-Mart Stores, Inc. | 220,300 | 11,623,028 | |||
| 19,407,779 | |||||
Retail/Wholesale - Building Products 1.4% | |||||
The Home Depot, Inc. | 242,900 | 8,550,080 | |||
Retail/Wholesale - Office Supplies 0.6% | |||||
Staples, Inc. | 135,600 | 3,974,436 | |||
Soap & Cleaning Preparations 0.3% | |||||
Clorox Company | 36,500 | 1,962,970 | |||
Telecom - Fiber Optics 0.5% | |||||
Corning, Inc. (b) | 260,100 | 3,396,906 | |||
Telecom - Wireless Equipment 1.0% | |||||
QUALCOMM, Inc. | 88,870 | 6,485,732 | |||
Telecommunications - Equipment 0.4% | |||||
Avaya, Inc. (b) | 40,100 | 633,179 | |||
Lucent Technologies, Inc. (b) | 423,000 | 1,598,940 | |||
| 2,232,119 | |||||
Telecommunications - Services 1.6% | |||||
SBC Communications, Inc. | 195,500 | 4,740,875 | |||
Verizon Communications, Inc. | 142,300 | 5,149,837 | |||
| 9,890,712 | |||||
Transportation - Air Freight 0.3% | |||||
FedEx Corporation | 23,200 | 1,895,208 | |||
Utility - Electric Power 1.2% | |||||
Exelon Corporation | 219,200 | 7,297,168 | |||
Total Common Stocks (Cost $495,474,869) | 628,228,160 | ||||
Short-Term Investments (a) 0.2% | |||||
Collateral Received for Securities Lending 0.0% | |||||
Navigator Prime Portfolio | 21,225 | 21,225 | |||
Repurchase Agreements (e) | |||||
State Street Bank (Dated 6/30/04), 0.75%, Due 7/01/04 (Repurchase proceeds $1,368,929); Collateralized by: United States Government & Agency Issues | 1,368,900 | 1,368,900 | |||
Total Short-Term Investments (Cost $1,390,125) | 1,390,125 | ||||
Total Investments in Securities (Cost $496,864,994) 100.0% | 629,618,285 | ||||
Other Assets and Liabilities, Net 0.0% | 22,979 | ||||
Net Assets 100.0% | $ | 629,641,264 | |||
| Shares or Principal Amount | Value (Note 2) | ||||
Common Stocks 95.7% | |||||
Auto/Truck - Original Equipment 1.4% | |||||
Eaton Corporation | 565,000 | $ | 36,578,100 | ||
Banks - Super Regional 3.4% | |||||
Comerica, Inc. | 555,000 | 30,458,400 | |||
Mellon Financial Corporation | 1,040,000 | 30,503,200 | |||
SouthTrust Corporation | 770,000 | 29,883,700 | |||
| 90,845,300 | |||||
Building - Air Conditioning & Heating Products 1.5% | |||||
American Standard Companies, Inc. (b) | 992,700 | 40,015,737 | |||
Building - Construction Products/Miscellaneous 2.7% | |||||
Masco Corporation | 1,245,000 | 38,819,100 | |||
Mohawk Industries, Inc. (b) | 460,000 | 33,731,800 | |||
| 72,550,900 | |||||
Building Products - Wood 1.2% | |||||
Weyerhaeuser Company | 495,000 | 31,244,400 | |||
Chemicals - Specialty 1.9% | |||||
Praxair, Inc. | 1,300,000 | 51,883,000 | |||
Commercial Services - Advertising 1.1% | |||||
The Interpublic Group of Companies, Inc. (b) (h) | 2,225,000 | 30,549,250 | |||
Computer - Data Storage 1.4% | |||||
Network Appliance, Inc. (b) | 1,695,000 | 36,493,350 | |||
Computer - IT Services 2.7% | |||||
Accenture, Ltd. Class A (b) | 1,150,000 | 31,602,000 | |||
Computer Sciences Corporation (b) | 840,000 | 39,001,200 | |||
| 70,603,200 | |||||
Computer - Manufacturers 1.1% | |||||
Sun Microsystems, Inc. (b) | 6,635,000 | 28,795,900 | |||
Computer - Software Design 2.4% | |||||
Cadence Design Systems, Inc. (b) | 2,250,000 | 32,917,500 | |||
Synopsys, Inc. (b) | 1,130,000 | 32,125,900 | |||
| 65,043,400 | |||||
Computer Software - Financial 1.5% | |||||
DST Systems, Inc. (b) (h) | 825,000 | 39,674,250 | |||
Computer Software - Security 1.8% | |||||
VeriSign, Inc. (b) (h) | 2,425,000 | 48,257,500 | |||
Cosmetics - Personal Care 0.6% | |||||
LIFE TIME FITNESS, Inc. (b) | 4,800 | 100,800 | |||
Weight Watchers International, Inc. (b) | 371,300 | 14,532,682 | |||
| 14,633,482 | |||||
Electronics - Contract Manufacturing 2.4% | |||||
Flextronics International, Ltd. (b) | 2,150,000 | 34,292,500 | |||
Sanmina-SCI Corporation (b) | 3,330,000 | 30,303,000 | |||
| 64,595,500 | |||||
Electronics - Miscellaneous Components 1.7% | |||||
Molex, Inc. Class A | 1,615,000 | �� | 44,057,200 | ||
17
SCHEDULES OF INVESTMENTS IN SECURITIES (continued) | June 30, 2004 (Unaudited) |
STRONG OPPORTUNITY FUND (continued)
| Shares or Principal Amount | Value (Note 2) | ||||
Electronics - Parts Distributors 1.7% | |||||
W.W. Grainger, Inc. | 800,000 | $ | 46,000,000 | ||
Electronics - Scientific Measuring 2.0% | |||||
Waters Corporation (b) | 1,100,000 | 52,558,000 | |||
Electronics - Semiconductor Manufacturing 1.2% | |||||
SanDisk Corporation (b) (h) | 1,454,700 | 31,552,443 | |||
Finance - Consumer/Commercial Loans 1.1% | |||||
CIT Group, Inc. | 795,000 | 30,440,550 | |||
Finance - Index Tracking Fund 1.3% | |||||
iShares Trust S&P SmallCap 600 Index Fund (h) | 230,000 | 33,856,000 | |||
Food - Dairy Products 1.4% | |||||
Dean Foods Company (b) | 1,020,000 | 38,056,200 | |||
Household - Appliances 1.3% | |||||
Whirlpool Corporation (h) | 505,000 | 34,643,000 | |||
Insurance - Diversified 0.7% | |||||
Genworth Financial, Inc. Class A (b) (h) | 870,000 | 19,966,500 | |||
Insurance - Property/Casualty/Title 3.4% | |||||
ACE, Ltd. | 800,000 | 33,824,000 | |||
MGIC Investment Corporation (h) | 255,000 | 19,344,300 | |||
XL Capital, Ltd. Class A | 500,000 | 37,730,000 | |||
| 90,898,300 | |||||
Internet - E*Commerce 1.2% | |||||
InterActiveCorp (b) | 1,030,000 | 31,044,200 | |||
Internet - Internet Content 1.2% | |||||
CNET Networks, Inc. (b) (h) | 2,800,000 | 30,996,000 | |||
Machinery - General Industrial 1.3% | |||||
Dover Corporation | 840,000 | 35,364,000 | |||
Media - Cable TV 4.3% | |||||
Comcast Corporation Class A (Non-Voting) (b) | 1,575,000 | 43,485,750 | |||
Cox Communications, Inc. Class A (b) | 1,240,000 | 34,459,600 | |||
The DIRECTV Group, Inc. (b) | 2,100,000 | 35,910,000 | |||
Telewest Communications PLC (GBP) (b) (i) | 39,540,000 | 636,633 | |||
| 114,491,983 | |||||
Media - Diversified 1.3% | |||||
Time Warner, Inc. (b) | 1,950,000 | 34,281,000 | |||
Media - Newspapers 1.5% | |||||
Tribune Company | 875,000 | 39,847,500 | |||
Media - Radio/TV 3.2% | |||||
The E.W. Scripps Company Class A (h) | 485,000 | 50,925,000 | |||
Liberty Media Corporation Class A (b) | 3,415,000 | 30,700,850 | |||
Liberty Media International, Inc. Class A (b) (h) | 130,000 | 4,823,000 | |||
| 86,448,850 | |||||
Medical - Biomedical/Biotechnology 3.4% | |||||
Biogen Idec, Inc. (b) | 575,000 | 36,368,750 | |||
Genzyme Corporation (b) (h) | 810,000 | 38,337,300 | |||
Protein Design Labs, Inc. (b) | 865,000 | 16,547,450 | |||
| 91,253,500 | |||||
Medical/Dental - Supplies 1.2% | |||||
Apogent Technologies, Inc. (b) | 1,005,000 | 32,160,000 | |||
Metal Ores - Gold/Silver 1.4% | |||||
Barrick Gold Corporation (h) | 1,877,400 | 37,078,650 | |||
Metal Ores - Miscellaneous 0.6% | |||||
The RTZ Corporation PLC (GBP) (i) | 615,000 | 14,903,342 | |||
Metal Products - Fasteners 1.3% | |||||
Illinois Tool Works, Inc. | 350,000 | 33,561,500 | |||
Mining - Gems 0.6% | |||||
BHP Billiton PLC (GBP) (i) | 1,755,000 | 15,369,249 | |||
Office - Equipment & Automation 1.0% | |||||
Canon, Inc. (JPY) (i) | 485,000 | 25,916,592 | |||
Oil & Gas - Drilling 3.0% | |||||
ENSCO International, Inc. (h) | 1,350,000 | 39,285,000 | |||
GlobalSantaFe Corporation | 1,580,000 | 41,870,000 | |||
| 81,155,000 | |||||
Oil & Gas - International Integrated 1.7% | |||||
ConocoPhillips | 585,000 | 44,629,650 | |||
Oil & Gas - Machinery/Equipment 2.1% | |||||
Weatherford International, Ltd. (b) (h) | 1,230,000 | 55,325,400 | |||
Oil & Gas - United States Exploration & Production 3.5% | |||||
Apache Corporation (h) | 1,130,000 | 49,211,500 | |||
Devon Energy Corporation | 665,000 | 43,890,000 | |||
| 93,101,500 | |||||
Pollution Control - Services 1.5% | |||||
Waste Management, Inc. | 1,280,000 | 39,232,000 | |||
Retail - Clothing/Shoes 4.2% | |||||
Abercrombie & Fitch Company Class A | 955,000 | 37,006,250 | |||
Nordstrom, Inc. | 885,000 | 37,709,850 | |||
The TJX Companies, Inc. | 1,515,000 | 36,572,100 | |||
| 111,288,200 | |||||
Retail - Discount & Variety 1.4% | |||||
Dollar Tree Stores, Inc. (b) | 1,385,000 | 37,990,550 | |||
Retail - Home Furnishings 0.0% | |||||
Design Within Reach, Inc. (b) | 4,900 | 80,507 | |||
Retail - Major Discount Chains 1.4% | |||||
Target Corporation | 905,000 | 38,435,350 | |||
Retail - Restaurants 1.4% | |||||
Brinker International, Inc. (b) | 1,085,000 | 37,020,200 | |||
Retail - Super/Mini Markets 1.4% | |||||
Safeway, Inc. (b) (h) | 1,440,000 | 36,489,600 | |||
Retail/Wholesale - Building Products 1.2% | |||||
Lowe’s Companies, Inc. | 615,000 | 32,318,250 | |||
Retail/Wholesale - Office Supplies 1.4% | |||||
Staples, Inc. | 1,235,000 | 36,197,850 | |||
Telecommunications - Services 1.6% | |||||
Sprint Corporation (h) | 2,450,000 | 43,120,000 | |||
18
STRONG OPPORTUNITY FUND (continued)
| Shares or Principal Amount | Value (Note 2) | ||||||
Telecommunications - Wireless Services 1.4% | |||||||
United States Cellular Corporation (b) | 973,900 | $ | 37,543,845 | ||||
Transportation - Airline 1.0% | |||||||
Northwest Airlines Corporation Class A (b) (h) | 2,350,000 | 26,132,000 | |||||
Utility - Gas Distribution 1.1% | |||||||
NiSource, Inc. (h) | 1,480,000 | 30,517,600 | |||||
Total Common Stocks (Cost $ 1,910,110,832) | 2,547,085,330 | ||||||
Short-Term Investments (a) 5.6% | |||||||
Collateral Received for Securities Lending 3.1% | |||||||
Navigator Prime Portfolio | 81,411,672 | 81,411,672 | |||||
Repurchase Agreements (e) 2.5% | |||||||
ABN AMRO Inc. (Dated 6/30/04), 1.40%, Due 7/01/04 (Repurchase proceeds $64,902,524); Collateralized by: United States Government & Agency Issues (e) | $ | 64,900,000 | 64,900,000 | ||||
State Street Bank (Dated 6/30/04), 0.75%, Due 7/01/04 (Repurchase proceeds $3,876,281); Collateralized by: United States Government & Agency Issues (e) | 3,876,200 | 3,876,200 | |||||
Total Short-Term Investments (Cost $150,187,872) | 150,187,872 | ||||||
Total Investments in Securities (Cost $2,060,298,704) 101.3% | 2,697,273,202 | ||||||
Other Assets and Liabilities, Net (1.3%) | (34,329,253 | ) | |||||
Net Assets 100.0% | $ | 2,662,943,949 | |||||
CURRENCY ABBREVIATIONS
GBP — British Pound
JPY — Japanese Yen
LEGEND
| (a) | Short-term investments include any security which has a remaining maturity of less than one year and investments in money market funds. |
| (b) | Non-income producing security. In case of a debt security, generally denotes that the issuer has defaulted on the payment of principle or interest, the issuer has filed for bankruptcy, or the fund has halted accruing income. |
| (c) | All or a portion of security is pledged to cover margin requirements on open futures contracts. |
| (d) | Restricted security. |
| (e) | See Note 2(J) of Notes to Financial Statements. |
| (f) | All or a portion of security is when-issued. |
| (g) | Illiquid security. |
| (h) | All or a portion of security is on loan. See Note 2(K) of Notes to Financial Statements. |
| (i) | Security trades in foreign currency and is converted to U.S. dollars daily using current exchange rates. |
Percentages are stated as a percent of net assets.
See Notes to Financial Statements.
19
STATEMENTS OF ASSETS AND LIABILITIES
June 30, 2004 (Unaudited)
| (In Thousands, Except Per Share Amounts) | ||||||||
Strong Balanced Fund | Strong Large Cap Core Fund | |||||||
Assets: | ||||||||
Investments in Securities, at Value (Cost of $167,887, and $3,288, respectively) | $ | 178,643 | $ | 3,860 | ||||
Receivable for Securities Sold | 1,086 | — | ||||||
Receivable for Fund Shares Sold | 3 | — | ||||||
Dividends and Interest Receivable | 692 | 1 | ||||||
Other Assets | 38 | 13 | ||||||
Total Assets | 180,462 | 3,874 | ||||||
Liabilities: | ||||||||
Payable for Securities Purchased | 2,260 | 3 | ||||||
Payable for Fund Shares Redeemed | 76 | 1 | ||||||
Variation Margin Payable | 16 | — | ||||||
Payable Upon Return of Securities on Loan | 18,182 | — | ||||||
Accrued Operating Expenses and Other Liabilities | 70 | 8 | ||||||
Total Liabilities | 20,604 | 12 | ||||||
Net Assets | $ | 159,858 | $ | 3,862 | ||||
Net Assets Consist of: | ||||||||
Capital Stock (Par Value and Paid-in Capital) | $ | 170,696 | $ | 4,294 | ||||
Undistributed Net Investment Income (Loss) | 19 | (12 | ) | |||||
Undistributed Net Realized Gain (Loss) | (21,598 | ) | (993 | ) | ||||
Net Unrealized Appreciation (Depreciation) | 10,741 | 573 | ||||||
Net Assets | $ | 159,858 | $ | 3,862 | ||||
Capital Shares Outstanding (Unlimited Number Authorized) | 8,503 | 376 | ||||||
Net Asset Value Per Share | $ | 18.80 | $ | 10.27 | ||||
See Notes to Financial Statements.
20
STATEMENTS OF ASSETS AND LIABILITIES (continued)
June 30, 2004 (Unaudited)
| (In Thousands, Except As Noted) | ||||
| Strong Growth and Income Fund | ||||
Assets: | ||||
Investments in Securities, at Value (Cost of $496,865) | $ | 629,618 | ||
Receivable for Securities Sold | 6,391 | |||
Receivable for Fund Shares Sold | 3 | |||
Dividends and Interest Receivable | 474 | |||
Other Assets | 98 | |||
Total Assets | 636,584 | |||
Liabilities: | ||||
Payable for Securities Purchased | 6,453 | |||
Payable for Fund Shares Redeemed | 197 | |||
Payable Upon Return of Securities on Loan | 21 | |||
Accrued Operating Expenses and Other Liabilities | 272 | |||
Total Liabilities | 6,943 | |||
Net Assets | $ | 629,641 | ||
Net Assets Consist of: | ||||
Capital Stock (Par Value and Paid-in Capital) | $ | 692,987 | ||
Undistributed Net Investment Income (Loss) | 92 | |||
Undistributed Net Realized Gain (Loss) | (196,191 | ) | ||
Net Unrealized Appreciation (Depreciation) | 132,753 | |||
Net Assets | $ | 629,641 | ||
Investor Class ($ and shares in full) | ||||
Net Assets | $ | 520,835,732 | ||
Capital Shares Outstanding (Unlimited Number Authorized) | 25,852,893 | |||
Net Asset Value Per Share | $ | 20.15 | ||
Institutional Class ($ and shares in full) | ||||
Net Assets | $ | 70,125,086 | ||
Capital Shares Outstanding (Unlimited Number Authorized) | 3,469,682 | |||
Net Asset Value Per Share | $ | 20.21 | ||
Advisor Class ($ and shares in full) | ||||
Net Assets | $ | 6,626,538 | ||
Capital Shares Outstanding (Unlimited Number Authorized) | 330,786 | |||
Net Asset Value Per Share | $ | 20.03 | ||
Class K ($ and shares in full) | ||||
Net Assets | $ | 32,053,908 | ||
Capital Shares Outstanding (Unlimited Number Authorized) | 1,603,358 | |||
Net Asset Value Per Share | $ | 19.99 | ||
See Notes to Financial Statements.
21
STATEMENTS OF ASSETS AND LIABILITIES (continued)
June 30, 2004 (Unaudited)
| (In Thousands, Except As Noted) | ||||
| Strong Opportunity Fund | ||||
Assets: | ||||
Investments in Securities, at Value (Cost of $2,060,299) | $ | 2,697,273 | ||
Receivable for Securities Sold | 48,912 | |||
Receivable for Fund Shares Sold | 1,142 | |||
Dividends and Interest Receivable | 841 | |||
Other Assets | 491 | |||
Total Assets | 2,748,659 | |||
Liabilities: | ||||
Payable for Securities Purchased | 2,636 | |||
Payable for Fund Shares Redeemed | 778 | |||
Payable Upon Return of Securities on Loan | 81,412 | |||
Accrued Operating Expenses and Other Liabilities | 889 | |||
Total Liabilities | 85,715 | |||
Net Assets | $ | 2,662,944 | ||
Net Assets Consist of: | ||||
Capital Stock (Par Value and Paid-in Capital) | $ | 2,257,022 | ||
Undistributed Net Investment Income (Loss) | (7,787 | ) | ||
Undistributed Net Realized Gain (Loss) | (223,265 | ) | ||
Net Unrealized Appreciation (Depreciation) | 636,974 | |||
Net Assets | $ | 2,662,944 | ||
Investor Class ($ and shares in full) | ||||
Net Assets | $ | 2,524,195,303 | ||
Capital Shares Outstanding (Unlimited Number Authorized) | 59,175,756 | |||
Net Asset Value Per Share | $ | 42.66 | ||
Advisor Class ($ and shares in full) | ||||
Net Assets | $ | 137,185,574 | ||
Capital Shares Outstanding (Unlimited Number Authorized) | 3,261,233 | |||
Net Asset Value Per Share | $ | 42.07 | ||
Class K ($ and shares in full) | ||||
Net Assets | $ | 1,563,072 | ||
Capital Shares Outstanding (Unlimited Number Authorized) | 36,489 | |||
Net Asset Value Per Share | $ | 42.84 | ||
See Notes to Financial Statements.
22
For the Six Months Ended June 30, 2004 (Unaudited)
| (In Thousands) | ||||||||
| Strong Balanced Fund | Strong Large Cap Core Fund | |||||||
Income: | ||||||||
Dividends (net of foreign withholding taxes of $4 and $0, respectively) | $ | 838 | $ | 22 | ||||
Interest | 1,185 | 1 | ||||||
Total Income | 2,023 | 23 | ||||||
Expenses: | ||||||||
Investment Advisory Fees | 495 | 14 | ||||||
Administrative Fees | 268 | 6 | ||||||
Custodian Fees | 13 | 1 | ||||||
Shareholder Servicing Costs | 279 | 14 | ||||||
Reports to Shareholders | 49 | 7 | ||||||
Professional Fees | 24 | 6 | ||||||
Federal and State Registration Fees | 15 | 8 | ||||||
Other | 19 | 1 | ||||||
Total Expenses before Expense Offsets | 1,162 | 57 | ||||||
Expense Offsets (Note 4) | (25 | ) | (22 | ) | ||||
Expenses, Net | 1,137 | 35 | ||||||
Net Investment Income (Loss) | 886 | (12 | ) | |||||
Realized and Unrealized Gain (Loss): | ||||||||
Net Realized Gain (Loss) on: | ||||||||
Investments | 11,840 | 371 | ||||||
Futures Contracts | 8 | — | ||||||
Net Realized Gain (Loss): | 11,848 | 371 | ||||||
Net Change in Unrealized Appreciation/(Depreciation) on: | ||||||||
Investments | (9,766 | ) | (253 | ) | ||||
Futures Contracts | (18 | ) | — | |||||
Net Change in Unrealized Appreciation/Depreciation | (9,784 | ) | (253 | ) | ||||
Net Gain (Loss) on Investments | 2,064 | 118 | ||||||
Net Increase (Decrease) in Net Assets Resulting from Operations | $ | 2,950 | $ | 106 | ||||
See Notes to Financial Statements.
23
STATEMENTS OF OPERATIONS (continued)
For the Six Months Ended June 30, 2004 (Unaudited)
| (In Thousands) | ||||
| Strong Growth and Income Fund | ||||
Income: | ||||
Dividends (net of foreign withholding taxes of $11) | $ | 4,797 | ||
Interest | 22 | |||
Total Income | 4,819 | |||
Expenses (Note 4): | ||||
Investment Advisory Fees | 1,866 | |||
Administrative Fees | 903 | |||
Custodian Fees | 25 | |||
Shareholder Servicing Costs | 1,263 | |||
12b-1 Fees | 9 | |||
Reports to Shareholders | 247 | |||
Other | 155 | |||
Total Expenses before Expense Offsets | 4,468 | |||
Expense Offsets | (102 | ) | ||
Expenses, Net | 4,366 | |||
Net Investment Income (Loss) | 453 | |||
Realized and Unrealized Gain (Loss): | ||||
Net Realized Gain (Loss) on Investments | 61,407 | |||
Net Change in Unrealized Appreciation/Depreciation on Investments | (46,588 | ) | ||
Net Gain (Loss) on Investments | 14,819 | |||
Net Increase (Decrease) in Net Assets Resulting from Operations | $ | 15,272 | ||
See Notes to Financial Statements.
24
STATEMENTS OF OPERATIONS (continued)
For the Six Months Ended June 30, 2004 (Unaudited)
| (In Thousands) | ||||
Strong Opportunity Fund | ||||
Income: | ||||
Dividends (net of foreign withholding taxes of $31) | $ | 10,287 | ||
Interest | 612 | |||
Total Income | 10,899 | |||
Expenses (Note 4): | ||||
Investment Advisory Fees | 10,120 | |||
Administrative Fees | 4,048 | |||
Custodian Fees | 80 | |||
Shareholder Servicing Costs | 3,646 | |||
12b-1 Fees | 171 | |||
Other | 1,036 | |||
Total Expenses before Expense Offsets | 19,101 | |||
Expense Offsets | (415 | ) | ||
Expenses, Net | 18,686 | |||
Net Investment Income (Loss) | (7,787 | ) | ||
Realized and Unrealized Gain (Loss): | ||||
Net Realized Gain (Loss) on: | ||||
Investments | 236,098 | |||
Foreign Currencies | 4 | |||
Net Realized Gain (Loss) | 236,102 | |||
Net Change in Unrealized Appreciation/Depreciation on: | ||||
Investments | (12,110 | ) | ||
Foreign Currencies | (1 | ) | ||
Net Change in Unrealized Appreciation/Depreciation | (12,111 | ) | ||
Net Gain (Loss) on Investments | 223,991 | |||
Net Increase (Decrease) in Net Assets Resulting from Operations | $ | 216,204 | ||
See Notes to Financial Statements.
25
STATEMENTS OF CHANGES IN NET ASSETS
| (In Thousands) | ||||||||
| Strong Balanced Fund | ||||||||
Six Months Ended June 30, 2004 | Year Ended Dec. 31, 2003 | |||||||
| (Unaudited) | ||||||||
Operations: | ||||||||
Net Investment Income (Loss) | $ | 886 | $ | 2,364 | ||||
Net Realized Gain (Loss) | 11,848 | 17,341 | ||||||
Net Change in Unrealized Appreciation/Depreciation | (9,784 | ) | 15,228 | |||||
Net Increase (Decrease) in Net Assets Resulting from Operations | 2,950 | 34,933 | ||||||
Distributions From Net Investment Income | (867 | ) | (2,605 | ) | ||||
Capital Share Transactions (Note 8): | ||||||||
Net Increase (Decrease) in Net Assets from Capital Share Transactions | (51,180 | ) | (41,388 | ) | ||||
Total Increase (Decrease) in Net Assets | (49,097 | ) | (9,060 | ) | ||||
Net Assets: | ||||||||
Beginning of Period | 208,955 | 218,015 | ||||||
End of Period | $ | 159,858 | $ | 208,955 | ||||
Undistributed Net Investment Income (Loss) | $ | 19 | $ | — | ||||
| Strong Large Cap Core Fund | ||||||||
Six Months Ended June 30, 2004 | Year Ended Dec. 31, 2003 | |||||||
| (Unaudited) | ||||||||
Operations: | ||||||||
Net Investment Income (Loss) | $ | (12 | ) | $ | — | |||
Net Realized Gain (Loss) | 371 | (336 | ) | |||||
Net Change in Unrealized Appreciation/Depreciation | (253 | ) | 1,205 | |||||
Net Increase (Decrease) in Net Assets Resulting from Operations | 106 | 869 | ||||||
Capital Share Transactions (Note 8): | ||||||||
Net Increase (Decrease) in Net Assets from Capital Share Transactions | (298 | ) | (1,086 | ) | ||||
Total Increase (Decrease) in Net Assets | (192 | ) | (217 | ) | ||||
Net Assets: | ||||||||
Beginning of Period | 4,054 | 4,271 | ||||||
End of Period | $ | 3,862 | $ | 4,054 | ||||
Undistributed Net Investment Income (Loss) | $ | (12 | ) | $ | — | |||
See Notes to Financial Statements.
26
STATEMENTS OF CHANGES IN NET ASSETS (continued)
| (In Thousands) | ||||||||
| Strong Growth and Income Fund | ||||||||
Six Months Ended June 30, 2004 | Year Ended Dec. 31, 2003 | |||||||
| (Unaudited) | ||||||||
Operations: | ||||||||
Net Investment Income (Loss) | $ | 453 | $ | 2,534 | ||||
Net Realized Gain (Loss) | 61,407 | 18,558 | ||||||
Net Change in Unrealized Appreciation/Depreciation | (46,588 | ) | 142,318 | |||||
Net Increase (Decrease) in Net Assets Resulting from Operations | 15,272 | 163,410 | ||||||
Distributions: | ||||||||
From Net Investment Income: | ||||||||
Investor Class | (333 | ) | (1,427 | ) | ||||
Institutional Class | (239 | ) | (858 | ) | ||||
Advisor Class | (6 | ) | (23 | ) | ||||
Class K | (62 | ) | (214 | ) | ||||
Total Distributions | (640 | ) | (2,522 | ) | ||||
Capital Share Transactions (Note 8): | ||||||||
Net Increase (Decrease) in Net Assets from Capital Share Transactions | (139,979 | ) | (84,622 | ) | ||||
Total Increase (Decrease) in Net Assets | (125,347 | ) | 76,266 | |||||
Net Assets: | ||||||||
Beginning of Period | 754,988 | 678,722 | ||||||
End of Period | $ | 629,641 | $ | 754,988 | ||||
Undistributed Net Investment Income (Loss) | $ | 92 | $ | 279 | ||||
| Strong Opportunity Fund | ||||||||
Six Months Ended June 30, 2004 | Year Ended Dec. 31, 2003 | |||||||
| (Unaudited) | ||||||||
Operations: | ||||||||
Net Investment Income (Loss) | $ | (7,787 | ) | $ | (12,170 | ) | ||
Net Realized Gain (Loss) | 236,102 | (1,598 | ) | |||||
Net Change in Unrealized Appreciation/Depreciation | (12,111 | ) | 908,575 | |||||
Net Increase (Decrease) in Net Assets Resulting from Operations | 216,204 | 894,807 | ||||||
Capital Share Transactions (Note 8): | ||||||||
Net Increase (Decrease) in Net Assets from Capital Share Transactions | (403,357 | ) | (656,258 | ) | ||||
Total Increase (Decrease) in Net Assets | (187,153 | ) | 238,549 | |||||
Net Assets: | ||||||||
Beginning of Period | 2,850,097 | 2,611,548 | ||||||
End of Period | $ | 2,662,944 | $ | 2,850,097 | ||||
Undistributed Net Investment Income (Loss) | $ | (7,787 | ) | $ | — | |||
See Notes to Financial Statements.
27
STRONG BALANCED FUND
| Period Ended | ||||||||||||||||||||||||||||
| June 30, 2004(b) | Dec. 31, 2003 | Dec. 31, 2002 | Dec. 31, 2001 | Dec. 31, 2000(c) | Oct. 31, 2000 | Oct. 31, 1999 | ||||||||||||||||||||||
Selected Per-Share Data(a) | ||||||||||||||||||||||||||||
Net Asset Value, Beginning of Period | $ | 18.62 | $ | 16.06 | $ | 18.84 | $ | 21.83 | $ | 24.77 | $ | 24.92 | $ | 21.14 | ||||||||||||||
Income From Investment Operations: | ||||||||||||||||||||||||||||
Net Investment Income (Loss) | 0.10 | 0.19 | 0.40 | 0.58 | 0.12 | 0.82 | 0.71 | |||||||||||||||||||||
Net Realized and Unrealized Gains (Losses) on Investments | 0.18 | 2.58 | (2.77 | ) | (2.99 | ) | (1.53 | ) | 0.61 | 3.75 | ||||||||||||||||||
Total from Investment Operations | 0.28 | 2.77 | (2.37 | ) | (2.41 | ) | (1.41 | ) | 1.43 | 4.46 | ||||||||||||||||||
Less Distributions: | ||||||||||||||||||||||||||||
From Net Investment Income | (0.10 | ) | (0.21 | ) | (0.41 | ) | (0.58 | ) | (0.20 | ) | (0.83 | ) | (0.68 | ) | ||||||||||||||
From Net Realized Gains | — | — | — | — | (1.33 | ) | (0.75 | ) | — | |||||||||||||||||||
Total Distributions | (0.10 | ) | (0.21 | ) | (0.41 | ) | (0.58 | ) | (1.53 | ) | (1.58 | ) | (0.68 | ) | ||||||||||||||
Net Asset Value, End of Period | $ | 18.80 | $ | 18.62 | $ | 16.06 | $ | 18.84 | $ | 21.83 | $ | 24.77 | $ | 24.92 | ||||||||||||||
Ratios and Supplemental Data | ||||||||||||||||||||||||||||
Total Return | +1.49 | % | +17.36 | % | –12.65 | % | –11.03 | % | –5.60 | % | +5.66 | % | +21.26 | % | ||||||||||||||
Net Assets, End of Period (In Millions) | $ | 160 | $ | 209 | $ | 218 | $ | 300 | $ | 347 | $ | 372 | $ | 344 | ||||||||||||||
Ratio of Expenses to Average Net Assets before Expense Offsets | 1.3 | %* | 1.3 | % | 1.3 | % | 1.2 | % | 1.1 | %* | 1.1 | % | 1.1 | % | ||||||||||||||
Ratio of Expenses to Average Net Assets | 1.3 | %* | 1.3 | % | 1.3 | % | 1.2 | % | 1.1 | %* | 1.1 | % | 1.1 | % | ||||||||||||||
Ratio of Net Investment Income (Loss) to Average Net Assets | 1.0 | %* | 1.1 | % | 2.3 | % | 2.9 | % | 3.3 | %* | 3.2 | % | 3.0 | % | ||||||||||||||
Portfolio Turnover Rate | 80.2 | % | 204.7 | % | 225.5 | % | 234.1 | % | 45.1 | % | 150.9 | % | 64.7 | % | ||||||||||||||
STRONG LARGE CAP CORE FUND
| Period Ended | ||||||||||||||||||||||||
| June 30, 2004(b) | Dec. 31, 2003 | Dec. 31, 2002 | Dec. 31, 2001 | Dec. 31, 2000 | Dec. 31, 1999 | |||||||||||||||||||
Selected Per-Share Data(a) | ||||||||||||||||||||||||
Net Asset Value, Beginning of Period | $ | 10.01 | $ | 8.05 | $ | 11.01 | $ | 12.40 | $ | 13.85 | $ | 11.25 | ||||||||||||
Income From Investment Operations: | ||||||||||||||||||||||||
Net Investment Income (Loss) | (0.03 | ) | — | (0.08 | ) | (0.10 | ) | (0.09 | ) | (0.11 | ) | |||||||||||||
Net Realized and Unrealized Gains (Losses) on Investments | 0.29 | 1.96 | (2.88 | ) | (1.29 | ) | (1.19 | ) | 3.41 | |||||||||||||||
Total from Investment Operations | 0.26 | 1.96 | (2.96 | ) | (1.39 | ) | (1.28 | ) | 3.30 | |||||||||||||||
Less Distributions: | ||||||||||||||||||||||||
From Net Realized Gains | — | — | — | — | (0.17 | ) | (0.70 | ) | ||||||||||||||||
Total Distributions | — | — | — | — | (0.17 | ) | (0.70 | ) | ||||||||||||||||
Net Asset Value, End of Period | $ | 10.27 | $ | 10.01 | $ | 8.05 | $ | 11.01 | $ | 12.40 | $ | 13.85 | ||||||||||||
Ratios and Supplemental Data | ||||||||||||||||||||||||
Total Return | +2.60 | % | +24.35 | % | –26.88 | % | –11.21 | % | –9.19 | % | +29.36 | % | ||||||||||||
Net Assets, End of Period (In Millions) | $ | 4 | $ | 4 | $ | 4 | $ | 6 | $ | 6 | $ | 5 | ||||||||||||
Ratio of Expenses to Average Net Assets before Expense Offsets | 3.0 | %* | 3.0 | % | 2.5 | % | 2.7 | % | 2.0 | % | 2.0 | % | ||||||||||||
Ratio of Expenses to Average Net Assets | 1.8 | %* | 1.7 | % | 1.8 | % | 2.0 | % | 2.0 | % | 2.0 | % | ||||||||||||
Ratio of Net Investment Income (Loss) to Average Net Assets | (0.6 | )%* | (0.0 | )%(d) | (0.9 | )% | (1.1 | )% | (0.8 | )% | (1.1 | )% | ||||||||||||
Portfolio Turnover Rate | 98.4 | % | 105.5 | % | 269.3 | % | 196.4 | % | 154.9 | % | 178.4 | % | ||||||||||||
| * | Calculated on an annualized basis. |
| (a) | Information presented relates to a share of capital stock of the Fund outstanding for the entire period. |
| (b) | For the six months ended June 30, 2004 (Unaudited). |
| (c) | In 2000, the Fund changed its fiscal year-end from October to December. |
| (d) | Amount calculated is less than 0.05%. |
See Notes to Financial Statements.
28
FINANCIAL HIGHLIGHTS (continued)
STRONG GROWTH AND INCOME FUND — INVESTOR CLASS
| Period Ended | ||||||||||||||||||||||||||||
| June 30, 2004(b) | Dec. 31, 2003 | Dec. 31, 2002 | Dec. 31, 2001 | Dec. 31, 2000(c) | Oct. 31, 2000 | Oct. 31, 1999 | ||||||||||||||||||||||
Selected Per-Share Data(a) | ||||||||||||||||||||||||||||
Net Asset Value, Beginning of Period | $ | 19.68 | $ | 15.85 | $ | 20.28 | $ | 25.37 | $ | 28.34 | $ | 25.26 | $ | 18.73 | ||||||||||||||
Income From Investment Operations: | ||||||||||||||||||||||||||||
Net Investment Income (Loss) | 0.00 | (e) | 0.04 | (d) | 0.02 | (0.02 | ) | (0.00 | )(e) | (0.09 | ) | (0.03 | ) | |||||||||||||||
Net Realized and Unrealized Gains (Losses) on Investments | 0.48 | 3.83 | (4.45 | ) | (5.07 | ) | (2.65 | ) | 3.19 | 6.56 | ||||||||||||||||||
Total from Investment Operations | 0.48 | 3.87 | (4.43 | ) | (5.09 | ) | (2.65 | ) | 3.10 | 6.53 | ||||||||||||||||||
Less Distributions: | ||||||||||||||||||||||||||||
From Net Investment Income | (0.01 | ) | (0.04 | ) | (0.00 | )(e) | — | — | — | (0.00 | )(e) | |||||||||||||||||
From Net Realized Gains | — | — | — | — | (0.32 | ) | (0.02 | ) | — | |||||||||||||||||||
Total Distributions | (0.01 | ) | (0.04 | ) | (0.00 | )(e) | — | (0.32 | ) | (0.02 | ) | (0.00 | )(e) | |||||||||||||||
Net Asset Value, End of Period | $ | 20.15 | $ | 19.68 | $ | 15.85 | $ | 20.28 | $ | 25.37 | $ | 28.34 | $ | 25.26 | ||||||||||||||
Ratios and Supplemental Data | ||||||||||||||||||||||||||||
Total Return | +2.45 | % | +24.44 | % | –21.83 | % | –20.06 | % | –9.33 | % | +12.29 | % | +34.88 | % | ||||||||||||||
Net Assets, End of Period (In Millions) | $ | 521 | $ | 633 | $ | 582 | $ | 886 | $ | 1,109 | $ | 1,228 | $ | 861 | ||||||||||||||
Ratio of Expenses to Average Net Assets before Expense Offsets | 1.4 | %* | 1.4 | % | 1.4 | % | 1.3 | % | 1.1 | %* | 1.1 | % | 1.1 | % | ||||||||||||||
Ratio of Expenses to Average Net Assets | 1.4 | %* | 1.4 | % | 1.4 | % | 1.3 | % | 1.1 | %* | 1.1 | % | 1.1 | % | ||||||||||||||
Ratio of Net Investment Income (Loss) to Average Net Assets | 0.0 | %* | 0.2 | % | 0.1 | % | (0.1 | )% | (0.0 | )%*(e) | (0.4 | )% | (0.1 | )% | ||||||||||||||
Portfolio Turnover Rate(g) | 72.3 | % | 199.4 | % | 187.8 | % | 171.9 | % | 23.3 | % | 122.0 | % | 52.3 | % | ||||||||||||||
STRONG GROWTH AND INCOME FUND — INSTITUTIONAL CLASS
| Period Ended | ||||||||||||||||||||||||
| June 30, 2004(b) | Dec. 31, 2003 | Dec. 31, 2002 | Dec. 31, 2001 | Dec. 31, 2000(c) | Oct. 31, 2000(f) | |||||||||||||||||||
Selected Per-Share Data(a) | ||||||||||||||||||||||||
Net Asset Value, Beginning of Period | $ | 19.72 | $ | 15.92 | $ | 20.49 | $ | 25.46 | $ | 28.41 | $ | 29.15 | ||||||||||||
Income From Investment Operations: | ||||||||||||||||||||||||
Net Investment Income (Loss) | 0.07 | 0.16 | (d) | 0.15 | 0.08 | (0.00 | )(e) | 0.01 | ||||||||||||||||
Net Realized and Unrealized Gains (Losses) on Investments | 0.48 | 3.83 | (4.49 | ) | (5.05 | ) | (2.63 | ) | (0.75 | ) | ||||||||||||||
Total from Investment Operations | 0.55 | 3.99 | (4.34 | ) | (4.97 | ) | (2.63 | ) | (0.74 | ) | ||||||||||||||
Less Distributions: | ||||||||||||||||||||||||
From Net Investment Income | (0.06 | ) | (0.19 | ) | (0.23 | ) | — | — | — | |||||||||||||||
From Net Realized Gains | — | — | — | — | (0.32 | ) | — | |||||||||||||||||
Total Distributions | (0.06 | ) | (0.19 | ) | (0.23 | ) | — | (0.32 | ) | — | ||||||||||||||
Net Asset Value, End of Period | $ | 20.21 | $ | 19.72 | $ | 15.92 | $ | 20.49 | $ | 25.46 | $ | 28.41 | ||||||||||||
Ratios and Supplemental Data | ||||||||||||||||||||||||
Total Return | +2.81 | % | +25.26 | % | –21.22 | % | –19.52 | % | –9.24 | % | –2.54 | % | ||||||||||||
Net Assets, End of Period (In Millions) | $ | 70 | $ | 84 | $ | 67 | $ | 47 | $ | 31 | $ | 1 | ||||||||||||
Ratio of Expenses to Average Net Assets before Expense Offsets | 0.7 | %* | 0.7 | % | 0.7 | % | 0.6 | % | 0.6 | %* | 0.6 | %* | ||||||||||||
Ratio of Expenses to Average Net Assets | 0.7 | %* | 0.7 | % | 0.7 | % | 0.6 | % | 0.6 | %* | 0.6 | %* | ||||||||||||
Ratio of Net Investment Income (Loss) to Average Net Assets | 0.7 | %* | 0.9 | % | 0.9 | % | 0.6 | % | 0.1 | %* | 0.1 | %* | ||||||||||||
Portfolio Turnover Rate(g) | 72.3 | % | 199.4 | % | 187.8 | % | 171.9 | % | 23.3 | % | 122.0 | % | ||||||||||||
| * | Calculated on an annualized basis. |
| (a) | Information presented relates to a share of capital stock of the Fund outstanding for the entire period. |
| (b) | For the six months ended June 30, 2004 (Unaudited). |
| (c) | In 2000, the Fund changed its fiscal year-end from October to December. |
| (d) | Net investment income per share represents net investment income divided by the average shares outstanding throughout the year. |
| (e) | Amount calculated is less than $0.005 or 0.05%. |
| (f) | For the period from February 29, 2000 (commencement of class) to October 31, 2000. |
| (g) | Calculated on the basis of the Fund as a whole without distinguishing between the classes of shares issued. |
See Notes to Financial Statements.
29
FINANCIAL HIGHLIGHTS (continued)
STRONG GROWTH AND INCOME FUND — ADVISOR CLASS
| Period Ended | ||||||||||||||||||||||||
| June 30, 2004(b) | Dec. 31, 2003 | Dec. 31, 2002 | Dec. 31, 2001 | Dec. 31, 2000(c) | Oct. 31, 2000(d) | |||||||||||||||||||
Selected Per-Share Data(a) | ||||||||||||||||||||||||
Net Asset Value, Beginning of Period | $ | 19.57 | $ | 15.77 | $ | 20.20 | $ | 25.32 | $ | 28.29 | $ | 29.15 | ||||||||||||
Income From Investment Operations: | ||||||||||||||||||||||||
Net Investment Income (Loss) | 0.01 | 0.05 | (e) | 0.04 | (0.04 | ) | (0.00 | )(f) | (0.05 | ) | ||||||||||||||
Net Realized and Unrealized Gains (Losses) on Investments | 0.47 | 3.80 | (4.41 | ) | (5.08 | ) | (2.65 | ) | (0.81 | ) | ||||||||||||||
Total from Investment Operations | 0.48 | 3.85 | (4.37 | ) | (5.12 | ) | (2.65 | ) | (0.86 | ) | ||||||||||||||
Less Distributions: | ||||||||||||||||||||||||
From Net Investment Income | (0.02 | ) | (0.05 | ) | (0.06 | ) | — | — | — | |||||||||||||||
From Net Realized Gains | — | — | — | — | (0.32 | ) | — | |||||||||||||||||
Total Distributions | (0.02 | ) | (0.05 | ) | (0.06 | ) | — | (0.32 | ) | — | ||||||||||||||
Net Asset Value, End of Period | $ | 20.03 | $ | 19.57 | $ | 15.77 | $ | 20.20 | $ | 25.32 | $ | 28.29 | ||||||||||||
Ratios and Supplemental Data | ||||||||||||||||||||||||
Total Return | +2.44 | % | +24.42 | % | –21.67 | % | –20.22 | % | –9.35 | % | –2.95 | % | ||||||||||||
Net Assets, End of Period (In Millions) | $ | 7 | $ | 9 | $ | 10 | $ | 14 | $ | 5 | $ | 0 | (g) | |||||||||||
Ratio of Expenses to Average Net Assets before Expense Offsets | 1.4 | %* | 1.4 | % | 1.3 | % | 1.5 | % | 1.3 | %* | 1.3 | %* | ||||||||||||
Ratio of Expenses to Average Net Assets | 1.4 | %* | 1.3 | % | 1.3 | % | 1.5 | % | 1.3 | %* | 1.3 | %* | ||||||||||||
Ratio of Net Investment Income (Loss) to Average Net Assets | 0.0 | %* | 0.3 | % | 0.2 | % | (0.3 | )% | (0.2 | )%* | (0.7 | )%* | ||||||||||||
Portfolio Turnover Rate(h) | 72.3 | % | 199.4 | % | 187.8 | % | 171.9 | % | 23.3 | % | 122.0 | % | ||||||||||||
STRONG GROWTH AND INCOME FUND — CLASS K
| Period Ended | ||||||||||||
| June 30, 2004(b) | Dec. 31, 2003 | Dec. 31, 2002 | ||||||||||
Selected Per-Share Data(a) | ||||||||||||
Net Asset Value, Beginning of Period | $ | 19.52 | $ | 15.75 | $ | 20.28 | ||||||
Income From Investment Operations: | ||||||||||||
Net Investment Income (Loss) | 0.05 | 0.11 | (e) | 0.11 | ||||||||
Net Realized and Unrealized Gains (Losses) on Investments | 0.46 | 3.79 | (4.46 | ) | ||||||||
Total from Investment Operations | 0.51 | 3.90 | (4.35 | ) | ||||||||
Less Distributions: | ||||||||||||
From Net Investment Income | (0.04 | ) | (0.13 | ) | (0.18 | ) | ||||||
From Net Realized Gains | — | — | — | |||||||||
Total Distributions | (0.04 | ) | (0.13 | ) | (0.18 | ) | ||||||
Net Asset Value, End of Period | $ | 19.99 | $ | 19.52 | $ | 15.75 | ||||||
Ratios and Supplemental Data | ||||||||||||
Total Return | +2.63 | % | +24.90 | % | –21.47 | % | ||||||
Net Assets, End of Period (In Millions) | $ | 32 | $ | 30 | $ | 19 | ||||||
Ratio of Expenses to Average Net Assets before Expense Offsets | 1.1 | %* | 1.1 | % | 1.1 | % | ||||||
Ratio of Expenses to Average Net Assets | 1.0 | %* | 1.0 | % | 1.0 | % | ||||||
Ratio of Net Investment Income (Loss) to Average Net Assets | 0.4 | %* | 0.6 | % | 0.7 | % | ||||||
Portfolio Turnover Rate(h) | 72.3 | % | 199.4 | % | 187.8 | % | ||||||
| * | Calculated on an annualized basis. |
| (a) | Information presented relates to a share of capital stock of the Fund outstanding for the entire period. |
| (b) | For the six months ended June 30, 2004 (Unaudited). |
| (c) | In 2000, the Fund changed its fiscal year-end from October to December. |
| (d) | For the period from February 29, 2000 (commencement of class) to October 31, 2000. |
| (e) | Net investment income per share represents net investment income divided by the average shares outstanding throughout the year. |
| (f) | Amount calculated is less than $0.005. |
| (g) | Amount is less than $500,000. |
| (h) | Calculated on the basis of the Fund as a whole without distinguishing between the classes of shares issued. |
See Notes to Financial Statements.
30
FINANCIAL HIGHLIGHTS (continued)
STRONG OPPORTUNITY FUND — INVESTOR CLASS
| Period Ended | ||||||||||||||||||||||||
| June 30, 2004(b) | Dec. 31, 2003 | Dec. 31, 2002 | Dec. 31, 2001 | Dec. 31, 2000 | Dec. 31, 1999 | |||||||||||||||||||
Selected Per-Share Data(a) | ||||||||||||||||||||||||
Net Asset Value, Beginning of Period | $ | 39.45 | $ | 28.70 | $ | 39.29 | $ | 42.35 | $ | 44.69 | $ | 38.62 | ||||||||||||
Income From Investment Operations: | ||||||||||||||||||||||||
Net Investment Income (Loss) | (0.12 | ) | (0.14 | )(c) | (0.08 | ) | 0.07 | 0.17 | 0.08 | |||||||||||||||
Net Realized and Unrealized Gains (Losses) on Investments | 3.33 | 10.89 | (10.51 | ) | (2.11 | ) | 3.30 | 12.42 | ||||||||||||||||
Total from Investment Operations | 3.21 | 10.75 | (10.59 | ) | (2.04 | ) | 3.47 | 12.50 | ||||||||||||||||
Less Distributions: | ||||||||||||||||||||||||
From Net Investment Income | — | — | — | (0.07 | ) | (0.17 | ) | (0.08 | ) | |||||||||||||||
From Net Realized Gains | — | — | — | (0.95 | ) | (5.64 | ) | (6.35 | ) | |||||||||||||||
Total Distributions | — | — | — | (1.02 | ) | (5.81 | ) | (6.43 | ) | |||||||||||||||
Net Asset Value, End of Period | $ | 42.66 | $ | 39.45 | $ | 28.70 | $ | 39.29 | $ | 42.35 | $ | 44.69 | ||||||||||||
Ratios and Supplemental Data | ||||||||||||||||||||||||
Total Return | +8.14 | % | +37.46 | % | –26.95 | % | –4.80 | % | +8.57 | % | +33.39 | % | ||||||||||||
Net Assets, End of Period (In Millions) | $ | 2,524 | $ | 2,709 | $ | 2,507 | $ | 3,664 | $ | 3,337 | $ | 2,537 | ||||||||||||
Ratio of Expenses to Average Net Assets before Expense Offsets | 1.4 | %* | 1.4 | % | 1.4 | % | 1.3 | % | 1.2 | % | 1.2 | % | ||||||||||||
Ratio of Expenses to Average Net Assets | 1.4 | %* | 1.4 | % | 1.4 | % | 1.3 | % | 1.2 | % | 1.2 | % | ||||||||||||
Ratio of Net Investment Income (Loss) to Average Net Assets | (0.6 | )%* | (0.4 | )% | (0.2 | )% | 0.2 | % | 0.5 | % | 0.2 | % | ||||||||||||
Portfolio Turnover Rate(d) | 19.4 | % | 60.2 | % | 70.9 | % | 87.8 | % | 86.5 | % | 80.8 | % | ||||||||||||
STRONG OPPORTUNITY FUND — ADVISOR CLASS
| Period Ended | ||||||||||||||||||||
| June 30, 2004(b) | Dec. 31, 2003 | Dec. 31, 2002 | Dec. 31, 2001 | Dec. 31, 2000(e) | ||||||||||||||||
Selected Per-Share Data(a) | ||||||||||||||||||||
Net Asset Value, Beginning of Period | $ | 38.94 | $ | 28.37 | $ | 38.92 | $ | 42.10 | $ | 43.16 | ||||||||||
Income From Investment Operations: | ||||||||||||||||||||
Net Investment Income (Loss) | (0.16 | ) | (0.19 | )(c) | (0.11 | ) | (0.06 | )(c) | 0.03 | |||||||||||
Net Realized and Unrealized Gains (Losses) on Investments | 3.29 | 10.76 | (10.44 | ) | (2.08 | ) | 4.83 | |||||||||||||
Total from Investment Operations | 3.13 | 10.57 | (10.55 | ) | (2.14 | ) | 4.86 | |||||||||||||
Less Distributions: | ||||||||||||||||||||
From Net Investment Income | — | — | — | (0.09 | ) | (0.28 | ) | |||||||||||||
From Net Realized Gains | — | — | — | (0.95 | ) | (5.64 | ) | |||||||||||||
Total Distributions | — | — | — | (1.04 | ) | (5.92 | ) | |||||||||||||
Net Asset Value, End of Period | $ | 42.07 | $ | 38.94 | $ | 28.37 | $ | 38.92 | $ | 42.10 | ||||||||||
Ratios and Supplemental Data | ||||||||||||||||||||
Total Return | +8.04 | % | +37.26 | % | –27.11 | % | –5.08 | % | +12.10 | % | ||||||||||
Net Assets, End of Period (In Millions) | $ | 137 | $ | 141 | $ | 104 | $ | 89 | $ | 3 | ||||||||||
Ratio of Expenses to Average Net Assets before Expense Offsets | 1.6 | %* | 1.6 | % | 1.6 | % | 1.7 | % | 1.6 | %* | ||||||||||
Ratio of Expenses to Average Net Assets | 1.6 | %* | 1.6 | % | 1.6 | % | 1.7 | % | 1.6 | %* | ||||||||||
Ratio of Net Investment Income (Loss) to Average Net Assets | (0.7 | )%* | (0.6 | )% | (0.4 | )% | (0.3 | )% | 0.1 | %* | ||||||||||
Portfolio Turnover Rate(d) | 19.4 | % | 60.2 | % | 70.9 | % | 87.8 | % | 86.5 | % | ||||||||||
| * | Calculated on an annualized basis. |
| (a) | Information presented relates to a share of capital stock of the Fund outstanding for the entire period. |
| (b) | For the six months ended June 30, 2004 (Unaudited). |
| (c) | Net investment loss per share represents net investment loss divided by the average shares outstanding throughout the year. |
| (d) | Calculated on the basis of the Fund as a whole without distinguishing between the classes of shares issued. |
| (e) | For the period from February 24, 2000 (commencement of class) to December 31, 2000. |
See Notes to Financial Statements.
31
FINANCIAL HIGHLIGHTS (continued)
STRONG OPPORTUNITY FUND — CLASS K
| Period Ended | ||||||||||||
| June 30, 2004(b) | Dec. 31, 2003 | Dec. 31, 2002(c) | ||||||||||
Selected Per-Share Data(a) | ||||||||||||
Net Asset Value, Beginning of Period | $ | 39.58 | $ | 28.73 | $ | 29.48 | ||||||
Income From Investment Operations: | ||||||||||||
Net Investment Income (Loss) | (0.04 | ) | (0.06 | )(d) | 0.02 | |||||||
Net Realized and Unrealized Gains (Losses) on Investments | 3.30 | 10.91 | (0.77 | ) | ||||||||
Total from Investment Operations | 3.26 | 10.85 | (0.75 | ) | ||||||||
Less Distributions: | ||||||||||||
From Net Investment Income | — | — | — | |||||||||
Total Distributions | 0.00 | — | — | |||||||||
Net Asset Value, End of Period | $ | 42.84 | $ | 39.58 | $ | 28.73 | ||||||
Ratios and Supplemental Data | ||||||||||||
Total Return | +8.24 | % | +37.77 | % | –2.54 | % | ||||||
Net Assets, End of Period (In Millions) | $ | 2 | $ | 0 | (e) | $ | 1 | |||||
Ratio of Expenses to Average Net Assets before Expense Offsets | 1.4 | %* | 1.6 | % | 1.2 | %* | ||||||
Ratio of Expenses to Average Net Assets | 1.2 | %* | 1.2 | % | 1.2 | %* | ||||||
Ratio of Net Investment Income (Loss) to Average Net Assets | (0.3 | )%* | (0.2 | )% | 0.2 | %* | ||||||
Portfolio Turnover Rate(f) | 19.4 | % | 60.2 | % | 70.9 | % | ||||||
| * | Calculated on an annualized basis. |
| (a) | Information presented relates to a share of capital stock of the Fund outstanding for the entire period. |
| (b) | For the six months ended June 30, 2004 (Unaudited). |
| (c) | For the period from August 30, 2002 (commencement of class) to December 31, 2002. |
| (d) | Net investment loss per share represents net investment loss divided by the average shares outstanding throughout the year. |
| (e) | Amount is less than $500,000. |
| (f) | Calculated on the basis of the Fund as a whole without distinguishing between the classes of shares issued. |
See Notes to Financial Statements.
32
June 30, 2004 (Unaudited)
| 1. | Organization |
The accompanying financial statements represent the following Strong Core Funds (the “Funds”), each with its own investment objectives and policies:
| • | Strong Balanced Fund (a series fund of Strong Balanced Fund, Inc.) |
| • | Strong Large Cap Core Fund (a series fund of Strong Equity Funds, Inc.) |
| • | Strong Growth and Income Fund (a series fund of Strong Conservative Equity Funds, Inc.) |
| • | Strong Opportunity Fund (a series fund of Strong Opportunity Fund, Inc.) |
Each Fund is a diversified, open-end management investment company registered under the Investment Company Act of 1940, as amended (“1940 Act”).
Strong Balanced Fund and Strong Large Cap Core Fund offer Investor Class shares. Strong Growth and Income Fund offers Investor Class, Institutional Class, Advisor Class, and Class K shares. Strong Opportunity Fund offers Investor Class, Advisor Class, and Class K shares. All classes of shares differ principally in their respective administration, transfer agent, and distribution expenses and sales charges, if any. All classes of shares have identical rights to earnings, assets, and voting privileges, except for class-specific expenses and exclusive rights to vote on matters affecting only individual classes.
Investor Class shares are available to the general public, Institutional Class shares are generally available to investors that meet certain higher investment minimums, Advisor Class shares are available only through financial professionals and Class K shares are primarily available through retirement plans.
| 2. | Significant Accounting Policies |
The following is a summary of significant accounting policies followed by the Funds in the preparation of their financial statements.
| (A) | Security Valuation — Securities of the Funds traded on a national securities exchange are valued each business day at the last sales price. Securities traded on the NASDAQ Stock Market are valued each business day using the NASDAQ Official Closing Price (“NOCP”). Exchange-traded securities for which there were no transactions and NASDAQ-traded securities for which there is no NOCP are valued at the mean of the bid and ask prices. Debt securities of the Funds are generally valued each business day at the last sales price or the mean of the bid and asked prices when no last sales price is available, or are valued through a commercial pricing service that utilizes matrix pricing and/or pricing models to determine market values for normal institutional-sized trading units of debt securities and non-rated or thinly traded securities when their pricing models are believed to more accurately reflect the fair market value for such securities. Securities for which market quotations are not readily available are fair valued as determined in good faith under the general supervision of the Board of Directors. Some of the Fund’s portfolio securities may be listed on foreign exchanges that close before the U.S. markets and that trade on days when the U.S. markets are closed. As a result, management, under the supervision of the Strong Funds’ Board of Directors, will consider significant events affecting foreign securities and the movements of the domestic markets that occur after the close of the foreign markets and before the time a Fund’s net asset value (“NAV”) is calculated in valuing such foreign securities. Securities that are purchased within 60 days of their stated maturity are valued at amortized cost, which approximates fair value. |
The Funds may own certain securities that are restricted as to resale. Restricted securities include Section 4(2) commercial paper, securities issued in a private placement, or securities eligible for resale pursuant to Rule 144A under the Securities Act of 1933. Restricted securities may be determined to be liquid or illiquid. Securities are deemed illiquid based upon guidelines established by the Funds’ Board of Directors. Illiquid securities are valued after giving due consideration to pertinent factors, such as recent private sales, market conditions, and the issuer’s financial performance. The Strong Funds held no restricted securities that were deemed illiquid at June 30, 2004.
| (B) | Federal Income and Excise Taxes and Distributions to Shareholders — The Funds intend to comply with the requirements of the Internal Revenue Code of 1986, as amended, applicable to regulated investment companies and to distribute substantially all of their taxable income to their shareholders in a manner which results in no tax cost to the Funds. Therefore, no federal income or excise tax provision is recorded. |
Undistributed income or net realized gains for financial statement purposes may differ from what is determined for federal income tax purposes due to differences in the timing, recognition, and characterization of income, expense, and capital gain items for financial statement and tax purposes. Where appropriate, reclassifications between net asset accounts are made for such differences that are permanent in nature. The Funds may utilize earnings and profits distributed to shareholders on redemptions of shares as part of the dividends paid deduction.
33
NOTES TO FINANCIAL STATEMENTS (continued)
June 30, 2004 (Unaudited)
Strong Balanced Fund and Strong Growth and Income Fund generally pay dividends from net investment income quarterly and distribute net realized capital gains, if any, at least annually. Strong Large Cap Core Fund and Strong Opportunity Fund generally pay dividends from net investment income and distribute net realized capital gains, if any, at least annually.
| (C) | Realized Gains and Losses on Investment Transactions — Investment security transactions are recorded as of the trade date. Gains or losses realized on investment transactions are determined by comparing the identified cost of the security lot sold with the net sales proceeds. |
| (D) | Certain Investment Risks — The Funds may utilize derivative instruments including options, futures, and other instruments with similar characteristics to the extent that they are consistent with the Funds’ investment objectives and limitations. The Funds intend to use such derivative instruments primarily to hedge or protect itself from adverse movements in securities’ prices, foreign currencies, or interest rates. The use of these instruments involves certain risks, including the possibility that the future value of the underlying assets or indices fluctuate (in the case of futures and options), the derivative becomes illiquid, an imperfect correlation arises between the value of the derivative and the underlying assets or indices, or that the counterparty fails to perform its obligations when due. |
Investments in foreign-denominated assets or forward foreign currency contracts may involve greater risks than domestic investments such as foreign-related risks created by currency rate fluctuations, foreign political and economic instability, foreign financial reporting standards and taxes, and foreign securities markets and issuer regulation. Foreign securities may be less liquid than domestic securities.
| (E) | Futures — Upon entering into a futures contract, the Funds segregate cash and/or other liquid investments equal to the minimum “initial margin” requirements of the exchange and the futures commission merchant or broker. Each Fund designates liquid securities as collateral on open futures contracts. During the term of the futures contract, the Funds also receive credit from, or pay to, the futures commission merchant or broker an amount of cash or liquid assets equal to the daily fluctuation in the value of the futures contract. Such receipts or payments are known as “variation margin” and are recorded as unrealized gains or losses by the Funds. When the futures contract is closed, a realized gain or loss is recorded equal to the difference between the value of the futures contract at the time it was opened and the value at the time it was closed. |
| (F) | Written Options — The Funds may write put or call options. Premiums received by the Funds upon writing put or call options are recorded as an asset with a corresponding liability that is subsequently adjusted daily to the current market value of the option. Changes between the initial premiums received and the current market value of the options are recorded as unrealized gains or losses by the Funds. When a written option is closed, expired, or exercised, the Funds realize a gain or loss and the liability is eliminated. The Funds continue to bear the risk of adverse movements in the price of the underlying asset during the period of the written option, although any potential loss during the period would be reduced by the amount of the option premium received by the Funds. Each Fund designates liquid securities or cash on its books to cover its financial exposure on open written options contracts. |
| (G) | Foreign Currency Conversion — Securities and other assets and liabilities initially expressed in foreign currencies are converted daily into U.S. dollars based upon current exchange rates. Purchases and sales of foreign securities and foreign income are converted into U.S. dollars based upon currency exchange rates prevailing on the respective dates of such transactions. The effect of changes in foreign exchange rates on realized and unrealized security gains or losses is reflected as a component of such gains or losses. |
| (H) | Forward Foreign Currency Exchange Contracts — Forward foreign currency exchange contracts are valued at the forward rate and are marked-to-market daily. The change in market value is recorded as an unrealized gain or loss. When the contract is closed, the Funds record an exchange gain or loss equal to the difference between the value of the contract at the time it was opened and the value at the time it was closed. |
| (I) | Short Positions — The Funds may engage in short sale transactions. For financial statement purposes, an amount equal to the settlement amount is included in the Statements of Assets and Liabilities as an asset and an equivalent liability. The amount of the liability is subsequently marked-to-market to reflect the current value of the short position. Changes between the amount of the liability and the current market value of the short positions are recorded as unrealized gains or losses. The Funds are liable to the buyer for any dividends payable on securities while those securities are in a short position. These dividends are an expense of the Fund and are included in Other Expenses in the Statement of Operations. If the Funds sell securities short while also holding the long position in the security, they may protect unrealized gains, but will lose the opportunity to profit on such securities if the price rises. If the Funds sell securities short when not holding the long position in the security, they will experience a loss if the market price of the security increases between the date of the short sale and the date the security is replaced. |
34
| (J) | Repurchase Agreements — The Funds may enter into repurchase agreements with institutions that the Funds’ investment advisor, Strong Capital Management, Inc. (the “Advisor”) has determined are creditworthy. Each repurchase transaction is recorded at cost, which approximates fair value. The Funds require that the collateral, represented by cash and/or securities (primarily U.S. government securities), in a repurchase transaction be maintained in a segregated account under the control of the Funds’ custodial bank in a manner sufficient to enable the Funds to liquidate those securities in the event of a default of the counterparty. On a daily basis, the Funds’ custodial bank monitors the value of the collateral, including accrued interest, to ensure it is at least equal to the amounts owed to the Funds under each repurchase agreement. |
| (K) | Securities Lending — The Funds have entered into a Securities Lending Agreement (the “Agreement”) with Deutsche Bank, which was subsequently assumed by State Street Bank and Trust Company. Under the terms of the Agreement, the Funds may lend portfolio securities to qualified institutional borrowers in order to earn additional income. The Agreement requires that loans are collateralized at all times by cash and cash equivalents equal to at least 102% of the market value of the aggregate loaned securities, plus accrued interest, and the collateral is marked-to-market daily. Cash collateral received is invested in repurchase agreements, investment funds, government obligations, and/or bank obligations. |
At June 30, 2004, Strong Balanced Fund, Strong Growth and Income Fund, and Strong Opportunity Fund had securities with a market value of $17,737,072, $20,544, and $78,379,463, respectively, on loan and had received $18,181,603, $21,225, and $81,411,672, respectively, in collateral (both are included within Investments in the Statements of Assets and Liabilities). Amounts earned as interest on investments of cash collateral, net of rebates and other securities lending expenses, are included in Interest Income in the Statements of Operations. For the year ended June 30, 2004, the securities lending income totaled $10,587, $6,102, and $48,722 for Strong Balanced Fund, Strong Growth and Income Fund, and Strong Opportunity Fund, respectively.
The three primary risks associated with securities lending are: a borrower defaulting on its obligation to return the securities loaned resulting in a shortfall on the posted collateral; a principal loss arising from the lending agent’s investment of cash collateral; and the inability of the lending Fund to recall a security in time to exercise valuable voting rights or sell the security. In each case, the lending agent has indemnified the Funds for these types of losses.
| (L) | Directed Brokerage — The Funds direct certain portfolio trades to brokers who, in turn, pay a portion of the Funds’ expenses not attributable to the Advisor or its affiliates. Such amounts are included in Expense Offsets reported in the Funds’ Statements of Operations and in Note 4. |
| (M) | Earnings Credit Arrangements — Credits are earned on positive cash balances maintained in custodian accounts. These credits serve to reduce the custodian’s fees incurred by the Funds and are included in Expense Offsets reported in the Funds’ Statements of Operations and in Note 4. |
| (N) | Expenses — The Funds and other affiliated Strong Funds contract for certain services on a collective basis. The majority of the expenses are directly identifiable to an individual Fund. Expenses that are not readily identifiable to a specific Fund will be allocated in such manner as deemed equitable, taking into consideration, among other things, the nature and type of expense and the relative sizes of the Strong Funds. |
| (O) | Use of Estimates — The preparation of financial statements in conformity with accounting principles generally accepted in the United States of America requires management to make estimates and assumptions that affect the reported amounts in these financial statements. Actual results could differ from those estimates. |
| (P) | Guarantees and Indemnifications — In the normal course of business, the Funds enter into contracts with service providers that contain general indemnification clauses. The Funds’ maximum exposure under these arrangements is unknown, as this would involve future claims that may be made against the Funds that have not yet occurred. However, based on experience, the Funds expect the risk of loss to be remote. |
| (Q) | Other — Dividend income and distributions to shareholders are recorded on the ex-dividend date. Interest income is recorded on the accrual basis and includes amortization of premiums and discounts on the interest method. Income, expenses (other than expenses attributable to a specific class), and realized and unrealized gains or losses on investments are allocated to each class of shares based on its relative shares outstanding. |
35
NOTES TO FINANCIAL STATEMENTS (continued)
June 30, 2004 (Unaudited)
| 3. | Related Party Transactions |
The Advisor provides investment advisory and related services to the Funds. Strong Investor Services, Inc. (the “Administrator”), an affiliate of the Advisor, provides administrative, transfer agent, and related services to the Funds. Certain officers and, until December 2, 2003, certain directors of the Funds are or were affiliated with the Advisor and the Administrator. Investment advisory and administration fees, which are established by terms of the advisory and administration agreements, are based on the following annualized rates of the average daily net assets of the respective Fund:
| Administrative Fees | |||||||||||||||
| Advisory Fees | Investor Class | Institutional Class | Advisor Class | Class K | |||||||||||
Strong Balanced Fund | 0.60 | %(1) | 0.30 | % | * | * | * | ||||||||
Strong Large Cap Core Fund | 0.75 | %(2) | 0.30 | % | * | * | * | ||||||||
Strong Growth and Income Fund | 0.55 | % | 0.30 | % | 0.02 | % | 0.30 | % | 0.25 | % | |||||
Strong Opportunity Fund | 0.75 | %(2) | 0.30 | % | * | 0.30 | % | 0.25 | % | ||||||
| * | Does not offer Share class. |
| (1) | The investment advisory fees are 0.60% for the first $35 million assets and 0.55% for assets above $35 million. |
| (2) | The Investment Advisory fees are 0.75% for assets under $4 billion, 0.725% for the next $2 billion assets, and 0.70% for assets $6 billion and above. |
The Funds’ Advisor and/or Administrator may voluntarily waive or absorb certain expenses at their discretion. The Advisor and/or Administrator has contractually agreed to waive its fees and/or absorb expenses until May 1, 2005 for Strong Large Cap Core Fund, Strong Growth and Income Fund Class K, and Strong Opportunity Fund Class K to keep Net Annual Operating Expenses at no more than 2.00%, 0.99%, and 1.20%, respectively. Transfer agent and related service fees for the Investor Class shares are paid at an annual rate of $27.00 for each open shareholder account and $4.20 for each closed shareholder account. Transfer agent and related service fees for the Institutional Class, Advisor Class, and Class K shares are paid at an annual rate of 0.015%, 0.20%, and 0.20%, respectively, of the average daily net assets of each respective class. Transfer agent fees are recorded in Shareholder Servicing Costs in the Funds’ Statements of Operations. The Administrator also allocates to each Fund certain charges or credits resulting from transfer agency banking activities based on each Class’ level of subscription and redemption activity. Transfer Agency Banking Charges allocated to the Funds by the Administrator, if any, are included in Other Expenses in the Funds’ Statements of Operations. Transfer Agency Banking Credits allocated by the Administrator, if any, serve to reduce the transfer agent expenses incurred by the Funds and are included in Expense Offsets in the Funds’ Statements of Operations and in Note 4. The Administrator is also compensated for certain other out-of-pocket expenses related to transfer agent services.
Strong Growth and Income Fund and Strong Opportunity Fund have adopted a Rule 12b-1 distribution and service plan under the 1940 Act on behalf of each of the Fund’s Advisor Class shares. Under the plan, Strong Investments, Inc. (the “Distributor,” and an affiliate of the Advisor) is paid an annual rate of 0.25% of the average daily net assets of the Advisor Class shares as compensation for services provided and expenses incurred, including amounts paid to brokers or dealers, in connection with the sale of each Fund’s Advisor Class shares. See Note 4.
The Funds may invest cash in money market funds managed by the Advisor, subject to certain limitations set by the Fund’s Board of Directors and applicable law.
Certain information regarding related party transactions, excluding the effects of waivers and absorptions, for the six months ended June 30, 2004 is as follows:
Payable to/ (Receivable From) Administrator at June 30, 2004 | Shareholder Servicing and Other Related Expenses Paid to Administrator | Transfer Agency Banking Charges/(Credits) | Unaffiliated Directors’ and Independent Officers’ Fees | |||||||||
Strong Balanced Fund | $ | 48,446 | $ | 279,581 | $ | 3,530 | $ | 5,666 | ||||
Strong Large Cap Core Fund | 3,253 | 14,023 | 206 | 469 | ||||||||
Strong Growth and Income Fund | 184,224 | 1,266,516 | 13,859 | 20,271 | ||||||||
Strong Opportunity Fund | 657,029 | 3,652,619 | 25,112 | 76,812 | ||||||||
36
| 4. | Expenses and Expense Offsets |
For the six months ended June 30, 2004, the class specific expenses are as follows:
| Administrative Fees | Shareholder Servicing Costs | Reports to Shareholders | 12b-1 Fees | Other | |||||||||||
Strong Growth and Income Fund | |||||||||||||||
Investor Class | $ | 844,925 | $ | 1,218,972 | $ | 215,634 | $ | — | $ | 12,607 | |||||
Institutional Class | 7,643 | 5,816 | 25,077 | — | 2,907 | ||||||||||
Advisor Class | 10,938 | 7,329 | 1,574 | 9,115 | 508 | ||||||||||
Class K | 39,221 | 31,377 | 4,349 | — | 860 | ||||||||||
Strong Opportunity Fund | |||||||||||||||
Investor Class | 3,841,975 | 3,508,261 | 630,114 | — | 29,709 | ||||||||||
Advisor Class | 204,970 | 137,137 | 42,108 | 170,808 | 1,618 | ||||||||||
Class K | 992 | 795 | 465 | — | 211 | ||||||||||
For the six months ended June 30, 2004, the expense offsets are as follows:
Expense Waivers and Absorptions | Transfer Agency Banking Credits | Directed Brokerage | Earnings Credits | ||||||||||||
Strong Balanced Fund | $ | (18,766 | ) | $ | — | $ | (6,588 | ) | $ | (62 | ) | ||||
Strong Large Cap Core Fund | (18,808 | ) | — | (3,349 | ) | (0 | ) | ||||||||
Strong Growth and Income Fund | |||||||||||||||
Investor Class | 15,272 | — | — | — | |||||||||||
Institutional Class | 1,255 | — | — | — | |||||||||||
Class K | (11,500 | ) | — | — | — | ||||||||||
Advisor Class | 581 | — | — | — | |||||||||||
Fund Level | (60,612 | ) | — | (12,425 | ) | (79 | ) | ||||||||
Strong Opportunity Fund | |||||||||||||||
Investor Class | 92,963 | — | — | — | |||||||||||
Advisor Class | 9,419 | — | — | — | |||||||||||
Class K | (693 | ) | — | — | — | ||||||||||
Fund Level | (246,622 | ) | — | (65,026 | ) | (87 | ) | ||||||||
| 5. | Line of Credit |
The Strong Funds have established a line of credit agreement (“LOC”) with certain financial institutions, which expires October 8, 2004, to be used for temporary or emergency purposes. Combined borrowings among all participating Strong Funds are subject to a $350 million cap on the total LOC. For an individual Fund, borrowings under the LOC are limited to either the lesser of 15% of the market value of the Fund’s total assets or any explicit borrowing limits in the Funds’ registration statement. The principal amount of each borrowing under the LOC is due not more than 45 days after the date of the borrowing. Borrowings under the LOC bear interest based on prevailing market rates as defined in the LOC. A commitment fee of 0.09% per annum is incurred on the unused portion of the LOC and is allocated to all participating Strong Funds based on their net asset values. Strong Opportunity Fund and Strong Large Cap Core had no borrowings under the LOC during the period. Strong Balanced Fund, and Strong Growth and Income Fund had minimal borrowings under the LOC during the year. There were no outstanding borrowings by the Funds under the LOC at June 30, 2004.
| 6. | Investment Transactions |
The aggregate purchases and sales of shares of long-term securities during the six months ended June 30, 2004 are as follows:
| Purchases | Sales | |||||||||||
| U.S. Government and Agency | Other | U.S. Government and Agency | Other | |||||||||
Strong Balanced Fund | $ | 43,299,477 | $ | 101,332,924 | $ | 43,441,564 | $ | 147,996,282 | ||||
Strong Large Cap Core Fund | — | 3,702,683 | — | 4,138,662 | ||||||||
Strong Growth and Income Fund | — | 491,293,407 | — | 632,324,141 | ||||||||
Strong Opportunity Fund | — | 507,336,050 | — | 936,256,429 | ||||||||
37
NOTES TO FINANCIAL STATEMENTS (continued)
June 30, 2004 (Unaudited)
| 7. | Income Tax Information |
The following information for the Funds is presented on an income tax basis as of June 30, 2004:
| Cost of Investments | Gross Unrealized Appreciation | Gross Unrealized (Depreciation) | Net Unrealized Appreciation/ (Depreciation) on Investments | ||||||||||
Strong Balanced Fund | $ | 170,012,664 | $ | 10,763,575 | $ | (2,133,580 | ) | $ | 8,629,995 | ||||
Strong Large Cap Core Fund | 3,287,681 | 595,879 | (23,296 | ) | 572,583 | ||||||||
Strong Growth and Income Fund | 513,483,880 | 118,419,040 | (2,284,635 | ) | 116,134,405 | ||||||||
Strong Opportunity Fund | 2,099,712,323 | 678,561,449 | (81,000,570 | ) | 597,560,879 | ||||||||
The difference between cost amounts for financial statement and federal income tax purposes is due primarily to timing differences in recognizing certain gains and losses on security transactions.
The capital loss carryovers (expiring in varying amounts through 2011) as of December 31, 2003, and tax basis post-October losses as of December 31, 2003, which are not recognized for tax purposes until the first day of the following fiscal year, are:
| Net Capital Loss Carryovers | Post-October Losses | |||||
Strong Balanced Fund | $ | 29,257,442 | $ | — | ||
Strong Large Cap Core Fund | 1,329,240 | 34,841 | ||||
Strong Growth and Income Fund | 246,233,478 | 7,799,769 | ||||
Strong Opportunity Fund | 416,414,763 | — | ||||
38
| 8. | Capital Share Transactions |
| Strong Balanced Fund | ||||||||
Six Months Ended June 30, 2004 | Year Ended Dec. 31, 2003 | |||||||
| (Unaudited) | ||||||||
Capital Share Transactions of the Fund Were as Follows: | ||||||||
Proceeds from Shares Sold | $ | 17,262,811 | $ | 32,626,685 | ||||
Transfer in from Merger (Note 9) | — | 5,544,540 | ||||||
Proceeds from Reinvestment of Distributions | 835,061 | 2,514,411 | ||||||
Payment for Shares Redeemed | (69,277,501 | ) | (82,073,813 | ) | ||||
Net Increase (Decrease) in Net Assets from Capital Share Transactions | $ | (51,179,629 | ) | $ | (41,388,177 | ) | ||
Transactions in Shares of the Fund Were as Follows: | ||||||||
Sold | 913,686 | 1,911,180 | ||||||
Transfer in from Merger (Note 9) | — | 348,494 | ||||||
Issued in Reinvestment of Distributions | 44,813 | 144,599 | ||||||
Redeemed | (3,675,681 | ) | (4,758,107 | ) | ||||
Net Increase (Decrease) in Shares of the Fund | (2,717,182 | ) | (2,353,834 | ) | ||||
| Strong Large Cap Core Fund | ||||||||
Six Months Ended June 30, 2004 | Year Ended Dec. 31, 2003 | |||||||
| (Unaudited) | ||||||||
Capital Share Transactions of the Fund Were as Follows: | ||||||||
Proceeds from Shares Sold | $ | 475,768 | $ | 938,346 | ||||
Proceeds from Reinvestment of Distributions | — | — | ||||||
Payment for Shares Redeemed | (773,956 | ) | (2,023,881 | ) | ||||
Net Increase (Decrease) in Net Assets from Capital Share Transactions | $ | (298,188 | ) | $ | (1,085,535 | ) | ||
Transactions in Shares of the Fund Were as Follows: | ||||||||
Sold | 47,129 | 107,906 | ||||||
Issued in Reinvestment of Distributions | — | — | ||||||
Redeemed | (76,355 | ) | (233,342 | ) | ||||
Net Increase (Decrease) in Shares of the Fund | (29,226 | ) | (125,436 | ) | ||||
39
NOTES TO FINANCIAL STATEMENTS (continued)
June 30, 2004 (Unaudited)
| Strong Growth and Income Fund | ||||||||
| Six Months Ended June 30, 2004 | Year Ended Dec. 31, 2003 | |||||||
| (Unaudited) | ||||||||
Capital Share Transactions of Each Class of Shares of the Fund Were as Follows: | ||||||||
INVESTOR CLASS | ||||||||
Proceeds from Shares Sold | $ | 36,741,021 | $ | 203,112,596 | ||||
Proceeds from Reinvestment of Distributions | 326,807 | 1,392,195 | ||||||
Payment for Shares Redeemed | (161,274,968 | ) | (289,307,195 | ) | ||||
Net Increase (Decrease) in Net Assets from Capital Share Transactions | (124,207,140 | ) | (84,802,404 | ) | ||||
INSTITUTIONAL CLASS | ||||||||
Proceeds from Shares Sold | 6,598,552 | 16,100,601 | ||||||
Proceeds from Reinvestment of Distributions | 180,573 | 705,353 | ||||||
Payment for Shares Redeemed | (22,176,568 | ) | (17,235,352 | ) | ||||
Net Increase (Decrease) in Net Assets from Capital Share Transactions | (15,397,443 | ) | (429,398 | ) | ||||
ADVISOR CLASS | ||||||||
Proceeds from Shares Sold | 552,764 | 1,932,654 | ||||||
Proceeds from Reinvestment of Distributions | 6,008 | 23,212 | ||||||
Payment for Shares Redeemed | (2,741,895 | ) | (5,560,191 | ) | ||||
Net Increase (Decrease) in Net Assets from Capital Share Transactions | (2,183,123 | ) | (3,604,325 | ) | ||||
CLASS K | ||||||||
Proceeds from Shares Sold | 14,527,108 | 15,545,119 | ||||||
Proceeds from Reinvestment of Distributions | 30,511 | 114,699 | ||||||
Payment for Shares Redeemed | (12,748,468 | ) | (11,445,984 | ) | ||||
Net Increase (Decrease) in Net Assets from Capital Share Transactions | 1,809,151 | 4,213,834 | ||||||
Net Increase (Decrease) in Net Assets from Capital Share Transactions | $ | (139,978,555 | ) | $ | (84,622,293 | ) | ||
40
| Strong Growth and Income Fund | ||||||
| Six Months Ended June 30, 2004 | Year Ended Dec. 31, 2003 | |||||
| (Unaudited) | ||||||
Transactions in Shares of Each Class of the Funds Were as Follows: | ||||||
INVESTOR CLASS | ||||||
Sold | 1,842,356 | 11,952,254 | ||||
Issued in Reinvestment of Distributions | 17,022 | 79,360 | ||||
Redeemed | (8,182,227 | ) | (16,571,248 | ) | ||
Net Increase (Decrease) in Shares | (6,322,849 | ) | (4,539,634 | ) | ||
INSTITUTIONAL CLASS | ||||||
Sold | 331,176 | 939,263 | ||||
Issued in Reinvestment of Distributions | 9,307 | 40,748 | ||||
Redeemed | (1,108,644 | ) | (951,684 | ) | ||
Net Increase (Decrease) in Shares | (768,161 | ) | 28,327 | |||
ADVISOR CLASS | ||||||
Sold | 28,054 | 115,023 | ||||
Issued in Reinvestment of Distributions | 315 | 1,344 | ||||
Redeemed | (138,574 | ) | (331,631 | ) | ||
Net Increase (Decrease) in Shares | (110,205 | ) | (215,264 | ) | ||
CLASS K | ||||||
Sold | 736,475 | 926,705 | ||||
Issued in Reinvestment of Distributions | 1,590 | 6,709 | ||||
Redeemed | (648,826 | ) | (643,521 | ) | ||
Net Increase (Decrease) in Shares | 89,239 | 289,893 | ||||
41
NOTES TO FINANCIAL STATEMENTS (continued)
June 30, 2004 (Unaudited)
| Strong Opportunity Fund | ||||||||
| Six Months Ended June 30, 2004 | Year Ended Dec. 31, 2003 | |||||||
| (Unaudited) | ||||||||
Capital Share Transactions of Each Class of Shares of the Fund Were as Follows: | ||||||||
INVESTOR CLASS | ||||||||
Proceeds from Shares Sold | $ | 162,545,807 | $ | 531,529,373 | ||||
Proceeds from Reinvestment of Distributions | — | — | ||||||
Payment for Shares Redeemed | (553,344,454 | ) | (1,184,570,695 | ) | ||||
Net Increase (Decrease) in Net Assets from Capital Share Transactions | (390,798,647 | ) | (653,041,322 | ) | ||||
ADVISOR CLASS | ||||||||
Proceeds from Shares Sold | 13,384,406 | 38,084,933 | ||||||
Proceeds from Reinvestment of Distributions | — | — | ||||||
Payment for Shares Redeemed | (27,308,628 | ) | (40,603,841 | ) | ||||
Net Increase (Decrease) in Net Assets from Capital Share Transactions | (13,924,222 | ) | (2,518,908 | ) | ||||
CLASS K | ||||||||
Proceeds from Shares Sold | 1,474,093 | 198,407 | ||||||
Proceeds from Reinvestment of Distributions | — | — | ||||||
Payment for Shares Redeemed | (108,701 | ) | (896,534 | ) | ||||
Net Increase (Decrease) in Net Assets from Capital Share Transactions | 1,365,392 | (698,127 | ) | |||||
Net Increase (Decrease) in Net Assets from Capital Share Transactions | $ | (403,357,477 | ) | $ | (656,258,357 | ) | ||
Transactions in Shares of Each Class of the Fund Were as Follows: | ||||||||
INVESTOR CLASS | ||||||||
Sold | 3,938,874 | 16,208,728 | ||||||
Issued in Reinvestment of Distributions | — | — | ||||||
Redeemed | (13,451,967 | ) | (34,871,478 | ) | ||||
Net Increase (Decrease) in Shares | (9,513,093 | ) | (18,662,750 | ) | ||||
ADVISOR CLASS | ||||||||
Sold | 327,170 | 1,179,895 | ||||||
Issued in Reinvestment of Distributions | — | — | ||||||
Redeemed | (674,525 | ) | (1,234,407 | ) | ||||
Net Increase (Decrease) in Shares | (347,355 | ) | (54,512 | ) | ||||
CLASS K | ||||||||
Sold | 35,439 | 6,374 | ||||||
Issued in Reinvestment of Distributions | — | — | ||||||
Redeemed | (2,605 | ) | (24,791 | ) | ||||
Net Increase (Decrease) in Shares | 32,834 | (18,417 | ) | |||||
42
| 9. | Acquisition Information |
Effective March 28, 2003, Strong Balanced Fund acquired, through a non-taxable exchange, substantially all of the net assets of Strong Balanced Asset Fund. Strong Balanced Fund issued 348,494 shares (valued at $5,544,540) for the outstanding shares of Strong Balanced Asset Fund at March 28, 2003. The aggregate net assets of Strong Balanced Fund and Strong Balanced Asset Fund immediately before the acquisition were $208,384,213 and $5,544,540, respectively. The combined net assets of Strong Balanced Fund immediately after the acquisition were $213,928,753. The net assets of Strong Balanced Asset Fund included net unrealized depreciation on investments of $503,735 and accumulated net realized losses of $731,189. Subject to IRS regulations, Strong Balanced Fund may use $709,865 of capital loss carryovers from Strong Balanced Asset Fund. Strong Balanced Fund results of operations shown herein, do not include the results of operations for Strong Balanced Asset Fund prior to March 28, 2003.
| 10. | Legal and Regulatory Matters |
On or about May 20, 2004, the Advisor, the Administrator, and the Distributor (collectively, “Strong”), former chairman Richard S. Strong, and two employees of Strong entered into agreements with the Securities and Exchange Commission (“SEC”), the New York Attorney General (“NYAG”), the State of Wisconsin Department of Justice (the Wisconsin Attorney General), and the Wisconsin Department of Financial Institutions representing a settlement of all the market-timing investigations of Strong and certain affiliates by these agencies. In the settlements, Strong, without admitting or denying the findings in any of the orders, consented to entries of cease and desist orders and injunctive relief relating to breaches of their fiduciary duties and violations of state and federal securities laws, including anti-fraud provisions. The settlements require the Advisor to pay $40 million in investor restoration and $40 million in civil penalties. The settlements require Mr. Strong to pay $30 million in investor restoration and $30 million in civil penalties. The NYAG settlement also requires Strong to reduce fees for all Funds (except money market funds and certain very short-term income funds) by an aggregate of at least $7 million a year for five years. Separately, the Board of Directors of the Strong Funds and the Advisor have agreed that the Advisor may allocate such fee and/or expense reductions in a manner it deems reasonable, provided that (i) each applicable Fund shall participate in such fee reduction, (ii) each Fund that was impacted by market timing related to the settlements shall receive a fee reduction of at least 0.025% each year, (iii) such fee reduction shall be taken after giving effect to all waivers and reimbursements currently in effect, and (iv) fees and expenses shall not subsequently be increased without prior Board approval. Additionally, the settlements require, among other things: 1) retention of an independent consultant to develop a payment plan for the amount of investor restoration; 2) the services of an independent compliance consultant to conduct a periodic review of Strong’s compliance policies and procedures; and 3) enhanced corporate governance policies for the Strong Funds. The NYAG settlement also requires: 1) the retention of a senior officer to assist the Board in monitoring compliance and reviewing fee arrangements; and 2) additional fee disclosure to investors in the Funds. Strong and Mr. Strong, and not the investors in any Strong Fund, will bear all the costs of complying with the settlements, including restoration, civil penalties, and associated legal fees stemming from these regulatory proceedings. Strong has not yet determined if the investor restoration or civil penalties will create any financial benefit to the Strong Funds.
Strong has received one or more subpoenas or requests for information from the West Virginia Attorney General and other regulatory agencies requesting documents, if any, related to market timing and late trading practices. Strong is aware of multiple outstanding class and derivative actions (“Actions”) filed since September 4, 2003, against Strong, Strong Funds, Strong Financial Corporation, Strong Investments, Inc., Strong affiliates, and certain of their officers and directors as defendants in certain federal and state courts with respect to factual matters referenced in the NYAG settlement. On February 20 and June 15, 2004, the United States Judicial Panel for Multi District Litigation (“MDL”) ordered the transfer of all but one of the Actions to the District of Maryland so those cases involving Strong could be coordinated and consolidated into one or two actions covered by a single complaint (“MDL Consolidated Actions”). A single Wisconsin state court Action involving Strong was not removed to the District of Maryland court. The District of Maryland court has since appointed co-chairs/chief administrative counsel for the plaintiffs in the actions involving all of the fund families before it. It has also appointed a lead plaintiff and lead plaintiff’s counsel for the actions involving each individual fund family, including Strong. The Actions generally allege, among other things, that the defendants violated their fiduciary duty to fund shareholders and certain retirement plan participants, and made false and misleading statements in the funds’ prospectuses in violation of federal and state securities laws. The Actions generally seek one or more of the following: compensatory damages, punitive damages, special damages, exemplary damages, rescission, restitution, payment of plaintiffs’ attorneys’ fees and experts’ fees, and/or replacement of the Board of Directors of the Strong Funds. Strong expects that the MDL Consolidated Actions will allege the same types of violations of law and seek the same forms of damages and remedies as did the numerous prior Actions. Certain state Actions will not be consolidated into the MDL Consolidated Actions and proceedings in these state court Actions may be stayed or proceed independently of the MDL Consolidated Actions.
43
NOTES TO FINANCIAL STATEMENTS (continued)
June 30, 2004 (Unaudited)
The Strong Funds will not bear any costs incurred in connection with these Actions. Based on currently available information, Strong believes that the Actions will not have a material adverse financial impact on the Strong Funds, and are not likely to materially affect Strong’s ability to provide investment management services to its clients, including the Strong Funds. The Funds may experience increased redemptions or a decrease in new sales of shares as a result of the regulatory settlements and the ongoing Actions, which could result in increased transaction costs and operating expenses, or otherwise negatively impact the Strong Funds.
| 11. | Pending Acquisition |
On May 26, 2004, Strong Financial Corporation (“SFC”) announced that it reached a definitive agreement with Wells Fargo & Company (“Wells Fargo”) to acquire assets of SFC and certain of its affiliates, including the Advisor. As part of the proposed transaction, SFC will be seeking approval from the Board of Directors of the Strong Funds (“Board”) on various matters including appointing Wells Fargo Funds Management, LLC, a wholly owned subsidiary of Wells Fargo, as a new investment advisor for the Strong Funds and a merger of those funds into the Wells Fargo Funds family of mutual funds.
The mergers, which are anticipated to close in the first quarter of 2005, are subject to a number of conditions, including approval by the Board and shareholders of the Strong Funds.
44
Each officer and director holds the same position with the 27 registered open-end management investment companies consisting of 71 mutual funds (“Strong Funds”).
Willie D. Davis (DOB 7-24-34), Director of the Strong Funds since July 1994.
Mr. Davis has been President and Chief Executive Officer of All Pro Broadcasting, Inc., since 1977; Director of Wisconsin Energy Corporation (formerly WICOR, Inc., a utility company) since 1990, Metro-Goldwyn-Mayer, Inc. (an entertainment company) since 1998, Bassett Furniture Industries, Inc. since 1997, Checker’s Drive-In Restaurants, Inc. (formerly Rally’s Hamburgers, Inc.) since 1994, Johnson Controls, Inc. (an automotive systems and facility management company) since 1992, MGM Mirage (formerly MGM Grand, Inc., an entertainment/hotel company) since 1990, Dow Chemical Company since 1988, Sara Lee Corporation (a food/consumer products company) since 1983, Alliance Bank since 1980, Manpower, Inc. (a worldwide provider of staffing services) since 2001, and Kmart Corporation (a discount consumer products company) from 1985 to 2003; and Trustee of the University of Chicago since 1980 and Marquette University since 1988.
Gordon B. Greer (DOB 2-17-32), Director of the Strong Funds since March 2002.
Mr. Greer was Of Counsel for Bingham McCutchen LLP (a law firm previously known as Bingham Dana LLP) from 1997 to February 2002 and Partner of Bingham McCutchen LLP from 1967 to 1997. On behalf of Bingham McCutchen LLP, Mr. Greer provided representation to the disinterested directors of the Strong Funds from 1991 to February 2002. Bingham McCutchen LLP has provided representation to the Independent Directors of the Strong Funds since 1991.
Stanley Kritzik (DOB 1-9-30), Director of the Strong Funds since January 1995 and Chairman of the Audit Committee of the Strong Funds since July 2000.
Mr. Kritzik has been Partner of Metropolitan Associates (a real estate firm) since 1962; Director of Wisconsin Health Information Network since November 1997, Health Network Ventures, Inc. from 1992 to April 2000, and Aurora Health Care from September 1987 to September 2002; and Member of the Board of Governors of Snowmass Village Resort Association from October 1999 to October 2002.
Neal Malicky (DOB 9-14-34), Director of the Strong Funds since December 1999.
Mr. Malicky has been President Emeritus of Baldwin-Wallace College since July 2000; Chancellor of Baldwin-Wallace College from July 1999 to June 2000; President of Baldwin-Wallace College from July 1981 to June 1999; Director of Aspire Learning Corporation since June 2000; Trustee of Southwest Community Health Systems, Cleveland Scholarship Program, and The National Conference for Community and Justice until 2001; President of the National Association of Schools and Colleges of the United Methodist Church, Chairperson of the Association of Independent Colleges and Universities of Ohio, and Secretary of the National Association of Independent Colleges and Universities until 2001.
William F. Vogt (DOB 7-19-47), Director and Chairman of the Independent Directors Committee of the Strong Funds since January 1995.
Mr. Vogt has been Senior Vice President of IDX Systems Corporation (a management consulting firm) since June 2001; President of Vogt Management Consulting, Inc. from July 1990 to June 2001; and former Fellow of the American College of Medical Practice Executives.
45
DIRECTORS AND OFFICERS (continued)
Ane K. Ohm (DOB 10-16-69), Anti-Money Laundering Compliance Officer of the Strong Funds since November 2002.
Ms. Ohm has been Anti-Money Laundering Compliance Officer of Strong Financial Corporation since February 2003; Assistant Executive Vice President of Strong Financial Corporation since November 2003; Assistant Executive Vice President of Strong Capital Management, Inc. (the “Advisor”) since December 2001; Director of Mutual Fund Administration of Strong Investor Services, Inc. since April 2001; Vice President of Strong Investor Services, Inc. since December 2001; and Marketing Services Manager of Strong Investments, Inc. (the “Distributor”) from November 1998 to April 2001.
Phillip O. Peterson (DOB 12-5-44), Independent President of the Strong Funds since January 2004.
Mr. Peterson was a mutual fund industry consultant from August 1999 to December 2003; Partner of KPMG LLP from 1981 to July 1999; Director of The Hartford Group of Mutual Funds (71 funds) since 2002; and Director of the Fortis Mutual Fund Group (38 funds) from 2000 to 2002.
Richard W. Smirl (DOB 4-18-67), Vice President of the Strong Funds since February 2002 and Secretary of the Strong Funds since November 2001.
Mr. Smirl has been Senior Counsel of Strong Financial Corporation since December 2001; Assistant Secretary of Strong Financial Corporation from December 2001 to February 2003; Secretary of Strong Financial Corporation since February 2003; Assistant Executive Vice President of the Advisor since December 2001; Chief Legal Officer of the Advisor since February 2003; Secretary of the Advisor since November 2002; Assistant Secretary of the Advisor from December 2001 to November 2002; Senior Counsel of the Advisor from July 2000 to December 2001; General Counsel of the Distributor since November 2001; Secretary of the Distributor since July 2000; Vice President and Chief Compliance Officer of the Distributor from July 2000 to December 2003; Lead Counsel of the Distributor from July 2000 to November 2001; Vice President of Strong Investor Services, Inc. since December 2001; Assistant Secretary of Strong Investor Services, Inc. from December 2001 to May 2003; Secretary of Strong Investor Services, Inc. since May 2003; Partner at Keesal, Young & Logan LLP (a law firm) from September 1999 to July 2000; and Associate at Keesal, Young & Logan LLP from September 1992 to September 1999.
Gilbert L. Southwell III (DOB 4-13-54), Assistant Secretary of the Strong Funds since July 2001.
Mr. Southwell has been Associate Counsel of Strong Financial Corporation since December 2001; Assistant Secretary of the Advisor since December 2002; Associate Counsel of the Advisor from April 2001 to December 2001; Partner at Michael, Best & Friedrich, LLP (a law firm) from October 1999 to March 2001; and Assistant General Counsel of U.S. Bank, National Association (formerly Firstar Bank, N.A.) and/or certain of its subsidiaries from November 1984 to September 1999.
John W. Widmer (DOB 1-19-65), Treasurer of the Strong Funds since April 1999.
Mr. Widmer has been Treasurer of the Advisor since April 1999; Assistant Treasurer of Strong Financial Corporation since December 2001; Assistant Secretary of Strong Financial Corporation from December 2001 to January 2003; Treasurer of Strong Service Corporation since April 1999; Treasurer and Assistant Secretary of Strong Investor Services, Inc. since July 2001; and Manager of the Financial Management and Sales Reporting Systems department of the Advisor from May 1997 to April 1999.
Thomas M. Zoeller (DOB 2-21-64), Vice President of the Strong Funds since October 1999.
Mr. Zoeller has been Executive Vice President of the Advisor since April 2001; Chief Financial Officer of the Advisor since February 1998; Secretary of the Advisor from December 2001 to November 2002; Member of the Office of the Chief Executive of Strong Financial Corporation since May 2001; Chief Financial Officer and Treasurer of Strong Investments, Inc. since October 1993; Executive Vice President of Strong Investor Services, Inc. since July 2001; Secretary of Strong Investor Services, Inc. from July 2001 to May 2003; Executive Vice President, Chief Financial Officer, and Secretary of Strong Service Corporation since December 2001; Treasurer of Strong Service Corporation from September 1996 to April 1999; Vice President of Strong Service Corporation from April 1999 to December 2001; Member of the Office of the Chief Executive of the Advisor from November 1998 until May 2001; and Senior Vice President of the Advisor from February 1998 to April 2001.
Except for Messrs. Davis, Kritzik, Malicky, and Vogt, the address of all of the Directors and Officers is P.O. Box 2936, Milwaukee, WI 53201. Mr. Davis’s address is 161 North La Brea, Inglewood, CA 90301. Mr. Kritzik’s address is 1123 North Astor Street, Milwaukee, WI 53202. Mr. Malicky’s address is 4608 Turnberry Drive, Lawrence, KS 66047. Mr. Vogt’s address is P.O. Box 7657, Avon, CO 81620.
The statement of additional information contains additional information about fund directors and officers and is available without charge, upon request, by calling 1-800-368-3863.
46
Directors
Willie D. Davis
Gordon B. Greer
Stanley Kritzik
Neal Malicky
William F. Vogt
Officers
Phillip O. Peterson, Independent President
Thomas M. Zoeller, Vice President
Richard W. Smirl, Vice President and Secretary
Gilbert L. Southwell III, Assistant Secretary
John W. Widmer, Treasurer
Ane K. Ohm, Anti-Money Laundering Compliance Officer
Investment Advisor
Strong Capital Management, Inc.
P.O. Box 2936, Milwaukee,Wisconsin 53201
Distributor
Strong Investments, Inc.
P.O. Box 2936, Milwaukee,Wisconsin 53201
Custodian
State Street Bank and Trust Company
801 Pennsylvania Avenue, Kansas City, Missouri 64105
Transfer Agent and Dividend-Disbursing Agent
Strong Investor Services, Inc.
P.O. Box 2936, Milwaukee,Wisconsin 53201
Independent Accountants
PricewaterhouseCoopers LLP
100 East Wisconsin Avenue, Milwaukee,Wisconsin 53202
Legal Counsel
Godfrey & Kahn, S.C.
780 North Water Street, Milwaukee,Wisconsin 53202
Strong Investments
P.O. Box 2936 | Milwaukee, WI 53201
To learn more about our funds, discuss an existing
account, or conduct a transaction, call 1-800-368-3863
or visit www.Strong.com.
Please carefully consider a fund’s investment objectives,
risks, charges, and expenses before investing. For this
and other information, call us or visit our web site for
a free prospectus. Please read it carefully before you
invest or send money.
To receive a free copy of the policies and procedures
the funds use to determine how to vote proxies relating
to portfolio securities, or to receive a free copy of a fund’s
proxy voting record for the most recent 12-month period
ending on June 30, call 1-800-368-3863, or visit the
Securities and Exchange Commission’s web site
at www.sec.gov.
If you are a Financial Professional, call 1-800-368-1683.
This report does not constitute an offer for the sale of securities. Strong Funds are offered for sale by prospectus only. Securities are offered through Strong Investments, Inc. RT45357 08-04
SCOR/WH2056 06-04
| Item 2. | Code of Ethics |
Not applicable for filing of Semiannual Reports to Shareholders.
| Item 3. | Audit Committee Financial Expert |
Not applicable for filing of Semiannual Reports to Shareholders.
| Item 4. | Principal Accountant Fees and Services |
Not applicable for filing of Semiannual Reports to Shareholders.
| Item 5. | Audit Committee of Listed Registrants |
Not applicable for filing of Semiannual Reports to Shareholders.
| Item 6. | Schedule of Investments |
Not applicable; full Schedule of Investments included in Item 1.
| Item 7. | Disclosure of Proxy Voting Policies and Procedures for Closed-End Management Investment Companies |
Not applicable to this Registrant, insofar as the Registrant is not a closed-end management investment company.
| Item 8. | Purchases of Equity Securities by Closed-End Management Investment Company and Affiliated Purchases |
Not applicable to this Registrant, insofar as the Registrant is not a closed-end management investment company.
| Item 9. | Submission of Matters to a Vote of Security Holders |
There were no material changes to the procedures by which shareholders may recommend nominees to the Funds’ Board of Directors.
| Item 10. | Controls and Procedures |
(a) An evaluation was performed within 90 days from the date hereof under the supervision of the Registrant’s management, including the principal executive officer and treasurer, regarding the effectiveness of the registrant’s disclosure controls and procedures. Based on that evaluation, it was determined that such disclosure controls and procedures provide reasonable assurance that the material information required to be disclosed by the Registrant in the reports it files or submits on Form N-CSR (1) is accumulated and communicated to the Registrant’s management, including its principal executive officer and treasurer, to allow timely decisions regarding required disclosure, and (2) is recorded, processed, summarized, and reported within the time periods specified in the Commission’s rules and forms.
(b) There were no significant changes in the Registrant’s internal control over financial reporting that occurred during the Registrant’s most recent fiscal half-year that has materially affected, or is reasonably likely to materially affect, the Registrant’s internal control over financial reporting.
| Item 11. | Exhibits |
The following exhibits are attached to this Form N-CSR:
| 11(a)(1) | Code of Ethics—Not applicable for filing of Semiannual Reports to Shareholders. | |
| 11(a)(2)(i) | Certification of Principal Executive Officer Required by Section 302 of the Sarbanes-Oxley Act of 2002 | |
| 11(a)(2)(ii) | Certification of Principal Financial Officer Required by Section 302 of the Sarbanes-Oxley Act of 2002 | |
| 11(b) | Certification of Chief Executive Officer and Chief Financial Officer Required by Section 906 of the Sarbanes-Oxley Act of 2002 | |
Signatures
Pursuant to the requirements of the Securities Exchange Act of 1934 and the Investment Company Act of 1940, the Registrant has duly caused this report to be signed on its behalf by the undersigned, thereunto duly authorized.
Strong Opportunity Fund, Inc., on behalf of Strong Advisor Select Fund, Strong Advisor U.S. Small/Mid Cap Growth Fund, Strong Endeavor Fund and Strong Opportunity Fund
| By: | /s/ Richard W. Smirl | |
| Richard W. Smirl, Vice President and Secretary | ||
Date: September 3, 2004 | ||
Pursuant to the requirements of the Securities Exchange Act of 1934 and the Investment Company Act of 1940, this report has been signed below by the following persons on behalf of the registrant and in the capacities and on the dates indicated.
| By: | /s/ Thomas M. Zoeller | |
| Thomas M. Zoeller, Principal Executive Officer | ||
Date: September 3, 2004 | ||
| By: | /s/ John W. Widmer | |
| John W. Widmer, Treasurer (Principal Financial Officer) | ||
Date: September 3, 2004 | ||