OMB APPROVAL | ||
OMB Number: | 3235-0570 | |
Expires: | Nov. 30, 2005 | |
Estimated average burden | ||
hours per response: | 5.0 | |
UNITED STATES
SECURITIES AND EXCHANGE COMMISSION
Washington, D.C. 20549
FORM N-CSR
CERTIFIED SHAREHOLDER REPORT OF REGISTERED MANAGEMENT
INVESTMENT COMPANIES
Investment Company Act file number: 811-3793
Strong Opportunity Fund, Inc., on behalf
of Strong Advisor Select Fund,
Strong Advisor U.S. Small/Mid Cap Growth Fund,
Strong Endeavor Fund and Strong Opportunity Fund
(Exact name of registrant as specified in charter)
| P.O. Box 2936 Milwaukee, WI | 53201 | |
| (Address of principal executive offices) | (Zip code) |
John W. Widmer, Strong Capital Management, Inc.
P.O. Box 2936 Milwaukee, WI 53201
(Name and address of agent for service)
Registrant’s telephone number, including area code: (414) 359-3400
Date of fiscal year end: December 31
Date of reporting period: December 31, 2004
Form N-CSR is to be used by management investment companies to file reports with the Commission not later than 10 days after the transmission to stockholders of any report that is required to be transmitted to stockholders under Rule 30e-1 under the Investment Company Act of 1940 (17 CFR 270.30e-1). The Commission may use the information provided on Form N-CSR in its regulatory, disclosure review, inspection, and policymaking roles.
A registrant is required to disclose the information specified by Form N-CSR, and the Commission will make this information public. A registrant is not required to respond to the collection of information contained in Form N-CSR unless the Form displays a currently valid Office of Management and Budget (“OMB”) control number. Please direct comments concerning the accuracy of the information collection burden estimate and any suggestions for reducing the burden to Secretary, Securities and Exchange Commission, 450 Fifth Street, NW, Washington, DC 20549-0609. The OMB has reviewed this collection of information under the clearance requirements of 44 U.S.C. (S) 3507.
Item 1. Reports to Shareholders
ANNUAL REPORT | December 31, 2004
Strong
Advisor Equity
Funds

Strong Advisor Common Stock Fund
Strong Advisor Mid Cap Growth Fund
Strong Advisor Small Cap Value Fund
Strong Advisor U.S. Value Fund
Strong Advisor Endeavor Large Cap Fund
Strong Advisor Focus Fund
Strong Advisor International Core Fund
Strong Advisor Select Fund
Strong Advisor Technology Fund
Strong Advisor U.S. Small/Mid Cap Growth Fund
Strong Advisor Utilities and Energy Fund
Strong Advisor Large Company Core Fund |

ANNUAL REPORT | December 31, 2004
Strong
Advisor Equity
Funds
On May 26, 2004, Strong Financial Corporation (“SFC”) announced that it reached a definitive agreement with Wells Fargo & Company (“Wells Fargo”) for Wells Fargo to acquire certain assets of SFC and certain of its affiliates, including the Advisor. On December 10, 2004, and on December 22, 2004, shareholders of the Strong Funds met and approved 1) the reorganization of each Strong Fund into a Wells Fargo Advantage Fund (“Reorganization”), and 2) interim investment advisory agreements between the Strong Funds and Wells Fargo Funds Management, LLC and certain sub-advisors (“Interim Agreements”). The Interim Agreements became effective January 1, 2005. The Reorganization of the Funds is expected to occur on or about April 11, 2005.
| Investment Reviews | ||
| 2 | ||
| 6 | ||
| 10 | ||
| 14 | ||
| 18 | ||
| 22 | ||
| 26 | ||
| 30 | ||
| 34 | ||
| 38 | ||
| 42 | ||
| 46 | ||
| 50 | ||
| Financial Information | ||
Schedules of Investments in Securities | ||
| 52 | ||
| 54 | ||
| 55 | ||
| 61 | ||
| 63 | ||
| 64 | ||
| 65 | ||
| 66 | ||
| 67 | ||
| 68 | ||
| 70 | ||
| 70 | ||
| 72 | ||
| 80 | ||
| 86 | ||
| Financial Highlights | 93 | |
| Notes to Financial Statements | 114 | |
| Report of Independent Registered Public Accounting Firm | 138 | |
| Results of Shareholders Meetings | 139 | |
| Directors and Officers | 144 | |

Market Update From Dick Weiss
January 1, 2004, to December 31, 2004
It’s indisputable: When it comes to the stock market, resolution brings results.
We saw this clearly at the tail end of 2004. The market as a whole had wandered aimlessly for the first 10 months of the year, spooked by uncertainty over the outcome of a contentious U.S. Presidential Election and our continuing involvement in Iraq. With George W. Bush’s reelection in November, the market surged, driven by the knowledge that there would be no change of administration in Washington and the U.S. commitment to democratize Iraq would continue.
One issue that currently weighs on the markets is inflation. There was tremendous inflation at the raw material level in both 2003 and 2004, but it has not shown up in any marked degree in the Consumer Price Index (CPI). The most obvious example occurred in the energy sector, where oil rose well above $50 per barrel. Historically, that sort of spike in oil prices would have dramatically (and negatively) impacted the average American’s financial affairs. This time, however, it did not.
Why? Because rather than pass on those increasing raw material costs to customers, most companies chose to take the hit themselves, largely because demand seemed soft. It seems to me that the tricky question is whether companies will continue to absorb higher prices for raw materials (thus depressing profit margins) or, rather, pass those costs along to the public.
In any event, it’s clear that there’s a lot more inflation in the system than is reflected in the CPI. Hence, it’s become a matter of how that inflation will be managed — and by whom.
It’s also worth noting that there are deflationary pressures afoot in the world’s economy today. China, absorbing millions of new workers into its labor pool, is exporting cheap goods around the globe. The United States is the destination for a disproportionate share of that production, and the Chinese are financing our purchases. For the moment, that practice has helped to prop up the U.S. dollar. In the long run, it has unsettling implications.
As we look at 2005, there are a lot of moving parts out there — inflation, deflation, Iraq, China, the ups-and-downs of the U.S. dollar, and the mind-boggling developments in technology with their transformative effects on both our corporate and personal lives. Rapidly aging populations in Europe and China will cause seismic demographic shifts that we believe will have a long-term, dramatic effect on the world economy and markets.
Thanks for your continued investment.

Richard T. Weiss
Strong Financial Corporation
Strong Advisor Common Stock Fund
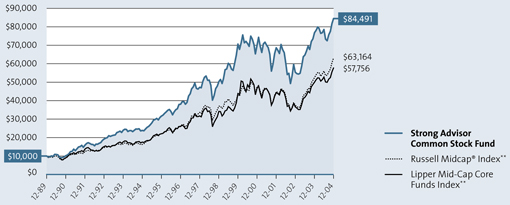
Continuing the previous year’s bull market, the U.S. stock market posted another positive year in 2004. The Strong Advisor Common Stock Fund’s Class Z shares gained 9.96% for the 12 months ending December 31, 2004. This result trailed that of the Fund’s broad-based benchmark, the Russell Midcap Index, which returned 20.22% during the same period.
A growing economy and higher rates
Strong consumer spending continued to carry the economy during 2004, while corporate spending gradually strengthened. The Federal Reserve continued to raise interest rates gradually during the period — exemplifying its confidence in the economy’s underlying strength. The Fed initiated five separate quarter-percentage-point rate hikes between June 30 and the end of the year.
We positioned the Strong Advisor Common Stock Fund with an expectation for higher rates and an aggressive economic recovery in 2004. The market rose only modestly for the first two-thirds of the year, as uncertainty surrounded the outcome of the U.S. presidential election and energy costs continued to rise. However, in the year’s fourth quarter, after the election ended in decisive fashion and energy prices began declining, the stock market rallied and ended the year on a very positive note.
Choosing stocks for the portfolio
The Strong Advisor Common Stock Fund uses a private market methodology to build its portfolio of securities. In other words, our investment process leads us to evaluate companies’ competitive strengths, assets, and financial position. We synthesize this information to gauge the value an independent buyer would pay for the entire company, and then we look for stocks to buy that are trading at a discount to that value.
This process attracted us to the Internet sector, especially in companies helping to rejuvenate the advertising business. We believed that Internet advertising companies would benefit from the rising economy as well as take market share from traditional advertising businesses.
DoubleClick was an investment based on this thesis. After the Internet “bubble” burst several years ago, the stock represented a compelling opportunity for value investors attracted to its reasonable price. After the company changed its business model several times in 2003, we concluded that DoubleClick’s acquisitions would complement positive trends we forecasted for Internet stocks in 2004.
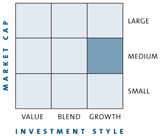
Morningstar® Style Box™ *
Despite a favorable operating environment in 2004, DoubleClick faced challenges in integrating several of its acquisitions. Also, the company’s core ad-serving technology could not withstand pricing pressure from its competition. In the last quarter of 2004, the company announced intentions to explore strategic opportunities to increase shareholder value. Against this backdrop, DoubleClick was a disappointing performer for the Fund during the period. More helpful for performance was the Fund’s overweight position in energy stocks, which generally enjoyed very strong results. In 2004 we saw record-high energy prices, caused principally by a combination of a strengthening global economy and tightening crude oil and natural gas supplies. As energy companies increased their production to take advantage of the higher prices, the number of drilling rigs worldwide increased significantly.
One energy stock we owned during the period was Noble Corporation, which has one of the world’s most diverse fleets of offshore rigs. As drilling activity increased, the utilization rates of the rigs also increased, allowing Noble Corporation to receive higher day rates. Energy analysts expect that the financial leverage from the increased drilling activity may be fully realized in 2005, for which earnings estimates are more than 80% above 2004 levels. This anticipated future financial strength caused Noble Corporation’s stock price to appreciate nearly 40% during 2004.
What lies ahead?
Our outlook for 2005 depends on several factors, including the pressure of inflation, the dollar’s resilience to large trade and fiscal deficits, and the need for more rapid economic growth from countries outside of the United States. Consumer spending is starting to drop off slightly, but we expect that increased corporate spending and lower fuel costs should support the continued economic recovery.
The Fund is expected to reorganize into the Wells Fargo Advantage Common Stock Fund, the successor to the Strong Advisor Common Stock Fund, on or about April 11, 2005.
We appreciate your trust in our investment expertise and are committed to providing you with positive long-term performance. Best wishes for a happy, healthy, and profitable 2005.
Richard T. Weiss
Portfolio Co-Manager
Ann M. Miletti
Portfolio Co-Manager
| * | The Morningstar Style Box™ reflects a fund’s investment strategy. For equity funds, the vertical axis shows the market capitalization of the stocks owned and the horizontal axis shows investment style (value, blend, or growth). |
Mention of specific securities in this report is not indicative of whether the Fund may make additional purchases of, sell all or a portion of, or continue to hold those securities.
2
Fund Highlights
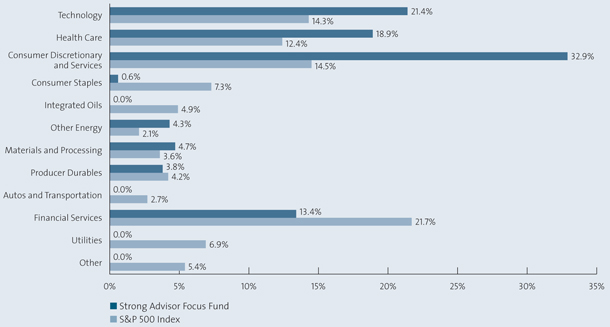
Sector Weightings
Percent of Net Assets, as of 12-31-04
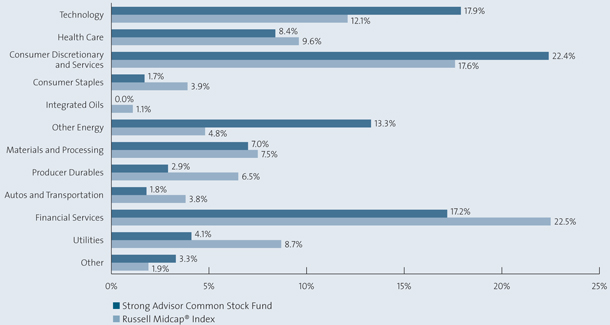
| Source: Frank Russell Company via FactSet |
Fund Highlights are continued on next page.
3
Strong Advisor Common Stock Fund
Growth of an Assumed $10,000 Investment†
From 12-29-89 to 12-31-04
Performance is historical and does not guarantee future results. Investment returns and principal value will fluctuate, and you may have a gain or loss when you sell shares. Current performance may be lower or higher than the quoted performance. Call us or visit www.Strong.com for the most recent month-end performance.
| † | This graph, provided in accordance with SEC regulations, compares a $10,000 investment in the Fund, made at its inception, with the performance of the Russell Midcap® Index and the Lipper Mid-Cap Core Funds Index. Results include the reinvestment of all dividends and capital gains distributions. The graph and the Average Annual Total Returns table do not reflect the deduction of taxes, if any, that a shareholder would pay on Fund distributions or the redemption of Fund shares. This graph is based on Class Z shares only; performance for other classes will vary due to differences in fee structures. |
Definitions:
| ** | The Russell Midcap® Index measures the performance of the 800 smallest companies in the Russell 1000 Index, which represent approximately 26% of the total market capitalization of the Russell 1000 Index. The Lipper Mid-Cap Core Funds Index is the average of the 30 largest funds in the Lipper Mid-Cap Core Funds Category. Source of the Russell Index data is Standard & Poor’s Micropal. Source of the Lipper Index data is Lipper. |
It is not possible to invest directly in an index.
Top Holdings
Percent of Net Assets, as of 12-31-04
Noble Corporation | 2.5 | % | |
Burlington Resources, Inc. | 2.3 | % | |
Cablevision Systems New York Group Class A | 2.2 | % | |
Apache Corporation | 2.1 | % | |
Mentor Graphics Corporation | 1.8 | % | |
Lonza Group AG | 1.8 | % | |
Smith International, Inc. | 1.8 | % | |
Pactiv Corporation | 1.8 | % | |
City National Corporation | 1.7 | % | |
EOG Resources, Inc. | 1.7 | % | |
| Top Ten | 19.7 | % | |
Holdings vary. More complete holdings are available at www.Strong.com.
Percentage Restrictions: The Fund’s prospectus and statement of additional information may describe restrictions on the percentage of a particular type or quality of security in which the Fund may invest (“Percentage Restrictions”). Percentage Restrictions apply at the time the Fund purchases a security. Circumstances subsequent to the purchase of the security, such as a change in: (1) the Fund’s assets (e.g., due to cash inflows and redemptions), (2) the market value of the security, or (3) the pricing, liquidity, or rating of the security, may cause the Fund to exceed or fall short of the Percentage Restriction. If this happens, the Fund’s continued holding of the security will not constitute a violation of the Percentage Restriction.
4
Average Annual Total Returns
As of 12-31-04
Class A1,2 | |||
1-year | 3.37 | % | |
5-year | 2.14 | % | |
10-year | 12.44 | % | |
Since Fund Inception (12-29-89) | 14.45 | % |
Class A, excluding sales load | |||
1-year | 9.67 | % | |
5-year | 3.36 | % | |
10-year | 13.11 | % | |
Since Fund Inception (12-29-89) | 14.90 | % |
Class B1,2 | |||
1-year | 3.89 | % | |
5-year | 2.32 | % | |
10-year | 12.66 | % | |
Since Fund Inception (12-29-89) | 14.62 | % |
Class C1,2 | |||
1-year | 7.84 | % | |
5-year | 2.68 | % | |
10-year | 12.48 | % | |
Since Fund Inception (12-29-89) | 14.30 | % |
Class Z1,3 | |||
1-year | 9.96 | % | |
5-year | 3.64 | % | |
10-year | 13.47 | % | |
Since Fund Inception (12-29-89) | 15.28 | % |
Performance is historical and does not guarantee future results. Investment returns and principal value will fluctuate, and you may have a gain or loss when you sell shares. Current performance may be lower or higher than the quoted performance. Call us or visit www.Strong.com for the most recent month-end performance.
Fee Waivers:
| 1 | From time to time, the Fund’s advisor and/or administrator has waived fees and/or absorbed Fund expenses, which has resulted in higher returns. As of 12-31-04, there are waivers and/or absorptions in effect for all share classes. |
Performance:
| 2 | Average annual total returns reflect the effect of the maximum sales charge of 5.75% for Class A, the applicable contingent deferred sales charge of 5.00% in year 1 and eliminated after year 6 for Class B, and the applicable contingent deferred sales charge of 1.00% and eliminated after 12 months for Class C. The performance of the Class A, B, and C shares is based on the performance of the Fund’s Class Z shares (formerly Retail Class shares) prior to 11-30-00. The performance of the Class A shares is restated to reflect the load and the different expenses of the Class A shares, as applicable. The performance of the Class B shares is restated to reflect the contingent deferred sales charge and the different expenses of the Class B shares, as applicable. The performance of the Class C shares is restated to reflect the contingent deferred sales charge and the different expenses of the Class C shares, as applicable. |
Please consult a prospectus for information about all share classes.
From time to time, the Fund’s performance was significantly enhanced through investments in initial public offerings (IPOs). In addition, the effect of IPOs purchased when the Fund’s asset base was small may have been magnified. Given these circumstances, you should not expect that such enhanced returns can be consistently achieved. Please consider this before investing.
General:
| 3 | The Class Z shares are closed to new accounts, though the Fund may continue to offer its shares to certain company-sponsored retirement plans, institutional investors meeting specific eligibility requirements, and other limited groups as described in the prospectus. |
Top Ten Industries
Percent of Net Assets, as of 12-31-04
Oil & Gas — United States Exploration & Production | 6.1 | % | |
Media — Cable TV | 6.1 | % | |
Electronics — Semiconductor Manufacturing | 5.3 | % | |
Insurance — Property/Casualty/Title | 4.1 | % | |
Oil & Gas — Drilling | 4.0 | % | |
Medical/Dental — Services | 2.7 | % | |
Retail — Department Stores | 2.6 | % | |
Computer — IT Services | 2.4 | % | |
Medical — Biomedical/Biotechnology | 2.4 | % | |
Medical — Products | 2.4 | % | |
| Top Ten | 38.1 | % | |
Risks: Stock funds should only be considered for long-term goals as values fluctuate in response to the activities of individual companies and general market and economic conditions. Investment strategies that concentrate in particular market segments or fewer securities tend to increase the total risk of an investment (relative to the broader market). This Fund is exposed to the following specific risks: growth-style investing risk and small- and medium-company risk. Consult the Fund’s prospectus for additional information on these and other risks.
5
Strong Advisor Mid Cap Growth Fund
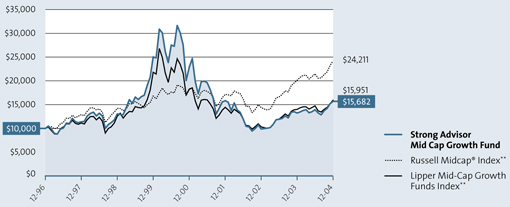
Recording its second consecutive year of positive double-digit returns, the Strong Advisor Mid Cap Growth Fund Class Z shares recorded a gain of 18.41% during 2004. Though the fund performed well, it fell short of the 20.22% return registered by the broad-based Russell Midcap Index.
During 2004, mid-cap value stocks outperformed mid-cap growth stocks by a wide margin, continuing a pattern we have seen for four of the last five years. This worked against our ability to beat the Russell Midcap Index, which includes both growth and value stocks. Other sources of weakness compared with the benchmark included Fund holdings in generic drug, homebuilding, and biotechnology stocks.
Positive contributors to the Fund’s performance came most noticeably from the consumer discretionary sector, including names such as Starbucks, Harman International, and Station Casinos. Energy was another area of strength for the Fund, led by outstanding performance from Ultra Petroleum, a fast-growing exploration and production company. Other standout positive contributors were Puerto Rican bank, Doral Financial, and technology leaders Apple Computer and Marvell Technology.
Capitalizing on strong, sustainable growth
We believe earnings and revenue growth are critical factors in determining stock price movements. Thus, our research process is centered around finding companies with the prospects for robust and sustainable growth in earnings and revenue. To find that growth, we use thorough, hands-on research, emphasizing the potential profitability of a company’s business model and management’s track record in successfully executing its strategy. We then combine that company-specific analysis with our assessment of macroeconomic, secular, and technical trends to form a decision about whether to invest in a particular stock.
For example, several months ago, we purchased shares of Ultra Petroleum because we believed it had tremendous potential profitability — extremely high production growth combined with the industry’s lowest cost structure. Our conclusion was that Ultra Petroleum’s high production growth rate was likely to continue for several more years, driven by the strength of its drilling prospects and management’s solid track record. Finally, an investment in Ultra Petroleum made sense given the team’s positive overall outlook for crude oil and natural gas prices. Ultra Petroleum was up 95% in 2004 and was one of the Fund’s largest holdings as of December 31, 2004.
Morningstar® Style Box™*

The importance of effective selling criteria
Deciding when to sell a stock is just as important as deciding when to buy. Our selling criteria are essentially the opposite of our buying criteria. We may sell a stock when we see a deterioration in its fundamental qualities that causes us to become suspicious about the company’s prospective growth profile or the potential profitability of its business model. Examples of events that can trigger this suspicion are questionable earnings reports, new competitive threats, changes in the economy, or changes in management personnel.
In July of 2004, following its latest quarterly earnings report, we began selling shares of eResearch Technology, which provides software and consulting services to help companies streamline the Food and Drug Administration approval process. For the first time in several quarters, eResearch failed to post earnings that were higher than analysts’ estimates. Also, the growth in backlog of orders, a leading indicator of future growth, slowed dramatically. Our instincts to get more cautious proved accurate. In the following weeks and months, eResearch management guided analysts’ forecasts lower for the remainder of 2004 and for 2005. After falling as low as $10.70 in October, the stock finished the year at $15.85, down sharply from our initial sales in the mid $20s.
Looking ahead
As we begin 2005, our outlook for the next several months remains positive, as we expect the economy to benefit from continued low interest rates and inflation. This environment should allow for solid growth in corporate profits, which is typically beneficial to stock prices. We plan to continue to seek out the fastest-growing companies we can identify that we believe fit within the framework of our investment process.
Effective February 18, 2005, Jerome “Cam” Philpott, CFA, and Stuart Roberts of Wells Capital Management Incorporated will become the Portfolio Co-Managers of the Fund. In addition, the Fund is expected to reorganize into the Wells Fargo Advantage Mid Cap Growth Fund on or about April 11, 2005.
It has been my pleasure being the Fund’s Portfolio Manager over the last year and a half. Thank you for your investment in the Strong Advisor Mid Cap Growth Fund.

Brandon Nelson
Portfolio Manager
| * | The Morningstar Style Box™ reflects a fund’s investment strategy. For equity funds, the vertical axis shows the market capitalization of the stocks owned and the horizontal axis shows investment style (value, blend, or growth). |
Mention of specific securities in this report is not indicative of whether the Fund may make additional purchases of, sell all or a portion of, or continue to hold those securities.
6
Fund Highlights
Sector Weightings
Percent of Net Assets, as of 12-31-04
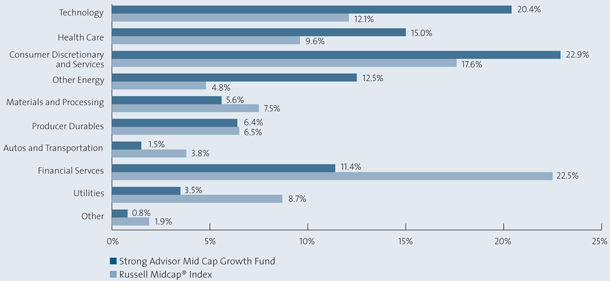
Source: Frank Russell Company via FactSet
Fund Highlights are continued on next page.
7
Strong Advisor Mid Cap Growth Fund
Growth of an Assumed $10,000 Investment†
From 12-31-96 to 12-31-04
Performance is historical and does not guarantee future results. Investment returns and principal value will fluctuate, and you may have a gain or loss when you sell shares. Current performance may be lower or higher than the quoted performance. Call us or visit www.Strong.com for the most recent month-end performance.
| † | This graph, provided in accordance with SEC regulations, compares a $10,000 investment in the Fund, made at its inception, with the performance of the Russell Midcap® Index and the Lipper Mid-Cap Growth Funds Index. Results include the reinvestment of all dividends and capital gains distributions. The graph and the Average Annual Total Returns table do not reflect the deduction of taxes, if any, that a shareholder would pay on Fund distributions or the redemption of Fund shares. This graph is based on Class Z shares only; performance for other classes will vary due to differences in fee structures. |
Definitions:
| ** | The Russell Midcap® Index measures the performance of the 800 smallest companies in the Russell 1000 Index, which represent approximately 26% of the total market capitalization of the Russell 1000 Index. The Lipper Mid-Cap Growth Funds Index is the average of the 30 largest funds in the Lipper Mid-Cap Growth Funds Category. Source of the Russell Index data is Standard & Poor’s Micropal. Source of the Lipper Index data is Lipper. |
It is not possible to invest directly in an index.
Top Holdings
Percent of Net Assets, as of 12-31-04
Ultra Petroleum Corporation | 3.6 | % | |
Doral Financial Corporation | 3.3 | % | |
Starbucks Corporation | 3.1 | % | |
Apple Computer, Inc. | 2.8 | % | |
Marvell Technology Group, Ltd. | 2.7 | % | |
Station Casinos, Inc. | 2.5 | % | |
Cognizant Technology Solutions Corporation Class A | 2.4 | % | |
Sierra Health Services, Inc. | 2.4 | % | |
Marriott International, Inc. Class A | 2.1 | % | |
Alliance Data Systems Corporation | 2.0 | % | |
| Top Ten | 26.9 | % | |
Holdings vary. More complete holdings are available at www.Strong.com.
Percentage Restrictions: The Fund’s prospectus and statement of additional information may describe restrictions on the percentage of a particular type or quality of security in which the Fund may invest (“Percentage Restrictions”). Percentage Restrictions apply at the time the Fund purchases a security. Circumstances subsequent to the purchase of the security, such as a change in: (1) the Fund’s assets (e.g., due to cash inflows and redemptions), (2) the market value of the security, or (3) the pricing, liquidity, or rating of the security, may cause the Fund to exceed or fall short of the Percentage Restriction. If this happens, the Fund’s continued holding of the security will not constitute a violation of the Percentage Restriction.
8
Average Annual Total Returns
As of 12-31-04
Class A1,2 | |||
1-year | 11.58 | % | |
5-year | -10.00 | % | |
Since Fund Inception (12-31-96) | 4.87 | % |
Class A, excluding sales load | |||
1-year | 18.43 | % | |
5-year | -8.93 | % | |
Since Fund Inception (12-31-96) | 5.65 | % |
Class B1,2 | |||
1-year | 12.71 | % | |
5-year | -10.12 | % | |
Since Fund Inception (12-31-96) | 5.07 | % |
Class C1,2 | |||
1-year | 16.71 | % | |
5-year | -9.51 | % | |
Since Fund Inception (12-31-96) | 5.07 | % |
Class Z1,3 | |||
1-year | 18.41 | % | |
5-year | -8.93 | % | |
Since Fund Inception (12-31-96) | 5.79 | % |
Performance is historical and does not guarantee future results. Investment returns and principal value will fluctuate, and you may have a gain or loss when you sell shares. Current performance may be lower or higher than the quoted performance. Call us or visit www.Strong.com for the most recent month-end performance.
Fee Waivers:
| 1 | From time to time, the Fund’s advisor and/or administrator has waived fees and/or absorbed Fund expenses, which has resulted in higher returns. As of 12-31-04, there are waivers and/or absorptions in effect for all share classes. |
Performance:
| 2 | Average annual total returns reflect the effect of the maximum sales charge of 5.75% for Class A, the applicable contingent deferred sales charge of 5.00% in year 1 and eliminated after year 6 for Class B, and the applicable contingent deferred sales charge of 1.00% and eliminated after 12 months for Class C. The performance of the Class A, B, and C shares is based on the performance of the Fund’s Class Z shares (formerly Retail Class shares) prior to 11-30-00. The performance of the Class A shares is restated to reflect the load and the different expenses of the Class A shares, as applicable. The performance of the Class B shares is restated to reflect the contingent deferred sales charge and the different expenses of the Class B shares, as applicable. The performance of the Class C shares is restated to reflect the contingent deferred sales charge and the different expenses of the Class C shares, as applicable. |
Please consult a prospectus for information about all share classes.
From time to time, the Fund’s performance was significantly enhanced through investments in initial public offerings (IPOs). In addition, the effect of IPOs purchased when the Fund’s asset base was small may have been magnified. Given these circumstances, you should not expect that such enhanced returns can be consistently achieved. Please consider this before investing.
General:
| 3 | The Class Z shares are closed to new accounts, though the Fund may continue to offer its shares to certain company-sponsored retirement plans, institutional investors meeting specific eligibility requirements, and other limited groups as described in the prospectus. |
Top Ten Industries
Percent of Net Assets, as of 12-31-04
Oil & Gas — United States Exploration & Production | 8.4 | % | |
Medical — Health Maintenance Organizations | 6.8 | % | |
Financial Services — Miscellaneous | 5.6 | % | |
Electronics — Semiconductor Manufacturing | 4.3 | % | |
Leisure — Gaming/Equipment | 3.5 | % | |
Leisure — Hotels & Motels | 3.4 | % | |
Computer — IT Services | 3.3 | % | |
Finance — Mortgage & Related Services | 3.3 | % | |
Retail — Restaurants | 3.1 | % | |
Telecommunications — Wireless Services | 3.1 | % | |
| Top Ten | 44.8 | % | |
Risks: Stock funds should only be considered for long-term goals as values fluctuate in response to the activities of individual companies and general market and economic conditions. Investment strategies that concentrate in particular market segments or fewer securities tend to increase the total risk of an investment (relative to the broader market). This Fund is exposed to the following specific risks: small- and medium-company risk. Consult the Fund’s prospectus for additional information on these and other risks.
9
Strong Advisor Small Cap Value Fund
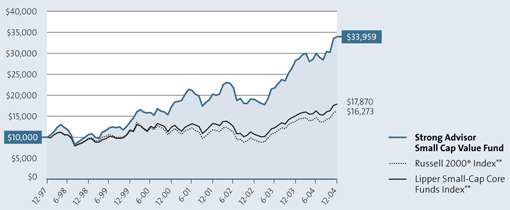
The U.S. equity markets fluctuated for much of 2004 before turning in a strong rally in the fourth quarter. Despite rising interest rates, investors were cheered in part by an incumbent winning the U.S. presidential race and crude oil prices easing from their all-time highs. For the 12 months ending December 31, 2004, the Strong Advisor Small Cap Value Fund’s Class Z shares returned 20.09% versus the 18.33% return of its benchmark, the Russell 2000 Index.
Small-capitalization value stocks outperformed their large-and mid-cap counterparts during the period. In fact, small-cap value was one of the top-performing asset classes in 2004. What’s more, the Russell 2000 Index, which includes both value and growth stocks from the small-cap sector, reached record highs during the year and has outperformed the S&P 500 Index, which is dominated by large-cap stocks, for six years in a row.
The small-cap value asset class contains many stocks that are underfollowed, undervalued, and underloved. Our team employs a qualitative and quantitative screening process, followed by fundamental research, which allows only companies that meet our high standards to become holdings in the Fund.
Industrials, materials, and energy aided performance
The industrials and materials sectors added value to the Fund. Within industrials, stocks in construction and engineering, along with commercial services and supplies, performed well and were among the top contributors for the period. Meanwhile, chemical names aided performance in the materials sector. PolyOne Corporation, a specialty polymer manufacturer, was a strong performer from sales of its resin products. On the other hand, despite a solid rally in metals and mining stocks in the third quarter, the Fund experienced a pullback in many of these names during the fourth quarter. However, we continued to have conviction in these stocks, as we believed they could add significant value to the Fund over the long term.
The energy sector — in which the Fund remained overweighted compared to the benchmark during the period — also contributed to performance. Several energy equipment and services names, as well as oil and gas securities, were top contributors to performance. Range Resources was a top performer for the energy sector as the oil services and natural gas firm reported higher than expected natural gas reserves. Range Resources is an independent oil and gas company operating in the Southwest, Gulf Coast and Appalachian regions of the United States. In addition, Global Industries, an offshore oil pipeline services firm, was a strong contributor. Global has the largest fleet of service vessels available in the Gulf of Mexico. Many of our energy holdings have been long-term positions for the Fund. While some of these stocks lost ground near the end of the year as energy prices retreated from their October highs, we believed the valuations of the Fund’s energy holdings remained attractive. Investors’ concerns about energy supplies, coupled with international political unrest and high global demand, led us to maintain a positive outlook for this sector throughout 2004.
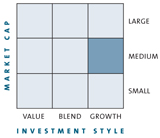
Morningstar® Style Box™ *

Late in the year, the Fund’s consumer discretionary stocks began moving up, with commercial services and retailers leading performance. The Fund owned well known, yet underfollowed, stocks such as American Eagle Outfitters, Stamps.com, and Circuit City Stores, all of which contributed to performance.
Technology and financials disappointed
The technology sector slightly detracted from the Fund’s performance for the year. Some technology names rebounded near year end after a difficult third quarter. Software and computer stocks, in particular, produced solid returns and helped performance compared with the benchmark. However, some semiconductor stocks were hit hard at the end of the fourth quarter, namely Cirrus Logic, a multimedia chipmaker for the consumer entertainment industry (DVDs, televisions, digital home theater systems), as well as solutions for automotive and industrial applications. We believed that many technology holdings became overvalued during the year, and therefore we were selective in this area, as we have been for several years.
The Fund also underperformed the benchmark in the financials sector. We remained cautious about this area, especially the banking industry, in which the Fund was significantly underweighted compared to the benchmark. Given the rising interest-rate environment, we believed traditional banks might experience downward pressure on their profit margins. We continued to look for companies with the ability to increase revenue growth while possessing underlying fundamentals that met our stringent criteria. Select names within the insurance industry illustrated this point. Versus the benchmark, the Fund maintains a lower concentration of real estate securities, specifically REITs. Due to this underweighting, the Fund underperformed in this area for the year.
Looking ahead
Despite significant outperformance by the small-cap value asset class during the past six years, we believe many opportunities still exist. While valuations in some groups such as technology and financials appear overextended, we remain alert for pullbacks that could present opportunities for adding to positions in which we have conviction. Meanwhile, our outlook on energy remains constructive, and we continue to maintain larger investments in the sector based on our belief that certain industries in it offer the potential for strong and sustainable earnings growth.
The Fund is expected to reorganize into the Wells Fargo Advantage Small Cap Value Fund, the successor to the Strong Advisor Small Cap Value Fund, on or about April 11, 2005.
Thank you for your investment in the Strong Advisor Small Cap Value Fund.
I. Charles Rinaldi
Portfolio Manager
| * | The Morningstar Style Box™ reflects a fund’s investment strategy. For equity funds, the vertical axis shows the market capitalization of the stocks owned and the horizontal axis shows investment style (value, blend, or growth). |
Mention of specific securities in this report is not indicative of whether the Fund may make additional purchases of, sell all or a portion of, or continue to hold those securities.
10
Fund Highlights
Sector Weightings
Percent of Net Assets, as of 12-31-04
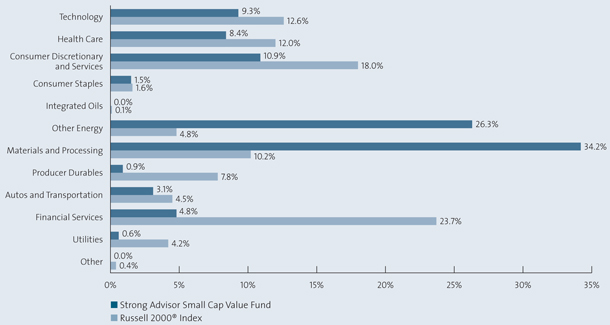
| Source: Frank Russell Company via FactSet | ||
| Fund Highlights are continued on next page. | ||
11
Strong Advisor Small Cap Value Fund
Growth of an Assumed $10,000 Investment†
From 12-31-97 to 12-31-04
Performance is historical and does not guarantee future results. Investment returns and principal value will fluctuate, and you may have a gain or loss when you sell shares. Current performance may be lower or higher than the quoted performance. Call us or visit www.Strong.com for the most recent month-end performance.
| † | This graph, provided in accordance with SEC regulations, compares a $10,000 investment in the Fund, made at its inception, with the performance of the Russell 2000® Index and the Lipper Small-Cap Core Funds Index. Results include the reinvestment of all dividends and capital gains distributions. The graph and the Average Annual Total Returns table do not reflect the deduction of taxes, if any, that a shareholder would pay on Fund distributions or the redemption of Fund shares. This graph is based on Class Z shares only; performance for other classes will vary due to differences in fee structures. |
Definitions:
| ** | The Russell 2000® Index measures the performance of the 2,000 smallest companies in the Russell 3000 Index, which represents approximately 8% of the total market capitalization of the Russell 3000 Index. The Lipper Small-Cap Core Funds Index is the average of the 30 largest funds in the Lipper Small-Cap Core Funds Category. Source of the Russell Index data is Standard & Poor’s Micropal. Source of the Lipper Index data is Lipper. |
It is not possible to invest directly in an index.
Top Holdings
Percent of Net Assets, as of 12-31-04
Range Resources Corporation | 4.2 | % | |
Chicago Bridge & Iron Company NV | 3.0 | % | |
Forest Oil Corporation | 2.7 | % | |
Glamis Gold, Ltd. | 2.6 | % | |
Global Industries, Ltd. | 2.2 | % | |
United States Steel Corporation | 2.0 | % | |
Apex Silver Mines, Ltd. | 1.9 | % | |
UNOVA, Inc. | 1.8 | % | |
Steel Dynamics, Inc. | 1.6 | % | |
Beverly Enterprises, Inc. | 1.6 | % | |
| Top Ten | 23.6 | % | |
Holdings vary. More complete holdings are available at www.Strong.com.
Percentage Restrictions: The Fund’s prospectus and statement of additional information may describe restrictions on the percentage of a particular type or quality of security in which the Fund may invest (“Percentage Restrictions”). Percentage Restrictions apply at the time the Fund purchases a security. Circumstances subsequent to the purchase of the security, such as a change in: (1) the Fund’s assets (e.g., due to cash inflows and redemptions), (2) the market value of the security, or (3) the pricing, liquidity, or rating of the security, may cause the Fund to exceed or fall short of the Percentage Restriction. If this happens, the Fund’s continued holding of the security will not constitute a violation of the Percentage Restriction.
12
Average Annual Total Returns
As of 12-31-04
Class A1,2 | |||
1-year | 13.00 | % | |
5-year | 18.47 | % | |
Since Fund Inception (12-31-97) | 17.83 | % |
Class A, excluding sales load | |||
1-year | 19.89 | % | |
5-year | 19.88 | % | |
Since Fund Inception (12-31-97) | 18.83 | % |
Class B1,2 | |||
1-year | 13.95 | % | |
5-year | 18.88 | % | |
Since Fund Inception (12-31-97) | 18.83 | % |
Class C1,2 | |||
1-year | 18.00 | % | |
5-year | 19.13 | % | |
Since Fund Inception (12-31-97) | 18.15 | % |
Class Z1,3 | |||
1-year | 20.09 | % | |
5-year | 20.10 | % | |
Since Fund Inception (12-31-97) | 19.08 | % |
Performance is historical and does not guarantee future results. Investment returns and principal value will fluctuate, and you may have a gain or loss when you sell shares. Current performance may be lower or higher than the quoted performance. Call us or visit www.Strong.com for the most recent month-end performance.
Fee Waivers:
| 1 | From time to time, the Fund’s advisor and/or administrator has waived fees and/or absorbed Fund expenses, which has resulted in higher returns. As of 12-31-04, there are waivers and/or absorptions in effect for all share classes. |
Performance:
| 2 | Average annual total returns reflect the effect of the maximum sales charge of 5.75% for Class A, the applicable contingent deferred sales charge of 5.00% in year 1 and eliminated after year 6 for Class B, and the applicable contingent deferred sales charge of 1.00% and eliminated after 12 months for Class C. The performance of the Class A, B, and C shares is based on the performance of the Fund’s Class Z shares (formerly Retail Class shares) prior to 11-30-00. The performance of the Class A shares is restated to reflect the load and the different expenses of the Class A shares, as applicable. The performance of the Class B shares is restated to reflect the contingent deferred sales charge and the different expenses of the Class B shares, as applicable. The performance of the Class C shares is restated to reflect the contingent deferred sales charge and the different expenses of the Class C shares, as applicable. |
Please consult a prospectus for information about all share classes.
From time to time, the Fund’s performance was significantly enhanced through investments in initial public offerings (IPOs). In addition, the effect of IPOs purchased when the Fund’s asset base was small may have been magnified. Given these circumstances, you should not expect that such enhanced returns can be consistently achieved. Please consider this before investing.
General:
| 3 | The Class Z shares are closed to new accounts, though the Fund may continue to offer its shares to certain company-sponsored retirement plans, institutional investors meeting specific eligibility requirements, and other limited groups as described in the prospectus. |
Top Ten Industries
Percent of Net Assets, as of 12-31-04
Oil & Gas — United States Exploration & Production | 12.2 | % | |
Oil & Gas — Field Services | 8.9 | % | |
Metal Ores — Gold/Silver | 8.8 | % | |
Steel — Producers | 5.6 | % | |
Oil & Gas — Drilling | 3.7 | % | |
Building — Heavy Construction | 3.0 | % | |
Insurance — Property/Casualty/Title | 2.8 | % | |
Commercial Services — Security/Safety | 2.7 | % | |
Commercial Services — Staffing | 2.4 | % | |
Medical — Nursing Homes | 2.4 | % | |
| Top Ten | 52.5 | % | |
Risks: Stock funds should only be considered for long-term goals as values fluctuate in response to the activities of individual companies and general market and economic conditions. Investment strategies that concentrate in particular market segments or fewer securities tend to increase the total risk of an investment (relative to the broader market). This Fund is exposed to the following specific risks: value-style investing risk and small-company risk. Consult the Fund’s prospectus for additional information on these and other risks.
13
Strong Advisor U.S. Value Fund
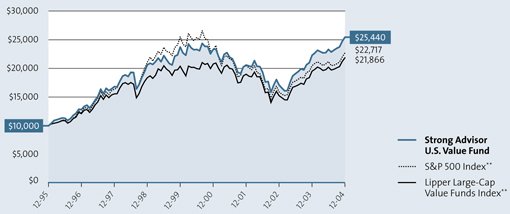
The Strong Advisor U.S. Value Fund outperformed its broad-based index, the S&P 500 Index for the year ended December 31, 2004. The Fund’s Class Z shares returned 14.11%, while the S&P 500 Index returned 10.87%.
The first half of 2004 delivered high-energy prices, robust economic data, and solid corporate profits. However, the third quarter was sluggish due to fears that the economy had hit a soft spot. Employment numbers, which were weak in the early stages of the third quarter, turned positive in the final month, which encouraged investors. After the presidential elections in November, we observed a powerful rally in share prices, a resurgence of positive economic data, and a decline in energy prices. The persistence of these positive indicators supported a consensus that a market rally could be sustainable, amid growing concerns over a weaker U.S. dollar, rising interest rates, and a prolonged rebuilding effort in Iraq.
Finding “the right company at the right price”
Our disciplined investment process focuses on finding the right company at the right price at the right time. We spend virtually all of our time and effort on bottom-up, fundamental stock research. Individual stock selection, not sector allocation, drives the Fund’s performance. During the period, stock selection was particularly strong in financials, utilities, and information technology. The strength of stocks this year, particularly in the fourth quarter, was driven by the optimism of not only shareholders but also corporate managers. Merger-and-acquisition activity heated up significantly, and the Fund owned a number of stocks involved in this trend. Bank One, Charter One Financial, Cox Communications, Provident Financial Group, Public Service Enterprise Group, and SOLA International all received takeover bids, directly benefiting our performance.
The Fund’s sector weightings are the direct result of our individual company selections, rather than top-down, macroeconomic considerations. That said, the portfolio benefited this year from having a significant presence in energy, industrial, and utility sectors. As the year progressed, we shifted some energy exposure from exploration and production (E&P) to oil services — for example, Cooper Cameron — amid the euphoric sentiment created by industry consolidation in the E&P group. Moreover, as industrials moved to all-time highs during the year, we moved to an underweighting, compared to the benchmark, in this sector. Within utilities, where we also took profits but remained largely invested throughout the year, electric utility holdings such as First Energy and TXU were standout performers.
Morningstar® Style Box™ *
Investments in insurance
Our stance on financial stocks, which was to sell bank stocks into strength and to buy insurance stocks into weakness, has been relatively unchanged for several years and served us well during 2004. Financials have been consistent market performers over this period, never falling out of favor. In fact, financials delivered record earnings and traded at record high prices. One of the primary reasons that value indices have performed so much better than growth indices over the last five years has been the strength in financials. Overall, we significantly reduced financials into 2004’s strength. Within financials, we continued to overweight insurance compared to the benchmark, with names like Loews and SAFECO aiding performance.
The Fund benefited from having fewer investments in the very weak technology sector. Despite the sector’s weakness, we were able to take advantage of some specific opportunities and were rewarded for this selectivity through the performance of software giant Microsoft and semiconductor maker Texas Instruments.
Our consumer discretionary stocks proved to be drags on performance. Lack of exposure to faster-growing industries such as Internet and catalog retailing detracted from performance. We continued to believe our larger holdings in this sector, Clear Channel Communications and Reader’s Digest Association, represented exceptional value and added to both during the year.
As in 2003, the year saw considerable weakness in the U.S. dollar, a condition that is typically more beneficial for larger companies, as they are more likely to be exporters and can therefore benefit from stronger currencies abroad. Despite this, small caps outperformed again in 2004. After six years of underperformance, we believe it is reasonable for investors in large-cap stocks to expect them to play “catch-up” in 2005 and beyond.
Focusing on out-of-favor stocks
We will continue to keep our heads down and our eyes open, seeking out companies with solid assets, manageable debt levels, and credible management teams. We will work to buy the stocks of these companies at attractive prices — which often come when they are temporarily out of favor with investors. Discipline and patience, along with a strong focus on risk management, continue to be hallmarks of our management style.
The Fund is expected to reorganize into the Wells Fargo Advantage U.S. Value Fund, the successor to the Strong Advisor U.S. Value Fund, on or about April 11, 2005.
Thank you for your investment in the Strong Advisor U.S. Value Fund.

Robert J. Costomiris
Portfolio Manager
| * | The Morningstar Style Box™ reflects a fund’s investment strategy. For equity funds, the vertical axis shows the market capitalization of the stocks owned and the horizontal axis shows investment style (value, blend, or growth). |
Mention of specific securities in this report is not indicative of whether the Fund may make additional purchases of, sell all or a portion of, or continue to hold those securities.
14
Fund Highlights
Sector Weightings
Percent of Net Assets, as of 12-31-04
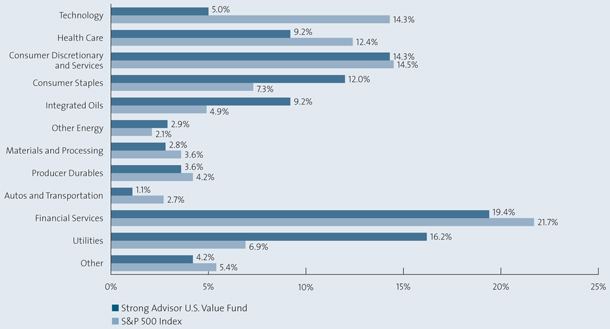
| Source: Frank Russell Company via FactSet | ||
| Fund Highlights are continued on next page. | ||
15
Strong Advisor U.S. Value Fund
Growth of an Assumed $10,000 Investment†
From 12-29-95 to 12-31-04
Performance is historical and does not guarantee future results. Investment returns and principal value will fluctuate, and you may have a gain or loss when you sell shares. Current performance may be lower or higher than the quoted performance. Call us or visit www.Strong.com for the most recent month-end performance.
| † | This graph, provided in accordance with SEC regulations, compares a $10,000 investment in the Fund, made at its inception, with the performance of the S&P 500 Index and the Lipper Large-Cap Value Funds Index. Results include the reinvestment of all dividends and capital gains distributions. The graph and the Average Annual Total Returns table do not reflect the deduction of taxes, if any, that a shareholder would pay on Fund distributions or the redemption of Fund shares. This graph is based on Class Z shares only; performance for other classes will vary due to differences in fee structures. |
Definitions:
| ** | The S&P 500 Index consists of 500 stocks chosen for market size, liquidity, and industry group representation. It is a market value weighted index (stock price times number of shares outstanding), with each stock’s weight in the Index proportionate to its market value. The Lipper Large-Cap Value Funds Index is the average of the 30 largest funds in the Lipper Large-Cap Value Funds Category. Source of the S&P Index data is Standard & Poor’s Micropal. Source of the Lipper Index data is Lipper. |
It is not possible to invest directly in an index.
Top Holdings
Percent of Net Assets, as of 12-31-04
Exxon Mobil Corporation | 5.3 | % | |
General Electric Company | 3.5 | % | |
Comcast Corporation Class A | 3.2 | % | |
Bristol-Myers Squibb Company | 2.6 | % | |
ImClone Systems, Inc. | 2.6 | % | |
Del Monte Foods Company | 2.4 | % | |
Kraft Foods, Inc. Class A | 2.2 | % | |
The Kroger Company | 2.2 | % | |
Clear Channel Communications, Inc. | 2.1 | % | |
Cooper Cameron Corporation | 2.0 | % | |
| Top Ten | 28.1 | % | |
Holdings vary. More complete holdings are available at www.Strong.com.
Percentage Restrictions: The Fund’s prospectus and statement of additional information may describe restrictions on the percentage of a particular type or quality of security in which the Fund may invest (“Percentage Restrictions”). Percentage Restrictions apply at the time the Fund purchases a security. Circumstances subsequent to the purchase of the security, such as a change in: (1) the Fund’s assets (e.g., due to cash inflows and redemptions), (2) the market value of the security, or (3) the pricing, liquidity, or rating of the security, may cause the Fund to exceed or fall short of the Percentage Restriction. If this happens, the Fund’s continued holding of the security will not constitute a violation of the Percentage Restriction.
16
Average Annual Total Returns
As of 12-31-04
Class A1,2 | |||
1-year | 7.50 | % | |
5-year | 0.18 | % | |
Since Fund Inception (12-29-95) | 10.01 | % |
Class A, excluding sales load | |||
1-year | 14.08 | % | |
5-year | 1.38 | % | |
Since Fund Inception (12-29-95) | 10.74 | % |
Class B1,2 | |||
1-year | 8.20 | % | |
5-year | 0.28 | % | |
Since Fund Inception (12-29-95) | 10.10 | % |
Class C1,2 | |||
1-year | 12.15 | % | |
5-year | 0.67 | % | |
Since Fund Inception (12-29-95) | 10.00 | % |
Class K1,2 | |||
1-year | 14.53 | % | |
5-year | 1.81 | % | |
Since Fund Inception (12-29-95) | 11.18 | % |
Class Z1,3 | |||
1-year | 14.11 | % | |
5-year | 1.40 | % | |
Since Fund Inception (12-29-95) | 10.93 | % |
Performance is historical and does not guarantee future results. Investment returns and principal value will fluctuate, and you may have a gain or loss when you sell shares. Current performance may be lower or higher than the quoted performance. Call us or visit www.Strong.com for the most recent month-end performance.
Fee Waivers:
| 1 | From time to time, the Fund’s advisor and/or administrator has waived fees and/or absorbed Fund expenses, which has resulted in higher returns. As of 12-31-04, there are waivers and/or absorptions in effect for all share classes. |
Performance:
| 2 | Average annual total returns reflect the effect of the maximum sales charge of 5.75% for Class A, the applicable contingent deferred sales charge of 5.00% in year 1 and eliminated after year 6 for Class B, and the applicable contingent deferred sales charge of 1.00% and eliminated after 12 months for Class C. The performance of the Class A, B, and C shares is based on the performance of the Fund’s Class Z shares (formerly Retail Class shares) prior to 11-30-00. The performance of the Class A shares is restated to reflect the load and the different expenses of the Class A shares, as applicable. The performance of the Class B shares is restated to reflect the contingent deferred sales charge and the different expenses of the Class B shares, as applicable. The performance of the Class C shares is restated to reflect the contingent deferred sales charge and the different expenses of the Class C shares, as applicable. The performance of Class K shares prior to 12-31-01, is based on the Fund’s Class Z shares’ performance. |
Please consult a prospectus for information about all share classes.
General:
| 3 | The Class Z shares are closed to new accounts, though the Fund may continue to offer its shares to certain company-sponsored retirement plans, institutional investors meeting specific eligibility requirements, and other limited groups as described in the prospectus. |
Top Ten Industries
Percent of Net Assets, as of 12-31-04
Oil & Gas — International Integrated | 8.2 | % | |
Diversified Operations | 6.4 | % | |
Food — Miscellaneous Preparation | 6.0 | % | |
Medical — Biomedical/Biotechnology | 5.3 | % | |
Utility — Electric Power | 5.0 | % | |
Media — Radio/TV | 4.6 | % | |
Telecommunications — Services | 4.6 | % | |
Banks — Money Center | 4.4 | % | |
Media — Cable TV | 3.4 | % | |
Medical — Ethical Drugs | 3.2 | % | |
| Top Ten | 51.1 | % | |
Risks: Stock funds should only be considered for long-term goals as values fluctuate in response to the activities of individual companies and general market and economic conditions. Investment strategies that concentrate in particular market segments or fewer securities tend to increase the total risk of an investment (relative to the broader market). This Fund is exposed to value-style investing risk. Consult the Fund’s prospectus for additional information on this and other risks.
17
Strong Advisor Endeavor Large Cap Fund
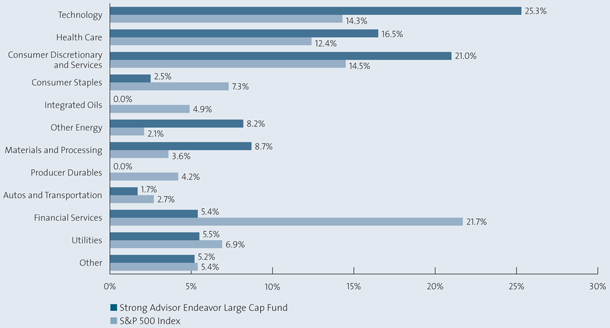
The U.S. stock market delivered a second consecutive year of gains to investors in 2004. The economy grew in fits and starts, making equity returns volatile, with much of the year’s gain being produced in the fourth quarter. For the year ended December 31, 2004, the Strong Advisor Endeavor Large Cap Fund’s Class A shares returned 8.79% (15.38% when excluding the initial sales charge), compared to its broad-based benchmark, the S&P 500 Index, which advanced 10.87%. The Fund performed well against its benchmark, as it focused on companies with the strongest fundamentals and avoided many of the period’s highly publicized disappointments.
The year tested investors, as gains in the equity market were limited for much of the year by uncertainty about the presidential election, uneven job growth, increasing energy prices, rising short-term interest rates, a declining dollar, and continued turmoil in Iraq. Despite these trends, the economy continued to expand, and many companies experienced healthy profit growth that supported higher stock prices.
Investigative approach to investing
Throughout the year we executed on our intensive research process of “surrounding the company” in order to generate competitive returns for our shareholders. We attempt to delve deeply into each company through financial statement analysis, conversations with management and channel checks of suppliers, customers and competitors. By utilizing this encompassing model, we are often able to identify companies that have the potential to produce a great deal of value relative to the required investment. Moreover, the process tends to provide us with comprehensive knowledge regarding each of the Fund’s holdings.
Equally important is the fact that our team encourages an environment open to dissent. Within this environment, portfolio managers and analysts constantly challenge each individual investment. Every question presented requires the investment to further justify its position within the Fund. This is a well-established and respected practice of all team members that should continue to assist us in assessing the risk and reward of every investment.
Holdings that outperformed
Due to the concerns about oil supply relative to growing demand, companies that produce energy and those that make equipment to recover energy performed well. One of these was Canadian Natural Resources, a premier exploration and production company with substantial potential for production growth from its Horizon oil sands project, located in Alberta, Canada. Horizon is expected to come on line in 2008 and has been estimated to be capable of producing up to six billion barrels of oil over about 40 years. In addition to its Alberta operations, the company has holdings in the North Sea and West Africa.
Morningstar® Style Box™ *

Another top performer for the year was Yahoo!. One of the key drivers for this online media company was an increase in online advertising. During the period, online media represented almost 15% of total media consumption by consumers and continued to gain market share. However, only 3% to 5% of total advertising dollars were spent online. If recent trends persist, this gap could start to close next year. Yahoo!’s competitive advantages are its breadth of offerings to advertisers, its global reach, and its breadth of product offerings on wireline and wireless devices.
Despite solid fundamental results, the Fund’s holding in Teva Pharmaceuticals underperformed in 2004 due to investors’ concern regarding future competition in both the branded and generic pharmaceutical businesses. We believe this negative sentiment will prove misguided and we continue to hold the stock. In 2005, we hope to see confirmation of our positive fundamental outlook for the generic industry, numerous new product launches for Teva, and stable market share trends for Teva’s largest branded product, Copaxone.
Outlook for 2005
As we enter 2005, we are optimistic that the economy will continue to strengthen, driven by accelerating enterprise, capital spending, and a resultant growth in earnings. The market remains constructive, climbing a “wall of worry” reflecting investors’ concerns about the health of the consumer, fading fiscal stimulus, record budget and trade deficits, a falling dollar, and uncertain employment growth.
Companies today have record levels of free cash flow but thus far have been reluctant to invest in large-scale projects. Consequently, we have seen a huge build-up in liquidity, with corporate debt levels at fifty-year lows. Historically rising corporate profits and cash flows have led to accelerating capital investment. For this reason, we believe that most of the capital spending cycle and inventory build-up is yet to come.
In addition, we will pay close attention to the levels of job creation, long-term interest rates and the resulting impact on the U.S. dollar. As always, we will continue to carefully select holdings for the Fund, emphasizing companies possessing unique and strong fundamentals.
The Fund is expected to reorganize into the Wells Fargo Advantage Endeavor Large Cap Fund, the successor to the Strong Advisor Endeavor Large Cap Fund, on or about April 11, 2005.
Thank you for your continued investment in the Strong Advisor Endeavor Large Cap Fund. We appreciate the trust you have placed in us.
Thomas J. Pence
Portfolio Manager
| * | The Morningstar Style Box™ reflects a fund’s investment strategy. For equity funds, the vertical axis shows the market capitalization of the stocks owned and the horizontal axis shows investment style (value, blend, or growth). |
Mention of specific securities in this report is not indicative of whether the Fund may make additional purchases of, sell all or a portion of, or continue to hold those securities.
18
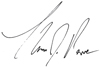
Fund Highlights
Sector Weightings
Percent of Net Assets, as of 12-31-04
Source: Frank Russell Company via FactSet
Fund Highlights are continued on next page.
19
Strong Advisor Endeavor Large Cap Fund
Growth of an Assumed $10,000 Investment†
From 9-28-01 to 12-31-04
Performance is historical and does not guarantee future results. Investment returns and principal value will fluctuate, and you may have a gain or loss when you sell shares. Current performance may be lower or higher than the quoted performance. Call us or visit www.Strong.com for the most recent month-end performance.
| † | This graph, provided in accordance with SEC regulations, compares a $10,000 investment in the Fund, made at its inception, with the performance of the S&P 500 Index and the Lipper Large-Cap Growth Funds Index. Results include the reinvestment of all dividends and capital gains distributions. The graph and the Average Annual Total Returns table do not reflect the deduction of taxes, if any, that a shareholder would pay on Fund distributions or the redemption of Fund shares. This graph is based on Class A shares only and reflects the effect of the maximum sales charge of 5.75%; performance for other share classes will vary due to differences in fee structures and sales charges. |
Definitions:
| ** | The S&P 500 Index consists of 500 stocks chosen for market size, liquidity, and industry group representation. It is a market value weighted index (stock price times number of shares outstanding), with each stock’s weight in the Index proportionate to its market value. The Lipper Large-Cap Growth Funds Index is the average of the 30 largest funds in the Lipper Large-Cap Growth Funds Category. Source of the S&P 500 Index data is Standard & Poor’s Micropal. Source of the Lipper Index data is Lipper. |
It is not possible to invest directly in an index.
Top Holdings
Percent of Net Assets, as of 12-31-04
Yahoo! Inc. | 5.1 | % | |
Sprint Corporation | 4.6 | % | |
WellPoint, Inc. | 4.1 | % | |
EMC Corporation | 3.8 | % | |
General Electric Company | 3.7 | % | |
Dell, Inc. | 3.5 | % | |
Phelps Dodge Corporation | 2.9 | % | |
Oracle Systems Corporation | 2.7 | % | |
Texas Instruments, Inc. | 2.6 | % | |
Halliburton Company | 2.6 | % | |
| Top Ten | 35.6 | % | |
Holdings vary. More complete holdings are available at www.Strong.com.
Percentage Restrictions: The Fund’s prospectus and statement of additional information may describe restrictions on the percentage of a particular type or quality of security in which the Fund may invest (“Percentage Restrictions”). Percentage Restrictions apply at the time the Fund purchases a security. Circumstances subsequent to the purchase of the security, such as a change in: (1) the Fund’s assets (e.g., due to cash inflows and redemptions), (2) the market value of the security, or (3) the pricing, liquidity, or rating of the security, may cause the Fund to exceed or fall short of the Percentage Restriction. If this happens, the Fund’s continued holding of the security will not constitute a violation of the Percentage Restriction.
20
Average Annual Total Returns
As of 12-31-04
Class A1,2 | |||
1-year | 8.79 | % | |
3-year | 1.14 | % | |
Since Fund Inception (9-28-01) | 3.61 | % |
Class A, excluding sales load | |||
1-year | 15.38 | % | |
3-year | 3.17 | % | |
Since Fund Inception (9-28-01) | 5.51 | % |
Class B1,2 | |||
1-year | 9.44 | % | |
3-year | 1.30 | % | |
Since Fund Inception (9-28-01) | 4.06 | % |
Class C1,2 | |||
1-year | 13.44 | % | |
3-year | 2.58 | % | |
Since Fund Inception (9-28-01) | 4.90 | % |
Performance is historical and does not guarantee future results. Investment returns and principal value will fluctuate, and you may have a gain or loss when you sell shares. Current performance may be lower or higher than the quoted performance. Call us or visit www.Strong.com for the most recent month-end performance.
Fee Waivers:
| 1 | From time to time, the Fund’s advisor and/or administrator has waived fees and/or absorbed Fund expenses, which has resulted in higher returns. As of 12-31-04, there are waivers and/or absorptions in effect for all share classes. |
Performance:
| 2 | Average annual total returns include the effect of the maximum sales charge of 5.75% for Class A, the applicable contingent sales charge of 5.00% in year 1 and eliminated after year 6 for Class B, and the applicable contingent deferred sales charge of 1.00% and eliminated after 12 months for Class C. |
Please consult a prospectus for information about all share classes.
Top Ten Industries
Percent of Net Assets, as of 12-31-04
Medical — Products | 6.9 | % | |
Electronics — Semiconductor Manufacturing | 6.6 | % | |
Telecommunications — Wireless Equipment | 5.3 | % | |
Internet — Content | 5.1 | % | |
Diversified Operations | 5.1 | % | |
Telecommunications — Services | 4.6 | % | |
Medical — Health Maintenance Organizations | 4.1 | % | |
Computer — Manufacturers | 3.9 | % | |
Computer — Data Storage | 3.8 | % | |
Metal Ores — Miscellaneous | 2.9 | % | |
Top Ten | 48.3 | % | |
Risks: Stock funds should only be considered for long-term goals as values fluctuate in response to the activities of individual companies and general market and economic conditions. Investment strategies that concentrate in particular market segments or fewer securities tend to increase the total risk of an investment (relative to the broader market). This Fund is exposed to growth-style investing risk. Consult the Fund’s prospectus for additional information on this and other risks.
21
For the year ended December 31, 2004, the Strong Advisor Focus Fund’s Class A shares delivered a very strong return of 11.16% in 2004 (18.03% when excluding the initial sales charge). This bested the S&P 500 Index, the Fund’s broad-based benchmark, which returned 10.87% including reinvested dividends.
Four broad trends dominated 2004. First, the economy experienced continued robust corporate earnings growth. Second, long-term interest rates surprised most market prognosticators by finishing the year lower than where they started. Third, political uncertainty was alleviated by the clean George W. Bush victory, unmarred by any terrorist events or procedural troubles. This, we believe, gave the market the spark of confidence needed to ignite the subsequent fourth-quarter rally. The fourth trend in evidence during 2004 was another year of dominance by value stocks over growth stocks. The Fund performed well in this “value” environment by concentrating on finding and investing in the stocks of companies that exemplified the theme of dominant business models generating dynamic market share growth.
Searching for “share-gainers”
Our investment process emphasizes security selection as the main determinant of our portfolio construction. We focus our research on what we call “share-gainers” — that is, those companies that have developed business models that allow them not only to grow faster than the underlying economy but to do so in a sustainable fashion. Moreover, the Fund was populated with industry leaders, regardless of their size, as these companies often have sustainable advantages over their competition. A key driver of the Fund’s returns was our analysts’ ability to identify companies with growth prospects that were underestimated by the market. To be clear, it is not only the rate of growth that is important, but also how long we expect that growth to last.
One other factor that helped contribute to the Fund’s returns was our sell discipline. If we begin to suspect that a security’s underlying fundamentals are not performing in line with or better than our expectations, we generally trim or sell the position. Strong growth stocks often receive premium valuations, but that premium can collapse if the market suddenly becomes skeptical about the company’s future prospects.
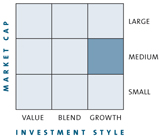
Morningstar® Style Box™*
Google outperforms
Internet search engine provider Google was an addition to the Fund in 2004 that exemplified our process. Our fundamental research identified Google as an attractive investment opportunity. We recognized that Google was not only benefiting from increased usage of the Internet, but also from the movement of advertisers’ dollars away from traditional media to the Internet. Moreover, the returns its business model generated were some of the best we found in any sector of the economy.
Outlook for 2005
In the latter half of the year, the yield curve flattened considerably, as the Fed kept raising short-term interest rates, while long-term rates stayed about where they were. To us, this signaled the bond market’s perception that economic growth may slow in the coming months. If the economy does in fact decelerate, it would make finding rapidly growing companies more difficult. Nevertheless, we are confident that our focus on share-gainers can help us find good growth opportunities in a wide variety of economic environments.
Effective January 1, 2005, John S. Dale, CFA, and Gary E. Nussbaum, CFA, of Peregrine Capital Management, Inc., became the Portfolio Co-Managers of the Fund. In addition, the Fund is expected to reorganize into the Wells Fargo Advantage Large Company Growth Fund on or about April 11, 2005.
It has been my pleasure in being the Fund’s Portfolio Manager over the last year and a half. Thank you for your investment in the Strong Advisor Focus Fund.

Thomas C. Ognar
Portfolio Manager
| * | The Morningstar Style Box™ reflects a fund’s investment strategy. For equity funds, the vertical axis shows the market capitalization of the stocks owned and the horizontal axis shows investment style (value, blend, or growth). |
Mention of specific securities in this report is not indicative of whether the Fund may make additional purchases of, sell all or a portion of, or continue to hold those securities.
22
Fund Highlights
Sector Weightings
Percent of Net Assets, as of 12-31-04
Source: Frank Russell Company via FactSet
Fund Highlights are continued on next page.
23
Strong Advisor Focus Fund
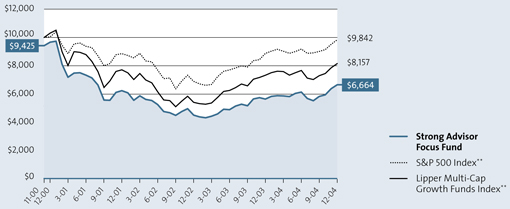
Growth of an Assumed $10,000 Investment†
From 11-30-00 to 12-31-04
Performance is historical and does not guarantee future results. Investment returns and principal value will fluctuate, and you may have a gain or loss when you sell shares. Current performance may be lower or higher than the quoted performance. Call us or visit www.Strong.com for the most recent month-end performance.
| † | This graph, provided in accordance with SEC regulations, compares a $10,000 investment in the Fund, made at its inception, with the performance of the S&P 500 Index and the Lipper Multi-Cap Growth Funds Index. Results include the reinvestment of all dividends and capital gains distributions. The graph and the Average Annual Total Returns table do not reflect the deduction of taxes, if any, that a shareholder would pay on Fund distributions or the redemption of Fund shares. This graph is based on Class A shares only and reflects the effect of the maximum sales charge of 5.75%; performance for other classes will vary due to differences in fee structures and sales charges. |
Definitions:
| ** | The S&P 500 Index consists of 500 stocks chosen for market size, liquidity, and industry group representation. It is a market value weighted index (stock price times number of shares outstanding), with each stock’s weight in the Index proportionate to its market value. The Lipper Multi-Cap Growth Funds Index is the average of the 30 largest funds in the Lipper Multi-Cap Growth Funds Category. Source of the S&P Index data is Standard & Poor’s Micropal. Source of the Lipper Index data is Lipper. |
It is not possible to invest directly in an index.
Top Holdings
Percent of Net Assets, as of 12-31-04
eBay, Inc. | 7.4 | % | |
Dell, Inc. | 6.7 | % | |
PETCO Animal Supplies, Inc. | 6.7 | % | |
First Marblehead Corporation | 6.1 | % | |
Digital River, Inc. | 4.8 | % | |
Gilead Sciences, Inc. | 4.4 | % | |
PETsMART, Inc. | 4.4 | % | |
Hughes Supply, Inc. | 4.1 | % | |
St. Jude Medical, Inc. | 3.7 | % | |
Kinetic Concepts, Inc. | 3.6 | % | |
Top Ten | 51.9 | % | |
Holdings vary. More complete holdings are available at www.Strong.com.
Percentage Restrictions: The Fund’s prospectus and statement of additional information may describe restrictions on the percentage of a particular type or quality of security in which the Fund may invest (“Percentage Restrictions”). Percentage Restrictions apply at the time the Fund purchases a security. Circumstances subsequent to the purchase of the security, such as a change in: (1) the Fund’s assets (e.g., due to cash inflows and redemptions), (2) the market value of the security, or (3) the pricing, liquidity, or rating of the security, may cause the Fund to exceed or fall short of the Percentage Restriction. If this happens, the Fund’s continued holding of the security will not constitute a violation of the Percentage Restriction.
24
Average Annual Total Returns
As of 12-31-04
Class A1,2 | |||
1-year | 11.16 | % | |
3-year | 0.24 | % | |
Since Fund Inception (11-30-00) | -9.46 | % |
Class A, excluding sales load | |||
1-year | 18.03 | % | |
3-year | 2.22 | % | |
Since Fund Inception (11-30-00) | -8.14 | % |
Class B1,2 | |||
1-year | 12.89 | % | |
3-year | 0.55 | % | |
Since Fund Inception (11-30-00) | -9.27 | % |
Class C1,2 | |||
1-year | 16.89 | % | |
3-year | 1.85 | % | |
Since Fund Inception (11-30-00) | -8.62 | % |
Performance is historical and does not guarantee future results. Investment returns and principal value will fluctuate, and you may have a gain or loss when you sell shares. Current performance may be lower or higher than the quoted performance. Call us or visit www.Strong.com for the most recent month-end performance.
Fee Waivers:
| 1 | From time to time, the Fund’s advisor and/or administrator has waived fees and/or absorbed Fund expenses, which has resulted in higher returns. As of 12-31-04, there are waivers and/or absorptions in effect for all share classes. |
Performance:
| 2 | Average annual total returns include the effect of the maximum sales charge of 5.75% for Class A, the applicable contingent sales charge of 5.00% in year 1 and eliminated after year 6 for Class B, and the applicable contingent deferred sales charge of 1.00% and eliminated after 12 months for Class C. |
Please consult a prospectus for information about all share classes.
Top Ten Industries
Percent of Net Assets, as of 12-31-04
Retail — Miscellaneous | 11.0 | % | |
Medical — Products | 10.1 | % | |
Internet — E*Commerce | 7.5 | % | |
Computer — Manufacturers | 6.7 | % | |
Financial Services — Miscellaneous | 6.1 | % | |
Electronics — Semiconductor Manufacturing | 5.4 | % | |
Internet — Network Security/Solutions | 4.8 | % | |
Medical — Biomedical/Biotechnology | 4.4 | % | |
Retail/Wholesale — Building Products | 4.1 | % | |
Commercial Services — Schools | 3.7 | % | |
| Top Ten | 63.8 | % | |
Risks: Stock funds should only be considered for long-term goals as values fluctuate in response to the activities of individual companies and general market and economic conditions. Investment strategies that concentrate in particular market segments or fewer securities tend to increase the total risk of an investment (relative to the broader market). This Fund is exposed to the following specific risks: growth-style investing risk, nondiversified portfolio risk, and small- and medium-company risk. Consult the Fund’s prospectus for additional information on these and other risks.
25
Strong Advisor International Core Fund
The Strong Advisor International Core Fund’s Class A shares rose 12.51% during the year ending December 31, 2004 (19.38% when excluding the initial sales charge). This return trailed the Morgan Stanley Capital International Europe Australasia, and Far East (MSCI EAFE) Index, which returned 20.25% during the same period.
The Fund’s performance was helped by positive stock selection. By contrast, sector allocation, especially investments in consumer staples, detracted from results. However, the main reason the Fund lagged the MSCI EAFE was a lack of sufficient exposure to certain foreign currencies. Especially during the fourth quarter of 2004, many currencies experienced significant appreciation against the U.S. dollar. The Fund was generally invested in countries whose currencies did not see the strongest relative performance. For example, currencies in Canada, Brazil, Hong Kong, Singapore and Mexico — all markets we overweighted compared to the benchmark — rose an average of 3.7% during the year’s final three months. By contrast, the euro, yen, and British pound gained over 7.0% against the dollar. Our underweighting in Europe, including the U.K., and in Japan hurt relative performance when investment gains were translated back to dollars.
Strong fourth quarter for global equities
Major global stock markets found themselves stuck in trading ranges for most of the first three quarters of the year. During this period of investor malaise, high-quality, large-capitalization stocks came back into favor. This trend helped the Fund’s performance because our investment style has always favored companies with stable earnings growth, strong balance sheets and sound management practices — the very qualities being rewarded by the market.
In the fourth quarter, however, global investors once again became more risk tolerant. In their view, the fall in oil prices and the apparent success of China’s efforts to stabilize its economy were beneficial to global growth. Investors also believed that the re-election of President Bush would generate more initiatives to stimulate the U.S. economy. As in 2003, global investors favored emerging markets and lower-quality, small-capitalization stocks.
Stock selection helped
Positive security selection provided the strongest contribution to the Fund’s performance. Stock picks in the materials and energy sectors were particularly helpful. We have emphasized these two sectors for two years now because we believed that commodity prices would increase, based on tight supplies and growing demand, especially from China. Commodity prices did indeed increase during 2004, and portfolio holdings benefiting from this trend included BHP Billiton, an Australian mining and oil company; Companhia Vale do Rio Doce, a Brazilian iron ore miner; Encana, a Canadian energy company; and ENI, an Italian energy company. As valuations rose throughout the year, we believed that these sectors became less compelling, so we took profits in large holdings and reduced our larger positions.
Morningstar® Style Box™*

By contrast, results were dragged down by the lackluster performance of global consumer staples stocks. For example, European stocks in this sector, such as French beauty products maker L’Oreal and Swiss food company Nestlé, were hurt by weakness in the U.S. dollar, increasingly tough earnings comparisons, and compressed profit margins related to higher raw material costs.
Results from our investments in Asia were mixed. The Fund benefited from strong stock selection in Hong Kong as real estate prices continued to rebound. For example, Swire Pacific, with interests in office real state and aviation, saw its share price increase along with expectations for the local economy. Performance from Japanese holdings was more subdued. The Fund benefited from exporters Hitachi and Komatsu as well as retailer Daimaru, which gained along with Japan’s economy. However, the Fund’s smaller holdings in Japanese financial stocks, which rebounded sharply during the year’s fourth quarter, detracted from results.
Risks and opportunities
International investors face a number of risks in the year ahead, including the potential for more geopolitical instability, further U.S. dollar depreciation leading to faster Federal Reserve rate hikes, and disappointing European economic growth causing a slowdown in earnings. On the other hand, an unexpected drop in oil prices would be very beneficial to the economy. Also, if the Bush administration’s fiscal policies can stimulate the U.S. economy, our trading partners may benefit as well. A healthy economy in China would have a similar effect on its own trading partners, especially in Asia.
We are looking for an increasingly risk-averse investment environment in 2005, which may favor high-quality, large-cap stocks. However, after two consecutive years of strong returns, it is reasonable to expect that global markets may lack clear near-term direction.
Effective January 1, 2005, Mark Beale and Richard D. Lewis of New Star Institutional Managers Limited became the Portfolio Co-Managers of the Fund. In addition, the Fund is expected to reorganize into the Wells Fargo Advantage International Core Fund on or about April 11, 2005.
Thank you for your investment in the Strong Advisor International Core Fund.
| * | The Morningstar Style Box™ reflects a fund’s investment strategy. For equity funds, the vertical axis shows the market capitalization of the stocks owned and the horizontal axis shows investment style (value, blend, or growth). |
Mention of specific securities in this report is not indicative of whether the Fund may make additional purchases of, sell all or a portion of, or continue to hold those securities.
26
Fund Highlights
Sector Weightings
Percent of Net Assets, as of 12-31-04
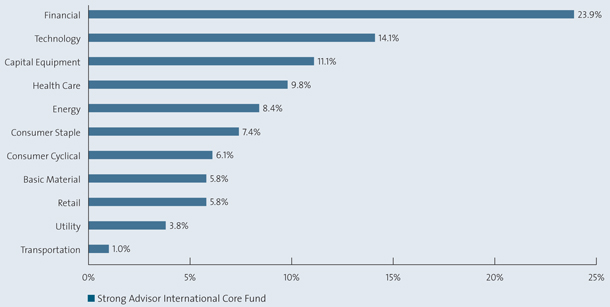
Source: Frank Russell Company via FactSet
Fund Highlights are continued on next page.
27
Strong Advisor International Core Fund
Growth of an Assumed $10,000 Investment†
From 9-28-01 to 12-31-04
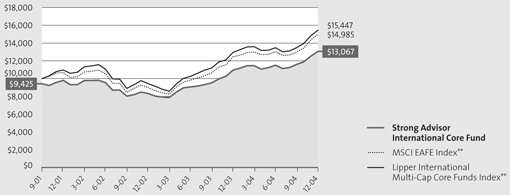
Performance is historical and does not guarantee future results. Investment returns and principal value will fluctuate, and you may have a gain or loss when you sell shares. Current performance may be lower or higher than the quoted performance. Call us or visit www.Strong.com for the most recent month-end performance.
| † | This graph, provided in accordance with SEC regulations, compares a $10,000 investment in the Fund, made at its inception, with the performance of the Morgan Stanley Capital International Europe, Australasia, and Far East (“MSCI EAFE”) Index and the Lipper International Multi-Cap Core Funds Index. Results include the reinvestment of all dividends and capital gains distributions. The graph and the Average Annual Total Returns table do not reflect the deduction of taxes, if any, that a shareholder would pay on Fund distributions or the redemption of Fund shares. This graph is based on Class A shares only and reflects the effect of the maximum sales charge of 5.75%; performance for other share classes will vary due to differences in fee structures and sales charges. |
| Definitions: |
| ** | The MSCI EAFE® Index (Europe, Australasia, Far East) is a free float-adjusted market capitalization index that is designed to measure developed market equity performance, excluding the U.S. and Canada. The Lipper International Multi-Cap Core Funds Index is the average of the 30 largest funds in the Lipper International Multi-Cap Core Funds Category. These funds invest assets in securities with primary trading markets outside of the United States. Source of the MSCI EAFE Index data is Standard & Poor’s Micropal. Source of the Lipper Index data is Lipper. |
| It is not possible to invest directly in an index. |
Top Countries
Percent of Net Assets, as of 12-31-04
Japan | 20.0 | % | |
United Kingdom | 17.9 | % | |
France | 10.8 | % | |
Switzerland | 6.9 | % | |
Germany | 6.5 | % | |
Netherlands | 4.8 | % | |
Singapore | 3.7 | % | |
Italy | 3.5 | % | |
Brazil | 2.9 | % | |
Hong Kong | 2.9 | % | |
Top Ten | 79.9 | % | |
Holdings vary. More complete holdings are available at www.Strong.com.
Percentage Restrictions: The Fund’s prospectus and statement of additional information may describe restrictions on the percentage of a particular type or quality of security in which the Fund may invest (“Percentage Restrictions”). Percentage Restrictions apply at the time the Fund purchases a security. Circumstances subsequent to the purchase of the security, such as a change in: (1) the Fund’s assets (e.g., due to cash inflows and redemptions), (2) the market value of the security, or (3) the pricing, liquidity, or rating of the security, may cause the Fund to exceed or fall short of the Percentage Restriction. If this happens, the Fund’s continued holding of the security will not constitute a violation of the Percentage Restriction.
28
Average Annual Total Returns
As of 12-31-04
Class A1,2,3 | |||
1-year | 12.51 | % | |
3-year | 7.86 | % | |
Since Fund Inception (9-28-01) | 8.56 | % | |
Class A, excluding sales load | |||
1-year | 19.38 | % | |
3-year | 10.02 | % | |
Since Fund Inception (9-28-01) | 10.55 | % | |
Class B1,2,3 | |||
1-year | 14.32 | % | |
3-year | 8.93 | % | |
Since Fund Inception (9-28-01) | 9.77 | % | |
Class C1,2,3 | |||
1-year | 18.44 | % | |
3-year | 10.03 | % | |
Since Fund Inception (9-28-01) | 10.53 | % | |
Performance is historical and does not guarantee future results. Investment returns and principal value will fluctuate, and you may have a gain or loss when you sell shares. Current performance may be lower or higher than the quoted performance. Call us or visit www.Strong.com for the most recent month-end performance.
Fee Waivers:
| 1 | From time to time, the Fund’s advisor and/or administrator has waived fees and/or absorbed Fund expenses, which has resulted in higher returns. As of 12-31-04, there are waivers and/or absorptions in effect for all share classes. |
Performance:
| 2 | Average annual total returns include the effect of the maximum sales charge of 5.75% for Class A, the applicable contingent sales charge of 5.00% in year 1 and eliminated after year 6 for Class B, and the applicable contingent deferred sales charge of 1.00% and eliminated after 12 months for Class C. |
| 3 | The Fund’s Class A, B, and C shares have a redemption fee of 1.00% against shares that are held 30 calendar days or fewer after purchase. Performance data does not reflect the deduction of this fee, which, if reflected, would reduce the performance. Please consult a prospectus for information about all share classes. |
Top Ten Industries
Percent of Net Assets, as of 12-31-04
Oil & Gas — International Integrated | 8.4 | % | |
Banks — Money Center | 7.8 | % | |
Banks — Foreign | 7.2 | % | |
Diversified Operations | 5.6 | % | |
Medical — Ethical Drugs | 4.0 | % | |
Medical — Products | 3.6 | % | |
Telecommunications — Wireless Services | 3.1 | % | |
Metal Ores — Miscellaneous | 3.0 | % | |
Finance — Index Tracking Fund | 2.8 | % | |
Electronics — Miscellaneous Components | 2.8 | % | |
Top Ten | 48.3 | % | |
Risks: Stock funds should only be considered for long-term goals as values fluctuate in response to the activities of individual companies and general market and economic conditions. Investments in foreign companies often present more risk because of currency exchange fluctuation, government regulations, and the potential for political and economic instability. These risks are generally intensified in emerging markets. Consult the Fund’s prospectus for additional information on these and other risks.
29
In 2004, the Fund continued to focus on companies with the strongest fundamentals and avoided many of the highly publicized disappointments during the period. For the year ended December 31, 2004, the Strong Advisor Select Fund’s Class A shares rose by 10.09% (16.80% when excluding the initial sales charge), compared to its broad-based benchmark, the S&P 500 Index, which advanced 10.87%. As the economy grew in fits and starts, equity returns were volatile, with much of the year’s gain being produced in the fourth quarter.
Putting our comprehensive analysis to work
Throughout the year we executed on our intensive research process of “surrounding the company” in order to generate competitive returns for the Fund’s shareholders. We attempt to delve deeply into each company through financial statement analysis, conversations with management and, lastly, investigations of suppliers, customers, and competitors. By utilizing this encompassing model, we are often able to identify companies that produce a great deal of value relative to the required investment. Moreover, the process tends to provide us with comprehensive knowledge regarding each of the Fund’s holdings and specifically, we can gain a better understanding of where the growth is being generated.
Equally important to our methodology is the fact that our team operates in an environment open to dissent. Within this environment, portfolio managers and analysts constantly challenge each individual investment. Every question presented requires the investment’s position in the portfolio to be further justified. This practice is well established and respected among all team members, and it should continue to play a vital role in helping us assess the risk and reward of every investment the Fund owns.
Two contributors to performance
Our extensive research also enables us to analyze interesting and non-traditional growth opportunities in the market, such as those recently provided by the energy sector. Due to the concerns about oil supply relative to growing demand, companies that produce energy and those that make equipment to recover energy performed well. One of these was Canadian Natural Resources, a premier exploration and production company with substantial potential for production growth from its Horizon oil sands project, located in Alberta, Canada. Horizon is expected to come online in 2008 and has been estimated to be capable of producing up to six billion barrels of oil over about 40 years. In addition to its Alberta operations, Canadian Natural Resources has energy holdings in the North Sea and West Africa.
Morningstar® Style Box™*

Another top performer for the year was Sprint Corporation. In 2004, the diversified telecommunications company, aided particularly by strength in its wireless business, reduced debt levels, streamlined operations and worked to create packaged bundles of communications services for customers.
What’s more, in December Sprint announced a merger with Nextel Communications. In our opinion, the merger created a favorable position for Sprint by reducing the number of competitors in the industry. Moreover, the union looked to be a very complementary one. If approved by the regulatory agencies, the merger would allow Sprint not only to tap into Nextel’s vast base of corporate customers, but also to gain access to the proprietary Direct Connect functionality of Nextel’s phones. Lastly, Sprint announced plans, in regards to the merger, to potentially sell its wireline business in an effort to streamline operations.
Looking ahead to 2005
As we enter 2005, we believe the key question is not whether the economy will grow but rather to what degree. We are optimistic that the economy will continue to strengthen, driven by accelerating enterprise capital spending and a resultant growth in earnings.
The market remains constructive, climbing a “wall of worry” reflecting investors’ concerns about the health of the consumer, fading fiscal stimulus, record budget and trade deficits, rising interest rates, a falling dollar, and uncertain employment growth. Companies today have record levels of free cash flow but thus far have seemed reluctant to invest in large-scale projects. Consequently, we have seen a huge build-up in liquidity, with corporate debt levels at fifty-year lows. Historically, rising corporate profits and cash flows have led to accelerating capital investment. For this reason, we believe that most of the capital spending cycle and inventory build-up is yet to come.
In addition, we will pay close attention to the levels of job creation, long-term interest rates and the resulting impact on the U.S. dollar. As always, we will continue to carefully select holdings for the fund, attempting to emphasize companies possessing unique and strong fundamentals.
The Fund is expected to reorganize into the Wells Fargo Advantage Endeavor Select Fund, the successor to the Strong Advisor Select Fund, on or about April 11, 2005.
Thank you for your continued investment in the Strong Advisor Select Fund. We appreciate the trust you have placed in us.
 |
Thomas J. Pence |
| Portfolio Co-Manager |
 |
Erik J. Voss |
| Portfolio Co-Manager |
| * | The Morningstar Style Box™ reflects a fund’s investment strategy. For equity funds, the vertical axis shows the market capitalization of the stocks owned and the horizontal axis shows investment style (value, blend, or growth). |
Mention of specific securities in this report is not indicative of whether the Fund may make additional purchases of, sell all or a portion of, or continue to hold those securities.
30
Fund Highlights
Sector Weightings
Percent of Net Assets, as of 12-31-04
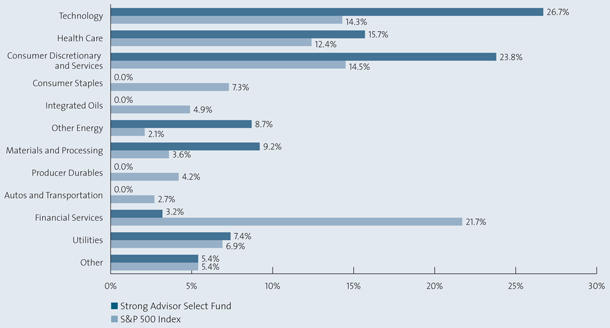
Source: Frank Russell Company via FactSet
Fund Highlights are continued on next page.
31
Strong Advisor Select Fund
Growth of an Assumed $10,000 Investment†
From 12-29-00 to 12-31-04
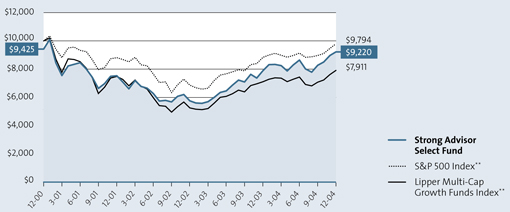
Performance is historical and does not guarantee future results. Investment returns and principal value will fluctuate, and you may have a gain or loss when you sell shares. Current performance may be lower or higher than the quoted performance. Call us or visit www.Strong.com for the most recent month-end performance.
| † | This graph, provided in accordance with SEC regulations, compares a $10,000 investment in the Fund, made at its inception, with a similar investment in the S&P 500 Index and the Lipper Multi-Cap Growth Funds Index. Results include the reinvestment of all dividends and capital gains distributions. The graph and the Average Annual Total Returns table do not reflect the deduction of taxes, if any, that a shareholder would pay on Fund distributions or the redemption of Fund shares. This graph is based on Class A shares only and reflects the effect of the maximum sales charge of 5.75%; performance for other classes will vary due to differences in fee structures and sales charges. |
Definitions:
| ** | The S&P 500 Index consists of 500 stocks chosen for market size, liquidity, and industry group representation. It is a market value weighted index (stock price times number of shares outstanding), with each stock’s weight in the Index proportionate to its market value. The Lipper Multi-Cap Growth Funds Index is the average of the 30 largest funds in the Lipper Multi-Cap Growth Funds Category. Source of the S&P Index data is Standard & Poor’s Micropal. Source of the Lipper Index data is Lipper. |
| It is not possible to invest directly in an index. |
Top Holdings
Percent of Net Assets, as of 12-31-04
Yahoo! Inc. | 5.8 | % | |
Marvel Enterprises, Inc. | 4.8 | % | |
Sprint Corporation | 4.6 | % | |
WellPoint, Inc. | 4.5 | % | |
EMC Corporation | 4.3 | % | |
Phelps Dodge Corporation | 3.9 | % | |
General Electric Company | 3.7 | % | |
Dell, Inc. | 3.4 | % | |
Harman International Industries, Inc. | 3.3 | % | |
Oracle Systems Corporation | 3.3 | % | |
Top Ten | 41.6 | % | |
Holdings vary. More complete holdings are available at www.Strong.com.
Percentage Restrictions: The Fund’s prospectus and statement of additional information may describe restrictions on the percentage of a particular type or quality of security in which the Fund may invest (“Percentage Restrictions”). Percentage Restrictions apply at the time the Fund purchases a security. Circumstances subsequent to the purchase of the security, such as a change in: (1) the Fund’s assets (e.g., due to cash inflows and redemptions), (2) the market value of the security, or (3) the pricing, liquidity, or rating of the security, may cause the Fund to exceed or fall short of the Percentage Restriction. If this happens, the Fund’s continued holding of the security will not constitute a violation of the Percentage Restriction.
32
Average Annual Total Returns
As of 12-31-04
Class A1,2 | |||
1-year | 10.09 | % | |
3-year | 4.88 | % | |
Since Fund Inception (12-29-00) | -2.01 | % | |
Class A, excluding sales load | |||
1-year | 16.80 | % | |
3-year | 6.98 | % | |
Since Fund Inception (12-29-00) | -0.55 | % | |
Class B1,2 | |||
1-year | 10.82 | % | |
3-year | 4.93 | % | |
Since Fund Inception (12-29-00) | -1.82 | % | |
Class C1,2 | |||
1-year | 14.82 | % | |
3-year | 6.17 | % | |
Since Fund Inception (12-29-00) | -1.29 | % | |
Performance is historical and does not guarantee future results. Investment returns and principal value will fluctuate, and you may have a gain or loss when you sell shares. Current performance may be lower or higher than the quoted performance. Call us or visit www.Strong.com for the most recent month-end performance.
Fee Waivers:
| 1 | From time to time, the Fund’s advisor and/or administrator has waived fees and/or absorbed Fund expenses, which has resulted in higher returns. As of 12-31-04, there are waivers and/or absorptions in effect for all share classes. |
Performance:
| 2 | Average annual total returns include the effect of the maximum sales charge of 5.75% for Class A, the applicable contingent deferred sales charge of 5.00% in year 1 and eliminated after year 6 for Class B, and the applicable contingent deferred sales charge of 1.00% and eliminated after 12 months for Class C. |
| Please consult a prospectus for information about all share classes. |
Top Ten Industries
Percent of Net Assets, as of 12-31-04
Internet — Content | 5.7 | % | |
Telecommunications — Wireless Equipment | 5.7 | % | |
Electronics — Semiconductor Manufacturing | 5.6 | % | |
Medical — Products | 5.5 | % | |
Diversified Operations | 5.1 | % | |
Leisure — Toys/Games/Hobby | 4.8 | % | |
Telecommunications — Services | 4.6 | % | |
Medical — Health Maintenance Organizations | 4.5 | % | |
Computer — Data Storage | 4.3 | % | |
Metal Ores — Miscellaneous | 3.9 | % | |
Top Ten | 49.7 | % | |
Risks: Stock funds should only be considered for long-term goals as values fluctuate in response to the activities of individual companies and general market and economic conditions. Investment strategies that concentrate in particular market segments or fewer securities tend to increase the total risk of an investment (relative to the broader market). This Fund is exposed to the following specific risks: growth-style investing risk, nondiversified-portfolio risk, and small- and medium-company risk. Consult the Fund’s prospectus for additional information on these and other risks.
33
Strong Advisor Technology Fund
It was a challenging year for the Strong Advisor Technology Fund. The Fund’s Class A shares returned -10.03% (-4.58% when excluding the initial sales charge) during 2004. By contrast, the Fund’s broad-based benchmark, the S&P 500 Index, returned 10.87% during the same period.
The Fund’s significant underperformance can be attributable to the poor performance of the semiconductor sector, in which we were overweighted compared to the benchmark, as well as weakness in the individual software held in the portfolio. In addition, the Fund’s performance suffered from its riskier profile relative to the benchmark, characterized especially by its larger weighting in small and mid-cap technology stocks.
The portfolio’s largest detractor from performance during the past 12 months was LSI Logic Corporation, a designer and manufacturer of complex high-performance, integrated circuits and storage systems. The next largest detractor was Magma Design Automation, a maker of electronic design automation software for engineers who design semiconductors. The stock fell after Magma announced that its third-quarter earnings per share would be worse than analysts expected because of disappointing growth in new customer orders.
Tough environment for tech
The overall market climate started the year with a strong tone, but soon moved into what was essentially a sideways trading pattern that persisted through the end of August. Concerns about the continued conflict in Iraq, the uncertainty surrounding a presidential election, higher than expected inflation rates (especially with respect to oil prices), and a sentiment that world economic growth may be slowing all weighed on the equity markets.
Technology stocks, which are cyclical in nature, typically perform best when macroeconomic political factors are positive, so the change in market temperament was especially difficult for stocks in the sector to weather. However, the technology sector began to realize stronger performance beginning in August, but becoming especially pronounced in late October and early November, as oil prices appeared to retreat as it became clear that the U.S. presidential election would not end in a contested fashion, as in 2000.
Morningstar® Style Box™ *

Our approach to selecting stocks
Our management strategy remained consistent during the period. We sought to maintain a balance among the various subsectors that make up the technology universe: semiconductors and related equipment, software, computer hardware and storage, business services, and biotechnology. We sought to identify the companies within each subsector that we believed had the best fundamental qualities and were positioned to outperform. To this end, we looked for companies with above-average growth prospects, strong intellectual property, excellent management teams, and achievable financing plans.
Although we did not seek to keep a balanced representation of all major subsectors, our bottom-up, stock selection process, rather than a rigid, top-down asset allocation program, primarily drove the portfolio’s makeup.
In choosing stocks for the portfolio, we employed a relative valuation technique. The key element of this strategy was to look at a stock’s PEG (Price/Earnings to Growth) ratio. This figure represents the relationship of a company’s price-earnings ratio — a key measure that indicates how expensive a stock is relative to the earnings the company generates — to its projected five-year compound annual growth rate. We were interested in finding companies with favorable PEG ratios — that is, those that were positioned to deliver attractive levels of growth and that offered reasonable valuations.
Among the stocks selected for the portfolio using these approaches was the Fund’s strongest contributor to performance during the period, Mine Safety Appliances Company, which makes and sells safety and health equipment. Health care imaging company, CTI Molecular, also helped performance. The stock rose more than 28% in a single day in mid-November after the company reported stronger-than-expected earnings and anticipated an increase in first-quarter sales.
New Manager and Fund Reorganization
Effective January 1, 2005, Huachen Chen, CFA, and Walter C. Price, Jr., CFA, of RCM Capital Management LLC became the Portfolio Co-Managers of the Fund. In addition, the Fund is expected to reorganize into the Wells Fargo Advantage Specialized Technology Fund on or about April 11, 2005.
Thank you for your investment in the Strong Advisor Technology Fund.
| * | The Morningstar Style Box™ reflects a fund’s investment strategy. For equity funds, the vertical axis shows the market capitalization of the stocks owned and the horizontal axis shows investment style (value, blend, or growth). |
| Mention of specific securities in this report is not indicative of whether the Fund may make additional purchases of, sell all or a portion of, or continue to hold those securities. |
34
Fund Highlights
Sector Weightings
Percent of Net Assets, as of 12-31-04
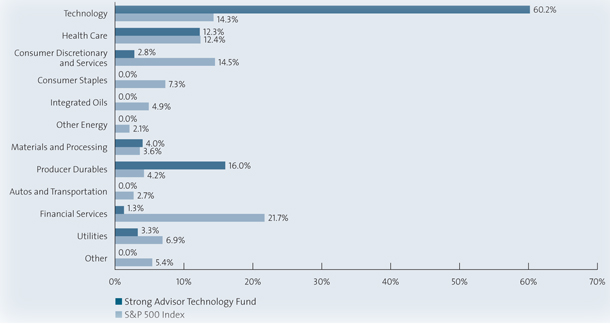
Source: Frank Russell Company via FactSet
Fund Highlights are continued on next page.
35
Strong Advisor Technology Fund
Growth of an Assumed $10,000 Investment†
From 11-30-00 to 12-31-04
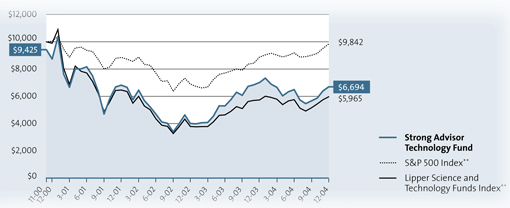
Performance is historical and does not guarantee future results. Investment returns and principal value will fluctuate, and you may have a gain or loss when you sell shares. Current performance may be lower or higher than the quoted performance. Call us or visit www.Strong.com for the most recent month-end performance.
| † | This graph, provided in accordance with SEC regulations, compares a $10,000 investment in the Fund, made at its inception, with the performance of the S&P 500 Index and the Lipper Science and Technology Funds Index. Results include the reinvestment of all dividends and capital gains distributions. The graph and the Average Annual Total Returns table do not reflect the deduction of taxes, if any, that a shareholder would pay on Fund distributions or the redemption of Fund shares. This graph is based on Class A shares only and reflects the effect of the maximum sales charge of 5.75%; performance for other classes will vary due to differences in fee structures and sales charges. |
Definitions:
| ** | The S&P 500 Index consists of 500 stocks chosen for market size, liquidity, and industry group representation. It is a market value weighted index (stock price times number of shares outstanding), with each stock’s weight in the Index proportionate to its market value. The Lipper Science and Technology Funds Index is the average of the 30 largest funds in the Lipper Science and Technology Funds Category. Source of the S&P Index data is Standard & Poor’s Micropal. Source of the Lipper Index data is Lipper. |
It is not possible to invest directly in an index.
Top Holdings
Percent of Net Assets, as of 12-31-04
Avid Technology, Inc. | 4.1 | % | |
Linear Technology Corporation | 3.5 | % | |
Microsoft Corporation | 3.4 | % | |
Mine Safety Appliances Company | 3.4 | % | |
Dell, Inc. | 3.3 | % | |
TTM Technologies, Inc. | 3.2 | % | |
America Movil ADR Series L | 3.1 | % | |
Lucent Technologies, Inc. | 3.0 | % | |
KLA-Tencor Corporation | 3.0 | % | |
Ariba, Inc. | 3.0 | % | |
Top Ten | 33.0 | % | |
Holdings vary. More complete holdings are available at www.Strong.com.
Percentage Restrictions: The Fund’s prospectus and statement of additional information may describe restrictions on the percentage of a particular type or quality of security in which the Fund may invest (“Percentage Restrictions”). Percentage Restrictions apply at the time the Fund purchases a security. Circumstances subsequent to the purchase of the security, such as a change in: (1) the Fund’s assets (e.g., due to cash inflows and redemptions), (2) the market value of the security, or (3) the pricing, liquidity, or rating of the security, may cause the Fund to exceed or fall short of the Percentage Restriction. If this happens, the Fund’s continued holding of the security will not constitute a violation of the Percentage Restriction.
36
Average Annual Total Returns
As of 12-31-04
Class A1,2 | |||
1-year | -10.03 | % | |
3-year | -2.54 | % | |
Since Fund Inception (11-30-00) | -9.36 | % |
Class A, excluding sales load | |||
1-year | -4.58 | % | |
3-year | -0.60 | % | |
Since Fund Inception (11-30-00) | -8.04 | % |
Class B1,2 | |||
1-year | -9.51 | % | |
3-year | -2.03 | % | |
Since Fund Inception (11-30-00) | -9.00 | % |
Class C1,2 | |||
1-year | -5.66 | % | |
3-year | -0.71 | % | |
Since Fund Inception (11-30-00) | -8.45 | % |
Performance is historical and does not guarantee future results. Investment returns and principal value will fluctuate, and you may have a gain or loss when you sell shares. Current performance may be lower or higher than the quoted performance. Call us or visit www.Strong.com for the most recent month-end performance.
Fee Waivers:
| 1 | From time to time, the Fund’s advisor and/or administrator has waived fees and/or absorbed Fund expenses, which has resulted in higher returns. As of 12-31-04, there are waivers and/or absorptions in effect for all share classes. |
Performance:
| 2 | Average annual total returns include the effect of the maximum sales charge of 5.75% for Class A, the applicable contingent deferred sales charge of 5.00% in year 1 and eliminated after year 6 for Class B, and the applicable contingent deferred sales charge of 1.00% and eliminated after 12 months for Class C. |
Please consult a prospectus for information about all share classes.
Top Ten Industries
Percent of Net Assets, as of 12-31-04
Electronics — Semiconductor Manufacturing | 16.2 | % | |
Computer Software — Desktop | 5.6 | % | |
Computer Software — Education/Entertainment | 4.8 | % | |
Telecommunications — Equipment | 4.6 | % | |
Computer — IT Services | 4.5 | % | |
Electronics — Miscellaneous Components | 4.4 | % | |
Computer Software — Enterprise | 4.3 | % | |
Leisure — Movies & Related | 4.1 | % | |
Telecommunications — Wireless Equipment | 3.7 | % | |
Medical — Systems/Equipment | 3.4 | % | |
Top Ten | 55.6 | % | |
Risks: Stock funds should only be considered for long-term goals as values fluctuate in response to the activities of individual companies and general market and economic conditions. Investment strategies that concentrate in particular market segments or fewer securities tend to increase the total risk of an investment (relative to the broader market). This Fund is exposed to the following specific risks: growth-style investing risk, concentrated-portfolio risk, technology risk, and small- and medium-company risk. Consult the Fund’s prospectus for additional information on these and other risks.
37
Strong Advisor U.S. Small/Mid Cap Growth Fund
After a very strong year for the Fund in 2003, 2004 was more difficult. For the year ended December 31, 2004, the Strong Advisor U.S. Small/Mid Cap Growth Fund’s Class A shares returned -5.22% (0.54% when excluding the initial sales charge), well behind its broad-based benchmark, the Russell Midcap Index, which returned 20.22% for the same period. The Fund’s underperformance occurred primarily in the year’s first and third quarters. During the second and fourth quarters, the Fund’s performance was more closely in line with the benchmark.
Factors affecting performance
There were two primary factors driving the Fund’s underperformance. First, small- and mid-cap growth stocks dramatically underperformed their respective value counterparts. There was a general contraction of stock valuations that took place in January and February, as weak economic data caused many investors to question the strength of the recovery and thus to lose confidence in stocks’ growth prospects. Then, in the second quarter, the economy began to pick up steam. In response, the Federal Reserve Board signaled that it was ready to raise short-term interest rates to help keep the economy from overheating and to help keep inflation in check. Higher interest rates have traditionally hurt the fastest-growing companies — the type we favor for this portfolio — the most.
The third quarter brought more uncertainty about the sustainability of the U.S. economic recovery. For one thing, the Fed kept upward pressure on interest rates with hikes of one-quarter of a percentage point in August and September following the June increase. Moreover, the price of crude oil continued to push higher, stoking fears that the high cost of energy would siphon disposable cash from other areas of the economy. In response, growth stocks significantly underperformed the broader market during the third quarter. In fact, according to a Merrill Lynch study of growth versus value strategies, during the first three quarters of 2004, the fastest-growing companies had the worst performance.
In the fourth quarter, the broader market turned in a strong rally in which mid- and small-cap growth stocks fully participated. Although the Fund posted a double-digit gain for the quarter, it nevertheless underperformed for the year.
The other reason for the Fund’s underperformance was unfavorable stock selection. One company that provided tremendous returns in 2003, Odyssey HealthCare, unexpectedly lowered its guidance on fourth-quarter earnings, hurting not only its own share price but also those of other companies in the hospice services industry. As one of the Fund’s largest holdings, Odyssey HealthCare negatively effected the performance of the Fund, and we sold the stock.
Morningstar® Style Box™*
Positioned for a stronger economy
Throughout 2004, we did not make any substantial changes to the Fund’s overall positioning from 2003. The portfolio remained poised to benefit from an improving business environment and increasing consumer confidence. Although the potential for further interest-rate hikes remains, we believe this trend presents limited risk to the companies in the portfolio. This is because we look for companies with little debt, and we have also significantly underweighted stocks from the financial sector compared to the benchmark, which could face the most volatility from rising rates. In the short term, it is true that some stocks may fluctuate in value due to interest-rate concerns. In the longer term, however, we believe profit growth ultimately drives stock performance and that this Fund’s portfolio of high-quality, fast-growing companies should be able to do well in this environment.
Our outlook
The Federal Reserve increased short-term interest rates five times in 2004 and appears ready to keep raising rates in the new year to keep inflation in check. Nevertheless, we think the worst of the resulting volatility is behind us. Normally, small-cap growth stocks appreciate in value after several Federal Reserve rates hikes, and we saw some evidence of that in the fourth quarter. Easing energy prices also represent a potentially positive influence on stock prices. Moreover, we expect to see strong corporate earnings in upcoming quarters. Given that many stocks are still at what we consider reasonable valuations, we believe such earnings improvements could help drive the prices of small- and mid-cap growth stocks higher in 2005.
Effective January 1, 2005, Jerome “Cam” Philpott, CFA, and Stuart Roberts of Wells Capital Management Incorporated became the Portfolio Co-Managers of the Fund. In addition, the Fund is expected to reorganize into the Wells Fargo Advantage Small Cap Fund on or about April 11, 2005.
Thank you for your investment in the Strong Advisor U.S. Small/Mid Cap Growth Fund.
| * | The Morningstar Style Box™ reflects a fund’s investment strategy. For equity funds, the vertical axis shows the market capitalization of the stocks owned and the horizontal axis shows investment style (value, blend, or growth). |
Mention of specific securities in this report is not indicative of whether the Fund may make additional purchases of, sell all or a portion of, or continue to hold those securities.
38
Fund Highlights
Sector Weightings
Percent of Net Assets, as of 12-31-04
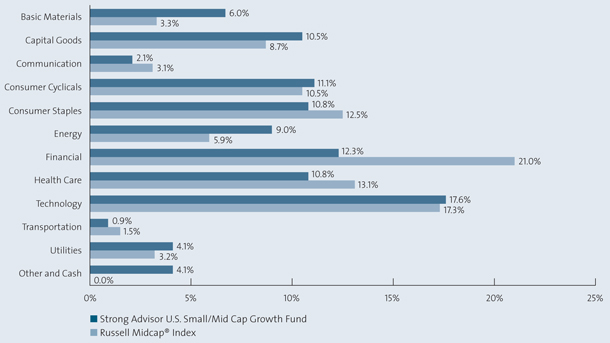
Source: Frank Russell Company via FactSet
Fund Highlights are continued on next page.
39
Strong Advisor U.S. Small/Mid Cap Growth Fund
Growth of an Assumed $10,000 Investment†
From 3-28-02 to 12-31-04
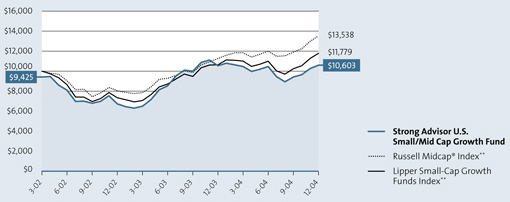
Performance is historical and does not guarantee future results. Investment returns and principal value will fluctuate, and you may have a gain or loss when you sell shares. Current performance may be lower or higher than the quoted performance. Call us or visit www.Strong.com for the most recent month-end performance.
| † | This graph, provided in accordance with SEC regulations, compares a $10,000 investment in the Fund, made at its inception, with the performance of the Russell Midcap® Index and the Lipper Small-Cap Growth Funds Index. Results include the reinvestment of all dividends and capital gains distributions. The graph and the Average Annual Total Returns table do not reflect the deduction of taxes, if any, that a shareholder would pay on Fund distributions or the redemption of Fund shares. This graph is based on Class A shares only and reflects the effect of the maximum sales charge of 5.75%; performance for other classes will vary due to differences in fee structures and sales charges. |
Definitions:
| ** | The Russell Midcap® Index measures the performance of the 800 smallest companies in the Russell 1000 Index, which represent approximately 26% of the total market capitalization of the Russell 1000 Index. The Lipper Small-Cap Growth Funds Index is the average of the 30 largest funds in the Lipper Small-Cap Growth Funds Category. Source of the Russell Index data is Standard & Poor’s Micropal. Source of the Lipper Index data is Lipper. |
It is not possible to invest directly in an index.
Top Holdings
Percent of Net Assets, as of 12-31-04
Landstar Systems, Inc. | 4.3 | % | |
Alamosa Holdings, Inc. | 4.0 | % | |
Joy Global, Inc. | 3.3 | % | |
Penn Virginia Corporation | 3.1 | % | |
Trimble Navigation, Ltd. | 3.0 | % | |
A.S.V., Inc. | 2.6 | % | |
Cognizant Technology Solutions Corporation Class A | 2.5 | % | |
Getty Images, Inc. | 2.5 | % | |
Terex Corporation | 2.4 | % | |
Investors Financial Services Corporation | 2.4 | % | |
Top Ten | 30.1 | % | |
Holdings vary. More complete holdings are available at www.Strong.com.
Percentage Restrictions: The Fund’s prospectus and statement of additional information may describe restrictions on the percentage of a particular type or quality of security in which the Fund may invest (“Percentage Restrictions”). Percentage Restrictions apply at the time the Fund purchases a security. Circumstances subsequent to the purchase of the security, such as a change in: (1) the Fund’s assets (e.g., due to cash inflows and redemptions), (2) the market value of the security, or (3) the pricing, liquidity, or rating of the security, may cause the Fund to exceed or fall short of the Percentage Restriction. If this happens, the Fund’s continued holding of the security will not constitute a violation of the Percentage Restriction.
40
Average Annual Total Returns
As of 12-31-04
Class A1,2 | |||
1-year | -5.22 | % | |
Since Fund Inception (3-28-02) | 2.14 | % | |
Class A, excluding sales load | |||
1-year | 0.54 | % | |
Since Fund Inception (3-28-02) | 4.36 | % | |
Class B1,2 | |||
1-year | -4.46 | % | |
Since Fund Inception (3-28-02) | 2.96 | % | |
Class C1,2 | |||
1-year | -0.46 | % | |
Since Fund Inception (3-28-02) | 4.36 | % | |
Performance is historical and does not guarantee future results. Investment returns and principal value will fluctuate, and you may have a gain or loss when you sell shares. Current performance may be lower or higher than the quoted performance. Call us or visit www.Strong.com for the most recent month-end performance.
Fee Waivers:
| 1 | From time to time, the Fund’s advisor and/or administrator has waived fees and/or absorbed Fund expenses, which has resulted in higher returns. As of 12-31-04, there are waivers and/or absorptions in effect for all share classes. |
Performance:
| 2 | Average annual total returns include the effect of the maximum sales charge of 5.75% for Class A, the applicable contingent deferred sales charge of 5.00% in year 1 and eliminated after year 6 for Class B, and the applicable contingent deferred sales charge of 1.00% and eliminated after 12 months for Class C. |
Please consult a prospectus for information about all share classes.
Top Ten Industries
Percent of Net Assets, as of 12-31-04
Machinery — Construction/Mining | 10.7 | % | |
Oil & Gas — United States Exploration & Production | 9.1 | % | |
Transportation — Truck | 6.5 | % | |
Telecommunications — Wireless Services | 5.7 | % | |
Retail — Restaurants | 5.4 | % | |
Electronics — Semiconductor Manufacturing | 4.5 | % | |
Medical — Systems/Equipment | 3.7 | % | |
Internet — Network Security/Solutions | 3.0 | % | |
Telecommunications — Wireless Equipment | 3.0 | % | |
Computer — IT Services | 2.5 | % | |
Top Ten | 54.1 | % | |
Risks: Stock funds should only be considered for long-term goals as values fluctuate in response to the activities of individual companies and general market and economic conditions. Investment strategies that concentrate in particular market segments or fewer securities tend to increase the total risk of an investment (relative to the broader market). This Fund is exposed to the following specific risks: growth-style investing risk, and small- and medium-company risk. Consult the Fund’s prospectus for additional information on these and other risks.
41
Strong Advisor Utilities And Energy Fund
For the year ended December 31,2004, the Strong Advisor Utilities and Energy Fund’s Class A shares returned 15.61% (22.68% when excluding the initial sales charge), easily outpacing the 10.87% return of its broad-based benchmark, the S&P 500 Index. Rising energy prices and an overall favorable interest-rate environment aided the Fund’s performance, with all four of its sectors posting positive returns.
Interest-rate environment remained favorable
In the second quarter, reacting in part to stronger-than-expected employment data, the yield of 10-year Treasury bonds rose from 3.84% to 4.58%, resulting in price setbacks for a number of utility and telecommunications stocks. Over the years, we have found that large sell-offs triggered by the perception of rising interest rates frequently provide a good opportunity to reposition the Fund in stocks we like at reasonable valuations. Consequently, we added to a number of electric utility positions as we saw opportunities created by the decline. Also helping the Fund weather this interest-rate storm was our decision to allocate more than half of its assets to cash and to sectors, such as energy and gas utilities, that are less sensitive to rising interest rates. During the otherwise weak second quarter, this strategy helped the Fund deliver a positive return.
In the first, third, and fourth quarters, the Fund benefited from a favorable environment for long-term interest rates, which tend to have a bigger impact on utility stocks than short-term rates. Long-term rates ended the year very close to their level at the beginning of the period, while short-term rates climbed due to five increases by the Federal Reserve Board. As a result, the target federal funds rate rose from 1% at the beginning of 2004 to 2.25% at the end of the year.
Overweighting energy helped performance
A significant portion of the Fund’s gains came during the second half of the year. To a large degree, this was due to the strength in energy prices — particularly crude oil, which climbed above $50 per barrel in October. Increasing demand for fuel in Asia, political instability in Venezuela and Nigeria, and the ongoing conflict in Iraq all contributed to the high price of oil. In fact, analysts estimated that during the period oil prices included a premium of approximately $10 that was attributable to the fear that terrorist activity might interrupt supply.
Morningstar® Style Box™*
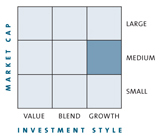
These developments benefited the Fund because of its overweighting, compared to its benchmark, in energy and gas utilities. High commodity prices led to robust cash flows and earnings, resulting in dividend increases and stock repurchases for many of the Fund’s larger energy holdings. Against this backdrop, integrated energy holding ConocoPhillips was a significant contributor to performance, as was ONEOK, a core holding in the gas sector.
Although the Fund’s electric utility stocks — representing about 39% of its assets at period end — underperformed its energy holdings by a considerable degree, they still handily outperformed the benchmark. In this group our results were aided by TXU, a new position that took top honors as the Fund’s largest gainer. TXU, an independent utility based in Texas, is a company we have followed closely for a long time. It encountered a serious liquidity crisis in 2002 and spent much of 2003 repairing its balance sheet. In 2004, the company replaced its CEO with John Wilder, a veteran manager with experience in turnaround situations. We correctly anticipated that his leadership would have a positive impact on investors’ outlook for the company.
Looking ahead
Although energy prices trended lower for most of the fourth quarter, we believe they could be in the process of finding a new, higher equilibrium level than we saw in past years. Consequently, we believe the pattern of dividend increases on the part of companies representing major positions in the Fund that we saw in 2004 could continue in 2005. However, given the healthy gains in energy stocks and the recent softness in oil and gas prices, we will be increasingly sensitive to valuations in that sector going forward.
Additionally, the potential for tax legislation in 2005, that would make permanent the current 15% tax on dividends, adds to the attractiveness of stocks that pay dividends or might increase their dividend payments. We will continue to keep our eye on dividends and dividend policy, as we believe doing so will help us to identify capable, shareholder-friendly managements and financially strong companies with the ability to deliver robust cash flows and dynamic earnings growth.
Effective January 1, 2005, Gary J. Dunn and David L. Roberts of Wells Capital Management Incorporated became the Portfolio Co-Managers of the Fund. In addition, the Fund is expected to reorganize into the Wells Fargo Advantage Equity Income Fund on or about April 11, 2005.
Thank you for your investment in the Strong Advisor Utilities and Energy Fund.
| * | The Morningstar Style Box™ reflects a fund’s investment strategy. For equity funds, the vertical axis shows the market capitalization of the stocks owned and the horizontal axis shows investment style (value, blend, or growth). |
Mention of specific securities in this report is not indicative of whether the Fund may make additional purchases of, sell all or a portion of, or continue to hold those securities.
42
Fund Highlights
Sector Weightings
Percent of Net Assets, as of 12-31-04
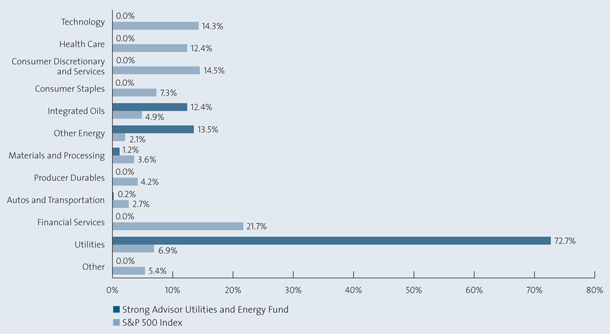
Source: Frank Russell Company via FactSet
Fund Highlights are continued on next page.
43
Strong Advisor Utilities And Energy Fund
Growth of an Assumed $10,000 Investment†
From 7-31-02 to 12-31-04
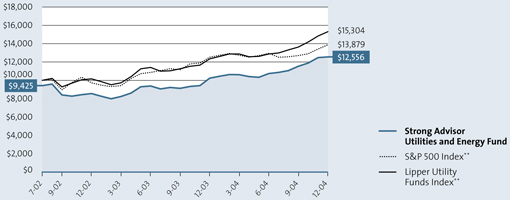
Performance is historical and does not guarantee future results. Investment returns and principal value will fluctuate, and you may have a gain or loss when you sell shares. Current performance may be lower or higher than the quoted performance. Call us or visit www.Strong.com for the most recent month-end performance.
| † | This graph, provided in accordance with SEC regulations, compares a $10,000 investment in the Fund, made at its inception, with the performance of the S&P 500 Index and the Lipper Utility Funds Index. Results include the reinvestment of all dividends and capital gains distributions. The graph and the Average Annual Total Returns table do not reflect the deduction of taxes, if any, that a shareholder would pay on Fund distributions or the redemption of Fund shares. This graph is based on Class A shares only and reflects the effect of the maximum sales charge of 5.75%; performance for other classes will vary due to differences in fee structures and sales charges. |
Definitions:
| ** | The S&P 500 Index consists of 500 stocks chosen for market size, liquidity, and industry group representation. It is a market value weighted index (stock price times number of shares outstanding), with each stock’s weight in the Index proportionate to its market value. The Lipper Utility Funds Index is the average of the 30 largest funds in the Lipper Utility Funds Category. The funds invest primarily in utility shares. Source of the S&P 500 Index data is Standard & Poor’s Micropal. Source of the Lipper Index data is Lipper. |
It is not possible to invest directly in an index.
Top Holdings
Percent of Net Assets, as of 12-31-04
Constellation Energy Group, Inc. | 8.3 | % | |
ONEOK, Inc. | 7.0 | % | |
Exelon Corporation | 5.9 | % | |
TXU Corporation | 5.6 | % | |
Schlumberger, Ltd. | 5.2 | % | |
Wisconsin Energy Corporation | 4.3 | % | |
Southern Union Company | 4.3 | % | |
PPL Corporation | 4.1 | % | |
BP PLC Sponsored ADR | 3.9 | % | |
American Electric Power Company, Inc. | 3.9 | % | |
Top Ten | 52.5 | % | |
Holdings vary. More complete holdings are available at www.Strong.com.
Percentage Restrictions: The Fund’s prospectus and statement of additional information may describe restrictions on the percentage of a particular type or quality of security in which the Fund may invest (“Percentage Restrictions”). Percentage Restrictions apply at the time the Fund purchases a security. Circumstances subsequent to the purchase of the security, such as a change in: (1) the Fund’s assets (e.g., due to cash inflows and redemptions), (2) the market value of the security, or (3) the pricing, liquidity, or rating of the security, may cause the Fund to exceed or fall short of the Percentage Restriction. If this happens, the Fund’s continued holding of the security will not constitute a violation of the Percentage Restriction.
44
Average Annual Total Returns
As of 12-31-04
Class A1,2 | |||
1-year | 15.61 | % | |
Since Fund Inception (7-31-02) | 9.87 | % | |
Class A, excluding sales load | |||
1-year | 22.68 | % | |
Since Fund Inception (7-31-02) | 12.59 | % | |
Class B1,2 | |||
1-year | 17.13 | % | |
Since Fund Inception (7-31-02) | 10.62 | % | |
Class C1,2 | |||
1-year | 21.07 | % | |
Since Fund Inception (7-31-02) | 11.99 | % | |
Performance is historical and does not guarantee future results. Investment returns and principal value will fluctuate, and you may have a gain or loss when you sell shares. Current performance may be lower or higher than the quoted performance. Call us or visit www.Strong.com for the most recent month-end performance.
Fee Waivers:
| 1 | From time to time, the Fund’s advisor and/or administrator has waived fees and/or absorbed Fund expenses, which has resulted in higher returns. As of 12-31-04, there are waivers and/or absorptions in effect for all share classes. |
Performance:
| 2 | Average annual total returns include the effect of the maximum sales charge of 5.75% for Class A, the applicable contingent deferred sales charge of 5.00% in year 1 and eliminated after year 6 for Class B, and the applicable contingent deferred sales charge of 1.00% and eliminated after 12 months for Class C. |
Please consult a prospectus for information about all share classes.
Top Ten Industries
Percent of Net Assets, as of 12-31-04
Utility — Electric Power | 39.0 | % | |
Utility — Gas Distribution | 21.6 | % | |
Oil & Gas — International Integrated | 11.9 | % | |
Oil & Gas — Field Services | 5.2 | % | |
Oil & Gas — Drilling | 4.1 | % | |
Telecommunications — Services | 3.3 | % | |
Telecommunications — Services Foreign | 3.1 | % | |
Oil & Gas — United States Exploration & Production | 2.2 | % | |
Diversified Operations | 2.1 | % | |
Chemicals — Specialty | 1.2 | % | |
Top Ten | 93.7 | % | |
Risks: Stock funds should only be considered for long-term goals as values fluctuate in response to the activities of individual companies and general market and economic conditions. Investment strategies that concentrate in particular market segments or fewer securities tend to increase the total risk of an investment (relative to the broader market). This Fund is exposed to the following specific risks: value-style investing risk, concentrated-portfolio risk, energy-company risk, public-utilities-sector risk, and small- and medium-company risk. Consult the Fund’s prospectus for additional information on these and other risks.
45
Strong Advisor Large Company Core Fund
The Strong Advisor Large Company Core Fund Class A shares rose 4.32% during the year ending December 31, 2004 (10.69% when excluding the initial sales charge). This result lagged the Fund’s broad-based benchmark the S&P 500 Index, which gained 10.87% during the same period.
The Fund’s performance was helped by stock selection in the health care sector. In addition, the Fund benefited from stock selection in the financial sector.
The Fund’s investment process
We followed a consistent management strategy throughout the past 12 months. Our investment process was “bottom up,” meaning that we evaluated candidates for inclusion in the portfolio on an individual basis. In other words, our focus was on adding value through stock selection, as opposed to making indirect sector bets.
In choosing stocks, we followed a three-step process. First, we sought to purchase companies with improving fundamentals and earnings quality, which we defined as the proportion of earnings that are based on cash flow and not on management’s estimations and forecasts. Second, we looked for companies whose management strategy was to attempt to maximize the long-term value of the business, which we defined as the present value of the company’s future net cash flows. Finally, we wished to purchase stocks at a discount to what we believed was their fair value. To arrive at this value, we used multiple valuation tools, including both absolute and relative value metrics. After constructing the portfolio using this approach, we applied a series of risk measures to better understand how the portfolio was constructed and seek ways to reduce risk for the Fund’s shareholders.
What worked, what didn’t
Applying this stock selection process, the Fund owned a position in Aetna, a health and related benefits company. Following years of declining membership, the company’s operational turnaround began to take hold, leading membership to rise. As a result of solid pricing and growth in membership, Aetna realized higher earnings, profit margins and cash flow. In addition, the entire health care industry saw its prospects improve stemming from reduced regulatory risk and an increased likelihood of Medicare privatization. Against this backdrop, Aetna’s shares enjoyed strong performance throughout the period, especially during the strong stock market rally of the fourth quarter.
Morningstar® Style Box™*
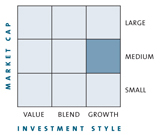
Tyson Foods, however, was a portfolio holding that did not work out as well. Tyson, the world’s largest producer of meats and the largest chicken-products producer in the U.S., faced higher-than-expected expenses as a result of rising costs for chicken feed. At the same time, demand for chicken, which was strong in the summertime, decreased. The lower demand caused high inventories and put pressure on prices, cutting into Tyson’s earnings. These factors combined to lower the company’s earnings in the year’s third quarter and reduce investors’ future expectations.
Questions lie ahead
A number of questions remain unanswered for the year ahead: What will happen to crude oil prices? How quickly will the Federal Reserve Board continue to raise interest rates? Will the U.S. dollar continue its decline against the euro, yen and other world currencies? How will the war on terrorism proceed, and will violence in the Middle East persist? Although we can’t predict the answers to these questions, we are confident that these will be significant factors in how the market responds in 2005.
New Manager and Fund Reorganization
Effective January 1, 2005, David A. Katz, CFA, of Matrix Asset Advisors, Inc., became the sole Portfolio Manager of the Fund. In addition, the Fund is expected to reorganize into the Wells Fargo Advantage Large Company Core Fund, the successor to the Strong Advisor Large Company Core Fund, on or about April 11, 2005.
We thank you for your investment in the Strong Advisor Large Company Core Fund.
| * | The Morningstar Style Box™ reflects a fund’s investment strategy. For equity funds, the vertical axis shows the market capitalization of the stocks owned and the horizontal axis shows investment style (value, blend, or growth). |
Mention of specific securities in this report is not indicative of whether the Fund may make additional purchases of, sell all or a portion of, or continue to hold those securities.
46
Fund Highlights
Sector Weightings
Percent of Net Assets, as of 12-31-04
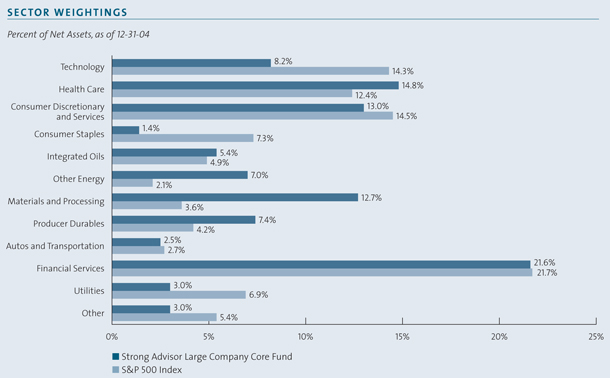
Source: Frank Russell Company via FactSet
Fund Highlights are continued on next page.
47
Strong Advisor Large Company Core Fund
Growth of an Assumed $10,000 Investment†
From 11-3-97 to 12-31-04
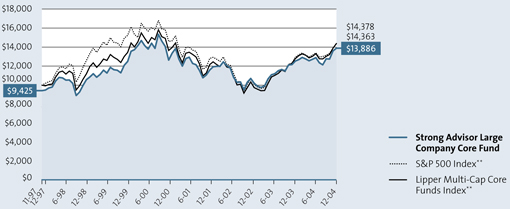
Performance is historical and does not guarantee future results. Investment returns and principal value will fluctuate, and you may have a gain or loss when you sell shares. Current performance may be lower or higher than the quoted performance. Call us or visit www.Strong.com for the most recent month-end performance.
| † | This graph, provided in accordance with SEC regulations, compares a $10,000 investment in the Fund, made at its inception, with the performance of the S&P 500 Index and the Lipper Multi-Cap Core Funds Index. Results include the reinvestment of all dividends and capital gains distributions. The graph and the Average Annual Total Returns table do not reflect the deduction of taxes, if any, that a shareholder would pay on Fund distributions or the redemption of Fund shares. This graph is based on Class A shares only and reflects the effect of the maximum sales charge of 5.75%; performance for other classes will vary due to differences in fee structures and sales charges. |
| To equalize time periods, the indices’ performances were prorated for the month of November 1997. |
| Definitions: |
| ** | The S&P 500 Index consists of 500 stocks chosen for market size, liquidity, and industry group representation. It is a market value weighted index (stock price times number of shares outstanding), with each stock’s weight in the Index proportionate to its market value. The Lipper Multi-Cap Core Funds Index is the average of the 30 largest funds in the Lipper Multi-Cap Core Funds Category. Source of the S&P 500 Index data is Standard & Poor’s Micropal. Source of the Lipper Index data is Lipper. |
| It is not possible to invest directly in an index. |
Top Holdings
Percent of Net Assets, as of 12-31-04
UnitedHealth Group, Inc. | 3.8 | % | |
CIT Group, Inc. | 3.5 | % | |
Becton, Dickinson & Company | 3.2 | % | |
Sherwin Williams Company | 3.2 | % | |
Archer Daniels Midland Company | 3.1 | % | |
Wachovia Corporation | 3.1 | % | |
NIKE, Inc. Class B | 3.0 | % | |
Burlington Resources, Inc. | 3.0 | % | |
Eaton Corporation | 3.0 | % | |
Prudential Financial, Inc. | 2.9 | % | |
Top Ten | 31.8 | % | |
Holdings vary. More complete holdings are available at www.Strong.com.
Percentage Restrictions: The Fund’s prospectus and statement of additional information may describe restrictions on the percentage of a particular type or quality of security in which the Fund may invest (“Percentage Restrictions”). Percentage Restrictions apply at the time the Fund purchases a security. Circumstances subsequent to the purchase of the security, such as a change in: (1) the Fund’s assets (e.g., due to cash inflows and redemptions), (2) the market value of the security, or (3) the pricing, liquidity, or rating of the security, may cause the Fund to exceed or fall short of the Percentage Restriction. If this happens, the Fund’s continued holding of the security will not constitute a violation of the Percentage Restriction.
48
Average Annual Total Returns
As of 12-31-04
Class A1,2,3 | |||
1-year | 4.32 | % | |
5-year | -0.71 | % | |
Since Fund Inception (11-3-97) | 4.69 | % |
Class A, excluding sales load | |||
1-year | 10.69 | % | |
5-year | 0.48 | % | |
Since Fund Inception (11-3-97) | 5.50 | % |
Class B1,2 | |||
1-year | 4.67 | % | |
5-year | -0.85 | % | |
Since Fund Inception (11-3-97) | 4.57 | % |
Class C1,2 | |||
1-year | 8.57 | % | |
5-year | -0.46 | % | |
Since Fund Inception (11-3-97) | 4.56 | % |
Class K1,2 | |||
1-year | 11.32 | % | |
5-year | 0.79 | % | |
Since Fund Inception (11-3-97) | 5.79 | % |
Performance is historical and does not guarantee future results. Investment returns and principal value will fluctuate, and you may have a gain or loss when you sell shares. Current performance may be lower or higher than the quoted performance. Call us or visit www.Strong.com for the most recent month-end performance.
Fee Waivers:
| 1 | From time to time, the Fund’s advisor and/or administrator has waived fees and/or absorbed Fund expenses, which has resulted in higher returns. As of 12-31-04, there are waivers and/or absorptions in effect for all share classes. |
| Performance: |
| 2 | Average annual total returns for Class A shares include the effect of the maximum sales charge of 5.75%, which was first charged on 9-17-99 and are based on the performance of the Rockhaven Fund’s Class A shares (the predecessor Fund) prior to 9-16-02. Average annual total returns for Class B shares include the effect of the applicable contingent deferred sales charge, which is 5.00% in year 1 and is eliminated after year 6, and are based on the performance of the Rockhaven Fund’s Class A shares from inception through 9-15-02, restated to reflect the contingent deferred sales charge and the different expenses of the Class B shares, as applicable, and the historical performance of the Fund’s Class A shares from 9-16-02 to 9-30-02. Average annual total returns for Class C shares include the effect of the applicable contingent deferred sales charge, which is 1.00%, and is eliminated after 12 months and are based on the performance of the Rockhaven Fund’s Class A shares from inception through 9-15-02, restated to reflect the contingent deferred sales charge and the different expenses of the Class C shares, as applicable, and the historical performance of the Fund’s Class A shares from 9-16-02 to 9-30-02. The performance of the Class K shares is based on the performance of the Rockhaven Fund’s Class A shares from inception through 9-15-02, and the historical performance of the Fund’s Class A shares from 9-16-02 to 9-30-02, and does not reflect the Fund’s maximum sales charge of 5.75%, which was charged from 9-17-99 through 9-30-02. |
| 3 | The Fund’s Class A shares have a redemption fee of 1.00% against shares that are held 360 calendar days or fewer after purchase. Performance data does not reflect the deduction of this fee, which, if reflected, would reduce the performance. |
| Please consult a prospectus for information about all share classes. |
Top Ten Industries
Percent of Net Assets, as of 12-31-04
Medical — Health Maintenance Organizations | 6.2 | % | |
Finance — Consumer/Commercial Loans | 6.0 | % | |
Banks — Super Regional | 5.4 | % | |
Oil & Gas — International Integrated | 5.3 | % | |
Telecommunications — Wireless Equipment | 4.8 | % | |
Oil & Gas — United States Exploration & Production | 4.5 | % | |
Medical/Dental — Supplies | 3.2 | % | |
Building — Paint & Allied Products | 3.2 | % | |
Food — Flour & Grain | 3.1 | % | |
Apparel — Shoes & Related Manufacturing | 3.0 | % | |
Top Ten | 44.7 | % | |
Risks: Stock funds should only be considered for long-term goals as values fluctuate in response to the activities of individual companies and general market and economic conditions. Consult the Fund’s prospectus for additional information on this and other risks.
49
| December 31, 2004 |
About Your Fund’s Expenses
Example
As a shareholder of a mutual fund, you may incur two types of costs: (1) transaction costs, including sales charges (loads) on purchase payments, or other distributions; redemption fees; and exchange fees; and (2) ongoing costs, including management fees; distribution and/or service (12b-1) fees; and other fund expenses.
This Example is intended to help you understand your ongoing costs (in dollars) of investing in the Fund and to compare these costs with the ongoing costs of investing in other mutual funds. The Example is based on a hypothetical investment of $1,000 invested at the beginning of the period and held for the entire period, July 1, 2004 through December 31, 2004.
Actual Expenses
The columns under the heading entitled “Actual” help you to estimate the actual expenses you paid over the period. The “Actual — Ending Account Value” shown is derived from the Fund’s actual return, and the “Actual — Expenses Paid During Period” shows the dollar amount that would have been paid by an investor who started with $1,000 in the Fund. To estimate the expenses you paid on your account during this period, simply divide your account value by $1,000 (for example, an $8,600 account value divided by $1,000 = 8.60), then multiply the result by the number in the column under the heading entitled “Actual — Expenses Paid During Period”.
Hypothetical Example for Comparison Purposes
The columns under the heading entitled “Hypothetical” provide information about hypothetical account values and hypothetical expenses based on the Fund’s actual expense ratio and an assumed rate of return of 5% per year before expenses, which is not the Fund’s actual return. The hypothetical account values and expenses may not be used to estimate the actual ending account balance or expenses you paid for the period. You may use this information to compare the ongoing costs of investing in the Fund and other funds. To do so, compare this 5% hypothetical example with the 5% hypothetical examples that appear in the shareholder reports of the other funds.
Please note that the expenses shown in the table are meant to highlight your ongoing costs only and do not reflect any transactional costs, such as sales charges (loads), redemption fees, or exchange fees. Therefore, the last column of the table (Hypothetical — Expenses Paid During Period) is useful in comparing ongoing costs only, and will not help you determine the relative total costs of owning different funds. In addition, if these transactional costs were included, your costs could have been higher.
Actual Returns vs. Hypothetical Returns
Six Months Ended December 31, 2004
| Actual | Hypothetical (5% return before expenses) | |||||||||||||||||||
| Class | Fund’s Annualized | Beginning 7-01-04 | Ending 12-31-04 | Expenses Paid During Period3 | Ending Account Value 12-31-04 | Expenses Paid During Period3 | ||||||||||||||
Strong Advisor Common Stock Fund | A B C Z | 1.56 2.29 2.33 1.30 | % % % % | $ $ $ $ | 1,000.00 1,000.00 1,000.00 1,000.00 | $ $ $ $ | 1,073.70 1,070.10 1,069.60 1,075.30 | $ $ $ $ | 8.13 11.92 12.12 6.78 | $ $ $ $ | 1,017.29 1,013.62 1,013.42 1,018.60 | $ $ $ $ | 7.91 11.59 11.79 6.60 | |||||||
Strong Advisor Mid Cap Growth Fund | A B C Z | 1.77 2.32 2.25 1.84 | % % % % | $ $ $ $ | 1,000.00 1,000.00 1,000.00 1,000.00 | $ $ $ $ | 1,123.90 1,121.40 1,121.40 1,124.40 | $ $ $ $ | 9.45 12.37 12.00 9.83 | $ $ $ $ | 1,016.24 1,013.47 1,013.83 1,015.89 | $ $ $ $ | 8.97 11.74 11.39 9.32 | |||||||
(Continued on next page)
50
Actual Returns vs. Hypothetical Returns
Six Months Ended December 31, 2004
| Actual | Hypothetical (5% return before expenses) | |||||||||||||||||||
| Class | Fund’s Annualized | Beginning 7-01-04 | Ending 12-31-04 | Expenses Paid During Period3 | Ending 12-31-04 | Expenses Paid During Period3 | ||||||||||||||
Strong Advisor Small Cap Value Fund | A B C Z | 1.54 2.27 2.29 1.35 | % % % % | $ $ $ $ | 1,000.00 1,000.00 1,000.00 1,000.00 | $ $ $ $ | 1,132.20 1,127.80 1,128.00 1,132.80 | $ $ $ $ | 8.25 12.14 12.25 7.24 | $ $ $ $ | 1,017.39 1,013.72 1,013.62 1,018.35 | $ $ $ $ | 7.81 11.49 11.59 6.85 | |||||||
Strong Advisor U.S. Value Fund | A B C K Z | 1.36 2.10 2.20 0.93 1.33 | % % % % % | $ $ $ $ $ | 1,000.00 1,000.00 1,000.00 1,000.00 1,000.00 | $ $ $ $ $ | 1,091.40 1,086.90 1,086.60 1,093.60 1,091.20 | $ $ $ $ $ | 7.15 11.02 11.54 4.89 6.99 | $ $ $ $ $ | 1,018.30 1,014.58 1,014.08 1,020.46 1,018.45 | $ $ $ $ $ | 6.90 10.63 11.14 4.72 6.75 | |||||||
Strong Advisor Endeavor Large Cap Fund | A B C | 1.64 2.41 2.44 | % % % | $ $ $ | 1,000.00 1,000.00 1,000.00 | $ $ $ | 1,093.00 1,088.70 1,088.70 | $ $ $ | 8.63 12.65 12.81 | $ $ $ | 1,016.89 1,013.02 1,012.87 | $ $ $ | 8.31 12.19 12.35 | |||||||
Strong Advisor Focus Fund | A B C | 2.49 2.42 2.46 | % % % | $ $ $ | 1,000.00 1,000.00 1,000.00 | $ $ $ | 1,084.40 1,084.60 1,084.60 | $ $ $ | 13.05 12.68 12.89 | $ $ $ | 1,012.62 1,012.97 1,012.77 | $ $ $ | 12.60 12.25 12.45 | |||||||
Strong Advisor International Core Fund | A B C | 0.00 0.00 0.00 | % % % | $ $ $ | 1,000.00 1,000.00 1,000.00 | $ $ $ | 1,135.70 1,136.00 1,135.20 | $ $ $ | — — — | $ $ $ | 1,025.14 1,025.14 1,025.14 | $ $ $ | — — — | |||||||
Strong Advisor Select Fund | A B C | 1.56 2.35 2.37 | % % % | $ $ $ | 1,000.00 1,000.00 1,000.00 | $ $ $ | 1,067.20 1,062.10 1,062.10 | $ $ $ | 8.11 12.18 12.28 | $ $ $ | 1,017.29 1,013.32 1,013.22 | $ $ $ | 7.91 11.89 11.99 | |||||||
Strong Advisor Technology Fund | A B C | 2.37 2.42 2.35 | % % % | $ $ $ | 1,000.00 1,000.00 1,000.00 | $ $ $ | 1,030.50 1,031.00 1,031.10 | $ $ $ | 12.10 12.35 12.00 | $ $ $ | 1,013.22 1,012.97 1,013.32 | $ $ $ | 11.99 12.25 11.89 | |||||||
Strong Advisor U.S. Small/Mid Cap Growth Fund | A B C | 2.42 2.42 2.39 | % % % | $ $ $ | 1,000.00 1,000.00 1,000.00 | $ $ $ | 1,013.50 1,013.50 1,013.50 | $ $ $ | 12.25 12.25 12.10 | $ $ $ | 1,012.97 1,012.97 1,013.12 | $ $ $ | 12.25 12.25 12.09 | |||||||
Strong Advisor Utilities and Energy Fund | A B C | 2.11 2.82 2.85 | % % % | $ $ $ | 1,000.00 1,000.00 1,000.00 | $ $ $ | 1,167.80 1,164.50 1,163.20 | $ $ $ | 11.50 15.34 15.50 | $ $ $ | 1,014.53 1,010.96 1,010.81 | $ $ $ | 10.68 14.25 14.41 | |||||||
Strong Advisor Large Company Core Fund | A B C K | 1.43 2.39 2.45 0.91 | % % % % | $ $ $ $ | 1,000.00 1,000.00 1,000.00 1,000.00 | $ $ $ $ | 1,077.00 1,071.60 1,070.60 1,080.20 | $ $ $ $ | 7.47 12.45 12.75 4.76 | $ $ $ $ | 1,017.95 1,013.12 1,012.82 1,020.56 | $ $ $ $ | 7.25 12.09 12.40 4.62 | |||||||
| 1 | Based on the Fund’s most recent six-month period; may differ from expense ratios based on one-year data in the Financial Highlights. |
| 2 | These ratios do not include the effect of directed brokerage credits and/or custody earnings credits, if any. |
| 3 | Expenses are equal to the Fund’s annualized expense ratio multiplied by the average account value over the period, multiplied by 184 days, and divided by 366. |
51
SCHEDULES OF INVESTMENTS IN SECURITIES | December 31, 2004 |
STRONG ADVISOR COMMON STOCK FUND
| Shares or Principal Amount | Value (Note 2) | ||||
Common Stocks 94.4% | |||||
Apparel - Shoes & Related Manufacturing 1.3% | |||||
Reebok International, Ltd. | 390,000 | $ | 17,160,000 | ||
Banks - Super Regional 2.3% | |||||
Fifth Third Bancorp | 345,000 | 16,311,600 | |||
Marshall & Ilsley Corporation | 315,000 | 13,923,000 | |||
| 30,234,600 | |||||
Banks - West/Southwest 1.7% | |||||
City National Corporation | 315,000 | 22,254,750 | |||
Building - Heavy Construction 1.5% | |||||
Jacobs Engineering Group, Inc. (b) | 420,000 | 20,071,800 | |||
Chemicals - Specialty 1.8% | |||||
Lonza Group AG (CHF) (h) | 425,000 | 23,787,332 | |||
Commercial Services - Leasing 1.4% | |||||
Ryder Systems, Inc. | 385,000 | 18,391,450 | |||
Computer - Data Storage 1.5% | |||||
Seagate Technology (b)(f) | 1,100,000 | 18,997,000 | |||
Computer - IT Services 2.4% | |||||
Affiliated Computer Services, Inc. Class A (b) | 265,000 | 15,950,350 | |||
BearingPoint, Inc. (b) | 1,955,000 | 15,698,650 | |||
| 31,649,000 | |||||
Computer - Software Design 1.8% | |||||
Mentor Graphics Corporation (b)(f) | 1,565,000 | 23,928,850 | |||
Computer Software - Enterprise 2.2% | |||||
Business Objects SA Sponsored ADR (b)(f) | 420,000 | 10,642,800 | |||
Citrix Systems, Inc. (b) | 745,000 | 18,274,850 | |||
| 28,917,650 | |||||
Containers 1.8% | |||||
Pactiv Corporation (b) | 905,000 | 22,887,450 | |||
Cosmetics - Personal Care 1.6% | |||||
International Flavors & Fragrances, Inc. | 485,000 | 20,777,400 | |||
Diversified Operations 1.6% | |||||
Carlisle Companies, Inc. (f) | 290,000 | 18,826,800 | |||
SPX Corporation | 60,000 | 2,403,600 | |||
| 21,230,400 | |||||
Electrical - Equipment 1.3% | |||||
EnerSys (b)(f) | 1,090,000 | 16,622,500 | |||
Electronics - Contract Manufacturing 1.2% | |||||
Solectron Corporation (b) | 3,000,000 | 15,990,000 | |||
Electronics - Miscellaneous Components 1.5% | |||||
Amphenol Corporation Class A (b) | 540,000 | 19,839,600 | |||
Electronics - Semiconductor Manufacturing 5.3% | |||||
Advanced Micro Devices, Inc. (b)(f) | 740,000 | 16,294,800 | |||
Fairchild Semiconductor International, Inc. (b) | 1,110,000 | 18,048,600 | |||
SanDisk Corporation (b) | 670,000 | 16,729,900 | |||
Silicon Laboratories, Inc. (b)(f) | 520,000 | 18,361,200 | |||
| 69,434,500 | |||||
Finance - Equity REIT 0.8% | |||||
Apartment Investment & Management Company Class A | 265,000 | $ | 10,213,100 | ||
Finance - Investment Brokers 1.2% | |||||
Merrill Lynch & Company, Inc. | 265,000 | 15,839,050 | |||
Finance - Publicly Traded Investment Funds- Equity (Non 40 Act) 1.4% | |||||
Biotech HOLDRs Trust (f) | 115,000 | 17,585,800 | |||
Insurance - Brokers 1.5% | |||||
Arthur J. Gallagher & Company | 615,000 | 19,987,500 | |||
Insurance - Diversified 1.2% | |||||
Genworth Financial, Inc. Class A (f) | 575,000 | 15,525,000 | |||
Insurance - Property/Casualty/Title 4.1% | |||||
MBIA, Inc. | 275,000 | 17,402,000 | |||
RenaissanceRe Holdings, Ltd. | 370,000 | 19,269,600 | |||
The St. Paul Travelers Companies, Inc. | 440,000 | 16,310,800 | |||
| 52,982,400 | |||||
Internet - Content 0.7% | |||||
Ask Jeeves, Inc. (b)(f) | 330,000 | 8,827,500 | |||
Internet - E*Commerce 1.2% | |||||
IAC/InterActiveCorp (b)(f) | 555,000 | 15,329,100 | |||
Internet - Software 0.5% | |||||
DoubleClick, Inc. (b) | 850,000 | 6,613,000 | |||
Machinery - General Industrial 1.3% | |||||
Roper Industries, Inc. | 280,000 | 17,015,600 | |||
Media - Cable TV 6.1% | |||||
Cablevision Systems New York Group Class A (b) | 1,150,000 | 28,635,000 | |||
The DIRECTV Group, Inc. (b) | 1,000,000 | 16,740,000 | |||
News Corporation Class A | 1,000,000 | 18,660,000 | |||
Telewest Global, Inc. (b) | 850,000 | 14,943,000 | |||
| 78,978,000 | |||||
Media - Newspapers 1.1% | |||||
Dow Jones & Company, Inc. (f) | 340,000 | 14,640,400 | |||
Media - Periodicals 1.0% | |||||
Verenigde Nederlandse Uitgeversbedrijven NV (EUR) (h) | 455,000 | 13,410,930 | |||
Media - Radio/TV 1.6% | |||||
Liberty Media Corporation Class A (b) | 1,900,000 | 20,862,000 | |||
Medical - Biomedical/Biotechnology 2.4% | |||||
Celgene Corporation (b)(f) | 495,000 | 13,132,350 | |||
Medimmune, Inc. (b) | 655,000 | 17,757,050 | |||
| 30,889,400 | |||||
Medical - Ethical Drugs 0.6% | |||||
Biovail Corporation International (b) | 500,000 | 8,265,000 | |||
Medical - Products 2.4% | |||||
Respironics, Inc. (b) | 180,000 | 9,784,800 | |||
Valeant Pharmaceuticals International (f) | 795,000 | 20,948,250 | |||
| 30,733,050 | |||||
52
STRONG ADVISOR COMMON STOCK FUND (continued)
Shares or Principal Amount | Value (Note 2) | ||||||
Medical/Dental - Services 2.7% | |||||||
Omnicare, Inc. (f) | 505,000 | $ | 17,483,100 | ||||
Pharmaceutical Product Development, Inc. (b) | 440,000 | 18,167,600 | |||||
| 35,650,700 | |||||||
Medical/Dental - Supplies 1.4% | |||||||
Hillenbrand Industries, Inc. | 320,000 | 17,772,800 | |||||
Metal Ores - Gold/Silver 0.3% | |||||||
Placer Dome, Inc. | 180,000 | 3,394,800 | |||||
Metal Ores - Miscellaneous 1.5% | |||||||
Alcoa, Inc. | 600,000 | 18,852,000 | |||||
Oil & Gas - Drilling 4.0% | |||||||
Nabors Industries, Ltd. (b) | 385,000 | 19,746,650 | |||||
Noble Corporation (b) | 650,000 | 32,331,000 | |||||
| 52,077,650 | |||||||
Oil & Gas - Machinery/Equipment 1.8% | |||||||
Smith International, Inc. (b) | 425,000 | 23,124,250 | |||||
Oil & Gas - United States Exploration & Production 6.1% | |||||||
Apache Corporation (e) | 550,000 | 27,813,500 | |||||
Burlington Resources, Inc. (e) | 680,000 | 29,580,000 | |||||
EOG Resources, Inc. | 310,000 | 22,121,600 | |||||
| 79,515,100 | |||||||
Pollution Control - Services 1.5% | |||||||
Republic Services, Inc. | 565,000 | 18,950,100 | |||||
Retail - Clothing/Shoes 1.1% | |||||||
Ann Taylor Stores Corporation (b) | 670,000 | 14,425,100 | |||||
Retail - Department Stores 2.6% | |||||||
Kohl’s Corporation (b) | 320,000 | 15,734,400 | |||||
Saks, Inc. (f) | 1,280,000 | 18,572,800 | |||||
| 34,307,200 | |||||||
Retail - Leisure Product 1.3% | |||||||
The Sports Authority, Inc. (b)(f) | 630,000 | 16,222,500 | |||||
Retail - Restaurants 1.3% | |||||||
Outback Steakhouse, Inc. | 355,000 | 16,251,900 | |||||
Retail - Super/Mini Markets 1.5% | |||||||
The Kroger Company (b) | 1,130,000 | 19,820,200 | |||||
Retail/Wholesale - Auto Parts 1.6% | |||||||
Advanced Auto Parts, Inc. (b) | 470,000 | 20,529,600 | |||||
Telecommunications - Services 1.5% | |||||||
Sprint Corporation | 790,000 | 19,631,500 | |||||
Telecommunications - Wireless Equipment 1.3% | |||||||
Nokia Corporation Sponsored ADR | 1,040,000 | 16,296,800 | |||||
Transportation - Airline 1.6% | |||||||
Continental Airlines, Inc. Class B (b)(f) | 1,550,000 | 20,987,000 | |||||
Total Common Stocks (Cost $869,459,480) | 1,227,680,312 | ||||||
Put Options Purchased 0.0% | |||||||
Oil & Gas - United States Exploration & Production | |||||||
Apache Corporation: | |||||||
Expires 1/21/05 at $50.00 | 25,000 | $ | 146,250 | ||||
Expires 4/15/05 at $55.00 | 25,000 | 23,125 | |||||
Burlington Resources, Inc., | |||||||
Expires 1/21/05 at $42.50 | 70,000 | 43,750 | |||||
Total Put Options Purchased (Cost $392,150) | 213,125 | ||||||
Short-Term Investments (a) 9.7% | |||||||
Collateral Received for Securities Lending 4.1% | |||||||
Navigator Prime Portfolio | 53,056,922 | 53,056,922 | |||||
Repurchase Agreements (c) 5.6% | |||||||
ABN AMRO Inc. (Dated 12/31/04), 2.15%, Due 1/03/05 (Repurchase proceeds $70,912,703); Collateralized by: United States Government & Agency Issues | $ | 70,900,000 | 70,900,000 | ||||
State Street Bank (Dated 12/31/04), 0.85%, Due 1/03/05 (Repurchase proceeds $1,727,422); Collateralized by: United States Government & Agency Issues | 1,727,300 | 1,727,300 | |||||
| 72,627,300 | |||||||
Total Short-Term Investments (Cost $125,684,222) | 125,684,222 | ||||||
Total Investments in Securities (Cost $995,535,852) 104.1% | 1,353,577,659 | ||||||
Other Assets and Liabilities, Net (4.1%) | (53,446,748 | ) | |||||
Net Assets 100.0% | $ | 1,300,130,911 | |||||
WRITTEN OPTIONS ACTIVITY | |||||||
| Contracts | Premiums | ||||||
Options outstanding at beginning of year | — | $ | — | ||||
Options written during the year | 1,200 | 252,144 | |||||
Options closed | — | — | |||||
Options expired | — | — | |||||
Options exercised | — | — | |||||
Options outstanding at end of year | 1,200 | 252,144 | |||||
WRITTEN CALL OPTIONS DETAIL | |||||||
Contracts (100 shares per contract) | Value (Note 2) | ||||||
Apache Corporation | |||||||
(Strike Price is $50.00. Expiration date is 1/21/05. Premium received is $67,999.) | 250 | $ | (38,125 | ) | |||
(Strike Price is $55.00. Expiration date is 4/15/05. Premium received is $74,248.) | 250 | (43,125 | ) | ||||
Burlington Resources, Inc. | |||||||
(Strike Price is $42.50. Expiration date is 1/21/05. Premium received is $109,897.) | 700 | (119,000 | ) | ||||
| 1,200 | $ | (200,250 | ) | ||||
53
SCHEDULES OF INVESTMENTS IN SECURITIES (continued) | December 31 , 2004 |
STRONG ADVISOR MID CAP GROWTH FUND
| Shares or Principal Amount | Value (Note 2) | ||||
Common Stocks 99.4% | |||||
Apparel - Clothing Manufacturing 1.9% | |||||
Coach, Inc. (b) | 23,000 | $ | 1,297,200 | ||
Banks - West/Southwest 0.4% | |||||
Placer Sierra Bancshares | 10,500 | 298,620 | |||
Building - Construction Products/Miscellaneous 0.4% | |||||
USG Corporation (b) | 6,000 | 241,620 | |||
Chemicals - Specialty 0.4% | |||||
Airgas, Inc. | 11,000 | 291,610 | |||
Computer - IT Services 3.3% | |||||
Cognizant Technology Solutions Corporation Class A (b) | 39,000 | 1,650,870 | |||
Kanbay International, Inc. (b) | 8,100 | 253,530 | |||
Satyam Computer Services, Ltd. ADR | 14,000 | 337,820 | |||
| 2,242,220 | |||||
Computer - Local Networks 2.0% | |||||
Juniper Networks, Inc. (b) | 24,000 | 652,560 | |||
Polycom, Inc. (b) | 29,000 | 676,280 | |||
| 1,328,840 | |||||
Computer - Manufacturers 2.8% | |||||
Apple Computer, Inc. (b) | 29,000 | 1,867,600 | |||
Computer Software - Desktop 2.0% | |||||
Adobe Systems, Inc. | 11,000 | 690,140 | |||
Macromedia, Inc. (b) | 22,000 | 684,640 | |||
| 1,374,780 | |||||
Computer Software - Security 0.8% | |||||
VeriSign, Inc. (b) | 17,000 | 569,840 | |||
Diversified Operations 0.8% | |||||
Textron, Inc. | 7,000 | 516,600 | |||
Electronics - Military Systems 1.1% | |||||
L-3 Communications Corporation | 10,000 | 732,400 | |||
Electronics - Miscellaneous Components 1.0% | |||||
Rockwell Automation, Inc. | 14,000 | 693,700 | |||
Electronics - Scientific Measuring 0.5% | |||||
PerkinElmer, Inc. | 15,600 | 350,844 | |||
Electronics - Semiconductor Manufacturing 4.3% | |||||
Marvell Technology Group, Ltd. (b) | 51,000 | 1,808,970 | |||
Tessera Technologies, Inc. (b) | 11,000 | 409,310 | |||
Varian Semiconductor Equipment Associates, Inc. (b) | 18,000 | 663,300 | |||
| 2,881,580 | |||||
Energy - Other 1.5% | |||||
CONSOL Energy, Inc. | 24,000 | 985,200 | |||
Finance - Consumer/Commercial Loans 1.4% | |||||
AmeriCredit Corporation (b) | 38,000 | 929,100 | |||
Finance - Investment Brokers 1.0% | |||||
Chicago Mercantile Exchange Holdings, Inc. | 3,000 | 686,100 | |||
Finance - Mortgage & Related Services 3.3% | |||||
Doral Financial Corporation | 45,000 | 2,216,250 | |||
Financial Services - Miscellaneous 5.6% | |||||
Alliance Data Systems Corporation (b) | 29,000 | $ | 1,376,920 | ||
Euronet Services, Inc. (b) | 16,000 | 416,320 | |||
First Marblehead Corporation (b) | 21,000 | 1,181,250 | |||
Jackson Hewitt Tax Service, Inc. | 31,500 | 795,375 | |||
| 3,769,865 | |||||
Household - Consumer Electronics 1.5% | |||||
Harman International Industries, Inc. | 8,200 | 1,041,400 | |||
Internet - Content 2.7% | |||||
Ask Jeeves, Inc. (b) | 20,000 | 535,000 | |||
InfoSpace, Inc. (b) | 26,700 | 1,269,585 | |||
| 1,804,585 | |||||
Internet - E*Commerce 0.5% | |||||
Arbinet-thexchange, Inc. (b) | 13,500 | 335,475 | |||
Internet - Internet Service Provider 1.1% | |||||
j2 Global Communications, Inc. (b) | 21,000 | 724,500 | |||
Internet - Network Security/Solutions 1.4% | |||||
Digital River, Inc. (b) | 23,000 | 957,030 | |||
Leisure - Gaming/Equipment 3.5% | |||||
Boyd Gaming Corporation | 16,000 | 666,400 | |||
Station Casinos, Inc. | 31,000 | 1,695,080 | |||
| 2,361,480 | |||||
Leisure - Hotels & Motels 3.4% | |||||
Marriott International, Inc. Class A | 22,000 | 1,385,560 | |||
Starwood Hotels & Resorts Worldwide, Inc. | 16,000 | 934,400 | |||
| 2,319,960 | |||||
Machinery - Construction/Mining 1.8% | |||||
Joy Global, Inc. | 28,000 | 1,216,040 | |||
Machinery - General Industrial 2.5% | |||||
IDEX Corporation | 19,500 | 789,750 | |||
Pentair, Inc. | 21,000 | 914,760 | |||
| 1,704,510 | |||||
Media - Radio/TV 0.5% | |||||
Central European Media Enterprises, Ltd. Class A (b) | 9,000 | 350,838 | |||
Medical - Biomedical/Biotechnology 1.4% | |||||
Biosite Diagnostics, Inc. (b) | 9,000 | 553,860 | |||
Sepracor, Inc. (b) | 7,000 | 415,590 | |||
| 969,450 | |||||
Medical - Drug/Diversified 1.8% | |||||
Bone Care International, Inc. (b) | 20,000 | 557,000 | |||
Conor Medsystems, Inc. (b) | 15,500 | 214,675 | |||
HealthExtras, Inc. (b) | 25,500 | 415,650 | |||
| 1,187,325 | |||||
Medical - Ethical Drugs 1.1% | |||||
Eyetech Pharmaceuticals, Inc. (b) | 15,700 | 714,350 | |||
Medical - Health Maintenance Organizations 6.8% | |||||
Aetna, Inc. | 10,000 | 1,247,500 | |||
Centene Corporation (b) | 18,000 | 510,300 | |||
Molina Healthcare, Inc. (b) | 17,000 | 788,460 | |||
PacifiCare Health Systems, Inc. Class A (b) | 8,000 | 452,160 | |||
Sierra Health Services, Inc. (b) | 29,000 | 1,598,190 | |||
| 4,596,610 | |||||
Medical - Outpatient/Home Care 0.4% | |||||
Amedisys, Inc. (b) | 9,000 | 291,510 | |||
54
STRONG ADVISOR MD CAP GROWTH FUND (continued)
55
SCHEDULES OF INVESTMENTS IN SECURITIES (continued) | December 31, 2004 |
STRONG ADVISOR SMALL CAP VALUE FUND (continued)
| Shares or Principal Amount | Value (Note 2) | ||||
Chemicals - Plastics 2.4% | |||||
Intertape Polymer Group, Inc. (b)(d) | 2,732,600 | $ | 24,893,986 | ||
Intertape Polymer Group, Inc. | |||||
(Acquired 9/05/03; Cost $680,073) | |||||
(CAD) (b)(g)(h) | 93,000 | 845,243 | |||
PolyOne Corporation (b) | 3,012,000 | 27,288,720 | |||
| 53,027,949 | |||||
Chemicals - Specialty 1.5% | |||||
OM Group, Inc. (b) | 1,039,100 | 33,687,622 | |||
Commercial Services - Advertising 1.3% | |||||
R.H. Donnelley Corporation (b)(e) | 477,800 | 28,214,090 | |||
Commercial Services - Consulting 0.0% | |||||
Navigant Consulting, Inc. (b) | 100 | 2,660 | |||
Commercial Services - Healthcare 0.6% | |||||
Healthcare Services Group, Inc. | 606,050 | 12,630,082 | |||
Commercial Services - Miscellaneous 0.3% | |||||
Providence Service Corporation (b) | 275,669 | 5,780,779 | |||
Commercial Services - Security/Safety 2.7% | |||||
Armor Holdings, Inc. (b)(e) | 302,800 | 14,237,656 | |||
DHB Industries, Inc. (b)(e) | 162,500 | 3,094,000 | |||
The GEO Group, Inc. (b)(d) | 964,610 | 25,639,334 | |||
OSI Systems, Inc. (b)(e) | 768,850 | 17,460,584 | |||
| 60,431,574 | |||||
Commercial Services - Staffing 2.4% | |||||
CDI Corporation | 389,345 | 8,324,196 | |||
Cross Country Healthcare, Inc. (b) | 392,600 | 7,098,208 | |||
Kforce, Inc. (b)(d) | 1,904,860 | 21,143,946 | |||
MPS Group, Inc. (b) | 1,450,315 | 17,780,862 | |||
| 54,347,212 | |||||
Computer - Data Storage 0.1% | |||||
Iomega Corporation (b) | 226,210 | 1,253,203 | |||
Computer - Manufacturers 0.5% | |||||
Cray, Inc. (b) | 2,341,700 | 10,912,322 | |||
Computer Software - Enterprise 1.4% | |||||
JDA Software Group, Inc. (b)(e) | 1,213,000 | 16,521,060 | |||
Lightbridge, Inc. (b)(d) | 2,374,400 | 14,341,376 | |||
TIBCO Software, Inc. (b)(e) | 50,000 | 667,000 | |||
| 31,529,436 | |||||
Computer Software - Medical 1.4% | |||||
IDX Systems Corporation (b)(e) | 944,300 | 32,540,578 | |||
Containers 0.2% | |||||
Constar International, Inc. (b) | 577,700 | 4,459,844 | |||
Electrical - Equipment 0.4% | |||||
Encore Wire Corporation (b) | 596,600 | 7,952,678 | |||
Electronics - Contract Manufacturing 0.4% | |||||
Celestica, Inc. (b) | 570,200 | 8,045,522 | |||
Electronics - Miscellaneous Components 0.5% | |||||
Coherent, Inc. (b)(e) | 386,100 | 11,752,884 | |||
Electronics - Parts Distributors 0.3% | |||||
Richardson Electronics, Ltd. | 671,800 | 7,127,798 | |||
Electronics - Scientific Measuring 0.4% | |||||
Newport Corporation (b)(e) | 571,600 | $ | 8,059,560 | ||
Electronics - Semiconductor Manufacturing 1.8% | |||||
Cirrus Logic, Inc. (b) | 2,277,400 | 12,548,474 | |||
Credence Systems Corporation (b)(e) | 951,025 | 8,701,879 | |||
STATS ChipPAC, Ltd. ADR (b) | 1,546,147 | 9,462,420 | |||
TriQuint Semiconductor, Inc. (b) | 1,083,120 | 4,819,884 | |||
Zoran Corporation (b) | 365,600 | 4,233,648 | |||
| 39,766,305 | |||||
Energy - Other 0.1% | |||||
Headwaters, Inc. (b)(e) | 46,400 | 1,322,400 | |||
Finance - Consumer/Commercial Loans 0.1% | |||||
World Acceptance Corporation (b) | 106,446 | 2,928,330 | |||
Finance - Equity REIT 0.6% | |||||
American Financial Realty Trust | 598,100 | 9,677,258 | |||
Government Properties Trust, Inc. | 384,700 | 3,793,142 | |||
| 13,470,400 | |||||
Finance - Investment Brokers 0.0% | |||||
Labranche & Company, Inc. (b) | 14,700 | 131,712 | |||
Food - Miscellaneous Preparation 1.4% | |||||
Del Monte Foods Company (b) | 2,873,785 | 31,669,111 | |||
Insurance - Diversified 0.1% | |||||
PXRE Group, Ltd. | 116,100 | 2,926,881 | |||
Insurance - Property/Casualty/Title 2.8% | |||||
Argonaut Group, Inc. (b) | 424,385 | 8,967,255 | |||
Donegal Group, Inc. Class A | 257,800 | 5,911,354 | |||
Endurance Specialty Holdings, Ltd. | 410,810 | 14,049,702 | |||
Mercury General Corporation | 416,510 | 24,957,279 | |||
Montpelier Re Holdings, Ltd. | 260,900 | 10,031,605 | |||
| 63,917,195 | |||||
Internet - E*Commerce 0.0% | |||||
Stamps.com, Inc. (b) | 48,475 | 767,844 | |||
Internet - Internet Service Provider 1.6% | |||||
EarthLink, Inc. (b)(e) | 2,632,200 | 30,322,944 | |||
Net2Phone, Inc. (b) | 1,957,395 | 6,655,143 | |||
| 36,978,087 | |||||
Leisure - Services 0.0% | |||||
Great Wolf Resorts, Inc. (b) | 16,500 | 368,610 | |||
Pegasus Solutions, Inc. (b) | 1,000 | 12,600 | |||
| 381,210 | |||||
Machinery - General Industrial 2.2% | |||||
Robbins & Myers, Inc. | 363,500 | 8,662,205 | |||
UNOVA, Inc. (b)(e) | 1,629,500 | 41,210,055 | |||
| 49,872,260 | |||||
Medical - Biomedical/Biotechnology 0.3% | |||||
CV Therapeutics, Inc. (b)(e) | 300,600 | 6,913,800 | |||
Medical - Generic Drugs 0.5% | |||||
Andrx Corporation (b)(e) | 546,100 | 11,921,363 | |||
Medical - Nursing Homes 2.4% | |||||
Beverly Enterprises, Inc. (b) | 3,854,700 | 35,270,505 | |||
Manor Care, Inc. | 525,600 | 18,622,008 | |||
| 53,892,513 | |||||
Medical - Outpatient/Home Care 0.7% | |||||
Gentiva Health Services, Inc. (b) | 978,300 | 16,357,176 | |||
56
STRONG ADVISOR SMALL CAP VALUE FUND (continued)
Shares or Principal Amount | Value (Note 2) | ||||
Medical - Products 1.4% | |||||
Allied Healthcare Products, Inc. (b)(d) | 1,044,879 | $ | 6,843,957 | ||
Discovery Partners International, Inc. (b)(d) | 1,936,800 | 9,199,800 | |||
OraSure Technologies, Inc. (b) | 2,185,750 | 14,688,240 | |||
| 30,731,997 | |||||
Medical - Systems/Equipment 0.8% | |||||
Applera Corporation-Applied Biosystems Group (e) | 851,900 | 17,813,229 | |||
Medical/Dental - Services 0.4% | |||||
Covalent Group, Inc. (b) | 259,133 | 660,789 | |||
Omnicare, Inc. | 218,000 | 7,547,160 | |||
| 8,207,949 | |||||
Metal Ores - Gold/Silver 8.8% | |||||
Apex Silver Mines, Ltd. (b)(d) | 2,477,000 | 42,554,860 | |||
Glamis Gold, Ltd. (b)(e) | 3,389,800 | 58,168,968 | |||
Goldcorp, Inc. (e) | 2,118,200 | 31,857,728 | |||
Harmony Gold Mining Company, Ltd. Sponsored ADR | 2,369,400 | 21,964,338 | |||
Meridian Gold, Inc. (b)(e) | 1,389,500 | 26,358,815 | |||
Randgold Resources, Ltd. ADR (b)(e) | 1,483,000 | 16,906,200 | |||
| 197,810,909 | |||||
Metal Processing & Fabrication 0.4% | |||||
Webco Industries, Inc. (b)(d) | 905,745 | 9,754,874 | |||
Mining - Gems 0.7% | |||||
Eldorado Gold Corporation (b) | 46,500 | 137,175 | |||
Eldorado Gold Corporation (CAD) (b)(h) | 3,056,900 | 9,074,097 | |||
Quadra Mining, Ltd. (CAD) (b)(h) | 1,287,300 | 6,118,243 | |||
| 15,329,515 | |||||
Oil & Gas - Drilling 3.7% | |||||
Grey Wolf, Inc. (b) | 2,039,600 | 10,748,692 | |||
Helmerich & Payne, Inc. (e) | 584,480 | 19,895,699 | |||
Parker Drilling Company (b) | 1,469,200 | 5,773,956 | |||
Pride International, Inc. (b) | 1,209,300 | 24,839,022 | |||
Transocean, Inc. (b)(e) | 523,000 | 22,169,970 | |||
| 83,427,339 | |||||
Oil & Gas - Field Services 8.9% | |||||
BJ Services Company (e) | 344,200 | 16,019,068 | |||
Global Industries, Ltd. (b)(d) | 6,068,600 | 50,308,694 | |||
Key Energy Services, Inc. (b) | 2,240,800 | 26,441,440 | |||
Layne Christensen Company (b)(d) | 1,474,092 | 26,754,770 | |||
Matrix Service Company (b)(d) | 1,534,334 | 12,366,732 | |||
Newpark Resources, Inc. (b) | 3,579,860 | 18,436,279 | |||
Oceaneering International, Inc. (b)(e) | 697,360 | 26,025,475 | |||
Petroleum Helicopters, Inc. (b) | 120,374 | 3,103,121 | |||
Petroleum Helicopters, Inc. (non-voting) (b)(d) | 179,477 | 4,499,488 | |||
Willbros Group, Inc. (b) | 665,300 | 15,335,165 | |||
| 199,290,232 | |||||
Oil & Gas - Machinery/Equipment 1.0% | |||||
Input/Output, Inc. (b)(e) | 1,085,190 | 9,593,080 | |||
Smith International, Inc. (b)(e) | 231,400 | 12,590,474 | |||
| 22,183,554 | |||||
Oil & Gas - United States Exploration & Production 12.2% | |||||
Forest Oil Corporation (b)(e) | 1,891,100 | 59,985,692 | |||
McMoRan Exploration Company (b)(d)(e) | 1,162,800 | 21,744,360 | |||
Newfield Exploration Company (b)(e) | 248,300 | 14,662,115 | |||
Noble Energy, Inc. (e) | 479,000 | 29,535,140 | |||
PetroQuest Energy, Inc. (b) | 798,200 | 3,951,090 | |||
Pioneer Natural Resources Company (e) | 589,100 | 20,677,410 | |||
Range Resources Corporation (d)(e) | 4,653,800 | 95,216,748 | |||
Remington Oil & Gas Corporation (b) | 492,300 | $ | 13,415,175 | ||
Stone Energy Corporation (b)(e) | 332,100 | 14,974,389 | |||
| 274,162,119 | |||||
Paper & Paper Products 1.9% | |||||
Chesapeake Corporation | 461,680 | 12,539,229 | |||
Wausau-Mosinee Paper Corporation | 1,701,700 | 30,392,362 | |||
| 42,931,591 | |||||
Pollution Control - Services 0.9% | |||||
Calgon Carbon Corporation (d) | 2,227,200 | 20,222,976 | |||
Retail - Clothing/Shoes 1.3% | |||||
Foot Locker, Inc. (e) | 459,400 | 12,371,642 | |||
Payless ShoeSource, Inc. (b) | 320,500 | 3,942,150 | |||
Too, Inc. (b) | 528,200 | 12,919,772 | |||
| 29,233,564 | |||||
Retail - Consumer Electronics 0.3% | |||||
Circuit City Stores, Inc. | 380,700 | 5,954,148 | |||
Retail - Major Discount Chains 0.0% | |||||
Shopko Stores, Inc. (b)(e) | 20,000 | 373,600 | |||
Retail - Miscellaneous 0.6% | |||||
Barbeques Galore, Ltd. Sponsored ADR (d) | 549,021 | 3,294,126 | |||
Sharper Image Corporation (b)(e) | 552,800 | 10,420,280 | |||
| 13,714,406 | |||||
Steel - Producers 5.6% | |||||
IPSCO, Inc. | 724,400 | 34,626,320 | |||
Roanoke Electric Steel Corporation | 502,800 | 10,393,379 | |||
Steel Dynamics, Inc. (e) | 952,100 | 36,065,548 | |||
United States Steel Corporation (e) | 886,800 | 45,448,500 | |||
| 126,533,747 | |||||
Steel - Specialty Alloys 2.3% | |||||
Carpenter Technology Corporation (e) | 302,250 | 17,669,535 | |||
GrafTech International, Ltd. (b)(e) | 3,551,900 | 33,600,974 | |||
| 51,270,509 | |||||
Telecommunications - Equipment 0.3% | |||||
ADC Telecommunications, Inc. (b) | 2,297,500 | 6,157,300 | |||
Telecommunications - Services 0.5% | |||||
Cincinnati Bell, Inc. (b) | 2,843,400 | 11,800,110 | |||
Transportation - Airline 1.3% | |||||
Lan Airlines SA Sponsored ADR | 902,900 | 29,073,380 | |||
Transportation - Truck 0.7% | |||||
Covenant Transport, Inc. Class A (b)(d) | 787,700 | 16,399,914 | |||
Total Common Stocks (Cost $1,352,216,783) | 2,089,665,752 | ||||
Convertible Preferred Stocks 0.7% | |||||
Oil & Gas - United States Exploration & Production | |||||
Petrohawk Energy Corporation Series B (Acquired 11/16/04; Cost $13,330,000) (g) | 172,000 | 14,723,200 | |||
Total Convertible Preferred Stocks (Cost $13,330,000) | 14,723,200 | ||||
57
SCHEDULES OF INVESTMENTS IN SECURITIES (continued) | December 31, 2004 |
STRONG ADVISOR SMALL CAP VALUE FUND (continued)
Shares or Amount | Value (Note 2) | |||||||
Short-Term Investments (a) 7.8% | ||||||||
Repurchase Agreements (c) | ||||||||
ABN AMRO Inc. (Dated 12/31/04),2.15%, Due 1/03/05 (Repurchase proceeds $173,931,157); Collateralized by: United States Government & Agency Issues | $ | 173,900,000 | $ | 173,900,000 | ||||
State Street Bank (Dated 12/31/04),0.85%, Due 1/03/05 (Repurchase proceeds $3,025,014); Collateralized by: United States Government & Agency Issues | 3,024,800 | 3,024,800 | ||||||
Total Short-Term Investments (Cost $176,924,800) | 176,924,800 | |||||||
Total Investments in Securities (Cost $1,542,471,583) 101.3% | 2,281,313,752 | |||||||
Other Assets and Liabilities, Net (1.3%) | (29,776,182 | ) | ||||||
Net Assets 100.0% | $ | 2,251,537,570 | ||||||
WRITTEN OPTIONS ACTIVITY | ||||||||
| Contracts | Premiums | |||||||
Options outstanding at beginning of year | 22,822 | $ | 7,843,245 | |||||
Options written during the year | 104,564 | 26,457,536 | ||||||
Options closed | (81,942 | ) | (22,049,594 | ) | ||||
Options expired | (4,729 | ) | (635,823 | ) | ||||
Options exercised | (4,492 | ) | (1,246,293 | ) | ||||
Options outstanding at end of year | 36,223 | $ | 10,369,071 | |||||
WRITTEN CALL OPTION DETAIL | ||||||||
Contracts (100 shares per contract) | Value (Note 2) | |||||||
ABM Industries, Inc. | ||||||||
(Strike Price is $22.50. Expiration date is 7/15/05. Premium received is $11,200.) | 100 | $ | (4,000 | ) | ||||
Andrx Corporation | ||||||||
(Strike Price is $20.00. Expiration date is 1/21/05. Premium received is $16,700.) | 100 | (20,250 | ) | |||||
(Strike Price is $17.50. Expiration date is 3/18/05. Premium received is $243,494.) | 500 | (250,000 | ) | |||||
(Strike Price is $20.00. Expiration date is 3/18/05. Premium received is $84,148.) | 450 | (139,500 | ) | |||||
Applera Corporation-Applied Biosystems Group | ||||||||
(Strike Price is $20.00. Expiration date is 1/21/05. Premium received is $88,948.) | 850 | (95,625 | ) | |||||
(Strike Price is $20.00. Expiration date is 3/18/05. Premium received is $66,798.) | 400 | (63,000 | ) | |||||
Armor Holdings, Inc. | ||||||||
(Strike Price is $45.00. Expiration date is 1/21/05. Premium received is $16,200.) | 100 | (27,000 | ) | |||||
(Strike Price is $40.00. Expiration date is 2/18/05. Premium received is $58,049.) | 150 | (114,000 | ) | |||||
(Strike Price is $45.00. Expiration date is 2/18/05. Premium received is $250,244.) | 1,000 | (370,000 | ) | |||||
(Strike Price is $50.00. Expiration date is 2/18/05. Premium received is $31,049.) | 150 | (21,375 | ) | |||||
(Strike Price is $50.00. Expiration date is 5/20/05. Premium received is $70,398.) | 200 | (66,000 | ) | |||||
BJ Services Company | ||||||||
(Strike Price is $45.00. Expiration date is 1/21/05. Premium received is $16,350.) | 50 | $ | (11,750 | ) | ||||
(Strike Price is $47.50. Expiration date is 1/21/05. Premium received is $96,299.) | 400 | (37,000 | ) | |||||
(Strike Price is $45.00. Expiration date is 2/18/05. Premium received is $29,699.) | 100 | (31,000 | ) | |||||
(Strike Price is $50.00. Expiration date is 4/15/05. Premium received is $114,797.) | 400 | (74,000 | ) | |||||
CV Therapeutics, Inc. | ||||||||
(Strike Price is $17.50. Expiration date is 1/21/05. Premium received is $22,199.) | 300 | (166,500 | ) | |||||
(Strike Price is $22.50. Expiration date is 1/21/05. Premium received is $61,898.) | 450 | (51,750 | ) | |||||
(Strike Price is $17.50. Expiration date is 4/15/05. Premium received is $74,433.) | 100 | (69,500 | ) | |||||
(Strike Price is $20.00. Expiration date is 4/15/05. Premium received is $121,397.) | 200 | (106,000 | ) | |||||
(Strike Price is $22.50. Expiration date is 4/15/05. Premium received is $95,366.) | 200 | (79,000 | ) | |||||
(Strike Price is $30.00. Expiration date is 7/15/05. Premium received is $58,803.) | 150 | (56,250 | ) | |||||
Carpenter Technology Corporation | ||||||||
(Strike Price is $55.00. Expiration date is 1/21/05. Premium received is $291,574.) | 600 | (276,000 | ) | |||||
(Strike Price is $60.00. Expiration date is 1/21/05. Premium received is $67,748.) | 250 | (43,125 | ) | |||||
(Strike Price is $55.00. Expiration date is 2/18/05. Premium received is $131,747.) | 250 | (143,750 | ) | |||||
(Strike Price is $60.00. Expiration date is 2/18/05. Premium received is $40,299.) | 150 | (45,750 | ) | |||||
(Strike Price is $45.00. Expiration date is 3/18/05. Premium received is $419,090.) | 300 | (423,000 | ) | |||||
(Strike Price is $50.00. Expiration date is 3/18/05. Premium received is $503,488.) | 500 | (500,000 | ) | |||||
(Strike Price is $55.00. Expiration date is 3/18/05. Premium received is $338,492.) | 500 | (327,500 | ) | |||||
(Strike Price is $60.00. Expiration date is 6/17/05. Premium received is $188,096.) | 300 | (184,500 | ) | |||||
Chicago Bridge & Iron Company NV | ||||||||
(Strike Price is $30.00. Expiration date is 1/21/05. Premium received is $14,976.) | 78 | (78,000 | ) | |||||
(Strike Price is $35.00. Expiration date is 4/15/05. Premium received is $93,398.) | 200 | (114,000 | ) | |||||
(Strike Price is $40.00. Expiration date is 4/15/05. Premium received is $12,700.) | 100 | (24,000 | ) | |||||
Coherent, Inc. | ||||||||
(Strike Price is $30.00. Expiration date is 1/21/05. Premium received is $15,790.) | 100 | (12,250 | ) | |||||
(Strike Price is $30.00. Expiration date is 2/18/05. Premium received is $109,447.) | 675 | (129,937 | ) | |||||
Credence Systems Corporation | ||||||||
(Strike Price is $7.50. Expiration date is 5/20/05. Premium received is $25,249.) | 125 | (27,188 | ) | |||||
58
STRONG ADVISOR SMALL CAP VALUE FUND (continued)
| Contracts (100 shares per contract) | Value (Note 2) | |||||
DHB Industries, Inc. | ||||||
(Strike Price is $17.50. Expiration date is 1/21/05. Premium received is $104,507.) | 500 | $ | (101,250 | ) | ||
(Strike Price is $20.00. Expiration date is 1/21/05. Premium received is $50,449.) | 350 | (24,500 | ) | |||
(Strike Price is $17.50. Expiration date is 2/18/05. Premium received is $55,899.) | 200 | (56,500 | ) | |||
(Strike Price is $20.00. Expiration date is 2/18/05. Premium received is $37,899.) | 200 | (32,000 | ) | |||
(Strike Price is $17.50. Expiration date is 4/15/05. Premium received is $69,970.) | 200 | (76,000 | ) | |||
(Strike Price is $20.00. Expiration date is 4/15/05. Premium received is $44,974.) | 175 | (46,812 | ) | |||
EarthLink, Inc. | ||||||
(Strike Price is $10.00. Expiration date is 1/21/05. Premium received is $84,238.) | 645 | (101,587 | ) | |||
(Strike Price is $10.00. Expiration date is 7/15/05. Premium received is $22,699.) | 100 | (22,250 | ) | |||
(Strike Price is $12.50. Expiration date is 7/15/05. Premium received is $44,499.) | 500 | (45,000 | ) | |||
Foot Locker, Inc. | ||||||
(Strike Price is $25.00. Expiration date is 2/18/05. Premium received is $47,399.) | 200 | (45,500 | ) | |||
(Strike Price is $25.00. Expiration date is 5/20/05. Premium received is $59,399.) | 200 | (63,000 | ) | |||
Forest Oil Corporation | ||||||
(Strike Price is $30.00. Expiration date is 2/18/05. Premium received is $27,699.) | 100 | (26,000 | ) | |||
(Strike Price is $30.00. Expiration date is 5/20/05. Premium received is $122,097.) | 300 | (111,000 | ) | |||
H.B. Fuller Company | ||||||
(Strike Price is $25.00. Expiration date is 2/18/05. Premium received is $130,307.) | 550 | (198,000 | ) | |||
(Strike Price is $25.00. Expiration date is 5/20/05. Premium received is $346,992.) | 1,000 | (400,000 | ) | |||
Glamis Gold, Ltd. | ||||||
(Strike Price is $17.50. Expiration date is 2/18/05. Premium received is $23,899.) | 200 | (17,500 | ) | |||
(Strike Price is $20.00. Expiration date is 5/20/05. Premium received is $98,598.) | 550 | (45,375 | ) | |||
Goldcorp, Inc. | ||||||
(Strike Price is $15.00. Expiration date is 2/18/05. Premium received is $23,699.) | 300 | (24,000 | ) | |||
GrafTech International, Ltd. | ||||||
(Strike Price is $10.00. Expiration date is 3/18/05. Premium received is $33,949.) | 350 | (23,625 | ) | |||
Headwaters, Inc. | ||||||
(Strike Price is $30.00. Expiration date is 1/21/05. Premium received is $32,819.) | 160 | (8,000 | ) | |||
(Strike Price is $30.00. Expiration date is 2/18/05. Premium received is $62,099.) | 300 | (36,750 | ) | |||
Helmerich & Payne, Inc. | ||||||
(Strike Price is $35.00. Expiration date is 2/18/05. Premium received is $29,099.) | 300 | (29,250 | ) | |||
(Strike Price is $30.00. Expiration date is 3/18/05. Premium received is $54,302.) | 150 | (67,500 | ) | |||
IDX Systems Corporation | ||||||
(Strike Price is $35.00. Expiration date is 2/18/05. Premium received is $149,546.) | 650 | $ | (105,625 | ) | ||
(Strike Price is $40.00. Expiration date is 2/18/05. Premium received is $14,800.) | 200 | (4,500 | ) | |||
Input/Output, Inc. | ||||||
(Strike Price is $7.50. Expiration date is 2/18/05. Premium received is $12,382.) | 150 | (23,250 | ) | |||
(Strike Price is $10.00. Expiration date is 2/18/05. Premium received is $7,350.) | 150 | (4,875 | ) | |||
JDA Software Group, Inc. | ||||||
(Strike Price is $15.00. Expiration date is 4/15/05. Premium received is $14,100.) | 150 | (11,625 | ) | |||
McMoRan Exploration Company | ||||||
(Strike Price is $17.50. Expiration date is 1/21/05. Premium received is $16,800.) | 150 | (24,375 | ) | |||
Meridian Gold, Inc. | ||||||
(Strike Price is $15.00. Expiration date is 1/21/05. Premium received is $41,399.) | 200 | (79,000 | ) | |||
(Strike Price is $17.50. Expiration date is 4/15/05. Premium received is $21,200.) | 100 | (26,000 | ) | |||
(Strike Price is $20.00. Expiration date is 4/15/05. Premium received is $11,700.) | 100 | (14,250 | ) | |||
Newfield Exploration Company | ||||||
(Strike Price is $60.00. Expiration date is 1/21/05. Premium received is $86,298.) | 400 | (47,000 | ) | |||
(Strike Price is $60.00. Expiration date is 3/18/05. Premium received is $12,850.) | 50 | (16,000 | ) | |||
(Strike Price is $65.00. Expiration date is 3/18/05. Premium received is $18,200.) | 100 | (13,750 | ) | |||
(Strike Price is $65.00. Expiration date is 6/17/05. Premium received is $63,399.) | 200 | (55,000 | ) | |||
Newport Corporation | ||||||
(Strike Price is $12.50. Expiration date is 2/18/05. Premium received is $44,449.) | 350 | (63,875 | ) | |||
Noble Energy, Inc. | ||||||
(Strike Price is $60.00. Expiration date is 1/21/05. Premium received is $84,083.) | 400 | (98,000 | ) | |||
(Strike Price is $65.00. Expiration date is 1/21/05. Premium received is $19,676.) | 100 | (3,500 | ) | |||
(Strike Price is $60.00. Expiration date is 2/18/05. Premium received is $109,421.) | 400 | (130,000 | ) | |||
(Strike Price is $65.00. Expiration date is 2/18/05. Premium received is $22,846.) | 150 | (14,625 | ) | |||
(Strike Price is $60.00. Expiration date is 5/20/05. Premium received is $17,450.) | 50 | (24,750 | ) | |||
(Strike Price is $65.00. Expiration date is 5/20/05. Premium received is $10,350.) | 50 | (12,375 | ) | |||
OSI Systems, Inc. | ||||||
(Strike Price is $20.00. Expiration date is 1/21/05. Premium received is $14,700.) | 100 | (27,250 | ) | |||
(Strike Price is $22.50. Expiration date is 1/21/05. Premium received is $18,300.) | 150 | (12,000 | ) | |||
(Strike Price is $22.50. Expiration date is 4/15/05. Premium received is $31,399.) | 200 | (39,500 | ) | |||
59
SCHEDULES OF INVESTMENTS IN SECURITIES (continued) | December 31, 2004 |
STRONG ADVISOR SMALL CAP VALUE FUND (continued)
| Contracts (100 shares per contract) | Value (Note 2) | |||||
Oceaneering International, Inc. | ||||||
(Strike Price is $35.00. Expiration date is 1/21/05. Premium received is $224,041.) | 750 | $ | (187,500 | ) | ||
(Strike Price is $40.00. Expiration date is 1/21/05. Premium received is $6,100.) | 50 | (1,375 | ) | |||
(Strike Price is $35.00. Expiration date is 4/15/05. Premium received is $19,600.) | 50 | (19,000 | ) | |||
(Strike Price is $40.00. Expiration date is 4/15/05. Premium received is $83,598.) | 550 | (75,625 | ) | |||
Pioneer Natural Resources Company | ||||||
(Strike Price is $35.00. Expiration date is 6/17/05. Premium received is $27,699.) | 100 | (27,000 | ) | |||
R.H. Donnelley Corporation | ||||||
(Strike Price is $50.00. Expiration date is 1/21/05. Premium received is $21,199.) | 100 | (90,000 | ) | |||
(Strike Price is $55.00. Expiration date is 2/18/05. Premium received is $59,685.) | 200 | (92,000 | ) | |||
(Strike Price is $55.00. Expiration date is 5/20/05. Premium received is $117,397.) | 200 | (119,000 | ) | |||
(Strike Price is $60.00. Expiration date is 5/20/05. Premium received is $29,699.) | 100 | (30,000 | ) | |||
Randgold Resources, Ltd. ADR | ||||||
(Strike Price is $12.50. Expiration date is 3/18/05. Premium received is $5,900.) | 100 | (5,750 | ) | |||
(Strike Price is $12.50. Expiration date is 6/17/05. Premium received is $10,200.) | 100 | (10,000 | ) | |||
Range Resources Corporation | ||||||
(Strike Price is $17.50. Expiration date is 1/21/05. Premium received is $17,700.) | 100 | (30,500 | ) | |||
(Strike Price is $20.00. Expiration date is 1/21/05. Premium received is $10,888.) | 100 | (10,000 | ) | |||
(Strike Price is $17.50. Expiration date is 3/18/05. Premium received is $82,948.) | 350 | (117,250 | ) | |||
(Strike Price is $20.00. Expiration date is 3/18/05. Premium received is $32,312.) | 250 | (39,375 | ) | |||
(Strike Price is $22.50. Expiration date is 3/18/05. Premium received is $16,800.) | 200 | (13,000 | ) | |||
Sharper Image Corporation | ||||||
(Strike Price is $22.50. Expiration date is 5/20/05. Premium received is $52,999.) | 250 | (20,625 | ) | |||
(Strike Price is $25.00. Expiration date is 5/20/05. Premium received is $24,137.) | 200 | (7,500 | ) | |||
Shopko Stores, Inc. | ||||||
(Strike Price is $17.50. Expiration date is 3/18/05. Premium received is $31,399.) | 200 | (41,500 | ) | |||
Smith International, Inc. | ||||||
(Strike Price is $55.00. Expiration date is 1/21/05. Premium received is $14,350.) | 50 | (7,000 | ) | |||
(Strike Price is $60.00. Expiration date is 4/15/05. Premium received is $38,549.) | 150 | (22,500 | ) | |||
(Strike Price is $65.00. Expiration date is 4/15/05. Premium received is $16,700.) | 100 | (5,500 | ) | |||
Steel Dynamics, Inc. | ||||||
(Strike Price is $35.00. Expiration date is 1/21/05. Premium received is $109,297.) | 400 | $ | (138,000 | ) | ||
(Strike Price is $35.00. Expiration date is 2/18/05. Premium received is $252,774.) | 540 | (234,900 | ) | |||
(Strike Price is $40.00. Expiration date is 2/18/05. Premium received is $91,648.) | 450 | (81,000 | ) | |||
(Strike Price is $45.00. Expiration date is 2/18/05. Premium received is $67,998.) | 500 | (28,750 | ) | |||
(Strike Price is $35.00. Expiration date is 5/20/05. Premium received is $48,699.) | 100 | (59,500 | ) | |||
(Strike Price is $40.00. Expiration date is 5/20/05. Premium received is $25,699.) | 100 | (34,500 | ) | |||
(Strike Price is $45.00. Expiration date is 5/20/05. Premium received is $27,699.) | 100 | (18,500 | ) | |||
Stone Energy Corporation | ||||||
(Strike Price is $45.00. Expiration date is 3/18/05. Premium received is $165,946.) | 600 | (151,500 | ) | |||
(Strike Price is $50.00. Expiration date is 6/17/05. Premium received is $47,399.) | 200 | (34,500 | ) | |||
TIBCO Software, Inc. | ||||||
(Strike Price is $10.00. Expiration date is 2/18/05. Premium received is $105,997.) | 500 | (172,500 | ) | |||
Transocean, Inc. | ||||||
(Strike Price is $40.00. Expiration date is 1/21/05. Premium received is $57,899.) | 200 | (57,500 | ) | |||
(Strike Price is $40.00. Expiration date is 2/18/05. Premium received is $154,146.) | 450 | (162,000 | ) | |||
(Strike Price is $45.00. Expiration date is 2/18/05. Premium received is $32,099.) | 300 | (33,000 | ) | |||
(Strike Price is $40.00. Expiration date is 5/20/05. Premium received is $21,849.) | 50 | (25,750 | ) | |||
(Strike Price is $45.00. Expiration date is 5/20/05. Premium received is $65,248.) | 250 | (66,875 | ) | |||
United States Steel Corporation | ||||||
(Strike Price is $40.00. Expiration date is 1/21/05. Premium received is $145,747.) | 250 | (282,500 | ) | |||
(Strike Price is $45.00. Expiration date is 1/21/05. Premium received is $483,789.) | 900 | (594,000 | ) | |||
(Strike Price is $50.00. Expiration date is 1/21/05. Premium received is $251,694.) | 850 | (227,375 | ) | |||
(Strike Price is $55.00. Expiration date is 1/21/05. Premium received is $31,899.) | 200 | (13,500 | ) | |||
(Strike Price is $50.00. Expiration date is 2/18/05. Premium received is $67,398.) | 200 | (82,000 | ) | |||
(Strike Price is $55.00. Expiration date is 2/18/05. Premium received is $7,600.) | 50 | (9,625 | ) | |||
(Strike Price is $45.00. Expiration date is 4/15/05. Premium received is $264,444.) | 350 | (309,750 | ) | |||
(Strike Price is $50.00. Expiration date is 4/15/05. Premium received is $164,246.) | 250 | (146,250 | ) | |||
(Strike Price is $55.00. Expiration date is 4/15/05. Premium received is $153,796.) | 400 | (144,000 | ) | |||
60
STRONG ADVISOR SMALL CAP VALUE FUND (continued)
61
SCHEDULES OF INVESTMENTS IN SECURITIES (continued) | December 31, 2004 |
STRONG ADVISOR U.S. VALUE FUND (continued)
| Shares or Principal Amount | Value (Note 2) | ||||
Principal Financial Group, Inc. | 25,300 | $ | 1,035,782 | ||
Prudential Financial, Inc. | 34,100 | 1,874,136 | |||
| 6,751,613 | |||||
Insurance - Life 0.3% | |||||
Lincoln National Corporation | 25,000 | 1,167,000 | |||
Insurance - Property/Casualty/Title 2.9% | |||||
The Allstate Corporation | 32,000 | 1,655,040 | |||
Chubb Corporation | 16,500 | 1,268,850 | |||
Hartford Financial Services Group, Inc. | 21,800 | 1,510,958 | |||
Old Republic International Corporation | 37,000 | 936,100 | |||
The St. Paul Travelers Companies, Inc. | 132,000 | 4,893,240 | |||
| 10,264,188 | |||||
Leisure - Photo Equipment/Related 0.2% | |||||
Eastman Kodak Company (f) | 24,200 | 780,450 | |||
Machinery - Farm 0.5% | |||||
Deere & Company | 26,000 | 1,934,400 | |||
Media - Cable TV 3.4% | |||||
Comcast Corporation Class A (b) | 345,000 | 11,481,600 | |||
Liberty Media International, Inc. Class A (b) | 18,700 | 864,501 | |||
| 12,346,101 | |||||
Media - Diversified 1.8% | |||||
Time Warner, Inc. (b) | 325,000 | 6,318,000 | |||
Media - Newspapers 0.6% | |||||
Gannett Company, Inc. | 26,200 | 2,140,540 | |||
Media - Periodicals 1.9% | |||||
The Readers Digest Association, Inc. | 480,800 | 6,687,928 | |||
Media - Radio/TV 4.6% | |||||
Clear Channel Communications, Inc. | 230,000 | 7,702,700 | |||
The Walt Disney Company | 93,000 | 2,585,400 | |||
Liberty Media Corporation Class A (b) | 374,000 | 4,106,520 | |||
Viacom, Inc. Class B | 62,858 | 2,287,403 | |||
| 16,682,023 | |||||
Medical - Biomedical/Biotechnology 5.3% | |||||
Chiron Corporation (b)(f) | 210,000 | 6,999,300 | |||
ImClone Systems, Inc. (b)(f) | 200,100 | 9,220,608 | |||
Serono SA ADR (f) | 175,000 | 2,856,000 | |||
| 19,075,908 | |||||
Medical - Ethical Drugs 3.2% | |||||
Bristol-Myers Squibb Company | 360,000 | 9,223,200 | |||
Merck & Company, Inc. | 76,000 | 2,442,640 | |||
| 11,665,840 | |||||
Medical/Dental - Services 0.1% | |||||
Medco Health Solutions, Inc. (b) | 7,839 | 326,102 | |||
Metal Ores - Gold/Silver 0.4% | |||||
Newmont Mining Corporation | |||||
Holding Company | 35,000 | 1,554,350 | |||
Metal Ores - Miscellaneous 0.5% | |||||
Alcoa, Inc. | 52,100 | 1,636,982 | |||
Oil & Gas - Drilling 0.3% | |||||
Pride International, Inc. (b) | 45,000 | 924,300 | |||
Oil & Gas - International Integrated 8.2% | |||||
ChevronTexaco Corporation | 96,000 | 5,040,960 | |||
ConocoPhillips | 49,000 | 4,254,670 | |||
Exxon Mobil Corporation | 372,000 | $ | 19,068,720 | ||
Royal Dutch Petroleum Company - New York Shares (f) | 20,000 | 1,147,600 | |||
| 29,511,950 | |||||
Oil & Gas - Machinery/Equipment 2.0% | |||||
Cooper Cameron Corporation (b) | 135,000 | 7,264,350 | |||
Oil & Gas - United States Exploration & Production 0.9% | |||||
Devon Energy Corporation | 28,000 | 1,089,760 | |||
Kerr McGee Corporation | 7,000 | 404,530 | |||
Unocal Corporation | 40,200 | 1,738,248 | |||
| 3,232,538 | |||||
Paper & Paper Products 0.3% | |||||
MeadWestvaco Corporation | 12,000 | 406,680 | |||
OfficeMax, Inc. | 10,000 | 313,800 | |||
Smurfit-Stone Container Corporation (b) | 20,000 | 373,600 | |||
| 1,094,080 | |||||
Pollution Control - Services 1.2% | |||||
Waste Management, Inc. | 147,000 | 4,401,180 | |||
Retail - Department Stores 0.8% | |||||
Federated Department Stores, Inc. | 25,000 | 1,444,750 | |||
May Department Stores Company | 44,793 | 1,316,914 | |||
| 2,761,664 | |||||
Retail - Miscellaneous 0.1% | |||||
Blockbuster, Inc. Class A (f) | 16,845 | 160,701 | |||
Blockbuster, Inc. Class B | 16,845 | 148,404 | |||
| 309,105 | |||||
Retail - Restaurants 1.5% | |||||
McDonald’s Corporation | 163,000 | 5,225,780 | |||
Retail - Super/Mini Markets 2.4% | |||||
Albertson’s, Inc. (f) | 20,000 | 477,600 | |||
The Kroger Company (b) | 445,000 | 7,805,300 | |||
Safeway, Inc. (b) | 27,000 | 532,980 | |||
| 8,815,880 | |||||
Retail/Wholesale - Office Supplies 0.1% | |||||
Office Depot, Inc. (b) | 17,000 | 295,120 | |||
Telecommunications - Services 4.6% | |||||
AT&T Corporation | 47,000 | 895,820 | |||
BellSouth Corporation | 98,000 | 2,723,420 | |||
CenturyTel, Inc. | 9,000 | 319,230 | |||
Commonwealth Telephone Enterprises, Inc. (b)(f) | 5,000 | 248,300 | |||
Qwest Communications International, Inc. (b) | 60,000 | 266,400 | |||
SBC Communications, Inc. | 174,000 | 4,483,980 | |||
Sprint Corporation | 51,000 | 1,267,350 | |||
Verizon Communications, Inc. | 155,000 | 6,279,050 | |||
| 16,483,550 | |||||
Telecommunications - Wireless Equipment 1.4% | |||||
Nokia Corporation Sponsored ADR | 330,000 | 5,171,100 | |||
Telecommunications - Wireless Services 0.3% | |||||
ALLTEL Corporation | 19,000 | 1,116,440 | |||
Tobacco 1.5% | |||||
Altria Group, Inc. | 55,000 | 3,360,500 | |||
Loews Corp - Carolina Group | 67,700 | 1,959,915 | |||
| 5,320,415 | |||||
Transportation - Air Freight 0.3% | |||||
FedEx Corporation | 12,000 | 1,181,880 | |||
62
STRONG ADVISOR U.S. VALUE FUND (continued)
63
SCHEDULES OF INVESTMENTS IN SECURITIES (continued) | December 31, 2004 |
STRONG ADVISOR ENDEAVOR LARGE CAP FUND (continued)
64
STRONG ADVISOR FOCUS FUND (continued)
65
SCHEDULES OF INVESTMENTS IN SECURITIES (continued) | December 31, 2004 |
STRONG ADVISOR INTERNATIONAL CORE FUND (continued)
66
STRONG ADVISOR SELECT FUND (continued)
67
SCHEDULES OF INVESTMENTS IN SECURITIES (continued) | December 31, 2004 |
STRONG ADVISOR TECHNOLOGY FUND (continued)
68
STRONG ADVISOR U.S. SMALL/MID CAP GROWTH FUND (continued)
| Shares or Principal Amount | Value (Note 2) | ||||||
Computer - IT Services 2.5% | |||||||
Cognizant Technology Solutions Corporation Class A (b) | 3,080 | $ | 130,376 | ||||
Computer - Peripheral Equipment 2.0% | |||||||
Synaptics, Inc. (b) | 3,305 | 101,067 | |||||
Computer Software - Desktop 1.8% | |||||||
Sonic Solutions (b) | 4,040 | 90,658 | |||||
Electronics - Miscellaneous Components 1.3% | |||||||
Sigmatel, Inc. (b) | 1,935 | 68,751 | |||||
Electronics - Semiconductor Manufacturing 4.5% | |||||||
Cree, Inc. (b) | 1,400 | 56,112 | |||||
FormFactor, Inc. (b) | 2,995 | 81,284 | |||||
Tessera Technologies, Inc. (b) | 2,555 | 95,072 | |||||
| 232,468 | |||||||
Energy - Other 1.1% | |||||||
Massey Energy Company | 1,655 | 57,842 | |||||
Finance - Consumer/Commercial Loans 1.6% | |||||||
United PanAm Financial Corporation (b) | 4,350 | 82,911 | |||||
Financial Services - Miscellaneous 2.4% | |||||||
Investors Financial Services Corporation | 2,525 | 126,199 | |||||
Insurance - Property/Casualty/Title 1.7% | |||||||
ProAssurance Corporation (b) | 2,260 | 88,389 | |||||
Internet - Content 2.3% | |||||||
Ask Jeeves, Inc. (b) | 1,750 | 46,812 | |||||
InfoSpace, Inc. (b) | 1,525 | 72,514 | |||||
| 119,326 | |||||||
Internet - E*Commerce 2.5% | |||||||
Getty Images, Inc. (b) | 1,875 | 129,094 | |||||
Internet - Network Security/Solutions 3.0% | |||||||
Equinix, Inc. (b) | 2,270 | 97,020 | |||||
F5 Networks, Inc. (b) | 1,215 | 59,195 | |||||
| 156,215 | |||||||
Leisure - Hotels & Motels 1.1% | |||||||
Las Vegas Sands Corporation (b) | 1,135 | 54,480 | |||||
Leisure - Products 1.0% | |||||||
Celebrate Express, Inc. (b) | 2,765 | 52,535 | |||||
Machinery - Construction/Mining 10.7% | |||||||
A.S.V., Inc. (b) | 2,840 | 136,036 | |||||
Bucyrus International, Inc. Class A | 3,020 | 122,733 | |||||
Joy Global, Inc. | 3,890 | 168,943 | |||||
Terex Corporation (b) | 2,650 | 126,272 | |||||
| 553,984 | |||||||
Medical - Biomedical/Biotechnology 0.7% | |||||||
Immunicon Corporation (b) | 5,500 | 38,390 | |||||
Medical - Drug/Diversified 1.0% | |||||||
MGI Pharma, Inc. (b) | 1,780 | 49,858 | |||||
Medical - Ethical Drugs 2.1% | |||||||
Salix Pharmaceuticals, Ltd. (b) | 6,272 | 110,324 | |||||
Medical - Health Maintenance Organizations 1.6% | |||||||
Centene Corporation (b) | 2,950 | $ | 83,632 | ||||
Medical - Outpatient/Home Care 1.4% | |||||||
LCA-Vision, Inc. | 3,075 | 71,924 | |||||
Medical - Products 1.9% | |||||||
Kyphon, Inc. (b) | 3,815 | 98,274 | |||||
Medical - Systems/Equipment 3.7% | |||||||
Foxhollow Technologies, Inc. (b) | 4,125 | 101,434 | |||||
Ventana Medical Systems, Inc. (b) | 1,415 | 90,546 | |||||
| 191,980 | |||||||
Medical/Dental - Services 1.6% | |||||||
American Healthways, Inc. (b) | 2,488 | 82,204 | |||||
Oil & Gas - Machinery/Equipment 1.5% | |||||||
CARBO Ceramics, Inc. | 1,095 | 75,555 | |||||
Oil & Gas - United States Exploration & Production 9.1% | |||||||
KCS Energy, Inc. (b) | 3,725 | 55,055 | |||||
Penn Virginia Corporation | 3,940 | 159,846 | |||||
Quicksilver Resources, Inc. (b) | 2,810 | 103,352 | |||||
Range Resources Corporation | 3,210 | 65,677 | |||||
Ultra Petroleum Corporation (b) | 1,840 | 88,559 | |||||
| 472,489 | |||||||
Retail - Clothing/Shoes 1.2% | |||||||
Urban Outfitters, Inc. (b) | 1,390 | 61,716 | |||||
Retail - Restaurants 5.4% | |||||||
BJ’S Restaurants, Inc. (b) | 5,220 | 73,080 | |||||
The Cheesecake Factory, Inc. (b) | 3,120 | 101,306 | |||||
P.F. Chang’s China Bistro, Inc. (b) | 970 | 54,659 | |||||
Peets Coffee & Tea, Inc. (b) | 1,929 | 51,061 | |||||
| 280,106 | |||||||
Telecommunications - Wireless Equipment 3.0% | |||||||
Trimble Navigation, Ltd. (b) | 4,635 | 153,140 | |||||
Telecommunications - Wireless Services 5.7% | |||||||
Alamosa Holdings, Inc. (b) | 16,630 | 207,376 | |||||
Nextel Communications, Inc. Class A (b) | 2,920 | 87,600 | |||||
| 294,976 | |||||||
Transportation - Truck 6.5% | |||||||
J.B. Hunt Transport Services, Inc. | 2,525 | 113,246 | |||||
Landstar Systems, Inc. (b) | 2,990 | 220,184 | |||||
| 333,430 | |||||||
Total Common Stocks (Cost $3,434,784) | 4,757,865 | ||||||
Short-Term Investments (a) 8.1% | |||||||
Repurchase Agreements (c) | |||||||
State Street Bank (Dated 12/31/04), 0.85%, Due 1/03/05 (Repurchase proceeds $420,030); | $ | 420,000 | 420,000 | ||||
Total Short-Term Investments (Cost $420,000) | 420,000 | ||||||
Total Investments in Securities (Cost $3,854,784)100.1% | 5,177,865 | ||||||
Other Assets and Liabilities, Net (0.1%) | (3,833 | ) | |||||
Net Assets 100.0% | $ | 5,174,032 | |||||
69
SCHEDULES OF INVESTMENTS IN SECURITIES (continued) | December 31, 2004 |
STRONG ADVISOR UTILITIES AND ENERGY FUND
70
STRONG ADVISOR LARGE COMPANY CORE FUND (continued)
| Shares or Principal Amount | Value (Note 2) | |||||
Electronics - Scientific Measuring 2.4% | ||||||
Danaher Corporation | 39,400 | $ | 2,261,954 | |||
Finance - Consumer/Commercial Loans 6.0% | ||||||
CIT Group, Inc. | 73,200 | 3,354,023 | ||||
MBNA Corporation | 83,750 | 2,360,913 | ||||
| 5,714,936 | ||||||
Finance - Mortgage & Related Services 1.8% | ||||||
FHLMC | 23,250 | 1,713,525 | ||||
Food - Confectionery 1.4% | ||||||
Hershey Foods Corporation | 24,550 | 1,363,507 | ||||
Food - Flour & Grain 3.1% | ||||||
Archer Daniels Midland Company | 133,300 | 2,973,923 | ||||
Insurance - Diversified 2.9% | ||||||
Prudential Financial, Inc. | 51,250 | 2,816,700 | ||||
Insurance - Life 2.3% | ||||||
MetLife, Inc. | 55,150 | 2,234,127 | ||||
Insurance - Property/Casualty/Title 2.7% | ||||||
The Allstate Corporation | 49,700 | 2,570,484 | ||||
Media - Radio/TV 2.8% | ||||||
The Walt Disney Company | 95,000 | 2,641,000 | ||||
Medical - Drug/Diversified 2.6% | ||||||
Schering AG ADR | 33,600 | 2,494,800 | ||||
Medical - Health Maintenance Organizations 6.2% | ||||||
Aetna, Inc. | 18,600 | 2,320,350 | ||||
UnitedHealth Group, Inc. | 41,350 | 3,640,040 | ||||
| 5,960,390 | ||||||
Medical - Products 2.5% | ||||||
Alcon, Inc. | 29,800 | 2,401,880 | ||||
Medical/Dental - Supplies 3.2% | ||||||
Becton, Dickinson & Company | 54,400 | 3,089,919 | ||||
Oil & Gas - International Integrated 5.3% | ||||||
ConocoPhillips | 31,050 | 2,696,072 | ||||
Exxon Mobil Corporation | 46,248 | 2,370,672 | ||||
| 5,066,744 | ||||||
Oil & Gas - Machinery/Equipment 2.4% | ||||||
Baker Hughes, Inc. | 55,000 | 2,346,850 | ||||
Oil & Gas - United States Exploration & Production 4.5% | ||||||
Burlington Resources, Inc. | 66,200 | 2,879,700 | ||||
Devon Energy Corporation | 36,000 | 1,401,120 | ||||
| 4,280,820 | ||||||
Retail - Restaurants 2.8% | ||||||
McDonald’s Corporation | 84,800 | 2,718,688 | ||||
Retail/Wholesale - Building Products 2.8% | ||||||
The Home Depot, Inc. | 63,300 | 2,705,442 | ||||
Steel - Producers 2.3% | ||||||
Nucor Corporation | 42,700 | 2,234,918 | ||||
Telecommunications - Wireless Equipment 4.8% | ||||||
Motorola, Inc. | 146,850 | $ | 2,525,820 | |||
Telefonaktiebolaget LM Ericsson Sponsored ADR (b) | 66,750 | 2,101,958 | ||||
| 4,627,778 | ||||||
Utility - Electric Power 2.9% | ||||||
Edison International | 87,250 | 2,794,618 | ||||
Total Common Stocks (Cost $80,141,874) | 94,046,900 | |||||
Short-Term Investments (a) 1.9% | ||||||
Repurchase Agreements (c) | ||||||
State Street Bank (Dated 12/31/04),0.85%, Due 1/03/05 (Repurchase proceeds $1,796,527); Collateralized by: United States Government & Agency Issues | $ | 1,796,400 | 1,796,400 | |||
Total Short-Term Investments (Cost $1,796,400) | 1,796,400 | |||||
Total Investments in Securities (Cost $81,938,274) 99.9% | 95,843,300 | |||||
Other Assets and Liabilities, Net 0.1% | 94,388 | |||||
Net Assets 100.0% | $ | 95,937,688 | ||||
CURRENCY ABBREVIATIONS
CAD | — | Canadian Dollar | ||
CHF | — | Swiss Franc | ||
EUR | — | European Euro |
LEGEND
| (a) | Short-term investments include any security which has a remaining maturity of less than one year and investments in money market funds. |
| (b) | Non-income producing security. |
| (c) | See Note 2(J) of Notes to Financial Statements. |
| (d) | Affiliated Issuer (See Note 9 of Notes to Financial Statements.) |
| (e) | All or a portion of these securities are held in conjunction with open written option contracts. |
| (f) | All or a portion of security is on loan. See Note 2(K) of Notes to Financial Statements. |
| (g) | Restricted and Illiquid security. |
| (h) | Security trades in foreign currency and is converted to U.S. dollars daily using current exchange rates. |
Percentages are stated as a percent of net assets.
See Notes to Financial Statements.
71
STATEMENTS OF ASSETS AND LIABILITIES
December 31, 2004
| (In Thousands) | ||||||||||
| Strong Advisor Common Stock Fund | Strong Advisor Mid Cap Growth Fund | Strong Advisor Small Cap Value Fund | ||||||||
Assets: | ||||||||||
Investments in Securities, at Value | ||||||||||
Unaffiliated Issuers (Cost of $995,536, $49,742, and $1,288,768, respectively) | $ | 1,353,578 | $ | 67,707 | $ | 1,869,107 | ||||
Affiliated Issuers (Cost of $0, $0, and $253,704, respectively) | — | — | 412,207 | |||||||
Receivable for Securities Sold | 24,688 | — | 9,031 | |||||||
Receivable for Fund Shares Sold | 669 | 34 | 7,706 | |||||||
Dividends and Interest Receivable | 667 | 25 | 795 | |||||||
Other Assets | 139 | 65 | 212 | |||||||
Total Assets | 1,379,741 | 67,831 | 2,299,058 | |||||||
Liabilities: | ||||||||||
Payable for Securities Purchased | 433 | 42 | 10,356 | |||||||
Written Options, at Value | ||||||||||
(Premiums Received of $252, $0, and $10,369, respectively) | 200 | — | 11,005 | |||||||
Payable for Fund Shares Redeemed | 25,572 | 185 | 25,624 | |||||||
Payable Upon Return of Securities on Loan | 53,057 | — | — | |||||||
Accrued Operating Expenses and Other Liabilities | 348 | 51 | 535 | |||||||
Total Liabilities | 79,610 | 278 | 47,520 | |||||||
Net Assets | $ | 1,300,131 | $ | 67,553 | $ | 2,251,538 | ||||
Net Assets Consist of: | ||||||||||
Capital Stock (Par Value and Paid-in Capital) | $ | 930,928 | $ | 157,904 | $ | 1,511,264 | ||||
Undistributed Net Investment Income (Loss) | — | — | — | |||||||
Accumulated Net Realized Gain (Loss) | 11,096 | (108,316 | ) | 2,068 | ||||||
Net Unrealized Appreciation/Depreciation | 358,107 | 17,965 | 738,206 | |||||||
Net Assets | $ | 1,300,131 | $ | 67,553 | $ | 2,251,538 | ||||
See Notes to Financial Statements.
72
STATEMENTS OF ASSETS AND LIABILITIES (continued)
December 31, 2004
Strong Advisor Stock Fund | Strong Advisor Mid Cap Growth Fund | Strong Advisor Value Fund | |||||||
Class A ($ and shares in full) | |||||||||
Net Assets | $ | 73,611,745 | $ | 10,309,450 | $ | 598,225,839 | |||
Capital Shares Outstanding (Unlimited Number Authorized) | 3,285,920 | 742,726 | 20,496,923 | ||||||
Net Asset Value Per Share | $ | 22.40 | $ | 13.88 | $ | 29.19 | |||
Public Offering Price Per Share | $ | 23.77 | $ | 14.73 | $ | 30.97 | |||
Class B ($ and shares in full) | |||||||||
Net Assets | $ | 37,907,614 | $ | 2,990,041 | $ | 136,824,800 | |||
Capital Shares Outstanding (Unlimited Number Authorized) | 1,743,894 | 221,643 | 4,849,386 | ||||||
Net Asset Value Per Share | $ | 21.74 | $ | 13.49 | $ | 28.21 | |||
Class C ($ and shares in full) | |||||||||
Net Assets | $ | 26,375,343 | $ | 575,274 | $ | 157,329,105 | |||
Capital Shares Outstanding (Unlimited Number Authorized) | 1,213,555 | 42,633 | 5,564,960 | ||||||
Net Asset Value Per Share | $ | 21.73 | $ | 13.49 | $ | 28.27 | |||
Class Z ($ and shares in full) | |||||||||
Net Assets | $ | 1,162,236,209 | $ | 53,678,011 | $ | 1,359,157,826 | |||
Capital Shares Outstanding (Unlimited Number Authorized) | 51,306,961 | 3,882,273 | 46,225,942 | ||||||
Net Asset Value Per Share | $ | 22.65 | $ | 13.83 | $ | 29.40 | |||
See Notes to Financial Statements.
73
STATEMENTS OF ASSETS AND LIABILITIES (continued)
December 31, 2004
| (In Thousands) | |||
| Strong Advisor U.S. Value Fund | |||
Assets: | |||
Investments in Securities, at Value | |||
Unaffiliated Issuers (Cost of $311,421) | $ | 370,007 | |
Receivable for Fund Shares Sold | 701 | ||
Dividends and Interest Receivable | 452 | ||
Other Assets | 43 | ||
Total Assets | 371,203 | ||
Liabilities: | |||
Payable for Fund Shares Redeemed | 1,854 | ||
Payable Upon Return of Securities on Loan | 9,099 | ||
Accrued Operating Expenses and Other Liabilities | 127 | ||
Total Liabilities | 11,080 | ||
Net Assets | $ | 360,123 | |
Net Assets Consist of: | |||
Capital Stock (Par Value and Paid-in Capital) | $ | 299,334 | |
Undistributed Net Investment Income (Loss) | 32 | ||
Accumulated Net Realized Gain (Loss) | 2,171 | ||
Net Unrealized Appreciation/Depreciation | 58,586 | ||
Net Assets | $ | 360,123 | |
See Notes to Financial Statements.
74
STATEMENTS OF ASSETS AND LIABILITIES (continued)
December 31, 2004
| Strong Advisor U.S. Value Fund | |||
Class A ($ and shares in full) | |||
Net Assets | $ | 5,264,414 | |
Capital Shares Outstanding (Unlimited Number Authorized) | 283,860 | ||
Net Asset Value Per Share | $ | 18.55 | |
Public Offering Price Per Share | $ | 19.68 | |
Class B ($ and shares in full) | |||
Net Assets | $ | 6,368,645 | |
Capital Shares Outstanding (Unlimited Number Authorized) | 343,793 | ||
Net Asset Value Per Share | $ | 18.52 | |
Class C ($ and shares in full) | |||
Net Assets | $ | 4,293,731 | |
Capital Shares Outstanding (Unlimited Number Authorized) | 232,841 | ||
Net Asset Value Per Share | $ | 18.44 | |
Class K ($ and shares in full) | |||
Net Assets | $ | 91,939,878 | |
Capital Shares Outstanding (Unlimited Number Authorized) | 4,997,868 | ||
Net Asset Value Per Share | $ | 18.40 | |
Class Z ($ and shares in full) | |||
Net Assets | $ | 252,255,933 | |
Capital Shares Outstanding (Unlimited Number Authorized) | 13,502,274 | ||
Net Asset Value Per Share | $ | 18.68 | |
See Notes to Financial Statements.
75
STATEMENTS OF ASSETS AND LIABILITIES (continued)
December 31, 2004
| (In Thousands, Except As Noted) | ||||||||||||
| Strong Advisor Endeavor Large Cap Fund | Strong Advisor Focus Fund | Strong Advisor International Core Fund | ||||||||||
Assets: | ||||||||||||
Investments in Securities, at Value | ||||||||||||
Unaffiliated Issuers (Cost of $37,016, $1,803, and $1,744, respectively) | $ | 44,310 | $ | 2,507 | $ | 2,286 | ||||||
Receivable for Fund Shares Sold | 93 | — | — | |||||||||
Dividends and Interest Receivable | 29 | — | 4 | |||||||||
Other Assets | 12 | 13 | 10 | |||||||||
Total Assets | 44,444 | 2,520 | 2,300 | |||||||||
Liabilities: | ||||||||||||
Payable for Fund Shares Redeemed | 42 | — | — | |||||||||
Accrued Operating Expenses and Other Liabilities | 20 | 6 | 8 | |||||||||
Total Liabilities | 62 | 6 | 8 | |||||||||
Net Assets | $ | 44,382 | $ | 2,514 | $ | 2,292 | ||||||
Net Assets Consist of: | ||||||||||||
Capital Stock (Par Value and Paid-in Capital) | $ | 37,244 | $ | 5,886 | $ | 1,752 | ||||||
Undistributed Net Investment Income (Loss) | — | — | 1 | |||||||||
Accumulated Net Realized Gain (Loss) | (156 | ) | (4,076 | ) | (3 | ) | ||||||
Net Unrealized Appreciation/Depreciation | 7,294 | 704 | 542 | |||||||||
Net Assets | $ | 44,382 | $ | 2,514 | $ | 2,292 | ||||||
Class A ($ and shares in full) | ||||||||||||
Net Assets | $ | 42,958,690 | $ | 1,160,439 | $ | 756,757 | ||||||
Capital Shares Outstanding (Unlimited Number Authorized) | 3,694,749 | 164,119 | 57,504 | |||||||||
Net Asset Value Per Share | $ | 11.63 | $ | 7.07 | $ | 13.16 | ||||||
Public Offering Price Per Share ($11.63 divided by .9425,$7.07 divided by .9425 and $13.16 divided by .9425, respectively) | $ | 12.34 | $ | 7.50 | $ | 13.96 | ||||||
Class B ($ and shares in full) | ||||||||||||
Net Assets | $ | 949,653 | $ | 1,100,895 | $ | 1,217,938 | ||||||
Capital Shares Outstanding (Unlimited Number Authorized) | 83,202 | 158,995 | 92,730 | |||||||||
Net Asset Value Per Share | $ | 11.41 | $ | 6.92 | $ | 13.13 | ||||||
Class C ($ and shares in full) | ||||||||||||
Net Assets | $ | 473,702 | $ | 252,460 | $ | 317,109 | ||||||
Capital Shares Outstanding (Unlimited Number Authorized) | 41,526 | 36,481 | 24,171 | |||||||||
Net Asset Value Per Share | $ | 11.41 | $ | 6.92 | $ | 13.12 | ||||||
See Notes to Financial Statements.
76
STATEMENTS OF ASSETS AND LIABILITIES (continued)
December 31, 2004
| (In Thousands, Except As Noted) | |||||||||||
| Strong Advisor Select Fund | Strong Advisor Technology Fund | Strong Advisor U.S. Small/Mid Cap Growth Fund | |||||||||
Assets: | |||||||||||
Investments in Securities, at Value | |||||||||||
Unaffiliated Issuers (Cost of $81,337, $1,399, and $3,855, respectively) | $ | 97,446 | $ | 1,501 | $ | 5,178 | |||||
Receivable for Fund Shares Sold | 260 | — | 1 | ||||||||
Dividends and Interest Receivable | 54 | — | — | ||||||||
Other Assets | 22 | 22 | 3 | ||||||||
Total Assets | 97,782 | 1,523 | 5,182 | ||||||||
Liabilities: | |||||||||||
Payable for Fund Shares Redeemed | 70 | 5 | — | ||||||||
Accrued Operating Expenses and Other Liabilities | 27 | 6 | 8 | ||||||||
Total Liabilities | 97 | 11 | 8 | ||||||||
Net Assets | $ | 97,685 | $ | 1,512 | $ | 5,174 | |||||
Net Assets Consist of: | |||||||||||
Capital Stock (Par Value and Paid-in Capital) | $ | 79,192 | $ | 1,986 | $ | 4,450 | |||||
Undistributed Net Investment Income (Loss) | — | — | — | ||||||||
Accumulated Net Realized Gain (Loss) | 2,384 | (575 | ) | (599 | ) | ||||||
Net Unrealized Appreciation/Depreciation | 16,109 | 101 | 1,323 | ||||||||
Net Assets | $ | 97,685 | $ | 1,512 | $ | 5,174 | |||||
Class A ($ and shares in full) | |||||||||||
Net Assets | $ | 94,805,424 | $ | 763,546 | $ | 2,499,638 | |||||
Capital Shares Outstanding (Unlimited Number Authorized) | 10,349,311 | 107,685 | 222,245 | ||||||||
Net Asset Value Per Share | $ | 9.16 | $ | 7.09 | $ | 11.25 | |||||
Public Offering Price Per Share ($9.16 divided by .9425,$7.09 divided by .9425, and $11.25 divided by .9425, respectively) | $ | 9.72 | $ | 7.52 | $ | 11.94 | |||||
Class B ($ and shares in full) | |||||||||||
Net Assets | $ | 1,800,298 | $ | 539,079 | $ | 1,517,675 | |||||
Capital Shares Outstanding (Unlimited Number Authorized) | 202,930 | 77,158 | 134,984 | ||||||||
Net Asset Value Per Share | $ | 8.87 | $ | 6.99 | $ | 11.24 | |||||
Class C ($ and shares in full) | |||||||||||
Net Assets | $ | 1,079,544 | $ | 209,309 | $ | 1,156,719 | |||||
Capital Shares Outstanding (Unlimited Number Authorized) | 121,653 | 30,053 | 102,780 | ||||||||
Net Asset Value Per Share | $ | 8.87 | $ | 6.96 | $ | 11.25 | |||||
See Notes to Financial Statements.
77
STATEMENTS OF ASSETS AND LIABILITIES (continued)
December 31, 2004
(In Thousands, Except As Noted) | |||
Strong Advisor Utilities and Energy Fund | |||
Assets: | |||
Investments in Securities, at Value | |||
Unaffiliated Issuers (Cost of $1,632) | $ | 1,928 | |
Dividends and Interest Receivable | 21 | ||
Other Assets | 6 | ||
Total Assets | 1,955 | ||
Accrued Operating Expenses and Other Liabilities | 8 | ||
Net Assets | $ | 1,947 | |
Net Assets Consist of: | |||
Capital Stock (Par Value and Paid-in Capital) | $ | 1,469 | |
Undistributed Net Investment Income (Loss) | 3 | ||
Accumulated Net Realized Gain (Loss) | 178 | ||
Net Unrealized Appreciation/Depreciation | 297 | ||
Net Assets | $ | 1,947 | |
Class A ($ and shares in full) | |||
Net Assets | $ | 1,288,414 | |
Capital Shares Outstanding (Unlimited Number Authorized) | 108,375 | ||
Net Asset Value Per Share | $ | 11.89 | |
Public Offering Price Per Share ($11.89 divided by .9425) | $ | 12.62 | |
Class B ($ and shares in full) | |||
Net Assets | $ | 374,985 | |
Capital Shares Outstanding (Unlimited Number Authorized) | 31,885 | ||
Net Asset Value Per Share | $ | 11.76 | |
Class C ($ and shares in full) | |||
Net Assets | $ | 283,752 | |
Capital Shares Outstanding (Unlimited Number Authorized) | 24,181 | ||
Net Asset Value Per Share | $ | 11.73 | |
See Notes to Financial Statements.
78
STATEMENTS OF ASSETS AND LIABILITIES (continued)
December 31, 2004
(In Thousands, Except As Noted) | |||
Strong Advisor Large Company Core Fund | |||
Assets: | |||
Investments in Securities, at Value | |||
Unaffiliated Issuers (Cost of $81,938) | $ | 95,843 | |
Receivable for Fund Shares Sold | 89 | ||
Dividends and Interest Receivable | 112 | ||
Other Assets | 24 | ||
Total Assets | 96,068 | ||
Liabilities: | |||
Payable for Fund Shares Redeemed | 100 | ||
Accrued Operating Expenses and Other Liabilities | 30 | ||
Total Liabilities | 130 | ||
Net Assets | $ | 95,938 | |
Net Assets Consist of: | |||
Capital Stock (Par Value and Paid-in Capital) | $ | 80,707 | |
Undistributed Net Investment Income (Loss) | — | ||
Accumulated Net Realized Gain (Loss) | 1,326 | ||
Net Unrealized Appreciation/Depreciation | 13,905 | ||
Net Assets | $ | 95,938 | |
Class A ($ and shares in full) | |||
Net Assets | $ | 55,120,560 | |
Capital Shares Outstanding (Unlimited Number Authorized) | 5,026,244 | ||
Net Asset Value Per Share | $ | 10.97 | |
Public Offering Price Per Share ($10.97 divided by .9425) | $ | 11.64 | |
Class B ($ and shares in full) | |||
Net Assets | $ | 9,103,370 | |
Capital Shares Outstanding (Unlimited Number Authorized) | 848,241 | ||
Net Asset Value Per Share | $ | 10.73 | |
Class C ($ and shares in full) | |||
Net Assets | $ | 7,456,583 | |
Capital Shares Outstanding (Unlimited Number Authorized) | 695,324 | ||
Net Asset Value Per Share | $ | 10.72 | |
Class K ($ and shares in full) | |||
Net Assets | $ | 24,257,175 | |
Capital Shares Outstanding (Unlimited Number Authorized) | 2,192,221 | ||
Net Asset Value Per Share | $ | 11.07 | |
See Notes to Financial Statements.
79
For the Year Ended December 31, 2004
| (In Thousands) | ||||||||||||
| Strong Advisor Common Stock Fund | Strong Advisor Mid Cap Growth Fund | Strong Advisor Small Cap Value Fund | ||||||||||
Income: | ||||||||||||
Dividends – Unaffiliated Issuers (net of foreign withholding taxes of $74, $3, and $423, respectively) | $ | 12,178 | $ | 224 | $ | 9,651 | ||||||
Dividends – Affiliated Issuers | — | — | 631 | |||||||||
Interest | 960 | 21 | 1,502 | |||||||||
Total Income | 13,138 | 245 | 11,784 | |||||||||
Expenses (Note 4): | ||||||||||||
Investment Advisory Fees | 10,660 | 481 | 15,396 | |||||||||
Administrative Fees | 4,264 | 192 | 6,158 | |||||||||
Custodian Fees | 82 | 13 | 157 | |||||||||
Shareholder Servicing Costs | 3,093 | 304 | 5,103 | |||||||||
Reports to Shareholders | 406 | 87 | 708 | |||||||||
12b-1 Fees | 862 | 58 | 4,239 | |||||||||
Other | 526 | 92 | 666 | |||||||||
Total Expenses before Expense Waivers and Offsets | 19,893 | 1,227 | 32,427 | |||||||||
Expense Waivers and Offsets | (544 | ) | (33 | ) | (832 | ) | ||||||
Expenses, Net | 19,349 | 1,194 | 31,595 | |||||||||
Net Investment Income (Loss) | (6,211 | ) | (949 | ) | (19,811 | ) | ||||||
Realized and Unrealized Gain (Loss): | ||||||||||||
Net Realized Gain (Loss) on: | ||||||||||||
Investments | 215,028 | 10,458 | 277,265 | |||||||||
Foreign Currencies | 7 | — | — | |||||||||
Written Options | — | — | (6,948 | ) | ||||||||
Net Realized Gain (Loss) | 215,035 | 10,458 | 270,317 | |||||||||
Net Change in Unrealized Appreciation/Depreciation on: | ||||||||||||
Investments | (86,255 | ) | 1,475 | 119,110 | ||||||||
Foreign Currencies | 5 | — | — | |||||||||
Written Options | 52 | — | 1,248 | |||||||||
Net Change in Unrealized Appreciation/Depreciation | (86,198 | ) | 1,475 | 120,358 | ||||||||
Net Gain (Loss) on Investments | 128,837 | 11,933 | 390,675 | |||||||||
Net Increase (Decrease) in Net Assets Resulting from Operations | $ | 122,626 | $ | 10,984 | $ | 370,864 | ||||||
See Notes to Financial Statements.
80
STATEMENTS OF OPERATIONS (continued)
For the Year Ended December 31, 2004
| (In Thousands) | ||||
| Strong Advisor U.S. Value Fund | ||||
Income: | ||||
Dividends – Unaffiliated Issuers (net of foreign withholding taxes of $3) | $ | 8,039 | ||
Interest | 168 | |||
Total Income | 8,207 | |||
Expenses (Note 4): | ||||
Investment Advisory Fees | 1,812 | |||
Administrative Fees | 947 | |||
Custodian Fees | 27 | |||
Shareholder Servicing Costs | 1,000 | |||
Reports to Shareholders | 257 | |||
12b-1 Fees | 112 | |||
Other | 199 | |||
Total Expenses before Expense Waivers and Offsets | 4,354 | |||
Expense Waivers and Offsets | (210 | ) | ||
Expenses, Net | 4,144 | |||
Net Investment Income (Loss) | 4,063 | |||
Realized and Unrealized Gain (Loss): | ||||
Net Realized Gain (Loss) on: | ||||
Investments | 30,629 | |||
Futures Contracts | (15 | ) | ||
Written Options | 33 | |||
Net Realized Gain (Loss) | 30,647 | |||
Net Change in Unrealized Appreciation/Depreciation on Investments | 9,863 | |||
Net Gain (Loss) on Investments | 40,510 | |||
Net Increase (Decrease) in Net Assets Resulting from Operations | $ | 44,573 | ||
See Notes to Financial Statements.
81
STATEMENTS OF OPERATIONS (continued)
For the Year Ended December 31, 2004
| (In Thousands) | ||||||||||||
| Strong Advisor Endeavor Large Cap Fund | Strong Advisor Focus Fund | Strong Advisor International Core Fund | ||||||||||
Income: | ||||||||||||
Dividends – Unaffiliated Issuers (net of foreign withholding taxes of $3, $0, and $4, respectively) | $ | 280 | $ | 5 | $ | 40 | ||||||
Interest | 8 | 1 | 1 | |||||||||
Total Income | 288 | 6 | 41 | |||||||||
Expenses (Note 4): | ||||||||||||
Investment Advisory Fees | 298 | 19 | 13 | |||||||||
Administrative Fees | 119 | 8 | 5 | |||||||||
Custodian Fees | 7 | 3 | 6 | |||||||||
Shareholder Servicing Costs | 80 | 6 | 4 | |||||||||
12b-1 Fees | 109 | 17 | 13 | |||||||||
Professional Fees | 20 | 14 | 15 | |||||||||
Federal and State Registration Fees | 36 | 40 | 34 | |||||||||
Other | 15 | 2 | 3 | |||||||||
Total Expenses before Expense Waivers and Offsets | 684 | 109 | 93 | |||||||||
Expense Waivers and Offsets | (15 | ) | (53 | ) | (93 | ) | ||||||
Expenses, Net | 669 | 56 | — | |||||||||
Net Investment Income (Loss) | (381 | ) | (50 | ) | 41 | |||||||
Realized and Unrealized Gain (Loss): | ||||||||||||
Net Realized Gain (Loss) on Investments | 5,706 | 499 | 81 | |||||||||
Net Change in Unrealized Appreciation/Depreciation on Investments | 821 | (36 | ) | 215 | ||||||||
Net Gain (Loss) on Investments | 6,527 | 463 | 296 | |||||||||
Net Increase (Decrease) in Net Assets Resulting from Operations | $ | 6,146 | $ | 413 | $ | 337 | ||||||
See Notes to Financial Statements.
82
STATEMENTS OF OPERATIONS (continued)
For the Year Ended December 31, 2004
| (In Thousands) | ||||||||||||
| Strong Advisor Select Fund | Strong Advisor Technology Fund | Strong Advisor U.S. Small/Mid Cap Growth Fund | ||||||||||
Income: | ||||||||||||
Dividends – Unaffiliated Issuers (net of foreign withholding taxes of $5, $0, and $0, respectively) | $ | 387 | $ | 7 | $ | 6 | ||||||
Interest | 27 | 1 | 1 | |||||||||
Total Income | 414 | 8 | 7 | |||||||||
Expenses (Note 4): | ||||||||||||
Investment Advisory Fees | 593 | 11 | 40 | |||||||||
Administrative Fees | 237 | 5 | 16 | |||||||||
Custodian Fees | 9 | 2 | 6 | |||||||||
Shareholder Servicing Costs | 158 | 3 | 11 | |||||||||
12b-1 Fees | 211 | 9 | 34 | |||||||||
Professional Fees | 25 | 14 | 15 | |||||||||
Federal and State Registration Fees | 38 | 39 | 35 | |||||||||
Other | 17 | 2 | 5 | |||||||||
Total Expenses before Expense Waivers and Offsets | 1,288 | 85 | 162 | |||||||||
Expenses Waivers and Offsets | (29 | ) | (58 | ) | (34 | ) | ||||||
Expenses, Net | 1,259 | 27 | 128 | |||||||||
Net Investment Income (Loss) | (845 | ) | (19 | ) | (121 | ) | ||||||
Realized and Unrealized Gain (Loss): | ||||||||||||
Net Realized Gain (Loss) on Investments | 14,045 | 188 | (352 | ) | ||||||||
Net Change in Unrealized Appreciation/Depreciation on Investments | 372 | (221 | ) | 425 | ||||||||
Net Gain (Loss) on Investments | 14,417 | (33 | ) | 73 | ||||||||
Net Increase (Decrease) in Net Assets Resulting from Operations | $ | 13,572 | $ | (52 | ) | $ | (48 | ) | ||||
See Notes to Financial Statements.
83
STATEMENTS OF OPERATIONS (continued)
For the Year Ended December 31, 2004
| (In Thousands) | ||||
| Strong Advisor Utilities and Energy Fund | ||||
Income: | ||||
Dividends – Unaffiliated Issuers (net of foreign withholding taxes of $4) | $ | 251 | ||
Interest | 4 | |||
Total Income | 255 | |||
Expenses (Note 4): | ||||
Investment Advisory Fees | 68 | |||
Administrative Fees | 27 | |||
Custodian Fees | 5 | |||
Shareholder Servicing Costs | 18 | |||
12b-1 Fees | 26 | |||
Professional Fees | 15 | |||
Federal and State Registration Fees | 36 | |||
Other | 3 | |||
Total Expenses before Expense Waivers and Offsets | 198 | |||
Expense Waivers and Offsets | (4 | ) | ||
Expenses, Net | 194 | |||
Net Investment Income (Loss) | 61 | |||
Realized and Unrealized Gain (Loss): | ||||
Net Realized Gain (Loss) on Investments | 2,964 | |||
Net Change in Unrealized Appreciation/Depreciation on Investments | (1,242 | ) | ||
Net Gain (Loss) on Investments | 1,722 | |||
Net Increase (Decrease) in Net Assets Resulting from Operations | $ | 1,783 | ||
See Notes to Financial Statements.
84
STATEMENTS OF OPERATIONS (continued)
For the Year Ended December 31, 2004
| (In Thousands) | ||||
| Strong Advisor Large Company Core Fund | ||||
Income: | ||||
Dividends – Unaffiliated Issuers (net of foreign withholding taxes of $4) | $ | 1,399 | ||
Interest | 67 | |||
Total Income | 1,466 | |||
Expenses (Note 4): | ||||
Investment Advisory Fees | 794 | |||
Administrative Fees | 303 | |||
Custodian Fees | 11 | |||
Shareholder Servicing Costs | 214 | |||
12b-1 Fees | 310 | |||
Other | 127 | |||
Total Expenses before Expense Waivers and Offsets | 1,759 | |||
Expense Waivers and Offsets | (220 | ) | ||
Expenses, Net | 1,539 | |||
Net Investment Income (Loss) | (73 | ) | ||
Realized and Unrealized Gain (Loss): | ||||
Net Realized Gain (Loss) on Investments | 9,068 | |||
Net Change in Unrealized Appreciation/Depreciation on Investments | 848 | |||
Net Gain (Loss) on Investments | 9,916 | |||
Net Increase (Decrease) in Net Assets Resulting from Operations | $ | 9,843 | ||
See Notes to Financial Statements.
85
STATEMENTS OF CHANGES IN NET ASSETS
| (In Thousands) | ||||||||||||||||
Strong Advisor Common Stock Fund | Strong Advisor Mid Cap Growth Fund | |||||||||||||||
| Year Ended Dec. 31, 2004 | Year Ended Dec. 31, 2003 | Year Ended Dec. 31, 2004 | Year Ended Dec. 31, 2003 | |||||||||||||
Operations: | ||||||||||||||||
Net Investment Income (Loss) | $ | (6,211 | ) | $ | (7,290 | ) | $ | (949 | ) | $ | (1,218 | ) | ||||
Net Realized Gain (Loss) | 215,035 | 76,043 | 10,458 | 11,159 | ||||||||||||
Net Change in Unrealized Appreciation/Depreciation | (86,198 | ) | 450,650 | 1,475 | 16,288 | |||||||||||
Net Increase (Decrease) in Net Assets Resulting from Operations | 122,626 | 519,403 | 10,984 | 26,229 | ||||||||||||
Distributions: | ||||||||||||||||
From Net Realized Gains: | ||||||||||||||||
Class A | (5,224 | ) | — | — | — | |||||||||||
Class B | (2,711 | ) | — | — | — | |||||||||||
Class C | (1,934 | ) | — | — | — | |||||||||||
Class Z | (81,830 | ) | — | — | — | |||||||||||
Total Distributions | (91,699 | ) | — | — | — | |||||||||||
Capital Share Transactions (Note 8): | ||||||||||||||||
Net Increase (Decrease) in Net Assets from Capital Share Transactions | (321,774 | ) | (384,712 | ) | (14,748 | ) | (29,181 | ) | ||||||||
Total Increase (Decrease) in Net Assets | (290,847 | ) | 134,691 | (3,764 | ) | (2,952 | ) | |||||||||
Net Assets: | ||||||||||||||||
Beginning of Year | 1,590,978 | 1,456,287 | 71,317 | 74,269 | ||||||||||||
End of Year | $ | 1,300,131 | $ | 1,590,978 | $ | 67,553 | $ | 71,317 | ||||||||
Undistributed Net Investment Income (Loss) | $ | — | $ | — | $ | — | $ | — | ||||||||
See Notes to Financial Statements.
86
STATEMENTS OF CHANGES IN NET ASSETS (continued)
| (In Thousands) | ||||||||
| Strong Advisor Small Cap Value Fund | ||||||||
| Year Ended Dec. 31, 2004 | Year Ended Dec. 31, 2003 | |||||||
Operations: | ||||||||
Net Investment Income (Loss) | $ | (19,811 | ) | $ | (9,098 | ) | ||
Net Realized Gain (Loss) | 270,317 | 82,632 | ||||||
Net Change in Unrealized Appreciation/Depreciation | 120,358 | 595,643 | ||||||
Net Increase (Decrease) in Net Assets Resulting from Operations | 370,864 | 669,177 | ||||||
Distributions: | ||||||||
From Net Investment Income: | ||||||||
Class A | — | (248 | ) | |||||
Class B | — | (48 | ) | |||||
Class C | — | (61 | ) | |||||
Class Z | — | (436 | ) | |||||
From Net Realized Gains: | ||||||||
Class A | (65,935 | ) | (15,533 | ) | ||||
Class B | (15,208 | ) | (2,975 | ) | ||||
Class C | (17,606 | ) | (3,815 | ) | ||||
Class Z | (142,847 | ) | (27,278 | ) | ||||
Total Distributions | (241,596 | ) | (50,394 | ) | ||||
Capital Share Transactions (Note 8): | ||||||||
Net Increase (Decrease) in Net Assets from Capital Share Transactions | (3,499 | ) | 339,695 | |||||
Total Increase (Decrease) in Net Assets | 125,769 | 958,478 | ||||||
Net Assets: | ||||||||
Beginning of Year | 2,125,769 | 1,167,291 | ||||||
End of Year | $ | 2,251,538 | $ | 2,125,769 | ||||
Undistributed Net Investment Income (Loss) | $ | — | $ | — | ||||
See Notes to Financial Statements.
87
STATEMENTS OF CHANGES IN NET ASSETS (continued)
| (In Thousands) | ||||||||
Strong Advisor U.S. Value Fund | ||||||||
| Year Ended Dec. 31, 2004 | Year Ended Dec. 31, 2003 | |||||||
Operations: | ||||||||
Net Investment Income (Loss) | $ | 4,063 | $ | 1,864 | ||||
Net Realized Gain (Loss) | 30,647 | 11,073 | ||||||
Net Change in Unrealized Appreciation/Depreciation | 9,863 | 49,990 | ||||||
Net Increase (Decrease) in Net Assets Resulting from Operations | 44,573 | 62,927 | ||||||
Distributions: | ||||||||
From Net Investment Income: | ||||||||
Class A | (46 | ) | (36 | ) | ||||
Class B | (19 | ) | (11 | ) | ||||
Class C | (9 | ) | (9 | ) | ||||
Class K | (1,196 | ) | (523 | ) | ||||
Class Z | (2,578 | ) | (1,255 | ) | ||||
From Net Realized Gains: | ||||||||
Class A | (352 | ) | — | |||||
Class B | (435 | ) | — | |||||
Class C | (299 | ) | — | |||||
Class K | (5,975 | ) | — | |||||
Class Z | (16,835 | ) | — | |||||
Total Distributions | (27,744 | ) | (1,834 | ) | ||||
Capital Share Transactions (Note 8): | ||||||||
Net Increase (Decrease) in Net Assets from Capital Share Transactions | 83,023 | (16,592 | ) | |||||
Total Increase (Decrease) in Net Assets | 99,852 | 44,501 | ||||||
Net Assets: | ||||||||
Beginning of Year | 260,271 | 215,770 | ||||||
End of Year | $ | 360,123 | $ | 260,271 | ||||
Undistributed Net Investment Income (Loss) | $ | 32 | $ | 19 | ||||
See Notes to Financial Statements.
88
STATEMENTS OF CHANGES IN NET ASSETS (continued)
| (In Thousands) | ||||||||||||||||
Strong Advisor Endeavor Large Cap Fund | Strong Advisor Focus Fund | |||||||||||||||
| Year Ended Dec. 31, 2004 | Year Ended Dec. 31, 2003 | Year Ended Dec. 31, 2004 | Year Ended Dec. 31, 2003 | |||||||||||||
Operations: | ||||||||||||||||
Net Investment Income (Loss) | $ | (381 | ) | $ | (305 | ) | $ | (50 | ) | $ | (47 | ) | ||||
Net Realized Gain (Loss) | 5,706 | 3,624 | 499 | 225 | ||||||||||||
Net Change in Unrealized Appreciation/Depreciation | 821 | 6,766 | (36 | ) | 615 | |||||||||||
Net Increase (Decrease) in Net Assets Resulting from Operations | 6,146 | 10,085 | 413 | 793 | ||||||||||||
Distributions From Net Investment Income | — | — | — | — | ||||||||||||
Capital Share Transactions (Note 8): | ||||||||||||||||
Net Increase (Decrease) in Net Assets from Capital Share Transactions | 486 | (1,142 | ) | (1,019 | ) | (1,326 | ) | |||||||||
Total Increase (Decrease) in Net Assets | 6,632 | 8,943 | (606 | ) | (533 | ) | ||||||||||
Net Assets: | ||||||||||||||||
Beginning of Year | 37,750 | 28,807 | 3,120 | 3,653 | ||||||||||||
End of Year | $ | 44,382 | $ | 37,750 | $ | 2,514 | $ | 3,120 | ||||||||
Undistributed Net Investment Income (Loss) | $ | — | $ | — | $ | — | $ | — | ||||||||
See Notes to Financial Statements.
89
STATEMENTS OF CHANGES IN NET ASSETS (continued)
| (In Thousands) | ||||||||||||||||
Strong Advisor International Core Fund | Strong Advisor Select Fund | |||||||||||||||
| Year Ended Dec. 31, 2004 | Year Ended Dec. 31, 2003 | Year Ended Dec. 31, 2004 | Year Ended Dec. 31, 2003 | |||||||||||||
Operations: | ||||||||||||||||
Net Investment Income (Loss) | $ | 41 | $ | 22 | $ | (845 | ) | $ | (745 | ) | ||||||
Net Realized Gain (Loss) | 81 | (12 | ) | 14,045 | 8,935 | |||||||||||
Net Change in Unrealized Appreciation/Depreciation | 215 | 342 | 372 | 15,584 | ||||||||||||
Net Increase (Decrease) in Net Assets Resulting from Operations | 337 | 352 | 13,572 | 23,774 | ||||||||||||
Distributions: | ||||||||||||||||
From Net Investment Income: | ||||||||||||||||
Class A | (14 | ) | (7 | ) | — | — | ||||||||||
Class B | (23 | ) | (10 | ) | — | — | ||||||||||
Class C | (6 | ) | (3 | ) | — | — | ||||||||||
From Net Realized Gains: | ||||||||||||||||
Class A | (15 | ) | — | (5,514 | ) | — | ||||||||||
Class B | (23 | ) | — | (108 | ) | — | ||||||||||
Class C | (6 | ) | — | (66 | ) | — | ||||||||||
Total Distributions | (87 | ) | (20 | ) | (5,688 | ) | — | |||||||||
Capital Share Transactions (Note 8): | ||||||||||||||||
Net Increase (Decrease) in Net Assets from Capital Share Transactions | 547 | 562 | 7,544 | 2,173 | ||||||||||||
Total Increase (Decrease) in Net Assets | 797 | 894 | 15,428 | 25,947 | ||||||||||||
Net Assets: | ||||||||||||||||
Beginning of Year | 1,495 | 601 | 82,257 | 56,310 | ||||||||||||
End of Year | $ | 2,292 | $ | 1,495 | $ | 97,685 | $ | 82,257 | ||||||||
Undistributed Net Investment Income (Loss) | $ | 1 | $ | 2 | $ | — | $ | — | ||||||||
See Notes to Financial Statements.
90
STATEMENTS OF CHANGES IN NET ASSETS (continued)
| (In Thousands) | ||||||||||||||||
Strong Advisor Technology Fund | Strong Advisor U.S. Small/Mid Cap Growth Fund | |||||||||||||||
| Year Ended Dec. 31, 2004 | Year Ended Dec. 31, 2003 | Year Ended Dec. 31, 2004 | Year Ended Dec. 31, 2003 | |||||||||||||
Operations: | ||||||||||||||||
Net Investment Income (Loss) | $ | (19 | ) | $ | (39 | ) | $ | (121 | ) | $ | (58 | ) | ||||
Net Realized Gain (Loss) | 188 | 435 | (352 | ) | (68 | ) | ||||||||||
Net Change in Unrealized Appreciation/Depreciation | (221 | ) | 787 | 425 | 890 | |||||||||||
Net Increase (Decrease) in Net Assets Resulting from Operations | (52 | ) | 1,183 | (48 | ) | 764 | ||||||||||
Distributions From Net Investment Income | — | — | — | — | ||||||||||||
Capital Share Transactions (Note 8): | ||||||||||||||||
Net Increase (Decrease) in Net Assets from Capital Share Transactions | (629 | ) | (479 | ) | (315 | ) | 4,011 | |||||||||
Total Increase (Decrease) in Net Assets | (681 | ) | 704 | (363 | ) | 4,775 | ||||||||||
Net Assets: | ||||||||||||||||
Beginning of Year | 2,193 | 1,489 | 5,537 | 762 | ||||||||||||
End of Year | $ | 1,512 | $ | 2,193 | $ | 5,174 | $ | 5,537 | ||||||||
Undistributed Net Investment Income (Loss) | $ | — | $ | — | $ | — | $ | — | ||||||||
Strong Advisor Utilities and Energy Fund | ||||||||
| Year Ended Dec. 31, 2004 | Year Ended Dec. 31, 2003 | |||||||
Operations: | ||||||||
Net Investment Income (Loss) | $ | 61 | $ | 185 | ||||
Net Realized Gain (Loss) | 2,964 | 134 | ||||||
Net Change in Unrealized Appreciation/Depreciation | (1,242 | ) | 1,523 | |||||
Net Increase (Decrease) in Net Assets Resulting from Operations | 1,783 | 1,842 | ||||||
Distributions: | ||||||||
From Net Investment Income: | ||||||||
Class A | (47 | ) | (180 | ) | ||||
Class B | (7 | ) | (2 | ) | ||||
Class C | (5 | ) | (2 | ) | ||||
From Net Realized Gains: | ||||||||
Class A | (663 | ) | — | |||||
Class B | (30 | ) | — | |||||
Class C | (22 | ) | — | |||||
Total Distributions | (774 | ) | (184 | ) | ||||
Capital Share Transactions (Note 8): | ||||||||
Net Increase (Decrease) in Net Assets from Capital Share Transactions | (9,377 | ) | 2,271 | |||||
Total Increase (Decrease) in Net Assets | (8,368 | ) | 3,929 | |||||
Net Assets: | ||||||||
Beginning of Year | 10,315 | 6,386 | ||||||
End of Year | $ | 1,947 | $ | 10,315 | ||||
Undistributed Net Investment Income (Loss) | $ | 3 | $ | 1 | ||||
See Notes to Financial Statements.
91
STATEMENTS OF CHANGES IN NET ASSETS (continued)
| (In Thousands) | ||||||||
| Strong Advisor Large Company Core Fund | ||||||||
Year Ended Dec. 31, 2004 | Year Ended Dec. 31, 2003 | |||||||
Operations: | ||||||||
Net Investment Income (Loss) | $ | (73 | ) | $ | 23 | |||
Net Realized Gain (Loss) | 9,068 | 2,100 | ||||||
Net Change in Unrealized Appreciation/Depreciation | 848 | 13,076 | ||||||
Net Increase (Decrease) in Net Assets Resulting from Operations | 9,843 | 15,199 | ||||||
Distributions: | ||||||||
From Net Investment Income: | ||||||||
Class A | — | (20 | ) | |||||
Class K | — | (46 | ) | |||||
From Net Realized Gains: | ||||||||
Class A | (4,798 | ) | (62 | ) | ||||
Class B | (759 | ) | (7 | ) | ||||
Class C | (636 | ) | (6 | ) | ||||
Class K | (2,151 | ) | (33 | ) | ||||
Total Distributions | (8,344 | ) | (174 | ) | ||||
Capital Share Transactions (Note 8): | ||||||||
Net Increase (Decrease) in Net Assets from Capital Share Transactions | (22,266 | ) | 92,004 | |||||
Total Increase (Decrease) in Net Assets | (20,767 | ) | 107,029 | |||||
Net Assets: | ||||||||
Beginning of Year | 116,705 | 9,676 | ||||||
End of Year | $ | 95,938 | $ | 116,705 | ||||
Undistributed Net Investment Income (Loss) | $ | — | $ | — | ||||
See Notes to Financial Statements.
92
STRONG ADVISOR COMMON STOCK FUND — CLASS A
| Year Ended | ||||||||||||||||||||
| Dec. 31, 2004 | Dec. 31, 2003 | Dec. 31, 2002 | Dec. 31, 2001 | Dec. 31, 2000(b)(c) | ||||||||||||||||
Selected Per-Share Data(a) | ||||||||||||||||||||
Net Asset Value, Beginning of Period | $ | 21.98 | $ | 15.87 | $ | 19.71 | $ | 20.15 | $ | 18.90 | ||||||||||
Income From Investment Operations: | ||||||||||||||||||||
Net Investment Income (Loss) | (0.14 | )(d) | (0.10 | ) | (0.08 | )(d) | (0.04 | ) | (0.00 | )(e) | ||||||||||
Net Realized and Unrealized Gains (Losses) on Investments | 2.21 | 6.21 | (3.76 | ) | (0.36 | ) | 1.28 | |||||||||||||
Total from Investment Operations | 2.07 | 6.11 | (3.84 | ) | (0.40 | ) | 1.28 | |||||||||||||
Less Distributions: | ||||||||||||||||||||
From Net Investment Income | — | — | — | — | (0.03 | ) | ||||||||||||||
From Net Realized Gains | (1.65 | ) | — | — | (0.04 | ) | — | |||||||||||||
Total Distributions | (1.65 | ) | — | — | (0.04 | ) | (0.03 | ) | ||||||||||||
Net Asset Value, End of Period | $ | 22.40 | $ | 21.98 | $ | 15.87 | $ | 19.71 | $ | 20.15 | ||||||||||
Ratios and Supplemental Data | ||||||||||||||||||||
Total Return(f) | +9.67 | % | +38.50 | % | –19.48 | % | –1.99 | % | +6.78 | % | ||||||||||
Net Assets, End of Period (In Millions) | $ | 74 | $ | 81 | $ | 46 | $ | 28 | $ | 0 | (g) | |||||||||
Ratio of Expenses to Average Net Assets before Expense Waivers and Offsets | 1.6 | % | 1.6 | % | 1.6 | % | 1.6 | % | 1.6 | %* | ||||||||||
Ratio of Expenses to Average Net Assets | 1.5 | % | 1.5 | % | 1.6 | % | 1.6 | % | 1.6 | %* | ||||||||||
Ratio of Net Investment Income (Loss) to Average Net Assets | (0.6 | )% | (0.6 | )% | (0.5 | )% | (0.5 | )% | (0.2 | )%* | ||||||||||
Portfolio Turnover Rate(h) | 41.6 | % | 41.8 | % | 64.9 | % | 89.3 | % | 95.4 | % | ||||||||||
STRONG ADVISOR COMMON STOCK FUND — CLASS B
| Year Ended | ||||||||||||||||||||
| Dec. 31, 2004 | Dec. 31, 2003 | Dec. 31, 2002 | Dec. 31, 2001 | Dec. 31, 2000(b)(c) | ||||||||||||||||
Selected Per-Share Data(a) | ||||||||||||||||||||
Net Asset Value, Beginning of Period | $ | 21.53 | $ | 15.67 | $ | 19.62 | $ | 20.16 | $ | 18.90 | ||||||||||
Income From Investment Operations: | ||||||||||||||||||||
Net Investment Income (Loss) | (0.29 | )(d) | (0.24 | ) | (0.22 | )(d) | (0.09 | ) | (0.01 | ) | ||||||||||
Net Realized and Unrealized Gains (Losses) on Investments | 2.15 | 6.10 | (3.73 | ) | (0.41 | ) | 1.28 | |||||||||||||
Total from Investment Operations | 1.86 | 5.86 | (3.95 | ) | (0.50 | ) | 1.27 | |||||||||||||
Less Distributions: | ||||||||||||||||||||
From Net Investment Income | — | — | — | — | (0.01 | ) | ||||||||||||||
From Net Realized Gains | (1.65 | ) | — | — | (0.04 | ) | — | |||||||||||||
Total Distributions | (1.65 | ) | — | — | (0.04 | ) | (0.01 | ) | ||||||||||||
Net Asset Value, End of Period | $ | 21.74 | $ | 21.53 | $ | 15.67 | $ | 19.62 | $ | 20.16 | ||||||||||
Ratios and Supplemental Data | ||||||||||||||||||||
Total Return(f) | +8.89 | % | +37.40 | % | –20.13 | % | –2.48 | % | +6.76 | % | ||||||||||
Net Assets, End of Period (In Millions) | $ | 38 | $ | 39 | $ | 24 | $ | 16 | $ | 0 | (g) | |||||||||
Ratio of Expenses to Average Net Assets before Expense Waivers and Offsets | 2.3 | % | 2.4 | % | 2.4 | % | 2.5 | % | 2.0 | %* | ||||||||||
Ratio of Expenses to Average Net Assets | 2.3 | % | 2.3 | % | 2.4 | % | 2.3 | % | 2.0 | %* | ||||||||||
Ratio of Net Investment Income (Loss) to Average Net Assets | (1.4 | )% | (1.4 | )% | (1.3 | )% | (1.1 | )% | (0.6 | )%* | ||||||||||
Portfolio Turnover Rate(h) | 41.6 | % | 41.8 | % | 64.9 | % | 89.3 | % | 95.4 | % | ||||||||||
| * | Calculated on an annualized basis. |
| (a) | Information presented relates to a share of capital stock of the Fund outstanding for the entire period. |
| (b) | For the period from November 30, 2000 (commencement of class) to December 31, 2000. |
| (c) | Per share data reflects a 1.233 for 1.000 share split which occurred on March 8, 2001. |
| (d) | Net investment income (loss) per share represents net investment income (loss) divided by average shares outstanding throughout the year. |
| (e) | Amount calculated is less than $0.005. |
| (f) | Total return assumes dividend reinvestment and does not reflect the effect of sales charges. |
| (g) | Amount is less than $500,000. |
| (h) | Calculated on the basis of the Fund as a whole without distinguishing between the classes of shares issued. |
See Notes to Financial Statements.
93
FINANCIAL HIGHLIGHTS (continued)
STRONG ADVISOR COMMON STOCK FUND — CLASS C
| Year Ended | ||||||||||||||||||||
| Dec. 31, 2004 | Dec. 31, 2003 | Dec. 31, 2002 | Dec. 31, 2001 | Dec. 31, 2000(b)(c) | ||||||||||||||||
Selected Per-Share Data(a) | ||||||||||||||||||||
Net Asset Value, Beginning of Period | $ | 21.53 | $ | 15.68 | $ | 19.62 | $ | 20.16 | $ | 18.90 | ||||||||||
Income From Investment Operations: | ||||||||||||||||||||
Net Investment Income (Loss) | (0.30 | )(d) | (0.25 | ) | (0.22 | )(d) | (0.09 | ) | (0.01 | ) | ||||||||||
Net Realized and Unrealized Gains (Losses) on Investments | 2.15 | 6.10 | (3.72 | ) | (0.41 | ) | 1.28 | |||||||||||||
Total from Investment Operations | 1.85 | 5.85 | (3.94 | ) | (0.50 | ) | 1.27 | |||||||||||||
Less Distributions: | ||||||||||||||||||||
From Net Investment Income | — | — | — | — | (0.01 | ) | ||||||||||||||
From Net Realized Gains | (1.65 | ) | — | — | (0.04 | ) | — | |||||||||||||
Total Distributions | (1.65 | ) | — | — | (0.04 | ) | (0.01 | ) | ||||||||||||
Net Asset Value, End of Period | $ | 21.73 | $ | 21.53 | $ | 15.68 | $ | 19.62 | $ | 20.16 | ||||||||||
Ratios and Supplemental Data | ||||||||||||||||||||
Total Return(e) | +8.84 | % | +37.31 | % | –20.08 | % | –2.48 | % | +6.76 | % | ||||||||||
Net Assets, End of Period (In Millions) | $ | 26 | $ | 34 | $ | 23 | $ | 15 | $ | 0 | (f) | |||||||||
Ratio of Expenses to Average Net Assets before Expense Waivers and Offsets | 2.4 | % | 2.4 | % | 2.4 | % | 2.4 | % | 2.0 | %* | ||||||||||
Ratio of Expenses to Average Net Assets | 2.3 | % | 2.3 | % | 2.4 | % | 2.2 | % | 2.0 | %* | ||||||||||
Ratio of Net Investment Income (Loss) to Average Net Assets | (1.4 | )% | (1.4 | )% | (1.3 | )% | (1.1 | )% | (0.6 | )%* | ||||||||||
Portfolio Turnover Rate(g) | 41.6 | % | 41.8 | % | 64.9 | % | 89.3 | % | 95.4 | % | ||||||||||
STRONG ADVISOR COMMON STOCK FUND — CLASS Z
|
| |||||||||||||||||||
| Year Ended | ||||||||||||||||||||
| Dec. 31, 2004 | Dec. 31, 2003 | Dec. 31, 2002 | Dec. 31, 2001 | Dec. 31, 2000 | ||||||||||||||||
Selected Per-Share Data(a) | ||||||||||||||||||||
Net Asset Value, Beginning of Period | $ | 22.15 | $ | 15.97 | $ | 19.78 | $ | 20.16 | $ | 25.21 | ||||||||||
Income From Investment Operations: | ||||||||||||||||||||
Net Investment Income (Loss) | (0.08 | )(d) | (0.09 | ) | (0.05 | )(d) | (0.02 | ) | 0.04 | |||||||||||
Net Realized and Unrealized Gains (Losses) on Investments | 2.23 | 6.27 | (3.76 | ) | (0.32 | ) | (0.59 | ) | ||||||||||||
Total from Investment Operations | 2.15 | 6.18 | (3.81 | ) | (0.34 | ) | (0.55 | ) | ||||||||||||
Less Distributions: | ||||||||||||||||||||
From Net Investment Income | — | — | — | — | (0.04 | ) | ||||||||||||||
From Net Realized Gains | (1.65 | ) | — | — | (0.04 | ) | (4.46 | ) | ||||||||||||
Total Distributions | (1.65 | ) | — | — | (0.04 | ) | (4.50 | ) | ||||||||||||
Net Asset Value, End of Period | $ | 22.65 | $ | 22.15 | $ | 15.97 | $ | 19.78 | $ | 20.16 | ||||||||||
Ratios and Supplemental Data | ||||||||||||||||||||
Total Return(e) | +9.96 | % | +38.70 | % | –19.26 | % | –1.70 | % | –1.20 | % | ||||||||||
Net Assets, End of Period (In Millions) | $ | 1,162 | $ | 1,437 | $ | 1,363 | $ | 1,703 | $ | 1,719 | ||||||||||
Ratio of Expenses to Average Net Assets before Expense Waivers and Offsets | 1.3 | % | 1.4 | % | 1.3 | % | 1.3 | % | 1.2 | % | ||||||||||
Ratio of Expenses to Average Net Assets | 1.3 | % | 1.4 | % | 1.3 | % | 1.3 | % | 1.2 | % | ||||||||||
Ratio of Net Investment Income (Loss) to Average Net Assets | (0.4 | )% | (0.4 | )% | (0.3 | )% | (0.1 | )% | 0.2 | % | ||||||||||
Portfolio Turnover Rate(g) | 41.6 | % | 41.8 | % | 64.9 | % | 89.3 | % | 95.4 | % | ||||||||||
| * | Calculated on an annualized basis. |
| (a) | Information presented relates to a share of capital stock of the Fund outstanding for the entire period. |
| (b) | For the period from November 30, 2000 (commencement of class) to December 31, 2000. |
| (c) | Per share data reflects a 1.233 for 1.000 share split which occurred on March 8, 2001. |
| (d) | Net investment income (loss) per share represents net investment income (loss) divided by average shares outstanding throughout the year. |
| (e) | Total return assumes dividend reinvestment and does not reflect the effect of sales charges. |
| (f) | Amount is less than $500,000. |
| (g) | Calculated on the basis of the Fund as a whole without distinguishing between the classes of shares issued. |
See Notes to Financial Statements.
94
FINANCIAL HIGHLIGHTS (continued)
STRONG ADVISOR MID CAP GROWTH FUND — CLASS A
| Year Ended | ||||||||||||||||||||
| Dec. 31, 2004 | Dec. 31, 2003 | Dec. 31, 2002 | Dec. 31, 2001 | Dec. 31, 2000(b)(c) | ||||||||||||||||
Selected Per-Share Data(a) | ||||||||||||||||||||
Net Asset Value, Beginning of Period | $ | 11.72 | $ | 8.71 | $ | 13.95 | $ | 20.22 | $ | 17.71 | ||||||||||
Income From Investment Operations: | ||||||||||||||||||||
Net Investment Income (Loss) | (0.17 | )(d) | (0.13 | )(d) | (0.14 | )(d) | (0.22 | )(d) | (0.01 | ) | ||||||||||
Net Realized and Unrealized Gains (Losses) on Investments | 2.33 | 3.14 | (5.10 | ) | (6.05 | ) | 2.52 | |||||||||||||
Total from Investment Operations | 2.16 | 3.01 | (5.24 | ) | (6.27 | ) | 2.51 | |||||||||||||
Less Distributions: | ||||||||||||||||||||
From Net Realized Gains | — | — | — | (0.00 | )(e) | — | ||||||||||||||
Total Distributions | — | — | — | (0.00 | )(e) | — | ||||||||||||||
Net Asset Value, End of Period | $ | 13.88 | $ | 11.72 | $ | 8.71 | $ | 13.95 | $ | 20.22 | ||||||||||
Ratios and Supplemental Data | ||||||||||||||||||||
Total Return(f) | +18.43 | % | +34.56 | % | –37.56 | % | –30.98 | % | +14.16 | % | ||||||||||
Net Assets, End of Period (In Millions) | $ | 10 | $ | 10 | $ | 6 | $ | 7 | $ | 1 | ||||||||||
Ratio of Expenses to Average Net Assets before Expense Waivers and Offsets | 1.8 | % | 1.7 | % | 1.6 | % | 1.8 | % | 1.7 | %* | ||||||||||
Ratio of Expenses to Average Net Assets | 1.7 | % | 1.6 | % | 1.6 | % | 1.8 | % | 1.7 | %* | ||||||||||
Ratio of Net Investment Income (Loss) to Average Net Assets | (1.4 | )% | (1.3 | )% | (1.3 | )% | (1.4 | )% | (1.3 | )%* | ||||||||||
Portfolio Turnover Rate(g) | 192.3 | % | 249.6 | % | 526.6 | % | 650.0 | % | 683.7 | % | ||||||||||
STRONG ADVISOR MID CAP GROWTH FUND — CLASS B
| Year Ended | ||||||||||||||||||||
| Dec. 31, 2004 | Dec. 31, 2003 | Dec. 31, 2002 | Dec. 31, 2001 | Dec. 31, 2000(b)(c) | ||||||||||||||||
Selected Per-Share Data(a) | ||||||||||||||||||||
Net Asset Value, Beginning of Period | $ | 11.46 | $ | 8.59 | $ | 13.89 | $ | 20.21 | $ | 17.71 | ||||||||||
Income From Investment Operations: | ||||||||||||||||||||
Net Investment Income (Loss) | (0.24 | )(d) | (0.22 | )(d) | (0.23 | )(d) | (0.28 | )(d) | (0.02 | ) | ||||||||||
Net Realized and Unrealized Gains (Losses) on Investments | 2.27 | 3.09 | (5.07 | ) | (6.04 | ) | 2.52 | |||||||||||||
Total from Investment Operations | 2.03 | 2.87 | (5.30 | ) | (6.32 | ) | 2.50 | |||||||||||||
Less Distributions: | ||||||||||||||||||||
From Net Realized Gains | — | — | — | (0.00 | )(e) | — | ||||||||||||||
Total Distributions | — | — | — | (0.00 | )(e) | — | ||||||||||||||
Net Asset Value, End of Period | $ | 13.49 | $ | 11.46 | $ | 8.59 | $ | 13.89 | $ | 20.21 | ||||||||||
Ratios and Supplemental Data | ||||||||||||||||||||
Total Return(f) | +17.71 | % | +33.41 | % | –38.16 | % | –31.25 | % | +14.11 | % | ||||||||||
Net Assets, End of Period (In Millions) | $ | 3 | $ | 3 | $ | 2 | $ | 3 | $ | 0 | (h) | |||||||||
Ratio of Expenses to Average Net Assets before Expense Waivers and Offsets | 2.5 | % | 2.6 | % | 2.6 | % | 2.9 | % | 2.0 | %* | ||||||||||
Ratio of Expenses to Average Net Assets | 2.4 | % | 2.4 | % | 2.5 | % | 2.3 | % | 2.0 | %* | ||||||||||
Ratio of Net Investment Income (Loss) to Average Net Assets | (2.0 | )% | (2.1 | )% | (2.2 | )% | (1.9 | )% | (1.6 | )%* | ||||||||||
Portfolio Turnover Rate(g) | 192.3 | % | 249.6 | % | 526.6 | % | 650.0 | % | 683.7 | % | ||||||||||
| * | Calculated on an annualized basis. |
| (a) | Information presented relates to a share of capital stock of the Fund outstanding for the entire period. |
| (b) | For the period from November 30, 2000 (commencement of class) to December 31, 2000. |
| (c) | Per share data reflects a 1.053 for 1.000 share split which occurred on March 8, 2001. |
| (d) | Net investment income (loss) per share represents net investment income (loss) divided by average shares outstanding throughout the year. |
| (e) | Amount calculated is less than $0.005. |
| (f) | Total return assumes dividend reinvestment and does not reflect the effect of sales charges. |
| (g) | Calculated on the basis of the Fund as a whole without distinguishing between the classes of shares issued. |
| (h) | Amount is less than $500,000. |
See Notes to Financial Statements.
95
FINANCIAL HIGHLIGHTS (continued)
STRONG ADVISOR MID CAP GROWTH FUND — CLASS C
| Year Ended | ||||||||||||||||||||
| Dec. 31, 2004 | Dec. 31, 2003 | Dec. 31, 2002 | Dec. 31, 2001 | Dec. 31, 2000(b)(c) | ||||||||||||||||
Selected Per-Share Data(a) | ||||||||||||||||||||
Net Asset Value, Beginning of Period | $ | 11.46 | $ | 8.59 | $ | 13.88 | $ | 20.20 | $ | 17.71 | ||||||||||
Income From Investment Operations: | ||||||||||||||||||||
Net Investment Income (Loss) | (0.24 | )(d) | (0.21 | )(d) | (0.23 | )(d) | (0.28 | )(d) | (0.02 | ) | ||||||||||
Net Realized and Unrealized Gains (Losses) on Investments | 2.27 | 3.08 | (5.06 | ) | (6.04 | ) | 2.51 | |||||||||||||
Total from Investment Operations | 2.03 | 2.87 | (5.29 | ) | (6.32 | ) | 2.49 | |||||||||||||
Less Distributions: | ||||||||||||||||||||
From Net Realized Gains | — | — | — | (0.00 | )(e) | — | ||||||||||||||
Total Distributions | — | — | — | (0.00 | )(e) | — | ||||||||||||||
Net Asset Value, End of Period | $ | 13.49 | $ | 11.46 | $ | 8.59 | $ | 13.88 | $ | 20.20 | ||||||||||
Ratios and Supplemental Data | ||||||||||||||||||||
Total Return(f) | +17.71 | % | +33.41 | % | –38.11 | % | –31.27 | % | +14.06 | % | ||||||||||
Net Assets, End of Period (In Millions) | $ | 1 | $ | 1 | $ | 1 | $ | 1 | $ | 0 | (g) | |||||||||
Ratio of Expenses to Average Net Assets before Expense Waivers and Offsets | 2.4 | % | 2.6 | % | 2.5 | % | 2.8 | % | 2.0 | %* | ||||||||||
Ratio of Expenses to Average Net Assets | 2.4 | % | 2.4 | % | 2.4 | % | 2.3 | % | 2.0 | %* | ||||||||||
Ratio of Net Investment Income (Loss) to Average Net Assets | (2.0 | )% | (2.1 | )% | (2.2 | )% | (1.9 | )% | (1.6 | )%* | ||||||||||
Portfolio Turnover Rate(h) | 192.3 | % | 249.6 | % | 526.6 | % | 650.0 | % | 683.7 | % | ||||||||||
STRONG ADVISOR MID CAP GROWTH FUND — CLASS Z
| Year Ended | ||||||||||||||||||||
| Dec. 31, 2004 | Dec. 31, 2003 | Dec. 31, 2002 | Dec. 31, 2001 | Dec. 31, 2000 | ||||||||||||||||
Selected Per-Share Data(a) | ||||||||||||||||||||
Net Asset Value, Beginning of Period | $ | 11.68 | $ | 8.70 | $ | 13.97 | $ | 20.21 | $ | 23.25 | ||||||||||
Income From Investment Operations: | ||||||||||||||||||||
Net Investment Income (Loss) | (0.18 | )(d) | (0.14 | )(d) | (0.16 | )(d) | (0.19 | ) | (0.15 | ) | ||||||||||
Net Realized and Unrealized Gains (Losses) on Investments | 2.33 | 3.12 | (5.11 | ) | (6.05 | ) | (1.90 | ) | ||||||||||||
Total from Investment Operations | 2.15 | 2.98 | (5.27 | ) | (6.24 | ) | (2.05 | ) | ||||||||||||
Less Distributions: | ||||||||||||||||||||
From Net Realized Gains | — | — | — | (0.00 | )(e) | (0.99 | ) | |||||||||||||
Total Distributions | — | — | — | (0.00 | )(e) | (0.99 | ) | |||||||||||||
Net Asset Value, End of Period | $ | 13.83 | $ | 11.68 | $ | 8.70 | $ | 13.97 | $ | 20.21 | ||||||||||
Ratios and Supplemental Data | ||||||||||||||||||||
Total Return(f) | +18.41 | % | +34.25 | % | –37.72 | % | –30.86 | % | –8.47 | % | ||||||||||
Net Assets, End of Period (In Millions) | $ | 54 | $ | 58 | $ | 65 | $ | 128 | $ | 185 | ||||||||||
Ratio of Expenses to Average Net Assets before Expense Waivers and Offsets | 1.9 | % | 1.8 | % | 1.8 | % | 1.6 | % | 1.4 | % | ||||||||||
Ratio of Expenses to Average Net Assets | 1.8 | % | 1.7 | % | 1.8 | % | 1.6 | % | 1.3 | % | ||||||||||
Ratio of Net Investment Income (Loss) to Average Net Assets | (1.5 | )% | (1.4 | )% | (1.5 | )% | (1.2 | )% | (0.9 | )% | ||||||||||
Portfolio Turnover Rate(h) | 192.3 | % | 249.6 | % | 526.6 | % | 650.0 | % | 683.7 | % | ||||||||||
| * | Calculated on an annualized basis. |
| (a) | Information presented relates to a share of capital stock of the Fund outstanding for the entire period. |
| (b) | For the period from November 30, 2000 (commencement of class) to December 31, 2000. |
| (c) | Per share data reflects a 1.053 for 1.000 share split which occurred on March 8, 2001. |
| (d) | Net investment income (loss) per share represents net investment income (loss) divided by average shares outstanding throughout the year. |
| (e) | Amount calculated is less than $0.005. |
| (f) | Total return assumes dividend reinvestment and does not reflect the effect of sales charges. |
| (g) | Amount is less than $500,000. |
| (h) | Calculated on the basis of the Fund as a whole without distinguishing between the classes of shares issued. |
See Notes to Financial Statements.
96
FINANCIAL HIGHLIGHTS (continued)
STRONG ADVISOR SMALL CAP VALUE FUND — CLASS A
| Year Ended | ||||||||||||||||||||
| Dec. 31, 2004 | Dec. 31, 2003 | Dec. 31, 2002 | Dec. 31, 2001 | Dec. 31, 2000(b) | ||||||||||||||||
Selected Per-Share Data(a) | ||||||||||||||||||||
Net Asset Value, Beginning of Period | $ | 27.40 | $ | 18.92 | $ | 20.17 | $ | 17.17 | $ | 15.36 | ||||||||||
Income From Investment Operations: | ||||||||||||||||||||
Net Investment Income (Loss) | (0.27 | )(c) | (0.12 | )(c) | 0.03 | (c) | (0.14 | )(c) | (0.00 | )(d) | ||||||||||
Net Realized and Unrealized Gains (Losses) on Investments | 5.51 | 9.26 | (1.28 | ) | 3.18 | 1.81 | ||||||||||||||
Total from Investment Operations | 5.24 | 9.14 | (1.25 | ) | 3.04 | 1.81 | ||||||||||||||
Less Distributions: | ||||||||||||||||||||
From Net Investment Income | — | (0.01 | ) | — | — | — | ||||||||||||||
From Net Realized Gains | (3.45 | ) | (0.65 | ) | — | (0.04 | ) | — | ||||||||||||
Total Distributions | (3.45 | ) | (0.66 | ) | — | (0.04 | ) | — | ||||||||||||
Net Asset Value, End of Period | $ | 29.19 | $ | 27.40 | $ | 18.92 | $ | 20.17 | $ | 17.17 | ||||||||||
Ratios and Supplemental Data | ||||||||||||||||||||
Total Return(e) | +19.89 | % | +48.49 | % | –6.20 | % | +17.70 | % | +11.78 | % | ||||||||||
Net Assets, End of Period (In Millions) | $ | 598 | $ | 674 | $ | 335 | $ | 169 | $ | 1 | ||||||||||
Ratio of Expenses to Average Net Assets before Expense Waivers and Offsets | 1.6 | % | 1.6 | % | 1.6 | % | 1.6 | % | 1.6 | %* | ||||||||||
Ratio of Expenses to Average Net Assets | 1.5 | % | 1.5 | % | 1.6 | % | 1.6 | % | 1.6 | %* | ||||||||||
Ratio of Net Investment Income (Loss) to Average Net Assets | (1.0 | )% | (0.5 | )% | 0.1 | % | (0.7 | )% | (0.8 | )%* | ||||||||||
Portfolio Turnover Rate(f) | 34.2 | % | 30.2 | % | 28.2 | % | 42.0 | % | 60.3 | % | ||||||||||
STRONG ADVISOR SMALL CAP VALUE FUND — CLASS B
| Year Ended | ||||||||||||||||||||
| Dec. 31, 2004 | Dec. 31, 2003 | Dec. 31, 2002 | Dec. 31, 2001 | Dec. 31, 2000(b) | ||||||||||||||||
Selected Per-Share Data(a) | ||||||||||||||||||||
Net Asset Value, Beginning of Period | $ | 26.79 | $ | 18.66 | $ | 20.05 | $ | 17.16 | $ | 15.36 | ||||||||||
Income From Investment Operations: | ||||||||||||||||||||
Net Investment Income (Loss) | (0.47 | )(c) | (0.29 | )(c) | (0.14 | )(c) | (0.25 | )(c) | (0.01 | ) | ||||||||||
Net Realized and Unrealized Gains (Losses) on Investments | 5.34 | 9.08 | (1.25 | ) | 3.18 | 1.81 | ||||||||||||||
Total from Investment Operations | 4.87 | 8.79 | (1.39 | ) | 2.93 | 1.80 | ||||||||||||||
Less Distributions: | ||||||||||||||||||||
From Net Investment Income | — | (0.01 | ) | — | — | — | ||||||||||||||
From Net Realized Gains | (3.45 | ) | (0.65 | ) | — | (0.04 | ) | — | ||||||||||||
Total Distributions | (3.45 | ) | (0.66 | ) | — | (0.04 | ) | — | ||||||||||||
Net Asset Value, End of Period | $ | 28.21 | $ | 26.79 | $ | 18.66 | $ | 20.05 | $ | 17.16 | ||||||||||
Ratios and Supplemental Data | ||||||||||||||||||||
Total Return(e) | +18.95 | % | +47.28 | % | –6.93 | % | +17.07 | % | +11.72 | % | ||||||||||
Net Assets, End of Period (In Millions) | $ | 137 | $ | 126 | $ | 76 | $ | 40 | $ | 0 | (g) | |||||||||
Ratio of Expenses to Average Net Assets before Expense Waivers and Offsets | 2.3 | % | 2.4 | % | 2.4 | % | 2.5 | % | 2.0 | %* | ||||||||||
Ratio of Expenses to Average Net Assets | 2.3 | % | 2.4 | % | 2.4 | % | 2.3 | % | 1.8 | %* | ||||||||||
Ratio of Net Investment Income (Loss) to Average Net Assets | (1.7 | )% | (1.4 | )% | (0.7 | )% | (1.4 | )% | (0.8 | )%* | ||||||||||
Portfolio Turnover Rate(f) | 34.2 | % | 30.2 | % | 28.2 | % | 42.0 | % | 60.3 | % | ||||||||||
| * | Calculated on an annualized basis. |
| (a) | Information presented relates to a share of capital stock of the Fund outstanding for the entire period. |
| (b) | For the period from November 30, 2000 (commencement of class) to December 31, 2000. |
| (c) | Net investment income (loss) per share represents net investment income (loss) divided by average shares outstanding throughout the year. |
| (d) | Amount calculated is less than $0.005. |
| (e) | Total return assumes dividend reinvestment and does not reflect the effect of sales charges. |
| (f) | Calculated on the basis of the Fund as a whole without distinguishing between the classes of shares issued. |
| (g) | Amount is less than $500,000. |
See Notes to Financial Statements.
97
FINANCIAL HIGHLIGHTS (continued)
STRONG ADVISOR SMALL CAP VALUE FUND — CLASS C
| Year Ended | ||||||||||||||||||||
| Dec. 31, 2004 | Dec. 31, 2003 | Dec. 31, 2002 | Dec. 31, 2001 | Dec. 31, 2000(b) | ||||||||||||||||
Selected Per-Share Data(a) | ||||||||||||||||||||
Net Asset Value, Beginning of Period | $ | 26.83 | $ | 18.68 | $ | 20.07 | $ | 17.17 | $ | 15.36 | ||||||||||
Income From Investment Operations: | ||||||||||||||||||||
Net Investment Income (Loss) | (0.47 | )(c) | (0.28 | )(c) | (0.13 | )(c) | (0.24 | )(c) | (0.01 | ) | ||||||||||
Net Realized and Unrealized Gains (Losses) on Investments | 5.36 | 9.09 | (1.26 | ) | 3.18 | 1.82 | ||||||||||||||
Total from Investment Operations | 4.89 | 8.81 | (1.39 | ) | 2.94 | 1.81 | ||||||||||||||
Less Distributions: | ||||||||||||||||||||
From Net Investment Income | — | (0.01 | ) | — | — | — | ||||||||||||||
From Net Realized Gains | (3.45 | ) | (0.65 | ) | — | (0.04 | ) | — | ||||||||||||
Total Distributions | (3.45 | ) | (0.66 | ) | — | (0.04 | ) | — | ||||||||||||
Net Asset Value, End of Period | $ | 28.27 | $ | 26.83 | $ | 18.68 | $ | 20.07 | $ | 17.17 | ||||||||||
Ratios and Supplemental Data | ||||||||||||||||||||
Total Return(d) | +19.00 | % | +47.34 | % | –6.93 | % | +17.12 | % | +11.78 | % | ||||||||||
Net Assets, End of Period (In Millions) | $ | 157 | $ | 159 | $ | 98 | $ | 38 | $ | 0 | (e) | |||||||||
Ratio of Expenses to Average Net Assets before Expense Waivers and Offsets | 2.3 | % | 2.3 | % | 2.4 | % | 2.4 | % | 2.0 | %* | ||||||||||
Ratio of Expenses to Average Net Assets | 2.3 | % | 2.3 | % | 2.4 | % | 2.2 | % | 1.8 | %* | ||||||||||
Ratio of Net Investment Income (Loss) to Average Net Assets | (1.7 | )% | (1.3 | )% | (0.6 | )% | (1.4 | )% | (0.7 | )%* | ||||||||||
Portfolio Turnover Rate(f) | 34.2 | % | 30.2 | % | 28.2 | % | 42.0 | % | 60.3 | % | ||||||||||
STRONG ADVISOR SMALL CAP VALUE FUND — CLASS Z
| Year Ended | ||||||||||||||||||||
| Dec. 31, 2004 | Dec. 31, 2003 | Dec. 31, 2002 | Dec. 31, 2001 | Dec. 31, 2000 | ||||||||||||||||
Selected Per-Share Data(a) | ||||||||||||||||||||
Net Asset Value, Beginning of Period | $ | 27.53 | $ | 18.98 | $ | 20.22 | $ | 17.17 | $ | 13.59 | ||||||||||
Income From Investment Operations: | ||||||||||||||||||||
Net Investment Income (Loss) | (0.22 | )(c) | (0.09 | )(c) | 0.04 | (c) | (0.08 | ) | 0.00 | (g) | ||||||||||
Net Realized and Unrealized Gains (Losses) on Investments | 5.54 | 9.30 | (1.28 | ) | 3.17 | 3.58 | ||||||||||||||
Total from Investment Operations | 5.32 | 9.21 | (1.24 | ) | 3.09 | 3.58 | ||||||||||||||
Less Distributions: | ||||||||||||||||||||
From Net Investment Income | — | (0.01 | ) | — | — | — | ||||||||||||||
From Net Realized Gains | (3.45 | ) | (0.65 | ) | — | (0.04 | ) | — | ||||||||||||
Total Distributions | (3.45 | ) | (0.66 | ) | — | (0.04 | ) | — | ||||||||||||
Net Asset Value, End of Period | $ | 29.40 | $ | 27.53 | $ | 18.98 | $ | 20.22 | $ | 17.17 | ||||||||||
Ratios and Supplemental Data | ||||||||||||||||||||
Total Return(d) | +20.09 | % | +48.70 | % | –6.13 | % | +17.99 | % | +26.34 | % | ||||||||||
Net Assets, End of Period (In Millions) | $ | 1,359 | $ | 1,167 | $ | 659 | $ | 541 | $ | 249 | ||||||||||
Ratio of Expenses to Average Net Assets before Expense Waivers and Offsets | 1.4 | % | 1.4 | % | 1.5 | % | 1.4 | % | 1.4 | % | ||||||||||
Ratio of Expenses to Average Net Assets | 1.4 | % | 1.4 | % | 1.5 | % | 1.4 | % | 1.4 | % | ||||||||||
Ratio of Net Investment Income (Loss) to Average Net Assets | (0.8 | )% | (0.4 | )% | 0.2 | % | (0.5 | )% | 0.0 | %(g) | ||||||||||
Portfolio Turnover Rate(f) | 34.2 | % | 30.2 | % | 28.2 | % | 42.0 | % | 60.3 | % | ||||||||||
| * | Calculated on an annualized basis. |
| (a) | Information presented relates to a share of capital stock of the Fund outstanding for the entire period. |
| (b) | For the period from November 30, 2000 (commencement of class) to December 31, 2000. |
| (c) | Net investment income (loss) per share represents net investment income (loss) divided by average shares outstanding throughout the year. |
| (d) | Total return assumes dividend reinvestment and does not reflect the effect of sales charges. |
| (e) | Amount is less than $500,000. |
| (f) | Calculated on the basis of the Fund as a whole without distinguishing between the classes of shares issued. |
| (g) | Amount calculated is less than $0.005 or 0.05%. |
See Notes to Financial Statements.
98
FINANCIAL HIGHLIGHTS (continued)
STRONG ADVISOR U.S. VALUE FUND — CLASS A
| Year Ended | ||||||||||||||||||||
| Dec. 31, 2004 | Dec. 31, 2003 | Dec. 31, 2002 | Dec. 31, 2001 | Dec. 31, 2000(b)(c) | ||||||||||||||||
Selected Per-Share Data(a) | ||||||||||||||||||||
Net Asset Value, Beginning of Period | $ | 17.65 | $ | 13.66 | $ | 17.83 | $ | 20.65 | $ | 19.99 | ||||||||||
Income From Investment Operations: | ||||||||||||||||||||
Net Investment Income (Loss) | 0.20 | 0.14 | 0.12 | (d) | 0.05 | 0.00 | (e) | |||||||||||||
Net Realized and Unrealized Gains (Losses) on Investments | 2.22 | 4.00 | (2.77 | ) | (2.56 | ) | 0.68 | |||||||||||||
Total from Investment Operations | 2.42 | 4.14 | (2.65 | ) | (2.51 | ) | 0.68 | |||||||||||||
Less Distributions: | ||||||||||||||||||||
From Net Investment Income | (0.18 | ) | (0.15 | ) | (0.16 | ) | (0.06 | ) | (0.02 | ) | ||||||||||
From Net Realized Gains | (1.34 | ) | — | (1.36 | ) | (0.25 | ) | — | ||||||||||||
Total Distributions | (1.52 | ) | (0.15 | ) | (1.52 | ) | (0.31 | ) | (0.02 | ) | ||||||||||
Net Asset Value, End of Period | $ | 18.55 | $ | 17.65 | $ | 13.66 | $ | 17.83 | $ | 20.65 | ||||||||||
Ratios and Supplemental Data | ||||||||||||||||||||
Total Return(f) | +14.08 | % | +30.48 | % | –16.34 | % | –12.17 | % | +3.45 | % | ||||||||||
Net Assets, End of Period (In Millions) | $ | 5 | $ | 5 | $ | 3 | $ | 3 | $ | 0 | (g) | |||||||||
Ratio of Expenses to Average Net Assets before Expense Waivers and Offsets | 1.4 | % | 1.4 | % | 1.3 | % | 1.8 | % | 1.3 | %* | ||||||||||
Ratio of Expenses to Average Net Assets | 1.4 | % | 1.4 | % | 1.3 | % | 1.8 | % | 1.3 | %* | ||||||||||
Ratio of Net Investment Income (Loss) to Average Net Assets | 1.1 | % | 1.0 | % | 0.9 | % | 0.1 | % | 0.1 | %* | ||||||||||
Portfolio Turnover Rate(h) | 46.9 | % | 53.4 | % | 89.8 | % | 116.1 | % | 14.4 | % | ||||||||||
STRONG ADVISOR U.S. VALUE FUND—CLASS B
| Year Ended | ||||||||||||||||||||
| Dec. 31, 2004 | Dec. 31, 2003 | Dec. 31, 2002 | Dec. 31, 2001 | Dec. 31, 2000(b)(c) | ||||||||||||||||
Selected Per-Share Data(a) | ||||||||||||||||||||
Net Asset Value, Beginning of Period | $ | 17.64 | $ | 13.67 | $ | 17.81 | $ | 20.66 | $ | 19.99 | ||||||||||
Income From Investment Operations: | ||||||||||||||||||||
Net Investment Income (Loss) | 0.07 | 0.03 | 0.02 | (d) | (0.00 | )(e) | (0.01 | ) | ||||||||||||
Net Realized and Unrealized Gains (Losses) on Investments | 2.21 | 3.98 | (2.78 | ) | (2.60 | ) | 0.69 | |||||||||||||
Total from Investment Operations | 2.28 | 4.01 | (2.76 | ) | (2.60 | ) | 0.68 | |||||||||||||
Less Distributions: | ||||||||||||||||||||
From Net Investment Income | (0.06 | ) | (0.04 | ) | (0.02 | ) | — | (0.01 | ) | |||||||||||
From Net Realized Gains | (1.34 | ) | — | (1.36 | ) | (0.25 | ) | — | ||||||||||||
Total Distributions | (1.40 | ) | (0.04 | ) | (1.38 | ) | (0.25 | ) | (0.01 | ) | ||||||||||
Net Asset Value, End of Period | $ | 18.52 | $ | 17.64 | $ | 13.67 | $ | 17.81 | $ | 20.66 | ||||||||||
Ratios and Supplemental Data | ||||||||||||||||||||
Total Return(f) | +13.20 | % | +29.37 | % | –17.01 | % | –12.60 | % | +3.43 | % | ||||||||||
Net Assets, End of Period (In Millions) | $ | 6 | $ | 5 | $ | 3 | $ | 2 | $ | 0 | (g) | |||||||||
Ratio of Expenses to Average Net Assets before Expense Waivers and Offsets | 2.2 | % | 2.2 | % | 2.2 | % | 2.9 | % | 2.0 | %* | ||||||||||
Ratio of Expenses to Average Net Assets | 2.1 | % | 2.2 | % | 2.1 | % | 2.3 | % | 2.0 | %* | ||||||||||
Ratio of Net Investment Income (Loss) to Average Net Assets | 0.4 | % | 0.2 | % | 0.1 | % | (0.4 | %) | (0.5 | %)* | ||||||||||
Portfolio Turnover Rate(h) | 46.9 | % | 53.4 | % | 89.8 | % | 116.1 | % | 14.4 | % | ||||||||||
| * | Calculated on an annualized basis. |
| (a) | Information presented relates to a share of capital stock of the Fund outstanding for the entire period. |
| (b) | For the period from November 30, 2000 (commencement of class) to December 31, 2000. |
| (c) | Per share data reflects a 1.023 for 1.000 share split which occurred on March 8, 2001. |
| (d) | Net investment income (loss) per share represents net investment income (loss) divided by average shares outstanding throughout the year. |
| (e) | Amount calculated is less than $0.005. |
| (f) | Total return assumes dividend reinvestment and does not reflect the effect of sales charges. |
| (g) | Amount is less than $500,000. |
| (h) | Calculated on the basis of the Fund as a whole without distinguishing between the classes of shares issued. |
See Notes to Financial Statements.
99
FINANCIAL HIGHLIGHTS (continued)
STRONG ADVISOR U.S. VALUE FUND — CLASS C
| Year Ended | ||||||||||||||||||||
| Dec. 31, 2004 | Dec. 31, 2003 | Dec. 31, 2002 | Dec. 31, 2001 | Dec. 31, 2000(b)(c) | ||||||||||||||||
Selected Per-Share Data(a) | ||||||||||||||||||||
Net Asset Value, Beginning of Period | $ | 17.56 | $ | 13.61 | $ | 17.82 | $ | 20.66 | $ | 19.99 | ||||||||||
Income From Investment Operations: | ||||||||||||||||||||
Net Investment Income (Loss) | 0.06 | 0.03 | 0.02 | (d) | (0.00 | )(e) | (0.01 | ) | ||||||||||||
Net Realized and Unrealized Gains (Losses) on Investments | 2.20 | 3.97 | (2.78 | ) | (2.59 | ) | 0.69 | |||||||||||||
Total from Investment Operations | 2.26 | 4.00 | (2.76 | ) | (2.59 | ) | 0.68 | |||||||||||||
Less Distributions: | ||||||||||||||||||||
From Net Investment Income | (0.04 | ) | (0.05 | ) | (0.09 | ) | — | (0.01 | ) | |||||||||||
From Net Realized Gains | (1.34 | ) | — | (1.36 | ) | (0.25 | ) | — | ||||||||||||
Total Distributions | (1.38 | ) | (0.05 | ) | (1.45 | ) | (0.25 | ) | (0.01 | ) | ||||||||||
Net Asset Value, End of Period | $ | 18.44 | $ | 17.56 | $ | 13.61 | $ | 17.82 | $ | 20.66 | ||||||||||
Ratios and Supplemental Data | ||||||||||||||||||||
Total Return(f) | +13.15 | % | +29.42 | % | –17.05 | % | –12.55 | % | +3.42 | % | ||||||||||
Net Assets, End of Period (In Millions) | $ | 4 | $ | 4 | $ | 1 | $ | 1 | $ | 0 | (g) | |||||||||
Ratio of Expenses to Average Net Assets before Expense Waivers and Offsets | 2.2 | % | 2.2 | % | 2.2 | % | 2.4 | % | 2.0 | %* | ||||||||||
Ratio of Expenses to Average Net Assets | 2.2 | % | 2.2 | % | 2.2 | % | 2.2 | % | 2.0 | %* | ||||||||||
Ratio of Net Investment Income (Loss) to Average Net Assets | 0.3 | % | 0.2 | % | 0.2 | % | (0.3 | )% | (0.5 | )%* | ||||||||||
Portfolio Turnover Rate(h) | 46.9 | % | 53.4 | % | 89.8 | % | 116.1 | % | 14.4 | % | ||||||||||
STRONG ADVISOR U.S. VALUE FUND — CLASS K
| Year Ended | ||||||||||||
| Dec. 31, 2004 | Dec. 31, 2003 | Dec. 31, 2002 | ||||||||||
Selected Per-Share Data(a) | ||||||||||||
Net Asset Value, Beginning of Period | $ | 17.52 | $ | 13.56 | $ | 17.82 | ||||||
Income From Investment Operations: | ||||||||||||
Net Investment Income (Loss) | 0.27 | 0.16 | 0.22 | (d) | ||||||||
Net Realized and Unrealized Gains (Losses) on Investments | 2.21 | 4.02 | (2.81 | ) | ||||||||
Total from Investment Operations | 2.48 | 4.18 | (2.59 | ) | ||||||||
Less Distributions: | ||||||||||||
From Net Investment Income | (0.26 | ) | (0.22 | ) | (0.36 | ) | ||||||
From Net Realized Gains | (1.34 | ) | — | (1.36 | ) | |||||||
Total Distributions | (1.60 | ) | (0.22 | ) | (1.72 | ) | ||||||
Net Asset Value, End of Period | $ | 18.40 | $ | 17.52 | $ | 13.56 | ||||||
Ratios and Supplemental Data | ||||||||||||
Total Return(f) | +14.53 | % | +31.03 | % | –15.98 | % | ||||||
Net Assets, End of Period (In Millions) | $ | 92 | $ | 87 | $ | 11 | ||||||
Ratio of Expenses to Average Net Assets before Expense Waivers and Offsets | 1.1 | % | 1.1 | % | 1.1 | % | ||||||
Ratio of Expenses to Average Net Assets | 1.0 | % | 1.0 | % | 1.0 | % | ||||||
Ratio of Net Investment Income (Loss) to Average Net Assets | 1.5 | % | 1.3 | % | 1.6 | % | ||||||
Portfolio Turnover Rate(h) | 46.9 | % | 53.4 | % | 89.8 | % | ||||||
| * | Calculated on an annualized basis. |
| (a) | Information presented relates to a share of capital stock of the Fund outstanding for the entire period. |
| (b) | For the period from November 30, 2000 (commencement of class) to December 31, 2000. |
| (c) | Per share data reflects a 1.023 for 1.000 share split which occurred on March 8, 2001. |
| (d) | Net investment income (loss) per share represents new investment income (loss) divided by average shares outstanding throughout the year. |
| (e) | Amount calculated is less than $0.005. |
| (f) | Total return assumes dividend reinvestment and does not reflect the effect of sales charges. |
| (g) | Amount is less than $500,000. |
| (h) | Calculated on the basis of the Fund as a whole without distinguishing between the classes of shares issued. |
See Notes to Financial Statements.
100
FINANCIAL HIGHLIGHTS (continued)
STRONG ADVISOR U.S. VALUE FUND — CLASS Z
| Year Ended | ||||||||||||||||||||||||
| Dec. 31, 2004 | Dec. 31, 2003 | Dec. 31, 2002 | Dec. 31, 2001 | Dec. 31, 2000(b) | Oct. 31, 2000 | |||||||||||||||||||
Selected Per-Share Data(a) | ||||||||||||||||||||||||
Net Asset Value, Beginning of Period | $ | 17.77 | $ | 13.74 | $ | 17.87 | $ | 20.65 | $ | 21.63 | $ | 20.58 | ||||||||||||
Income From Investment Operations: | ||||||||||||||||||||||||
Net Investment Income (Loss) | 0.20 | 0.15 | 0.05 | (c) | 0.11 | 0.03 | 0.05 | |||||||||||||||||
Net Realized and Unrealized Gains (Losses) on Investments | 2.24 | 3.99 | (2.79 | ) | (2.53 | ) | (0.52 | ) | 1.53 | |||||||||||||||
Total from Investment Operations | 2.44 | 4.14 | (2.74 | ) | (2.42 | ) | (0.49 | ) | 1.58 | |||||||||||||||
Less Distributions: | ||||||||||||||||||||||||
From Net Investment Income | (0.19 | ) | (0.11 | ) | (0.03 | ) | (0.11 | ) | (0.03 | ) | (0.05 | ) | ||||||||||||
From Net Realized Gains | (1.34 | ) | — | (1.36 | ) | (0.25 | ) | (0.46 | ) | (0.48 | ) | |||||||||||||
Total Distributions | (1.53 | ) | (0.11 | ) | (1.39 | ) | (0.36 | ) | (0.49 | ) | (0.53 | ) | ||||||||||||
Net Asset Value, End of Period | $ | 18.68 | $ | 17.77 | $ | 13.74 | $ | 17.87 | $ | 20.65 | $ | 21.63 | ||||||||||||
Ratios and Supplemental Data | ||||||||||||||||||||||||
Total Return(d) | +14.11 | % | +30.23 | % | –16.86 | % | –11.72 | % | –2.17 | % | +7.72 | % | ||||||||||||
Net Assets, End of Period (In Millions) | $ | 252 | $ | 159 | $ | 197 | $ | 186 | $ | 251 | $ | 252 | ||||||||||||
Ratio of Expenses to Average Net Assets before Expense Waivers and Offsets | 1.4 | % | 1.6 | % | 1.9 | % | 1.2 | % | 1.1 | %* | 1.0 | % | ||||||||||||
Ratio of Expenses to Average Net Assets | 1.3 | % | 1.6 | % | 1.9 | % | 1.2 | % | 1.1 | %* | 1.0 | % | ||||||||||||
Ratio of Net Investment Income (Loss) to Average Net Assets | 1.2 | % | 0.8 | % | 0.3 | % | 0.6 | % | 0.8 | %* | 0.3 | % | ||||||||||||
Portfolio Turnover Rate(e) | 46.9 | % | 53.4 | % | 89.8 | % | 116.1 | % | 14.4 | % | 46.5 | % | ||||||||||||
STRONG ADVISOR ENDEAVOR LARGE CAP FUND — CLASS A
| Year Ended | ||||||||||||||||
| Dec. 31, 2004 | Dec. 31, 2003 | Dec. 31, 2002 | Dec. 31, 2001(f) | |||||||||||||
Selected Per-Share Data(a) | ||||||||||||||||
Net Asset Value, Beginning of Period | $ | 10.08 | $ | 7.55 | $ | 10.59 | $ | 10.00 | ||||||||
Income From Investment Operations: | ||||||||||||||||
Net Investment Income (Loss) | (0.10 | ) | (0.07 | )(c) | (0.10 | )(c) | (0.01 | ) | ||||||||
Net Realized and Unrealized Gains (Losses) on Investments | 1.65 | 2.60 | (2.94 | ) | 0.86 | (g) | ||||||||||
Total from Investment Operations | 1.55 | 2.53 | (3.04 | ) | 0.85 | |||||||||||
Less Distributions: | ||||||||||||||||
From Net Investment Income | — | — | — | — | ||||||||||||
From Net Realized Gains | — | — | — | (0.26 | ) | |||||||||||
Total Distributions | — | — | — | (0.26 | ) | |||||||||||
Net Asset Value, End of Period | $ | 11.63 | $ | 10.08 | $ | 7.55 | $ | 10.59 | ||||||||
Ratios and Supplemental Data | ||||||||||||||||
Total Return(d) | +15.38 | % | +33.51 | % | –28.71 | % | +8.45 | % | ||||||||
Net Assets, End of Period (In Millions) | $ | 43 | $ | 37 | $ | 28 | $ | 28 | ||||||||
Ratio of Expenses to Average Net Assets before Expense Waivers and Offsets | 1.7 | % | 1.7 | % | 2.0 | % | 2.4 | %* | ||||||||
Ratio of Expenses to Average Net Assets | 1.7 | % | 1.6 | % | 2.0 | % | 2.4 | %* | ||||||||
Ratio of Net Investment Income (Loss) to Average Net Assets | (0.9 | )% | (0.9 | )% | (1.2 | )% | (1.1 | )%* | ||||||||
Portfolio Turnover Rate(e) | 168.3 | % | 234.1 | % | 420.4 | % | 54.0 | % | ||||||||
| * | Calculated on an annualized basis. |
| (a) | Information presented relates to a share of capital stock of the Fund outstanding for the entire period. |
| (b) | In 2000, the Fund changed its fiscal year-end from October to December. |
| (c) | Net investment income (loss) per share represents net investment income (loss) divided by average shares outstanding throughout the year. |
| (d) | Total return assumes dividend reinvestment and does not reflect the effect of sales charges. |
| (e) | Calculated on the basis of the Fund as a whole without distinguishing between the classes of shares issued. |
| (f) | For the period from September 28, 2001 (commencement of class) to December 31, 2001. |
| (g) | The amount shown may not correlate with the aggregate gains and losses of portfolio securities due to the timing of subscriptions and redemptions of fund shares. |
See Notes to Financial Statements.
101
FINANCIAL HIGHLIGHTS (continued)
STRONG ADVISOR ENDEAVOR LARGE CAP FUND — CLASS B
| Year Ended | ||||||||||||||||
| Dec. 31, 2004 | Dec. 31, 2003 | Dec. 31, 2002 | Dec. 31, 2001(b) | |||||||||||||
Selected Per-Share Data(a) | ||||||||||||||||
Net Asset Value, Beginning of Period | $ | 9.97 | $ | 7.51 | $ | 10.57 | $ | 10.00 | ||||||||
Income From Investment Operations: | ||||||||||||||||
Net Investment Income (Loss) | (0.17 | ) | (0.12 | )(c) | (0.12 | )(c) | (0.04 | ) | ||||||||
Net Realized and Unrealized Gains (Losses) on Investments | 1.61 | 2.58 | (2.94 | ) | 0.87 | (d) | ||||||||||
Total from Investment Operations | 1.44 | 2.46 | (3.06 | ) | 0.83 | |||||||||||
Less Distributions: | ||||||||||||||||
From Net Investment Income | — | — | — | — | ||||||||||||
From Net Realized Gains | — | — | — | (0.26 | ) | |||||||||||
Total Distributions | — | — | — | (0.26 | ) | |||||||||||
Net Asset Value, End of Period | $ | 11.41 | $ | 9.97 | $ | 7.51 | $ | 10.57 | ||||||||
Ratios and Supplemental Data | ||||||||||||||||
Total Return(e) | +14.44 | % | +32.76 | % | –28.95 | % | +8.25 | % | ||||||||
Net Assets, End of Period (In Millions) | $ | 1 | $ | 1 | $ | 0 | (f) | $ | 0 | (f) | ||||||
Ratio of Expenses to Average Net Assets before Expense Waivers and Offsets | 2.5 | % | 2.5 | % | 4.7 | % | 2.7 | %* | ||||||||
Ratio of Expenses to Average Net Assets | 2.4 | % | 2.1 | % | 2.2 | % | 2.6 | %* | ||||||||
Ratio of Net Investment Income (Loss) to Average Net Assets | (1.7 | )% | (1.3 | )% | (1.4 | )% | (1.6 | )%* | ||||||||
Portfolio Turnover Rate(g) | 168.3 | % | 234.1 | % | 420.4 | % | 54.0 | % | ||||||||
STRONG ADVISOR ENDEAVOR LARGE CAP FUND — CLASS C
| Year Ended | ||||||||||||||||
| Dec. 31, 2004 | Dec. 31, 2003 | Dec. 31, 2002 | Dec. 31, 2001(b) | |||||||||||||
Selected Per-Share Data(a) | ||||||||||||||||
Net Asset Value, Beginning of Period | $ | 9.97 | $ | 7.51 | $ | 10.57 | $ | 10.00 | ||||||||
Income From Investment Operations: | ||||||||||||||||
Net Investment Income (Loss) | (0.18 | ) | (0.12 | )(c) | (0.13 | )(c) | (0.04 | ) | ||||||||
Net Realized and Unrealized Gains (Losses) on Investments | 1.62 | 2.58 | (2.93 | ) | 0.87 | (d) | ||||||||||
Total from Investment Operations | 1.44 | 2.46 | (3.06 | ) | 0.83 | |||||||||||
Less Distributions: | ||||||||||||||||
From Net Investment Income | — | — | — | — | ||||||||||||
From Net Realized Gains | — | — | — | (0.26 | ) | |||||||||||
Total Distributions | — | — | — | (0.26 | ) | |||||||||||
Net Asset Value, End of Period | $ | 11.41 | $ | 9.97 | $ | 7.51 | $ | 10.57 | ||||||||
Ratios and Supplemental Data | ||||||||||||||||
Total Return(e) | +14.44 | % | +32.76 | % | –28.95 | % | +8.25 | % | ||||||||
Net Assets, End of Period (In Millions) | $ | 0 | (f) | $ | 0 | (f) | $ | 0 | (f) | $ | 0 | (f) | ||||
Ratio of Expenses to Average Net Assets before Expense Waivers and Offsets | 2.6 | % | 2.6 | % | 4.2 | % | 2.7 | %* | ||||||||
Ratio of Expenses to Average Net Assets | 2.5 | % | 2.1 | % | 2.3 | % | 2.6 | %* | ||||||||
Ratio of Net Investment Income (Loss) to Average Net Assets | (1.7 | )% | (1.4 | )% | (1.5 | )% | (1.6 | )%* | ||||||||
Portfolio Turnover Rate(g) | 168.3 | % | 234.1 | % | 420.4 | % | 54.0 | % | ||||||||
| * | Calculated on an annualized basis. |
| (a) | Information presented relates to a share of capital stock of the Fund outstanding for the entire period. |
| (b) | For the period from September 28, 2001 (commencement of class) to December 31, 2001. |
| (c) | Net investment income (loss) per share represents net investment income (loss) divided by average shares outstanding throughout the year. |
| (d) | The amount shown may not correlate with the aggregate gains and losses of portfolio securities due to the timing of subscriptions and redemptions of fund shares. |
| (e) | Total return assumes dividend reinvestment and does not reflect the effect of sales charges. |
| (f) | Amount is less than $500,000. |
| (g) | Calculated on the basis of the Fund as a whole without distinguishing between the classes of shares issued. |
See Notes to Financial Statements.
102
FINANCIAL HIGHLIGHTS (continued)
STRONG ADVISOR FOCUS FUND — CLASS A
| Year Ended | ||||||||||||||||||||
| Dec. 31, 2004 | Dec. 31, 2003 | Dec. 31, 2002 | Dec. 31, 2001 | Dec. 31, 2000(b) | ||||||||||||||||
Selected Per-Share Data(a) | ||||||||||||||||||||
Net Asset Value, Beginning of Period | $ | 5.99 | $ | 4.79 | $ | 6.62 | $ | 10.26 | $ | 10.00 | ||||||||||
Income From Investment Operations: | ||||||||||||||||||||
Net Investment Income (Loss) | (0.12 | )(c) | (0.05 | )(c) | (0.10 | )(c) | (0.07 | ) | (0.01 | ) | ||||||||||
Net Realized and Unrealized Gains (Losses) on Investments | 1.20 | 1.25 | (1.73 | ) | (3.57 | ) | 0.27 | |||||||||||||
Total from Investment Operations | 1.08 | 1.20 | (1.83 | ) | (3.64 | ) | 0.26 | |||||||||||||
Less Distributions: | ||||||||||||||||||||
From Net Investment Income | — | — | — | — | — | |||||||||||||||
Total Distributions | — | — | — | — | — | |||||||||||||||
Net Asset Value, End of Period | $ | 7.07 | $ | 5.99 | $ | 4.79 | $ | 6.62 | $ | 10.26 | ||||||||||
Ratios and Supplemental Data | ||||||||||||||||||||
Total Return(d) | +18.03 | % | +25.05 | % | –27.64 | % | –35.48 | % | +2.60 | % | ||||||||||
Net Assets, End of Period (In Millions) | $ | 1 | $ | 2 | $ | 2 | $ | 5 | $ | 1 | ||||||||||
Ratio of Expenses to Average Net Assets before Expense Waivers and Offsets | 3.9 | % | 3.0 | % | 2.9 | % | 3.4 | % | 7.3 | %* | ||||||||||
Ratio of Expenses to Average Net Assets | 2.1 | % | 1.3 | % | 2.1 | % | 1.5 | % | 2.4 | %* | ||||||||||
Ratio of Net Investment Income (Loss) to Average Net Assets | (1.9 | )% | (1.0 | )% | (1.7 | )% | (0.9 | )% | (1.0 | )%* | ||||||||||
Portfolio Turnover Rate(e) | 98.3 | % | 248.9 | % | 350.1 | % | 605.7 | % | 45.1 | % | ||||||||||
STRONG ADVISOR FOCUS FUND — CLASS B
| Year Ended | ||||||||||||||||||||
| Dec. 31, 2004 | Dec. 31, 2003 | Dec. 31, 2002 | Dec. 31, 2001 | Dec. 31, 2000(b) | ||||||||||||||||
Selected Per-Share Data(a) | ||||||||||||||||||||
Net Asset Value, Beginning of Period | $ | 5.87 | $ | 4.73 | $ | 6.55 | $ | 10.23 | $ | 10.00 | ||||||||||
Income From Investment Operations: | ||||||||||||||||||||
Net Investment Income (Loss) | (0.13 | )(c) | (0.09 | )(c) | (0.11 | )(c) | (0.08 | ) | (0.01 | ) | ||||||||||
Net Realized and Unrealized Gains (Losses) on Investments | 1.18 | 1.23 | (1.71 | ) | (3.60 | ) | 0.24 | |||||||||||||
Total from Investment Operations | 1.05 | 1.14 | (1.82 | ) | (3.68 | ) | 0.23 | |||||||||||||
Less Distributions: | ||||||||||||||||||||
From Net Investment Income | — | — | — | — | — | |||||||||||||||
Total Distributions | — | — | — | — | — | |||||||||||||||
Net Asset Value, End of Period | $ | 6.92 | $ | 5.87 | $ | 4.73 | $ | 6.55 | $ | 10.23 | ||||||||||
Ratios and Supplemental Data | ||||||||||||||||||||
Total Return(d) | +17.89 | % | +24.10 | % | –27.79 | % | –35.97 | % | +2.30 | % | ||||||||||
Net Assets, End of Period (In Millions) | $ | 1 | $ | 1 | $ | 1 | $ | 2 | $ | 0 | (f) | |||||||||
Ratio of Expenses to Average Net Assets before Expense Waivers and Offsets | 4.7 | % | 3.9 | % | 4.1 | % | 4.6 | % | 8.1 | %* | ||||||||||
Ratio of Expenses to Average Net Assets | 2.3 | % | 2.0 | % | 2.4 | % | 2.4 | % | 3.1 | %* | ||||||||||
Ratio of Net Investment Income (Loss) to Average Net Assets | (2.1 | )% | (1.7 | )% | (2.0 | )% | (1.7 | )% | (1.6 | )%* | ||||||||||
Portfolio Turnover Rate(e) | 98.3 | % | 248.9 | % | 350.1 | % | 605.7 | % | 45.1 | % | ||||||||||
| * | Calculated on an annualized basis. |
| (a) | Information presented relates to a share of capital stock of the Fund outstanding for the entire period. |
| (b) | For the period from November 30, 2000 (commencement of class) to December 31, 2000. |
| (c) | Net investment income (loss) per share represents new investment income (loss) divided by average shares outstanding throughout the year. |
| (d) | Total return assumes dividend reinvestment and does not reflect the effect of sales charges. |
| (e) | Calculated on the basis of the Fund as a whole without distinguishing between the classes of shares issued. |
| (f) | Amount is less than $500,000. |
See Notes to Financial Statements.
103
FINANCIAL HIGHLIGHTS (continued)
STRONG ADVISOR FOCUS FUND — CLASS C
| Year Ended | ||||||||||||||||||||
| Dec. 31, 2004 | Dec. 31, 2003 | Dec. 31, 2002 | Dec. 31, 2001 | Dec. 31, 2000(b) | ||||||||||||||||
Selected Per-Share Data(a) | ||||||||||||||||||||
Net Asset Value, Beginning of Period | $ | 5.87 | $ | 4.73 | $ | 6.55 | $ | 10.23 | $ | 10.00 | ||||||||||
Income From Investment Operations: | ||||||||||||||||||||
Net Investment Income (Loss) | (0.13 | )(c) | (0.09 | )(c) | (0.11 | )(c) | (0.09 | ) | (0.02 | ) | ||||||||||
Net Realized and Unrealized Gains (Losses) on Investments | 1.18 | 1.23 | (1.71 | ) | (3.59 | ) | 0.25 | |||||||||||||
Total from Investment Operations | 1.05 | 1.14 | (1.82 | ) | (3.68 | ) | 0.23 | |||||||||||||
Less Distributions: | ||||||||||||||||||||
From Net Investment Income | — | — | — | — | — | |||||||||||||||
Total Distributions | — | — | — | — | — | |||||||||||||||
Net Asset Value, End of Period | $ | 6.92 | $ | 5.87 | $ | 4.73 | $ | 6.55 | $ | 10.23 | ||||||||||
Ratios and Supplemental Data | ||||||||||||||||||||
Total Return(d) | +17.89 | % | +24.10 | % | –27.79 | % | –35.97 | % | +2.30 | % | ||||||||||
Net Assets, End of Period (In Millions) | $ | 0 | (e) | $ | 0 | (e) | $ | 0 | (e) | $ | 1 | $ | 0 | (e) | ||||||
Ratio of Expenses to Average Net Assets before Expense Waivers and Offsets | 4.7 | % | 3.8 | % | 3.9 | % | 4.3 | % | 8.1 | %* | ||||||||||
Ratio of Expenses to Average Net Assets | 2.3 | % | 1.9 | % | 2.4 | % | 2.4 | % | 4.5 | %* | ||||||||||
Ratio of Net Investment Income (Loss) to Average Net Assets | (2.1 | )% | (1.6 | )% | (2.0 | )% | (1.7 | )% | (2.7 | )%* | ||||||||||
Portfolio Turnover Rate(f) | 98.3 | % | 248.9 | % | 350.1 | % | 605.7 | % | 45.1 | % | ||||||||||
STRONG ADVISOR INTERNATIONAL CORE FUND — CLASS A
| Year Ended | ||||||||||||||||
| Dec. 31, 2004 | Dec. 31, 2003 | Dec. 31, 2002 | Dec. 31, 2001(g) | |||||||||||||
Selected Per-Share Data(a) | ||||||||||||||||
Net Asset Value, Beginning of Period | $ | 11.47 | $ | 8.84 | $ | 10.41 | $ | 10.00 | ||||||||
Income From Investment Operations: | ||||||||||||||||
Net Investment Income (Loss) | 0.28 | (c) | 0.18 | (c) | (0.06 | )(c) | (0.03 | ) | ||||||||
Net Realized and Unrealized Gains (Losses) on Investments | 1.93 | 2.59 | (1.51 | ) | 0.44 | |||||||||||
Total from Investment Operations | 2.21 | 2.77 | (1.57 | ) | 0.41 | |||||||||||
Less Distributions: | ||||||||||||||||
From Net Investment Income | (0.25 | ) | (0.14 | ) | — | — | ||||||||||
From Net Realized Gains | (0.27 | ) | — | — | — | |||||||||||
Total Distributions | (0.52 | ) | (0.14 | ) | — | — | ||||||||||
Net Asset Value, End of Period | $ | 13.16 | $ | 11.47 | $ | 8.84 | $ | 10.41 | ||||||||
Ratios and Supplemental Data | ||||||||||||||||
Total Return(d) | +19.38 | % | +31.38 | % | –15.08 | % | +4.10 | % | ||||||||
Net Assets, End of Period (In Millions) | $ | 1 | $ | 1 | $ | 0 | (e) | $ | 0 | (e) | ||||||
Ratio of Expenses to Average Net Assets before Expense Waivers and Offsets | 4.8 | % | 7.7 | % | 52.4 | % | 2.2 | %* | ||||||||
Ratio of Expenses to Average Net Assets | 0.0 | %(h) | 0.0 | %(h) | 2.2 | % | 2.2 | %* | ||||||||
Ratio of Net Investment Income (Loss) to Average Net Assets | 2.3 | % | 1.8 | % | (0.6 | )% | (1.1 | )%* | ||||||||
Portfolio Turnover Rate(f) | 28.1 | % | 88.1 | % | 46.9 | % | 4.0 | % | ||||||||
| * | Calculated on an annualized basis. |
| (a) | Information presented relates to a share of capital stock of the Fund outstanding for the entire period. |
| (b) | For the period from November 30, 2000 (commencement of class) to December 31, 2000 (Note 1). |
| (c) | Net investment income (loss) per share represents net investment income (loss) divided by average shares outstanding throughout the year. |
| (d) | Total return assumes dividend reinvestment and does not reflect the effect of sales charges. |
| (e) | Amount is less than $500,000. |
| (f) | Calculated on the basis of the Fund as a whole without distinguishing between the classes of shares issued. |
| (g) | For the period from September 28, 2001 (commencement of class) to December 31, 2001. |
| (h) | Amount calculated is less than 0.05%. |
See Notes to Financial Statements.
104
FINANCIAL HIGHLIGHTS (continued)
STRONG ADVISOR INTERNATIONAL CORE FUND — CLASS B
| Year Ended | ||||||||||||||||
| Dec. 31, 2004 | Dec. 31, 2003 | Dec. 31, 2002 | Dec. 31, 2001(b) | |||||||||||||
Selected Per-Share Data(a) | ||||||||||||||||
Net Asset Value, Beginning of Period | $ | 11.45 | $ | 8.82 | $ | 10.40 | $ | 10.00 | ||||||||
Income From Investment Operations: | ||||||||||||||||
Net Investment Income (Loss) | 0.28 | (c) | 0.20 | (c) | (0.08 | )(c) | (0.04 | ) | ||||||||
Net Realized and Unrealized Gains (Losses) on Investments | 1.92 | 2.58 | (1.50 | ) | 0.44 | |||||||||||
Total from Investment Operations | 2.20 | 2.78 | (1.58 | ) | 0.40 | |||||||||||
Less Distributions: | ||||||||||||||||
From Net Investment Income | (0.25 | ) | (0.15 | ) | — | — | ||||||||||
From Net Realized Gains | (0.27 | ) | — | — | — | |||||||||||
Total Distributions | (0.52 | ) | (0.15 | ) | — | — | ||||||||||
Net Asset Value, End of Period | $ | 13.13 | $ | 11.45 | $ | 8.82 | $ | 10.40 | ||||||||
Ratios and Supplemental Data | ||||||||||||||||
Total Return(d) | +19.32 | % | +31.58 | % | –15.19 | % | +4.00 | % | ||||||||
Net Assets, End of Period (In Millions) | $ | 1 | $ | 1 | $ | 0 | (e) | $ | 0 | (e) | ||||||
Ratio of Expenses to Average Net Assets before Expense Waivers and Offsets | 5.5 | % | 8.6 | % | 52.0 | % | 3.0 | %* | ||||||||
Ratio of Expenses to Average Net Assets | 0.0 | %(f) | 0.0 | %(f) | 2.4 | % | 2.7 | %* | ||||||||
Ratio of Net Investment Income (Loss) to Average Net Assets | 2.3 | % | 2.0 | % | (0.8 | )% | (1.6 | )%* | ||||||||
Portfolio Turnover Rate(g) | 28.1 | % | 88.1 | % | 46.9 | % | 4.0 | % | ||||||||
STRONG ADVISOR INTERNATIONAL CORE FUND — CLASS C
| Year Ended | ||||||||||||||||
| Dec. 31, 2004 | Dec. 31, 2003 | Dec. 31, 2002 | Dec. 31, 2001(b) | |||||||||||||
Selected Per-Share Data(a) | ||||||||||||||||
Net Asset Value, Beginning of Period | $ | 11.43 | $ | 8.82 | $ | 10.40 | $ | 10.00 | ||||||||
Income From Investment Operations: | ||||||||||||||||
Net Investment Income (Loss) | 0.28 | (c) | 0.21 | (c) | (0.06 | )(c) | (0.04 | ) | ||||||||
Net Realized and Unrealized Gains (Losses) on Investments | 1.93 | 2.57 | (1.52 | ) | 0.44 | |||||||||||
Total from Investment Operations | 2.21 | 2.78 | (1.58 | ) | 0.40 | |||||||||||
Less Distributions: | ||||||||||||||||
From Net Investment Income | (0.25 | ) | (0.17 | ) | — | — | ||||||||||
From Net Realized Gains | (0.27 | ) | — | — | — | |||||||||||
Total Distributions | (0.52 | ) | (0.17 | ) | — | — | ||||||||||
Net Asset Value, End of Period | $ | 13.12 | $ | 11.43 | $ | 8.82 | $ | 10.40 | ||||||||
Ratios and Supplemental Data | ||||||||||||||||
Total Return(d) | +19.44 | % | +31.52 | % | –15.19 | % | +4.00 | % | ||||||||
Net Assets, End of Period (In Millions) | $ | 0 | (e) | $ | 0 | (e) | $ | 0 | (e) | $ | 0 | (e) | ||||
Ratio of Expenses to Average Net Assets before Expense Waivers and Offsets | 5.5 | % | 8.4 | % | 52.5 | % | 3.0 | %* | ||||||||
Ratio of Expenses to Average Net Assets | 0.0 | %(f) | 0.0 | %(f) | 2.4 | % | 2.7 | %* | ||||||||
Ratio of Net Investment Income (Loss) to Average Net Assets | 2.3 | % | 2.1 | % | (0.7 | )% | (1.6 | )%* | ||||||||
Portfolio Turnover Rate(g) | 28.1 | % | 88.1 | % | 46.9 | % | 4.0 | % | ||||||||
| * | Calculated on an annualized basis. |
| (a) | Information presented relates to a share of capital stock of the Fund outstanding for the entire period. |
| (b) | For the period from September 28, 2001 (commencement of class) to December 31, 2001. |
| (c) | Net investment income (loss) per share represents net investment income (loss) divided by average shares outstanding throughout the year. |
| (d) | Total return assumes dividend reinvestment and does not reflect the effect of sales charges. |
| (e) | Amount is less than $500,000. |
| (f) | Amount calculated is less than 0.05%. |
| (g) | Calculated on the basis of the Fund as a whole without distinguishing between the classes of shares issued. |
See Notes to Financial Statements.
105
FINANCIAL HIGHLIGHTS (continued)
STRONG ADVISOR SELECT FUND — CLASS A
| Year Ended | ||||||||||||||||
| Dec. 31, 2004 | Dec. 31, 2003 | Dec. 31, 2002 | Dec. 31, 2001 | |||||||||||||
Selected Per-Share Data(a) | ||||||||||||||||
Net Asset Value, Beginning of Period | $ | 8.36 | $ | 6.10 | $ | 7.99 | $ | 10.00 | ||||||||
Income From Investment Operations: | ||||||||||||||||
Net Investment Income (Loss) | (0.09 | )(b) | (0.07 | )(b) | (0.07 | )(b) | (0.01 | ) | ||||||||
Net Realized and Unrealized Gains (Losses) on Investments | 1.47 | 2.33 | (1.81 | ) | (2.00 | )(c) | ||||||||||
Total from Investment Operations | 1.38 | 2.26 | (1.88 | ) | (2.01 | ) | ||||||||||
Less Distributions: | ||||||||||||||||
From Net Realized Gains | (0.58 | ) | — | (0.01 | ) | — | ||||||||||
Total Distributions | (0.58 | ) | — | (0.01 | ) | — | ||||||||||
Net Asset Value, End of Period | $ | 9.16 | $ | 8.36 | $ | 6.10 | $ | 7.99 | ||||||||
Ratios and Supplemental Data | ||||||||||||||||
Total Return(d) | +16.80 | % | +37.05 | % | –23.52 | % | –20.10 | % | ||||||||
Net Assets, End of Period (In Millions) | $ | 95 | $ | 81 | $ | 56 | $ | 57 | ||||||||
Ratio of Expenses to Average Net Assets before Expense Waivers and Offsets | 1.6 | % | 1.6 | % | 1.6 | % | 4.4 | % | ||||||||
Ratio of Expenses to Average Net Assets | 1.6 | % | 1.6 | % | 1.6 | % | 1.7 | % | ||||||||
Ratio of Net Investment Income (Loss) to Average Net Assets | (1.0 | )% | (1.0 | )% | (1.1 | )% | (0.8 | )% | ||||||||
Portfolio Turnover Rate(e) | 168.7 | % | 243.6 | % | 437.3 | % | 359.7 | % | ||||||||
STRONG ADVISOR SELECT FUND — CLASS B
| Year Ended | ||||||||||||||||
| Dec. 31, 2004 | Dec. 31, 2003 | Dec. 31, 2002 | Dec. 31, 2001 | |||||||||||||
Selected Per-Share Data(a) | ||||||||||||||||
Net Asset Value, Beginning of Period | $ | 8.18 | $ | 6.02 | $ | 7.94 | $ | 10.00 | ||||||||
Income From Investment Operations: | ||||||||||||||||
Net Investment Income (Loss) | (0.15 | )(b) | (0.12 | )(b) | (0.12 | )(b) | (0.09 | ) | ||||||||
Net Realized and Unrealized Gains (Losses) on Investments | 1.42 | 2.28 | (1.79 | ) | (1.97 | )(c) | ||||||||||
Total from Investment Operations | 1.27 | 2.16 | (1.91 | ) | (2.06 | ) | ||||||||||
Less Distributions: | ||||||||||||||||
From Net Realized Gains | (0.58 | ) | — | (0.01 | ) | — | ||||||||||
Total Distributions | (0.58 | ) | — | (0.01 | ) | — | ||||||||||
Net Asset Value, End of Period | $ | 8.87 | $ | 8.18 | $ | 6.02 | $ | 7.94 | ||||||||
Ratios and Supplemental Data | ||||||||||||||||
Total Return(d) | +15.82 | % | +35.88 | % | –24.04 | % | –20.60 | % | ||||||||
Net Assets, End of Period (In Millions) | $ | 2 | $ | 1 | $ | 0 | (f) | $ | 0 | (f) | ||||||
Ratio of Expenses to Average Net Assets before Expense Waivers and Offsets | 2.4 | % | 2.4 | % | 2.4 | % | 12.4 | % | ||||||||
Ratio of Expenses to Average Net Assets | 2.4 | % | 2.3 | % | 2.4 | % | 2.5 | % | ||||||||
Ratio of Net Investment Income (Loss) to Average Net Assets | (1.7 | )% | (1.8 | )% | (1.9 | )% | (1.7 | )% | ||||||||
Portfolio Turnover Rate(e) | 168.7 | % | 243.6 | % | 437.3 | % | 359.7 | % | ||||||||
| (a) | Information presented relates to a share of capital stock of the Fund outstanding for the entire period. |
| (b) | Net investment income (loss) per share represents net investment income (loss) divided by average shares outstanding throughout the year. |
| (c) | The amount shown may not correlate with the aggregate gains and losses of portfolio securities due to the timing of subscriptions and redemptions of fund shares. |
| (d) | Total return assumes dividend reinvestment and does not reflect the effect of sales charges. |
| (e) | Calculated on the basis of the Fund as a whole without distinguishing between the classes of shares issued. |
| (f) | Amount is less than $500,000. |
See Notes to Financial Statements.
106
FINANCIAL HIGHLIGHTS (continued)
STRONG ADVISOR SELECT FUND — CLASS C
| Year Ended | ||||||||||||||||
| Dec. 31, 2004 | Dec. 31, 2003 | Dec. 31, 2002 | Dec. 31, 2001 | |||||||||||||
Selected Per-Share Data(a) | ||||||||||||||||
Net Asset Value, Beginning of Period | $ | 8.18 | $ | 6.02 | $ | 7.93 | $ | 10.00 | ||||||||
Income From Investment Operations: | ||||||||||||||||
Net Investment Income (Loss) | (0.16 | )(b) | (0.13 | )(b) | (0.12 | )(b) | (0.10 | ) | ||||||||
Net Realized and Unrealized Gains (Losses) on Investments | 1.43 | 2.29 | (1.78 | ) | (1.97 | )(c) | ||||||||||
Total from Investment Operations | 1.27 | 2.16 | (1.90 | ) | (2.07 | ) | ||||||||||
Less Distributions: | ||||||||||||||||
From Net Realized Gains | (0.58 | ) | — | (0.01 | ) | — | ||||||||||
Total Distributions | (0.58 | ) | — | (0.01 | ) | — | ||||||||||
Net Asset Value, End of Period | $ | 8.87 | $ | 8.18 | $ | 6.02 | $ | 7.93 | ||||||||
Ratios and Supplemental Data | ||||||||||||||||
Total Return(d) | +15.82 | % | +35.88 | % | –23.95 | % | –20.70 | % | ||||||||
Net Assets, End of Period (In Millions) | $ | 1 | $ | 0 | (e) | $ | 0 | (e) | $ | 0 | (e) | |||||
Ratio of Expenses to Average Net Assets before Expense Waivers and Offsets | 2.4 | % | 2.5 | % | 2.3 | % | 12.8 | % | ||||||||
Ratio of Expenses to Average Net Assets | 2.4 | % | 2.4 | % | 2.3 | % | 2.5 | % | ||||||||
Ratio of Net Investment Income (Loss) to Average Net Assets | (1.8 | )% | (1.8 | )% | (1.8 | )% | (1.7 | )% | ||||||||
Portfolio Turnover Rate(f) | 168.7 | % | 243.6 | % | 437.3 | % | 359.7 | % | ||||||||
STRONG ADVISOR TECHNOLOGY FUND — CLASS A
| Year Ended | ||||||||||||||||||||
| Dec. 31, 2004 | Dec. 31, 2003 | Dec. 31, 2002 | Dec. 31, 2001 | Dec. 31, 2000(g) | ||||||||||||||||
Selected Per-Share Data(a) | ||||||||||||||||||||
Net Asset Value, Beginning of Period | $ | 7.43 | $ | 4.24 | $ | 7.22 | $ | 9.27 | $ | 10.00 | ||||||||||
Income From Investment Operations: | ||||||||||||||||||||
Net Investment Income (Loss) | (0.09 | ) | (0.10 | )(b) | (0.11 | )(b) | (0.05 | ) | (0.05 | ) | ||||||||||
Net Realized and Unrealized Gains (Losses) on Investments | (0.25 | ) | 3.29 | (2.87 | ) | (1.99 | ) | (0.68 | ) | |||||||||||
Total from Investment Operations | (0.34 | ) | 3.19 | (2.98 | ) | (2.04 | ) | (0.73 | ) | |||||||||||
Less Distributions: | ||||||||||||||||||||
From Net Investment Income | — | — | — | — | — | |||||||||||||||
From Net Realized Gains | — | — | — | (0.01 | ) | — | ||||||||||||||
Total Distributions | — | — | — | (0.01 | ) | — | ||||||||||||||
Net Asset Value, End of Period | $ | 7.09 | $ | 7.43 | $ | 4.24 | $ | 7.22 | $ | 9.27 | ||||||||||
Ratios and Supplemental Data | ||||||||||||||||||||
Total Return(d) | –4.58 | % | +75.24 | % | –41.27 | % | –21.98 | % | –7.30 | % | ||||||||||
Net Assets, End of Period (In Millions) | $ | 1 | $ | 1 | $ | 1 | $ | 2 | $ | 0 | (e) | |||||||||
Ratio of Expenses to Average Net Assets before Expense Waivers and Offsets | 5.2 | % | 3.6 | % | 3.3 | % | 7.0 | % | �� | 17.2 | %* | |||||||||
Ratio of Expenses to Average Net Assets | 1.8 | % | 2.2 | % | 2.3 | % | 1.6 | % | 9.5 | %* | ||||||||||
Ratio of Net Investment Income (Loss) to Average Net Assets | (1.3 | )% | (1.8 | )% | (2.1 | )% | (1.0 | )% | (8.2 | )%* | ||||||||||
Portfolio Turnover Rate(f) | 145.7 | % | 184.5 | % | 136.5 | % | 157.9 | % | 49.3 | % | ||||||||||
| * | Calculated on an annualized basis. |
| (a) | Information presented relates to a share of capital stock of the Fund outstanding for the entire period. |
| (b) | Net investment income (loss) per share represents new investment income (loss) divided by average shares outstanding throughout the year. |
| (c) | The amount shown may not correlate with the aggregate gains and losses of portfolio securities due to the timing of subscriptions and redemptions of fund shares. |
| (d) | Total return assumes dividend reinvestment and does not reflect the effect of sales charges. |
| (e) | Amount is less than $500,000. |
| (f) | Calculated on the basis of the Fund as a whole without distinguishing between the classes of shares issued. |
| (g) | For the period from November 30, 2000 (commencement of class) to December 31, 2000. |
See Notes to Financial Statements.
107
FINANCIAL HIGHLIGHTS (continued)
STRONG ADVISOR TECHNOLOGY FUND — CLASS B
| Year Ended | ||||||||||||||||||||
Dec. 31, 2004 | Dec. 31, 2003 | Dec. 31, 2002 | Dec. 31, 2001 | Dec. 31, 2000(b) | ||||||||||||||||
Selected Per-Share Data(a) | ||||||||||||||||||||
Net Asset Value, Beginning of Period | $ | 7.32 | $ | 4.17 | $ | 7.13 | $ | 9.26 | $ | 10.00 | ||||||||||
Income From Investment Operations: | ||||||||||||||||||||
Net Investment Income (Loss) | (0.08 | ) | (0.11 | )(c) | (0.11 | )(c) | (0.09 | ) | (0.08 | ) | ||||||||||
Net Realized and Unrealized Gains (Losses) on Investments | (0.25 | ) | 3.26 | (2.85 | ) | (2.03 | ) | (0.66 | ) | |||||||||||
Total from Investment Operations | (0.33 | ) | 3.15 | (2.96 | ) | (2.12 | ) | (0.74 | ) | |||||||||||
Less Distributions: | ||||||||||||||||||||
From Net Investment Income | — | — | — | — | — | |||||||||||||||
From Net Realized Gains | — | — | — | (0.01 | ) | — | ||||||||||||||
Total Distributions | — | — | — | (0.01 | ) | — | ||||||||||||||
Net Asset Value, End of Period | $ | 6.99 | $ | 7.32 | $ | 4.17 | $ | 7.13 | $ | 9.26 | ||||||||||
Ratios and Supplemental Data | ||||||||||||||||||||
Total Return(d) | –4.51 | % | +75.54 | % | –41.51 | % | –22.87 | % | –7.40 | % | ||||||||||
Net Assets, End of Period (In Millions) | $ | 1 | $ | 1 | $ | 0 | (e) | $ | 0 | (e) | $ | 0 | (e) | |||||||
Ratio of Expenses to Average Net Assets before Expense Waivers and Offsets | 5.9 | % | 4.5 | % | 4.5 | % | 9.3 | % | 17.3 | %* | ||||||||||
Ratio of Expenses to Average Net Assets | 1.8 | % | 2.2 | % | 2.4 | % | 2.5 | % | 11.1 | %* | ||||||||||
Ratio of Net Investment Income (Loss) to Average Net Assets | (1.2 | )% | (1.7 | )% | (2.2 | )% | (1.9 | )% | (9.7 | )%* | ||||||||||
Portfolio Turnover Rate(f) | 145.7 | % | 184.5 | % | 136.5 | % | 157.9 | % | 49.3 | % | ||||||||||
STRONG ADVISOR TECHNOLOGY FUND — CLASS C
| Year Ended | ||||||||||||||||||||
| Dec. 31, 2004 | Dec. 31, 2003 | Dec. 31, 2002 | Dec. 31, 2001 | Dec. 31, 2000(b) | ||||||||||||||||
Selected Per-Share Data(a) | ||||||||||||||||||||
Net Asset Value, Beginning of Period | $ | 7.30 | $ | 4.16 | $ | 7.11 | $ | 9.26 | $ | 10.00 | ||||||||||
Income From Investment Operations: | ||||||||||||||||||||
Net Investment Income (Loss) | (0.09 | ) | (0.10 | )(c) | (0.12 | )(c) | (0.09 | ) | (0.08 | ) | ||||||||||
Net Realized and Unrealized Gains (Losses) on Investments | (0.25 | ) | 3.24 | (2.83 | ) | (2.05 | ) | (0.66 | ) | |||||||||||
Total from Investment Operations | (0.34 | ) | 3.14 | (2.95 | ) | (2.14 | ) | (0.74 | ) | |||||||||||
Less Distributions: | ||||||||||||||||||||
From Net Investment Income | — | — | — | — | — | |||||||||||||||
From Net Realized Gains | — | — | — | (0.01 | ) | — | ||||||||||||||
Total Distributions | — | — | — | (0.01 | ) | — | ||||||||||||||
Net Asset Value, End of Period | $ | 6.96 | $ | 7.30 | $ | 4.16 | $ | 7.11 | $ | 9.26 | ||||||||||
Ratios and Supplemental Data | ||||||||||||||||||||
Total Return(d) | –4.66 | % | +75.48 | % | –41.49 | % | –23.09 | % | –7.40 | % | ||||||||||
Net Assets, End of Period (In Millions) | $ | 0 | (e) | $ | 0 | (e) | $ | 0 | (e) | $ | 1 | $ | 0 | (e) | ||||||
Ratio of Expenses to Average Net Assets before Expense Waivers and Offsets | 6.0 | % | 4.5 | % | 4.2 | % | 8.9 | % | 17.3 | %* | ||||||||||
Ratio of Expenses to Average Net Assets | 1.8 | % | 2.2 | % | 2.5 | % | 2.4 | % | 11.1 | %* | ||||||||||
Ratio of Net Investment Income (Loss) to Average Net Assets | (1.2 | )% | (1.8 | )% | (2.2 | )% | (1.8 | )% | (9.7 | )%* | ||||||||||
Portfolio Turnover Rate(f) | 145.7 | % | 184.5 | % | 136.5 | % | 157.9 | % | 49.3 | % | ||||||||||
| * | Calculated on an annualized basis. |
| (a) | Information presented relates to a share of capital stock of the Fund outstanding for the entire period. |
| (b) | For the period from November 30, 2000 (commencement of class) to December 31, 2000. |
| (c) | Net investment income (loss) per share represents net investment income (loss) divided by average shares outstanding throughout the year. |
| (d) | Total return assumes dividend reinvestment and does not reflect the effect of sales charges. |
| (e) | Amount is less than $500,000. |
| (f) | Calculated on the basis of the Fund as a whole without distinguishing between the classes of shares issued. |
See Notes to Financial Statements.
108
FINANCIAL HIGHLIGHTS (continued)
STRONG ADVISOR U.S. SMALL/MID CAP GROWTH FUND — CLASS A
| Year Ended | ||||||||||||
| Dec. 31, 2004 | Dec. 31, 2003 | Dec. 31, 2002(b) | ||||||||||
Selected Per-Share Data(a) | ||||||||||||
Net Asset Value, Beginning of Period | $ | 11.19 | $ | 7.14 | $ | 10.00 | ||||||
Income From Investment Operations: | ||||||||||||
Net Investment Income (Loss) | (0.24 | )(c) | (0.24 | )(c) | (0.14 | )(c) | ||||||
Net Realized and Unrealized Gains (Losses) on Investments | 0.30 | 4.29 | (2.72 | ) | ||||||||
Total from Investment Operations | 0.06 | 4.05 | (2.86 | ) | ||||||||
Less Distributions: | ||||||||||||
From Net Investment Income | — | — | — | |||||||||
Total Distributions | — | — | — | |||||||||
Net Asset Value, End of Period | $ | 11.25 | $ | 11.19 | $ | 7.14 | ||||||
Ratios and Supplemental Data | ||||||||||||
Total Return(d) | +0.54 | % | +56.72 | % | –28.60 | % | ||||||
Net Assets, End of Period (In Millions) | $ | 2 | $ | 3 | $ | 0 | (e) | |||||
Ratio of Expenses to Average Net Assets before Expense Waivers and Offsets | 2.6 | % | 3.8 | % | 14.1 | %* | ||||||
Ratio of Expenses to Average Net Assets | 2.4 | % | 2.4 | % | 2.5 | %* | ||||||
Ratio of Net Investment Income (Loss) to Average Net Assets | (2.3 | )% | (2.4 | )% | (2.4 | )%* | ||||||
Portfolio Turnover Rate(f) | 116.6 | % | 114.0 | % | 98.1 | % | ||||||
STRONG ADVISOR U.S. SMALL/MID CAP GROWTH FUND — CLASS B
| Year Ended | ||||||||||||
| Dec. 31, 2004 | Dec. 31, 2003 | Dec. 31, 2002(b) | ||||||||||
Selected Per-Share Data(a) | ||||||||||||
Net Asset Value, Beginning of Period | $ | 11.18 | $ | 7.14 | $ | 10.00 | ||||||
Income From Investment Operations: | ||||||||||||
Net Investment Income (Loss) | (0.24 | )(c) | (0.23 | )(c) | (0.14 | )(c) | ||||||
Net Realized and Unrealized Gains (Losses) on Investments | 0.30 | 4.27 | (2.72 | ) | ||||||||
Total from Investment Operations | 0.06 | 4.04 | (2.86 | ) | ||||||||
Less Distributions: | ||||||||||||
From Net Investment Income | — | — | — | |||||||||
Total Distributions | — | — | — | |||||||||
Net Asset Value, End of Period | $ | 11.24 | $ | 11.18 | $ | 7.14 | ||||||
Ratios and Supplemental Data | ||||||||||||
Total Return(d) | +0.54 | % | +56.58 | % | –28.60 | % | ||||||
Net Assets, End of Period (In Millions) | $ | 2 | $ | 1 | $ | 0 | (e) | |||||
Ratio of Expenses to Average Net Assets before Expense Waivers and Offsets | 3.4 | % | 4.7 | % | 14.9 | %* | ||||||
Ratio of Expenses to Average Net Assets | 2.4 | % | 2.4 | % | 2.5 | %* | ||||||
Ratio of Net Investment Income (Loss) to Average Net Assets | (2.3 | )% | (2.4 | )% | (2.4 | )%* | ||||||
Portfolio Turnover Rate(f) | 116.6 | % | 114.0 | % | 98.1 | % | ||||||
| * | Calculated on an annualized basis. |
| (a) | Information presented relates to a share of capital stock of the Fund outstanding for the entire period. |
| (b) | For the period from March 28, 2002 (commencement of class) to December 31, 2002. |
| (c) | Net investment income (loss) per share represents net investment income (loss) divided by average shares outstanding throughout the year. |
| (d) | Total return assumes dividend reinvestment and does not reflect the effect of sales charges. |
| (e) | Amount is less than $500,000. |
| (f) | Calculated on the basis of the Fund as a whole without distinguishing between the classes of shares issued. |
See Notes to Financial Statements.
109
FINANCIAL HIGHLIGHTS (continued)
STRONG ADVISOR U.S.SMALL/MID CAP GROWTH FUND — CLASS C
| Year Ended | ||||||||||||
| Dec. 31, 2004 | Dec. 31, 2003 | Dec. 31, 2002(b) | ||||||||||
Selected Per-Share Data(a) | ||||||||||||
Net Asset Value, Beginning of Period | $ | 11.19 | $ | 7.14 | $ | 10.00 | ||||||
Income From Investment Operations: | ||||||||||||
Net Investment Income (Loss) | (0.24 | )(c) | (0.23 | )(c) | (0.13 | )(c) | ||||||
Net Realized and Unrealized Gains (Losses) on Investments | 0.30 | 4.28 | (2.73 | ) | ||||||||
Total from Investment Operations | 0.06 | 4.05 | (2.86 | ) | ||||||||
Less Distributions: | ||||||||||||
From Net Investment Income | — | — | — | |||||||||
Total Distributions | — | — | — | |||||||||
Net Asset Value, End of Period | $ | 11.25 | $ | 11.19 | $ | 7.14 | ||||||
Ratios and Supplemental Data | ||||||||||||
Total Return(d) | +0.54 | % | +56.72 | % | –28.60 | % | ||||||
Net Assets, End of Period (In Millions) | $ | 1 | $ | 2 | $ | 0 | (e) | |||||
Ratio of Expenses to Average Net Assets before Expense Waivers and Offsets | 3.5 | % | 4.7 | % | 15.3 | %* | ||||||
Ratio of Expenses to Average Net Assets | 2.4 | % | 2.4 | % | 2.5 | %* | ||||||
Ratio of Net Investment Income (Loss) to Average Net Assets | (2.3 | )% | (2.3 | )% | (2.4 | )%* | ||||||
Portfolio Turnover Rate(f) | 116.6 | % | 114.0 | % | 98.1 | % | ||||||
STRONG ADVISOR UTILITIES AND ENERGY FUND — CLASS A
| Year Ended | ||||||||||||
| Dec. 31, 2004 | Dec. 31, 2003 | Dec. 31, 2002(g) | ||||||||||
Selected Per-Share Data(a) | ||||||||||||
Net Asset Value, Beginning of Period | $ | 10.63 | $ | 9.02 | $ | 10.00 | ||||||
Income From Investment Operations: | ||||||||||||
Net Investment Income | 0.08 | (c) | 0.14 | 0.08 | (c) | |||||||
Net Realized and Unrealized Gains (Losses) on Investments | 2.29 | 1.61 | (1.00 | ) | ||||||||
Total from Investment Operations | 2.37 | 1.75 | (0.92 | ) | ||||||||
Less Distributions: | ||||||||||||
From Net Investment Income | (0.14 | ) | (0.14 | ) | (0.06 | ) | ||||||
From Net Realized Gains | (0.97 | ) | — | — | ||||||||
Total Distributions | (1.11 | ) | (0.14 | ) | (0.06 | ) | ||||||
Net Asset Value, End of Period | $ | 11.89 | $ | 10.63 | $ | 9.02 | ||||||
Ratios and Supplemental Data | ||||||||||||
Total Return(d) | +22.68 | % | +19.61 | % | –9.21 | % | ||||||
Net Assets, End of Period (In Millions) | $ | 1 | $ | 10 | $ | 6 | ||||||
Ratio of Expenses to Average Net Assets before Expense Waivers and Offsets | 2.2 | % | 1.9 | % | 2.2 | %* | ||||||
Ratio of Expenses to Average Net Assets | 2.1 | % | 1.9 | % | 2.2 | %* | ||||||
Ratio of Net Investment Income to Average Net Assets | 0.7 | % | 1.5 | % | 2.0 | %* | ||||||
Portfolio Turnover Rate(f) | 121.6 | % | 174.2 | % | 46.2 | % | ||||||
| * | Calculated on an annualized basis. |
| (a) | Information presented relates to a share of capital stock of the Fund outstanding for the entire period. |
| (b) | For the period from March 28, 2002 (commencement of class) to December 31, 2002. |
| (c) | Net investment income (loss) per share represents net investment income (loss) divided by average shares outstanding throughout the year. |
| (d) | Total return assumes dividend reinvestment and does not reflect the effect of sales charges. |
| (e) | Amount is less than $500,000. |
| (f) | Calculated on the basis of the Fund as a whole without distinguishing between the classes of shares issued. |
| (g) | For the period from July 31, 2002 (commencement of class) to December 31, 2002. |
See Notes to Financial Statements.
110
FINANCIAL HIGHLIGHTS (continued)
STRONG ADVISOR UTILITIES AND ENERGY FUND — CLASS B
| Year Ended | ||||||||||||
| Dec. 31, 2004 | Dec. 31, 2003 | Dec. 31, 2002(b) | ||||||||||
Selected Per-Share Data(a) | ||||||||||||
Net Asset Value, Beginning of Period | $ | 10.64 | $ | 9.04 | $ | 10.00 | ||||||
Income From Investment Operations: | ||||||||||||
Net Investment Income | 0.00 | (c)(d) | 0.09 | 0.06 | (c) | |||||||
Net Realized and Unrealized Gains on Investments | 2.32 | 1.62 | (1.00 | ) | ||||||||
Total from Investment Operations | 2.32 | 1.71 | (0.94 | ) | ||||||||
Less Distributions: | ||||||||||||
From Net Investment Income | (0.23 | ) | (0.11 | ) | (0.02 | ) | ||||||
From Net Realized Gains | (0.97 | ) | — | — | ||||||||
Total Distributions | (1.20 | ) | (0.11 | ) | (0.02 | ) | ||||||
Net Asset Value, End of Period | $ | 11.76 | $ | 10.64 | $ | 9.04 | ||||||
Ratios and Supplemental Data | ||||||||||||
Total Return(e) | +22.13 | % | +18.97 | % | –9.39 | % | ||||||
Net Assets, End of Period (In Millions) | $ | 0 | (f) | $ | 0 | (f) | $ | 0 | (f) | |||
Ratio of Expenses to Average Net Assets before Expense Waivers and Offsets | 3.0 | % | 2.7 | % | 5.1 | %* | ||||||
Ratio of Expenses to Average Net Assets | 2.7 | % | 2.4 | % | 2.5 | %* | ||||||
Ratio of Net Investment Income to Average Net Assets | 0.0 | % | 1.0 | % | 1.6 | %* | ||||||
Portfolio Turnover Rate(g) | 121.6 | % | 174.2 | % | 46.2 | % | ||||||
STRONG ADVISOR UTILITIES AND ENERGY FUND — CLASS C
| Year Ended | ||||||||||||
| Dec. 31, 2004 | Dec. 31, 2003 | Dec. 31, 2002(b) | ||||||||||
Selected Per-Share Data(a) | ||||||||||||
Net Asset Value, Beginning of Period | $ | 10.62 | $ | 9.02 | $ | 10.00 | ||||||
Income From Investment Operations: | ||||||||||||
Net Investment Income (Loss) | 0.00 | (c)(d) | 0.09 | 0.05 | (c) | |||||||
Net Realized and Unrealized Gains (Losses) on Investments | 2.31 | 1.61 | (0.99 | ) | ||||||||
Total from Investment Operations | 2.31 | 1.70 | (0.94 | ) | ||||||||
Less Distributions: | ||||||||||||
From Net Investment Income | (0.23 | ) | (0.10 | ) | (0.04 | ) | ||||||
From Net Realized Gains (Losses) | (0.97 | ) | — | — | ||||||||
Total Distributions | (1.20 | ) | (0.10 | ) | (0.04 | ) | ||||||
Net Asset Value, End of Period | $ | 11.73 | $ | 10.62 | $ | 9.02 | ||||||
Ratios and Supplemental Data | ||||||||||||
Total Return(e) | +22.07 | % | +18.97 | % | –9.45 | % | ||||||
Net Assets, End of Period (In Millions) | $ | 0 | (f) | $ | 0 | (f) | $ | 0 | (f) | |||
Ratio of Expenses to Average Net Assets before Expense Waivers and Offsets | 3.0 | % | 2.7 | % | 5.3 | %* | ||||||
Ratio of Expenses to Average Net Assets | 2.7 | % | 2.4 | % | 2.5 | %* | ||||||
Ratio of Net Investment Income to Average Net Assets | 0.0 | % | 0.9 | % | 1.3 | %* | ||||||
Portfolio Turnover Rate(g) | 121.6 | % | 174.2 | % | 46.2 | % | ||||||
| * | Calculated on an annualized basis. |
| (a) | Information presented relates to a share of capital stock of the Fund outstanding for the entire period. |
| (b) | For the period from July 31, 2002 (commencement of class) to December 31, 2002. |
| (c) | Net investment income (loss) per share represents net investment income (loss) divided by average shares outstanding throughout the year. |
| (d) | Amount calculated is less than $0.005. |
| (e) | Total return assumes dividend reinvestment and does not reflect the effect of sales charges. |
| (f) | Amount is less than $500,000. |
| (g) | Calculated on the basis of the Fund as a whole without distinguishing between the classes of shares issued. |
See Notes to Financial Statements.
111
FINANCIAL HIGHLIGHTS (continued)
STRONG ADVISOR LARGE COMPANY CORE FUND — CLASS A
| Year Ended | ||||||||||||||||||||||||
| Dec. 31, 2004 | Dec. 31, 2003 | Dec. 31, 2002(b) | Sep. 30, 2002(c) | Sep. 30, 2001 | Sep. 30, 2000 | |||||||||||||||||||
Selected Per-Share Data(a) | ||||||||||||||||||||||||
Net Asset Value, Beginning of Period | $ | 10.81 | $ | 8.81 | $ | 8.24 | $ | 9.65 | $ | 14.67 | $ | 11.72 | ||||||||||||
Income From Investment Operations: | ||||||||||||||||||||||||
Net Investment Income | (0.01 | ) | (0.00 | )(d)(e) | 0.01 | (e) | 0.07 | 0.12 | 0.14 | |||||||||||||||
Net Realized and Unrealized Gains (Losses) on Investments | 1.12 | 2.02 | 0.57 | (1.10 | ) | (3.79 | ) | 3.26 | ||||||||||||||||
| �� | ||||||||||||||||||||||||
Total from Investment Operations | 1.11 | 2.02 | 0.58 | (1.03 | ) | (3.67 | ) | 3.40 | ||||||||||||||||
Less Distributions: | ||||||||||||||||||||||||
From Net Investment Income | — | (0.01 | ) | (0.01 | ) | (0.05 | ) | (0.12 | ) | (0.14 | ) | |||||||||||||
From Net Realized Gains | (0.95 | ) | (0.01 | ) | — | (0.33 | ) | (1.23 | ) | (0.31 | ) | |||||||||||||
Total Distributions | (0.95 | ) | (0.02 | ) | (0.01 | ) | (0.38 | ) | (1.35 | ) | (0.45 | ) | ||||||||||||
Net Asset Value, End of Period | $ | 10.97 | $ | 10.81 | $ | 8.81 | $ | 8.24 | $ | 9.65 | $ | 14.67 | ||||||||||||
Ratios and Supplemental Data | ||||||||||||||||||||||||
Total Return(f) | +10.69 | % | +22.93 | % | +6.99 | % | –11.47 | % | –26.39 | % | +29.48 | % | ||||||||||||
Net Assets, End of Period (In Millions) | $ | 55 | $ | 67 | $ | 9 | $ | 6 | $ | 4 | $ | 5 | ||||||||||||
Ratio of Expenses to Average Net Assets before Expense Waivers and Offsets | 1.6 | % | 1.7 | % | 3.1 | %* | 3.7 | % | 4.7 | % | 3.8 | % | ||||||||||||
Ratio of Expenses to Average Net Assets | 1.5 | % | 1.5 | % | 1.5 | %* | 1.5 | % | 1.5 | % | 1.5 | % | ||||||||||||
Ratio of Net Investment Income to Average Net Assets | (0.1 | )% | (0.0 | )%(d) | 0.1 | %* | 0.8 | % | 1.0 | % | 1.1 | % | ||||||||||||
Portfolio Turnover Rate(g) | 190.5 | % | 148.2 | % | 36.4 | % | 190.4 | % | 221.6 | % | 142.7 | % | ||||||||||||
STRONG ADVISOR LARGE COMPANY CORE FUND — CLASS B
| Year Ended | ||||||||||||
| Dec. 31, 2004 | Dec. 31, 2003 | Dec. 31, 2002(h) | ||||||||||
Selected Per-Share Data(a) | ||||||||||||
Net Asset Value, Beginning of Period | $ | 10.69 | $ | 8.79 | $ | 8.21 | ||||||
Income From Investment Operations: | ||||||||||||
Net Investment Income | (0.09 | ) | (0.10 | )(e) | (0.02 | )(e) | ||||||
Net Realized and Unrealized Gains on Investments | 1.08 | 2.01 | 0.60 | |||||||||
Total from Investment Operations | 0.99 | 1.91 | 0.58 | |||||||||
Less Distributions: | ||||||||||||
From Net Investment Income | — | (0.00 | )(d) | — | ||||||||
From Net Realized Gains | (0.95 | ) | (0.01 | ) | — | |||||||
Total Distributions | (0.95 | ) | (0.01 | ) | — | |||||||
Net Asset Value, End of Period | $ | 10.73 | $ | 10.69 | $ | 8.79 | ||||||
Ratios and Supplemental Data | ||||||||||||
Total Return(f) | +9.67 | % | +21.74 | % | +7.06 | % | ||||||
Net Assets, End of Period (In Millions) | $ | 9 | $ | 8 | $ | 0 | (i) | |||||
Ratio of Expenses to Average Net Assets before Expense Waivers and Offsets | 2.4 | % | 2.5 | % | 4.2 | %* | ||||||
Ratio of Expenses to Average Net Assets | 2.4 | % | 2.4 | % | 2.5 | %* | ||||||
Ratio of Net Investment Income to Average Net Assets | (0.9 | )% | (1.0 | )% | (0.2 | )%* | ||||||
Portfolio Turnover Rate(g) | 190.5 | % | 148.2 | % | 36.4 | % | ||||||
| * | Calculated on an annualized basis. |
| (a) | Information presented relates to a share of capital stock of the Fund outstanding for the entire period. |
| (b) | In 2002, the Fund changed its fiscal year-end from September to December. |
| (c) | Effective September 5, 2002 Strong Capital Management, Inc. assumed the investment advisory responsibilities from Rockhaven Asset Management, LLC. |
| (d) | Amount calculated is less than $0.005 or 0.05%. |
| (e) | Net investment income (loss) per share represents net investment income (loss) divided by average shares outstanding throughout the year. |
| (f) | Total return assumes dividend reinvestment and does not reflect the effect of sales charges. |
| (g) | Calculated on the basis of the Fund as a whole without distinguishing between the classes of shares issued. |
| (h) | For the period from September 30, 2002 (commencement of class) to December 31, 2002. |
| (i) | Amount is less than $500,000. |
See Notes to Financial Statements.
112
FINANCIAL HIGHLIGHTS (continued)
STRONG ADVISOR LARGE COMPANY CORE FUND — CLASS C
| Year Ended | ||||||||||||
| Dec. 31, 2004 | Dec. 31, 2003 | Dec. 31, 2002(b) | ||||||||||
Selected Per-Share Data(a) | ||||||||||||
Net Asset Value, Beginning of Period | $ | 10.69 | $ | 8.79 | $ | 8.21 | ||||||
Income From Investment Operations: | ||||||||||||
Net Investment Income (Loss) | (0.11 | ) | (0.10 | )(c) | (0.02 | )(c) | ||||||
Net Realized and Unrealized Gains (Losses) on Investments | 1.09 | 2.01 | 0.60 | |||||||||
Total from Investment Operations | 0.98 | 1.91 | 0.58 | |||||||||
Less Distributions: | ||||||||||||
From Net Investment Income | — | — | (0.00 | )(d) | ||||||||
From Net Realized Gains (Losses) | (0.95 | ) | (0.01 | ) | — | |||||||
Total Distributions | (0.95 | ) | (0.01 | ) | (0.00 | )(d) | ||||||
Net Asset Value, End of Period | $ | 10.72 | $ | 10.69 | $ | 8.79 | ||||||
Ratios and Supplemental Data | ||||||||||||
Total Return(e) | +9.57 | % | +21.73 | % | +7.09 | % | ||||||
Net Assets, End of Period (In Millions) | $ | 7 | $ | 6 | $ | 0 | (f) | |||||
Ratio of Expenses to Average Net Assets before Expense Waivers and Offsets | 2.5 | % | 2.5 | % | 4.2 | %* | ||||||
Ratio of Expenses to Average Net Assets | 2.4 | % | 2.4 | % | 2.5 | %* | ||||||
Ratio of Net Investment Income to Average Net Assets | (1.0 | )% | (1.0 | )% | (0.2 | )*% | ||||||
Portfolio Turnover Rate(g) | 190.5 | % | 148.2 | % | 36.4 | % | ||||||
STRONG ADVISOR LARGE COMPANY CORE FUND — CLASS K
| Year Ended | ||||||||||||
| Dec. 31, 2004 | Dec. 31, 2003 | Dec. 31, 2002(b) | ||||||||||
Selected Per-Share Data(a) | ||||||||||||
Net Asset Value, Beginning of Period | $ | 10.84 | $ | 8.80 | $ | 8.21 | ||||||
Income From Investment Operations: | ||||||||||||
Net Investment Income | 0.06 | 0.05 | (c) | 0.02 | (c) | |||||||
Net Realized and Unrealized Losses on Investments | 1.12 | 2.03 | 0.59 | |||||||||
Total from Investment Operations | 1.18 | 2.08 | 0.61 | |||||||||
Less Distributions: | ||||||||||||
From Net Investment Income | — | (0.03 | ) | (0.02 | ) | |||||||
From Net Realized Gains | (0.95 | ) | (0.01 | ) | — | |||||||
Total Distributions | (0.95 | ) | (0.04 | ) | (0.02 | ) | ||||||
Net Asset Value, End of Period | $ | 11.07 | $ | 10.84 | $ | 8.80 | ||||||
Ratios and Supplemental Data | ||||||||||||
Total Return(e) | +11.32 | % | +23.66 | % | +7.38 | % | ||||||
Net Assets, End of Period (In Millions) | $ | 24 | $ | 35 | $ | 0 | (f) | |||||
Ratio of Expenses to Average Net Assets before Expense Waivers and Offsets | 1.3 | % | 1.4 | % | 2.9 | %* | ||||||
Ratio of Expenses to Average Net Assets | 1.0 | % | 1.0 | % | 1.0 | %* | ||||||
Ratio of Net Investment Income to Average Net Assets | 0.4 | % | 0.5 | % | 1.1 | %* | ||||||
Portfolio Turnover Rate(g) | 190.5 | % | 148.2 | % | 36.4 | % | ||||||
| * | Calculated on an annualized basis. |
| (a) | Information presented relates to a share of capital stock of the Fund outstanding for the entire period. |
| (b) | For the period from September 30, 2002 (commencement of class) to December 31, 2002. |
| (c) | Net investment income (loss) per share represents net investment income (loss) divided by average shares outstanding throughout the year. |
| (d) | Amount calculated is less than $0.005. |
| (e) | Total return assumes dividend reinvestment and does not reflect the effect of sales charges. |
| (f) | Amount is less than $500,000. |
| (g) | Calculated on the basis of the Fund as a whole without distinguishing between the classes of shares issued. |
See Notes to Financial Statements.
113
December 31, 2004
| 1. | Organization |
The accompanying financial statements represent the following Strong Advisor Equity Funds (the “Funds”), each with its own investment objectives and policies:
| • | Strong Advisor Common Stock Fund(1) (a series fund of Strong Common Stock Fund, Inc.) |
| • | Strong Advisor Mid Cap Growth Fund(1) (a series fund of Strong Equity Funds, Inc.) |
| • | Strong Advisor Small Cap Value Fund(1) (a series fund of Strong Equity Funds, Inc.) |
| • | Strong Advisor U.S. Value Fund(1) (a series fund of Strong Conservative Equity Funds, Inc.) |
| • | Strong Advisor Endeavor Large Cap Fund(1) (a series fund of Strong Common Stock Fund, Inc.) |
| • | Strong Advisor Focus Fund(2) (a series fund of Strong Common Stock Fund, Inc.) |
| • | Strong Advisor International Core Fund(1) (a series fund of Strong International Equity Funds, Inc.) |
| • | Strong Advisor Select Fund(2) (a series fund of Strong Opportunity Fund, Inc.) |
| • | Strong Advisor Technology Fund(1) (a series fund of Strong Common Stock Fund, Inc.) |
| • | Strong Advisor U.S. Small/Mid Cap Growth Fund(1) (a series fund of Strong Opportunity Fund, Inc.) |
| • | Strong Advisor Utilities and Energy Fund(1) (a series fund of Strong Equity Funds, Inc.) |
| • | Strong Advisor Large Company Core Fund(1) (a series fund of Strong Equity Funds, Inc.) |
(1) Diversified Fund.
(2) Non-diversified Fund.
Each Fund is an open-end management investment company registered under the Investment Company Act of 1940, as amended (“1940 Act”).
Strong Advisor Common Stock Fund, Strong Advisor Mid Cap Growth Fund, and Strong Advisor Small Cap Value Fund offer Class A, B, C, and Z shares. Strong Advisor U.S. Value Fund offers Class A, B, C, K, and Z shares. Strong Advisor Endeavor Large Cap Fund, Strong Advisor Focus Fund, Strong Advisor International Core Fund, Strong Advisor Select Fund, Strong Advisor Technology Fund, Strong Advisor U.S. Small/Mid Cap Growth Fund, and Strong Advisor Utilities and Energy Fund offer Class A, B, and C shares. Strong Advisor Large Company Core Fund offers Class A, B, C, and K shares. All classes of shares differ principally in their respective administration, transfer agent, and distribution expenses and sales charges, if any. All classes of shares have identical rights to earnings, assets, and voting privileges, except for class-specific expenses and exclusive rights to vote on matters affecting only individual classes.
Class A, B, and C shares are available only through financial professionals. Class K shares are primarily available through retirement plans. Class Z shares are available to certain investors and investment professionals who owned Investor Class shares of the Fund on November 30, 2000 and to certain other investors as set forth in the Funds’ prospectuses.
| 2. | Significant Accounting Policies |
The following is a summary of significant accounting policies followed by the Funds in the preparation of their financial statements.
| (A) | Security Valuation — Securities of the Funds traded on a national securities exchange are valued each business day at the last sales price on that principal exchange. Securities traded on the NASDAQ Stock Market are valued each business day using the NASDAQ Official Closing Price (“NOCP”). Exchange-traded securities for which there were no transactions and NASDAQ-traded securities for which there is no NOCP are valued at the mean of the bid and ask prices. Securities for which market quotations are not readily available are fair valued as determined in good faith under the general supervision of the Funds’ Board of Directors. Some of the Fund’s portfolio securities may be listed on foreign exchanges that close before the U.S. markets and that trade on days when the U.S. markets are closed. As a result, management, under the supervision of the Funds’ Board of Directors, will consider significant events affecting foreign securities and the movements of the domestic markets that occur after the close of the foreign markets and before the time a Fund’s net asset value (“NAV”) is calculated in valuing such foreign securities. Securities that are purchased within 60 days of their stated maturity are valued at amortized cost, which approximates fair value. |
The Funds may own certain securities that are restricted as to resale. Restricted securities include Section 4(2) commercial paper, securities issued in a private placement, or securities eligible for resale pursuant to Rule 144A under the Securities Act of 1933. Restricted securities may be determined to be liquid or illiquid. Securities are deemed illiquid based upon guidelines established by the Funds’ Board of Directors. Illiquid securities are valued after giving due consideration to pertinent factors, such as recent private sales, market conditions, and the issuer’s financial performance. The aggregate cost and fair value of restricted securities held at December 31, 2004, that are deemed illiquid, are as follows:
| Aggregate Cost | Aggregate Fair Value | Percent of Net Assets | |||||||
Strong Advisor Small Cap Value Fund | $ | 14,010,073 | $ | 15,568,443 | 0.7 | % | |||
114
| (B) | Federal Income and Excise Taxes and Distributions to Shareholders — The Funds intend to comply with the requirements of the Internal Revenue Code of 1986, as amended, applicable to regulated investment companies and to distribute substantially all of their taxable income to their shareholders in a manner which results in no tax cost to the Funds. Therefore, no federal income or excise tax provision is recorded. |
Undistributed net investment income or accumulated net realized gains for financial statement purposes may differ from what is determined for federal income tax purposes due to differences in the timing, recognition, and characterization of income, expense, and capital gain items for financial statement and tax purposes. Where appropriate, reclassifications between net asset accounts are made for such differences that are permanent in nature. The Funds may utilize earnings and profits distributed to shareholders on redemptions of shares as part of the dividends paid deduction.
Each Fund, other than Strong Advisor U.S. Value Fund and Strong Advisor Utilities and Energy Fund, generally pays dividends from net investment income and distributes net realized capital gains, if any, at least annually. Strong Advisor U.S. Value Fund and Strong Advisor Utilities and Energy Fund generally pay dividends from net investment income quarterly and distribute net realized capital gains, if any, at least annually.
| (C) | Realized Gains and Losses on Investment Transactions — Investment security transactions are recorded as of the trade date. Gains or losses realized on investment transactions are determined by comparing the identified cost of the security lot sold with the net sales proceeds. |
| (D) | Certain Investment Risks — The Funds may utilize derivative instruments including options, futures, and other instruments with similar characteristics to the extent that they are consistent with the Funds’ investment objectives and limitations. The Funds intend to use such derivative instruments primarily to hedge or protect itself from adverse movements in securities’ prices, foreign currencies, or interest rates. The use of these instruments involves certain risks, including the possibility that the future value of the underlying assets or indices fluctuate (in the case of futures and options), the derivative becomes illiquid, an imperfect correlation arises between the value of the derivative and the underlying assets or indices, or that the counterparty fails to perform its obligations when due. |
Investments in foreign-denominated assets or forward foreign currency contracts may involve greater risks than domestic investments such as foreign-related risks created by currency rate fluctuations, foreign political and economic instability, foreign financial reporting standards and taxes, and foreign securities markets and issuer regulation. Foreign securities may be less liquid than domestic securities.
| (E) | Futures — Upon entering into a futures contract, the Funds segregate cash and/or other liquid investments equal to the minimum “initial margin” requirements of the exchange and the futures commission merchant or broker. Each Fund designates liquid securities as collateral on open futures contracts. During the term of the futures contract, the Funds also receive credit from, or pay to, the futures commission merchant or broker an amount of cash or liquid assets equal to the daily fluctuation in the value of the futures contract. Such receipts or payments are known as “variation margin” and are recorded as unrealized gains or losses by the Funds. When the futures contract is closed, a realized gain or loss is recorded equal to the difference between the value of the futures contract at the time it was opened and the value at the time it was closed. |
| (F) | Written Options — The Funds may write put or call options. Premiums received by the Funds upon writing put or call options are recorded as an asset with a corresponding liability that is subsequently adjusted daily to the current market value of the option. Changes between the initial premiums received and the current market value of the options are recorded as unrealized gains or losses by the Funds. When a written option is closed, expired, or exercised, the Funds realize a gain or loss and the liability is eliminated. The Funds continue to bear the risk of adverse movements in the price of the underlying asset during the period of the written option, although any potential loss during the period would be reduced by the amount of the option premium received by the Funds. Each Fund designates liquid securities or cash on its books to cover its financial exposure on open written options contracts. |
| (G) | Foreign Currency Conversion — Securities and other assets and liabilities initially expressed in foreign currencies are converted daily into U.S. dollars based upon current exchange rates. Purchases and sales of foreign securities and foreign income are converted into U.S. dollars based upon currency exchange rates prevailing on the respective dates of such transactions. The effect of changes in foreign exchange rates on realized and unrealized security gains or losses is reflected as a component of such gains or losses. |
| (H) | Forward Foreign Currency Exchange Contracts — Forward foreign currency exchange contracts are valued at the forward rate and are marked-to-market daily. The change in market value is recorded as an unrealized gain or loss. When the contract is closed, the Funds record an exchange gain or loss equal to the difference between the value of the contract at the time it was opened and the value at the time it was closed. |
115
NOTES TO FINANCIAL STATEMENTS (continued)
December 31, 2004
| (I) | Short Positions — The Funds may engage in short sale transactions. For financial statement purposes, an amount equal to the settlement amount is included in the Statements of Assets and Liabilities as an asset and an equivalent liability. |
The amount of the liability is subsequently marked-to-market to reflect the current value of the short position. Changes between the amount of the liability and the current market value of the short positions are recorded as unrealized gains or losses. The Funds are liable to the buyer for any dividends payable on securities while those securities are in a short position. These dividends are an expense of the Fund and are included in Other Expenses in the Statement of Operations. If the Funds sell securities short while also holding the long position in the security, they may protect unrealized gains but will lose the opportunity to profit on such securities if the price rises. If the Funds sell securities short when not holding the long position in the security, they will experience a loss if the market price of the security increases between the date of the short sale and the date the security is replaced.
| (J) | Repurchase Agreements — The Funds may enter into repurchase agreements with institutions that the Funds’ investment advisor, Strong Capital Management, Inc. (the “Advisor”), has determined are creditworthy. Each repurchase transaction is recorded at cost, which approximates fair value. The Funds require that the collateral, represented by cash and/or securities (primarily U.S. government securities), in a repurchase transaction be maintained in a segregated account under the control of the Funds’ custodial bank in a manner sufficient to enable the Funds to liquidate those securities in the event of a default of the counterparty. On a daily basis, the Funds’ custodial bank monitors the value of the collateral, including accrued interest, to ensure it is at least equal to the amounts owed to the Funds under each repurchase agreement. |
| (K) | Securities Lending — The Funds, except Strong Advisor Utilities and Energy Fund and Strong Advisor Large Company Core Fund, have entered into a Securities Lending Agreement (the “Agreement”) with State Street Bank and Trust Company. Under the terms of the Agreement, the Funds may lend portfolio securities to qualified institutional borrowers in order to earn additional income. The Agreement requires that loans are collateralized at all times by cash and cash equivalents equal to at least 102% of the market value of the aggregate loaned securities, plus accrued interest, and the collateral is marked-to-market daily. Cash collateral received is invested in repurchase agreements, investment funds, government obligations, and/or bank obligations. |
At December 31, 2004, Strong Advisor Common Stock Fund and Strong Advisor U.S. Value Fund had securities with a market value of $51,720,204 and $8,841,705, respectively, on loan and had received $53,056,922 and $9,099,275, respectively, in collateral (both are included within Investments in the Statements of Assets and Liabilities). Amounts earned as interest on investments of cash collateral, net of rebates and other securities lending expenses, are included in Interest Income in the Statements of Operations. For the year ended December 31, 2004, the securities lending income totaled, $143,323, $987, and $12,336 for Strong Advisor Common Stock Fund, Strong Advisor Mid Cap Growth Fund, and Strong Advisor U.S. Value Fund, respectively.
The three primary risks associated with securities lending are: a borrower defaulting on its obligation to return the securities loaned resulting in a shortfall on the posted collateral; a principal loss arising from the lending agent’s investment of cash collateral; and the inability of the lending Fund to recall a security in time to exercise valuable voting rights or sell the security. In each case, the lending agent has indemnified the Funds for these types of losses.
| (L) | Directed Brokerage — Through November 30, 2004, the Funds directed certain portfolio trades to brokers who, in turn, paid a portion of the Funds’ expenses not attributable to the Advisor or its affiliates. Such amounts are included in Expense Waivers and Offsets reported in the Funds’ Statements of Operations and in Note 4. |
| (M) | Earnings Credit Arrangements — Credits are earned on positive cash balances maintained in custodian accounts. |
These credits serve to reduce the custodian’s fees incurred by certain Funds and are included in Expense Waivers and Offsets reported in the Funds’ Statements of Operations and in Note 4.
| (N) | Expenses — The Funds and other affiliated Strong Funds contract for certain services on a collective basis. The majority of the expenses are directly identifiable to an individual Fund. Expenses that are not readily identifiable to a specific Fund will be allocated in such a manner as deemed equitable, taking into consideration, among other things, the nature and type of expense and the relative sizes of the Strong Funds. |
| (O) | Use of Estimates — The preparation of financial statements in conformity with accounting principles generally accepted in the United States of America requires management to make estimates and assumptions that affect the reported amounts in these financial statements. Actual results could differ from those estimates. |
| (P) | Indemnifications — In the normal course of business, the Funds enter into contracts with service providers that contain general indemnification clauses. The Funds’ maximum exposure under these arrangements is unknown, as this would involve future claims that may be made against the Funds that have not yet occurred. However, based on experience, the Funds expect the risk of material loss to be remote under any of these indemnification agreements. |
116
| (Q) | Redemption Fees — Class A shares of Strong Advisor Large Company Core Fund held for 360 calendar days or less after purchase are subject to a redemption fee of 1.00%, based on the redeemed share’s market value. Class A, B, and C shares of Strong Advisor International Core Fund held for thirty calendar days or less after purchase are subject to a redemption fee of 1.00%, based on the redeemed share’s market value. Redemption fees are paid directly to the Funds. The amount collected for the period is included in Capital Stock reported in the Statements of Assets and Liabilities and in Note 8. Strong Advisor International Core Fund did not collect any redemption fees during the period. |
| (R) | Other — Dividend income, net of applicable withholding taxes, and distributions to shareholders are recorded on the ex-dividend date. Interest income is recorded on the accrual basis and includes amortization of premiums and discounts on the interest method. Income, expenses (other than expenses attributable to a specific class), and realized and unrealized gains or losses on investments are allocated to each class of shares based on its relative shares outstanding. |
| 3. | Related Party Transactions |
The Advisor provides investment advisory and related services to the Funds. Strong Investor Services, Inc. (the “Administrator”), an affiliate of the Advisor, provides administrative, transfer agent, and related services to the Funds. Certain officers are affiliated with the Advisor and the Administrator. Investment advisory and administration fees, which are established by terms of the advisory and administration agreements, are based on the following annualized rates of the average daily net assets of the respective Fund:
| Administrative Fees | ||||||||||||||||||
| Advisory Fees(1) | Class A | Class B | Class C | Class K | Class Z | |||||||||||||
Strong Advisor Common Stock Fund | 0.75 | % | 0.30 | % | 0.30 | % | 0.30 | % | * | 0.30 | % | |||||||
Strong Advisor Mid Cap Growth Fund | 0.75 | % | 0.30 | % | 0.30 | % | 0.30 | % | * | 0.30 | % | |||||||
Strong Advisor Small Cap Value Fund | 0.75 | % | 0.30 | % | 0.30 | % | 0.30 | % | * | 0.30 | % | |||||||
Strong Advisor U.S. Value Fund | 0.55 | % | 0.30 | % | 0.30 | % | 0.30 | % | 0.25 | % | 0.30 | % | ||||||
Strong Advisor Endeavor Large Cap Fund | 0.75 | % | 0.30 | % | 0.30 | % | 0.30 | % | * | * | ||||||||
Strong Advisor Focus Fund | 0.75 | % | 0.30 | % | 0.30 | % | 0.30 | % | * | * | ||||||||
Strong Advisor International Core Fund | 0.75 | % | 0.30 | % | 0.30 | % | 0.30 | % | * | * | ||||||||
Strong Advisor Select Fund | 0.75 | % | 0.30 | % | 0.30 | % | 0.30 | % | * | * | ||||||||
Strong Advisor Technology Fund | 0.75 | % | 0.30 | % | 0.30 | % | 0.30 | % | * | * | ||||||||
Strong Advisor U.S. Small/Mid Cap Growth Fund | 0.75 | % | 0.30 | % | 0.30 | % | 0.30 | % | * | * | ||||||||
Strong Advisor Utilities and Energy Fund | 0.75 | % | 0.30 | % | 0.30 | % | 0.30 | % | * | * | ||||||||
Strong Advisor Large Company Core Fund | 0.75 | % | 0.30 | % | 0.30 | % | 0.30 | % | 0.25 | % | * | |||||||
| * | Does not offer share class. |
| (1) | The investment advisory fees are 0.75% for assets under $4 billion, 0.725% for the next $2 billion assets, and 0.70% for assets $6 billion and above. Strong Advisor U.S. Value Fund does not have a breakpoint schedule. |
The Funds’ Advisor and/or Administrator may voluntarily waive or absorb certain expenses at their discretion. The Advisor and/or Administrator has contractually agreed to waive and/or absorb expenses for the following Funds until May 1, 2005, to keep Net Annual Operating Expenses at or below the following percentages:
| Class A | Class B | Class C | Class K | Class Z | |||||||||||
Strong Advisor Common Stock Fund | * | 2.50 | % | * | * | * | * | ||||||||
Strong Advisor Mid Cap Growth Fund | * | 2.50 | % | 2.50 | % | * | * | * | |||||||
Strong Advisor Small Cap Value Fund | * | * | * | * | * | * | |||||||||
Strong Advisor U.S. Value Fund | 2.50 | % | 2.50 | % | 2.50 | % | 0.99 | % | * | ||||||
Strong Advisor Endeavor Large Cap Fund | * | 2.50 | % | 2.50 | % | * | * | * | * | ||||||
Strong Advisor Focus Fund | 2.50 | % | 2.50 | % | 2.50 | % | * | * | * | * | |||||
Strong Advisor International Core Fund | 2.50 | % | 2.50 | % | 2.50 | % | * | * | * | * | |||||
Strong Advisor Select Fund | 2.50 | % | 2.50 | % | 2.50 | % | * | * | * | * | |||||
Strong Advisor Technology Fund | 2.50 | % | 2.50 | % | 2.50 | % | * | * | * | * | |||||
Strong Advisor U.S. Small/Mid Cap Growth Fund | 2.50 | % | 2.50 | % | 2.50 | % | * | * | * | * | |||||
Strong Advisor Utilities and Energy Fund | * | * | * | * | * | * | * | ||||||||
Strong Advisor Large Company Core Fund | 1.50 | %(1) | 2.50 | % | 2.50 | % | 0.99 | % | * | * |
| * | Contractual rate not applicable to Class. |
| ** | Does not offer share class. |
| (1) | The contractual rate is indefinite and may only be terminated by the Board of Directors of the Funds, but not before May 1, 2005. |
117
NOTES TO FINANCIAL STATEMENTS (continued)
December 31, 2004
Pursuant to the direction of the Board and in implementation of certain regulatory settlements (as described in Note 10), the Advisor has contractually agreed to waive its fees and/or absorb expenses in the amount of 0.010% for the Strong Advisor Focus Fund and 0.033% for the Funds with the exception of the Strong Advisor Focus Fund and the Strong Advisor International Core Fund from May 21, 2004 until May 21, 2005. However, the Funds are expected to reorganize into the Wells Fargo Funds family on April 11, 2005 and be subject to a different expense structure. Transfer agent and related service fees for Class Z shares are paid at an annual rate of $27.00 for each open shareholder account and $4.20 for each closed shareholder account. Transfer agent and related service fees for each of the Funds’ Class A, B, C, and K shares are paid at an annual rate of 0.20% of the average daily net assets of each respective class. Transfer agent fees are recorded in Shareholder Servicing Costs in the Funds’ Statements of Operations and in Note 4. The Administrator also allocates to each Fund certain charges or credits resulting from transfer agency banking activities based on each Class level of subscription and redemption activity. Transfer Agency Banking Charges allocated to the Funds by the Administrator, if any, are included in Other Expenses in the Funds’ Statements of Operations and in Note 4. Transfer Agency Banking Credits allocated by the Administrator, if any, serve to reduce the transfer agency expenses incurred by the Funds and are included in Expense Waivers and Offsets in the Funds’ Statements of Operations and in Note 4. The Administrator is also compensated for certain other out-of-pocket expenses related to transfer agent services.
The Funds have adopted a Rule 12b-1 distribution and service plan under the 1940 Act on behalf of each of the Funds’ Class A, B, and C shares. Under the plan, Strong Investments, Inc. (the “Distributor” and an affiliate of the Advisor) is paid an annual rate of 0.25%, 1.00%, and 1.00% of the average daily net assets of the Class A, B, and C shares, respectively, as compensation for services provided and expenses incurred, including amounts paid to brokers or dealers, in connection with the sale of each Fund’s Class A, B, and C shares. See Note 4.
The Funds’ Class A, B, and C shares have sales charges (loads) charged to shareholders. The Funds’ Class A shares have a maximum 5.75% front-end sales charge. The Funds’ Class A shares, except Strong Advisor Large Company Core Fund, may be subject to a 1.00% contingent deferred sales charge if shares are purchased without an initial sales charge and are redeemed within one year of purchase (usually on purchases of $1,000,000 or more). The Funds’ Class B shares have a maximum 5.00% contingent deferred sales charge. The Funds’ Class C shares have a maximum 1.00% contingent deferred sales charge if the shares are sold within one year of their original purchase date. Sales charges are not an expense of the Funds and are not reflected in the financial statements of the Funds. Certain of these sales charges may be waived in limited circumstances.
For the year ended December 31, 2004, the Distributor received aggregate sales charges from the sale of Class A shares as follows: Strong Advisor Common Stock Fund $6,995, Strong Advisor Mid Cap Growth Fund $1,526, Strong Advisor Small Cap Value Fund $11,071, Strong Advisor U.S. Value Fund $1,394, Strong Advisor Endeavor Large Cap Fund $833, Strong Advisor Focus Fund $8, Strong Advisor International Core Fund $623, Strong Advisor Select Fund $8,144, Strong Advisor Technology Fund $0, Strong Advisor U.S. Small/Mid Cap Growth Fund $2,085, Strong Advisor Utilities and Energy Fund $3,104, and Strong Advisor Large Company Core Fund $11,178.
For the year ended December 31, 2004, the Distributor received aggregate contingent deferred sales charges from the redemption of Class A, B, and C shares as follows: Strong Advisor Common Stock Fund $117,659, Strong Advisor Mid Cap Growth Fund $13,467, Strong Advisor Small Cap Value Fund $292,835, Strong Advisor U.S. Value Fund $18,810, Strong Advisor Endeavor Large Cap Fund $7,310, Strong Advisor Focus Fund $10,747, Strong Advisor International Core Fund $249, Strong Advisor Select Fund $3,297, Strong Advisor Technology Fund $1,983, Strong Advisor U.S. Small/Mid Cap Growth Fund $5,324, Strong Advisor Utilities and Energy Fund $0, and Strong Advisor Large Company Core Fund $33,497.
Through December 31, 2004, Next Century Growth Investors, LLC (“Next Century Growth”), an affiliate of the Advisor, managed the investments of Strong Advisor U.S. Small/Mid Cap Growth Fund under a subadvisory agreement with the Advisor. Next Century Growth was compensated by the Advisor (not the Fund) and assumed all of its own expenses in providing subadvisory services.
Through December 31, 2004, W.H. Reaves & Co., Inc. (“Reaves”) managed the investments of Strong Advisor Utilities and Energy Fund under a subadvisory agreement with the Advisor. Reaves was compensated by the Advisor (not the Fund) and assumed all of its own expenses in providing subadvisory services. The investment subadvisory fees were based on breakpoints ranging from net asset values of $200 million to $2.5 billion. The investment subadvisory fees were also subject to adjustment upward or downward depending on the Fund’s performance measured against a benchmark. The benchmark is 90% of the performance of a blend of utilities and energy indices. In addition, Reaves directly affected purchases and sales of securities for the Fund. In conjunction therewith, brokerage commissions paid to Reaves by the Fund for the year ended December 31, 2004, totaled $27,577.
The Funds may invest cash in money market funds managed by the Advisor, subject to certain limitations set by the Fund’s Board of Directors and applicable law.
118
Certain information regarding related party transactions, excluding the effects of waivers and absorptions, for the year ended December 31, 2004, is as follows:
| Payable to/ (Receivable from) Advisor or Administrator at Dec. 31, 2004 | Shareholder Servicing and Other Related Expenses Paid to Administrator | Transfer Agency Banking Charges/(Credits) | Unaffiliated Directors’ and Independent Officers’ Fees | |||||||||||
Strong Advisor Common Stock Fund | $ | 238,871 | $ | 3,096,442 | $ | 1,218 | $ | 61,522 | ||||||
Strong Advisor Mid Cap Growth Fund | 22,907 | 305,003 | 2,063 | 3,294 | ||||||||||
Strong Advisor Small Cap Value Fund | 385,320 | 5,106,123 | 714 | 75,486 | ||||||||||
Strong Advisor U.S. Value Fund | 85,094 | 1,000,805 | 24,495 | 11,784 | ||||||||||
Strong Advisor Endeavor Large Cap Fund | 10,437 | 79,810 | 1,877 | 2,058 | ||||||||||
Strong Advisor Focus Fund | (798 | ) | 5,589 | 18 | 973 | |||||||||
Strong Advisor International Core Fund | (14 | ) | 3,715 | 18 | 919 | |||||||||
Strong Advisor Select Fund | 17,733 | 158,480 | 1,622 | 3,297 | ||||||||||
Strong Advisor Technology Fund | 71 | 3,196 | (7 | ) | 934 | |||||||||
Strong Advisor U.S. Small/Mid Cap Growth Fund | 554 | 11,234 | 51 | 992 | ||||||||||
Strong Advisor Utilities and Energy Fund | 2,570 | 18,137 | 8 | 1,223 | ||||||||||
Strong Advisor Large Company Core Fund | 15,008 | 214,747 | 782 | 3,695 | ||||||||||
At December 31, 2004, Strong Financial Corporation, the Advisor’s parent, owned 11% and 12% of the outstanding shares of Strong Advisor U.S. Small/Mid Cap Growth Fund and Strong Advisor Utilities and Energy Fund, respectively.
At December 31, 2004, the Distributor owned 18% of the outstanding shares of Strong Advisor International Core Fund.
119
NOTES TO FINANCIAL STATEMENTS (continued)
December 31, 2004
| 4. | Expenses and Expense Waivers and Offsets |
For the year ended December 31, 2004, the class specific expenses are as follows:
| Administrative Fees | Shareholder Servicing Costs | Reports to Shareholders | 12b-1 Fees | Other | |||||||||||
Strong Advisor Common Stock Fund | |||||||||||||||
Class A | $ | 228,909 | $ | 154,099 | $ | 29,502 | $ | 190,757 | $ | 38 | |||||
Class B | 112,002 | 77,638 | 10,795 | 373,340 | 180 | ||||||||||
Class C | 89,390 | 61,670 | 15,923 | 297,967 | 1,572 | ||||||||||
Class Z | 3,833,576 | 2,799,279 | 350,153 | — | 3,378 | ||||||||||
Strong Advisor Mid Cap Growth Fund | |||||||||||||||
Class A | 28,000 | 18,965 | 11,485 | 23,334 | 172 | ||||||||||
Class B | 8,431 | 6,239 | 707 | 28,102 | 22 | ||||||||||
Class C | 1,908 | 1,408 | 80 | 6,359 | 24 | ||||||||||
Class Z | 154,054 | 277,430 | 74,689 | — | 2,807 | ||||||||||
Strong Advisor Small Cap Value Fund | |||||||||||||||
Class A | 1,789,907 | 1,215,772 | 199,186 | 1,491,589 | 122 | ||||||||||
Class B | 374,862 | 270,132 | 41,128 | 1,249,541 | 1,140 | ||||||||||
Class C | 449,504 | 316,101 | 62,582 | 1,498,348 | 2,329 | ||||||||||
Class Z | 3,544,194 | 3,301,167 | 404,982 | — | 1,725 | ||||||||||
Strong Advisor U.S. Value Fund | |||||||||||||||
Class A | 13,364 | 9,167 | 1,915 | 11,136 | 163 | ||||||||||
Class B | 17,261 | 12,228 | 2,209 | 57,538 | 46 | ||||||||||
Class C | 12,969 | 9,498 | 3,897 | 43,232 | 827 | ||||||||||
Class K | 206,023 | 164,821 | 685 | — | 4,619 | ||||||||||
Class Z | 697,798 | 803,956 | 248,618 | — | 19,976 | ||||||||||
Strong Advisor Endeavor Large Cap Fund | |||||||||||||||
Class A | 115,573 | 77,070 | 5,584 | 96,310 | 1,881 | ||||||||||
Class B | 2,466 | 1,709 | 284 | 8,219 | 3 | ||||||||||
Class C | 1,288 | 931 | 437 | 4,292 | 92 | ||||||||||
Strong Advisor Focus Fund | |||||||||||||||
Class A | 3,465 | 2,433 | 388 | 2,887 | 11 | ||||||||||
Class B | 3,259 | 2,499 | 555 | 10,865 | 10 | ||||||||||
Class C | 833 | 633 | 208 | 2,775 | 22 | ||||||||||
Strong Advisor International Core Fund | |||||||||||||||
Class A | 1,867 | 1,288 | 252 | 1,556 | 7 | ||||||||||
Class B | 2,723 | 1,945 | 374 | 9,119 | 9 | ||||||||||
Class C | 683 | 477 | 106 | 2,288 | 7 | ||||||||||
Strong Advisor Select Fund | |||||||||||||||
Class A | 231,919 | 154,690 | 4,166 | 193,266 | 1,624 | ||||||||||
Class B | 2,809 | 1,966 | 371 | 9,444 | 3 | ||||||||||
Class C | 2,506 | 1,781 | 402 | 8,380 | 37 | ||||||||||
Strong Advisor Technology Fund | |||||||||||||||
Class A | 2,376 | 1,614 | 426 | 1,980 | 12 | ||||||||||
Class B | 1,552 | 1,087 | 291 | 5,174 | 4 | ||||||||||
Class C | 653 | 475 | 212 | 2,172 | 11 | ||||||||||
Strong Advisor U.S. Small/Mid Cap Growth Fund | |||||||||||||||
Class A | 7,660 | 5,203 | 1,077 | 6,383 | 32 | ||||||||||
Class B | 4,100 | 2,821 | 611 | 13,666 | 11 | ||||||||||
Class C | 4,226 | 2,890 | 1,615 | 14,086 | 329 | ||||||||||
Strong Advisor Utilities and Energy Fund | |||||||||||||||
Class A | 25,554 | 17,057 | 215 | 21,295 | 21 | ||||||||||
Class B | 858 | 593 | 65 | 2,875 | 4 | ||||||||||
Class C | 674 | 464 | 87 | 2,246 | 5 | ||||||||||
Strong Advisor Large Company Core Fund | |||||||||||||||
Class A | 182,630 | 122,861 | 6,193 | 152,191 | 252 | ||||||||||
Class B | 25,472 | 17,722 | 3,876 | 84,905 | 57 | ||||||||||
Class C | 21,976 | 15,184 | 12,068 | 73,253 | 734 | ||||||||||
Class K | 72,873 | 58,298 | 9,478 | — | 420 | ||||||||||
120
For the year ended December 31, 2004, the class specific expense waivers and offsets are as follows:
Expense and | Transfer Agency Banking Credits | Directed Brokerage | Earnings Credits | |||||||||||||
Strong Advisor Common Stock Fund | ||||||||||||||||
Class A | $ | (4,691 | ) | $ | (194 | ) | $ | — | $ | — | ||||||
Class B | (3,438 | ) | — | — | — | |||||||||||
Class C | (3,323 | ) | — | — | — | |||||||||||
Class Z | (25,848 | ) | — | — | — | |||||||||||
Fund Level | (410,853 | ) | — | (95,052 | ) | (425 | ) | |||||||||
Strong Advisor Mid Cap Growth Fund | ||||||||||||||||
Class A | (752 | ) | — | — | — | |||||||||||
Class B | (548 | ) | — | — | — | |||||||||||
Class C | (226 | ) | — | — | — | |||||||||||
Class Z | (6,626 | ) | — | — | — | |||||||||||
Fund Level | (18,890 | ) | — | (6,030 | ) | (66 | ) | |||||||||
Strong Advisor Small Cap Value Fund | ||||||||||||||||
Class A | (47,064 | ) | (1,116 | ) | — | — | ||||||||||
Class B | (15,004 | ) | — | — | — | |||||||||||
Class C | (16,535 | ) | — | — | — | |||||||||||
Class Z | (45,370 | ) | (535 | ) | — | — | ||||||||||
Fund Level | (603,883 | ) | — | (100,922 | ) | (1,217 | ) | |||||||||
Strong Advisor U.S. Value Fund | ||||||||||||||||
Class A | (596 | ) | — | — | — | |||||||||||
Class B | (765 | ) | — | — | — | |||||||||||
Class C | (879 | ) | — | — | — | |||||||||||
Class K | (62,507 | ) | — | — | — | |||||||||||
Class Z | (7,497 | ) | — | — | — | |||||||||||
Fund Level | (100,280 | ) | — | (37,546 | ) | (88 | ) | |||||||||
Strong Advisor Endeavor Large Cap Fund | ||||||||||||||||
Class A | (60 | ) | — | — | — | |||||||||||
Class B | (45 | ) | — | — | — | |||||||||||
Class C | (279 | ) | — | — | — | |||||||||||
Fund Level | (12,224 | ) | — | (2,821 | ) | (12 | ) | |||||||||
Strong Advisor Focus Fund | ||||||||||||||||
Class A | (9,011 | ) | — | — | — | |||||||||||
Class B | (14,500 | ) | — | — | — | |||||||||||
Class C | (3,674 | ) | — | — | — | |||||||||||
Fund Level | (24,762 | ) | — | (1,272 | ) | (4 | ) | |||||||||
Strong Advisor International Core Fund | ||||||||||||||||
Class A | (4,971 | ) | — | — | — | |||||||||||
Class B | (14,170 | ) | — | — | — | |||||||||||
Class C | (3,560 | ) | — | — | — | |||||||||||
Fund Level | (70,114 | ) | — | (142 | ) | (2 | ) | |||||||||
Strong Advisor Select Fund | ||||||||||||||||
Class A | (354 | ) | — | — | — | |||||||||||
Class B | (65 | ) | — | — | — | |||||||||||
Class C | (41 | ) | — | — | — | |||||||||||
Fund Level | (23,829 | ) | — | (4,420 | ) | (132 | ) | |||||||||
Strong Advisor Technology Fund | ||||||||||||||||
Class A | (6,788 | ) | (14 | ) | — | — | ||||||||||
Class B | (8,216 | ) | — | — | — | |||||||||||
Class C | (3,622 | ) | — | — | — | |||||||||||
Fund Level | (29,255 | ) | — | (9,994 | ) | (1 | ) | |||||||||
Strong Advisor U.S. Small/Mid Cap Growth Fund | ||||||||||||||||
Class A | (3,377 | ) | — | — | — | |||||||||||
Class B | (12,388 | ) | — | — | — | |||||||||||
Class C | (13,810 | ) | — | — | — | |||||||||||
Fund Level | (1,783 | ) | — | (2,257 | ) | (5 | ) | |||||||||
Strong Advisor Utilities and Energy Fund | ||||||||||||||||
Class A | (199 | ) | — | — | — | |||||||||||
Class B | (614 | ) | — | — | — | |||||||||||
Class C | (532 | ) | — | — | — | |||||||||||
Fund Level | (2,817 | ) | — | — | (11 | ) | ||||||||||
121
NOTES TO FINANCIAL STATEMENTS (continued)
December 31, 2004
Expense and | Transfer Agency Banking Credits | Directed Brokerage | Earnings Credits | ||||||||||||
Strong Advisor Large Company Core Fund | |||||||||||||||
Class A | $ | (69,744 | ) | $ | — | $ | — | $ | — | ||||||
Class B | (702 | ) | — | — | — | ||||||||||
Class C | (5,404 | ) | — | — | — | ||||||||||
Class K | (100,269 | ) | — | — | — | ||||||||||
Fund Level | (30,498 | ) | — | (12,836 | ) | (263 | ) | ||||||||
| * | These amounts include the contractually agreed upon waivers of fees and/or absorptions of expenses for the period from May 21, 2004 thru December 31, 2004 pursuant to the direction of the Board and in implementation of certain regulatory settlements as discussed in Note 3 and in Note 10. These amounts also include reimbursement by the Advisor for the legal costs incurred by the funds for the legal and regulatory matters discussed in Note 10. |
| 5. | Line of Credit |
The Strong Funds have established a line of credit agreement (“LOC”) with certain financial institutions, which expires June 30, 2005, to be used for temporary or emergency purposes. Combined borrowings among all participating Strong Funds are subject to a $200 million cap on the total LOC. For an individual Fund, borrowings under the LOC are limited to either the lesser of 15% of the market value of the Fund’s total assets or any explicit borrowing limits in the Fund’s registration statement. The principal amount of each borrowing under the LOC is due not more than 45 days after the date of the borrowing. Borrowings under the LOC bear interest based on prevailing market rates as defined in the LOC. A commitment fee of 0.09% per annum is incurred on the unused portion of the LOC and is allocated to all participating Strong Funds based on their net asset values. For the year ended December 31, 2004, there were no borrowings by Strong Advisor Common Stock Fund, Strong Advisor Mid Cap Growth Fund, Strong Advisor Small Cap Value Fund, Strong Advisor Focus Fund, Strong Advisor International Core Fund, Strong Advisor Select Fund, and Strong Advisor Utilities and Energy Fund under the LOC. Strong Advisor U.S. Value Fund, Strong Advisor Endeavor Large Cap Fund, Strong Advisor Technology Fund, Strong Advisor U.S. Small/Mid Cap Growth Fund, and Strong Advisor Large Company Core Fund had minimal borrowings under the LOC during the year. At December 31, 2004, there were no outstanding borrowings by the Funds under the LOC.
| 6. | Investment Transactions |
The aggregate purchases and sales of long-term securities during the year ended December 31, 2004, are as follows:
| Purchases | Sales | |||||
Strong Advisor Common Stock Fund | $ | 566,676,111 | $ | 958,239,833 | ||
Strong Advisor Mid Cap Growth Fund | 121,247,814 | 135,162,532 | ||||
Strong Advisor Small Cap Value Fund | 675,712,823 | 998,506,759 | ||||
Strong Advisor U.S. Value Fund | 189,733,438 | 149,740,704 | ||||
Strong Advisor Endeavor Large Cap Fund | 66,620,929 | 67,956,459 | ||||
Strong Advisor Focus Fund | 2,405,452 | 3,522,520 | ||||
Strong Advisor International Core Fund | 960,798 | 468,004 | ||||
Strong Advisor Select Fund | 132,026,280 | 135,125,674 | ||||
Strong Advisor Technology Fund | 2,138,389 | 2,744,820 | ||||
Strong Advisor U.S. Small/Mid Cap Growth Fund | 6,060,712 | 6,839,594 | ||||
Strong Advisor Utilities and Energy Fund | 10,079,864 | 19,422,253 | ||||
Strong Advisor Large Company Core Fund | 198,895,465 | 230,876,092 | ||||
There were no purchases or sales of long-term U.S. government securities during the year ended December 31, 2004.
122
| 7. | Income Tax Information |
The following information for the Funds is presented on an income tax basis as of December 31, 2004:
| Cost of Investments | Gross Unrealized Appreciation | Gross Unrealized (Depreciation) | Net Unrealized Appreciation/ (Depreciation) on Investments | Distributable Ordinary Income | Distributable Long-Term Capital Gains | ||||||||||||||
Strong Advisor Common Stock Fund | $ | 1,005,219,718 | $ | 361,469,810 | $ | (13,111,869 | ) | $ | 348,357,941 | $ | — | $ | 20,778,680 | ||||||
Strong Advisor Mid Cap Growth Fund | 50,046,026 | 17,730,197 | (69,073 | ) | 17,661,124 | — | — | ||||||||||||
Strong Advisor Small Cap Value Fund | 1,569,481,534 | 745,687,438 | (33,855,220 | ) | 711,832,218 | 13,371,489 | 16,024,017 | ||||||||||||
Strong Advisor U.S. Value Fund | 312,279,155 | 61,974,300 | (4,246,833 | ) | 57,727,467 | 320,753 | 2,740,644 | ||||||||||||
Strong Advisor Endeavor Large Cap Fund | 37,081,188 | 7,490,637 | (261,853 | ) | 7,228,784 | — | — | ||||||||||||
Strong Advisor Focus Fund | 1,810,776 | 702,229 | (5,664 | ) | 696,565 | — | — | ||||||||||||
Strong Advisor International Core Fund | 1,751,637 | 540,589 | (6,298 | ) | 534,291 | 600 | 4,561 | ||||||||||||
Strong Advisor Select Fund | 81,429,500 | 16,572,411 | (555,516 | ) | 16,016,895 | — | 2,476,574 | ||||||||||||
Strong Advisor Technology Fund | 1,399,325 | 193,063 | (91,766 | ) | 101,297 | — | — | ||||||||||||
Strong Advisor U.S. Small/Mid Cap Growth Fund | 3,855,915 | 1,333,659 | (11,709 | ) | 1,321,950 | — | — | ||||||||||||
Strong Advisor Utilities and Energy Fund | 1,632,097 | 302,710 | (6,763 | ) | 295,947 | 89,028 | 93,449 | ||||||||||||
Strong Advisor Large Company Core Fund | 81,988,625 | 14,209,053 | (354,378 | ) | 13,854,675 | 1,105,436 | 271,747 | ||||||||||||
The difference between cost amounts for financial statement and federal income tax purposes is due primarily to timing differences in recognizing certain gains and losses on security transactions.
The tax components of dividends paid during the years ended December 31, 2004 and 2003 and capital loss carryovers (expiring in varying amounts through 2012) as of December 31, 2004, and tax basis post-October losses as of December 31, 2004, which are not recognized for tax purposes until the first day of the following fiscal year, are:
| 2004 Income Tax Information | 2003 Income Tax Information | |||||||||||||||||
| Ordinary Income Distributions | Long-Term Gains | Net Capital Loss Carryovers | Post-October Losses | Ordinary Income Distributions | Long-Term Capital Gains Distributions | |||||||||||||
Strong Advisor Common Stock Fund | $ | — | $ | 91,698,461 | $ | — | $ | — | $ | — | $ | — | ||||||
Strong Advisor Mid Cap Growth Fund | — | — | 108,011,874 | — | — | — | ||||||||||||
Strong Advisor Small Cap Value Fund | 23,373,468 | 218,221,859 | — | — | 793,398 | 49,600,777 | ||||||||||||
Strong Advisor U.S. Value Fund | 15,252,146 | 12,492,467 | — | — | 1,833,699 | — | ||||||||||||
Strong Advisor Endeavor Large Cap Fund | — | — | 90,931 | — | — | — | ||||||||||||
Strong Advisor Focus Fund | — | — | 4,068,581 | — | — | — | ||||||||||||
Strong Advisor International Core Fund | 42,765 | 43,977 | — | — | 19,549 | — | ||||||||||||
Strong Advisor Select Fund | — | 5,687,370 | — | — | — | — | ||||||||||||
Strong Advisor Technology Fund | — | — | 567,403 | 7,749 | — | — | ||||||||||||
Strong Advisor U.S. Small/Mid Cap Growth Fund | — | — | 532,011 | 66,115 | — | — | ||||||||||||
Strong Advisor Utilities and Energy Fund | 362,658 | 411,177 | — | — | 184,358 | — | ||||||||||||
Strong Advisor Large Company Core Fund | 2,041,005 | 6,303,600 | — | — | 71,868 | 101,831 | ||||||||||||
For corporate shareholders in the Funds, the percentages of ordinary dividend income distributed for the year ended December 31, 2004, which is designated as qualifying for the dividends-received deduction, is as follows (unaudited): Strong Advisor Common Stock Fund 0.0%, Strong Advisor Mid Cap Growth Fund 0.0%, Strong Advisor Small Cap Value Fund 37.9%, Strong Advisor U.S. Value Fund 49.6%, Strong Advisor Endeavor Large Cap Fund 0.0%, Strong Advisor Focus Fund 0.0%, Strong Advisor International Core Fund 0.0%, Strong Advisor Select Fund 0.0%, Strong Advisor Technology Fund 0.0%, Strong Advisor U.S. Small/Mid Cap Growth Fund 0.0%, Strong Advisor Utilities and Energy Fund 58.7%, and Strong Advisor Large Company Core Fund 9.8%.
For shareholders in the Funds, the percentages of dividend income distributed for the year ended December 31, 2004, which is designated as qualified dividend income under the Jobs and Growth Tax Relief Reconciliation Act of 2003, is as follows (unaudited): Strong Advisor Common Stock Fund 0.0%, Strong Advisor Mid Cap Growth Fund 0.0%, Strong Advisor Small Cap Value Fund 23.6%, Strong Advisor U.S. Value Fund 48.4%, Strong Advisor Endeavor Large Cap Fund 0.0%, Strong Advisor Focus Fund 0.0%, Strong Advisor International Core Fund 94.5%, Strong Advisor Select Fund 0.0%, Strong Advisor Technology Fund 0.0%, Strong Advisor U.S. Small/Mid Cap Growth Fund 0.0%, Strong Advisor Utilities and Energy Fund 67.5%, and Strong Advisor Large Company Core Fund 51.5%.
Capital loss carryovers utilized during the year ended December 31, 2004, are as follows: Strong Advisor Common Stock Fund $98,017,939, Strong Advisor Mid Cap Growth Fund $10,073,777, Strong Advisor Small Cap Value Fund $0, Strong Advisor U.S. Value Fund $3,875,228, Strong Advisor Endeavor Large Cap Fund $5,545,446, Strong Advisor Focus Fund $441,833,
123
NOTES TO FINANCIAL STATEMENTS (continued)
December 31, 2004
Strong Advisor International Core Fund $30,211, Strong Advisor Select Fund $5,735,050, Strong Advisor Technology Fund $195,747, Strong Advisor U.S. Small/Mid Cap Growth Fund $424,473, Strong Advisor Utilities and Energy Fund $313,921, and Strong Advisor Large Company Core Fund $0.
| 8. | Capital Share Transactions |
Strong Advisor Common Stock Fund | Strong Advisor Mid Cap Growth Fund | |||||||||||||||
Year Ended Dec. 31, 2004 | Year Ended Dec. 31, 2003 | Year Ended Dec. 31, 2004 | Year Ended Dec. 31, 2003 | |||||||||||||
Capital Share Transactions of Each Class of Shares of the Funds Were as Follows: | ||||||||||||||||
CLASS A | ||||||||||||||||
Proceeds from Shares Sold | $ | 18,351,436 | $ | 62,389,061 | $ | 2,254,765 | $ | 29,891,257 | ||||||||
Proceeds from Reinvestment of Distributions | 5,133,631 | — | — | — | ||||||||||||
Payment for Shares Redeemed | (32,357,772 | ) | (48,584,158 | ) | (3,456,543 | ) | (29,161,740 | ) | ||||||||
Net Increase (Decrease) in Net Assets from Capital Share Transactions | (8,872,705 | ) | 13,804,903 | (1,201,778 | ) | 729,517 | ||||||||||
CLASS B | ||||||||||||||||
Proceeds from Shares Sold | 1,929,309 | 8,099,013 | 101,227 | 490,452 | ||||||||||||
Proceeds from Reinvestment of Distributions | 2,298,727 | — | — | — | ||||||||||||
Payment for Shares Redeemed | (5,546,942 | ) | (3,494,374 | ) | (482,585 | ) | (720,050 | ) | ||||||||
Net Increase (Decrease) in Net Assets from Capital Share Transactions | (1,318,906 | ) | 4,604,639 | (381,358 | ) | (229,598 | ) | |||||||||
CLASS C | ||||||||||||||||
Proceeds from Shares Sold | 4,049,548 | 9,917,355 | 43,997 | 326,442 | ||||||||||||
Proceeds from Reinvestment of Distributions | 1,501,280 | — | — | — | ||||||||||||
Payment for Shares Redeemed | (13,428,469 | ) | (8,090,361 | ) | (345,908 | ) | (698,172 | ) | ||||||||
Net Increase (Decrease) in Net Assets from Capital Share Transactions | (7,877,641 | ) | 1,826,994 | (301,911 | ) | (371,730 | ) | |||||||||
CLASS Z | ||||||||||||||||
Proceeds from Shares Sold | 114,300,846 | 203,644,369 | 7,522,386 | 31,734,000 | ||||||||||||
Proceeds from Reinvestment of Distributions | 77,961,481 | — | — | — | ||||||||||||
Payment for Shares Redeemed | (495,966,918 | ) | (608,593,067 | ) | (20,385,158 | ) | (61,043,159 | ) | ||||||||
Net Increase (Decrease) in Net Assets from Capital Share Transactions | (303,704,591 | ) | (404,948,698 | ) | (12,862,772 | ) | (29,309,159 | ) | ||||||||
Net Increase (Decrease) in Net Assets from Capital Share Transactions | $ | (321,773,843 | ) | $ | (384,712,162 | ) | $ | (14,747,819 | ) | $ | (29,180,970 | ) | ||||
124
Strong Advisor Common Stock Fund | Strong Advisor Mid Cap Growth Fund | |||||||||||
| Year Ended Dec. 31, 2004 | Year Ended Dec. 31, 2003 | Year Ended Dec. 31, 2004 | Year Ended Dec. 31, 2003 | |||||||||
Transactions in Shares of Each Class of the Funds Were as Follows: | ||||||||||||
CLASS A | ||||||||||||
Sold | 829,082 | 3,431,779 | 183,160 | 3,106,763 | ||||||||
Issued in Reinvestment of Distributions | 236,355 | — | — | — | ||||||||
Redeemed | (1,468,160 | ) | (2,666,367 | ) | (282,618 | ) | (2,955,165 | ) | ||||
Net Increase (Decrease) in Shares | (402,723 | ) | 765,412 | (99,458 | ) | 151,598 | ||||||
CLASS B | ||||||||||||
Sold | 89,606 | 457,112 | 8,503 | 50,542 | ||||||||
Issued in Reinvestment of Distributions | 109,048 | — | — | — | ||||||||
Redeemed | (258,192 | ) | (198,050 | ) | (41,116 | ) | (70,959 | ) | ||||
Net Increase (Decrease) in Shares | (59,538 | ) | 259,062 | (32,613 | ) | (20,417 | ) | |||||
CLASS C | ||||||||||||
Sold | 187,445 | 546,220 | 3,832 | 34,377 | ||||||||
Issued in Reinvestment of Distributions | 71,218 | — | — | — | ||||||||
Redeemed | (625,270 | ) | (442,002 | ) | (29,654 | ) | (69,097 | ) | ||||
Net Increase (Decrease) in Shares | (366,607 | ) | 104,218 | (25,822 | ) | (34,720 | ) | |||||
CLASS Z | ||||||||||||
Sold | 5,128,434 | 11,182,299 | 615,596 | 3,193,498 | ||||||||
Issued in Reinvestment of Distributions | 3,551,776 | — | — | — | ||||||||
Redeemed | (22,238,478 | ) | (31,635,485 | ) | (1,676,497 | ) | (5,725,809 | ) | ||||
Net Increase (Decrease) in Shares | (13,558,268 | ) | (20,453,186 | ) | (1,060,901 | ) | (2,532,311 | ) | ||||
125
NOTES TO FINANCIAL STATEMENTS (continued)
December 31, 2004
Strong Advisor Small Cap Value Fund | ||||||||
Year Ended Dec. 31, 2004 | Year Ended Dec. 31, 2003 | |||||||
Capital Share Transactions of Each Class of Shares of the Fund Were as Follows: | ||||||||
CLASS A | ||||||||
Proceeds from Shares Sold | $ | 111,965,665 | $ | 320,685,110 | ||||
Proceeds from Reinvestment of Distributions | 63,761,770 | 15,265,206 | ||||||
Payment for Shares Redeemed | (287,141,565 | ) | (184,534,476 | ) | ||||
Net Increase (Decrease) in Net Assets from Capital Share Transactions | (111,414,130 | ) | 151,415,840 | |||||
CLASS B | ||||||||
Proceeds from Shares Sold | 3,500,020 | 23,520,790 | ||||||
Proceeds from Reinvestment of Distributions | 13,852,760 | 2,765,426 | ||||||
Payment for Shares Redeemed | (13,748,747 | ) | (12,814,273 | ) | ||||
Net Increase (Decrease) in Net Assets from Capital Share Transactions | 3,604,033 | 13,471,943 | ||||||
CLASS C | ||||||||
Proceeds from Shares Sold | 7,497,546 | 50,717,429 | ||||||
Proceeds from Reinvestment of Distributions | 14,891,930 | 3,207,242 | ||||||
Payment for Shares Redeemed | (32,663,862 | ) | (42,529,352 | ) | ||||
Net Increase (Decrease) in Net Assets from Capital Share Transactions | (10,274,386 | ) | 11,395,319 | |||||
CLASS Z | ||||||||
Proceeds from Shares Sold | 586,760,998 | 568,392,266 | ||||||
Proceeds from Reinvestment of Distributions | 140,802,162 | 27,317,931 | ||||||
Payment for Shares Redeemed | (612,977,746 | ) | (432,298,660 | ) | ||||
Net Increase (Decrease) in Net Assets from Capital Share Transactions | 114,585,414 | 163,411,537 | ||||||
Net Increase (Decrease) in Net Assets from Capital Share Transactions | $ | (3,499,069 | ) | $ | 339,694,639 | |||
126
Strong Advisor Small Cap Value Fund | ||||||
Year Ended Dec. 31, 2004 | Year Ended Dec. 31, 2003 | |||||
Transactions in Shares of Each Class of the Fund Were as Follows: | ||||||
CLASS A | ||||||
Sold | 3,946,949 | 14,585,227 | ||||
Issued in Reinvestment of Distributions | 2,293,078 | 588,254 | ||||
Redeemed | (10,327,642 | ) | (8,277,317 | ) | ||
Net Increase (Decrease) in Shares | (4,087,615 | ) | 6,896,164 | |||
CLASS B | ||||||
Sold | 127,051 | 1,128,906 | ||||
Issued in Reinvestment of Distributions | 514,591 | 108,960 | ||||
Redeemed | (501,970 | ) | (590,325 | ) | ||
Net Increase (Decrease) in Shares | 139,672 | 647,541 | ||||
CLASS C | ||||||
Sold | 273,175 | 2,388,522 | ||||
Issued in Reinvestment of Distributions | 552,197 | 126,120 | ||||
Redeemed | (1,184,664 | ) | (1,842,815 | ) | ||
Net Increase (Decrease) in Shares | (359,292 | ) | 671,827 | |||
CLASS Z | ||||||
Sold | 20,439,069 | 25,560,482 | ||||
Issued in Reinvestment of Distributions | 5,026,696 | 1,047,467 | ||||
Redeemed | (21,628,099 | ) | (18,917,370 | ) | ||
Net Increase (Decrease) in Shares | 3,837,666 | 7,690,579 | ||||
127
NOTES TO FINANCIAL STATEMENTS (continued)
December 31, 2004
Strong Advisor U.S. Value Fund | ||||||||
Year Ended Dec. 31, 2004 | Year Ended Dec. 31, 2003 | |||||||
Capital Share Transactions of Each Class of Shares of the Fund Were as Follows: | ||||||||
CLASS A | ||||||||
Proceeds from Shares Sold | $ | 1,588,383 | $ | 2,442,595 | ||||
Proceeds from Reinvestment of Distributions | 379,245 | 33,629 | ||||||
Payment for Shares Redeemed | (1,676,157 | ) | (1,164,555 | ) | ||||
Net Increase (Decrease) in Net Assets from Capital Share Transactions | 291,471 | 1,311,669 | ||||||
CLASS B | ||||||||
Proceeds from Shares Sold | 1,289,813 | 1,532,091 | ||||||
Proceeds from Reinvestment of Distributions | 395,211 | 9,048 | ||||||
Payment for Shares Redeemed | (552,807 | ) | (708,664 | ) | ||||
Net Increase (Decrease) in Net Assets from Capital Share Transactions | 1,132,217 | 832,475 | ||||||
CLASS C | ||||||||
Proceeds from Shares Sold | 698,417 | 2,936,148 | ||||||
Proceeds from Reinvestment of Distributions | 278,278 | 7,949 | ||||||
Payment for Shares Redeemed | (1,141,334 | ) | (802,924 | ) | ||||
Net Increase (Decrease) in Net Assets from Capital Share Transactions | (164,639 | ) | 2,141,173 | |||||
CLASS K | ||||||||
Proceeds from Shares Sold | 22,132,402 | 75,594,336 | ||||||
Proceeds from Reinvestment of Distributions | 109,087 | 26,245 | ||||||
Payment for Shares Redeemed | (21,908,649 | ) | (5,956,750 | ) | ||||
Net Increase (Decrease) in Net Assets from Capital Share Transactions | 332,840 | 69,663,831 | ||||||
CLASS Z | ||||||||
Proceeds from Shares Sold | 135,909,011 | 65,563,705 | ||||||
Proceeds from Reinvestment of Distributions | 11,406,386 | 421,710 | ||||||
Payment for Shares Redeemed | (65,884,168 | ) | (156,527,039 | ) | ||||
Net Increase (Decrease) in Net Assets from Capital Share Transactions | 81,431,229 | (90,541,624 | ) | |||||
Net Increase (Decrease) in Net Assets from Capital Share Transactions | $ | 83,023,118 | $ | (16,592,476 | ) | |||
128
Strong Advisor U.S. Value Fund | ||||||
Year Ended Dec. 31, 2004 | Year Ended Dec. 31, 2003 | |||||
Transactions in Shares of Each Class of the Fund Were as Follows: | ||||||
CLASS A | ||||||
Sold | 86,445 | 158,971 | ||||
Issued in Reinvestment of Distributions | 21,022 | 2,133 | ||||
Redeemed | (92,877 | ) | (76,619 | ) | ||
Net Increase (Decrease) in Shares | 14,590 | 84,485 | ||||
CLASS B | ||||||
Sold | 71,109 | 101,156 | ||||
Issued in Reinvestment of Distributions | 21,981 | 558 | ||||
Redeemed | (30,337 | ) | (49,252 | ) | ||
Net Increase (Decrease) in Shares | 62,753 | 52,462 | ||||
CLASS C | ||||||
Sold | 38,764 | 187,092 | ||||
Issued in Reinvestment of Distributions | 15,559 | 485 | ||||
Redeemed | (62,341 | ) | (51,438 | ) | ||
Net Increase (Decrease) in Shares | (8,018 | ) | 136,139 | |||
CLASS K | ||||||
Sold | 1,217,353 | 4,541,506 | ||||
Issued in Reinvestment of Distributions | 6,087 | 1,657 | ||||
Redeemed | (1,213,371 | ) | (382,792 | ) | ||
Net Increase (Decrease) in Shares | 10,069 | 4,160,371 | ||||
CLASS Z | ||||||
Sold | 7,524,230 | 4,464,350 | ||||
Issued in Reinvestment of Distributions | 627,559 | 26,615 | ||||
Redeemed | (3,593,330 | ) | (9,915,698 | ) | ||
Net Increase (Decrease) in Shares | 4,558,459 | (5,424,733 | ) | |||
129
NOTES TO FINANCIAL STATEMENTS (continued)
December 31, 2004
Strong Advisor Endeavor Large Cap Fund | Strong Advisor Focus Fund | |||||||||||||||
| Year Ended Dec. 31, 2004 | Year Ended Dec. 31, 2003 | Year Ended Dec. 31, 2004 | Year Ended Dec. 31, 2003 | |||||||||||||
Capital Share Transactions of Each Class of Shares of the Funds Were as Follows: | ||||||||||||||||
CLASS A | ||||||||||||||||
Proceeds from Shares Sold | $ | 13,301,217 | $ | 11,550,715 | $ | 60,018 | $ | 133,502 | ||||||||
Proceeds from Reinvestment of Distributions | — | — | — | — | ||||||||||||
Payment for Shares Redeemed | (12,914,635 | ) | (13,087,873 | ) | (680,874 | ) | (1,033,507 | ) | ||||||||
Net Increase (Decrease) in Net Assets from Capital Share Transactions | 386,582 | (1,537,158 | ) | (620,856 | ) | (900,005 | ) | |||||||||
CLASS B | ||||||||||||||||
Proceeds from Shares Sold | 189,456 | 545,692 | 20,662 | 33,725 | ||||||||||||
Proceeds from Reinvestment of Distributions | — | — | — | — | ||||||||||||
Payment for Shares Redeemed | (74,741 | ) | (294,637 | ) | (299,660 | ) | (391,552 | ) | ||||||||
Net Increase (Decrease) in Net Assets from Capital Share Transactions | 114,715 | 251,055 | (278,998 | ) | (357,827 | ) | ||||||||||
CLASS C | ||||||||||||||||
Proceeds from Shares Sold | 115,461 | 236,667 | 1,722 | 128,342 | ||||||||||||
Proceeds from Reinvestment of Distributions | — | — | — | — | ||||||||||||
Payment for Shares Redeemed | (130,885 | ) | (92,284 | ) | (121,067 | ) | (196,335 | ) | ||||||||
Net Increase (Decrease) in Net Assets from Capital Share Transactions | (15,424 | ) | 144,383 | (119,345 | ) | (67,993 | ) | |||||||||
Net Increase (Decrease) in Net Assets from Capital Share Transactions | $ | 485,873 | $ | (1,141,720 | ) | $ | (1,019,199 | ) | $ | (1,325,825 | ) | |||||
Transactions in Shares of Each Class of the Funds Were as Follows: | ||||||||||||||||
CLASS A | ||||||||||||||||
Sold | 1,297,888 | 1,382,830 | 9,354 | 26,782 | ||||||||||||
Issued in Reinvestment of Distributions | — | — | — | — | ||||||||||||
Redeemed | (1,234,210 | ) | (1,497,908 | ) | (109,938 | ) | (189,152 | ) | ||||||||
Net Increase (Decrease) in Shares | 63,678 | (115,078 | ) | (100,584 | ) | (162,370 | ) | |||||||||
CLASS B | ||||||||||||||||
Sold | 18,279 | 66,016 | 3,451 | 6,628 | ||||||||||||
Issued in Reinvestment of Distributions | — | — | — | — | ||||||||||||
Redeemed | (7,217 | ) | (36,913 | ) | (49,543 | ) | (74,150 | ) | ||||||||
Net Increase (Decrease) in Shares | 11,062 | 29,103 | (46,092 | ) | (67,522 | ) | ||||||||||
CLASS C | ||||||||||||||||
Sold | 11,182 | 27,852 | 279 | 25,997 | ||||||||||||
Issued in Reinvestment of Distributions | — | — | — | — | ||||||||||||
Redeemed | (12,797 | ) | (10,494 | ) | (20,057 | ) | (37,048 | ) | ||||||||
Net Increase (Decrease) in Shares | (1,615 | ) | 17,358 | (19,778 | ) | (11,051 | ) | |||||||||
130
Strong Advisor International Core Fund | Strong Advisor Select Fund | |||||||||||||||
Year Ended Dec. 31, 2004 | Year Ended Dec. 31, 2003 | Year Ended Dec. 31, 2004 | Year Ended Dec. 31, 2003 | |||||||||||||
Capital Share Transactions of Each Class of Shares of the Funds Were as Follows: | ||||||||||||||||
CLASS A | ||||||||||||||||
Proceeds from Shares Sold | $ | 162,808 | $ | 451,750 | $ | 31,977,070 | $ | 28,987,396 | ||||||||
Proceeds from Reinvestment of Distributions | 26,258 | 6,485 | 5,498,260 | — | ||||||||||||
Payment for Shares Redeemed | (104,660 | ) | (163,951 | ) | (31,618,577 | ) | (27,068,354 | ) | ||||||||
Net Increase (Decrease) in Net Assets from Capital Share Transactions | 84,406 | 294,284 | 5,856,753 | 1,919,042 | ||||||||||||
CLASS B | ||||||||||||||||
Proceeds from Shares Sold | 358,381 | 346,867 | 1,138,452 | 257,127 | ||||||||||||
Proceeds from Reinvestment of Distributions | 35,883 | 6,923 | 91,274 | — | ||||||||||||
Payment for Shares Redeemed | (32,276 | ) | (65,208 | ) | (113,933 | ) | (103,058 | ) | ||||||||
Net Increase (Decrease) in Net Assets from Capital Share Transactions | 361,988 | 288,582 | 1,115,793 | 154,069 | ||||||||||||
CLASS C | ||||||||||||||||
Proceeds from Shares Sold | 91,773 | 562,293 | 687,954 | 204,823 | ||||||||||||
Proceeds from Reinvestment of Distributions | 10,119 | 2,436 | 60,012 | — | ||||||||||||
Payment for Shares Redeemed | (1,587 | ) | (585,411 | ) | (176,310 | ) | (104,606 | ) | ||||||||
Net Increase (Decrease) in Net Assets from Capital Share Transactions | 100,305 | (20,682 | ) | 571,656 | 100,217 | |||||||||||
Net Increase (Decrease) in Net Assets from Capital Share Transactions | $ | 546,699 | $ | 562,184 | $ | 7,544,202 | $ | 2,173,328 | ||||||||
Transactions in Shares of Each Class of the Funds Were as Follows: | ||||||||||||||||
CLASS A | ||||||||||||||||
Sold | 13,169 | 47,151 | 3,631,057 | 4,305,907 | ||||||||||||
Issued in Reinvestment of Distributions | 2,027 | 570 | 622,745 | — | ||||||||||||
Redeemed | (8,684 | ) | (14,929 | ) | (3,620,140 | ) | (3,730,994 | ) | ||||||||
Net Increase (Decrease) in Shares | 6,512 | 32,792 | 633,662 | 574,913 | ||||||||||||
CLASS B | ||||||||||||||||
Sold | 29,318 | 36,895 | 129,807 | 37,614 | ||||||||||||
Issued in Reinvestment of Distributions | 2,774 | 609 | 10,663 | — | ||||||||||||
Redeemed | (2,840 | ) | (6,823 | ) | (13,648 | ) | (14,269 | ) | ||||||||
Net Increase (Decrease) in Shares | 29,252 | 30,681 | 126,822 | 23,345 | ||||||||||||
CLASS C | ||||||||||||||||
Sold | 7,509 | 58,481 | 80,437 | 29,859 | ||||||||||||
Issued in Reinvestment of Distributions | 783 | 215 | 7,011 | — | ||||||||||||
Redeemed | (134 | ) | (59,716 | ) | (20,141 | ) | (13,880 | ) | ||||||||
Net Increase (Decrease) in Shares | 8,158 | (1,020 | ) | 67,307 | 15,979 | |||||||||||
131
NOTES TO FINANCIAL STATEMENTS (continued)
December 31, 2004
Strong Advisor Technology Fund | Strong Advisor U.S. Small/Mid Cap Growth Fund | |||||||||||||||
| Year Ended Dec. 31, 2004 | Year Ended Dec. 31, 2003 | Year Ended Dec. 31, 2004 | Year Ended Dec. 31, 2003 | |||||||||||||
Capital Share Transactions of Each Class of Shares of the Funds Were as Follows: | ||||||||||||||||
CLASS A | ||||||||||||||||
Proceeds from Shares Sold | $ | 465,534 | $ | 475,649 | $ | 1,205,572 | $ | 2,506,870 | ||||||||
Proceeds from Reinvestment of Distributions | — | — | — | — | ||||||||||||
Payment for Shares Redeemed | (1,007,814 | ) | (1,132,211 | ) | (1,597,336 | ) | (182,320 | ) | ||||||||
Net Increase (Decrease) in Net Assets from Capital Share Transactions | (542,280 | ) | (656,562 | ) | (391,764 | ) | 2,324,550 | |||||||||
CLASS B | ||||||||||||||||
Proceeds from Shares Sold | 35,990 | 285,676 | 632,045 | 711,067 | ||||||||||||
Proceeds from Reinvestment of Distributions | — | — | — | — | ||||||||||||
Payment for Shares Redeemed | (34,928 | ) | (18,271 | ) | (243,443 | ) | (132,452 | ) | ||||||||
Net Increase (Decrease) in Net Assets from Capital Share Transactions | 1,062 | 267,405 | 388,602 | 578,615 | ||||||||||||
CLASS C | ||||||||||||||||
Proceeds from Shares Sold | 4,510 | 38,794 | 168,462 | 1,161,876 | ||||||||||||
Proceeds from Reinvestment of Distributions | — | — | — | — | ||||||||||||
Payment for Shares Redeemed | (92,766 | ) | (128,137 | ) | (480,054 | ) | (53,800 | ) | ||||||||
Net Increase (Decrease) in Net Assets from Capital Share Transactions | (88,256 | ) | (89,343 | ) | (311,592 | ) | 1,108,076 | |||||||||
Net Increase (Decrease) in Net Assets from Capital Share Transactions | $ | (629,474 | ) | $ | (478,500 | ) | $ | (314,754 | ) | $ | 4,011,241 | |||||
Transactions in Shares of Each Class of the Funds Were as Follows: | ||||||||||||||||
CLASS A | ||||||||||||||||
Sold | 63,505 | 83,030 | 110,108 | 237,549 | ||||||||||||
Issued in Reinvestment of Distributions | — | — | — | — | ||||||||||||
Redeemed | (133,227 | ) | (168,601 | ) | (148,158 | ) | (16,651 | ) | ||||||||
Net Increase (Decrease) in Shares | (69,722 | ) | (85,571 | ) | (38,050 | ) | 220,898 | |||||||||
CLASS B | ||||||||||||||||
Sold | 4,869 | 47,464 | 58,082 | 69,682 | ||||||||||||
Issued in Reinvestment of Distributions | — | — | — | — | ||||||||||||
Redeemed | (5,138 | ) | (2,590 | ) | (23,370 | ) | (11,990 | ) | ||||||||
Net Increase (Decrease) in Shares | (269 | ) | 44,874 | 34,712 | 57,692 | |||||||||||
CLASS C | ||||||||||||||||
Sold | 623 | 5,992 | 14,560 | 114,610 | ||||||||||||
Issued in Reinvestment of Distributions | — | — | — | — | ||||||||||||
Redeemed | (12,823 | ) | (21,193 | ) | (46,160 | ) | (4,922 | ) | ||||||||
Net Increase (Decrease) in Shares | (12,200 | ) | (15,201 | ) | (31,600 | ) | 109,688 | |||||||||
132
Strong Advisor Utilities and Energy Fund | ||||||||
| Year Ended Dec. 31, 2004 | Year Ended Dec. 31, 2003 | |||||||
Capital Share Transactions of Each Class of Shares of the Fund Were as Follows: | ||||||||
CLASS A | ||||||||
Proceeds from Shares Sold | $ | 797,521 | $ | 10,745,467 | ||||
Proceeds from Reinvestment of Distributions | 70,401 | 57,522 | ||||||
Payment for Shares Redeemed* | (10,424,129 | ) | (8,634,471 | ) | ||||
Net Increase (Decrease) in Net Assets from Capital Share Transactions | (9,556,207 | ) | 2,168,518 | |||||
CLASS B | ||||||||
Proceeds from Shares Sold | 167,861 | 50,393 | ||||||
Proceeds from Reinvestment of Distributions | 10,103 | 232 | ||||||
Payment for Shares Redeemed | (4,656 | ) | — | |||||
Net Increase (Decrease) in Net Assets from Capital Share Transactions | 173,308 | 50,625 | ||||||
CLASS C | ||||||||
Proceeds from Shares Sold | 81,865 | 61,694 | ||||||
Proceeds from Reinvestment of Distributions | 9,058 | 1,418 | ||||||
Payment for Shares Redeemed | (85,522 | ) | (11,717 | ) | ||||
Net Increase (Decrease) in Net Assets from Capital Share Transactions | 5,401 | 51,395 | ||||||
Net Increase (Decrease) in Net Assets from Capital Share Transactions | $ | (9,377,498 | ) | $ | 2,270,538 | |||
Transactions in Shares of Each Class of the Fund Were as Follows: | ||||||||
CLASS A | ||||||||
Sold | 66,748 | 1,122,369 | ||||||
Issued in Reinvestment of Distributions | 6,063 | 5,985 | ||||||
Redeemed* | (894,125 | ) | (876,335 | ) | ||||
Net Increase (Decrease) in Shares | (821,314 | ) | 252,019 | |||||
CLASS B | ||||||||
Sold | 14,681 | 5,210 | ||||||
Issued in Reinvestment of Distributions | 869 | 24 | ||||||
Redeemed | (401 | ) | — | |||||
Net Increase (Decrease) in Shares | 15,149 | 5,234 | ||||||
CLASS C | ||||||||
Sold | 6,789 | 6,587 | ||||||
Issued in Reinvestment of Distributions | 781 | 145 | ||||||
Redeemed | (7,747 | ) | (1,155 | ) | ||||
Net Increase (Decrease) in Shares | (177 | ) | 5,577 | |||||
| * | Includes a Redemption-in-Kind on December 21, 2004 of $7,100,325 (587,051 shares). |
133
NOTES TO FINANCIAL STATEMENTS (continued)
December 31, 2004
Strong Advisor Large Company Core Fund | ||||||||
| Year Ended Dec. 31, 2004 | Year Ended Dec. 31, 2003 | |||||||
Capital Share Transactions of Each Class of Shares of the Fund Were as Follows: | ||||||||
CLASS A | ||||||||
Proceeds from Shares Sold | $ | 9,883,148 | $ | 59,864,417 | ||||
Proceeds from Reinvestment of Distributions | 4,635,427 | 78,573 | ||||||
Proceeds from Redemption Fees* | 12,474 | — | ||||||
Payment for Shares Redeemed | (27,594,187 | ) | (9,871,639 | ) | ||||
Net Increase (Decrease) in Net Assets from Capital Share Transactions | (13,063,138 | ) | 50,071,351 | |||||
CLASS B | ||||||||
Proceeds from Shares Sold | 1,903,385 | 6,531,413 | ||||||
Proceeds from Reinvestment of Distributions | 598,238 | 5,649 | ||||||
Proceeds from Redemption Fees* | 1,571 | — | ||||||
Payment for Shares Redeemed | (983,260 | ) | (411,263 | ) | ||||
Net Increase (Decrease) in Net Assets from Capital Share Transactions | 1,519,934 | 6,125,799 | ||||||
CLASS C | ||||||||
Proceeds from Shares Sold | 3,118,877 | 5,690,544 | ||||||
Proceeds from Reinvestment of Distributions | 599,527 | 5,296 | ||||||
Proceeds from Redemption Fees* | 1,296 | — | ||||||
Payment for Shares Redeemed | (2,595,138 | ) | (624,699 | ) | ||||
Net Increase (Decrease) in Net Assets from Capital Share Transactions | 1,124,562 | 5,071,141 | ||||||
CLASS K | ||||||||
Proceeds from Shares Sold | 8,644,119 | 33,605,594 | ||||||
Proceeds from Reinvestment of Distributions | 2,151,242 | 78,412 | ||||||
Proceeds from Redemption Fees* | 6,536 | — | ||||||
Payment for Shares Redeemed | (22,649,704 | ) | (2,948,367 | ) | ||||
Net Increase (Decrease) in Net Assets from Capital Share Transactions | (11,847,807 | ) | 30,735,639 | |||||
Net Increase (Decrease) in Net Assets from Capital Share Transactions | $ | (22,266,449 | ) | $ | 92,003,930 | |||
| * | The amount of redemption fees collected for the year ended December 31, 2003 was $12,110 and was paid to the Fund in 2004. |
134
Strong Advisor Large Company Core Fund | ||||||
Year Ended Dec. 31, 2004 | Year Ended Dec. 31, 2003 | |||||
Transactions in Shares of Each Class of the Fund Were as Follows: | ||||||
CLASS A | ||||||
Sold | 907,676 | 6,235,824 | ||||
Issued in Reinvestment of Distributions | 435,913 | 7,791 | ||||
Redeemed | (2,559,965 | ) | (976,959 | ) | ||
Net Increase (Decrease) in Shares | (1,216,376 | ) | 5,266,656 | |||
CLASS B | ||||||
Sold | 176,952 | 691,767 | ||||
Issued in Reinvestment of Distributions | 57,309 | 549 | ||||
Redeemed | (93,209 | ) | (40,925 | ) | ||
Net Increase (Decrease) in Shares | 141,052 | 651,391 | ||||
CLASS C | ||||||
Sold | 290,100 | 596,467 | ||||
Issued in Reinvestment of Distributions | 57,480 | 512 | ||||
Redeemed | (242,815 | ) | (61,554 | ) | ||
Net Increase (Decrease) in Shares | 104,765 | 535,425 | ||||
CLASS K | ||||||
Sold | 793,688 | 3,545,081 | ||||
Issued in Reinvestment of Distributions | 200,954 | 8,183 | ||||
Redeemed | (2,065,289 | ) | (302,576 | ) | ||
Net Increase (Decrease) in Shares | (1,070,647 | ) | 3,250,688 | |||
135
NOTES TO FINANCIAL STATEMENTS (continued)
December 31, 2004
| 9. | Investments in Affiliates |
Affiliated issuers, as defined under the 1940 Act, include any Fund of the Strong Funds and any issuer in which the Fund’s holdings of an issuer represent 5% or more of the outstanding voting securities of the issuer. A summary of transactions in the securities of these issuers during the year ended December 31, 2004, is as follows:
| Balance of Shares Held Jan. 1, 2004 | Gross Purchases and Additions | Gross Sales and Reductions | Balance of Shares Held Dec. 31, 2004 | Value Dec. 31, 2004 | Investment Jan. 1, 2004- | Realized on Sales | ||||||||||||||
Strong Advisor Small Cap Value Fund | ||||||||||||||||||||
Allied Healthcare Products, Inc. | 848,200 | 276,559 | (79,880 | ) | 1,044,879 | $ | 6,843,957 | $ | — | $ | 203,991 | |||||||||
Apex Silver Mines, Ltd. | 2,115,100 | 617,000 | (255,100 | ) | 2,477,000 | 42,554,860 | — | (448,152 | ) | |||||||||||
Barbeques Galore, Ltd. Sponsored ADR | 434,231 | 129,790 | (15,000 | ) | 549,021 | 3,294,126 | 96,609 | 77,745 | ||||||||||||
Calgon Carbon Corporation | 2,584,600 | 218,300 | (575,700 | ) | 2,227,200 | 20,222,976 | 316,686 | 23,661 | ||||||||||||
Covenant Transport, Inc. Class A | 783,000 | 153,500 | (148,800 | ) | 787,700 | 16,399,914 | — | 1,360 | ||||||||||||
Discovery Partners International, Inc. | 1,503,400 | 492,600 | (59,200 | ) | 1,936,800 | 9,199,800 | — | (116,185 | ) | |||||||||||
Dura Automotive Systems, Inc.1 | 1,120,900 | 182,500 | (430,300 | ) | 873,100 | 9,455,673 | — | 1,056,334 | ||||||||||||
Encore Wire Corporation1 | 1,163,900 | 486,700 | 2 | (1,054,000 | ) | 596,600 | 7,952,678 | — | 21,678,535 | |||||||||||
Evans & Sutherland Computer Corporation | 700,200 | 307,953 | — | 1,008,153 | 7,026,826 | — | — | |||||||||||||
The GEO Group, Inc. (Formerly Wackenhut Corrections Corporation) | 781,910 | 222,300 | (39,600 | ) | 964,610 | 25,639,334 | — | 91,881 | ||||||||||||
Global Industries, Ltd. | 3,894,600 | 2,254,000 | (80,000 | ) | 6,068,600 | 50,308,694 | — | (241,281 | ) | |||||||||||
Intertape Polymer Group, Inc. | 2,426,100 | 306,500 | — | 2,732,600 | 24,893,986 | — | — | |||||||||||||
Kforce, Inc. | 1,862,485 | 370,215 | (327,840 | ) | 1,904,860 | 21,143,946 | — | 1,169,847 | ||||||||||||
Layne Christensen Company | 1,514,300 | 97,502 | (137,710 | ) | 1,474,092 | 26,754,770 | — | 904,486 | ||||||||||||
Lightbridge, Inc. | 1,523,100 | 929,600 | (78,300 | ) | 2,374,400 | 14,341,376 | — | (334,278 | ) | |||||||||||
Matrix Service Company | 841,900 | 712,900 | (20,466 | ) | 1,534,334 | 12,366,732 | — | (185,719 | ) | |||||||||||
McMoRan Exploration Company | 837,500 | 370,300 | (45,000 | ) | 1,162,800 | 21,744,360 | — | (39,044 | ) | |||||||||||
Petroleum Helicopters, Inc. (non-voting) | 174,260 | 5,217 | — | 179,477 | 4,499,488 | — | — | |||||||||||||
Range Resources Corporation | 4,132,300 | 750,700 | (229,200 | ) | 4,653,800 | 95,216,748 | 217,613 | 442,914 | ||||||||||||
Richardson Electronics, Ltd.1 | 536,700 | 242,100 | (107,000 | ) | 671,800 | 7,127,798 | 107,140 | (213,588 | ) | |||||||||||
Webco Industries, Inc. | 285,460 | 628,285 | (8,000 | ) | 905,745 | 9,754,874 | — | (7,290 | ) | |||||||||||
The Wet Seal, Inc. Class A1 | — | 1,324,020 | (1,324,020 | ) | — | — | — | (6,139,201 | ) | |||||||||||
| 1 | Issuer was not an affiliate as of December 31, 2004. |
| 2 | Includes increase due to stock split. |
| 10. | Legal and Regulatory Matters |
On or about May 20, 2004, the Advisor, the Administrator, and the Distributor (collectively, “Strong”), former chairman Richard S. Strong, and two employees of Strong entered into agreements with the Securities and Exchange Commission (“SEC”), the New York Attorney General (“NYAG”), the State of Wisconsin Department of Justice (the Wisconsin Attorney General), and the Wisconsin Department of Financial Institutions representing a settlement of all the market-timing investigations of Strong and certain affiliates by these agencies. In the settlements, Strong, without admitting or denying the findings in any of the orders, consented to entries of cease and desist orders and injunctive relief relating to breaches of their fiduciary duties and violations of state and federal securities laws, including anti-fraud provisions. The settlements require the Advisor to pay $40 million in investor restoration and $40 million in civil penalties. The settlements require Mr. Strong to pay $30 million in investor restoration and $30 million in civil penalties. The NYAG settlement also requires Strong or its successor to reduce fees for all Funds (except money market funds and certain very short-term income funds) by an aggregate of at least $7 million a year for five years. Separately, the Board of Directors of the Strong Funds and the Advisor have agreed that the Advisor may allocate such fee and/or expense reductions in a manner it deems reasonable, provided that (i) each applicable Fund shall participate in such fee reduction, (ii) each Fund that was impacted by market timing related to the settlements shall receive a fee reduction of at least 0.025% each year, (iii) such fee reduction shall be taken after giving effect to all waivers and reimbursements currently in effect, and (iv) fees and expenses shall not subsequently be increased without prior Board approval. Additionally, the settlements require, among other things: 1) retention of an independent consultant to develop a payment plan for the amount of investor restoration; 2) the services of an independent compliance consultant to conduct a periodic review of Strong’s compliance policies and procedures; and 3) enhanced corporate governance policies for the Strong Funds. The NYAG settlement also requires: 1) the retention of a senior officer to assist the Board in monitoring compliance and reviewing fee arrangements; and 2) additional fee disclosure to investors in the Funds. Strong and Mr. Strong, and not the
136
investors in any Strong Fund, will bear all the costs of complying with the settlements, including restoration, civil penalties, and associated legal fees stemming from these regulatory proceedings. Strong has not yet determined if the investor restoration or civil penalties will create any financial benefit to the Strong Funds.
Strong has received one or more subpoenas or requests for information from the West Virginia Attorney General and other regulatory agencies requesting documents, if any, related to market timing and late trading practices. Strong is aware of multiple outstanding class and derivative actions (“Actions”) filed since September 4, 2003, against Strong, Strong Funds, Strong Financial Corporation, Strong Investments, Inc., Strong affiliates, and certain of their employees, officers, directors, and others as defendants in certain federal and state courts with respect to factual matters referenced in the NYAG settlement. On February 20, 2004, the United States Judicial Panel for Multi District Litigation (“MDL”) ordered the transfer of most of the Actions to the District of Maryland so those cases involving Strong could be coordinated and consolidated into one or two actions covered by a single complaint (“MDL Consolidated Actions”). The MDL ordered all or most of the other federal court Actions and certain state court Actions involving Strong to be consolidated into no more than three actions and be heard by the District of Maryland court. On September 30, 2004, three consolidated amended complaints were filed in the District of Maryland court. The Actions generally allege, among other things, that the defendants violated their fiduciary duty to fund shareholders and certain retirement plan participants, and made false and misleading statements in the funds’ prospectuses in violation of federal and state securities laws. The Actions generally seek one or more of the following: compensatory damages, punitive damages, special damages, exemplary damages, rescission, restitution, payment of plaintiffs’ attorneys’ fees and experts’ fees, and/or replacement of the Board of Directors of the Strong Funds. Certain state Actions were not consolidated into the MDL Consolidated Actions and proceedings in these state court Actions have been or may be stayed or proceed independently of the MDL Consolidated Actions.
The Strong Funds will not bear any costs incurred in connection with these Actions. Based on currently available information, Strong believes that the Actions will not have a material adverse financial impact on the Strong Funds, and are not likely to materially affect Strong’s ability to provide investment management services to its clients, including the Strong Funds. The Funds may experience increased redemptions or a decrease in new sales of shares as a result of the regulatory settlements and the ongoing Actions, which could result in increased transaction costs and operating expenses, or otherwise negatively impact the Strong Funds.
| 11. | Pending Fund Merger |
On May 26, 2004, Strong Financial Corporation (“SFC”) announced that it reached a definitive agreement with Wells Fargo & Company (“Wells Fargo”) for Wells Fargo to acquire certain assets of SFC and certain of its affiliates, including the Advisor. As part of the transaction, Fund shareholders met on December 10, 2004 or December 22, 2004 on various matters including appointing Wells Fargo Funds Management, LLC, a wholly owned subsidiary of Wells Fargo, as a new investment advisor for the Strong Funds. A reorganization of the Strong Funds into the Wells Fargo Funds family is anticipated to take place in April 2005.
137
REPORT OF INDEPENDENT REGISTERED PUBLIC ACCOUNTING FIRM
The Board of Directors and Shareholders
of Strong Advisor Equity Funds:
We have audited the accompanying statements of assets and liabilities of Strong Advisor Common Stock Fund, Strong Advisor Mid Cap Growth Fund, Strong Advisor Small Cap Value Fund, Strong Advisor U.S. Value Fund, Strong Advisor Endeavor Large Cap Fund, Strong Advisor Focus Fund, Strong Advisor International Core Fund, Strong Advisor Select Fund, Strong Advisor Technology Fund, Strong Advisor U.S. Small/Mid Cap Growth Fund, Strong Advisor Utilities and Energy Fund, and Strong Advisor Large Company Core Fund (all twelve collectively constituting Strong Advisor Equity Funds, hereafter referred to as the “Funds”), including the schedules of investments, as of December 31, 2004, and the related statements of operations for the year then ended, the statements of changes in net assets for the year then ended, and the financial highlights for the year then ended. These financial statements and financial highlights are the responsibility of the Company’s management. Our responsibility is to express an opinion on these financial statements and financial highlights based on our audits. The statements of changes in net assets for the period ended December 31, 2003 and the financial highlights for each of the years or periods ended December 31, 2003, and prior, were audited by other auditors whose report thereon dated February 3, 2004 expressed an unqualified opinion on those financial statements.
We conducted our audits in accordance with the standards of the Public Company Accounting Oversight Board (United States). Those standards require that we plan and perform the audit to obtain reasonable assurance about whether the financial statements and financial highlights are free of material misstatement. An audit includes examining, on a test basis, evidence supporting the amounts and disclosures in the financial statements. Our procedures included confirmation of securities owned as of December 31, 2004, by correspondence with the custodian and brokers or by other appropriate auditing procedures. An audit also includes assessing the accounting principles used and significant estimates made by management, as well as evaluating the overall financial statement presentation. We believe that our audits provide a reasonable basis for our opinion.
In our opinion, the financial statements and financial highlights referred to above present fairly, in all material respects, the financial position of the Funds as of December 31, 2004, the results of their operations for the year then ended, the changes in their net assets for the year then ended, and the financial highlights for the year then ended, in conformity with U.S. generally accepted accounting principles.
/s/ KPMG LLP
Chicago, Illinois
February 14, 2005
138
| December 31, 2004 |
Results of Special Meeting of Shareholders of Strong Advisor Common Stock Fund
At a Special Meeting of the Shareholders of the Fund held on December 10, 2004, shareholders approved the following proposals: To approve the reorganization of the Strong Advisor Common Stock Fund into the Wells Fargo Advantage Common Stock Fund.
| For | Against | Abstain | ||
| 31,158,829.876 | 1,422,999.002 | 1,140,730.647 |
To approve an interim advisory agreement with Wells Fargo Funds Management, LLC.
| For | Against | Abstain | ||
| 31,032,664.604 | 1,494,041.282 | 1,195,538.639 |
To approve an interim sub-advisory agreement with Wells Capital Management Incorporated.
| For | Against | Abstain | ||
| 31,006,524.945 | 1,481,328.363 | 1,234,706.217 |
Appointment of Messrs. Phillip O. Peterson, William F. Vogt, and Gordon B. Greer as Trustees of the Liquidating Trust, which is referenced in the Agreement and Plan of Reorganization.
| For | Against | Abstain | ||
| 33,722,559.525 | — | — |
Results of Special Meeting of Shareholders of Strong Advisor Mid Cap Growth Fund
At a Special Meeting of the Shareholders of the Fund held on December 10, 2004, shareholders approved the following proposals: To approve the reorganization of the Strong Advisor Mid Cap Growth Fund into the Wells Fargo Advantage Mid Cap Growth Fund.
| For | Against | Abstain | ||
| 2,793,869.251 | 44,738.407 | 193,855.170 |
To approve an interim advisory agreement with Wells Fargo Funds Management, LLC.
| For | Against | Abstain | ||
| 2,744,097.207 | 90,382.068 | 197,983.553 |
To approve an interim sub-advisory agreement with Wells Capital Management Incorporated.
| For | Against | Abstain | ||
| 2,788,660.601 | 45,716.312 | 198,085.915 |
Appointment of Messrs. Phillip O. Peterson, William F. Vogt, and Gordon B. Greer as Trustees of the Liquidating Trust, which is referenced in the Agreement and Plan of Reorganization.
| For | Against | Abstain | ||
| 3,032,462.828 | — | — |
Results of Special Meeting of Shareholders of Strong Advisor Small Cap Value Fund
At a Special Meeting of the Shareholders of the Fund held on December 22, 2004, shareholders approved the following proposals: To approve the reorganization of the Strong Advisor Small Cap Value Fund into the Wells Fargo Advantage Small Cap Value Fund.
| For | Against | Abstain | ||
| 33,682,758.214 | 858,645.869 | 1,267,349.236 |
To approve an interim advisory agreement with Wells Fargo Funds Management, LLC.
| For | Against | Abstain | ||
| 33,669,973.056 | 820,174.308 | 1,318,605.955 |
139
RESULTS OF SHAREHOLDERS MEETINGS (Unaudited) (continued) | December 31, 2004 |
To approve an interim sub-advisory agreement with Wells Capital Management Incorporated.
| For | Against | Abstain | ||
| 33,618,644.758 | 832,169.819 | 1,357,938.742 |
Appointment of Messrs. Phillip O. Peterson, William F. Vogt, and Gordon B. Greer as Trustees of the Liquidating Trust, which is referenced in the Agreement and Plan of Reorganization.
| For | Against | Abstain | ||
| 35,808,753.319 | — | — |
Results of Special Meeting of Shareholders of Strong Advisor U.S. Value Fund
At a Special Meeting of the Shareholders of the Fund held on December 10, 2004, shareholders approved the following proposals: To approve the reorganization of the Strong Advisor U.S. Value Fund into the Wells Fargo Advantage U.S. Value Fund.
| For | Against | Abstain | ||
| 13,389,747.135 | 104,439.491 | 63,498.406 |
To approve an interim advisory agreement with Wells Fargo Funds Management, LLC.
| For | Against | Abstain | ||
| 13,373,669.790 | 115,153.273 | 68,861.969 |
To approve an interim sub-advisory agreement with Wells Capital Management Incorporated.
| For | Against | Abstain | ||
| 13,364,430.657 | 114,765.666 | 78,488.709 |
Appointment of Messrs. Phillip O. Peterson, William F. Vogt, and Gordon B. Greer as Trustees of the Liquidating Trust, which is referenced in the Agreement and Plan of Reorganization.
| For | Against | Abstain | ||
| 13,557,685.032 | — | — |
Results of Special Meeting of Shareholders of Strong Advisor Endeavor Large Cap Fund
At a Special Meeting of the Shareholders of the Fund held on December 10, 2004, shareholders approved the following proposals: To approve the reorganization of the Strong Advisor Endeavor Large Cap Fund into the Wells Fargo Advantage Endeavor Large Cap Fund.
| For | Against | Abstain | ||
| 2,108,654.620 | 69,560.000 | 22,557.000 |
To approve an interim advisory agreement with Wells Fargo Funds Management, LLC.
| For | Against | Abstain | ||
| 2,104,962.620 | 65,830.000 | 29,979.000 |
To approve an interim sub-advisory agreement with Wells Capital Management Incorporated.
| For | Against | Abstain | ||
| 2,101,798.620 | 64,150.000 | 34,823.000 |
Appointment of Messrs. Phillip O. Peterson, William F. Vogt, and Gordon B. Greer as Trustees of the Liquidating Trust, which is referenced in the Agreement and Plan of Reorganization.
| For | Against | Abstain | ||
| 2,200,771.620 | — | — |
140
Results of Special Meeting of Shareholders of Strong Advisor Focus Fund
At a Special Meeting of the Shareholders of the Fund held on December 10, 2004, shareholders approved the following proposals: To approve the reorganization of the Strong Advisor Focus Fund into the Wells Fargo Advantage Large Company Growth Fund.
| For | Against | Abstain | ||
| 201,123.000 | 13,232.000 | 4,769.000 |
To approve an interim advisory agreement with Wells Fargo Funds Management, LLC.
| For | Against | Abstain | ||
| 201,911.000 | 13,232.000 | 3,981.000 |
To approve an interim sub-advisory agreement with Peregrine Capital Management, Inc.
| For | Against | Abstain | ||
| 194,596.000 | 16,761.000 | 7,767.000 |
Appointment of Messrs. Phillip O. Peterson, William F. Vogt, and Gordon B. Greer as Trustees of the Liquidating Trust, which is referenced in the Agreement and Plan of Reorganization.
| For | Against | Abstain | ||
| 219,124.000 | — | — |
Results of Special Meeting of Shareholders of Strong Advisor International Core Fund
At a Special Meeting of the Shareholders of the Fund held on December 10, 2004, shareholders approved the following proposals: To approve the reorganization of the Strong Advisor International Core Fund into the Wells Fargo Advantage International Core Fund.
| For | Against | Abstain | ||
| 86,591.609 | 1,751.000 | — |
To approve an interim advisory agreement with Wells Fargo Funds Management, LLC.
| For | Against | Abstain | ||
| 86,591.609 | 1,751.000 | — |
To approve an interim sub-advisory agreement with New Star Institutional Managers Limited.
| For | Against | Abstain | ||
| 86,591.609 | 1,751.000 | — |
Appointment of Messrs. Phillip O. Peterson, William F. Vogt, and Gordon B. Greer as Trustees of the Liquidating Trust, which is referenced in the Agreement and Plan of Reorganization.
| For | Against | Abstain | ||
| 88,342.609 | — | — |
Results of Special Meeting of Shareholders of Strong Advisor Select Fund
At a Special Meeting of the Shareholders of the Fund held on December 10, 2004, shareholders approved the following proposals: To approve the reorganization of the Strong Advisor Select Fund into the Wells Fargo Advantage Endeavor Select Fund.
| For | Against | Abstain | ||
| 4,648,966.486 | 126,390.000 | 52,595.000 |
To approve an interim advisory agreement with Wells Fargo Funds Management, LLC.
| For | Against | Abstain | ||
| 4,643,878.486 | 120,130.000 | 63,943.000 |
141
RESULTS OF SHAREHOLDERS MEETINGS (Unaudited) (continued) | December 31, 2004 |
To approve an interim sub-advisory agreement with Wells Capital Management Incorporated.
| For | Against | Abstain | ||
| 4,633,164.486 | 116,326.000 | 78,461.000 |
Appointment of Messrs. Phillip O. Peterson, William F. Vogt, and Gordon B. Greer as Trustees of the Liquidating Trust, which is referenced in the Agreement and Plan of Reorganization.
| For | Against | Abstain | ||
| 4,827,951.486 | — | — |
Results of Special Meeting of Shareholders of Strong Advisor Technology Fund
At a Special Meeting of the Shareholders of the Fund held on December 10, 2004, shareholders approved the following proposals: To approve the reorganization of the Strong Advisor Technology Fund into the Wells Fargo Advantage Specialized Technology Fund.
| For | Against | Abstain | ||
| 112,147.508 | 687.000 | 1,010.000 |
To approve an interim advisory agreement with Wells Fargo Funds Management, LLC.
| For | Against | Abstain | ||
| 112,147.508 | 687.000 | 1,010.000 |
To approve an interim sub-advisory agreement with RCM Capital Management, LLC.
| For | Against | Abstain | ||
| 112,147.508 | 687.000 | 1,010.000 |
Appointment of Messrs. Phillip O. Peterson, William F. Vogt, and Gordon B. Greer as Trustees of the Liquidating Trust, which is referenced in the Agreement and Plan of Reorganization.
| For | Against | Abstain | ||
| 113,844.508 | — | — |
Results of Special Meeting of Shareholders of Strong Advisor U.S. Small/Mid Cap Growth Fund
At a Special Meeting of the Shareholders of the Fund held on December 10, 2004, shareholders approved the following proposals: To approve the reorganization of the Strong Advisor U.S. Small/Mid Cap Growth Fund into the Wells Fargo Advantage Small Cap Growth Fund.
| For | Against | Abstain | ||
| 262,365.954 | 4,857.000 | 12,621.000 |
To approve an interim advisory agreement with Wells Fargo Funds Management, Inc.
| For | Against | Abstain | ||
| 262,213.954 | 5,009.000 | 12,621.000 |
To approve an interim sub-advisory agreement with Wells Capital Management Incorporated.
| For | Against | Abstain | ||
| 262,213.954 | 4,699.000 | 12,931.000 |
Appointment of Messrs. Phillip O. Peterson, William F. Vogt, and Gordon B. Greer as Trustees of the Liquidating Trust, which is referenced in the Agreement and Plan of Reorganization.
| For | Against | Abstain | ||
| 279,843.954 | — | — |
142
Results of Special Meeting of Shareholders of Strong Advisor Utilities and Energy Fund
At a Special Meeting of the Shareholders of the Fund held on December 10, 2004, shareholders approved the following proposals: To approve the reorganization of the Strong Advisor Utilities and Energy Fund into the Wells Fargo Advantage Equity Income Fund.
| For | Against | Abstain | ||
| 636,265.000 | 1,743.000 | — |
To approve an interim advisory agreement with Wells Fargo Funds Management, LLC.
| For | Against | Abstain | ||
| 636,265.000 | 1,743.000 | — |
To approve an interim sub-advisory agreement with Wells Capital Management Incorporated.
| For | Against | Abstain | ||
| 635,686.000 | 2,322.000 | — |
Appointment of Messrs. Phillip O. Peterson, William F. Vogt, and Gordon B. Greer as Trustees of the Liquidating Trust, which is referenced in the Agreement and Plan of Reorganization.
| For | Against | Abstain | ||
| 638,008.000 | — | — |
Results of Special Meeting of Shareholders of Strong Advisor Large Company Core Fund
At a Special Meeting of the Shareholders of the Fund held on December 10, 2004, shareholders approved the following proposals: To approve the reorganization of the Strong Advisor Large Company Core Fund into the Wells Fargo Advantage Large Company Core Fund.
| For | Against | Abstain | ||
| 5,100,289.787 | 86,631.717 | 106,736.070 |
To approve an interim advisory agreement with Wells Fargo Funds Management, LLC.
| For | Against | Abstain | ||
| 5,088,005.787 | 89,534.717 | 116,117.070 |
To approve an interim sub-advisory agreement with Matrix Asset Advisors, Inc.
| For | Against | Abstain | ||
| 5,067,419.787 | 91,935.717 | 134,302.070 |
Appointment of Messrs. Phillip O. Peterson, William F. Vogt, and Gordon B. Greer as Trustees of the Liquidating Trust, which is referenced in the Agreement and Plan of Reorganization.
| For | Against | Abstain | ||
| 5,293,657.574 | — | — |
143
Each officer and director holds the same position with the 27 registered open-end management investment companies consisting of 70 mutual funds (“Strong Funds”).
Willie D. Davis (DOB 7-24-34), Director of the Strong Funds since July 1994.
Mr. Davis has been President and Chief Executive Officer of All Pro Broadcasting, Inc., since 1977; Director of Wisconsin Energy Corporation (formerly WICOR, Inc., a utility company) since 1990, Metro-Goldwyn-Mayer, Inc. (an entertainment company) since 1998, Checker’s Drive-In Restaurants, Inc. (formerly Rally’s Hamburgers, Inc.) since 1994, Johnson Controls, Inc. (an automotive systems and facility management company) since 1992, MGM Mirage (formerly MGM Grand, Inc., an entertainment/hotel company) since 1990, Dow Chemical Company since 1988, Sara Lee Corporation (a food/consumer products company) since 1983, Alliance Bank since 1980, Manpower, Inc. (a worldwide provider of staffing services) since 2001, Bassett Furniture Industries, Inc. from 1997 to December 2004, and Kmart Corporation (a discount consumer products company) from 1985 to 2003; and Trustee of the University of Chicago since 1980 and Marquette University since 1988.
Gordon B. Greer (DOB 2-17-32), Director of the Strong Funds since March 2002.
Mr. Greer was Of Counsel for Bingham McCutchen LLP (a law firm previously known as Bingham Dana LLP) from 1997 to February 2002 and Partner of Bingham McCutchen LLP from 1967 to 1997. On behalf of Bingham McCutchen LLP, Mr. Greer provided representation to the disinterested directors of the Strong Funds from 1991 to February 2002. Bingham McCutchen LLP has provided representation to the Independent Directors of the Strong Funds since 1991.
Stanley Kritzik (DOB 1-9-30), Director of the Strong Funds since January 1995 and Chairman of the Audit Committee of the Strong Funds since July 2000.
Mr. Kritzik has been Partner of Metropolitan Associates (a real estate firm) since 1962; Director of Wisconsin Health Information Network from November 1997 to September 2004, Health Network Ventures, Inc. from 1992 to April 2000, and Aurora Health Care from September 1987 to September 2002; and Member of the Board of Governors of Snowmass Village Resort Association from October 1999 to October 2002.
Neal Malicky (DOB 9-14-34), Director of the Strong Funds since December 1999.
Mr. Malicky has been President Emeritus of Baldwin-Wallace College since July 2000; Chancellor of Baldwin-Wallace College from July 1999 to June 2000; President of Baldwin-Wallace College from July 1981 to June 1999; Trustee of Southwest Community Health Systems, Cleveland Scholarship Program, and The National Conference for Community and Justice until 2001; President of the National Association of Schools and Colleges of the United Methodist Church, Chairperson of the Association of Independent Colleges and Universities of Ohio, and Secretary of the National Association of Independent Colleges and Universities until 2001.
William F. Vogt (DOB 7-19-47), Director and Chairman of the Independent Directors Committee of the Strong Funds since January 1995.
Mr. Vogt has been President of Vogt Holdings, LLC since July 2004; Senior Vice President of IDX Systems Corporation (a management consulting firm) from June 2001 to June 2004; President of Vogt Management Consulting, Inc. from July 1990 to June 2001; and former Fellow of the American College of Medical Practice Executives.
144
DIRECTORS AND OFFICERS (continued)
Ane K. Ohm (DOB 10-16-69), Anti-Money Laundering Compliance Officer of the Strong Funds since November 2002.
Ms. Ohm has been Anti-Money Laundering Compliance Officer of Strong Financial Corporation since February 2003; Assistant Executive Vice President of Strong Financial Corporation since November 2003; Assistant Executive Vice President of Strong Capital Management, Inc. (the “Advisor”) since December 2001; Director of Mutual Fund Administration of Strong Investor Services, Inc. since April 2001; Vice President of Strong Investor Services, Inc. since December 2001; and Marketing Services Manager of Strong Investments, Inc. (the “Distributor”) from November 1998 to April 2001.
R. Michael Parker (DOB 6-17-45), Chief Compliance Officer of the Strong Funds since August 2004.
Mr. Parker was a Senior Compliance Examiner with the United States Securities and Exchange Commission from April 1970 to April 2004.
Phillip O. Peterson (DOB 12-5-44), Independent President of the Strong Funds since January 2004.
Mr. Peterson was a mutual fund industry consultant from August 1999 to December 2003; Partner of KPMG LLP from 1981 to July 1999; Director of The Hartford Group of Mutual Funds (71 funds) since 2002; and Director of the Fortis Mutual Fund Group (38 funds) from 2000 to 2002.
John W. Widmer (DOB 1-19-65), Treasurer of the Strong Funds since April 1999; Secretary of the Strong Funds since November 2004.
Mr. Widmer has been Treasurer of the Advisor since April 1999; Assistant Treasurer of Strong Financial Corporation since December 2001; Secretary of Strong Financial Corporation since September 2004; Assistant Secretary of Strong Financial Corporation from December 2001 to January 2003; Treasurer of Strong Service Corporation since April 1999; Treasurer and Secretary of Strong Investor Services, Inc. since September 2004; Treasurer and Assistant Secretary of Strong Investor Services, Inc. from July 2001 to September 2004; and Manager of the Financial Management and Sales Reporting Systems department of the Advisor from May 1997 to April 1999.
Thomas M. Zoeller (DOB 2-21-64), Vice President of the Strong Funds since October 1999.
Mr. Zoeller has been Executive Vice President of the Advisor since April 2001; Chief Financial Officer of the Advisor since February 1998; Secretary of the Advisor from December 2001 to November 2002; Member of the Office of the Chief Executive of Strong Financial Corporation since May 2001; Chief Financial Officer and Treasurer of Strong Investments, Inc. from October 1993 to September 2004; Executive Vice President of Strong Investor Services, Inc. since July 2001; Secretary of Strong Investor Services, Inc. from July 2001 to May 2003; Executive Vice President, Chief Financial Officer, and Secretary of Strong Service Corporation since December 2001; Treasurer of Strong Service Corporation from September 1996 to April 1999; Vice President of Strong Service Corporation from April 1999 to December 2001; Member of the Office of the Chief Executive of the Advisor from November 1998 until May 2001; Senior Vice President of the Advisor from February 1998 to April 2001; and Director of Capital Processing International, LLC since September 2004.
Effective January 2005, Dana J. Russart replaced Mr. Zoeller as Vice President of the Strong Funds.
Except for Messrs. Davis, Malicky, and Vogt, the address of all of the Directors and Officers is P.O. Box 2936, Milwaukee, WI 53201. Mr. Davis’s address is 161 North La Brea, Inglewood, CA 90301. Mr. Malicky’s address is 4608 Turnberry Drive, Lawrence, KS 66047. Mr. Vogt’s address is P.O. Box 7657, Avon, CO 81620.
The statement of additional information contains additional information about fund directors and officers and is available without charge, upon request, by calling 1-800-368-3863.
145
Directors
Willie D. Davis
Gordon B. Greer
Stanley Kritzik
Neal Malicky
William F. Vogt
Officers
Ane K. Ohm, Anti-Money Laundering Compliance Officer
R. Michael Parker, Chief Compliance Officer
Phillip O. Peterson, Independent President
John W. Widmer, Treasurer and Secretary
Thomas M. Zoeller, Vice President
Investment Advisor
Strong Capital Management, Inc.
P.O. Box 2936, Milwaukee, Wisconsin 53201
Distributor
Strong Investments, Inc.
P.O. Box 2936, Milwaukee, Wisconsin 53201
Custodian
State Street Bank and Trust Company
801 Pennsylvania Avenue, Kansas City, Missouri 64105
Transfer Agent and Dividend-Disbursing Agent
Strong Investor Services, Inc.
P.O. Box 2936, Milwaukee, Wisconsin 53201
Independent Registered Public Accounting Firm
KPMG LLP
303 East Wacker Drive, Chicago, IL 60601-5212
Legal Counsel
Godfrey & Kahn, S.C.
780 North Water Street, Milwaukee, Wisconsin 53202
146
Contact Us
To learn more about our funds, discuss an existing account, or conduct a transaction, call 1-800-368-3863 or visit www.Strong.com.
To reach us by mail, please forward to Strong Investments, P.O. Box 2936, Milwaukee, Wisconsin 53201.
Please carefully consider a fund’s investment objectives, risks, charges, and expenses before investing. For this and other information, call us or visit our web site for a free prospectus. Please read it carefully before you invest or send money.
If you are a Financial Professional, call 1-800-368-1683.
Proxy Voting Information
To receive a free copy of the policies and procedures the funds use to determine how to vote proxies relating to portfolio securities, or to receive a free copy of a fund’s proxy voting record for the most recent 12-month period ending on June 30, call 1-800-368-3863, or visit the Securities and Exchange Commission’s (SEC) web site at www.sec.gov.
Filing of Portfolio Holdings
The funds file their complete schedule of portfolio holdings with the SEC for the first and third quarters of each fiscal year on Form N-Q. Form N-Q is available on the SEC’s web site at www.sec.gov, and may be reviewed and copied at the SEC’s public reference rooms at 450 Fifth Street, N.W., Washington, D.C. 20549, or at the SEC’s regional offices in New York City, at 233 Broadway, and in Chicago, at 175 West Jackson Boulevard, Suite 900.

This report does not constitute an offer for the sale of securities. Strong Funds are offered for sale by prospectus only. Securities are offered through Strong Investments, Inc. RT48464 02-05
AEQY/WH2001 12-04
Item 1. Reports to Shareholders
ANNUAL REPORT | December 31, 2004
Strong
Growth
Funds
 | ||
Strong Blue Chip Fund
Strong Discovery Fund
Strong Endeavor Fund
Strong Large Cap Growth Fund
Strong U.S. Emerging Growth Fund
Strong Enterprise Fund
Strong Growth 20 Fund
Strong Growth Fund
Strong Large Company Growth Fund | ||

ANNUAL REPORT | December 31, 2004
Strong
Growth
Funds
On May 26, 2004, Strong Financial Corporation (“SFC”) announced that it reached a definitive agreement with Wells Fargo & Company (“Wells Fargo”) for Wells Fargo to acquire certain assets of SFC and certain of its affiliates, including the Advisor. On December 10, 2004, and on December 22, 2004, shareholders of the Strong Funds met and approved 1) the reorganization of each Strong Fund into a Wells Fargo Advantage Fund (“Reorganization”), and 2) interim investment advisory agreements between the Strong Funds and Wells Fargo Funds Management, LLC and certain sub-advisors (“Interim Agreements”). The Interim Agreements became effective January 1, 2005. The Reorganization of the Funds is expected to occur on or about April 11, 2005.
Table of Contents
| Investment Reviews | ||
| 2 | ||
| 6 | ||
| 10 | ||
| 14 | ||
| 18 | ||
| 22 | ||
| 26 | ||
| 30 | ||
| 34 | ||
Your Fund’s Expenses | 38 | |
Financial Information | ||
| 40 | ||
| 40 | ||
| 42 | ||
| 44 | ||
| 45 | ||
| 47 | ||
| 49 | ||
| 49 | ||
| 52 | ||
| 54 | ||
| 61 | ||
| 64 | ||
| 68 | ||
| 77 | ||
| 92 | ||
| 93 | ||
| 97 | ||

Market Update From Dick Weiss
January 1, 2004, to December 31, 2004 |
It’s indisputable: When it comes to the stock market, resolution brings results.
We saw this clearly at the tail end of 2004. The market as a whole had wandered aimlessly for the first 10 months of the year, spooked by uncertainty over the outcome of a contentious U.S. Presidential Election and our continuing involvement in Iraq. With George W. Bush’s reelection in November, the market surged, driven by the knowledge that there would be no change of administration in Washington and the U.S. commitment to democratize Iraq would continue.
One issue that currently weighs on the markets is inflation. There was tremendous inflation at the raw material level in both 2003 and 2004, but it has not shown up in any marked degree in the Consumer Price Index (CPI). The most obvious example occurred in the energy sector, where oil rose well above $50 per barrel. Historically, that sort of spike in oil prices would have dramatically (and negatively) impacted the average American’s financial affairs. This time, however, it did not.
Why? Because rather than pass on those increasing raw material costs to customers, most companies chose to take the hit themselves, largely because demand seemed soft. It seems to me that the tricky question is whether companies will continue to absorb higher prices for raw materials (thus depressing profit margins) or, rather, pass those costs along to the public.
In any event, it’s clear that there’s a lot more inflation in the system than is reflected in the CPI. Hence, it’s become a matter of how that inflation will be managed — and by whom.
It’s also worth noting that there are deflationary pressures afoot in the world’s economy today. China, absorbing millions of new workers into its labor pool, is exporting cheap goods around the globe. The United States is the destination for a disproportionate share of that production, and the Chinese are financing our purchases. For the moment, that practice has helped to prop up the U.S. dollar. In the long run, it has unsettling implications.
As we look at 2005, there are a lot of moving parts out there — inflation, deflation, Iraq, China, the ups-and-downs of the U.S. dollar, and the mind-boggling developments in technology with their transformative effects on both our corporate and personal lives. Rapidly aging populations in Europe and China will cause seismic demographic shifts that we believe will have a long-term, dramatic effect on the world economy and markets.
Thanks for your continued investment.

Richard T. Weiss
Strong Financial Corporation |
The Strong Blue Chip Fund posted a return of 12.68% for the twelve months ended December 31, 2004. This placed it ahead of its broad-based benchmark, the Standard and Poor’s 500, which returned 10.87% for the same period.
A narrow market for much of the year
While equity markets were at times volatile during the first nine months of 2004, for the most part stocks fluctuated within a relatively narrow band. This breather was not entirely surprising given 2003’s strong gains, but other factors played a role in keeping equity returns mild for most of the year, including the continuing situation in Iraq, impending Federal Reserve interest-rate hikes, high energy prices, and worries about the impact of slowing Chinese growth on the Asian regional and global economies.
April was a particularly challenging month for the markets and the Fund, as a sharp improvement in employment data provoked fears of inflation and higher interest rates. Because the Fund had significant positions in stocks that were negatively affected by such concerns, performance suffered during this time. Investor sentiment began to improve somewhat near the end of May, as the market once again focused its attention on the good news regarding strong corporate profits and new job creation. Holdings that had been hurt by investors’ concerns in April had largely stabilized and recovered by the end of the first half of the year.
Change came in the fourth quarter
Although equity returns remained tepid in the year’s third quarter, they staged a solid comeback in the fourth, as investors gained greater confidence in the economic outlook. Corporate profits climbed to record levels, job creation appeared to pick up, and oil prices moved down from their earlier highs. The quick resolution to the November elections — unlike the drawn-out scenario in 2000 — and a result that was generally seen as positive for business allowed the equity markets to enjoy a strong upturn through most of the remainder of the year.
The Fed raised rates a total of five times before the end of the year, bringing the target rate up to 2.25% from 1.00%. The measured pace of these increases, a quarter point at a time, helped to quiet fears of inflation.
Factors driving Fund performance
In the first half of the year, the Fund’s energy holdings contributed positively to performance. Our emphasis in this sector was on the large integrated oil companies, which benefited from higher demand for oil, strong margins on refining operations, and low debt levels that helped to mute the impact of rising interest rates.
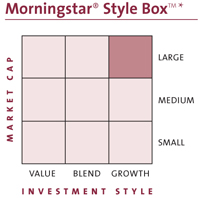
Later in the year, many of the Fund’s gains took place in such cyclical sectors as materials, select technology, and industrial stocks. This was indicative of improving investor sentiment with respect to the sustainability of the economic recovery. We had significant holdings in these areas, including Phelps Dodge and Nucor. Home sales continued to be strong, allowing our investments among homebuilders to make meaningful contributions to the Fund’s performance. Internet companies Ebay and Yahoo! also had a positive impact on the Fund’s returns.
Our focus on large capitalization stocks hurt our results over the year, as smaller-company stocks on the whole outperformed larger-cap stocks. We were nonetheless able to comfortably outpace the Fund’s benchmark for the year.
Our investment outlook
For months, many factors took a toll on investor confidence — factors that had little to do with the economy or corporate earnings. Now, investors once again are paying attention to some very positive underlying economic trends. This offers the potential for positive impact on equity markets, though perhaps not at the same rate as in the fourth quarter of 2004.
We anticipate that economic growth should continue at a sustainable pace in coming months. Corporate earnings have been strong, and there is good reason they will continue to be so. Inflation remains at manageable levels, and the Federal Reserve appears to be strongly committed to its measured pace of rate increases. There are still many concerns facing investors, including geopolitical uncertainty and rising interest rates, but on balance, we believe positive economic factors could help to drive reasonable gains among large-cap stocks in coming months.
Although energy prices remain an area of concern — despite recent declines — we believe that even at higher levels, oil prices are not likely to put a severe crimp in economic growth. Energy consumption per unit of Gross Domestic Product (GDP) is dramatically lower than it was in the 1970s, indicating a level of efficiency that allows the economy to absorb higher prices.
Effective January 1, 2005, John S. Dale, CFA, and Gary E. Nussbaum, CFA, of Peregrine Capital Management, Inc., became the Portfolio Co-Managers of the Fund. In addition, the Fund is expected to reorganize into the Wells Fargo Advantage Large Company Growth Fund on or about April 11, 2005.
Thank you for your investment in the Strong Blue Chip Fund.
| * | The Morningstar Style Box™ reflects a fund’s investment strategy. For equity funds, the vertical axis shows the market capitalization of the stocks owned and the horizontal axis shows investment style (value, blend, or growth). |
Mention of specific securities in this report is not indicative of whether the Fund may make additional purchases of, sell all or a portion of, or continue to hold those securities.
2
Fund Highlights
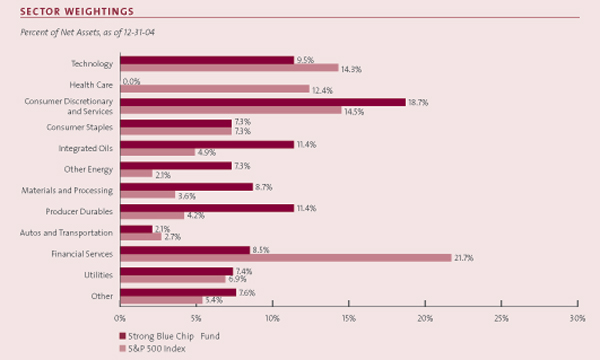
Source: Frank Russell Company via FactSet
3
Strong Blue Chip Fund
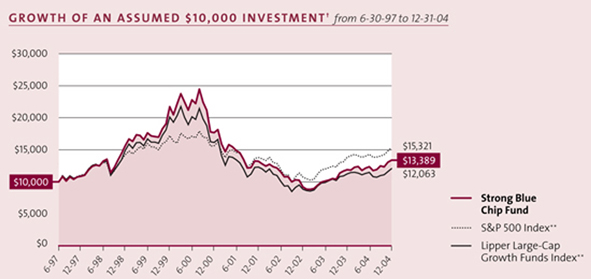
Performance is historical and does not guarantee future results. Investment returns and principal value will fluctuate, and you may have a gain or loss when you sell shares. Current performance may be lower or higher than the quoted performance. Call us or visit www.Strong.com for the most recent month-end performance.
| † | This graph, provided in accordance with SEC regulations, compares a $10,000 investment in the Fund, made at its inception, with the performance of the S&P 500 Index and the Lipper Large-Cap Growth Funds Index. Results include the reinvestment of all dividends and capital gains distributions. The graph and the Average Annual Total Returns table do not reflect the deduction of taxes, if any, that a shareholder would pay on Fund distributions or the redemption of Fund shares. |
Definitions:
| ** | The S&P 500 Index consists of 500 stocks chosen for market size, liquidity, and industry group representation. It is a market value weighted index (stock price times number of shares outstanding), with each stock’s weight in the Index proportionate to its market value. The Lipper Large-Cap Growth Funds Index is the average of the 30 largest funds in the Lipper Large-Cap Growth Funds Category. Source of the S&P Index data is Standard & Poor’s Micropal. Source of the Lipper Index data is Lipper. |
| It is not possible to invest directly in an index. |
Top Holdings
Percent of Net Assets, as of 12-31-04
eBay, Inc. | 5.3 | % | |
ConocoPhillips | 4.7 | % | |
Yahoo! Inc. | 4.1 | % | |
America Movil ADR Series L | 3.8 | % | |
QUALCOMM, Inc. | 3.7 | % | |
General Electric Company | 3.7 | % | |
Tyco International, Ltd. | 3.7 | % | |
Burlington Resources, Inc. | 3.6 | % | |
D.R. Horton, Inc. | 3.6 | % | |
Starwood Hotels & Resorts Worldwide, Inc. | 3.5 | % | |
Top Ten | 39.7 | % | |
Holdings vary. More complete holdings are available at www.Strong.com.
Percentage Restrictions: The Fund’s prospectus and statement of additional information may describe restrictions on the percentage of a particular type or quality of security in which the Fund may invest (“Percentage Restrictions”). Percentage Restrictions apply at the time the Fund purchases a security. Circumstances subsequent to the purchase of the security, such as a change in: (1) the Fund’s assets (e.g., due to cash inflows and redemptions), (2) the market value of the security, or (3) the pricing, liquidity, or rating of the security, may cause the Fund to exceed or fall short of the Percentage Restriction. If this happens, the Fund’s continued holding of the security will not constitute a violation of the Percentage Restriction.
4
Average Annual Total Returns
As of 12-31-04
Investor Class1 | |||
1-year | 12.68 | % | |
5-year | -9.23 | % | |
Since Fund Inception (6-30-97) | 3.97 | % |
Performance is historical and does not guarantee future results. Investment returns and principal value will fluctuate, and you may have a gain or loss when you sell shares. Current performance may be lower or higher than the quoted performance. Call us or visit www.Strong.com for the most recent month-end performance.
Fee Waivers:
| 1 | From time to time, the Fund’s advisor and/or administrator has waived fees and/or absorbed Fund expenses, which has resulted in higher returns. As of 12-31-04, there are waivers and/or absorptions in effect. |
Top Ten Industries
Percent of Net Assets, as of 12-31-04
Diversified Operations | 12.6 | % | |
Oil & Gas — International Integrated | 8.9 | % | |
Telecommunications — Wireless Services | 7.2 | % | |
Oil & Gas — United States Exploration & Production | 5.8 | % | |
Building — Resident/Commercial | 5.7 | % | |
Internet — E*Commerce | 5.3 | % | |
Internet — Content | 4.1 | % | |
Telecommunications — Wireless Equipment | 3.7 | % | |
Leisure — Hotels & Motels | 3.5 | % | |
Steel — Producers | 3.5 | % | |
Top Ten | 60.3 | % | |
Risks: Stock funds should only be considered for long-term goals as values fluctuate in response to the activities of individual companies and general market and economic conditions. Investment strategies that concentrate in particular market segments or fewer securities tend to increase the total risk of an investment (relative to the broader market). This Fund is exposed to growth-style investing risk and medium-company risk. Consult the Fund’s prospectus for additional information on these and other risks.
5
The stock market delivered a second consecutive year of gains to investors in 2004. The economy grew in fits and starts, making equity returns volatile, with much of the year’s gain being produced in the fourth quarter. For the year ended December 31, 2004, the Strong Discovery Fund’s value rose by 15.69%, compared to the Fund’s broad-based benchmark, the Russell 2000 Index, which advanced 18.33%. While the Fund delivered strong returns to shareholders, it lagged the benchmark, as the Fund’s growth style underperformed the broader market.
The year tested investors, as gains in the equity market were limited for much of the year by uncertainty about the presidential election, uneven job growth, rising short-term interest rates, increasing energy prices, a declining dollar, and continued turmoil in Iraq. Despite these trends, the economy continued to expand, and many companies experienced healthy profit growth that supported increased stock prices. Investor expectations vacillated from optimistic to dubious with each economic statistic that was released. While an improving economy and stock market were evident, investor satisfaction with the level of growth and sustainability was continually debated.
Investigative approach to investing
Throughout the year, we faithfully executed our intensive research process of “surrounding the company” in order to attempt to generate competitive returns for the Fund’s shareholders. We attempt to delve deeply into each company through financial statement analysis, conversations with management and, lastly, investigations of suppliers, customers and competitors. By utilizing this encompassing model, we are often able to identify companies that will produce a great deal of value relative to the required investment. Moreover, the process provides us with comprehensive knowledge regarding each of the Fund’s holdings and specifically, we can gain a better understanding of where the growth is being generated.
In addition to our research process, our team encourages an environment open to dissent. Within this environment, portfolio managers and analysts constantly challenge each individual investment. Every question presented requires the investments’ position in the portfolio to be further justified. This is a well-established and respected practice of all team members that we expect to continue to assist us in assessing the risk and reward of every investment.
Marvel Enterprises and Equinix stood out
One result of our intensive research and inquisitive mindset was the Fund’s position in Marvel Enterprises. During 2004, this character-based entertainment company with interests in toy development and publishing continued to strengthen its licensing-based business model, as investors saw Spiderman return to the screen. In the process, the company may have gained valuable leverage in negotiating licensing agreements, and, we believe, laid potential groundwork for other fruitful uses of its vast pipeline of characters.
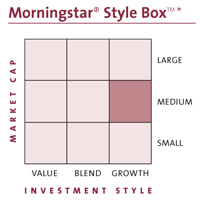
Our extensive research also enabled us to analyze interesting growth opportunities within technology. Due to increases in broadband penetration, multimedia content, and wireless data, Internet demand has been growing at an accelerated pace. One specific Fund holding that benefited from this trend was Equinix, the largest U.S. manager of data centers, which houses servers of corporations and Web portals. The company’s competitive advantage is their industry-leading aggregation of networks, which provides on-site direct interconnect access to more than 170 bandwidth providers representing more than 90% of the world’s Internet traffic. This service (of direct interconnect to the network) provides customers with access to the lowest-cost, highest-performance solution because it is a direct interconnect as opposed to other business models that require third parties.
During 2004, a holding that did not perform to our expectations was GrafTech International. This company manufactures and provides high-quality natural and synthetic graphite and carbon products and services for a variety of end markets. During the year, GrafTech incurred margin pressure due to an unexpected increase in commodity costs. Unfortunately, due to terms in the majority of long-term contracts, the company was not able to pass through the increased cost to customers. We liquidated the Fund’s position because we believed commodity costs would remain at higher levels. Therefore, the company would have continued expense pressure, impacting earnings for the foreseeable future resulting in GrafTech underperforming the markets expectations.
Outlook for 2005
As we enter 2005, we believe the key question is not whether the economy will grow but rather to what degree. We are optimistic that the economy will continue to strengthen, driven by continued acceleration of enterprise capital spending and a resultant growth in earnings.
The market remains constructive, as investors climb a “wall of worry” with concerns about the health of the consumer, fading fiscal stimulus, record budget and trade deficits, a falling dollar, and uncertain employment growth. Companies today have record levels of free cash flow, but thus far have been reluctant to invest in large-scale projects. Consequently, we have seen a huge build-up in liquidity, with corporate debt levels at fifty-year lows. Historically, rising corporate profits and cash flows have led to accelerating capital investment. For this reason, we believe that most of the capital spending cycle and inventory build-up is yet to come.
In addition, we plan to pay close attention to the levels of job creation, long-term interest rates, and the resulting impact on the U.S. dollar. As always, we will try to continue to carefully select holdings for the Fund with an eye toward owning companies possessing unique and strong fundamentals.
The Fund is expected to reorganize into the Wells Fargo Advantage Discovery Fund, the successor to the Strong Discovery Fund, on or about April 11, 2005.
Thank you for your investment in the Strong Discovery Fund. We appreciate the trust you have placed in us.
 |
Thomas J. Pence
|
| Portfolio Co-Manager |

James M. Leach
Portfolio Co-Manager
| * | The Morningstar Style Box™ reflects a fund’s investment strategy. For equity funds, the vertical axis shows the market capitalization of the stocks owned and the horizontal axis shows investment style (value, blend, or growth). |
Mention of specific securities in this report is not indicative of whether the Fund may make additional purchases of, sell all or a portion of, or continue to hold those securities.
6
Fund Highlights
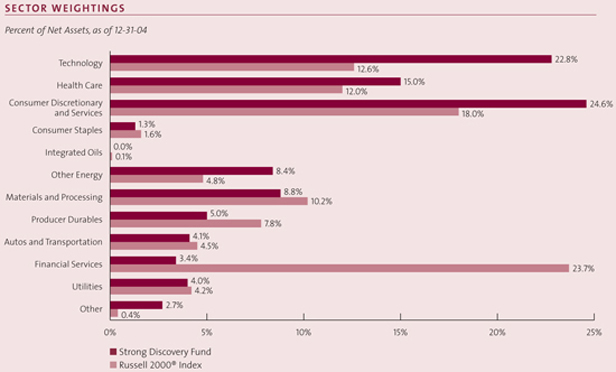
Source: Frank Russell Company via FactSet
7
Strong Discovery Fund
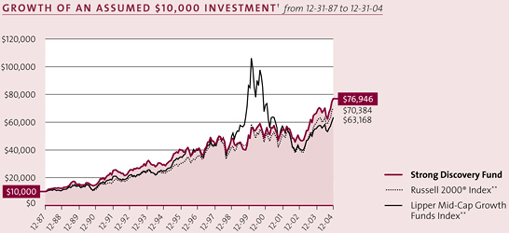
Performance is historical and does not guarantee future results. Investment returns and principal value will fluctuate, and you may have a gain or loss when you sell shares. Current performance may be lower or higher than the quoted performance. Call us or visit www.Strong.com for the most recent month-end performance.
| † | This graph, provided in accordance with SEC regulations, compares a $10,000 investment in the Fund, made at its inception, with the performance of the Russell 2000® Index and the Lipper Mid-Cap Growth Funds Index. Results include the reinvestment of all dividends and capital gains distributions. The graph and the Average Annual Total Returns table do not reflect the deduction of taxes, if any, that a shareholder would pay on Fund distributions or the redemption of Fund shares. |
Definitions:
| ** | The Russell 2000® Index measures the performance of the 2,000 smallest companies in the Russell 3000® Index, which represents approximately 8% of the total market capitalization of the Russell 3000® Index. The Lipper Mid-Cap Growth Funds Index is the average of the 30 largest funds in the Lipper Mid-Cap Growth Funds Category. Source of the Russell Index data is Standard & Poor’s Micropal. Source of the Lipper Index data is Lipper. |
| It is not possible to invest directly in an index. |
Top Holdings
Percent of Net Assets, as of 12-31-04
Marvel Enterprises, Inc. | 2.4 | % | |
NII Holdings, Inc. Class B | 2.3 | % | |
Lyondell Petrochemical Company | 2.1 | % | |
Abercrombie & Fitch Company Class A | 2.0 | % | |
Expeditors International of Washington, Inc. | 2.0 | % | |
Digene Corporation | 1.9 | % | |
Pan American Silver Corporation | 1.9 | % | |
Harman International Industries, Inc. | 1.9 | % | |
Marvell Technology Group, Ltd. | 1.8 | % | |
TIBCO Software, Inc. | 1.8 | % | |
Top Ten | 20.1 | % | |
Holdings vary. More complete holdings are available at www.Strong.com.
Percentage Restrictions: The Fund’s prospectus and statement of additional information may describe restrictions on the percentage of a particular type or quality of security in which the Fund may invest (“Percentage Restrictions”). Percentage Restrictions apply at the time the Fund purchases a security. Circumstances subsequent to the purchase of the security, such as a change in: (1) the Fund’s assets (e.g., due to cash inflows and redemptions), (2) the market value of the security, or (3) the pricing, liquidity, or rating of the security, may cause the Fund to exceed or fall short of the Percentage Restriction. If this happens, the Fund’s continued holding of the security will not constitute a violation of the Percentage Restriction.
8
Average Annual Total Returns
As of 12-31-04
Investor Class1 | |||
1-year | 15.69 | % | |
5-year | 8.78 | % | |
10-year | 10.04 | % | |
Since Fund Inception (12-31-87) | 12.75 | % |
Performance is historical and does not guarantee future results. Investment returns and principal value will fluctuate, and you may have a gain or loss when you sell shares. Current performance may be lower or higher than the quoted performance. Call us or visit www.Strong.com for the most recent month-end performance.
Fee Waivers:
| 1 | From time to time, the Fund’s advisor and/or administrator has waived fees and/or absorbed Fund expenses, which has resulted in higher returns. As of 12-31-04, there are waivers and/or absorptions in effect. |
Top Ten Industries
Percent of Net Assets, as of 12-31-04
Electronics — Semiconductor Manufacturing | 7.0 | % | |
Internet — E*Commerce | 6.8 | % | |
Medical — Biomedical/Biotechnology | 6.1 | % | |
Telecommunications — Wireless Services | 5.2 | % | |
Computer Software — Enterprise | 3.2 | % | |
Computer Software — Security | 2.9 | % | |
Oil & Gas — United States Exploration & Production | 2.7 | % | |
Oil & Gas — Drilling | 2.5 | % | |
Leisure — Toys/Games/Hobby | 2.4 | % | |
Medical — Systems/Equipment | 2.2 | % | |
Top Ten | 41.0 | % | |
Risks: Stock funds should only be considered for long-term goals as values fluctuate in response to the activities of individual companies and general market and economic conditions. Investment strategies that concentrate in particular market segments or fewer securities tend to increase the total risk of an investment (relative to the broader market). This Fund is exposed to the following specific risks: growth-style investing risk, small-company risk, and medium-company risk. Consult the Fund’s prospectus for additional information on these and other risks.
9
The stock market delivered a second consecutive year of gains to investors in 2004. The economy grew in fits and starts, making equity returns volatile, with much of the year’s gain being produced in the fourth quarter. For the year ended December 31, 2004, the Strong Endeavor Fund rose by 14.16%, compared to its broad-based benchmark, the Standard & Poor’s 500 Index, which advanced 10.87%. The Fund outperformed its benchmark, as it focused on companies with the strongest fundamentals and avoided many of the highly publicized disappointments during the period.
The year tested investors, as gains in the equity market were limited for much of the year by uncertainty about the presidential election, uneven job growth, increasing energy prices, rising short-term interest rates, a declining dollar, and continued turmoil in Iraq. Despite these trends, the economy continued to expand, and many companies experienced healthy profit growth that supported higher stock prices.
Investigative approach to investing
Throughout the year, we faithfully executed on our intensive research process of “surrounding the company” in order to generate competitive returns for Fund shareholders. We attempt to delve deeply into each company through financial statement analysis, conversations with management, and channel checks of suppliers, customers and competitors. By utilizing this encompassing model, we are often able to identify companies that have the potential to produce a great deal of value relative to the required investment. Moreover, the process provides us with comprehensive knowledge regarding each of the Fund’s holdings.
Equally important is the fact that our team encourages an environment open to dissent. Within this environment, portfolio managers and analysts constantly challenge each individual investment. Every question presented requires the investment to further justify its position within the Fund. This is a well-established and respected practice of all team members that expect to continue to assist us in assessing the risk and reward of every investment.
Holdings that outperformed
Due to the concerns about oil supply relative to growing demand, many companies that produce energy and those that make equipment to recover energy performed well.
The Fund held one of these, Canadian Natural Resources, a premier exploration and production company. The company’s Horizon oil sands project, currently under construction in Alberta, Canada, is expected to come on line in 2008 and has been estimated to be capable of producing up to six billion barrels of oil over about 40 years. In addition to its Alberta operations, the company has holdings in the North Sea and West Africa.
Another top performer for the Fund for the year was Yahoo!. One of the key drivers for this online media company was an increase in online advertising. During the period, online media represented almost 15% of total media consumption by consumers and continued to gain market share. However, only 3 to 5% of total advertising dollars were spent online. If recent trends persist, we believe this gap could start to close in 2005. Yahoo!’s competitive advantages are its breadth of offerings to advertisers, its global reach and its breadth of product offerings on wireline and wireless devices.
Despite solid fundamental results, Fund’s holding in Teva Pharmaceuticals underperformed in 2004 due to investors’ concern regarding future competition in both the branded and generic pharmaceutical businesses, which resulted in a negative impact on the Fund’s performance. Based on our analysis, we believed this negative sentiment would prove misguided. We hoped to see confirmation of our positive fundamental outlook for the generic industry; numerous new product launches for Teva, and stable market share trends for Teva’s largest branded product, Copaxone.
Outlook for 2005
As we enter 2005, we are optimistic that the economy will continue to strengthen, driven by continued acceleration of enterprise capital spending and a resultant growth in earnings. The market remains constructive, climbing a “wall of worry” reflecting investors’ concerns about the health of the consumer, fading fiscal stimulus, record budget and trade deficits, a falling dollar, and uncertain employment growth.
Companies today have record levels of free cash flow but thus far have been reluctant to invest in large-scale projects. Consequently, we have seen a huge build-up in liquidity, with corporate debt levels at fifty-year lows. Historically rising corporate profits and cash flows have led to accelerating capital investment. For this reason, we believe that most of the capital spending cycle and inventory build-up is yet to come.
In addition, we plan to pay close attention to the levels of job creation, long-term interest rates, and the resulting impact on the U.S. dollar. As always, we will try to continue to carefully select holdings for the Fund, emphasizing companies possessing unique and strong fundamentals.
The Fund is expected to reorganize into the Wells Fargo Advantage Capital Growth Fund, the successor to the Strong Large Company Growth Fund, on or about April 11, 2005.
Thank you for your continued investment in the Strong Endeavor Fund. We appreciate the trust you have placed in us.
 |
Thomas J. Pence
|
| Portfolio Manager |
| * | The Morningstar Style Box™ reflects a fund’s investment strategy. For equity funds, the vertical axis shows the market capitalization of the stocks owned and the horizontal axis shows investment style (value, blend, or growth). |
Mention of specific securities in this report is not indicative of whether the Fund may make additional purchases of, sell all or a portion of, or continue to hold those securities.
10
Fund Highlights
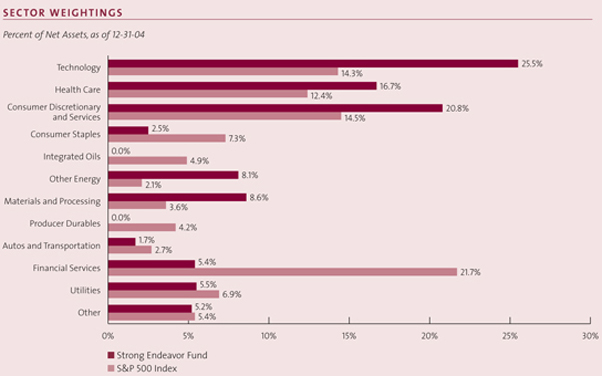
Source: Frank Russell Company via FactSet
11
Strong Endeavor Fund

Performance is historical and does not guarantee future results. Investment returns and principal value will fluctuate, and you may have a gain or loss when you sell shares. Current performance may be lower or higher than the quoted performance. Call us or visit www.Strong.com for the most recent month-end performance.
| † | This graph, provided in accordance with SEC regulations, compares a $10,000 investment in the Fund, made at its inception, with a similar investment in the S&P 500 Index and the Lipper Large-Cap Growth Funds Index. Results include the reinvestment of all dividends and capital gains distributions. The graph and the Average Annual Total Returns table do not reflect the deduction of taxes, if any, that a shareholder would pay on Fund distributions or the redemption of Fund shares. To equalize time periods, the indices’ performances were prorated for the month of April 2001. |
Definitions:
| ** | The S&P 500 Index consists of 500 stocks chosen for market size, liquidity, and industry group representation. It is a market value weighted index (stock price times number of shares outstanding), with each stock’s weight in the Index proportionate to its market value. The Lipper Large-Cap Growth Funds Index is the average of the 30 largest funds in the Lipper Large-Cap Growth Funds Category. Source of the S&P Index data is Standard & Poor’s Micropal. Source of the Lipper Index data is Lipper. |
| It is not possible to invest directly in an index. |
Top Holdings
Percent of Net Assets, as of 12-31-04
Yahoo! Inc. | 5.3 | % | |
Sprint Corporation | 4.7 | % | |
WellPoint, Inc. | 4.5 | % | |
EMC Corporation | 4.0 | % | |
Dell, Inc. | 3.9 | % | |
General Electric Company | 3.8 | % | |
Phelps Dodge Corporation | 2.9 | % | |
Halliburton Company | 2.7 | % | |
Oracle Systems Corporation | 2.7 | % | |
Texas Instruments, Inc. | 2.7 | % | |
Top Ten | 37.2 | % | |
Holdings vary. More complete holdings are available at www.Strong.com.
Percentage Restrictions: The Fund’s prospectus and statement of additional information may describe restrictions on the percentage of a particular type or quality of security in which the Fund may invest (“Percentage Restrictions”). Percentage Restrictions apply at the time the Fund purchases a security. Circumstances subsequent to the purchase of the security, such as a change in: (1) the Fund’s assets (e.g., due to cash inflows and redemptions), (2) the market value of the security, or (3) the pricing, liquidity, or rating of the security, may cause the Fund to exceed or fall short of the Percentage Restriction. If this happens, the Fund’s continued holding of the security will not constitute a violation of the Percentage Restriction.
12
Average Annual Total Returns
As of 12-31-04
Investor Class1 | |||
1-year | 14.16 | % | |
3-year | 2.29 | % | |
Since Fund Inception (4-6-01) | 1.67 | % |
Performance is historical and does not guarantee future results. Investment returns and principal value will fluctuate, and you may have a gain or loss when you sell shares. Current performance may be lower or higher than the quoted performance. Call us or visit www.Strong.com for the most recent month-end performance.
Fee Waivers:
| 1 | From time to time, the Fund’s advisor and/or administrator has waived fees and/or absorbed Fund expenses, which has resulted in higher returns. As of 12-31-04, there are waivers and/or absorptions in effect. |
Top Ten Industries
Percent of Net Assets, as of 12-31-04
Medical — Products | 7.2 | % | |
Electronics — Semiconductor Manufacturing | 7.0 | % | |
Telecommunications — Wireless Equipment | 5.5 | % | |
Internet — Content | 5.3 | % | |
Diversified Operations | 5.2 | % | |
Telecommunications — Services | 4.7 | % | |
Medical — Health Maintenance Organizations | 4.5 | % | |
Computer — Manufacturers | 4.3 | % | |
Computer — Data Storage | 4.0 | % | |
Metal Ores — Miscellaneous | 2.9 | % | |
Top Ten | 50.6 | % | |
Risks: Stock funds should only be considered for long-term goals as values fluctuate in response to the activities of individual companies and general market and economic conditions. Investment strategies that concentrate in particular market segments or fewer securities tend to increase the total risk of an investment (relative to the broader market). This Fund is exposed to growth-style investing risk. Consult the Fund’s prospectus for additional information on these and other risks.
13
In a second consecutive year of positive performance following the long bear market, the Strong Large Cap Growth Fund gained 8.64% during the 12 months ending December 31, 2004. The Fund’s broad-based benchmark, the Standard & Poor’s 500 Index, returned 10.87% during the same time.
Higher growth and interest rates
The U.S. economy continued to grow at a healthy pace in 2004 despite the Federal Reserve Board’s policy of sustained but moderate interest rate hikes and the sharp increase in energy prices during most of the year. Stocks generally responded favorably to strong earnings growth, which drove most shares higher. However, the large-capitalization growth stock segment of the market was the market’s weakest-performing area for the fifth straight year. Large-cap stocks tended to trail small-cap stocks, while growth generally underperformed value.
The Fund performed well by focusing the portfolio’s investments on the “haves” versus the “have-nots” in the economy. In other words, we continued to favor growth companies with high-quality management teams that we believed could gain market share and deliver sustainable revenue and earnings growth. We also sought to avoid companies that appeared destined to become fallen growth stocks. The “haves” we sought could be found in virtually every industry — including retail, new media and Internet, energy, health care, industrials, or financial services — allowing us to build a diversified portfolio.
Stock performance
The Fund’s most successful investments in 2004 had a number of common characteristics: excellent management teams with clear visions of how to achieve growth, a differentiated business model, and sound financial management.
For example, one of the Fund’s top performers was Internet giant Yahoo!. This well-run leading online portal is helping spur the developed world’s growth in Internet usage by inventing and nurturing new services and markets that were faint dreams only a decade ago. Today, Yahoo! is a new “bellwether” in the age of broadband-driven media and e-commerce.
Another big gainer in the portfolio was retailer Target. Target hit the bull’s-eye with investors in 2004 as they shed their languishing Marshall Field’s and Mervyn’s department stores to refocus the company exclusively on its faster-growing namesake stores. Investors, ourselves included, applauded management’s moves to reinvent a company that has existed for over 100 years.

Another area of emphasis producing gains in 2004 was our exposure to energy-related stocks, which benefited from rising oil and natural gas prices. By contrast, an area we de-emphasized, to the Fund’s advantage, was the pharmaceutical sector, which we believed faced a number of headwinds for earnings growth creating difficult challenges for many once-stellar growth companies. However, Pfizer was one of our principal underperformers due to factors such as political rhetoric, generic competition, and safety concerns of a key drug. Although we were able to properly forecast these issues and reduce our position, it remained an underperformer in the portfolio.
What’s changed, what’s not
In 2005, we are beginning a new chapter by joining forces with the venerable company Wells Fargo & Company. Additionally, two of my senior partners, Brandon Nelson and Tom Ognar, officially join me as Portfolio Co-Managers of the Fund on January 1, 2005.
In many respects, these changes represent the status quo from a portfolio-management perspective, as my partners and I have worked side by side for many years. Moreover, the Fund’s investment philosophy and process have not changed. We are very excited about the future and truly appreciate your confidence and patience through the recent changes.
The Fund is expected to reorganize into the Wells Fargo Advantage Large Cap Growth Fund, the successor to the Strong Large Cap Growth Fund, on or about April 11, 2005.
We look forward to continuing to help you meet your long-term investment objectives. Thank you for your investment in the Strong Large Cap Growth Fund.
 |
Bruce C. Olson |
Portfolio Manager |
| * | The Morningstar Style Box™ reflects a fund’s investment strategy. For equity funds, the vertical axis shows the market capitalization of the stocks owned and the horizontal axis shows investment style (value, blend, or growth). |
Mention of specific securities in this report is not indicative of whether the Fund may make additional purchases of, sell all or a portion of, or continue to hold those securities.
14
Fund Highlights
Source: Frank Russell Company via FactSet
15
Strong Large Cap Growth Fund
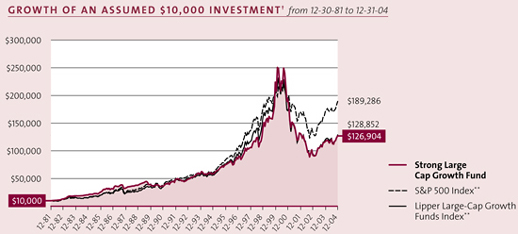
Performance is historical and does not guarantee future results. Investment returns and principal value will fluctuate, and you may have a gain or loss when you sell shares. Current performance may be lower or higher than the quoted performance. Call us or visit www.Strong.com for the most recent month-end performance.
| † | This graph, provided in accordance with SEC regulations, compares a $10,000 investment in the Fund, made at its inception, with the performance of the S&P 500 Index and the Lipper Large-Cap Growth Funds Index. Results include the reinvestment of all dividends and capital gains distributions. The graph and the Average Annual Total Returns table do not reflect the deduction of taxes, if any, that a shareholder would pay on Fund distributions or the redemption of Fund shares |
Definitions:
| ** | The S&P 500 Index consists of 500 stocks chosen for market size, liquidity, and industry group representation. It is a market value weighted index (stock price times number of shares outstanding), with each stock’s weight in the Index proportionate to its market value. The Lipper Large-Cap Growth Funds Index is the average of the 30 largest funds in the Lipper Large-Cap Growth Funds Category. Source of the S&P Index data is Standard & Poor’s Micropal. Source of the Lipper Index data is Lipper |
| It is not possible to invest directly in an index. |
Top Holdings
Percent of Net Assets, as of 12-31-04
Dell, Inc. | 3.1 | % | |
Target Corporation | 3.1 | % | |
The Procter & Gamble Company | 2.8 | % | |
Juniper Networks, Inc. | 2.7 | % | |
eBay, Inc. | 2.5 | % | |
Amgen, Inc. | 2.4 | % | |
General Electric Company | 2.4 | % | |
Johnson & Johnson | 2.3 | % | |
Yahoo! Inc. | 2.2 | % | |
QUALCOMM, Inc. | 2.0 | % | |
Top Ten | 25.5 | % | |
Holdings vary. More complete holdings are available at www.Strong.com.
Percentage Restrictions: The Fund’s prospectus and statement of additional information may describe restrictions on the percentage of a particular type or quality of security in which the Fund may invest (“Percentage Restrictions”). Percentage Restrictions apply at the time the Fund purchases a security. Circumstances subsequent to the purchase of the security, such as a change in: (1) the Fund’s assets (e.g., due to cash inflows and redemptions), (2) the market value of the security, or (3) the pricing, liquidity, or rating of the security, may cause the Fund to exceed or fall short of the Percentage Restriction. If this happens, the Fund’s continued holding of the security will not constitute a violation of the Percentage Restriction.
16
Average Annual Total Returns
As of 12-31-04
Investor Class1 | |||
1-year | 8.64 | % | |
5-year | -10.74 | % | |
10-year | 7.95 | % | |
Since Fund Inception (12-30-81) | 11.68 | % |
Performance is historical and does not guarantee future results. Investment returns and principal value will fluctuate, and you may have a gain or loss when you sell shares. Current performance may be lower or higher than the quoted performance. Call us or visit www.Strong.com for the most recent month-end performance.
Fee Waivers:
| 1 | From time to time, the Fund’s advisor and/or administrator has waived fees and/or absorbed Fund expenses, which has resulted in higher returns. As of 12-31-04, there are waivers and/or absorptions in effect. |
Top Ten Industries
Percent of Net Assets, as of 12-31-04
Medical — Biomedical/Biotechnology | 5.4 | % | |
Medical — Products | 5.4 | % | |
Computer — Local Networks | 4.8 | % | |
Electronics — Semiconductor Manufacturing | 4.1 | % | |
Telecommunications — Wireless Equipment | 4.0 | % | |
Leisure — Gaming/Equipment | 3.8 | % | |
Internet — Content | 3.3 | % | |
Diversified Operations | 3.3 | % | |
Computer — Manufacturers | 3.1 | % | |
Retail — Major Discount Chains | 3.1 | % | |
Top Ten | 40.3 | % | |
Risks: Stock funds should only be considered for long-term goals as values fluctuate in response to the activities of individual companies and general market and economic conditions. Investment strategies that concentrate in particular market segments or fewer securities tend to increase the total risk of an investment (relative to the broader market). This Fund is exposed to growth-style investing risk. Consult the Fund’s prospectus for additional information on these and other risks.
17
Strong U.S. Emerging Growth Fund
After a very strong year for the Fund in 2003, 2004 was more difficult. For the year ended December 31, 2004, the Strong U.S. Emerging Growth Fund returned 6.51%, well behind its broad-based benchmark, the Russell 2000 Index, which returned 18.33% for the same period. The Fund’s underperformance occurred primarily in the year’s first and third quarters. During the second and fourth quarters, the Fund’s performance was more closely in line with the benchmark.
Factors affecting performance
There were two primary factors driving the Fund’s underperformance. First, small- and mid-cap growth stocks dramatically underperformed their respective value counterparts. There was a general contraction of stock valuations that took place in January and February, as weak economic data caused many investors to question the strength of the recovery and thus to lose confidence in stocks’ growth prospects. Then, in the second quarter, the economy began to pick up steam. In response, the Federal Reserve Board signaled that it was ready to raise short-term interest rates to help keep the economy from overheating and to help keep inflation in check. Higher interest rates have traditionally hurt the fastest-growing companies — the type we favored for this portfolio — the most.
The third quarter brought more uncertainty about the sustainability of the U.S. economic recovery. For one thing, the Fed kept upward pressure on interest rates with hikes of one-quarter of a percentage point in August and September following the June increase. Moreover, the price of crude oil continued to push higher, stoking fears that the high cost of energy would siphon disposable cash from other areas of the economy. In response, growth stocks significantly underperformed the broader market during the third quarter. In fact, according to a Merrill Lynch study of growth versus value strategies, during the first three quarters of 2004, the fastest-growing companies had the worst performance.
In the fourth quarter, the broader market turned in a strong rally in which mid- and small-cap growth stocks fully participated. Although the Fund posted a double-digit gain for the quarter, it nevertheless underperformed for the year.
The other reason for the Fund’s underperformance was unfavorable stock selection. One company that provided tremendous returns in 2003, Odyssey HealthCare, unexpectedly lowered its guidance on fourth-quarter earnings, hurting not only its own share price but also those of other companies in the hospice services industry. As one of the Fund’s largest holdings, Odyssey HealthCare negatively effected the performance of the Fund, and we sold the stock.
Positioned for a stronger economy
Throughout 2004, we did not make any substantial changes to the Fund’s overall positioning from 2003. The portfolio remained poised to benefit from an improving business environment and increasing consumer confidence. Although the potential for further interest-rate hikes remains, we believe this trend presents limited risk to the companies in the portfolio. This is because we look for companies with little debt, and we have also significantly underweighted stocks from the financial sector, which could face the most volatility from rising rates. In the short term, it is true that some stocks may fluctuate in value due to interest-rate concerns. In the longer term, however, we believe profit growth ultimately drives stock performance, and that this Fund’s portfolio of high-quality, fast-growing companies should be able to do well in this environment.
Our outlook
The Federal Reserve increased short-term interest rates five times in 2004 and appears ready to keep raising rates in the new year to keep inflation in check. Nevertheless, we think the worst of the resulting volatility is behind us. Normally, small-cap growth stocks appreciate in value after several Federal Reserve rate hikes, and we saw some evidence of this in the fourth quarter. Easing energy prices also represent a potentially positive influence on stock prices. Moreover, we expect to see strong corporate earnings in upcoming quarters. Given that many stocks are still at what we consider reasonable valuations, we believe such earnings improvements could help drive the prices of small- and mid-cap growth stocks higher in 2005.
Effective January 1, 2005, Jerome “Cam” Philpott, CFA, and Stuart Roberts of Wells Capital Management Incorporated became the Portfolio Co-Managers of the Fund. In addition, the Fund is expected to reorganize into the Wells Fargo Advantage Small Cap Fund on or about April 11, 2005.
Thank you for your investment in the Strong U.S. Emerging Growth Fund.
| * | The Morningstar Style Box™ reflects a fund’s investment strategy. For equity funds, the vertical axis shows the market capitalization of the stocks owned and the horizontal axis shows investment style (value, blend, or growth). |
Mention of specific securities in this report is not indicative of whether the Fund may make additional purchases of, sell all or a portion of, or continue to hold those securities.
18
Fund Highlights

Source: Frank Russell Company via FactSet
19
Strong U.S. Emerging Growth Fund
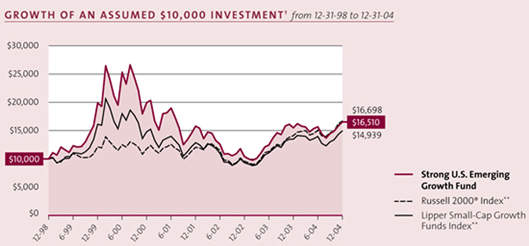
Performance is historical and does not guarantee future results. Investment returns and principal value will fluctuate, and you may have a gain or loss when you sell shares. Current performance may be lower or higher than the quoted performance. Call us or visit www.Strong.com for the most recent month-end performance.
| † | This graph, provided in accordance with SEC regulations, compares a $10,000 investment in the Fund, made at its inception, with the performance of the Russell 2000® Index and the Lipper Small-Cap Growth Funds Index. Results include the reinvestment of all dividends and capital gains distributions. The graph and the Average Annual Total Returns table do not reflect the deduction of taxes, if any, that a shareholder would pay on Fund distributions or the redemption of Fund shares. |
Definitions:
| ** | The Russell 2000® Index measures the performance of the 2,000 smallest companies in the Russell 3000® Index, which represents approximately 8% of the total market capitalization of the Russell 3000® Index. The Lipper Small-Cap Growth Funds Index is the average of the 30 largest funds in the Lipper Small-Cap Growth Funds Category. Source of the Russell Index data is Standard & Poor’s Micropal. Source of the Lipper Index data is Lipper. |
| It is not possible to invest directly in an index. |
Top Holdings
Percent of Net Assets, as of 12-31-04
Investors Financial Services Corporation | 3.3 | % | |
JLG Industries, Inc. | 3.2 | % | |
Trimble Navigation, Ltd. | 3.2 | % | |
Landstar Systems, Inc. | 3.1 | % | |
Shuffle Master, Inc. | 2.9 | % | |
Cognizant Technology Solutions Corporation Class A | 2.8 | % | |
Joy Global, Inc. | 2.8 | % | |
Alamosa Holdings, Inc. | 2.8 | % | |
Getty Images, Inc. | 2.7 | % | |
P.F. Chang’s China Bistro, Inc. | 2.6 | % | |
Top Ten | 29.4 | % | |
Holdings vary. More complete holdings are available at www.Strong.com.
Percentage Restrictions: The Fund’s prospectus and statement of additional information may describe restrictions on the percentage of a particular type or quality of security in which the Fund may invest (“Percentage Restrictions”). Percentage Restrictions apply at the time the Fund purchases a security. Circumstances subsequent to the purchase of the security, such as a change in: (1) the Fund’s assets (e.g., due to cash inflows and redemptions), (2) the market value of the security, or (3) the pricing, liquidity, or rating of the security, may cause the Fund to exceed or fall short of the Percentage Restriction. If this happens, the Fund’s continued holding of the security will not constitute a violation of the Percentage Restriction.
20
Average Annual Total Returns
As of 12-31-04
Investor Class1 | |||
1-year | 6.51 | % | |
5-year | -3.65 | % | |
Since Fund Inception (12-31-98) | 8.72 | % |
Performance is historical and does not guarantee future results. Investment returns and principal value will fluctuate, and you may have a gain or loss when you sell shares. Current performance may be lower or higher than the quoted performance. Call us or visit www.Strong.com for the most recent month-end performance.
Fee Waivers:
| 1 | From time to time, the Fund’s advisor and/or administrator has waived fees and/or absorbed Fund expenses, which has resulted in higher returns. As of 12-31-04, there are waivers and/or absorptions in effect. |
Performance: From time to time, the Fund’s performance was significantly enhanced through investments in initial public offerings (IPOs). In addition, the effect of IPOs purchased when the Fund’s asset base was small may have been magnified. Given these circumstances, you should not expect that such enhanced returns can be consistently achieved. Please consider this before investing.
Top Ten Industries
Percent of Net Assets, as of 12-31-04
Machinery — Construction/Mining | 13.5 | % | |
Transportation — Truck | 6.8 | % | |
Oil & Gas — United States Exploration & Production | 6.5 | % | |
Retail — Restaurants | 5.7 | % | |
Telecommunications — Wireless Services | 5.0 | % | |
Electronics — Semiconductor Manufacturing | 4.9 | % | |
Financial Services — Miscellaneous | 4.5 | % | |
Commercial Services — Market Research | 4.0 | % | |
Medical — Systems/Equipment | 3.9 | % | |
Telecommunications — Wireless Equipment | 3.2 | % | |
Top Ten | 58.0 | % | |
Risks: Stock funds should only be considered for long-term goals as values fluctuate in response to the activities of individual companies and general market and economic conditions. Investment strategies that concentrate in particular market segments or fewer securities tend to increase the total risk of an investment (relative to the broader market). This Fund is exposed to the following specific risks: growth-style investing risk, small-company risk, and medium-company risk. Consult the Fund’s prospectus for additional information on these and other risks.
21
The U.S. stock market delivered a second consecutive year of gains to investors in 2004. The economy grew in fits and starts, making equity returns volatile, with much of the year’s gain being produced in the fourth quarter. For the year ended December 31, 2004, the Strong Enterprise Fund returned 14.55%, compared to its broad-based benchmark, the Russell Midcap Index, which advanced 20.22%. While the Fund delivered strong returns to shareholders, it didn’t keep pace with the benchmark, as the Fund’s growth style underperformed the broader market.
During 2004, mid-cap value stocks outperformed mid-cap growth stocks by a wide margin, continuing a pattern we have seen for four of the last five years. This, of course, worked against our ability to beat the Fund’s broad-based benchmark, the Russell Midcap Index, which includes both growth and value stocks.
The year tested investors, as gains in the equity market were limited for much of the year by uncertainty about the presidential election, uneven job growth, increasing energy prices, rising short-term interest rates, a declining dollar, and continued turmoil in Iraq. Despite these trends, the economy continued to expand, and many companies experienced healthy profit growth that supported rising stock prices. Investor expectations vacillated from optimistic to dubious with each economic statistic that was released. While an improving economy and stock market were evident, investor satisfaction with the level of growth and sustainability was continually debated.
Investigative approach to investing
Throughout the year we faithfully executed on our intensive research process of “surrounding the company” in order to generate competitive returns for Fund shareholders. We attempt to delve deeply into each company through financial statement analysis, conversations with management and, lastly, channel checks of suppliers, customers and competitors. By utilizing this encompassing model, we are often able to identify companies that will produce a great deal of value relative to the required investment. Moreover, the process provides us with comprehensive knowledge regarding each of the Fund’s holdings.
In addition to our research process, our team encourages an environment open to dissent. Within this environment, portfolio managers and analysts constantly challenge each individual investment. Every question presented requires the investment to further justify its position within the Fund. This is a well-established and respected practice of all team members that will continue to assist us in assessing the risk and reward of every investment.
One result of our intensive research was the Fund’s position in St. Joe, which is engaged in town, resort, commercial and industrial development, land sales, and commercial real estate services in Northwest Florida. After meeting with management and touring numerous land developments, we concluded that Northwest Florida could be an untapped real estate market in which tremendous growth opportunities lie ahead. The company had an abundance of land available for development in this area. More importantly, the firm’s strategic focus is to release and develop land in a very disciplined manner aimed at creating maximum value. With its long-term focus on value creation, we viewed St. Joe as a core growth investment within the Fund.
Another company that continued to perform well for the Fund was Harman International Industries. Harman designs, manufactures, and sells high fidelity auto products and electronic systems for the consumer and professional markets. During 2004, Harman enjoyed accelerated growth, as it continued to roll out infotainment systems to more automotive manufacturers and increased the number of installations per manufacturer. Furthermore, the company announced a strategic acquisition whose purpose was to reduce costs and increase Harman’s control over the entire electronic system.
Despite solid fundamental results, the Fund’s holding in Teva Pharmaceuticals underperformed in 2004 due to investors’ concern regarding future competition in both the branded and generic pharmaceutical businesses, which resulted in a negative impact on the Fund’s performance. Based on our analysis, we believed this negative sentiment would prove misguided. We hoped to see confirmation of our positive fundamental outlook for the generic industry, numerous new product launches for Teva, and stable market share trends for Teva’s largest branded product, Copaxone.
Outlook for 2005
As we enter 2005, we believe the key question is not whether the economy will grow, but rather to what degree. We are optimistic that the economy will continue to strengthen, driven by continued acceleration of enterprise capital spending and a resultant growth in earnings.
The market remains constructive, climbing a “wall of worry” reflecting investors’ concerns about the health of the consumer, fading fiscal stimulus, record budget and trade deficits, a falling dollar, and uncertain employment growth. Companies today have record levels of free cash flow but thus far have been reluctant to invest in large-scale projects. Consequently, we have seen a huge build-up in liquidity, with corporate debt levels at fifty-year lows. Historically, rising corporate profits and cash flows have led to accelerating capital investment. For this reason, we believe that most of the capital spending cycle and inventory build-up is yet to come.
In addition, we expect to pay close attention to the levels of job creation, long-term interest rates, and the resulting impact on the U.S. dollar. As always, we will try to continue to carefully select holdings for the Fund with an eye toward owning companies possessing unique and strong fundamentals.
The Fund is expected to reorganize into the Wells Fargo Advantage Enterprise Fund, the successor to the Strong Enterprise Fund, on or about April 11, 2005.
Thank you for your continued investment in the Strong Enterprise Fund. We appreciate the trust you have placed in us.
 |
Thomas J. Pence
|
Portfolio Manager |
| * | The Morningstar Style Box™ reflects a fund’s investment strategy. For equity funds, the vertical axis shows the market capitalization of the stocks owned and the horizontal axis shows investment style (value, blend, or growth). |
Mention of specific securities in this report is not indicative of whether the Fund may make additional purchases of, sell all or a portion of, or continue to hold those securities.
22
Fund Highlights
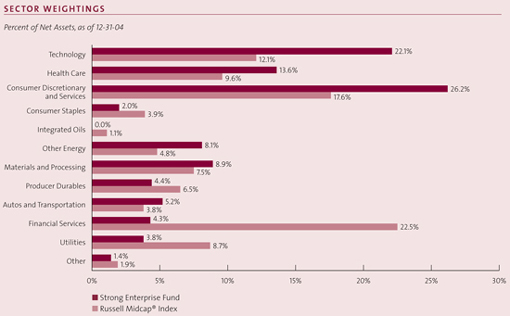
Source: Frank Russell Company via FactSet
Fund Highlights are continued on next page.
23
Strong Enterprise Fund
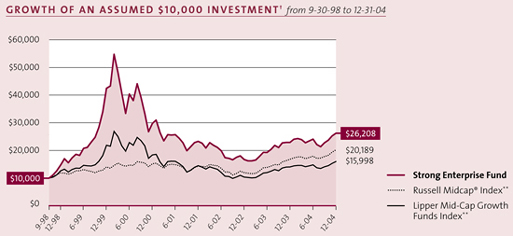
Performance is historical and does not guarantee future results. Investment returns and principal value will fluctuate, and you may have a gain or loss when you sell shares. Current performance may be lower or higher than the quoted performance. Call us or visit www.Strong.com for the most recent month-end performance.
| † | This graph, provided in accordance with SEC regulations, compares a $10,000 investment in the Fund, made at its inception, with the performance of the Russell Midcap® Index and the Lipper Mid-Cap Growth Funds Index. Results include the reinvestment of all dividends and capital gains distributions. The graph and the Average Annual Total Returns table do not reflect the deduction of taxes, if any, that a shareholder would pay on Fund distributions or the redemption of Fund shares. This graph is based on Investor Class shares only; performance for other classes will vary due to differences in fee structures. |
| Definitions: |
| ** | The Russell Midcap® Index measures the performance of the 800 smallest companies in the Russell 1000® Index, which represent approximately 26% of the total market capitalization of the Russell 1000® Index. The Lipper Mid-Cap Growth Funds Index is the average of the 30 largest funds in the Lipper Mid-Cap Growth Funds Category. Source of the Russell Index data is Standard & Poor’s Micropal. Source of the Lipper Index data is Lipper. |
| It is not possible to invest directly in an index. |
Top Holdings
Percent of Net Assets, as of 12-31-04
Marvel Enterprises, Inc. | 2.5 | % | |
Expeditors International of Washington, Inc. | 2.2 | % | |
Lyondell Petrochemical Company | 2.1 | % | |
Abercrombie & Fitch Company Class A | 2.0 | % | |
NII Holdings, Inc. Class B | 2.0 | % | |
Constellation Brands, Inc. Class A | 2.0 | % | |
WellPoint, Inc. | 1.9 | % | |
Transocean, Inc. | 1.9 | % | |
Harman International Industries, Inc. | 1.9 | % | |
Marvell Technology Group, Ltd. | 1.9 | % | |
Top Ten | 20.4 | % | |
Holdings vary. More complete holdings are available at www.Strong.com.
Percentage Restrictions: The Fund’s prospectus and statement of additional information may describe restrictions on the percentage of a particular type or quality of security in which the Fund may invest (“Percentage Restrictions”). Percentage Restrictions apply at the time the Fund purchases a security. Circumstances subsequent to the purchase of the security, such as a change in: (1) the Fund’s assets (e.g., due to cash inflows and redemptions), (2) the market value of the security, or (3) the pricing, liquidity, or rating of the security, may cause the Fund to exceed or fall short of the Percentage Restriction. If this happens, the Fund’s continued holding of the security will not constitute a violation of the Percentage Restriction.
24
Average Annual Total Returns
As of 12-31-04
Investor Class1 | |||
1-year | 14.55 | % | |
5-year | -9.19 | % | |
Since Fund Inception (9-30-98) | 16.66 | % |
Institutional Class1,2 | |||
1-year | 15.68 | % | |
5-year | -8.94 | % | |
Since Fund Inception (9-30-98) | 16.92 | % |
Advisor Class1,3 | |||
1-year | 14.92 | % | |
5-year | -9.13 | % | |
Since Fund Inception (9-30-98) | 16.65 | % |
Class K1,4 | |||
1-year | 15.38 | % | |
5-year | -8.89 | % | |
Since Fund Inception (9-30-98) | 16.97 | % |
Performance is historical and does not guarantee future results. Investment returns and principal value will fluctuate, and you may have a gain or loss when you sell shares. Current performance may be lower or higher than the quoted performance. Call us or visit www.Strong.com for the most recent month-end performance.
Fee Waivers:
| 1 | From time to time, the Fund’s advisor and/or administrator has waived fees and/or absorbed Fund expenses, which has resulted in higher returns. As of 12-31-04, there are waivers and/or absorptions in effect for all share classes |
Performance:
| 2 | The performance of the Institutional Class shares prior to 6-30-03 is based on the Fund’s Investor Class shares’ performance, and has not been restated for the lower expense ratio of the Institutional Class shares. |
| 3 | The performance of the Advisor Class shares prior to 2-24-00 is based on the Fund’s Investor Class shares’ performance, restated for the higher expense ratio of the Advisor Class shares. |
| 4 | The performance of the Class K shares prior to 8-30-02 is based on the Fund’s Investor Class shares’ performance, and has not been restated for the lower expense ratio of the Class K shares. |
| Please consult a prospectus for information about all share classes. |
Top Ten Industries
Percent of Net Assets, as of 12-31-04
Electronics — Semiconductor Manufacturing | 7.5 | % | |
Internet — E*Commerce | 6.9 | % | |
Telecommunications — Wireless Services | 5.1 | % | |
Medical — Biomedical/Biotechnology | 4.1 | % | |
Computer Software — Security | 3.4 | % | |
Oil & Gas — Drilling | 3.3 | % | |
Computer Software — Enterprise | 2.8 | % | |
Auto/Truck — Original Equipment | 2.6 | % | |
Leisure — Toys/Games/Hobby | 2.5 | % | |
Internet — Content | 2.4 | % | |
Top Ten | 40.6 | % | |
Risks: Stock funds should only be considered for long-term goals as values fluctuate in response to the activities of individual companies and general market and economic conditions. Investment strategies that concentrate in particular market segments or fewer securities tend to increase the total risk of an investment (relative to the broader market). This Fund is exposed to the following specific risks: growth-style investing risk, small-company risk, and medium-company risk. Consult the Fund’s prospectus for additional information on these and other risks.
25
Recording its second consecutive year of positive double-digit returns, the Strong Growth 20 Fund had a successful year in 2004, posting a return of 13.27%. This return was well ahead of the broadly-based Standard & Poor’s 500 Index return of 10.87%.
The outperformance of the Fund was driven by outstanding stock selection within the consumer discretionary sector, including names such as eBay, Yahoo!, Harman International, Starbucks, and Coach. Internet-related stocks were particularly positive contributors to performance throughout the year, as investors continued to gravitate to this extremely fast-growing segment of the economy. Energy was another area of strength for the Fund, led by outstanding performance from Ultra Petroleum, a fast-growing exploration and production company. Other standout contributors were Puerto Rican bank Doral Financial, and semiconductor leader Marvell Technology. Some areas of weakness during the year included communications, computer technology, homebuilding, education, and generic drug stocks.
Capitalizing on strong, sustainable growth
As we have noted in the past, we believe earnings and revenue growth are critical factors in determining stock price movements. Thus, our research process is centered around finding companies with the prospects for robust and sustainable growth in earnings and revenue. To find that growth, we use thorough, hands-on research, emphasizing companies whose management teams have a history of successfully executing their strategy and whose business model has sufficient profit potential. We then marry our company-specific analysis with our analysis of macroeconomic, secular, and technical trends to form our decision about whether the Fund should invest in a particular stock.
For example, several months ago, we purchased shares of Ultra Petroleum because we believed it had tremendous profitability potential — extremely high production growth combined with the industry’s lowest cost structure. Our conclusion was that Ultra Petroleum’s high production growth rate was likely to continue for several more years, driven by the strength of its drilling prospects and management’s solid track record. Finally, an investment in Ultra Petroleum made sense given the team’s positive overall outlook for crude oil and natural gas prices. Ultra Petroleum was up 95% in 2004 and was the largest holding in the Fund as of December 31, 2004.
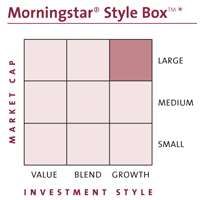
The importance of effective sell criteria
Deciding when to sell a stock is just as important as deciding when to buy. Our criteria for selling are essentially the opposite of our buying criteria. We may sell a stock when a deterioration in its fundamental qualities causes us to become suspicious about the company’s continued growth or profitability potential. Examples of events that can cause this suspicion are questionable earnings reports, new competitive threats, changes in the economy, or changes in management personnel.
In July of 2004, following its latest quarterly earnings report, we began selling shares of eResearch Technology, which provides software and consulting services to help companies streamline the Food and Drug Administration approval process. For the first time in several quarters, eResearch failed to post a positive earnings surprise relative to analysts’ estimates. Also, the growth in backlog of orders, a lead indicator of future growth, showed dramatic deceleration. Our inclination to get more cautious proved accurate. In the following weeks and months, eResearch management guided earnings estimates lower for the remainder of 2004 and for 2005. After falling as low as $10.70 per share in October, the stock finished the year at $15.85, down sharply from our initial sales in the mid $20s.
Outlook for 2005
As we begin 2005, our outlook for the next several months remains positive, as we expect the economy to benefit from continued low interest rates and inflation. This environment should allow for solid growth in corporate profits, which tends to be beneficial for stock prices. We plan to continue to seek out the fastest-growing companies we can identify that we believe fit within the framework of our investment process.
On a separate note, in April 2005, the Strong Growth 20 Fund is scheduled to be reorganized into the Wells Fargo Advantage Growth Fund (the successor to the Strong Growth Fund), a Fund co-managed by me and two of my senior partners, Bruce Olson and Tom Ognar. Bruce, Tom, and I are very experienced portfolio managers who have worked closely together on the same team for the past several years. We consider it a privilege to manage other people’s investments and look forward to the opportunity to continue managing yours.
Thank you for your investment in the Strong Growth 20 Fund.

Brandon M. Nelson
Portfolio Manager
| * | The Morningstar Style Box™ reflects a fund’s investment strategy. For equity funds, the vertical axis shows the market capitalization of the stocks owned and the horizontal axis shows investment style (value, blend, or growth). |
Mention of specific securities in this report is not indicative of whether the Fund may make additional purchases of, sell all or a portion of, or continue to hold those securities.
26
Fund Highlights
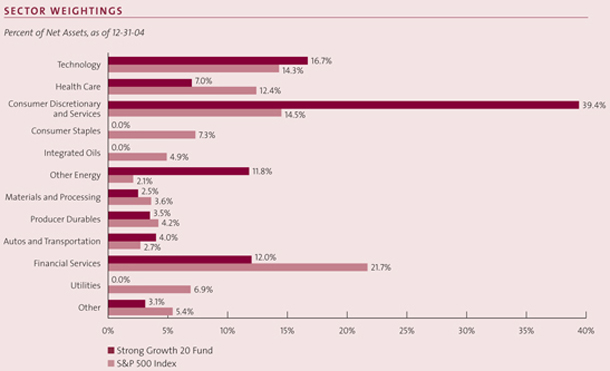
Source: Frank Russell Company via FactSet
Fund Highlights are continued on next page.
27
Strong Growth 20 Fund
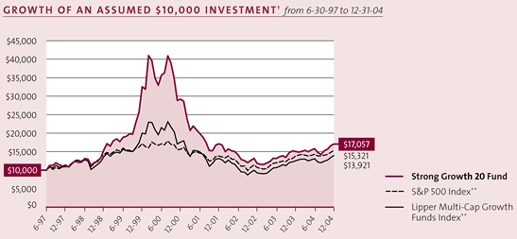
Performance is historical and does not guarantee future results. Investment returns and principal value will fluctuate, and you may have a gain or loss when you sell shares. Current performance may be lower or higher than the quoted performance. Call us or visit www.Strong.com for the most recent month-end performance.
| † | This graph, provided in accordance with SEC regulations, compares a $10,000 investment in the Fund, made at its inception, with the performance of the S&P 500 Index and the Lipper Multi-Cap Growth Funds Index. Results include the reinvestment of all dividends and capital gains distributions. The graph and the Average Annual Total Returns table do not reflect the deduction of taxes, if any, that a shareholder would pay on Fund distributions or the redemption of Fund shares. This graph is based on Investor Class shares only; performance for other classes will vary, due to differences in fee structures. |
Definitions:
| ** | The S&P 500 Index consists of 500 stocks chosen for market size, liquidity, and industry group representation. It is a market value weighted index (stock price times number of shares outstanding), with each stock’s weight in the Index proportionate to its market value. The Lipper Multi-Cap Growth Funds Index is the average of the 30 largest funds in the Lipper Multi-Cap Growth Funds Category. Source of the S&P Index data is Standard & Poor’s Micropal. Source of the Lipper Index data is Lipper. |
| It is not possible to invest directly in an index. |
Top Holdings
Percent of Net Assets, as of 12-31-04
Ultra Petroleum Corporation | 8.1 | % | |
Doral Financial Corporation | 7.6 | % | |
Marvell Technology Group, Ltd. | 6.2 | % | |
Yahoo! Inc. | 6.1 | % | |
Aetna, Inc. | 5.9 | % | |
eBay, Inc. | 5.8 | % | |
Coach, Inc. | 4.7 | % | |
Station Casinos, Inc. | 4.6 | % | |
FedEx Corporation | 4.0 | % | |
Google, Inc. Class A | 3.9 | % | |
Top Ten | 56.9 | % | |
Holdings vary. More complete holdings are available at www.Strong.com.
Percentage Restrictions: The Fund’s prospectus and statement of additional information may describe restrictions on the percentage of a particular type or quality of security in which the Fund may invest (“Percentage Restrictions”). Percentage Restrictions apply at the time the Fund purchases a security. Circumstances subsequent to the purchase of the security, such as a change in: (1) the Fund’s assets (e.g., due to cash inflows and redemptions), (2) the market value of the security, or (3) the pricing, liquidity, or rating of the security, may cause the Fund to exceed or fall short of the Percentage Restriction. If this happens, the Fund’s continued holding of the security will not constitute a violation of the Percentage Restriction.
28
Average Annual Total Returns
As of 12-31-04
Investor Class1 | |||
1-year | 13.27 | % | |
5-year | -12.13 | % | |
Since Fund Inception (6-30-97) | 7.38 | % |
Advisor Class1, 2 | |||
1-year | 13.55 | % | |
5-year | -12.05 | % | |
Since Fund Inception (6-30-97) | 7.35 | % |
Performance is historical and does not guarantee future results. Investment returns and principal value will fluctuate, and you may have a gain or loss when you sell shares. Current performance may be lower or higher than the quoted performance. Call us or visit www.Strong.com for the most recent month-end performance.
Fee Waivers:
| 1 | From time to time, the Fund’s advisor and/or administrator has waived fees and/or absorbed Fund expenses, which has resulted in higher returns. As of 12-31-04, there are waivers and/or absorptions in effect for all share classes. |
Performance:
| 2 | The performance of the Advisor Class shares prior to 2-24-00 is based on the Fund’s Investor Class shares’ performance, restated or the higher expense ratio of the Advisor Class shares. |
| Please consult a prospectus for information about all share classes. |
| From time to time, the Fund’s performance was significantly enhanced through investments in initial public offerings (IPOs). In addition, the effect of IPOs purchased when the Fund’s asset base was small may have been magnified. Given these circumstances, you should not expect that such enhanced returns can be consistently achieved. Please consider this before investing. |
Top Ten Industries
Percent of Net Assets, as of 12-31-04
Internet — Content | 12.2 | % | |
Oil & Gas — United States Exploration & Production | 9.5 | % | |
Finance — Mortgage & Related Services | 7.6 | % | |
Electronics — Semiconductor Manufacturing | 6.2 | % | |
Medical — Health Maintenance Organizations | 5.9 | % | |
Internet — E*Commerce | 5.8 | % | |
Apparel — Clothing Manufacturing | 4.7 | % | |
Leisure — Gaming/Equipment | 4.6 | % | |
Financial Services — Miscellaneous | 4.4 | % | |
Transportation — Air Freight | 4.0 | % | |
Top Ten | 64.9 | % | |
Risks: Stock funds should only be considered for long-term goals as values fluctuate in response to the activities of individual companies and general market and economic conditions. Investment strategies that concentrate in particular market segments or fewer securities tend to increase the total risk of an investment (relative to the broader market). This Fund is exposed to the following specific risks: growth-style investing risk, nondiversified-portfolio risk, and medium-company risk. Consult the Fund’s prospectus for additional information on these and other risks.
29
The Strong Growth Fund delivered a solid return of 12.57% for the year ended December 31, 2004. This bested the Standard & Poor’s 500 Index, the Fund’s broad-based benchmark, which returned 10.87%.
Four broad trends dominated 2004. First, the economy experienced continued robust corporate earnings growth. In this environment, the Fund benefited from a pro-cyclical growth positioning. Second, long-term interest rates surprised most market prognosticators by finishing the year lower than where they started. Third, political uncertainty was alleviated by the clean George W. Bush victory, unmarred by any terrorist events or procedural troubles. This, we believe, gave the market the spark of confidence needed to ignite the subsequent fourth quarter rally. The fourth trend in evidence during 2004 was another year of dominance by value stocks over growth stocks. Nevertheless, the Fund performed well in this environment, which we believe was a result of our emphasis on selecting securities that exemplified the theme of dominant business models generating dynamic market share growth.
Searching for “share-gainers”
Our investment process emphasized security selection as the main determinant of our portfolio construction. We used a dynamic process of fundamental research and quantitative screens, overlaying this data with secular growth themes we identified and developed during this process. We focused our research on what we call “share-gainers”— that is, those companies that have developed business models that allow them not only to grow faster than the underlying economy, but also to do so in a sustainable fashion. We did extensive research on the rate, the consistency, and the sustainability of both revenue and earnings growth. We also gravitated to industry leaders; as such companies often have sustainable advantages over their competition. Finally, we emphasized companies whose management teams have a history of successfully executing their strategy, as strategy without execution is worthless.
The Fund’s sector allocation tended to be guided by our fundamentally driven security selection process. However, we did monitor sector allocation closely as part of our risk-management strategy. We were aware of the risk of having too many eggs in one basket. Another key to our process is our sell discipline. If we begin to suspect that a security’s underlying fundamentals are not performing in line with or better than our expectations, we do not hesitate to trim or sell the position. Strong growth stocks often receive premium valuations, but that premium can collapse if the market suddenly becomes skeptical about the company’s future prospects.
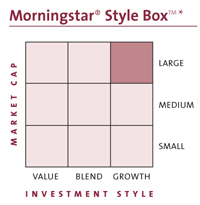
Google outperforms
Internet search engine provider Google was an addition to the Fund that exemplified our process. We recognized that Google was not only benefiting from increased usage of the Internet, but also from the movement of advertisers’ dollars away from traditional media to the Internet. Our research found that Google provides consumers and advertisers with a mutually rewarding experience. Moreover, the returns its business model generated were some of the best we found in any sector of the economy. Google exemplified what we look for: a market share gainer in a fast growing industry with an impressive return on capital business model.
Digene was an example of a stock we owned that didn’t work to our expectations. Its HPV/HCV test was the only diagnostic test available for diagnosing HPV (human papillomavirus) infection, which is the primary cause of cervical cancer. Our expectations for growth in revenues and earnings were met with disappointment, as the rollout of HPV/HCV test was slower and more costly than we anticipated. We decided to sell our position as we foresaw that it would take time to reevaluate whether there were structural or just timing problems with the doctors’ acceptance of this test.
Outlook for 2005
In the latter half of the year, the yield curve flattened considerably, as the Fed kept raising short-term interest rates, while long-term rates stayed about where they were. To us, this signaled the bond market’s perception that economic growth might slow in the coming months.
If the economy does decelerate, it would make finding rapidly growing companies more of a challenge. Nevertheless, we believe that our focus on share-gainers can help us find good growth opportunities in a wide variety of economic environments.
On a separate note, we added Brandon Nelson and Bruce Olson as portfolio managers on the Fund on January 1, 2005. Both have years of experience as portfolio managers on the team that has supported the management of the Fund. They have been key contributors to our research and portfolio management process.
The Fund is expected to reorganize into the Wells Fargo Advantage Growth Fund, the successor to the Strong Growth Fund, on or about April 11, 2005.
Thank you for your continued investment in the Growth Fund.
Thomas C. Ognar
Portfolio Manager
| * | The Morningstar Style Box™ reflects a fund’s investment strategy. For equity funds, the vertical axis shows the market capitalization of the stocks owned and the horizontal axis shows investment style (value, blend, or growth). |
Mention of specific securities in this report is not indicative of whether the Fund may make additional purchases of, sell all or a portion of, or continue to hold those securities.
30
Fund Highlights
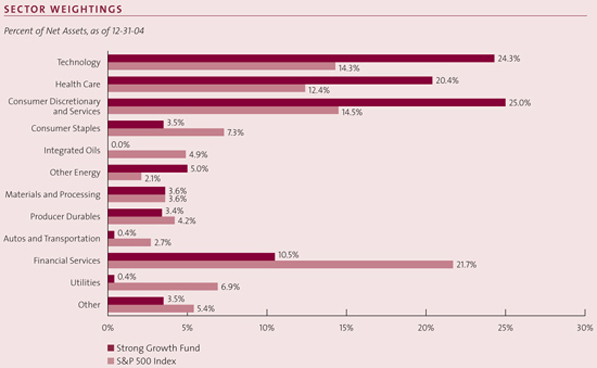
Source: Frank Russell Company via FactSet
Fund Highlights are continued on next page.
31
Strong Growth Fund
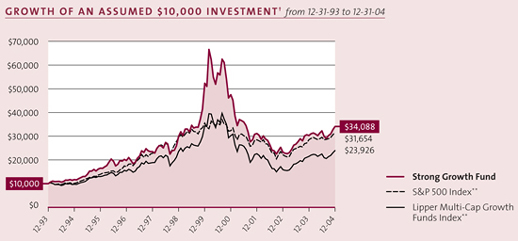
Performance is historical and does not guarantee future results. Investment returns and principal value will fluctuate, and you may have a gain or loss when you sell shares. Current performance may be lower or higher than the quoted performance. Call us or visit www.Strong.com for the most recent month-end performance.
| † | This graph, provided in accordance with SEC regulations, compares a $10,000 investment in the Fund, made at its inception, with the performance of the S&P 500 Index and the Lipper Multi-Cap Growth Funds Index. Results include the reinvestment of all dividends and capital gains distributions. The graph and the Average Annual Total Returns table do not reflect the deduction of taxes, if any, that a shareholder would pay on Fund distributions or the redemption of Fund shares. This graph is based on Investor Class shares only; performance for other classes will vary due to differences in fee structures. |
Definitions:
| ** | The S&P 500 Index consists of 500 stocks chosen for market size, liquidity, and industry group representation. It is a market value weighted index (stock price times number of shares outstanding), with each stock’s weight in the Index proportionate to its market value. The Lipper Multi-Cap Growth Funds Index is the average of the 30 largest funds in the Lipper Multi-Cap Growth Funds Category. Source of the S&P Index data is Standard & Poor’s Micropal. Source of the Lipper Index data is Lipper. |
It is not possible to invest directly in an index.
Top Holdings
Percent of Net Assets, as of 12-31-04
Dell, Inc. | 3.0 | % | |
eBay, Inc. | 3.0 | % | |
PETCO Animal Supplies, Inc. | 2.8 | % | |
Cognizant Technology Solutions Corporation Class A | 2.4 | % | |
First Marblehead Corporation | 2.3 | % | |
Hughes Supply, Inc. | 2.3 | % | |
Kinetic Concepts, Inc. | 2.3 | % | |
Yahoo! Inc. | 2.1 | % | |
PETsMART, Inc. | 2.0 | % | |
Polycom, Inc. | 2.0 | % | |
Top Ten | 24.2 | % | |
Holdings vary. More complete holdings are available at www.Strong.com.
Percentage Restrictions: The Fund’s prospectus and statement of additional information may describe restrictions on the percentage of a particular type or quality of security in which the Fund may invest (“Percentage Restrictions”). Percentage Restrictions apply at the time the Fund purchases a security. Circumstances subsequent to the purchase of the security, such as a change in: (1) the Fund’s assets (e.g., due to cash inflows and redemptions), (2) the market value of the security, or (3) the pricing, liquidity, or rating of the security, may cause the Fund to exceed or fall short of the Percentage Restriction. If this happens, the Fund’s continued holding of the security will not constitute a violation of the Percentage Restriction.
32
Average Annual Total Returns
As of 12-31-04
Investor Class1 | |||
1-year | 12.57 | % | |
5-year | -8.21 | % | |
10-year | 11.26 | % | |
Since Fund Inception (12-31-93) | 11.79 | % | |
Institutional Class1,2 | |||
1-year | 13.26 | % | |
5-year | -7.62 | % | |
10-year | 11.62 | % | |
Since Fund Inception (12-31-93) | 12.12 | % | |
Advisor Class1,3 | |||
1-year | 12.46 | % | |
5-year | -8.33 | % | |
10-year | 11.02 | % | |
Since Fund Inception (12-31-93) | 11.54 | % | |
Class C1,4 | |||
1-year | 10.57 | % | |
5-year | -9.13 | % | |
10-year | 10.04 | % | |
Since Fund Inception (12-31-93) | 10.55 | % | |
Class K1,5 | |||
1-year | 13.23 | % | |
5-year | -7.89 | % | |
10-year | 11.45 | % | |
Since Fund Inception (12-31-93) | 11.97 | % | |
Performance is historical and does not guarantee future results. Investment returns and principal value will fluctuate, and you may have a gain or loss when you sell shares. Current performance may be lower or higher than the quoted performance. Call us or visit www.Strong.com for the most recent month-end performance.
Fee Waivers:
| 1 | From time to time, the Fund’s advisor and/or administrator has waived fees and/or absorbed Fund expenses, which has resulted in higher returns. As of 12-31-04, there are waivers and/or absorptions in effect for all share classes. |
Performance:
| 2 | The performance of the Institutional Class shares prior to 2-24-00 is based on the Fund’s Investor Class shares’ performance, and has not been restated for the lower expense ratio of the Institutional Class shares. |
| 3 | The performance of the Advisor Class shares prior to 2-24-00 is based on the Fund’s Investor Class shares’ performance, restated for the higher expense ratio of the Advisor Class shares. |
| 4 | The performance of Class C shares prior to 12-26-02 is based on the Fund’s Investor Class shares’ performance, restated for the higher expense ratio of the Class C shares. Average annual total returns include a 1.00% contingent deferred sales charge imposed on redemptions made within 12 months of purchase. |
| 5 | The performance of the Class K shares prior to 8-30-02 is based on the Fund’s Investor Class shares’ performance and has not been restated for the lower expense ratio of the Class K shares. |
Please consult a prospectus for information about all share classes.
Top Ten Industries
Percent of Net Assets, as of 12-31-04
Retail — Miscellaneous | 5.5 | % | |
Financial Services — Miscellaneous | 5.3 | % | |
Electronics — Semiconductor Manufacturing | 4.6 | % | |
Computer — Local Networks | 4.6 | % | |
Medical — Products | 4.4 | % | |
Internet — Content | 3.9 | % | |
Medical — Biomedical/Biotechnology | 3.7 | % | |
Internet — E*Commerce | 3.4 | % | |
Computer — Manufacturers | 3.0 | % | |
Retail/Wholesale — Building Products | 3.0 | % | |
Top Ten | 41.4 | % | |
Risks: Stock funds should only be considered for long-term goals as values fluctuate in response to the activities of individual companies and general market and economic conditions. Investment strategies that concentrate in particular market segments or fewer securities tend to increase the total risk of an investment (relative to the broader market). This Fund is exposed to the following specific risks: growth-style investing risk and medium-company risk. Consult the Fund’s prospectus for additional information on these and other risks.
33
Strong Large Company Growth Fund
The U.S. stock market delivered a second consecutive year of gains to investors in 2004. The economy grew in fits and starts, making equity returns volatile, with much of the year’s gain being produced in the fourth quarter. For the year ended December 31, 2004, the Strong Large Company Growth Fund rose by 17.51%, compared to its broad-based benchmark, the Standard & Poor’s 500 Index, which advanced 10.87%. The Fund dramatically outperformed its benchmark, as it focused on companies with the strongest fundamentals and avoided many of the period’s highly publicized disappointments.
Investors’ patience was tested, as gains in the equity market were limited for much of the year by uncertainty about the presidential election, uneven job growth, increasing energy prices, rising short-term interest rates, a declining dollar, and continued turmoil in Iraq. Despite these trends, the economy continued to expand, and many companies experienced healthy profit growth that supported higher stock prices.
Investigative approach to investing
Throughout the year we faithfully executed on our intensive research process of “surrounding the company” in order to generate competitive returns for shareholders. We attempt to delve deeply into each company through financial statement analysis, conversations with management and channel checks of suppliers, customers, and competitors. By utilizing this encompassing model, we are often able to identify companies with the potential to produce a great deal of value relative to the required investment. Moreover, the process provides us with comprehensive knowledge regarding each of the Fund’s holdings.
Equally important is the fact that our team encourages an environment open to dissent. Within this environment, portfolio managers and analysts constantly challenge each individual investment. Every question presented requires the investment to further justify its position within the Fund. This is a well-established and respected practice of all team members that we expect to continue to utilize in assessing the risk and reward of every investment.
Holdings that outperformed
Due to the concerns about oil supply relative to growing demand, many companies that produce energy or make equipment to recover energy performed well. One of these was Transocean, a top performer in the offshore contract drilling industry focusing on deep-water drilling for oil and gas wells. In 2004 capacity was tight in this market, resulting in increased day rates. Specifically, the firm recently signed a contract for a fifth-generation unit, named “Deep Seas,” for $240,000 per day compared to spot rates of $130,000 per day in 2003. Furthermore, we thought the recent increase in drilling activity both in the North Sea and Gulf of Mexico boded well for the company.
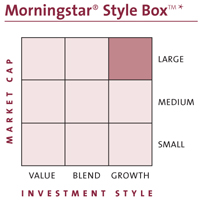
Another top performer for the year was Sprint. In 2004 the diversified telecommunications company, aided particularly by strength in its wireless business, reduced debt levels, streamlined operations, and worked to create packaged bundles of communications services for customers.
What’s more, in December Sprint announced a merger with Nextel Communications. In our opinion, the merger created a favorable position for Sprint by reducing the number of competitors in the industry. Moreover, the business union looked to be a very complementary one. If approved by the regulatory agencies, the merger would not only allow Sprint to tap into Nextel’s vast base of corporate customers, but also to gain access to the proprietary Direct Connect functionality of Nextel’s phones. Lastly, Sprint announced plans, in regards to the merger, to potentially sell its wireline business in an effort to streamline operations.
Despite solid fundamental results, the Fund’s holding in Teva Pharmaceuticals underperformed in 2004 due to investors’ concern regarding future competition in both the branded and generic pharmaceutical businesses, which resulted in a negative impact on the Fund’s performance. Based on our analysis, we believed this negative sentiment would prove misguided. We hoped to see confirmation of our positive fundamental outlook for the generic industry, numerous new product launches for Teva, and stable market share trends for Teva’s largest branded product, Copaxone.
Outlook for 2005
As we enter 2005, we are optimistic that the economy will continue to strengthen, driven by continued acceleration of enterprise capital spending and a resultant growth in earnings. The market remains constructive, climbing a “wall of worry” reflecting concerns about the health of the consumer, fading fiscal stimulus, record budget and trade deficits, a falling dollar, and uncertain employment growth.
Companies today have record levels of free cash flow but thus far have been reluctant to invest in large-scale projects. Consequently, we have seen a huge build-up in liquidity, with corporate debt levels at fifty-year lows. Historically, rising corporate profits and cash flows have led to accelerating capital investment. For this reason, we believe that most of the capital spending cycle and inventory build-up is yet to come.
In addition, we expect to pay close attention to the levels of job creation, long-term interest rates and the resulting impact on the U.S. dollar. As always, we will try to continue to carefully select holdings for the Fund, emphasizing companies possessing unique and strong fundamentals.
The Fund is expected to reorganize into the Wells Fargo Advantage Capital Growth Fund, the successor to the Strong Large Company Growth Fund, on or about April 11, 2005.
Thank you for your continued investment in the Strong Large Company Growth Fund. We appreciate the trust you have placed in us.

Thomas J. Pence
Portfolio Manager
| * | The Morningstar Style Box™ reflects a fund’s investment strategy. For equity funds, the vertical axis shows the market capitalization of the stocks owned and the horizontal axis shows investment style (value, blend, or growth). |
Mention of specific securities in this report is not indicative of whether the Fund may make additional purchases of, sell all or a portion of, or continue to hold those securities.
34
Fund Highlights
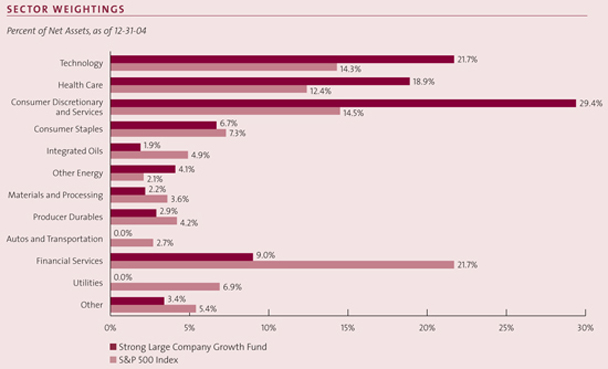
Source: Frank Russell Company via FactSet
Fund Highlights are continued on next page.
35
Strong Large Company Growth Fund
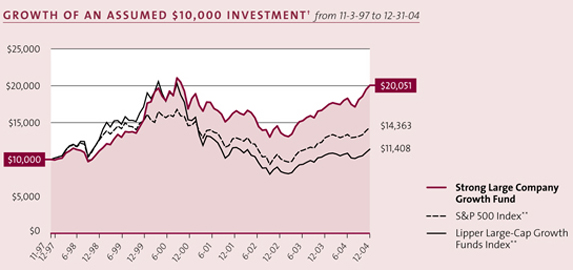
Performance is historical and does not guarantee future results. Investment returns and principal value will fluctuate, and you may have a gain or loss when you sell shares. Current performance may be lower or higher than the quoted performance. Call us or visit www.Strong.com for the most recent month-end performance.
| † | This graph, provided in accordance with SEC regulations, compares a $10,000 investment in the Fund, made at its inception, with the performance of the S&P 500 Index and the Lipper Large-Cap Growth Funds Index. Results include the reinvestment of all dividends and capital gains distributions. The graph and the Average Annual Total Returns table do not reflect the deduction of taxes, if any, that a shareholder would pay on Fund distributions or the redemption of Fund shares. This graph is based on the Investor Class shares only; performance for other classes will vary, due to differences in fee structures. To equalize time periods, the indices’ performances were prorated for the month of November 1997. |
Definitions:
| ** | The S&P 500 Index consists of 500 stocks chosen for market size, liquidity, and industry group representation. It is a market value weighted index (stock price times number of shares outstanding), with each stock’s weight in the Index proportionate to its market value. The Lipper Large-Cap Growth Funds Index is the average of the 30 largest funds in the Lipper Large-Cap Growth Funds Category. Source of the S&P 500 Index data is Standard & Poor’s Micropal. Source of the Lipper Index data is Lipper. |
It is not possible to invest directly in an index.
Top Holdings
Percent of Net Assets, as of 12-31-04
Yahoo! Inc. | 4.9 | % | |
Sprint Corporation | 4.5 | % | |
WellPoint, Inc. | 4.0 | % | |
EMC Corporation | 3.8 | % | |
General Electric Company | 3.6 | % | |
Dell, Inc. | 3.4 | % | |
Phelps Dodge Corporation | 2.7 | % | |
Oracle Systems Corporation | 2.6 | % | |
Texas Instruments, Inc. | 2.6 | % | |
Genzyme Corporation | 2.5 | % | |
Top Ten | 34.6 | % | |
Holdings vary. More complete holdings are available at www.Strong.com.
Percentage Restrictions: The Fund’s prospectus and statement of additional information may describe restrictions on the percentage of a particular type or quality of security in which the Fund may invest (“Percentage Restrictions”). Percentage Restrictions apply at the time the Fund purchases a security. Circumstances subsequent to the purchase of the security, such as a change in: (1) the Fund’s assets (e.g., due to cash inflows and redemptions), (2) the market value of the security, or (3) the pricing, liquidity, or rating of the security, may cause the Fund to exceed or fall short of the Percentage Restriction. If this happens, the Fund’s continued holding of the security will not constitute a violation of the Percentage Restriction.
36
Average Annual Total Returns
As of 12-31-04
Investor Class1,2 | |||
1-year | 17.51 | % | |
5-year | 2.58 | % | |
Since Fund Inception (11-3-97) | 10.21 | % | |
Class K1,3 | |||
1-year | 18.06 | % | |
5-year | 2.73 | % | |
Since Fund Inception (11-3-97) | 10.32 | % | |
Performance is historical and does not guarantee future results. Investment returns and principal value will fluctuate, and you may have a gain or loss when you sell shares. Current performance may be lower or higher than the quoted performance. Call us or visit www.Strong.com for the most recent month-end performance.
Fee Waivers:
| 1 | From time to time, the Fund’s advisor and/or administrator has waived fees and/or absorbed Fund expenses, which has resulted in higher returns. As of 12-31-04, there are waivers and/or absorptions in effect for both share classes. |
We have contractually agreed to waive fees and/or absorb expenses for an indefinite period of time to keep Total Annual Operating Expenses of the Large Company Growth Fund at no more than 1.50% for the Investor Class shares and 0.99% for the Class K shares. This contract may only be terminated by the Board of Directors of the Fund, but not before May 1, 2005.
Performance:
| 2 | The performance of the Investor Class prior to 9-16-02 is based on the performance of the Rockhaven Premier Dividend Fund (the predecessor Fund), and does not reflect the Fund’s maximum sales charge of 5.75%, which was charged from 9-17-99 through 9-13-02. The Fund’s Investor Class has a redemption fee of 1.00% against shares that are held 360 calendar days or fewer after purchase. Performance data does not reflect the deduction of this fee, which, if reflected, would reduce performance. |
| 3 | The performance of the Class K shares prior to 6-30-03 is based on the performance of the Fund’s Investor Class or the Fund’s predecessor, the Rockhaven Premier Dividend Fund. The prior performance has not been restated for the lower expense ratio of the Class K shares and does not reflect the Fund’s maximum sales charge of 5.75% (charged from 9-17-99 through 9-13-02) or the Investor Class redemption fee. |
The predecessor Fund’s investment strategy emphasized investments in convertible securities.
Please consult a prospectus for information about all share classes.
Top Ten Industries
Percent of Net Assets, as of 12-31-04
Medical — Products | 6.8 | % | |
Electronics — Semiconductor Manufacturing | 6.6 | % | |
Telecommunications — Wireless Equipment | 5.2 | % | |
Diversified Operations | 5.0 | % | |
Internet— Content | 4.9 | % | |
Telecommunications — Services | 4.5 | % | |
Medical — Health Maintenance Organizations | 4.0 | % | |
Computer — Manufacturers | 3.9 | % | |
Computer — Data Storage | 3.8 | % | |
Metal Ores — Miscellaneous | 2.7 | % | |
Top Ten | 47.4 | % | |
Risks: Stock funds should only be considered for long-term goals as values fluctuate in response to the activities of individual companies and general market and economic conditions. Investment strategies that concentrate in particular market segments or fewer securities tend to increase the total risk of an investment (relative to the broader market). This Fund is exposed to growth-style investing risk. Consult the Fund’s prospectus for additional information on these and other risks.
37
| YOUR FUND’S EXPENSES | December 31, 2004 |
About Your Fund’s Expenses
Example
As a shareholder of a mutual fund, you may incur two types of costs: (1) transaction costs, including sales charges (loads) on purchase payments, or other distributions; redemption fees; and exchange fees; and (2) ongoing costs, including management fees; distribution and/or service (12b-1) fees; and other fund expenses.
This Example is intended to help you understand your ongoing costs (in dollars) of investing in the Fund and to compare these costs with the ongoing costs of investing in other mutual funds. The Example is based on a hypothetical investment of $1,000 invested at the beginning of the period and held for the entire period, July 1, 2004 through December 31, 2004.
Actual Expenses
The columns under the heading entitled “Actual” help you to estimate the actual expenses you paid over the period. The “Actual — Ending Account Value” shown is derived from the Fund’s actual return, and the “Actual — Expenses Paid During Period” shows the dollar amount that would have been paid by an investor who started with $1,000 in the Fund. To estimate the expenses you paid on your account during this period, simply divide your account value by $1,000 (for example, an $8,600 account value divided by $1,000 = 8.60), then multiply the result by the number in the column under the heading entitled “Actual — Expenses Paid During Period”.
Hypothetical Example for Comparison Purposes
The columns under the heading entitled “Hypothetical” provide information about hypothetical account values and hypothetical expenses based on the Fund’s actual expense ratio and an assumed rate of return of 5% per year before expenses, which is not the Fund’s actual return. The hypothetical account values and expenses may not be used to estimate the actual ending account balance or expenses you paid for the period. You may use this information to compare the ongoing costs of investing in the Fund and other funds. To do so, compare this 5% hypothetical example with the 5% hypothetical examples that appear in the shareholder reports of the other funds.
Please note that the expenses shown in the table are meant to highlight your ongoing costs only and do not reflect any transactional costs, such as sales charges (loads), redemption fees, or exchange fees. Therefore, the last column of the table (Hypothetical — Expenses Paid During Period) is useful in comparing ongoing costs only, and will not help you determine the relative total costs of owning different funds. In addition, if these transactional costs were included, your costs could have been higher.
38
Actual Returns vs. Hypothetical Returns
Six Months Ended December 31, 2004
Class | Fund’s | Beginning 7-01-04 | Actual | Hypothetical (5% return before expenses) | ||||||||||||||||
Ending 12-31-04 | Expenses Paid During Period3 | Ending Account Value 12-31-04 | Expenses Paid During Period3 | |||||||||||||||||
Strong Blue Chip Fund | Investor | 1.51 | % | $ | 1,000.00 | $ | 1,083.90 | $ | 7.91 | $ | 1,017.55 | $ | 7.66 | |||||||
Strong Discovery Fund | Investor | 1.40 | % | $ | 1,000.00 | $ | 1,096.80 | $ | 7.38 | $ | 1,018.10 | $ | 7.10 | |||||||
Strong Endeavor Fund | Investor | 1.94 | % | $ | 1,000.00 | $ | 1,090.20 | $ | 10.19 | $ | 1,015.38 | $ | 9.83 | |||||||
Strong Large Cap Growth Fund | Investor | 1.20 | % | $ | 1,000.00 | $ | 1,051.30 | $ | 6.19 | $ | 1,019.10 | $ | 6.09 | |||||||
Strong U.S. Emerging Growth Fund | Investor | 1.67 | % | $ | 1,000.00 | $ | 1,054.50 | $ | 8.62 | $ | 1,016.74 | $ | 8.47 | |||||||
Strong Enterprise Fund | Investor Institutional Advisor K | 1.86 0.80 1.50 1.06 | % % % % | $ $ $ $ | 1,000.00 1,000.00 1,000.00 1,000.00 | $ $ $ $ | 1,088.10 1,093.80 1,090.10 1,092.60 | $ $ $ $ | 9.76 4.21 7.88 5.58 | $ $ $ $ | 1,015.79 1,021.11 1,017.60 1,019.81 | $ $ $ $ | 9.42 4.06 7.61 5.38 | |||||||
Strong Growth 20 Fund | Investor Advisor | 1.79 1.57 | % % | $ $ | 1,000.00 1,000.00 | $ $ | 1,080.20 1,081.40 | $ $ | 9.36 8.21 | $ $ | 1,016.14 1,017.24 | $ $ | 9.07 7.96 | |||||||
Strong Growth Fund | Investor Institutional Advisor C K | 1.48 0.90 1.54 2.36 0.93 | % % % % % | $ $ $ $ $ | 1,000.00 1,000.00 1,000.00 1,000.00 1,000.00 | $ $ $ $ $ | 1,058.00 1,061.60 1,057.80 1,053.80 1,061.50 | $ $ $ $ $ | 7.66 4.66 7.97 12.18 4.82 | $ $ $ $ $ | 1,017.70 1,020.61 1,017.39 1,013.27 1,020.46 | $ $ $ $ $ | 7.51 4.57 7.81 11.94 4.72 | |||||||
Strong Large Company Growth Fund | Investor K | 1.43 0.95 | % % | $ $ | 1,000.00 1,000.00 | $ $ | 1,096.40 1,099.40 | $ $ | 7.54 5.01 | $ $ | 1,017.95 1,020.36 | $ $ | 7.25 4.82 | |||||||
| 1 | Based on the Fund’s most recent six-month period; may differ from expense ratios based on one-year data in the Financial Highlights. |
| 2 | These ratios do not include the effect of directed brokerage credits and/or custody earnings credits, if any. |
| 3 | Expenses are equal to the Fund’s annualized expense ratio multiplied by the average account value over the period, multiplied by 184 days, and divided by 366. |
39
| December 31, 2004 |
40
STRONG DISCOVERY FUND (continued)
Shares or Principal Amount | Value (Note 2) | ||||
Commercial Services - Miscellaneous 1.5% | |||||
Cogent, Inc. (b) | 29,000 | $ | 957,000 | ||
Hewitt Associates, Inc. Class A (b) | 59,900 | 1,917,399 | |||
| 2,874,399 | |||||
Computer - Local Networks 0.9% | |||||
MRV Communications, Inc. (b) | 493,400 | 1,810,778 | |||
Computer - Peripheral Equipment 1.2% | |||||
Synaptics, Inc. (b) (d) | 74,600 | 2,281,268 | |||
Computer Software - Desktop 1.5% | |||||
Macromedia, Inc. (b) | 94,600 | 2,943,952 | |||
Computer Software - Enterprise 3.2% | |||||
Cognos, Inc. (b) | 58,800 | 2,590,728 | |||
TIBCO Software, Inc. (b) | 260,076 | 3,469,414 | |||
| 6,060,142 | |||||
Computer Software - Medical 1.0% | |||||
Cerner Corporation (b) (d) | 35,100 | 1,866,267 | |||
Computer Software - Security 2.9% | |||||
Check Point Software Technologies, Ltd. (b) | 108,800 | 2,679,744 | |||
McAfee, Inc. (b) | 68,100 | 1,970,133 | |||
VeriSign, Inc. (b) | 27,000 | 905,040 | |||
| 5,554,917 | |||||
Electronics - Contract Manufacturing 0.7% | |||||
Sanmina-SCI Corporation (b) | 167,520 | 1,418,894 | |||
Electronics - Miscellaneous Components 1.3% | |||||
General Cable Corporation (b) (d) | 110,600 | 1,531,810 | |||
Sigmatel, Inc. (b) (d) | 27,100 | 962,863 | |||
| 2,494,673 | |||||
Electronics - Semiconductor Manufacturing 7.0% | |||||
Advanced Micro Devices, Inc. (b) (d) | 129,700 | 2,855,994 | |||
Altera Corporation (b) | 81,300 | 1,682,910 | |||
Cree, Inc. (b) (d) | 72,600 | 2,909,808 | |||
Marvell Technology Group, Ltd. (b) (d) | 99,700 | 3,536,359 | |||
National Semiconductor Corporation | 59,500 | 1,068,025 | |||
Tessera Technologies, Inc. (b) (d) | 35,500 | 1,320,955 | |||
| 13,374,051 | |||||
Finance - Investment Management 0.5% | |||||
T. Rowe Price Group, Inc. | 16,600 | 1,032,520 | |||
Household - Consumer Electronics 1.9% | |||||
Harman International Industries, Inc. | 27,970 | 3,552,190 | |||
Internet - Content 2.2% | |||||
Monster Worldwide, Inc. (b) | 67,600 | 2,274,064 | |||
SINA Corp (b) (d) | 59,100 | 1,894,746 | |||
| 4,168,810 | |||||
Internet - E*Commerce 6.8% | |||||
Ameritrade Holding Corporation (b) | 195,000 | 2,772,900 | |||
Getty Images, Inc. (b) | 42,900 | 2,953,665 | |||
Overstock.com, Inc. (b) (d) | 30,900 | 2,132,100 | |||
Priceline.com, Inc. (b) (d) | 126,656 | 2,987,815 | |||
ValueClick, Inc. (b) | 164,200 | 2,188,786 | |||
| 13,035,266 | |||||
Internet - Network Security/Solutions 1.3% | |||||
Equinix, Inc. (b) (d) | 57,300 | 2,449,002 | |||
Internet - Software 0.8% | |||||
OpenTV Corporation Class A (b) | 407,748 | $ | 1,565,752 | ||
Leisure - Gaming/Equipment 0.7% | |||||
Harrah’s Entertainment, Inc. (d) | 19,800 | 1,324,422 | |||
Leisure - Hotels & Motels 0.0% | |||||
Las Vegas Sands Corporation (b) | 1,900 | 91,200 | |||
Leisure - Movies & Related 0.9% | |||||
Lions Gate Entertainment Corporation (b) (d) | 153,070 | 1,625,603 | |||
Leisure - Services 0.8% | |||||
Royal Caribbean Cruises, Ltd. | 27,500 | 1,497,100 | |||
Leisure - Toys/Games/Hobby 2.4% | |||||
Marvel Enterprises, Inc. (b) (d) | 226,564 | 4,640,031 | |||
Machinery - Construction/Mining 1.1% | |||||
Bucyrus International, Inc. Class A (d) | 51,900 | 2,109,216 | |||
Machinery - General Industrial 1.6% | |||||
Albany International Corporation Class A | 27,200 | 956,352 | |||
UNOVA, Inc. (b) | 82,800 | 2,094,012 | |||
| 3,050,364 | |||||
Media - Radio/TV 0.5% | |||||
Westwood One, Inc. (b) | 36,800 | 991,024 | |||
Medical - Biomedical/Biotechnology 6.1% | |||||
Digene Corporation (b) | 139,823 | 3,656,372 | |||
Genzyme Corporation (b) | 39,500 | 2,293,765 | |||
Guilford Pharmaceuticals, Inc. (b) | 339,700 | 1,681,515 | |||
InterMune, Inc. (b) | 76,000 | 1,007,760 | |||
Northfield Laboratories, Inc. (b) | 79,500 | 1,792,725 | |||
Protein Design Labs, Inc. (b) | 62,600 | 1,293,316 | |||
| 11,725,453 | |||||
Medical - Drug/Diversified 1.1% | |||||
Bone Care International, Inc. (b) (d) | 77,000 | 2,144,450 | |||
Medical - Ethical Drugs 0.9% | |||||
Inspire Pharmaceuticals, Inc. (b) (d) | 101,590 | 1,703,664 | |||
Medical - Hospitals 0.7% | |||||
Community Health Systems, Inc. (b) | 49,390 | 1,376,993 | |||
Medical - Products 1.8% | |||||
American Medical Systems Holdings, Inc. (b) (d) | 63,800 | 2,667,478 | |||
EPIX Pharmaceuticals, Inc. (b) | 48,400 | 866,844 | |||
| 3,534,322 | |||||
Medical - Systems/Equipment 2.2% | |||||
Fisher Scientific International, Inc. (b) | 46,000 | 2,869,480 | |||
Varian Medical Systems, Inc. (b) | 31,700 | 1,370,708 | |||
| 4,240,188 | |||||
Medical/Dental - Services 1.1% | |||||
LabOne, Inc. (b) | 63,700 | 2,040,948 | |||
Medical/Dental - Supplies 1.0% | |||||
Dentsply International, Inc. | 34,330 | 1,929,346 | |||
Metal Ores - Miscellaneous 1.6% | |||||
Phelps Dodge Corporation | 30,800 | 3,046,736 | |||
41
SCHEDULES OF INVESTMENTS IN SECURITIES (continued) | December 31, 2004 |
STRONG DISCOVERY FUND (continued)
42
STRONG ENDEAVOR FUND (continued)
Shares or Amount | Value (Note 2) | ||||||
Marvell Technology Group, Ltd. (b) | 11,260 | $ | 399,392 | ||||
Texas Instruments, Inc. | 21,040 | 518,005 | |||||
| 1,362,352 | |||||||
Finance - Consumer/Commercial Loans 1.1% | |||||||
CIT Group, Inc. | 4,830 | 221,310 | |||||
Food - Confectionery 1.0% | |||||||
William Wrigley Jr. Company | 2,750 | 190,272 | |||||
Household - Consumer Electronics 1.4% | |||||||
Harman International Industries, Inc. | 2,170 | 275,590 | |||||
Insurance - Property/Casualty/Title 1.8% | |||||||
The Allstate Corporation | 6,600 | 341,352 | |||||
Internet - Content 5.3% | |||||||
Yahoo! Inc. (b) | 27,170 | 1,023,766 | |||||
Internet - E*Commerce 2.1% | |||||||
eBay, Inc. (b) | 3,570 | 415,120 | |||||
Leisure - Hotels & Motels 0.3% | |||||||
Las Vegas Sands Corporation (b) | 1,330 | 63,840 | |||||
Leisure - Services 0.5% | |||||||
Royal Caribbean Cruises, Ltd. | 1,880 | 102,347 | |||||
Leisure - Toys/Games/Hobby 2.3% | |||||||
Marvel Enterprises, Inc. (b) | 21,570 | 441,754 | |||||
Media - Cable TV 1.8% | |||||||
EchoStar Communications Corporation Class A | 10,610 | 352,676 | |||||
Medical - Biomedical/Biotechnology 2.6% | |||||||
Genzyme Corporation (b) | 8,760 | 508,693 | |||||
Medical - Generic Drugs 2.5% | |||||||
Teva Pharmaceutical Industries, Ltd. ADR | 16,230 | 484,628 | |||||
Medical - Health Maintenance Organizations 4.5% | |||||||
WellPoint, Inc. (b) | 7,630 | 877,450 | |||||
Medical - Products 7.2% | |||||||
Alcon, Inc. | 5,880 | 473,928 | |||||
Boston Scientific Corporation (b) | 11,560 | 410,958 | |||||
Medtronic, Inc. | 10,110 | 502,164 | |||||
| 1,387,050 | |||||||
Medical - Systems/Equipment 1.6% | |||||||
Fisher Scientific International, Inc. (b) | 4,900 | 305,662 | |||||
Metal Ores - Gold/Silver 1.6% | |||||||
Placer Dome, Inc. | 16,670 | 314,396 | |||||
Metal Ores - Miscellaneous 2.9% | |||||||
Phelps Dodge Corporation | 5,720 | 565,822 | |||||
Oil & Gas - Canadian Exploration & Production 0.6% | |||||||
Canadian Natural Resources, Ltd. | 2,870 | 122,750 | |||||
Oil & Gas - Drilling 1.3% | |||||||
Transocean, Inc. (b) | 5,930 | 251,373 | |||||
Oil & Gas - Field Services 2.7% | |||||||
Halliburton Company | 13,140 | $ | 515,614 | ||||
Oil & Gas - Production/Pipeline 2.3% | |||||||
The Williams Companies, Inc. | 26,790 | 436,409 | |||||
Oil & Gas - United States Exploration & Production 1.3% | |||||||
Noble Energy, Inc. | 4,140 | 255,272 | |||||
Paper & Paper Products 1.3% | |||||||
Smurfit-Stone Container Corporation (b) | 13,110 | 244,895 | |||||
Real Estate Operations 0.6% | |||||||
The St. Joe Company | 1,750 | 112,350 | |||||
Retail - Drug Stores 1.5% | |||||||
CVS Corporation | 6,530 | 294,307 | |||||
Retail - Major Discount Chains 2.1% | |||||||
Target Corporation | 7,965 | 413,622 | |||||
Retail/Wholesale - Office Supplies 2.6% | |||||||
Staples, Inc. | 14,700 | 495,537 | |||||
Telecommunications - Equipment 1.4% | |||||||
Lucent Technologies, Inc. (b) | 70,830 | 266,321 | |||||
Telecommunications - Services 4.7% | |||||||
Sprint Corporation | 36,900 | 916,965 | |||||
Telecommunications - Wireless Equipment 5.5% | |||||||
Motorola, Inc. | 25,410 | 437,052 | |||||
QUALCOMM, Inc. | 9,190 | 389,656 | |||||
Research in Motion, Ltd. (b) | 2,850 | 234,897 | |||||
| 1,061,605 | |||||||
Telecommunications - Wireless Services 0.8% | |||||||
NII Holdings, Inc. Class B (b) | 3,310 | 157,059 | |||||
Transportation - Airline 1.7% | |||||||
Southwest Airlines Company | 20,700 | 336,996 | |||||
Total Common Stocks (Cost $16,533,210) | 19,489,025 | ||||||
Short-Term Investments (a) 3.2% | |||||||
Repurchase Agreements (c) | |||||||
ABN AMRO Inc. (Dated 12/31/04), 2.15%, Due 1/03/05 (Repurchase proceeds $500,090); Collateralized by: United States Government & Agency Issues | $ | 500,000 | 500,000 | ||||
State Street Bank (Dated 12/31/04), 0.85%, Due 1/03/05 (Repurchase proceeds $127,609); Collateralized by: United States Government & Agency Issues | 127,600 | 127,600 | |||||
Total Short-Term Investments (Cost $627,600) | 627,600 | ||||||
Total Investments in Securities (Cost $17,160,810) 103.6% | 20,116,625 | ||||||
Other Assets and Liabilities, Net (3.6%) | (699,967 | ) | |||||
Net Assets 100.0% | $ | 19,416,658 | |||||
43
SCHEDULES OF INVESTMENTS IN SECURITIES (continued) | December 31, 2004 |
Shares or Principal Amount | Value (Note 2) | ||||
Common Stocks 99.1% | |||||
Agricultural Operations 0.6% | |||||
Monsanto Company | 60,000 | $ | 3,333,000 | ||
Banks - Midwest 0.5% | |||||
TCF Financial Corporation | 80,000 | 2,571,200 | |||
Chemicals - Specialty 1.0% | |||||
Praxair, Inc. | 115,000 | 5,077,250 | |||
Commercial Services - Miscellaneous 1.1% | |||||
Paychex, Inc. | 160,000 | 5,452,800 | |||
Commercial Services - Schools 1.5% | |||||
Apollo Group, Inc. Class A (b) | 95,000 | 7,667,450 | |||
Computer - Data Storage 1.0% | |||||
EMC Corporation (b) | 360,000 | 5,353,200 | |||
Computer - IT Services 0.9% | |||||
Cognizant Technology Solutions Corporation Class A (b) | 115,000 | 4,867,950 | |||
Computer - Local Networks 4.8% | |||||
Cisco Systems, Inc. (b) | 300,000 | 5,790,000 | |||
Juniper Networks, Inc. (b) | 520,000 | 14,138,800 | |||
Polycom, Inc. (b) | 210,000 | 4,897,200 | |||
| 24,826,000 | |||||
Computer - Manufacturers 3.1% | |||||
Dell, Inc. (b) | 385,000 | 16,223,900 | |||
Computer Software - Desktop 1.5% | |||||
Microsoft Corporation | 300,000 | 8,013,000 | |||
Computer Software - Education/Entertainment 1.4% | |||||
Electronic Arts, Inc. (b) | 115,000 | 7,093,200 | |||
Computer Software - Enterprise 1.0% | |||||
Oracle Systems Corporation (b) | 385,000 | 5,282,200 | |||
Computer Software - Security 1.5% | |||||
Symantec Corporation (b) | 95,000 | 2,447,200 | |||
VeriSign, Inc. (b) | 155,000 | 5,195,600 | |||
| 7,642,800 | |||||
Cosmetics - Personal Care 2.8% | |||||
The Procter & Gamble Company | 265,000 | 14,596,200 | |||
Diversified Operations 3.3% | |||||
General Electric Company | 340,000 | 12,410,000 | |||
Tyco International, Ltd. | 135,000 | 4,824,900 | |||
| 17,234,900 | |||||
Electronics - Miscellaneous Components 0.5% | |||||
Rockwell Automation, Inc. | 55,000 | 2,725,250 | |||
Electronics - Scientific Measuring 1.1% | |||||
Danaher Corporation (d) | 95,000 | 5,453,950 | |||
Electronics - Semiconductor Manufacturing 4.1% | |||||
Advanced Micro Devices, Inc. (b) (d) | 145,000 | 3,192,900 | |||
Altera Corporation (b) | 130,000 | 2,691,000 | |||
Analog Devices, Inc. | 130,000 | $ | 4,799,600 | ||
Marvell Technology Group, Ltd. (b) | 180,000 | 6,384,600 | |||
Microchip Technology, Inc. (d) | 155,000 | 4,132,300 | |||
| 21,200,400 | |||||
Finance - Consumer/Commercial Loans 1.1% | |||||
SLM Corporation | 110,000 | 5,872,900 | |||
Finance - Investment Brokers 2.3% | |||||
The Goldman Sachs Group, Inc. | 65,000 | 6,762,600 | |||
Lehman Brothers Holdings, Inc. | 60,000 | 5,248,800 | |||
| 12,011,400 | |||||
Finance - Mortgage & Related Services 1.9% | |||||
Countrywide Financial Corporation | 115,000 | 4,256,150 | |||
FHLMC | 75,000 | 5,527,500 | |||
| 9,783,650 | |||||
Financial Services - Miscellaneous 1.6% | |||||
American Express Company | 145,000 | 8,173,650 | |||
Food - Miscellaneous Preparation 1.6% | |||||
PepsiCo, Inc. | 160,000 | 8,352,000 | |||
Household - Consumer Electronics 1.0% | |||||
Harman International Industries, Inc. | 40,000 | 5,080,000 | |||
Insurance - Accident & Health 0.5% | |||||
AFLAC, Inc. | 65,000 | 2,589,600 | |||
Internet - Content 3.3% | |||||
Google, Inc. Class A (b) (d) | 30,000 | 5,793,000 | |||
Yahoo! Inc. (b) | 305,000 | 11,492,400 | |||
| 17,285,400 | |||||
Internet - E*Commerce 2.5% | |||||
eBay, Inc. (b) | 110,000 | 12,790,800 | |||
Leisure - Gaming/Equipment 3.8% | |||||
International Game Technology | 275,000 | 9,454,500 | |||
Station Casinos, Inc. | 95,000 | 5,194,600 | |||
Wynn Resorts, Ltd. (b) (d) | 75,000 | 5,019,000 | |||
| 19,668,100 | |||||
Leisure - Hotels & Motels 1.4% | |||||
Marriott International, Inc. Class A | 115,000 | 7,242,700 | |||
Machinery - Farm 0.9% | |||||
Deere & Company (d) | 60,000 | 4,464,000 | |||
Media - Radio/TV 1.1% | |||||
XM Satellite Radio Holdings, Inc. Class A (b) | 145,000 | 5,454,900 | |||
Medical - Biomedical/Biotechnology 5.4% | |||||
Amgen, Inc. (b) | 190,000 | 12,188,500 | |||
Biogen Idec, Inc. (b) (d) | 40,000 | 2,664,400 | |||
Genzyme Corporation (b) | 75,000 | 4,355,250 | |||
Gilead Sciences, Inc. (b) | 250,000 | 8,747,500 | |||
| 27,955,650 | |||||
Medical - Drug/Diversified 2.9% | |||||
Abbott Laboratories | 60,000 | 2,799,000 | |||
Johnson & Johnson | 190,000 | 12,049,800 | |||
| 14,848,800 | |||||
Medical - Ethical Drugs 1.6% | |||||
Eyetech Pharmaceuticals, Inc. (b) | 72,900 | 3,316,950 | |||
Eli Lilly & Company | 90,000 | 5,107,500 | |||
| 8,424,450 | |||||
Medical - Generic Drugs 0.9% | |||||
Teva Pharmaceutical Industries, Ltd. ADR | 150,000 | 4,479,000 | |||
44
STRONG LARGE CAP GROWTH FUND (continued)
Shares or Principal Amount | Value (Note 2) | ||||||
Medical - Health Maintenance Organizations 1.0% | |||||||
Aetna, Inc. | 40,000 | $ | 4,990,000 | ||||
Medical - Hospitals 0.5% | |||||||
HCA, Inc. (d) | 65,000 | 2,597,400 | |||||
Medical - Products 5.4% | |||||||
Biomet, Inc. | 145,000 | 6,291,550 | |||||
Guidant Corporation | 50,000 | 3,605,000 | |||||
St. Jude Medical, Inc. (b) (d) | 240,000 | 10,063,200 | |||||
Zimmer Holdings, Inc. (b) (d) | 100,000 | 8,012,000 | |||||
| 27,971,750 | |||||||
Medical/Dental - Supplies 1.1% | |||||||
Kinetic Concepts, Inc. (b) | 75,000 | 5,722,500 | |||||
Metal Ores - Miscellaneous 0.5% | |||||||
Alcoa, Inc. | 85,000 | 2,670,700 | |||||
Oil & Gas - Drilling 0.6% | |||||||
Noble Corporation (b) (d) | 60,000 | 2,984,400 | |||||
Oil & Gas - Field Services 0.5% | |||||||
BJ Services Company | 60,000 | 2,792,400 | |||||
Oil & Gas - International Integrated 1.0% | |||||||
Exxon Mobil Corporation | 100,000 | 5,126,000 | |||||
Oil & Gas - Machinery/Equipment 1.0% | |||||||
Smith International, Inc. (b) (d) | 100,000 | 5,441,000 | |||||
Oil & Gas - United States Exploration & Production 2.7% | |||||||
Apache Corporation | 70,000 | 3,539,900 | |||||
Occidental Petroleum Corporation | 75,000 | 4,377,000 | |||||
Ultra Petroleum Corporation (b) | 55,000 | 2,647,150 | |||||
XTO Energy, Inc. | 100,000 | 3,538,000 | |||||
| 14,102,050 | |||||||
Retail - Consumer Electronics 0.5% | |||||||
Best Buy Company, Inc. | 45,500 | 2,703,610 | |||||
Retail - Department Stores 0.6% | |||||||
Kohl’s Corporation (b) | 60,000 | 2,950,200 | |||||
Retail - Discount & Variety 1.8% | |||||||
Dollar General Corporation (d) | 260,000 | 5,400,200 | |||||
Dollar Tree Stores, Inc. (b) | 145,000 | 4,158,600 | |||||
| 9,558,800 | |||||||
Retail - Drug Stores 1.2% | |||||||
Walgreen Company | 160,000 | 6,139,200 | |||||
Retail - Major Discount Chains 3.1% | |||||||
Target Corporation | 310,000 | 16,098,300 | |||||
Retail - Miscellaneous 1.3% | |||||||
Cabela’s, Inc. (b) | 80,000 | 1,819,200 | |||||
PETCO Animal Supplies, Inc. (b) | 120,000 | 4,737,600 | |||||
| 6,556,800 | |||||||
Retail - Restaurants 0.8% | |||||||
Starbucks Corporation (b) | 65,000 | 4,053,400 | |||||
Retail - Super/Mini Markets 1.0% | |||||||
Whole Foods Marketing, Inc. | 55,000 | 5,244,250 | |||||
Retail/Wholesale - Building Products 3.0% | |||||||
The Home Depot, Inc. | 240,000 | $ | 10,257,600 | ||||
Lowe’s Companies, Inc. | 90,000 | 5,183,100 | |||||
| 15,440,700 | |||||||
Retail/Wholesale - Office Supplies 1.1% | |||||||
Staples, Inc. | 175,000 | 5,899,250 | |||||
Telecommunications - Fiber Optics 0.9% | |||||||
Corning, Inc. (b) | 375,000 | 4,413,750 | |||||
Telecommunications - Wireless Equipment 4.0% | |||||||
Motorola, Inc. | 315,000 | 5,418,000 | |||||
QUALCOMM, Inc. | 250,000 | 10,600,000 | |||||
Research in Motion, Ltd. (b) (d) | 60,000 | 4,945,200 | |||||
| 20,963,200 | |||||||
Total Common Stocks (Cost $406,996,297) | 513,511,310 | ||||||
Short-Term Investments (a) 3.9% | |||||||
Collateral Received for Securities Lending 2.8% | |||||||
Navigator Prime Portfolio | 14,854,959 | 14,854,959 | |||||
Repurchase Agreements (c) 1.1% | |||||||
ABN AMRO Inc. (Dated 12/31/04), 2.15%, Due 1/03/05 (Repurchase proceeds $1,500,269); Collateralized by: United States Government & Agency Issues | $ | 1,500,000 | 1,500,000 | ||||
State Street Bank (Dated 12/31/04), 0.85%, Due 1/03/05 (Repurchase proceeds $4,030,986); Collateralized by: United States Government & Agency Issues | 4,030,700 | 4,030,700 | |||||
Total Repurchase Agreements | 5,530,700 | ||||||
Total Short-Term Investments (Cost $20,385,659) | 20,385,659 | ||||||
Total Investments in Securities (Cost $427,381,956) 103.0% | 533,896,969 | ||||||
Other Assets and Liabilities, Net (3.0%) | (15,466,295 | ) | |||||
Net Assets 100.0% | $ | 518,430,674 | |||||
| Shares or Principal Amount | Value (Note 2) | ||||||
Common Stocks 101.8% | |||||||
Chemicals - Specialty 1.0% | |||||||
Symyx Technologies, Inc. (b) | 21,835 | $ | 656,797 | ||||
Commercial Services - Consulting 1.1% | |||||||
Navigant Consulting, Inc. (b) | 26,825 | 713,545 | |||||
Commercial Services - Market Research 4.0% | |||||||
Corporate Executive Board Company | 17,445 | 1,167,768 | |||||
CoStar Group, Inc. (b) | 30,265 | 1,397,638 | |||||
| 2,565,406 | |||||||
Commercial Services - Schools 2.2% | |||||||
Bright Horizons Family Solutions, Inc. (b) | 11,390 | 737,616 | |||||
Laureate Education, Inc. (b) | 15,380 | 678,104 | |||||
| 1,415,720 | |||||||
45
SCHEDULES OF INVESTMENTS IN SECURITIES (continued) | December 31, 2004 |
STRONG U.S. EMERGING GROWTH FUND (continued)
| Shares or Principal Amount | Value (Note 2) | ||||
Computer - IT Services 2.8% | |||||
Cognizant Technology Solutions Corporation Class A (b) | 43,330 | $ | 1,834,159 | ||
Computer - Peripheral Equipment 2.1% | |||||
Synaptics, Inc. (b) | 44,125 | 1,349,342 | |||
Computer Software - Desktop 1.3% | |||||
Sonic Solutions (b) | 37,290 | 836,788 | |||
Electronics - Miscellaneous Components 1.4% | |||||
Sigmatel, Inc. (b) | 24,720 | 878,302 | |||
Electronics - Semiconductor Manufacturing 4.9% | |||||
Cree, Inc. (b) | 18,580 | 744,686 | |||
FormFactor, Inc. (b) | 39,325 | 1,067,280 | |||
Tessera Technologies, Inc. (b) | 35,815 | 1,332,676 | |||
| 3,144,642 | |||||
Energy - Other 1.2% | |||||
Massey Energy Company | 21,225 | 741,814 | |||
Financial Services - Miscellaneous 4.5% | |||||
Investors Financial Services Corporation | �� | 42,970 | 2,147,641 | ||
iPayment, Inc. (b) | 14,825 | 734,134 | |||
| 2,881,775 | |||||
Insurance - Property/Casualty/Title 1.0% | |||||
ProAssurance Corporation (b) | 16,905 | 661,155 | |||
Internet - Content 2.4% | |||||
Ask Jeeves, Inc. (b) | 21,955 | 587,296 | |||
InfoSpace, Inc. (b) | 20,580 | 978,579 | |||
| 1,565,875 | |||||
Internet - E*Commerce 2.7% | |||||
Getty Images, Inc. (b) | 25,010 | 1,721,938 | |||
Internet - Network Security/Solutions 3.2% | |||||
Equinix, Inc. (b) | 29,525 | 1,261,898 | |||
F5 Networks, Inc. (b) | 15,825 | 770,994 | |||
| 2,032,892 | |||||
Leisure - Gaming/Equipment 2.9% | |||||
Shuffle Master, Inc. (b) | 39,390 | 1,855,269 | |||
Leisure - Hotels & Motels 1.1% | |||||
Las Vegas Sands Corporation (b) | 15,070 | 723,360 | |||
Leisure - Products 1.0% | |||||
Celebrate Express, Inc. (b) | 34,429 | 654,151 | |||
Machinery - Construction/Mining 13.5% | |||||
A.S.V., Inc. (b) | 31,090 | 1,489,211 | |||
Bucyrus International, Inc. Class A | 39,430 | 1,602,435 | |||
JLG Industries, Inc. | 106,155 | 2,083,823 | |||
Joy Global, Inc. | 42,140 | 1,830,140 | |||
Terex Corporation (b) | 34,590 | 1,648,214 | |||
| 8,653,823 | |||||
Medical - Biomedical/Biotechnology 0.7% | |||||
Immunicon Corporation (b) | 68,200 | 476,036 | |||
Medical - Drug/Diversified 1.0% | |||||
MGI Pharma, Inc. (b) | 22,780 | 638,068 | |||
Medical - Ethical Drugs 2.2% | |||||
Salix Pharmaceuticals, Ltd. (b) | 79,592 | $ | 1,400,023 | ||
Medical - Health Maintenance Organizations 1.7% | |||||
Centene Corporation (b) | 38,770 | 1,099,129 | |||
Medical - Products 1.9% | |||||
Kyphon, Inc. (b) | 47,560 | 1,225,146 | |||
Medical - Systems/Equipment 3.9% | |||||
Foxhollow Technologies, Inc. (b) | 55,240 | 1,358,352 | |||
Ventana Medical Systems, Inc. (b) | 18,195 | 1,164,298 | |||
| 2,522,650 | |||||
Medical/Dental - Services 1.7% | |||||
American Healthways, Inc. (b) | 33,431 | 1,104,560 | |||
Oil & Gas - Field Services 1.1% | |||||
Oceaneering International, Inc. (b) | 18,430 | 687,808 | |||
Oil & Gas - Machinery/Equipment 1.5% | |||||
CARBO Ceramics, Inc. | 14,370 | 991,530 | |||
Oil & Gas - United States Exploration & Production 6.5% | |||||
\KCS Energy, Inc. (b) | 51,200 | 756,736 | |||
Quicksilver Resources, Inc. (b) | 37,540 | 1,380,721 | |||
Range Resources Corporation | 41,535 | 849,806 | |||
Ultra Petroleum Corporation (b) | 24,525 | 1,180,388 | |||
| 4,167,651 | |||||
Retail - Clothing/Shoes 2.4% | |||||
Chicos FAS, Inc. (b) | 16,829 | 766,224 | |||
Urban Outfitters, Inc. (b) | 17,990 | 798,756 | |||
| 1,564,980 | |||||
Retail - Restaurants 5.7% | |||||
The Cheesecake Factory, Inc. (b) | 40,980 | 1,330,621 | |||
P.F. Chang’s China Bistro, Inc. (b) | 29,845 | 1,681,766 | |||
Peets Coffee & Tea, Inc. (b) | 25,080 | 663,868 | |||
| 3,676,255 | |||||
Telecommunications - Wireless Equipment 3.2% | |||||
Trimble Navigation, Ltd. (b) | 61,740 | 2,039,890 | |||
Telecommunications - Wireless Services 5.0% | |||||
Alamosa Holdings, Inc. (b) | 142,100 | 1,771,987 | |||
Nextel Partners, Inc. Class A (b) | 73,365 | 1,433,552 | |||
| 3,205,539 | |||||
Transportation - Services 2.2% | |||||
C.H. Robinson Worldwide, Inc. | 25,255 | 1,402,158 | |||
Transportation - Truck 6.8% | |||||
J.B. Hunt Transport Services, Inc. | 32,765 | 1,469,510 | |||
Knight Transportation, Inc. | 38,705 | 959,884 | |||
Landstar Systems, Inc. (b) | 26,675 | 1,964,347 | |||
| 4,393,741 | |||||
Total Common Stocks (Cost $45,508,393) | 65,481,917 | ||||
46
STRONG U.S. EMERGING GROWTH FUND (continued)
47
SCHEDULES OF INVESTMENTS IN SECURITIES (continued) | December 31, 2004 |
STRONG ENTERPRISE FUND (continued)
Shares or Principal Amount | Value (Note 2) | ||||||
Medical - Generic Drugs 0.9% | |||||||
Teva Pharmaceutical Industries, Ltd. ADR (d) | 83,600 | $ | 2,496,296 | ||||
Medical - Health Maintenance Organizations 1.9% | |||||||
WellPoint, Inc. (b) | 46,905 | 5,394,075 | |||||
Medical - Hospitals 0.7% | |||||||
Community Health Systems, Inc. (b) (d) | 73,550 | 2,050,574 | |||||
Medical - Nursing Homes 0.5% | |||||||
Manor Care, Inc. (d) | 38,700 | 1,371,141 | |||||
Medical - Products 1.4% | |||||||
American Medical Systems Holdings, Inc. (b) (d) | 95,400 | 3,988,674 | |||||
Medical - Systems/Equipment 2.3% | |||||||
Fisher Scientific International, Inc. (b) | 68,970 | 4,302,349 | |||||
Varian Medical Systems, Inc. (b) | 47,430 | 2,050,873 | |||||
| 6,353,222 | |||||||
Medical/Dental - Services 1.0% | |||||||
Quest Diagnostics, Inc. | 28,900 | 2,761,395 | |||||
Medical/Dental - Supplies 1.0% | |||||||
Dentsply International, Inc. (d) | 51,170 | 2,875,754 | |||||
Metal Ores - Gold/Silver 1.6% | |||||||
Placer Dome, Inc. (d) | 241,190 | 4,548,843 | |||||
Metal Ores - Miscellaneous 1.5% | |||||||
Phelps Dodge Corporation | 42,000 | 4,154,640 | |||||
Mining - Gems 1.1% | |||||||
Pan American Silver Corporation (b) (d) | 187,800 | 3,001,044 | |||||
Oil & Gas - Canadian Exploration & Production 0.6% | |||||||
Canadian Natural Resources, Ltd. | 39,300 | 1,680,861 | |||||
Oil & Gas - Drilling 3.3% | |||||||
ENSCO International, Inc. (d) | 61,690 | 1,958,041 | |||||
Pride International, Inc. (b) (d) | 90,600 | 1,860,924 | |||||
Transocean, Inc. (b) | 126,700 | 5,370,813 | |||||
| 9,189,778 | |||||||
Oil & Gas - Machinery/Equipment 1.1% | |||||||
Input/Output, Inc. (b) | 361,600 | 3,196,544 | |||||
Oil & Gas - Production/Pipeline 1.6% | |||||||
The Williams Companies, Inc. | 274,000 | 4,463,460 | |||||
Oil & Gas - United States Exploration & Production 1.4% | |||||||
Chesapeake Energy Corporation (d) | 229,910 | 3,793,515 | |||||
Paper & Paper Products 1.0% | |||||||
Smurfit-Stone Container Corporation (b) | 156,700 | 2,927,156 | |||||
Real Estate Operations 1.4% | |||||||
The St. Joe Company | 61,400 | 3,941,880 | |||||
Retail - Clothing/Shoes 2.0% | |||||||
Abercrombie & Fitch Company Class A | 122,700 | 5,760,765 | |||||
Retail - Home Furnishings 0.7% | |||||||
Williams-Sonoma, Inc. (b) | 54,200 | $ | 1,899,168 | ||||
Retail - Miscellaneous 2.1% | |||||||
Michaels Stores, Inc. | 102,200 | 3,062,934 | |||||
PETsMART, Inc. | 77,962 | 2,769,990 | |||||
| 5,832,924 | |||||||
Retail/Wholesale - Office Supplies 0.7% | |||||||
Staples, Inc. | 62,300 | 2,100,133 | |||||
Telecommunications - Wireless Equipment 1.4% | |||||||
Novatel Wireless, Inc. (b) (d) | 100,913 | 1,955,694 | |||||
Research in Motion, Ltd. (b) | 23,940 | 1,973,135 | |||||
| 3,928,829 | |||||||
Telecommunications - Wireless Services 5.1% | |||||||
Crown Castle International Corporation (b) | 233,200 | 3,880,448 | |||||
NII Holdings, Inc. Class B (b) (d) | 120,280 | 5,707,286 | |||||
Nextel Partners, Inc. Class A (b) (d) | 242,060 | 4,729,852 | |||||
| 14,317,586 | |||||||
Transportation - Airline 0.8% | |||||||
Southwest Airlines Company | 143,100 | 2,329,668 | |||||
Transportation - Services 2.2% | |||||||
Expeditors International of Washington, Inc. | 112,700 | 6,297,676 | |||||
Trucks & Parts - Heavy Duty 2.4% | |||||||
Cummins, Inc. (d) | 56,400 | 4,725,756 | |||||
Oshkosh Truck Corporation | 30,100 | 2,058,238 | |||||
| 6,783,994 | |||||||
Total Common Stocks (Cost $224,314,273) | 274,849,870 | ||||||
Short-Term Investments (a) 14.5% | |||||||
Collateral Received for Securities Lending 11.4% | |||||||
Navigator Prime Portfolio | 32,019,561 | 32,019,561 | |||||
Repurchase Agreements (c) 3.1% | |||||||
ABN AMRO Inc. (Dated 12/31/04), 2.15%, Due 1/03/05 (Repurchase proceeds $6,801,218); Collateralized by: United States Government & Agency Issues | $ | 6,800,000 | 6,800,000 | ||||
State Street Bank (Dated 12/31/04), 0.85%, Due 1/03/05 (Repurchase proceeds $2,027,544); Collateralized by: United States Government & Agency Issues | 2,027,400 | 2,027,400 | |||||
Total Repurchase Agreements | 8,827,400 | ||||||
Total Short-Term Investments (Cost $40,846,961) | 40,846,961 | ||||||
Total Investments in Securities (Cost $265,161,234) 112.2% | 315,696,831 | ||||||
Other Assets and Liabilities, Net (12.2%) | (34,330,942 | ) | |||||
Net Assets 100.0% | $ | 281,365,889 | |||||
48
49
SCHEDULES OF INVESTMENTS IN SECURITIES (continued) | December 31, 2004 |
STRONG GROWTH FUND (continued)
| Shares or Principal Amount | Value (Note 2) | ||||
Commercial Services - Miscellaneous 1.8% | |||||
Cogent, Inc. (b) | 185,000 | $ | 6,105,000 | ||
Paychex, Inc. | 625,000 | 21,300,000 | |||
| 27,405,000 | |||||
Commercial Services - Schools 1.5% | |||||
Apollo Group, Inc. Class A (b) | 275,001 | 22,195,331 | |||
Computer - Data Storage 1.1% | |||||
EMC Corporation (b) | 550,000 | 8,178,500 | |||
Xyratex, Ltd. (b) | 481,600 | 7,936,768 | |||
| 16,115,268 | |||||
Computer - IT Services 2.9% | |||||
Accenture, Ltd. Class A (b) | 100,000 | 2,700,000 | |||
Cognizant Technology Solutions Corporation Class A (b) | 860,000 | 36,403,800 | |||
Kanbay International, Inc. (b) | 75,100 | 2,350,630 | |||
Satyam Computer Services, Ltd. ADR | 80,000 | 1,930,400 | |||
| 43,384,830 | |||||
Computer - Local Networks 4.6% | |||||
Cisco Systems, Inc. (b) | 825,000 | 15,922,500 | |||
Juniper Networks, Inc. (b) | 770,000 | 20,936,300 | |||
Polycom, Inc. (b) | 1,275,000 | 29,733,000 | |||
QLogic Corporation (b) | 75,000 | 2,754,750 | |||
| 69,346,550 | |||||
Computer - Manufacturers 3.0% | |||||
Dell, Inc. (b) | 1,080,000 | 45,511,200 | |||
Computer Software - Desktop 2.1% | |||||
Microsoft Corporation | 1,075,000 | 28,713,250 | |||
NAVTEQ Corporation (b) | 80,000 | 3,708,800 | |||
| 32,422,050 | |||||
Computer Software - Education/Entertainment 1.3% | |||||
Blackboard, Inc. (b) | 75,000 | 1,110,750 | |||
Electronic Arts, Inc. (b) | 290,000 | 17,887,200 | |||
| 18,997,950 | |||||
Computer Software - Enterprise 2.9% | |||||
Cognos, Inc. (b) | 410,000 | 18,064,600 | |||
Mercury Interactive Corporation (b) | 335,000 | 15,259,250 | |||
TIBCO Software, Inc. (b) | 780,000 | 10,405,200 | |||
| 43,729,050 | |||||
Computer Software - Medical 0.3% | |||||
Cerner Corporation (b) | 90,000 | 4,785,300 | |||
Computer Software - Security 1.4% | |||||
Symantec Corporation (b) | 55,000 | 1,416,800 | |||
VeriSign, Inc. (b) | 575,000 | 19,274,000 | |||
| 20,690,800 | |||||
Cosmetics - Personal Care 1.9% | |||||
The Gillette Company | 90,000 | 4,030,200 | |||
The Procter & Gamble Company | 445,000 | 24,510,600 | |||
| 28,540,800 | |||||
Diversified Operations 2.7% | |||||
General Electric Company | 775,000 | 28,287,500 | |||
Tyco International, Ltd. | 335,000 | 11,972,900 | |||
| 40,260,400 | |||||
Electronics - Contract Manufacturing 0.5% | |||||
Flextronics International, Ltd. (b) (d) | 550,000 | 7,601,000 | |||
Electronics - Miscellaneous Components 0.7% | |||||
Plantronics, Inc. | 175,000 | 7,257,250 | |||
Rockwell Automation, Inc. | 70,000 | 3,468,500 | |||
| 10,725,750 | |||||
Electronics - Scientific Measuring 0.4% | |||||
PerkinElmer, Inc. | 280,000 | $ | 6,297,200 | ||
Electronics - Semiconductor Manufacturing 4.6% | |||||
Altera Corporation (b) | 355,000 | 7,348,500 | |||
Analog Devices, Inc. | 305,000 | 11,260,600 | |||
Marvell Technology Group, Ltd. (b) (d) | 275,000 | 9,754,250 | |||
Maxim Integrated Products, Inc. | 175,000 | 7,418,250 | |||
Microchip Technology, Inc. (d) | 880,000 | 23,460,800 | |||
SiRF Technology Holdings, Inc. (b) | 800,000 | 10,176,000 | |||
| 69,418,400 | |||||
Energy - Other 0.4% | |||||
CONSOL Energy, Inc. | 150,000 | 6,157,500 | |||
Finance - Consumer/Commercial Loans 0.9% | |||||
SLM Corporation | 250,000 | 13,347,500 | |||
Finance - Investment Brokers 0.6% | |||||
Lehman Brothers Holdings, Inc. | 105,000 | 9,185,400 | |||
Finance - Mortgage & Related Services 1.1% | |||||
Countrywide Financial Corporation | 430,000 | 15,914,300 | |||
Finance - Publicly Traded Investment Funds-Equity (Non 40 Act) 1.0% | |||||
Pharmaceutical Holders Trust | 205,000 | 14,901,450 | |||
Financial Services - Miscellaneous 5.3% | |||||
Alliance Data Systems Corporation (b) | 575,000 | 27,301,000 | |||
American Express Company | 130,000 | 7,328,100 | |||
CheckFree Corporation (b) | 150,000 | 5,712,000 | |||
First Marblehead Corporation (b) | 626,800 | 35,257,500 | |||
iPayment, Inc. (b) | 90,000 | 4,456,800 | |||
| 80,055,400 | |||||
Food - Miscellaneous Preparation 0.9% | |||||
PepsiCo, Inc. | 265,000 | 13,833,000 | |||
Household - Consumer Electronics 0.4% | |||||
Harman International Industries, Inc. | 45,000 | 5,715,000 | |||
Insurance - Diversified 0.5% | |||||
Prudential Financial, Inc. | 145,000 | 7,969,200 | |||
Insurance - Property/Casualty/Title 0.4% | |||||
RenaissanceRe Holdings, Ltd. | 120,000 | 6,249,600 | |||
Internet - Content 3.9% | |||||
FindWhat.com (b) | 225,000 | 3,989,250 | |||
Google, Inc. Class A (b) (d) | 122,000 | 23,558,200 | |||
Yahoo! Inc. (b) | 855,000 | 32,216,400 | |||
| 59,763,850 | |||||
Internet - E*Commerce 3.4% | |||||
Arbinet-thexchange, Inc. (b) | 250,000 | 6,212,500 | |||
eBay, Inc. (b) | 385,000 | 44,767,800 | |||
| 50,980,300 | |||||
Internet - Network Security/Solutions 1.9% | |||||
Digital River, Inc. (b) | 700,000 | 29,127,000 | |||
50
STRONG GROWTH FUND (continued)
| Shares or Principal Amount | Value (Note 2) | ||||
Leisure - Gaming/Equipment 1.6% | |||||
International Game Technology | 225,000 | $ | 7,735,500 | ||
Station Casinos, Inc. | 315,000 | 17,224,200 | |||
| 24,959,700 | |||||
Leisure - Hotels & Motels 0.4% | |||||
Marriott International, Inc. Class A | 95,000 | 5,983,100 | |||
Leisure - Services 1.2% | |||||
Carnival Corporation | 165,000 | 9,508,950 | |||
Royal Caribbean Cruises, Ltd. (d) | 170,000 | 9,254,800 | |||
| 18,763,750 | |||||
Machinery - General Industrial 0.4% | |||||
Pentair, Inc. | 140,000 | 6,098,400 | |||
Media - Radio/TV 0.3% | |||||
Univision Communications, Inc. Class A (b) | 15,000 | 439,050 | |||
Viacom, Inc. Class B | 130,000 | 4,730,700 | |||
| 5,169,750 | |||||
Medical - Biomedical/Biotechnology 3.7% | |||||
Amgen, Inc. (b) | 325,000 | 20,848,750 | |||
Amylin Pharmaceuticals, Inc. (b) | 220,000 | 5,139,200 | |||
Genzyme Corporation (b) | 70,000 | 4,064,900 | |||
Gilead Sciences, Inc. (b) | 750,000 | 26,242,500 | |||
| 56,295,350 | |||||
Medical - Drug/Diversified 0.7% | |||||
Bone Care International, Inc. (b) | 170,000 | 4,734,500 | |||
Johnson & Johnson | 100,000 | 6,342,000 | |||
| 11,076,500 | |||||
Medical - Ethical Drugs 1.6% | |||||
Eli Lilly & Company | 225,000 | 12,768,750 | |||
Pfizer, Inc. | 400,000 | 10,756,000 | |||
| 23,524,750 | |||||
Medical - Generic Drugs 1.2% | |||||
Teva Pharmaceutical Industries, Ltd. ADR | 625,000 | 18,662,500 | |||
Medical - Health Maintenance Organizations 2.0% | |||||
Aetna, Inc. | 80,000 | 9,980,000 | |||
Centene Corporation (b) | 120,000 | 3,402,000 | |||
Molina Healthcare, Inc. (b) | 355,000 | 16,464,900 | |||
| 29,846,900 | |||||
Medical - Outpatient/Home Care 1.2% | |||||
Psychiatric Solutions, Inc. (b) | 520,000 | 19,011,200 | |||
Medical - Products 4.4% | |||||
Advanced Neuromodulation Systems, Inc. (b) | 100,000 | 3,946,000 | |||
INAMED Corporation (b) | 385,000 | 24,351,250 | |||
St. Jude Medical, Inc. (b) | 700,000 | 29,351,000 | |||
Zimmer Holdings, Inc. (b) | 105,000 | 8,412,600 | |||
| 66,060,850 | |||||
Medical - Systems/Equipment 0.3% | |||||
Symmetry Medical, Inc. (b) | 218,500 | 4,599,425 | |||
Medical/Dental - Services 1.5% | |||||
Covance, Inc. (b) | 605,000 | 23,443,750 | |||
Medical/Dental - Supplies 2.3% | |||||
Kinetic Concepts, Inc. (b) | 455,000 | 34,716,500 | |||
Oil & Gas - Drilling 0.8% | |||||
ENSCO International, Inc. | 400,000 | 12,696,000 | |||
Oil & Gas - Field Services 0.4% | |||||
BJ Services Company | 120,000 | $ | 5,584,800 | ||
Oil & Gas - Machinery/Equipment 2.0% | |||||
Baker Hughes, Inc. | 75,000 | 3,200,250 | |||
Grant Prideco, Inc. (b) | 400,000 | 8,020,000 | |||
Smith International, Inc. (b) | 345,000 | 18,771,450 | |||
| 29,991,700 | |||||
Oil & Gas - United States Exploration & Production 1.4% | |||||
Bill Barrett Corporation (b) | 87,800 | 2,808,722 | |||
XTO Energy, Inc. | 500,000 | 17,690,000 | |||
| 20,498,722 | |||||
Retail - Leisure Product 1.7% | |||||
Dick’s Sporting Goods, Inc. (b) | 600,000 | 21,090,000 | |||
Guitar Center, Inc. (b) | 90,000 | 4,742,100 | |||
| 25,832,100 | |||||
Retail - Miscellaneous 5.5% | |||||
Michaels Stores, Inc. | 325,000 | 9,740,250 | |||
PETCO Animal Supplies, Inc. (b) | 1,080,000 | 42,638,400 | |||
PETsMART, Inc. | 855,000 | 30,378,150 | |||
| 82,756,800 | |||||
Retail - Restaurants 0.9% | |||||
Red Robin Gourmet Burgers, Inc. (b) | 140,000 | 7,485,800 | |||
Texas Roadhouse, Inc. Class A (b) | 203,908 | 6,025,481 | |||
| 13,511,281 | |||||
Retail - Super/Mini Markets 0.4% | |||||
Whole Foods Marketing, Inc. | 70,000 | 6,674,500 | |||
Retail/Wholesale - Building Products 3.0% | |||||
The Home Depot, Inc. | 260,000 | 11,112,400 | |||
Hughes Supply, Inc. | 1,065,000 | 34,452,750 | |||
| 45,565,150 | |||||
Telecommunications - Equipment 1.3% | |||||
ADTRAN, Inc. | 75,000 | 1,435,500 | |||
Dycom Industries, Inc. (b) | 255,000 | 7,782,600 | |||
InPhonic, Inc. (b) | 375,000 | 10,305,000 | |||
| 19,523,100 | |||||
Telecommunications - Fiber Optics 0.3% | |||||
Corning, Inc. (b) (d) | 350,000 | 4,119,500 | |||
Telecommunications - Wireless Equipment 0.9% | |||||
Motorola, Inc. | 310,000 | 5,332,000 | |||
QUALCOMM, Inc. | 95,000 | 4,028,000 | |||
Research in Motion, Ltd. (b) (d) | 60,000 | 4,945,200 | |||
| 14,305,200 | |||||
Telecommunications - Wireless Services 0.4% | |||||
NII Holdings, Inc. Class B (b) | 135,000 | 6,405,750 | |||
Transportation - Services 0.4% | |||||
Expeditors International of Washington, Inc. (d) | 100,000 | 5,588,000 | |||
Total Common Stocks (Cost $1,125,822,959) | 1,504,329,419 | ||||
51
SCHEDULES OF INVESTMENTS IN SECURITIES (continued) | December 31, 2004 |
STRONG GROWTH FUND (continued)
52
STRONG LARGE COMPANY GROWTH FUND (continued)
Shares or Principal | Value (Note 2) | ||||||
Oil & Gas - Field Services 2.5% | |||||||
Halliburton Company | 66,400 | $ | 2,605,536 | ||||
Oil & Gas - Production/Pipeline 2.1% | |||||||
The Williams Companies, Inc. | 137,650 | 2,242,319 | |||||
Oil & Gas - United States Exploration & Production 1.2% | |||||||
Noble Energy, Inc. | 20,950 | 1,291,777 | |||||
Paper & Paper Products 1.2% | |||||||
Smurfit-Stone Container Corporation (b) | 67,650 | 1,263,702 | |||||
Real Estate Operations 0.5% | |||||||
The St. Joe Company | 8,650 | 555,330 | |||||
Retail - Drug Stores 1.4% | |||||||
CVS Corporation | 33,400 | 1,505,338 | |||||
Retail - Major Discount Chains 2.0% | |||||||
Target Corporation | 40,550 | 2,105,762 | |||||
Retail/Wholesale - Office Supplies 2.4% | |||||||
Staples, Inc. | 74,450 | 2,509,709 | |||||
Telecommunications - Equipment 1.3% | |||||||
Lucent Technologies, Inc. (b) | 357,450 | 1,344,012 | |||||
Telecommunications - Services 4.5% | |||||||
Sprint Corporation | 186,800 | 4,641,980 | |||||
Telecommunications - Wireless Equipment 5.2% | |||||||
Motorola, Inc. | 129,800 | 2,232,560 | |||||
QUALCOMM, Inc. | 46,850 | 1,986,440 | |||||
Research in Motion, Ltd. (b) | 15,050 | 1,240,421 | |||||
| 5,459,421 | |||||||
Telecommunications - Wireless Services 0.8% | |||||||
NII Holdings, Inc. Class B (b) | 17,150 | 813,767 | |||||
Transportation - Airline 1.7% | |||||||
Southwest Airlines Company | 105,600 | 1,719,168 | |||||
Total Common Stocks (Cost $85,824,451) | 98,757,692 | ||||||
Short-Term Investments (a) 6.3% | |||||||
Repurchase Agreements (c) | |||||||
State Street Bank (Dated 12/31/04), 0.85%, Due 1/03/05 (Repurchase proceeds $6,543,063); Collateralized by: United States Government & Agency Issues | $ | 6,542,600 | 6,542,600 | ||||
Total Short-Term Investments (Cost $6,542,600) | 6,542,600 | ||||||
Total Investments in Securities (Cost $92,367,051) 100.9% | 105,300,292 | ||||||
Other Assets and Liabilities, Net (0.9%) | (950,578 | ) | |||||
Net Assets 100.0% | $ | 104,349,714 | |||||
LEGEND
| (a) | Short-term investments include any security which has a remaining maturity of less than one year and investments in money market funds. |
| (b) | Non-income producing security. |
| (c) | See Note 2(J) of Notes to Financial Statements. |
| (d) | All or a portion of security is on loan. See Note 2(K) of Notes to Financial Statements. |
Percentages are stated as a percent of net assets.
See Notes to Financial Statements.
53
STATEMENTS OF ASSETS AND LIABILITIES
December 31, 2004
| (In Thousands, Except Per Share Amounts) | |||||||||||
Strong Blue Chip | Strong Discovery Fund | Strong Endeavor Fund | |||||||||
Assets: | |||||||||||
Investments in Securities, at Value (Cost of $122,567, $172,891 and $17,161, respectively) | $ | 152,109 | $ | 210,115 | $ | 20,117 | |||||
Receivable for Securities Sold | — | 450 | 279 | ||||||||
Receivable for Fund Shares Sold | 28 | 727 | 1 | ||||||||
Dividends and Interest Receivable | 223 | 18 | 14 | ||||||||
Other Assets | 50 | 25 | 3 | ||||||||
Total Assets | 152,410 | 211,335 | 20,414 | ||||||||
Liabilities: | |||||||||||
Payable for Securities Purchased | — | 416 | — | ||||||||
Payable for Fund Shares Redeemed | 1,521 | 262 | 978 | ||||||||
Payable Upon Return of Securities on Loan | — | 19,405 | — | ||||||||
Accrued Operating Expenses and Other Liabilities | 112 | 71 | 19 | ||||||||
Total Liabilities | 1,633 | 20,154 | 997 | ||||||||
Net Assets | $ | 150,777 | $ | 191,181 | $ | 19,417 | |||||
Net Assets Consist of: | |||||||||||
Capital Stock (Par Value and Paid-in Capital) | $ | 283,907 | $ | 145,731 | $ | 18,138 | |||||
Undistributed Net Investment Income (Loss) | — | — | — | ||||||||
Accumulated Net Realized Gain (Loss) | (162,671 | ) | 8,226 | (1,677 | ) | ||||||
Net Unrealized Appreciation (Depreciation) | 29,541 | 37,224 | 2,956 | ||||||||
Net Assets | $ | 150,777 | $ | 191,181 | $ | 19,417 | |||||
Capital Shares Outstanding (Unlimited Number Authorized) | 12,033 | 8,879 | 1,826 | ||||||||
Net Asset Value Per Share – Investor Class | $ | 12.53 | $ | 21.53 | $ | 10.64 | |||||
See Notes to Financial Statements.
54
STATEMENTS OF ASSETS AND LIABILITIES (continued)
December 31, 2004
| (In Thousands, Except Per Share Amounts) | ||||||||
Strong Large Cap | Strong U.S. Growth Fund | |||||||
Assets: | ||||||||
Investments in Securities, at Value (Cost of $427,382 and $45,815, respectively) | $ | 533,897 | $ | 65,789 | ||||
Receivable for Securities Sold | 3,900 | 1,455 | ||||||
Receivable for Fund Shares Sold | 207 | 213 | ||||||
Dividends and Interest Receivable | 260 | 5 | ||||||
Other Assets | 35 | 15 | ||||||
Total Assets | 538,299 | 67,477 | ||||||
Liabilities: | ||||||||
Payable for Securities Purchased | 545 | — | ||||||
Payable for Fund Shares Redeemed | 4,273 | 3,118 | ||||||
Payable Upon Return of Securities on Loan | 14,855 | — | ||||||
Accrued Operating Expenses and Other Liabilities | 195 | 42 | ||||||
Total Liabilities | 19,868 | 3,160 | ||||||
Net Assets | $ | 518,431 | $ | 64,317 | ||||
Net Assets Consist of: | ||||||||
Capital Stock (Par Value and Paid-in Capital) | $ | 889,737 | $ | 88,152 | ||||
Undistributed Net Investment Income (Loss) | — | — | ||||||
Accumulated Net Realized Gain (Loss) | (477,821 | ) | (43,809 | ) | ||||
Net Unrealized Appreciation (Depreciation) | 106,515 | 19,974 | ||||||
Net Assets | $ | 518,431 | $ | 64,317 | ||||
Capital Shares Outstanding (Unlimited Number Authorized) | 22,792 | 4,053 | ||||||
Net Asset Value Per Share – Investor Class | $ | 22.75 | $ | 15.87 | ||||
See Notes to Financial Statements.
55
STATEMENTS OF ASSETS AND LIABILITIES (continued)
December 31, 2004
(In Thousands, Except As Noted) | ||||
Strong Fund | ||||
Assets: | ||||
Investments in Securities, at Value (Cost of $265,161) | $ | 315,697 | ||
Receivable for Fund Shares Sold | 126 | |||
Dividends and Interest Receivable | 27 | |||
Other Assets | 163 | |||
Total Assets | 316,013 | |||
Liabilities: | ||||
Payable for Securities Purchased | 672 | |||
Payable for Fund Shares Redeemed | 1,737 | |||
Payable Upon Return of Securities on Loan | 32,020 | |||
Accrued Operating Expenses and Other Liabilities | 218 | |||
Total Liabilities | 34,647 | |||
Net Assets | $ | 281,366 | ||
Net Assets Consist of: | ||||
Capital Stock (Par Value and Paid-in Capital) | $ | 523,906 | ||
Undistributed Net Investment Income (Loss) | — | |||
Accumulated Net Realized Gain (Loss) | (293,076 | ) | ||
Net Unrealized Appreciation (Depreciation) | 50,536 | |||
Net Assets | $ | 281,366 | ||
Investor Class ($ and shares in full) | ||||
Net Assets | $ | 260,211,880 | ||
Capital Shares Outstanding (Unlimited Number Authorized) | 10,428,023 | |||
Net Asset Value Per Share | $ | 24.95 | ||
Institutional Class ($ and shares in full) | ||||
Net Assets | $ | 7,126,043 | ||
Capital Shares Outstanding (Unlimited Number Authorized) | 281,661 | |||
Net Asset Value Per Share | $ | 25.30 | ||
Advisor Class ($ and shares in full) | ||||
Net Assets | $ | 1,529,366 | ||
Capital Shares Outstanding (Unlimited Number Authorized) | 61,075 | |||
Net Asset Value Per Share | $ | 25.04 | ||
Class K ($ and shares in full) | ||||
Net Assets | $ | 12,498,600 | ||
Capital Shares Outstanding (Unlimited Number Authorized) | 492,812 | |||
Net Asset Value Per Share | $ | 25.36 | ||
See Notes to Financial Statements.
56
STATEMENTS OF ASSETS AND LIABILITIES (continued)
December 31, 2004
| (In Thousands, Except As Noted) | ||||
Strong Growth 20 Fund | ||||
Assets: | ||||
Investments in Securities, at Value (Cost of $109,725) | $ | 149,902 | ||
Receivable for Fund Shares Sold | 47 | |||
Dividends and Interest Receivable | 59 | |||
Other Assets | 11 | |||
Total Assets | 150,019 | |||
Liabilities: | ||||
Payable for Fund Shares Redeemed | 977 | |||
Accrued Operating Expenses and Other Liabilities | 111 | |||
Total Liabilities | 1,088 | |||
Net Assets | $ | 148,931 | ||
Net Assets Consist of: | ||||
Capital Stock (Par Value and Paid-in Capital) | $ | 464,521 | ||
Undistributed Net Investment Income (Loss) | — | |||
Accumulated Net Realized Gain (Loss) | (355,767 | ) | ||
Net Unrealized Appreciation (Depreciation) | 40,177 | |||
Net Assets | $ | 148,931 | ||
Investor Class ($ and shares in full) | ||||
Net Assets | $ | 144,535,143 | ||
Capital Shares Outstanding (Unlimited Number Authorized) | 9,844,093 | |||
Net Asset Value Per Share | $ | 14.68 | ||
Advisor Class ($ and shares in full) | ||||
Net Assets | $ | 4,396,307 | ||
Capital Shares Outstanding (Unlimited Number Authorized) | 298,125 | |||
Net Asset Value Per Share | $ | 14.75 | ||
See Notes to Financial Statements.
57
STATEMENTS OF ASSETS AND LIABILITIES (continued)
December 31, 2004
| (In Thousands) | ||||
Strong Growth Fund | ||||
Assets: | ||||
Investments in Securities, at Value (Cost of $1,166,426) | $ | 1,544,932 | ||
Receivable for Securities Sold | 5,686 | |||
Receivable for Fund Shares Sold | 1,591 | |||
Dividends and Interest Receivable | 365 | |||
Other Assets | 108 | |||
Total Assets | 1,552,682 | |||
Liabilities: | ||||
Payable for Securities Purchased | 9,950 | |||
Payable for Fund Shares Redeemed | 12,797 | |||
Payable Upon Return of Securities on Loan | 15,173 | |||
Accrued Operating Expenses and Other Liabilities | 538 | |||
Total Liabilities | 38,458 | |||
Net Assets | $ | 1,514,224 | ||
Net Assets Consist of: | ||||
Capital Stock (Par Value and Paid-in Capital) | $ | 1,830,258 | ||
Undistributed Net Investment Income (Loss) | — | |||
Accumulated Net Realized Gain (Loss) | (694,540 | ) | ||
Net Unrealized Appreciation (Depreciation) | 378,506 | |||
Net Assets | $ | 1,514,224 | ||
See Notes to Financial Statements.
58
STATEMENTS OF ASSETS AND LIABILITIES (continued)
December 31, 2004
Strong Growth Fund | |||
Investor Class | |||
Net Assets | $ | 1,146,002,206 | |
Capital Shares Outstanding (Unlimited Number Authorized) | 59,211,933 | ||
Net Asset Value Per Share | $ | 19.35 | |
Institutional Class | |||
Net Assets | $ | 294,891,588 | |
Capital Shares Outstanding (Unlimited Number Authorized) | 14,754,240 | ||
Net Asset Value Per Share | $ | 19.99 | |
Advisor Class | |||
Net Assets | $ | 6,357,036 | |
Capital Shares Outstanding (Unlimited Number Authorized) | 330,676 | ||
Net Asset Value Per Share | $ | 19.22 | |
Class C | |||
Net Assets | $ | 314,277 | |
Capital Shares Outstanding (Unlimited Number Authorized) | 16,539 | ||
Net Asset Value Per Share | $ | 19.00 | |
Class K | |||
Net Assets | $ | 66,658,415 | |
Capital Shares Outstanding (Unlimited Number Authorized) | 3,387,961 | ||
Net Asset Value Per Share | $ | 19.68 | |
See Notes to Financial Statements.
59
STATEMENTS OF ASSETS AND LIABILITIES (continued)
December 31, 2004
| (In Thousands, Except As Noted) | ||||
| Strong Large Company Growth Fund | ||||
Assets: | ||||
Investments in Securities, at Value (Cost of $92,367) | $ | 105,300 | ||
Receivable for Fund Shares Sold | 2,190 | |||
Dividends and Interest Receivable | 63 | |||
Other Assets | 12 | |||
Total Assets | 107,565 | |||
Liabilities: | ||||
Payable for Securities Purchased | 2,967 | |||
Payable for Fund Shares Redeemed | 215 | |||
Accrued Operating Expenses and Other Liabilities | 33 | |||
Total Liabilities | 3,215 | |||
Net Assets | $ | 104,350 | ||
Net Assets Consist of: | ||||
Capital Stock (Par Value and Paid-in Capital) | $ | 91,817 | ||
Undistributed Net Investment Income (Loss) | — | |||
Accumulated Net Realized Gain (Loss) | (400 | ) | ||
Net Unrealized Appreciation (Depreciation) | 12,933 | |||
Net Assets | $ | 104,350 | ||
Investor Class ($ and shares in full) | ||||
Net Assets | $ | 99,454,712 | ||
Capital Shares Outstanding (Unlimited Number Authorized) | 6,334,310 | |||
Net Asset Value Per Share | $ | 15.70 | ||
Class K ($ and shares in full) | ||||
Net Assets | $ | 4,895,002 | ||
Capital Shares Outstanding (Unlimited Number Authorized) | 309,347 | |||
Net Asset Value Per Share | $ | 15.82 | ||
See Notes to Financial Statements.
60
For the Year Ended December 31, 2004
| (In Thousands) | ||||||||||||
| Strong Blue Chip Fund | Strong Discovery Fund | Strong Endeavor Fund | ||||||||||
Income: | ||||||||||||
Dividends (net of foreign withholding taxes of $2, $2 and $2, respectively) | $ | 2,009 | $ | 412 | $ | 151 | ||||||
Interest | 61 | 77 | 6 | |||||||||
Total Income | 2,070 | 489 | 157 | |||||||||
Expenses: | ||||||||||||
Investment Advisory Fees | 758 | 1,282 | 160 | |||||||||
Administrative Fees | 455 | 427 | 64 | |||||||||
Custodian Fees | 10 | 21 | 7 | |||||||||
Shareholder Servicing Costs | 965 | 534 | 138 | |||||||||
Reports to Shareholders | 168 | 99 | 4 | |||||||||
12b-1 Fees | — | — | 53 | |||||||||
Other | 85 | 102 | 36 | |||||||||
Total Expenses before Expense Waivers and Offsets | 2,441 | 2,465 | 462 | |||||||||
Expense Waivers and Offsets (Note 4) | (54 | ) | (68 | ) | (43 | ) | ||||||
Expenses, Net | 2,387 | 2,397 | 419 | |||||||||
Net Investment Income (Loss) | (317 | ) | (1,908 | ) | (262 | ) | ||||||
Realized and Unrealized Gain (Loss): | ||||||||||||
Net Realized Gain (Loss) on Investments | 28,524 | 18,988 | 186 | |||||||||
Net Change in Unrealized Appreciation/Depreciation on Investments | (10,314 | ) | 7,878 | 2,183 | ||||||||
Net Gain (Loss) on Investments | 18,210 | 26,866 | 2,369 | |||||||||
Net Increase (Decrease) in Net Assets Resulting from Operations | $ | 17,893 | $ | 24,958 | $ | 2,107 | ||||||
See Notes to Financial Statements.
61
STATEMENTS OF OPERATIONS (continued)
For the Year Ended December 31, 2004
| (In Thousands) | ||||||||
| Strong Large Cap Growth Fund | Strong U.S. Emerging Growth Fund | |||||||
Income: | ||||||||
Dividends (net of foreign withholding taxes of $9 and $1, respectively) | $ | 4,890 | $ | 70 | ||||
Interest | 106 | 11 | ||||||
Total Income | 4,996 | 81 | ||||||
Expenses: | ||||||||
Investment Advisory Fees | 3,065 | 619 | ||||||
Administrative Fees | 1,664 | 248 | ||||||
Custodian Fees | 35 | 15 | ||||||
Shareholder Servicing Costs | 1,594 | 357 | ||||||
Reports to Shareholders | 288 | 69 | ||||||
Other | 243 | 63 | ||||||
Total Expenses before Expense Waivers and Offsets | 6,889 | 1,371 | ||||||
Expense Waivers and Offsets (Note 4) | (202 | ) | (33 | ) | ||||
Expenses, Net | 6,687 | 1,338 | ||||||
Net Investment Income (Loss) | (1,691 | ) | (1,257 | ) | ||||
Realized and Unrealized Gain (Loss): | ||||||||
Net Realized Gain (Loss) on Investments | 73,815 | 18,408 | ||||||
Net Change in Unrealized Appreciation/Depreciation on Investments | (28,242 | ) | (14,290 | ) | ||||
Net Gain (Loss) on Investments | 45,573 | 4,118 | ||||||
Net Increase (Decrease) in Net Assets Resulting from Operations | $ | 43,882 | $ | 2,861 | ||||
See Notes to Financial Statements.
62
STATEMENTS OF OPERATIONS (continued)
For the Year Ended December 31, 2004
| (In Thousands) | ||||||||||||||||
| Strong Enterprise Fund | Strong Growth 20 Fund | Strong Growth Fund | Strong Large Company Growth Fund | |||||||||||||
Income: | ||||||||||||||||
Dividends (net of foreign withholding taxes of $13, $25, $34 and $5, respectively) | $ | 835 | $ | 544 | $ | 10,914 | $ | 651 | ||||||||
Interest | 92 | 59 | 279 | 39 | ||||||||||||
Total Income | 927 | 603 | 11,193 | 690 | ||||||||||||
Expenses (Note 4): | ||||||||||||||||
Investment Advisory Fees | 2,076 | 1,267 | 11,725 | 582 | ||||||||||||
Administrative Fees | 810 | 508 | 3,856 | 231 | ||||||||||||
Custodian Fees | 30 | 15 | 107 | 11 | ||||||||||||
Shareholder Servicing Costs | 1,732 | 1,037 | 4,537 | 237 | ||||||||||||
Reports to Shareholders | 292 | 181 | 1,066 | 41 | ||||||||||||
12b-1 Fees | 4 | 12 | 23 | 187 | ||||||||||||
Other | 171 | 114 | 643 | 73 | ||||||||||||
Total Expenses before Expense Waivers and Offsets | 5,115 | 3,134 | 21,957 | 1,362 | ||||||||||||
Expense Waivers and Offsets | (153 | ) | (88 | ) | (818 | ) | (256 | ) | ||||||||
Expenses, Net | 4,962 | 3,046 | 21,139 | 1,106 | ||||||||||||
Net Investment Income (Loss) | (4,035 | ) | (2,443 | ) | (9,946 | ) | (416 | ) | ||||||||
Realized and Unrealized Gain (Loss): | ||||||||||||||||
Net Realized Gain (Loss) on: | ||||||||||||||||
Investments | 38,766 | 31,815 | 261,989 | 9,100 | ||||||||||||
Futures Contracts | — | 298 | — | 1 | ||||||||||||
Net Realized Gain (Loss) | 38,766 | 32,113 | 261,989 | 9,101 | ||||||||||||
Net Change in Unrealized Appreciation/Depreciation on Investments | 3,910 | (10,723 | ) | (70,440 | ) | 4,516 | ||||||||||
Net Gain (Loss) on Investments | 42,676 | 21,390 | 191,549 | 13,617 | ||||||||||||
Net Increase (Decrease) in Net Assets Resulting from Operations | $ | 38,641 | $ | 18,947 | $ | 181,603 | $ | 13,201 | ||||||||
See Notes to Financial Statements.
63
STATEMENTS OF CHANGES IN NET ASSETS
| (In Thousands) | ||||||||||||||||
| Strong Blue Chip Fund | Strong Discovery Fund | |||||||||||||||
| Year Ended Dec. 31, 2004 | Year Ended Dec. 31, 2003 | Year Ended Dec. 31, 2004 | Year Ended Dec. 31, 2003 | |||||||||||||
Operations: | ||||||||||||||||
Net Investment Income (Loss) | $ | (317 | ) | $ | (1,371 | ) | $ | (1,908 | ) | $ | (1,012 | ) | ||||
Net Realized Gain (Loss) | 28,524 | (20,202 | ) | 18,989 | 19,126 | |||||||||||
Net Change in Unrealized Appreciation/Depreciation | (10,314 | ) | 67,883 | 7,877 | 30,925 | |||||||||||
Net Increase (Decrease) in Net Assets Resulting from Operations | 17,893 | 46,310 | 24,958 | 49,039 | ||||||||||||
Distributions: | ||||||||||||||||
From Net Investment Income | — | — | — | (7 | ) | |||||||||||
From Net Realized Gains | — | — | (10,141 | ) | (1,805 | ) | ||||||||||
Total Distributions | — | — | (10,141 | ) | (1,812 | ) | ||||||||||
Capital Share Transactions (Note 8): | ||||||||||||||||
Net Increase (Decrease) in Net Assets from Capital Share Transactions | (43,426 | ) | (73,292 | ) | 9,571 | (13,795 | ) | |||||||||
Total Increase (Decrease) in Net Assets | (25,533 | ) | (26,982 | ) | 24,388 | 33,432 | ||||||||||
Net Assets: | ||||||||||||||||
Beginning of Year | 176,310 | 203,292 | 166,793 | 133,361 | ||||||||||||
End of Year | $ | 150,777 | $ | 176,310 | $ | 191,181 | $ | 166,793 | ||||||||
Undistributed Net Investment Income (Loss) | $ | — | $ | — | $ | — | $ | — | ||||||||
| Strong Endeavor Fund | Strong Large Cap Growth Fund | |||||||||||||||
| Year Ended Dec. 31, 2004 | Year Ended Dec. 31, 2003 | Year Ended Dec. 31, 2004 | Year Ended Dec. 31, 2003 | |||||||||||||
Operations: | ||||||||||||||||
Net Investment Income (Loss) | $ | (262 | ) | $ | (50 | ) | $ | (1,691 | ) | $ | (3,032 | ) | ||||
Net Realized Gain (Loss) | 186 | 521 | 73,815 | 36,332 | ||||||||||||
Net Change in Unrealized Appreciation/Depreciation | 2,183 | 801 | (28,242 | ) | 117,845 | |||||||||||
Net Increase (Decrease) in Net Assets Resulting from Operations | 2,107 | 1,272 | 43,882 | 151,145 | ||||||||||||
Distributions From Net Investment Income | — | — | — | — | ||||||||||||
Capital Share Transactions (Note 8): | ||||||||||||||||
Net Increase (Decrease) in Net Assets from Capital Share Transactions | 12,810 | (447 | ) | (169,582 | ) | (95,908 | ) | |||||||||
Total Increase (Decrease) in Net Assets | 14,917 | 825 | (125,700 | ) | 55,237 | |||||||||||
Net Assets: | ||||||||||||||||
Beginning of Year | 4,500 | 3,675 | 644,131 | 588,894 | ||||||||||||
End of Year | $ | 19,417 | $ | 4,500 | $ | 518,431 | $ | 644,131 | ||||||||
Undistributed Net Investment Income (Loss) | $ | — | $ | — | $ | — | $ | — | ||||||||
See Notes to Financial Statements.
64
STATEMENTS OF CHANGES IN NET ASSETS (continued)
| (In Thousands) | ||||||||
| Strong U.S. Emerging Growth Fund | ||||||||
| Year Ended Dec. 31, 2004 | Year Ended Dec. 31, 2003 | |||||||
Operations: | ||||||||
Net Investment Income (Loss) | $ | (1,257 | ) | $ | (1,325 | ) | ||
Net Realized Gain (Loss) | 18,408 | 7,047 | ||||||
Net Change in Unrealized Appreciation/Depreciation | (14,290 | ) | 26,088 | |||||
Net Increase (Decrease) in Net Assets Resulting from Operations | 2,861 | 31,810 | ||||||
Distributions From Net Investment Income | — | — | ||||||
Capital Share Transactions (Note 8): | ||||||||
Net Increase (Decrease) in Net Assets from Capital Share Transactions | (38,659 | ) | 9,891 | |||||
Total Increase (Decrease) in Net Assets | (35,798 | ) | 41,701 | |||||
Net Assets: | ||||||||
Beginning of Year | 100,115 | 58,414 | ||||||
End of Year | $ | 64,317 | $ | 100,115 | ||||
Undistributed Net Investment Income (Loss) | $ | — | $ | — | ||||
| Strong Enterprise Fund | ||||||||
| Year Ended Dec. 31, 2004 | Year Ended Dec. 31, 2003 | |||||||
Operations: | ||||||||
Net Investment Income (Loss) | $ | (4,035 | ) | $ | (3,606 | ) | ||
Net Realized Gain (Loss) | 38,766 | 41,662 | ||||||
Net Change in Unrealized Appreciation/Depreciation | 3,910 | 43,963 | ||||||
Net Increase (Decrease) in Net Assets Resulting from Operations | 38,641 | 82,019 | ||||||
Distributions From Net Investment Income | — | — | ||||||
Capital Share Transactions (Note 8): | ||||||||
Net Increase (Decrease) in Net Assets from Capital Share Transactions | (44,503 | ) | (24,147 | ) | ||||
Total Increase (Decrease) in Net Assets | (5,862 | ) | 57,872 | |||||
Net Assets: | ||||||||
Beginning of Year | 287,228 | 229,356 | ||||||
End of Year | $ | 281,366 | $ | 287,228 | ||||
Undistributed Net Investment Income (Loss) | $ | — | $ | — | ||||
See Notes to Financial Statements.
65
STATEMENTS OF CHANGES IN NET ASSETS (continued)
| (In Thousands) | ||||||||
| Strong Growth 20 Fund | ||||||||
| Year Ended Dec. 31, 2004 | Year Ended Dec. 31, 2003 | |||||||
Operations: | ||||||||
Net Investment Income (Loss) | $ | (2,443 | ) | $ | (3,998 | ) | ||
Net Realized Gain (Loss) | 32,113 | 24,865 | ||||||
Net Change in Unrealized Appreciation/Depreciation | (10,723 | ) | 43,224 | |||||
Net Increase (Decrease) in Net Assets Resulting from Operations | 18,947 | 64,091 | ||||||
Distributions From Net Investment Income | — | — | ||||||
Capital Share Transactions (Note 8): | ||||||||
Net Increase (Decrease) in Net Assets from Capital Share Transactions | (128,908 | ) | 4,591 | |||||
Total Increase (Decrease) in Net Assets | (109,961 | ) | 68,682 | |||||
Net Assets: | ||||||||
Beginning of Year | 258,892 | 190,210 | ||||||
End of Year | $ | 148,931 | $ | 258,892 | ||||
Undistributed Net Investment Income (Loss) | $ | — | $ | — | ||||
| Strong Growth Fund | ||||||||
| Year Ended Dec. 31, 2004 | Year Ended Dec. 31, 2003 | |||||||
Operations: | ||||||||
Net Investment Income (Loss) | $ | (9,946 | ) | $ | (16,286 | ) | ||
Net Realized Gain (Loss) | 261,988 | 145,925 | ||||||
Net Change in Unrealized Appreciation/Depreciation | (70,439 | ) | 320,600 | |||||
Net Increase (Decrease) in Net Assets Resulting from Operations | 181,603 | 450,239 | ||||||
Distributions From Net Investment Income | — | — | ||||||
Capital Share Transactions (Note 8): | ||||||||
Net Increase (Decrease) in Net Assets from Capital Share Transactions | (410,294 | ) | (181,638 | ) | ||||
Total Increase (Decrease) in Net Assets | (228,691 | ) | 268,601 | |||||
Net Assets: | ||||||||
Beginning of Year | 1,742,915 | 1,474,314 | ||||||
End of Year | $ | 1,514,224 | $ | 1,742,915 | ||||
Undistributed Net Investment Income (Loss) | $ | — | $ | — | ||||
See Notes to Financial Statements.
66
STATEMENTS OF CHANGES IN NET ASSETS (continued)
| (In Thousands) | ||||||||
| Strong Large Company Growth Fund | ||||||||
| Year Ended Dec. 31, 2004 | Year Ended Dec. 31, 2003 | |||||||
Operations: | ||||||||
Net Investment Income (Loss) | $ | (416 | ) | $ | (202 | ) | ||
Net Realized Gain (Loss) | 9,101 | 1,276 | ||||||
Net Change in Unrealized Appreciation/Depreciation | 4,516 | 8,628 | ||||||
Net Increase (Decrease) in Net Assets Resulting from Operations | 13,201 | 9,702 | ||||||
Distributions: | ||||||||
From Net Investment Income | ||||||||
Investor Class | — | (14 | ) | |||||
Capital Share Transactions (Note 8): | ||||||||
Net Increase (Decrease) in Net Assets from Capital Share Transactions | 19,374 | 40,712 | ||||||
Total Increase (Decrease) in Net Assets | 32,575 | 50,400 | ||||||
Net Assets: | ||||||||
Beginning of Year | 71,775 | 21,375 | ||||||
End of Year | $ | 104,350 | $ | 71,775 | ||||
Undistributed Net Investment Income (Loss) | $ | — | $ | — | ||||
See Notes to Financial Statements.
67
STRONG BLUE CHIP FUND
| Year Ended | ||||||||||||||||||||||||
| Dec. 31, 2004 | Dec. 31, 2003 | Dec. 31, 2002 | Dec. 31, 2001 | Dec. 31, 2000(b) | Oct. 31, 2000 | |||||||||||||||||||
Selected Per-Share Data(a) | ||||||||||||||||||||||||
Net Asset Value, Beginning of Period | $ | 11.12 | $ | 8.62 | $ | 12.36 | $ | 16.56 | $ | 20.99 | $ | 18.10 | ||||||||||||
Income From Investment Operations: | ||||||||||||||||||||||||
Net Investment Income (Loss) | (0.03 | ) | (0.09 | ) | (0.08 | ) | (0.06 | ) | (0.01 | ) | (0.09 | ) | ||||||||||||
Net Realized and Unrealized Gains (Losses) on Investments | 1.44 | 2.59 | (3.66 | ) | (4.14 | ) | (3.42 | ) | 2.98 | |||||||||||||||
Total from Investment Operations | 1.41 | 2.50 | (3.74 | ) | (4.20 | ) | (3.43 | ) | 2.89 | |||||||||||||||
Less Distributions: | ||||||||||||||||||||||||
From Net Realized Gains | — | — | — | — | (1.00 | ) | — | |||||||||||||||||
Total Distributions | — | — | — | — | (1.00 | ) | — | |||||||||||||||||
Net Asset Value, End of Period | $ | 12.53 | $ | 11.12 | $ | 8.62 | $ | 12.36 | $ | 16.56 | $ | 20.99 | ||||||||||||
Ratios and Supplemental Data | ||||||||||||||||||||||||
Total Return(c) | +12.68 | % | +29.00 | % | –30.26 | % | –25.36 | % | –16.43 | % | +15.97 | % | ||||||||||||
Net Assets, End of Period (In Millions) | $ | 151 | $ | 176 | $ | 203 | $ | 339 | $ | 499 | $ | 616 | ||||||||||||
Ratio of Expenses to Average Net Assets before Expense Waivers and Offsets | 1.6 | % | 1.7 | % | 1.6 | % | 1.4 | % | 1.1 | %* | 1.1 | % | ||||||||||||
Ratio of Expenses to Average Net Assets | 1.6 | % | 1.7 | % | 1.6 | % | 1.4 | % | 1.1 | %* | 1.1 | % | ||||||||||||
Ratio of Net Investment Income (Loss) to Average Net Assets | (0.2 | )% | (0.8 | )% | (0.7 | )% | (0.4 | )% | (0.2 | )%* | (0.5 | )% | ||||||||||||
Portfolio Turnover Rate | 201.8 | % | 268.5 | % | 214.0 | % | 203.9 | % | 21.2 | % | 67.9 | % | ||||||||||||
STRONG DISCOVERY FUND
| Year Ended | ||||||||||||||||||||
| Dec. 31, 2004 | Dec. 31, 2003 | Dec. 31, 2002 | Dec. 31, 2001 | Dec. 31, 2000 | ||||||||||||||||
Selected Per-Share Data(a) | ||||||||||||||||||||
Net Asset Value, Beginning of Period | $ | 19.73 | $ | 14.42 | $ | 16.84 | $ | 16.39 | $ | 18.64 | ||||||||||
Income From Investment Operations: | ||||||||||||||||||||
Net Investment Income (Loss) | (0.21 | ) | (0.12 | ) | (0.06 | ) | (0.08 | ) | 0.06 | |||||||||||
Net Realized and Unrealized Gains (Losses) on Investments | 3.22 | 5.64 | (1.91 | ) | 0.76 | 0.51 | ||||||||||||||
Total from Investment Operations | 3.01 | 5.52 | (1.97 | ) | 0.68 | 0.57 | ||||||||||||||
Less Distributions: | ||||||||||||||||||||
From Net Investment Income | — | (0.00 | )(d) | — | — | (0.04 | ) | |||||||||||||
From Net Realized Gains | (1.21 | ) | (0.21 | ) | (0.45 | ) | (0.23 | ) | (2.78 | ) | ||||||||||
Total Distributions | (1.21 | ) | (0.21 | ) | (0.45 | ) | (0.23 | ) | (2.82 | ) | ||||||||||
Net Asset Value, End of Period | $ | 21.53 | $ | 19.73 | $ | 14.42 | $ | 16.84 | $ | 16.39 | ||||||||||
Ratios and Supplemental Data | ||||||||||||||||||||
Total Return(c) | +15.69 | % | +38.34 | % | –12.12 | % | +4.17 | % | +3.97 | % | ||||||||||
Net Assets, End of Period (In Millions) | $ | 191 | $ | 167 | $ | 133 | $ | 158 | $ | 165 | ||||||||||
Ratio of Expenses to Average Net Assets before Expense Waivers and Offsets | 1.4 | % | 1.5 | % | 1.5 | % | 1.5 | % | 1.5 | % | ||||||||||
Ratio of Expenses to Average Net Assets | 1.4 | % | 1.4 | % | 1.5 | % | 1.5 | % | 1.5 | % | ||||||||||
Ratio of Net Investment Income (Loss) to Average Net Assets | (1.1 | )% | (0.7 | )% | (0.4 | )% | (0.5 | )% | 0.3 | % | ||||||||||
Portfolio Turnover Rate | 171.2 | % | 302.2 | % | 420.0 | % | 501.7 | % | 481.8 | % | ||||||||||
| * | Calculated on an annualized basis. |
| (a) | Information presented relates to a share of capital stock of the Fund outstanding for the entire period. |
| (b) | In 2000, the Fund changed its fiscal year-end from October to December. |
| (c) | Total return assumes dividend reinvestment and does not reflect the effect of sales charges. |
| (d) | Amount calculated is less than $0.005. |
See Notes to Financial Statements.
68
FINANCIAL HIGHLIGHTS (continued)
STRONG ENDEAVOR FUND
| Year Ended | ||||||||||||||||
| Dec. 31, 2004 | Dec. 31, 2003 | Dec. 31, 2002 | Dec. 31, 2001(b) | |||||||||||||
Selected Per-Share Data(a) | ||||||||||||||||
Net Asset Value, Beginning of Period | $ | 9.32 | $ | 7.03 | $ | 9.94 | $ | 10.00 | ||||||||
Income From Investment Operations: | ||||||||||||||||
Net Investment Income (Loss) | (0.14 | ) | (0.10 | ) | (0.11 | ) | (0.06 | )(c) | ||||||||
Net Realized and Unrealized Gains (Losses) on Investments | 1.46 | 2.39 | (2.80 | ) | 0.00 | (d) | ||||||||||
Total from Investment Operations | 1.32 | 2.29 | (2.91 | ) | (0.06 | ) | ||||||||||
Less Distributions: | ||||||||||||||||
From Net Investment Income | — | — | — | — | ||||||||||||
Total Distributions | — | — | — | — | ||||||||||||
Net Asset Value, End of Period | $ | 10.64 | $ | 9.32 | $ | 7.03 | $ | 9.94 | ||||||||
Ratios and Supplemental Data | ||||||||||||||||
Total Return(e) | +14.16 | % | +32.57 | % | –29.28 | % | –0.60 | % | ||||||||
Net Assets, End of Period (In Millions) | $ | 19 | $ | 5 | $ | 4 | $ | 6 | ||||||||
Ratio of Expenses to Average Net Assets before Expense Waivers and Offsets | 2.2 | % | 2.8 | % | 2.7 | % | 3.1 | %* | ||||||||
Ratio of Expenses to Average Net Assets | 2.0 | % | 1.9 | % | 1.9 | % | 2.2 | %* | ||||||||
Ratio of Net Investment Income (Loss) to Average Net Assets | (1.2 | )% | (1.1 | )% | (1.2 | )% | (1.2 | )%* | ||||||||
Portfolio Turnover Rate | 215.2 | % | 243.0 | % | 416.8 | % | 391.8 | % | ||||||||
STRONG LARGE CAP GROWTH FUND
| Year Ended | ||||||||||||||||||||||||
| Dec. 31, 2004 | Dec. 31, 2003 | Dec. 31, 2002 | Dec. 31, 2001 | Dec. 31, 2000(f) | Oct. 31, 2000 | |||||||||||||||||||
Selected Per-Share Data(a) | ||||||||||||||||||||||||
Net Asset Value, Beginning of Period | $ | 20.94 | $ | 16.51 | $ | 23.55 | $ | 34.77 | $ | 45.49 | $ | 41.52 | ||||||||||||
Income From Investment Operations: | ||||||||||||||||||||||||
Net Investment Income (Loss) | (0.07 | ) | (0.10 | ) | (0.08 | ) | (0.02 | ) | 0.01 | (0.16 | ) | |||||||||||||
Net Realized and Unrealized Gains (Losses) on Investments | 1.88 | 4.53 | (6.96 | ) | (11.20 | ) | �� | (4.81 | ) | 12.01 | ||||||||||||||
Total from Investment Operations | 1.81 | 4.43 | (7.04 | ) | (11.22 | ) | (4.80 | ) | 11.85 | |||||||||||||||
Less Distributions: | ||||||||||||||||||||||||
From Net Investment Income | — | — | — | (0.00 | )(d) | — | — | |||||||||||||||||
From Net Realized Gains | — | — | — | — | (5.92 | ) | (7.88 | ) | ||||||||||||||||
Total Distributions | — | — | — | (0.00 | )(d) | (5.92 | ) | (7.88 | ) | |||||||||||||||
Net Asset Value, End of Period | $ | 22.75 | $ | 20.94 | $ | 16.51 | $ | 23.55 | $ | 34.77 | $ | 45.49 | ||||||||||||
Ratios and Supplemental Data | ||||||||||||||||||||||||
Total Return(e) | +8.64 | % | +26.83 | % | –29.89 | % | –32.27 | % | –10.34 | % | +28.12 | % | ||||||||||||
Net Assets, End of Period (In Millions) | $ | 518 | $ | 644 | $ | 589 | $ | 976 | $ | 1,574 | $ | 1,769 | ||||||||||||
Ratio of Expenses to Average Net Assets before Expense Waivers and Offsets | 1.2 | % | 1.3 | % | 1.2 | % | 1.1 | % | 1.0 | %* | 1.0 | % | ||||||||||||
Ratio of Expenses to Average Net Assets | 1.2 | % | 1.3 | % | 1.2 | % | 1.1 | % | 1.0 | %* | 1.0 | % | ||||||||||||
Ratio of Net Investment Income (Loss) to Average Net Assets | (0.3 | )% | (0.5 | )% | (0.4 | )% | (0.1 | )% | 0.1 | %* | (0.4 | )% | ||||||||||||
Portfolio Turnover Rate | 89.0 | % | 253.4 | % | 443.2 | % | 468.7 | % | 68.6 | % | 455.0 | % | ||||||||||||
| * | Calculated on an annualized basis. |
| (a) | Information presented relates to a share of capital stock of the Fund outstanding for the entire period. |
| (b) | For the period from April 6, 2001 (inception date) to December 31, 2001. |
| (c) | Net investment income (loss) per share represents net investment income (loss) divided by average shares outstanding throughout the year. |
| (d) | Amount calculated is less than $0.005. |
| (e) | Total return assumes dividend reinvestment and does not reflect the effect of sales charges. |
| (f) | In 2000, the Fund changed its fiscal year-end from October to December. |
See Notes to Financial Statements.
69
FINANCIAL HIGHLIGHTS (continued)
STRONG U.S. EMERGING GROWTH FUND
| Year Ended | ||||||||||||||||||||
| Dec. 31, 2004 | Dec. 31, 2003 | Dec. 31, 2002 | Dec. 31, 2001 | Dec. 31, 2000 | ||||||||||||||||
Selected Per-Share Data(a) | ||||||||||||||||||||
Net Asset Value, Beginning of Period | $ | 14.90 | $ | 10.02 | $ | 15.17 | $ | 19.17 | $ | 19.59 | ||||||||||
Income From Investment Operations: | ||||||||||||||||||||
Net Investment Income (Loss) | (0.31 | ) | (0.20 | ) | (0.24 | ) | (0.23 | ) | (0.19 | ) | ||||||||||
Net Realized and Unrealized Gains (Losses) on Investments | 1.28 | 5.08 | (4.91 | ) | (3.77 | ) | 0.22 | |||||||||||||
Total from Investment Operations | 0.97 | 4.88 | (5.15 | ) | (4.00 | ) | 0.03 | |||||||||||||
Less Distributions: | ||||||||||||||||||||
From Net Investment Income | — | — | — | — | — | |||||||||||||||
From Net Realized Gains | — | — | — | — | (0.45 | ) | ||||||||||||||
Total Distributions | — | — �� | — | — | (0.45 | ) | ||||||||||||||
Net Asset Value, End of Period | $ | 15.87 | $ | 14.90 | $ | 10.02 | $ | 15.17 | $ | 19.17 | ||||||||||
Ratios and Supplemental Data | ||||||||||||||||||||
Total Return(b) | +6.51 | % | +48.70 | % | –33.95 | % | –20.87 | % | +0.29 | % | ||||||||||
Net Assets, End of Period (In Millions) | $ | 64 | $ | 100 | $ | 58 | $ | 86 | $ | 112 | ||||||||||
Ratio of Expenses to Average Net Assets before Expense Waivers and Offsets | 1.7 | % | 1.8 | % | 1.9 | % | 1.6 | % | 1.4 | % | ||||||||||
Ratio of Expenses to Average Net Assets | 1.6 | % | 1.7 | % | 1.9 | % | 1.6 | % | 1.4 | % | ||||||||||
Ratio of Net Investment Income (Loss) to Average Net Assets | (1.5 | )% | (1.6 | )% | (1.8 | )% | (1.5 | )% | (1.2 | )% | ||||||||||
Portfolio Turnover Rate | 112.3 | % | 100.3 | % | 171.5 | % | 168.2 | % | 186.8 | % | ||||||||||
| STRONG ENTERPRISE FUND — INVESTOR CLASS | ||||||||||||||||||||
| Year Ended | ||||||||||||||||||||
| Dec. 31, 2004 | Dec. 31, 2003 | Dec. 31, 2002 | Dec. 31, 2001 | Dec. 31, 2000 | ||||||||||||||||
Selected Per-Share Data(a) | ||||||||||||||||||||
Net Asset Value, Beginning of Period | $ | 21.78 | $ | 15.90 | $ | 22.14 | $ | 28.37 | $ | 41.24 | ||||||||||
Income From Investment Operations: | ||||||||||||||||||||
Net Investment Income (Loss) | (0.34 | )(c) | (0.30 | ) | (0.28 | )(c) | (0.31 | ) | (0.28 | ) | ||||||||||
Net Realized and Unrealized Gains (Losses) on Investments | 3.51 | 6.18 | (5.96 | ) | (5.92 | ) | (12.04 | ) | ||||||||||||
Total from Investment Operations | 3.17 | 5.88 | (6.24 | ) | (6.23 | ) | (12.32 | ) | ||||||||||||
Less Distributions: | ||||||||||||||||||||
From Net Investment Income | — | — | — | — | — | |||||||||||||||
From Net Realized Gains | — | — | — | — | (0.55 | ) | ||||||||||||||
Total Distributions | — | — | — | — | (0.55 | ) | ||||||||||||||
Net Asset Value, End of Period | $ | 24.95 | $ | 21.78 | $ | 15.90 | $ | 22.14 | $ | 28.37 | ||||||||||
Ratios and Supplemental Data | ||||||||||||||||||||
Total Return(b) | +14.55 | % | +36.98 | % | –28.18 | % | –21.96 | % | –29.77 | % | ||||||||||
Net Assets, End of Period (In Millions) | $ | 260 | $ | 249 | $ | 224 | $ | 372 | $ | 575 | ||||||||||
Ratio of Expenses to Average Net Assets before Expense Waivers and Offsets | 1.9 | % | 2.0 | % | 2.0 | % | 1.8 | % | 1.4 | % | ||||||||||
Ratio of Expenses to Average Net Assets | 1.9 | % | 1.8 | % | 2.0 | % | 1.8 | % | 1.4 | % | ||||||||||
Ratio of Net Investment Income (Loss) to Average Net Assets | (1.5 | )% | (1.4 | )% | (1.5 | )% | (1.2 | )% | (0.7 | )% | ||||||||||
Portfolio Turnover Rate(d) | 184.5 | % | 261.2 | % | 376.8 | % | 629.8 | % | 473.7 | % | ||||||||||
| (a) | Information presented relates to a share of capital stock of the Fund outstanding for the entire period. |
| (b) | Total return assumes dividend reinvestment and does not reflect the effect of sales charges. |
| (c) | Net investment income (loss) per share represents net investment income (loss) divided by average shares outstanding throughout the year. |
| (d) | Calculated on the basis of the Fund as a whole without distinguishing between classes of shares issued. |
See Notes to Financial Statements.
70
FINANCIAL HIGHLIGHTS (continued)
STRONG ENTERPRISE FUND — INSTITUTIONAL CLASS
| Year Ended | ||||||||
| Dec. 31, 2004 | Dec. 31, 2003(b) | |||||||
Selected Per-Share Data(a) | ||||||||
Net Asset Value, Beginning of Period | $ | 21.87 | $ | 18.34 | ||||
Income From Investment Operations: | ||||||||
Net Investment Income (Loss) | (0.11 | )(c) | (0.06 | ) | ||||
Net Realized and Unrealized Gains (Losses) on Investments | 3.54 | 3.59 | ||||||
Total from Investment Operations | 3.43 | 3.53 | ||||||
Less Distributions: | ||||||||
From Net Investment Income | — | — | ||||||
Total Distributions | — | — | ||||||
Net Asset Value, End of Period | $ | 25.30 | $ | 21.87 | ||||
Ratios and Supplemental Data | ||||||||
Total Return(d) | +15.68 | % | +19.25 | % | ||||
Net Assets, End of Period (In Millions) | $ | 7 | $ | 2 | ||||
Ratio of Expenses to Average Net Assets before Expense Waivers and Offsets | 0.9 | % | 1.2 | %* | ||||
Ratio of Expenses to Average Net Assets | 0.8 | % | 1.0 | %* | ||||
Ratio of Net Investment Income (Loss) to Average Net Assets | (0.5 | )% | (0.7 | )%* | ||||
Portfolio Turnover Rate(e) | 184.5 | % | 261.2 | % | ||||
STRONG ENTERPRISE FUND — ADVISOR CLASS
| Year Ended | ||||||||||||||||||||
| Dec. 31, 2004 | Dec. 31, 2003 | Dec. 31, 2002 | Dec. 31, 2001 | Dec. 31, 2000(f) | ||||||||||||||||
Selected Per-Share Data(a) | ||||||||||||||||||||
Net Asset Value, Beginning of Period | $ | 21.79 | $ | 15.86 | $ | 22.04 | $ | 28.31 | $ | 51.32 | ||||||||||
Income From Investment Operations: | ||||||||||||||||||||
Net Investment Income (Loss) | (0.27 | )(c) | (0.23 | ) | (0.24 | )(c) | (0.21 | ) | (0.03 | ) | ||||||||||
Net Realized and Unrealized Gains (Losses) on Investments | 3.52 | 6.16 | (5.94 | ) | (6.06 | ) | (22.43 | ) | ||||||||||||
Total from Investment Operations | 3.25 | 5.93 | (6.18 | ) | (6.27 | ) | (22.46 | ) | ||||||||||||
Less Distributions: | ||||||||||||||||||||
From Net Investment Income | — | — | — | — | — | |||||||||||||||
From Net Realized Gains | — | — | — | — | (0.55 | ) | ||||||||||||||
Total Distributions | — | — | — | — | (0.55 | ) | ||||||||||||||
Net Asset Value, End of Period | $ | 25.04 | $ | 21.79 | $ | 15.86 | $ | 22.04 | $ | 28.31 | ||||||||||
Ratios and Supplemental Data | ||||||||||||||||||||
Total Return(d) | +14.92 | % | +37.39 | % | –28.04 | % | –22.15 | % | –43.68 | % | ||||||||||
Net Assets, End of Period (In Millions) | $ | 2 | $ | 2 | $ | 1 | $ | 1 | $ | 0 | (g) | |||||||||
Ratio of Expenses to Average Net Assets before Expense Waivers and Offsets | 1.6 | % | 1.5 | % | 1.8 | % | 2.1 | % | 2.0 | %* | ||||||||||
Ratio of Expenses to Average Net Assets | 1.6 | % | 1.5 | % | 1.8 | % | 2.1 | % | 1.9 | %* | ||||||||||
Ratio of Net Investment Income (Loss) to Average Net Assets | (1.2 | )% | (1.1 | )% | (1.3 | )% | (1.6 | )% | (1.2 | )%* | ||||||||||
Portfolio Turnover Rate(e) | 184.5 | % | 261.2 | % | 376.8 | % | 629.8 | % | 473.7 | % | ||||||||||
| * | Calculated on an annualized basis. |
| (a) | Information presented relates to a share of capital stock of the Fund outstanding for the entire period. |
| (b) | For the period from June 30, 2003 (commencement of class) to December 31, 2003. |
| (c) | Net investment income (loss) per share represents net investment income (loss) divided by average shares outstanding throughout the year. |
| (d) | Total return assumes dividend reinvestment and does not reflect the effect of sales charges. |
| (e) | Calculated on the basis of the Fund as a whole without distinguishing between classes of shares issued. |
| (f) | For the period from February 24, 2000 (commencement of class) to December 31, 2000. |
| (g) | Amount is less than $500,000. |
See Notes to Financial Statements.
71
FINANCIAL HIGHLIGHTS (continued)
STRONG ENTERPRISE FUND — CLASS K
| Year Ended | ||||||||||||
| Dec. 31, 2004 | Dec. 31, 2003 | Dec. 31, 2002(b) | ||||||||||
Selected Per-Share Data(a) | ||||||||||||
Net Asset Value, Beginning of Period | $ | 21.98 | $ | 15.94 | $ | 16.32 | ||||||
Income From Investment Operations: | ||||||||||||
Net Investment Income (Loss) | (0.19 | )(c) | (0.10 | ) | (0.04 | )(c) | ||||||
Net Realized and Unrealized Gains (Losses) on Investments | 3.57 | 6.14 | (0.34 | ) | ||||||||
Total from Investment Operations | 3.38 | 6.04 | (0.38 | ) | ||||||||
Less Distributions: | ||||||||||||
From Net Investment Income | — | — | — | |||||||||
Total Distributions | — | — | — | |||||||||
Net Asset Value, End of Period | $ | 25.36 | $ | 21.98 | $ | 15.94 | ||||||
Ratios and Supplemental Data | ||||||||||||
Total Return(d) | +15.38 | % | +37.89 | % | –2.33 | % | ||||||
Net Assets, End of Period (In Millions) | $ | 12 | $ | 34 | $ | 4 | ||||||
Ratio of Expenses to Average Net Assets before Expense Waivers and Offsets | 1.3 | % | 1.3 | % | 1.3 | %* | ||||||
Ratio of Expenses to Average Net Assets | 1.1 | % | 1.2 | % | 1.1 | %* | ||||||
Ratio of Net Investment Income (Loss) to Average Net Assets | (0.8 | )% | (0.8 | )% | (0.6 | )%* | ||||||
Portfolio Turnover Rate(e) | 184.5 | % | 261.2 | % | 376.8 | % | ||||||
STRONG GROWTH 20 FUND — INVESTOR CLASS
| Year Ended | ||||||||||||||||||||
| Dec. 31, 2004 | Dec. 31, 2003 | Dec. 31, 2002 | Dec. 31, 2001 | Dec. 31, 2000 | ||||||||||||||||
Selected Per-Share Data(a) | ||||||||||||||||||||
Net Asset Value, Beginning of Period | $ | 12.96 | $ | 10.19 | $ | 14.74 | $ | 25.13 | $ | 30.63 | ||||||||||
Income From Investment Operations: | ||||||||||||||||||||
Net Investment Income (Loss) | (0.19 | )(c) | (0.17 | )(c) | (0.21 | ) | (0.15 | ) | (0.10 | ) | ||||||||||
Net Realized and Unrealized Gains (Losses) on Investments | 1.91 | 2.94 | (4.34 | ) | (10.24 | ) | (3.05 | ) | ||||||||||||
Total from Investment Operations | 1.72 | 2.77 | (4.55 | ) | (10.39 | ) | (3.15 | ) | ||||||||||||
Less Distributions: | ||||||||||||||||||||
From Net Investment Income | — | — | — | — | — | |||||||||||||||
From Net Realized Gains | — | — | — | — | (2.35 | ) | ||||||||||||||
Total Distributions | — | — | — | — | (2.35 | ) | ||||||||||||||
Net Asset Value, End of Period | $ | 14.68 | $ | 12.96 | $ | 10.19 | $ | 14.74 | $ | 25.13 | ||||||||||
Ratios and Supplemental Data | ||||||||||||||||||||
Total Return(d) | +13.27 | % | +27.18 | % | –30.87 | % | –41.35 | % | –10.33 | % | ||||||||||
Net Assets, End of Period (In Millions) | $ | 145 | $ | 253 | $ | 184 | $ | 361 | $ | 766 | ||||||||||
Ratio of Expenses to Average Net Assets before Expense Waivers and Offsets | 1.9 | % | 1.8 | % | 1.9 | % | 1.5 | % | 1.3 | % | ||||||||||
Ratio of Expenses to Average Net Assets | 1.8 | % | 1.7 | % | 1.9 | % | 1.5 | % | 1.3 | % | ||||||||||
Ratio of Net Investment Income (Loss) to Average Net Assets | (1.4 | )% | (1.5 | )% | (1.5 | )% | (0.8 | )% | (0.4 | )% | ||||||||||
Portfolio Turnover Rate(e) | 187.1 | % | 318.1 | % | 460.8 | % | 658.7 | % | 521.0 | % | ||||||||||
| * | Calculated on an annualized basis. |
| (a) | Information presented relates to a share of capital stock of the Fund outstanding for the entire period. |
| (b) | For the period from August 30, 2002 (commencement of class) to December 31, 2002. |
| (c) | Net investment income (loss) per share represents net investment income (loss) divided by average shares outstanding throughout the year. |
| (d) | Total return assumes dividend reinvestment and does not reflect the effect of sales charges. |
| (e) | Calculated on the basis of the Fund as a whole without distinguishing between classes of shares issued. |
See Notes to Financial Statements.
72
FINANCIAL HIGHLIGHTS (continued)
STRONG GROWTH 20 FUND — ADVISOR CLASS
| Year Ended | ||||||||||||||||||||
| Dec. 31, 2004 | Dec. 31, 2003 | Dec. 31, 2002 | Dec. 31, 2001 | Dec. 31, 2000(b) | ||||||||||||||||
Selected Per-Share Data(a) | ||||||||||||||||||||
Net Asset Value, Beginning of Period | $ | 12.99 | $ | 10.19 | $ | 14.69 | $ | 25.06 | $ | 36.61 | ||||||||||
Income From Investment Operations: | ||||||||||||||||||||
Net Investment Income (Loss) | (0.16 | )(c) | (0.15 | )(c) | (0.15 | ) | (0.12 | ) | (0.02 | ) | ||||||||||
Net Realized and Unrealized Gains (Losses) on Investments | 1.92 | 2.95 | (4.35 | ) | (10.25 | ) | (9.18 | ) | ||||||||||||
Total from Investment Operations | 1.76 | 2.80 | (4.50 | ) | (10.37 | ) | (9.20 | ) | ||||||||||||
Less Distributions: | ||||||||||||||||||||
From Net Investment Income | — | — | — | — | — | |||||||||||||||
From Net Realized Gains | — | — | — | — | (2.35 | ) | ||||||||||||||
Total Distributions | — | — | — | — | (2.35 | ) | ||||||||||||||
Net Asset Value, End of Period | $ | 14.75 | $ | 12.99 | $ | 10.19 | $ | 14.69 | $ | 25.06 | ||||||||||
Ratios and Supplemental Data | ||||||||||||||||||||
Total Return(d) | +13.55 | % | +27.48 | % | –30.63 | % | –41.38 | % | –25.17 | % | ||||||||||
Net Assets, End of Period (In Millions) | $ | 4 | $ | 6 | $ | 7 | $ | 10 | $ | 5 | ||||||||||
Ratio of Expenses to Average Net Assets before Expense Waivers and Offsets | 1.6 | % | 1.6 | % | 1.6 | % | 1.6 | % | 2.0 | %* | ||||||||||
Ratio of Expenses to Average Net Assets | 1.6 | % | 1.5 | % | 1.6 | % | 1.6 | % | 1.9 | %* | ||||||||||
Ratio of Net Investment Income (Loss) to Average Net Assets | (1.2 | )% | (1.3 | )% | (1.2 | )% | (0.9 | )% | (1.0 | )%* | ||||||||||
Portfolio Turnover Rate(e) | 187.1 | % | 318.1 | % | 460.8 | % | 658.7 | % | 521.0 | % | ||||||||||
| STRONG GROWTH FUND — INVESTOR CLASS | ||||||||||||||||||||
| Year Ended | ||||||||||||||||||||
| Dec. 31, 2004 | Dec. 31, 2003 | Dec. 31, 2002 | Dec. 31, 2001 | Dec. 31, 2000 | ||||||||||||||||
Selected Per-Share Data(a) | ||||||||||||||||||||
Net Asset Value, Beginning of Period | $ | 17.19 | $ | 13.21 | $ | 17.68 | $ | 27.05 | $ | 35.66 | ||||||||||
Income From Investment Operations: | ||||||||||||||||||||
Net Investment Income (Loss) | (0.13 | )(c) | (0.16 | )(c) | (0.18 | )(c) | (0.15 | ) | (0.17 | ) | ||||||||||
Net Realized and Unrealized Gains (Losses) on Investments | 2.29 | 4.14 | (4.29 | ) | (9.15 | ) | (3.21 | ) | ||||||||||||
Total from Investment Operations | 2.16 | 3.98 | (4.47 | ) | (9.30 | ) | (3.38 | ) | ||||||||||||
Less Distributions: | ||||||||||||||||||||
From Net Investment Income | — | — | — | — | — | |||||||||||||||
From Net Realized Gains | — | — | — | (0.07 | ) | (5.23 | ) | |||||||||||||
Total Distributions | — | — | — | (0.07 | ) | (5.23 | ) | |||||||||||||
Net Asset Value, End of Period | $ | 19.35 | $ | 17.19 | $ | 13.21 | $ | 17.68 | $ | 27.05 | ||||||||||
Ratios and Supplemental Data | ||||||||||||||||||||
Total Return(d) | +12.57 | % | +30.13 | % | –25.28 | % | –34.39 | % | –9.23 | % | ||||||||||
Net Assets, End of Period (In Millions) | $ | 1,146 | $ | 1,366 | $ | 1,256 | $ | 2,022 | $ | 3,411 | ||||||||||
Ratio of Expenses to Average Net Assets before Expense Waivers and Offsets | 1.5 | % | 1.5 | % | 1.6 | % | 1.4 | % | 1.2 | % | ||||||||||
Ratio of Expenses to Average Net Assets | 1.5 | % | 1.5 | % | 1.6 | % | 1.4 | % | 1.2 | % | ||||||||||
Ratio of Net Investment Income (Loss) to Average Net Assets | (0.8 | )% | (1.1 | )% | (1.2 | )% | (0.7 | )% | (0.6 | )% | ||||||||||
Portfolio Turnover Rate(e) | 91.6 | % | 138.8 | % | 248.5 | % | 399.8 | % | 366.3 | % | ||||||||||
| * | Calculated on an annualized basis. |
| (a) | Information presented relates to a share of capital stock of the Fund outstanding for the entire period. |
| (b) | For the period from February 24, 2000 (commencement of class) to December 31, 2000. |
| (c) | Net investment income (loss) per share represents net investment income (loss) divided by average shares outstanding throughout the year. |
| (d) | Total return assumes dividend reinvestment and does not reflect the effect of sales charges. |
| (e) | Calculated on the basis of the Fund as a whole without distinguishing between the classes of shares issued. |
See Notes to Financial Statements.
73
FINANCIAL HIGHLIGHTS (continued)
STRONG GROWTH FUND — INSTITUTIONAL CLASS
| Year Ended | ||||||||||||||||||||
| Dec. 31, 2004 | Dec. 31, 2003 | Dec. 31, 2002 | Dec. 31, 2001 | Dec. 31, 2000(b) | ||||||||||||||||
Selected Per-Share Data(a) | ||||||||||||||||||||
Net Asset Value, Beginning of Period | $ | 17.65 | $ | 13.48 | $ | 17.91 | $ | 27.17 | $ | 43.74 | ||||||||||
Income From Investment Operations: | ||||||||||||||||||||
Net Investment Income (Loss) | (0.03 | )(c) | (0.07 | )(c) | (0.08 | )(c) | (0.02 | ) | (0.01 | ) | ||||||||||
Net Realized and Unrealized Gains (Losses) on Investments | 2.37 | 4.24 | (4.35 | ) | (9.17 | ) | (11.33 | ) | ||||||||||||
Total from Investment Operations | 2.34 | 4.17 | (4.43 | ) | (9.19 | ) | (11.34 | ) | ||||||||||||
Less Distributions: | ||||||||||||||||||||
From Net Investment Income | — | — | — | — | — | |||||||||||||||
From Net Realized Gains | — | — | — | (0.07 | ) | (5.23 | ) | |||||||||||||
Total Distributions | — | — | — | (0.07 | ) | (5.23 | ) | |||||||||||||
Net Asset Value, End of Period | $ | 19.99 | $ | 17.65 | $ | 13.48 | $ | 17.91 | $ | 27.17 | ||||||||||
Ratios and Supplemental Data | ||||||||||||||||||||
Total Return(d) | +13.26 | % | +30.93 | % | –24.73 | % | –33.84 | % | –25.72 | % | ||||||||||
Net Assets, End of Period (In Millions) | $ | 295 | $ | 311 | $ | 195 | $ | 73 | $ | 18 | ||||||||||
Ratio of Expenses to Average Net Assets before Expense Waivers and Offsets | 0.9 | % | 0.9 | % | 0.9 | % | 0.9 | % | 0.8 | %* | ||||||||||
Ratio of Expenses to Average Net Assets | 0.9 | % | 0.9 | % | 0.9 | % | 0.9 | % | 0.8 | %* | ||||||||||
Ratio of Net Investment Income (Loss) to Average Net Assets | (0.2 | )% | (0.5 | )% | (0.5 | )% | (0.3 | )% | (0.1 | )%* | ||||||||||
Portfolio Turnover Rate(e) | 91.6 | % | 138.8 | % | 248.5 | % | 399.8 | % | 366.3 | % | ||||||||||
| STRONG GROWTH FUND — ADVISOR CLASS | ||||||||||||||||||||
| Year Ended | ||||||||||||||||||||
| Dec. 31, 2004 | Dec. 31, 2003 | Dec. 31, 2002 | Dec. 31, 2001 | Dec. 31, 2000(b) | ||||||||||||||||
Selected Per-Share Data(a) | ||||||||||||||||||||
Net Asset Value, Beginning of Period | $ | 17.09 | $ | 13.14 | $ | 17.58 | $ | 26.96 | $ | 43.74 | ||||||||||
Income From Investment Operations: | ||||||||||||||||||||
Net Investment Income (Loss) | (0.15 | )(c) | (0.16 | )(c) | (0.17 | )(c) | (0.15 | ) | (0.02 | ) | ||||||||||
Net Realized and Unrealized Gains (Losses) on Investments | 2.28 | 4.11 | (4.27 | ) | (9.16 | ) | (11.53 | ) | ||||||||||||
Total from Investment Operations | 2.13 | 3.95 | (4.44 | ) | (9.31 | ) | (11.55 | ) | ||||||||||||
Less Distributions: | ||||||||||||||||||||
From Net Investment Income | — | — | — | — | — | |||||||||||||||
From Net Realized Gains | — | — | — | (0.07 | ) | (5.23 | ) | |||||||||||||
Total Distributions | — | — | — | (0.07 | ) | (5.23 | ) | |||||||||||||
Net Asset Value, End of Period | $ | 19.22 | $ | 17.09 | $ | 13.14 | $ | 17.58 | $ | 26.96 | ||||||||||
Ratios and Supplemental Data | ||||||||||||||||||||
Total Return(d) | +12.46 | % | +30.06 | % | –25.26 | % | –34.54 | % | –26.21 | % | ||||||||||
Net Assets, End of Period (In Millions) | $ | 6 | $ | 9 | $ | 10 | $ | 14 | $ | 4 | ||||||||||
Ratio of Expenses to Average Net Assets before Expense Waivers and Offsets | 1.6 | % | 1.6 | % | 1.6 | % | 1.6 | % | 2.0 | %* | ||||||||||
Ratio of Expenses to Average Net Assets | 1.5 | % | 1.6 | % | 1.6 | % | 1.6 | % | 1.9 | %* | ||||||||||
Ratio of Net Investment Income (Loss) to Average Net Assets | (0.9 | )% | (1.1 | )% | (1.2 | )% | (1.0 | )% | (0.9 | )%* | ||||||||||
Portfolio Turnover Rate(e) | 91.6 | % | 138.8 | % | 248.5 | % | 399.8 | % | 366.3 | % | ||||||||||
| * | Calculated on an annualized basis. |
| (a) | Information presented relates to a share of capital stock of the Fund outstanding for the entire period. |
| (b) | For the period from February 24, 2000 (commencement of class) to December 31, 2000. |
| (c) | Net investment income (loss) per share represents net investment income (loss) divided by average shares outstanding throughout the year. |
| (d) | Total return assumes dividend reinvestment and does not reflect the effect of sales charges. |
| (e) | Calculated on the basis of the Fund as a whole without distinguishing between the classes of shares issued. |
��
See Notes to Financial Statements.
74
FINANCIAL HIGHLIGHTS (continued)
STRONG GROWTH FUND — CLASS C
| Year Ended | ||||||||||||
| Dec. 31, 2004 | Dec. 31, 2003 | Dec. 31, 2002(b) | ||||||||||
Selected Per-Share Data(a) | ||||||||||||
Net Asset Value, Beginning of Period | $ | 17.03 | $ | 13.21 | $ | 13.44 | ||||||
Income From Investment Operations: | ||||||||||||
Net Investment Income (Loss) | (0.30 | )(c) | (0.32 | )(c) | 0.00 | (c)(d) | ||||||
Net Realized and Unrealized Gains (Losses) on Investments | 2.27 | 4.14 | (0.23 | ) | ||||||||
Total from Investment Operations | 1.97 | 3.82 | (0.23 | ) | ||||||||
Less Distributions: | ||||||||||||
From Net Investment Income | — | — | — | |||||||||
Total Distributions | — | — | — | |||||||||
Net Asset Value, End of Period | $ | 19.00 | $ | 17.03 | $ | 13.21 | ||||||
Ratios and Supplemental Data | ||||||||||||
Total Return(e) | +11.57 | % | +28.92 | % | –1.71 | % | ||||||
Net Assets, End of Period (In Millions) | $ | 0 | (f) | $ | 1 | $ | 0 | (f) | ||||
Ratio of Expenses to Average Net Assets before Expense Waivers and Offsets | 3.4 | % | 4.3 | % | 2.3 | %* | ||||||
Ratio of Expenses to Average Net Assets | 2.4 | % | 2.5 | % | 2.3 | %* | ||||||
Ratio of Net Investment Income (Loss) to Average Net Assets | (1.7 | )% | (2.0 | )% | 0.0 | %*(d) | ||||||
Portfolio Turnover Rate(g) | 91.6 | % | 138.8 | % | 248.5 | % | ||||||
STRONG GROWTH FUND — CLASS K
| Year Ended | ||||||||||||
| Dec. 31, 2004 | Dec. 31, 2003 | Dec. 31, 2002(h) | ||||||||||
Selected Per-Share Data(a) | ||||||||||||
Net Asset Value, Beginning of Period | $ | 17.38 | $ | 13.29 | $ | 13.53 | ||||||
Income From Investment Operations: | ||||||||||||
Net Investment Income (Loss) | (0.03 | )(c) | (0.08 | )(c) | (0.01 | )(c) | ||||||
Net Realized and Unrealized Gains (Losses) on Investments | 2.33 | 4.17 | (0.23 | ) | ||||||||
Total from Investment Operations | 2.30 | 4.09 | (0.24 | ) | ||||||||
Less Distributions: | ||||||||||||
From Net Investment Income | — | — | — | |||||||||
Total Distributions | — | — | — | |||||||||
Net Asset Value, End of Period | $ | 19.68 | $ | 17.38 | $ | 13.29 | ||||||
Ratios and Supplemental Data | ||||||||||||
Total Return(e) | +13.23 | % | +30.78 | % | –1.77 | % | ||||||
Net Assets, End of Period (In Millions) | $ | 67 | $ | 56 | $ | 13 | ||||||
Ratio of Expenses to Average Net Assets before Expense Waivers and Offsets | 1.3 | % | 1.2 | % | 1.3 | %* | ||||||
Ratio of Expenses to Average Net Assets | 1.0 | % | 1.0 | % | 1.0 | %* | ||||||
Ratio of Net Investment Income (Loss) to Average Net Assets | (0.2 | )% | (0.5 | )% | (0.7 | )%* | ||||||
Portfolio Turnover Rate(g) | 91.6 | % | 138.8 | % | 248.5 | % | ||||||
| * | Calculated on an annualized basis. |
| (a) | Information presented relates to a share of capital stock of the Fund outstanding for the entire period. |
| (b) | For the period from December 26, 2002 (commencement of class) to December 31, 2002. |
| (c) | Net investment income (loss) per share represents net investment income (loss) divided by average shares outstanding throughout the year. |
| (d) | Amount calculated is less than $0.005 or 0.05%. |
| (e) | Total return assumes dividend reinvestment and does not reflect the effect of sales charges. |
| (f) | Amount is less than $500,000. |
| (g) | Calculated on the basis of the Fund as a whole without distinguishing between the classes of shares issued. |
| (h) | For the period from August 30, 2002 (commencement of class) through December 31, 2002. |
See Notes to Financial Statements.
75
FINANCIAL HIGHLIGHTS (continued)
STRONG LARGE COMPANY GROWTH FUND — INVESTOR CLASS
| Year Ended | ||||||||||||||||||||||||
| Dec. 31, 2004 | Dec. 31, 2003 | Dec. 31, 2002(b) | Sep. 30, 2002(c) | Sep. 30, 2001 | Sep. 30, 2000 | |||||||||||||||||||
Selected Per-Share Data(a) | ||||||||||||||||||||||||
Net Asset Value, Beginning of Period | $ | 13.36 | $ | 10.66 | $ | 10.25 | $ | 12.17 | $ | 19.15 | $ | 13.12 | ||||||||||||
Income From Investment Operations: | ||||||||||||||||||||||||
Net Investment Income | (0.06 | ) | (0.04 | ) | 0.00 | (d) | 0.31 | 0.32 | 0.29 | |||||||||||||||
Net Realized and Unrealized Gains (Losses) on Investments | 2.40 | (e) | 2.75 | (e) | 0.45 | (1.93 | ) | (5.09 | ) | 6.26 | ||||||||||||||
Total from Investment Operations | 2.34 | 2.71 | 0.45 | (1.62 | ) | (4.77 | ) | 6.55 | ||||||||||||||||
Less Distributions: | ||||||||||||||||||||||||
From Net Investment Income | — | (0.01 | ) | (0.04 | ) | (0.27 | ) | (0.32 | ) | (0.27 | ) | |||||||||||||
From Net Realized Gains | — | — | — | (0.03 | ) | (1.89 | ) | (0.25 | ) | |||||||||||||||
Total Distributions | — | (0.01 | ) | (0.04 | ) | (0.30 | ) | (2.21 | ) | (0.52 | ) | |||||||||||||
Net Asset Value, End of Period | $ | 15.70 | $ | 13.36 | $ | 10.66 | $ | 10.25 | $ | 12.17 | $ | 19.15 | ||||||||||||
Ratios and Supplemental Data | ||||||||||||||||||||||||
Total Return(f) | +17.51 | % | +25.41 | % | +4.38 | % | –13.69 | % | –26.22 | % | +50.67 | % | ||||||||||||
Net Assets, End of Period (In Millions) | $ | 99 | $ | 71 | $ | 21 | $ | 18 | $ | 33 | $ | 37 | ||||||||||||
Ratio of Expenses to Average Net Assets before Expense Waivers and Offsets | 1.8 | % | 1.8 | % | 1.9 | %* | 1.7 | % | 1.6 | % | 1.6 | % | ||||||||||||
Ratio of Expenses to Average Net Assets | 1.4 | % | 1.5 | % | 1.3 | %* | 1.5 | % | 1.5 | % | 1.5 | % | ||||||||||||
Ratio of Net Investment Income (Loss) to Average Net Assets | (0.5 | )% | (0.5 | )% | 0.2 | %* | 2.3 | % | 2.2 | % | 1.8 | % | ||||||||||||
Portfolio Turnover Rate(g) | 238.9 | % | 229.0 | % | 71.8 | % | 311.3 | % | 285.3 | % | 180.8 | % | ||||||||||||
STRONG LARGE COMPANY GROWTH FUND — CLASS K
| Year Ended | ||||||||
| Dec. 31, 2004 | Dec. 31, 2003(h) | |||||||
Selected Per-Share Data(a) | ||||||||
Net Asset Value, Beginning of Period | $ | 13.40 | $ | 11.96 | ||||
Income From Investment Operations: | ||||||||
Net Investment Income | (0.01 | ) | (0.00 | )(d) | ||||
Net Realized and Unrealized Gains (Losses) on Investments | 2.43 | (e) | 1.44 | (i) | ||||
Total from Investment Operations | 2.42 | 1.44 | ||||||
Less Distributions: | ||||||||
From Net Investment Income | — | — | ||||||
Total Distributions | — | — | ||||||
Net Asset Value, End of Period | $ | 15.82 | $ | 13.40 | ||||
Ratios and Supplemental Data | ||||||||
Total Return(f) | +18.06 | % | +12.04 | % | ||||
Net Assets, End of Period (In Millions) | $ | 5 | $ | 1 | ||||
Ratio of Expenses to Average Net Assets before Expense Waivers and Offsets | 1.3 | % | 2.1 | %* | ||||
Ratio of Expenses to Average Net Assets | 0.9 | % | 0.9 | %* | ||||
Ratio of Net Investment Income (Loss) to Average Net Assets | (0.1 | )% | (0.0 | )%*(d) | ||||
Portfolio Turnover Rate(g) | 238.9 | % | 229.0 | % | ||||
| * | Calculated on an annualized basis. |
| (a) | Information presented relates to a share of capital stock of the Fund outstanding for the entire period. |
| (b) | In 2002, the Fund changed its fiscal year-end from September to December. |
| (c) | Effective September 5, 2002, Strong Capital Management, Inc. assumed the investment advisory responsibilities from Rockhaven Asset Management, LLC. |
| (d) | Amount calculated is less than $0.005 or 0.05%. |
| (e) | Includes $0.01 in redemption fees (Note 2Q). |
| (f) | Total return assumes dividend reinvestment and does not reflect the effect of sales charges. |
| (g) | Calculated on the basis of the Fund as a whole without distinguishing between the classes of shares issued. |
| (h) | For the period from June 30, 2003 (commencement of class) through December 31, 2003. |
| (i) | Includes $0.02 in redemption fees (Note 2Q). |
See Notes to Financial Statements.
76
December 31, 2004
| 1. | Organization |
The accompanying financial statements represent the following Strong Growth Funds (the “Funds”), each with its own investment objectives and policies:
| • | Strong Blue Chip Fund(1) (a series fund of Strong Conservative Equity Funds, Inc.) |
| • | Strong Discovery Fund(1) (a series fund of Strong Discovery Fund, Inc.) |
| • | Strong Endeavor Fund(1) (a series fund of Strong Opportunity Fund, Inc.) |
| • | Strong Large Cap Growth Fund(1) (a series fund of Strong Large Cap Growth Fund, Inc.) |
| • | Strong U.S. Emerging Growth Fund(1) (a series fund of Strong Equity Funds, Inc.) |
| • | Strong Enterprise Fund(1) (a series fund of Strong Equity Funds, Inc.) |
| • | Strong Growth 20 Fund(2) (a series fund of Strong Equity Funds, Inc.) |
| • | Strong Growth Fund(1) (a series fund of Strong Equity Funds, Inc.) |
| • | Strong Large Company Growth Fund(1) (a series fund of Strong Equity Funds, Inc.) |
(1) Diversified Fund.
(2) Non-diversified Fund.
Each Fund is an open-end management investment company registered under the Investment Company Act of 1940, as amended (“1940 Act”).
Strong Blue Chip Fund, Strong Discovery Fund, Strong Endeavor Fund, Strong Large Cap Growth Fund, and Strong U.S. Emerging Growth Fund offer Investor Class shares. Strong Enterprise Fund offers Investor Class, Institutional Class, Advisor Class, and Class K shares. Strong Growth 20 Fund offers Investor Class and Advisor Class shares. Strong Growth Fund offers Investor Class, Institutional Class, Advisor Class, Class C, and Class K shares. Strong Large Company Growth Fund offers Investor Class and Class K shares. All classes of shares differ principally in their respective administration, transfer agent, and distribution expenses and sales charges, if any. All classes of shares have identical rights to earnings, assets, and voting privileges, except for class-specific expenses and exclusive rights to vote on matters affecting only individual classes.
Investor Class shares are available to the general public, Institutional Class shares are generally available to investors that meet certain higher initial investment minimums, Advisor Class shares and Class C shares are available only through financial professionals, and Class K shares are primarily available through retirement plans.
Effective June 30, 2003 (public launch July 1, 2003), Strong Enterprise Fund issued an additional class of shares: Institutional Class shares.
Effective June 30, 2003 (public launch July 1, 2003), Strong Large Company Growth Fund issued an additional class of shares: Class K shares.
| 2. | Significant Accounting Policies |
The following is a summary of significant accounting policies followed by the Funds in the preparation of their financial statements.
| (A) | Security Valuation — Securities of the Funds traded on a national securities exchange are valued each business day at the last sales price on that principal exchange. Securities traded on the NASDAQ Stock Market are valued each business day using the NASDAQ Official Closing Price (“NOCP”). Exchange-traded securities for which there were no transactions and NASDAQ-traded securities for which there is no NOCP are valued at the mean of the bid and ask prices. Securities for which market quotations are not readily available are fair valued as determined in good faith under the general supervision of the Funds’ Board of Directors. Some of the Fund’s portfolio securities may be listed on foreign exchanges that close before the U.S. markets and that trade on days when the U.S. markets are closed. As a result, management, under the supervision of the Funds’ Board of Directors, will consider significant events affecting foreign securities and the movements of the domestic markets that occur after the close of the foreign markets and before the time a Fund’s net asset value (“NAV”) is calculated in valuing such foreign securities. Securities that are purchased within 60 days of their stated maturity are valued at amortized cost, which approximates fair value. |
The Funds may own certain securities that are restricted as to resale. Restricted securities include Section 4(2) commercial paper, securities issued in a private placement, or securities eligible for resale pursuant to Rule 144A under the Securities Act of 1933. Restricted securities may be determined to be liquid or illiquid. Securities are deemed illiquid based upon guidelines established by the Funds’ Board of Directors. Illiquid securities are valued after giving due consideration to pertinent factors, such as recent private sales, market conditions, and the issuer’s financial performance. The Funds held no restricted and illiquid securities at December 31, 2004.
77
NOTES TO FINANCIAL STATEMENTS (continued)
December 31, 2004
| (B) | Federal Income and Excise Taxes and Distributions to Shareholders — The Funds intend to comply with the requirements of the Internal Revenue Code of 1986, as amended, applicable to regulated investment companies and to distribute substantially all of their taxable income to their shareholders in a manner which results in no tax cost to the Funds. Therefore, no federal income or excise tax provision is recorded. |
Undistributed net investment income or accumulated net realized gains for financial statement purposes may differ from what is determined for federal income tax purposes due to differences in the timing, recognition, and characterization of income, expense, and capital gain items for financial statement and tax purposes. Where appropriate, reclassifications between net asset accounts are made for such differences that are permanent in nature. The Funds may utilize earnings and profits distributed to shareholders on redemptions of shares as part of the dividends paid deduction.
Strong Discovery Fund, Strong Endeavor Fund, Strong Large Cap Growth Fund, Strong U.S. Emerging Growth Fund, Strong Enterprise Fund, Strong Growth 20 Fund, Strong Growth Fund, and Strong Large Company Growth Fund generally pay dividends from net investment income and distribute net realized capital gains, if any, at least annually. Strong Blue Chip Fund generally pays dividends from net investment income quarterly and distributes net realized capital gains, if any, at least annually.
| (C) | Realized Gains and Losses on Investment Transactions — Investment security transactions are recorded as of the trade date. Gains or losses realized on investment transactions are determined by comparing the identified cost of the security lot sold with the net sales proceeds. |
| (D) | Certain Investment Risks — The Funds may utilize derivative instruments including options, futures, and other instruments with similar characteristics to the extent that they are consistent with the Funds’ investment objectives and limitations. The Funds intend to use such derivative instruments primarily to hedge or protect itself from adverse movements in securities’ prices, foreign currencies, or interest rates. The use of these instruments involves certain risks, including the possibility that the future value of the underlying assets or indices fluctuate (in the case of futures and options), the derivative becomes illiquid, an imperfect correlation arises between the value of the derivative and the underlying assets or indices, or that the counterparty fails to perform its obligations when due. |
Investments in foreign-denominated assets or forward foreign currency contracts may involve greater risks than domestic investments such as foreign-related risks created by currency rate fluctuations, foreign political and economic instability, foreign financial reporting standards and taxes, and foreign securities markets and issuer regulation. Foreign securities may be less liquid than domestic securities.
| (E) | Futures — Upon entering into a futures contract, the Funds segregate cash and/or other liquid investments equal to the minimum “initial margin” requirements of the exchange and the futures commission merchant or broker. Each Fund designates liquid securities as collateral on open futures contracts. During the term of the futures contract, the Funds also receive credit from, or pay to, the futures commission merchant or broker an amount of cash or liquid assets equal to the daily fluctuation in the value of the futures contract. Such receipts or payments are known as “variation margin” and are recorded as unrealized gains or losses by the Funds. When the futures contract is closed, a realized gain or loss is recorded equal to the difference between the value of the futures contract at the time it was opened and the value at the time it was closed. |
| (F) | Written Options — The Funds may write put or call options. Premiums received by the Funds upon writing put or call options are recorded as an asset with a corresponding liability that is subsequently adjusted daily to the current market value of the option. Changes between the initial premiums received and the current market value of the options are recorded as unrealized gains or losses by the Funds. When a written option is closed, expired, or exercised, the Funds realize a gain or loss and the liability is eliminated. The Funds continue to bear the risk of adverse movements in the price of the underlying asset during the period of the written option, although any potential loss during the period would be reduced by the amount of the option premium received by the Funds. Each Fund designates liquid securities or cash on its books to cover its financial exposure on open written options contracts. |
| (G) | Foreign Currency Conversion — Securities and other assets and liabilities initially expressed in foreign currencies are converted daily into U.S. dollars based upon current exchange rates. Purchases and sales of foreign securities and foreign income are converted into U.S. dollars based upon currency exchange rates prevailing on the respective dates of such transactions. The effect of changes in foreign exchange rates on realized and unrealized security gains or losses is reflected as a component of such gains or losses. |
| (H) | Forward Foreign Currency Exchange Contracts — Forward foreign currency exchange contracts are valued at the forward rate and are marked-to-market daily. The change in market value is recorded as an unrealized gain or loss. When the contract is closed, the Funds record an exchange gain or loss equal to the difference between the value of the contract at the time it was opened and the value at the time it was closed. |
78
| (I) | Short Positions — The Funds may engage in short sale transactions. For financial statement purposes, an amount equal to the settlement amount is included in the Statements of Assets and Liabilities as an asset and an equivalent liability. |
The amount of the liability is subsequently marked-to-market to reflect the current value of the short position. Changes between the amount of the liability and the current market value of the short positions are recorded as unrealized gains or losses. The Funds are liable to the buyer for any dividends payable on securities while those securities are in a short position. These dividends are an expense of the Fund and are included in Other Expenses in the Statement of Operations. If the Funds sell securities short while also holding the long position in the security, they may protect unrealized gains, but will lose the opportunity to profit on such securities if the price rises. If the Funds sell securities short when not holding the long position in the security, they will experience a loss if the market price of the security increases between the date of the short sale and the date the security is replaced.
| (J) | Repurchase Agreements — The Funds may enter into repurchase agreements with institutions that the Funds’ investment advisor, Strong Capital Management, Inc. (the “Advisor”), has determined are creditworthy. Each repurchase transaction is recorded at cost, which approximates fair value. The Funds require that the collateral, represented by cash and/or securities (primarily U.S. government securities), in a repurchase transaction be maintained in a segregated account under the control of the Funds’ custodial bank in a manner sufficient to enable the Funds to liquidate those securities in the event of a default of the counterparty. On a daily basis, the Funds’ custodial bank monitors the value of the collateral, including accrued interest, to ensure it is at least equal to the amounts owed to the Funds under each repurchase agreement. |
| (K) | Securities Lending — The Funds have entered into a Securities Lending Agreement (the “Agreement”) with State Street Bank and Trust Company. Under the terms of the Agreement, the Funds may lend portfolio securities to qualified institutional borrowers in order to earn additional income. The Agreement requires that loans are collateralized at all times by cash and cash equivalents equal to at least 102% of the market value of the aggregate loaned securities, plus accrued interest, and the collateral is marked-to-market daily. Cash collateral received is invested in repurchase agreements, investment funds, government obligations, and/or bank obligations. |
At December 31, 2004, Strong Discovery Fund, Strong Large Cap Growth Fund, Strong Enterprise Fund, and Strong Growth Fund had securities with a market value of $18,976,049, $14,434,935, $31,332,604, and $14,650,246, respectively, on loan and had received $19,404,609, $14,854,959, $32,019,561, and $15,172,847, respectively, in collateral (both are included within Investments in the Statements of Assets and Liabilities). Amounts earned as interest on investments of cash collateral, net of rebates and other securities lending expenses, are included in Interest Income in the Statements of Operations. For the year ended December 31, 2004, the securities lending income totaled $35,763, $13,340, $54,275, and $37,677 for Strong Discovery Fund, Strong Large Cap Growth Fund, Strong Enterprise Fund, and Strong Growth Fund, respectively.
The three primary risks associated with securities lending are: a borrower defaulting on its obligation to return the securities loaned resulting in a shortfall on the posted collateral; a principal loss arising from the lending agent’s investment of cash collateral; and the inability of the lending Fund to recall a security in time to exercise valuable voting rights or sell the security. In each case, the lending agent has indemnified the Funds for these types of losses.
| (L) | Directed Brokerage — Through November 30, 2004, the Funds directed certain portfolio trades to brokers who, in turn, paid a portion of the Funds’ expenses not attributable to the Advisor or its affiliates. Such amounts are included in Expense Waivers and Offsets reported in the Funds’ Statements of Operations and in Note 4. |
| (M) | Earnings Credit Arrangements — Credits are earned on positive cash balances maintained in custodian accounts. |
These credits serve to reduce the custodian’s fees incurred by certain Funds and are included in Expense Waivers and Offsets reported in the Funds’ Statements of Operations and in Note 4.
| (N) | Expenses — The Funds and other affiliated Strong Funds contract for certain services on a collective basis. The majority of the expenses are directly identifiable to an individual Fund. Expenses that are not readily identifiable to a specific Fund will be allocated in such a manner as deemed equitable, taking into consideration, among other things, the nature and type of expense and the relative sizes of the Strong Funds. |
| (O) | Use of Estimates — The preparation of financial statements in conformity with accounting principles generally accepted in the United States of America requires management to make estimates and assumptions that affect the reported amounts in these financial statements. Actual results could differ from those estimates. |
| (P) | Indemnifications — In the normal course of business, the Funds enter into contracts with service providers that contain general indemnification clauses. The Funds’ maximum exposure under these arrangements is unknown, as this would involve future claims that may be made against the Funds that have not yet occurred. However, based on experience, the Funds expect the risk of material loss to be remote under any of these indemnification agreements. |
79
NOTES TO FINANCIAL STATEMENTS (continued)
December 31, 2004
| (Q) | Redemption Fees — Investor Class shares of Strong Large Company Growth Fund held for 360 calendar days or less after purchase are subject to a redemption fee of 1.00%, based on the redeemed share’s market value. Redemption fees are paid directly to the Fund. The amount collected for the period is included in Capital Stock reported in the Statements of Assets and Liabilities and in Note 8. |
| (R) | Other — Dividend income, net of applicable withholding taxes, and distributions to shareholders are recorded on the ex-dividend date. Interest income is recorded on the accrual basis and includes amortization of premiums and discounts on the interest method. Income, expenses (other than expenses attributable to a specific class), and realized and unrealized gains or losses on investments are allocated to each class of shares based on its relative shares outstanding. |
| 3. | Related Party Transactions |
The Advisor provides investment advisory and related services to the Funds. Strong Investor Services, Inc. (the “Administrator”), an affiliate of the Advisor, provides administrative, transfer agent, and related services to the Funds. Certain officers are affiliated with the Advisor and the Administrator. Investment advisory and administration fees, which are established by terms of the advisory and administration agreements, are based on the following annualized rates of the average daily net assets of the respective Fund:
| Administrative Fees | ||||||||||||||||||
| Advisory Fees | Investor Class | Institutional Class | Advisor Class | Class C | Class K | |||||||||||||
Strong Blue Chip Fund | 0.50 | % | 0.30 | % | * | * | * | * | ||||||||||
Strong Discovery Fund | 0.75 | % | 0.25 | % | * | * | * | * | ||||||||||
Strong Endeavor Fund | 0.75 | %(1) | 0.30 | % | * | * | * | * | ||||||||||
Strong Large Cap Growth Fund | 0.60 | %(2) | 0.30 | % | * | * | * | * | ||||||||||
Strong U.S. Emerging Growth Fund | 0.75 | %(1) | 0.30 | % | * | * | * | * | ||||||||||
Strong Enterprise Fund | 0.75 | %(1) | 0.30 | % | 0.02 | % | 0.30 | % | * | 0.25 | % | |||||||
Strong Growth 20 Fund | 0.75 | %(1) | 0.30 | % | * | 0.30 | % | * | * | |||||||||
Strong Growth Fund | 0.75 | %(1) | 0.30 | % | 0.02 | % | 0.30 | % | 0.30 | % | 0.25 | % | ||||||
Strong Large Company Growth Fund | 0.75 | %(1) | 0.30 | % | * | * | * | 0.25 | % | |||||||||
| * | Does not offer share class. |
| (1) | The investment advisory fees are 0.75% for assets under $4 billion, 0.725% for the next $2 billion assets, and 0.70% for assets $6 billion and above. |
| (2) | The investment advisory fees are 0.60% for first $35 million assets and 0.55% for assets over $35 million. |
The Funds’ Advisor and/or Administrator may voluntarily waive or absorb certain expenses at their discretion. The Advisor and/or Administrator has contractually agreed to waive its fees and/or absorb expenses for the Investor Class shares of the Strong Large Company Growth Fund to keep Net Annual Operating Expenses at no more than 1.50%. This agreement may only be terminated by the Board of Directors of the Funds, but not before May 1, 2005. The Advisor and/or Administrator has contractually agreed to waive and/or absorb expenses until May 1, 2005, to keep Net Annual Operating Expenses of the Investor Class of Strong Endeavor Fund and Strong Enterprise Fund at no more than 2.00%, Class C of Strong Growth Fund at no more than 2.50%, Class K of Strong Enterprise Fund at no more than 1.20% and Class K of Strong Growth Fund and Strong Large Company Growth Fund at no more than 0.99%. Pursuant to the direction of the Board and in implementation of certain regulatory settlements (as described in Note 9), the Advisor has contractually agreed to waive its fees and/or absorb expenses in the amount of 0.033% for the Funds from May 21, 2004 until May 21, 2005. However, the Funds are expected to reorganize into the Wells Fargo Fund family on April 11, 2005 and be subject to a different expense structure.
Transfer agent and related service fees for the Investor Class shares are paid at an annual rate of $27.00 for each open shareholder account and $4.20 for each closed shareholder account. Transfer agent and related service fees for the Institutional Class, Advisor Class, Class C, and Class K shares are paid at an annual rate of 0.015%, 0.20%, 0.20%, and 0.20%, respectively, of the average daily net assets of each respective class. Transfer agent fees are recorded in Shareholder Servicing Costs in the Funds’ Statements of Operations and in Note 4. The Administrator also allocates to each Fund certain charges or credits resulting from transfer agency banking activities based on each Class’ level of subscription and redemption activity. Transfer Agency Banking Charges allocated to the Funds by the Administrator, if any, are included in Other Expenses in the Funds’ Statements of Operations and in Note 4. Transfer Agency Banking Credits allocated by the Administrator, if any, serve to reduce the transfer agent expenses incurred by the Funds and are included in Expense Waivers and Offsets in the Funds’ Statements of Operations and in Note 4. The Administrator is also compensated for certain other out-of-pocket expenses related to transfer agent services.
Strong Endeavor Fund, Strong Large Company Growth Fund, Strong Enterprise Fund, Strong Growth 20 Fund, and Strong Growth Fund have adopted a Rule 12b-1 distribution and service plan under the 1940 Act on behalf of the Investor Class shares of Strong Endeavor Fund and Strong Large Company Growth Fund, the Advisor Class shares of Strong Enterprise Fund, Strong Growth 20 Fund, and Strong Growth Fund and the Class C shares of Strong Growth Fund. Under the plan, Strong Investments,
80
Inc. (the “Distributor,” and an affiliate of the Advisor) is paid an annual rate of 0.25% of the average daily net assets of the Investor Class shares and the Advisor Class shares and 1.00% for Class C shares as compensation for services provided and expenses incurred, including amounts paid to brokers or dealers, in connection with the sale of each Class’ shares. See Note 4.
Strong Growth Fund’s Class C shares have a maximum 1.00% contingent deferred sales charge if shares are sold within one year of their original purchase date. For the year ended December 31, 2004, the Distributor received aggregate contingent deferred sales charges from the redemption of Class C shares for Strong Growth Fund of $381. Sales charges are not an expense of the Funds and are not reflected in the financial statements of the Funds. Sales charges may be waived in limited circumstances.
Through December 31, 2004, Next Century Growth Investors, LLC (“Next Century Growth”), an affiliate of the Advisor, managed investments of Strong U.S. Emerging Growth Fund under a subadvisory agreement with the Advisor. Next Century Growth was compensated by the Advisor (not the Fund) and assumed all of its own expenses in providing subadvisory services.
The Funds may invest cash in money market funds managed by the Advisor, subject to certain limitations set by the Fund’s Board of Directors and applicable law.
Certain information regarding related party transactions, excluding the effects of waivers and absorptions, for the year ended December 31, 2004, is as follows:
| Payable to/ (Receivable from) Advisor or Administrator at Dec. 31, 2004 | Shareholder Servicing and Other Related Expenses | Transfer Agency Banking Charges/(Credits) | Unaffiliated Directors’ and Independent Officers’ Fees | |||||||||
Strong Blue Chip Fund | $ | 74,184 | $ | 967,601 | $ | 7,240 | $ | 6,712 | ||||
Strong Discovery Fund | 41,148 | 535,571 | 3,128 | 6,686 | ||||||||
Strong Endeavor Fund | 12,050 | 137,724 | 908 | 1,263 | ||||||||
Strong Large Cap Growth Fund | 123,575 | 1,596,566 | 10,442 | 24,318 | ||||||||
Strong U.S. Emerging Growth Fund | 24,215 | 358,444 | 3,111 | 3,536 | ||||||||
Strong Enterprise Fund | 143,490 | 1,736,854 | 8,228 | 11,174 | ||||||||
Strong Growth 20 Fund | 75,517 | 1,039,560 | 6,110 | 8,660 | ||||||||
Strong Growth Fund | 349,101 | 4,544,532 | 44,783 | 67,142 | ||||||||
Strong Large Company Growth Fund | 18,780 | 238,775 | 3,602 | 2,742 | ||||||||
| 4. | Expenses and Expense Waivers and Offsets |
For the year ended December 31, 2004, the class specific expenses are as follows:
| Administrative Fees | Shareholder Servicing Costs | Reports to Shareholders | 12b-1 Fees | Other | |||||||||||
Strong Enterprise Fund | |||||||||||||||
Investor Class | $ | 760,779 | $ | 1,692,962 | $ | 280,564 | $ | — | $ | 11,050 | |||||
Institutional Class | 784 | 596 | 1,424 | — | 1 | ||||||||||
Advisor Class | 4,813 | 3,306 | 463 | 4,011 | 62 | ||||||||||
Class K | 44,053 | 35,266 | 9,777 | — | 1,839 | ||||||||||
Strong Growth 20 Fund | |||||||||||||||
Investor Class | 494,111 | 1,027,394 | 178,921 | — | 8,082 | ||||||||||
Advisor Class | 13,817 | 9,241 | 1,938 | 11,514 | 954 | ||||||||||
Strong Growth Fund | |||||||||||||||
Investor Class | 3,626,197 | 4,358,988 | 756,013 | — | 24,879 | ||||||||||
Institutional Class | 57,419 | 43,251 | 258,885 | — | 26,236 | ||||||||||
Advisor Class | 22,461 | 15,102 | 3,227 | 18,717 | 51 | ||||||||||
Class C | 1,229 | 848 | 4,288 | 4,091 | 18 | ||||||||||
Class K | 148,903 | 119,122 | 43,793 | — | 818 | ||||||||||
Strong Large Company Growth Fund | |||||||||||||||
Investor Class | 223,944 | 231,179 | 39,580 | 186,620 | 4,969 | ||||||||||
Class K | 7,360 | 5,911 | 983 | — | 319 | ||||||||||
81
NOTES TO FINANCIAL STATEMENTS (continued)
December 31, 2004
For the year ended December 31, 2004, the expense waivers and offsets are as follows:
Expense and | Transfer Agency Banking Credits | Directed Brokerage Credits | Earnings Credits | ||||||||||||
Strong Blue Chip Fund | $ | (51,889 | ) | $ | — | $ | (1,891 | ) | $ | (129 | ) | ||||
Strong Discovery Fund | (56,602 | ) | — | (10,748 | ) | (392 | ) | ||||||||
Strong Endeavor Fund | (42,243 | ) | — | (305 | ) | (39 | ) | ||||||||
Strong Large Cap Growth Fund | (175,356 | ) | — | (25,931 | ) | (532 | ) | ||||||||
Strong U.S. Emerging Growth Fund | (27,521 | ) | — | (4,963 | ) | (161 | ) | ||||||||
Strong Enterprise Fund | |||||||||||||||
Investor Class | (16,076 | ) | — | — | — | ||||||||||
Institutional Class | (368 | ) | — | — | — | ||||||||||
Advisor Class | (172 | ) | — | — | — | ||||||||||
Class K | (26,819 | ) | — | — | — | ||||||||||
Fund Level | (81,431 | ) | — | (27,692 | ) | (355 | ) | ||||||||
Strong Growth 20 Fund | |||||||||||||||
Investor Class | (13,702 | ) | — | — | — | ||||||||||
Advisor Class | (570 | ) | — | — | — | ||||||||||
Fund Level | (46,606 | ) | — | (26,398 | ) | (271 | ) | ||||||||
Strong Growth Fund | |||||||||||||||
Investor Class | (49,280 | ) | — | — | — | ||||||||||
Institutional Class | (1,130 | ) | — | — | — | ||||||||||
Advisor Class | (713 | ) | — | — | — | ||||||||||
Class C | (3,645 | ) | — | — | — | ||||||||||
Class K | (196,509 | ) | — | — | — | ||||||||||
Fund Level | (455,946 | ) | — | (109,824 | ) | (858 | ) | ||||||||
Strong Large Company Growth Fund | |||||||||||||||
Investor Class | (205,720 | ) | — | — | — | ||||||||||
Class K | (9,980 | ) | — | — | — | ||||||||||
Fund Level | (23,285 | ) | — | (17,166 | ) | (52 | ) | ||||||||
| * | These amounts include the contractually agreed upon waivers of fees and/or absorptions of expenses for the period from May 21, 2004 thru December 31, 2004 pursuant to the direction of the Board and in implementation of certain regulatory settlements as discussed in Note 3 and in Note 9. These amounts also include reimbursement by the Advisor for the legal costs incurred by the funds for the legal and regulatory matters discussed in Note 9. |
| 5. | Line of Credit |
The Strong Funds have established a line of credit agreement (“LOC”) with certain financial institutions, which expires June 30, 2005, to be used for temporary or emergency purposes. Combined borrowings among all participating Strong Funds are subject to a $200 million cap on the total LOC. For an individual Fund, borrowings under the LOC are limited to either the lesser of 15% of the market value of the Fund’s total assets or any explicit borrowing limits in the Fund’s registration statement. The principal amount of each borrowing under the LOC is due not more than 45 days after the date of the borrowing.
Borrowings under the LOC bear interest based on prevailing market rates as defined in the LOC. A commitment fee of 0.09% per annum is incurred on the unused portion of the LOC and is allocated to all participating Strong Funds based on their net asset values. Strong Blue Chip Fund, Strong Discovery Fund, Strong Endeavor Fund, Strong Large Cap Growth Fund, Strong Growth 20 Fund, and Strong Growth Fund had no borrowings under the LOC during the period. Strong U.S. Emerging Growth Fund, Strong Enterprise Fund, and Strong Large Company Growth Fund had minimal borrowings under the LOC during the year. At December 31, 2004, there were no outstanding borrowings by the Funds under the LOC.
| 6. | Investment Transactions |
The aggregate purchases and sales of long-term securities during the year ended December 31, 2004, are as follows:
| Purchases | Sales | |||||
Strong Blue Chip Fund | $ | 299,189,769 | $ | 347,213,562 | ||
Strong Discovery Fund | 288,426,390 | 296,313,815 | ||||
Strong Endeavor Fund | 55,533,094 | 42,871,520 | ||||
Strong Large Cap Growth Fund | 488,140,487 | 661,015,584 | ||||
Strong U.S. Emerging Growth Fund | 92,206,505 | 130,830,822 | ||||
Strong Enterprise Fund | 509,701,352 | 557,478,547 | ||||
Strong Growth 20 Fund | 312,633,203 | 439,563,841 | ||||
Strong Growth Fund | 1,420,926,867 | 1,822,075,574 | ||||
Strong Large Company Growth Fund | 197,174,273 | 183,361,574 | ||||
There were no purchases or sales of long-term U.S. government securities during the year ended December 31, 2004.
82
| 7. | Income Tax Information |
The following information for the Funds is presented on an income tax basis as of December 31, 2004:
| Cost of Investments | Gross Unrealized Appreciation | Gross Unrealized (Depreciation) | Net Unrealized Investments | Distributable Ordinary Income | Distributable Long-Term Capital Gains | ||||||||||||||
Strong Blue Chip Fund | $ | 122,568,060 | $ | 29,737,854 | $ | (197,036 | ) | $ | 29,540,818 | $ | — | $ | — | ||||||
Strong Discovery Fund | 173,202,098 | 37,963,244 | (1,050,447 | ) | 36,912,797 | 3,928,236 | 4,608,244 | ||||||||||||
Strong Endeavor Fund | 17,243,847 | 3,021,446 | (148,668 | ) | 2,872,778 | — | — | ||||||||||||
Strong Large Cap Growth Fund | 430,639,167 | 106,275,818 | (3,018,016 | ) | 103,257,802 | — | — | ||||||||||||
Strong U.S. Emerging Growth Fund | 46,049,708 | 19,935,159 | (196,050 | ) | 19,739,109 | — | — | ||||||||||||
Strong Enterprise Fund | 265,834,702 | 51,533,582 | (1,671,453 | ) | 49,862,129 | — | — | ||||||||||||
Strong Growth 20 Fund | 110,452,088 | 39,667,413 | (217,651 | ) | 39,449,762 | — | — | ||||||||||||
Strong Growth Fund | 1,184,885,094 | 368,874,377 | (8,827,205 | ) | 360,047,172 | — | — | ||||||||||||
Strong Large Company Growth Fund | 92,868,432 | 13,193,769 | (761,909 | ) | 12,431,860 | — | 100,811 | ||||||||||||
The difference between cost amounts for financial statement and federal income tax purposes is due primarily to timing differences in recognizing certain gains and losses on security transactions.
The tax components of dividends paid during the years ended December 31, 2004 and 2003 and capital loss carryovers (expiring in varying amounts through 2011) as of December 31, 2004, and tax basis post-October losses as of December 31, 2004, which are not recognized for tax purposes until the first day of the following fiscal year, are:
| 2004 Income Tax Information | 2003 Income Tax Information | |||||||||||||||||
| Ordinary Income Distributions | Long-Term Capital Gains Distributions | Net Capital Loss Carryovers | Post-October Losses | Ordinary Income Distributions | Long-Term Capital Gains Distributions | |||||||||||||
Strong Blue Chip Fund | $ | — | $ | — | $ | 161,656,258 | $ | 1,014,186 | $ | — | $ | — | ||||||
Strong Discovery Fund | 2,277,341 | 7,863,798 | — | — | 1,811,805 | — | ||||||||||||
Strong Endeavor Fund | — | — | 1,593,990 | — | — | — | ||||||||||||
Strong Large Cap Growth Fund | — | — | 474,563,716 | — | — | — | ||||||||||||
Strong U.S. Emerging Growth Fund | — | — | 43,574,217 | — | — | — | ||||||||||||
Strong Enterprise Fund | — | — | 292,402,241 | — | — | — | ||||||||||||
Strong Growth 20 Fund | — | — | 355,039,307 | — | — | — | ||||||||||||
Strong Growth Fund | — | — | 676,081,394 | — | — | — | ||||||||||||
Strong Large Company Growth Fund | — | — | — | — | 14,224 | — | ||||||||||||
For corporate shareholders in the Funds, the percentage of ordinary dividend income distributed for the year ended December 31, 2004, which is designated as qualifying for the dividends-received deduction is 0.0% (unaudited).
For shareholders in the Funds, the percentage of dividend income distributed for the year ended December 31, 2004, which is designated as qualified dividend income under the Jobs and Growth Tax Relief Reconciliation Act of 2003 is 0.0% (unaudited).
Capital loss carryovers utililized during the year ended December 31, 2004 are as follows: Strong Blue Chip Fund $29,046,750, Strong Discovery Fund $0, Strong Endeavor Fund $249,696, Strong Large Cap Growth Fund $49,400,573, Strong U.S. Emerging Growth Fund $18,303,411, Strong Enterprise Fund $36,956,602, Strong Growth 20 Fund $30,639,188, Strong Growth Fund $235,730,148, and Strong Large Company Growth Fund $7,653,439.
83
NOTES TO FINANCIAL STATEMENTS (continued)
December 31, 2004
| 8. | Capital Share Transactions |
| Strong Blue Chip Fund | Strong Discovery Fund | |||||||||||||||
| Year Ended Dec. 31, 2004 | Year Ended Dec. 31, 2003 | Year Ended Dec. 31, 2004 | Year Ended Dec. 31, 2003 | |||||||||||||
Capital Share Transactions of Each of the Funds Were as Follows: | ||||||||||||||||
Proceeds from Shares Sold | $ | 15,912,520 | $ | 38,554,582 | $ | 56,324,478 | $ | 72,860,267 | ||||||||
Proceeds from Reinvestment of Distributions | — | — | 9,873,900 | 1,765,655 | ||||||||||||
Payment for Shares Redeemed | (59,338,232 | ) | (111,846,495 | ) | (56,627,640 | ) | (88,420,497 | ) | ||||||||
Net Increase (Decrease) in Net Assets from Capital Share Transactions | $ | (43,425,712 | ) | $ | (73,291,913 | ) | $ | 9,570,738 | $ | (13,794,575 | ) | |||||
Transactions in Shares of Each of the Funds Were as Follows: | ||||||||||||||||
Sold | 1,389,346 | 4,237,712 | 2,749,369 | 4,453,708 | ||||||||||||
Issued in Reinvestment of Distributions | — | — | 486,928 | 93,470 | ||||||||||||
Redeemed | (5,218,702 | ) | (11,971,115 | ) | (2,809,343 | ) | (5,340,622 | ) | ||||||||
Net Increase (Decrease) in Shares | (3,829,356 | ) | (7,733,403 | ) | 426,954 | (793,444 | ) | |||||||||
| Strong Endeavor Fund | Strong Large Cap Growth Fund | |||||||||||||||
| Year Ended Dec. 31, 2004 | Year Ended Dec. 31, 2003 | Year Ended Dec. 31, 2004 | Year Ended Dec. 31, 2003 | |||||||||||||
Capital Share Transactions of Each of the Funds Were as Follows: | ||||||||||||||||
Proceeds from Shares Sold | $ | 25,656,689 | $ | 2,761,167 | $ | 23,281,058 | $ | 119,300,083 | ||||||||
Proceeds from Reinvestment of Distributions | — | — | — | — | ||||||||||||
Payment for Shares Redeemed | (12,846,928 | ) | (3,208,236 | ) | (192,863,717 | ) | (215,208,135 | ) | ||||||||
Net Increase (Decrease) in Net Assets from Capital Share Transactions | $ | 12,809,761 | $ | (447,069 | ) | $ | (169,582,659 | ) | $ | (95,908,052 | ) | |||||
Transactions in Shares of Each of the Funds Were as Follows: | ||||||||||||||||
Sold | 2,651,582 | 352,819 | 1,096,912 | 6,748,415 | ||||||||||||
Issued in Reinvestment of Distributions | — | — | — | — | ||||||||||||
Redeemed | (1,308,723 | ) | (392,692 | ) | (9,063,690 | ) | (11,659,100 | ) | ||||||||
Net Increase (Decrease) in Shares | 1,342,859 | (39,873 | ) | (7,966,778 | ) | (4,910,685 | ) | |||||||||
84
Strong U.S. Emerging Growth Fund | ||||||||
| Year Ended Dec. 31, 2004 | Year Ended Dec. 31, 2003 | |||||||
Capital Share Transactions of the Fund Were as Follows: | ||||||||
Proceeds from Shares Sold | $ | 30,644,802 | $ | 80,614,500 | ||||
Proceeds from Reinvestment of Distributions | — | — | ||||||
Payment for Shares Redeemed | (69,304,172 | ) | (70,723,291 | ) | ||||
Net Increase (Decrease) in Net Assets from Capital Share Transactions | $ | (38,659,370 | ) | $ | 9,891,209 | |||
Transactions in Shares of the Fund Were as Follows: | ||||||||
Sold | 2,023,780 | 6,579,270 | ||||||
Issued in Reinvestment of Distributions | — | — | ||||||
Redeemed | (4,690,716 | ) | (5,686,579 | ) | ||||
Net Increase (Decrease) in Shares | (2,666,936 | ) | 892,691 | |||||
| Strong Enterprise Fund | ||||||||
| Year Ended Dec. 31, 2004 | Year Ended Dec. 31, 2003 | |||||||
| (Note 1) | ||||||||
Capital Share Transactions of Each Class of Shares of the Fund Were as Follows: | ||||||||
INVESTOR CLASS | ||||||||
Proceeds from Shares Sold | $ | 58,477,939 | $ | 57,913,922 | ||||
Proceeds from Reinvestment of Distributions | — | — | ||||||
Payment for Shares Redeemed | (82,232,803 | ) | (108,083,036 | ) | ||||
Net Increase (Decrease) in Net Assets from Capital Share Transactions | (23,754,864 | ) | (50,169,114 | ) | ||||
INSTITUTIONAL CLASS | ||||||||
Proceeds from Shares Sold | 5,292,766 | 2,440,911 | ||||||
Proceeds from Reinvestment of Distributions | — | — | ||||||
Payment for Shares Redeemed | (1,119,418 | ) | (571,699 | ) | ||||
Net Increase (Decrease) in Net Assets from Capital Share Transactions | 4,173,348 | 1,869,212 | ||||||
ADVISOR CLASS | ||||||||
Proceeds from Shares Sold | 313,237 | 794,357 | ||||||
Proceeds from Reinvestment of Distributions | — | — | ||||||
Payment for Shares Redeemed | (673,372 | ) | (860,789 | ) | ||||
Net Increase (Decrease) in Net Assets from Capital Share Transactions | (360,135 | ) | (66,432 | ) | ||||
CLASS K | ||||||||
Proceeds from Shares Sold | 5,305,094 | 27,685,600 | ||||||
Proceeds from Reinvestment of Distributions | — | — | ||||||
Payment for Shares Redeemed | (29,866,227 | ) | (3,466,148 | ) | ||||
Net Increase (Decrease) in Net Assets from Capital Share Transactions | (24,561,133 | ) | 24,219,452 | |||||
Net Increase (Decrease) in Net Assets from Capital Share Transactions | $ | (44,502,784 | ) | $ | (24,146,882 | ) | ||
85
NOTES TO FINANCIAL STATEMENTS (continued)
December 31, 2004
| Strong Enterprise Fund | ||||||
| Year Ended Dec. 31, 2004 | Year Ended Dec. 31, 2003 | |||||
| (Note 1) | ||||||
Transactions in Shares of Each Class of the Fund Were as Follows: | ||||||
INVESTOR CLASS | ||||||
Sold | 2,647,620 | 3,153,308 | ||||
Issued in Reinvestment of Distributions | — | — | ||||
Redeemed | (3,660,631 | ) | (5,809,732 | ) | ||
Net Increase (Decrease) in Shares | (1,013,011 | ) | (2,656,424 | ) | ||
INSTITUTIONAL CLASS | ||||||
Sold | 234,398 | 124,525 | ||||
Issued in Reinvestment of Distributions | — | — | ||||
Redeemed | (49,394 | ) | (27,868 | ) | ||
Net Increase (Decrease) in Shares | 185,004 | 96,657 | ||||
ADVISOR CLASS | ||||||
Sold | 13,653 | 41,765 | ||||
Issued in Reinvestment of Distributions | — | — | ||||
Redeemed | (30,106 | ) | (42,658 | ) | ||
Net Increase (Decrease) in Shares | (16,453 | ) | (893 | ) | ||
CLASS K | ||||||
Sold | 231,322 | 1,484,422 | ||||
Issued in Reinvestment of Distributions | — | — | ||||
Redeemed | (1,294,725 | ) | (174,720 | ) | ||
Net Increase (Decrease) in Shares | (1,063,403 | ) | 1,309,702 | |||
86
| Strong Growth 20 Fund | ||||||||
Year Ended Dec. 31, 2004 | Year Ended Dec. 31, 2003 | |||||||
Capital Share Transactions of Each Class of Shares of the Fund Were as Follows: | ||||||||
INVESTOR CLASS | ||||||||
Proceeds from Shares Sold | $ | 16,029,770 | $ | 215,730,444 | ||||
Proceeds from Reinvestment of Distributions | — | — | ||||||
Payment for Shares Redeemed | (143,016,698 | ) | (208,651,373 | ) | ||||
Net Increase (Decrease) in Net Assets from Capital Share Transactions | (126,986,928 | ) | 7,079,071 | |||||
ADVISOR CLASS | ||||||||
Proceeds from Shares Sold | 1,291,825 | 1,330,952 | ||||||
Proceeds from Reinvestment of Distributions | — | — | ||||||
Payment for Shares Redeemed | (3,213,182 | ) | (3,819,394 | ) | ||||
Net Increase (Decrease) in Net Assets from Capital Share Transactions | (1,921,357 | ) | (2,488,442 | ) | ||||
Net Increase (Decrease) in Net Assets from Capital Share Transactions | $ | (128,908,285 | ) | $ | 4,590,629 | |||
Transactions in Shares of Each Class of the Fund Were as Follows: | ||||||||
INVESTOR CLASS | ||||||||
Sold | 1,211,916 | 20,382,621 | ||||||
Issued in Reinvestment of Distributions | — | — | ||||||
Redeemed | (10,901,063 | ) | (18,867,469 | ) | ||||
Net Increase (Decrease) in Shares | (9,689,147 | ) | 1,515,152 | |||||
ADVISOR CLASS | ||||||||
Sold | 99,212 | 116,482 | ||||||
Issued in Reinvestment of Distributions | — | — | ||||||
Redeemed | (243,324 | ) | (323,340 | ) | ||||
Net Increase (Decrease) in Shares | (144,112 | ) | (206,858 | ) | ||||
87
NOTES TO FINANCIAL STATEMENTS (continued)
December 31, 2004
| Strong Growth Fund | ||||||||
Year Ended Dec. 31, 2004 | Year Ended Dec. 31, 2003 | |||||||
Capital Share Transactions of Each Class of Shares of the Fund Were as Follows: | ||||||||
INVESTOR CLASS | ||||||||
Proceeds from Shares Sold | $ | 95,253,378 | $ | 195,543,770 | ||||
Proceeds from Reinvestment of Distributions | — | — | ||||||
Payment for Shares Redeemed | (452,294,896 | ) | (449,810,001 | ) | ||||
Net Increase (Decrease) in Net Assets from Capital Share Transactions | (357,041,518 | ) | (254,266,231 | ) | ||||
INSTITUTIONAL CLASS | ||||||||
Proceeds from Shares Sold | 50,957,625 | 97,951,922 | ||||||
Proceeds from Reinvestment of Distributions | — | — | ||||||
Payment for Shares Redeemed | (102,489,398 | ) | (53,916,690 | ) | ||||
Net Increase (Decrease) in Net Assets from Capital Share Transactions | (51,531,773 | ) | 44,035,232 | |||||
ADVISOR CLASS | ||||||||
Proceeds from Shares Sold | 1,130,060 | 4,568,184 | ||||||
Proceeds from Reinvestment of Distributions | — | — | ||||||
Payment for Shares Redeemed | (4,859,149 | ) | (7,899,492 | ) | ||||
Net Increase (Decrease) in Net Assets from Capital Share Transactions | (3,729,089 | ) | (3,331,308 | ) | ||||
CLASS C | ||||||||
Proceeds from Shares Sold | 7,895 | 385,777 | ||||||
Proceeds from Reinvestment of Distributions | — | — | ||||||
Payment for Shares Redeemed | (240,608 | ) | (48,846 | ) | ||||
Net Increase (Decrease) in Net Assets from Capital Share Transactions | (232,713 | ) | 336,931 | |||||
CLASS K | ||||||||
Proceeds from Shares Sold | 29,280,184 | 51,582,602 | ||||||
Proceeds from Reinvestment of Distributions | — | — | ||||||
Payment for Shares Redeemed | (27,039,383 | ) | (19,995,565 | ) | ||||
Net Increase (Decrease) in Net Assets from Capital Share Transactions | 2,240,801 | 31,587,037 | ||||||
Net Increase (Decrease) in Net Assets from Capital Share Transactions | $ | (410,294,292 | ) | $ | (181,638,339 | ) | ||
88
| Strong Growth Fund | ||||||
| Year Ended Dec. 31, 2004 | Year Ended Dec. 31, 2003 | |||||
Transactions in Shares of Each Class of the Fund Were as Follows: | ||||||
INVESTOR CLASS | ||||||
Sold | 5,403,825 | 13,337,882 | ||||
Issued in Reinvestment of Distributions | — | — | ||||
Redeemed | (25,653,429 | ) | (28,947,288 | ) | ||
Net Increase (Decrease) in Shares | (20,249,604 | ) | (15,609,406 | ) | ||
INSTITUTIONAL CLASS | ||||||
Sold | 2,807,793 | 6,457,458 | ||||
Issued in Reinvestment of Distributions | — | — | ||||
Redeemed | (5,693,537 | ) | (3,285,692 | ) | ||
Net Increase (Decrease) in Shares | (2,885,744 | ) | 3,171,766 | |||
ADVISOR CLASS | ||||||
Sold | 64,603 | 304,356 | ||||
Issue | — | — | ||||
Redeemed | (277,909 | ) | (503,466 | ) | ||
Net Increase (Decrease) in Shares | (213,306 | ) | (199,110 | ) | ||
CLASS C | ||||||
Sold | 459 | 25,570 | ||||
Issue | — | — | ||||
Redeemed | (13,972 | ) | (2,959 | ) | ||
Net Increase (Decrease) in Shares | (13,513 | ) | 22,611 | |||
CLASS K | ||||||
Sold | 1,658,492 | 3,430,845 | ||||
Issue | — | — | ||||
Redeemed | (1,483,358 | ) | (1,204,449 | ) | ||
Net Increase (Decrease) in Shares | 175,134 | 2,226,396 | ||||
89
NOTES TO FINANCIAL STATEMENTS (continued)
December 31, 2004
Strong Large Company Growth Fund | ||||||||
| Year Ended Dec. 31, 2004 | Year Ended Dec. 31, 2003 | |||||||
| (Note 1) | ||||||||
Capital Share Transactions of Each Class of Shares of the Fund Were as Follows: | ||||||||
INVESTOR CLASS | ||||||||
Proceeds from Shares Sold | $ | 58,344,944 | $ | 71,224,694 | ||||
Proceeds from Reinvestment of Distributions | — | 12,085 | ||||||
Proceeds from Redemption Fees | 63,114 | 30,740 | ||||||
Payment for Shares Redeemed | (42,348,813 | ) | (31,528,112 | ) | ||||
Net Increase (Decrease) in Net Assets from Capital Share Transactions | 16,059,245 | 39,739,407 | ||||||
CLASS K | ||||||||
Proceeds from Shares Sold | 3,776,093 | 1,000,551 | ||||||
Proceeds from Reinvestment of Distributions | — | — | ||||||
Proceeds from Redemption Fees | 2,450 | 626 | ||||||
Payment for Shares Redeemed | (463,462 | ) | (28,718 | ) | ||||
Net Increase (Decrease) in Net Assets from Capital Share Transactions | 3,315,081 | 972,459 | ||||||
Net Increase (Decrease) in Net Assets from Capital Share Transactions | $ | 19,374,326 | $ | 40,711,866 | ||||
Transactions in Shares of Each Class of the Fund Were as Follows: | ||||||||
INVESTOR CLASS | ||||||||
Sold | 4,080,224 | 5,804,010 | ||||||
Issued in Reinvestment of Distributions | — | 1,118 | ||||||
Redeemed | (3,042,496 | ) | (2,514,076 | ) | ||||
Net Increase (Decrease) in Shares | 1,037,728 | 3,291,052 | ||||||
CLASS K | ||||||||
Sold | 265,582 | 78,792 | ||||||
Issued in Reinvestment of Distributions | — | — | ||||||
Redeemed | (32,837 | ) | (2,190 | ) | ||||
Net Increase (Decrease) in Shares | 232,745 | 76,602 | ||||||
90
| 9. | Legal and Regulatory Matters |
On or about May 20, 2004, the Advisor, the Administrator, and the Distributor (collectively, “Strong”), former chairman Richard S. Strong, and two employees of Strong entered into agreements with the Securities and Exchange Commission (“SEC”), the New York Attorney General (“NYAG”), the State of Wisconsin Department of Justice (the Wisconsin Attorney General), and the Wisconsin Department of Financial Institutions representing a settlement of all the market-timing investigations of Strong and certain affiliates by these agencies. In the settlements, Strong, without admitting or denying the findings in any of the orders, consented to entries of cease and desist orders and injunctive relief relating to breaches of their fiduciary duties and violations of state and federal securities laws, including anti-fraud provisions. The settlements require the Advisor to pay $40 million in investor restoration and $40 million in civil penalties. The settlements require Mr. Strong to pay $30 million in investor restoration and $30 million in civil penalties. The NYAG settlement also requires Strong or its successor to reduce fees for all Funds (except money market funds and certain very short-term income funds) by an aggregate of at least $7 million a year for five years. Separately, the Board of Directors of the Strong Funds and the Advisor have agreed that the Advisor may allocate such fee and/or expense reductions in a manner it deems reasonable, provided that (i) each applicable Fund shall participate in such fee reduction, (ii) each Fund that was impacted by market timing related to the settlements shall receive a fee reduction of at least 0.025% each year, (iii) such fee reduction shall be taken after giving effect to all waivers and reimbursements currently in effect, and (iv) fees and expenses shall not subsequently be increased without prior Board approval. Additionally, the settlements require, among other things: 1) retention of an independent consultant to develop a payment plan for the amount of investor restoration; 2) the services of an independent compliance consultant to conduct a periodic review of Strong’s compliance policies and procedures; and 3) enhanced corporate governance policies for the Strong Funds. The NYAG settlement also requires: 1) the retention of a senior officer to assist the Board in monitoring compliance and reviewing fee arrangements; and 2) additional fee disclosure to investors in the Funds. Strong and Mr. Strong, and not the investors in any Strong Fund, will bear all the costs of complying with the settlements, including restoration, civil penalties, and associated legal fees stemming from these regulatory proceedings. Strong has not yet determined if the investor restoration or civil penalties will create any financial benefit to the Strong Funds.
Strong has received one or more subpoenas or requests for information from the West Virginia Attorney General and other regulatory agencies requesting documents, if any, related to market timing and late trading practices. Strong is aware of multiple outstanding class and derivative actions (“Actions”) filed since September 4, 2003, against Strong, Strong Funds, Strong Financial Corporation, Strong Investments, Inc., Strong affiliates, and certain of their employees, officers, directors, and others as defendants in certain federal and state courts with respect to factual matters referenced in the NYAG settlement. On February 20, 2004, the United States Judicial Panel for Multi District Litigation (“MDL”) ordered the transfer of most of the Actions to the District of Maryland so those cases involving Strong could be coordinated and consolidated into one or two actions covered by a single complaint (“MDL Consolidated Actions”). The MDL ordered all or most of the other federal court Actions and certain state court Actions involving Strong to be consolidated into no more than three actions and be heard by the District of Maryland court. On September 30, 2004, three consolidated amended complaints were filed in the District of Maryland court. The Actions generally allege, among other things, that the defendants violated their fiduciary duty to fund shareholders and certain retirement plan participants, and made false and misleading statements in the funds’ prospectuses in violation of federal and state securities laws. The Actions generally seek one or more of the following: compensatory damages, punitive damages, special damages, exemplary damages, rescission, restitution, payment of plaintiffs’ attorneys’ fees and experts’ fees, and/or replacement of the Board of Directors of the Strong Funds. Certain state Actions were not consolidated into the MDL Consolidated Actions and proceedings in these state court Actions have been or may be stayed or proceed independently of the MDL Consolidated Actions.
The Strong Funds will not bear any costs incurred in connection with these Actions. Based on currently available information, Strong believes that the Actions will not have a material adverse financial impact on the Strong Funds, and are not likely to materially affect Strong’s ability to provide investment management services to its clients, including the Strong Funds. The Funds may experience increased redemptions or a decrease in new sales of shares as a result of the regulatory settlements and the ongoing Actions, which could result in increased transaction costs and operating expenses, or otherwise negatively impact the Strong Funds.
| 10. | Pending Fund Merger |
On May 26, 2004, Strong Financial Corporation (“SFC”) announced that it reached a definitive agreement with Wells Fargo & Company (“Wells Fargo”) for Wells Fargo to acquire certain assets of SFC and certain of its affiliates, including the Advisor. As part of the transaction, Fund shareholders met on December 10, 2004 or December 22, 2004 on various matters including appointing Wells Fargo Funds Management, LLC, a wholly owned subsidiary of Wells Fargo, as a new investment advisor for the Strong Funds. A reorganization of the Strong Funds into the Wells Fargo Funds family is anticipated to take place in April 2005.
91
REPORT OF INDEPENDENT REGISTERED PUBLIC ACCOUNTING FIRM
The Board of Directors and Shareholders of
Strong Growth Funds:
We have audited the accompanying statements of assets and liabilities of Strong Blue Chip Fund, Strong Discovery Fund, Strong Endeavor Fund, Strong Large Cap Growth Fund, Strong U.S. Emerging Growth Fund, Strong Enterprise Fund, Strong Growth 20 Fund, Strong Growth Fund and Strong Large Company Growth Fund (all nine collectively constituting Strong Growth Funds, hereafter referred to as the “Funds”), including the schedules of investments, as of December 31, 2004, and the related statements of operations for the year then ended, the statements of changes in net assets for the year then ended, and the financial highlights for the year then ended. These financial statements and financial highlights are the responsibility of the Company’s management. Our responsibility is to express an opinion on these financial statements and financial highlights based on our audits. The statement of changes in net assets for the period ended December 31, 2003 and the financial highlights for each of the years or periods ended December 31, 2003, and prior, were audited by other auditors whose report thereon dated February 3, 2004 expressed an unqualified opinion on those financial statements.
We conducted our audits in accordance with the standards of the Public Company Accounting Oversight Board (United States). Those standards require that we plan and perform the audit to obtain reasonable assurance about whether the financial statements and financial highlights are free of material misstatement. An audit includes examining, on a test basis, evidence supporting the amounts and disclosures in the financial statements. Our procedures included confirmation of securities owned as of December 31, 2004, by correspondence with the custodian and brokers or by other appropriate auditing procedures. An audit also includes assessing the accounting principles used and significant estimates made by management, as well as evaluating the overall financial statement presentation. We believe that our audits provide a reasonable basis for our opinion.
In our opinion, the financial statements and financial highlights referred to above present fairly, in all material respects, the financial position of the Funds as of December 31, 2004, the results of their operations for the year then ended, the changes in their net assets for the year then ended, and the financial highlights for the year then ended, in conformity with U.S. generally accepted accounting principles.
/s/ KPMG LLP
Chicago, Illinois
February 14, 2005
92
| December 31, 2004 |
Results of Special Meeting of Shareholders of Strong Blue Chip Fund
At a Special Meeting of the Shareholders of the Fund held on December 10, 2004, shareholders approved the following proposals: To approve the reorganization of the Strong Blue Chip Fund into the Wells Fargo Advantage Large Company Growth Fund.
For | Against | Abstain | ||
6,811,915.763 | 211,070.695 | 132,524.389 |
To approve an interim advisory agreement with Wells Fargo Funds Management, LLC.
For | Against | Abstain | ||
6,799,803.121 | 205,433.514 | 150,274.212 |
To approve an interim sub-advisory agreement with Peregrine Capital Management, Inc.
For | Against | Abstain | ||
6,780,321.462 | 220,311.452 | 154,877.933 |
Appointment of Messrs. Phillip O. Peterson, William F. Vogt, and Gordon B. Greer as Trustees of the Liquidating Trust, which is referenced in the Agreement and Plan of Reorganization.
For | Against | Abstain | ||
7,155,510.847 | — | — |
Results of Special Meeting of Shareholders of Strong Discovery Fund
At a Special Meeting of the Shareholders of the Fund held on December 10, 2004, shareholders approved the following proposals: To approve the reorganization of the Strong Discovery Fund into the Wells Fargo Advantage Discovery Fund.
For | Against | Abstain | ||
4,518,362.083 | 208,405.514 | 113,218.806 |
To approve an interim advisory agreement with Wells Fargo Funds Management, LLC.
For | Against | Abstain | ||
4,491,694.763 | 223,560.385 | 124,731.255 |
To approve an interim sub-advisory agreement with Wells Capital Management Incorporated.
For | Against | Abstain | ||
4,481,099.104 | 226,992.449 | 131,894.850 |
Appointment of Messrs. Phillip O. Peterson, William F. Vogt, and Gordon B. Greer as Trustees of the Liquidating Trust, which is referenced in the Agreement and Plan of Reorganization.
For | Against | Abstain | ||
4,839,986.403 | — | — |
Results of Special Meeting of Shareholders of Strong Endeavor Fund
At a Special Meeting of the Shareholders of the Fund held on December 10, 2004, shareholders approved the following proposals: To approve the reorganization of the Strong Endeavor Fund into the Wells Fargo Advantage Capital Growth Fund.
For | Against | Abstain | ||
1,929,267.145 | 6,444.512 | 1,395.188 |
To approve an interim advisory agreement with Wells Fargo Funds Management, LLC.
For | Against | Abstain | ||
1,929,033.500 | 7,164.851 | 908.494 |
93
RESULTS OF SHAREHOLDERS MEETINGS (Unaudited) (continued) | December 31, 2004 |
To approve an interim sub-advisory agreement with Wells Capital Management Incorporated.
For | Against | Abstain | ||
1,929,753.839 | 6,444.512 | 908.494 |
Appointment of Messrs. Phillip O. Peterson, William F. Vogt, and Gordon B. Greer as Trustees of the Liquidating Trust, which is referenced in the Agreement and Plan of Reorganization.
For | Against | Abstain | ||
1,937,106.845 | — | — |
Results of Special Meeting of Shareholders of Strong Large Cap Growth Fund
At a Special Meeting of the Shareholders of the Fund held on December 10, 2004, shareholders approved the following proposals: To approve the reorganization of the Strong Large Cap Growth Fund into the Wells Fargo Advantage Large Cap Growth Fund.
For | Against | Abstain | ||
15,846,343.032 | 490,055.107 | 264,559.511 |
To approve an interim advisory agreement with Wells Fargo Funds Management, LLC.
For | Against | Abstain | ||
15,802,770.852 | 492,068.386 | 306,118.412 |
To approve an interim sub-advisory agreement with Wells Capital Management Incorporated.
For | Against | Abstain | ||
15,774,762.555 | 509,132.408 | 317,062.687 |
Appointment of Messrs. Phillip O. Peterson, William F. Vogt, and Gordon B. Greer as Trustees of the Liquidating Trust, which is referenced in the Agreement and Plan of Reorganization.
For | Against | Abstain | ||
16,600,957.650 | — | — |
Results of Special Meeting of Shareholders of Strong U.S. Emerging Growth Fund
At a Special Meeting of the Shareholders of the Fund held on December 22, 2004, shareholders approved the following proposals: To approve the reorganization of the Strong U.S. Emerging Growth Fund into the Wells Fargo Advantage Small Cap Growth Fund.
For | Against | Abstain | ||
2,458,514.508 | 75,634.110 | 54,623.712 |
To approve an interim advisory agreement with Wells Fargo Funds Management, LLC.
For | Against | Abstain | ||
2,450,436.494 | 79,084.048 | 59,251.788 |
To approve an interim sub-advisory agreement with Wells Capital Management Incorporated.
For | Against | Abstain | ||
2,446,469.053 | 81,661.305 | 60,641.972 |
Appointment of Messrs. Phillip O. Peterson, William F. Vogt, and Gordon B. Greer as Trustees of the Liquidating Trust, which is referenced in the Agreement and Plan of Reorganization.
For | Against | Abstain | ||
2,588,772.330 | — | — |
94
Results of Special Meeting of Shareholders of Strong Enterprise Fund
At a Special Meeting of the Shareholders of the Fund held on December 10, 2004, shareholders approved the following proposals: To approve the reorganization of the Strong Enterprise Fund into the Wells Fargo Advantage Enterprise Fund.
For | Against | Abstain | ||
6,687,917.363 | 225,948.205 | 135,768.964 |
To approve an interim advisory agreement with Wells Fargo Funds Management, LLC.
For | Against | Abstain | ||
6,646,973.052 | 249,712.226 | 152,949.254 |
To approve an interim sub-advisory agreement with Wells Capital Management Incorporated.
For | Against | Abstain | ||
6,631,427.780 | 254,732.841 | 163,473.911 |
Appointment of Messrs. Phillip O. Peterson, William F. Vogt, and Gordon B. Greer as Trustees of the Liquidating Trust, which is referenced in the Agreement and Plan of Reorganization.
For | Against | Abstain | ||
7,049,634.532 | — | — |
Results of Special Meeting of Shareholders of Strong Growth 20 Fund
At a Special Meeting of the Shareholders of the Fund held on December 10, 2004, shareholders approved the following proposals: To approve the reorganization of the Strong Growth 20 Fund into the Wells Fargo Advantage Growth Fund.
For | Against | Abstain | ||
5,533,701.257 | 203,769.299 | 215,176.854 |
To approve an interim advisory agreement with Wells Fargo Funds Management, LLC.
For | Against | Abstain | ||
5,494,401.613 | 216,006.698 | 242,239.099 |
To approve an interim sub-advisory agreement with Wells Capital Management Incorporated.
For | Against | Abstain | ||
5,499,220.107 | 216,035.623 | 237,391.680 |
Appointment of Messrs. Phillip O. Peterson, William F. Vogt, and Gordon B. Greer as Trustees of the Liquidating Trust, which is referenced in the Agreement and Plan of Reorganization.
For | Against | Abstain | ||
5,952,647.410 | — | — |
Results of Special Meeting of Shareholders of Strong Growth Fund
At a Special Meeting of the Shareholders of the Fund held on December 10, 2004, shareholders approved the following proposals: To approve the reorganization of the Strong Growth Fund into the Wells Fargo Advantage Growth Fund.
For | Against | Abstain | ||
47,034,675.672 | 1,185,781.208 | 744,280.706 |
To approve an interim advisory agreement with Wells Fargo Funds Management, LLC.
For | Against | Abstain | ||
46,890,361.599 | 1,221,651.791 | 852,724.196 |
95
RESULTS OF SHAREHOLDERS MEETINGS (Unaudited) (continued) | December 31, 2004 |
To approve an interim sub-advisory agreement with Wells Capital Management Incorporated.
For | Against | Abstain | ||
46,815,360.747 | 1,260,105.361 | 889,271.478 |
Appointment of Messrs. Phillip O. Peterson, William F. Vogt, and Gordon B. Greer as Trustees of the Liquidating Trust, which is referenced in the Agreement and Plan of Reorganization.
For | Against | Abstain | ||
48,964,737.586 | — | — |
Results of Special Meeting of Shareholders of Strong Large Company Growth Fund
At a Special Meeting of the Shareholders of the Fund held on December 10, 2004, shareholders approved the following proposals: To approve the reorganization of the Strong Large Company Growth Fund into the Wells Fargo Advantage Capital Growth Fund.
For | Against | Abstain | ||
3,054,662.215 | 83,443.902 | 59,998.294 |
To approve an interim advisory agreement with Wells Fargo Funds Management, LLC.
For | Against | Abstain | ||
3,042,618.212 | 90,391.353 | 65,094.846 |
To approve an interim sub-advisory agreement with Wells Capital Management Incorporated.
For | Against | Abstain | ||
3,043,733.137 | 86,473.909 | 67,897.365 |
Appointment of Messrs. Phillip O. Peterson, William F. Vogt, and Gordon B. Greer as Trustees of the Liquidating Trust, which is referenced in the Agreement and Plan of Reorganization.
For | Against | Abstain | ||
3,198,104.411 | — | — |
96
Each officer and director holds the same position with the 27 registered open-end management investment companies consisting of 70 mutual funds (“Strong Funds”).
Willie D. Davis (DOB 7-24-34), Director of the Strong Funds since July 1994.
Mr. Davis has been President and Chief Executive Officer of All Pro Broadcasting, Inc., since 1977; Director of Wisconsin Energy Corporation (formerly WICOR, Inc., a utility company) since 1990, Metro-Goldwyn-Mayer, Inc. (an entertainment company) since 1998, Checker’s Drive-In Restaurants, Inc. (formerly Rally’s Hamburgers, Inc.) since 1994, Johnson Controls, Inc. (an automotive systems and facility management company) since 1992, MGM Mirage (formerly MGM Grand, Inc., an entertainment/hotel company) since 1990, Dow Chemical Company since 1988, Sara Lee Corporation (a food/consumer products company) since 1983, Alliance Bank since 1980, Manpower, Inc. (a worldwide provider of staffing services) since 2001, Bassett Furniture Industries, Inc. from 1997 to December 2004, and Kmart Corporation (a discount consumer products company) from 1985 to 2003; and Trustee of the University of Chicago since 1980 and Marquette University since 1988.
Gordon B. Greer (DOB 2-17-32), Director of the Strong Funds since March 2002.
Mr. Greer was Of Counsel for Bingham McCutchen LLP (a law firm previously known as Bingham Dana LLP) from 1997 to February 2002 and Partner of Bingham McCutchen LLP from 1967 to 1997. On behalf of Bingham McCutchen LLP, Mr. Greer provided representation to the disinterested directors of the Strong Funds from 1991 to February 2002. Bingham McCutchen LLP has provided representation to the Independent Directors of the Strong Funds since 1991.
Stanley Kritzik (DOB 1-9-30), Director of the Strong Funds since January 1995 and Chairman of the Audit Committee of the Strong Funds since July 2000.
Mr. Kritzik has been Partner of Metropolitan Associates (a real estate firm) since 1962; Director of Wisconsin Health Information Network from November 1997 to September 2004, Health Network Ventures, Inc. from 1992 to April 2000, and Aurora Health Care from September 1987 to September 2002; and Member of the Board of Governors of Snowmass Village Resort Association from October 1999 to October 2002.
Neal Malicky (DOB 9-14-34), Director of the Strong Funds since December 1999.
Mr. Malicky has been President Emeritus of Baldwin-Wallace College since July 2000; Chancellor of Baldwin-Wallace College from July 1999 to June 2000; President of Baldwin-Wallace College from July 1981 to June 1999; Trustee of Southwest Community Health Systems, Cleveland Scholarship Program, and The National Conference for Community and Justice until 2001; President of the National Association of Schools and Colleges of the United Methodist Church, Chairperson of the Association of Independent Colleges and Universities of Ohio, and Secretary of the National Association of Independent Colleges and Universities until 2001.
William F. Vogt (DOB 7-19-47), Director and Chairman of the Independent Directors Committee of the Strong Funds since January 1995.
Mr. Vogt has been President of Vogt Holdings, LLC since July 2004; Senior Vice President of IDX Systems Corporation (a management consulting firm) from June 2001 to June 2004; President of Vogt Management Consulting, Inc. from July 1990 to June 2001; and former Fellow of the American College of Medical Practice Executives.
97
DIRECTORS AND OFFICERS (continued)
Ane K. Ohm (DOB 10-16-69), Anti-Money Laundering Compliance Officer of the Strong Funds since November 2002.
Ms. Ohm has been Anti-Money Laundering Compliance Officer of Strong Financial Corporation since February 2003; Assistant Executive Vice President of Strong Financial Corporation since November 2003; Assistant Executive Vice President of Strong Capital Management, Inc. (the “Advisor”) since December 2001; Director of Mutual Fund Administration of Strong Investor Services, Inc. since April 2001; Vice President of Strong Investor Services, Inc. since December 2001; and Marketing Services Manager of Strong Investments, Inc. (the “Distributor”) from November 1998 to April 2001.
R. Michael Parker (DOB 6-17-45), Chief Compliance Officer of the Strong Funds since August 2004.
Mr. Parker was a Senior Compliance Examiner with the United States Securities and Exchange Commission from April 1970 to April 2004.
Phillip O. Peterson (DOB 12-5-44), Independent President of the Strong Funds since January 2004.
Mr. Peterson was a mutual fund industry consultant from August 1999 to December 2003; Partner of KPMG LLP from 1981 to July 1999; Director of The Hartford Group of Mutual Funds (71 funds) since 2002; and Director of the Fortis Mutual Fund Group (38 funds) from 2000 to 2002.
John W. Widmer (DOB 1-19-65), Treasurer of the Strong Funds since April 1999; Secretary of the Strong Funds since November 2004.
Mr. Widmer has been Treasurer of the Advisor since April 1999; Assistant Treasurer of Strong Financial Corporation since December 2001; Secretary of Strong Financial Corporation since September 2004; Assistant Secretary of Strong Financial Corporation from December 2001 to January 2003; Treasurer of Strong Service Corporation since April 1999; Treasurer and Secretary of Strong Investor Services, Inc. since September 2004; Treasurer and Assistant Secretary of Strong Investor Services, Inc. from July 2001 to September 2004; and Manager of the Financial Management and Sales Reporting Systems department of the Advisor from May 1997 to April 1999.
Thomas M. Zoeller (DOB 2-21-64), Vice President of the Strong Funds since October 1999.
Mr. Zoeller has been Executive Vice President of the Advisor since April 2001; Chief Financial Officer of the Advisor since February 1998; Secretary of the Advisor from December 2001 to November 2002; Member of the Office of the Chief Executive of Strong Financial Corporation since May 2001; Chief Financial Officer and Treasurer of Strong Investments, Inc. from October 1993 to September 2004; Executive Vice President of Strong Investor Services, Inc. since July 2001; Secretary of Strong Investor Services, Inc. from July 2001 to May 2003; Executive Vice President, Chief Financial Officer, and Secretary of Strong Service Corporation since December 2001; Treasurer of Strong Service Corporation from September 1996 to April 1999; Vice President of Strong Service Corporation from April 1999 to December 2001; Member of the Office of the Chief Executive of the Advisor from November 1998 until May 2001; Senior Vice President of the Advisor from February 1998 to April 2001; and Director of Capital Processing International, LLC since September 2004.
Effective January 2005, Dana J. Russart replaced Mr. Zoeller as Vice President of the Strong Funds.
Except for Messrs. Davis, Malicky, and Vogt, the address of all of the Directors and Officers is P.O. Box 2936, Milwaukee, WI 53201. Mr. Davis’s address is 161 North La Brea, Inglewood, CA 90301. Mr. Malicky’s address is 4608 Turnberry Drive, Lawrence, KS 66047. Mr. Vogt’s address is P.O. Box 7657, Avon, CO 81620.
The statement of additional information contains additional information about fund directors and officers and is available without charge, upon request, by calling 1-800-368-3863.
98
Directors
Willie D. Davis
Gordon B. Greer
Stanley Kritzik
Neal Malicky
William F. Vogt
Officers
Ane K. Ohm, Anti-Money Laundering Compliance Officer
R. Michael Parker, Chief Compliance Officer
Phillip O. Peterson, Independent President
John W. Widmer, Treasurer and Secretary
Thomas M. Zoeller, Vice President
Investment Advisor
Strong Capital Management, Inc.
P.O. Box 2936, Milwaukee, Wisconsin 53201
Distributor
Strong Investments, Inc.
P.O. Box 2936, Milwaukee, Wisconsin 53201
Custodian
State Street Bank and Trust Company
801 Pennsylvania Avenue, Kansas City, Missouri 64105
Transfer Agent and Dividend-Disbursing Agent
Strong Investor Services, Inc.
P.O. Box 2936, Milwaukee, Wisconsin 53201
Independent Registered Public Accounting Firm
KPMG LLP
303 East Wacker Drive, Chicago, IL 60601-5212
Legal Counsel
Godfrey & Kahn, S.C.
780 North Water Street, Milwaukee, Wisconsin 53202
99
NOTES
100
Contact Us
To learn more about our funds, discuss an existing account, or conduct a transaction, call 1-800-368-3863 or visit www.Strong.com.
To reach us by mail, please forward to Strong Investments, P.O. Box 2936, Milwaukee, Wisconsin 53201.
Please carefully consider a fund’s investment objectives, risks, charges, and expenses before investing. For this and other information, call us or visit our web site for a free prospectus. Please read it carefully before you invest or send money.
If you are a Financial Professional, call 1-800-368-1683.
Proxy Voting Information
To receive a free copy of the policies and procedures the funds use to determine how to vote proxies relating to portfolio securities, or to receive a free copy of a fund’s proxy voting record for the most recent 12-month period ending on June 30, call 1-800-368-3863, or visit the Securities and Exchange Commission’s (SEC) web site at www.sec.gov.
Filing of Portfolio Holdings
The funds file their complete schedule of portfolio holdings with the SEC for the first and third quarters of each fiscal year on Form N-Q. Form N-Q is available on the SEC’s web site at www.sec.gov, and may be reviewed and copied at the SEC’s public reference rooms at 450 Fifth Street, N.W., Washington, D.C. 20549, or at the SEC’s regional offices in New York City, at 233 Broadway, and in Chicago, at 175 West Jackson Boulevard, Suite 900.
This report does not constitute an offer for the sale of securities. Strong Funds are offered for sale by prospectus only. Securities are offered through Strong Investments, Inc. RT48465 02-05
AGRO/WH2890 12-04
ANNUAL REPORT | December 31, 2004
| Item 1. | Reports to Shareholders |
Strong
Core
Funds

Strong Balanced Fund | ||
Strong Large Cap Core Fund | ||
Strong Growth and Income Fund | ||
Strong Opportunity Fund | ||
 | ||
ANNUAL REPORT | December 31, 2004
Strong
Core
funds
On May 26, 2004, Strong Financial Corporation (“SFC”) announced that it reached a definitive agreement with Wells Fargo & Company (“Wells Fargo”) for Wells Fargo to acquire certain assets of SFC and certain of its affiliates, including the Advisor. On December 10, 2004, and on December 22, 2004, shareholders of the Strong Funds met and approved 1) the reorganization of each Strong Fund into a Wells Fargo Advantage Fund (“Reorganization”), and 2) interim investment advisory agreements between the Strong Funds and Wells Fargo Funds Management, LLC and certain sub-advisors (“Interim Agreements”). The Interim Agreements became effective January 1, 2005. The Reorganization of the Funds is expected to occur on or about April 11, 2005.
Investment Reviews | ||
| 2 | ||
| 6 | ||
| 10 | ||
| 14 | ||
| 18 | ||
Financial Information | ||
Schedules of Investments in Securities | ||
| 20 | ||
| 23 | ||
| 24 | ||
| 26 | ||
| 29 | ||
| 32 | ||
| 35 | ||
| 38 | ||
| Notes to Financial Statements | 43 | |
| Report of Independent Registered Public Accounting Firm | 55 | |
| Results to Shareholders Meetings | 56 | |
| Directors and Officers | 58 | |
Market Update From Dick Weiss
January 1, 2004, to December 31, 2004

It’s indisputable: When it comes to the stock market, resolution brings results.
We saw this clearly at the tail end of 2004. The market as a whole had wandered aimlessly for the first 10 months of the year, spooked by uncertainty over the outcome of a contentious U.S. Presidential Election and our continuing involvement in Iraq. With George W. Bush’s reelection in November, the market surged, driven by the knowledge that there would be no change of administration in Washington and the U.S. commitment to democratize Iraq would continue.
One issue that currently weighs on the markets is inflation. There was tremendous inflation at the raw material level in both 2003 and 2004, but it has not shown up in any marked degree in the Consumer Price Index (CPI). The most obvious example occurred in the energy sector, where oil rose well above $50 per barrel. Historically, that sort of spike in oil prices would have dramatically (and negatively) impacted the average American’s financial affairs. This time, however, it did not.
Why? Because rather than pass on those increasing raw material costs to customers, most companies chose to take the hit themselves, largely because demand seemed soft. It seems to me that the tricky question is whether companies will continue to absorb higher prices for raw materials (thus depressing profit margins) or, rather, pass those costs along to the public.
In any event, it’s clear that there’s a lot more inflation in the system than is reflected in the CPI. Hence, it’s become a matter of how that inflation will be managed — and by whom.
It’s also worth noting that there are deflationary pressures afoot in the world’s economy today. China, absorbing millions of new workers into its labor pool, is exporting cheap goods around the globe. The United States is the destination for a disproportionate share of that production, and the Chinese are financing our purchases. For the moment, that practice has helped to prop up the U.S. dollar. In the long run, it has unsettling implications.
As we look at 2005, there are a lot of moving parts out there — inflation, deflation, Iraq, China, the ups-and-downs of the U.S. dollar, and the mind-boggling developments in technology with their transformative effects on both our corporate and personal lives. Rapidly aging populations in Europe and China will cause seismic demographic shifts that we believe will have a long-term, dramatic effect on the world economy and markets.
Thanks for your continued investment.

Richard T. Weiss
Strong Financial Corporation
The Strong Balanced Fund underperformed its broad-based benchmark, the Standard & Poor’s 500 Index (S&P 500) during 2004. During the 12 months ending December 31, 2004, the Fund returned 6.86%, while the S&P 500 returned 10.87%. A balanced benchmark, the 60/40 Balanced Fund Index (which blends a 60% weighting in the S&P 500 with a 40% weighting in the Lehman Brothers Intermediate U.S. Government/Credit Bond Index), returned 7.81% for the same period.
A fourth-quarter breakout
The stock market was stuck in a trading range for much of 2004, failing to generate much positive or negative momentum. Although the economy continued to grow steadily and corporate earnings came in essentially as expected, rising oil prices and concerns about the potential for terrorism weighed on the market.
The market, however, rose sharply following the November 2 presidential election. Investors had been concerned that the election would fail to yield a quick and decisive victory, as happened in 2000. However, the clear-cut result seemed to calm these fears.
The Fund’s fixed-income portion benefited from a better-than-expected backdrop for bonds. Although the Federal Reserve raised short-term interest rates five times between June 30 and December 31, the market widely anticipated the increases, which had only a minimal negative impact on bonds with maturities exceeding five years.
Indeed, the most notable feature of the Treasury bond market in 2004 was the wide divergence between the behavior of short-term and long-term interest rates. Over the course of the year, the yield on 2-Year Treasury notes rose to just over 3.0% versus a level of 1.82% at the end of 2003. The 10-Year Treasury note started 2004 at a 4.25% yield, and finished the year practically unchanged at 4.22%. The yield of the long-term Treasury bond actually declined by 0.25%! While a “flattening” of the yield curve isn’t unusual during a period of tightening monetary policy, it was rather surprising to see long-maturity issues perform so well in the face of persistent short term rate hikes.
Skeptical of pharmaceuticals
The economy’s solid performance continued to benefit the Fund’s holdings in the industrial sector. In addition, the Fund was helped its reduced holdings in large-capitalization pharmaceutical stocks, a stance we took because we believed such companies in faced a number of political as well as self-induced challenges. The Fund also benefited from investments in the Internet sector as well as among lodging companies. In lodging, the Fund gained especially from its position in Starwood Hotels and Resorts, which benefited from a continued recovery in travel-related spending.
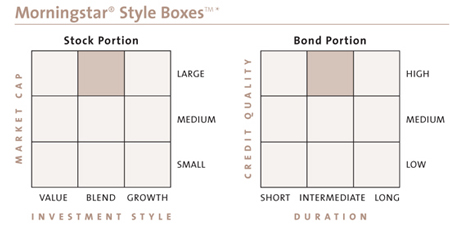
We do, however, wish that we had put more of an emphasis on energy stocks early in 2004 when these companies could be bought more cheaply; as oil and natural gas prices soared during the year, these stocks soared with them. We also, in hindsight, would have invested less in technology and health care stocks, neither of which performed well as a group during the year.
Focus on earnings growth and valuation
Following our overall management strategy of looking for companies with attractive valuations, strong earnings growth, and displaying positive fundamental financial momentum, we avoided investing in most large-capitalization drug companies. Although these companies were offering attractive valuations relative to their historic levels, the industry’s fundamentals appeared to be deteriorating and did not, in our opinion, provide compelling investment opportunities. The Fund did own a position in pharmaceutical giant Merck, but we sold all of the portfolio’s remaining shares in the company just days before it announced that the blockbuster drug Vioxx would be pulled from the market because of safety concerns.
We found a more attractive opportunity in UnitedHealth Group, a leading provider of health care benefits. Despite analysts’ expectations to the contrary, this company’s fundamentals continued to improve, even as the company continued to trade at an attractive valuation. This was a strong-performing stock for the Fund during the year.
Although valuation continued to be an important consideration when choosing investments for the Fund, we sometimes looked to other criteria when we believed that companies’ fundamentals were strong enough to make up for a higher-than-desired valuation. Several examples of this were found among Internet companies during the period, most notably Yahoo!, the leading Web portal, and eBay, the largest online auction site. These are two of the best examples of Internet companies which have been successful at obtaining advertising dollars that previously would have gone to “old media” outlets such as magazines, newspapers, and television stations.
Our management approach with the intermediate fixed-income portion of the portfolio was to maximize coupon income. We accomplished this goal by increasing the Fund’s exposure to corporate and mortgage-backed bonds, both of which offer higher interest rates than other types of bonds with comparable maturities.
In addition to extra income, the corporate bond market provided opportunities to capture relative price appreciation. A strong economic environment supported credit fundamentals, which allowed a narrowing of the “risk premium” versus Treasury yields. The market for mortgage-backed securities also performed well as the relative stability in intermediate rates allayed fears of a significant shift in the rate of prepayments related to refinance activity. All in all it was a pretty good year for investing in fixed income securities despite the steady climb in the Federal Reserve’s overnight rate targets and the Fund’s allocation to bonds served its purposes: diversification, volatility reduction, and income.
New Manager and Fund Reorganization
Effective January 1, 2005, David L. Roberts, CFA, of Wells Capital Management Incorporated began managing the equity portion of the Fund. W. Frank Koster continues to manage the bond portion of the Fund. In addition, the Fund is expected to reorganize into the Wells Fargo Advantage Balanced Fund on or about April 11, 2005.
Thank you for your investment in the Strong Balanced Fund.
| * | The Morningstar Style Box™ reflects a fund’s investment strategy. For equity funds, the vertical axis shows the market capitalization of the stocks owned and the horizontal axis shows investment style (value, blend, or growth). For fixed-income funds, the vertical axis shows the average credit quality of the bonds owned, and the horizontal axis shows interest-rate sensitivity as measured by a bond’s duration (short, intermediate, or long). |
Mention of specific securities in this report is not indicative of whether the Fund may make additional purchases of, sell all or a portion of, or continue to hold those securities.
2
Fund Highlights
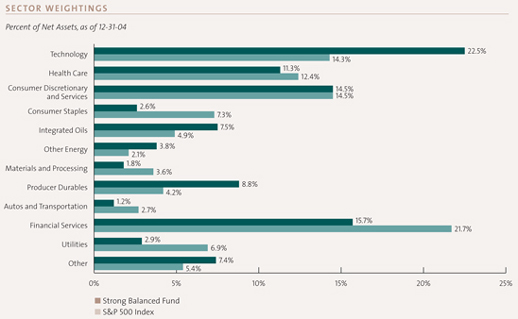
Source: Frank Russel Company via FactSet
Fund Highlights are continued on next page.
3
Strong Balanced Fund
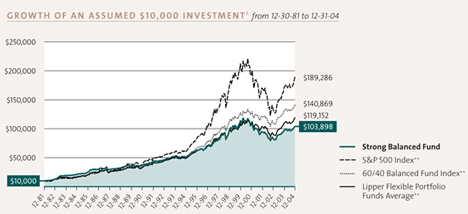
Performance is historical and does not guarantee future results. Investment returns and principal value will fluctuate, and you may have a gain or loss when you sell shares. Current performance may be lower or higher than the quoted performance. Call us or visit www.Strong.com for the most recent month-end performance.
| † | This graph, provided in accordance with SEC regulations, compares a $10,000 investment in the Fund, made at its inception, with the performance of the S&P 500 Index, the 60/40 Balanced Fund Index, and the Lipper Flexible Portfolio Funds Average. Results include the reinvestment of all dividends and capital gains distributions. The graph and the Average Annual Total Returns table do not reflect the deduction of taxes, if any, that a shareholder would pay on Fund distributions or the redemption of Fund shares. |
Definitions:
| ** | The S&P 500 Index consists of 500 stocks chosen for market size, liquidity, and industry group representation. It is a market value weighted index (stock price times number of shares outstanding), with each stock’s weight in the Index proportionate to its market value. The 60/40 Balanced Fund Index is comprised of 60% S&P 500 Index and 40% Lehman Brothers Intermediate U.S. Government/Credit Bond Index. The Lipper Flexible Portfolio Funds Average is the average of all funds in the Lipper Flexible Portfolio Funds Category. These funds allocate their investments across various asset classes, including domestic common stocks, bonds, and money market instruments with a focus on total return. Source of the S&P Index and 60/40 Balanced Fund Index data is Standard & Poor’s Micropal. Source of the Lipper Index data is Lipper. |
| It is not possible to invest directly in an index. |
Top Holdings
Percent of Net Assets, as of 12-31-04
United States Treasury Bills, Notes & Bonds | 6.1 | % | |
FNMA Notes | 3.7 | % | |
General Electric Company | 3.2 | % | |
Exxon Mobil Corporation | 2.7 | % | |
FNMA Guaranteed Mortgage Investment Pass-Thru Certificates | 2.6 | % | |
Bank of America Corporation | 2.3 | % | |
International Business Machines Corporation | 1.8 | % | |
Microsoft Corporation | 1.8 | % | |
The Procter & Gamble Company | 1.7 | % | |
UnitedHealth Group, Inc. | 1.6 | % | |
Top Ten | 27.5 | % | |
Holdings vary. More complete holdings are available at www.Strong.com.
Percentage Restrictions: The Fund’s prospectus and statement of additional information may describe restrictions on the percentage of a particular type or quality of security in which the Fund may invest (“Percentage Restrictions”). Percentage Restrictions apply at the time the Fund purchases a security. Circumstances subsequent to the purchase of the security, such as a change in: (1) the Fund’s assets (e.g., due to cash inflows and redemptions), (2) the market value of the security, or (3) the pricing, liquidity, or rating of the security, may cause the Fund to exceed or fall short of the Percentage Restriction. If this happens, the Fund’s continued holding of the security will not constitute a violation of the Percentage Restriction.
4
Average Annual Total Returns
As of 12-31-04
Investor Class1 | |||
1-year | 6.86 | % | |
5-year | -1.81 | % | |
10-year | 7.23 | % | |
Since Fund Inception (12-30-81) | 10.71 | % |
Performance is historical and does not guarantee future results. Investment returns and principal value will fluctuate, and you may have a gain or loss when you sell shares. Current performance may be lower or higher than the quoted performance. Call us or visit www.Strong.com for the most recent month-end performance.
Fee Waivers:
| 1 | From time to time, the Fund’s advisor and/or administrator has waived fees and/or absorbed Fund expenses, which has resulted in higher returns. As of 12-31-04, there are waivers and/or absorptions in effect. |
Top Ten Industries
Percent of Net Assets, as of 12-31-04
Diversified Operations | 5.4 | % | |
Oil & Gas — International Integrated | 4.4 | % | |
Computer Software — Enterprise | 2.6 | % | |
Computer — Manufacturers | 2.5 | % | |
Banks — Money Center | 2.3 | % | |
Telecom — Wireless Equipment | 2.3 | % | |
Retail — Major Discount Chains | 2.2 | % | |
Commercial Services — Miscellaneous | 1.9 | % | |
Finance — Investment Brokers | 1.9 | % | |
Utility — Electric Power | 1.8 | % | |
Top Ten | 27.3 | % | |
Risks: Stock investments should only be considered for long-term goals as values fluctuate in response to the activities of individual companies and general market and economic conditions. Bond investment values fluctuate in response to the financial condition of individual issuers, changes in interest rates, and general market and economic conditions. Consult the Fund’s prospectus for additional information on this and other risks.
5
The Strong Large Cap Core Fund posted a return of 8.69% for the one-year period ended December 31, 2004. This placed it behind its broad-based benchmark, the Standard and Poor’s 500, which returned 10.87% for the same period.
Investors were often uncertain
For much of the year, the equity markets took a breather after their strong returns in 2003. While there were many signs of economic improvement, there were also significant reasons for concern, including the unresolved conflict in Iraq, the potential for other global conflicts, uneven employment data, and the potential impact of rising interest rates. These factors weighed on the economy and on investor sentiment, keeping returns muted for most of the year.
Investor sentiment began to improve somewhat near the end of May, as the market focused its attention on good news regarding strong corporate profits and new job creation. Fund holdings that had been hurt by investors’ concerns in April had largely stabilized and recovered by the end of the first half of the year.
When the Federal Reserve acted to raise short-term rates by a quarter percentage point at the end of June, the modest move was widely anticipated. The Fed raised rates four more times before the end of the year, bringing the target rate up to 2.25% from 1.0%. The measured pace of these increases, a quarter point at a time, helped to quiet fears of inflation.
Although equity returns remained tepid in the year’s third quarter, they staged a solid comeback in the fourth quarter, as investors gained greater confidence in the economic outlook. Corporate profits climbed to record levels, job creation appeared to pick up, and oil prices moved down from their earlier highs. The quick resolution to the November elections — unlike the drawn-out scenario in 2000 — and a result that was generally seen as positive for business allowed the equity markets to enjoy a strong upturn through most of the remainder of the year.
Factors in our performance
In the first half of the year, the Fund’s energy holdings contributed positively to performance. Our emphasis in this sector was on the large integrated oil companies, which benefited from higher demand for oil, strong margins on refining operations, and low debt levels that helped to mute the impact of rising interest rates.
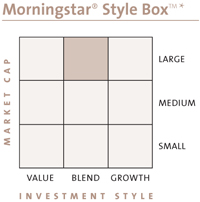
Later in the year, many of the Fund’s gains took place in such cyclical sectors as materials, select technology, and industrial stocks. This was indicative of improving investor sentiment with respect to the sustainability of the economic recovery. We had significant holdings in these areas, including Phelps Dodge and Nucor. Home sales continued to be strong, allowing our investments among homebuilders to make meaningful contributions to our performance. Internet companies eBay and Yahoo! also had a positive impact on our returns.
Equally important to our results, however, was avoiding large investments in major portions of the technology sector (as well as health care) that appeared to us to be overvalued relative to their earnings prospects.
For much of the year, the Fund outpaced its broad-based benchmark. As the equity markets surged ahead in the fourth quarter, we were able to post solid gains, though not at the same rate as the index. Our focus on large capitalization stocks, with a median market capitalization that typically exceeds that of the S&P 500, hurt our results over the year, as smaller-company stocks on the whole outperformed larger-cap stocks.
Looking ahead
For months, many factors took a toll on investor confidence — factors that had little to do with the economy or corporate earnings. Now, investors once again are paying attention to some very positive underlying economic trends. This offers the potential for positive impact on equity markets, though perhaps not at the same rate as in the fourth quarter of 2004.
We anticipate that economic growth should continue at a sustainable pace in coming months. Corporate earnings appear to be strong, and there is good reason they will continue to be so. Inflation remains at manageable levels, and the Federal Reserve appears to be strongly committed to its measured pace of rate increases. There are still many concerns facing investors, including geopolitical uncertainty and rising interest rates, but on balance, we believe positive economic factors could help to drive reasonable gains among large-cap stocks in coming months.
Effective January 1, 2005, David A. Katz, CFA, of Matrix Asset Advisors, Inc., became the sole Portfolio Manager of the Fund. In addition, the Fund is expected to reorganize into the Wells Fargo Advantage Growth and Income Fund, the successor to the Strong Growth and Income Fund, on or about April 11, 2005.
Thank you for your investment in the Strong Large Cap Core Fund.
| * | The Morningstar Style Box™ reflects a fund’s investment strategy. For equity funds, the vertical axis shows the market capitalization of the stocks owned and the horizontal axis shows investment style (value, blend, or growth). |
Mention of specific securities in this report is not indicative of whether the Fund may make additional purchases of, sell all or a portion of, or continue to hold those securities.
6
Fund Highlights
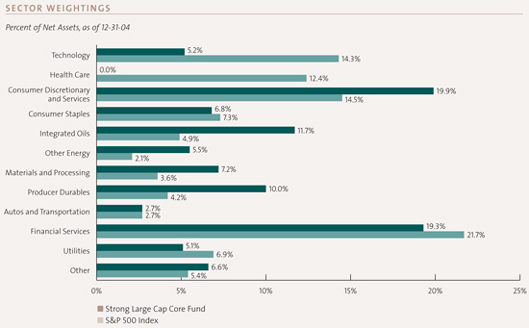
Source: Frank Russell Company via FactSet
Fund Highlights are continued on next page.
7
Strong Large Cap Core Fund
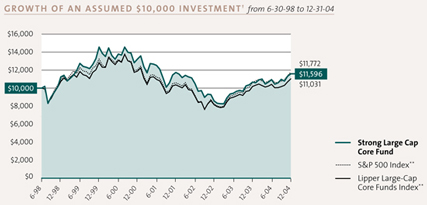
Performance is historical and does not guarantee future results. Investment returns and principal value will fluctuate, and you may have a gain or loss when you sell shares. Current performance may be lower or higher than the quoted performance. Call us or visit www.Strong.com for the most recent month-end performance.
| † | This graph, provided in accordance with SEC regulations, compares a $10,000 investment in the Fund, made at its inception, with the performance of the S&P 500 Index and the Lipper Large-Cap Core Funds Index. Results include the reinvestment of all dividends and capital gains distributions. The graph and the Average Annual Total Returns table do not reflect the deduction of taxes, if any, that a shareholder would pay on Fund distributions or the redemption of Fund shares. |
Definitions:
| ** | The S&P 500 Index consists of 500 stocks chosen for market size, liquidity, and industry group representation. It is a market value weighted index (stock price times number of shares outstanding), with each stock’s weight in the Index proportionate to its market value. The Lipper Large-Cap Core Funds Index is the average of the 30 largest funds in the Lipper Large-Cap Core Funds Category. Source of the S&P Index data is Standard & Poor’s Micropal. Source of the Lipper Index data is Lipper. |
It is not possible to invest directly in an index.
Top Holdings
Percent of Net Assets, as of 12-31-04
ConocoPhillips | 3.9 | % | |
Yahoo! Inc. | 3.6 | % | |
Citigroup, Inc. | 3.5 | % | |
Starwood Hotels & Resorts Worldwide, Inc. | 3.4 | % | |
eBay, Inc. | 3.4 | % | |
Tyco International, Ltd. | 3.4 | % | |
NIKE, Inc. Class B | 3.3 | % | |
American International Group, Inc. | 3.3 | % | |
Exxon Mobil Corporation | 3.0 | % | |
Bank of America Corporation | 3.0 | % | |
Top Ten | 33.8 | % | |
Holdings vary. More complete holdings are available at www.Strong.com.
Percentage Restrictions: The Fund’s prospectus and statement of additional information may describe restrictions on the percentage of a particular type or quality of security in which the Fund may invest (“Percentage Restrictions”). Percentage Restrictions apply at the time the Fund purchases a security. Circumstances subsequent to the purchase of the security, such as a change in: (1) the Fund’s assets (e.g., due to cash inflows and redemptions), (2) the market value of the security, or (3) the pricing, liquidity, or rating of the security, may cause the Fund to exceed or fall short of the Percentage Restriction. If this happens, the Fund’s continued holding of the security will not constitute a violation of the Percentage Restriction.
8
Average Annual Total Returns
As of 12-31-04
Investor Class1 | |||
1-year | 8.69 | % | |
5-year | -4.44 | % | |
Since Fund Inception (6-30-98) | 2.30 | % |
Performance is historical and does not guarantee future results. Investment returns and principal value will fluctuate, and you may have a gain or loss when you sell shares. Current performance may be lower or higher than the quoted performance. Call us or visit www.Strong.com for the most recent month-end performance.
Fee Waivers:
| 1 | From time to time, the Fund’s advisor and/or administrator has waived fees and/or absorbed Fund expenses, which has resulted in higher returns. As of 12-31-04, there are waivers and/or absorptions in effect. |
Performance: From time to time, the Fund’s performance was significantly enhanced through investments in initial public offerings (IPOs). In addition, the effect of IPOs purchased when the Fund’s asset base was small may have been magnified. Given these circumstances, you should not expect that such enhanced returns can be consistently achieved. Please consider this before investing.
Top Ten Industries
Percent of Net Assets, as of 12-31-04
Diversified Operations | 10.3 | % | |
Oil & Gas — International Integrated | 8.7 | % | |
Banks — Money Center | 6.4 | % | |
Finance — Investment Brokers | 5.1 | % | |
Building — Resident/Commercial | 4.9 | % | |
Telecommunications — Wireless Services | 4.7 | % | |
Oil & Gas — United States Exploration & Production | 4.4 | % | |
Internet — Internet Service Provider/Content | 3.6 | % | |
Leisure — Hotels & Motels | 3.4 | % | |
Internet — E*Commerce | 3.4 | % | |
Top Ten | 54.9 | % | |
Risks: Stock funds should only be considered for long-term goals as values fluctuate in response to the activities of individual companies and general market and economic conditions. Consult the Fund’s prospectus for additional information on this and other risks.
9
The Strong Growth and Income Fund Investor Class gained 8.88% during the 12 months ending December 31, 2004. This result lagged the Fund’s benchmark, the Standard & Poor’s 500 Index (S&P 500), which rose 10.87% during the same time frame.
A fourth-quarter breakout
The stock market was stuck in a trading range for much of 2004, failing to generate much positive or negative momentum for much of the year. Although the economy continued to grow steadily and corporate earnings came in essentially as expected, rising oil prices and concerns about the potential for terrorism weighed on the market.
The market, however, broke out of this trading range following the November 2 presidential election and rose sharply. Investors had been concerned that the election would fail to yield a quick and decisive victory, as happened in 2000. However, the clear-cut result seemed to calm these fears. Many investors most likely also saw the re-election of President Bush as an indication that investor-friendly policies such as lower dividend and capital gains tax rates were likely to continue.
Skeptical of pharmaceuticals
The economy’s solid performance continued to benefit the Fund’s holdings in the industrial sector. In addition, the Fund was helped by our decision to under-represent the portfolio in large-capitalization pharmaceutical stocks, a stance we took because we believed companies in the sector faced a number of political as well as self-induced challenges. The Fund also benefited from investments in the Internet sector as well as among lodging companies. In lodging, the Fund gained especially from its position in Starwood Hotels and Resorts Worldwide, Inc., which rose as business and leisure travel continued to rebound from its long slump in past years.
We do, however, wish that we had put more of an emphasis on energy stocks early in 2004 when these companies could be bought more cheaply; as oil and natural gas prices soared during the year, these stocks soared with them. We also, in hindsight, would have invested less in technology and health care stocks, neither of which performed well as a group during the year.
Focus on earnings growth and valuation
Our management approach during the period included a focus on screening techniques designed to uncover stocks displaying strong earnings growth and trading at attractive valuations. In other words, we were looking for companies with solid potential but that were not yet fully exploiting it. This process included an analysis of each company’s end market, competitive environment, and ability to meet or exceed stated financial goals.
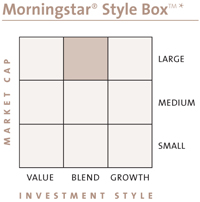
Following our overall management strategy of looking for companies with attractive valuations and displaying positive fundamental financial momentum, we avoided investing in most large-capitalization drug companies. Although these companies were offering attractive valuations relative to their historic levels, the industry’s fundamentals appeared to be deteriorating and did not, in our opinion, provide compelling investment opportunities. The Fund did own a position in pharmaceutical giant Merck, but we sold all of the portfolio’s remaining shares in the company before it announced that the blockbuster drug Vioxx would be pulled from the market because of safety concerns.
We found a more attractive opportunity in the health care sector in UnitedHealth Group, a leading provider of health care benefits. Despite analysts’ expectations to the contrary, this company’s fundamentals continued to improve, even as the company continued to trade at an attractive valuation. This was a strong-performing stock for the Fund during the year.
Although valuation continued to be an important consideration when choosing investments for the Fund, we sometimes looked to other criteria when we believed that companies’ fundamentals were particularly strong enough to make up for a higher-than-desired valuation. Several examples of this were found among Internet companies during the period, most notably Yahoo!, the leading Web portal, and eBay, the largest online auction site. These are two of the best examples of Internet companies who have been successful at obtaining advertising dollars that previously would have gone to “old media” outlets such as magazines, newspapers, and television stations.
New Manager and Fund Reorganization
Effective January 1, 2005, David A. Katz, CFA, of Matrix Asset Advisors, Inc., became the sole Portfolio Manager of the Fund. In addition, the Fund is expected to reorganize into the Wells Fargo Advantage Growth and Income Fund, the successor to the Strong Growth and Income Fund, on or about April 11, 2005.
Thank you for your investment in the Strong Growth and Income Fund.
| * | The Morningstar Style Box™ reflects a fund’s investment strategy. For equity funds, the vertical axis shows the market capitalization of the stocks owned and the horizontal axis shows investment style (value, blend, or growth). |
Mention of specific securities in this report is not indicative of whether the Fund may make additional purchases of, sell all or a portion of, or continue to hold those securities.
10
Fund Highlights
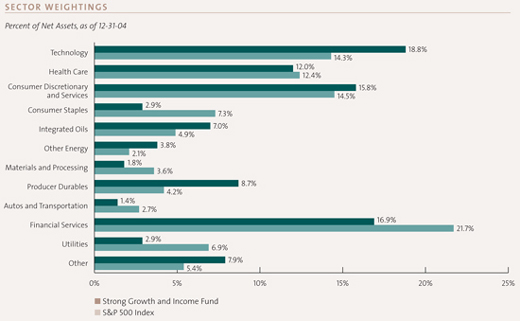
Source: Frank Russell Company via FactSet
Fund Highlights are continued on next page.
11
Strong Growth and Income Fund
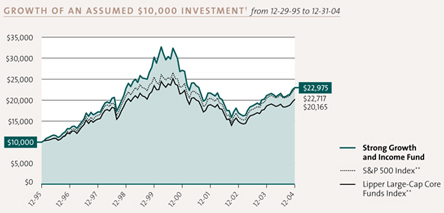
Performance is historical and does not guarantee future results. Investment returns and principal value will fluctuate, and you may have a gain or loss when you sell shares. Current performance may be lower or higher than the quoted performance. Call us or visit www.Strong.com for the most recent month-end performance.
| † | This graph, provided in accordance with SEC regulations, compares a $10,000 investment in the Fund, made at its inception, with the performance of the S&P 500 Index and the Lipper Large-Cap Core Funds Index. Results include the reinvestment of all dividends and capital gains distributions. The graph and the Average Annual Total Returns table do not reflect the deduction of taxes, if any, that a shareholder would pay on Fund distributions or the redemption of Fund shares. This graph is based on Investor Class shares only; performance for other classes will vary due to differences in fee structures. |
Definitions:
| ** | The S&P 500 Index consists of 500 stocks chosen for market size, liquidity, and industry group representation. It is a market value weighted index (stock price times number of shares outstanding), with each stock’s weight in the Index proportionate to its market value. The Lipper Large-Cap Core Funds Index is the average of the 30 largest funds in the Lipper Large-Cap Core Funds Category. Source of the S&P index data is Standard & Poor’s Micropal. Source of the Lipper index data is Lipper Inc. |
It is not possible to invest directly in an index.
Top Holdings
Percent of Net Assets, as of 12-31-04
General Electric Company | 5.0 | % | |
Exxon Mobil Corporation | 4.2 | % | |
Bank of America Corporation | 3.4 | % | |
The Procter & Gamble Company | 2.9 | % | |
Microsoft Corporation | 2.9 | % | |
Tyco International, Ltd. | 2.8 | % | |
UnitedHealth Group, Inc. | 2.6 | % | |
eBay, Inc. | 2.3 | % | |
Yahoo! Inc. | 2.3 | % | |
The Goldman Sachs Group, Inc. | 2.3 | % | |
Top Ten | 30.7 | % | |
Holdings vary. More complete holdings are available at www.Strong.com.
Percentage Restrictions: The Fund’s prospectus and statement of additional information may describe restrictions on the percentage of a particular type or quality of security in which the Fund may invest (“Percentage Restrictions”). Percentage Restrictions apply at the time the Fund purchases a security. Circumstances subsequent to the purchase of the security, such as a change in: (1) the Fund’s assets (e.g., due to cash inflows and redemptions), (2) the market value of the security, or (3) the pricing, liquidity, or rating of the security, may cause the Fund to exceed or fall short of the Percentage Restriction. If this happens, the Fund’s continued holding of the security will not constitute a violation of the Percentage Restriction.
12
Average Annual Total Returns
As of 12-31-04
Investor Class1 | |||
1-year | 8.88 | % | |
5-year | -5.35 | % | |
Since Fund Inception (12-29-95) | 9.68 | % | |
Institutional Class1, 2 | |||
1-year | 9.59 | % | |
5-year | -4.75 | % | |
Since Fund Inception (12-29-95) | 10.06 | % | |
Advisor Class1, 3 | |||
1-year | 8.85 | % | |
5-year | -5.40 | % | |
Since Fund Inception (12-29-95) | 9.53 | % | |
Class K1, 4 | |||
1-year | 9.35 | % | |
5-year | -5.11 | % | |
Since Fund Inception (12-29-95) | 9.83 | % | |
Performance is historical and does not guarantee future results. Investment returns and principal value will fluctuate, and you may have a gain or loss when you sell shares. Current performance may be lower or higher than the quoted performance. Call us or visit www.Strong.com for the most recent month-end performance.
Fee Waivers:
| 1 | From time to time, the Fund’s advisor and/or administrator has waived fees and/or absorbed Fund expenses, which has resulted in higher returns. As of 12-31-04, there are waivers and/or absorptions in effect for all share classes. |
Performance:
| 2 | The performance of the Institutional Class shares prior to 2-29-00 is based on the Fund’s Investor Class shares’ performance and has not been restated for the lower expense ratio of the Institutional Class shares. |
| 3 | The performance of the Advisor Class shares prior to 2-29-00 is based on the Fund’s Investor Class shares’ performance, restated for the higher expense ratio of the Advisor Class shares. |
| 4 | The performance of the Class K shares prior to 12-31-01 is based on the Fund’s Investor Class shares’ performance and has not been restated for the lower expense ratio of the Class K shares. |
Please consult a prospectus for information about all share classes.
Top Ten Industries
Percent of Net Assets, as of 12-31-04
Diversified Operations | 9.0 | % | |
Oil & Gas — International Integrated | 7.0 | % | |
Banks — Money Center | 4.0 | % | |
Computer — Manufacturers | 3.8 | % | |
Telecom — Wireless Equipment | 3.6 | % | |
Internet — Internet Service Provider/Content | 3.6 | % | |
Retail — Major Discount Chains | 3.5 | % | |
Finance — Investment Brokers | 3.4 | % | |
Commercial Services — Miscellaneous | 3.0 | % | |
Leisure — Hotels & Motels | 3.0 | % | |
Top Ten | 43.9 | % | |
Risks: Stock funds should only be considered for long-term goals as values fluctuate in response to the activities of individual companies and general market and economic conditions. Investment strategies that concentrate in particular market segments or fewer securities tend to increase the total risk of an investment (relative to the broader market). This Fund is exposed to growth-style investing risk. Consult the Fund’s prospectus for additional information on this and other risks.
13
Continuing the previous year’s bull market, the U.S. stock market posted another positive year in 2004. The Strong Opportunity Fund’s Investor Class shares gained 17.62% for the 12 months ending December 31, 2004. This result trailed that of the Fund’s broad-based benchmark, the Russell Midcap Index, which returned 20.22% during the same period.
A growing economy and higher rates
Strong consumer spending continued to carry the economy during 2004, while corporate spending gradually strengthened. The Federal Reserve continued to raise interest rates gradually during the period — exemplifying its confidence in the economy’s underlying strength. The Fed initiated five separate quarter-percentage-point rate hikes between June 30 and the end of the year.
We positioned the Strong Opportunity Fund with an expectation for higher rates and an aggressive economic recovery in 2004. The market rose only modestly for the first two-thirds of the year as a result of uncertainty surrounding the expected outcome of the U.S. presidential election along with rising energy costs. However, in the year’s fourth quarter, after the decisive election results and the relief in energy prices, the stock market rallied and ended the year on a very positive note.
Choosing stocks for the portfolio
The Strong Opportunity Fund uses a private market methodology in building its portfolio of securities. In other words, our investment process leads us to evaluate companies’ competitive strengths, assets, and financial position. We synthesize this information in an attempt to gauge the value an independent buyer would pay for the entire company, and then we look for stocks to buy that are trading at a discount to that value.
This process served us well in 2004 as it attracted us to luxury goods retailers, whose upscale clientele was, compared to lower-income customers, relatively unaffected by higher energy prices and sluggish employment growth. Upper-income shoppers were also buoyed by a second consecutive year of healthy stock market returns and a strong economy and housing market. Luxury retailers gave their customers a reason to shop in their stores by providing a strong representation of unique and wide assortments of fashions. We invested in luxury retailer Nordstrom, which through its differentiated business model emphasizing customer service, was well positioned to take advantage of the continued momentum in high-end spending. In 2004, Nordstrom enjoyed its second straight year of strong sales growth. In addition, the company’s focus on expense management and significant upgrades to its inventory and sales systems led to strong operating margins, record profits, and 2004 earnings estimates expected to rise by more than 50%. The increased profitability helped Nordstrom’s stock rise 36% during the year.
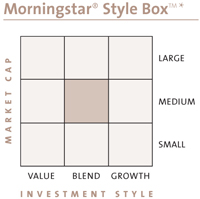
The portfolio also was overweighted compared to the benchmark in media stocks because we expected a faster-growing economy to generate higher advertising and broadcasting revenues. Based on this belief, we invested in Tribune Company for its exposure to both the advertising and the broadcasting markets. The newspaper group (Tribune included) faced questions about the accuracy of their circulation data and had to suffer the consequences of having fewer subscribers to sell to their advertisers. Finally, widely expected rule changes from the FCC that would help further deregulate the whole media industry failed to come through in 2004. The questions concerned investors, who wondered whether other media outlets also were providing inaccurate reporting statistics, as a smaller readership would translate into reduced advertising revenues. Despite a challenging year for Tribune, we have maintained the portfolio’s investments in the media sector, which appears favorably positioned for 2005.
What lies ahead?
Our outlook for 2005 depends on several factors, including the pressure of inflation, the dollar’s resilience to large trade and fiscal deficits, and the need for more rapid economic growth from countries outside of the United States. Consumer spending is starting to drop off slightly, but we expect that increased corporate spending and lower fuel costs should support the continued economic recovery.
The Fund is expected to reorganize into the Wells Fargo Advantage Opportunity Fund, the successor to the Strong Opportunity Fund, on or about April 11, 2005.
We appreciate your trust in our investment expertise and are committed to providing you with positive long-term performance. Best wishes for a happy, healthy, and profitable 2005.
Richard T.Weiss
Portfolio Co-Manager
Ann M. Miletti
Portfolio Co-Manager
| * | The Morningstar Style Box™ reflects a fund’s investment strategy. For equity funds, the vertical axis shows the market capitalization of the stocks owned and the horizontal axis shows investment style (value, blend, or growth). |
Mention of specific securities in this report is not indicative of whether the Fund may make additional purchases of, sell all or a portion of, or continue to hold those securities.
14
Fund Highlights
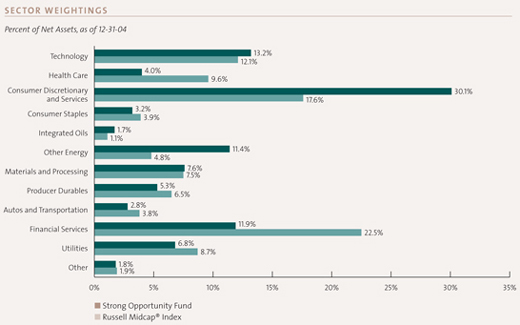
Source: Frank Russell Company via FactSet
Fund Highlights are continued on next page.
15
Strong Opportunity Fund
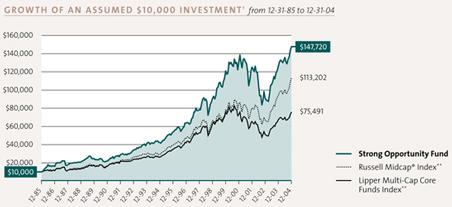
Performance is historical and does not guarantee future results. Investment returns and principal value will fluctuate, and you may have a gain or loss when you sell shares. Current performance may be lower or higher than the quoted performance. Call us or visit www.Strong.com for the most recent month-end performance.
| † | This graph, provided in accordance with SEC regulations, compares a $10,000 investment in the Fund, made at its inception, with the performance of the Russell Midcap® Index and the Lipper Multi-Cap Core Funds Index. Results include the reinvestment of all dividends and capital gains distributions. The graph and the Average Annual Total Returns table do not reflect the deduction of taxes, if any, that a shareholder would pay on Fund distributions or the redemption of Fund shares. This graph is based on Investor Class shares only; performance for other classes will vary due to differences in fee structures. |
Definitions:
| ** | The Russell Midcap® Index measures the performance of the 800 smallest companies in the Russell 1000 Index, which represent approximately 26% of the total market capitalization of the Russell 1000 Index. The Lipper Multi-Cap Core Funds Index is the average of the 30 largest funds in the Lipper Multi-Cap Core Funds Category. Source of the Russell Index data is Standard & Poor’s Micropal. Source of the Lipper Index data is Lipper. |
It is not possible to invest directly in an index.
Top Holdings
Percent of Net Assets, as of 12-31-04
Weatherford International, Ltd. | 2.5 | % | |
GlobalSantaFe Corporation | 2.1 | % | |
Praxair, Inc. | 1.8 | % | |
Apache Corporation | 1.8 | % | |
Molex, Inc. | 1.7 | % | |
Waters Corporation | 1.7 | % | |
Nordstrom, Inc. | 1.6 | % | |
Comcast Corporation | 1.6 | % | |
Barrick Gold Corporation | 1.6 | % | |
XL Capital, Ltd. | 1.5 | % | |
Top Ten | 17.9 | % | |
Holdings vary. More complete holdings are available at www.Strong.com.
Percentage Restrictions: The Fund’s prospectus and statement of additional information may describe restrictions on the percentage of a particular type or quality of security in which the Fund may invest (“Percentage Restrictions”). Percentage Restrictions apply at the time the Fund purchases a security. Circumstances subsequent to the purchase of the security, such as a change in: (1) the Fund’s assets (e.g., due to cash inflows and redemptions), (2) the market value of the security, or (3) the pricing, liquidity, or rating of the security, may cause the Fund to exceed or fall short of the Percentage Restriction. If this happens, the Fund’s continued holding of the security will not constitute a violation of the Percentage Restriction.
16
Average Annual Total Returns
As of 12-31-04
Investor Class1 | |||
1-year | 17.62 | % | |
5-year | 4.07 | % | |
10-year | 13.31 | % | |
Since Fund Inception (12-31-85) | 15.23 | % | |
Advisor Class1, 2 | |||
1-year | 17.39 | % | |
5-year | 3.82 | % | |
10-year | 13.01 | % | |
Since Fund Inception (12-31-85) | 14.89 | % | |
Class K1, 3 | |||
1-year | 17.86 | % | |
5-year | 4.18 | % | |
10-year | 13.38 | % | |
Since Fund Inception (12-31-85) | 15.26 | % | |
Performance is historical and does not guarantee future results. Investment returns and principal value will fluctuate, and you may have a gain or loss when you sell shares. Current performance may be lower or higher than the quoted performance. Call us or visit www.Strong.com for the most recent month-end performance.
Fee Waivers:
| 1 | From time to time, the Fund’s advisor and/or administrator has waived fees and/or absorbed Fund expenses, which has resulted in higher returns. As of 12-31-04, there are waivers and/or absorptions in effect for all share classes. |
Performance:
| 2 | The performance of the Advisor Class shares prior to 2-24-00, is based on the Fund’s Investor Class shares’ performance, restated for the higher expense ratio of the Advisor Class shares. |
| 3 | The performance of the Class K shares prior to 8-30-02 is based on the Fund’s Investor Class shares’ performance, and has not been restated for the lower expense ratio of the Class K shares. |
Please consult a prospectus for information about all share classes.
Top Ten Industries
Percent of Net Assets, as of 12-31-04
Media — Cable TV | 4.2 | % | |
Computer — IT Services | 3.6 | % | |
Insurance — Property/Casualty/Title | 3.6 | % | |
Oil & Gas — Drilling | 3.5 | % | |
Oil & Gas — United States Exploration & Production | 3.3 | % | |
Retail — Clothing/Shoes | 3.0 | % | |
Electronics — Miscellaneous Components | 3.0 | % | |
Finance — Index Tracking Funds | 2.8 | % | |
Auto/Truck — Original Equipment | 2.7 | % | |
Medical — Biomedical/Biotechnology | 2.6 | % | |
Top Ten | 32.3 | % | |
Risks: Stock funds should only be considered for long-term goals as values fluctuate in response to the activities of individual companies and general market and economic conditions. Investment strategies that concentrate in particular market segments or fewer securities tend to increase the total risk of an investment (relative to the broader market). This Fund is exposed to medium-company risk. Consult the Fund’s prospectus for additional information on this and other risks.
17
| December 31, 2004 |
About Your Fund’s Expenses
Example
As a shareholder of a mutual fund, you may incur two types of costs: (1) transaction costs, including sales charges (loads) on purchase payments, or other distributions; redemption fees; and exchange fees; and (2) ongoing costs, including management fees; distribution and/or service (12b-1) fees; and other fund expenses.
This Example is intended to help you understand your ongoing costs (in dollars) of investing in the Fund and to compare these costs with the ongoing costs of investing in other mutual funds. The Example is based on a hypothetical investment of $1,000 invested at the beginning of the period and held for the entire period, July 1, 2004 through December 31, 2004.
Actual Expenses
The columns under the heading entitled “Actual” help you to estimate the actual expenses you paid over the period. The “Actual—Ending Account Value” shown is derived from the Fund’s actual return, and the “Actual — Expenses Paid During Period” shows the dollar amount that would have been paid by an investor who started with $1,000 in the Fund. To estimate the expenses you paid on your account during this period, simply divide your account value by $1,000 (for example, an $8,600 account value divided by $1,000 = 8.60), then multiply the result by the number in the column under the heading entitled “Actual — Expenses Paid During Period”.
Hypothetical Example for Comparison Purposes
The columns under the heading entitled “Hypothetical” provide information about hypothetical account values and hypothetical expenses based on the Fund’s actual expense ratio and an assumed rate of return of 5% per year before expenses, which is not the Fund’s actual return. The hypothetical account values and expenses may not be used to estimate the actual ending account balance or expenses you paid for the period. You may use this information to compare the ongoing costs of investing in the Fund and other funds. To do so, compare this 5% hypothetical example with the 5% hypothetical examples that appear in the shareholder reports of the other funds.
Please note that the expenses shown in the table are meant to highlight your ongoing costs only and do not reflect any transactional costs, such as sales charges (loads), redemption fees, or exchange fees. Therefore, the last column of the table (Hypothetical—Expenses Paid During Period) is useful in comparing ongoing costs only, and will not help you determine the relative total costs of owning different funds. In addition, if these transactional costs were included, your costs could have been higher.
(continued on next page)
18
YOUR FUND’S EXPENSES (Continued) | December 31, 2004 |
Actual Returns vs. Hypothetical Returns
Six Months Ended December 31, 2004
| Class | Fund’s Annualized Expense Ratio1,2 | Beginning Account Value 7-01-04 | Actual | Hypothetical (5% return before expenses) | ||||||||||||||||
| Ending Account Value 12-31-04 | Expenses Paid During Period3 | Ending Account Value 12-31-04 | Expenses Paid During Period3 | |||||||||||||||||
Strong Balanced Fund | Investor | 1.27 | % | $ | 1,000.00 | $ | 1,052.90 | $ | 6.55 | $ | 1,018.75 | $ | 6.44 | |||||||
Strong Large Cap Core Fund | Investor | 1.90 | % | $ | 1,000.00 | $ | 1,059.40 | $ | 9.84 | $ | 1,015.58 | $ | 9.63 | |||||||
Strong Growth and Income Fund | Investor | 1.34 | % | $ | 1,000.00 | $ | 1,062.70 | $ | 6.95 | $ | 1,018.40 | $ | 6.80 | |||||||
| Institutional | 0.79 | % | $ | 1,000.00 | $ | 1,066.00 | $ | 4.10 | $ | 1,021.17 | $ | 4.01 | ||||||||
| Advisor | 1.43 | % | $ | 1,000.00 | $ | 1,062.60 | $ | 7.41 | $ | 1,017.95 | $ | 7.25 | ||||||||
| K | 0.89 | % | $ | 1,000.00 | $ | 1,065.50 | $ | 4.62 | $ | 1,020.66 | $ | 4.52 | ||||||||
Strong Opportunity Fund | Investor | 1.34 | % | $ | 1,000.00 | $ | 1,087.70 | $ | 7.03 | $ | 1,018.40 | $ | 6.80 | |||||||
| Advisor | 1.58 | % | $ | 1,000.00 | $ | 1,086.50 | $ | 8.29 | $ | 1,017.19 | $ | 8.01 | ||||||||
| K | 1.15 | % | $ | 1,000.00 | $ | 1,088.90 | $ | 6.04 | $ | 1,019.36 | $ | 5.84 | ||||||||
| 1 | Based on the Fund’s most recent six-month period; may differ from expense ratios based on one-year data in the Financial Highlights. |
| 2 | These ratios do not include the effect of directed brokerage credits and/or custody earnings credits, if any. |
| 3 | Expenses are equal to the Fund’s annualized expense ratio multiplied by the average account value over the period, multiplied by 184 days, and divided by 366. |
19
SCHEDULES OF INVESTMENTS IN SECURITIES | December 31, 2004 |
| Shares or Principal Amount | Value (Note 2) | ||||
Common Stocks 64.5% | |||||
Aerospace - Defense 1.3% | |||||
General Dynamics Corporation | 9,300 | $ | 972,780 | ||
Northrop Grumman Corporation | 18,500 | 1,005,660 | |||
| 1,978,440 | |||||
Aerospace - Defense Equipment 0.3% | |||||
Goodrich Corporation | 15,500 | 505,920 | |||
Banks - Money Center 2.3% | |||||
Bank of America Corporation | 66,500 | 3,124,835 | |||
J.P. Morgan Chase & Company | 13,416 | 523,358 | |||
| 3,648,193 | |||||
Banks - Super Regional 1.1% | |||||
U.S. Bancorp | 52,100 | 1,631,772 | |||
Building - Resident/Commercial 0.9% | |||||
Toll Brothers, Inc. (b) | 19,500 | 1,337,895 | |||
Chemicals - Basic 1.2% | |||||
The Dow Chemical Company | 36,400 | 1,802,164 | |||
Commercial Services - Miscellaneous 1.9% | |||||
Automatic Data Processing, Inc. | 32,500 | 1,441,375 | |||
Paychex, Inc. | 45,800 | 1,560,864 | |||
| 3,002,239 | |||||
Computer - Data Storage 0.8% | |||||
EMC Corporation (b) | 79,700 | 1,185,139 | |||
Computer - IT Services 1.8% | |||||
International Business Machines Corporation | 28,900 | 2,848,962 | |||
Computer - Manufacturers 2.5% | |||||
Apple Computer, Inc. (b) | 35,300 | 2,273,320 | |||
Dell, Inc. (b) | 37,400 | 1,576,036 | |||
| 3,849,356 | |||||
Computer - Peripheral Equipment 0.9% | |||||
Synaptics, Inc. (b) (g) | 46,500 | 1,421,970 | |||
Computer Software - Desktop 1.8% | |||||
Microsoft Corporation | 103,800 | 2,772,498 | |||
Computer Software - Enterprise 2.6% | |||||
Mercury Interactive Corporation (b) | 34,900 | 1,589,695 | |||
SAP AG Sponsored ADR (g) | 53,600 | 2,369,656 | |||
| 3,959,351 | |||||
Cosmetics - Personal Care 1.7% | |||||
The Procter & Gamble Company | 47,200 | 2,599,776 | |||
Diversified Operations 5.4% | |||||
General Electric Company | 137,400 | 5,015,100 | |||
Tyco International, Ltd. | 64,500 | 2,305,230 | |||
United Technologies Corporation | 10,800 | 1,116,180 | |||
| 8,436,510 | |||||
Electronics - Scientific Measuring 0.7% | |||||
Danaher Corporation (g) | 19,500 | 1,119,495 | |||
Electronics - Semiconductor Manufacturing 1.1% | |||||
Intel Corporation | 27,100 | 633,869 | |||
Maxim Integrated Products, Inc. | 23,800 | 1,008,882 | |||
| 1,642,751 | |||||
Finance - Equity REIT 0.4% | |||||
Vornado Realty Trust | 7,900 | 601,427 | |||
Finance - Investment Brokers 1.9% | |||||
The Goldman Sachs Group, Inc. | 19,800 | $ | 2,059,992 | ||
Morgan Stanley | 16,700 | 927,184 | |||
| 2,987,176 | |||||
Finance - Investment Management 0.4% | |||||
Franklin Resources, Inc. | 10,000 | 696,500 | |||
Finance - Publicly Traded Investment Funds-Equity (Non 40 Act) 0.5% | |||||
Semiconductor Holders Trust (g) | 24,300 | 810,648 | |||
Finance - Savings & Loan 0.4% | |||||
Golden West Financial Corporation | 9,400 | 577,348 | |||
Financial Services - Miscellaneous 0.7% | |||||
American Express Company | 18,400 | 1,037,208 | |||
Insurance - Property/Casualty/Title 0.9% | |||||
The Allstate Corporation | 27,000 | 1,396,440 | |||
Internet - Content 1.8% | |||||
Google, Inc. Class A (b) (g) | 4,600 | 888,260 | |||
Yahoo! Inc. (b) | 50,000 | 1,884,000 | |||
| 2,772,260 | |||||
Internet - E*Commerce 1.5% | |||||
eBay, Inc. (b) | 19,800 | 2,302,344 | |||
Leisure - Hotels & Motels 1.8% | |||||
Marriott International, Inc. Class A | 20,100 | 1,265,898 | |||
Starwood Hotels & Resorts Worldwide, Inc. | 26,200 | 1,530,080 | |||
| 2,795,978 | |||||
Machinery - General Industrial 1.1% | |||||
Ingersoll-Rand Company Class A | 20,800 | 1,670,240 | |||
Media - Books 0.5% | |||||
McGraw-Hill, Inc. | 9,200 | 842,168 | |||
Medical - Biomedical/Biotechnology 1.7% | |||||
Amgen, Inc. (b) | 21,900 | 1,404,885 | |||
Gilead Sciences, Inc. (b) | 33,600 | 1,175,664 | |||
| 2,580,549 | |||||
Medical - Drug/Diversified 1.2% | |||||
Johnson & Johnson | 28,500 | 1,807,470 | |||
Medical - Ethical Drugs 0.7% | |||||
Schering-Plough Corporation | 53,100 | 1,108,728 | |||
Medical - Health Maintenance Organizations 1.6% | |||||
UnitedHealth Group, Inc. | 28,900 | 2,544,067 | |||
Medical - Products 1.4% | |||||
St. Jude Medical, Inc. (b) | 26,800 | 1,123,724 | |||
Zimmer Holdings, Inc. (b) | 13,100 | 1,049,572 | |||
| 2,173,296 | |||||
Medical/Dental - Services 0.6% | |||||
Quest Diagnostics, Inc. (g) | 9,700 | 926,835 | |||
Oil & Gas - Field Services 1.3% | |||||
Halliburton Company | 53,100 | 2,083,644 | |||
20
STRONG BALANCED FUND (Continued)
| Shares or Principal Amount | Value (Note 2) | |||||
Oil & Gas - International Integrated 4.4% | ||||||
ChevronTexaco Corporation | 27,200 | $ | 1,428,272 | |||
ConocoPhillips | 14,200 | 1,232,986 | ||||
Exxon Mobil Corporation | 82,100 | 4,208,446 | ||||
| 6,869,704 | ||||||
Oil & Gas - Machinery/Equipment 0.7% | ||||||
Baker Hughes, Inc. | 24,800 | 1,058,216 | ||||
Oil & Gas - United States Exploration & Production 0.8% | ||||||
Anadarko Petroleum Corporation | 9,700 | 628,657 | ||||
Occidental Petroleum Corporation | 9,400 | 548,584 | ||||
| 1,177,241 | ||||||
Retail - Major Discount Chains 2.2% | ||||||
Target Corporation | 27,600 | 1,433,268 | ||||
Wal-Mart Stores, Inc. | 36,000 | 1,901,520 | ||||
| 3,334,788 | ||||||
Retail/Wholesale - Building Products 1.1% | ||||||
The Home Depot, Inc. | 40,300 | 1,722,422 | ||||
Retail/Wholesale - Office Supplies 0.4% | ||||||
Staples, Inc. | 17,000 | 573,070 | ||||
Telecommunications - Equipment 1.3% | ||||||
Lucent Technologies, Inc. (b) | 550,500 | 2,069,880 | ||||
Telecommunications - Wireless Equipment 2.3% | ||||||
Nokia Corporation Sponsored ADR | 123,400 | 1,933,678 | ||||
QUALCOMM, Inc. | 37,400 | 1,585,760 | ||||
| 3,519,438 | ||||||
Transportation - Air Freight 0.8% | ||||||
FedEx Corporation | 12,000 | 1,181,880 | ||||
Utility - Electric Power 1.8% | ||||||
Entergy Corporation | 24,600 | 1,662,714 | ||||
Exelon Corporation | 27,300 | 1,203,111 | ||||
| 2,865,825 | ||||||
Total Common Stocks (Cost $83,435,845) | 99,829,221 | |||||
Corporate Bonds 12.0% | ||||||
Aladdin Gaming Holdings LLC/Aladdin Capital Corporation Senior Discount Notes, 13.50%, Due 3/01/10 (b) (f) | $ | 3,700,000 | 18,500 | |||
America Movil SA de CV Guaranteed Senior Yankee Notes, 5.50%, Due 3/01/14 | 250,000 | 247,601 | ||||
Bank of America Corporation Subordinated Notes, 7.40%, Due 1/15/11 | 400,000 | 463,925 | ||||
Bellsouth Corporation Notes, 4.75%, Due 11/15/12 | 285,000 | 287,217 | ||||
Capital One Bank Medium-Term Notes, 6.50%, Due 6/13/13 | 210,000 | 229,841 | ||||
Cendant Corporation Notes, 6.25%, Due 3/15/10 | 100,000 | 108,344 | ||||
CenterPoint Energy Resources Corporation Senior Notes, Series B, 7.875%, Due 4/01/13 | 100,000 | 119,045 | ||||
Citigroup, Inc. Notes, 5.50%, Due 8/09/06 | 575,000 | 594,835 | ||||
Citizens Communications Company Notes, 9.25%, Due 5/15/11 | 150,000 | 176,250 | ||||
Comcast Corporation Senior Notes, 5.85%, Due 1/15/10 (g) | 250,000 | 268,284 | ||||
Core Investment Grade Trust Pass-Thru Certificates, 4.727%, Due 11/30/07 (g) | 1,000,000 | 1,024,000 | ||||
Countrywide Home Loans, Inc. Notes, Series L, 4.00%, Due 3/22/11 | $ | 200,000 | $ | 194,716 | ||
Cox Communications, Inc. Notes, 4.625%, Due 1/15/10 (d) | 515,000 | 514,383 | ||||
Credit Suisse First Boston USA, Inc. Notes: | ||||||
4.625%, Due 1/15/08 | 200,000 | 205,084 | ||||
6.50%, Due 1/15/12 | 250,000 | 278,642 | ||||
DaimlerChrysler North America Holding Corporation Guaranteed Notes, 4.05%, Due 6/04/08 | 100,000 | 99,872 | ||||
DaimlerChrysler North America Holding Corporation Notes, 7.75%, Due 1/18/11 | 200,000 | 230,905 | ||||
Devon Financing Corporation ULC Notes, 6.875%, Due 9/30/11 | 200,000 | 226,821 | ||||
Encana Corporation Yankee Notes, 4.60%, Due 8/15/09 (g) | 285,000 | 290,656 | ||||
EOP Operating LP Notes, 6.75%, Due 2/15/12 | 350,000 | 390,174 | ||||
European Investment Bank Yankee Notes (g): | ||||||
3.00%, Due 6/16/08 | 290,000 | 287,766 | ||||
4.625%, Due 3/01/07 | 500,000 | 513,596 | ||||
FedEx Corporation Notes, 2.65%, Due 4/01/07 | 245,000 | 240,089 | ||||
FirstEnergy Corporation Notes, 6.45%, Due 11/15/11 (g) | 150,000 | 163,198 | ||||
Ford Motor Credit Company Notes (g): | ||||||
6.50%, Due 1/25/07 | 250,000 | 260,086 | ||||
7.00%, Due 10/01/13 | 300,000 | 318,561 | ||||
France Telecom SA Yankee Notes, 8.50%, Due 3/01/11 | 350,000 | 418,030 | ||||
General Electric Capital Corporation Notes: | ||||||
2.75%, Due 9/25/06 | 530,000 | 525,033 | ||||
6.50%, Due 12/10/07 (g) | 250,000 | 269,572 | ||||
General Motors Acceptance Corporation Notes, 6.875%, Due 9/15/11 | 370,000 | 379,679 | ||||
Goldman Sachs Group, Inc. Senior Notes, 5.15%, Due 1/15/14 | 275,000 | 279,188 | ||||
Goodrich Corporation Senior Notes, 7.625%, Due 12/15/12 (g) | 100,000 | 118,758 | ||||
Harrah’s Operating, Inc. Guaranteed Senior Notes, 5.50%, Due 7/01/10 | 220,000 | 227,996 | ||||
Highwoods Realty LP Notes, 7.00%, Due 12/01/06 | 400,000 | 418,824 | ||||
Hutchison Whampoa International, Ltd. | ||||||
Guaranteed Yankee Notes, 6.25%, Due 1/24/14 (d) | 200,000 | 211,058 | ||||
JP Morgan Chase & Company Subordinated Notes: | ||||||
5.125%, Due 9/15/14 | 545,000 | 549,616 | ||||
6.625%, Due 3/15/12 | 300,000 | 336,282 | ||||
KB Home Senior Notes, 5.75%, Due 2/01/14 | 295,000 | 293,525 | ||||
Kraft Foods, Inc. Notes, 5.25%, Due 10/01/13 (g) | 305,000 | 314,347 | ||||
Kroger Company Notes, 6.75%, Due 4/15/12 (g) | 100,000 | 113,071 | ||||
M&T Bank Corporation Floating Rate | ||||||
Subordinated Notes, 3.85%, Due 4/01/13 (d) | 250,000 | 247,572 | ||||
Merrill Lynch & Company, Inc. | ||||||
Medium-Term Notes, Tranche #312, 4.00%, Due 11/15/07 (g) | 200,000 | 202,124 | ||||
21
SCHEDULES OF INVESTMENTS IN SECURITIES (continued) | December 31, 2004 |
STRONG BALANCED FUND (continued)
| Shares or Principal Amount | Value (Note 2) | |||||
Morgan Stanley Notes, 5.80%, Due 4/01/07 | $ | 500,000 | $ | 524,461 | ||
Motorola, Inc. Notes, 7.625%, Due 11/15/10 (g) | 150,000 | 174,204 | ||||
National Rural Utilities Cooperative Finance Corporation Notes, 6.50%, Due 3/01/07 | 300,000 | 318,519 | ||||
Norfolk Southern Corporation Senior Notes, 6.00%, Due 4/30/08 | 250,000 | 267,851 | ||||
Normandy Finance, Ltd. Yankee Notes, 7.625%, Due 7/15/08 (d) | 200,000 | 222,830 | ||||
PNC Funding Corporation Subordinated Notes, 6.125%, Due 2/15/09 | 450,000 | 481,915 | ||||
Pemex Project Funding Master Trust Notes, 7.375%, Due 12/15/14 | 150,000 | 167,100 | ||||
Plains All American Pipeline LP Senior Notes, 5.625%, Due 12/15/13 | 150,000 | 154,561 | ||||
Preferred Term Securities XV Variable Rate Yankee Notes, 4.0713%, Due 9/26/34 (d) | 265,000 | 265,000 | ||||
Principal Life Global Funding I Medium-Term Notes, Tranche #23, 3.625%, Due 4/30/08 (d) | 250,000 | 249,112 | ||||
Public Service Company of Colorado Corporate Notes, 7.875%, Due 10/01/12 | 175,000 | 212,302 | ||||
Republic of Italy Yankee Notes, 3.625%, Due 9/14/07 | 300,000 | 300,630 | ||||
SBC Communications, Inc. Notes, 5.10%, Due 9/15/14 | 200,000 | 202,242 | ||||
Safeway, Inc. Notes, 4.80%, Due 7/16/07 | 200,000 | 204,858 | ||||
Salomon Smith Barney Holdings, Inc. Senior Notes, 5.875%, Due 3/15/06 | 510,000 | 526,009 | ||||
Shaw Communications, Inc. Senior Yankee Notes, 7.20%, Due 12/15/11 | 195,000 | 216,206 | ||||
Telus Corporation Yankee Notes, 7.50%, Due 6/01/07 | 150,000 | 163,065 | ||||
Texas Eastern Transmission Corporation Notes, 5.25%, Due 7/15/07 | 200,000 | 206,984 | ||||
Travelers Property and Casualty Corporation Senior Notes, 5.00%, Due 3/15/13 (g) | 150,000 | 146,863 | ||||
Tyco International Group SA Guaranteed Yankee Notes, 6.00%, Due 11/15/13 | 120,000 | 130,962 | ||||
Union Pacific Corporation Notes, 5.75%, Due 10/15/07 | 305,000 | 321,132 | ||||
United Mexican States Yankee Notes, 7.50%, Due 1/14/12 | 200,000 | 227,300 | ||||
Verizon Global Funding Corporation Notes, 4.375%, Due 6/01/13 (g) | 300,000 | 292,835 | ||||
Total Corporate Bonds (Cost $19,068,440) | 18,634,007 | |||||
Non-Agency Mortgage & Asset-Backed Securities 5.5% | ||||||
Asset Securitization Corporation Commercial Mortgage Pass-Thru Certificates, Series 1995-MD4, Class A-1, 7.10%, Due 8/13/29 | 534,062 | 551,661 | ||||
Bear Stearns Commercial Mortgage Securities, Inc. Pass-Thru Certificates, Series 2004-T16, Class A5, 4.60%, Due 2/13/46 | 875,000 | 866,250 | ||||
Citigroup Mortgage Loan Trust Variable Rate Pass-Thru Certificates, Series 2004-HYB4,Class A-IA, 2.75%, Due 12/25/34 | 615,000 | 615,000 | ||||
Community Program Loan Trust Bonds, Series 1987, Class A-4, 4.50%, Due 10/01/18 | $ | 967,746 | $ | 968,597 | ||
Countrywide Home Equity Loan Trust Variable Rate Asset-Backed Notes, Series 2004-I, Class A, 2.6925%, Due 2/15/34 | 923,407 | 924,273 | ||||
CWABS, Inc. Variable Rate Revolving Home Equity Loan Asset-Backed Notes: | ||||||
Series 2002-C, Class A, 2.6425%, Due 5/15/28 | 319,034 | 319,410 | ||||
Series 2004-Q, Class 2A, 2.5172%, Due 12/15/33 | 520,000 | 520,548 | ||||
JP Morgan Chase Commercial Mortgage Securities Corporation Variable Rate Pass-Thru Certificates, Series 2004-C2, Class A2, 5.09%, Due 5/15/41 | 475,000 | 491,953 | ||||
LB-UBS Commercial Mortgage Trust Pass-Thru Certificates, Series 2004-C7,Class A6, 4.786%, Due 10/15/29 | 1,095,000 | 1,091,065 | ||||
Renaissance Home Equity Loan Trust Variable Rate Asset-Backed Certificates, Series 2004-3, Class AF1, 2.6375%, Due 11/25/34 | 645,534 | 645,534 | ||||
Residential Asset Securities Corporation Variable Rate Home Equity Mortgage Asset-Backed Pass-Thru Certificates, Series 2004-KS1, Class AI1, 2.5675%, Due 9/25/20 | 325,741 | 325,751 | ||||
Terwin Mortgage Trust Variable Rate Asset-Backed Certificates, Series 2004-21HE,Class 1-A1, 2.63%, Due 12/25/34 | 435,000 | 435,272 | ||||
USAA Auto Owner Trust Asset-Backed Notes, Series 2004-3, Class A-2, 2.79%, Due 6/15/07 | 560,000 | 558,895 | ||||
Washington Mutual Mortgage Pass-Thru Certificates, Series 2002-AR7, Class A-6, 5.53%, Due 7/25/32 | 202,824 | 203,590 | ||||
Total Non-Agency Mortgage & Asset-Backed Securities (Cost $8,498,097) | 8,517,799 | |||||
United States Government & Agency Issues 14.8% | ||||||
FHLMC Adjustable Rate Guaranteed Mortgage Participation Certificates, Series T-59, Class 2A1, 4.103%, Due 10/25/43 | 499,350 | 509,646 | ||||
FHLMC Adjustable Rate Guaranteed Mortgage Participation Certificates, 4.1189%, Due 7/25/43 | 428,212 | 435,435 | ||||
FHLMC Notes (c): | ||||||
5.50%, Due 7/15/06 | 150,000 | 155,285 | ||||
5.75%, Due 3/15/09 | 1,115,000 | 1,202,608 | ||||
FHLMC Participation Certificates: | ||||||
5.00%, Due 8/01/19 | 860,254 | 874,312 | ||||
8.00%, Due 3/01/16 | 307,843 | 327,468 | ||||
10.25%, Due 3/01/15 | 18,656 | 20,527 | ||||
10.50%, Due 1/01/16 | 3,400 | 3,840 | ||||
FNMA Guaranteed Mortgage Adjustable Rate Pass-Thru Certificates, 6.96%, Due 1/01/07 | 2,038,909 | 2,137,093 | ||||
FNMA Guaranteed Mortgage Pass-Thru Certificates, 5.00%, Due 12/01/18 | 459,737 | 467,679 | ||||
FNMA Guaranteed Real Estate Mortgage Investment Conduit Pass-Thru Trust, 9.50%, Due 11/25/31 | 588,430 | 650,950 | ||||
22
STRONG BALANCED FUND (continued)
| Shares or Principal Amount | Value (Note 2) | ||||||
FNMA Guaranteed Real Estate Mortgage Investment Conduit Trust Pass-Thru Certificates, 4.75%, Due 12/25/42 | $ | 710,000 | $ | 711,985 | |||
FNMA Guaranteed Real Estate Mortgage Investment Conduit Variable Rate Pass-Thru Certificates, Series G92-61,Class FJ, 3.06%, Due 10/25/22 | 47,911 | 48,015 | |||||
FNMA Notes: | |||||||
2.875%, Due 5/19/08 | 575,000 | 561,937 | |||||
3.25%, Due 8/15/08 | 925,000 | 913,579 | |||||
4.375%, Due 10/15/06 (c) | 200,000 | 204,083 | |||||
5.25%, Due 6/15/06 | 1,500,000 | 1,544,777 | |||||
5.50%, Due 2/15/06 | 1,360,000 | 1,396,660 | |||||
5.75%, Due 2/15/08 | 1,000,000 | 1,065,952 | |||||
GNMA Guaranteed Pass-Thru Certificates, 7.50%, Due 12/15/07 | 140,801 | 144,978 | |||||
United States Treasury Bonds, 7.25%, Due 5/15/16 (g) | 1,265,000 | 1,583,820 | |||||
United States Treasury Notes (g): | |||||||
2.25%, Due 2/15/07 | 250,000 | 245,840 | |||||
3.125%, Due 5/15/07 | 495,000 | 494,903 | |||||
3.50%, Due 11/15/09 | 3,545,000 | 3,529,494 | |||||
4.25%, Due 11/15/14 | 1,325,000 | 1,328,882 | |||||
10.375%, Due 11/15/12 | 1,985,000 | 2,367,269 | |||||
Total United States Government & Agency Issues (Cost $22,889,984) | 22,927,017 | ||||||
| Short-Term Investments (a) 12.5% | |||||||
Collateral Received for Securities Lending 9.3% | |||||||
Navigator Prime Portfolio | 14,451,839 | 14,451,839 | |||||
Corporate Bonds 1.2% | |||||||
AOL Time Warner, Inc. Notes, 5.625%, Due 5/01/05 | $ | 300,000 | 302,787 | ||||
Florida Power & Light Company First Mortgage Notes, 6.875%, Due 12/01/05 | 110,000 | 113,739 | |||||
Ford Motor Credit Company Notes, 7.60%, Due 8/01/05 | 160,000 | 163,757 | |||||
KN Energy, Inc. Senior Notes, 6.65%, Due 3/01/05 | 250,000 | 251,597 | |||||
MetLife, Inc. Debentures, 3.911%, Due 5/15/05 | 205,000 | 205,933 | |||||
MidAmerican Energy Holdings Company Senior Notes, 7.23%, Due 9/15/05 | 345,000 | 354,866 | |||||
NiSource Finance Corporation Notes, 7.625%, Due 11/15/05 | 305,000 | 316,176 | |||||
Pioneer National Resources Company Senior Notes, 8.875%, Due 4/15/05 | 200,000 | 203,089 | |||||
| 1,911,944 | |||||||
Repurchase Agreements (e) 2.0% | |||||||
ABN AMRO Inc. (Dated 12/31/04), 2.15%, Due 1/03/05 (Repurchase proceeds $2,100,376); Collateralized by: United States Government & Agency Issues | 2,100,000 | 2,100,000 | |||||
State Street Bank (Dated 12/31/04), 0.85%, Due 1/03/05 (Repurchase proceeds $1,019,072); Collateralized by: United States Government & Agency Issues | 1,019,000 | 1,019,000 | |||||
| 3,119,000 | |||||||
United States Government & Agency Issues 0.0% | |||||||
United States Treasury Bills, Due 2/24/05 (c) | $ | 50,000 | $ | 49,858 | |||
Total Short-Term Investments (Cost $19,511,100) | 19,532,641 | ||||||
Total Investments in Securities (Cost $153,403,466) 109.3% | 169,440,685 | ||||||
Other Assets and Liabilities, Net (9.3%) | (14,466,679 | ) | |||||
Net Assets 100.0% | $ | 154,974,006 | |||||
FUTURES
| Expiration Date | Underlying Face Amount at Value | Unrealized Appreciation/ (Depreciation) | ||||||
Purchased: | ||||||||
5 Ten-Year U.S. Treasury Notes | 3/05 | $ | 559,688 | $ | 5,213 | |||
Shares or Amount | Value (Note 2) | ||||
Common Stocks 91.4% | |||||
Apparel - Shoes & Related Manufacturing 3.3% | |||||
NIKE, Inc. Class B | 1,600 | $ | 145,104 | ||
Banks - Money Center 6.4% | |||||
Bank of America Corporation | 2,800 | 131,572 | |||
Citigroup, Inc. | 3,200 | 154,176 | |||
| 285,748 | |||||
Banks - Super Regional 2.8% | |||||
U.S. Bancorp | 4,000 | 125,280 | |||
Building - Construction Products/ Miscellaneous 2.0% | |||||
Masco Corporation | 2,400 | 87,672 | |||
Building - Resident/Commercial 4.9% | |||||
D.R. Horton, Inc. | 2,850 | 114,884 | |||
Standard Pacific Corporation | 1,600 | 102,624 | |||
| 217,508 | |||||
Computer Software - Desktop 2.5% | |||||
Microsoft Corporation | 4,100 | 109,511 | |||
Cosmetics - Personal Care 2.1% | |||||
The Procter & Gamble Company | 1,700 | 93,636 | |||
Diversified Operations 10.3% | |||||
Emerson Electric Company | 1,500 | 105,150 | |||
General Electric Company | 3,200 | 116,800 | |||
Tyco International, Ltd. | 4,200 | 150,108 | |||
United Technologies Corporation | 800 | 82,680 | |||
| 454,738 | |||||
Finance - Investment Brokers 5.1% | |||||
The Goldman Sachs Group, Inc. | 1,100 | 114,444 | |||
Lehman Brothers Holdings, Inc. | 1,300 | 113,724 | |||
| 228,168 | |||||
Insurance - Diversified 3.3% | |||||
American International Group, Inc. | 2,200 | 144,474 | |||
Internet - Content 3.6% | |||||
Yahoo! Inc. (b) | 4,200 | 158,256 | |||
23
SCHEDULES OF INVESTMENTS IN SECURITIES (continued) | December 31, 2004 |
STRONG LARGE CAP CORE FUND (continued)
| Shares or Principal Amount | Value (Note 2) | |||||
Internet - E*Commerce 3.4% | ||||||
eBay, Inc. (b) | 1,300 | $ | 151,164 | |||
Leisure - Hotels & Motels 3.4% | ||||||
Starwood Hotels & Resorts Worldwide, Inc. | 2,600 | 151,840 | ||||
Metal Ores - Miscellaneous 2.2% | ||||||
Phelps Dodge Corporation | 1,000 | 98,920 | ||||
Oil & Gas - Drilling 2.6% | ||||||
Transocean, Inc. (b) | 2,700 | 114,453 | ||||
Oil & Gas - International Integrated 8.7% | ||||||
ChevronTexaco Corporation | 1,500 | 78,765 | ||||
ConocoPhillips | 2,000 | 173,660 | ||||
Exxon Mobil Corporation | 2,600 | 133,276 | ||||
| 385,701 | ||||||
Oil & Gas - United States Exploration & Production 4.4% | ||||||
Devon Energy Corporation | 2,800 | 108,976 | ||||
Occidental Petroleum Corporation | 1,500 | 87,540 | ||||
| 196,516 | ||||||
Retail - Drug Stores 2.0% | ||||||
Walgreen Company | 2,300 | 88,251 | ||||
Retail - Major Discount Chains 2.0% | ||||||
Target Corporation | 1,700 | 88,281 | ||||
Retail - Restaurants 2.5% | ||||||
McDonald’s Corporation | 3,500 | 112,210 | ||||
Steel - Producers 2.4% | ||||||
Nucor Corporation | 2,000 | 104,680 | ||||
Telecommunications - Wireless Equipment 2.3% | ||||||
QUALCOMM, Inc. | 2,400 | 101,760 | ||||
Telecommunications - Wireless Services 4.7% | ||||||
America Movil ADR Series L | 2,100 | 109,935 | ||||
Mobile Telesystems Sponsored ADR | 700 | 96,957 | ||||
| 206,892 | ||||||
Tobacco 2.1% | ||||||
Altria Group, Inc. | 1,500 | 91,650 | ||||
Transportation - Air Freight 2.4% | ||||||
FedEx Corporation | 1,100 | 108,339 | ||||
Total Common Stocks (Cost $3,382,348) | 4,050,752 | |||||
Short-Term Investments (a) 8.4% | ||||||
Repurchase Agreements (e) | ||||||
State Street Bank (Dated 12/31/04), 0.85%, Due 1/03/05 (Repurchase proceeds $370,926); Collateralized by: United States Government & Agency Issues | $ | 370,900 | 370,900 | |||
Total Short-Term Investments (Cost $370,900) | 370,900 | |||||
Total Investments in Securities (Cost $3,753,248) 99.8% | 4,421,652 | |||||
Other Assets and Liabilities, Net 0.2% | 8,316 | |||||
Net Assets 100.0% | $ | 4,429,968 | ||||
| Shares or Principal Amount | Value (Note 2) | ||||
Common Stocks 99.9% | |||||
Aerospace - Defense 2.1% | |||||
General Dynamics Corporation | 56,100 | $ | 5,868,060 | ||
Northrop Grumman Corporation | 100,300 | 5,452,308 | |||
| 11,320,368 | |||||
Aerospace - Defense Equipment 0.6% | |||||
Goodrich Corporation | 93,100 | 3,038,784 | |||
Banks - Money Center 4.0% | |||||
Bank of America Corporation | 387,000 | 18,185,130 | |||
J.P. Morgan Chase & Company | 71,424 | 2,786,250 | |||
| 20,971,380 | |||||
Banks - Super Regional 1.6% | |||||
U.S. Bancorp | 272,800 | 8,544,096 | |||
Building - Resident/Commercial 1.3% | |||||
Toll Brothers, Inc. (b) | 101,800 | 6,984,498 | |||
Chemicals - Basic 1.8% | |||||
The Dow Chemical Company | 190,500 | 9,431,655 | |||
Commercial Services - Miscellaneous 3.0% | |||||
Automatic Data Processing, Inc. | 170,500 | 7,561,675 | |||
Paychex, Inc. | 240,300 | 8,189,424 | |||
| 15,751,099 | |||||
Computer - Data Storage 1.5% | |||||
EMC Corporation (b) | 541,400 | 8,050,618 | |||
Computer - IT Services 2.0% | |||||
International Business Machines Corporation | 108,700 | 10,715,646 | |||
Computer - Manufacturers 3.8% | |||||
Apple Computer, Inc. (b) | 186,600 | 12,017,040 | |||
Dell, Inc. (b) | 195,800 | 8,251,012 | |||
| 20,268,052 | |||||
Computer Software - Desktop 2.9% | |||||
Microsoft Corporation | 564,500 | 15,077,795 | |||
Computer Software - Enterprise 1.6% | |||||
Mercury Interactive Corporation (b) | 182,900 | 8,331,095 | |||
Cosmetics - Personal Care 2.9% | |||||
The Procter & Gamble Company | 276,600 | 15,235,128 | |||
Diversified Operations 9.0% | |||||
General Electric Company | 726,600 | 26,520,900 | |||
Tyco International, Ltd. | 418,800 | 14,967,912 | |||
United Technologies Corporation | 56,200 | 5,808,270 | |||
| 47,297,082 | |||||
Electronics - Scientific Measuring 1.1% | |||||
Danaher Corporation | 102,400 | 5,878,784 | |||
Electronics - Semiconductor Manufacturing 2.1% | |||||
Intel Corporation | 238,300 | 5,573,837 | |||
Maxim Integrated Products, Inc. | 126,000 | 5,341,140 | |||
| 10,914,977 | |||||
Finance - Equity REIT 0.6% | |||||
Vornado Realty Trust | 43,900 | 3,342,107 | |||
24
STRONG GROWTH AND INCOME FUND (continued)
| Shares or Principal Amount | Value (Note 2) | ||||||
Finance - Investment Brokers 3.4% | |||||||
The Goldman Sachs Group, Inc. | 116,167 | $ | 12,086,015 | ||||
Morgan Stanley | 101,400 | 5,629,728 | |||||
| 17,715,743 | |||||||
Finance - Investment Management 1.1% | |||||||
Franklin Resources, Inc. | 84,900 | 5,913,285 | |||||
Finance - Savings & Loan 0.6% | |||||||
Golden West Financial Corporation | 55,800 | 3,427,236 | |||||
Financial Services - Miscellaneous 1.2% | |||||||
American Express Company | 111,000 | 6,257,070 | |||||
Insurance - Property/Casualty/Title 1.4% | |||||||
The Allstate Corporation | 141,600 | 7,323,552 | |||||
Internet - Internet Content 3.6% | |||||||
Google, Inc. Class A (b) | 36,000 | 6,951,600 | |||||
Yahoo! Inc. (b) | 323,300 | 12,181,944 | |||||
| 19,133,544 | |||||||
Internet - E*Commerce 2.3% | |||||||
eBay, Inc. (b) | 103,700 | 12,058,236 | |||||
Leisure - Hotels & Motels 3.0% | |||||||
Marriott International, Inc. Class A | 121,100 | 7,626,878 | |||||
Starwood Hotels & Resorts Worldwide, Inc. | 137,100 | 8,006,640 | |||||
| 15,633,518 | |||||||
Machinery - General Industrial 1.7% | |||||||
Ingersoll-Rand Company Class A | 109,000 | 8,752,700 | |||||
Media - Books 0.9% | |||||||
McGraw-Hill, Inc. | 53,900 | 4,934,006 | |||||
Medical - Biomedical/Biotechnology 2.9% | |||||||
Amgen, Inc. (b) | 132,400 | 8,493,460 | |||||
Gilead Sciences, Inc. (b) | 191,200 | 6,690,088 | |||||
| 15,183,548 | |||||||
Medical - Drug/Diversified 2.1% | |||||||
Johnson & Johnson | 171,500 | 10,876,530 | |||||
Medical - Ethical Drugs 1.2% | |||||||
Schering-Plough Corporation | 309,900 | 6,470,712 | |||||
Medical - Health Maintenance Organizations 2.6% | |||||||
UnitedHealth Group, Inc. | 156,500 | 13,776,695 | |||||
Medical - Products 2.2% | |||||||
St. Jude Medical, Inc. (b) | 140,800 | 5,903,744 | |||||
Zimmer Holdings, Inc. (b) | 71,000 | 5,688,520 | |||||
| 11,592,264 | |||||||
Medical/Dental - Services 1.0% | |||||||
Quest Diagnostics, Inc. | 58,000 | 5,541,900 | |||||
Oil & Gas - Field Services 2.1% | |||||||
Halliburton Company | 277,700 | 10,896,948 | |||||
Oil & Gas - International Integrated 7.0% | |||||||
ChevronTexaco Corporation | 164,000 | 8,611,640 | |||||
ConocoPhillips | 75,300 | 6,538,299 | |||||
Exxon Mobil Corporation | 429,900 | 22,036,674 | |||||
| 37,186,613 | |||||||
Oil & Gas - Machinery/Equipment 1.0% | |||||||
Baker Hughes, Inc. | 130,000 | $ | 5,547,100 | ||||
Oil & Gas - United States Exploration & Production 0.7% | |||||||
Anadarko Petroleum Corporation | 58,600 | 3,797,866 | |||||
Retail - Major Discount Chains 3.5% | |||||||
Target Corporation | 160,600 | 8,339,958 | |||||
Wal-Mart Stores, Inc. | 188,400 | 9,951,288 | |||||
| 18,291,246 | |||||||
Retail/Wholesale - Building Products 2.0% | |||||||
The Home Depot, Inc. | 242,900 | 10,381,546 | |||||
Retail/Wholesale - Office Supplies 0.6% | |||||||
Staples, Inc. | 89,100 | 3,003,561 | |||||
Telecommunications - Equipment 2.1% | |||||||
Lucent Technologies, Inc. (b) | 2,914,800 | 10,959,648 | |||||
Telecommunications - Wireless Equipment 3.6% | |||||||
Nokia Corporation Sponsored ADR | 645,600 | 10,116,552 | |||||
QUALCOMM, Inc. | 216,340 | 9,172,816 | |||||
| 19,289,368 | |||||||
Transportation - Air Freight 1.3% | |||||||
FedEx Corporation | 72,600 | 7,150,374 | |||||
Utility - Electric Power 2.9% | |||||||
Entergy Corporation | 129,100 | 8,725,869 | |||||
Exelon Corporation | 147,800 | 6,513,546 | |||||
| 15,239,415 | |||||||
Total Common Stocks (Cost $415,545,707) | 527,487,388 | ||||||
Warrants 0.0% | |||||||
Telecommunications - Equipment | |||||||
Lucent Technologies, Expire 12/10/07 (b) | 7,551 | 11,931 | |||||
Total Warrants (Cost $0) | 11,931 | ||||||
Short-Term Investments (a) 2.2% | |||||||
Repurchase Agreements (e) | |||||||
ABN AMRO Inc. (Dated 12/31/04), 2.15%, Due 1/03/05 (Repurchase proceeds $10,201,828); Collateralized by: United States Government & Agency Issues | $ | 10,200,000 | 10,200,000 | ||||
State Street Bank (Dated 12/31/04), 0.85%, Due 1/03/05 (Repurchase proceeds $1,203,485); Collateralized by: United States Government & Agency Issues | 1,203,400 | 1,203,400 | |||||
Total Short-Term Investments (Cost $11,403,400) | 11,403,400 | ||||||
Total Investments in Securities (Cost $426,949,107) 102.1% | 538,902,719 | ||||||
Other Assets and Liabilities, Net (2.1%) | (10,891,908 | ) | |||||
Net Assets 100.0% | $ | 528,010,811 | |||||
25
| SCHEDULES OF INVESTMENTS IN SECURITIES (continued) | December 31, 2004 |
| Shares or Principal Amount | Value (Note 2) | ||||
Common Stocks 87.3% | |||||
Auto/Truck - Original Equipment 2.7% | |||||
Eaton Corporation (g) | 520,000 | $ | 37,627,200 | ||
Magna International, Inc. Class A | 360,000 | 29,718,000 | |||
| 67,345,200 | |||||
Building - Air Conditioning & Heating Products 1.5% | |||||
American Standard Companies, Inc. (b) (g) | 920,000 | 38,014,400 | |||
Building - Construction Products/ Miscellaneous 1.3% | |||||
Mohawk Industries, Inc. (b) (g) | 375,000 | 34,218,750 | |||
Building Products - Wood 1.2% | |||||
Weyerhaeuser Company (g) | 445,000 | 29,912,900 | |||
Chemicals - Specialty 1.8% | |||||
Praxair, Inc. (h) | 1,060,000 | 46,799,000 | |||
Commercial Services – Advertising 1.4% | |||||
The Interpublic Group of Companies, Inc. (b) (g) | 2,730,000 | 36,582,000 | |||
Computer - IT Services 3.6% | |||||
Accenture, Ltd. Class A (b) | 1,090,000 | 29,430,000 | |||
Computer Sciences Corporation (b) (g) | 570,000 | 32,130,900 | |||
Unisys Corporation (b) (g) | 2,940,000 | 29,929,200 | |||
| 91,490,100 | |||||
Computer - Manufacturers 1.2% | |||||
Sun Microsystems, Inc. (b) (g) | 5,730,000 | 30,827,400 | |||
Computer - Software Design 1.3% | |||||
Cadence Design Systems, Inc. (b) (g) | 2,425,000 | 33,489,250 | |||
Computer Software - Desktop 0.7% | |||||
Red Hat, Inc. (b) | 1,315,000 | 17,555,250 | |||
Computer Software - Enterprise 0.7% | |||||
Novell, Inc. (b) (g) | 2,695,000 | 18,191,250 | |||
Computer Software - Financial 1.3% | |||||
DST Systems, Inc. (b) (g) | 625,000 | 32,575,000 | |||
Computer Software - Security 1.3% | |||||
VeriSign, Inc. (b) (g) | 985,000 | 33,017,200 | |||
Electronics - Contract Manufacturing 1.7% | |||||
Flextronics International, Ltd. (b) (g) | 920,000 | 12,714,400 | |||
Sanmina-SCI Corporation (b) (g) | 3,610,000 | 30,576,700 | |||
| 43,291,100 | |||||
Electronics - Miscellaneous Components 3.0% | |||||
Molex, Inc. Class A | 1,600,000 | 42,640,000 | |||
Vishay Intertechnology, Inc. (b) | 2,160,000 | 32,443,200 | |||
| 75,083,200 | |||||
Electronics - Parts Distributors 1.5% | |||||
W.W. Grainger, Inc. | 560,000 | 37,307,200 | |||
Electronics - Scientific Measuring 1.7% | |||||
Waters Corporation (b) | 905,000 | 42,344,950 | |||
Electronics - Semiconductor Manufacturing 1.2% | |||||
SanDisk Corporation (b) (g) | 1,270,000 | 31,711,900 | |||
Finance - Index Tracking Funds 2.8% | |||||
iShares Trust S&P SmallCap 600 Index Fund | 220,000 | $ | 35,778,600 | ||
Standard & Poor’s MidCap 400 Depository Receipts | 280,000 | 33,916,400 | |||
| 69,695,000 | |||||
Finance - Investment Brokers 0.6% | |||||
Legg Mason, Inc. (g) | 225,000 | 16,483,500 | |||
Finance - Investment Management 1.4% | |||||
Mellon Financial Corporation | 1,120,000 | 34,843,200 | |||
Finance - Publicly Traded Investment Funds-Equity (Non 40 Act) 0.7% | |||||
Biotech HOLDRs Trust (g) | 115,000 | 17,585,800 | |||
Financial Services - Miscellaneous 1.3% | |||||
Equifax, Inc. | 120,000 | 3,372,000 | |||
Fiserv, Inc. (b) (g) | 730,000 | 29,338,700 | |||
| 32,710,700 | |||||
Food - Dairy Products 1.4% | |||||
Dean Foods Company (b) | 1,045,000 | 34,432,750 | |||
Insurance - Property/Casualty/Title 3.6% | |||||
ACE, Ltd.(g) | 835,000 | 35,696,250 | |||
MGIC Investment Corporation (g) | 240,000 | 16,538,400 | |||
XL Capital, Ltd. Class A | 500,000 | 38,825,000 | |||
| 91,059,650 | |||||
Internet - Content 1.1% | |||||
CNET Networks, Inc. (b) (g) | 2,560,000 | 28,748,800 | |||
Internet - E*Commerce 2.0% | |||||
Ameritrade Holding Corporation (b) (g) | 2,495,000 | 35,478,900 | |||
IAC/InterActiveCorp (b) (g) | 565,000 | 15,605,300 | |||
| 51,084,200 | |||||
Media - Cable TV 4.2% | |||||
Cablevision Systems New York Group Class A (b) (g) | 1,395,000 | 34,735,500 | |||
Comcast Corporation Class A (Non-Voting) (b) | 1,220,000 | 40,064,800 | |||
The DIRECTV Group, Inc. (b) | 1,910,000 | 31,973,400 | |||
| 106,773,700 | |||||
Media - Newspapers 1.2% | |||||
Tribune Company (g) | 735,000 | 30,972,900 | |||
Media - Radio/TV 2.5% | |||||
Liberty Media Corporation Class A (b) | 3,025,000 | 33,214,500 | |||
The E.W. Scripps Company Class A (g) | 625,000 | 30,175,000 | |||
| 63,389,500 | |||||
Medical - Biomedical/Biotechnology 2.6% | |||||
Genzyme Corporation (b) (g) | 615,000 | 35,713,050 | |||
Protein Design Labs, Inc. (b) (g) | 1,450,000 | 29,957,000 | |||
| 65,670,050 | |||||
Medical - Systems/Equipment 1.2% | |||||
Fisher Scientific International, Inc. (b) (g) | 495,000 | 30,878,100 | |||
Medical/Dental - Supplies 0.7% | |||||
Bausch & Lomb, Inc. (g) | 255,000 | 16,437,300 | |||
Metal Ores - Gold/Silver 1.6% | |||||
Barrick Gold Corporation | 1,628,000 | 39,430,160 | |||
Metal Products - Fasteners 1.2% | |||||
Illinois Tool Works, Inc. | 315,000 | 29,194,200 | |||
26
STRONG OPPORTUNITY FUND (continued)
| Shares or Principal Amount | Value (Note 2) | |||||||
Oil & Gas - Drilling 3.5% | ||||||||
ENSCO International, Inc. (g) | 1,130,000 | $ | 35,866,200 | |||||
GlobalSantaFe Corporation | 1,580,000 | 52,313,800 | ||||||
| 88,180,000 | ||||||||
Oil & Gas - International Integrated 1.4% | ||||||||
ConocoPhillips | 405,000 | 35,166,150 | ||||||
Oil & Gas - Machinery/Equipment 2.5% | ||||||||
Weatherford International, Ltd. (b) (g) | 1,215,000 | 62,329,500 | ||||||
Oil & Gas - United States Exploration & Production 3.3% | ||||||||
Apache Corporation | 905,000 | 45,765,850 | ||||||
Devon Energy Corporation | 950,000 | 36,974,000 | ||||||
| 82,739,850 | ||||||||
Pollution Control - Services 1.4% | ||||||||
Waste Management, Inc. | 1,140,000 | 34,131,600 | ||||||
Retail - Clothing/Shoes 3.0% | ||||||||
Nordstrom, Inc. (g) | 860,000 | 40,187,800 | ||||||
The TJX Companies, Inc. | 1,430,000 | 35,935,900 | ||||||
| 76,123,700 | ||||||||
Retail - Discount & Variety 1.3% | ||||||||
Dollar Tree Stores, Inc. (b) (g) | 1,160,000 | 33,268,800 | ||||||
Retail - Major Discount Chains 1.3% | ||||||||
Target Corporation | 625,000 | 32,456,250 | ||||||
Retail - Restaurants 1.3% | ||||||||
Darden Restaurants, Inc. (g) | 1,145,000 | 31,762,300 | ||||||
Retail - Super/Mini Markets 1.2% | ||||||||
Safeway, Inc. (b) | 1,565,000 | 30,893,100 | ||||||
Retail/Wholesale - Auto Parts 1.4% | ||||||||
AutoNation, Inc. (b) (g) | 1,905,000 | 36,595,050 | ||||||
Retail/Wholesale - Office Supplies 1.3% | ||||||||
Staples, Inc. (g) | 1,000,000 | 33,710,000 | ||||||
Telecommunications - Services 1.4% | ||||||||
Sprint Corporation | 1,435,000 | 35,659,750 | ||||||
Telecommunications - Wireless Services 1.3% | ||||||||
United States Cellular Corporation (b) | 740,000 | 33,122,400 | ||||||
Transportation - Airline 1.1% | ||||||||
Northwest Airlines Corporation Class A (b) (g) | 2,585,000 | 28,254,050 | ||||||
Utility - Gas Distribution 1.4% | ||||||||
NiSource, Inc. (g) | 1,525,000 | 34,739,500 | ||||||
Total Common Stocks (Cost $1,557,037,060) | 2,208,277,560 | |||||||
Call Options Purchased 0.0% | ||||||||
Chemicals - Specialty | ||||||||
Pharmaceutical Index | 48,000 | 835,200 | ||||||
Total Call Options Purchased (Cost $553,440) | 835,200 | |||||||
Short-Term Investments (a) 16.9% | ||||||||
Collateral Received for Securities Lending 3.4% | ||||||||
Navigator Prime Portfolio | 86,476,263 | $ | 86,476,263 | |||||
Repurchase Agreements (e) 12.9% | ||||||||
ABN AMRO Inc. (Dated 12/31/04), 2.15%, Due 1/03/05 (Repurchase proceeds $320,157,351); Collateralized by: United States Government & Agency Issues | $ | 320,100,000 | 320,100,000 | |||||
States Street Bank (Dated 12/31/04), 0.85%, Due 1/03/05 (Repurchase proceeds $4,986,253); Collateralized by: United States Government & Agency Issues | 4,985,900 | 4,985,900 | ||||||
| 325,085,900 | ||||||||
United States Government & Agency Issues 0.6% | ||||||||
United States Treasury Bills, Due 1/13/05 (i) | 14,400,000 | 14,392,987 | ||||||
Total Short-Term Investments (Cost $425,954,027) | 425,955,150 | |||||||
Total Investments in Securities (Cost $1,983,544,527) 104.2% | 2,635,067,910 | |||||||
Other Assets and Liabilities, Net (4.2%) | (106,795,997 | ) | ||||||
Net Assets 100.0% | $ | 2,528,271,913 | ||||||
WRITTEN OPTIONS ACTIVITY | ||||||||
| Contracts | Premiums | |||||||
Options outstanding at beginning of year | — | $ | — | |||||
Options written during the year | 1,980 | 1,139,544 | ||||||
Options closed | (1,000 | ) | (284,493 | ) | ||||
Options expired | — | — | ||||||
Options exercised | (427 | ) | (321,523 | ) | ||||
Options outstanding at end of year | 553 | $ | 533,528 | |||||
WRITTEN OPTIONS DETAIL | ||||||||
Contracts (100 shares per contract) | Value (Note 2) | |||||||
Call: | ||||||||
Praxair, Inc. (Strike Price is $35.00. Expiration date is 1/22/05. Premium received is $54,968.) | 73 | $ | (67,890 | ) | ||||
Put: | ||||||||
Pharmaceutical Index (Strike Price is $300.00. Expiration date is 1/22/05. Premium received is $478,560.) | 480 | (28,800 | ) | |||||
| 553 | $ | (96,690 | ) | |||||
LEGEND
| (a) | Short-term investments include any security which has a remaining maturity of less than one year and investments in money market funds. |
| (b) | Non-income producing security. In case of debt security, generally denotes that the issuer has defaulted on the payment of principal or interest, the issuer has filed for bankruptcy, or the Fund has halted accruing income. |
| (c) | All or a portion of security is pledged to cover margin requirements on open futures contracts. |
| (d) | Restricted security. |
| (e) | See Note 2(J) of Notes to Financial Statements. |
| (f) | Illiquid security. |
| (g) | All or a portion of security is on loan. See Note 2(K) of Notes to Financial Statements. |
| (h) | All or a portion of these securities are held in conjunction with open written option contracts. |
| (i) | All or a portion of security is pledged as collateral to cover open written option contracts. |
Percentages are stated as a percent of net assets.
See Notes to Financial Statements.
27
STATEMENTS OF ASSETS AND LIABILITIES
December 31, 2004
(In Thousands, Except Per Share Amounts)
| ||||||||
Strong Balanced Fund | Strong Large Cap Core Fund | |||||||
Assets: | ||||||||
Investments in Securities, at Value (Cost of $153,403, and $3,753, respectively) | $ | 169,441 | $ | 4,422 | ||||
Receivable for Securities Sold | 3 | — | ||||||
Receivable for Fund Shares Sold | 16 | 4 | ||||||
Dividends and Interest Receivable | 633 | 7 | ||||||
Variation Margin Receivable | 1 | — | ||||||
Other Assets | 16 | 4 | ||||||
Total Assets | 170,110 | 4,437 | ||||||
Liabilities: | ||||||||
Payable for Fund Shares Redeemed | 612 | — | ||||||
Payable Upon Return of Securities on Loan | 14,452 | — | ||||||
Accrued Operating Expenses and Other Liabilities | 72 | 7 | ||||||
Total Liabilities | 15,136 | 7 | ||||||
Net Assets | $ | 154,974 | $ | 4,430 | ||||
Net Assets Consist of: | ||||||||
Capital Stock (Par Value and Paid-in Capital) | $ | 157,687 | $ | 4,606 | ||||
Undistributed Net Investment Income (Loss) | — | — | ||||||
Accumulated Net Realized Gain (Loss) | (18,755 | ) | (844 | ) | ||||
Net Unrealized Appreciation/Depreciation | 16,042 | 668 | ||||||
Net Assets | $ | 154,974 | $ | 4,430 | ||||
Capital Shares Outstanding (Unlimited Number Authorized) | 7,896 | 407 | ||||||
Net Asset Value Per Share – Investor Class | $ | 19.63 | $ | 10.88 | ||||
See Notes to Financial Statements.
28
STATEMENTS OF ASSETS AND LIABILITIES (continued)
December 31, 2004
(In Thousands, Except As Noted)
| ||||
Strong Growth and Income Fund | ||||
Assets: | ||||
Investments in Securities, at Value (Cost of $426,949) | $ | 538,903 | ||
Receivable for Fund Shares Sold | 477 | |||
Dividends and Interest Receivable | 613 | |||
Other Assets | 52 | |||
Total Assets | 540,045 | |||
Liabilities: | ||||
Payable for Fund Shares Redeemed | 11,785 | |||
Accrued Operating Expenses and Other Liabilities | 249 | |||
Total Liabilities | 12,034 | |||
Net Assets | $ | 528,011 | ||
Net Assets Consist of: | ||||
Capital Stock (Par Value and Paid-in Capital) | $ | 562,753 | ||
Undistributed Net Investment Income (Loss) | 257 | |||
Accumulated Net Realized Gain (Loss) | (146,953 | ) | ||
Net Unrealized Appreciation/Depreciation | 111,954 | |||
Net Assets | $ | 528,011 | ||
Investor Class ($ and shares in full) | ||||
Net Assets | $ | 465,228,210 | ||
Capital Shares Outstanding (Unlimited Number Authorized) | 21,805,829 | |||
Net Asset Value Per Share | $ | 21.33 | ||
Institutional Class ($ and shares in full) | ||||
Net Assets | $ | 36,878,776 | ||
Capital Shares Outstanding (Unlimited Number Authorized) | 1,722,315 | |||
Net Asset Value Per Share | $ | 21.41 | ||
Advisor Class ($ and shares in full) | ||||
Net Assets | $ | 6,068,028 | ||
Capital Shares Outstanding (Unlimited Number Authorized) | 286,029 | |||
Net Asset Value Per Share | $ | 21.21 | ||
Class K ($ and shares in full) | ||||
Net Assets | $ | 19,835,797 | ||
Capital Shares Outstanding (Unlimited Number Authorized) | 936,752 | |||
Net Asset Value Per Share | $ | 21.17 | ||
See Notes to Financial Statements.
29
STATEMENTS OF ASSETS AND LIABILITIES (continued)
December 31, 2004
(In Thousands, Except As Noted)
| ||||
Strong Opportunity Fund | ||||
Assets: | ||||
Investments in Securities, at Value (Cost of $1,983,545) (Including Repurchase Agreements of $325,086) | $ | 2,635,068 | ||
Receivable for Securities Sold | 42,800 | |||
Receivable for Fund Shares Sold | 1,978 | |||
Dividends and Interest Receivable | 576 | |||
Other Assets | 262 | |||
Total Assets | 2,680,684 | |||
Liabilities: | ||||
Payable for Securities Purchased | 43,877 | |||
Written Options, at Value (Premiums Received of $534) | 97 | |||
Payable for Fund Shares Redeemed | 21,207 | |||
Payable Upon Return of Securities on Loan | 86,476 | |||
Accrued Operating Expenses and Other Liabilities | 755 | |||
Total Liabilities | 152,412 | |||
Net Assets | $ | 2,528,272 | ||
Net Assets Consist of: | ||||
Capital Stock (Par Value and Paid-in Capital) | $ | 1,903,324 | ||
Undistributed Net Investment Income (Loss) | — | |||
Accumulated Net Realized Gain (Loss) | (27,014 | ) | ||
Net Unrealized Appreciation/Depreciation | 651,962 | |||
Net Assets | $ | 2,528,272 | ||
Investor Class ($ and shares in full) | ||||
Net Assets | $ | 2,389,496,092 | ||
Capital Shares Outstanding (Unlimited Number Authorized) | 51,492,202 | |||
Net Asset Value Per Share | $ | 46.40 | ||
Advisor Class ($ and shares in full) | ||||
Net Assets | $ | 137,438,892 | ||
Capital Shares Outstanding (Unlimited Number Authorized) | 3,006,858 | |||
Net Asset Value Per Share | $ | 45.71 | ||
Class K ($ and shares in full) | ||||
Net Assets | $ | 1,336,929 | ||
Capital Shares Outstanding (Unlimited Number Authorized) | 28,659 | |||
Net Asset Value Per Share | $ | 46.65 | ||
See Notes to Financial Statements.
30
For the Year Ended December 31, 2004
(In Thousands)
| ||||||||
| Strong Balanced Fund | Strong Large Cap Core Fund | |||||||
Income: | ||||||||
Dividends (net of foreign withholding taxes of $4 and $0) | $ | 1,880 | $ | 67 | ||||
Interest | 2,318 | 2 | ||||||
Total Income | 4,198 | 69 | ||||||
Expenses: | ||||||||
Investment Advisory Fees | 929 | 29 | ||||||
Administrative Fees | 500 | 12 | ||||||
Custodian Fees | 32 | 2 | ||||||
Shareholder Servicing Costs | 522 | 26 | ||||||
Reports to Shareholders | 94 | 10 | ||||||
Professional Fees | 44 | 12 | ||||||
Federal and State Registration Fees | 27 | 17 | ||||||
Other | 40 | 3 | ||||||
Total Expenses before Expense Waivers and Offsets | 2,188 | 111 | ||||||
Expense Waivers and Offsets (Note 4) | (76 | ) | (39 | ) | ||||
Expenses, Net | 2,112 | 72 | ||||||
Net Investment Income (Loss) | 2,086 | (3 | ) | |||||
Realized and Unrealized Gain (Loss): | ||||||||
Net Realized Gain (Loss) on: | ||||||||
Investments | 13,196 | 520 | ||||||
Futures Contracts | (25 | ) | — | |||||
Net Realized Gain (Loss) | 13,171 | 520 | ||||||
Net Change in Unrealized Appreciation/Depreciation on: | ||||||||
Investments | (4,485 | ) | (157 | ) | ||||
Futures Contracts | 2 | — | ||||||
Net Change in Unrealized Appreciation/Depreciation | (4,483 | ) | (157 | ) | ||||
Net Gain (Loss) on Investments | 8,688 | 363 | ||||||
Net Increase (Decrease) in Net Assets Resulting from Operations | $ | 10,774 | $ | 360 | ||||
See Notes to Financial Statements.
31
STATEMENTS OF OPERATIONS (continued)
For the Year Ended December 31, 2004
(In Thousands)
| ||||
| Strong Growth and Income Fund | ||||
Income: | ||||
Dividends (net of foreign withholding taxes of $11) | $ | 10,636 | ||
Interest | 52 | |||
Total Income | 10,688 | |||
Expenses (Note 4): | ||||
Investment Advisory Fees | 3,391 | |||
Administrative Fees | 1,663 | |||
Custodian Fees | 39 | |||
Shareholder Servicing Costs | 2,304 | |||
12b-1 Fees | 17 | |||
Reports to Shareholders | 431 | |||
Other | 302 | |||
Total Expenses before Expense Waivers and Offsets | 8,147 | |||
Expense Waivers and Offsets | (309 | ) | ||
Expenses, Net | 7,838 | |||
Net Investment Income (Loss) | 2,850 | |||
Realized and Unrealized Gain (Loss): | ||||
Net Realized Gain (Loss) on Investments | 109,887 | |||
Net Change in Unrealized Appreciation/Depreciation | (67,388 | ) | ||
Net Gain (Loss) on Investments | 42,499 | |||
Net Increase (Decrease) in Net Assets Resulting from Operations | $ | 45,349 | ||
See Notes to Financial Statements.
32
STATEMENTS OF OPERATIONS (continued)
For the Year Ended December 31, 2004
(In Thousands)
| ||||
| Strong Opportunity Fund | ||||
Income: | ||||
Dividends (net of foreign withholding taxes of $ 131) | $ | 18,379 | ||
Interest | 2,251 | |||
Total Income | 20,630 | |||
Expenses (Note 4): | ||||
Investment Advisory Fees | 19,392 | |||
Administrative Fees | 7,756 | |||
Custodian Fees | 150 | |||
Shareholder Servicing Costs | 6,713 | |||
12b-1 Fees | 337 | |||
Reports to Shareholders | 1,107 | |||
Other | 846 | |||
Total Expenses before Expense Waivers and Offsets | 36,301 | |||
Expense Waivers and Offsets | (1,088 | ) | ||
Expenses, Net | 35,213 | |||
Net Investment Income (Loss) | (14,583 | ) | ||
Realized and Unrealized Gain (Loss): | ||||
Net Realized Gain (Loss) on: | ||||
Investments | 428,692 | |||
Written Options | 121 | |||
Foreign Currencies | (4 | ) | ||
Net Realized Gain (Loss) | 428,809 | |||
Net Change in Unrealized Appreciation/Depreciation on: | ||||
Investments | 2,439 | |||
Written Options | 437 | |||
Foreign Currencies | 1 | |||
Net Change in Unrealized Appreciation/Depreciation | 2,877 | |||
Net Gain (Loss) on Investments | 431,686 | |||
Net Increase (Decrease) in Net Assets Resulting from Operations | $ | 417,103 | ||
See Notes to Financial Statements.
33
STATEMENTS OF CHANGES IN NET ASSETS
(In Thousands)
| ||||||||
| Strong Balanced Fund | ||||||||
| Year Ended Dec. 31, 2004 | Year Ended Dec. 31, 2003 | |||||||
Operations: | ||||||||
Net Investment Income (Loss) | $ | 2,086 | $ | 2,364 | ||||
Net Realized Gain (Loss) | 13,171 | 17,341 | ||||||
Net Change in Unrealized Appreciation/Depreciation | (4,483 | ) | 15,228 | |||||
Net Increase (Decrease) in Net Assets Resulting from Operations | 10,774 | 34,933 | ||||||
Distributions from Net Investment Income | (2,151 | ) | (2,605 | ) | ||||
Capital Share Transactions (Note 8): | ||||||||
Net Increase (Decrease) in Net Assets from Capital Share Transactions | (62,604 | ) | (41,388 | ) | ||||
Total Increase (Decrease) in Net Assets | (53,981 | ) | (9,060 | ) | ||||
Net Assets: | ||||||||
Beginning of Year | 208,955 | 218,015 | ||||||
End of Year | $ | 154,974 | $ | 208,955 | ||||
Undistributed Net Investment Income (Loss) | $ | — | $ | — | ||||
Strong Large Cap Core Fund | ||||||||
| Year Ended Dec. 31, 2004 | Year Ended Dec. 31, 2003 | |||||||
Operations: | ||||||||
Net Investment Income (Loss) | $ | (3 | ) | $ | — | |||
Net Realized Gain (Loss) | 520 | (336 | ) | |||||
Net Change in Unrealized Appreciation/Depreciation | (157 | ) | 1,205 | |||||
Net Increase (Decrease) in Net Assets Resulting from Operations | 360 | 869 | ||||||
Distributions From Net Investment Income | — | — | ||||||
Capital Share Transactions (Note 8): | ||||||||
Net Increase (Decrease) in Net Assets from Capital Share Transactions | 16 | (1,086 | ) | |||||
Total Increase (Decrease) in Net Assets | 376 | (217 | ) | |||||
Net Assets: | ||||||||
Beginning of Year | 4,054 | 4,271 | ||||||
End of Year | $ | 4,430 | $ | 4,054 | ||||
Undistributed Net Investment Income (Loss) | $ | — | $ | — | ||||
See Notes to Financial Statements.
34
STATEMENTS OF CHANGES IN NET ASSETS (continued)
(In Thousands)
| ||||||||
| Strong Growth and Income Fund | ||||||||
Year Ended Dec. 31, 2004 | Year Ended Dec. 31, 2003 | |||||||
Operations: | ||||||||
Net Investment Income (Loss) | $ | 2,850 | $ | 2,534 | ||||
Net Realized Gain (Loss) | 109,887 | 18,558 | ||||||
Net Change in Unrealized Appreciation/Depreciation | (67,388 | ) | 142,318 | |||||
Net Increase (Decrease) in Net Assets Resulting from Operations | 45,349 | 163,410 | ||||||
Distributions: | ||||||||
From Net Investment Income: | ||||||||
Investor Class | (2,205 | ) | (1,427 | ) | ||||
Institutional Class | (468 | ) | (858 | ) | ||||
Advisor Class | (27 | ) | (23 | ) | ||||
Class K | (189 | ) | (214 | ) | ||||
Total Distributions | (2,889 | ) | (2,522 | ) | ||||
Capital Share Transactions (Note 8): | ||||||||
Net Increase (Decrease) in Net Assets from Capital Share Transactions | (269,437 | ) | (84,622 | ) | ||||
Total Increase (Decrease) in Net Assets | (226,977 | ) | 76,266 | |||||
Net Assets: | ||||||||
Beginning of Year | 754,988 | 678,722 | ||||||
End of Year | $ | 528,011 | $ | 754,988 | ||||
Undistributed Net Investment Income (Loss) | $ | 257 | $ | 279 | ||||
See Notes to Financial Statements.
35
STATEMENTS OF CHANGES IN NET ASSETS (continued)
(In Thousands)
| ||||||||
| Strong Opportunity Fund | ||||||||
| Year Ended Dec. 31, 2004 | Year Ended Dec. 31, 2003 | |||||||
Operations: | ||||||||
Net Investment Income (Loss) | $ | (14,583 | ) | $ | (12,170 | ) | ||
Net Realized Gain (Loss) | 428,809 | (1,598 | ) | |||||
Net Change in Unrealized Appreciation/Depreciation | 2,877 | 908,575 | ||||||
Net Increase (Decrease) in Net Assets Resulting from Operations | 417,103 | 894,807 | ||||||
Distributions From Net Investment Income | — | — | ||||||
Capital Share Transactions (Note 8): | ||||||||
Net Increase (Decrease) in Net Assets from Capital Share Transactions | (738,928 | ) | (656,258 | ) | ||||
Total Increase (Decrease) in Net Assets | (321,825 | ) | 238,549 | |||||
Net Assets: | ||||||||
Beginning of Year | 2,850,097 | 2,611,548 | ||||||
End of Year | $ | 2,528,272 | $ | 2,850,097 | ||||
Undistributed Net Investment Income (Loss) | $ | — | $ | — | ||||
See Notes to Financial Statements.
36
STRONG BALANCED FUND
| Year Ended | ||||||||||||||||||||||||
| Dec. 31, 2004 | Dec. 31, 2003 | Dec. 31, 2002 | Dec. 31, 2001 | Dec. 31, 2000(b) | Oct. 31, 2000 | |||||||||||||||||||
Selected Per-Share Data(a) | ||||||||||||||||||||||||
Net Asset Value, Beginning of Period | $ | 18.62 | $ | 16.06 | $ | 18.84 | $ | 21.83 | $ | 24.77 | $ | 24.92 | ||||||||||||
Income From Investment Operations: | ||||||||||||||||||||||||
Net Investment Income (Loss) | 0.25 | 0.19 | 0.40 | 0.58 | 0.12 | 0.82 | ||||||||||||||||||
Net Realized and Unrealized Gains (Losses) on Investments | 1.02 | 2.58 | (2.77 | ) | (2.99 | ) | (1.53 | ) | 0.61 | |||||||||||||||
Total from Investment Operations | 1.27 | 2.77 | (2.37 | ) | (2.41 | ) | (1.41 | ) | 1.43 | |||||||||||||||
Less Distributions: | ||||||||||||||||||||||||
From Net Investment Income | (0.26 | ) | (0.21 | ) | (0.41 | ) | (0.58 | ) | (0.20 | ) | (0.83 | ) | ||||||||||||
From Net Realized Gains | — | — | — | — | (1.33 | ) | (0.75 | ) | ||||||||||||||||
Total Distributions | (0.26 | ) | (0.21 | ) | (0.41 | ) | (0.58 | ) | (1.53 | ) | (1.58 | ) | ||||||||||||
Net Asset Value, End of Period | $ | 19.63 | $ | 18.62 | $ | 16.06 | $ | 18.84 | $ | 21.83 | $ | 24.77 | ||||||||||||
Ratios and Supplemental Data | ||||||||||||||||||||||||
Total Return(c) | +6.86 | % | +17.36 | % | –12.65 | % | –11.03 | % | –5.60 | % | +5.66 | % | ||||||||||||
Net Assets, End of Period (In Millions) | $ | 155 | $ | 209 | $ | 218 | $ | 300 | $ | 347 | $ | 372 | ||||||||||||
Ratio of Expenses to Average Net Assets before Expense Waivers and Offsets | 1.3 | % | 1.3 | % | 1.3 | % | 1.2 | % | 1.1 | %* | 1.1 | % | ||||||||||||
Ratio of Expenses to Average Net Assets | 1.3 | % | 1.3 | % | 1.3 | % | 1.2 | % | 1.1 | %* | 1.1 | % | ||||||||||||
Ratio of Net Investment Income (Loss) to Average Net Assets | 1.3 | % | 1.1 | % | 2.3 | % | 2.9 | % | 3.3 | %* | 3.2 | % | ||||||||||||
Portfolio Turnover Rate | 147.5 | % | 204.7 | % | 225.5 | % | 234.1 | % | 45.1 | % | 150.9 | % | ||||||||||||
STRONG LARGE CAP CORE FUND
| Year Ended | ||||||||||||||||||||
| Dec. 31, 2004 | Dec. 31, 2003 | Dec. 31, 2002 | Dec. 31, 2001 | Dec. 31, 2000 | ||||||||||||||||
Selected Per-Share Data(a) | ||||||||||||||||||||
Net Asset Value, Beginning of Period | $ | 10.01 | $ | 8.05 | $ | 11.01 | $ | 12.40 | $ | 13.85 | ||||||||||
Income From Investment Operations: | ||||||||||||||||||||
Net Investment Income (Loss) | (0.01 | ) | — | (0.08 | ) | (0.10 | ) | (0.09 | ) | |||||||||||
Net Realized and Unrealized Gains (Losses) on Investments | 0.88 | 1.96 | (2.88 | ) | (1.29 | ) | (1.19 | ) | ||||||||||||
Total from Investment Operations | 0.87 | 1.96 | (2.96 | ) | (1.39 | ) | (1.28 | ) | ||||||||||||
Less Distributions: | ||||||||||||||||||||
From Net Investment Income | — | — | — | — | — | |||||||||||||||
From Net Realized Gains | — | — | — | — | (0.17 | ) | ||||||||||||||
Total Distributions | — | — | — | — | (0.17 | ) | ||||||||||||||
Net Asset Value, End of Period | $ | 10.88 | $ | 10.01 | $ | 8.05 | $ | 11.01 | $ | 12.40 | ||||||||||
Ratios and Supplemental Data | ||||||||||||||||||||
Total Return(c) | +8.69 | % | +24.35 | % | –26.88 | % | –11.21 | % | –9.19 | % | ||||||||||
Net Assets, End of Period (In Millions) | $ | 4 | $ | 4 | $ | 4 | $ | 6 | $ | 6 | ||||||||||
Ratio of Expenses to Average Net Assets before Expense Waivers and Offsets | 2.8 | % | 3.0 | % | 2.5 | % | 2.7 | % | 2.0 | % | ||||||||||
Ratio of Expenses to Average Net Assets | 1.8 | % | 1.7 | % | 1.8 | % | 2.0 | % | 2.0 | % | ||||||||||
Ratio of Net Investment Income (Loss) to Average Net Assets | (0.1 | )% | (0.0 | )(d)% | (0.9 | )% | (1.1 | )% | (0.8 | )% | ||||||||||
Portfolio Turnover Rate | 185.7 | % | 105.5 | % | 269.3 | % | 196.4 | % | 154.9 | % | ||||||||||
| * | Calculated on an annualized basis. |
| (a) | Information presented relates to a share of capital stock of the Fund outstanding for the entire period. |
| (b) | In 2000, the Fund changed its fiscal year-end from October to December. |
| (c) | Total return assumes dividend reinvestment and does not reflect the effect of sales charges. |
| (d) | Amount calculated is less than 0.05%. |
See Notes to Financial Statements.
37
FINANCIAL HIGHLIGHTS (continued)
STRONG GROWTH AND INCOME FUND — INVESTOR CLASS
| Year Ended | ||||||||||||||||||||||||
| Dec. 31, 2004 | Dec. 31, 2003 | Dec. 31, 2002 | Dec. 31, 2001 | Dec. 31, 2000(b) | Oct. 31, 2000 | |||||||||||||||||||
Selected Per-Share Data(a) | ||||||||||||||||||||||||
Net Asset Value, Beginning of Period | $ | 19.68 | $ | 15.85 | $ | 20.28 | $ | 25.37 | $ | 28.34 | $ | 25.26 | ||||||||||||
Income From Investment Operations: | ||||||||||||||||||||||||
Net Investment Income (Loss) | 0.09 | 0.04 | (c) | 0.02 | (0.02 | ) | (0.00 | )(d) | (0.09 | ) | ||||||||||||||
Net Realized and Unrealized Gains (Losses) on Investments | 1.66 | 3.83 | (4.45 | ) | (5.07 | ) | (2.65 | ) | 3.19 | |||||||||||||||
Total from Investment Operations | 1.75 | 3.87 | (4.43 | ) | (5.09 | ) | (2.65 | ) | 3.10 | |||||||||||||||
Less Distributions: | ||||||||||||||||||||||||
From Net Investment Income | (0.10 | ) | (0.04 | ) | (0.00 | )(d) | — | — | — | |||||||||||||||
From Net Realized Gains | — | — | — | — | (0.32 | ) | (0.02 | ) | ||||||||||||||||
Total Distributions | (0.10 | ) | (0.04 | ) | (0.00 | )(d) | — | (0.32 | ) | (0.02 | ) | |||||||||||||
Net Asset Value, End of Period | $ | 21.33 | $ | 19.68 | $ | 15.85 | $ | 20.28 | $ | 25.37 | $ | 28.34 | ||||||||||||
Ratios and Supplemental Data | ||||||||||||||||||||||||
Total Return(e) | +8.88 | % | +24.44 | % | –21.83 | % | –20.06 | % | –9.33 | % | +12.29 | % | ||||||||||||
Net Assets, End of Period (In Millions) | $ | 465 | $ | 633 | $ | 582 | $ | 886 | $ | 1,109 | $ | 1,228 | ||||||||||||
Ratio of Expenses to Average Net Assets before Expense Waivers and Offsets | 1.4 | % | 1.4 | % | 1.4 | % | 1.3 | % | 1.1 | %* | 1.1 | % | ||||||||||||
Ratio of Expenses to Average Net Assets | 1.4 | % | 1.4 | % | 1.4 | % | 1.3 | % | 1.1 | %* | 1.1 | % | ||||||||||||
Ratio of Net Investment Income (Loss) to Average Net Assets | 0.4 | % | 0.2 | % | 0.1 | % | (0.1 | )% | (0.0 | )*(d)% | (0.4 | )% | ||||||||||||
Portfolio Turnover Rate(f) | 135.5 | % | 199.4 | % | 187.8 | % | 171.9 | % | 23.3 | % | 122.0 | % | ||||||||||||
| STRONG GROWTH AND INCOME FUND — INSTITUTIONAL CLASS | ||||||||||||||||||||||||
| Year Ended | ||||||||||||||||||||||||
| Dec. 31, 2004 | Dec. 31, 2003 | Dec. 31, 2002 | Dec. 31, 2001 | Dec. 31, 2000(b) | Oct. 31, 2000 (g) | |||||||||||||||||||
Selected Per-Share Data(a) | ||||||||||||||||||||||||
Net Asset Value, Beginning of Period | $ | 19.72 | $ | 15.92 | $ | 20.49 | $ | 25.46 | $ | 28.41 | $ | 29.15 | ||||||||||||
Income From Investment Operations: | ||||||||||||||||||||||||
Net Investment Income (Loss) | 0.26 | 0.16 | (c) | 0.15 | 0.08 | (0.00 | )(d) | 0.01 | ||||||||||||||||
Net Realized and Unrealized Gains (Losses) on Investments | 1.62 | 3.83 | (4.49 | ) | (5.05 | ) | (2.63 | ) | (0.75 | ) | ||||||||||||||
Total from Investment Operations | 1.88 | 3.99 | (4.34 | ) | (4.97 | ) | (2.63 | ) | (0.74 | ) | ||||||||||||||
Less Distributions: | ||||||||||||||||||||||||
From Net Investment Income | (0.19 | ) | (0.19 | ) | (0.23 | ) | — | — | — | |||||||||||||||
From Net Realized Gains | — | — | — | — | (0.32 | ) | — | |||||||||||||||||
Total Distributions | (0.19 | ) | (0.19 | ) | (0.23 | ) | — | (0.32 | ) | — | ||||||||||||||
Net Asset Value, End of Period | $ | 21.41 | $ | 19.72 | $ | 15.92 | $ | 20.49 | $ | 25.46 | $ | 28.41 | ||||||||||||
Ratios and Supplemental Data | ||||||||||||||||||||||||
Total Return(e) | +9.59 | % | +25.26 | % | –21.22 | % | –19.52 | % | –9.24 | % | –2.54 | % | ||||||||||||
Net Assets, End of Period (In Millions) | $ | 37 | $ | 84 | $ | 67 | $ | 47 | $ | 31 | $ | 1 | ||||||||||||
Ratio of Expenses to Average Net Assets before Expense Waivers and Offsets | 0.8 | % | 0.7 | % | 0.7 | % | 0.6 | % | 0.6 | %* | 0.6 | % | ||||||||||||
Ratio of Expenses to Average Net Assets | 0.7 | % | 0.7 | % | 0.7 | % | 0.6 | % | 0.6 | %* | 0.6 | % | ||||||||||||
Ratio of Net Investment Income (Loss) to Average Net Assets | 0.9 | % | 0.9 | % | 0.9 | % | 0.6 | % | 0.1 | %* | 0.1 | % | ||||||||||||
Portfolio Turnover Rate(f) | 135.5 | % | 199.4 | % | 187.8 | % | 171.9 | % | 23.3 | % | 122.0 | % | ||||||||||||
| * | Calculated on an annualized basis. |
| (a) | Information presented relates to a share of capital stock of the Fund outstanding for the entire period. |
| (b) | In 2000, the Fund changed its fiscal year-end from October to December. |
| (c) | Net investment income (loss) per share represents net investment income (loss) divided by average shares outstanding throughout the year. |
| (d) | Amount calculated is less than $0.005 or 0.05%. |
| (e) | Total return assumes dividend reinvestment and does not reflect the effect of sales charges. |
| (f) | Calculated on the basis of the Fund as a whole without distinguishing between the classes of shares issued. |
| (g) | For the period from February 29, 2000 (commencement of class) to October 31, 2000. |
See Notes to Financial Statements.
38
FINANCIAL HIGHLIGHTS (continued)
STRONG GROWTH AND INCOME FUND — ADVISOR CLASS
| Year Ended | ||||||||||||||||||||||||
| Dec. 31, 2004 | Dec. 31, 2003 | Dec. 31, 2002 | Dec. 31, 2001 | Dec. 31, 2000 (b) | Oct. 31, 2000 (c) | |||||||||||||||||||
Selected Per-Share Data(a) | ||||||||||||||||||||||||
Net Asset Value, Beginning of Period | $ | 19.57 | $ | 15.77 | $ | 20.20 | $ | 25.32 | $ | 28.29 | $ | 29.15 | ||||||||||||
Income From Investment Operations: | ||||||||||||||||||||||||
Net Investment Income (Loss) | 0.08 | 0.05 | (d) | 0.04 | (0.04 | ) | (0.00 | )(f) | (0.05 | ) | ||||||||||||||
Net Realized and Unrealized Gains (Losses) on Investments | 1.65 | 3.80 | (4.41 | ) | (5.08 | ) | (2.65 | ) | (0.81 | ) | ||||||||||||||
Total from Investment Operations | 1.73 | 3.85 | (4.37 | ) | (5.12 | ) | (2.65 | ) | (0.86 | ) | ||||||||||||||
Less Distributions: | ||||||||||||||||||||||||
From Net Investment Income | (0.09 | ) | (0.05 | ) | (0.06 | ) | — | — | — | |||||||||||||||
From Net Realized Gains | — | — | — | — | (0.32 | ) | — | |||||||||||||||||
Total Distributions | (0.09 | ) | (0.05 | ) | (0.06 | ) | — | (0.32 | ) | — | ||||||||||||||
Net Asset Value, End of Period | $ | 21.21 | $ | 19.57 | $ | 15.77 | $ | 20.20 | $ | 25.32 | $ | 28.29 | ||||||||||||
Ratios and Supplemental Data | ||||||||||||||||||||||||
Total Return(e) | +8.85 | % | +24.42 | % | –21.67 | % | –20.22 | % | –9.35 | % | –2.95 | % | ||||||||||||
Net Assets, End of Period (In Millions) | $ | 6 | $ | 9 | $ | 10 | $ | 14 | $ | 5 | $ | 0 | (g) | |||||||||||
Ratio of Expenses to Average Net Assets before Expense Waivers and Offsets | 1.4 | % | 1.4 | % | 1.3 | % | 1.5 | % | 1.3 | %* | 1.3 | %* | ||||||||||||
Ratio of Expenses to Average Net Assets | 1.4 | % | 1.3 | % | 1.3 | % | 1.5 | % | 1.3 | %* | 1.3 | %* | ||||||||||||
Ratio of Net Investment Income (Loss) to Average Net Assets | 0.4 | % | 0.3 | % | 0.2 | % | (0.3 | )% | (0.2 | )*% | (0.7 | )*% | ||||||||||||
Portfolio Turnover Rate(h) | 135.5 | % | 199.4 | % | 187.8 | % | 171.9 | % | 23.3 | % | 122.0 | % | ||||||||||||
STRONG GROWTH AND INCOME FUND — CLASS K
| Year Ended | ||||||||||||
| Dec. 31, 2004 | Dec. 31, 2003 | Dec. 31, 2002 | ||||||||||
Selected Per-Share Data(a) | ||||||||||||
Net Asset Value, Beginning of Period | $ | 19.52 | $ | 15.75 | $ | 20.28 | ||||||
Income From Investment Operations: | ||||||||||||
Net Investment Income (Loss) | 0.19 | 0.11 | (d) | 0.11 | ||||||||
Net Realized and Unrealized Gains (Losses) on Investments | 1.63 | 3.79 | (4.46 | ) | ||||||||
Total from Investment Operations | 1.82 | 3.90 | (4.35 | ) | ||||||||
Less Distributions: | ||||||||||||
From Net Investment Income | (0.17 | ) | (0.13 | ) | (0.18 | ) | ||||||
Total Distributions | (0.17 | ) | (0.13 | ) | (0.18 | ) | ||||||
Net Asset Value, End of Period | $ | 21.17 | $ | 19.52 | $ | 15.75 | ||||||
Ratios and Supplemental Data | ||||||||||||
Total Return(e) | +9.35 | % | +24.90 | % | –21.47 | % | ||||||
Net Assets, End of Period (In Millions) | $ | 20 | $ | 30 | $ | 19 | ||||||
Ratio of Expenses to Average Net Assets before Expense Waivers and Offsets | 1.1 | % | 1.1 | % | 1.1 | % | ||||||
Ratio of Expenses to Average Net Assets | 0.9 | % | 1.0 | % | 1.0 | % | ||||||
Ratio of Net Investment Income (Loss) to Average Net Assets | 0.8 | % | 0.6 | % | 0.7 | % | ||||||
Portfolio Turnover Rate(h) | 135.5 | % | 199.4 | % | 187.8 | % | ||||||
| * | Calculated on an annualized basis. |
| (a) | Information presented relates to a share of capital stock of the Fund outstanding for the entire period. |
| (b) | In 2000, the Fund changed its fiscal year-end from October to December. |
| (c) | For the period from February 29, 2000 (commencement of class) to October 31, 2000. |
| (d) | Net investment income (loss) per share represents net investment income (loss) divided by average shares outstanding throughout the year. |
| (e) | Total return assumes dividend reinvestment and does not reflect the effect of sales charges. |
| (f) | Amount calculated is less than $0.005. |
| (g) | Amount is less than $500,000. |
| (h) | Calculated on the basis of the Fund as a whole without distinguishing between the classes of shares issued. |
See Notes to Financial Statements.
39
FINANCIAL HIGHLIGHTS (continued)
STRONG OPPORTUNITY FUND — INVESTOR CLASS
| Year Ended | ||||||||||||||||||||
| Dec. 31, 2004 | Dec. 31, 2003 | Dec. 31, 2002 | Dec. 31, 2001 | Dec. 31, 2000 | ||||||||||||||||
Selected Per-Share Data(a) | ||||||||||||||||||||
Net Asset Value, Beginning of Period | $ | 39.45 | $ | 28.70 | $ | 39.29 | $ | 42.35 | $ | 44.69 | ||||||||||
Income From Investment Operations: | ||||||||||||||||||||
Net Investment Income (Loss) | (0.26 | ) | (0.14 | )(b) | (0.08 | ) | 0.07 | 0.17 | ||||||||||||
Net Realized and Unrealized Gains (Losses) on Investments | 7.21 | 10.89 | (10.51 | ) | (2.11 | ) | 3.30 | |||||||||||||
Total from Investment Operations | 6.95 | 10.75 | (10.59 | ) | (2.04 | ) | 3.47 | |||||||||||||
Less Distributions: | ||||||||||||||||||||
From Net Investment Income | — | — | — | (0.07 | ) | (0.17 | ) | |||||||||||||
From Net Realized Gains | — | — | — | (0.95 | ) | (5.64 | ) | |||||||||||||
Total Distributions | — | — | — | (1.02 | ) | (5.81 | ) | |||||||||||||
Net Asset Value, End of Period | $ | 46.40 | $ | 39.45 | $ | 28.70 | $ | 39.29 | $ | 42.35 | ||||||||||
Ratios and Supplemental Data | ||||||||||||||||||||
Total Return(c) | +17.62 | % | +37.46 | % | –26.95 | % | –4.80 | % | +8.57 | % | ||||||||||
Net Assets, End of Period (In Millions) | $ | 2,389 | $ | 2,709 | $ | 2,507 | $ | 3,664 | $ | 3,337 | ||||||||||
Ratio of Expenses to Average Net Assets before Expense Waivers and Offsets | 1.4 | % | 1.4 | % | 1.4 | % | 1.3 | % | 1.2 | % | ||||||||||
Ratio of Expenses to Average Net Assets | 1.4 | % | 1.4 | % | 1.4 | % | 1.3 | % | 1.2 | % | ||||||||||
Ratio of Net Investment Income (Loss) to Average Net Assets | (0.6 | )% | (0.4 | )% | (0.2 | )% | 0.2 | % | 0.5 | % | ||||||||||
Portfolio Turnover Rate(d) | 41.7 | % | 60.2 | % | 70.9 | % | 87.8 | % | 86.5 | % | ||||||||||
| STRONG OPPORTUNITY FUND — ADVISOR CLASS | ||||||||||||||||||||
| Year Ended | ||||||||||||||||||||
| Dec. 31, 2004 | Dec. 31, 2003 | Dec. 31, 2002 | Dec. 31, 2001 | Dec. 31, 2000(e) | ||||||||||||||||
Selected Per-Share Data(a) | ||||||||||||||||||||
Net Asset Value, Beginning of Period | $ | 38.94 | $ | 28.37 | $ | 38.92 | $ | 42.10 | $ | 43.16 | ||||||||||
Income From Investment Operations: | ||||||||||||||||||||
Net Investment Income (Loss) | (0.34 | ) | (0.19 | )(b) | (0.11 | ) | (0.06 | )(b) | 0.03 | |||||||||||
Net Realized and Unrealized Gains (Losses) on Investments | 7.11 | 10.76 | (10.44 | ) | (2.08 | ) | 4.83 | |||||||||||||
Total from Investment Operations | 6.77 | 10.57 | (10.55 | ) | (2.14 | ) | 4.86 | |||||||||||||
Less Distributions: | ||||||||||||||||||||
From Net Investment Income | — | — | — | (0.09 | ) | (0.28 | ) | |||||||||||||
From Net Realized Gains | — | — | — | (0.95 | ) | (5.64 | ) | |||||||||||||
Total Distributions | — | — | — | (1.04 | ) | (5.92 | ) | |||||||||||||
Net Asset Value, End of Period | $ | 45.71 | $ | 38.94 | $ | 28.37 | $ | 38.92 | $ | 42.10 | ||||||||||
Ratios and Supplemental Data | ||||||||||||||||||||
Total Return(c) | +17.39 | % | +37.26 | % | –27.11 | % | –5.08 | % | +12.10 | % | ||||||||||
Net Assets, End of Period (In Millions) | $ | 137 | $ | 141 | $ | 104 | $ | 89 | $ | 3 | ||||||||||
Ratio of Expenses to Average Net Assets before Expense Waivers and Offsets | 1.6 | % | 1.6 | % | 1.6 | %* | 1.7 | % | 1.6 | %* | ||||||||||
Ratio of Expenses to Average Net Assets | 1.6 | % | 1.6 | % | 1.6 | %* | 1.7 | % | 1.6 | %* | ||||||||||
Ratio of Net Investment Income (Loss) to Average Net Assets | (0.8 | )% | (0.6 | )% | (0.4 | )%* | (0.3 | )% | 0.1 | %* | ||||||||||
Portfolio Turnover Rate(d) | 41.7 | % | 60.2 | % | 70.9 | % | 87.8 | % | 86.5 | % | ||||||||||
| * | Calculated on an annualized basis. |
| (a) | Information presented relates to a share of capital stock of the Fund outstanding for the entire period. |
| (b) | Net investment income (loss) per share represents net investment income (loss) divided by average shares outstanding throughout the year. |
| (c) | Total return assumes dividend reinvestment and does not reflect the effect of sales charges. |
| (d) | Calculated on the basis of the Fund as a whole without distinguishing between the classes of shares issued. |
| (e) | For the period from February 24, 2000 (commencement of class) to December 31, 2000. |
See Notes to Financial Statements.
40
FINANCIAL HIGHLIGHTS (continued)
STRONG OPPORTUNITY FUND — CLASS K
| Year Ended | ||||||||||||
Dec. 31, 2004 | Dec. 31, 2003 | Dec. 31, 2002 (b) | ||||||||||
Selected Per-Share Data(a) | ||||||||||||
Net Asset Value, Beginning of Period | $ | 39.58 | $ | 28.73 | $ | 29.48 | ||||||
Income From Investment Operations: | ||||||||||||
Net Investment Income (Loss) | (0.14 | ) | (0.06 | )(c) | 0.02 | |||||||
Net Realized and Unrealized Gains (Losses) on Investments | 7.21 | 10.91 | (0.77 | ) | ||||||||
Total from Investment Operations | 7.07 | 10.85 | (0.75 | ) | ||||||||
Less Distributions: | ||||||||||||
From Net Investment Income | — | — | — | |||||||||
Total Distributions | — | — | — | |||||||||
Net Asset Value, End of Period | $ | 46.65 | $ | 39.58 | $ | 28.73 | ||||||
Ratios and Supplemental Data | ||||||||||||
Total Return(d) | +17.86 | % | +37.77 | % | –2.54 | % | ||||||
Net Assets, End of Period (In Millions) | $ | 1 | $ | 0 | (e) | $ | 1 | |||||
Ratio of Expenses to Average Net Assets before Expense Waivers and Offsets | 1.3 | % | 1.6 | % | 1.2 | %* | ||||||
Ratio of Expenses to Average Net Assets | 1.2 | % | 1.2 | % | 1.2 | %* | ||||||
Ratio of Net Investment Income (Loss) to Average Net Assets | (0.4 | )% | (0.2 | )% | 0.2 | %* | ||||||
Portfolio Turnover Rate(f) | 41.7 | % | 60.2 | % | 70.9 | % | ||||||
| * | Calculated on an annualized basis. |
| (a) | Information presented relates to a share of capital stock of the Fund outstanding for the entire period. |
| (b) | For the period from August 30, 2002 (commencement of class) to December 31, 2002. |
| (c) | Net investment income (loss) per share represents net investment income (loss) divided by average shares outstanding throughout the year. |
| (d) | Total return assumes dividend reinvestment and does not reflect the effect of sales charges. |
| (e) | Amount is less than $500,000. |
| (f) | Calculated on the basis of the Fund as a whole without distinguishing between the classes of shares issued. |
See Notes to Financial Statements.
41
December 31, 2004
| 1. | Organization |
The accompanying financial statements represent the following Strong Core Funds (the “Funds”), each with its own investment objectives and policies:
| • | Strong Balanced Fund (a series fund of Strong Balanced Fund, Inc.) |
| • | Strong Large Cap Core Fund (a series fund of Strong Equity Funds, Inc.) |
| • | Strong Growth and Income Fund (a series fund of Strong Conservative Equity Funds, Inc.) |
| • | Strong Opportunity Fund (a series fund of Strong Opportunity Fund, Inc.) |
Each Fund is a diversified, open-end management investment company registered under the Investment Company Act of 1940, as amended (“1940 Act”).
Strong Balanced Fund and Strong Large Cap Core Fund offer Investor Class shares. Strong Growth and Income Fund offers Investor Class, Institutional Class, Advisor Class, and Class K shares. Strong Opportunity Fund offers Investor Class, Advisor Class, and Class K shares. All classes of shares differ principally in their respective administration, transfer agent, and distribution expenses and sales charges, if any. All classes of shares have identical rights to earnings, assets, and voting privileges, except for class-specific expenses and exclusive rights to vote on matters affecting only individual classes.
Investor Class shares are available to the general public, Institutional Class shares are generally available to investors that meet certain higher investment minimums, Advisor Class shares are available only through financial professionals and Class K shares are primarily available through retirement plans.
| 2. | Significant Accounting Policies |
The following is a summary of significant accounting policies followed by the Funds in the preparation of their financial statements.
| (A) | Security Valuation — Securities of the Funds traded on a national securities exchange are valued each business day at the last sales price on that principal exchange. Securities traded on the NASDAQ Stock Market are valued each business day using the NASDAQ Official Closing Price (“NOCP”). Exchange-traded securities for which there were no transactions and NASDAQ-traded securities for which there is no NOCP are valued at the mean of the bid and ask prices. Debt securities of the Funds are generally valued each business day at the official close price (if published) and, if no official close price is published, at its last sales price, or the mean of the bid and asked prices when no last sales price is available, or are valued through a commercial pricing service that utilizes matrix pricing and/or pricing models to determine market values for normal institutional-sized trading units of debt securities and non-rated or thinly traded securities when their pricing models are believed to more accurately reflect the fair market value for such securities. The price evaluation made by a pricing service is not a guaranty that an individual security held by the Fund can be sold for that particular price at any particular time. Securities for which market quotations are not readily available are fair valued as determined in good faith under the general supervision of the Funds’ Board of Directors. Some of the Fund’s portfolio securities may be listed on foreign exchanges that close before the U.S. markets and that trade on days when the U.S. markets are closed. As a result, management, under the supervision of the Funds’ Board of Directors, will consider significant events affecting foreign securities and the movements of the domestic markets that occur after the close of the foreign markets and before the time a Fund’s net asset value (“NAV”) is calculated in valuing such foreign securities. Securities that are purchased within 60 days of their stated maturity are valued at amortized cost, which approximates fair value. |
The Funds may own certain securities that are restricted as to resale. Restricted securities include Section 4(2) commercial paper, securities issued in a private placement, or securities eligible for resale pursuant to Rule 144A under the Securities Act of 1933. Restricted securities may be determined to be liquid or illiquid. Securities are deemed illiquid based upon guidelines established by the Funds’ Board of Directors. Illiquid securities are valued after giving due consideration to pertinent factors, such as recent private sales, market conditions, and the issuer’s financial performance. The Strong Funds held no restricted securities that were deemed illiquid at December 31, 2004.
| (B) | Federal Income and Excise Taxes and Distributions to Shareholders — The Funds intend to comply with the requirements of the Internal Revenue Code of 1986, as amended, applicable to regulated investment companies and to distribute substantially all of their taxable income to their shareholders in a manner which results in no tax cost to the Funds. Therefore, no federal income or excise tax provision is recorded. |
Undistributed net investment income or accumulated net realized gains for financial statement purposes may differ from what is determined for federal income tax purposes due to differences in the timing, recognition, and characterization of income, expense, and capital gain items for financial statement and tax purposes. Where appropriate, reclassifications between net asset accounts are made for such differences that are permanent in nature. The Funds may utilize earnings and profits distributed to shareholders on redemptions of shares as part of the dividends paid deduction.
42
NOTES TO FINANCIAL STATEMENTS (continued)
December 31, 2004
Strong Balanced Fund and Strong Growth and Income Fund generally pay dividends from net investment income quarterly and distribute net realized capital gains, if any, at least annually. Strong Large Cap Core Fund and Strong Opportunity Fund generally pay dividends from net investment income and distribute net realized capital gains, if any, at least annually.
| (C) | Realized Gains and Losses on Investment Transactions — Investment security transactions are recorded as of the trade date. Gains or losses realized on investment transactions are determined by comparing the identified cost of the security lot sold with the net sales proceeds. |
| (D) | Certain Investment Risks — The Funds may utilize derivative instruments including options, futures, and other instruments with similar characteristics to the extent that they are consistent with the Funds’ investment objectives and limitations. The Funds intend to use such derivative instruments primarily to hedge or protect itself from adverse movements in securities’ prices, foreign currencies, or interest rates. The use of these instruments involves certain risks, including the possibility that the future value of the underlying assets or indices fluctuate (in the case of futures and options), the derivative becomes illiquid, an imperfect correlation arises between the value of the derivative and the underlying assets or indices, or that the counterparty fails to perform its obligations when due. |
Investments in foreign-denominated assets or forward foreign currency contracts may involve greater risks than domestic investments such as foreign-related risks created by currency rate fluctuations, foreign political and economic instability, foreign financial reporting standards and taxes, and foreign securities markets and issuer regulation. Foreign securities may be less liquid than domestic securities.
| (E) | Futures — Upon entering into a futures contract, the Funds segregate cash and/or other liquid investments equal to the minimum “initial margin” requirements of the exchange and the futures commission merchant or broker. Each Fund designates liquid securities as collateral on open futures contracts. During the term of the futures contract, the Funds also receive credit from, or pay to, the futures commission merchant or broker an amount of cash or liquid assets equal to the daily fluctuation in the value of the futures contract. Such receipts or payments are known as “variation margin” and are recorded as unrealized gains or losses by the Funds. When the futures contract is closed, a realized gain or loss is recorded equal to the difference between the value of the futures contract at the time it was opened and the value at the time it was closed. |
| (F) | Written Options — The Funds may write put or call options. Premiums received by the Funds upon writing put or call options are recorded as an asset with a corresponding liability that is subsequently adjusted daily to the current market value of the option. Changes between the initial premiums received and the current market value of the options are recorded as unrealized gains or losses by the Funds. When a written option is closed, expired, or exercised, the Funds realize a gain or loss and the liability is eliminated. The Funds continue to bear the risk of adverse movements in the price of the underlying asset during the period of the written option, although any potential loss during the period would be reduced by the amount of the option premium received by the Funds. Each Fund designates liquid securities or cash on its books to cover its financial exposure on open written options contracts. |
| (G) | Foreign Currency Conversion — Securities and other assets and liabilities initially expressed in foreign currencies are converted daily into U.S. dollars based upon current exchange rates. Purchases and sales of foreign securities and foreign income are converted into U.S. dollars based upon currency exchange rates prevailing on the respective dates of such transactions. The effect of changes in foreign exchange rates on realized and unrealized security gains or losses is reflected as a component of such gains or losses. |
| (H) | Forward Foreign Currency Exchange Contracts — Forward foreign currency exchange contracts are valued at the forward rate and are marked-to-market daily. The change in market value is recorded as an unrealized gain or loss. When the contract is closed, the Funds record an exchange gain or loss equal to the difference between the value of the contract at the time it was opened and the value at the time it was closed. |
| (I) | Short Positions — The Funds may engage in short sale transactions. For financial statement purposes, an amount equal to the settlement amount is included in the Statements of Assets and Liabilities as an asset and an equivalent liability. The amount of the liability is subsequently marked-to-market to reflect the current value of the short position. Changes between the amount of the liability and the current market value of the short positions are recorded as unrealized gains or losses. The Funds are liable to the buyer for any dividends payable on securities while those securities are in a short position. These dividends are an expense of the Fund and are included in Other Expenses in the Statement of Operations. If the Funds sell securities short while also holding the long position in the security, they may protect unrealized gains, but will lose the opportunity to profit on such securities if the price rises. If the Funds sell securities short when not holding the long position in the security, they will experience a loss if the market price of the security increases between the date of the short sale and the date the security is replaced. |
43
| (J) | Repurchase Agreements — The Funds may enter into repurchase agreements with institutions that the Funds’ investment advisor, Strong Capital Management, Inc. (the “Advisor”) has determined are creditworthy. Each repurchase transaction is recorded at cost, which approximates fair value. The Funds require that the collateral, represented by cash and/or securities (primarily U.S. government securities), in a repurchase transaction be maintained in a segregated account under the control of the Funds’ custodial bank in a manner sufficient to enable the Funds to liquidate those securities in the event of a default of the counterparty. On a daily basis, the Funds’ custodial bank monitors the value of the collateral, including accrued interest, to ensure it is at least equal to the amounts owed to the Funds under each repurchase agreement. |
| (K) | Securities Lending — The Funds have entered into a Securities Lending Agreement (the “Agreement”) with State Street Bank and Trust Company. Under the terms of the Agreement, the Funds may lend portfolio securities to qualified institutional borrowers in order to earn additional income. The Agreement requires that loans are collateralized at all times by cash and cash equivalents equal to at least 102% of the market value of the aggregate loaned securities, plus accrued interest, and the collateral is marked-to-market daily. Cash collateral received is invested in repurchase agreements, investment funds, government obligations, and/or bank obligations. |
At December 31, 2004, Strong Balanced Fund, and Strong Opportunity Fund had securities with a market value of $14,147,238, and $84,274,530, respectively, on loan and had received $14,451,839, and $86,476,263, respectively, in collateral (both are included within Investments in the Statements of Assets and Liabilities). Amounts earned as interest on investments of cash collateral, net of rebates and other securities lending expenses, are included in Interest Income in the Statements of Operations. For the year ended December 31, 2004, the securities lending income totaled $22,062, $13,641, and $97,568 for Strong Balanced Fund, Strong Growth and Income Fund, and Strong Opportunity Fund, respectively.
The three primary risks associated with securities lending are: a borrower defaulting on its obligation to return the securities loaned resulting in a shortfall on the posted collateral; a principal loss arising from the lending agent’s investment of cash collateral; and the inability of the lending Fund to recall a security in time to exercise valuable voting rights or sell the security. In each case, the lending agent has indemnified the Funds for these types of losses.
| (L) | Directed Brokerage — Through November 30, 2004, the Funds directed certain portfolio trades to brokers who, in turn, paid a portion of the Funds’ expenses not attributable to the Advisor or its affiliates. Such amounts are included in Expense Waivers and Offsets reported in the Funds’ Statements of Operations and in Note 4. |
| (M) | Earnings Credit Arrangements — Credits are earned on positive cash balances maintained in custodian accounts. These credits serve to reduce the custodian’s fees incurred by the Funds and are included in Expense Waivers and Offsets reported in the Funds’ Statements of Operations and in Note 4. |
| (N) | Expenses — The Funds and other affiliated Strong Funds contract for certain services on a collective basis. The majority of the expenses are directly identifiable to an individual Fund. Expenses that are not readily identifiable to a specific Fund will be allocated in such manner as deemed equitable, taking into consideration, among other things, the nature and type of expense and the relative sizes of the Strong Funds. |
| (O) | Use of Estimates — The preparation of financial statements in conformity with accounting principles generally accepted in the United States of America requires management to make estimates and assumptions that affect the reported amounts in these financial statements. Actual results could differ from those estimates. |
| (P) | Indemnifications — In the normal course of business, the Funds enter into contracts with service providers that contain general indemnification clauses. The Funds’ maximum exposure under these arrangements is unknown, as this would involve future claims that may be made against the Funds that have not yet occurred. However, based on experience, the Funds expect the risk of material loss to be remote under any of these indemnification agreements. |
| (Q) | Other — Dividend income, net of applicable withholding taxes, and distributions to shareholders are recorded on the ex-dividend date. Interest income is recorded on the accrual basis and includes amortization of premiums and discounts on the interest method. Income, expenses (other than expenses attributable to a specific class), and realized and unrealized gains or losses on investments are allocated to each class of shares based on its relative shares outstanding. |
44
NOTES TO FINANCIAL STATEMENTS (continued)
December 31, 2004
| 3. | Related Party Transactions |
The Advisor provides investment advisory and related services to the Funds. Strong Investor Services, Inc. (the “Administrator”), an affiliate of the Advisor, provides administrative, transfer agent, and related services to the Funds. Certain officers are affiliated with the Advisor and the Administrator. Investment advisory and administration fees, which are established by terms of the advisory and administration agreements, are based on the following annualized rates of the average daily net assets of the respective Fund:
| Administrative Fees | |||||||||||||||
| Advisory Fees | Investor Class | Institutional Class | Advisor Class | Class K | |||||||||||
Strong Balance Fund | 0.60 | %(1) | 0.30 | % | * | * | * | ||||||||
Strong Large Cap Core Fund | 0.75 | %(2) | 0.30 | % | * | * | * | ||||||||
Strong Growth and Income Fund | 0.55 | % | 0.30 | % | 0.02 | % | 0.30 | % | 0.25 | % | |||||
Strong Opportunity Fund | 0.75 | %(2) | 0.30 | % | * | 0.30 | % | 0.25 | % | ||||||
| * | Does not offer Share class. |
| (1) | The investment advisory fees are 0.60% for the first $35 million assets and 0.55% for assets above $35 million. |
| (2) | The Investment Advisory fees are 0.75% for assets under $4 billion, 0.725% for the next $2 billion assets, and 0.70% for assets $6 billion and above. |
The Funds’ Advisor and/or Administrator may voluntarily waive or absorb certain expenses at their discretion. The Advisor and/or Administrator has contractually agreed to waive its fees and/or absorb expenses until May 1, 2005 for Strong Large Cap Core Fund, Strong Growth and Income Fund Class K, and Strong Opportunity Fund Class K to keep Net Annual Operating Expenses at no more than 2.00%, 0.99%, and 1.20%, respectively. Pursuant to the direction of the Board and in implementation of certain regulatory settlements (as described in Note 10), the Advisor has contractually agreed to waive its fees and/or absorb expenses in the amount of 0.033% for the Funds from May 21, 2004 until May 21, 2005. However, the Funds are expected to reorganize into the Wells Fargo Funds family on April 11, 2005 and be subject to a different expense structure. Transfer agent and related service fees for the Investor Class shares are paid at an annual rate of $27.00 for each open shareholder account and $4.20 for each closed shareholder account. Transfer agent and related service fees for the Institutional Class, Advisor Class, and Class K shares are paid at an annual rate of 0.015%, 0.20%, and 0.20%, respectively, of the average daily net assets of each respective class. Transfer agent fees are recorded in Shareholder Servicing Costs in the Funds’ Statements of Operations and in Note 4. The Administrator also allocates to each Fund certain charges or credits resulting from transfer agency banking activities based on each Class’ level of subscription and redemption activity. Transfer Agency Banking Charges allocated to the Funds by the Administrator, if any, are included in Other Expenses in the Funds’ Statements of Operations. Transfer Agency Banking Credits allocated by the Administrator, if any, serve to reduce the transfer agent expenses incurred by the Funds and are included in Expense Waivers and Offsets in the Funds’ Statements of Operations and in Note 4. The Administrator is also compensated for certain other out-of-pocket expenses related to transfer agent services.
Strong Growth and Income Fund and Strong Opportunity Fund have adopted a Rule 12b-1 distribution and service plan under the 1940 Act on behalf of each of the Fund’s Advisor Class shares. Under the plan, Strong Investments, Inc. (the “Distributor,” and an affiliate of the Advisor) is paid an annual rate of 0.25% of the average daily net assets of the Advisor Class shares as compensation for services provided and expenses incurred, including amounts paid to brokers or dealers, in connection with the sale of each Fund’s Advisor Class shares. See Note 4.
The Funds may invest cash in money market funds managed by the Advisor, subject to certain limitations set by the Fund’s Board of Directors and applicable law.
Certain information regarding related party transactions, excluding the effects of waivers and absorptions, for the year ended December 31, 2004 is as follows:
Payable to/ (Receivable from) | Shareholder Servicing Administrator | Transfer Agency Banking Charges/(Credits) | Unaffiliated Directors’ and Independent Officers’ Fees | |||||||||
Strong Balance Fund | $ | 41,101 | $ | 523,045 | $ | 6,569 | $ | 7,640 | ||||
Strong Large Cap Core Fund | 2,140 | 26,307 | 206 | 1,002 | ||||||||
Strong Growth and Income Fund | 163,816 | 2,307,656 | 18,045 | 28,180 | ||||||||
Strong Opportunity Fund | 539,593 | 6,723,018 | 34,424 | 111,268 | ||||||||
45
| 4. | Expenses and Expense Waivers and Offsets |
For the year ended December 31, 2004, the class specific expenses are as follows:
| Administrative Fees | Shareholder Servicing Costs | Reports to Shareholders | 12b-1 Fees | Other | |||||||||||
Strong Growth and Income Fund | |||||||||||||||
Investor Class | $ | 1,562,947 | $ | 2,226,571 | $ | 350,984 | $ | — | $ | 14,128 | |||||
Institutional Class | 12,340 | 9,423 | 66,688 | — | 5,259 | ||||||||||
Advisor Class | 19,997 | 13,407 | 4,468 | 16,664 | 1,102 | ||||||||||
Class K | 67,805 | 54,244 | 8,607 | — | 1,568 | ||||||||||
Strong Opportunity Fund | |||||||||||||||
Investor Class | 7,349,226 | 6,440,381 | 1,017,635 | — | 41,006 | ||||||||||
Advisor Class | 404,271 | 270,503 | 88,940 | 336,892 | 2,940 | ||||||||||
Class K | 2,842 | 2,277 | 109 | — | 336 | ||||||||||
For the year ended December 31, 2004, the expense waivers and offsets are as follows:
Expense Waivers and Absorptions* | Directed Brokerage Credits | Earnings Credits | ||||||||||
Strong Balanced Fund | $ | (59,689 | ) | $ | (16,307 | ) | $ | (159 | ) | |||
Strong Large Cap Core Fund | (34,600 | ) | (4,533 | ) | — | |||||||
Strong Growth and Income Fund | ||||||||||||
Investor Class | (16,541 | ) | — | — | ||||||||
Institutional Class | (1,323 | ) | — | — | ||||||||
Class K | (586 | ) | — | — | ||||||||
Advisor Class | (30,620 | ) | — | — | ||||||||
Fund Level | (176,020 | ) | (83,731 | ) | (629 | ) | ||||||
Strong Opportunity Fund | ||||||||||||
Investor Class | (99,661 | ) | — | — | ||||||||
Advisor Class | (9,628 | ) | — | — | ||||||||
Class K | (861 | ) | — | — | ||||||||
Fund Level | (758,499 | ) | (217,831 | ) | (1,285 | ) | ||||||
| * | These amounts include the contractually agreed upon waivers of fees and/or absorptions of expenses for the period from May 21, 2004 thru December 31, 2004 pursuant to the direction of the Board and in implementation of certain regulatory settlements as discussed in Note 3 and in Note 10. These amounts also include reimbursement by the Advisor for the legal costs incurred by the funds for the legal and regulatory matters discussed in Note 10. |
| 5. | Line of Credit |
The Strong Funds have established a line of credit agreement (“LOC”) with certain financial institutions, which expires June 30, 2005, to be used for temporary or emergency purposes. Combined borrowings among all participating Strong Funds are subject to a $200 million cap on the total LOC. For an individual Fund, borrowings under the LOC are limited to either the lesser of 15% of the market value of the Fund’s total assets or any explicit borrowing limits in the Funds’ registration statement. The principal amount of each borrowing under the LOC is due not more than 45 days after the date of the borrowing.
Borrowings under the LOC bear interest based on prevailing market rates as defined in the LOC. A commitment fee of 0.09% per annum is incurred on the unused portion of the LOC and is allocated to all participating Strong Funds based on their net asset values. Strong Opportunity Fund had no borrowings under the LOC during the year. Strong Balanced Fund, Strong Large Cap Core Fund and Strong Growth and Income Fund had minimal borrowings under the LOC during the year. At December 31, 2004 there were no outstanding borrowings by the Funds under the LOC.
| 6. | Investment Transactions |
The aggregate purchases and sales of shares of long-term securities during the year ended December 31, 2004 are as follows:
| Purchases | Sales | |||||||||||
| U.S. Government and Agency | Other | U.S. Government and Agency | Other | |||||||||
Strong Balanced Fund | $ | 65,466,765 | $ | 180,430,918 | $ | 69,844,692 | $ | 236,922,750 | ||||
Strong Large Cap Core Fund | — | 7,050,108 | — | 7,354,215 | ||||||||
Strong Growth and Income Fund | — | 833,505,531 | — | 1,102,859,834 | ||||||||
Strong Opportunity Fund | — | 1,023,576,010 | — | 1,997,539,461 | ||||||||
46
NOTES TO FINANCIAL STATEMENTS (continued)
December 31, 2004
| 7. | Income Tax Information |
The following information for the Funds is presented on an income tax basis as of December 31, 2004:
| Cost of Investments | Gross Unrealized Appreciation | Gross Unrealized (Depreciation) | Net Unrealized Appreciation/ on Investments | Distributable Ordinary Income | Distributable Long-Term Capital Gains | ||||||||||||||
Strong Balanced Fund | $ | 154,304,467 | $ | 15,492,375 | $ | (356,157 | ) | $ | 15,136,218 | $ | — | $ | — | ||||||
Strong Large Cap Core Fund | 3,753,248 | 668,404 | — | 668,404 | — | — | |||||||||||||
Strong Growth and Income Fund | 433,730,729 | 105,171,990 | — | 105,171,990 | 257,010 | — | |||||||||||||
Strong Opportunity Fund | 1,996,010,436 | 639,494,312 | (436,838 | ) | 639,057,474 | — | — | ||||||||||||
The difference between cost amounts for financial statement and federal income tax purposes is due primarily to timing differences in recognizing certain gains and losses on security transactions.
The tax components of dividends paid during the years ended December 31, 2004 and 2003 and capital loss carryovers (expiring in varying amounts through 2011) as of December 31, 2004, and tax basis post-October losses as of December 31, 2004, which are not recognized for tax purposes until the first day of the following fiscal year, are:
| 2004 Income Tax Information | 2003 Income Tax Information | |||||||||||||||||
| Ordinary Income Distributions | Long-Term Capital Gains Distributions | Net Capital Loss Carryovers | Post-October Losses | Ordinary Income Distributions | Long-Term Capital Gains Distributions | |||||||||||||
Strong Balanced Fund | $ | 2,151,090 | $ | — | $ | 17,848,948 | $ | — | $ | 2,604,962 | $ | — | ||||||
Strong Large Cap Core Fund | — | — | 844,067 | — | — | — | ||||||||||||
Strong Growth and Income Fund | 2,889,458 | — | 140,026,264 | — | 2,522,045 | — | ||||||||||||
Strong Opportunity Fund | — | — | 14,471,353 | — | — | — | ||||||||||||
For corporate shareholders in the Funds, the percentages of ordinary dividend income distributed for the year ended December 31, 2004, which is designated as qualifying for the dividends-received deduction, is as follows (unaudited): Strong Balanced Fund 83.5%, Strong Large Cap Core Fund 0.0%, Strong Growth and Income Fund 100.0%, and Strong Opportunity Fund 0.0%.
For shareholders in the Funds, the percentages of dividend income distributed for the year ended December 31, 2004, which is designated as qualified dividend income under the Jobs and Growth Tax Relief Reconciliation Act of 2003, is as follows (unaudited): Strong Balanced Fund 80.9%, Strong Large Cap Core Fund 0.0%, Strong Growth and Income Fund 100.0%, and Strong Opportunity Fund 0.0%.
Strong Balanced Fund, Strong Large Cap Core, Strong Growth and Income Fund, and Strong Opportunity Fund utilized $11,109,854, $485,173, $91,056,932, and $400,236,414, respectively, of their capital loss carryovers during the year ended December 31, 2004.
47
| 8. | Capital Share Transactions |
| Strong Balanced Fund | ||||||||
| Year Ended Dec. 31, 2004 | Year Ended Dec. 31, 2003 | |||||||
Capital Share Transactions of the Fund Were as Follows: | ||||||||
Proceeds from Shares Sold | $ | 26,599,270 | $ | 32,626,685 | ||||
Transfer in from Merger (Note 9) | — | 5,544,540 | ||||||
Proceeds from Reinvestment of Distributions | 2,073,183 | 2,514,411 | ||||||
Payment for Shares Redeemed | (91,276,705 | ) | (82,073,813 | ) | ||||
Net Increase (Decrease) in Net Assets from Capital Share Transactions | $ | (62,604,252 | ) | $ | (41,388,177 | ) | ||
Transactions in Shares of the Fund Were as Follows: | ||||||||
Sold | 1,407,580 | 1,911,180 | ||||||
Transfer in from Merger (Note 9) | — | 348,494 | ||||||
Issued in Reinvestment of Distributions | 108,957 | 144,599 | ||||||
Redeemed | (4,840,528 | ) | (4,758,107 | ) | ||||
Net Increase (Decrease) in Shares of the Fund | (3,323,991 | ) | (2,353,834 | ) | ||||
| Strong Large Cap Core Fund | ||||||||
| Year Ended Dec. 31, 2004 | Year Ended Dec. 31, 2003 | |||||||
Capital Share Transactions of the Fund Were as Follows: | ||||||||
Proceeds from Shares Sold | $ | 1,222,482 | $ | 938,346 | ||||
Proceeds from Reinvestment of Distributions | — | — | ||||||
Payment for Shares Redeemed | (1,206,237 | ) | (2,023,881 | ) | ||||
Net Increase (Decrease) in Net Assets from Capital Share Transactions | $ | 16,245 | $ | (1,085,535 | ) | |||
Transactions in Shares of the Fund Were as Follows: | ||||||||
Sold | 120,843 | 107,906 | ||||||
Issued in Reinvestment of Distributions | — | — | ||||||
Redeemed | (118,728 | ) | (233,342 | ) | ||||
Net Increase (Decrease) in Shares of the Fund | 2,115 | (125,436 | ) | |||||
48
NOTES TO FINANCIAL STATEMENTS (continued)
December 31, 2004
| Strong Growth and Income Fund | ||||||||
Year Ended Dec. 31, 2004 | Year Ended Dec. 31, 2003 | |||||||
Capital Share Transactions of Each Class of Shares of the Fund Were as Follows: | ||||||||
INVESTOR CLASS | ||||||||
Proceeds from Shares Sold | $ | 56,766,975 | $ | 203,112,596 | ||||
Proceeds from Reinvestment of Distributions | 2,160,572 | 1,392,195 | ||||||
Payment for Shares Redeemed | (264,359,525 | ) | (289,307,195 | ) | ||||
Net Increase (Decrease) in Net Assets from Capital Share Transactions | (205,431,978 | ) | (84,802,404 | ) | ||||
INSTITUTIONAL CLASS | ||||||||
Proceeds from Shares Sold | 10,067,845 | 16,100,601 | ||||||
Proceeds from Reinvestment of Distributions | 409,578 | 705,353 | ||||||
Payment for Shares Redeemed | (60,154,178 | ) | (17,235,352 | ) | ||||
Net Increase (Decrease) in Net Assets from Capital Share Transactions | (49,676,755 | ) | (429,398 | ) | ||||
ADVISOR CLASS | ||||||||
Proceeds from Shares Sold | 884,899 | 1,932,654 | ||||||
Proceeds from Reinvestment of Distributions | 27,101 | 23,212 | ||||||
Payment for Shares Redeemed | (3,971,072 | ) | (5,560,191 | ) | ||||
Net Increase (Decrease) in Net Assets from Capital Share Transactions | (3,059,072 | ) | (3,604,325 | ) | ||||
CLASS K | ||||||||
Proceeds from Shares Sold | 16,023,072 | 15,545,119 | ||||||
Proceeds from Reinvestment of Distributions | 86,153 | 114,699 | ||||||
Payment for Shares Redeemed | (27,378,853 | ) | (11,445,984 | ) | ||||
Net Increase (Decrease) in Net Assets from Capital Share Transactions | (11,269,628 | ) | 4,213,834 | |||||
Net Increase (Decrease) in Net Assets from Capital Share Transactions | $ | (269,437,433 | ) | $ | (84,622,293 | ) | ||
49
Strong Growth and Income Fund | ||||||
| Year Ended Dec. 31, 2004 | Year Ended Dec. 31, 2003 | |||||
Transactions in Shares of Each Class of the Fund Were as Follows: | ||||||
INVESTOR CLASS | ||||||
Sold | 2,839,780 | 11,952,254 | ||||
Issued in Reinvestment of Distributions | 103,138 | 79,360 | ||||
Redeemed | (13,312,831 | ) | (16,571,248 | ) | ||
Net Increase (Decrease) in Shares | (10,369,913 | ) | (4,539,634 | ) | ||
INSTITUTIONAL CLASS | ||||||
Sold | 507,260 | 939,263 | ||||
Issued in Reinvestment of Distributions | 20,235 | 40,748 | ||||
Redeemed | (3,043,024 | ) | (951,684 | ) | ||
Net Increase (Decrease) in Shares | (2,515,529 | ) | 28,327 | |||
ADVISOR CLASS | ||||||
Sold | 44,541 | 115,023 | ||||
Issued in Reinvestment of Distributions | 1,314 | 1,344 | ||||
Redeemed | (200,817 | ) | (331,631 | ) | ||
Net Increase (Decrease) in Shares | (154,962 | ) | (215,264 | ) | ||
CLASS K | ||||||
Sold | 812,188 | 926,705 | ||||
Issued in Reinvestment of Distributions | 4,251 | 6,709 | ||||
Redeemed | (1,393,806 | ) | (643,521 | ) | ||
Net Increase (Decrease) in Shares | (577,367 | ) | 289,893 | |||
50
NOTES TO FINANCIAL STATEMENTS (continued)
December 31, 2004
| Strong Opportunity Fund | ||||||||
Year Ended Dec. 31, 2004 | Year Ended Dec. 31, 2003 | |||||||
Capital Share Transactions of Each Class of Shares of the Fund Were as Follows: | ||||||||
INVESTOR CLASS | ||||||||
Proceeds from Shares Sold | $ | 256,753,792 | $ | 531,529,373 | ||||
Proceeds from Reinvestment of Distributions | — | — | ||||||
Payment for Shares Redeemed | (971,891,509 | ) | (1,184,570,695 | ) | ||||
Net Increase (Decrease) in Net Assets from Capital Share Transactions | (715,137,717 | ) | (653,041,322 | ) | ||||
ADVISOR CLASS | ||||||||
Proceeds from Shares Sold | 24,631,677 | 38,084,933 | ||||||
Proceeds from Reinvestment of Distributions | — | — | ||||||
Payment for Shares Redeemed | (49,440,738 | ) | (40,603,841 | ) | ||||
Net Increase (Decrease) in Net Assets from Capital Share Transactions | (24,809,061 | ) | (2,518,908 | ) | ||||
CLASS K | ||||||||
Proceeds from Shares Sold | 1,580,103 | 198,407 | ||||||
Proceeds from Reinvestment of Distributions | — | — | ||||||
Payment for Shares Redeemed | (561,170 | ) | (896,534 | ) | ||||
Net Increase (Decrease) in Net Assets from Capital Share Transactions | 1,018,933 | (698,127 | ) | |||||
Net Increase (Decrease) in Net Assets from Capital Share Transactions | $ | (738,927,845 | ) | $ | (656,258,357 | ) | ||
Transactions in Shares of Each Class of the Fund Were as Follows: | ||||||||
INVESTOR CLASS | ||||||||
Sold | 6,141,602 | 16,208,728 | ||||||
Issued in Reinvestment of Distributions | — | — | ||||||
Redeemed | (23,338,250 | ) | (34,871,478 | ) | ||||
Net Increase (Decrease) in Shares | (17,196,648 | ) | (18,662,750 | ) | ||||
ADVISOR CLASS | ||||||||
Sold | 594,636 | 1,179,895 | ||||||
Issued in Reinvestment of Distributions | — | — | ||||||
Redeemed | (1,196,366 | ) | (1,234,407 | ) | ||||
Net Increase (Decrease) in Shares | (601,730 | ) | (54,512 | ) | ||||
CLASS K | ||||||||
Sold | 37,908 | 6,374 | ||||||
Issued in Reinvestment of Distributions | — | — | ||||||
Redeemed | (12,904 | ) | (24,791 | ) | ||||
Net Increase (Decrease) in Shares | 25,004 | (18,417 | ) | |||||
51
| 9. | Acquisition Information |
Effective March 28, 2003, Strong Balanced Fund acquired, through a non-taxable exchange, substantially all of the net assets of Strong Balanced Asset Fund. Strong Balanced Fund issued 348,494 shares (valued at $5,544,540) for the outstanding shares of Strong Balanced Asset Fund at March 28, 2003. The aggregate net assets of Strong Balanced Fund and Strong Balanced Asset Fund immediately before the acquisition were $208,384,213 and $5,544,540, respectively. The combined net assets of Strong Balanced Fund immediately after the acquisition were $213,928,753. The net assets of Strong Balanced Asset Fund included net unrealized depreciation on investments of $503,735 and accumulated net realized losses of $731,189. Subject to IRS regulations, Strong Balanced Fund may use $709,865 of capital loss carryovers from Strong Balanced Asset Fund.
| 10. | Legal and Regulatory Matters |
On or about May 20, 2004, the Advisor, the Administrator, and the Distributor (collectively, “Strong”), former chairman Richard S. Strong, and two employees of Strong entered into agreements with the Securities and Exchange Commission (“SEC”), the New York Attorney General (“NYAG”), the State of Wisconsin Department of Justice (the Wisconsin Attorney General), and the Wisconsin Department of Financial Institutions representing a settlement of all the market-timing investigations of Strong and certain affiliates by these agencies. In the settlements, Strong, without admitting or denying the findings in any of the orders, consented to entries of cease and desist orders and injunctive relief relating to breaches of their fiduciary duties and violations of state and federal securities laws, including anti-fraud provisions. The settlements require the Advisor to pay $40 million in investor restoration and $40 million in civil penalties. The settlements require Mr. Strong to pay $30 million in investor restoration and $30 million in civil penalties. The NYAG settlement also requires Strong or its successor to reduce fees for all Funds (except money market funds and certain very short-term income funds) by an aggregate of at least $7 million a year for five years. Separately, the Board of Directors of the Strong Funds and the Advisor have agreed that the Advisor may allocate such fee and/or expense reductions in a manner it deems reasonable, provided that (i) each applicable Fund shall participate in such fee reduction, (ii) each Fund that was impacted by market timing related to the settlements shall receive a fee reduction of at least 0.025% each year, (iii) such fee reduction shall be taken after giving effect to all waivers and reimbursements currently in effect, and (iv) fees and expenses shall not subsequently be increased without prior Board approval. Additionally, the settlements require, among other things: 1) retention of an independent consultant to develop a payment plan for the amount of investor restoration; 2) the services of an independent compliance consultant to conduct a periodic review of Strong’s compliance policies and procedures; and 3) enhanced corporate governance policies for the Strong Funds. The NYAG settlement also requires: 1) the retention of a senior officer to assist the Board in monitoring compliance and reviewing fee arrangements; and 2) additional fee disclosure to investors in the Funds. Strong and Mr. Strong, and not the investors in any Strong Fund, will bear all the costs of complying with the settlements, including restoration, civil penalties, and associated legal fees stemming from these regulatory proceedings. Strong has not yet determined if the investor restoration or civil penalties will create any financial benefit to the Strong Funds.
Strong has received one or more subpoenas or requests for information from the West Virginia Attorney General and other regulatory agencies requesting documents, if any, related to market timing and late trading practices. Strong is aware of multiple outstanding class and derivative actions (“Actions”) filed since September 4, 2003, against Strong, Strong Funds, Strong Financial Corporation, Strong Investments, Inc., Strong affiliates, and certain of their employees, officers, directors, and others as defendants in certain federal and state courts with respect to factual matters referenced in the NYAG settlement. On February 20, 2004, the United States Judicial Panel for Multi District Litigation (“MDL”) ordered the transfer of most of the Actions to the District of Maryland so those cases involving Strong could be coordinated and consolidated into one or two actions covered by a single complaint (“MDL Consolidated Actions”). The MDL ordered all or most of the other federal court Actions and certain state court Actions involving Strong to be consolidated into no more than three actions and be heard by the District of Maryland court. On September 30, 2004, three consolidated amended complaints were filed in the District of Maryland court. The Actions generally allege, among other things, that the defendants violated their fiduciary duty to fund shareholders and certain retirement plan participants, and made false and misleading statements in the funds’ prospectuses in violation of federal and state securities laws. The Actions generally seek one or more of the following: compensatory damages, punitive damages, special damages, exemplary damages, rescission, restitution, payment of plaintiffs’ attorneys’ fees and experts’ fees, and/or replacement of the Board of Directors of the Strong Funds. Certain state Actions were not consolidated into the MDL Consolidated Actions and proceedings in these state court Actions have been or may be stayed or proceed independently of the MDL Consolidated Actions.
The Strong Funds will not bear any costs incurred in connection with these Actions. Based on currently available information, Strong believes that the Actions will not have a material adverse financial impact on the Strong Funds, and are not likely to materially affect Strong’s ability to provide investment management services to its clients, including the Strong Funds. The Funds may experience increased redemptions or a decrease in new sales of shares as a result of the regulatory settlements and the ongoing Actions, which could result in increased transaction costs and operating expenses, or otherwise negatively impact the Strong Funds.
52
NOTES TO FINANCIAL STATEMENTS (continued)
December 31, 2004
| 11. | Pending Fund Merger |
On May 26, 2004, Strong Financial Corporation (“SFC”) announced that it reached a definitive agreement with Wells Fargo & Company (“Wells Fargo”) for Wells Fargo to acquire certain assets of SFC and certain of its affiliates, including the Advisor. As part of the transaction, Fund shareholders met on December 10, 2004 and December 22, 2004 on various matters including appointing Wells Fargo Funds Management, LLC, a wholly owned subsidiary of Wells Fargo, as a new investment advisor for the Strong Funds. A reorganization of the Strong Funds into the Wells Fargo Funds family is anticipated to take place in April 2005.
53
REPORT OF INDEPENDENT REGISTERED PUBLIC ACCOUNTING FIRM
The Board of Directors and Shareholders of Strong Core Funds:
We have audited the accompanying statements of assets and liabilities of Strong Balanced Fund, Strong Large Cap Core Fund, Strong Growth and Income Fund and Strong Opportunity Fund (all four collectively constituting Strong Core Funds, hereafter referred to as the “Funds”), including the schedules of investments, as of December 31, 2004, and the related statements of operations for the year then ended, the statements of changes in net assets for the year then ended, and the financial highlights for the year then ended. These financial statements and financial highlights are the responsibility of the Company’s management. Our responsibility is to express an opinion on these financial statements and financial highlights based on our audits. The statements of changes in net assets for the period ended December 31, 2003 and the financial highlights for each of the years or periods ended December 31, 2003, and prior, were audited by other auditors whose report thereon dated February 3, 2004 expressed an unqualified opinion on those financial statements.
We conducted our audits in accordance with the standards of the Public Company Accounting Oversight Board (United States). Those standards require that we plan and perform the audit to obtain reasonable assurance about whether the financial statements and financial highlights are free of material misstatement. An audit includes examining, on a test basis, evidence supporting the amounts and disclosures in the financial statements. Our procedures included confirmation of securities owned as of December 31, 2004, by correspondence with the custodian and brokers or by other appropriate auditing procedures. An audit also includes assessing the accounting principles used and significant estimates made by management, as well as evaluating the overall financial statement presentation. We believe that our audits provide a reasonable basis for our opinion.
In our opinion, the financial statements and financial highlights referred to above present fairly, in all material respects, the financial position of the Funds as of December 31, 2004, the results of their operations for the year then ended, the changes in their net assets for the year then ended, and the financial highlights for the year then ended, in conformity with U.S. generally accepted accounting principles.
/s/ KPMG LLP
Chicago, Illinois
February 14, 2005
54
| RESULTS OF SHAREHOLDERS MEETINGS (Unaudited) | December 31, 2004 |
Results of Special Meeting of Shareholders of Strong Balanced Fund
At a Special Meeting of the Shareholders of the Fund held on December 10, 2004, shareholders approved the following proposals:
To approve the reorganization of the Strong Balanced Fund into the Wells Fargo Advantage Balanced Fund.
| For | Against | Abstain | ||
| 5,287,198.603 | 181,624.173 | 74,027.969 |
To approve an interim advisory agreement with Wells Fargo Funds Management, LLC.
| For | Against | Abstain | ||
| 5,252,675.281 | 194,669.500 | 95,505.964 |
To approve an interim sub-advisory agreement with Wells Capital Management Incorporated.
| For | Against | Abstain | ||
| 5,246,223.444 | 201,898.830 | 94,728.471 |
Appointment of Messrs. Phillip O. Peterson, William F. Vogt, and Gordon B. Greer as Trustees of the Liquidating Trust, which is referenced in the Agreement and Plan of Reorganization.
| For | Against | Abstain | ||
| 5,542,850.745 | — | — |
Results of Special Meeting of Shareholders of Strong Large Cap Core Fund
At a Special Meeting of the Shareholders of the Fund held on December 10, 2004, shareholders approved the following proposals:
To approve the reorganization of the Strong Large Cap Core Fund into the Wells Fargo Advantage Growth and Income Fund.
| For | Against | Abstain | ||
| 222,056.215 | 5,455.169 | 4,611.455 |
To approve an interim advisory agreement with Wells Fargo Funds Management, LLC.
| For | Against | Abstain | ||
| 215,565.487 | 11,310.945 | 5,246.407 |
To approve an interim sub-advisory agreement with Matrix Asset Advisors, Inc.
| For | Against | Abstain | ||
| 215,422.070 | 11,529.945 | 5,170.824 |
Appointment of Messrs. Phillip O. Peterson, William F. Vogt, and Gordon B. Greer as Trustees of the Liquidating Trust, which is referenced in the Agreement and Plan of Reorganization.
| For | Against | Abstain | ||
| 232,122.839 | — | — |
Results of Special Meeting of Shareholders of Strong Growth and Income Fund
At a Special Meeting of the Shareholders of the Fund held on December 10, 2004, shareholders approved the following proposals:
To approve the reorganization of the Strong Growth and Income Fund into the Wells Fargo Advantage Growth and Income Fund.
| For | Against | Abstain | ||
| 16,163,142.481 | 556,325.046 | 382,462.241 |
To approve an interim advisory agreement with Wells Fargo Funds Management, LLC.
| For | Against | Abstain | ||
| 16,069,549.151 | 584,015.336 | 448,365.281 |
55
RESULTS OF SHAREHOLDERS MEETINGS (Unaudited) (continued) | December 31, 2004 |
To approve an interim sub-advisory agreement with Matrix Asset Advisors, Inc.
| For | Against | Abstain | ||
| 16,060,686.235 | 582,725.347 | 458,518.186 |
Appointment of Messrs. Phillip O. Peterson, William F. Vogt, and Gordon B. Greer as Trustees of the Liquidating Trust, which is referenced in the Agreement and Plan of Reorganization.
| For | Against | Abstain | ||
| 17,101,929.768 | — | — |
Results of Special Meeting of Shareholders of Strong Opportunity Fund
At a Special Meeting of the Shareholders of the Fund held on December 22, 2004, shareholders approved the following proposals:
To approve the reorganization of the Strong Opportunity Fund into the Wells Fargo Advantage Opportunity Fund.
| For | Against | Abstain | ||
| 29,549,187.473 | 1,031,060.571 | 776,287.190 |
To approve an interim advisory agreement with Wells Fargo Funds Management, LLC.
| For | Against | Abstain | ||
| 29,429,649.472 | 1,069,394.935 | 857,490.827 |
To approve an interim sub-advisory agreement with Wells Capital Management Incorporated.
| For | Against | Abstain | ||
| 29,387,106.297 | 1,081,478.969 | 887,949.968 |
Appointment of Messrs. Phillip O. Peterson, William F. Vogt, and Gordon B. Greer as Trustees of the Liquidating Trust, which is referenced in the Agreement and Plan of Reorganization.
| For | Against | Abstain | ||
| 31,356,535.234 | — | — |
56
Each officer and director holds the same position with the 27 registered open-end management investment companies consisting of 70 mutual funds (“Strong Funds”).
Willie D. Davis (DOB 7-24-34), Director of the Strong Funds since July 1994
Mr. Davis has been President and Chief Executive Officer of All Pro Broadcasting, Inc., since 1977; Director of Wisconsin Energy Corporation (formerly WICOR, Inc., a utility company) since 1990, Metro-Goldwyn-Mayer, Inc. (an entertainment company) since 1998, Checker’s Drive-In Restaurants, Inc. (formerly Rally’s Hamburgers, Inc.) since 1994, Johnson Controls, Inc. (an automotive systems and facility management company) since 1992, MGM Mirage (formerly MGM Grand, Inc., an entertainment/hotel company) since 1990, Dow Chemical Company since 1988, Sara Lee Corporation (a food/consumer products company) since 1983, Alliance Bank since 1980, Manpower, Inc. (a worldwide provider of staffing services) since 2001, Bassett Furniture Industries, Inc. from 1997 to December 2004, and Kmart Corporation (a discount consumer products company) from 1985 to 2003; and Trustee of the University of Chicago since 1980 and Marquette University since 1988.
Gordon B. Greer (DOB 2-17-32), Director of the Strong Funds since March 2002.
Mr. Greer was Of Counsel for Bingham McCutchen LLP (a law firm previously known as Bingham Dana LLP) from 1997 to February 2002 and Partner of Bingham McCutchen LLP from 1967 to 1997. On behalf of Bingham McCutchen LLP, Mr. Greer provided representation to the disinterested directors of the Strong Funds from 1991 to February 2002. Bingham McCutchen LLP has provided representation to the Independent Directors of the Strong Funds since 1991.
Stanley Kritzik (DOB 1-9-30), Director of the Strong Funds since January 1995 and Chairman of the Audit Committee of the Strong Funds since July 2000.
Mr. Kritzik has been Partner of Metropolitan Associates (a real estate firm) since 1962; Director of Wisconsin Health Information Network from November 1997 to September 2004, Health Network Ventures, Inc. from 1992 to April 2000, and Aurora Health Care from September 1987 to September 2002; and Member of the Board of Governors of Snowmass Village Resort Association from October 1999 to October 2002.
Neal Malicky (DOB 9-14-34), Director of the Strong Funds since December 1999.
Mr. Malicky has been President Emeritus of Baldwin-Wallace College since July 2000; Chancellor of Baldwin-Wallace College from July 1999 to June 2000; President of Baldwin-Wallace College from July 1981 to June 1999; Trustee of Southwest Community Health Systems, Cleveland Scholarship Program, and The National Conference for Community and Justice until 2001; President of the National Association of Schools and Colleges of the United Methodist Church, Chairperson of the Association of Independent Colleges and Universities of Ohio, and Secretary of the National Association of Independent Colleges and Universities until 2001.
William F. Vogt (DOB 7-19-47), Director and Chairman of the Independent Directors Committee of the Strong Funds since January 1995.
Mr. Vogt has been President of Vogt Holdings, LLC since July 2004; Senior Vice President of IDX Systems Corporation (a management consulting firm) from June 2001 to June 2004; President of Vogt Management Consulting, Inc. from July 1990 to June 2001; and former Fellow of the American College of Medical Practice Executives.
57
DIRECTORS AND OFFICERS (continued)
Ane K. Ohm (DOB 10-16-69), Anti-Money Laundering Compliance Officer of the Strong Funds since November 2002.
Ms. Ohm has been Anti-Money Laundering Compliance Officer of Strong Financial Corporation since February 2003; Assistant Executive Vice President of Strong Financial Corporation since November 2003; Assistant Executive Vice President of Strong Capital Management, Inc. (the “Advisor”) since December 2001; Director of Mutual Fund Administration of Strong Investor Services, Inc. since April 2001; Vice President of Strong Investor Services, Inc. since December 2001; and Marketing Services Manager of Strong Investments, Inc. (the “Distributor”) from November 1998 to April 2001.
R. Michael Parker (DOB 6-17-45), Chief Compliance Officer of the Strong Funds since August 2004.
Mr. Parker was a Senior Compliance Examiner with the United States Securities and Exchange Commission from April 1970 to April 2004.
Phillip O. Peterson (DOB 12-5-44), Independent President of the Strong Funds since January 2004.
Mr. Peterson was a mutual fund industry consultant from August 1999 to December 2003; Partner of KPMG LLP from 1981 to July 1999; Director of The Hartford Group of Mutual Funds (71 funds) since 2002; and Director of the Fortis Mutual Fund Group (38 funds) from 2000 to 2002.
John W. Widmer (DOB 1-19-65), Treasurer of the Strong Funds since April 1999; Secretary of the Strong Funds since November 2004.
Mr. Widmer has been Treasurer of the Advisor since April 1999; Assistant Treasurer of Strong Financial Corporation since December 2001; Secretary of Strong Financial Corporation since September 2004; Assistant Secretary of Strong Financial Corporation from December 2001 to January 2003; Treasurer of Strong Service Corporation since April 1999; Treasurer and Secretary of Strong Investor Services, Inc. since September 2004; Treasurer and Assistant Secretary of Strong Investor Services, Inc. from July 2001 to September 2004; and Manager of the Financial Management and Sales Reporting Systems department of the Advisor from May 1997 to April 1999.
Thomas M. Zoeller (DOB 2-21-64), Vice President of the Strong Funds since October 1999.
Mr. Zoeller has been Executive Vice President of the Advisor since April 2001; Chief Financial Officer of the Advisor since February 1998; Secretary of the Advisor from December 2001 to November 2002; Member of the Office of the Chief Executive of Strong Financial Corporation since May 2001; Chief Financial Officer and Treasurer of Strong Investments, Inc. from October 1993 to September 2004; Executive Vice President of Strong Investor Services, Inc. since July 2001; Secretary of Strong Investor Services, Inc. from July 2001 to May 2003; Executive Vice President, Chief Financial Officer, and Secretary of Strong Service Corporation since December 2001; Treasurer of Strong Service Corporation from September 1996 to April 1999; Vice President of Strong Service Corporation from April 1999 to December 2001; Member of the Office of the Chief Executive of the Advisor from November 1998 until May 2001; Senior Vice President of the Advisor from February 1998 to April 2001; and Director of Capital Processing International, LLC since September 2004.
Effective January 2005, Dana J. Russart replaced Mr. Zoeller as Vice President of the Strong Funds.
Except for Messrs. Davis, Malicky, and Vogt, the address of all of the Directors and Officers is P.O. Box 2936, Milwaukee, WI 53201. Mr. Davis’s address is 161 North La Brea, Inglewood, CA 90301. Mr. Malicky’s address is 4608 Turnberry Drive, Lawrence, KS 66047. Mr. Vogt’s address is P.O. Box 7657, Avon, CO 81620.
The statement of additional information contains additional information about fund directors and officers and is available without charge, upon request, by calling 1-800-368-3863.
58
Directors
Willie D. Davis
Gordon B. Greer
Stanley Kritzik
Neal Malicky
William F. Vogt
Officers
Ane K. Ohm, Anti-Money Laundering Compliance Officer
R. Michael Parker, Chief Compliance Officer
Phillip O. Peterson, Independent President
John W. Widmer, Treasurer and Secretary
Thomas M. Zoeller, Vice President
Investment Advisor
Strong Capital Management, Inc.
P.O. Box 2936, Milwaukee,Wisconsin 53201
Distributor
Strong Investments, Inc.
P.O. Box 2936, Milwaukee,Wisconsin 53201
Custodian
State Street Bank and Trust Company
801 Pennsylvania Avenue, Kansas City, Missouri 64105
Transfer Agent and Dividend-Disbursing Agent
Strong Investor Services, Inc.
P.O. Box 2936, Milwaukee,Wisconsin 53201
Independent Registered Public Accounting Firm
KPMG LLP
303 East Wacker Drive, Chicago, IL 60601-5212
Legal Counsel
Godfrey & Kahn, S.C.
780 North Water Street, Milwaukee,Wisconsin 53202
59
Contact Us
To learn more about our funds, discuss an existing account, or conduct a transaction, call 1-800-368-3863 or visit www.Strong.com.
To reach us by mail, please forward to Strong Investments, P.O. Box 2936, Milwaukee, Wisconsin 53201.
Please carefully consider a fund’s investment objectives, risks, charges, and expenses before investing. For this and other information, call us or visit our web site for a free prospectus. Please read it carefully before you invest or send money.
If you are a Financial Professional, call 1-800-368-1683.
Proxy Voting Information
To receive a free copy of the policies and procedures the funds use to determine how to vote proxies relating to portfolio securities, or to receive a free copy of a fund’s proxy voting record for the most recent 12-month period ending on June 30, call 1-800-368-3863, or visit the Securities and Exchange Commission’s (SEC) web site at www.sec.gov.
Filing of Portfolio Holdings
The funds file their complete schedule of portfolio holdings with the SEC for the first and third quarters of each fiscal year on Form N-Q. Form N-Q is available on the SEC’s web site at www.sec.gov, and may be reviewed and copied at the SEC’s public reference rooms at 450 Fifth Street, N.W., Washington, D.C. 20549, or at the SEC’s regional offices in New York City, at 233 Broadway, and in Chicago, at 175 West Jackson Boulevard, Suite 900.
| This report does not constitute an offer for the sale of securities. Strong Funds are offered for sale by prospectus only. Securities are offered through Strong Investments, Inc. RT48466 02-05 |
ACOR/WH2057 12-04
Item 2. Code of Ethics
(a) As of the end of the period covered by this report, the registrant has adopted a code of ethics that applies to the registrant’s principal executive officer, principal financial officer, principal accounting officer or controller, or persons performing similar functions. A copy of the code of ethics is filed as an exhibit to this Form N-CSR.
(b) During the period covered by this report, no amendments were made to the provisions of the code of ethics adopted in 2(a) above that apply to the registrant’s principal executive officer, principal financial officer, principal accounting officer or controller, or persons performing similar functions and relate to any element of the code of ethics definition.
(c) During the period covered by this report, no implicit or explicit waivers to the provisions of the code of ethics adopted in 2(a) above were granted to the registrant’s principal executive officer, principal financial officer, principal accounting officer or controller, or persons performing similar functions.
Item 3. Audit Committee Financial Expert
The registrant’s Board of Directors has determined that independent director Stanley Kritzik qualifies as an Audit Committee financial expert. The designation of a person as an “Audit Committee financial expert” does not mean that the person has any greater duties, obligations, or liability than those imposed on the persons without the “Audit Committee financial expert” designation. Similarly, the designation of a person as an “Audit Committee financial expert” does not affect the duties, obligations, or liability of any other member of the Audit Committee or Board of Directors.
Item 4. Principal Accountant Fees and Services
(a) – (d) Aggregate fees billed to the registrant for the last two fiscal years for professional services rendered by the registrant’s principal accountant were as follows:
| 2004 | ||||||||||||
| Audit Fees | Audit Related Feed | Tax Fees | Other Fees | |||||||||
Strong Opportunity Fund, Inc. | $ | 65,842 | $ | 0 | $ | 0 | $ | 0 | ||||
| 2003 | ||||||||||||
| Audit Fees | Audit Related Feed | Tax Fees | Other Fees | |||||||||
Strong Opportunity Fund, Inc. | $ | 115,897 | $ | 0 | $ | 12,917 | $ | 0 | ||||
Audit fees include amounts related to the audit of the registrant’s annual financial statements and services normally provided by the accountant in connection with statutory and regulatory filings. Audit-related fees include amounts reasonably related to the performance of the audit of the registrant’s financial statements, specifically the review of regulatory filings related to reorganizations and new share classes. Tax fees include amounts related to tax compliance, tax planning, and tax advice. Other fees include the registrant’s pro-rata share amounts for products and services other than those reported above.
(e) (1) The Audit Committee is required to preapprove audit and non-audit services performed for the Funds by the independent auditor in order to assure that the provision of such services does not impair the auditor’s independence. The Audit Committee also is required to preapprove certain non-audit services performed by the Funds’ independent auditor for the Funds’ investment adviser and certain of the adviser’s affiliates if the services relate directly to the operations and financial reporting of the Funds. Unless a type of service to be performed by the independent auditor has received preapproval, it will require specific preapproval by the Audit Committee. Any proposed services exceeding preapproved cost levels will require separate preapproval by the Audit Committee.
Notwithstanding any provision of this Policy, the Audit Committee is not required to preapprove services for which preapproval is not required by applicable law, including de minimis services (defined as non-audit services that constitute no more than 5% of the total amount of revenues paid to the independent auditor during the year in which the services are provided) and grandfathered services.
The Audit Committee may delegate preapproval authority to one or more of its members. The member or members to whom such authority is delegated shall report any preapproval decisions to the Audit Committee at its next scheduled meeting. The Audit Committee does not delegate its responsibility to preapprove services performed by the independent auditor to management.
(2) No services included in (b) – (d) above were approved pursuant to paragraph (c)(7)(i)(C) of Rule 2-01 of Regulation S-X.
(f) Not applicable.
(g) The aggregate fees billed for the most recent fiscal year (2004) and the preceding fiscal year (2003) by the registrant’s principal accountant for non-audit services rendered to the registrant, its investment adviser, and any entity controlling, controlled by, or under common control with the investment adviser that provides ongoing services to the registrant were $476,259 for 2004 and $512,254 for 2003.
(h) All non-audit services rendered in (g) above were preapproved by the registrant’s Audit Committee. Accordingly, these services were considered by the registrant’s Audit Committee in maintaining the principal accountant’s independence.
Item 5. Audit Committee of Listed Registrants
Not applicable.
Item 6. Schedule of Investments
Not applicable; a full Schedule of Investments is included in Item 1.
Item 7. Disclosure of Proxy Voting Policies and Procedures for Closed-End Management Investment Companies
Not applicable.
Item 8. Purchases of Equity Securities by Closed-End Management Investment Company and Affiliated Purchases
Not applicable.
Item 9. Submission of Matters to a Vote of Security Holders
There were no material changes to the procedures by which shareholders may recommend nominees to the Funds’ Board of Directors.
Item 10. Controls and Procedures
(a) An evaluation was performed within 90 days from the date hereof under the supervision of the Registrant’s management, including the principal executive officer and treasurer, regarding the effectiveness of the registrant’s disclosure controls and procedures. Based on that evaluation, it was determined that such disclosure controls and procedures provide reasonable assurance that the material information required to be disclosed by the Registrant in the reports it files or submits on Form N-CSR (1) is accumulated and communicated to the Registrant’s management, including its principal executive officer and treasurer, to allow timely decisions regarding required disclosure, and (2) is recorded, processed, summarized, and reported within the time periods specified in the Commission’s rules and forms.
(b) There were no significant changes in the Registrant’s internal control over financial reporting that occurred during the Registrant’s most recent fiscal half-year that has materially affected, or is reasonably likely to materially affect, the Registrant’s internal control over financial reporting.
Item 11. Exhibits
The following exhibits are attached to this Form N-CSR:
| 11 (a) (1) | Code of Ethics required by Item 2 of Form N-CSR | |
| 11 (a) (2) | Certification of Principal Executive Officer Required by Section 302 of the Sarbanes-Oxley Act of 2002 | |
| Certification of Principal Financial Officer Required by Section 302 of the Sarbanes-Oxley Act of 2002 | ||
| 11 (b) | Certification of Chief Executive Officer and Chief Financial Officer Required by Section 906 of the Sarbanes-Oxley Act of 2002 | |
Signatures
Pursuant to the requirements of the Securities Exchange Act of 1934 and the Investment Company Act of 1940, the Registrant has duly caused this report to be signed on its behalf by the undersigned, thereunto duly authorized.
Pursuant to the requirements of the Securities Exchange Act of 1934 and the Investment Company Act of 1940, this report has been signed below by the following persons on behalf of the registrant and in the capacities and on the dates indicated.
Strong Opportunity Fund, Inc., on behalf of Strong Advisor Select Fund, Strong Advisor U.S. Small/Mid Cap Growth Fund, Strong Endeavor Fund and Strong Opportunity Fund
| By: | /s/ Dana J. Russart | |
| Dana J. Russart, Principal Executive Officer | ||
| Date: February 14, 2005 | ||
| By: | /s/ John W. Widmer | |
John W. Widmer, Treasurer (Principal Financial Officer) and Secretary | ||
| Date: February 14, 2005 | ||