UNITED STATES
SECURITIES AND EXCHANGE COMMISSION
Washington, D.C. 20549
FORM N-CSR
CERTIFIED SHAREHOLDER REPORT OF REGISTERED MANAGEMENT INVESTMENT
COMPANIES
Investment Company Act file number 811-03851
Nicholas II, Inc.
(Exact Name of Registrant as specified in charter)
700 North Water Street, Milwaukee, Wisconsin 53202
(Address of Principal Executive Offices) (Zip Code)
Jeffrey T. May, Senior Vice President, Secretary and Treasurer
700 North Water Street
Milwaukee, Wisconsin 53202
(Name and Address of Agent for Service)
Registrant's telephone number, including area code: 414-272-4650
Date of fiscal year end: 09/30/2012
Date of reporting period: 03/31/2012
Item 1. Report to Stockholders.
SEMIANNUAL REPORT
March 31, 2012
NICHOLAS II, INC.

700 NORTH WATER STREET
MILWAUKEE, WISCONSIN 53202
WWW.NICHOLASFUNDS.COM
NICHOLAS II, INC.
May 2012
Dear Fellow Shareholders:
The investment climate over the past 12-months ended March 31, 2012, proved to be extremely volatile for equity investors. Throughout last summer, markets were concerned about European sovereign debt issues which were feared to cause a worldwide double-dip recession. This resulted in a correction in equities. Later, the fall brought enough positive economic data to assuage fears of a global slowdown, and European leaders began to show progress toward stemming the region’s debt crisis. This caused a strong stock market rebound from the summer lows through the end of 2011. Strong corporate earnings in the U.S., along with continued improvement in the economic data drove stocks higher again in the first quarter of 2012.
For the one-year period ended March 31, 2012, the Fund returned 6.86% compared to the Russell Midcap Growth Index of 4.43%. Returns for Nicholas II, Inc. Class I and Class N and selected indices are provided in the chart below for the periods ended March 31, 2012.
| | | | | | | | | | | | | | | |
| | | | | | Average Annual Total Returns | |
| | | 6 Month | | | 1 Year | | | 3 Year | | | 5 Year | | | 10 Year | |
| Nicholas II, Inc. – Class I | | 28.72 | % | | 6.86 | % | | 23.08 | % | | 5.30 | % | | 6.35 | % |
| Nicholas II, Inc. – Class N | | | | | | | | | | | | | | | |
| (linked to Class I) | | 28.52 | % | | 6.47 | % | | 22.69 | % | | 4.96 | % | | 6.09 | % |
| Russell Midcap Growth Index | | 27.39 | % | | 4.43 | % | | 29.16 | % | | 4.44 | % | | 6.92 | % |
| Russell 2000 Index | | 29.83 | % | | -0.18 | % | | 26.90 | % | | 2.13 | % | | 6.45 | % |
| Morningstar Mid-Cap | | | | | | | | | | | | | | | |
| Growth Category | | 26.47 | % | | 2.00 | % | | 25.93 | % | | 3.93 | % | | 5.97 | % |
| Standard & Poor’s 500 Index | | 25.89 | % | | 8.54 | % | | 23.42 | % | | 2.01 | % | | 4.12 | % |
| Ending value of $10,000 invested | | | | | | | | | | | | | | | |
| in Nicholas II, Inc. - Class I | $ | 12,872 | | $ | 10,686 | | $ | 18,647 | | $ | 12,947 | | $ | 18,502 | |
| Ending value of $10,000 invested | | | | | | | | | | | | | | | |
| in Nicholas II, Inc. - Class N | | | | | | | | | | | | | | | |
| (linked to Class I) | $ | 12,852 | | $ | 10,647 | | $ | 18,470 | | $ | 12,737 | | $ | 18,067 | |
| Fund’s Class I Expense Ratio (from 03/31/12 Financial Highlights): 0.65% | | | | | | | |
| Fund’s Class N Expense Ratio (from 03/31/12 Financial Highlights): 1.00% | | | | | | | |
| Fund’s Class I Expense Ratio (from 01/31/12 Prospectus): 0.65% | | | | | | | | | | |
| Fund’s Class N Expense Ratio (from 04/30/12 Prospectus): 0.99% | | | | | | | |
Performance data quoted represents past performance and is no guarantee of future results. The investment return and principal value of an investment will fluctuate so that an investor’s shares, when redeemed, may be worth more or less than their original cost. Current performance of the Fund may be lower or higher than the performance quoted. Performance data current to the most recent month-end, may be obtained by visiting www.nicholasfunds.com/returns.html.
The Fund’s returns are reduced by expenses; while the market indices are not. The ending values above illustrate the performance of a hypothetical $10,000 investment made in the Fund over the timeframes listed. Assumes reinvestment of dividends and capital gains. Returns shown do not reflect the deduction of taxes that a shareholder would pay on Fund distributions or the redemption of Fund shares. These figures do not imply any future performance.
Class N of the Fund commenced operations on February 28, 2005. Class I shares and Class N shares are invested in the same portfolio of securities. Annual returns will generally differ only to the extent that the classes do not have the same expenses. Please see the respective prospectus for details.
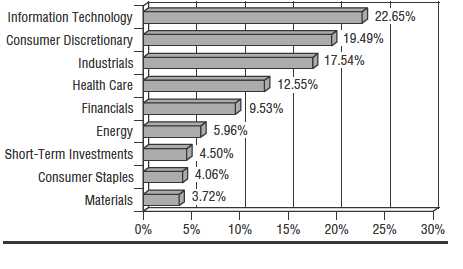
The Fund’s performance for the year ended March 31, 2012 was driven in large part by good stock selection in the consumer area, information technology area, and the energy sector. The Fund was concentrated on domestic oil production companies and not natural gas producing companies, which were severe underperformers in the energy sector. The Fund’s stocks in the healthcare and financial sectors underperformed those in the comparable index, which hurt the Fund’s performance versus the index. Currently, the Fund’s sector weightings are as follows: approximately 24% of net assets in consumer related stocks, 23% information technology, 18% industrials, 13% health care, 10% financials, 6% energy and 4% materials.
Looking at the longer-term numbers, the Fund has slightly underperformed compared to the benchmark for the three-year period and has shown outperformance for the five-year period. This is due to our more conservative nature. The three-year period was generally a straight up market whereas the five-year period includes the bear market of 2008, where the Fund outperformed significantly. We believe it is more important to preserve capital in difficult times.
Currently, the economy seems to be slowly improving. The Federal Reserve has continued to maintain a position of extremely low interest rates. The housing market also seems to be improving slightly and consumer spending has remained strong. Corporate profits as well remained solid. The European debt situation is a concern and may cause Europe to go into a recession. We continue to focus our efforts on well-managed mid-cap companies that have the ability to grow their earnings steadily, produce high returns on capital, and are selling at reasonable prices.
We appreciate your continued support.

The Fund may invest in smaller companies, which involve additional risks such as limited liquidity and greater volatility.
Please refer to the schedule of investments in the report for complete fund holdings information. Fund holdings and sector allocations are subject to change and should not be considered a recommendation to buy or sell any security.
The Russell Midcap Growth Index measures the performance of those Russell Midcap companies with higher price-to-book ratios and higher forecasted growth values. The Russell 2000 Index measures the performance of the 2000 smallest companies in the Russell 3000 Index, which represents approximately 10% of the total market capitalization of the Russell 3000 Index. The Standard & Poor’s (“S&P”) 500 Index is a broad based unmanaged index of 500 stocks, which is widely recognized as representative of the equity market in general. One cannot invest directly in an index. Each Morningstar Category average represents a universe of Funds with similar investment objectives.
Must be preceded or accompanied by a prospectus.
The Nicholas Funds are distributed by Quasar Distributors, LLC.
| | | | | | | | | | | | | | | | | | |
| Financial Highlights Class I (NCTWX) | | | | |
| For a share outstanding throughout each period | | | | | | | | | | | | | |
| |
| | | Six Months | | | | | | | | | | | | | | | | |
| | | Ended | | | | | | | | | | | | | | | | |
| | | 03/31/2012 | | | | | | Years Ended September 30, | | | | |
| | | (unaudited) | | | 2011 | | | 2010 | | | 2009 | | | 2008 | | | 2007 | |
| NET ASSET VALUE, | | | | | | | | | | | | | | | | | | |
| BEGINNING OF PERIOD | $ | 18.72 | | $ | 19.31 | | $ | 17.02 | | $ | 19.15 | | $ | 25.18 | | $ | 23.11 | |
| INCOME (LOSS) FROM | | | | | | | | | | | | | | | | | | |
| INVESTMENT OPERATIONS | | | | | | | | | | | | | | | | | | |
| Net investment income(1) | | .05 | | | .10 | | | .08 | | | .11 | | | .10 | | | .08 | |
| Net gain (loss) on securities | | | | | | | | | | | | | | | | | | |
| (realized and unrealized) | | 5.24 | | | (.22 | ) | | 2.31 | | | (1.01 | ) | | (3.46 | ) | | 3.10 | |
| Total from investment | | | | | | | | | | | | | | | | | | |
| operations | | 5.29 | | | (.12 | ) | | 2.39 | | | (.90 | ) | | (3.36 | ) | | 3.18 | |
| LESS DISTRIBUTIONS | | | | | | | | | | | | | | | | | | |
| From net investment income | | (.10 | ) | | (.09 | ) | | (.10 | ) | | (.11 | ) | | (.10 | ) | | (.06 | ) |
| From net capital gain | | (.49 | ) | | (.38 | ) | | — | | | (1.12 | ) | | (2.57 | ) | | (1.05 | ) |
| Total distributions | | (.59 | ) | | (.47 | ) | | (.10 | ) | | (1.23 | ) | | (2.67 | ) | | (1.11 | ) |
| NET ASSET VALUE, | | | | | | | | | | | | | | | | | | |
| END OF PERIOD | $ | 23.42 | | $ | 18.72 | | $ | 19.31 | | $ | 17.02 | | $ | 19.15 | | $ | 25.18 | |
| |
| TOTAL RETURN | | 28.72% | (2) | | (.90 | )% | | 14.06 | % | | (2.86) | % | | (14.65) | % | | 14.19 | % |
| |
| SUPPLEMENTAL DATA: | | | | | | | | | | | | | | | | | | |
| Net assets, end of period (millions) | $ | 476.2 | | $ | 398.7 | | $ | 418.0 | | $ | 384.7 | | $ | 421.8 | | $ | 539.9 | |
| Ratio of expenses | | | | | | | | | | | | | | | | | | |
| to average net assets | | .65% | (3) | | .65 | % | | .68 | % | | .72 | % | | .67 | % | | .66 | % |
| Ratio of net investment income | | | | | | | | | | | | | | | | | | |
| to average net assets | | .44% | (3) | | .46 | % | | .44 | % | | .78 | % | | .44 | % | | .34 | % |
| Portfolio turnover rate | | 15.24% | (3) | | 27.93 | % | | 28.67 | % | | 32.86 | % | | 27.48 | % | | 19.56 | % |
| (1) | Computed based on average shares outstanding. |
| (2) | Not annualized. |
| (3) | Annualized. |
The accompanying notes to financial statements are an integral part of these highlights.
– 3–
| | | | | | | | | | | | | | | | | | |
| Financial Highlights Class N (NNTWX) | |
| For a share outstanding throughout each period | | | | | | | | | | | | | |
| |
| | | Six Months | | | | | | | | | | | | | | | | |
| | | Ended | | | | | | | | | | | | | | | | |
| | | 03/31/2012 | | | | | | Years Ended September 30, | | | | |
| | | (unaudited) | | | 2011 | | | 2010 | | | 2009 | | | 2008 | | | 2007 | |
| NET ASSET VALUE, | | | | | | | | | | | | | | | | | | |
| BEGINNING OF PERIOD | $ | 18.49 | | $ | 19.11 | | $ | 16.87 | | $ | 19.04 | | $ | 25.03 | | $ | 23.00 | |
| INCOME (LOSS) FROM | | | | | | | | | | | | | | | | | | |
| INVESTMENT OPERATIONS | | | | | | | | | | | | | | | | | | |
| Net investment income(1) | | .01 | | | .02 | | | .02 | | | .07 | | | .03 | | | (.00) | (2) |
| Net gain (loss) on securities | | | | | | | | | | | | | | | | | | |
| (realized and unrealized) | | 5.19 | | | (.21 | ) | | 2.29 | | | (1.02 | ) | | (3.44 | ) | | 3.08 | |
| Total from investment | | | | | | | | | | | | | | | | | | |
| operations | | 5.20 | | | (.19 | ) | | 2.31 | | | (.95 | ) | | (3.41 | ) | | 3.08 | |
| LESS DISTRIBUTIONS | | | | | | | | | | | | | | | | | | |
| From net investment income | | (.02 | ) | | (.05 | ) | | (.07 | ) | | (.10 | ) | | (.01 | ) | | — | |
| From net capital gain | | (.49 | ) | | (.38 | ) | | — | | | (1.12 | ) | | (2.57 | ) | | (1.05 | ) |
| Total distributions | | (.51 | ) | | (.43 | ) | | (.07 | ) | | (1.22 | ) | | (2.58 | ) | | (1.05 | ) |
| NET ASSET VALUE, | | | | | | | | | | | | | | | | | | |
| END OF PERIOD | $ | 23.18 | | $ | 18.49 | | $ | 19.11 | | $ | 16.87 | | $ | 19.04 | | $ | 25.03 | |
| |
| TOTAL RETURN | | 28.52 | %(3) | | (1.25 | )% | | 13.70 | % | | (3.17)% | | | (14.92)% | | | 13.77 | % |
| |
| SUPPLEMENTAL DATA: | | | | | | | | | | | | | | | | | | |
| Net assets, end of period (millions) | $ | 114.1 | | $ | 102.9 | | $ | 44.1 | | $ | 31.9 | | $ | 1.8 | | $ | 0.8 | |
| Ratio of expenses | | | | | | | | | | | | | | | | | | |
| to average net assets | | 1.00 | %(4) | | .99 | % | | 1.00 | % | | .98 | % | | 1.02 | % | | 1.01 | % |
| Ratio of net investment income | | | | | | | | | | | | | | | | | | |
| to average net assets | | .09 | %(4) | | .10 | % | | .12 | % | | .48 | % | | .09 | % | | (.01 | )% |
| Portfolio turnover rate | | 15.24 | %(4) | | 27.93 | % | | 28.67 | % | | 32.86 | % | | 27.48 | % | | 19.56 | % |
| (1) | Computed based on average shares outstanding. |
| (2) | The amount rounds to $0.00. |
| (3) | Not annualized. |
| (4) | Annualized. |
The accompanying notes to financial statements are an integral part of these highlights.
– 4–
| | |
| Top Ten Equity Portfolio Holdings | | |
| March 31, 2012 (unaudited) | | |
| |
| | Percentage | |
| Name | of Net Assets | |
| Fastenal Company | 1.89 | % |
| IHS Inc. – Class A | 1.82 | % |
| O’Reilly Automotive, Inc | 1.78 | % |
| AMETEK, Inc | 1.73 | % |
| Coach, Inc | 1.70 | % |
| IDEX Corporation | 1.70 | % |
| DaVita, Inc | 1.68 | % |
| Jarden Corporation | 1.67 | % |
| TJX Companies, Inc. (The) | 1.65 | % |
| Fiserv, Inc | 1.60 | % |
| Total of top ten | 17.22 | % |
| |
| |
| Sector Diversification (as a percentage of portfolio) | |
| March 31, 2012 (unaudited) | | |
– 5–
Fund Expenses
For the six month period ended March 31, 2012 (unaudited)
As a shareholder of the Fund, you incur two types of costs: (1) transaction costs and (2) ongoing costs, including management fees and other operating expenses. The following table is intended to help you understand your ongoing costs (in dollars) of investing in the Fund and to compare these costs with those of other mutual funds.
The example is based on an investment of $1,000 made at the beginning of the period and held for the entire period.
The first line of the table below for each share class of the Fund provides information about the actual account values and actual expenses. You may use the information in this line, together with the amount you invested, to estimate the expenses that you paid over the period. Simply divide your account value by $1,000 (for example, an $8,600 account value divided by $1,000 = 8.6), then multiply the result by the number in the first line under the heading entitled “Expenses Paid During Period” to estimate the expenses you paid on your account during this period.
The second line of the table below provides information about hypothetical account values and hypothetical expenses based on the Fund’s actual expense ratios for each class of the Fund and an assumed rate of return of 5% per year before expenses, which are not the Fund’s actual returns. The hypothetical account values and expenses may not be used to estimate the actual ending account balance or expenses you paid for the period. You may use this information to compare the ongoing costs of investing in the Fund with other funds. To do so, compare this 5% hypothetical example with the 5% hypothetical examples that appear in the shareholder reports of other funds.
Please note that the expenses shown in the table are meant to highlight your ongoing costs only and do not reflect any transactional costs, such as wire fees. Therefore, the second line of the table is useful in comparing ongoing costs only, and will not help you determine the relative total costs of owning different funds. In addition, if these transactional costs were included, your costs would have been higher.
| | | | | | |
| Class I | | | | | | |
| | | Beginning | | Ending | | Expenses Paid |
| | | Account | | Account | | During Period* |
| | | Value 09/30/11 | | Value 03/31/12 | | 10/01/11 - 03/31/12 |
| Actual | $ | 1,000.00 | $ | 1,287.20 | $ | 3.72 |
| Hypothetical | | 1,000.00 | | 1,021.75 | | 3.29 |
| (5% return before expenses) | | | | | | |
| * | Expenses are equal to the Class I six-month annualized expense ratio of 0.65%, multiplied by the average account value over the period, multiplied by 182 then divided by 364 to reflect the one- half year period. |
– 6–
Fund Expenses (continued)
For the six month period ended March 31, 2012 (unaudited)
| | | | | | |
| Class N | | | | | | |
| | | Beginning | | Ending | | Expenses Paid |
| | | Account | | Account | | During Period** |
| | | Value 09/30/11 | | Value 03/31/12 | | 10/01/11 - 03/31/12 |
| Actual | $ | 1,000.00 | $ | 1,285.20 | $ | 5.71 |
| Hypothetical | | 1,000.00 | | 1,020.00 | | 5.05 |
| (5% return before expenses) | | | | | | |
| ** | Expenses are equal to the Class N six-month annualized expense ratio of 1.00%, multiplied by the average account value over the period, multiplied by 182 then divided by 364 to reflect the one-half year period. |
– 7–
| | | |
| Schedule of Investments | | |
| March 31, 2012 (unaudited) | | |
| |
| Shares or | | | |
| Principal | | | |
| Amount | | | Value |
| COMMON STOCKS — 95.40% | | |
| | Consumer Discretionary – Automobiles & Components — 1.10% | | |
| 265,000 | Gentex Corporation | $ | 6,492,500 |
| | Consumer Discretionary – Durables & Apparel — 5.38% | | |
| 130,000 | Coach, Inc | | 10,046,400 |
| 245,000 | Jarden Corporation* | | 9,856,350 |
| 50,000 | Polaris Industries Inc | | 3,607,500 |
| 130,000 | Tupperware Brands Corporation | | 8,255,000 |
| | | | 31,765,250 |
| | Consumer Discretionary – Retailing — 10.89% | | |
| 300,000 | Aaron’s, Inc | | 7,770,000 |
| 270,000 | CarMax, Inc.* | | 9,355,500 |
| 300,000 | LKQ Corporation* | | 9,351,000 |
| 100,000 | Nordstrom, Inc | | 5,572,000 |
| 115,000 | O’Reilly Automotive, Inc.* | | 10,505,250 |
| 150,000 | PetSmart, Inc | | 8,583,000 |
| 105,000 | Select Comfort Corporation* | | 3,400,950 |
| 245,000 | TJX Companies, Inc. (The) | | 9,728,950 |
| | | | 64,266,650 |
| | Consumer Discretionary – Services — 2.10% | | |
| 340,000 | InterContinental Hotels Group PLC | | 7,894,800 |
| 80,000 | Starwood Hotels & Resorts Worldwide, Inc | | 4,512,800 |
| | | | 12,407,600 |
| | Consumer Staples – Food & Staples Retailing — 1.11% | | |
| 90,000 | PriceSmart, Inc | | 6,552,900 |
| | Consumer Staples – Food, Beverage & Tobacco — 2.94% | | |
| 80,000 | Beam Inc | | 4,685,600 |
| 190,000 | Hormel Foods Corporation | | 5,608,800 |
| 130,000 | McCormick & Company, Inc | | 7,075,900 |
| | | | 17,370,300 |
| | Energy — 5.95% | | |
| 105,000 | Cameron International Corporation* | | 5,547,150 |
| 10,000 | CARBO Ceramics Inc | | 1,054,500 |
| 45,000 | Concho Resources Inc.* | | 4,593,600 |
| 70,000 | Continental Resources, Inc.* | | 6,007,400 |
| 50,000 | Helmerich & Payne, Inc | | 2,697,500 |
| 109,626 | Kinder Morgan Management, LLC* | | 8,181,411 |
| 130,000 | Whiting Petroleum Corporation* | | 7,059,000 |
| | | | 35,140,561 |
The accompanying notes to financial statements are an integral part of this schedule.
– 8–
| | | |
| Schedule of Investments (continued) | | |
| March 31, 2012 (unaudited) | | |
| |
| Shares or | | | |
| Principal | | | |
| Amount | | | Value |
| COMMON STOCKS — 95.40% (continued) | | |
| | Financials – Banks — 1.33% | | |
| 107,768 | Commerce Bancshares, Inc | $ | 4,366,759 |
| 60,000 | Cullen/Frost Bankers, Inc | | 3,491,400 |
| | | | 7,858,159 |
| | Financials – Diversified — 4.96% | | |
| 67,500 | Affiliated Managers Group, Inc.* | | 7,547,175 |
| 175,000 | MSCI Inc.* | | 6,441,750 |
| 230,000 | Raymond James Financial, Inc | | 8,401,900 |
| 105,000 | T. Rowe Price Group, Inc | | 6,856,500 |
| | | | 29,247,325 |
| | Financials – Insurance — 2.48% | | |
| 215,000 | Marsh & McLennan Companies, Inc | | 7,049,850 |
| 217,000 | Willis Group Holdings PLC | | 7,590,660 |
| | | | 14,640,510 |
| | Financials – Real Estate — 0.75% | | |
| 60,000 | Digital Realty Trust, Inc | | 4,438,200 |
| | Health Care – Equipment & Services — 6.57% | | |
| 377,000 | Allscripts Healthcare Solutions, Inc.* | | 6,258,200 |
| 110,000 | DaVita, Inc.* | | 9,918,700 |
| 205,000 | DENTSPLY International Inc | | 8,226,650 |
| 250,000 | ResMed Inc.* | | 7,727,500 |
| 120,000 | Stryker Corporation | | 6,657,600 |
| | | | 38,788,650 |
| | Health Care – Pharmaceuticals, | | |
| | Biotechnology & Life Sciences — 5.96% | | |
| 75,000 | Allergan, Inc | | 7,157,250 |
| 145,000 | Gilead Sciences, Inc.* | | 7,083,250 |
| 47,500 | Mettler-Toledo International Inc.* | | 8,775,625 |
| 140,000 | Teva Pharmaceutical Industries Ltd | | 6,308,400 |
| 103,920 | Thermo Fisher Scientific Inc | | 5,859,010 |
| | | | 35,183,535 |
| | Industrials – Capital Goods — 11.45% | | |
| 210,000 | AMETEK, Inc | | 10,187,100 |
| 180,000 | BE Aerospace, Inc.* | | 8,364,600 |
| 206,000 | Fastenal Company | | 11,144,600 |
| 237,500 | IDEX Corporation | | 10,005,875 |
| 175,000 | Pentair, Inc | | 8,331,750 |
| 115,000 | Snap-on Incorporated | | 7,011,550 |
The accompanying notes to financial statements are an integral part of this schedule.
– 9–
| | | |
| Schedule of Investments (continued) | | |
| March 31, 2012 (unaudited) | | |
| |
| Shares or | | | |
| Principal | | | |
| Amount | | | Value |
| COMMON STOCKS — 95.40% (continued) | | |
| | Industrials – Capital Goods — 11.45% (continued) | | |
| 30,000 | TransDigm Group Incorporated* | $ | 3,472,800 |
| 120,000 | Westinghouse Air Brake Technologies Corporation | | 9,044,400 |
| | | | 67,562,675 |
| | Industrials – Commercial & Professional Services — 1.83% | | |
| 115,000 | IHS Inc. – Class A* | | 10,769,750 |
| | Industrials – Transportation — 4.25% | | |
| 80,000 | C.H. Robinson Worldwide, Inc | | 5,239,200 |
| 143,000 | Expeditors International of Washington, Inc | | 6,650,930 |
| 135,000 | Landstar System, Inc | | 7,792,200 |
| 315,000 | UTi Worldwide Inc | | 5,427,450 |
| | | | 25,109,780 |
| | Information Technology – Hardware & Equipment — 5.31% | | |
| 185,000 | FLIR Systems, Inc | | 4,682,350 |
| 340,000 | Molex Incorporated – Class A | | 7,973,000 |
| 195,000 | Riverbed Technology, Inc.* | | 5,475,600 |
| 130,000 | SanDisk Corporation* | | 6,446,700 |
| 163,750 | Zebra Technologies Corporation – Class A* | | 6,743,225 |
| | | | 31,320,875 |
| | Information Technology – Semiconductors | | |
| | & Semiconductor Equipment — 5.21% | | |
| 215,000 | Altera Corporation | | 8,561,300 |
| 195,000 | Avago Technologies Limited | | 7,599,150 |
| 228,750 | Microchip Technology Incorporated | | 8,509,500 |
| 220,000 | Skyworks Solutions, Inc.* | | 6,083,000 |
| | | | 30,752,950 |
| | Information Technology – Software & Services — 12.11% | | |
| 110,000 | ANSYS, Inc.* | | 7,152,200 |
| 209,499 | Fidelity National Information Services, Inc | | 6,938,607 |
| 135,937 | Fiserv, Inc.* | | 9,432,668 |
| 95,000 | FleetCor Technologies, Inc.* | | 3,683,150 |
| 95,000 | Informatica Corporation* | | 5,025,500 |
| 30,000 | MercadoLibre, Inc | | 2,933,700 |
| 215,000 | Paychex, Inc | | 6,662,850 |
| 155,000 | Red Hat, Inc.* | | 9,282,950 |
| 120,000 | Teradata Corporation* | | 8,178,000 |
| 205,000 | TIBCO Software Inc.* | | 6,252,500 |
| 115,000 | VeriFone Systems, Inc.* | | 5,965,050 |
| | | | 71,507,175 |
The accompanying notes to financial statements are an integral part of this schedule.
– 10 –
| | | |
| Schedule of Investments (continued) | | |
| March 31, 2012 (unaudited) | | |
| |
| Shares or | | | |
| Principal | | | |
| Amount | | | Value |
| COMMON STOCKS — 95.40% (continued) | | |
| | Materials — 3.72% | | |
| 35,000 | Air Products and Chemicals, Inc | $ | 3,213,000 |
| 50,000 | Airgas, Inc | | 4,448,500 |
| 120,000 | AptarGroup, Inc | | 6,572,400 |
| 125,000 | Ecolab Inc | | 7,715,000 |
| | | | 21,948,900 |
| | TOTAL COMMON STOCKS | | |
| | (cost $348,172,022) | | 563,124,245 |
| SHORT-TERM INVESTMENTS — 4.49% | | |
| | Commercial Paper – 4.09% | | |
| $ 600,000 | Integrys Energy Group, Inc. 04/02/12, 0.42% | | 600,000 |
| 1,500,000 | Leggett & Platt, Incorporated 04/03/12, 0.36% | | 1,499,985 |
| 1,000,000 | Bacardi Corporation 04/04/12, 0.42% | | 999,977 |
| 1,350,000 | Wisconsin Energy Corporation 04/04/12, 0.26% | | 1,349,981 |
| 600,000 | Tyco Electronics Group S.A. 04/05/12, 0.43% | | 599,979 |
| 825,000 | Integrys Energy Group, Inc. 04/09/12, 0.35% | | 824,944 |
| 1,300,000 | Tyco Electronics Group S.A. 04/09/12, 0.45% | | 1,299,886 |
| 1,000,000 | Leggett & Platt, Incorporated 04/10/12, 0.32% | | 999,929 |
| 1,075,000 | BMW US Capital, LLC 04/11/12, 0.31% | | 1,074,917 |
| 1,650,000 | Stanley Black & Decker Inc. 04/12/12, 0.30% | | 1,649,862 |
| 1,000,000 | Integrys Energy Group, Inc. 04/13/12, 0.45% | | 999,862 |
| 1,300,000 | Sherwin-Williams Company (The) 04/16/12, 0.21% | | 1,299,894 |
| 775,000 | Thermo Fisher Scientific Inc. 04/17/12, 0.35% | | 774,887 |
| 925,000 | Bacardi Corporation 04/18/12, 0.43% | | 924,823 |
| 1,750,000 | Tyco Electronics Group S.A. 04/19/12, 0.44% | | 1,749,636 |
| 1,325,000 | BMW US Capital, LLC 04/20/12, 0.30% | | 1,324,801 |
| 1,000,000 | Clorox Company (The) 04/23/12, 0.40% | | 999,767 |
| 1,500,000 | H.J. Heinz Finance Company 04/23/12, 0.30% | | 1,499,737 |
| 1,000,000 | Diageo Capital plc 04/24/12, 0.45% | | 999,725 |
| 1,825,000 | Leggett & Platt, Incorporated 04/25/12, 0.32% | | 1,824,627 |
| 875,000 | Anheuser-Busch InBev Worldwide Inc. 04/26/12, 0.27% | | 874,843 |
| | | | 24,172,062 |
The accompanying notes to financial statements are an integral part of this schedule.
– 11 –
| | |
| Schedule of Investments (continued) | | |
| March 31, 2012 (unaudited) | | |
| |
| Shares or | | | |
| Principal | | | |
| Amount | | | Value |
| SHORT-TERM INVESTMENTS — 4.49% (continued) | | |
| Variable Rate Security – 0.40% | | |
| $2,374,104 | American Family Financial Services, Inc. 04/02/12, 0.10%(1) | $ | 2,374,104 |
| TOTAL SHORT-TERM INVESTMENTS | | |
| (cost $26,546,166) | | 26,546,166 |
| TOTAL INVESTMENTS | | |
| (cost $374,718,188) — 99.89% | | 589,670,411 |
| | | |
| OTHER ASSETS, NET OF LIABILITIES — 0.11% | | 621,380 |
| | | |
| TOTAL NET ASSETS | | |
| (basis of percentages disclosed above) – 100% | $ | 590,291,791 |
* Non-income producing security.
(1) Subject to a demand feature as defined by the Securities and Exchange Commission.
The accompanying notes to financial statements are an integral part of this schedule.
– 12 –
Statement of Assets and Liabilities
March 31, 2012 (unaudited)
| | |
| ASSETS | | |
| Investments in securities at value (cost $374,718,188) | $ | 589,670,411 |
| Receivables – | | |
| Investment securities sold | | 948,657 |
| Dividend and interest | | 522,025 |
| Capital stock subscription | | 9,274 |
| Total receivables | | 1,479,956 |
| Other | | 18,071 |
| Total assets | | 591,168,438 |
| |
| LIABILITIES | | |
| Payables – | | |
| Investment securities purchased | | 491,969 |
| Due to adviser – | | |
| Management fee | | 270,189 |
| Accounting and administrative fee | | 12,745 |
| Total due to adviser | | 282,934 |
| 12b-1 and servicing fee | | 28,911 |
| Other payables and accrued expense | | 72,833 |
| Total liabilities | | 876,647 |
| Total net assets | $ | 590,291,791 |
| |
| NET ASSETS CONSIST OF | | |
| Paid in capital | $ | 351,378,159 |
| Net unrealized appreciation on investments | | 214,952,223 |
| Accumulated undistributed net realized gain on investments | | 23,550,616 |
| Accumulated undistributed net investment income | | 410,793 |
| Total net assets | $ | 590,291,791 |
| |
| Class I: | | |
| Net assets | $ | 476,156,305 |
| Shares outstanding | | 20,327,830 |
| NET ASSET VALUE PER SHARE ($.01 par value, | | |
| 125,000,000 shares authorized), offering price and redemption price | $ | 23.42 |
| |
| Class N: | | |
| Net assets | $ | 114,135,486 |
| Shares outstanding | | 4,923,979 |
| NET ASSET VALUE PER SHARE ($.01 par value, | | |
| 75,000,000 shares authorized), offering price and redemption price | $ | 23.18 |
The accompanying notes to financial statements are an integral part of this statement.
– 13 –
| | |
| Statement of Operations | | |
| For the six months ended March 31, 2012 (unaudited) | | |
| |
| INCOME | | |
| Dividend (net of foreign taxes of $15,220) | $ | 2,944,160 |
| Interest | | 35,397 |
| Total income | | 2,979,557 |
| |
| EXPENSES | | |
| Management fee | | 1,449,915 |
| 12b-1 fees – Class N | | 137,504 |
| Transfer agent fees | | 101,602 |
| Accounting and administrative fees | | 68,145 |
| Servicing fees – Class N | | 55,001 |
| Postage and mailing | | 32,392 |
| Registration fees | | 31,742 |
| Printing | | 19,107 |
| Audit and tax fees | | 15,150 |
| Insurance | | 14,247 |
| Custodian fees | | 13,643 |
| Directors’ fees | | 12,050 |
| Accounting system and pricing service fees | | 5,727 |
| Legal fees | | 5,241 |
| Other operating expenses | | 4,000 |
| Total expenses | | 1,965,466 |
| Net investment income | | 1,014,091 |
| |
| NET REALIZED GAIN ON INVESTMENTS | | 24,436,484 |
| |
| CHANGE IN NET UNREALIZED | | |
| APPRECIATION/DEPRECIATION ON INVESTMENTS | | 110,391,916 |
| Net realized and unrealized gain on investments | | 134,828,400 |
| Net increase in net assets resulting from operations | $ | 135,842,491 |
The accompanying notes to financial statements are an integral part of this statement.
– 14 –
| | | | | | |
| Statements of Changes in Net Assets | |
| For the six months ended March 31, 2012 (unaudited) | | | | | | |
| and the year ended September 30, 2011 | | | | | | |
| |
| | | Six Months Ended | | | | |
| | | 03/31/2012 | | | Year Ended | |
| | | (unaudited) | | | 09/30/2011 | |
| INCREASE (DECREASE) IN NET ASSETS FROM OPERATIONS | | | | | | |
| Net investment income | $ | 1,014,091 | | $ | 2,211,980 | |
| Net realized gain on investments | | 24,436,484 | | | 11,789,537 | |
| Change in net unrealized | | | | | | |
| appreciation/depreciation on investments | | 110,391,916 | | | (24,148,540 | ) |
| Net increase (decrease) in net assets | | | | | | |
| resulting from operations | | 135,842,491 | | | (10,147,023 | ) |
| |
| DISTRIBUTIONS TO SHAREHOLDERS | | | | | | |
| From net investment income – Class I | | (1,998,096 | ) | | (1,855,287 | ) |
| From net realized gain on investments – Class I | | (9,875,674 | ) | | (8,197,926 | ) |
| From net investment income – Class N | | (99,251 | ) | | (189,759 | ) |
| From net realized gain on investments – Class N | | (2,547,779 | ) | | (1,517,676 | ) |
| Total distributions | | (14,520,800 | ) | | (11,760,648 | ) |
| |
| CAPITAL SHARE TRANSACTIONS | | | | | | |
| Proceeds from shares issued – Class I | | | | | | |
| (191,954 and 801,637 shares, respectively) | | 4,125,169 | | | 17,068,047 | |
| Reinvestment of distributions – Class I | | | | | | |
| (544,136 and 446,453 shares, respectively) | | 11,105,826 | | | 9,446,959 | |
| Cost of shares redeemed – Class I | | | | | | |
| (1,705,952 and 1,601,443 shares, respectively) | | (34,337,355 | ) | | (34,201,450 | ) |
| Proceeds from shares issued – Class N | | | | | | |
| (133,275 and 4,605,479 shares, respectively) | | 2,861,941 | | | 97,242,902 | |
| Reinvestment of distributions – Class N | | | | | | |
| (130,798 and 81,365 shares, respectively) | | 2,644,742 | | | 1,705,398 | |
| Cost of shares redeemed – Class N | | | | | | |
| (903,802 and 1,432,070 shares, respectively) | | (19,068,972 | ) | | (29,881,957 | ) |
| Change in net assets derived | | | | | | |
| from capital share transactions | | (32,668,649 | ) | | 61,379,899 | |
| Total increase in net assets | | 88,653,042 | | | 39,472,228 | |
| |
| NET ASSETS | | | | | | |
| Beginning of period | | 501,638,749 | | | 462,166,521 | |
| End of period (including accumulated | | | | | | |
| undistributed net investment income | | | | | | |
| of $410,793 and $1,494,049, respectively) | $ | 590,291,791 | | $ | 501,638,749 | |
The accompanying notes to financial statements are an integral part of these statements.
– 15 –
Notes to Financial Statements
March 31, 2012 (unaudited)
These financial statements have been prepared pursuant to reporting rules for interim
financial statements. Accordingly, these financial statements do not include all of the
information and footnotes required by generally accepted accounting principles (“GAAP”) for
annual financial statements. These financial statements should be read in conjunction with
the financial statements and financial highlights and notes in the Fund’s Annual Report on
Form N-CSR for the year ended September 30, 2011.
These financial statements have not been audited. Management believes that these financial
statements include all adjustments (which, unless otherwise noted, include only normal
recurring adjustments) necessary for a fair presentation of the financial results for each
period shown.
(1) Summary of Significant Accounting Policies —
Nicholas II, Inc. (the “Fund”) is organized as a Maryland corporation and is registered as
an open-end, diversified management investment company under the Investment
Company Act of 1940, as amended. The primary objective of the Fund is long-term
growth. The following is a summary of the significant accounting policies of the Fund:
(a) Equity securities traded on a stock exchange will ordinarily be valued on the basis
of the last sale price on the date of valuation on the securities principal exchange,
or if in the absence of any sale on that day, the closing bid price. For securities
principally traded on the NASDAQ market, the Fund uses the NASDAQ Official
Closing Price. Debt securities, excluding short-term investments, are valued at
their current evaluated bid price as determined by an independent pricing service,
which generates evaluations on the basis of dealer quotes for normal institutional-
sized trading units, issuer analysis, bond market activity and various other factors.
Securities for which market quotations may not be readily available are valued at
their fair value as determined in good faith by procedures adopted by the Board of
Directors. Variable rate demand notes are valued at cost, which approximates
market value. U.S. Treasury Bills and commercial paper are stated at amortized
cost, which approximates market value. The Fund did not maintain any positions in
derivative instruments or engage in hedging activities during the year. Investment
transactions for financial statement purposes are recorded on trade date.
In accordance with Accounting Standards Codification (“ASC”) 820-10, “Fair Value
Measurements and Disclosures” (“ASC 820-10”), fair value is defined as the price
that the Fund would receive upon selling an investment in a timely transaction to an
independent buyer in the principal or most advantageous market of the investment.
ASC 820-10 established a three-tier hierarchy to maximize the use of observable
market data and minimize the use of unobservable inputs and to establish
classification of fair value measurements for disclosure purposes. Inputs refer
broadly to the assumptions that market participants would use in pricing the asset
or liability, including assumptions about risk, for example, the risk inherent in a
particular valuation technique used to measure fair value such as a pricing model
and/or the risk inherent in the inputs to the valuation technique. Inputs may be
observable or unobservable. Observable inputs are inputs that reflect the
assumptions market participants would use in pricing the asset or liability based on
– 16 –
Notes to Financial Statements (continued)
March 31, 2012 (unaudited)
market data obtained from sources independent of the reporting entity.
Unobservable inputs are inputs that reflect the reporting entity’s own assumptions
about the assumptions market participants would use in pricing the asset or liability
based on the best information available in the circumstances. The three-tier
hierarchy of inputs is summarized in the three broad levels listed below.
Level 1 – quoted prices in active markets for identical investments
Level 2 – other significant observable inputs (including quoted prices for similar
investments, interest rates, benchmark yields, bids, offers, transactions,
spreads and other relationships observed in the markets among market
securities, underlying equity of the issuer, proprietary pricing models,
credit risk, etc.)
Level 3 – significant unobservable inputs (including the Fund’s own assumptions in
determining the fair value of investments)
The inputs or methodology used for valuing securities are not necessarily an
indication of the risk associated with investing in those securities.
The following is a summary of the inputs used as of March 31, 2012 in valuing the
Fund’s investments carried at value:
| | |
| | | Investments |
| Valuation Inputs | | in Securities |
| Level 1 – | | |
| Common Stocks(1) | $ | 563,124,245 |
| Level 2 – | | |
| Commercial Paper | | 24,172,062 |
| Variable Rate Security | | 2,374,104 |
| Level 3 – | | |
| None | | — |
| Total | $ | 589,670,411 |
| (1) See Schedule of Investments for further detail by industry. | | |
There were no significant transfers between levels during the period ended March
31, 2012 and the Fund did not hold any Level 3 investments during the period.
(b) Net realized gain (loss) on portfolio securities was computed on the basis of
specific identification.
(c) Dividend income is recorded on the ex-dividend date, and interest income is
recognized on an accrual basis. Non-cash dividends, if any, are recorded at value
on date of distribution. Generally, discounts and premiums on long-term debt
security purchases, if any, are amortized over the expected lives of the respective
securities using the effective yield method.
(d) Provision has not been made for federal income taxes or excise taxes since the
Fund has elected to be taxed as a “regulated investment company” and intends to
distribute substantially all net investment income and net realized capital gains on
sales of investments to its shareholders and otherwise comply with the provisions
– 17 –
Notes to Financial Statements (continued)
March 31, 2012 (unaudited)
of Subchapter M of the Internal Revenue Code applicable to regulated investment
companies.
Investment income, net capital gains (losses) and all expenses incurred by the Fund
are allocated based on the relative net assets of each class, except for service fees
and certain other fees and expenses related to one class of shares.
Class N shares are subject to a 0.25% 12b-1 fee and a 0.10% servicing fee, as
described in its prospectus. Income, expenses (other than expenses attributable to
a specific class), and realized and unrealized gains and losses are allocated daily to
each class of shares based upon the relative net asset value of outstanding shares.
(e) Dividends and distributions paid to shareholders are recorded on the ex-dividend
date. Distributions from net investment income are generally declared and paid at
least annually. Distributions of net realized capital gain, if any, are declared and
paid at least annually.
The amount of distributions from net investment income and net realized capital
gain are determined in accordance with federal income tax regulations, which may
differ from U.S. generally accepted accounting principles (“U.S. GAAP”) for
financial reporting purposes. Financial reporting records are adjusted for permanent
book-to-tax differences to reflect tax character.
The tax character of distributions paid during the six months ended March 31, 2012
and the year ended September 30, 2011 was as follows:
| | | | |
| | | 03/31/2012 | | 09/30/2011 |
| Distributions paid from: | | | | |
| Ordinary income | $ | 2,097,347 | $ | 2,045,046 |
| Long-term capital gain | | 12,423,453 | | 9,715,602 |
| Total distributions paid | $ | 14,520,800 | $ | 11,760,648 |
As of March 31, 2012, investment cost for federal tax purposes was $374,969,022
and the tax basis components of net assets were as follows:
| | | |
| Unrealized appreciation | $ | 217,338,455 | |
| Unrealized depreciation | | (2,637,066 | ) |
| Net unrealized appreciation | $ | 214,701,389 | |
The differences between book-basis and tax-basis unrealized appreciation is
attributable primarily to the tax deferral of losses from wash sales.
As of March 31, 2012, the Fund had a tax deferral of wash loss sales of
approximately $251,000.
As of March 31, 2012, the Fund has no capital loss carryforward.
On December 22, 2010, the Regulated Investment Company Modernization Act of
2010 (the “RIC Act”) was enacted, and the provisions within the RIC Act are
effective for the year ending September 30, 2012. The RIC Act modernized several
of the federal income and excise tax provisions related to regulated investment
companies (“RICs”). Under the RIC Act, new capital losses may be carried forward
– 18 –
Notes to Financial Statements (continued)
March 31, 2012 (unaudited)
indefinitely, with the character of the original loss retained. Prior to the RIC Act,
capital losses could be carried forward for eight years, and were carried forward as
short-term capital losses regardless of the character of the original loss. The RIC
Act also contains simplification provisions, which are aimed at preventing
disqualification of a RIC for inadvertent failures to comply with assets
diversification and/or qualifying income tests. The RIC Act exempts RICs from the
preferential dividend rule and repeals the 60-day designation requirement for
certain types of pay-through income and gains. In addition, the RIC Act contains
provisions aimed at preserving the character of distributions made by a RIC during
the portion of its taxable year ending after October 31 or December 31. The
provisions related to the RIC Act for qualification testing were effective for the
September 30, 2011 taxable year. All other provisions under the RIC Act are
effective for the September 30, 2012 taxable year.
The Fund had no material uncertain tax positions and has not recorded a liability for
unrecognized tax benefits as of March 31, 2012. Also, the Fund recognized no
interest and penalties related to uncertain tax benefits during the period ended
March 31, 2012. At March 31, 2012, the fiscal years 2008 through 2011 remain
open to examination in the Fund’s major tax jurisdictions.
(f) The preparation of financial statements in conformity with U.S. GAAP requires
management to make estimates and assumptions that affect the amounts reported
in the financial statements and accompanying notes. Actual results could differ
from estimates.
(g) In the normal course of business the Fund enters into contracts that contain
general indemnification clauses. The Fund’s maximum exposure under these
arrangements is unknown, as this would involve future claims against the Fund that
have not yet occurred. Based on experience, the Fund expects the risk of loss to be
remote.
(h) In connection with the preparation of the Fund’s financial statements, management
evaluated subsequent events after the date of the Statement of Assets and
Liabilities of March 31, 2012. There have been no significant subsequent events
since March 31, 2012 that would require adjustment to or additional disclosure in
these financial statements.
(i) In May 2011, the Financial Accounting Standards Board (“FASB”) issued
Accounting Standards Update (“ASU”) No. 2011-04 “Amendments to Achieve
Common Fair Value Measurement and Disclosure Requirements” in U.S. Generally
Accepted Accounting Principles (“U.S. GAAP”) and International Financial
Reporting Standards (“IFRS”). ASU No. 2011-04 amends FASB ASC Topic 820,
“Fair Value Measurements and Disclosures,” to establish common requirements for
measuring fair value and disclosing additional information about Level 3 fair value
measurements in accordance with U.S. GAAP and IFRS. ASU No. 2011-04 is
effective for fiscal years beginning after December 15, 2011 and for interim periods
within these fiscal years. Management is currently evaluating the impact these
amendments may have on the Fund’s financial statements.
– 19 –
Notes to Financial Statements (continued)
March 31, 2012 (unaudited)
(2) Related Parties —
(a) Investment Adviser and Management Agreement —
The Fund has an agreement with Nicholas Company, Inc. (with whom certain
officers and directors of the Fund are affiliated) (the “Adviser”) to serve as
investment adviser and manager. Under the terms of the agreement, a monthly fee
is paid to the Adviser based on an annualized fee of .75% of the average net asset
value up to and including $50 million, .60% of the average net asset value over $50
million up to and including $100 million and .50% of the average net asset value in
excess of $100 million. Also, the Adviser may be paid for accounting and
administrative services rendered by its personnel, subject to the following
guidelines: (i) up to five basis points, on an annual basis, of the average net asset
value of the Fund up to and including $2 billion and up to three basis points, on an
annual basis, of the average net asset value of the Fund greater than $2 billion,
based on the average net asset value of the Fund as determined by valuations made
at the close of each business day of each month, and (ii) where the preceding
calculation results in an annual payment of less than $50,000, the Adviser, in its
discretion, may charge the Fund up to $50,000 for such services.
(b) Legal Counsel —
A director of the Adviser is affiliated with a law firm that provides services to the
Fund. The Fund incurred expenses of $2,949 for the period ended March 31, 2012
for legal services rendered by this law firm.
(3) Investment Transactions —
For the period ended March 31, 2012, the cost of purchases and the proceeds from sales
of investment securities, other than short-term obligations, aggregated $40,143,447 and
$87,097,354, respectively.
– 20 –
| | | | | | | | | | | | | |
| Historical Record | | | | | | | | | |
| (unaudited) | | | | | | | | | | | | | |
| |
| | | | | Net | | | | | | | | | |
| | | | | Investment | | | | | | Dollar | | | Growth of |
| | | Net | | Income | | | Capital Gain | | | Weighted | | | an Initial |
| | | Asset Value | | Distributions | | | Distributions | | | Price/Earnings | | | $10,000 |
| | | Per Share | | Per Share | | | Per Share | | | Ratio(2) | | | Investment(3) |
| Class I | | | | | | | | | | | | | |
| October 17, 1983(1) | $ | 10.00 | $ | — | | $ | — | | | — | | $ | 10,000 |
| September 30, 1984 | | 11.66 | | — | | | — | | | 12.6 times | | | 11,660 |
| September 30, 1985 | | 14.39 | | 0.0930 | | | 0.1860 | | | 11.7 | | | 14,742 |
| September 30, 1986 | | 16.90 | | 0.1630 | | | 0.0610 | | | 15.0 | | | 17,581 |
| September 30, 1987 | | 21.01 | | 0.4200 | | | 0.5130 | | | 20.9 | | | 23,108 |
| September 30, 1988 | | 18.58 | | 0.3380 | | | 1.3030 | | | 15.0 | | | 22,766 |
| September 30, 1989 | | 21.76 | | 0.3350 | | | 0.0800 | | | 17.1 | | | 27,291 |
| September 30, 1990 | | 17.39 | | 0.3124 | | | 0.6686 | | | 14.8 | | | 22,888 |
| September 30, 1991 | | 23.87 | | 0.3422 | | | 0.1434 | | | 17.8 | | | 32,250 |
| September 30, 1992 | | 24.53 | | 0.2447 | | | 0.4042 | | | 17.3 | | | 34,052 |
| September 30, 1993 | | 26.94 | | 0.2350 | | | 0.8000 | | | 18.1 | | | 38,885 |
| September 30, 1994 | | 26.71 | | 0.2000 | | | 1.4700 | | | 18.5 | | | 41,020 |
| September 30, 1995 | | 30.07 | | 0.2056 | | | 1.8944 | | | 20.8 | | | 50,205 |
| September 30, 1996 | | 33.34 | | 0.1750 | | | 2.4979 | | | 28.9 | | | 60,922 |
| September 30, 1997 | | 40.65 | | 0.0779 | | | 3.1621 | | | 31.4 | | | 82,206 |
| September 30, 1998 | | 34.78 | | 0.0810 | | | 5.2282 | | | 28.6 | | | 80,845 |
| September 30, 1999 | | 31.83 | | 0.1337 | | | 4.0049 | | | 29.0 | | | 82,864 |
| September 30, 2000 | | 36.58 | | 0.0100 | | | 0.4701 | | | 35.1 | | | 96,527 |
| September 30, 2001 | | 17.54 | | — | | | 13.1200 | | | 23.4 | | | 76,361 |
| September 30, 2002 | | 15.34 | | — | | | 0.5766 | | | 22.2 | | | 68,730 |
| September 30, 2003 | | 18.97 | | — | | | — | | | 22.9 | | | 84,994 |
| September 30, 2004 | | 21.88 | | — | | | 0.0015 | | | 22.9 | | | 98,040 |
| September 30, 2005 | | 23.50 | | — | | | 0.9146 | | | 23.3 | | | 109,547 |
| September 30, 2006 | | 23.11 | | 0.0083 | | | 2.1472 | | | 22.4 | | | 118,142 |
| September 30, 2007 | | 25.18 | | 0.0643 | | | 1.0460 | | | 23.4 | | | 134,908 |
| September 30, 2008 | | 19.15 | | 0.0978 | | | 2.5678 | | | 17.5 | | | 115,141 |
| September 30, 2009 | | 17.02 | | 0.1072 | | | 1.1206 | | | 19.2 | | | 111,845 |
| September 30, 2010 | | 19.31 | | 0.0957 | | | — | | | 20.7 | | | 127,575 |
| September 30, 2011 | | 18.72 | | 0.0867 | | | 0.3831 | | | 17.2 | | | 126,423 |
| March 31, 2012 | | 23.42 | | 0.0992 | (a) | | 0.4903 | (a) | | 21.2 | | | 162,731 |
| Class N | | | | | | | | | | | | | |
| February 28, 2005(1) | $ | 22.59 | $ | — | | $ | — | | | 23.1 times | | $ | 10,000 |
| September 30, 2005 | | 23.45 | | — | | | — | | | 23.3 | | | 10,381 |
| September 30, 2006 | | 23.00 | | — | | | 2.1340 | | | 22.4 | | | 11,158 |
| September 30, 2007 | | 25.03 | | — | | | 1.0460 | | | 23.4 | | | 12,694 |
| September 30, 2008 | | 19.04 | | 0.0067 | | | 2.5678 | | | 17.5 | | | 10,800 |
| September 30, 2009 | | 16.87 | | 0.0969 | | | 1.1206 | | | 19.2 | | | 10,457 |
| September 30, 2010 | | 19.11 | | 0.0666 | | | — | | | 20.7 | | | 11,890 |
| September 30, 2011 | | 18.49 | | 0.0479 | | | 0.3831 | | | 17.2 | | | 11,741 |
| March 31, 2012 | | 23.18 | | 0.0191 | (a) | | 0.4903 | (a) | | 21.2 | | | 15,090 |
| (1) | Date of Initial Public Offering. |
| (2) | Based on latest 12 months accomplished earnings. |
| (3) | Assuming reinvestment of all distributions. |
| (a) | Paid on December 22, 2011 to shareholders of record on December 21, 2011. |
– 21 –
Approval of Investment Advisory Contract
(unaudited)
In October 2011, the Board of Directors of the Fund renewed the one-year term of the Investment Advisory Agreement by and between the Fund and the Adviser through October 2012. In connection with the renewal of the Investment Advisory Agreement, no changes to the amount or manner of calculation of the management fee or the terms of the agreement were proposed by the Adviser or adopted by the Board. For the annual period ended September 30, 2011, the management fee was 0.53% and the Fund’s Class I and Class N total expense ratios (including the management fee) were 0.65% and 0.99%, respectively. In renewing the Investment Advisory Agreement, the Board carefully considered the following factors on an absolute basis and relative to the Fund’s peer group: (i) the Fund’s historical performance; (ii) the Fund’s performance relative to its benchmark; (iii) the expense ratios for peer group funds in the mid-cap growth category and the Fund’s risk/return profile as measured by the standard deviation and the Sharpe Ratio; and (iv) the range and quality of the services offered by the Adviser. The peer group fund data included mid-cap growth focused funds with similar asset sizes, number of holdings and market capitalizations. In terms of the peer group data used for performance comparisons, the Fund’s Class I was ranked 15th, 16th, 16th and 18th out of 21 funds for the one-, three-, five- and ten-year periods ending September 30, 2011. The Fund’s Class I had the lowest expense ratio among its peer group.
The Board considered the range of services to be provided by the Adviser to the Fund under the Advisory Agreement. The Board concluded that the nature, extent and quality of the services to be provided were consistent with the terms of the Advisory Agreement and the needs of the Fund, and that the services provided were of a high quality.
The Board considered the investment performance of the Fund and the Adviser. Among other things, the Board noted its consideration of the Fund’s performance relative to peer funds and its benchmarks. The Board reviewed the actual and relative short-term and long-term performance of the Fund. The Board agreed that the Fund demonstrated satisfactory performance with respect to its benchmarks and peers. The Board also discussed the extent to which economies of scale would be realized, and whether such economies were reflected in the Fund’s fee levels and concluded that the Adviser had been instrumental in holding down Fund costs, citing consistently low fees in an environment where fund fees have been flat or on an upward trend.
The Board considered the cost of services provided and the profits to be realized by the Adviser from the relationship with the Fund. The Board concluded that given the Board’s focus on performance and maintaining a low fee structure that the Adviser’s profits were not relevant.
The Board determined that the Adviser had fully and adequately carried out the terms and conditions of its contract with the Fund. The Board expressed satisfaction with the Fund’s absolute performance, strategies to improve the relative performance, management’s control of expenses and the rate of the management fee for the Fund and the overall level of services provided by the Adviser.
– 22 –
Information on Proxy Voting
(unaudited)
A description of the policies and procedures that the Fund uses to determine how to vote proxies relating to portfolio securities is available, without charge, upon request by calling 800-544-6547 (toll-free) or 414-276-0535. It also appears in the Fund’s Statement of Additional Information, which can be found on the SEC’s website, www.sec.gov. A record of how the Fund voted its proxies for the most recent twelve-month period ended June 30, also is available on the Fund’s website, www.nicholasfunds.com, and the SEC’s website, www.sec.gov.
Quarterly Portfolio Schedule
(unaudited)
The Fund files its complete schedule of investments with the SEC for the first and third quarters of each fiscal year on Form N-Q. The Fund’s Form N-Q’s are available on the SEC’s website at www.sec.gov and may be reviewed and copied at the SEC’s Public Reference Room in Washington, D.C. Information on the operation of the Public Reference Room may be obtained by calling 800-SEC-0330.
– 23 –
Privacy Policy
(unaudited)
Nicholas II, Inc. respects each shareholder’s right to privacy. We are committed to safeguarding the information that you provide us to maintain and execute transactions on your behalf.
We collect the following non-public personal information about you:
Information we receive from you on applications or other forms, whether we receive the form in writing or electronically. This includes, but is not limited to, your name, address, phone number, tax identification number, date of birth, beneficiary information and investment selection.
Information about your transactions with us and account history with us. This includes, but is not limited to, your account number, balances and cost basis information. This also includes transaction requests made through our transfer agent.
Other general information that we may obtain about you such as demographic information.
WE DO NOT SELL ANY NON-PUBLIC PERSONAL INFORMATION ABOUT CURRENT OR FORMER SHAREHOLDERS.
INFORMATION SHARED WITH OUR TRANSFER AGENT, A THIRD PARTY COMPANY, ALSO IS NOT SOLD.
We may share, only as permitted by law, non-public personal information about you with third party companies. Listed below are some examples of third parties to whom we may disclose non-public personal information. While these examples do not cover every circumstance permitted by law, we hope they help you understand how your information may be shared.
We may share non-public personal information about you:
With companies who work for us to service your accounts or to process transactions that you may request. This would include, but is not limited to, our transfer agent to process your transactions, mailing houses to send you required reports and correspondence regarding the Fund and its Adviser, the Nicholas Company, Inc., and our dividend disbursing agent to process fund dividend checks.
With a party representing you, with your consent, such as your broker or lawyer.
When required by law, such as in response to a subpoena or other legal process.
The Fund and its Adviser maintain policies and procedures to safeguard your non-public personal information. Access is restricted to employees who the Adviser determines need the information in order to perform their job duties. To guard your non-public personal information we maintain physical, electronic, and procedural safeguards that comply with federal standards.
In the event that you hold shares of the Fund with a financial intermediary, including, but not limited to, a broker-dealer, bank, or trust company, the privacy policy of your financial intermediary would govern how your non-public personal information would be shared with non-affiliated third parties.
– 24 –
Automatic Investment Plan – An Update
(unaudited)
The Nicholas Family of Funds’ Automatic Investment Plan provides a simple method to dollar cost average into the fund(s) of your choice.
Dollar cost averaging involves making equal systematic investments over an extended time period. A fixed dollar investment will purchase more shares when the market is low and fewer shares when the market is high. The automatic investment plan is an excellent way for you to become a disciplined investor.
The following table illustrates what dollar cost averaging can achieve. Please note that past performance is no guarantee of future results. Nicholas Company recommends dollar cost averaging as a practical investment method. It should be consistently applied for long periods so that investments are made through several market cycles.
| | | | | |
| | | Nicholas II – Class I |
| $1,000 initial investment on | | 10/17/83 | * | | 03/31/02 |
| Number of years investing $100 each month | | | | | |
| following the date of initial investment | | 28.5 | | | 10 |
| Total cash invested | $ | 35,200 | | $ | 13,000 |
| Total dividend and capital gain distributions reinvested | $ | 109,520 | | $ | 3,909 |
| Total full shares owned at 03/31/12 | | 6,686 | | | 855 |
| Total market value at 03/31/12 | $ | 156,594 | | $ | 20,029 |
The results above assume purchase on the last day of the month. The Nicholas Automatic Investment Plan actually invests on the 20th of each month (or on the alternate date specified by the investor). Total market value includes reinvestment of all distributions.
| * | Date of Initial Public Offering. |
– 25 –
Directors and Officers
DAVID O. NICHOLAS, President and Director
ROBERT H. BOCK, Director
TIMOTHY P. REILAND, Director
JAY H. ROBERTSON, Director
ALBERT O. NICHOLAS, Executive Vice President
DAVID L. JOHNSON, Executive Vice President
JEFFREY T. MAY, Senior Vice President, Secretary,
Treasurer and Chief Compliance Officer
LYNN S. NICHOLAS, Senior Vice President
LAWRENCE J. PAVELEC, Senior Vice President
CANDACE L. LESAK, Vice President
Investment Adviser
NICHOLAS COMPANY, INC.
Milwaukee, Wisconsin
www.nicholasfunds.com
414-276-0535 or 800-544-6547
Transfer Agent
U.S. BANCORP FUND SERVICES, LLC
Milwaukee, Wisconsin
414-276-0535 or 800-544-6547
Distributor
QUASAR DISTRIBUTORS, LLC
Milwaukee, Wisconsin
Custodian
U.S. BANK N.A.
Milwaukee, Wisconsin
Independent Registered Public Accounting Firm
DELOITTE & TOUCHE LLP
Milwaukee, Wisconsin
Counsel
MICHAEL BEST & FRIEDRICH LLP
Milwaukee, Wisconsin
This report is submitted for the information of shareholders of the Fund. It is not authorized for distribution to prospective investors unless preceded or accompanied by an effective prospectus.
Item 2. Code of Ethics.
Applicable only to annual reports.
Item 3. Audit Committee Financial Expert.
Applicable only to annual reports.
Item 4. Principal Accountant Fees and Services.
Applicable only to annual reports.
Item 5. Audit Committee of Listed Registrants.
Not applicable to this filing.
Item 6. Schedule of Investments.
The schedule of investments in securities of unaffiliated issuers is included as part of the report to shareholders filed under Item 1.
Item 7. Disclosure of Proxy Voting Policies and Procedures for Closed-End Management Investment Companies.
Applicable only to annual reports filed by closed-end funds.
Item 8. Portfolio Managers of Closed-End Management Investment Companies.
Applicable only to annual reports filed by closed-end funds.
Item 9. Purchases of Equity Securities by Closed-End Management Investment Companies and Affiliated Purchasers.
Applicable only to closed-end funds.
Item 10. Submission of Matters to a Vote of Security Holders.
Not applicable to this filing.
Item 11. Controls and Procedures.
The Fund's principal executive officer and principal financial officer have concluded that the Fund's disclosure controls and procedures are sufficient to ensure that information required to be disclosed by the Fund in this Form N-CSR was recorded, processed, summarized and reported within the time periods specified in the Securities and Exchange Commission's rules and forms, based upon such officers' evaluation of these controls and procedures as of a date within 90 days of the filing date of the report. There were no significant changes or corrective actions with regard to significant deficiencies or material weaknesses in the Fund's internal controls or in other factors that could significantly affect the Fund's internal controls subsequent to the date of their evaluation.
Item 12. Exhibits.
(a)(1) Code of Ethics -- Any code of ethics, or amendments thereto, that is the subject of the disclosure required by Item 2, to the extent that the registrant intends to satisfy the Item 2 requirements through filing of an exhibit.
Not applicable to this filing.
(a)(2) Certifications of Principal Executive Officer and Principal Financial Officer pursuant to Section 302 of the Sarbannes-Oxley Act of 2002, attached hereto as part of EX-99.CERT.
(a)(3) Any written solicitation to purchase securities under Rule 23c-1 under the Act sent or given during the period covered by the report by or on behalf of the registrant to 10 or more person.
Applicable only to closed-end funds.
(b) Certifications of Principal Executive Officer and Principal Financial Officer pursuant to Section 906 of the Sarbannes-Oxley Act of 2002, attached hereto as part of EX-99.906CERT.
SIGNATURES
Pursuant to the requirements of the Securities Exchange Act of 1934 and the Investment Company Act of 1940, the registrant has duly caused this report to be signed on its behalf by the undersigned, thereunto duly authorized.
(Registrant) Nicholas II, Inc.
By: /s/ David O. Nicholas
Name: David O. Nicholas
Title: Principal Executive Officer
Date: 05/25/2012
Pursuant to the requirements of the Securities Exchange Act of 1934 and the Investment Company Act of 1940, this report has been signed by the following persons on behalf of the registrant and in the capacities and on the dates indicated.
By: /s/ David O. Nicholas
Name: David O. Nicholas
Title: Principal Executive Officer
Date: 05/25/2012
By: /s/ Jeffrey T. May
Name: Jeffrey T. May
Title: Principal Financial Officer
Date: 05/25/2012