UNITED STATES
SECURITIES AND EXCHANGE COMMISSION
Washington, D.C. 20549
FORM 10-K
ANNUAL REPORT PURSUANT TO SECTION 13 OR 15(d) OF
THE SECURITIES EXCHANGE ACT OF 1934
For the fiscal year ended May 2, 2010
Commission File No. 1-12597
CULP, INC.
(Exact name of registrant as specified in its charter)
NORTH CAROLINA (State or other jurisdiction of incorporation or other organization) | 56-1001967 (I.R.S. Employer Identification No.) |
1823 Eastchester Drive, High Point, North Carolina (Address of principal executive offices) | 27265 (zip code) |
(336) 889-5161 (Registrant’s telephone number, including area code) |
Securities registered pursuant to Section 12(b) of the Act:
| Title of Each Class | Name of Each Exchange On Which Registered |
| | |
| Common Stock, par value $.05/ Share | New York Stock Exchange |
| | |
Securities registered pursuant to Section 12(g) of the Act: None
Indicate by check mark if the registrant is a well-known seasoned issuer, as defined in Rule 405 of the Securities Act. YES o NO x
Indicate by check mark if the registrant is not required to file reports pursuant to Section 13 or Section 15(d) of the Securities Exchange Act of 1934. YES o NO x
Indicate by check mark whether the registrant (1) has filed all reports required to be filed by Section 13 or 15(d) of the Securities Exchange Act of 1934 during the preceding 12 months and (2) has been subject to the filing requirements for at least the past 90 days. YES x NO o
Indicate by check mark whether the registrant has submitted electronically and posted on its corporate Web site, if any, every Interactive Data File required to be submitted and posted pursuant to Rule 405 of Regulation S-T during the preceding 12 months (or for such shorter period that the registrant was required to submit and post such files).
YES o NO o
Indicate by check mark if disclosure of delinquent filers pursuant to Item 405 of Regulation S-K is not contained herein, and will not be contained, to the best of registrant’s knowledge, in definitive proxy or information statements incorporated by reference in Part III of this Form 10-K or any amendment to this Form 10-K. o
Indicate by check mark whether the registrant is a large accelerated filer, an accelerated filer, a non-accelerated filer, or a smaller reporting company. See definition of “large accelerated filer, accelerated filer, and smaller reporting company” in Rule 12b-2 of the Exchange Act. (Check one):
Large Accelerated Filer o | Accelerated Filer o | Non-Accelerated Filer x |
| | | |
| | Smaller Reporting Company o | |
Indicate by check mark whether the registrant is a shell company (as defined in Rule 12b-2 of the Act). YES o NO x
As of May 2, 2010, 13,051,785 shares of common stock were outstanding. As of November 1, 2009, the aggregate market value of the voting stock held by non-affiliates of the registrant on that date was $59,366,318 based on the closing sales price of such stock as quoted on the New York Stock Exchange (NYSE), assuming, for purposes of this report, that all executive officers and directors of the registrant are affiliates.
DOCUMENTS INCORPORATED BY REFERENCE
Portions of the registrant’s Proxy Statement to be filed pursuant to Regulation 14A of the Securities and Exchange Commission in connection with its Annual Meeting of Shareholders to be held on September 21, 2010 are incorporated by reference into Part III of this Form 10-K.
CULP, INC.
FORM 10-K REPORT
TABLE OF CONTENTS
| Item No. | | Page |
| |
| PART I |
| | | | |
| 1. | | |
| | | | 2 |
| | | | 3 |
| | | | 4 |
| | | | 6 |
| | | | 6 |
| | | | 7 |
| | | | 8 |
| | | | 8 |
| | | | 10 |
| | | | 11 |
| | | | 11 |
| | | | 12 |
| | | | 13 |
| | | | 13 |
| | | | 14 |
| | | | 15 |
| | | | 15 |
| | | | 16 |
| | | | 16 |
| 1A. | | 17 |
| 1B. | | 21 |
| 2. | | 22 |
| 3. | | 23 |
| 4. | | 23 |
| | | | |
|
| | | | |
| 5. | | 24 |
| 6. | | 26 |
| 7. | | 27 |
| 7A. | | 59 |
| 8. | | 60 |
| 9. | | 107 |
| 9A(T). | | 107 |
| 9B. | | 108 |
| Item No. | | Page |
| | | |
|
| | | |
| 10. | | 109 |
| | | |
| 11. | | 109 |
| | | |
| 12. | | 109 |
| | | |
| 13. | | 110 |
| | | |
| 14. | | 110 |
| | | |
|
| | | |
| 15. | | 111 |
| | | |
| | | 111 |
| | | |
| | | 114 |
| | | |
| | | 114 |
| | | |
| | | 115 |
| | | |
| | | 116 |
CAUTIONARY STATEMENT CONCERNING FORWARD-LOOKING INFORMATION
Parts I and II of this report contain statements that may be deemed “forward-looking statements” within the meaning of the federal securities laws, including the Private Securities Litigation Reform Act of 1995 (Section 27A of the Securities Act of 1933 and Section 27A of the Securities and Exchange Act of 1934). Such statements are inherently subject to risks and uncertainties. Further, forward-looking statements are intended to speak only as of the date on which they are made. Forward-looking statements are statements that include projections, expectations or beliefs about future events or results or otherwise are not statements of historical fact. Such statements are often but not always characterized by qualifying words such as “expect,” “believe,” “estimate,” “plan” and “project” and their derivatives, and include but are not limited to statements about expectations for the company’s future operations or success, sales, gross profit margins, operating income, SG&A or other expenses, and earnings, as well as any statements regarding future economic or industry trends or future developments. Factors that could influence the matters discussed in such statements include the level of housing starts and sales of existing homes, consumer confidence, trends in disposable income, and general economic conditions. Decreases in these economic indicators could have a negative effect on the company’s business and prospects. Likewise, increases in interest rates, particularly home mortgage rates, and increases in consumer debt or the general rate of inflation, could affect the company adversely. Changes in consumer tastes or preferences toward products not produced by the company could erode demand for the company’s products. Changes in the value of the U.S. dollar versus other currencies can affect the company’s financial results because a significant portion of the company’s operations are located outside the United States. Strengthening of the U.S. dollar against other currencies could make the company’s products less competitive on the basis of price in markets outside the United States, and strengthening of currencies in Canada and China can have a negative impact on the company’s sales in the U.S. of products produced in those countries. Also, economic and political instability in international areas could affect the company’s operations or sources of goods in those areas, as well as demand for the company’s products in international markets. Finally, unanticipated delays or costs in executing restructuring actions could cause the cumulative effect of restructuring actions to fail to meet the objectives set forth by management. Further information about these factors, as well as other factors that could affect the company’s future operations or financial results and the matters discussed in forward-looking statements are included in the “Risk Factors” section of this report in Item 1A.
Culp, Inc. manufactures, sources, and markets mattress fabrics used for covering mattresses and box springs, and upholstery fabrics primarily for use in production of upholstered furniture (residential and commercial).
We believe that Culp is the largest producer of mattress fabrics in North America, as measured by total sales, and one of the largest marketers of upholstery fabrics for furniture in North America, again measured by total sales. We have two operating segments – mattress fabrics and upholstery fabrics. The mattress fabric business markets woven and knitted fabrics that are used primarily in the production of bedding products, including mattresses, box springs, and mattress sets. The upholstery fabric business markets a variety of fabric products that are used in the production of residential and commercial upholstered furniture, sofas, recliners, chairs, loveseats, sectionals, sofa-beds, and office seating. Culp primarily markets fabrics that have broad appeal in the “good” and “better” priced categories of furniture and bedding.
Culp markets a variety of fabrics in different categories to its global customer base, including fabrics produced at our manufacturing facilities and fabrics produced by other suppliers. The company had eight active manufacturing plants and distribution facilities as of the end of fiscal 2010, which are located in North and South Carolina, Quebec, Canada, and Shanghai, China. We also source fabrics from other manufacturers, located primarily in China and Turkey, with almost all of those fabrics being produced specifically for the company and created by Culp designers. We operate distribution centers in North Carolina and Shanghai, China to facilitate distribution of our products. In recent fiscal years, the portion of total company sales represented by fabrics produced outside of the U.S. and Canada has increased, while sales of goods produced in the U.S. have decreased. This trend is due to the upholstery fabrics segment, where more than three-fourths of our sales now consist of fabrics produced in Asia.
Total net sales in fiscal 2010 were $206 million. The mattress fabrics segment had net sales of $115 million (56% of total net sales), while the upholstery fabrics segment had net sales of $91 million (44% of total net sales).
Sales increased in our upholstery fabrics segment and declined slightly in our mattress fabric segment during fiscal 2010 as compared to fiscal 2009. Weak business conditions in the home furnishings industry affected both of our business segments in the first half of the fiscal year. Although overall economic conditions remained weak, company performance in the second half of the fiscal year showed significant improvement, as compared to the previous year.
In mattress fabrics, knitted fabrics has been a growing portion of our sales, as consumer demand for this type of mattress panel covering has risen significantly. During fiscal 2009, we acquired the knitted fabrics business of Bodet & Horst USA, including its manufacturing operation in High Point, North Carolina, which had served as our primary source of knitted mattress fabric. This acquisition has provided us with more control over our ability to supply bedding customers with this increasingly popular fabric type.
In the upholstery fabrics segment, the majority of our fabrics are produced by other manufacturers, but in most cases the company continues to control important components of the production process, such as design, finishing, quality control and distribution. Microdenier suedes and a variety of other fabrics are sourced in China through our sourcing, finishing and distribution operation located near Shanghai.
In recent years the company has aggressively positioned itself as a more flexible upholstery fabric producer and marketer, with a smaller fixed asset base than in prior fiscal years, and with a more variable cost structure that will allow us to take advantage of opportunities in the bedding and furniture industries as they occur. We believe the improved performance for fiscal 2010 reflects the benefits of a lean and agile operating platform along with a strong competitive position in both businesses.
Additional information about trends and developments in each of our business segments is provided in the “Segments” discussion below.
Culp, Inc. was organized as a North Carolina corporation in 1972 and made its initial public offering in 1983. Since 1997, our stock has been listed on the New York Stock Exchange and traded under the symbol “CFI.” Our fiscal year is the 52 or 53 week period ending on the Sunday closest to April 30. Our executive offices are located in High Point, North Carolina.
Culp maintains an Internet website at www.culp.com. We will make this annual report and our other annual reports on Form 10-K, quarterly reports on Form 10-Q, current reports on Form 8-K and amendments to these reports, available free of charge on our Internet site as soon as reasonably practicable after such material is electronically filed with, or furnished to, the Securities and Exchange Commission. Information included on our website is not incorporated by reference into this annual report.
Our two operating segments are mattress fabrics and upholstery fabrics. The following table sets forth certain information for each of our segments.
| | Sales by Fiscal Year ($ in Millions) and Percentage of Total Company Sales | | |
| Segment | | | | | | | | | |
| Mattress Fabrics | $114.8 | | (56%) | | | $115.4 | | (57%) | | | $138.1 | | (54%) | | |
| Upholstery Fabrics | | | | | | | | | | | | | | | |
| Non-U.S.-Produced | $77.3 | | (37%) | | | $68.1 | | (33%) | | | $75.9 | | (30%) | | |
| U.S.-Produced | $14.3 | | (7%) | | | $20.4 | | (10%) | | | $40.0 | | (16%) | | |
| Total Upholstery | $91.6 | | (44%) | | | $88.5 | | (43%) | | | $115.9 | | (46%) | | |
| Total company | $206.4 | | (100%) | | | $203.9 | | (100%) | | | $254.0 | | (100%) | | |
Additional financial information about our operating segments can be found in Note 20 to the Consolidated Financial Statements included in Item 8 of this report.
Mattress Fabrics. The mattress fabrics segment manufactures and markets mattress fabric to bedding manufacturers. These fabrics encompass woven jacquard fabric and knitted fabric. Culp Home Fashions has manufacturing facilities located in Stokesdale and High Point, North Carolina, and St. Jerome, Quebec, Canada. The Stokesdale and St. Jerome plants manufacture and finish jacquard (damask) fabric. The Stokesdale plant also finishes knit fabrics, as well as houses the division offices and finished goods distribution capabilities. In August 2008, a third manufacturing plant facility was added when we acquired the knitted mattress fabrics business of Bodet & Horst USA, including its manufacturing facilities in High Point. We have also maintained flexibility in our supply of the major categories of mattress fabrics. All woven jacquard and knitted fabrics can be produced in multiple facilities, (internal or external to the company) providing us with mirrored, reactive capacity involving state of the art capabilities across plant facilities.
In recent fiscal years, we have taken significant steps to enhance our competitive position in this segment by consolidating all of our mattress fabrics manufacturing into these three manufacturing facilities. The company had capital expenditures during the period fiscal 2005 through 2010 totaling approximately $27 million, which primarily provided for the purchase of faster and more efficient weaving machines as well as increased knit machine capacity. These capital expenditures also provided high technology finishing equipment for woven and knitted fabrics.
The Bodet & Horst USA, LP acquisition was another step to enhance and secure our competitive position, as we invested $11.4 million to purchase the manufacturing operation that had been serving as our primary source of knitted mattress fabric. Knitted fabrics have been an increasingly important category of mattress fabrics, with industry sales in this type of fabric growing much faster than other categories. The completion of this acquisition during fiscal 2009 not only secured our supply of knitted mattress fabrics, but allowed for improved supply logistics, greater control of product development, and accelerated responsiveness to our customers. Subsequent to this acquisition, the demand for knitted mattress fabrics has continued to grow. During fiscal 2010, we made further investments in knitting machines and finishing equipment.
Upholstery Fabrics. The upholstery fabrics segment markets fabrics for residential and commercial furniture, including jacquard woven fabrics, velvets, microdenier suedes, woven dobbies, knitted fabrics, and piece-dyed woven products. Historically, all of our upholstery fabrics had been produced in our U.S. manufacturing plants. However, in fiscal 2007, sales of upholstery fabrics made in non-U.S. locations, including our facilities in China, exceeded U.S.-produced sales for the first time. In fiscal 2010, sales of non-U.S. produced upholstery accounted for almost 84% of our upholstery sales.
The upholstery fabrics segment operates fabric manufacturing facilities in Anderson, South Carolina, and Shanghai, China. We market fabrics produced in these two locations, as well as a variety of upholstery fabrics sourced from third party producers, mostly in China.
As demand for U.S.-produced upholstery declined significantly, we took aggressive steps to reduce our U.S. manufacturing costs, capacity, and selling, general and administrative expenses. Our restructuring actions over the past several years reduced our U.S. upholstery operations to the one manufacturing plant in South Carolina and one upholstery distribution facility in Burlington, North Carolina.
During the time that U.S. upholstery operations were shrinking, we established operations in China and gradually expanded them over time to include a variety of activities. The facilities near Shanghai began operations in 2004 with a finishing and inspection operation, where goods woven in China by selected outside suppliers are treated with finishing processes and subjected to U.S. quality control measures before being distributed to customers. In subsequent fiscal years, a variety of finished goods (with no further finishing needed) began to be sourced through our China operations, and in fiscal 2006 the operation was expanded to include a facility where upholstery fabrics are cut and sewn into “kits” that are made to the specifications of furniture manufacturing customers in the U.S. Cut and sewn “kit” operations have become an important method for furniture producers to reduce production costs by moving a larger percentage of the labor component of furniture manufacturing to lower cost environments. Other recent developments in our China operations include expansion of our product development and design capabilities in China and further strengthening of key strategic partnerships with mills. We also expanded our marketing efforts to sell our China products in countries other than the U.S., including the Chinese local market.
Over the past decade, we have moved our upholstery fabrics business from one that relied on a large fixed capital base that is difficult to adjust to a more flexible and scalable marketer of upholstery fabrics that meets changing levels of customer demand. At the same time, we have attempted to maintain control of the most important “value added” aspects of our business, such as design, finishing, quality control, and logistics. This strategic approach has allowed us to limit our investment of capital in fixed assets and to lower the costs of our products significantly, while continuing to leverage our design and finishing expertise, industry knowledge and important relationships.
Despite a very difficult economic backdrop in fiscal 2010, our sales in the upholstery fabric category resulted in an annual increase of 3.4%, representing the first annual gain in ten fiscal years. Increased sales in the upholstery fabrics segment were primarily the result of gains achieved through implementation of a business strategy that included: 1) innovation in a low- cost environment, 2) speed to market execution, 3) consistent quality, 4) reliable service and lead times, and 5) increased recognition of and reliance on the Culp brand. A return to profitability in upholstery fabrics has been achieved through development of a unique business model that has enabled the upholstery segment to execute a strategy that we believe is clearly differentiated from competitors. In this way, we have maintained our ability to provide furniture manufacturers with products from every category of fabric used to cover upholstered furniture, and to meet continually changing demand levels and consumer preferences.
Culp markets products primarily to manufacturers that operate in three principal markets. The mattress fabrics segment supplies the bedding industry, which produces mattress sets (mattresses, box springs, and foundations). The upholstery fabrics segment supplies the residential furniture industry and, to a lesser extent, the commercial furniture industry. The residential furniture market includes upholstered furniture sold to consumers for household use, including sofas, sofa-beds, chairs, recliners and sectionals. The commercial furniture and fabrics market includes upholstered office seating and modular office systems sold primarily for use in offices and other institutional settings, and commercial textile wall covering. The principal industries into which the company sells products are described below.
After many years of steady growth, both in unit volume and average selling prices, the bedding industry experienced a decrease in overall sales in calendar 2009 and 2008, due to the weak economy and an especially weak housing market. According to the International Sleep Products Association (ISPA), a trade association, the U.S. wholesale bedding industry accounted for an estimated $5.7 billion in sales in 2009, an 8.4% decrease from 2008. According to industry statistics, specialty bedding producers, which produce mattresses that do not use inner spring construction, saw sales decrease by 11.7% in 2009. The industry is comprised of several hundred manufacturers, but the largest five manufacturers accounted for more than 63% of the total wholesale shipments in 2009, while the top fifteen accounted for approximately 81%. Until recently, the bedding industry has been mature and stable. However, during the past two fiscal years it has weakened due to economic pressures. On a long-term basis, the stability of this market has been due in part to replacement purchases, which account for the majority of bedding industry sales. The overall weakness in the bedding market during 2008 and 2009 reflected a slight decline in average selling prices for mattresses sold in the U.S. According to ISPA, wholesale sales of bedding decreased 8.4% in 2009 and the number of units sold decreased by 11.0%. However, more recent interim industry reports show year-over-year growth, with units and dollars increasing by 12.8% and 10.7%, respectively, on a year-to-date basis as of May 2010.
Unlike the residential furniture industry, which has faced intense competition from imports, the bedding industry has largely remained a North American based business with limited competition from imports. The primary reasons for this fact include: 1) the short lead times demanded by mattress manufacturers and retailers due to their quick service delivery model, 2) the limited inventories carried by manufacturers and retailers requires “just-in-time” delivery of product, 3) the customized nature of each manufacturer and retailer’s product lines, 4) high shipping and import duty costs, 5) the relatively low direct labor content in mattresses, and 6) strong brand recognition.
Other key trends in the bedding industry include:
| · | Consumers have become increasingly aware of and are concerned with the health benefits of better sleep. This has caused an increased focus on the quality of bedding products and an apparent willingness on the part of consumers to pay more for bedding. |
| · | While mattress fabrics serve the functional purpose of providing a soft and durable cover, there is a growing emphasis on the design knitted or woven into the fabrics to appeal to the customer’s visual attraction and perceived value of the mattress on the retail floor. Mattress fabric design efforts are based on current trends in home décor and fashion. |
| · | Growth in non-traditional sources for retail mattress sales is now an important factor in home furnishings forecasts. These sales outlets, such as wholesale warehouse clubs and the internet, have the potential to increase overall consumption of goods due to convenience and high traffic volume which in turn result in higher turnover of product. |
| · | Increased popularity of knitted mattress fabric has continued. Knitted fabric was initially used primarily on premium mattresses, but these products are now being placed increasingly on mattresses at mid-range retail price points. |
The residential furniture industry has been severely affected by the global economic downturn. Declines in consumer spending and a very weak housing market led to significantly lower sales of residential furniture in 2008, a trend that continued into 2009. According to data published by the American Home Furnishings Alliance (AHFA), a trade association, prior to 2008 the residential furniture industry was mature and stable, with growth rates at or below the overall growth rate of the U.S. economy. However, shipments declined by 14.8% in 2008 compared to the prior year, and in 2009 retail furniture shipments dropped 18.1% compared to 2008. The overall weak demand for residential furniture has continued to affect the residential furniture industry, creating significant challenges for suppliers to the industry.
Other important trends and issues facing the residential furniture industry include:
| · | The sourcing of components and fully assembled furniture from overseas continues to play a major role in the residential furniture industry, although in 2008 and to a greater extent in 2009, the import rate declined. According to Furniture/Today, an industry trade publication, imports of residential furniture into the U.S. fell by 21% in 2009, following a decrease of 6% in 2008. By far, the largest source for these imports continues to be China, which now accounts for approximately 57% of total U.S. furniture imports. In past years, a large majority of furniture imports from China were wooden “casegoods,” but there has been significant recent growth in imports of upholstered furniture components, including upholstery fabric and “cut and sewn kits” for furniture covers. This trend has been especially strong for leather furniture, and it now extends to other coverings, including microdenier suedes and the more traditional types of fabrics manufactured by the company. The shift to offshore sourcing has led to significant deflation in retail furniture prices. |
| · | Imports of upholstery fabric, both in roll and in “kit” form, have increased in recent years. Fabrics entering the U.S. from China and other low labor cost countries are resulting in increased price competition in the upholstery fabric and upholstered furniture markets. |
| · | Leather and suede upholstered furniture has been gaining market share over the last ten years. This trend has increased over the last six years in large part because selling prices of leather furniture have been declining significantly over this time period. |
| · | The residential furniture industry has been consolidating at the manufacturing level for several years. The result of this trend is fewer, but larger, customers for marketers of upholstery fabrics. |
The market for commercial furniture - furniture used in offices and other institutional settings - declined approximately 29.7% from 2008 to 2009, following a 2.3% decline the previous year. The decline in 2009 reflects economic trends affecting businesses, which are the ultimate customers in this industry. This trend appears to be continuing into 2010 along with weak overall business conditions. According to the Business and Institutional Furniture Manufacturer’s Association (BIFMA), a trade association, the commercial furniture market in the U.S. totaled approximately $7.8 billion in 2009 in wholesale shipments by manufacturers, a substantial decline from the $11.2 billion total for 2008. This total represents a significant decrease from the industry’s peak of $13.3 billion in 2000.
As described above, our products include mattress fabrics and upholstery fabrics, which are the company’s identified operating segments.
Mattress Fabrics Segment
Mattress fabrics segment sales constituted 56% of sales in fiscal 2010, and 57% in fiscal 2009. The company has emphasized fabrics that have broad appeal at prices generally ranging from $1.35 to $7.50 per yard.
Upholstery Fabrics Segment
Upholstery fabrics segment sales totaled 44% of sales for fiscal 2010, and 43% in fiscal 2009. The company has emphasized fabrics that have broad appeal at “good” and “better” prices, generally ranging from $2.75 to $8.00 per yard.
Culp Fabric Categories by Segment
We market products in most categories of fabric that manufacturers currently use for bedding and furniture. The following table indicates the product lines within each segment, and a brief description of their characteristics.
Mattress Fabrics
| Woven jacquards | Florals and other intricate designs. Woven on complex looms using a variety of synthetic and natural yarns. |
| | |
Specialty | Suedes, velours, and other specialty type products are sourced to offer diversity for higher end mattresses. |
| | |
| Knitted Fabric | Floral and other intricate designs produced on special-width circular knit machines utilizing a variety of synthetic and natural yarns. Knitted mattress fabrics have inherent stretching properties and spongy softness, which conforms well with layered foam packages. |
Upholstery Fabrics
| Woven jacquards | Elaborate, complex designs such as florals and tapestries in traditional, transitional and contemporary styles. Woven on intricate looms using a wide variety of synthetic and natural yarns. |
| | |
| Woven dobbies | Fabrics that use straight lines to produce geometric designs such as plaids, stripes and solids in traditional and country styles. Woven on less complicated looms using a variety of weaving constructions and primarily synthetic yarns. |
| | |
| Velvets | Soft fabrics with a plush feel. Produced with synthetic yarns, either by weaving or by “tufting” yarn into a base fabric. Basic designs such as plaids in both traditional and contemporary styles. |
| | |
| Suede fabrics | Fabrics woven or knitted using microdenier polyester yarns, which are piece dyed and finished, usually by sanding. The fabrics are typically plain or small jacquard designs, with some being printed. These are sometimes referred to as microdenier suedes, and some are “leather look” fabrics. |
Mattress Fabrics Segment
Our mattress fabrics segment operates three manufacturing plants, located in Stokesdale, North Carolina; High Point, North Carolina and St. Jerome, Quebec, Canada. Over the past six fiscal years, we made capital expenditures of approximately $27 million to consolidate all of our production of woven jacquards, or damask fabric, to two of these plants and to modernize the equipment, enhance and provide finishing capabilities and expand capacity in each of these facilities. The result has been an increase in manufacturing efficiency and a substantial reduction in operating costs. Jacquard mattress fabric is woven at the Stokesdale and St. Jerome plants, and knitted fabrics are produced at the High Point facility. Most finishing and inspection processes for mattress fabrics are conducted at the Stokesdale plant.
In addition to the mattress fabrics we manufacture, we have important supply arrangements in place that allow us to source mattress fabric from strategic suppliers. A portion of our woven jacquard fabric and knitted fabric is obtained from a supplier located in Turkey, based on designs created by Culp designers, and we are sourcing certain specialty fabric products (such as suedes and embroidered fabrics) through our China platform.
Upholstery Fabrics Segment
We currently operate one upholstery manufacturing facility in the U.S. and three in China. The U.S. plant is located in Anderson, South Carolina, and mainly produces velvet upholstery fabrics with some production of certain decorative fabrics.
Our upholstery manufacturing facilities in China are all located within the same industrial area near Shanghai. At these plants, we apply strategic value-added finishing processes to fabrics sourced from a limited number of strategic suppliers in China, and we inspect sourced fabric there as well. In addition, the Shanghai operations include facilities where sourced fabric is cut and sewn to provide “kits” that are designed to be placed on specific furniture frames designated by our customers.
A large portion of our upholstery fabric products, as well as certain elements of our production processes, are being sourced from outside suppliers. The development of our facilities in China has provided a base from which to access a variety of products, including certain fabrics (such as microdenier suedes) that are not produced anywhere within the U.S. We have found opportunities to develop significant relationships with key overseas suppliers that allow us to source products on a cost-effective basis while at the same time limiting our investment of capital in manufacturing assets. We source unfinished and finished fabrics from a limited number of strategic suppliers in China who are willing to commit significant capacity to meet our needs while working with our product development team to meet the demands of our customers. We also source a substantial portion of our yarns, both for U.S. and China upholstery operations, through our China facilities. The remainder of our yarn is obtained from other suppliers around the world, as we have eliminated our internal yarn production capabilities.
Consumer tastes and preferences related to bedding and upholstered furniture change over time. The use of new fabrics and designs remains an important consideration for manufacturers to distinguish their products at retail and to capitalize on changes in preferred colors, patterns and textures. Culp’s success is largely dependent on our ability to market fabrics with appealing designs and patterns. The process of developing new designs involves maintaining an awareness of broad fashion and color trends both in the United States and internationally.
Mattress Fabrics Segment
Design is an important element of producing mattress fabrics. Price point delineation is accomplished through fabric quality as well as variation in design. Additionally, a consumer will be drawn to the mattress that is most visually appealing when walking into the retail showroom. Fibers also play an important part in design. Rayon, organic cotton and recycled fibers are incorporated into the design process to allow the retailer to offer the consumer additional benefits related to their sleeping experience. Mattress fabric designs are not introduced on a scheduled season. More frequently, designs are introduced upon customer request as they plan introduction to their retailers. Additionally, we work closely with our customers on new design offerings around the major furniture markets such as High Point and Las Vegas.
Upholstery Fabrics Segment
The company has developed an upholstery fabrics design and product development team (with staff located in the U.S. and in China) with focus on designing for value primarily on body cloths, while promoting style leadership with pillow fabrics and color. The team searches continually for new ideas and for the best sources of raw materials, yarns and fabrics utilizing a China supply network. Using these design elements, they develop product offerings using ideas and materials which take both fashion trends and cost considerations into account, to offer products designed to meet the needs of furniture manufacturers and ultimately the desires of consumers. Upholstery fabric designs are introduced at major fabric trade conferences that occur twice a year in the United States (June and December). Recently we have become more aggressive in registering copyrights for popular fabric patterns and taking steps to discourage the illegal copying of our proprietary designs.
Mattress Fabrics Segment
All of our shipments of mattress fabrics originate from our manufacturing facility in Stokesdale. Through arrangements with major customers and in accordance with industry practice, we maintain a significant inventory of mattress fabrics at our distribution facility in Stokesdale (“make to stock”), so that products may be shipped to customers with short lead times and on a “just in time” basis.
Upholstery Fabrics Segment
The majority of our upholstery fabrics are marketed on a “make to order” basis and are shipped directly from our distribution facilities in Burlington and Shanghai. In addition, an inventory comprising of a limited number of sourced fabric patterns is held at our distribution facilities in Burlington and Shanghai from which our customers can obtain quick delivery of sourced fabrics through a program known as “Culp Express.” We have developed a revised marketing strategy for our U.S.-produced upholstery products, providing customers with very quick delivery on target products at key price points. This program, known as “Store House,” is aimed at driving higher sales volume per fabric pattern and thus should result in improved manufacturing performance and lower unit costs for our U.S. upholstery operations, while employing a smaller fixed asset base. During fiscal 2010, market share opportunities have been expanded through strategic selling partnerships.
Mattress Fabrics Segment
Raw materials account for approximately 70% of mattress fabric production costs. The mattress fabrics segment purchases synthetic yarns (polypropylene, polyester and rayon), certain greige (unfinished) goods, latex adhesives, laminates, dyes and other chemicals. Most of these materials are available from several suppliers, and prices fluctuate based on supply and demand, the general rate of inflation, and particularly on the price of petrochemical products. The mattress fabrics segment has generally not had significant difficulty in obtaining raw materials.
Upholstery Fabrics Segment
Raw materials account for approximately 50%-60% of upholstery fabric manufacturing costs for products the company manufactures. This segment purchases synthetic yarns (polypropylene, polyester, acrylic and rayon), acrylic staple fiber, latex adhesives, dyes and other chemicals from various suppliers.
The upholstery fabric segment has outsourced all of its yarn requirements, and thus it has become more dependent upon suppliers for components yarn. In addition, we have outsourced a number of our U.S. upholstery fabric manufacturing services to suppliers, such as extrusion of yarn and upholstery fabric finishing. Although U.S. produced fabrics are a decreasing portion of our upholstery business, increased reliance by both our U.S. and China upholstery operations on outside suppliers for basic production needs such as base fabrics, yarns, and finishing services has caused the upholstery fabrics segment to become more vulnerable to price increases, delays, or production interruptions caused by problems within businesses that we do not control.
Both Segments
Many of our basic raw materials are petrochemical products or are produced from such products. For this reason, our material costs are especially sensitive to changes in prices for petrochemicals and the underlying price of oil. In addition, the financial condition and performance of a number of U.S.-based yarn suppliers has been severely impacted by the reductions in the overall size of the U.S. textile industry over the last several years. These conditions have increased the risk of business failures or further consolidations among the suppliers to the North American-based portions of our business. This situation could cause additional disruptions and pricing pressures in our supply of certain raw materials, yarns, and textile services obtained in the U.S. as overall demand for textiles produced in the U.S. declines.
Mattress Fabrics Segment
The mattress fabrics business and the bedding industry in general are slightly seasonal, with sales being the highest in late spring and late summer, with another peak in mid-winter.
Upholstery Fabrics Segment
The upholstery fabrics business is somewhat seasonal, with increased sales during our second and fourth fiscal quarters. This seasonality results from one-week closings of our manufacturing facilities and the facilities of most of our customers in the United States during our first and third fiscal quarters for the holiday weeks of July 4th and Christmas. This effect is becoming less pronounced as a larger portion of our fabrics are produced or sold in locations outside of the United States. However, the Chinese New Year (which occurs in January or February each year) can cause increased demand for products produced in China during the period immediately preceding the holiday.
Competition for our products is high and is based primarily on price, design, quality, timing of delivery and service.
Mattress Fabrics Segment
The mattress fabrics market is concentrated in a few relatively large suppliers. We believe our principal mattress fabric competitors are Bekaert Textiles B.V., Global Textile Alliance and several smaller companies producing knitted and other fabric.
Upholstery Fabrics Segment
In the upholstery fabric market, we compete against a large number of companies, ranging from a few large manufacturers comparable in size to the company to small producers, and a growing number of “converters” of fabrics (companies who buy and re-sell, but do not manufacture fabrics). We believe our principal upholstery fabric competitors are Richloom Fabrics, Merrimack Fabrics, Morgan Fabrics, and Specialty Textile, Inc. (or STI), plus a large number of smaller competitors (both manufacturers and converters).
Today, there is significant increased competition in U.S. markets by foreign producers of upholstery fabric, furniture components and finished upholstery furniture (as well as sales in the U.S. of leather furniture produced overseas which competes with upholstered furniture for market share). Foreign manufacturers often are able to produce upholstery fabric and other components of furniture with significantly lower raw material and production costs (especially labor) than those of our U.S. operations and other U.S.-based manufacturers. We compete with lower cost foreign goods on the basis of design, quality, reliability and speed of delivery. In addition, our operations in China allow us to facilitate the sourcing and marketing of goods produced in China.
The trend in the upholstery fabrics industry to greater overseas competition and the entry of more converters has caused the upholstery fabrics industry to become substantially more fragmented in recent years, with lower barriers to entry. This has resulted in a larger number of competitors selling upholstery fabrics, with an increase in competition based on price.
We are subject to various federal and state laws and regulations, including the Occupational Safety and Health Act (“OSHA”) and federal and state environmental laws, as well as similar laws governing our manufacturing facilities in China and Canada. We periodically review our compliance with these laws and regulations in an attempt to minimize the risk of violations.
Our operations involve a variety of materials and processes that are subject to environmental regulation. Under current law, environmental liability can arise from previously owned properties, leased properties and properties owned by third parties, as well as from properties currently owned and leased by the company. Environmental liabilities can also be asserted by adjacent landowners or other third parties in toxic tort litigation.
In addition, under the Comprehensive Environmental Response, Compensation, and Liability Act of 1980, as amended (“CERCLA”), and analogous state statutes, liability can be imposed for the disposal of waste at sites targeted for cleanup by federal and state regulatory authorities. Liability under CERCLA is strict as well as joint and several.
The U.S. Congress is currently considering legislation to address climate change that is intended to reduce overall green house gas emissions, including carbon dioxide. In addition, the U.S. Environmental Protection Agency has made a determination that green house gas emissions may be a threat to human health and the environment. International agreements may also result in new regulations on green house gas emissions. It is uncertain if, when, and in what form, a mandatory carbon dioxide emissions reduction program may be enacted either through legislation or regulation. However, if enacted, this type of program could materially increase our operating costs, including costs of raw materials, transportation and electricity. It is difficult to predict the extent to which any new rules or regulations would impact our business, but we would expect the effect on our operations to be similar to that for other manufacturers, particularly those in our industry.
We are periodically involved in environmental claims or litigation and requests for information from environmental regulators. Each of these matters is carefully evaluated, and the company provides for environmental matters based on information presently available. Based on this information, we do not believe that environmental matters will have a material adverse effect on either the company’s financial condition or results of operations. However, there can be no assurance that the costs associated with environmental matters will not increase in the future. See the discussion of a current environmental claim against the company below in Item 3 — “Legal Proceedings.”
As of May 2, 2010, we had 1,085 employees, compared to 1,047 at the end of fiscal 2009, and 1,187 at the end of fiscal 2008. Overall, the number of employees decreased over the past last five fiscal years in connection with our restructuring initiatives and efforts to reduce U.S. upholstery fabrics manufacturing costs, as well as initiatives to outsource certain operations. The number of employees located in the U.S. has decreased even more dramatically, while the number of employees in China has increased (see table below).
The hourly employees at our manufacturing facility in Canada (approximately 16% of the company’s workforce) are represented by a local, unaffiliated union. The collective bargaining agreement for these employees expires on February 1, 2011. We are not aware of any efforts to organize any more of our employees, and we believe our relations with our employees are good.
The following table illustrates the changes in the location of our workforce and number of employees, as of year-end, over the past five fiscal years.
| | | | | |
| | | | | | | | | | | | | | | | | |
| Mattress Fabrics Segment | | | 430 | | | | 420 | | | | 373 | | | | 361 | | | | 351 | | |
| | | | | | | | | | | | | | | | | | | | | | |
| Upholstery Fabrics Segment | | | | | | | | | | | | | | | | | | | | | |
| | | | | | | | | | | | | | | | | | | | | | |
| United States | | | 123 | | | | 119 | | | | 230 | | | | 297 | | | | 659 | | |
| | | | | | | | | | | | | | | | | | | | | | |
| China | | | 528 | | | | 504 | | | | 481 | | | | 479 | | | | 270 | | |
| | | | | | | | | | | | | | | | | | | | | | |
| Total Upholstery Fabrics Segment | | | 651 | | | | 623 | | | | 711 | | | | 776 | | | | 929 | | |
| | | | | | | | | | | | | | | | | | | | | | |
| Unallocated corporate | | | 4 | | | | 4 | | | | 3 | | | | 3 | | | | 3 | | |
| | | | | | | | | | | | | | | | | | | | | | |
| Total | | | 1,085 | | | | 1,047 | | | | 1,087 | | | | 1,140 | | | | 1,283 | | |
Mattress Fabrics Segment
Major customers for our mattress fabrics include the leading bedding manufacturers: Sealy, Serta (National Bedding), and Simmons. The loss of one or more of these customers would have a material adverse effect on the company. Our largest customer in the mattress fabrics segment is the parent company of Serta and Simmons (controlled by Ares Management, LLC and Ontario Teachers&apos), accounting for approximately 22% of the company’s overall sales in fiscal 2010. Our mattress fabrics customers also include many small and medium-size bedding manufacturers.
Upholstery Fabrics Segment
Our major customers for upholstery fabrics are leading manufacturers of upholstered furniture, including Ashley, Bassett, Berkline/Benchcraft, Best Home Furnishings, Flexsteel, Furniture Brands International (Broyhill and Lane), Klaussner Furniture, La-Z-Boy (La-Z-Boy Residential, Bauhaus, and England) and Southern Motion. Major customers for the company’s fabrics for commercial furniture include HON Industries. Our largest customer in the upholstery fabrics segment is La-Z-Boy Incorporated, the loss of which would have a material adverse effect on the company. Our sales to La-Z-Boy accounted for approximately 12% of the company’s total net sales in fiscal 2010.
The following table sets forth the company’s net sales by geographic area by amount and percentage of total net sales for the three most recent fiscal years.
(dollars in thousands)
| | | Fiscal 2010 | | | Fiscal 2009 | | | Fiscal 2008 | |
| United States | | | 160,360 | | | | 77.7 | % | | $ | 160,290 | | | | 78.6 | % | | $ | 202,701 | | | | 79.8 | % |
North America (Excluding USA) | | | 11,654 | | | | 5.6 | | | | 14,440 | | | | 7.1 | | | | 18,880 | | | | 7.4 | |
| Far East and Asia | | | 31,856 | | | | 15.4 | | | | 27,509 | | | | 13.5 | | | | 28,465 | | | | 11.2 | |
| All other areas | | | 2,546 | | | | 1.2 | | | | 1,699 | | | | 0.8 | | | | 4,000 | | | | 1.6 | |
| Subtotal (International) | | | 46,056 | | | | 22.3 | | | | 43,648 | | | | 21.4 | | | | 51,435 | | | | 20.2 | |
| Total | | | 206,416 | | | | 100 | % | | $ | 203,938 | | | | 100.0 | % | | $ | 254,046 | | | | 100.0 | % |
For additional segment information, see Note 20 in the consolidated financial statements.
Mattress Fabrics Segment
The backlog for mattress fabric is not a reliable predictor of future shipments because the majority of sales are on a just-in-time basis.
Upholstery Fabrics Segment
Although it is difficult to predict the amount of backlog that is “firm,” we have reported the portion of the upholstery fabric backlog from customers with confirmed shipping dates within five weeks of the end of the fiscal year. On May 2, 2010, the portion of the upholstery fabric backlog with confirmed shipping dates prior to June 6, 2010 was $9.0 million, all of which are expected to be filled early during fiscal 2010, as compared to $8.3 million as of the end of fiscal 2009 (for confirmed shipping dates prior to June 7, 2009).
Our business is subject to risks and uncertainties. In addition to the matters described above under “Cautionary Statement Concerning Forward-Looking Information,” set forth below are some of the risks and uncertainties that could cause a material adverse change in our results of operations or financial condition.
A continuation of the current economic downturn could result in declines in our sales and earnings.
Overall demand for our products depends upon consumer demand for furniture and bedding, which is subject to variations in the general economy. Because purchases of furniture or bedding are discretionary purchases for most individuals and businesses, demand for these products is sometimes more easily influenced by economic trends than demand for other products. Economic downturns can affect consumer spending habits and demand for home furnishings, which reduces the demand for our products and therefore could cause a decrease in our sales and earnings. The ongoing economic slowdown has caused a decrease in consumer spending and demand for home furnishings, including goods that incorporate our products.
It has been difficult to maintain and increase sales levels in the upholstery fabrics segment.
Although sales increased in fiscal 2010 for our upholstery fabrics segment, this was the first annual increase in sales for this business in ten fiscal years. Increased competition and fragmentation of the upholstery fabrics business, including a dramatic shift to imported fabrics and resulting price deflation for upholstery fabrics, have led to a significant reduction in the size of our upholstery business. The growth and profitability achieved by this segment in fiscal 2010 are encouraging, but there is no assurance that we will be able to maintain or consistently grow this business in the future.
Increased reliance on offshore operations and foreign sources of products or raw materials increases the likelihood of disruptions to our supply chain or our ability to deliver products to our customers on a timely basis.
We now rely significantly on operations in distant locations, particularly China, and in addition we have been purchasing an increasing share of our products and raw materials from offshore sources. At the same time, our domestic manufacturing capacity for the upholstery fabrics segment has been greatly reduced. These changes have caused us to place greater reliance on a much longer supply chain and on a larger number of suppliers that we do not control, both of which are inherently subject to greater risks of delay or disruption. In addition, operations and sourcing in foreign areas are subject to the risk of changing local governmental rules, taxes, changes in import rules or customs, potential political unrest, or other threats that could disrupt or increase the costs of operating in foreign areas or sourcing products overseas. Changes in the value of the U.S. dollar versus other currencies can affect our financial results because a significant portion of our operations are located outside the United States. Strengthening of the U.S. dollar against other currencies can have a negative impact on our sales of products produced in those countries. Any of the risks associated with foreign operations and sources could cause unanticipated increases in operating costs or disruptions in business, which could negatively impact our ultimate financial results.
We may have difficulty managing the outsourcing arrangements increasingly being used for products and services.
We are relying more on outside sources for various products and services, including yarn and other raw materials, greige (unfinished) fabrics, finished fabrics, and services such as weaving and finishing. Increased reliance on outsourcing lowers our capital investment and fixed costs, but it decreases the amount of control that we have over certain elements of our production capacity. Interruptions in our ability to obtain raw materials or other required products or services from our outside suppliers on a timely and cost effective basis, especially if alternative suppliers cannot be immediately obtained, could disrupt our production and damage our financial results.
Further write-offs or write-downs of assets would result in a decrease in our earnings and shareholders’ equity.
The company has long-lived assets, consisting mainly of property, plant and equipment and goodwill. ASC Topic 360 establishes an impairment accounting model for long-lived assets such as property, plant, and equipment and requires the company to assess for impairment whenever events or changes in circumstances indicate that the carrying value of the asset may not be recovered. ASC Topic 350 requires that goodwill be tested at least annually for impairment or whenever events or changes in circumstances indicate that the carrying value of the asset may not be recovered. Restructuring activities and other tests for impairment have resulted and could in the future result in the write-down of a portion of our long-lived assets and a corresponding reduction in earnings and net worth. In fiscal 2008, the company experienced asset write-downs of property, plant and equipment of $792,000, of which $503,000 related to the upholstery fabrics segment and $289,000 related to the mattress fabrics segment. In fiscal 2009, we experienced an additional $8 million in similar write-downs in the upholstery fabrics segment. Although no write-downs were experienced in fiscal 2010, there is no assurance that future write-downs of fixed assets or goodwill will not occur if business conditions deteriorate.
Changes in the price, availability and quality of raw materials could increase our costs or cause production delays and sales interruptions, which would result in decreased earnings.
We depend upon outside suppliers for most of our raw material needs, and increasingly we rely upon outside suppliers for component materials such as yarn and unfinished fabrics, as well as for certain services such as finishing and weaving. Fluctuations in the price, availability and quality of these goods and services could have a negative effect on our production costs and ability to meet the demands of our customers, which would affect our ability to generate sales and earnings. In many cases, we are not able to pass through increased costs of raw materials or increased production costs to our customers through price increases. In particular, many of our basic raw materials are petrochemical products or are produced from such products. For this reason, our material costs are especially sensitive to changes in prices for petrochemicals and the underlying price of oil. Increases in prices for oil, petrochemical products or other raw materials and services provided by outside suppliers could significantly increase our costs and negatively affect earnings.
Increases in energy costs would increase our operating costs and could adversely affect earnings.
Higher prices for electricity, natural gas and fuel increase our production and shipping costs. A significant shortage, increased prices, or interruptions in the availability of these energy sources would increase the costs of producing and delivering products to our customers, and would be likely to adversely affect our earnings. In many cases, we are not able to pass along the full extent of increases in our production costs to customers through price increases. During fiscal 2008, energy prices increased significantly, in part due to increases in the price of oil and other petrochemical products. Although some price increases were implemented to offset the effect of these increased costs, we were not able to fully recoup these costs, and operating margins were negatively affected. Energy costs eased somewhat in fiscal 2009 and 2010, but remain a volatile element of our costs. Further increases in energy costs could have a negative effect on our earnings.
Business difficulties or failures of large customers could result in a decrease in our sales and earnings.
We currently have several customers that account for a substantial portion of our sales. In the mattress fabric segment, several large bedding manufacturers have large market shares and comprise a significant portion of our mattress fabric sales, with Sealy, Inc. and Serta (National Bedding) accounting for approximately 22% of consolidated net sales in fiscal 2010. In the upholstery fabrics segment, La-Z-Boy Incorporated accounted for approximately 12% of consolidated net sales during fiscal 2010, and several other large furniture manufacturers comprised a significant portion of sales. A business failure or other significant financial difficulty by one or more of our major customers could cause a significant loss in sales, an adverse effect on our earnings, and difficulty in collection of our trade accounts receivable.
Loss of market share due to competition would result in declines in sales and could result in losses or decreases in earnings.
Our business is highly competitive, and in particular the upholstery fabric industry is fragmented and is experiencing an increase in the number of competitors. As a result, we face significant competition from a large number of competitors, both foreign and domestic. We compete with many other manufacturers of fabric, as well as converters who source fabrics from various producers and market them to manufacturers of furniture and bedding. In many cases, these fabrics are sourced from foreign suppliers who have a lower cost structure than the company. The highly competitive nature of our business means we are constantly subject to the risk of losing market share. Our sales of upholstery fabrics have decreased significantly over the past ten fiscal years due in part to the increased number of competitors in the marketplace, especially foreign sources of fabric. As a result of increased competition, there have been deflationary pressures on the prices for many of our products, which make it more difficult to pass along increased operating costs such as raw materials, energy or labor in the form of price increases and puts downward pressure on our profit margins. Also, the large number of competitors and wide range of product offerings in our business can make it more difficult to differentiate our products through design, styling, finish and other techniques.
If we fail to anticipate and respond to changes in consumer tastes and fashion trends, our sales and earnings may decline.
Demand for various types of upholstery fabrics and mattress coverings change over time due to fashion trends and changing consumer tastes for furniture and bedding. Our success in marketing our fabrics depends upon our ability to anticipate and respond in a timely manner to fashion trends in home furnishings. If we fail to identify and respond to these changes, our sales of these products may decline. In addition, incorrect projections about the demand for certain products could cause the accumulation of excess raw material or finished goods inventory, which could lead to inventory mark-downs and further decreases in earnings.
Restructuring initiatives create short-term costs that may not be offset by increased savings or efficiencies.
Over several years prior to the most recent fiscal year, we undertook significant restructuring activities, which involved closing manufacturing plants, realigning manufacturing assets, and changes in product strategy. These actions lowered our manufacturing costs and increased efficiency, but they also involved significant costs, including inventory markdowns, the write-off or write-down of assets, severance costs for terminated employees, contract termination costs, equipment moving costs, and similar charges. These charges caused significant decreases in earnings in prior fiscal years. There were no new restructuring initiatives in fiscal 2010, and we do not have any current plans for additional restructuring activities, but a significant and unanticipated downturn in business could lead to additional restructuring changes in the future.
We are subject to litigation and environmental regulations that could adversely impact our sales and earnings.
We are, and in the future may be, a party to legal proceedings and claims, including environmental matters, product liability and employment disputes, some of which claim significant damages. We face the continual business risk of exposure to claims that our business operations have caused personal injury or property damage. We maintain insurance against product liability claims and in some cases have indemnification agreements with regard to environmental claims, but there can be no assurance that these arrangements will continue to be available on acceptable terms or that such arrangements will be adequate for liabilities actually incurred. Given the inherent uncertainty of litigation, there can be no assurance that claims against the company will not have a material adverse impact on our earnings or financial condition. We are also subject to various laws and regulations in our business, including those relating to environmental protection and the discharge of materials into the environment. We could incur substantial costs as a result of noncompliance with or liability for cleanup or other costs or damages under environmental laws or other regulations.
We must comply with a number of governmental regulations applicable to our business, and changes in those regulations could adversely affect our business.
Our products and raw materials are and will continue to be subject to regulation in the United States by various federal, state and local regulatory authorities. In addition, other governments and agencies in other jurisdictions regulate the manufacture, sale and distribution of our products and raw materials. For example, standards for flame resistance of fabrics have been recently adopted on a nationwide basis. Also, rules and restrictions regarding the importation of fabrics and other materials, including custom duties, quotas and other regulations, are continually changing. Environmental laws, labor laws, tax regulations and other regulations continually affect our business. All of these rules and regulations can and do change from time to time, which can increase our costs or require us to make changes in our manufacturing processes, product mix, sources of products and raw materials, or distribution. Changes in the rules and regulations applicable to our business may negatively impact our sales and earnings.
None.
Our headquarters are located in High Point, North Carolina. As of the end of fiscal 2010, we owned or leased eight active manufacturing and distribution facilities and our corporate headquarters. The following is a list of our principal administrative, manufacturing and distribution facilities. The manufacturing facilities and distribution centers are organized by segment.
| | | Approx. | | |
| | | Total Area | Expiration |
| Location | Principal Use | (Sq. Ft.) | of Lease (1) |
| | | | | | |
· Administrative: | | | | | |
| High Point, North Carolina (2) | Upholstery fabric division offices and corporate headquarters | 56,880 | | 2019 | |
· Mattress Fabrics: | | | | | |
| Stokesdale, North Carolina | Manufacturing, distribution, and division offices | 230,000 | | Owned | |
| High Point, North Carolina | Manufacturing | 63,522 | | 2010 | |
| St. Jerome, Quebec, Canada | Manufacturing | 202,500 | | Owned | |
· Upholstery Fabrics: | | | | | |
| Anderson, South Carolina | Manufacturing | 99,000 | | Owned | |
| Burlington, North Carolina | Finished goods distribution | 67,330 | | 2010 | |
| Shanghai, China | Manufacturing and offices | 69,000 | | 2012 | |
| Shanghai, China | Manufacturing and warehousing | 90,000 | | 2012 | |
| Shanghai, China | Manufacturing and warehousing | 101,632 | | 2013 | |
____________________________________________________
| (1) | Includes all options to renew. |
| (2) | We are currently occupying the entire building. In the event we elect to renew the lease on April 1, 2012, the leased premises during any renewal period (see note 4 to the consolidated financial statements) will be 1/3 of the current occupied space of 56,880 square feet. |
We believe that our facilities are in good condition, well-maintained and suitable and adequate for present utilization. In the upholstery fabrics segment, we have the ability to source upholstery fabric from outside suppliers to meet current and expected demand trends and further increase our output of finished goods. This ability to source upholstery fabric is part of our long-term strategy to have a low-cost platform that is scalable, but not capital intensive. In the mattress fabrics segment, management has estimated that it is currently performing at near capacity. In response, we had capital expenditures of $6.6 million in fiscal 2010 and plan to continue our significant level of capital spending in fiscal 2011 for modernizing and expanding our woven and knit capacities. Also, we have the ability to source additional mattress fabric from outside suppliers to further increase our ultimate output of finished goods.
A lawsuit was filed against the company and other defendants (Chromatex, Inc., Rossville Industries, Inc., Rossville Companies, Inc. and Rossville Investments, Inc.) on February 5, 2008 in United States District Court for the Middle District of Pennsylvania. The plaintiffs are Alan Shulman, Stanley Siegel, Ruth Cherenson as Personal Representative of Estate of Alan Cherenson, and Adrienne Rolla and M.F. Rolla as Executors of the Estate of Joseph Byrnes. The plaintiffs were partners in a general partnership that formerly owned a manufacturing plant in West Hazleton, Pennsylvania (the “Site”). Approximately two years after this general partnership sold the Site to defendants Chromatex, Inc. and Rossville Industries, Inc. the company leased and operated the Site as part of the company’s Rossville/Chromatex division. The lawsuit involves court judgments that have been entered against the plaintiffs and against defendant Chromatex, Inc. requiring them to pay costs incurred by the United States Environmental Protection Agency (“USEPA”) responding to environmental contamination at the Site, in amounts approximating $8.6 million, plus unspecified future environmental costs. Neither USEPA nor any other governmental authority has asserted any claim against the company on account of these matters. The plaintiffs seek contribution from the company and other defendants and a declaration that the company and the other defendants are responsible for environmental response costs under environmental laws and certain agreements. The plaintiffs also assert that the company tortiously interfered with contracts between them and other defendants in the case and diverted assets to prevent the plaintiffs from being paid monies owed to them. The company does not believe it has any liability for the matters described in this litigation and intends to defend itself vigorously. In addition, the company has an indemnification agreement with certain other defendants in the litigation pursuant to which the other defendants agreed to indemnify the company for any damages it incurs as a result of the environmental matters that are subject of this litigation. For these reasons, no reserve has been recorded.
EQUITY, RELATED STOCKHOLDER MATTERS, AND
ISSUER PURCHASES OF EQUITY SECURITIES
Registrar and Transfer Agent
Computershare Trust Company, N.A.
c/o Computershare Investor Services
Post Office Box 43078
Providence, Rhode Island 02940-3078
(800) 254-5196
(781) 575-2879 (Foreign shareholders)
www.computershare.com/investor
Stock Listing
Culp, Inc. common stock is traded on the New York Stock Exchange (“NYSE”) under the symbol CFI. As of May 2, 2010, Culp, Inc. had approximately 2,200 shareholders based on the number of holders of record and an estimate of individual participants represented by security position listings.
On January 29, 2010, we received notification from the NYSE that we regained compliance with the NYSE’s quantitative continued listing standards. In accordance with the NYSE’s Listed Company Manual, the company will be subject to a 12-month follow up period of review to ensure the company does not once again fall below the NYSE’s continued listing standards. We received a letter of noncompliance from the NYSE on December 11, 2008, notifying us that we had fallen below both the minimum shareholders’ equity and market capitalization requirements for continued listing on the NYSE. According to the January 2010 letter from the NYSE, our reinstatement to compliance comes as a result of our consistent and positive performance commensurate with the business plan submitted to the NYSE, and our compliance with the NYSE’s minimum market capitalization and shareholders’ equity requirements over the past two quarters.
Analyst Coverage
These analysts cover Culp, Inc.:
Raymond, James & Associates - Budd Bugatch, CFA
Value Line - Craig Sirois
Dividends and Share Repurchases; Sales of Unregistered Securities
We have not paid a cash dividend nor repurchased any of our common stock from our shareholders during the past three fiscal years. There were no sales of unregistered securities during fiscal 2010.
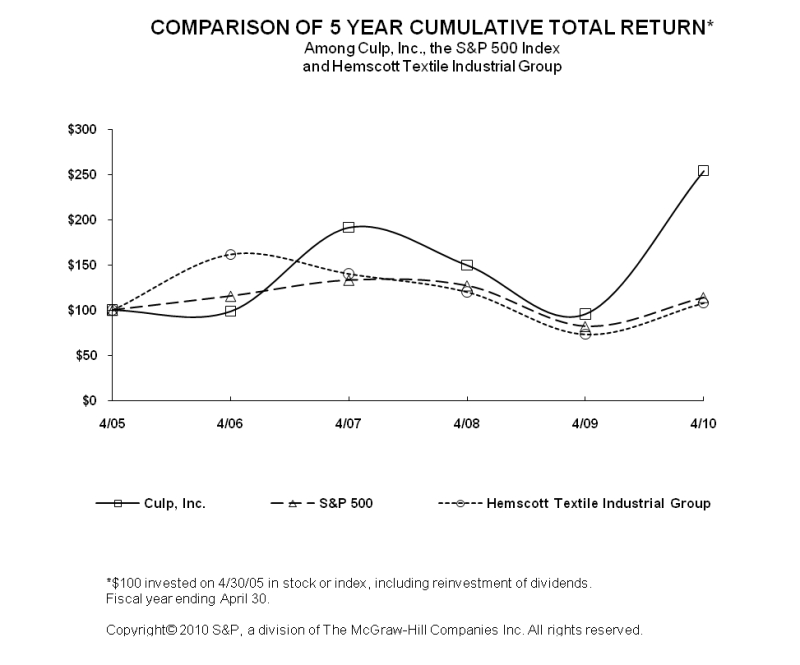
Performance Comparison
The following graph shows changes over the five fiscal years ending May 2, 2010 in the value of $100 invested in (1) the common stock of the company, (2) the Hemscott Textile Manufacturing Group Index (formerly named Core Data Textile Manufacturing Group Index) reported by Standard and Poor’s, consisting of twelve companies (including the company) in the textile industry, and (3) the Standard & Poor’s 500 Index.
The graph assumes an initial investment of $100 at the end of fiscal 2005 and the reinvestment of all dividends during the periods identified.
Market Information
See Item 6, Selected Financial Data, and Selected Quarterly Data in Item 8, for market information regarding the company’s common stock.
| | | | | | | | | | | | | | | | | | percent | |
| | | fiscal | | | fiscal | | | fiscal | | | fiscal | | | fiscal | | | change | |
| (amounts in thousands) | | 2010 | | | 2009 | | | 2008 | | | 2007 | | | 2006 | | | 2010/2009 | |
| INCOME (LOSS) STATEMENT DATA | | | | | | | | | | | | | | | | | | |
| net sales | | $ | 206,416 | | | | 203,938 | | | | 254,046 | | | | 250,533 | | | | 261,101 | | | 1.2 | |
| cost of sales (6) | | | 167,639 | | | | 179,286 | | | | 220,887 | | | | 219,328 | | | | 237,233 | | | (6.5 | ) |
| gross profit | | | 38,777 | | | | 24,652 | | | | 33,159 | | | | 31,205 | | | | 23,868 | | | 57.3 | |
| selling, general, and administrative expenses (6) | | | 22,805 | | | | 19,751 | | | | 23,973 | | | | 27,030 | | | | 28,954 | | | 15.5 | |
| restructuring (credit) expense (6) | | | (370 | ) | | | 9,471 | | | | 886 | | | | 3,534 | | | | 10,273 | | | N.M. | |
| income (loss) from operations | | | 16,342 | | | | (4,570 | ) | | | 8,300 | | | | 641 | | | | (15,359 | ) | | N.M. | |
| interest expense | | | 1,314 | | | | 2,359 | | | | 2,975 | | | | 3,781 | | | | 4,010 | | | (44.3 | ) |
| interest income | | | (116 | ) | | | (89 | ) | | | (254 | ) | | | (207 | ) | | | (126 | ) | | 30.3 | |
| other expense | | | 828 | | | | 43 | | | | 736 | | | | 68 | | | | 634 | | | N.M. | |
| income (loss) before income taxes | | | 14,316 | | | | (6,883 | ) | | | 4,843 | | | | (3,001 | ) | | | (19,877 | ) | | (308.0 | ) |
| income taxes | | | 1,128 | | | | 31,959 | | | | (542 | ) | | | (1,685 | ) | | | (8,081 | ) | | N.M. | |
| net income (loss) | | $ | 13,188 | | | | (38,842 | ) | | | 5,385 | | | | (1,316 | ) | | | (11,796 | ) | | (134.0 | ) |
| depreciation (7) | | $ | 4,010 | | | | 6,712 | | | | 5,548 | | | | 7,849 | | | | 14,362 | | | (40.3 | ) |
| weighted average shares outstanding | | | 12,709 | | | | 12,651 | | | | 12,624 | | | | 11,922 | | | | 11,567 | | | 0.5 | |
| weighted average shares outstanding, assuming dilution | | | 13,057 | | | | 12,651 | | | | 12,765 | | | | 11,922 | | | | 11,567 | | | 3.2 | |
| PER SHARE DATA | | | | | | | | | | | | | | | | | | | | | | | |
| net income (loss) per share - basic | | $ | 1.04 | | | | (3.07 | ) | | | 0.43 | | | | (0.11 | ) | | | (1.02 | ) | | (133.8 | ) |
| net income (loss) per share - diluted | | | 1.01 | | | | (3.07 | ) | | | 0.42 | | | | (0.11 | ) | | | (1.02 | ) | | (132.9 | ) |
| | | | | | | | | | | | | | | | | | | | | | | | |
| book value | | $ | 4.83 | | | | 3.76 | | | | 6.83 | | | | 6.29 | | | | 6.39 | | | 28.5 | |
| BALANCE SHEET DATA | | | | | | | | | | | | | | | | | | | | | | | |
| operating working capital (5) | | $ | 22,979 | | | | 23,503 | | | | 38,368 | | | | 46,335 | | | | 44,907 | | | (2.2 | ) |
| property, plant and equipment, net | | | 28,403 | | | | 24,253 | | | | 32,939 | | | | 37,773 | | | | 44,639 | | | 17.1 | |
| total assets | | | 112,598 | | | | 95,294 | | | | 148,029 | | | | 159,946 | | | | 157,467 | | | 18.2 | |
| capital expenditures | | | 7,397 | | | | 3,160 | | | | 6,928 | | | | 4,227 | | | | 6,470 | | | 134.1 | |
| long-term debt and lines of credit (1) | | | 11,687 | | | | 16,368 | | | | 21,423 | | | | 40,753 | | | | 47,722 | | | (28.6 | ) |
| shareholders' equity | | | 63,047 | | | | 48,031 | | | | 86,359 | | | | 79,077 | | | | 74,523 | | | 31.3 | |
| capital employed (3) | | | 53,416 | | | | 52,602 | | | | 102,868 | | | | 109,661 | | | | 112,531 | | | 1.5 | |
| RATIOS & OTHER DATA | | | | | | | | | | | | | | | | | | | | | | | |
| gross profit margin | | | 18.8 | % | | | 12.1 | % | | | 13.1 | % | | | 12.5 | % | | | 9.1 | % | | | |
| operating income (loss) margin | | | 7.9 | % | | | (2.2 | )% | | | 3.3 | % | | | 0.3 | % | | | (5.9 | )% | | | |
| net income (loss) margin | | | 6.4 | % | | | (19.0 | )% | | | 2.1 | % | | | (0.5 | )% | | | (4.5 | )% | | | |
| effective income tax rate | | | 7.9 | % | | | (464.3 | )% | | | (11.2 | )% | | | 56.1 | % | | | 40.7 | % | | | |
| long-term debt to total capital employed ratio (1) | | | 21.9 | % | | | 31.1 | % | | | 20.8 | % | | | 37.2 | % | | | 42.4 | % | | | |
| operating working capital turnover (5) | | | 9.0 | | | | 6.4 | | | | 5.8 | | | | 5.3 | | | | 5.0 | | | | |
| days sales in receivables | | | 35 | | | | 32 | | | | 37 | | | | 41 | | | | 39 | | | | |
| inventory turnover | | | 6.7 | | | | 6.0 | | | | 5.8 | | | | 5.7 | | | | 5.4 | | | | |
| STOCK DATA | | | | | | | | | | | | | | | | | | | | | | | |
| stock price | | | | | | | | | | | | | | | | | | | | | | | |
| high | | $ | 16.98 | | | | 7.91 | | | | 12.30 | | | | 8.52 | | | | 5.23 | | | | |
| low | | | 3.50 | | | | 1.30 | | | | 6.12 | | | | 4.24 | | | | 3.83 | | | | |
| close | | | 11.94 | | | | 4.40 | | | | 7.53 | | | | 8.50 | | | | 4.64 | | | | |
| P/E ratio (2) | | | | | | | | | | | | | | | | | | | | | | | |
| high (4) | | | 17 | | | N.M. | | | | 29 | | | N.M. | | | N.M. | | | | |
| low (4) | | | 3 | | | N.M. | | | | 15 | | | N.M. | | | N.M. | | | | |
| daily average trading volume (shares) | | | 80.1 | | | | 19.2 | | | | 38.3 | | | | 17.8 | | | | 12.5 | | | | |
| (1) Long-term debt includes long-term and current maturities of long-term debt and lines of credit. | |
| (2) P/E ratios based on trailing 12-month net income per share. | |
(3) Capital employed includes long-term and current maturities of long-term debt, lines of credit, and shareholders’ equity, offset by cash and cash equivalents and short-term investments. | |
| (4) N.M – Not meaningful | | | |
| (5) Operating working capital for this calculation is accounts receivable and inventories, offset by accounts payable. | |
| (6) The company incurred restructuring and related charges (credits) in fiscal 2006 through 2010. See note 3 of the company's consolidated financial statements. | |
| (7) Includes accelerated depreciation of $2.1 $1.2, $5.0 and $6.0 million for fiscal 2009, 2007, and 2006, respectively. | |
| No accelerated depreciation was recorded in fiscal 2010 and 2008. | | | |
FINANCIAL CONDITION AND RESULTS OF OPERATIONS
The following analysis of the financial condition and results of operations should be read in conjunction with the consolidated financial statements and notes attached thereto.
Overview
Our fiscal year is the 52 or 53 week period ending on the Sunday closest to April 30. Fiscal 2010, 2009, and 2008 included 52 weeks, 53 weeks, and 52 weeks, respectively. Our operations are classified into two business segments: mattress fabrics and upholstery fabrics. The mattress fabrics segment manufactures, sources, and sells fabrics to bedding manufacturers. The upholstery fabrics segment sources, manufacturers and sells fabrics primarily to residential and commercial (contract) furniture manufacturers.
We evaluate the operating performance of our segments based upon income (loss) from operations before restructuring and related charges (credits), certain unallocated corporate expenses, and other non-recurring items. Cost of sales in both segments include costs to manufacture or source our products, including costs such as raw material and finished goods purchases, direct and indirect labor, overhead and incoming freight charges. Unallocated corporate expenses primarily represent compensation and benefits for certain executive officers and all costs related to being a public company. Segment assets include assets used in the operation of each segment and primarily consist of accounts receivable, inventories, and property, plant and equipment. The mattress fabrics segment also includes in segment assets, assets held for sale, goodwill, and non-compete agreements associated with certain acquisitions. The upholstery fabrics segment also includes assets held for sale in segment assets.
We reported net sales of $206.4 million in fiscal 2010, an increase of 1.2%, compared with $203.9 million for fiscal 2009. Also, we reported net sales of $57.2 million in the fourth quarter of fiscal 2010, an increase of 20%, compared with $47.8 million in the fourth quarter of fiscal 2009. The increase in net sales represents favorable growth trends in both our mattress fabric and upholstery fabric segments.
We reported pre-tax income of $14.3 million in fiscal 2010 compared with a pre-tax loss of $6.9 million in fiscal 2009. The pre-tax loss in fiscal 2009 included restructuring and related charges of $13.1 million. Of the $13.1 million restructuring and related charges, $11.5 million and $1.6 million represented non-cash and cash charges, respectively. We reported net income of $13.2 million in fiscal 2010, or $1.01 per diluted share, compared with a net loss of $38.8 million in fiscal 2009, or $3.07 per diluted share. The net loss for fiscal 2009 included a $27.2 million non-cash charge, or $2.15 per diluted share, for the establishment of a valuation allowance against substantially all of our net deferred tax assets, and $13.1 million, or $1.03 per diluted share, in restructuring and related charges noted above.
The mattress fabric segment reported net sales of $114.8 million in fiscal 2010 compared with $115.4 million for fiscal 2009. Although mattress fabric sales remained flat for fiscal 2010, mattress fabric net sales increased 26% in the fourth quarter of fiscal 2010 compared with the fourth quarter of fiscal 2009. This increase in the fourth quarter reflects significant improvement in consumer demand in the bedding industry and the closure of a key competitor in late calendar 2009. Segment operating income was $15.5 million in fiscal 2010 compared with $13.2 million in fiscal 2009. Operating margins improved to 13.5% in fiscal 2010 compared with 11.5% in fiscal 2009. The increase in operating income and margins is primarily due to favorable raw material pricing stemming from our global sourcing efforts, a sales shift to higher margin products, and the efficiency gains made possible from our capital investment programs.
The upholstery fabric segment reported net sales of $91.6 million in fiscal 2010, an increase of 3.4%, compared with $88.5 million for fiscal 2009. This increase represents the first annual sales gain for the upholstery fabric segment in ten fiscal years. In addition, upholstery fabric net sales increased 13% in the fourth quarter of fiscal 2010 compared with the fourth quarter of fiscal 2009. Operating income for fiscal 2010 was $6.0 million compared with an operating loss of $1.5 million for fiscal 2009, representing a $7.5 million turnaround. This substantial improvement in operating income was primarily due to a multi-year restructuring process that established a leaner and more agile manufacturing platform, including a wholly-owned business located in China that is scalable, but not capital intensive.
Throughout fiscal 2010, we strengthened our financial position and generated significant cash flow despite an unfavorable economic environment. Our cash and cash equivalents and short-term investments totaled $21.3 million at May 2, 2010, compared with $11.8 million at May 3, 2009. In fiscal 2010, cash flow from operations was $21.6 million, which primarily represents cash flow from earnings totaling $18.5 million. During fiscal 2010, we generated substantially less cash flow from working capital reductions and more from operating income, as profit margins significantly improved. In addition, we reduced our total long-term debt, including current maturities, to $11.7 million at May 2, 2010, compared with $16.4 million at May 3, 2009. Our next significant scheduled principal payment is in the amount of $2.2 million and is not due until August 2011. As of May 2, 2010, we have lines of credit totaling $12.5 million in the U.S. and China, with no outstanding balances. All of our long-term debt and line of credit agreements are unsecured.
Results of Operations
The following table sets forth certain items in the company’s consolidated statements of net income (loss) as a percentage of net sales.
| | | Fiscal | | | Fiscal | | | Fiscal | |
| | | 2010 | | | 2009 | | | 2008 | |
| Net sales | | | 100.0 | % | | | 100.0 | % | | | 100.0 | % |
| Cost of sales | | | 81.2 | | | | 87.9 | | | | 86.9 | |
| Gross profit | | | 18.8 | | | | 12.1 | | | | 13.1 | |
| Selling, general and administrative expenses | | | 11.0 | | | | 9.7 | | | | 9.4 | |
| Restructuring (credit) expense | | | (0.2 | ) | | | 4.6 | | | | 0.3 | |
| Income (loss) from operations | | | 7.9 | | | | (2.2 | ) | | | 3.3 | |
| Interest expense, net | | | 0.5 | | | | 1.2 | | | | 1.1 | |
| Other expense | | | 0.4 | | | | 0.0 | | | | 0.3 | |
| Income (loss) before income taxes | | | 6.9 | | | | (3.4 | ) | | | 1.9 | |
| Income taxes * | | | 7.9 | | | | (464.3 | ) | | | (11.2 | ) |
| Net income (loss) | | | 6.4 | % | | | (19.0 | )% | | | 2.1 | % |
* Calculated as a percentage of income (loss) before income taxes.
The tables on the following two pages set forth the company’s statements of operations by segment for the fiscal years ended May 2, 2010, May 3, 2009, and April 27, 2008.
| CULP, INC. |
| STATEMENTS OF OPERATIONS BY SEGMENT |
| FOR THE TWELVE MONTHS ENDED MAY 2, 2010 AND MAY 3, 2009 |
| | | | | | | | | | | | | | | | | | | | | | | | | |
| | | | | | | | | | | | | | | | | | | | | | | | | |
| (Amounts in thousands) |
| | | | | | | | | | | | | | | | | | | | | | | | | |
| | | | | | | | | | | | | | | | | | | | | | | | | |
| | | TWELVE MONTHS ENDED (UNAUDITED) |
| | | | | | | | | | | | | | | | | | | | | | | | | |
| | | Amounts | | | | | | | | | | | | Percent of Total Sales |
| | | May 2, | | | | | | May 3, | | | | | | % Over | | | | | | May 2, | | | May 3, | |
| Net Sales by Segment | | 2010 | | | | | | 2009 | | | | | | (Under) | | | | | | 2010 | | | 2009 | |
| | | | | | | | | | | | | | | | | | | | | | | | | |
| Mattress Fabrics | | $ | 114,848 | | | | | | | 115,396 | | | | | | | (0.5 | ) % | | | | | | 55.6 | % | | | 56.6 | % |
| Upholstery Fabrics | | | 91,568 | | | | | | | 88,542 | | | | | | | 3.4 | % | | | | | | 44.4 | % | | | 43.4 | % |
| | | | | | | | | | | | | | | | | | | | | | | | | | | | | | |
| Net Sales | | $ | 206,416 | | | | | | | 203,938 | | | | | | | 1.2 | % | | | | | | 100.0 | % | | | 100.0 | % |
| | | | | | | | | | | | | | | | | | | | | | | | | | | | | | |
| | | | | | | | | | | | | | | | | | | | | | | | | | | | | | |
| Gross Profit by Segment | | | | | | | | | | | | | | | | | | | | | | | Gross Profit Margin | |
| | | | | | | | | | | | | | | | | | | | | | | | | | | | | | |
| Mattress Fabrics | | $ | 23,652 | | | | | | | 20,996 | | | | | | | 12.7 | % | | | | | | 20.6 | % | | | 18.2 | % |
| Upholstery Fabrics | | | 15,183 | | | | | | | 7,253 | | | | | | | 109.3 | % | | | | | | 16.6 | % | | | 8.2 | % |
| Subtotal | | | 38,835 | | | | | | | 28,249 | | | | | | | 37.5 | % | | | | | | 18.8 | % | | | 13.9 | % |
| | | | | | | | | | | | | | | | | | | | | | | | | | | | | | |
| Restructuring related charges | | | (58 | ) | | | (1 | ) | | | (3,597 | ) | | | (1 | ) | | N.M. | | | | (2 | ) | | | (0.0 | ) % | | | (1.8 | ) % |
| | | | | | | | | | | | | | | | | | | | | | | | | | | | | | | | | |
| Gross Profit | | $ | 38,777 | | | | | | | | 24,652 | | | | | | | | 57.3 | % | | | | | | | 18.8 | % | | | 12.1 | % |
| | | | | | | | | | | | | | | | | | | | | | | | | | | | | | | | | |
| | | | | | | | | | | | | | | | | | | | | | | | | | | | | | | | | |
| Selling, General and Administrative expenses by Segment | | | | | | | | | | | | | | | | | | | | | | | | | | Percent of Sales | |
| | | | | | | | | | | | | | | | | | | | | | | | | | | | | | | | | |
| Mattress Fabrics | | $ | 8,178 | | | | | | | | 7,749 | | | | | | | | 5.5 | % | | | | | | | 7.1 | % | | | 6.7 | % |
| Upholstery Fabrics | | | 9,227 | | | | | | | | 8,756 | | | | | | | | 5.4 | % | | | | | | | 10.1 | % | | | 9.9 | % |
| Unallocated Corporate | | | 5,400 | | | | | | | | 3,225 | | | | | | | | 67.4 | % | | | | | | | 2.6 | % | | | 1.6 | % |
| Subtotal | | | 22,805 | | | | | | | | 19,730 | | | | | | | | 15.6 | % | | | | | | | 11.0 | % | | | 9.7 | % |
| | | | | | | | | | | | | | | | | | | | | | | | | | | | | | | | | |
| Restructuring related charges | | | - | | | | (1 | ) | | | 21 | | | | (1 | ) | | N.M. | | | | (2 | ) | | | 0.0 | % | | | 0.0 | % |
| | | | | | | | | | | | | | | | | | | | | | | | | | | | | | | | | |
| Selling, General and Administrative expenses | | $ | 22,805 | | | | | | | | 19,751 | | | | | | | | 15.5 | % | | | | | | | 11.0 | % | | | 9.7 | % |
| | | | | | | | | | | | | | | | | | | | | | | | | | | | | | | | | |
| | | | | | | | | | | | | | | | | | | | | | | | | | | | | | | | | |
| Operating Income (loss) by Segment | | | | | | | | | | | | | | | | | | | | | | | | | | Operating Income (Loss) Margin |
| | | | | | | | | | | | | | | | | | | | | | | | | | | | | | | | | |
| Mattress Fabrics | | $ | 15,474 | | | | | | | | 13,247 | | | | | | | | 16.8 | % | | | | | | | 13.5 | % | | | 11.5 | % |
| Upholstery Fabrics | | | 5,956 | | | | | | | | (1,503 | ) | | | | | | N.M. | | | | (2 | ) | | | 6.5 | % | | | (1.7 | ) % |
| Unallocated Corporate | | | (5,400 | ) | | | | | | | (3,225 | ) | | | | | | | 67.4 | % | | | | | | | (2.6 | ) % | | | (1.6 | ) % |
| Subtotal | | | 16,030 | | | | | | | | 8,519 | | | | | | | | 88.2 | % | | | | | | | 7.8 | % | | | 4.2 | % |
| | | | | | | | | | | | | | | | | | | | | | | | | | | | | | | | | |
| Restructuring credit (expense) and restructuring related charges | | | 312 | | | | (1 | ) | | | (13,089 | ) | | | (1 | ) | | N.M. | | | | (2 | ) | | | 0.2 | % | | | (6.4 | ) % |
| | | | | | | | | | | | | | | | | | | | | | | | | | | | | | | | | |
| Operating income (loss) | | $ | 16,342 | | | | | | | | (4,570 | ) | | | | | | N.M. | | | | (2 | ) | | | 7.9 | % | | | (2.2 | ) % |
| | | | | | | | | | | | | | | | | | | | | | | | | | | | | | | | | |
| | | | | | | | | | | | | | | | | | | | | | | | | | | | | | | | | |
| Depreciation by Segment | | | | | | | | | | | | | | | | | | | | | | | | | | | | | | | | |
| | | | | | | | | | | | | | | | | | | | | | | | | | | | | | | | | |
| Mattress Fabrics | | $ | 3,458 | | | | | | | | 3,542 | | | | | | | | (2.4 | ) % | | | | | | | | | | | | |
| Upholstery Fabrics | | | 552 | | | | | | | | 1,080 | | | | | | | | (48.9 | ) % | | | | | | | | | | | | |
| Subtotal | | | 4,010 | | | | | | | | 4,622 | | | | | | | | (13.2 | ) % | | | | | | | | | | | | |
| Accelerated Depreciation | | | - | | | | | | | | 2,090 | | | | | | | | (100.0 | ) % | | | | | | | | | | | | |
| Total Depreciation | | $ | 4,010 | | | | | | | | 6,712 | | | | | | | | (40.3 | ) % | | | | | | | | | | | | |
| | | | | | | | | | | | | | | | | | | | | | | | | | | | | | | | | |
| | | | | | | | | | | | | | | | | | | | | | | | | | | | | | | | | |
| Notes: | | | | | | | | | | | | | | | | | | | | | | | | | | | | | | | | |
| | | | | | | | | | | | | | | | | | | | | | | | | | | | | | | | | |
| (1) See restructuring and related (credits) charges section of Management's Discussion and Analysis for detailed explanation of charges and credits. | | |
| | | | | | | | | | | | | | | | | | | | | | | | | | | | | | | | | |
| (2) N.M. - Not Meaningful | | | | | | | | | | | | | | | | | | | | | | | | | | | | | | | | |
| | | | | | | | | | | | | | | | | | | | | | | | | | | | | | | | | |
| CULP, INC. |
| STATEMENTS OF OPERATIONS BY SEGMENT |
| FOR THE TWELVE MONTHS ENDED MAY 3, 2009 AND APRIL 27, 2008 |
| | | | | | | | | | | | | | | | | | | | | | | | | |
| | | | | | | | | | | | | | | | | | | | | | | | | |
| (Amounts in thousands) |
| | | | | | | | | | | | | | | | | | | | | | | | | |
| | | | | | | | | | | | | | | | | | | | | | | | | |
| | | YEARS ENDED |
| | | | | | | | | | | | | | | | | | | | | | | | | |
| | | Amounts | | | | | | | | | | | | Percent of Total Sales |
| | | May 3, | | | | | | April 27, | | | | | | % Over | | | | | | May 3, | | | April 27, | |
| Net Sales by Segment | | 2009 | | | | | | 2008 | | | | | | (Under) | | | | | | 2009 | | | 2008 | |
| | | | | | | | | | | | | | | | | | | | | | | | | |
| Mattress Fabrics | | $ | 115,396 | | | | | | | 138,064 | | | | | | | (16.4 | ) % | | | | | | 56.6 | % | | | 54.3 | % |
| Upholstery Fabrics | | | 88,542 | | | | | | | 115,982 | | | | | | | (23.7 | ) % | | | | | | 43.4 | % | | | 45.7 | % |
| | | | | | | | | | | | | | | | | | | | | | | | | | | | | | |
| Net Sales | | $ | 203,938 | | | | | | | 254,046 | | | | | | | (19.7 | ) % | | | | | | 100.0 | % | | | 100.0 | % |
| | | | | | | | | | | | | | | | | | | | | | | | | | | | | | |
| | | | | | | | | | | | | | | | | | | | | | | | | | | | | | |
| Gross Profit by Segment | | | | | | | | | | | | | | | | | | | | | | | Gross Profit Margin | |
| | | | | | | | | | | | | | | | | | | | | | | | | | | | | | |
| Mattress Fabrics | | $ | 20,996 | | | | | | | 22,576 | | | | | | | (7.0 | ) % | | | | | | 18.2 | % | | | 16.4 | % |
| Upholstery Fabrics | | | 7,253 | | | | | | | 12,829 | | | | | | | (43.5 | ) % | | | | | | 8.2 | % | | | 11.1 | % |
| Subtotal | | | 28,249 | | | | | | | 35,405 | | | | | | | (20.2 | ) % | | | | | | 13.9 | % | | | 13.9 | % |
| | | | | | | | | | | | | | | | | | | | | | | | | | | | | | |
| Loss on impairment of equipment | | | - | | | | | | | (289 | ) | | | (2 | ) | | | (100.0 | ) % | | | | | | 0.0 | % | | | (0.1 | ) % |
| Restructuring related charges | | | (3,597 | ) | | | (1 | ) | | | (1,957 | ) | | | (1 | ) | | | 83.8 | % | | | | | | (1.8 | ) % | | | (0.8 | ) % |
| | | | | | | | | | | | | | | | | | | | | | | | | | | | | | | | |
| Gross Profit | | $ | 24,652 | | | | | | | | 33,159 | | | | | | | | (25.7 | ) % | | | | | | 12.1 | % | | | 13.1 | % |
| | | | | | | | | | | | | | | | | | | | | | | | | | | | | | | | |
| | | | | | | | | | | | | | | | | | | | | | | | | | | | | | | | |
| Selling, General and Administrative expenses by Segment | | | | | | | | | | | | | | | | | | | | | | | | | Percent of Sales |
| | | | | | | | | | | | | | | | | | | | | | | | | | | | | | | | |
| Mattress Fabrics | | $ | 7,749 | | | | | | | | 8,457 | | | | | | | | (8.4 | ) % | | | | | | 6.7 | % | | | 6.1 | % |
| Upholstery Fabrics | | | 8,756 | | | | | | | | 11,650 | | | | | | | | (24.8 | ) % | | | | | | 9.9 | % | | | 10.0 | % |
| Unallocated Corporate | | | 3,225 | | | | | | | | 3,797 | | | | | | | | (15.1 | ) % | | | | | | 1.6 | % | | | 1.5 | % |
| Subtotal | | | 19,730 | | | | | | | | 23,904 | | | | | | | | (17.5 | ) % | | | | | | 9.7 | % | | | 9.4 | % |
| | | | | | | | | | | | | | | | | | | | | | | | | | | | | | | | |
| Restructuring related charges | | | 21 | | | | (1 | ) | | | 69 | | | | (1 | ) | | | (69.6 | ) % | | | | | | 0.0 | % | | | 0.0 | % |
| | | | | | | | | | | | | | | | | | | | | | | | | | | | | | | | |
| Selling, General and Administrative expenses | | $ | 19,751 | | | | | | | | 23,973 | | | | | | | | (17.6 | ) % | | | | | | 9.7 | % | | | 9.4 | % |
| | | | | | | | | | | | | | | | | | | | | | | | | | | | | | | | |
| | | | | | | | | | | | | | | | | | | | | | | | | | | | | | | | |
| Operating Income (loss) by Segment | | | | | | | | | | | | | | | | | | | | | | | | | Operating Income (Loss) Margin |
| | | | | | | | | | | | | | | | | | | | | | | | | | | | | | | | |
| Mattress Fabrics | | $ | 13,247 | | | | | | | | 14,118 | | | | | | | | (6.2 | ) % | | | | | | 11.5 | % | | | 10.2 | % |
| Upholstery Fabrics | | | (1,503 | ) | | | | | | | 1,180 | | | | | | | N.M. | | | | (3 | ) | | | (1.7 | ) % | | | 1.0 | % |
| Unallocated Corporate | | | (3,225 | ) | | | | | | | (3,797 | ) | | | | | | | (15.1 | ) % | | | | | | | (1.6 | ) % | | | (1.5 | ) % |
| Subtotal | | | 8,519 | | | | | | | | 11,501 | | | | | | | | (25.9 | ) % | | | | | | | 4.2 | % | | | 4.5 | % |
| | | | | | | | | | | | | | | | | | | | | | | | | | | | | | | | | |
| Loss on impairment of equipment | | | - | | | | | | | | (289 | ) | | | (2 | ) | | | (100.0 | ) % | | | | | | | 0.0 | % | | | (0.1 | ) % |
| Restructuring expense and restructuring related charges | | | (13,089 | ) | | | (1 | ) | | | (2,912 | ) | | | (1 | ) | | N.M. | | | | (3 | ) | | | (6.4 | ) % | | | (1.1 | ) % |
| | | | | | | | | | | | | | | | | | | | | | | | | | | | | | | | | |
| Operating (loss) income | | $ | (4,570 | ) | | | | | | | 8,300 | | | | | | | N.M. | | | | (3 | ) | | | (2.2 | ) % | | | 3.3 | % |
| | | | | | | | | | | | | | | | | | | | | | | | | | | | | | | | | |
| | | | | | | | | | | | | | | | | | | | | | | | | | | | | | | | | |
| Depreciation by Segment | | | | | | | | | | | | | | | | | | | | | | | | | | | | | | | | |
| | | | | | | | | | | | | | | | | | | | | | | | | | | | | | | | | |
| Mattress Fabrics | | $ | 3,542 | | | | | | | | 3,443 | | | | | | | | 2.9 | % | | | | | | | | | | | | |
| Upholstery Fabrics | | | 1,080 | | | | | | | | 2,105 | | | | | | | | (48.7 | ) % | | | | | | | | | | | | |
| Subtotal | | | 4,622 | | | | | | | | 5,548 | | | | | | | | (16.7 | ) % | | | | | | | | | | | | |
| Accelerated Depreciation | | | 2,090 | | | | | | | | - | | | | | | | | 100.0 | % | | | | | | | | | | | | |
| Total Depreciation | | $ | 6,712 | | | | | | | | 5,548 | | | | | | | | 21.0 | % | | | | | | | | | | | | |
| | | | | | | | | | | | | | | | | | | | | | | | | | | | | | | | | |
| | | | | | | | | | | | | | | | | | | | | | | | | | | | | | | | | |
| Notes: | | | | | | | | | | | | | | | | | | | | | | | | | | | | | | | | |
| | | | | | | | | | | | | | | | | | | | | | | | | | | | | | | | | |
(1) See restructuring and related charges (credits) section of Management's Discussion and Analysis for detailed explanation of charges and credits. | | |
| | | | | | | | | | | | | | | | | | | | | | | | | | | | | | |
(2) The $289 represents an impairment loss on older and existing equipment that is being replaced by newer and more efficient equipment. This impairment loss pertains to the mattress fabrics segment. |
| | | | | | |
| (3) N.M. - Not Meaningful | | | | | | | | | | | | | | | | | | | | | | | | | | | | | | | | |
| | | | | | | | | | | | | | | | | | | | | | | | | | | | | | | | | |
2010 compared with 2009
Segment Analysis
Mattress Fabrics Segment
Net Sales
For fiscal 2010, the mattress fabrics segment reported net sales of $114.8 million compared with $115.4 million for fiscal 2009. In contrast to the small year over year decline, mattress fabric net sales increased 26% in the fourth quarter of fiscal 2010 compared with the fourth quarter of fiscal 2009. This increase in the fourth quarter reflects significant improvement in consumer demand in the bedding industry in early calendar 2010 and the closure of a key competitor in late calendar 2009.
Gross Profit and Operating Income
The mattress fabrics segment reported gross profit of $23.7 million in fiscal 2010 compared with $21.0 million for fiscal 2009. The mattress fabrics segment reported operating income of $15.5 million in fiscal 2010 compared with $13.2 million in fiscal 2009. Despite net sales remaining relatively the same in fiscal 2010 compared with 2009, gross profit margins increased to 20.6% in fiscal 2010 compared with 18.2% in fiscal 2009. Also, operating income margins increased to 13.5% in fiscal 2010 compared with 11.5% in fiscal 2009.
Our improved performance in our mattress fabric segment reflects the benefits of the ongoing investments we have made to develop an efficient and scalable manufacturing platform. These investments include the Bodet & Horst acquisition made in August 2008. In addition, we also benefited from other operational initiatives. During the fourth quarter of fiscal 2010, we completed the installation of state-of-the-art finishing equipment for our growing knit fabric business. This initiative represents the final step in our strategy to become fully vertical in our manufacturing platform for the knit fabrics product category and will complement our fully vertical manufacturing platform for woven fabrics. Benefits from this initiative include faster response time, quality enhancements, fabric innovation opportunities, and lower costs. We are also in the process of further expanding our capacity for both knit and woven product lines, as well as completing an energy initiative in our Canadian operation that will have an environmental benefit and reduce future operating costs. Capital expenditures for our mattress fabric business totaled $6.6 million in fiscal 2010, reflecting our continued commitment to the bedding industry. We plan to continue our significant level of capital spending in fiscal 2011 in order to modernize and expand our woven and knit capacities.
Our improved operating performance in fiscal 2010 also reflects lower raw material prices obtained from our global sourcing strategy. Although we are pleased with our performance in fiscal 2010, we are currently facing significant pricing pressures and higher raw material costs.
Selling, general, and administrative expenses were $8.2 million, or 7.1% of net sales, in fiscal 2010 compared with $7.7 million, or 6.7% of net sales, in fiscal 2009.
Segment Assets
Segment assets consist of accounts receivable, inventory, assets held for sale, non-compete agreements associated with certain acquisitions, goodwill, and property, plant and equipment. As of May 2, 2010, accounts receivable and inventory totaled $22.3 million, compared to $21.8 million at May 3, 2009. This change reflects the net sales increase in the fourth quarter of fiscal 2010 noted above.
At May 2, 2010, and May 3, 2009, this segment had assets held for sale with carrying values totaling $34,000 and $20,000, respectively. During the fourth quarter of fiscal 2010, equipment with a carrying value of $59,000 was classified as held for sale. We determined that the carrying value of this equipment exceeded its fair value (based on quoted market prices). Consequently, we recorded an impairment loss of $25,000 in cost of sales in the 2010 Consolidated Statement of Operations. The remaining carrying value of $34,000 is expected to be sold in fiscal 2011. This segment reported equipment with a carrying value of $20,000 as held for sale at May 3, 2009. This equipment was sold for $20,000 during fiscal 2010.
At May 2, 2010, and May 3, 2009, the carrying value of our non-compete agreements were $843,000 and $1.2 million, respectively. At May 2, 2010, and May 3, 2009 the carrying value of the segment’s goodwill was $11.5 million and $11.6 million, respectively. During the first quarter of fiscal 2010, we finalized our valuation of the fair values for the assets acquired and liabilities assumed for the Bodet & Horst acquisition. As a result of this final valuation, we recorded an adjustment to increase the fair value of the associated non-compete agreement and reduce the fair value of goodwill by $131,000.
At May 2, 2010, and May 3, 2009, property, plant and equipment totaled $26.7 million and $23.7 million, respectively. The $26.7 million represents property, plant, and equipment located in the U.S. of $18.8 million and located in Canada of $7.9 million. The $23.7 million balance at May 3, 2009, represents property, plant, and equipment located in the U.S. of $16.4 million and located in Canada of $7.3 million. The increase in this segment’s property, plant, and equipment balance at May 2, 2010, compared with May 3, 2009, is primarily due to fiscal 2010 capital spending of $6.6 million, offset by depreciation expense of $3.5 million.
Upholstery Fabrics Segment
Net Sales
Upholstery fabric net sales (which include both fabric and cut and sewn kits) were $91.6 million in fiscal 2010, compared with $88.5 million in fiscal 2009, an increase of 3.4%. This increase represents the first annual sales gain for the upholstery fabric segment in ten fiscal years. In addition, upholstery fabric net sales increased 13% in the fourth quarter of fiscal 2010 compared with the fourth quarter of fiscal 2009. As noted below, the increase in net sales reflects our focus this fiscal year on product development, sales and marketing initiatives, delivery performance, and aggressively defending our copyrights. In addition, fiscal 2010 net sales were affected by the planned discontinuation of certain U.S. products as part of our profit improvement plan implemented in fiscal 2009, and a significant increase in the provision for returns, allowances, and discounts.
Net sales of upholstery fabrics produced outside our U.S. manufacturing operations were $77.3 million in fiscal 2010, an increase of 14% from $68.1 million in fiscal 2009. Net sales produced outside our U.S. manufacturing operations represented 84% of total upholstery fabric net sales in fiscal 2010 compared with 77% in fiscal 2009. Net sales of U.S. produced upholstery fabrics were $14.3 million in fiscal 2010, a decrease of 30% from $20.4 million in fiscal 2009. This continued shift toward production outside our U.S. manufacturing operations is the result of our long-term strategy to build a wholly-owned and low-cost business located in China that is scalable, and not capital intensive.
Gross Profit and Operating Income (Loss)
The upholstery fabrics segment reported gross profit of $15.2 million in fiscal 2010 compared with $7.3 million for fiscal 2009. This significant improvement in gross profit led to operating income of $6.0 million in fiscal 2010 compared with an operating loss of $1.5 million in fiscal 2009, representing a $7.5 million turnaround.
The substantial improvement in the upholstery fabric segment’s gross profit and operating income reflects the increase in net sales noted above and the incremental benefits of our restructuring activities and the profit improvement plan completed in fiscal 2009 (see 2009 vs. 2008 comparison for details of the profit improvement plan). We are realizing the benefits of our long-term strategy to build a wholly-owned and low-cost business located in China that is scalable, but not capital intensive. Additionally, we are beginning to benefit from a complimentary strategy to grow business in our one remaining U.S. upholstery facility, based upon a model of utilizing China sourced yarns, low overhead and a focused, volume oriented product strategy. Also, the favorable results of our restructuring activities and profit improvement plan allowed us to shift our focus in fiscal 2010 to product development, sales and marketing initiatives, and delivery performance. Lastly, we began efforts to aggressively defending our design copyrights and have taken action to protect our creativity, and we believe these efforts are helping us retain and grow sales of certain upholstery fabrics.
Although we are pleased with our performance in fiscal 2010, we are currently facing significant pricing pressures and higher raw material costs.
Selling, general, and administrative expenses were $9.2 million, or 10.1% of net sales, in fiscal 2010 compared with $8.8 million, or 9.9% of net sales, in fiscal 2009.
Segment Assets
Segment assets consist of accounts receivable, inventory, property, plant and equipment, and assets held for sale. As of May 2, 2010, accounts receivable and inventory totaled $23.5 million, compared to $20.3 million at May 3, 2009. This change reflects the net sales increase in the fourth quarter of fiscal 2010 noted above.
At May 2, 2010, the upholstery fabrics segment had property, plant, and equipment totaling $989,000. This $989,000 represents property, plant, and equipment located in the U.S. and China of $887,000 and $102,000, respectively. During the second quarter of fiscal 2010, assets with a carrying value of $699,000 were reclassified from held for sale (see below paragraph). As of May 3, 2009, the upholstery fabrics segment reported no carrying value associated with its property, plant, and equipment due to impairment charges incurred in fiscal 2009 (see restructuring section below) and the classification of property, plant, and equipment as assets held for sale.
At May 2, 2010 and May 3, 2009, this segment had assets held for sale with a carrying value of $89,000 and $1.2 million, respectively. Due to the favorable results from our profit improvement plan and restructuring activities initiated in the second quarter of fiscal 2009, management assessed the classification of upholstery fabric assets classified as held for sale during the second quarter of fiscal 2010. As a result of this assessment, upholstery fabric assets with a carrying value of $699,000 were reclassified from assets held for sale to held and used (included in property, plant, and equipment on the May 2, 2010 Consolidated Balance Sheet). This carrying value of $699,000 represents these assets’ carrying amount before being classified as held for sale (the third quarter of fiscal 2009) adjusted for depreciation expense that would have been recognized had these assets been classified as held and used, which is lower than these assets’ fair value at the date they were reclassified to held and used (during the second quarter of fiscal 2010). Consequently we recorded a charge totaling $178,000 in the second quarter of fiscal 2010 to depreciation expense in the 2010 Consolidated Statement of Operations.
We expect the remaining carrying amount of $89,000 to be sold by the end of fiscal 2011. We determined that the carrying value of $89,000 did not exceed its fair value. As a result, an impairment charge was not recorded in fiscal 2010. During fiscal 2010, we received sales proceeds of $241,000 on assets classified as held for sale.
Restructuring and Related Charges (Credits)
During fiscal 2010, we recorded a restructuring and related credit of $312,000, of which a credit of $186,000 was for employee termination benefits, a credit of $170,000 was for sales proceeds received on equipment with no carrying value, a credit of $50,000 was for inventory markdowns, a credit of $14,000 was for lease termination and other exit costs, offset by a charge of $108,000 for other operating costs associated with closed plant facilities. Of this total credit, a charge of $58,000 was recorded to cost of sales and a credit of $370,000 was recorded to restructuring credit in the 2010 Consolidated Statement of Operations.
During fiscal 2009, total restructuring and related charges incurred were $13.1 million, of which $8.0 million was for write-downs of equipment and buildings, $3.5 million for inventory markdowns, $786,000 for employee termination benefits, $728,000 for lease termination and other exit costs, and $140,000 for other operating costs associated with closed plant facilities. Of these total charges, $3.6 million was recorded in cost of sales, $21,000 was recorded in selling, general, and administrative expenses, and $9.5 million was recorded in restructuring expense in the 2009 Consolidated Statement of Operations. Of these total charges, $11.5 million and $1.6 million represent non-cash and cash charges, respectively.
A detailed explanation of each of our significant restructuring plans for fiscal 2010 and 2009 is presented below.
September 2008 – Upholstery Fabrics
On September 3, 2008, our board of directors approved changes to the upholstery fabric operations, including the consolidation of plant facilities in China and the reduction of excess manufacturing capacity. These actions were in response to the extremely challenging industry conditions for upholstery fabrics. The plant closings associated with this restructuring plan have been completed.
During fiscal 2010, a restructuring credit of $101,000 was recorded for lease termination and other exit costs. This $101,000 credit was recorded to restructuring credit in the 2010 Consolidated Statement of Operations.
During fiscal 2009, restructuring and related charges totaled $9.6 million, of which $6.6 million related to impairment charges on equipment and leasehold improvements, $2.1 million for accelerated depreciation, $502,000 for inventory markdowns, $443,000 for lease termination and other exit costs, $25,000 for other operating costs associated with closed plant facilities, and $10,000 for employee termination benefits. The $2.1 million accelerated depreciation charge represents the incremental depreciation expense to reflect revised depreciation estimates and useful lives for certain fixed assets that were to be used over a shortened useful life from the period the restructuring plan was announced until the respective plant facility was closed and operations ceased. Of this total charge, $7.0 million and $2.6 million were recorded in restructuring expense and cost of sales, respectively, in the 2009 Consolidated Statement of Operations.
December 2006-Upholstery Fabrics
On December 12, 2006, our board of directors approved a restructuring plan within the upholstery fabrics segment to consolidate the company’s U.S. upholstery fabrics manufacturing facilities and outsource its specialty yarn production. This process involved closing the company’s weaving plant located in Graham, North Carolina, and closing the yarn plant located in Lincolnton, North Carolina. We transferred certain production from the Graham plant to our Anderson, South Carolina and Shanghai, China plant facilities as well as a small portion to contract weavers.
During fiscal 2010, we recorded a restructuring credit of $389,000. The $389,000 represents a credit of $186,000 for employee termination benefits, a credit of $170,000 for sales proceeds received for equipment with no carrying value, a credit of $50,000 for inventory markdowns, offset by a charge of $13,000 for lease termination and other exit costs, and a charge of $4,000 for other operating costs associated with closed plant facilities. Of this $389,000 restructuring credit, a credit of $343,000 was recorded in restructuring credit and a credit of $46,000 was recorded in cost of sales in the 2010 Consolidated Statement of Operations.
During fiscal 2009, we further assessed the net realizable value of our inventory, recoverability of our property, plant, and equipment, and selling, general, and administrative expenses based on demand trends related to our U.S. upholstery fabric operations. This assessment was required based on the adverse economic conditions resulting from the depressed housing market, credit crisis, and decreased consumer spending that developed in the second quarter of fiscal 2009, and which was more severe than we anticipated at the end of fiscal 2008. As a result, restructuring and related charges incurred were $3.5 million, of which $1.4 million related to impairment charges on a building and equipment, $886,000 related to inventory markdowns, $798,000 related to employee termination benefits, $271,000 related to lease termination and other exit costs, and $116,000 related to other operating costs associated with closed plant facilities. Of this total charge, $2.5 million was recorded in restructuring expense, $980,000 was recorded in cost of sales, and $21,000 was recorded in selling, general, and administrative expenses in the 2009 Consolidated Statement of Operations.
Long-Lived Asset Impairments
During fiscal 2010, we did not incur any impairment charges regarding our upholstery fabric property, plant, and equipment.
During fiscal 2009, we incurred impairment charges on property, plant, and equipment in connection with our restructuring activities. These impairment charges totaled $8.0 million and were recorded in restructuring expense in the 2009 Consolidated Statement of Operations. This $8.0 million impairment charge includes $2.2 million for fixed assets that were abandoned in connection with the consolidation of certain plant facilities in China and $774,000 to reflect the $4.0 million selling price of the company’s corporate headquarters. Also, during the course of the company’s strategic review in the second quarter of fiscal 2009 of its upholstery fabrics business, we assessed the recoverability of the carrying value of our upholstery fabric fixed assets that were being held and used in operations. This strategic review resulted in impairment losses of $4.4 million and $543,000 for fixed assets located in China and the U.S., respectively. In addition, we incurred impairment losses totaling $115,000 for assets held for sale associated with its U.S upholstery fabric operations. These losses reflect the amounts by which the carrying values of these fixed assets exceeded their estimated fair values determined by their estimated future discounted cash flows and quoted market prices.
Management remains cautiously optimistic about the company’s long-term prospects in the upholstery fabrics business, especially in light of much improved financial performance of this segment. While the recent improvements in this business are favorable indicators, we remain committed to taking additional steps if necessary to maintain the profitability of the company’s upholstery fabrics operations, regardless of prevailing economic and business conditions. We could experience additional inventory markdowns and further restructuring charges in the upholstery fabric operations if current favorable trends in profitability do not continue.
Other Income Statement Categories
Selling, General and Administrative Expenses – Selling, general, and administrative expenses (SG&A) for the company as a whole were $22.8 million, or 11% of net sales, for fiscal 2010 compared with $19.8 million, or 9.7% of net sales, for fiscal 2009, an increase of 15.5%. This increase in SG&A expenses primarily pertains to an increase in stock-based compensation expense reflecting an increase in the company’s stock price and an increase in incentive compensation expense as a result of significantly improved financial performance.
Interest Expense (Income) -- Interest expense for fiscal 2010 decreased to $1.3 million from $2.4 million in fiscal 2009. This trend reflects lower outstanding balances on our long-term debt. Interest income for fiscal 2010 increased to $116,000 from $89,000 in fiscal 2009. This increase reflects our higher cash and short-term investment balances in fiscal 2010 compared with 2009.
Other Expense – Other expense for fiscal 2010 was $828,000 compared with $43,000 in fiscal 2009. This change primarily reflects fluctuations in foreign currency exchange rates for our subsidiary domiciled in Canada. As a result of the our increased cash and short-term investment position in fiscal 2010, we are currently trying to maintain a natural hedge by keeping an equal balance of our assets and liabilities denominated in Canadian dollars. We expect other expense to decrease in fiscal 2011 if we are able to maintain this natural hedge.
Income Taxes
Significant judgment is required in determining the provision for income taxes. During the ordinary course of business, there are many transactions and calculations for which the ultimate tax determination is uncertain. We account for income taxes using the asset and liability approach as prescribed by ASC Topic 740, “Income Taxes.” This approach requires recognition of deferred tax assets and liabilities for the expected future tax consequences of events that have been included in the consolidated financial statements or income tax returns. Using the enacted tax rates in effect for the fiscal year in which differences are expected to reverse, deferred tax assets and liabilities are determined based on the differences between financial reporting and tax basis of an asset or liability. If a change in the effective tax rate to be applied to a timing difference is determined to be appropriate, it will affect the provision for income taxes during the period that the determination is made.
Effective Income Tax Rate
We recorded income tax expense of $1.1 million, or 7.9% of income before income tax expense, in fiscal 2010 compared to income tax expense of $32.0 million, or 464.3% of loss before income tax expense in fiscal 2009. Income tax expense for fiscal 2010 is different from the amount obtained by applying our statutory rate of 34% to income before income taxes for the following reasons:
| · | The income tax rate decreased 33% for the reduction in the valuation allowance recorded against substantially all of our net deferred tax assets associated with our U.S. and China operations. This reduction in our valuation allowance is primarily due to U.S. taxable income generated by the repatriation of undistributed earnings from our subsidiaries located in China and the resulting usage of U.S. net operating loss carryforwards. Also, this reduction pertains to the realization on and projected realization of deferred tax assets created from tax versus book depreciation associated with the company’s China operations. |
| · | The income tax rate decreased 12% for the tax effects of foreign exchange losses on U.S. denominated account balances in which income taxes are paid in Canadian dollars. In fiscal 2009, the income tax rate increased 26% for the tax effects of foreign exchange gains on U.S. denominated account balances in which income taxes are paid in Canadian dollars. In fiscal 2010 and 2009, the Canadian foreign exchange rate in relation to the U.S. dollar was very volatile due to changes in oil prices and global economic conditions. |
| · | The income tax rate decreased 6% for taxable income subject to lower statutory income rates in foreign jurisdictions (Canada and China) compared with the statutory income tax rate of 34% for the United States. |
| · | The income tax rate increased 12% for the recording of a deferred tax liability for estimated U.S. income taxes that were paid upon repatriation of undistributed earnings from the company’s subsidiaries located in China. |
| · | The income tax rate increased 10% for an increase in unrecognized tax benefits. |
| · | The income tax rate increased 3% for non-deductible stock-based compensation expense and other miscellaneous items. |
The income tax benefit for fiscal 2009 is different from the amount obtained by applying our statutory rate of 34% to loss before income taxes for the following reasons:
| · | The income tax rate increased 395% for a $27.2 million non-cash charge for the establishment of a valuation allowance against substantially all of the company’s net deferred tax assets. |
| · | The income tax rate increased 50% for an increase in unrecognized tax benefits. |
| · | The income tax rate increased 26% for the tax effects of foreign exchange gains on U.S. denominated account balances in which income taxes are paid in Canadian dollars. In fiscal 2009, the Canadian foreign exchange rate in relation to the U.S. dollar was very volatile due to changes in oil prices and global economic conditions. |
| · | The income tax rate increased 23% for the recording of a deferred tax liability for estimated U.S. income taxes that were paid upon repatriation of undistributed earnings from the company’s subsidiaries located in China. |
| · | The income tax rate increased 4% for non-deductible stock-based compensation expense and other miscellaneous items. |
Deferred Income Taxes
In accordance with ASC Topic 740, we evaluate our deferred income taxes to determine if a valuation allowance is required. ASC Topic 740 requires that companies assess whether a valuation allowance should be established based on the consideration of all available evidence using a “more likely than not” standard with significant weight being given to evidence that can be objectively verified. Since the company operates in multiple jurisdictions, we assess the need for a valuation allowance on a jurisdiction-by-jurisdiction basis, taking into account the effects of local tax law. Based on this assessment, we recorded a valuation allowance of $22.6 million at May 2, 2010. This valuation allowance of $22.6 million consists of a full valuation allowance of $21.3 million against our net deferred assets associated with our U.S. operations and a partial valuation allowance of $1.3 million against our net deferred tax assets associated with our China operations.
Our net deferred tax asset regarding our U.S. operations primarily resulted from the recording of the income tax benefit of U.S. income tax loss carryforwards over the last several fiscal years, which totaled $64.0 million at May 2, 2010. The cumulative U.S. pre-tax losses incurred over the last several fiscal years, the significant uncertainty in current and expected demand for furniture and mattresses, and the prevailing uncertainty in the overall economic climate, have made it very difficult to forecast our financial results associated with our U.S. operations. Based on this significant negative evidence, we maintain our position that it is more-likely-than-not that the U.S. net deferred tax assets will not be fully recovered. Consequently, we recorded a full allowance of $21.3 million against our U.S. net deferred tax assets.
Our net deferred tax asset regarding our China operations primarily pertains to the book versus tax basis difference associated with our China operations’ fixed assets. This book versus tax basis difference resulted from our impairment losses and fixed asset write-downs associated with our September 2008 Upholstery Fabrics restructuring plan (see note 3). In order for this net deferred tax asset to be realized, our China operations must have sufficient pre-tax income levels to utilize tax depreciation expense each of the next four fiscal years. Due to the favorable results from our restructuring activities and profit improvement plan initiated in the second quarter of fiscal 2009, our China operations have been restored to profitability, reporting pre-tax income of $7.9 million in fiscal 2010. Although our China operations reported pre-tax income of $7.9 million in fiscal 2010, on a cumulative basis over the last three fiscal years, our China operations have substantially performed on a break-even basis (achieved in the fourth quarter of fiscal 2010). The significant uncertainty in current and expected demand for furniture, and the prevailing uncertainty in the overall economic climate, has made it very difficult to forecast medium and long-term financial results associated with our China operations. Based on the current economic conditions, we believe it is too uncertain to project pre-tax income associated with our China operations after fiscal 2011. Based on this significant positive and negative evidence, we recorded a partial valuation allowance of $1.3 million against net deferred tax assets associated with our China operations for tax versus book depreciation that is expected to reverse beyond fiscal 2011 and we recognized an income tax benefit of $334,000 in fiscal 2010 for the reduction in this valuation allowance for the tax versus book depreciation that is projected to reverse in fiscal 2011.
Due to cumulative losses associated with our operations in the U.S. and China, we established a full valuation allowance against our U.S. and China net deferred taxes totaling $27.2 million in fiscal 2009. Of this $27.2 million valuation allowance, $25.3 million and $1.9 million pertained to our U.S. and China operations, respectively. In fiscal 2010, we recorded an income tax benefit of $4.6 million for the reduction of this valuation allowance. This $4.6 million decrease results from the realization of loss carryforwards associated with the company’s U.S. operations and the realization and projected realization of tax versus book depreciation associated with the company’s China operations, as discussed above.
The recorded valuation allowance of $22.6 million has no effect on our operations, loan covenant compliance, or the possible realization of the U.S. income tax loss carryforwards in the future. If it is determined that it is more-likely-than-not that we will realize any of these U.S. income tax loss carryforwards, an income tax benefit would be recognized at that time.
At May 2, 2010, the current deferred tax asset of $150,000 represents $84,000 and $66,000 from our operations located in Canada and China, respectively. At May 2, 2010, the non-current deferred tax asset of $324,000 pertains to our operations located in China. At May 2, 2010, the non-current deferred tax liability of $982,000 pertains to our operations located in Canada.
At May 3, 2009, the current deferred tax asset of $54,000 and the non-current deferred tax liability of $974,000 pertained to our operations located in Canada.
Income tax payments, net of income tax refunds, were $1.3 million in 2010, $69,000 in 2009, and $360,000 in 2008.
See Notes 1 and 11 in the Notes to the Consolidated Financial Statements for further details.
2009 compared with 2008
Segment Analysis
Mattress Fabrics Segment
Net Sales
For fiscal 2009, the mattress fabrics segment reported net sales of $115.4 million compared with $138.1 million for fiscal 2008, a decrease of 16%. These trends reflected unprecedented weak consumer demand in the bedding industry and the planned discontinuance during fiscal 2009 of certain products.
Gross Profit and Operating Income
The mattress fabrics segment reported gross profit of $21.0 million in fiscal 2009 compared with $22.6 million for fiscal 2008. This segment reported operating income of $13.2 million in fiscal 2009 compared with $14.1 million in fiscal 2008. Despite the significant decline in net sales, gross profit margins increased to 18.2% in fiscal 2009 compared with 16.4% in fiscal 2008. Also, operating income margins increased to 11.5% in fiscal 2009 compared with 10.2% in fiscal 2008.
During fiscal 2009 the company took major actions to respond to the decrease in net sales. We completed a $5.0 million capital project to significantly strengthen our woven fabrics manufacturing operations and provide further reactive capacity to our customers. In addition, the acquisition of the knitted mattress fabrics operation of Bodet & Horst was successfully integrated into our operations.
Selling, general, and administrative expenses were $7.7 million, or 6.7% of net sales, in fiscal 2009 compared with $8.5 million, or 6.1% of net sales, in fiscal 2008. This trend primarily reflected declining business volumes in fiscal 2009 compared with fiscal 2008.
Segment Assets
Segment assets consist of accounts receivable, inventory, assets held for sale, non-compete agreements associated with certain acquisitions, goodwill, and property, plant and equipment. As of May 3, 2009, accounts receivable and inventory totaled $21.8 million, compared to $27.6 million at April 27, 2008. This decrease was primarily due to lower sales volume in fiscal 2009 compared with fiscal 2008 and improved working capital management.
At May 3, 2009 and April 27, 2008, this segment had assets held for sale with carrying values totaling $20,000 and $35,000, respectively. Effective January 2, 2008, we adopted a plan to sell certain older equipment related to the mattress fabrics segment that was being replaced by newer and more efficient equipment. In connection with the plan of disposal, we determined that the carrying value of this equipment was $513,000, which exceeded its fair value of $224,000. Consequently, we recorded an impairment loss of $289,000 in fiscal 2008. This impairment loss of $289,000 was recorded in cost of sales in the 2008 Consolidated Statement of Operations. We received sales proceeds totaling $189,000 in fiscal 2008. In fiscal 2009, an impairment loss of $15,000 was recorded as the company determined that the fair value of the remaining equipment classified as held for sale exceeded its fair value.
At May 3, 2009 and April 27, 2008, the carrying value of our non-compete agreements were $1.2 million and $789,000, respectively. At May 3, 2009 and April 27, 2008, the carrying value of the segment’s goodwill was $11.6 million and $4.1 million, respectively. The increase in the carrying value of the non-compete agreements and goodwill pertains to the Bodet & Horst acquisition.
At May 3, 2009 and April 27, 2008, property, plant and equipment totaled $23.7 million and $21.7 million, respectively. This increase primarily reflects the completion of a $5.0 million capital project and property, plant, and equipment purchased in connection with the Bodet & Horst acquisition, offset by depreciation expense of $3.5 million in fiscal 2009. The $23.7 million balance at May 3, 2009, represents property, plant, and equipment located in the U.S. of $16.4 million and located in Canada of $7.3 million. The $21.7 million balance at April 27, 2008 represents property, plant, and equipment located in the U.S. of $13.1 million, located in Canada of $8.4 million, and corporate allocations of $168,000.
Bodet & Horst Asset Acquisition
Pursuant to an Asset Purchase Agreement among the company, Bodet & Horst USA, LP and Bodet & Horst GMBH & Co. KG (collectively “Bodet & Horst”) dated August 11, 2008, we purchased certain assets and assumed certain liabilities of the knitted mattress fabric operation of Bodet & Horst, including its manufacturing operation in High Point, North Carolina. This purchase allowed us to have a vertically integrated manufacturing platform in all major product categories of the mattress fabrics industry. The purchase involved the equipment, inventory, and intellectual property associated with the High Point manufacturing operation, which had served as our primary source of knitted mattress fabric prior to the acquisition. Demand for this product line has grown significantly, as knits are increasingly being utilized on mattresses at volume retail price points. The purchase price for the assets was cash in the amount of $11.4 million, which included an adjustment of $477,000 for changes in working capital as defined in the asset purchase agreement, and the assumption of certain liabilities. Also, in connection with the purchase, we entered into a six-year consulting and non-compete agreement with the principal owner of Bodet & Horst, providing for payments to the owner in the amount of $75,000 per year to be paid in quarterly installments (of which $50,000 and $25,000 will be allocated to the non-compete covenant and consulting fees, respectively) for the agreement’s full six-year term.
The acquisition was financed by $11.0 million of unsecured notes pursuant to a Note Purchase Agreement dated August 11, 2008. This agreement is described more fully in Note 12 in the Notes to the Consolidated Financial Statements.
In connection with the asset purchase agreement, we assumed the lease of the building where the operation is located. This lease is with a partnership owned by certain shareholders and officers of the company and their immediate families. This lease is described more fully in Note 14 in the Notes to the Consolidated Financial Statements.
During the first quarter of fiscal 2010, we finalized our valuation of the fair values for the assets acquired and liabilities assumed regarding this purchase. As a result of this final valuation, we recorded an adjustment to increase the fair value of the non-compete agreement and reduce the fair value of the goodwill by $131,000. The following table presents the final allocation of the acquisition cost, including professional fees and other related acquisition costs, to the assets acquired and liabilities assumed based on their fair values.
| (dollars in thousands) | | Fair Value | |
| Inventories | | $ | 1,439 | |
| Other current assets | | | 17 | |
| Property, plant, and equipment | | | 3,000 | |
| Non-compete agreement | | | 887 | |
| Goodwill | | | 7,348 | |
| Accounts payable | | | (1,291 | ) |
| | | $ | 11,400 | |
Of the total consideration paid of $11,400, $11,365 and $35 were paid in fiscal 2009 and 2008, respectively.
We recorded a non-compete agreement at its fair value based on various valuation techniques. This non-compete agreement will be amortized on a straight-line basis over the six-year life of the agreement. Property, plant, and equipment will be depreciated on a straight-line basis over useful lives ranging from five to fifteen years. Goodwill is deductible for income tax purposes over the statutory period of fifteen years.
The following unaudited pro forma consolidated results of operations for the years ending May 3, 2009 and April 27, 2008 have been prepared as if the acquisition of Bodet & Horst had occurred at April 30, 2007.
| | | | | | | |
| | | Years ended | |
| (dollars in thousands, except per share data) | | May 3, 2009 | | | April 27, 2008 | |
| Net Sales | | $ | 203,938 | | | $ | 254,046 | |
| | | | | | | | | |
| (Loss) income from operations | | | (3,625 | ) | | | 11,703 | |
| | | | | | | | | |
| Net (loss) income | | | (38,388 | ) | | | 6,968 | |
| | | | | | | | | |
| Net (loss) income per share, basic | | | (3.03 | ) | | | 0.55 | |
| | | | | | | | | |
| Net (loss) income per share, diluted | | | (3.03 | ) | | | 0.55 | |
| | | | | | | | | |
The unaudited pro forma information is presented for informational purposes only and is not necessarily indicative of the results of operations that actually would have been achieved had the acquisition been consummated as of that time, nor is it intended to be a projection of future results.
Upholstery Fabrics Segment
Net Sales
Upholstery fabric net sales (which include both fabric and cut and sewn kits) were $88.5 million in fiscal 2009 compared with $115.9 million in fiscal 2008, a decrease of 24%. Net sales of upholstery fabrics produced outside the company’s U.S. manufacturing operations were $68.1 million in fiscal 2009, a decrease of 10% from $75.9 million in fiscal 2008. Net sales of U.S. produced upholstery fabrics were $20.4 million in fiscal 2009, a decrease of 49% from $40.0 million in fiscal 2008. Upholstery fabric sales reflected worsening soft demand industry wide, as well as worsening demand for U.S. produced upholstery fabrics driven by consumer preference for leather and suede furniture and other imported furniture and fabrics.
Gross Profit and Operating (Loss) Income
The upholstery fabrics segment reported gross profit of $7.3 million in fiscal 2009 compared with $12.8 million for fiscal 2008. The upholstery fabrics segment reported an operating loss for fiscal 2009 of $1.5 million compared with operating income of $1.2 million in fiscal 2008.
In response to declines in net sales and operating profits, the company took the following major actions as part of the profit improvement plan initiated during the second quarter of fiscal 2009:
| · | Consolidated our China operations into fewer facilities and reduced excess manufacturing capacity. (See Restructuring and Related Charges section for further details). |
| · | Significantly reduced the cost structure of our U.S. velvet operations located in Anderson, SC. |
| · | Implemented a modest price increase on certain upholstery fabrics; and wherever possible, obtained price concessions from suppliers on certain high volume items where we could not increase our selling prices |
| · | Continued focus on improved inventory management. Inventory was $9.1 million at May 3, 2009, a decrease of 56% from $20.8 million at April 27, 2008. |
Segment Assets
Segment assets consist of accounts receivable, inventory, property, plant and equipment, and assets held for sale. As of May 3, 2009, accounts receivable and inventory totaled $20.3 million, compared to $34.9 million at April 27, 2008. This decline reflected lower sales and improved working capital management. At May 3, 2009, the upholstery fabrics reported no carrying value associated with property, plant and equipment. Property, plant, and equipment totaled $11.2 million at April 27, 2008. The $11.2 million balance at April 27, 2008, represents property, plant, and equipment located in China of $9.0 million, located in the U.S. of $1.7 million, and corporate allocations of $501,000. This decline reflected restructuring charges of $8.0 million for fixed asset impairments (see restructuring and related charges section for more details), $2.1 million related to accelerated depreciation in connection with the consolidation of plant facilities in China, and reclassifications of property, plant, and equipment to assets held for sale.
At May 3, 2009 and April 27, 2008, this segment had assets held for sale with a carrying value of $1.2 million and $792,000, respectively. Assets held for sale represent buildings and equipment associated with our U.S. upholstery fabric operations. The company determined that the carrying values of some of the underlying assets exceeded their fair values. Consequently, the company recorded an impairment charge totaling $115,000 and $20,000 in restructuring expense in the 2009 and 2008 Consolidated Statement of Operations, respectively.
Restructuring and Related Charges (Credits)
During fiscal 2009, total restructuring and related charges incurred were $13.1 million, of which $8.0 million was for write-downs of equipment and buildings, $3.5 million for inventory markdowns, $786,000 for employee termination benefits, $728,000 for lease termination and other exit costs, and $140,000 for other operating costs associated with closed plant facilities. Of these total charges, $3.6 million was recorded in cost of sales, $21,000 was recorded in selling, general, and administrative expenses, and $9.5 million was recorded in restructuring expense in the 2009 Consolidated Statement of Operations. Of these total charges, $11.5 million and $1.6 million represent non-cash and cash charges, respectively.
During fiscal 2008, total restructuring and related charges incurred were $2.9 million, of which $1.0 million related to inventory markdowns, $1.0 million for other operating costs associated with closed plant facilities, $533,000 for lease termination and other exit costs, $503,000 for write-downs of buildings and equipment, $189,000 for asset movement costs, $23,000 for employee termination benefits, and a credit of $362,000 for sales proceeds received on equipment with no carrying value. Of these total charges, $1.9 million was recorded in cost of sales, $69,000 was recorded in selling, general, and administrative expenses, and $866,000 was recorded in restructuring expense in the 2008 Consolidated Statement of Operations. Of these total charges, $1.4 million and $1.5 million represent cash and non-cash charges, respectively.
A detailed explanation of each of our significant restructuring plans for fiscal 2009 and 2008 is presented below.
September 2008 – Upholstery Fabrics
During fiscal 2009, restructuring and related charges totaled $9.6 million, of which $6.6 million related to impairment charges on equipment and leasehold improvements, $2.1 million for accelerated depreciation, $502,000 for inventory markdowns, $443,000 for lease termination and other exit costs, $25,000 for other operating costs associated with closed plant facilities, and $10,000 for employee termination benefits. The $2.1 million accelerated depreciation charge represents the incremental depreciation expense to reflect revised depreciation estimates and useful lives for certain fixed assets that were to be used over a shortened useful life from the period the restructuring plan was announced until the respective plant facility was closed and operations ceased. Of this total charge, $7.0 million and $2.6 million were recorded in restructuring expense and cost of sales, respectively, in the 2009 Consolidated Statement of Operations.
No restructuring and related charges were incurred in fiscal 2008, as this restructuring plan was initiated in the second quarter of fiscal 2009.
December 2006-Upholstery Fabrics
During fiscal 2009, we further assessed the net realizable value of our inventory, recoverability of our property, plant, and equipment, and selling, general, and administrative expenses based on current demand trends related to our U.S. upholstery fabric operations. This assessment was required based on the adverse economic conditions resulting from the depressed housing market, credit crisis, and decreased consumer spending that developed in the second quarter of fiscal 2009, and which was more severe than we anticipated at the end of fiscal 2008. As a result, restructuring and related charges incurred were $3.5 million of which $1.4 million related to impairment charges on a building and equipment, $886,000 related to inventory markdowns, $798,000 related to employee termination benefits, $271,000 related to lease termination and other exit costs, and $116,000 related to other operating costs associated with closed plant facilities. Of this total charge, $2.5 million was recorded in restructuring expense, $980,000 was recorded in cost of sales, and $21,000 was recorded in selling, general, and administrative expenses in the 2009 Consolidated Statement of Operations.
During fiscal 2008, total restructuring and related charges incurred for this restructuring plan were $2.9 million of which $1.0 million related to inventory markdowns, $978,000 related to other operating costs associated with closed plant facilities, $503,000 related to write-downs of buildings and equipment, $467,000 related to lease termination and other exit costs, $189,000 related to asset movement costs, $171,000 related to employee termination benefits, and a credit of $362,000 related to sales proceeds received on equipment with no carrying value. Of this total charge, $1.9 million was recorded in cost of sales, $69,000 was recorded in selling, general, and administrative expenses, and $968,000 was recorded in restructuring expense in the 2008 Consolidated Statement of Operations.
Other Income Statement Categories
Selling, General and Administrative Expenses – Selling, general, and administrative expenses (SG&A) for the company as a whole were $19.8 million, or 9.7% of net sales, for fiscal 2009 compared with $24.0 million, or 9.4% of net sales, for fiscal 2008, a decrease of 17.6%. This trend primarily reflected the company’s restructuring efforts and profit improvement plan associated with its upholstery fabrics segment, partially offset by an increase of $358,000 in the provision for doubtful accounts in fiscal 2009.
Interest Expense (Income) -- Interest expense for fiscal 2009 decreased to $2.4 million from $3.0 million in fiscal 2008. This trend primarily reflected lower outstanding balances on existing long-term debt and a decrease in interest rates, partially offset by interest expense incurred on the $11.0 million unsecured note used to finance the Bodet & Horst acquisition. Interest income for fiscal 2009 decreased to $89,000 from $254,000 in fiscal 2008. This trend reflected a significant reduction in money market interest rates during fiscal 2009.
Other Expense – Other expense for fiscal 2009 was $43,000 compared with $736,000 in fiscal 2008. This change primarily reflected fluctuations in foreign currency exchange rates for our subsidiary domiciled in Canada.
Income Taxes
We recorded income tax expense of $32.0 million, or 464.3% of loss before income tax expense in fiscal 2009 compared to an income tax benefit of $542,000, or 11.2% of income before income taxes in fiscal 2008. Income tax expense for fiscal 2009 is different from the amount obtained by applying our statutory rate of 34% to loss before income taxes for the following reasons:
| · | The income tax rate increased 395% for a $27.2 million non-cash charge for the establishment of a valuation allowance against substantially all of the company’s net deferred tax assets. |
| · | The income tax rate increased 50% for an increase in unrecognized tax benefits. |
| · | The income tax rate increased 26% for the tax effects of foreign exchange gains on U.S. denominated account balances in which income taxes are paid in Canadian dollars. In fiscal 2008, the income tax rate decreased 23% for the tax effects of foreign exchange losses on U.S. denominated account balances in which income taxes are paid in Canadian dollars. In fiscal 2009 and 2008, the Canadian foreign exchange rate in relation to the U.S. dollar was very volatile due to changes in oil prices and global economic conditions. |
| · | The income tax rate increased 23% for the recording of a deferred tax liability for estimated U.S. income taxes that were paid upon repatriation of undistributed earnings from the company’s subsidiaries located in China. |
| · | The income tax rate increased 4% for non-deductible stock-based compensation and other miscellaneous items. |
The income tax benefit for fiscal 2008 is different from the amount obtained by applying our statutory rate of 34% to income before income taxes for the following reasons:
| · | The income tax rate was reduced by 23% for the tax effects of foreign exchange losses on U.S. denominated account balances in which income taxes are paid in Canadian dollars. In fiscal 2008, the Canadian foreign exchange rate in relation to the U.S. dollar was very volatile due to changes in oil prices and global economic conditions. |
| · | The income tax rate was reduced by 19% for the tax effects of a tax holiday for our subsidiaries located in China. Under a tax holiday in the People’s Republic of China, the company was granted an exemption from income taxes for two years commencing from the first profit-making year on a calendar year basis and a 50% reduction in income tax rates for the following three years. Calendar year 2004 was the first profit-making year. We were entitled to a 50% income tax reduction through December 31, 2008. The income tax rate was reduced by 0.4% for the tax effects of the tax holiday in China in fiscal 2009. This decrease compared with fiscal 2008 is due to lower pre-tax income in fiscal 2009 for our China operations. |
| · | The income tax rate was reduced by 12% for research and development credits taken on our Canadian income tax returns for fiscal years 2006 through 2008. We engaged a consultant in fiscal 2008 to assist management in documenting and determining the amount of these credits that could be deducted on the company’s Canadian tax returns. |
| · | The income tax rate was reduced by 12% for income tax incentives granted by the Chinese government for the start up of a cut and sew operation located in China in fiscal 2008. |
| · | The income tax rate decreased 10% for taxable income subject to lower statutory income tax rates in foreign jurisdictions (Canada and China) compared with the statutory income tax rate of 34% for the United States. |
| · | The income tax rate increased by 27% for an increase in unrecognized tax benefits. |
| · | The income tax rate increased 4% for non-deductible stock-based compensation expense and other miscellaneous items. |
Handling Costs
The company records warehousing costs in selling, general and administrative expenses. These costs were $2.2 million, $2.2 million, and $3.0 million in fiscal 2010, 2009, and 2008, respectively. Warehousing costs include the operating expenses of the company’s various finished goods distribution centers, such as personnel costs, utilities, building rent and material handling equipment, and lease expense. Had these costs been included in cost of sales, gross profit would have been $36.6 million, or 17.7%, in fiscal 2010, $22.5 million, or 11.0%, in fiscal 2009, and $30.2 million, or 11.9%, in fiscal 2008.
Liquidity and Capital Resources
Liquidity
Our sources of liquidity include cash and cash equivalents, short-term investments, cash flow from operations, and amounts available under our unsecured revolving credit lines. These sources have been adequate for day-to-day operations and capital expenditures. We believe our present cash and cash equivalents and short-term investment balance of $21.3 million, cash flow from operations, and current availability under our unsecured revolving credit lines will be sufficient to fund our business needs and fiscal 2011 contractual obligations (see below commitments table).
In fiscal 2010, we continued our focus on strengthening our financial position. Cash and cash equivalents and short-term investments as of May 2, 2010 were $21.3 million compared with $11.8 million at May 3, 2009. Our cash and cash equivalents and short-term investment balance reflects cash flow from operations in fiscal 2010 of $21.6 million compared with $22.8 million in fiscal 2009. Cash flow from operations in fiscal 2010 primarily represented cash flow from earnings totaling $18.5 million. Cash flow from operations in fiscal 2009 primarily represented cash flow from earnings generated from the mattress fabrics segment and working capital reductions in both segments. Our cash and cash equivalents and short-term investment balance also reflects cash outlays for capital expenditures totaling $7.4 million during fiscal 2010, payments on long-term debt of $4.8 million, payments on vendor-financed capital expenditures and a capital lease obligation totaling $1.6 million, offset by cash proceeds received on the sale of common stock and equipment totaling $1.3 million.
We reduced our total long-term debt, including current maturities, to $11.7 million at May 2, 2010 from $16.4 million at May 3, 2009. This reduction primarily related to the last principal payment of $4.8 million made in March 2010 on our prior unsecured term notes. Cash flow from operations and the sale of the corporate headquarters (see below) allowed us to substantially reduce total borrowings during fiscal 2009. During fiscal 2009, we repaid $16.1 million in long-term debt, of which $4.6 million related to principal payments due in March and June 2010. Our long-term debt balance was $16.4 million and $21.4 million at May 3, 2009 and April 27, 2008, respectively. Our long-term debt balance of $16.4 million, included an $11.0 million unsecured term loan added in the second quarter of fiscal 2009 to finance the Bodet & Horst acquisition.
Our next significant scheduled principal payment is $2.2 million and is due in August 2011. As of May 2, 2010, we have lines of credit totaling $12.5 million in the U.S. and China, with no outstanding balances. All of our long-term debt and line of credit agreements are unsecured.
Our cash and cash equivalents and short-term investment balance may be adversely affected by factors beyond our control, such as weakening industry demand and delays in receipt of payment on accounts receivable.
Corporate Headquarters Office Space
Effective January 29, 2009, we sold our corporate headquarters building in High Point, North Carolina for a purchase price of $4.0 million. The agreement allowed the company to lease the building back from the purchaser under an operating lease for an initial term of approximately three years expiring on March 31, 2012 and for rent payable in monthly installments of $30,020, plus approximately two-thirds of the building’s normal occupancy costs. The contract contains renewal options as defined in the agreement for periods from April 1, 2012 through September 30, 2015 and October 1, 2015 through March 31, 2019. The proceeds of the sale were used to pay off the remaining balance of our real estate loans totaling $4.0 million.
Working Capital
Accounts receivable at May 2, 2010 were $19.8 million, an increase of 9.4%, compared with $18.1 million at May 3, 2009. This increase primarily reflects increased business volume in both our business segments in the fourth quarter of fiscal 2010 compared with the fourth quarter of fiscal 2009. Days’ sales in receivables were 35 days and 32 days at the end of fiscal 2010 and 2009, respectively.
Inventories at May 2, 2010 were $26.0 million, an increase of 8.4%, compared with $24.0 million at May 3, 2009. This increase primarily reflects increased business volume in both our business segments in the fourth quarter of fiscal 2010 compared with the fourth quarter of fiscal 2009. Inventory turns for fiscal 2010 were 6.7 versus 6.0 for fiscal 2009.
Accounts payable-trade as of May 2, 2010 were $22.3 million, an increase of 31%, compared with $17.0 million at May 3, 2009. This increase primarily reflects increased business volume in both our business segments in the fourth quarter of fiscal 2010 compared with the fourth quarter of fiscal 2009.
Operating working capital (comprised of accounts receivable and inventories, less accounts payable –trade and capital expenditures) was $23.0 million at May 2, 2010, down from $23.5 million at May 3, 2009. Operating working capital turnover was 9.0 in fiscal 2010 compared to 6.4 in fiscal 2009.
Financing Arrangements
Unsecured Term Notes – Bodet & Horst
In connection with the Bodet & Horst acquisition (Note 2), we entered into a note agreement dated August 11, 2008. The agreement provided for the issuance of $11.0 million of unsecured term notes with a fixed interest rate of 8.01% and a term of seven years. Principal payments of $2.2 million per year are due on the notes beginning August 11, 2011. The principal payments are payable over an average term of 5.2 years through August 11, 2015. The agreement contains customary financial and other covenants as defined in the agreement.
Unsecured Term Notes - Prior
Our prior unsecured senior term notes had a fixed interest rate of 8.80% (payable semi-annually in March and September and subject to prepayment provisions each fiscal quarter as defined in the agreement). These unsecured term notes were paid in full in March 2010.
Government of Quebec Loan
We have an agreement with the Government of Quebec for a term loan that is non-interest bearing and is payable in 48 equal monthly installments that commenced on December 1, 2009. The proceeds were used to partially finance capital expenditures at our Rayonese facility located in Quebec, Canada. At May 2, 2010, the outstanding balance on this loan was valued at $700,000 and $687,000 in Canadian and U.S. dollars, respectively. At May 3, 2009, the outstanding balance on this loan was valued at $800,000 and $674,000 in Canadian and U.S. dollars, respectively.
Revolving Credit Agreement –United States
We have an unsecured credit agreement that provides for a revolving loan commitment of $6.5 million, including letters of credit up to $5.5 million. This agreement bears interest at the one-month LIBOR plus an adjustable margin (all in rate of 3.27% at May 2, 2010) based on the company’s debt/EBITDA ratio, as defined in the agreement. As of May 2, 2010 there were $425,000 in outstanding letters of credit (all of which related to workers compensation) under the agreement. At May 2, 2010 and May 3, 2009, there were no borrowings outstanding under this agreement.
On July 15, 2009, we entered into a fourteenth amendment to this revolving credit agreement. This amendment extended the expiration date to August 15, 2010. It is management’s intention to extend this revolving credit agreement.
On February 24, 2010, we entered into a fifteenth amendment to this revolving credit agreement. This amendment provided greater flexibility by increasing the capital expenditure limit on a cash basis from $4.0 million to $7.5 million for fiscal 2010. In addition, for any fiscal year after fiscal 2010, capital expenditures are not to exceed the sum of $4.0 million and such additional amount of capital expenditures that would not cause the company to be in noncompliance with the fixed charge coverage ratio as defined in the agreement.
Revolving Credit Agreement - China
Effective March 3, 2010, we renewed our revolving credit agreement in China. The agreement provides for a line of credit available up to approximately $6.0 million and extends the expiration date to March 2, 2011. This agreement bears interest at a rate determined by the Chinese government. There were no borrowings or letters of credit outstanding under the agreement as of May 2, 2010 and May 3, 2009.
Overall
Our loan agreements require, among other things, that we maintain compliance with certain financial covenants. At May 2, 2010 the company was in compliance with these financial covenants.
The principal payment requirements for long-term debt during the next five fiscal years are: 2011 – $196,000; 2012 – $2.4 million; 2013 – $2.4 million; 2014 – $2.3 million; 2015 - $2.2 million; and thereafter – $2.2 million.
Commitments
The following table summarizes the company’s contractual payment obligations and commitments for each of the next five fiscal years (in thousands):
| | | 2011 | | | 2012 | | | 2013 | | | 2014 | | | 2015 | | | Thereafter | | | Total | |
Capital expenditures | | | 3,837 | | | | - | | | | - | | | | - | | | | - | | | | - | | | | 3,837 | |
| Accounts payable – capital expenditures | | | 567 | | | | - | | | | - | | | | - | | | | - | | | | - | | | | 567 | |
| Operating leases | | | 1,559 | | | | 1,178 | | | | 484 | | | | 100 | | | | 13 | | | | - | | | | 3,334 | |
| Interest Expense (1) | | | 894 | | | | 754 | | | | 578 | | | | 402 | | | | 226 | | | | 49 | | | | 2,903 | |
| Long-term debt – principal | | | 196 | | | | 2,397 | | | | 2,397 | | | | 2,297 | | | | 2,200 | | | | 2,200 | | | | 11,687 | |
| Total (2) | | | 7,053 | | | | 4,329 | | | | 3,459 | | | | 2,799 | | | | 2,439 | | | | 2,249 | | | | 22,328 | |
Note: Payment Obligations by Fiscal Year Ending April
| (1) | Interest expense includes interest incurred on accounts payable-capital expenditures, and long-term debt. |
| (2) | As more fully disclosed in Notes 1 and 11 of the Notes to the Consolidated Financial Statements, the company adopted certain provisions of ASC Topic 740, “Income Taxes” (formerly known as Financial Accounting Standards Board Interpretation No.48 “Accounting for Uncertainty In Income Taxes” which supplements SFAS No. 109, “Accounting for Income Taxes”). At May 2, 2010, the company had $10.1 million of total gross unrecognized tax benefits, of which $6.3 million and $3.8 million were classified as net non-current deferred income taxes and income taxes payable – long-term. The final outcome of these tax uncertainties is dependent upon various matters including tax examinations, legal proceedings, competent authority proceedings, changes in regulatory tax laws, or interpretations of those tax laws, or expiration of statutes of limitation. As a result of these inherent uncertainties, the company cannot reasonably estimate the timing of payment of these amounts. Of the $10.1 million in total gross unrecognized tax benefits, $6.3 million would not be subject to cash payments due to the company’s U.S. federal and state net operating loss carryforwards. |
Capital Expenditures
Capital expenditures on an accrual and cash basis for fiscal 2010 were $7.4 million. The capital spending of $7.4 million consisted of $6.6 million for the mattress fabrics segment, $481,000 for the upholstery fabrics segment, and $316,000 for unallocated corporate. Depreciation expense for fiscal 2010 was $4.0 million, of which $3.5 million related to the mattress fabrics segment and $552,000 related to the upholstery fabrics segment. Depreciation expense for the upholstery fabrics segment included a $178,000 charge related to the reclassification of certain upholstery fabric assets classified from held for sale to held and used (included in property, plant, and equipment on the May 2, 2010 Consolidated Balance Sheet).
For fiscal 2011, we currently expect capital expenditures to be approximately $8.0 million, which we plan to fund from cash flow from operations. Planned capital expenditures for fiscal 2011 primarily relate to the mattress fabrics segment. For fiscal 2011, we currently expect depreciation expense to be approximately $5.0 million, which primarily relates to the mattress fabrics segment.
Accounts Payable – Capital Expenditures
At May 2, 2010, we had total amounts due for capital expenditures totaling $567,000, of which $377,000 was vendor-financed and $190,000 was non-vendor financed. The company’s vendor-financed arrangement bears interest with a fixed interest rate of 7.14%. During August 2009, we prepaid and paid in full $521,000 on a vendor-financed arrangement that had a fixed interest rate of 6%. The total outstanding amount of $567,000 is required to be paid in full in fiscal 2011.
Capital Lease Obligation
In May 2008, we entered into a capital lease to finance a portion of the construction of certain equipment related to our mattress fabrics segment. The lease agreement contained a bargain purchase option and incurred interest at a rate of 8.5%. The lease agreement required total principal payments totaling $1.4 million which commenced on July 1, 2008, and was paid in full by the end of fiscal 2010. This agreement was secured by equipment with a carrying value of $2.4 million.
Any significant increase in our raw material costs, utility/energy costs and general economic inflation could have a material adverse impact on the company, because competitive conditions have limited our ability to pass significant operating increases on to customers.
Critical Accounting Policies
U.S. generally accepted accounting principles require us to make estimates and assumptions that affect the reported amounts in the consolidated financial statements and accompanying notes. Some of these estimates require difficult, subjective and/or complex judgments about matters that are inherently uncertain, and as a result actual results could differ significantly from those estimates. Due to the estimation processes involved, management considers the following summarized accounting policies and their application to be critical to understanding the company’s business operations, financial condition and results of operations.
Accounts Receivable - Allowance for Doubtful Accounts. Substantially all of our accounts receivable are due from residential and commercial furniture and bedding manufacturers. Ownership of these manufacturers is increasingly concentrated and certain bedding manufacturers have a high degree of leverage. As of May 2, 2010, accounts receivable from furniture manufacturers totaled approximately $11.7 million, and accounts receivable from bedding manufacturers totaled approximately $8.1 million. Additionally, as of May 2, 2010, the aggregate accounts receivable balance of the company’s ten largest customers was $8.2 million, or 41% of trade accounts receivable. One customer within the upholstery fabrics segment represented 13% of consolidated accounts receivable at May 2, 2010. No customers within the mattress fabrics segment represented more than 10% of consolidated accounts receivable at May 2, 2010.
We continuously perform credit evaluations of its customers, considering numerous inputs including customers’ financial position, past payment history, cash flows and management capability; historical loss experience; and economic conditions and prospects. Once evaluated, each customer is assigned a credit grade. Credit grades are adjusted as warranted. Significant management judgment and estimates must be used in connection with establishing the reserve for allowance for doubtful accounts. While management believes that adequate allowances for doubtful accounts have been provided in the consolidated financial statements, it is possible that we could experience additional unexpected credit losses.
The reserve balance for doubtful accounts was $1.3 million and $1.5 million at May 2, 2010 and May 3, 2009, respectively.
Inventory Valuation. We operate as a “make-to-order” and “make-to-stock” business. Although management closely monitors demand in each product area to decide which patterns and styles to hold in inventory, the increasing availability of low cost imports and the gradual shifts in consumer preferences expose the company to markdowns of inventory.
Management continually examines inventory to determine if there are indicators that the carrying value exceeds its net realizable value. Experience has shown that the most significant indicator of the need for inventory markdowns is the age of the inventory and the planned discontinuance of certain patterns. As a result, the company provides inventory valuation markdowns based upon set percentages for inventory aging categories, generally using six, nine, twelve and fifteen month categories. While management believes that adequate markdowns for excess and obsolete inventory have been made in the consolidated financial statements, significant unanticipated changes in demand or changes in consumer tastes and preferences could result in additional excess and obsolete inventory in the future.
The reserve for inventory markdowns was $1.4 million and $3.0 million at May 2, 2010 and May 3, 2009, respectively.
Long-lived Assets. Management reviews long-lived assets, which consist principally of property, plant and equipment, for impairment whenever events or changes in circumstances indicate that the carrying value of the asset may not be recovered. Recoverability of long-lived assets to be held and used is measured by a comparison of the carrying amount of the asset to future net undiscounted cash flows expected to be generated by the asset. If the carrying amount of an asset exceeds its estimated future cash flows, the related cost and accumulated depreciation are removed from the accounts and an impairment charge is recognized for the excess of the carrying amount over the fair value of the asset. After the impairment loss is recognized, the adjusted carrying amount shall be its new accounting basis. Assets to be disposed of by sale are reported at the lower of the carrying value or fair value less cost to sell when the company has committed to a disposal plan, and are reported separately as assets held for sale in the consolidated balance sheets. Unforeseen events and changes in circumstances and market conditions could negatively affect the value of assets and result in an impairment charge.
Goodwill. Management assesses goodwill for impairment at the end of each fiscal year or between annual tests if an event that occurs or circumstances change that would more likely than not reduce the fair value of a reporting unit below its carrying values. At the end of fiscal 2009, we tested for impairment of goodwill utilizing a two-step approach. In the first step, we estimated the fair market values of its reporting units (mattress fabrics and upholstery fabrics) using a present value of future cash flows approach, subject to a comparison for reasonableness to its market capitalization at the date of valuation. We used a discount rate equal to its average cost of funds to discount the expected future cash flows. If the fair market value of a reporting unit exceeded its carrying amount, goodwill of the reporting unit was considered not impaired, thus the second step of the impairment test is unnecessary. If the carrying amount of the reporting unit exceeded its implied fair value, the second step of the goodwill impairment test would be performed to measure the amount of the impairment loss, if any. In the second step the implied fair market value of the goodwill would be estimated as the fair market value of the reporting unit used in the first step less the fair values of all other net tangible and intangible assets of the reporting unit. If the carrying amount of the goodwill exceeded its implied fair market value, an impairment loss would be recognized in an amount equal to that excess, not to exceed the carrying amount of the goodwill. Based on the results of the fiscal 2009 impairment test, no impairment of goodwill was incurred and the second step of the impairment test was unnecessary. Additionally, the estimated fair value of the mattress fabric segment exceeded its carrying value by approximately $22.8 million or 38%.
In accordance with ASC Topic 350, “Goodwill and Other Intangible Assets”, a detailed determination of the fair value of the reporting unit may be carried forward from one year to the next if all of the following conditions are met: a) assets and liabilities that make up the reporting unit have not changed since the most recent fair value determination (May 3, 2009), b) the most recent fair value determination resulted in an amount that exceeded the carrying amount of the reporting unit by a substantial margin, c) based on analysis of events that have occurred and circumstances that have changed since the most recent fair value determination, the likelihood that a current fair value determination would be less that the current carrying amount of the reporting unit is remote. Based on our analysis of the above criteria, we carried forward our fiscal 2009 detailed determination of the fair value of our reporting units to fiscal 2010 and therefore, no impairment of goodwill was incurred in fiscal 2010.
The company’s remaining goodwill at May 2, 2010, of $11.5 million relates to the mattress fabrics segment.
Although the company believes it has based the impairment testing on reasonable estimates and assumptions, the use of different estimates and assumptions could result in materially different results.
Restructuring Charges. In accordance with ASC Topic 420, Exit or Disposal Cost Obligations, a liability for a cost associated with an exit or disposal activity must be recognized and measured initially at its fair value in the period in which the liability is incurred, except for certain employee termination benefits that qualify under ASC Topic 712, Nonretirement
Postemployment Benefits.
In fiscal 2009 and 2008, the upholstery fabric segment was under significant pressure from a variety of external forces, such as the current consumer preference for leather and suede furniture and the growing competition from imported fabrics and cut and sewn kits. In an effort to reduce operating expenses and scale U.S. productive capacity in line with current and expected demand trends, we executed restructuring initiatives during the past several years. These restructuring initiatives have resulted in restructuring charges related to the remaining lease costs of the closed facilities, the write-down of property, plant and equipment, workforce reduction and elimination of facilities.
Severance and related charges are accrued at the date the restructuring is approved by the board of directors based on an estimate of amounts that will be paid to affected employees, in accordance with ASC Topic 712. Under ASC Topic 360, asset impairment charges related to the consolidation or closure of manufacturing facilities are based on an estimate of expected sales prices for the real estate and equipment. Other exit costs, which principally consist of charges for lease termination and losses from termination of existing contracts, equipment relocation costs and inventory markdowns that are related to the restructuring are accounted for in accordance with ASC Topic 420.
We reassess the individual accrual requirements at the end of each reporting period. If circumstances change, causing current estimates to differ from original estimates, adjustments are recorded in the period of change. Restructuring charges, and adjustments of those charges, are summarized in Note 3 to the consolidated financial statements.
Income Taxes. Income taxes are accounted for under the asset and liability method. Deferred income taxes are recognized for temporary differences between the financial statement carrying amounts and the tax bases of the company’s assets and liabilities and operating loss and tax credit carryforwards at income tax rates expected to be in effect when such amounts are realized or settled. The effect on deferred income taxes of a change in tax rates is recognized in income (loss) in the period that includes the enactment date.
We evaluate our deferred income taxes to determine if a valuation allowance is required. ASC Topic 740 requires that companies assess whether a valuation allowance should be established based on the consideration of all available evidence using a “more likely than not” standard with significant weight being given to evidence that can be objectively verified. Since the company operates in multiple jurisdictions, we assess the need for a valuation allowance on a jurisdiction-by-jurisdiction basis, taking into account the effects of local tax law. Based on this assessment, we recorded a valuation allowance of $22.6 million at May 2, 2010. This valuation allowance of $22.6 million consists of a full valuation allowance of $21.3 million against our net deferred assets associated with our U.S. operations and a partial valuation allowance of $1.3 million against our net deferred tax assets associated with our China operations.
Our net deferred tax asset regarding our U.S. operations primarily resulted from the recording of the income tax benefit of U.S. income tax loss carryforwards over the last several fiscal years, which totaled $64.0 million at May 2, 2010. The cumulative U.S. pre-tax losses incurred over the last several fiscal years, the significant uncertainty in current and expected demand for furniture and mattresses, and the prevailing uncertainty in the overall economic climate, has made it very difficult to forecast our financial results associated with our U.S. operations. Based on this significant negative evidence, we maintain our position that it is more-likely-than-not that the U.S. net deferred tax assets will not be fully recovered. Consequently, we recorded a full allowance of $21.3 million against our U.S. net deferred tax assets.
Our net deferred tax asset regarding our China operations primarily pertains to the book versus tax basis difference associated with our China operations’ fixed assets. This book versus tax basis difference resulted from our impairment losses and fixed asset write-downs associated with our September 2008 Upholstery Fabrics restructuring plan (see note 3). In order for this net deferred tax asset to be realized, our China operations must have sufficient pre-tax income levels to utilize tax depreciation expense each of the next four fiscal years. Due to the favorable results from our restructuring activities and profit improvement plan initiated in the second quarter of fiscal 2009, our China operations have been restored to profitability, reporting pre-tax income of $7.9 million in fiscal 2010. Although our China operations reported pre-tax income of $7.9 million in fiscal 2010, on a cumulative basis over the last three fiscal years, our China operations have substantially performed on a break-even basis (achieved in the fourth quarter of fiscal 2010). The significant uncertainty in current and expected demand for furniture, and the prevailing uncertainty in the overall economic climate, has made it very difficult to forecast medium and long-term financial results associated with our China operations. Based on the current economic conditions, we believe it is too uncertain to project pre-tax income associated with our China operations after fiscal 2011. Based on this significant positive and negative evidence, we recorded a partial valuation allowance of $1.3 million against net deferred tax assets associated with our China operations for tax versus book depreciation that is expected to reverse beyond fiscal 2011 and we recognized an income tax benefit of $334,000 in fiscal 2010 for the reduction in this valuation allowance for the tax versus book depreciation that is projected to reverse in fiscal 2011.
We adopted certain provisions of ASC Topic 740, (these provisions were formerly known as Financial Accounting Standards Board Interpretation No. 48,”Accounting for Uncertainty in Income Taxes- which supplements SFAS No. 109, Accounting for Income Taxes). We must recognize the tax impact from an uncertain tax position only if it is more likely than not that the tax position will be sustained on examination by the taxing authorities, based on the technical merits of the position. The tax impact recognized in the financial statements from such a position is measured based on the largest benefit that has a greater than 50% likelihood of being realized upon ultimate resolution. Penalties and interest related to uncertain tax positions are recorded as tax expense. Significant judgment is required in the identification of uncertain tax positions and in the estimation of penalties and interest on uncertain tax positions.
At May 2, 2010, the company had $10.1 million of total gross unrecognized tax benefits, of which $6.3 million and $3.8 million were classified as net non-current deferred income taxes and income taxes payable – long-term, respectively, in the accompanying consolidated balance sheets.
Adoption of New Accounting Pronouncements
Refer to Note 1 located in the notes to the consolidated statements for recently adopted accounting pronouncements for fiscal 2010.
Recently Issued Accounting Standards
Refer to Note 24 located in the notes to the consolidated statements for recently issued accounting pronouncements for fiscal 2011.
ABOUT MARKET RISK
We are exposed to market risk from changes in interest rates on our revolving credit lines. Our revolving credit line in the United States bears interest at the one-month LIBOR plus an adjustable margin based on the company’s debt/EBITDA ratio, as defined in the credit agreement. Our revolving credit line associated with our China subsidiaries bears interest at a rate determined by the Chinese government. At May 2, 2010, there were no borrowings outstanding under these revolving credit lines.
We are not exposed to market risk from changes in interest rates on our long-term debt. The company’s unsecured term notes issued in connection with the Bodet & Horst acquisition have a fixed interest rate of 8.01% and the loan associated with the Government of Quebec is non-interest bearing.
We are exposed to market risk from changes in the value of foreign currencies for our subsidiaries domiciled in China and Canada. On January 21, 2009, the company entered into a Canadian dollar foreign exchange contract associated with its loan from the Government of Quebec. The agreement effectively converted the Canadian dollar principal debt payments at a fixed Canadian dollar foreign exchange rate versus the United States dollar of 1.21812. This agreement was terminated in the first quarter of fiscal 2010 (see note 17 in the notes to the consolidated financial statements for further details). Additionally, we try to maintain a natural hedge by keeping an equal balance of our assets and liabilities denominated in the local currency of our subsidiaries domiciled in China and Canada, although there is no assurance that we will be able to continually maintain this natural hedge. Our foreign subsidiaries use the United States dollar as their functional currency. A substantial portion of our imports purchased outside the United States are denominated in U.S. dollars. A 10% change in either exchange rate at May 2, 2010, would not have had a significant impact on our results of operations or financial position.
AND SUPPLEMENTARY DATA
To the Board of Directors and Shareholders
Culp, Inc.:
We have audited the accompanying consolidated balance sheets of Culp, Inc. (a North Carolina corporation) and Subsidiaries (the Company) as of May 2, 2010, and May 3, 2009, and the related consolidated statements of operations, shareholders’ equity and cash flows for each of the three years in the period ended May 2, 2010. These financial statements are the responsibility of the Company’s management. Our responsibility is to express an opinion on these financial statements and financial statement schedule based on our audits.
We conducted our audits in accordance with the standards of the Public Company Accounting Oversight Board (United States). Those standards require that we plan and perform the audit to obtain reasonable assurance about whether the financial statements are free of material misstatement. The Company is not required to have, nor were we engaged to perform an audit of its internal control over financial reporting. Our audit included consideration of internal control over financial reporting as a basis for designing audit procedures that are appropriate in the circumstances, but not for the purpose of expressing an opinion on the effectiveness of the Company’s internal control over financial reporting. Accordingly, we express no such opinion. An audit includes examining, on a test basis, evidence supporting the amounts and disclosures in the financial statements. An audit also includes assessing the accounting principles used and significant estimates made by management, as well as evaluating the overall financial statement presentation. We believe that our audits provide a reasonable basis for our opinion.
In our opinion, the consolidated financial statements referred to above present fairly, in all material respects, the financial position of Culp, Inc. and Subsidiaries as of May 2, 2010, and May 3, 2009, and the results of their operations and their cash flows for each of the three years in the period ended May 2, 2010, in conformity with accounting principles generally accepted in the United States of America.
/s/ Grant Thornton LLP
Greensboro, North Carolina
July 15, 2010