Exhibit 99.2

Investor Presentation First Quarter 2023 Highlights F&M TRUST Franklin Financial Services Corporation
Forward Looking Statements Certain statements appearing herein which are not historical in nature are forward-looking statements within the meaning of the Private Securities Litigation Reform Act of 1995. Such forward-looking statements refer to a future period or periods, reflecting Management’s current views as to likely future developments, and use words “may,” “will,” “expect,” “believe,” “estimate,” “anticipate,” or similar terms. Because forward-looking statements involve certain risks, uncertainties and other factors over which the Corporation has no direct control, actual results could differ materially from those contemplated in such statements. These factors include (but are not limited to) the following: general economic conditions, changes in interest rates, changes in the rate of inflation and product and service prices, change in the Corporation’s cost of funds, changes in government monetary policy, changes in government regulation and taxation of financial institutions, effects of government shutdowns and budget negotiations, impacts of the interruption, degradation or breach in security of our information and technology systems or other technological risks and attacks, acts of war, terrorism or geopolitical instabilities, changes in accounting policies or practices, changes in technology, the intensification of competition within the Corporation’s market area, and other similar factors. We caution readers not to place undue reliance on these forward-looking statements. They only reflect management’s analysis as of this date. The Corporation does not revise or update these forward-looking statements to reflect events or changed circumstances. Please carefully review the risk factors described in other documents the Corporation files from time to time with the SEC, including the Annual Reports on Form 10-K, Quarterly Reports on Form 10-Q, and any Current Reports on Form 8-K. F&M TRUST Franklin Financial Services Corporation 2
CEO Comments While there were many national headlines in the first quarter of 2023, adding confusion and chaos to the banking world, the quarter was relatively calm for Franklin Financial Services Corporation. The Company continued to reposition its balance sheet against the rising interest-rate environment, focus on maintaining deposit relationships, and carefully grow the commercial loan portfolio with the recognition of a possible recession looming in the second half of the year. With 92% of our depositor’s funds collateralized, or FDIC insured, the direct impact of several bank failures during the quarter was negligible to the Company. Importantly, the decline in deposits at the beginning of the quarter as certain depositors sought higher-yielding products has slowed due to a focused effort by the bank that included direct customer communication and raising some deposit rates. The Company remains focused on maintaining strong liquidity levels despite the challenges of the unrealized losses in our investment portfolio. Over the quarter, investments were liquidated when we could get a short earn back, a small amount of brokered CDs were acquired, and we borrowed under the new Federal Reserve Bank Term Funding Program to enhance our liquidity position, which will be further detailed later in this presentation. We remain diligent in addressing our liquidity needs but feel comfortable in our current position. In the first quarter of 2023, we began to realize results from the work we put in during 2022 to develop and increase our commercial loan balances. Our Treasury team has also been effective in bringing commercial deposit relationships to the bank. We believe we will continue to see growth through the second quarter and into the third. At the moment, the fourth quarter seems a long way away. Credit quality is very strong right now and we are well-positioned to absorb any challenges that might arise later in the year. The Company is taking a series of small steps to adjust to changing conditions without making large bets that could subject it to issues if there are additional dramatic moves in the economy. We remain optimistic for the future and focused on growth as we move the Company forward. Thank you for your interest. Sincerely, F&M TRUST Franklin Financial Services Corporation 3
Mission, Vision & Core Values Mission Statement Delivering the right financial solutions from people you know and trust. Vision We are committed to remaining independent by growing our bank to meet the increasing needs of our employees, customers, communities, and shareholders. We strive to be a financial services leader in the markets we serve. Core Values The employees, officers, and directors are committed to the core values of integrity, teamwork, excellence, accountability, and concern for our customers and the communities we serve. F&M TRUST Franklin Financial Services Corporation 4
Overview of Franklin Financial Franklin Financial, which was formed in 1983, is a holding company headquartered in Franklin County, PA Franklin Financial’s wholly-owned subsidiary, F&M Trust, was founded in Chambersburg, PA in 1906 Total assets of the Company were $1.71 billion as of March 31, 2023 As of March 31, 2023, Franklin Financial reported $1.07 billion in brokerage and trust assets under management Franklin Financial stock is trading on the Nasdaq Stock Market (NASDAQ: FRAF) F&M TRUST Franklin Financial Services Corporation 5
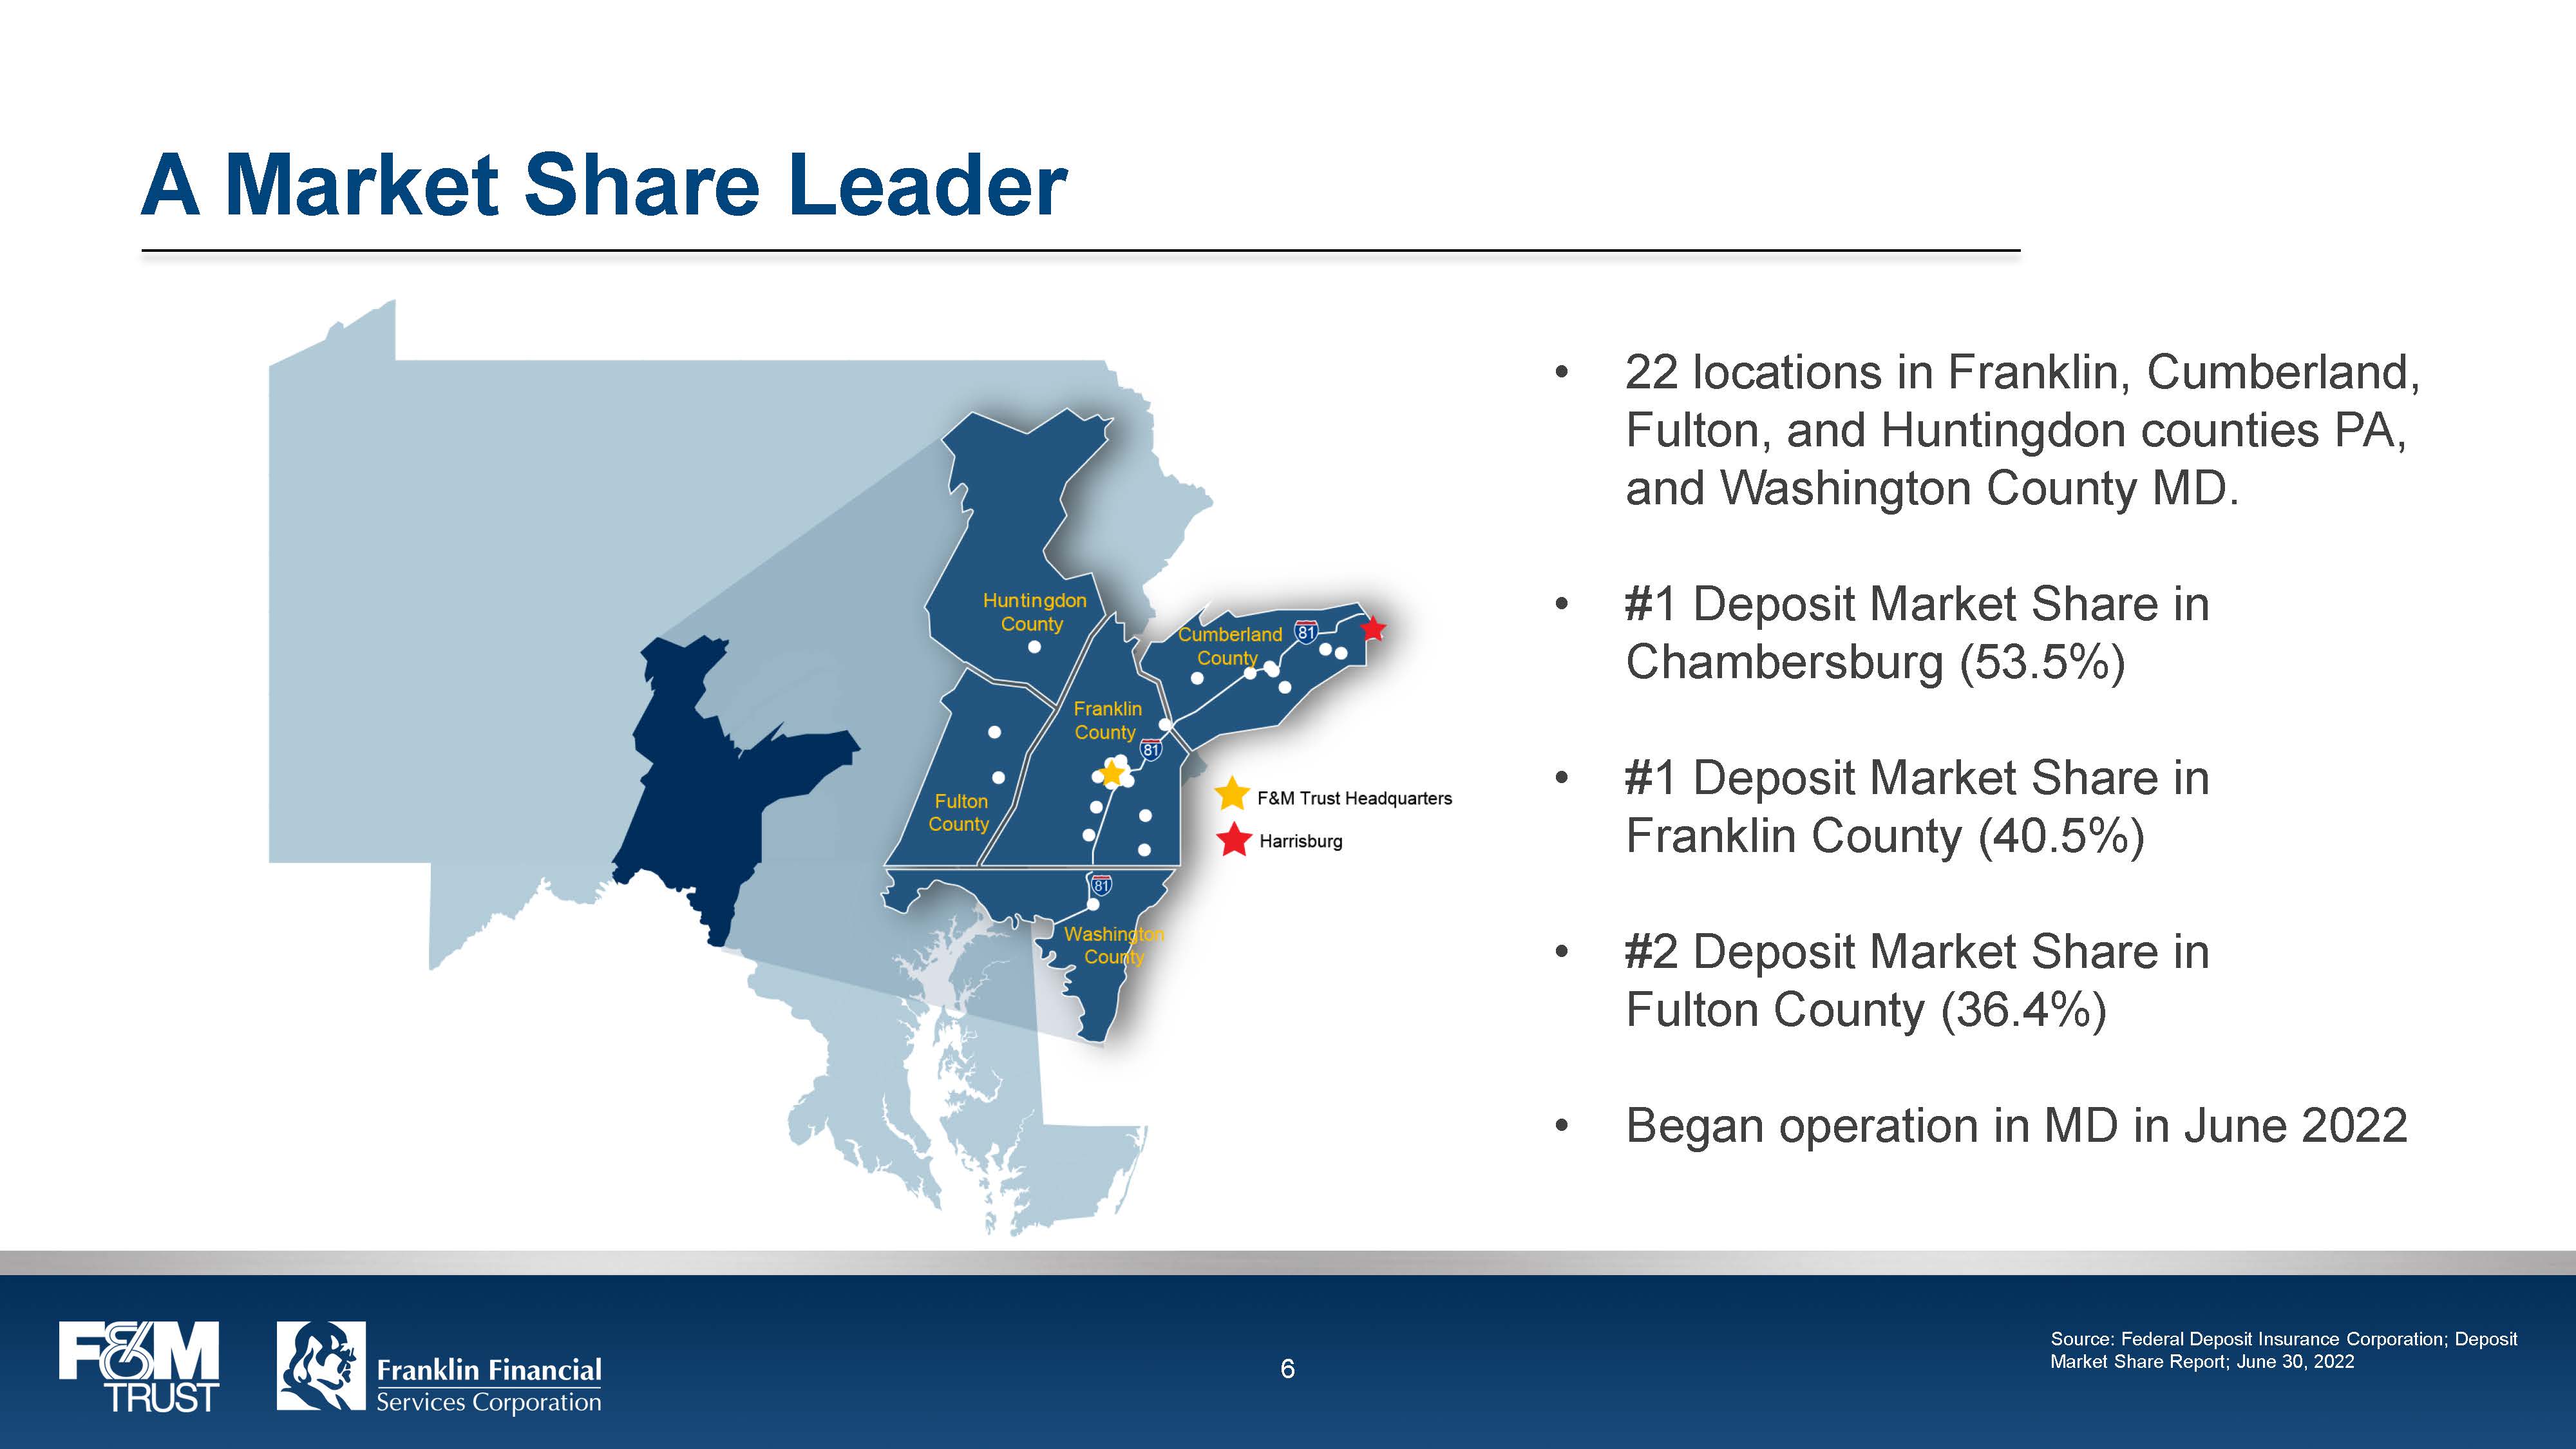
A Market Share Leader 22 locations in Franklin, Cumberland, Fulton, and Huntingdon counties PA, and Washington County MD. #1 Deposit Market Share in Chambersburg (53.5%) #1 Deposit Market Share in Franklin County (40.5%) #2 Deposit Market Share in Fulton County (36.4%) Began operation in MD in June 2022 F&M TRUST Franklin Financial Services Corporation 6 Source: Federal Deposit Insurance Corporation; Deposit Market Share Report; June 30, 2022
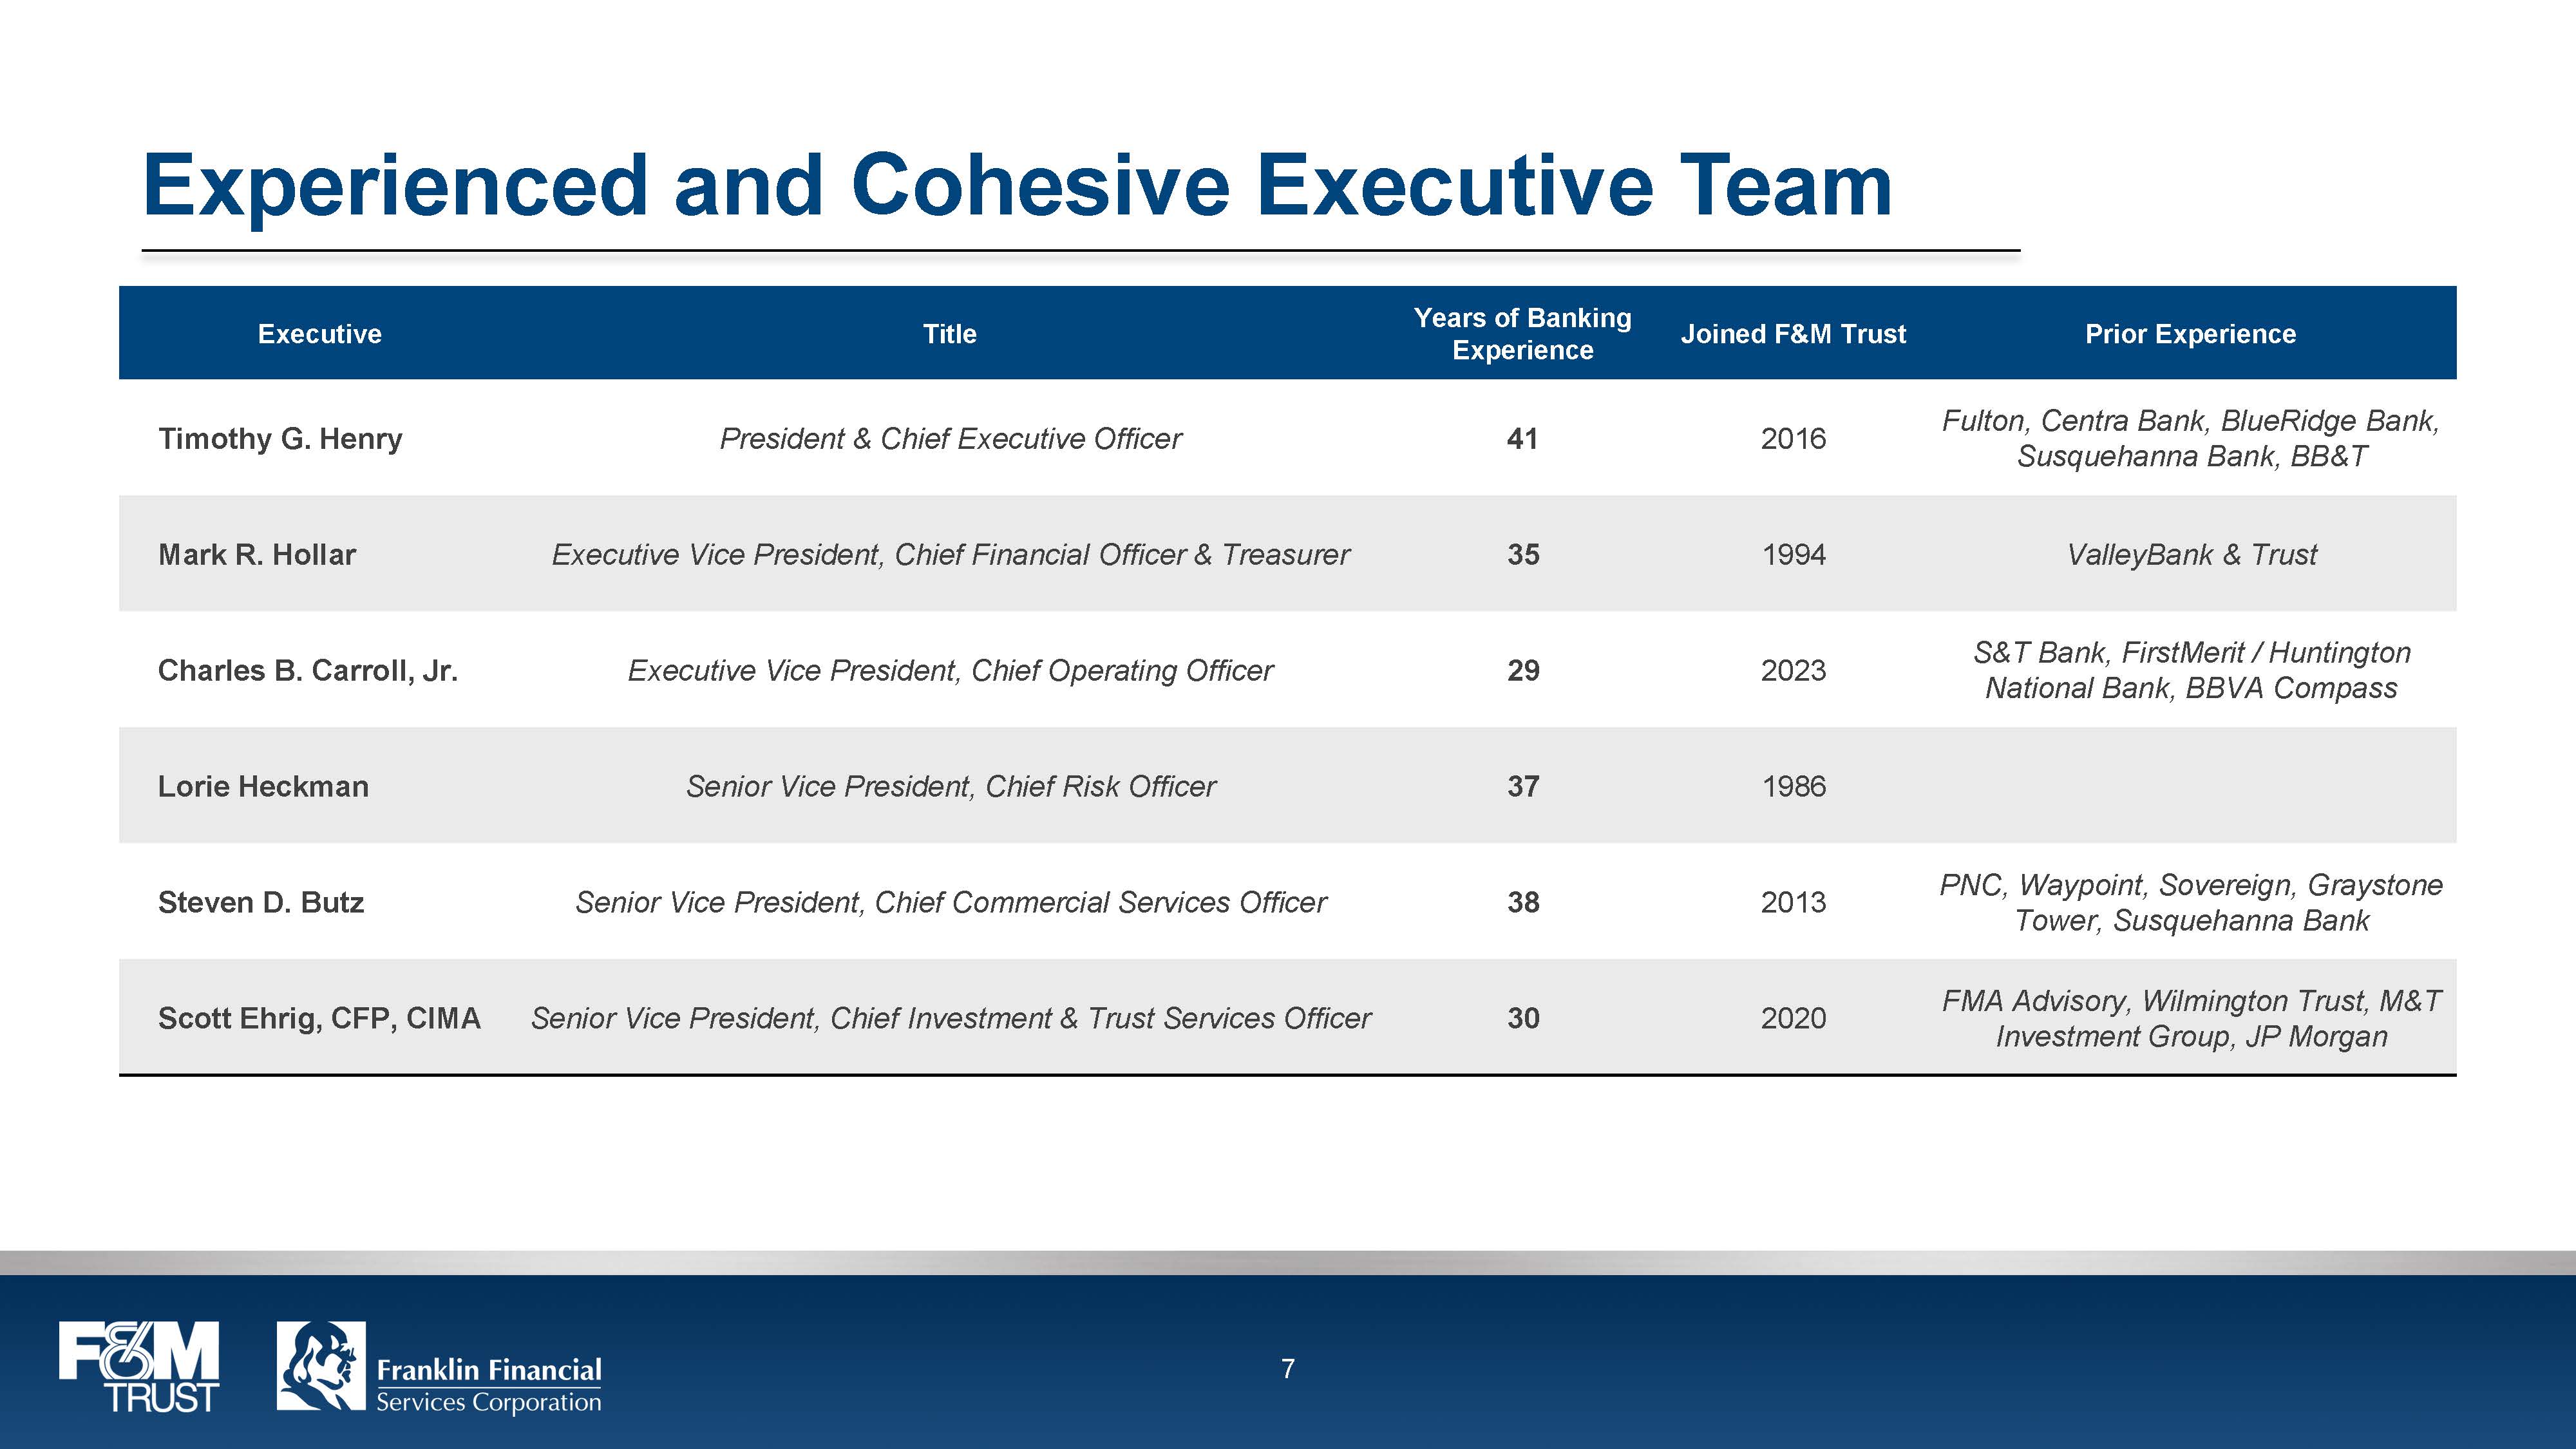
Executive Title Years of Banking Experience Joined F&M Trust Prior Experience Timothy G. Henry President & Chief Executive Officer 41 2016 Fulton, Centra Bank, BlueRidge Bank, Susquehanna Bank, BB&T Mark R. Hollar Executive Vice President, Chief Financial Officer & Treasurer 35 1994 ValleyBank & Trust Charles B. Carroll, Jr. Executive Vice President, Chief Operating Officer 29 2023 S&T Bank, FirstMerit / Huntington National Bank, BBVA Compass Lorie Heckman Senior Vice President, Chief Risk Officer 37 1986 Steven D. Butz Senior Vice President, Chief Commercial Services Officer 38 2013 PNC, Waypoint, Sovereign, Graystone Tower, Susquehanna Bank Scott Ehrig, CFP, CIMA Senior Vice President, Chief Investment & Trust Services Officer 30 2020 FMA Advisory, Wilmington Trust, M&T Investment Group, JP Morgan F&M TRUST Franklin Financial Services Corporation 7
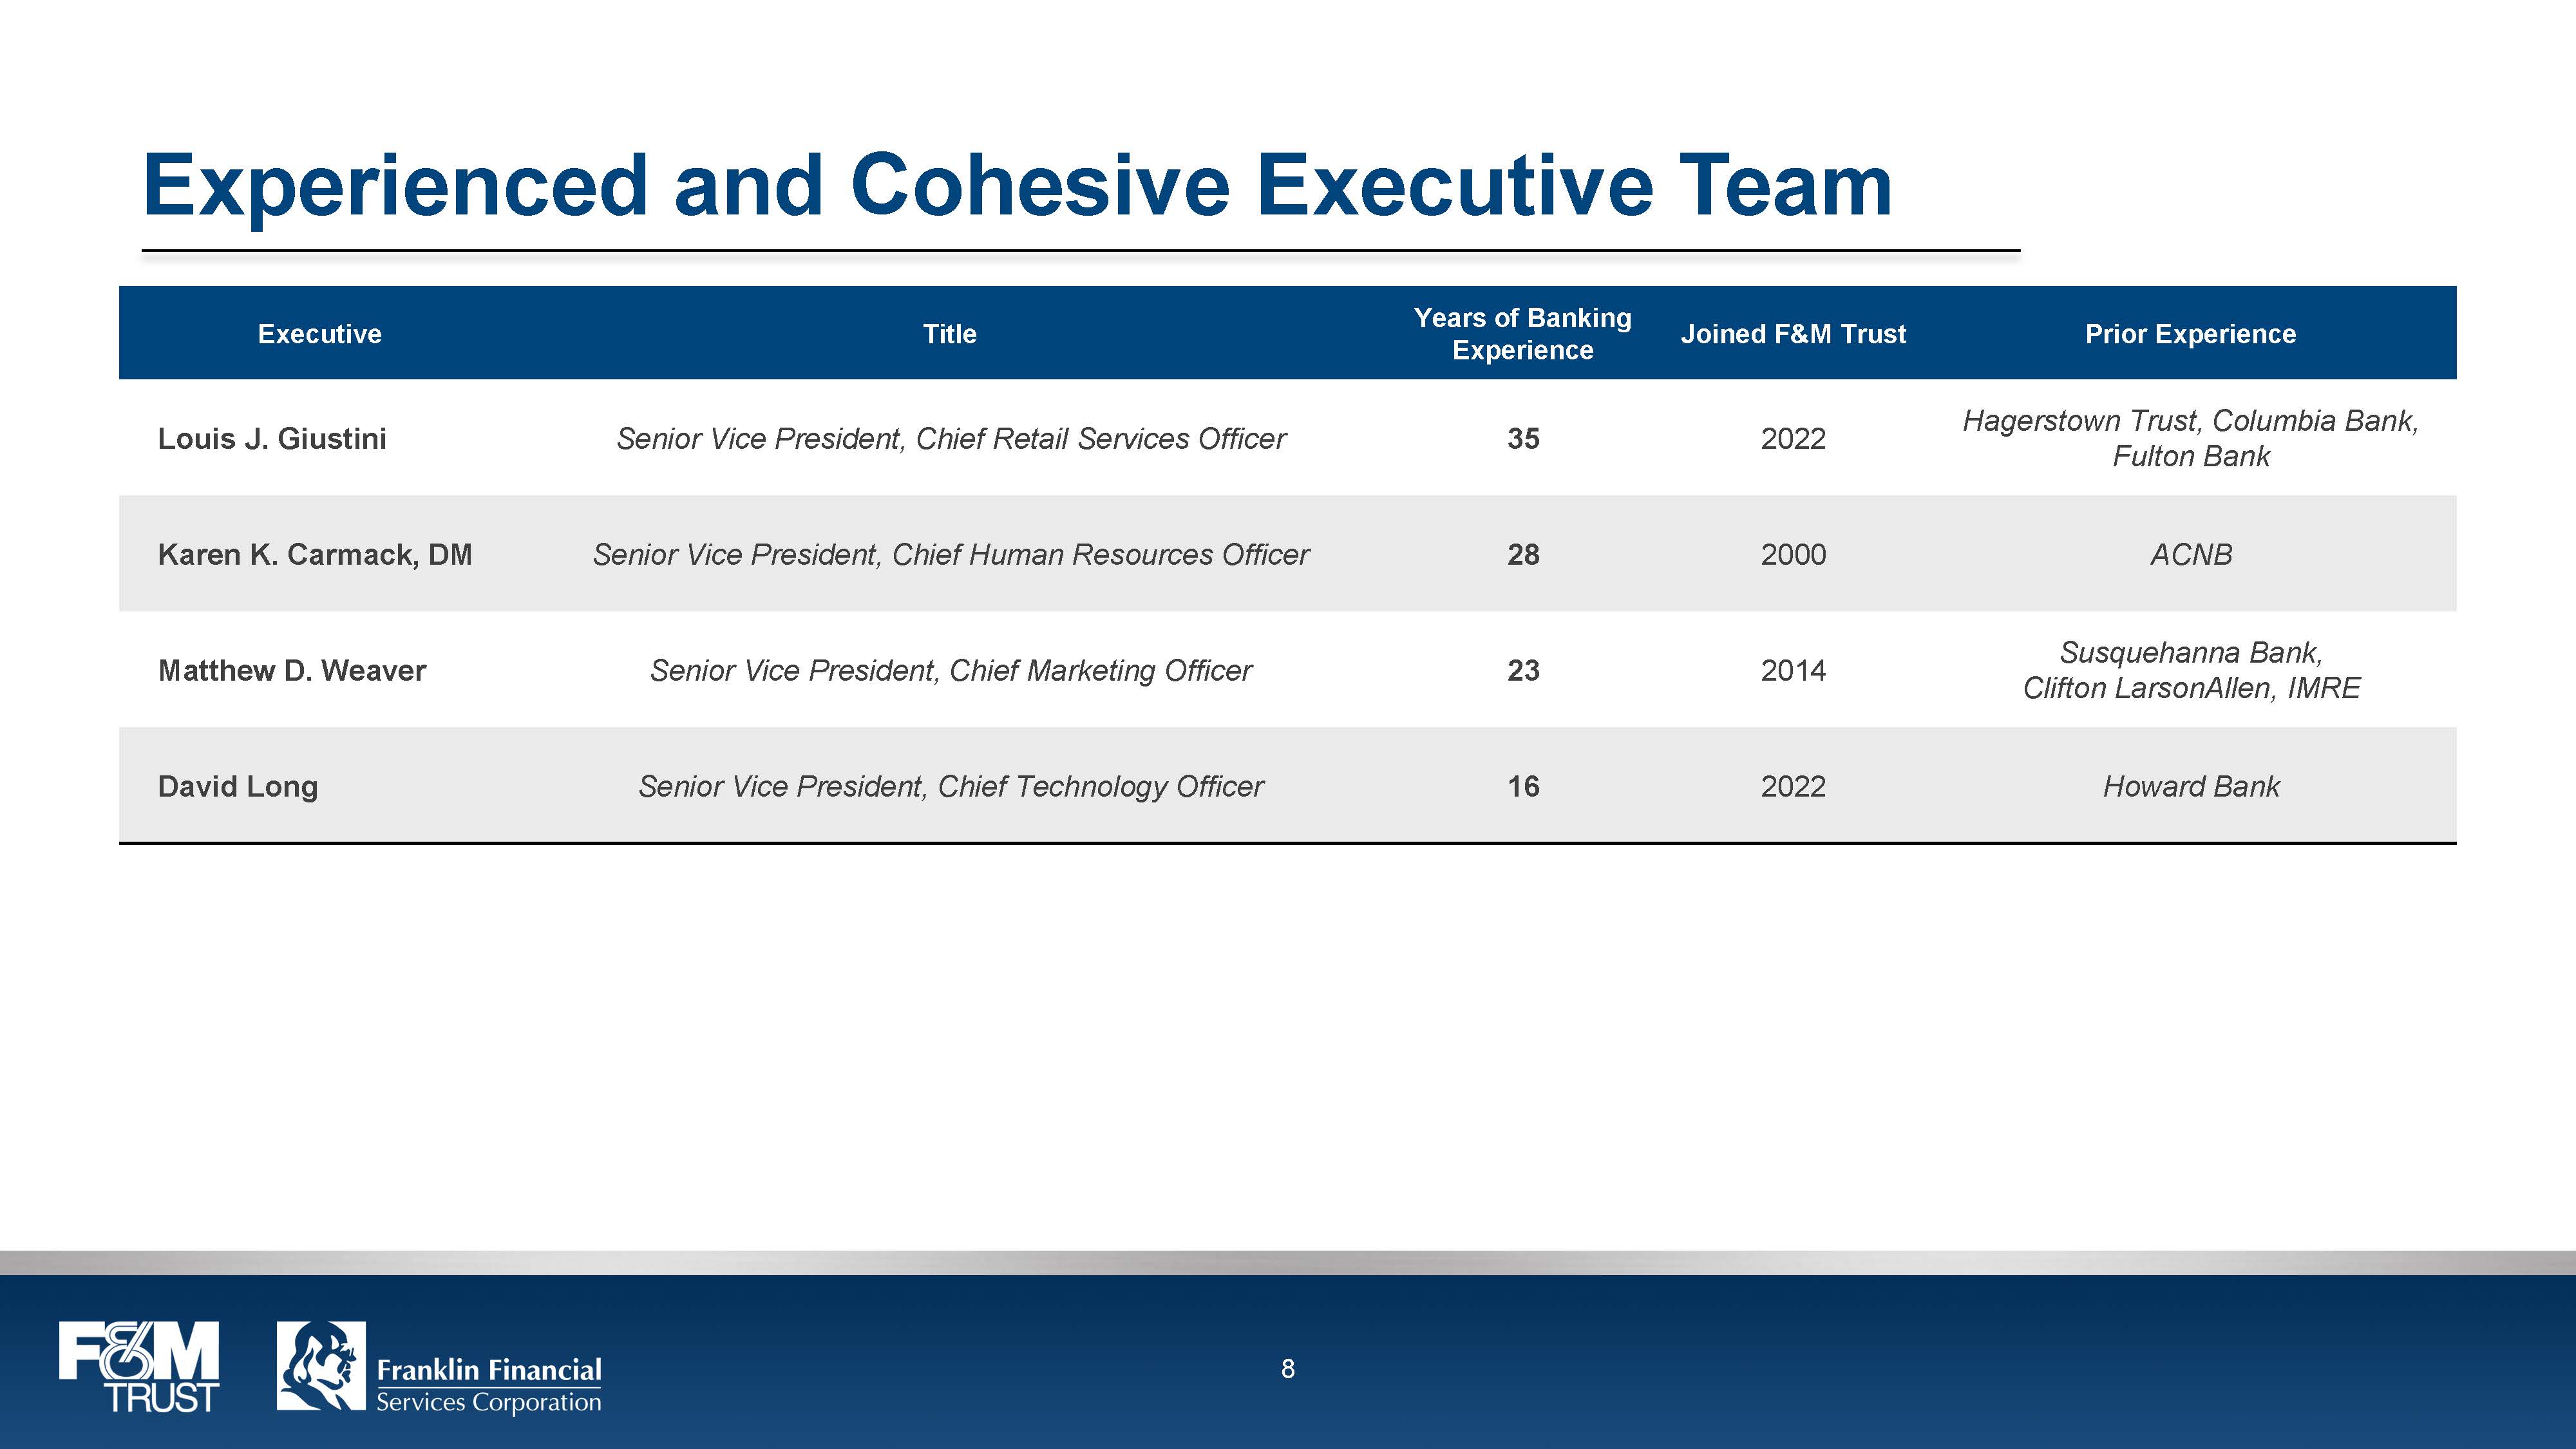
Experienced and Cohesive Executive Team Executive Title Years of Banking Experience Joined F&M Trust Prior Experience Louis J. Giustini Senior Vice President, Chief Retail Services Officer 35 2022 Hagerstown Trust, Columbia Bank, Fulton Bank Karen K. Carmack, DM Senior Vice President, Chief Human Resources Officer 28 2000 ACNB Matthew D. Weaver Senior Vice President, Chief Marketing Officer 23 2014 Susquehanna Bank, Clifton LarsonAllen, IMRE David Long Senior Vice President, Chief Technology Officer 16 2022 Howard Bank F&M TRUST Franklin Financial Services Corporation 8
Well-Established Company Market share leader in core deposit, loan, and asset-management segments in economically stable and historically growing markets Recently hired executive team members with extensive banking industry experience and market knowledge, adding to an experienced management team Consistently strong core operating fundamentals with a diverse revenue mix Strong regulatory capital position, sound risk management, and neutral to slightly asset-sensitive balance sheet positioned to benefit from rising interest rates Historically stable core deposit base, which becomes more valuable in a rising rate environment A well-diversified loan portfolio with an emphasis on small-business relationships without reliance on participation loans Accelerating digital transformation and technology adoption to support business growth and service F&M TRUST Franklin Financial Services Corporation 9
First Quarter 2023 Financial Updates Net interest income for the first quarter of 2023 was $12.8 million compared to $14.6 million for the fourth quarter of 2022 Continue to adjust deposit rates in response to market conditions Net interest margin was 3.41% for the first quarter compared to 3.58% for the fourth quarter of 2022 Provision for credit loss was $529 thousand for the first quarter of 2023 compared to $650 thousand for the fourth quarter of 2022, due primarily to loan growth Allowance for loan loss ratio of 1.31%; non-performing asset ratio of 0.01% Capital position remained strong with a total risk-based capital ratio of 17.21% and a leverage ratio of 9.58% F&M TRUST Franklin Financial Services Corporation 10
First Quarter 2023 Financial Updates Maintained the dividend at $0.32 per share for the second quarter of 2023 Loan-to-deposit ratio of 72% is up slightly and allows for lending opportunities at higher interest rates Fee income from new mortgages originated for sale in the secondary market was flat from the fourth quarter of 2022 and down $181 thousand compared to the first quarter of 2022 Deposits decreased 3.2% from year-end 2022 Loans were up 2.6% from year-end 2022, primarily in the commercial loan portfolio Sold $33 million of investment securities at a loss of $602 thousand as part of portfolio restructuring F&M TRUST Franklin Financial Services Corporation 11
Digital Transformation Registered Zelle® users increased 19.06% and mobile banking users increased 5.3% from the first quarter of 2022 to the first quarter of 2023 as customers continue to transition to digital banking channels Treasury services improved digital solutions to help business customers streamline payment and collection processes, manage liquidity, and prevent fraud, resulting in increased fee income and deposits Business online banking customers increased 9.2% from the first quarter of 2022 to the first quarter of 2023 Utilize AI-driven predictive modeling to deliver targeted marketing content through the bank’s online and mobile banking platforms, website, and at the point-of-sale Launched Salesforce in Retail, Commercial and Investment & Trust Services segments of the bank F&M TRUST Franklin Financial Services Corporation 12
Outlook for the Remainder of 2023 The Company will continue building for the future by leveraging our investments in our physical, technological, and sales infrastructure including: Further integration of Salesforce into sales, operations, and marketing Expanding our presence in the Pennsylvania and Maryland markets Expanding the use of digitization in both customer interface and operational workflows The focus on cross-selling between Commercial, Retail, and Investment & Trust Services lines of business, to the benefit of the bank’s customers, continues with improvement due to the adoption and use of Salesforce throughout the bank Commercial loan growth will continue due to the integration of new commercial relationship managers, improved underwriting processes, and growth into new regional markets for the bank F&M TRUST Franklin Financial Services Corporation 13
Outlook for the Remainder of 2023 Deposit balances will moderate due to the tension between rising rates and the bank’s efforts to control interest costs and manage liquidity needs Competition for deposits and quality loans may have an adverse effect on NIM The negative effect of Accumulate Other Comprehensive Income on book capital should level off as investments move to maturity (average portfolio duration is under 4.4 years) Fee income from the Investment & Trust Services division should continue to grow with the addition of new clients/assets and should only be moderated by the general performance of both the bond and equity markets With increased focus on finding operating efficiencies, both internally and with our external third-party vendors, we expect to see an improved efficiency ratio going into 2024 F&M TRUST Franklin Financial Services Corporation 14
Summary The Company continues to be well capitalized and positioned to successfully develop new Commercial and Investment & Trust relationships The bank is positioned to fund growth Asset quality is good, and the Company is well provisioned for losses should they occur in future quarters due to economic factors The Company is actively working to bring more digitally based products and services to its customers The Company is positioning for future growth and expansion following the completed consolidation and move to a new corporate headquarters and operations center, the addition of Salesforce, transitioning of senior leadership, and a new full-service community office in Maryland F&M TRUST Franklin Financial Services Corporation 15
Financial Updates First Quarter Ended March 31, 2023 F&M TRUST Franklin Financial Services Corporation 16
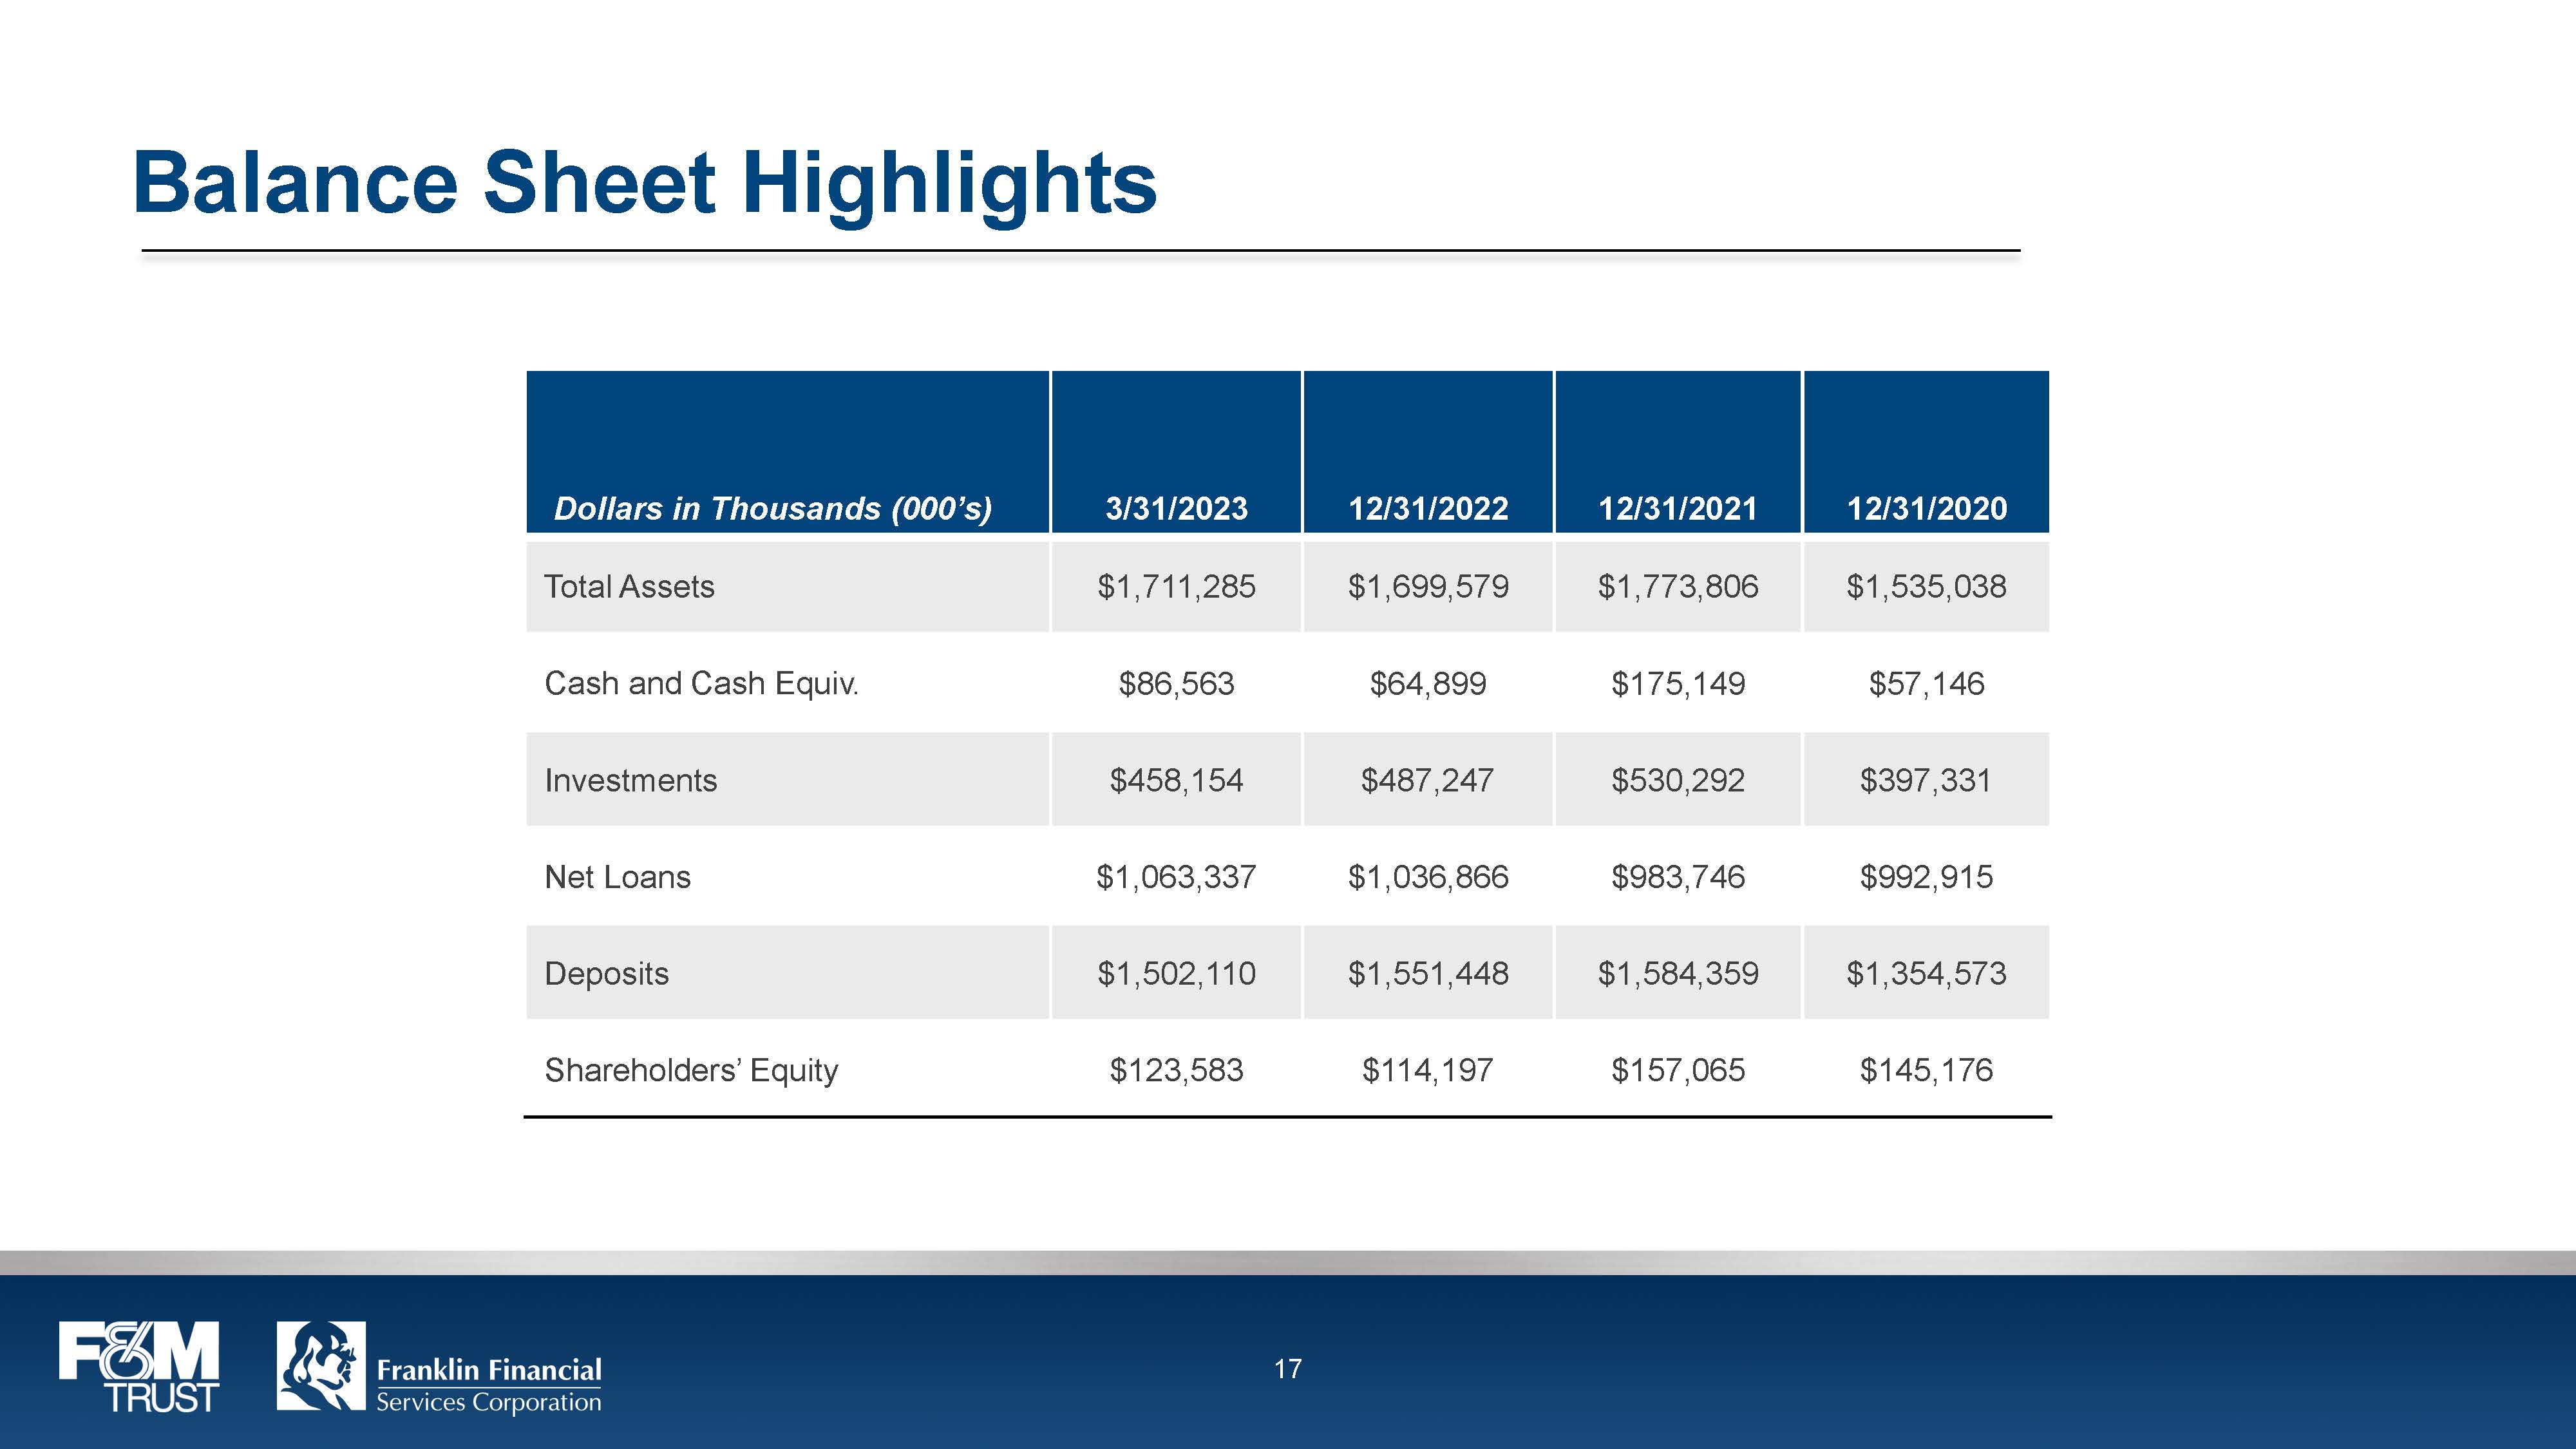
Balance Sheet Highlights Dollars in Thousands (000’s) 3/31/2023 12/31/2022 12/31/2021 12/31/2020 Total Assets $1,711,285 $1,699,579 $1,773,806 $1,535,038 Cash and Cash Equiv. $86,563 $64,899 $175,149 $57,146 Investments $458,154 $487,247 $530,292 $397,331 Net Loans $1,063,337 $1,036,866 $983,746 $992,915 Deposits $1,502,110 $1,551,448 $1,584,359 $1,354,573 Shareholders’ Equity $123,583 $114,197 $157,065 $145,176 F&M TRUST Franklin Financial Services Corporation 17
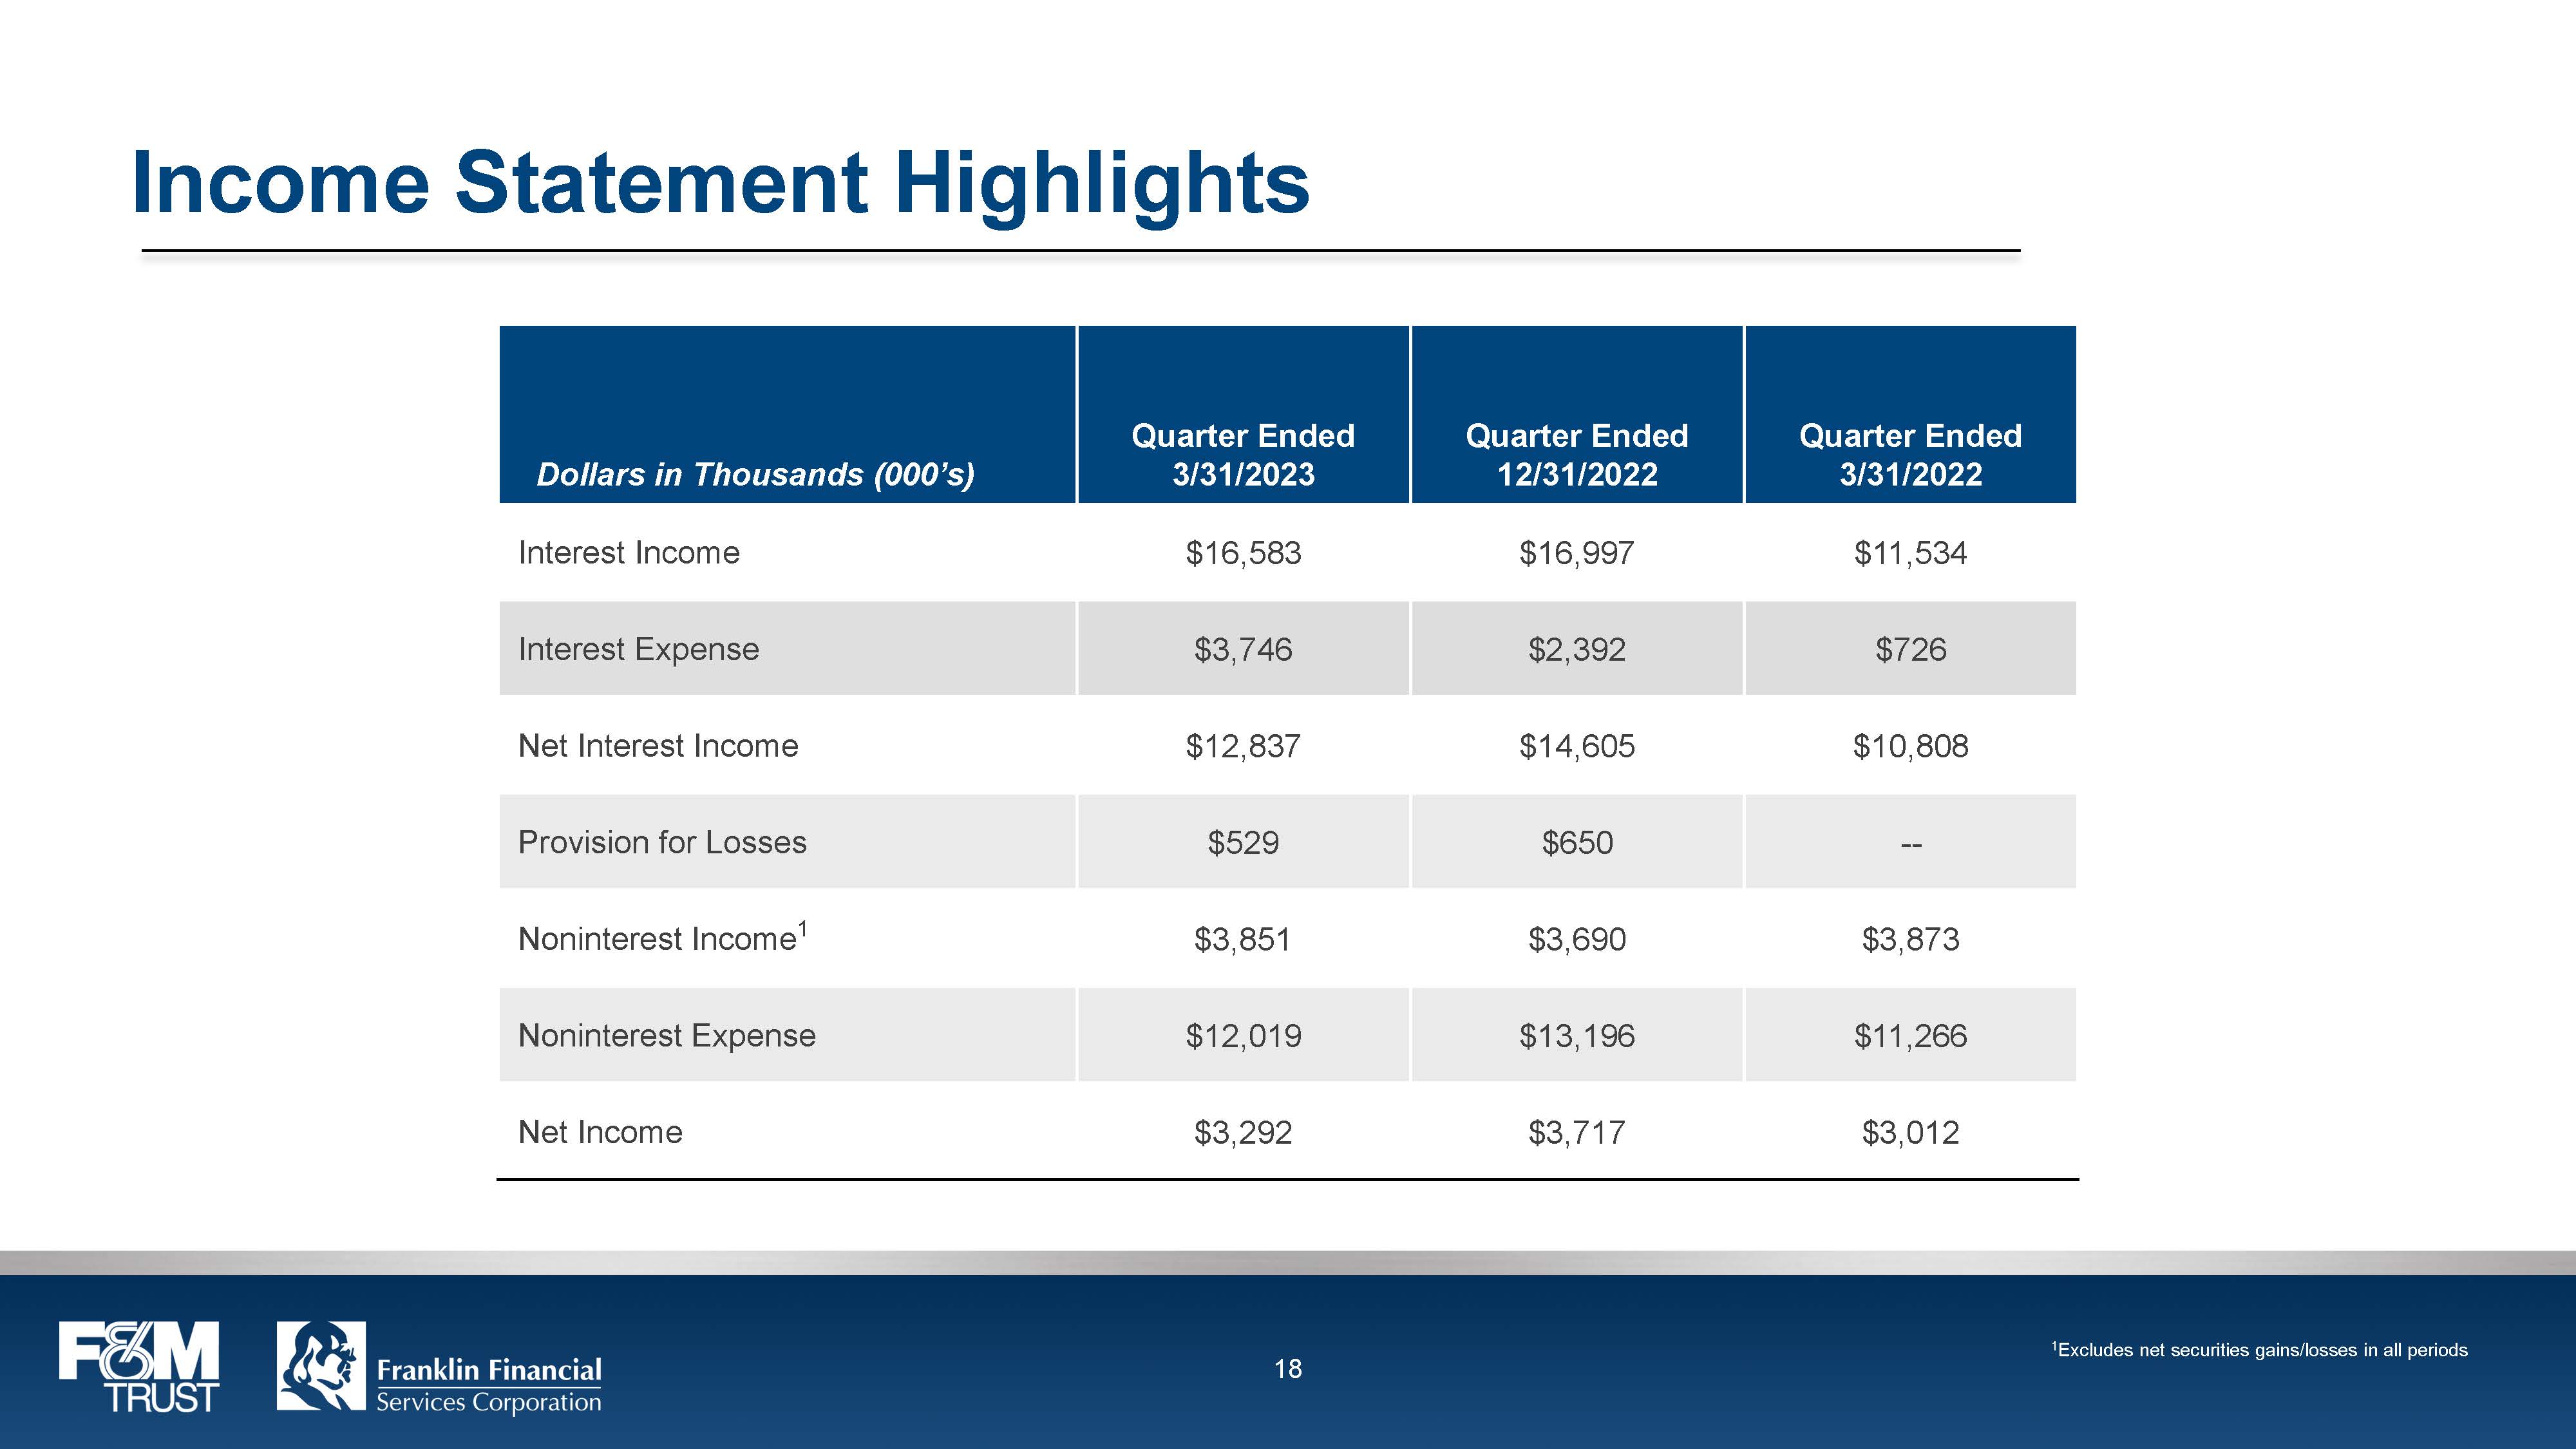
Income Statement Highlights Dollars in Thousands (000’s) Quarter Ended 3/31/2023 Quarter Ended 12/31/2022 Quarter Ended 3/31/2022 Interest Income $16,583 $16,997 $11,534 Interest Expense $3,746 $2,392 $726 Net Interest Income $12,837 $14,605 $10,808 Provision for Losses $529 $650 -- Noninterest Income1 $3,851 $3,690 $3,873 Noninterest Expense $12,019 $13,196 $11,266 Net Income $3,292 $3,717 $3,012 F&M TRUST Franklin Financial Services Corporation 18 1Excludes net securities gains/losses in all periods
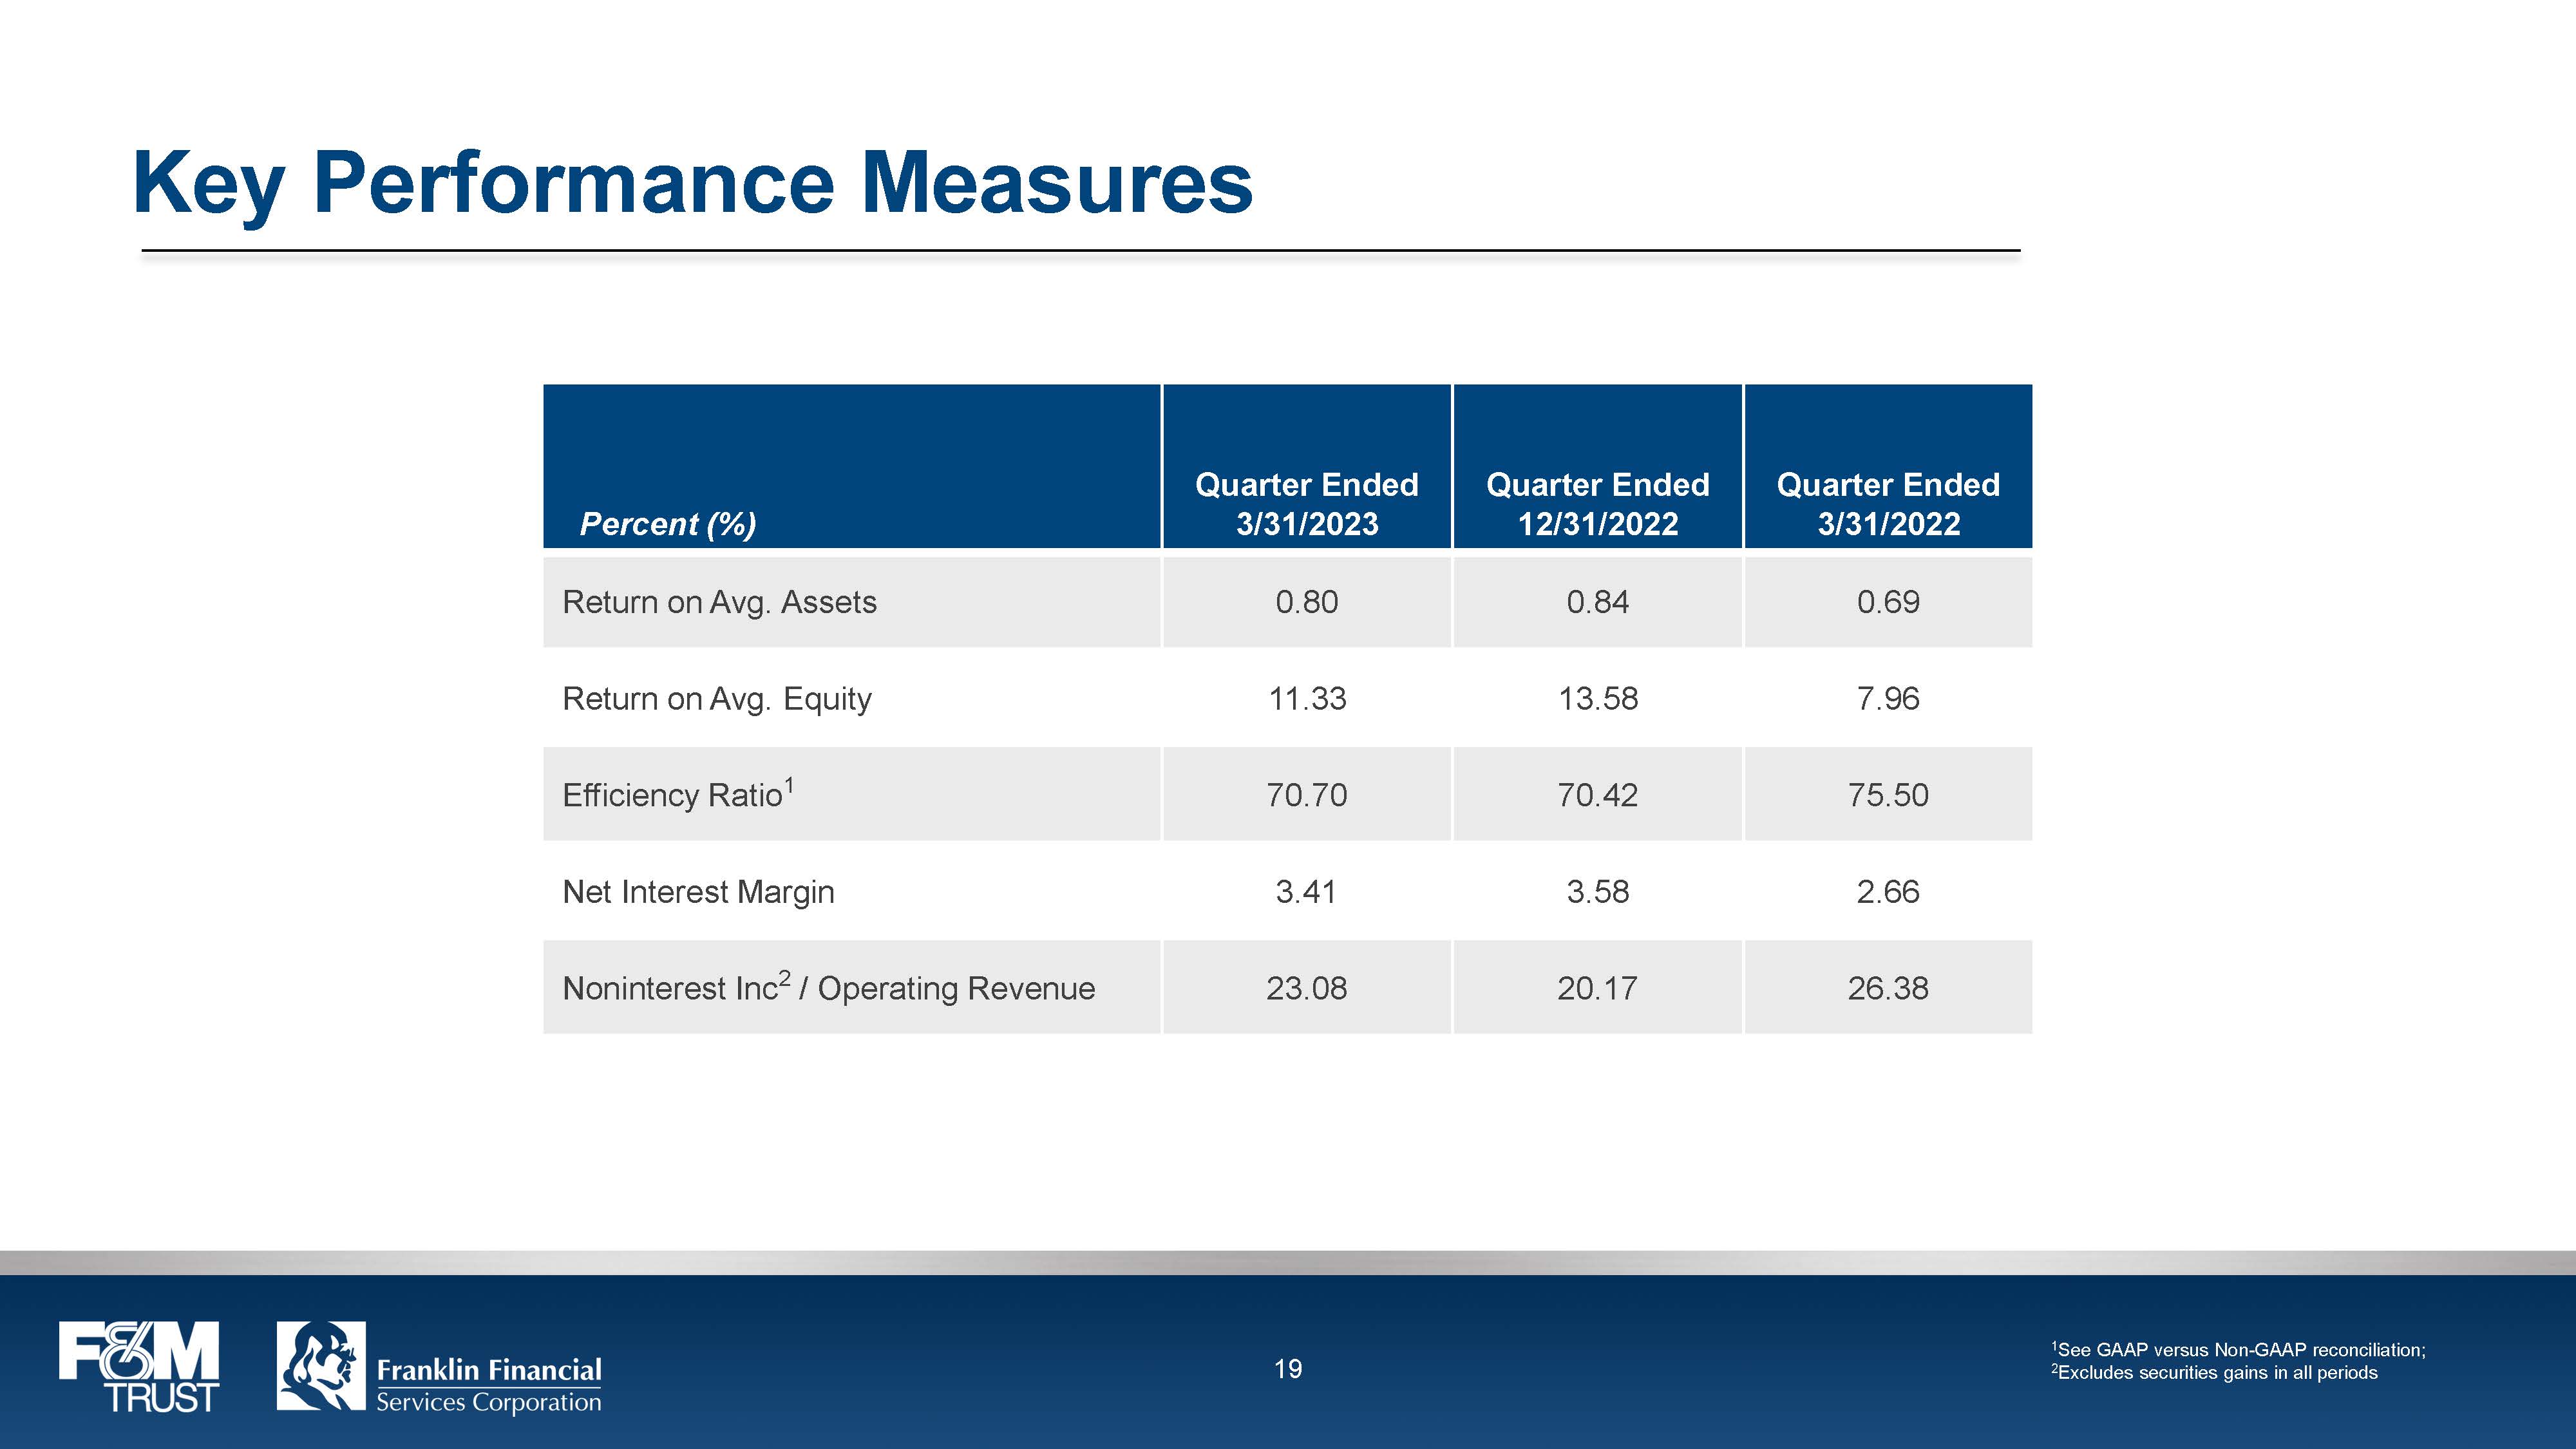
Key Performance Measures Percent (%) Quarter Ended 3/31/2023 Quarter Ended 12/31/2022 Quarter Ended 3/31/2022 Return on Avg. Assets 0.80 0.84 0.69 Return on Avg. Equity 11.33 13.58 7.96 Efficiency Ratio1 70.70 70.42 75.50 Net Interest Margin 3.41 3.58 2.66 Noninterest Inc2 / Operating Revenue 23.08 20.17 26.38 F&M TRUST Franklin Financial Services Corporation 19 1See GAAP versus Non-GAAP reconciliation; 2Excludes securities gains in all periods
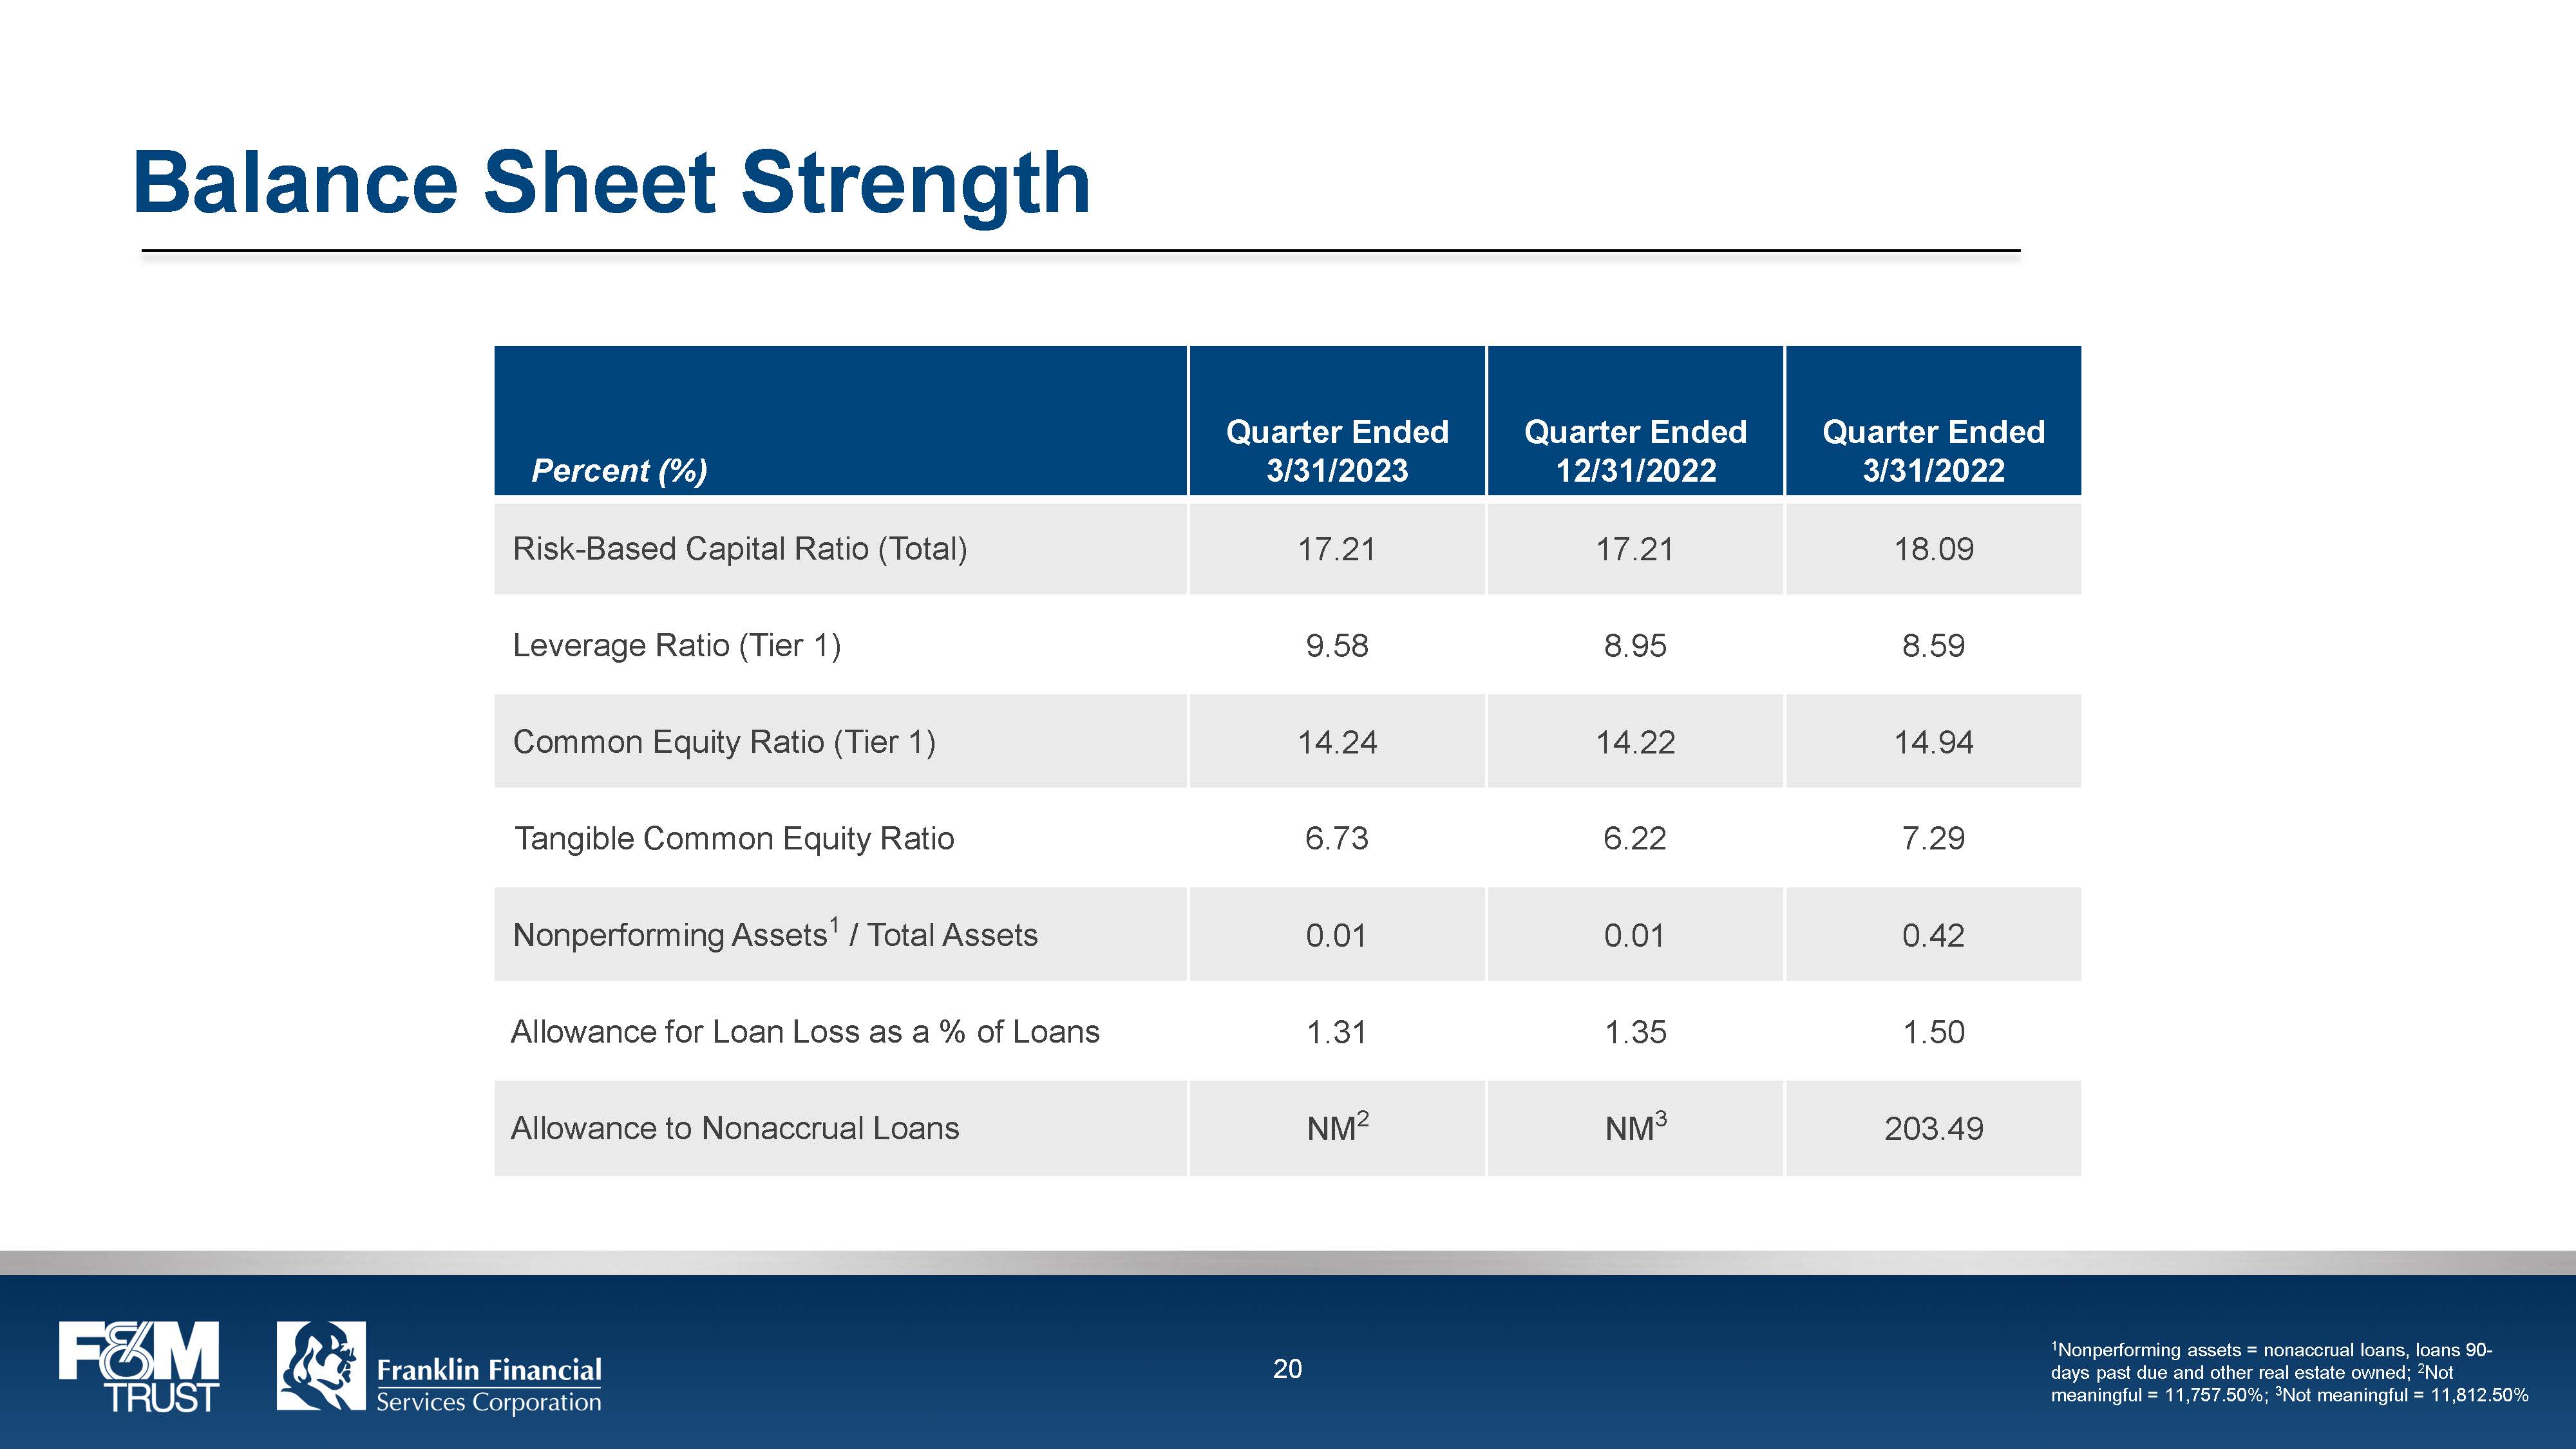
Balance Sheet Strength Percent (%) Quarter Ended 3/31/2023 Quarter Ended 12/31/2022 Quarter Ended 3/31/2022 Risk-Based Capital Ratio (Total) 17.21 17.21 18.09 Leverage Ratio (Tier 1) 9.58 8.95 8.59 Common Equity Ratio (Tier 1) 14.24 14.22 14.94 Tangible Common Equity Ratio 6.73 6.22 7.29 Nonperforming Assets1 / Total Assets 0.01 0.01 0.42 Allowance for Loan Loss as a % of Loans 1.31 1.35 1.50 Allowance to Nonaccrual Loans NM2 NM3 203.49 F&M TRUST Franklin Financial Services Corporation 20 1Nonperforming assets = nonaccrual loans, loans 90-days past due and other real estate owned; 2Not meaningful = 11,757.50%; 3Not meaningful = 11,812.50%
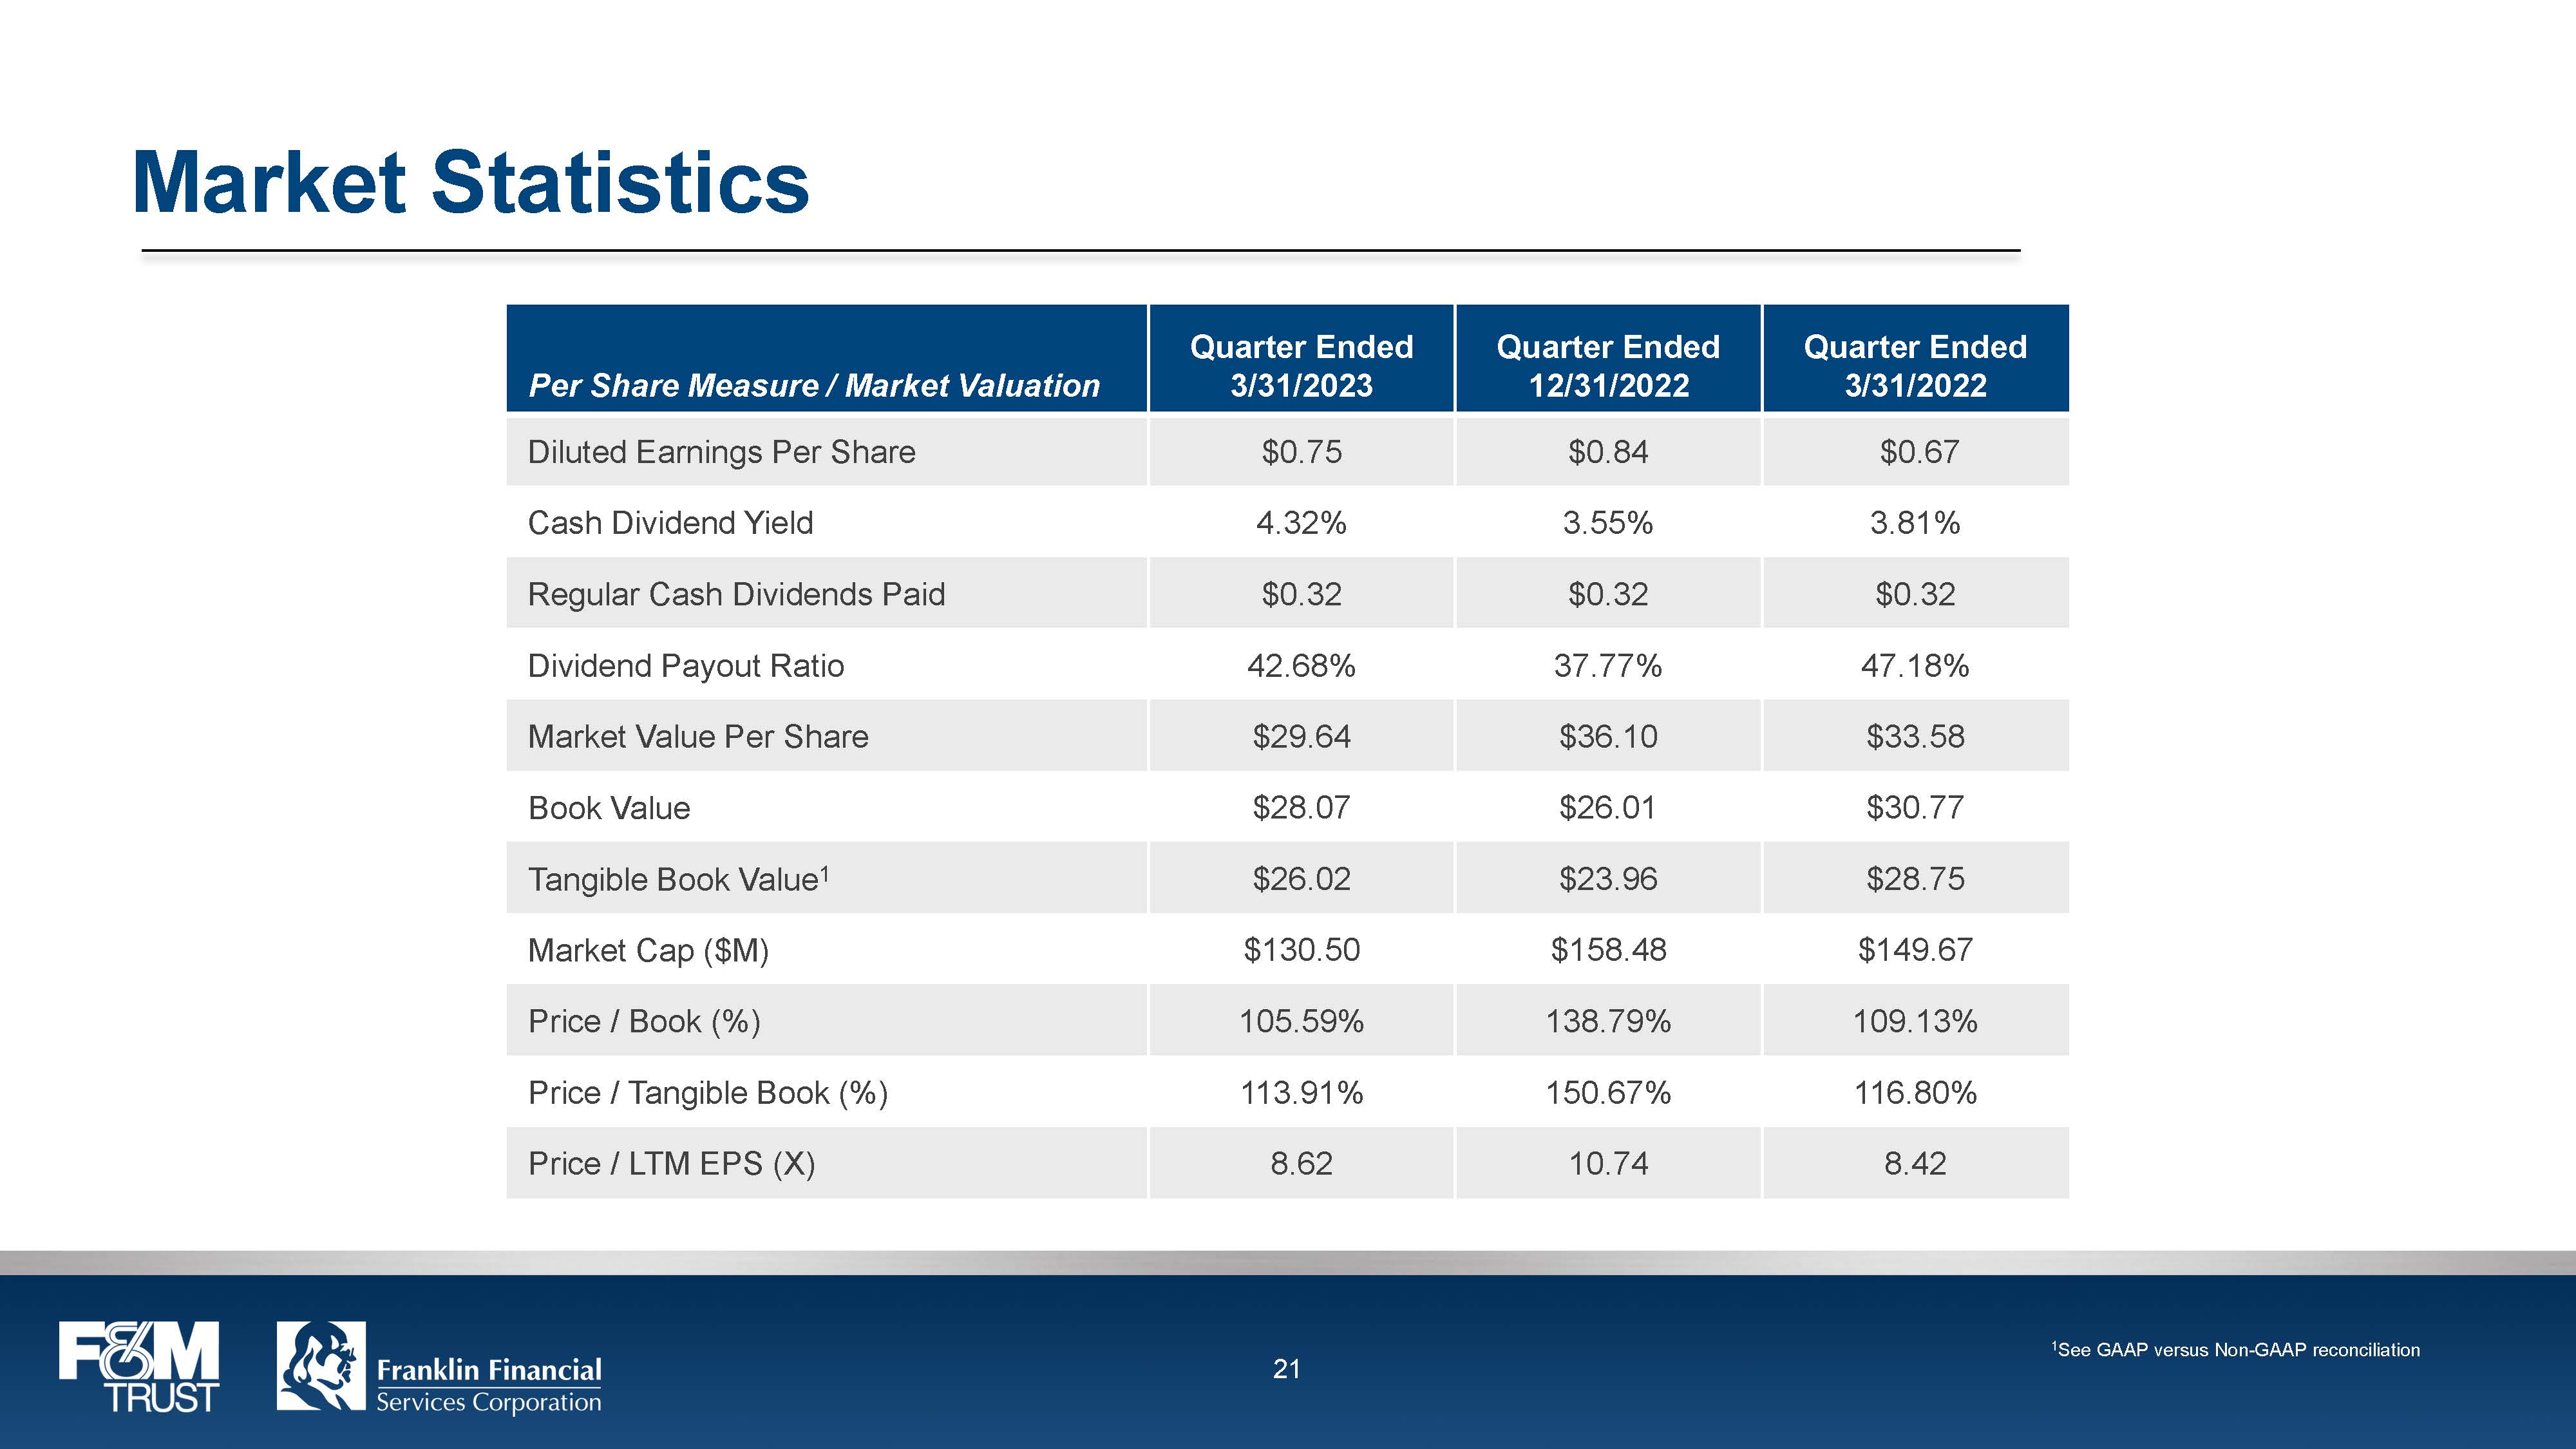
Market Statistics Per Share Measure / Market Valuation Quarter Ended 3/31/2023 Quarter Ended 12/31/2022 Quarter Ended 3/31/2022 Diluted Earnings Per Share $0.75 $0.84 $0.67 Cash Dividend Yield 4.32% 3.55% 3.81% Regular Cash Dividends Paid $0.32 $0.32 $0.32 Dividend Payout Ratio 42.68% 37.77% 47.18% Market Value Per Share $29.64 $36.10 $33.58 Book Value $28.07 $26.01 $30.77 Tangible Book Value1 $26.02 $23.96 $28.75 Market Cap ($M) $130.50 $158.48 $149.67 Price / Book (%) 105.59% 138.79% 109.13% Price / Tangible Book (%) 113.91% 150.67% 116.80% Price / LTM EPS (X) 8.62 10.74 8.42 F&M TRUST Franklin Financial Services Corporation 21 1See GAAP versus Non-GAAP reconciliation
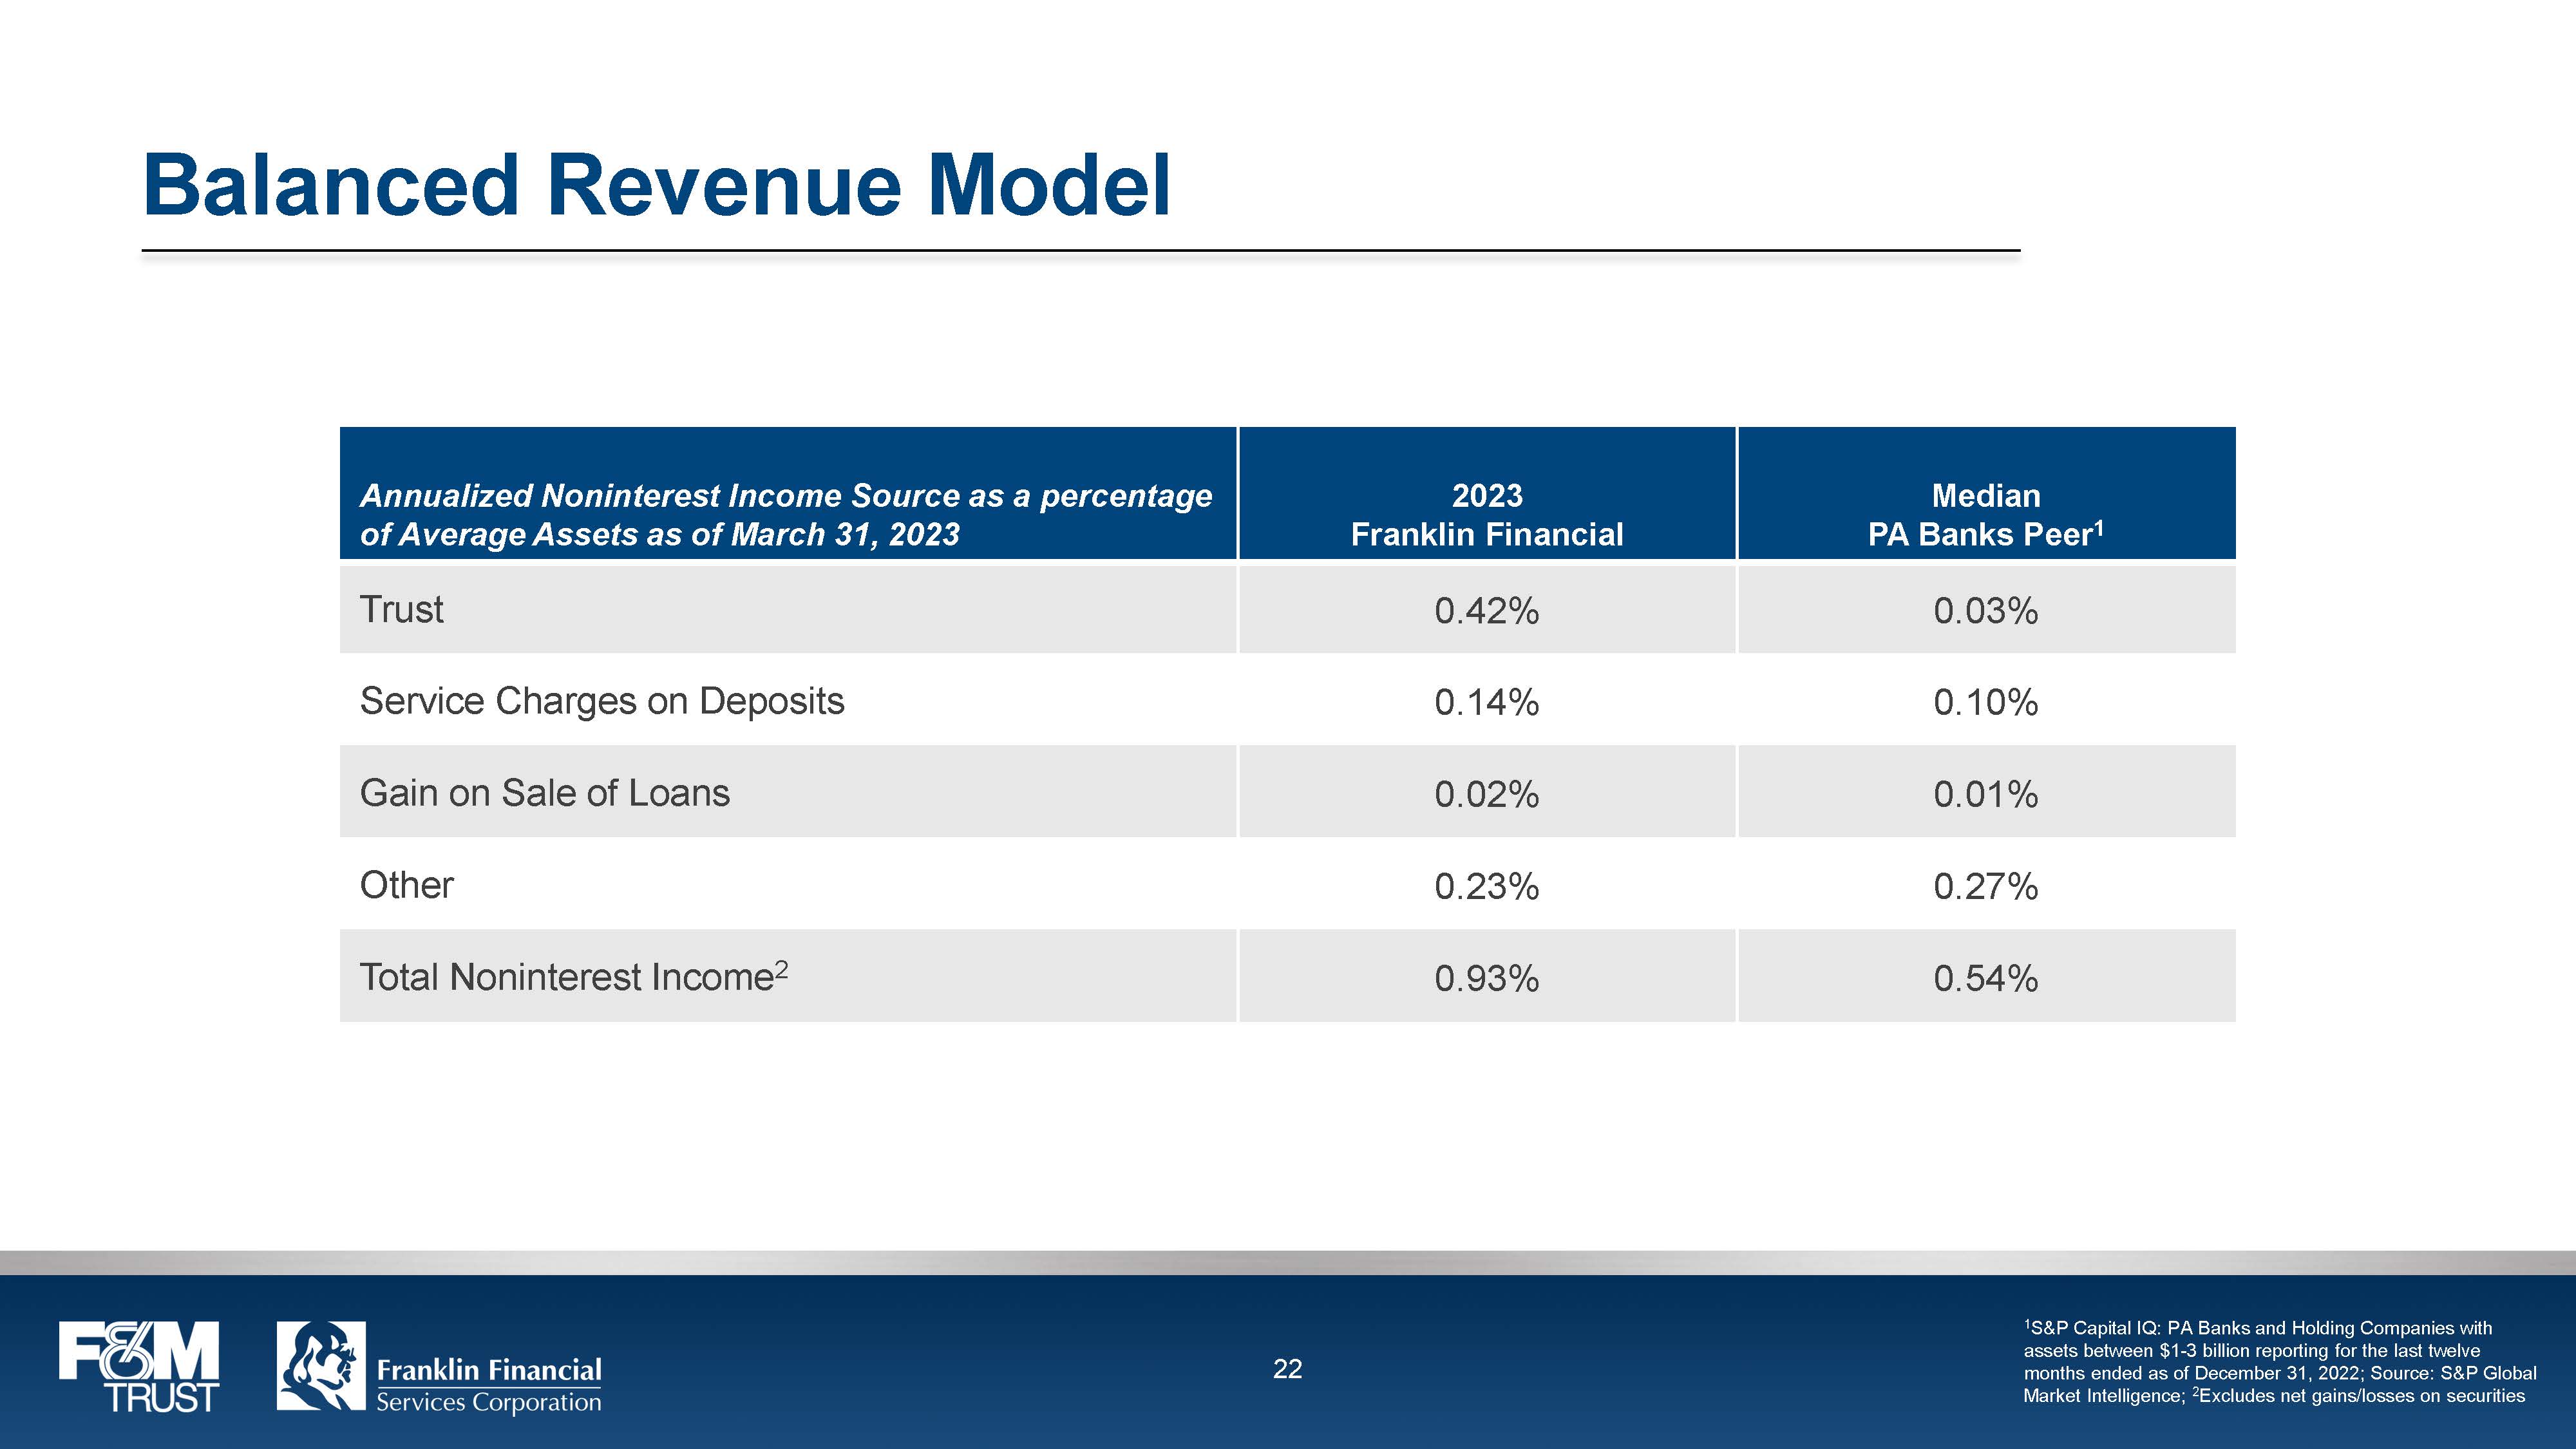
Balanced Revenue Model Annualized Noninterest Income Source as a percentage of Average Assets as of March 31, 2023 2023 Franklin Financial Median PA Banks Peer1 Trust 0.42% 0.03% Service Charges on Deposits 0.14% 0.10% Gain on Sale of Loans 0.02% 0.01% Other 0.23% 0.27% Total Noninterest Income2 0.93% 0.54% F&M TRUST Franklin Financial Services Corporation 22 1S&P Capital IQ: PA Banks and Holding Companies with assets between $1-3 billion reporting for the last twelve months ended as of December 31, 2022; Source: S&P Global Market Intelligence; 2Excludes net gains/losses on securities
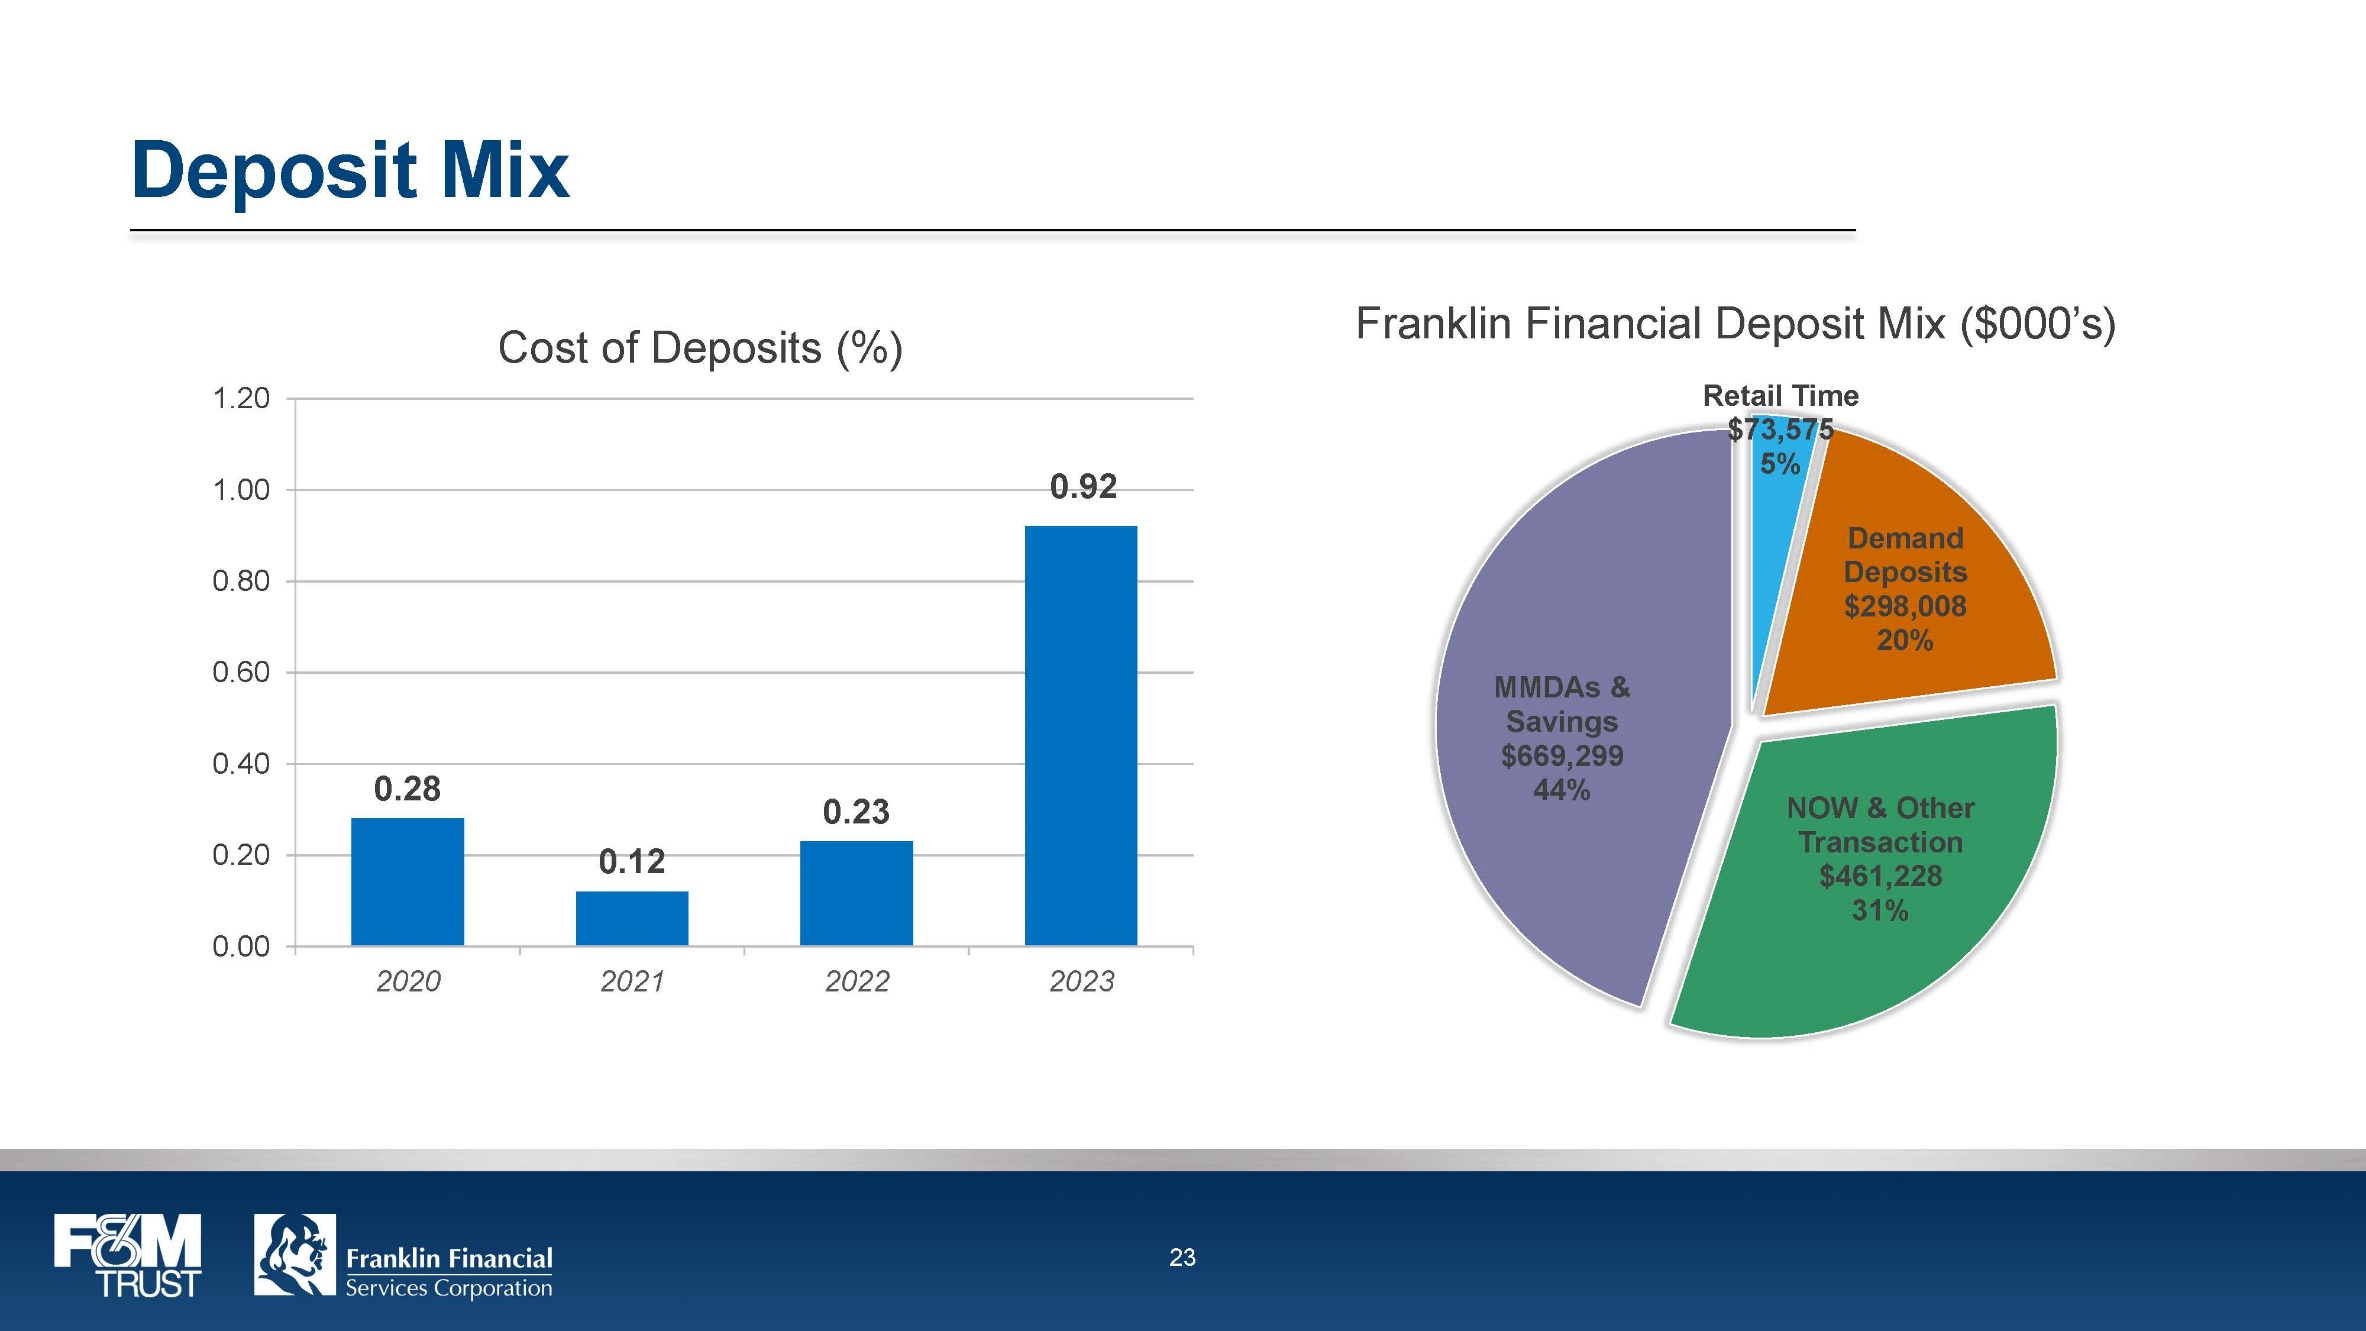
Deposit Mix 0.28 0.12 0.23 0.92 2020 2021 2022 2023 Cost of Deposits (%) Franklin Financial Deposit Mix ($000’s) Retail Time $73,575 5% Demand Deposits $298,008 20% NOW & Other Transaction $461,228 31% MMDAs & Savings $669,299 44% F&M TRUST Franklin Financial Services Corporation 23
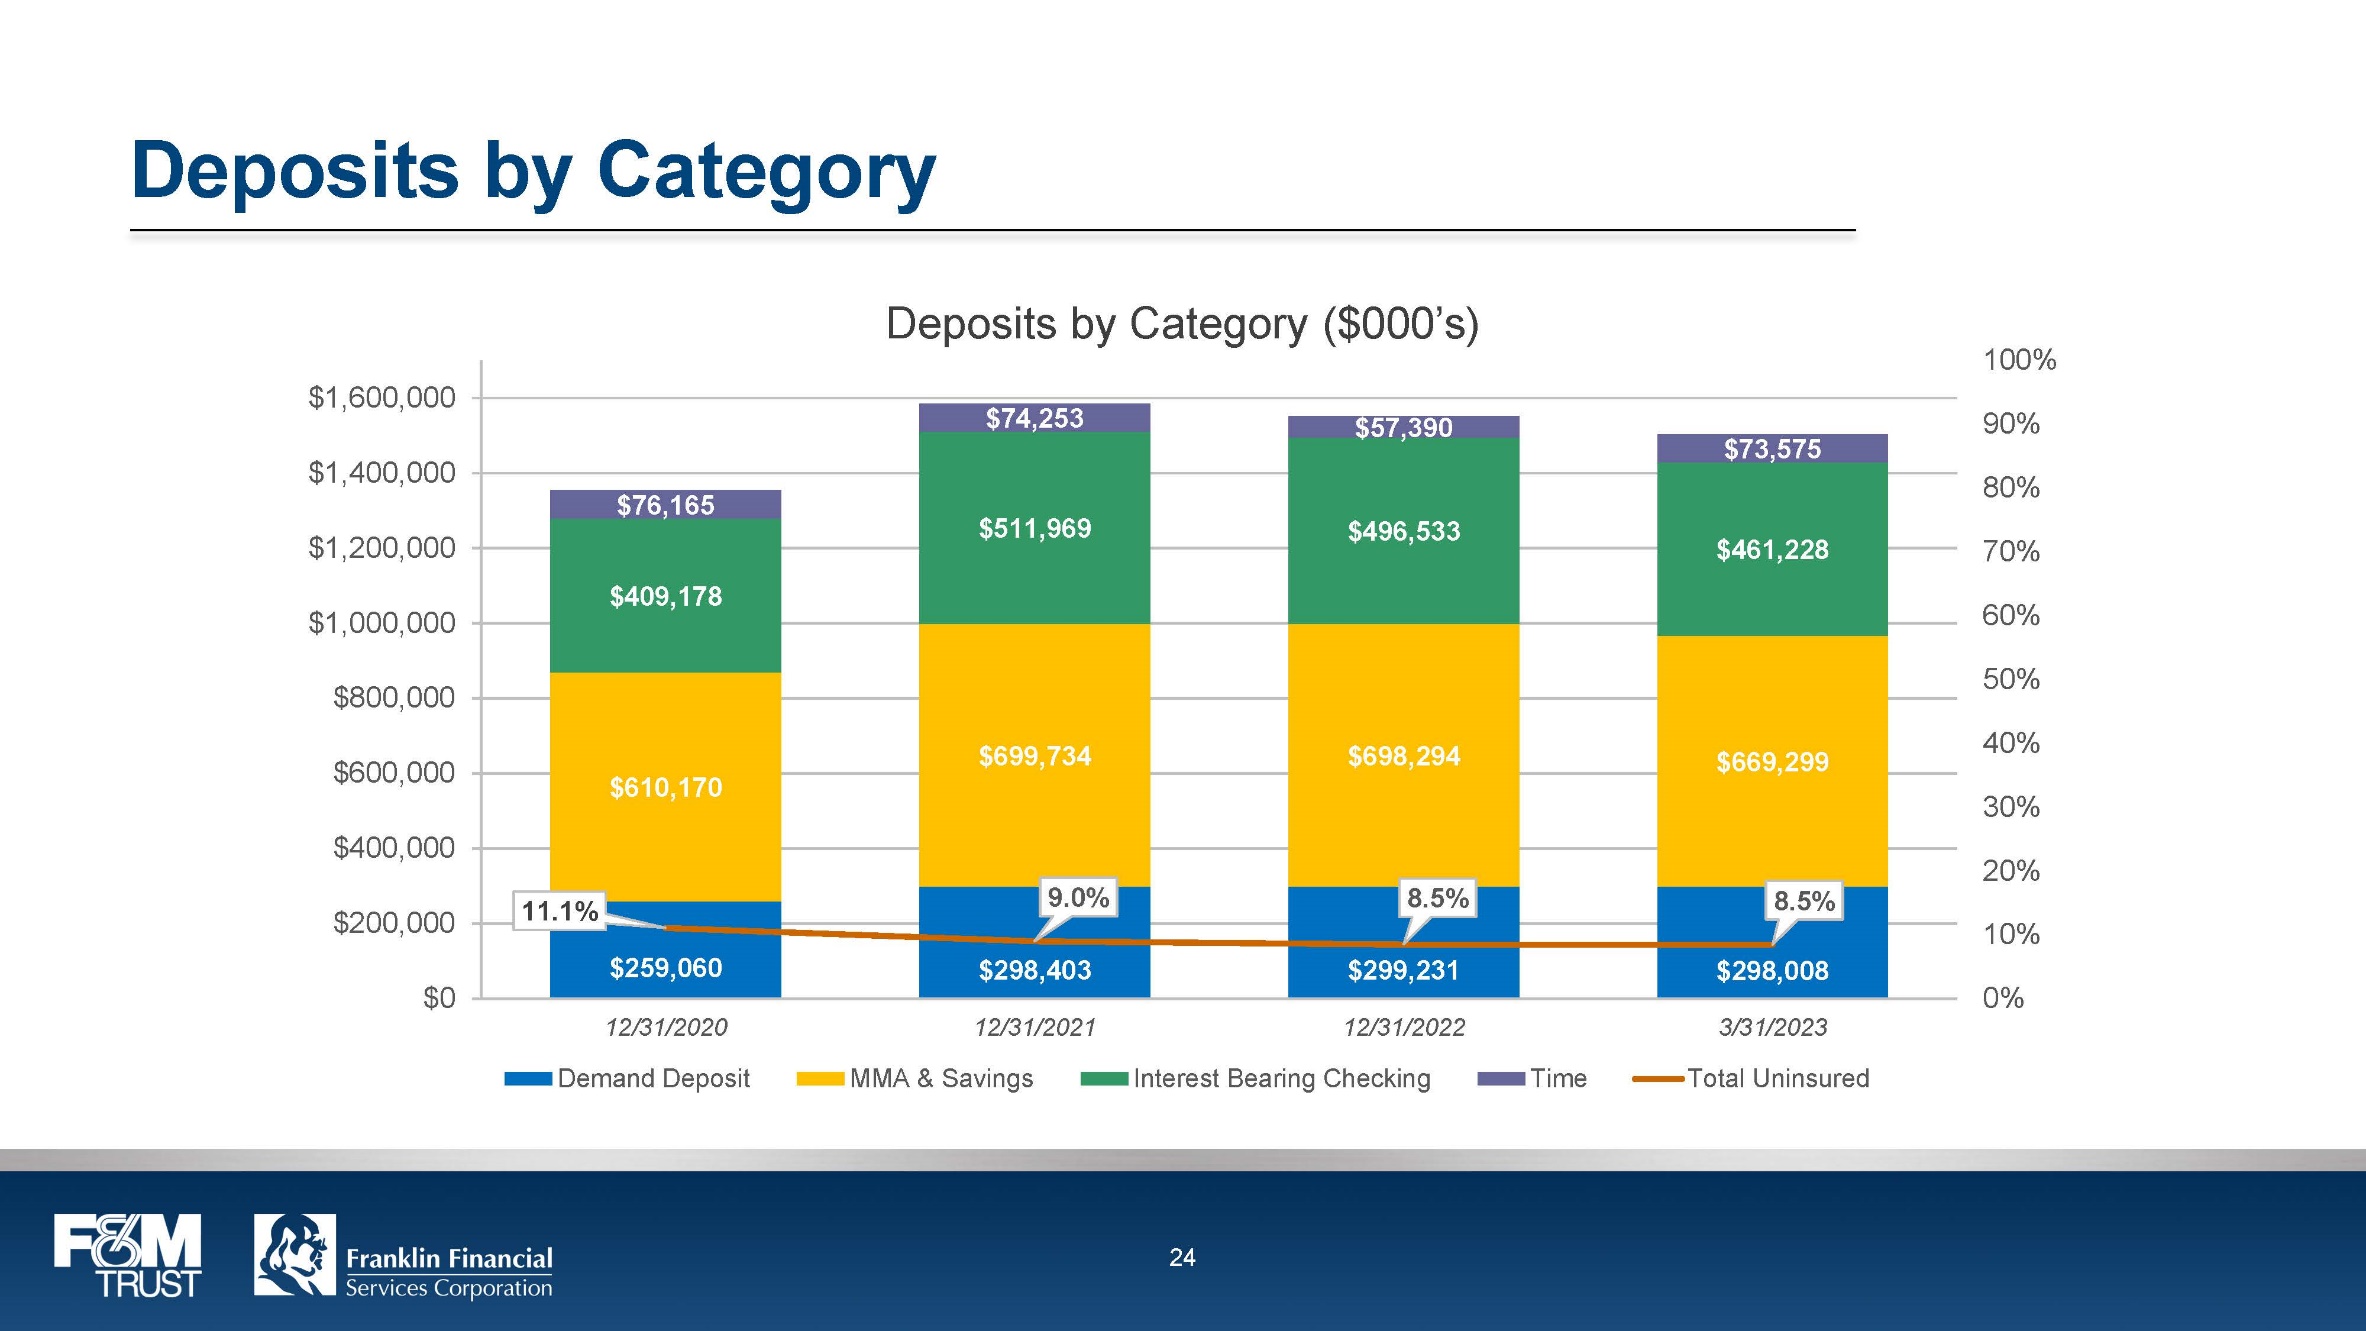
Deposits by Category Deposits by Category ($000’s) $76,165 $74,253 $57,390 $73,575 $409,178 $511,969 $469,533 $461,228 $610,170 $699,731 $698,294 $669,299 11.1% 9.0% 8.5% 8.5% $259,060 $298,403 $299,231 $298,008 12/31/2020 12/31/2021 12/31/2022 3/31/2023 Demand Deposits MMA & Savings Interest Bearing Checking Time Total Uninsured F&M TRUST Franklin Financial Services Corporation 24
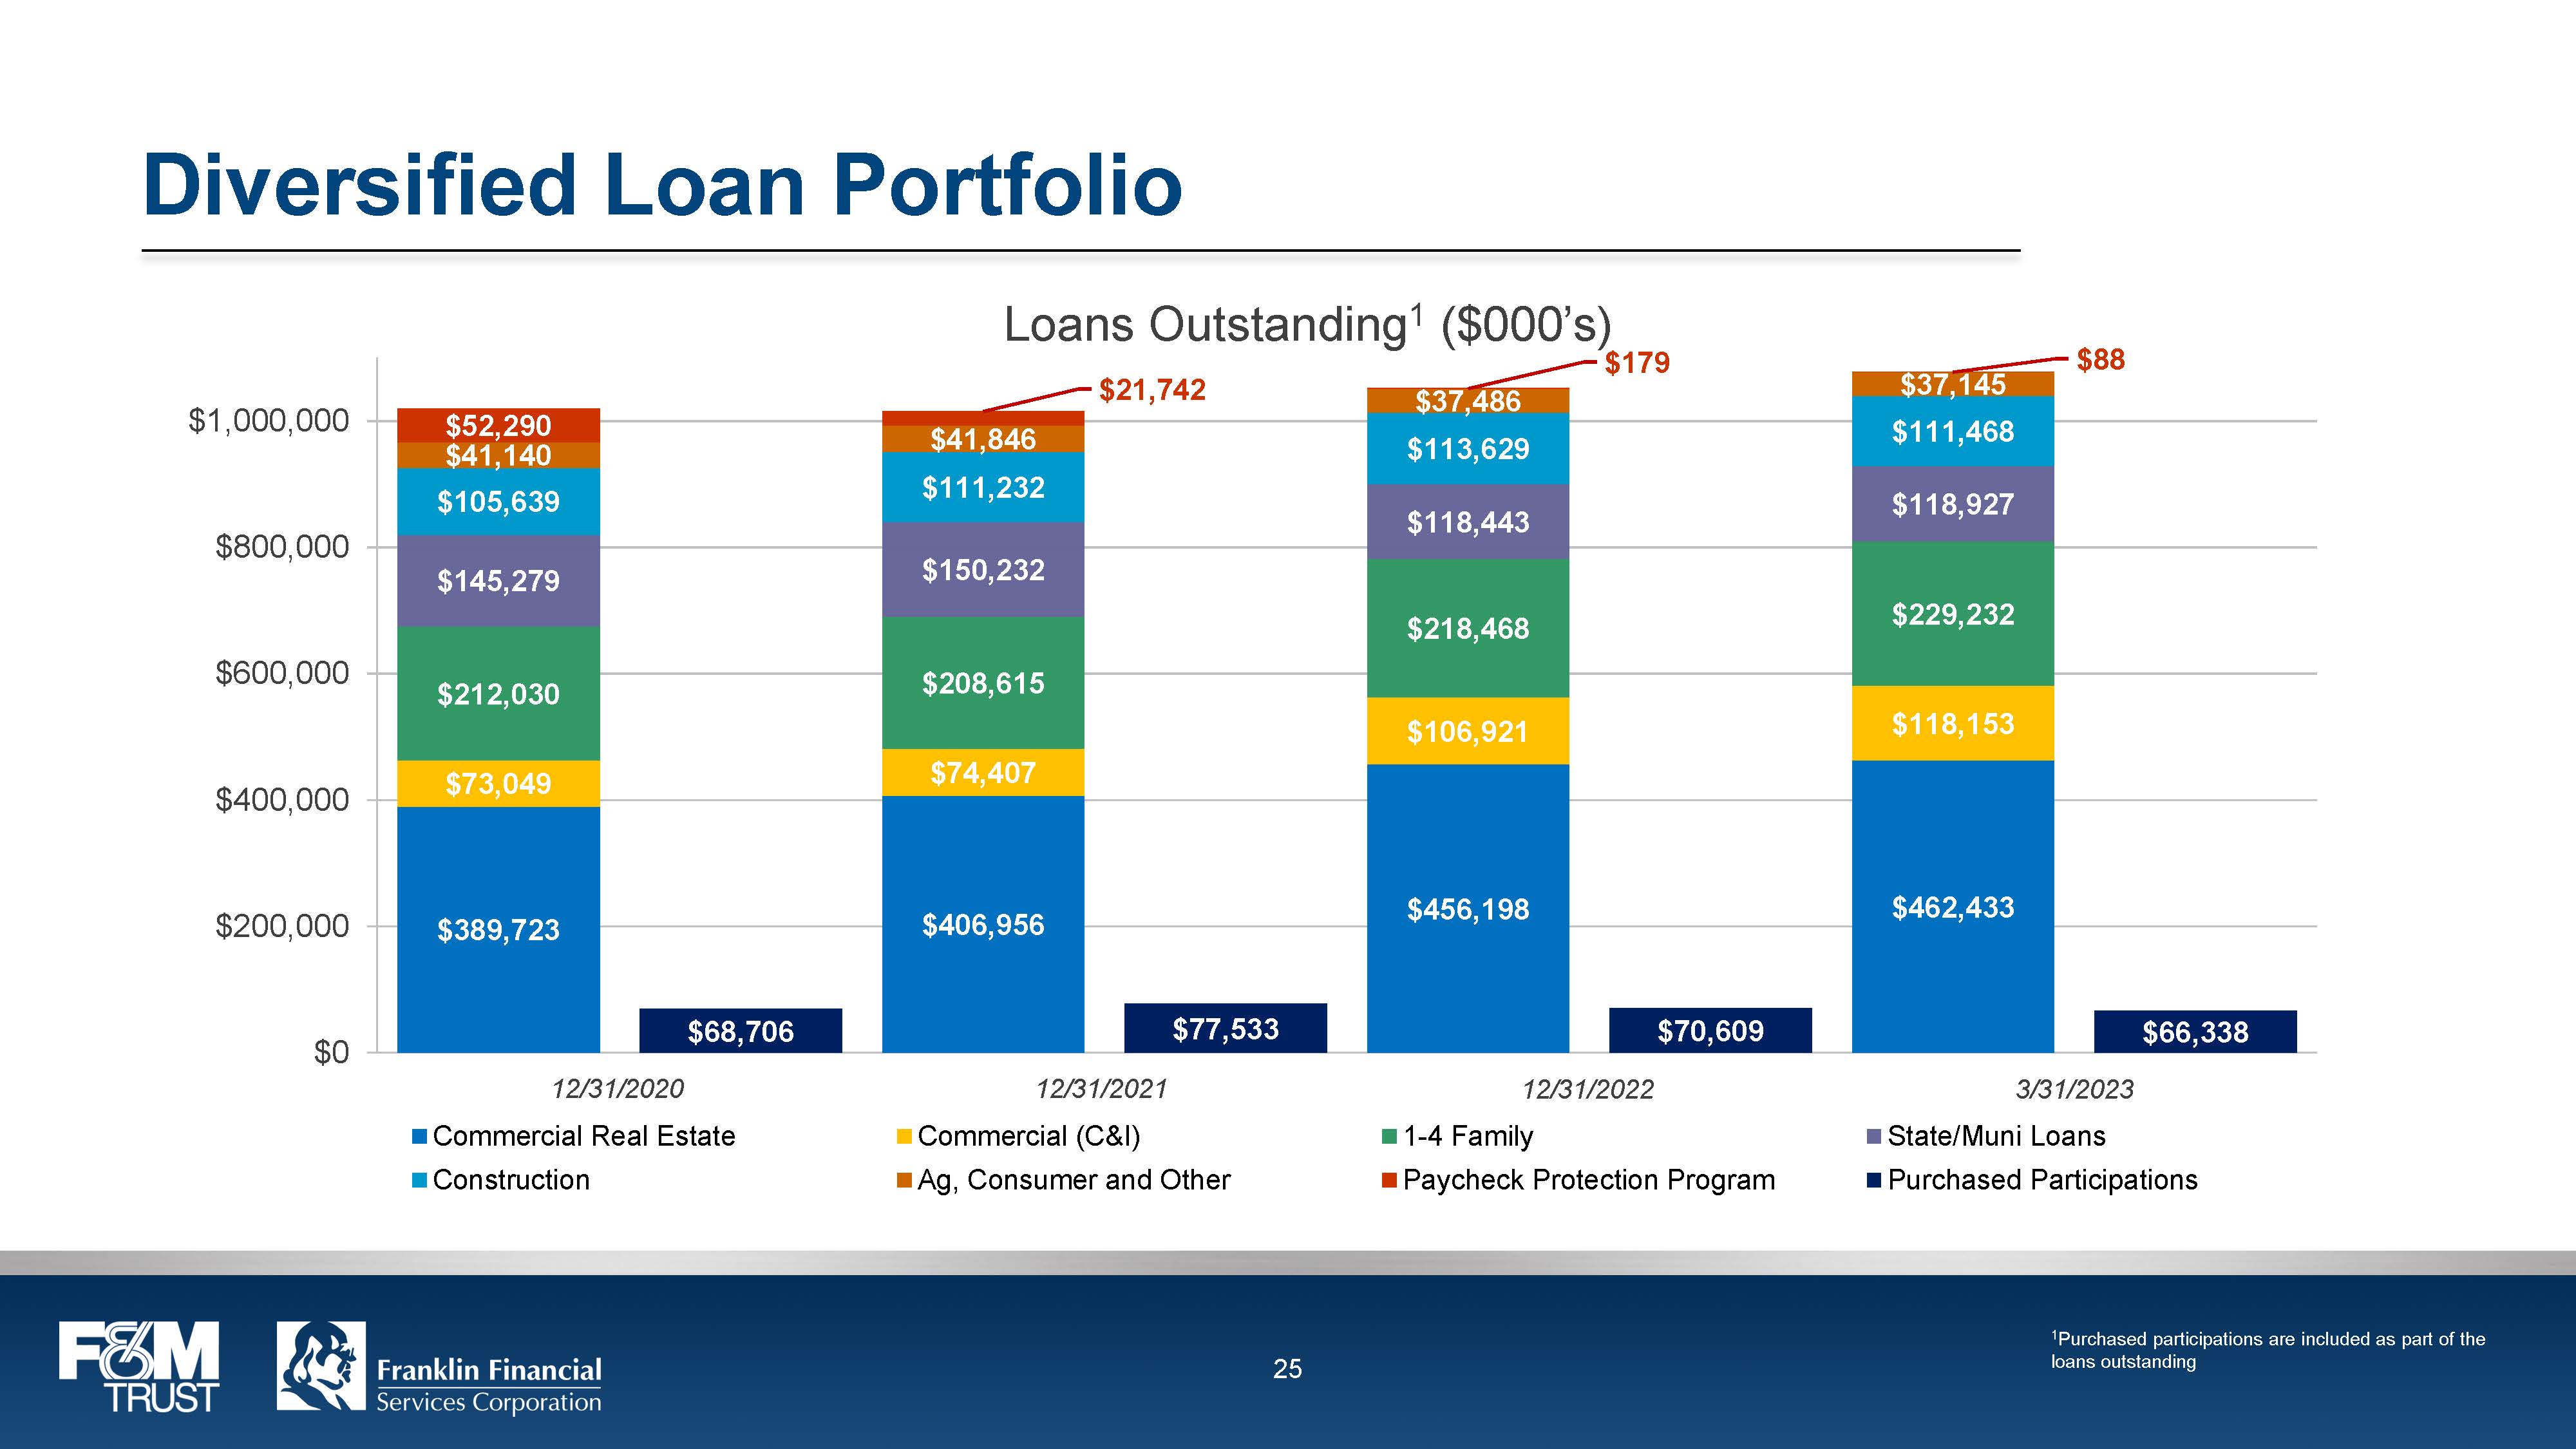
Diversified Loan Portfolio Loans Outstanding1 ($000’s) $52,290 $21,742 $179 $88 $41,140 $41,846 $37,486 $37,145 $105,639 $111,232 $113,629 $111,468 $145,279 $150,232 $118,443 $118,927 $212,030 $208,615 $218,468 $229,232 $73,049 $74,407 $106,921 $118,153 $389,723 $406,956 $456,198 $46,433 $68,703 $77,533 $70,609 $66,338 12/31/2020 12/31/2021 12/31/2022 3/31/2023 Commercial Real Estate Commercial (C&I) 1-4 Family State/Muni Loans Construction Ag, Consumer and Other Paycheck Protection Program Purchased Participation F&M TRUST Franklin Financial Services Corporation 25 1Purchased participations are included as part of the loans outstanding
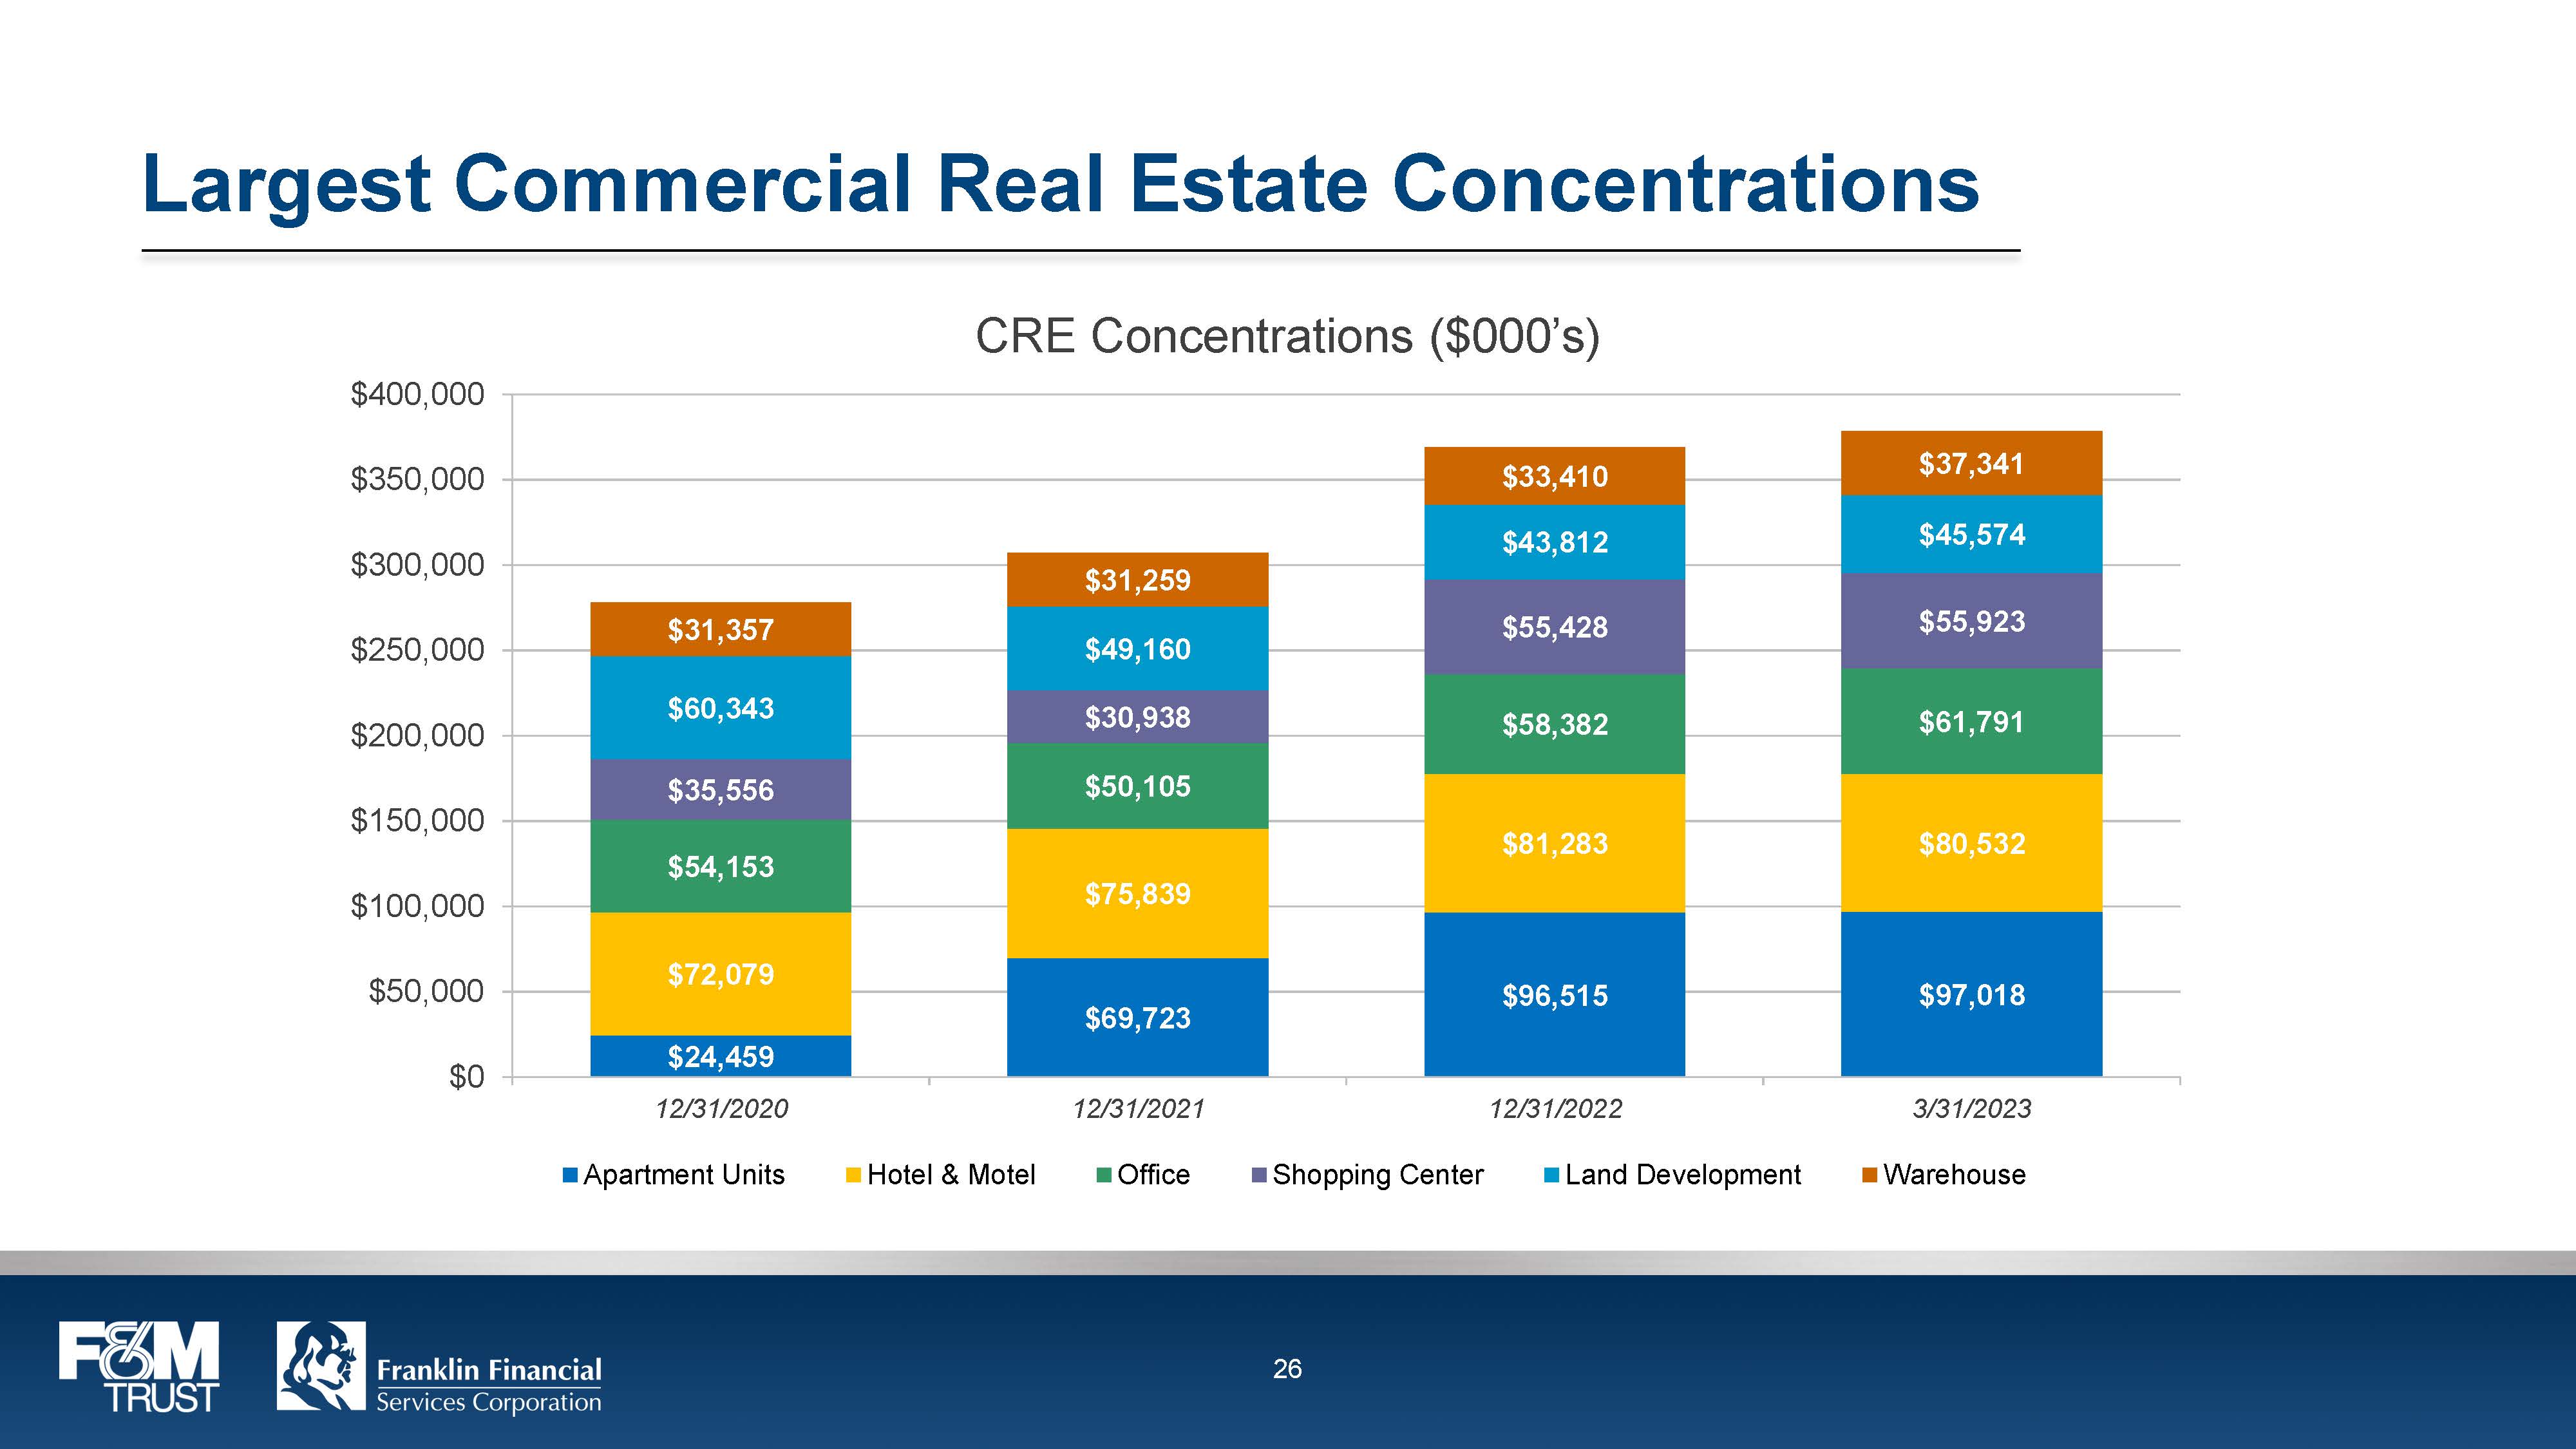
Largest Commercial Real Estate Concentrations CRE Concentrations ($000’s) $31,357 $31,259 $33,410 $37,341 $60,343 $49,160 $43,812 $45,574 $35,556 $30,938 $55,428 $55,923 $54,153 $50,105 $58,382 $61,791 $72,079 $75,839 $81,283 $80,532 $24,459 $69,723 $96,515 $97,018 12/31/2020 12/31/2021 12/31/2022 3/31/2023 Apartment Units Hotel & Motel Office Shopping Center Land Development Warehouse F&M TRUST Franklin Financial Services Corporation 26
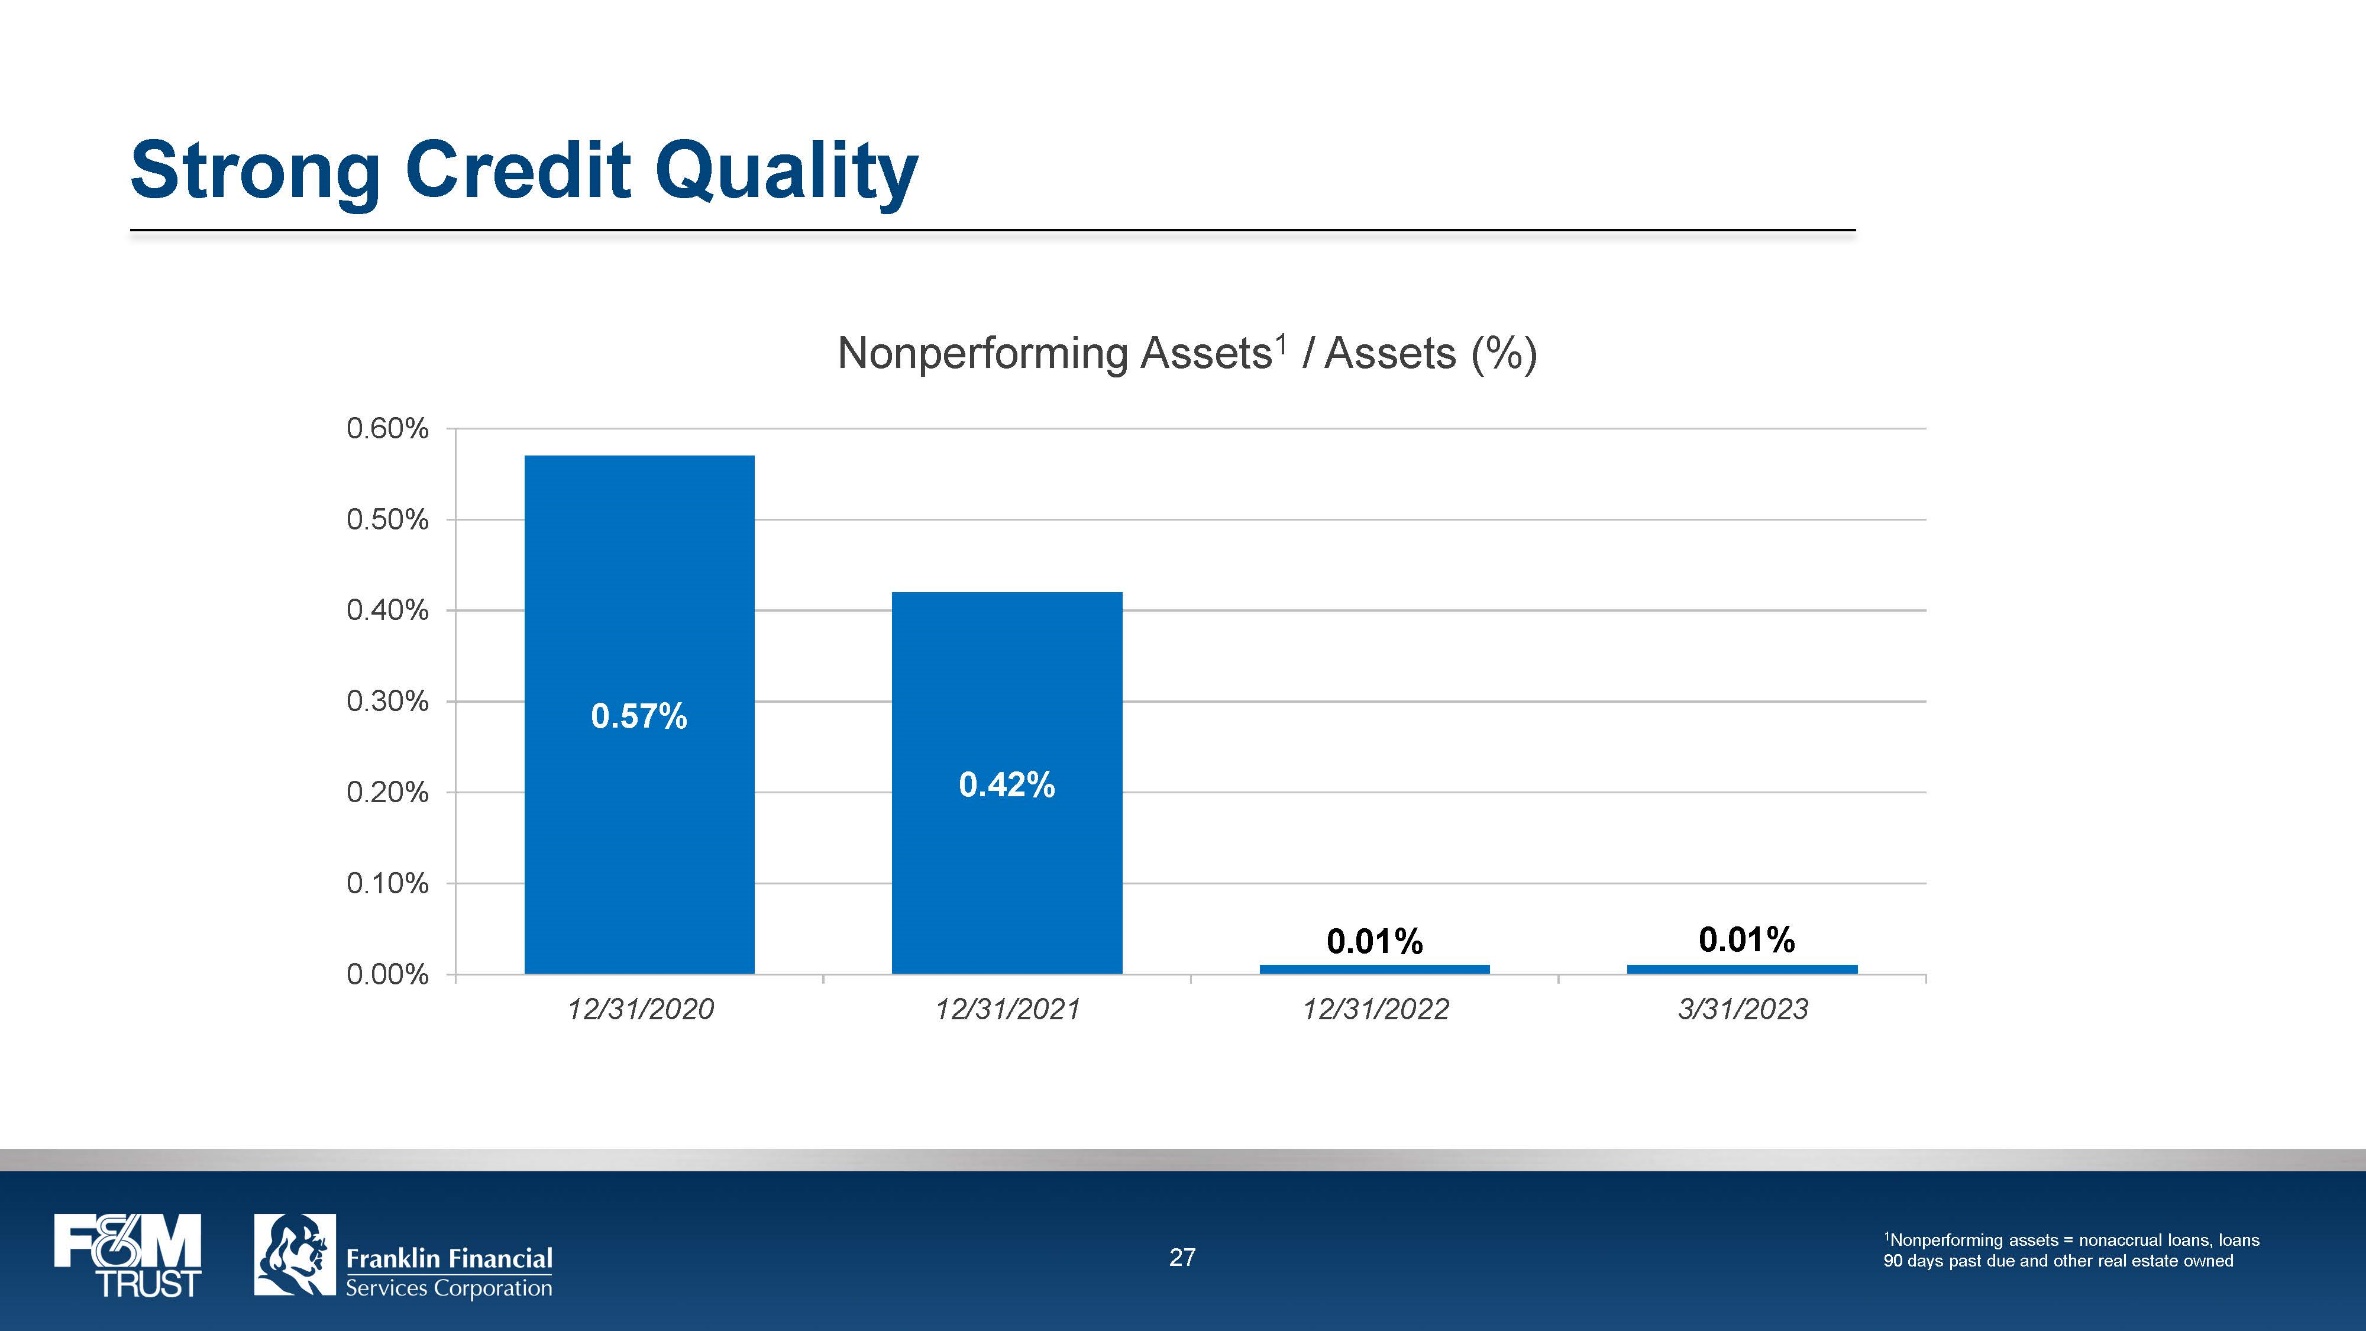
Strong Credit Quality Nonperforming Assets1 / Assets (%) 0.57% 0.42% 0.01% 0.01% 12/31/2020 12/31/2021 12/31/2022 3/31/2023 1Nonperforming assets = nonaccrual loans, loans 90 days past due and other real estate owned F&M TRUST Franklin Financial Services Corporation 27
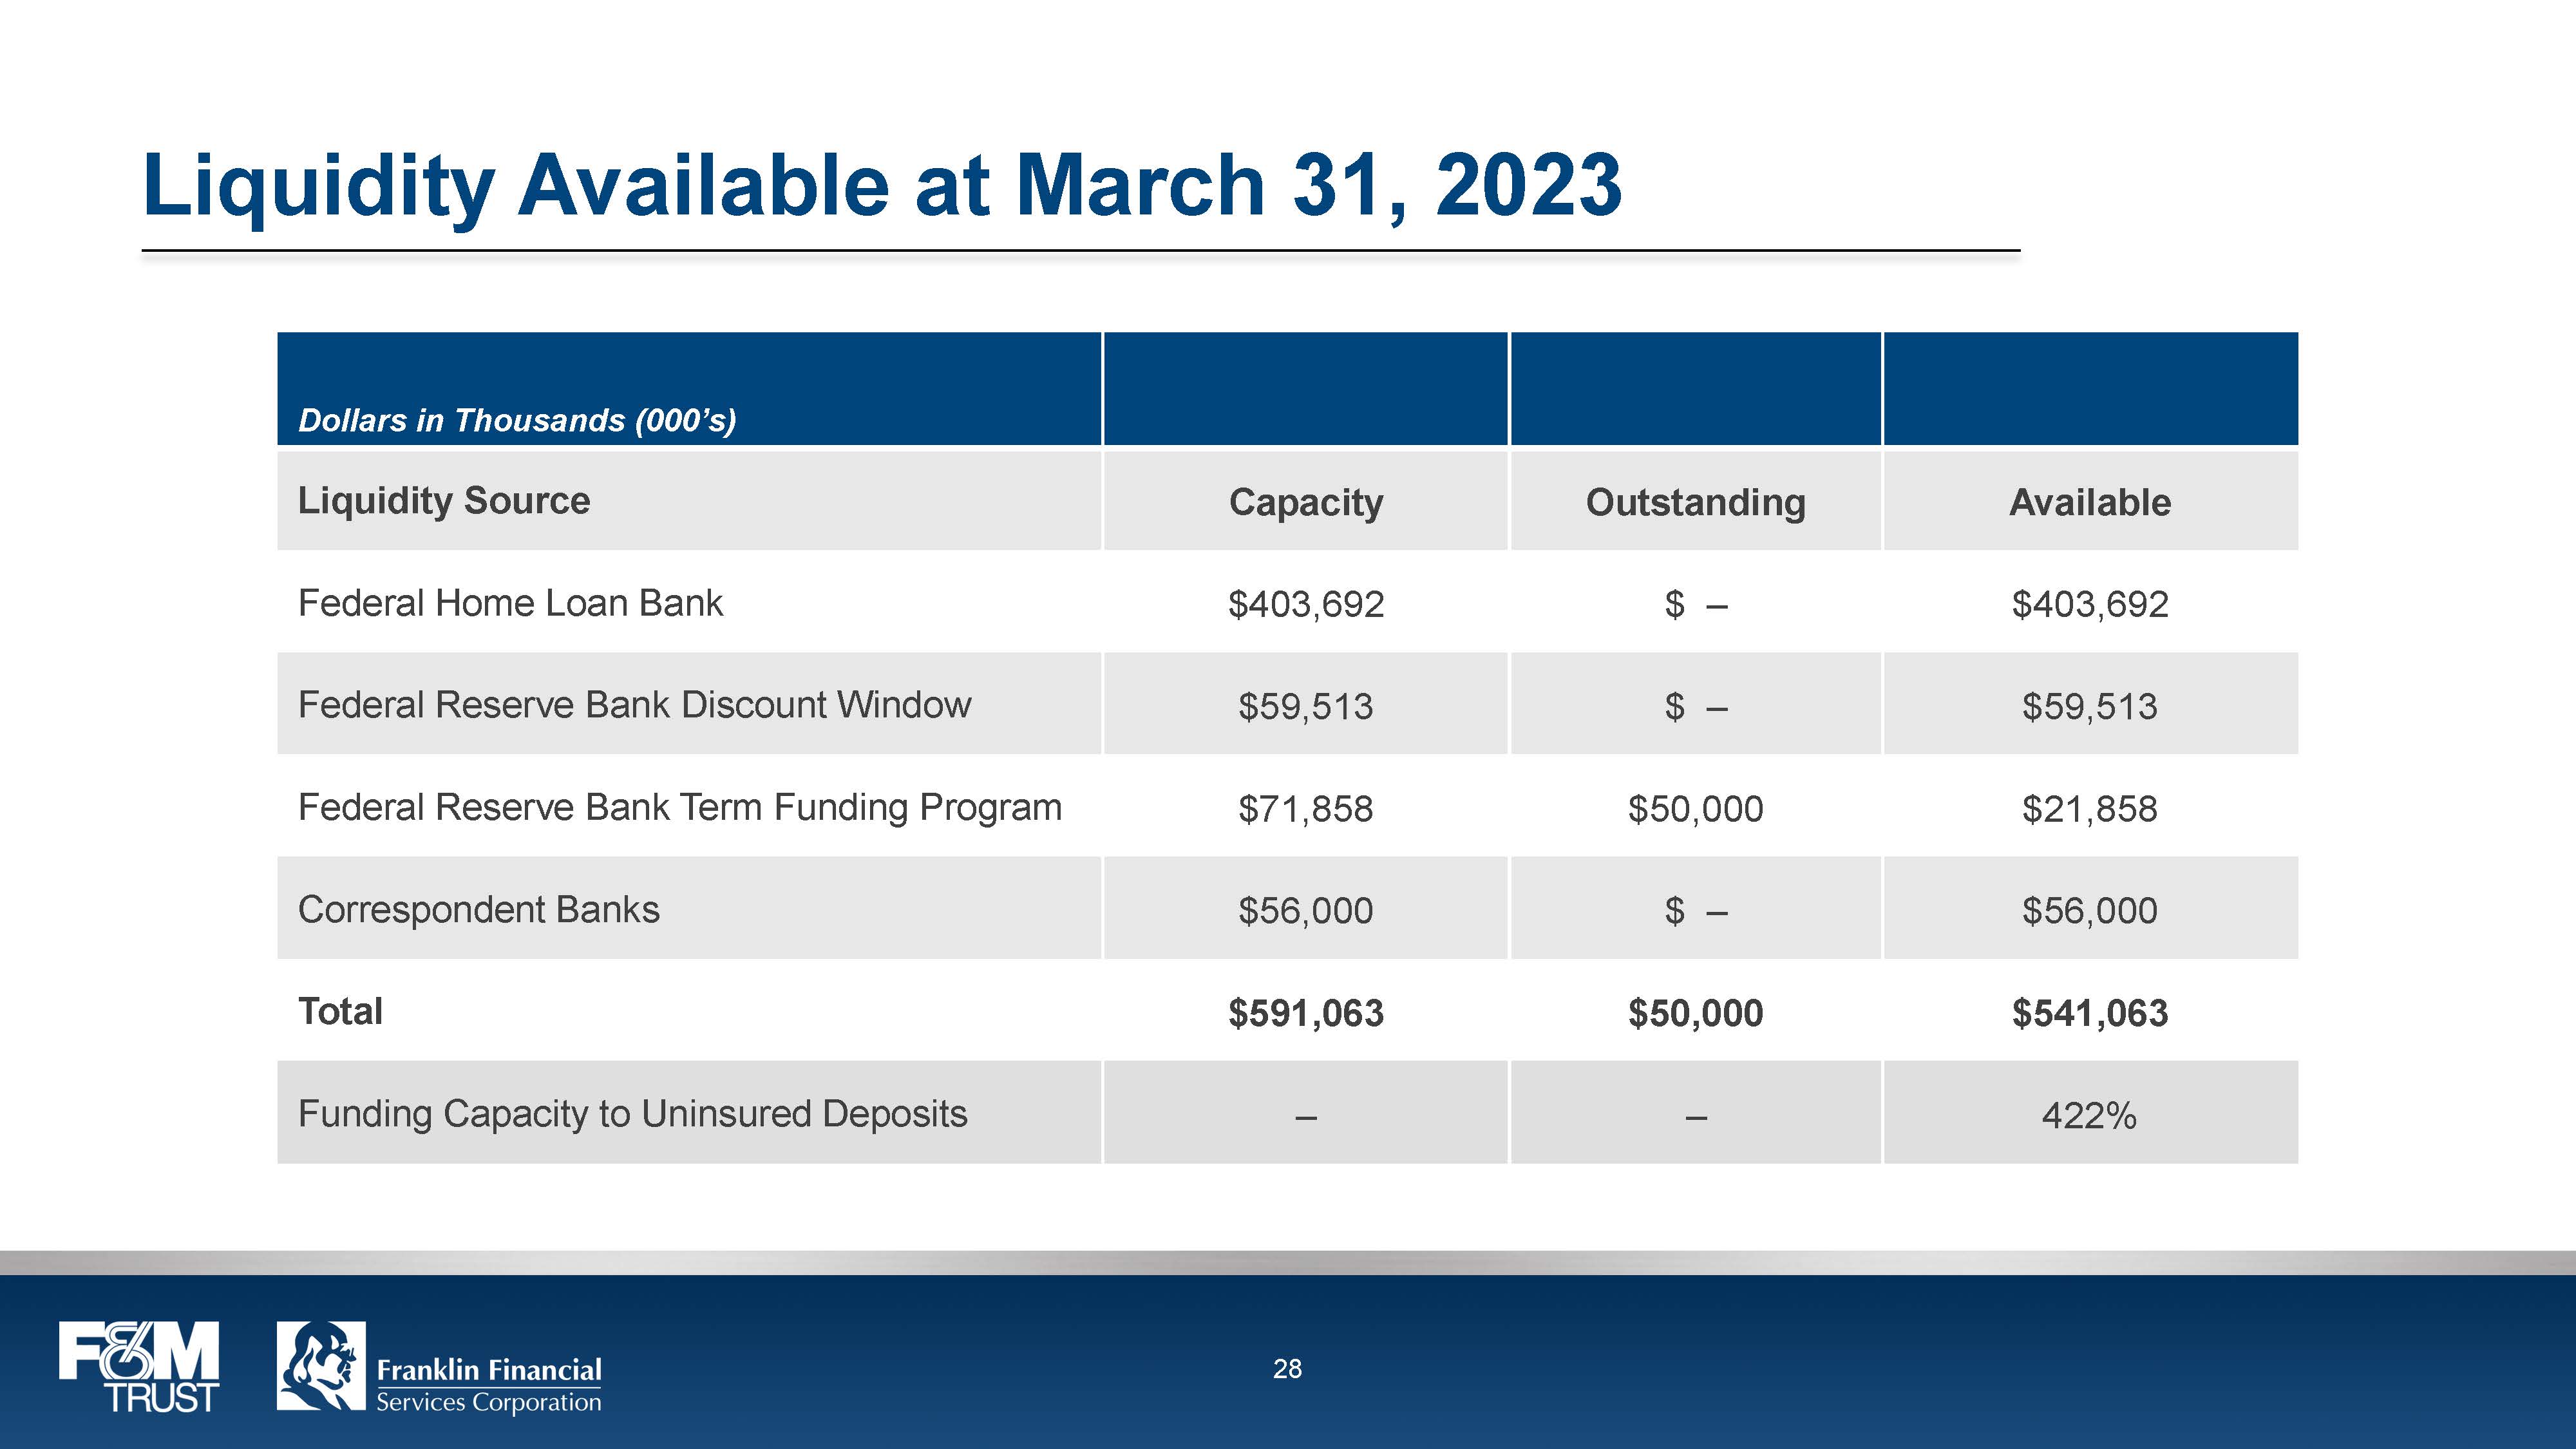
Liquidity Available at March 31, 2023 Dollars in Thousands (000’s) Liquidity Source Capacity Outstanding Available Federal Home Loan Bank $403,692 $ – $403,692 Federal Reserve Bank Discount Window $59,513 $ – $59,513 Federal Reserve Bank Term Funding Program $71,858 $50,000 $21,858 Correspondent Banks $56,000 $ – $56,000 Total $591,063 $50,000 $541,063 Funding Capacity to Uninsured Deposits – – 422% F&M TRUST Franklin Financial Services Corporation 28
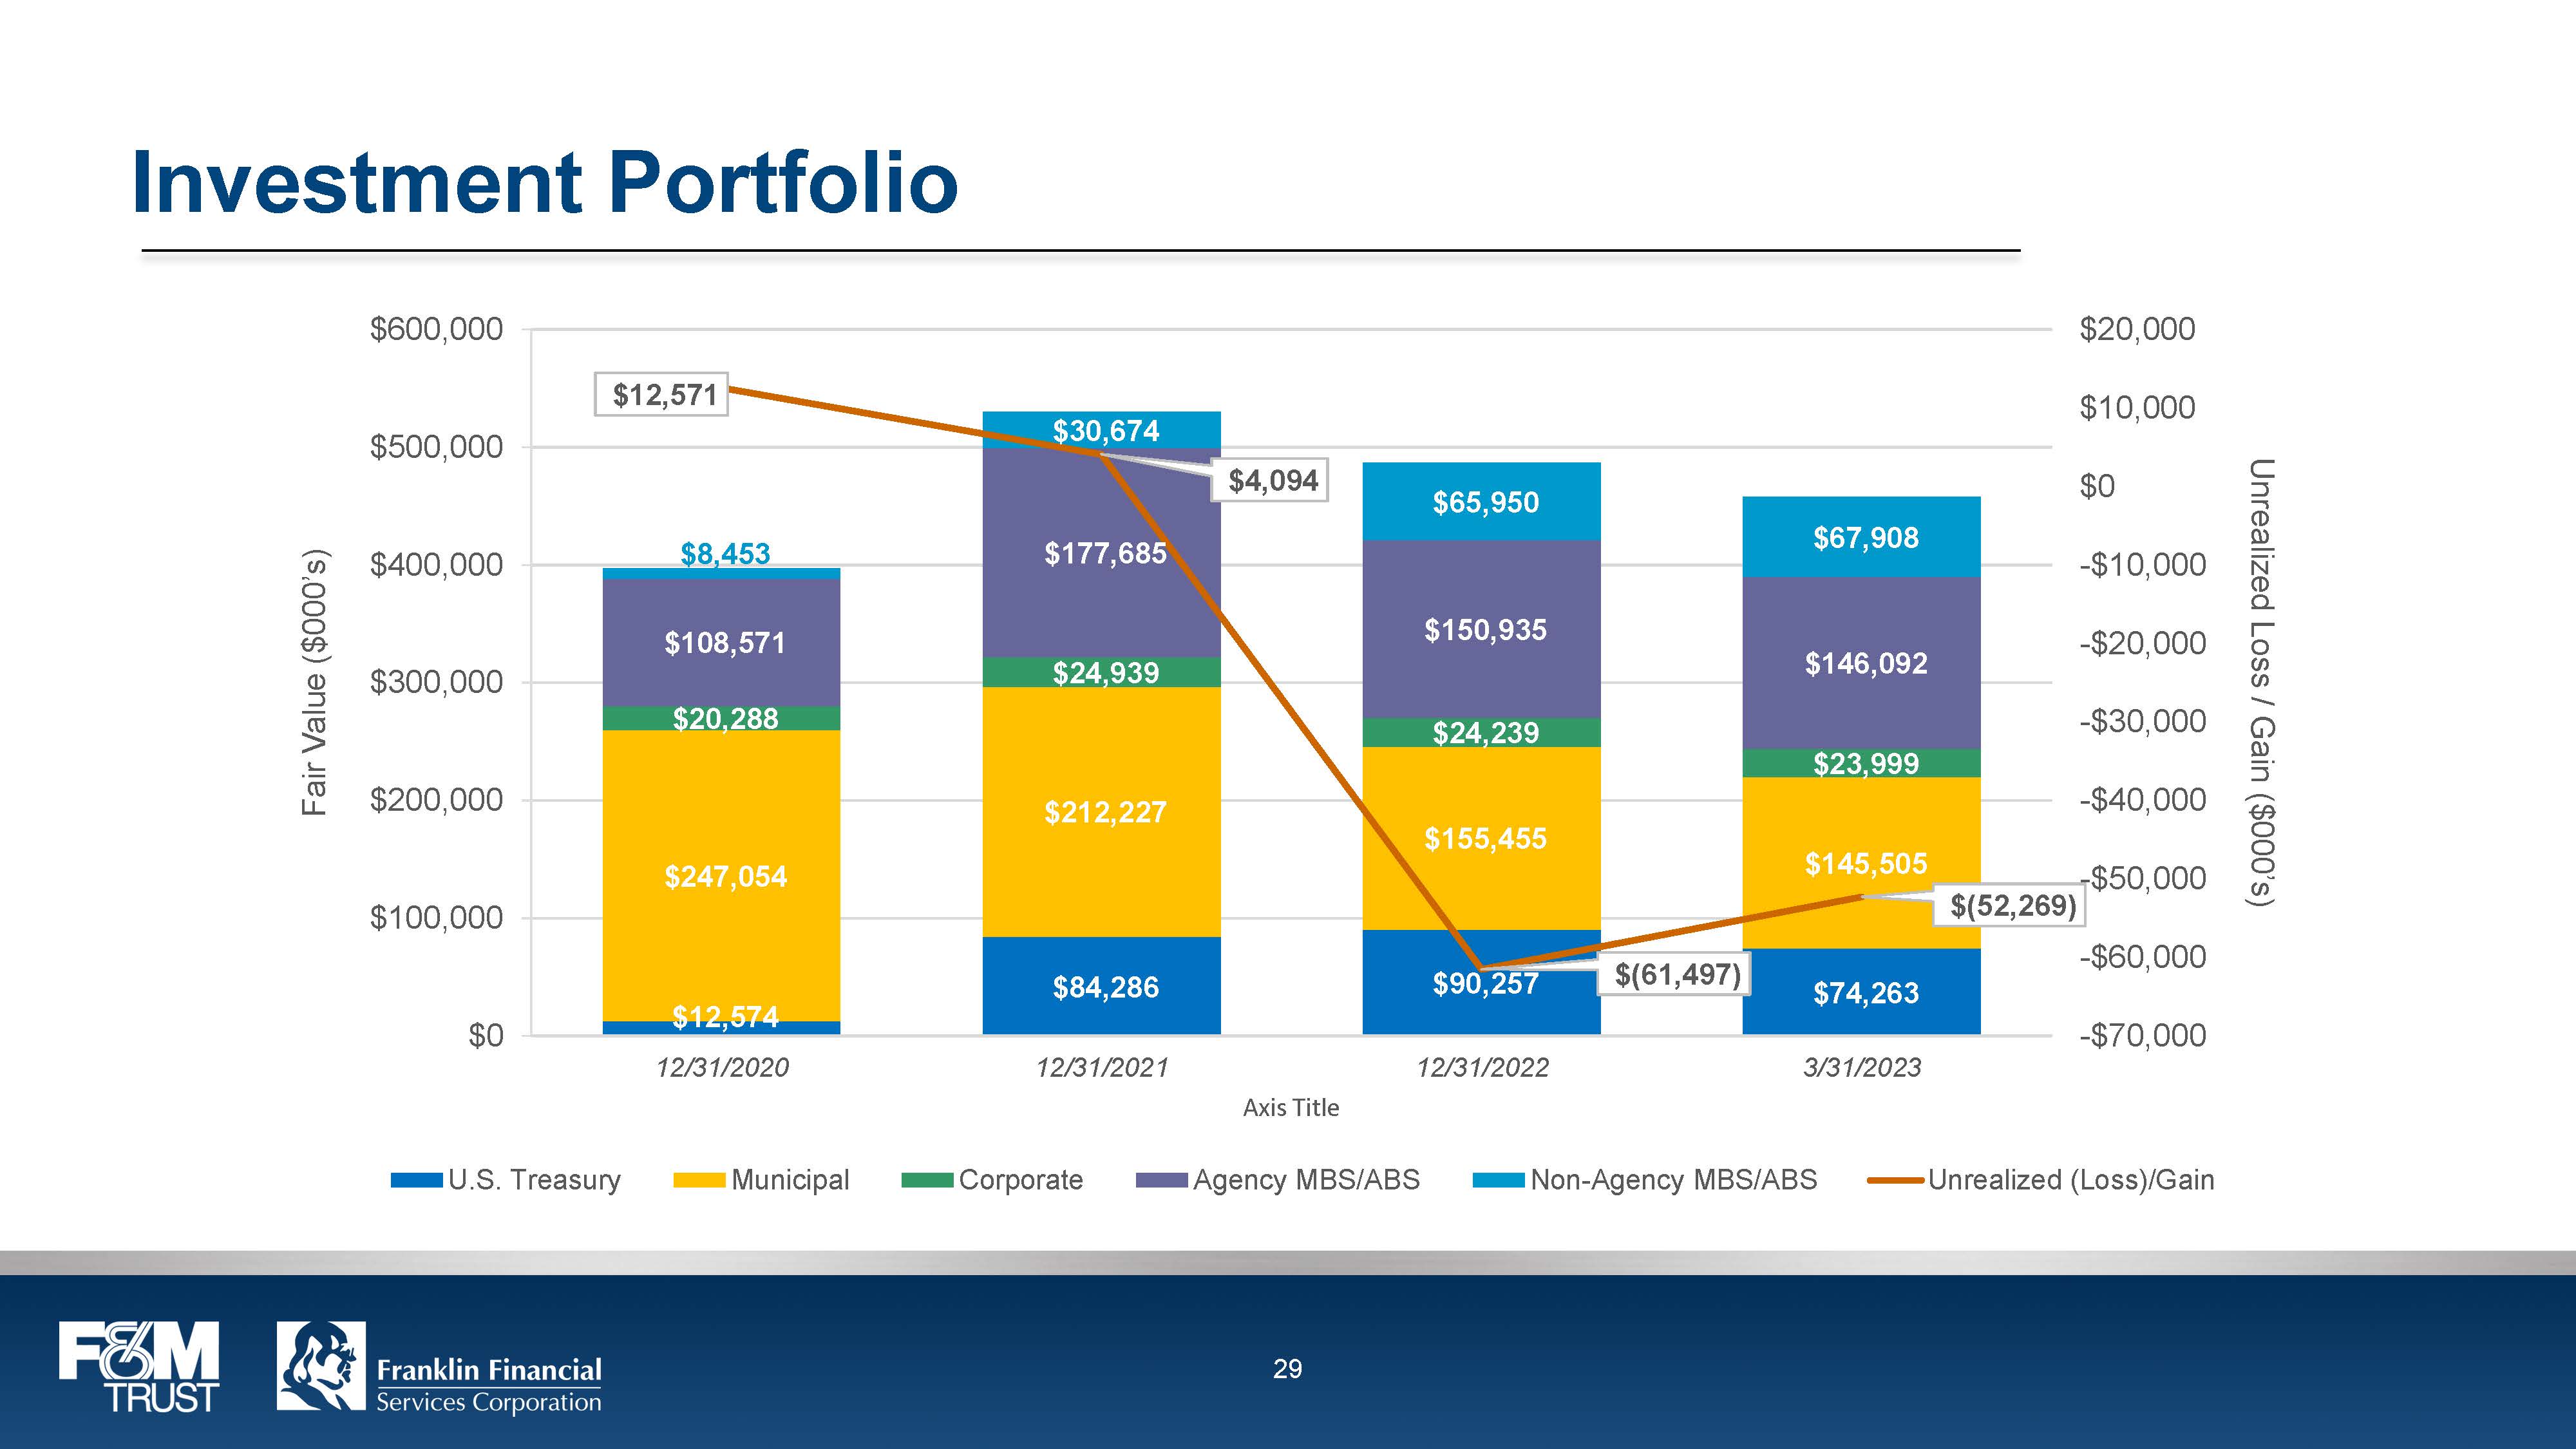
Investment Portfolio $12,571 $4,094 ($6,197) $52,269 $8,453 $30,674 $65,950 $67,908 $108,571 $177,685 $150,935 $146,092 $20,288 $24,939 $24,239 $23,999 $247,054 $212,227 $155,455 $145,505 $12,574 $84,286 $90,257 $74,263 12/31/2020 12/31/2021 12/31/2022 3/31/2023 U.S. Treasury Municipal Corporate Agency MBS/ABS Non-Agency MBS/ABS Unrealized (Loss)/Gain F&M TRUST Franklin Financial Services Corporation 29
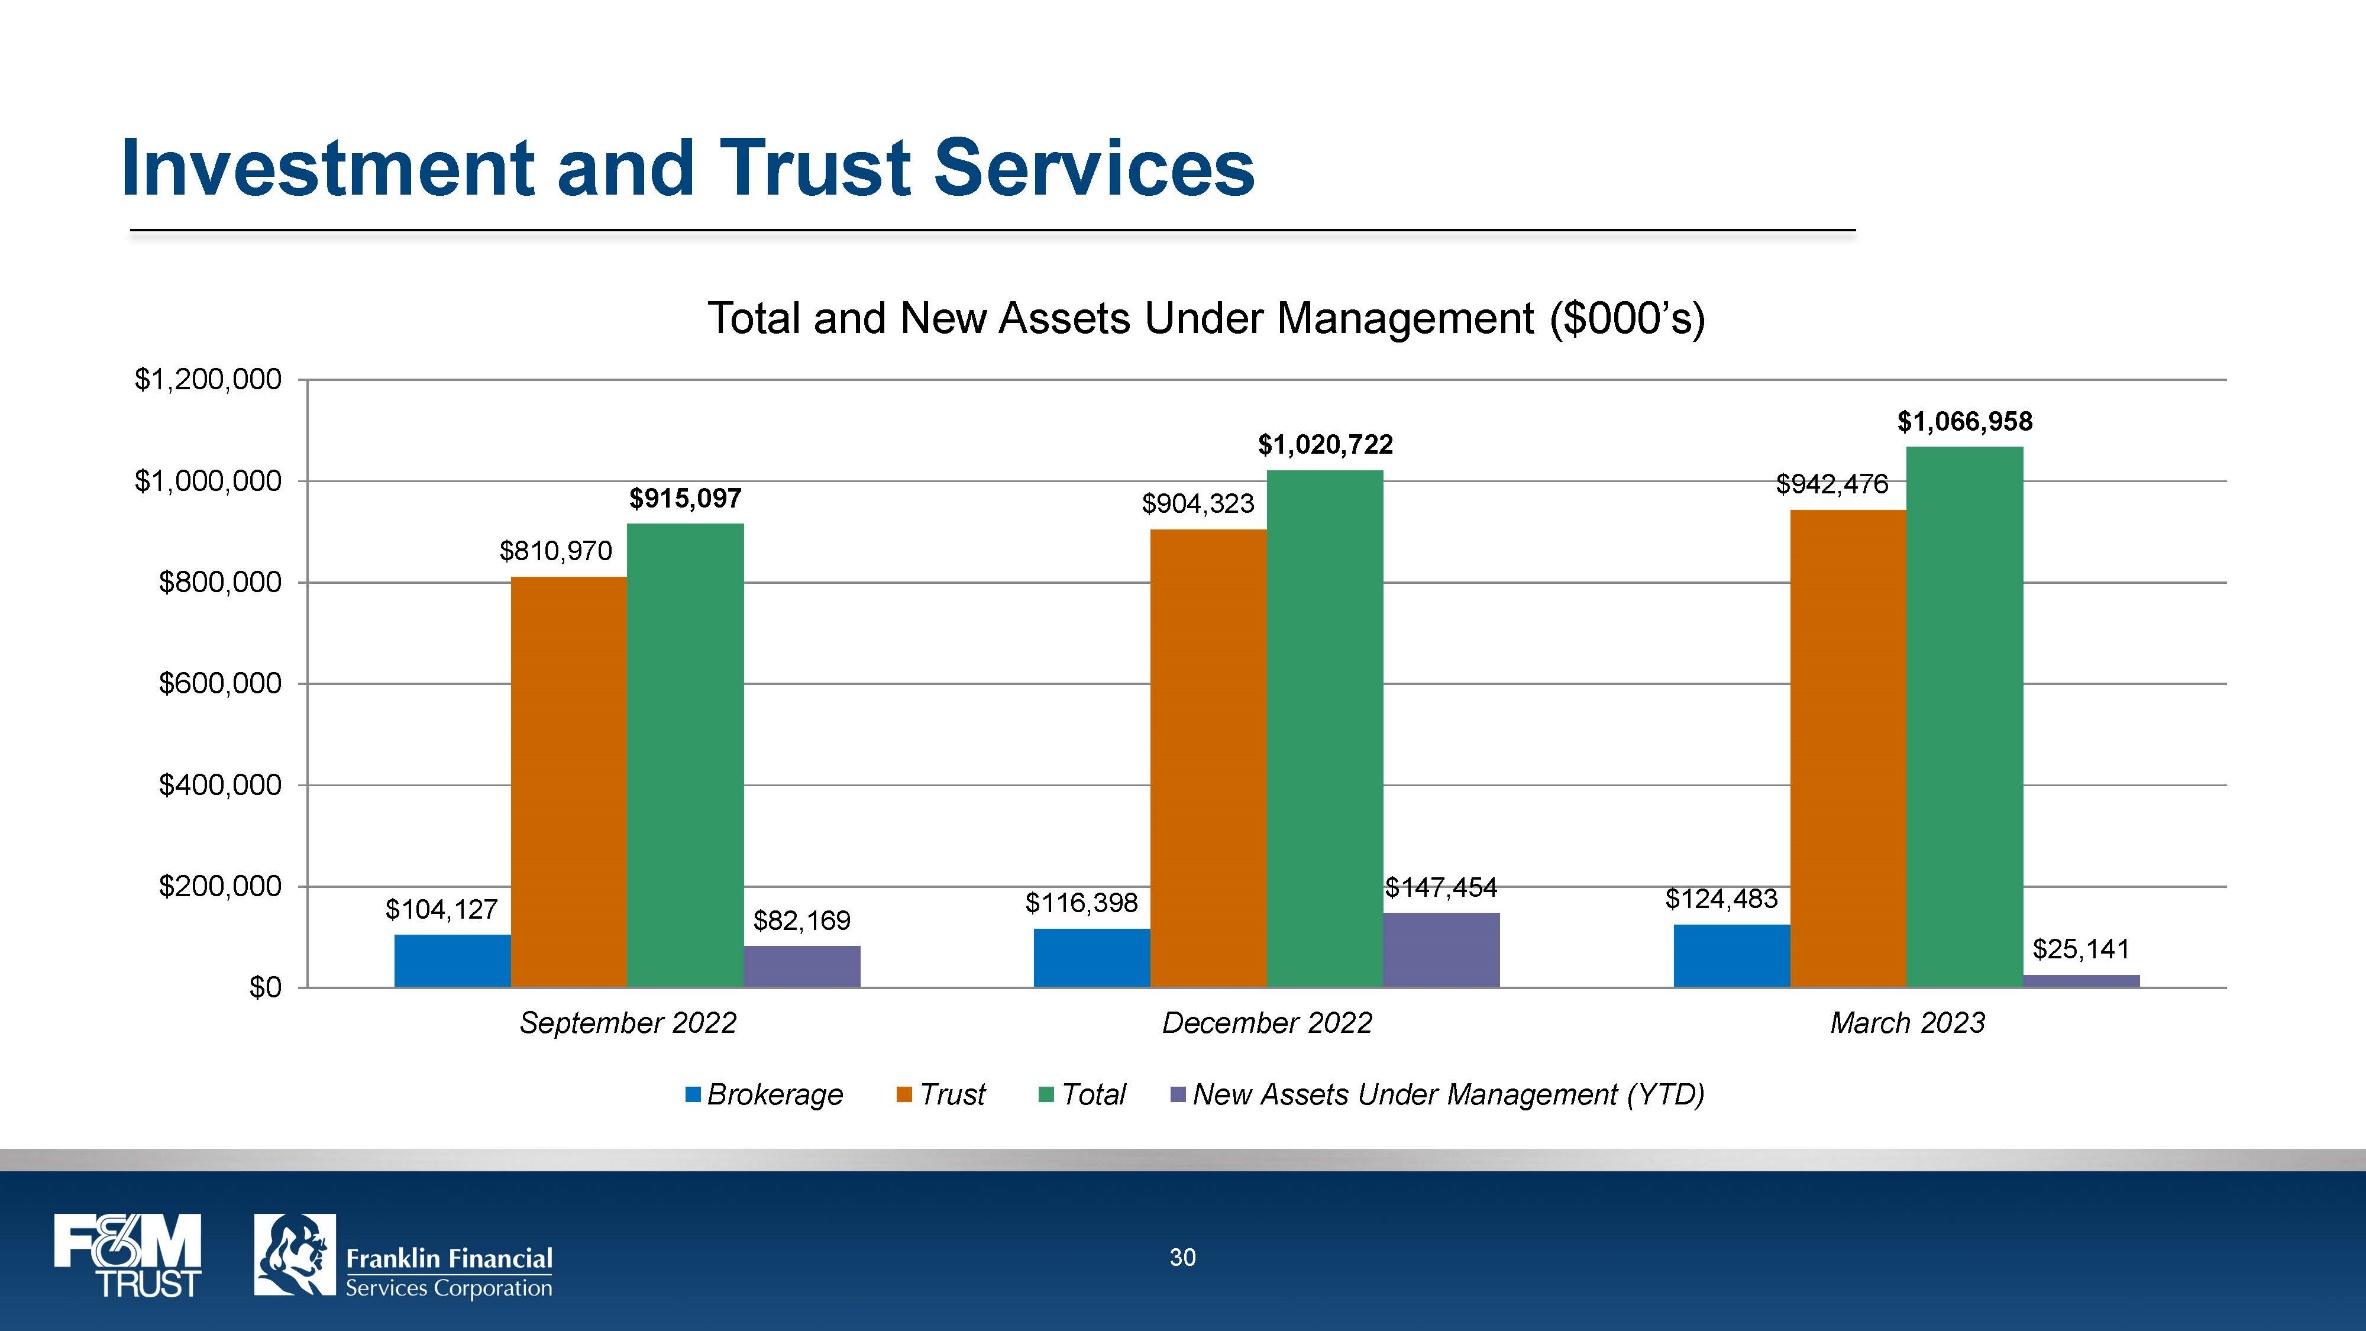
Investment and Trust Services Total and New Assets Under Management ($000’s) $104,127 $810,970 $915,097 $82,169 $116,398 $904,323 $1,020,722 $147,454 $124,483 $942,476 $1,066,958 $25,141 Sep-22 Dec-22 Mar-23 Brokerage Trust Total New Assets Under Management (YTD) F&M TRUST Franklin Financial Services Corporation 30
Stock Symbol: FRAF (Nasdaq) www.franklinfin.com www.fmtrust.bank F&M TRUST Franklin Financial Services Corporation 31

Appendix F&M TRUST Franklin Financial Services Corporation 32
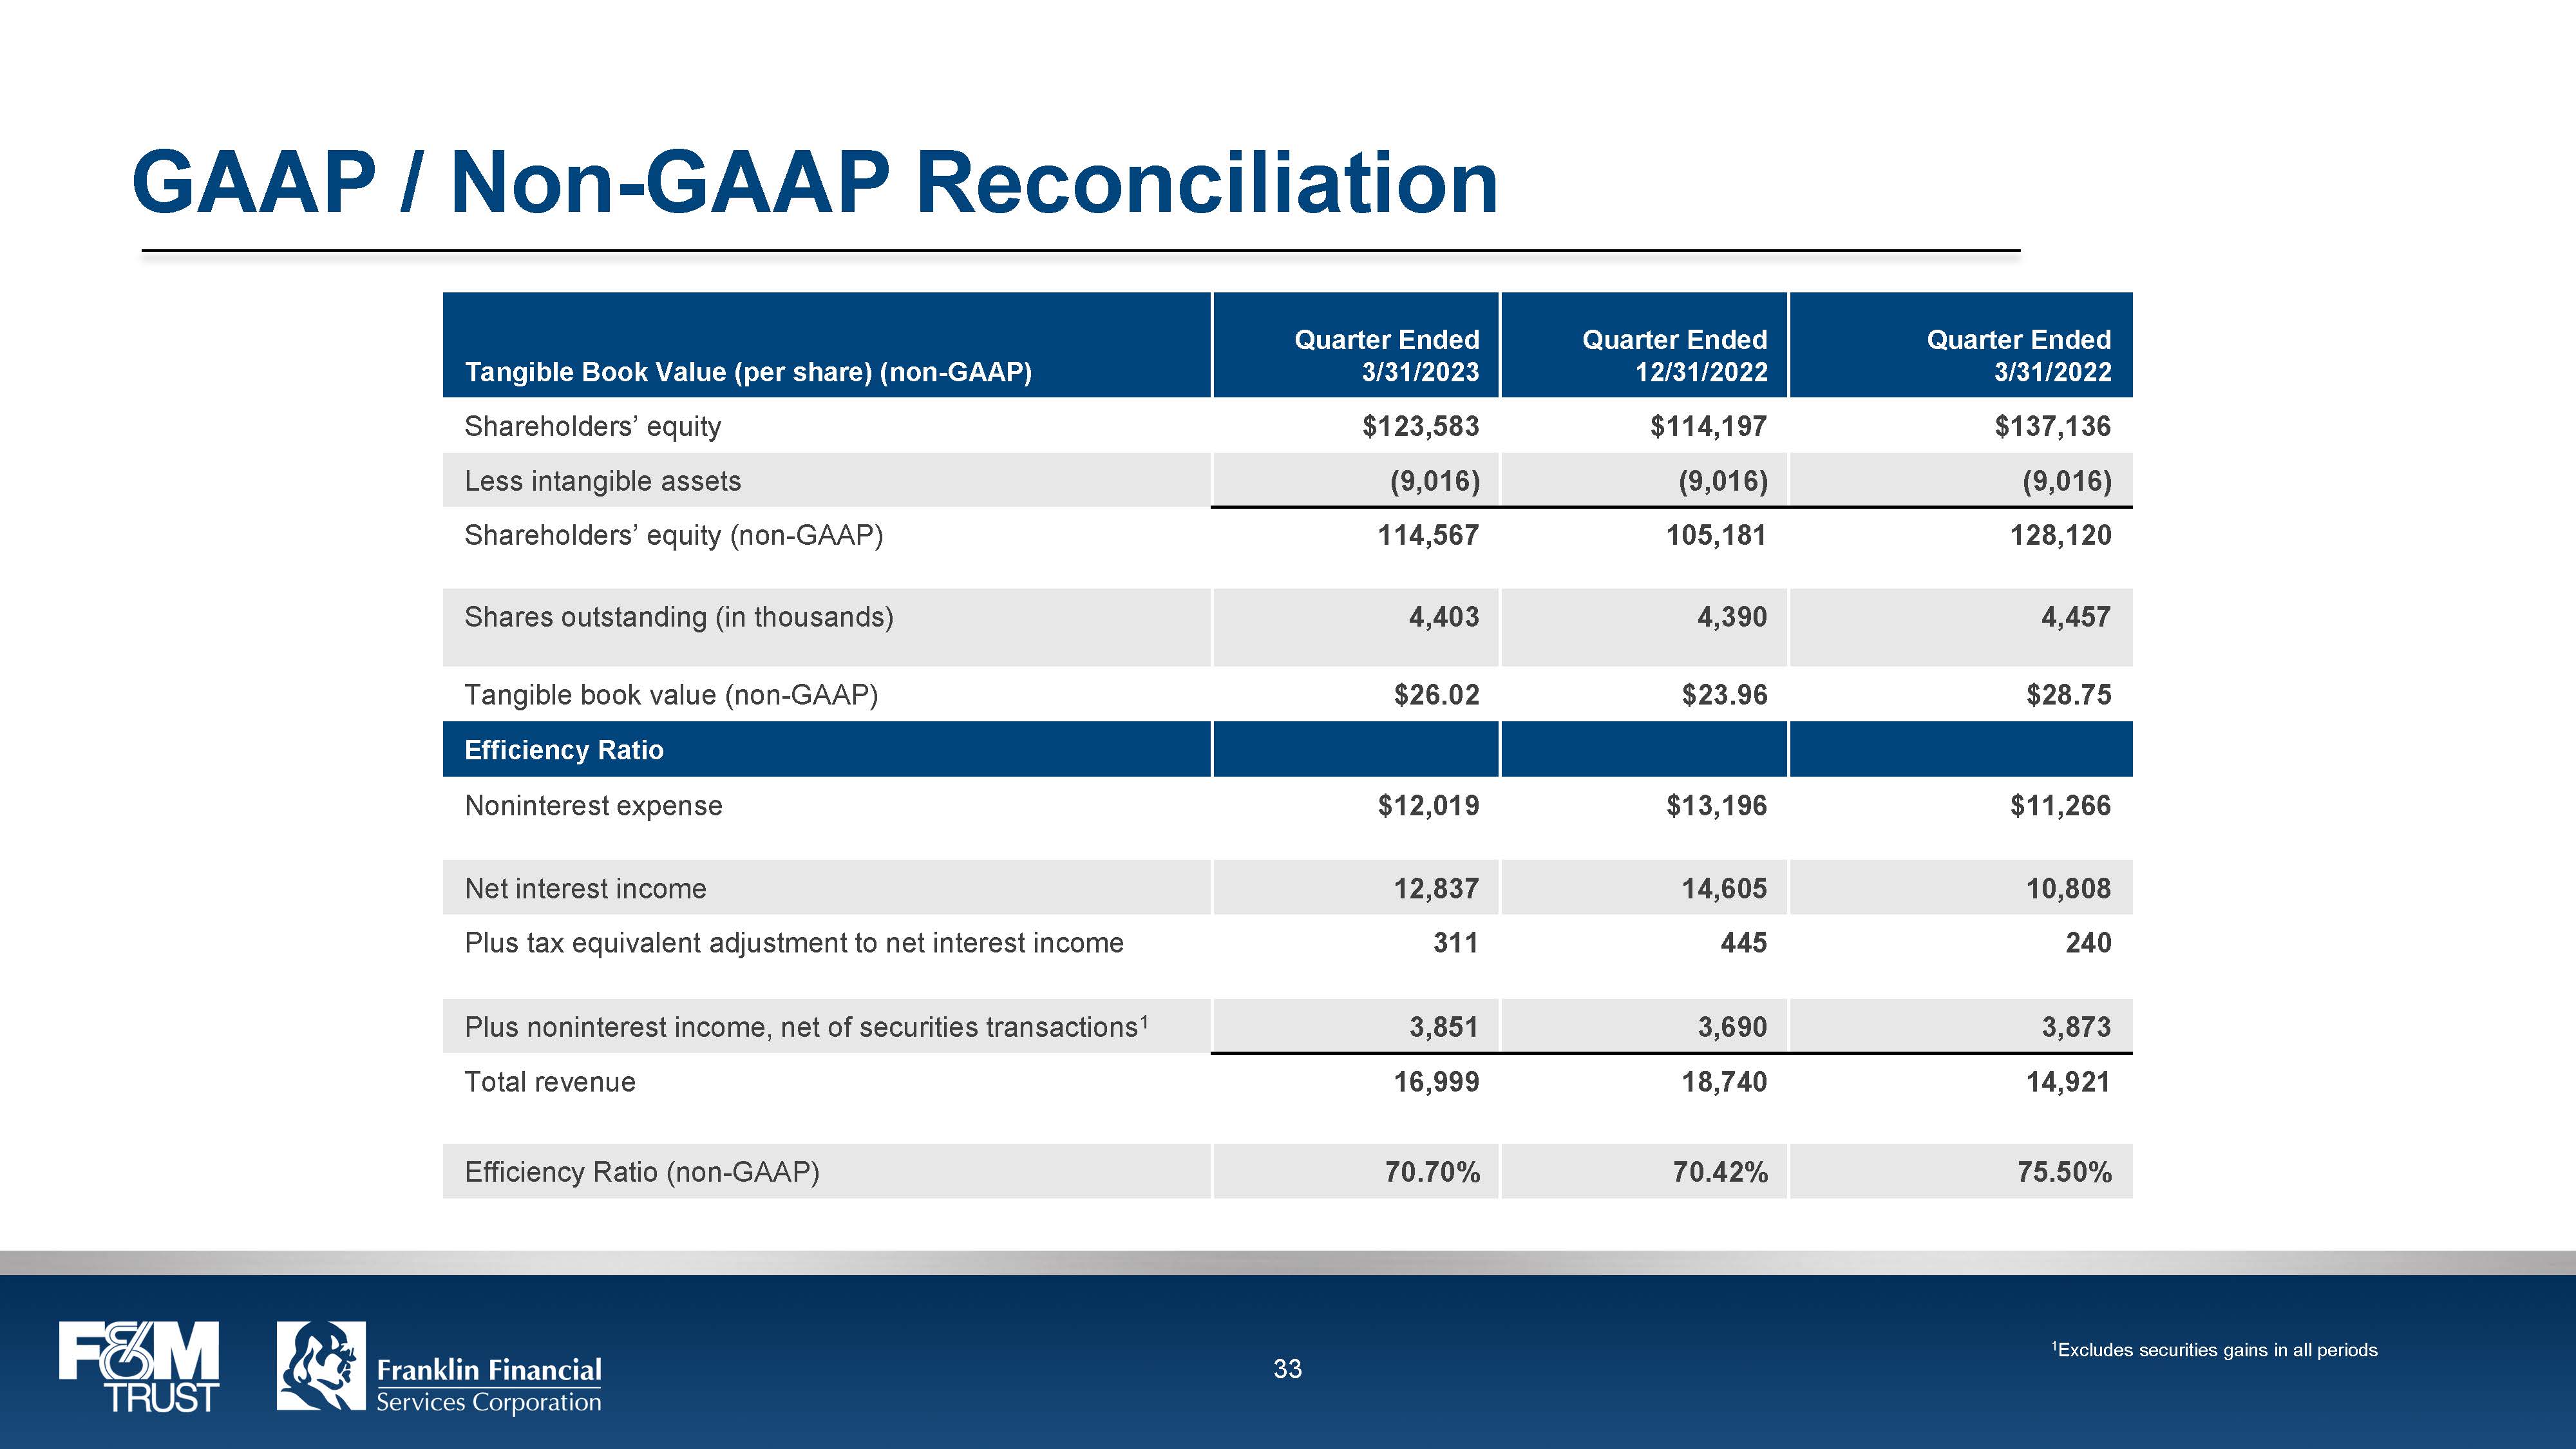
GAAP / Non-GAAP Reconciliation Tangible Book Value (per share) (non-GAAP) Quarter Ended 3/31/2023 Quarter Ended 12/31/2022 Quarter Ended 3/31/2022 Shareholders’ equity $123,583 $114,197 $137,136 Less intangible assets (9,016) (9,016) (9,016) Shareholders’ equity (non-GAAP) 114,567 105,181 128,120 Shares outstanding (in thousands) 4,403 4,390 4,457 Tangible book value (non-GAAP) $26.02 $23.96 $28.75 Efficiency Ratio Noninterest expense $12,019 $13,196 $11,266 Net interest income 12,837 14,605 10,808 Plus tax equivalent adjustment to net interest income 311 445 240 Plus noninterest income, net of securities transactions1 3,851 3,690 3,873 Total revenue 16,999 18,740 14,921 Efficiency Ratio (non-GAAP) 70.70% 70.42% 75.50% 1Excludes securities gains in all periods F&M TRUST Franklin Financial Services Corporation 33