Exhibit 99.1
Annual MeetingApril 23, 2024

Call to OrderG. Warren Elliott

InvocationPam Johns

Minutes of Last MeetingG. Warren Elliott
Forward Looking Statements
In order to help you to better understand the business of the Company – where we have been and where we want to go – my remarks today (and those of other Company officers who will speak or respond to questions) will include forward looking statements relating to anticipated financial performance, future operating results, business prospects, new products, and similar matters. These statements represent our best judgment, based upon present circumstances and the information now available to us, of what we think may occur in the future – and, of course, it is possible that actual results may differ materially from those we envision today. For a more complete discussion on the subject of forward looking statements, including a list of some of the risk factors that might adversely affect operating results, I refer you to the section entitled “Forward Looking Statements” which appears in our annual report on Form 10-K as filed with the Securities and Exchange Commission (SEC).

IntroductionG. Warren Elliott

Board of DirectorsG. Warren Elliott Chairman of the BoardTimothy (Tim) G. Henry President & CEO
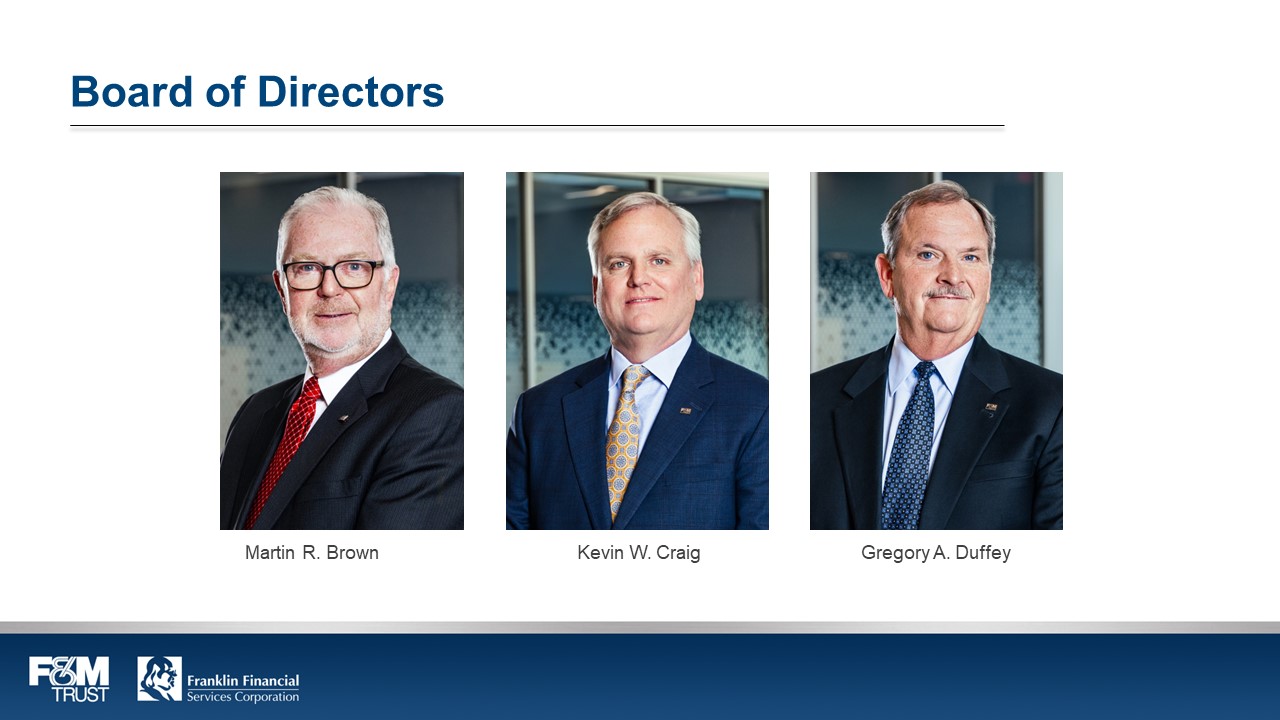
Board of DirectorsMartin R. BrownKevin W. CraigGregory A. Duffey
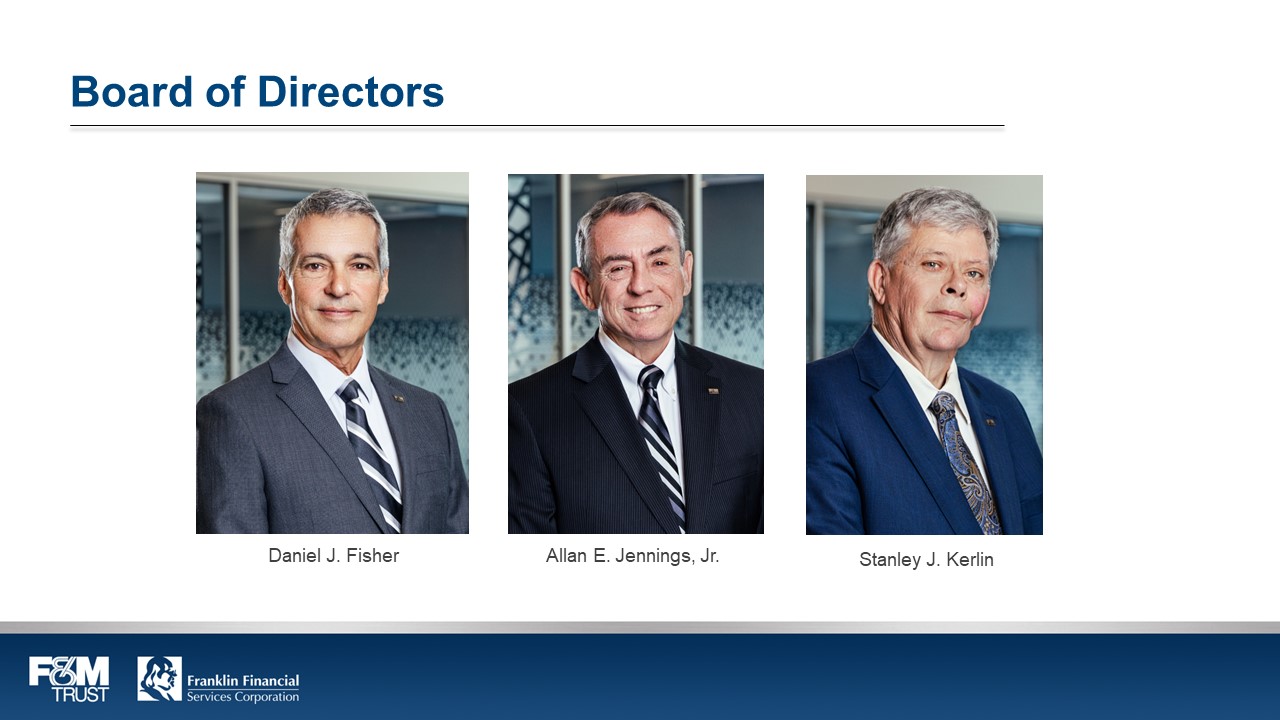
Board of DirectorsDaniel J. FisherAllan E. Jennings, Jr. Stanley J. Kerlin
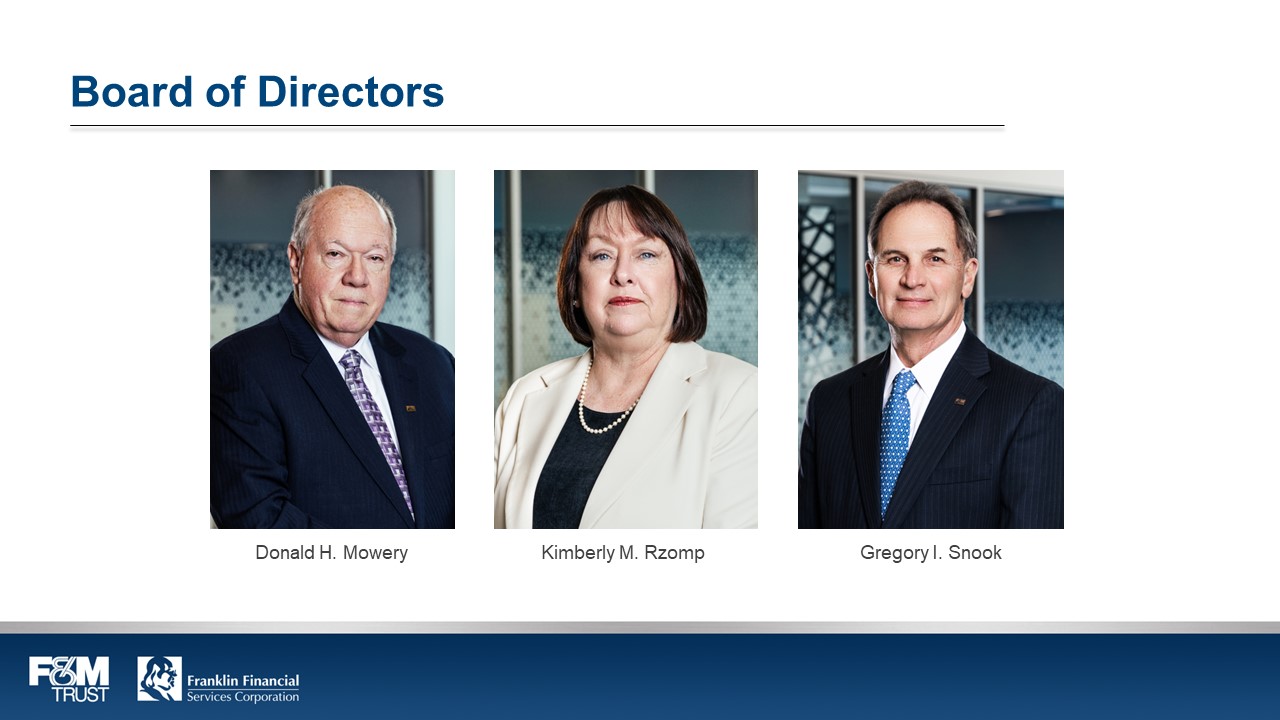
Board of DirectorsDonald H. MoweryKimberly M. RzompGregory I. Snook
Nick BybelPartner, Bybel Rutledge LLPZoe ClaytonAssistant Corporate Secretary – Judge of ElectionsIan KandrayCPA, Crowe LLP
Chairman’s RemarksG. Warren Elliott

G. Warren ElliottChairman of the Board

Election of DirectorsG. Warren Elliott

Kevin W. CraigDaniel J. FisherDonald H. Mowery
Say-On-Pay VoteG. Warren Elliott
Ratification of AuditorsG. Warren Elliott

Polls OpenG. Warren Elliott
Financial OverviewMark R. Hollar, Chief Financial Officer
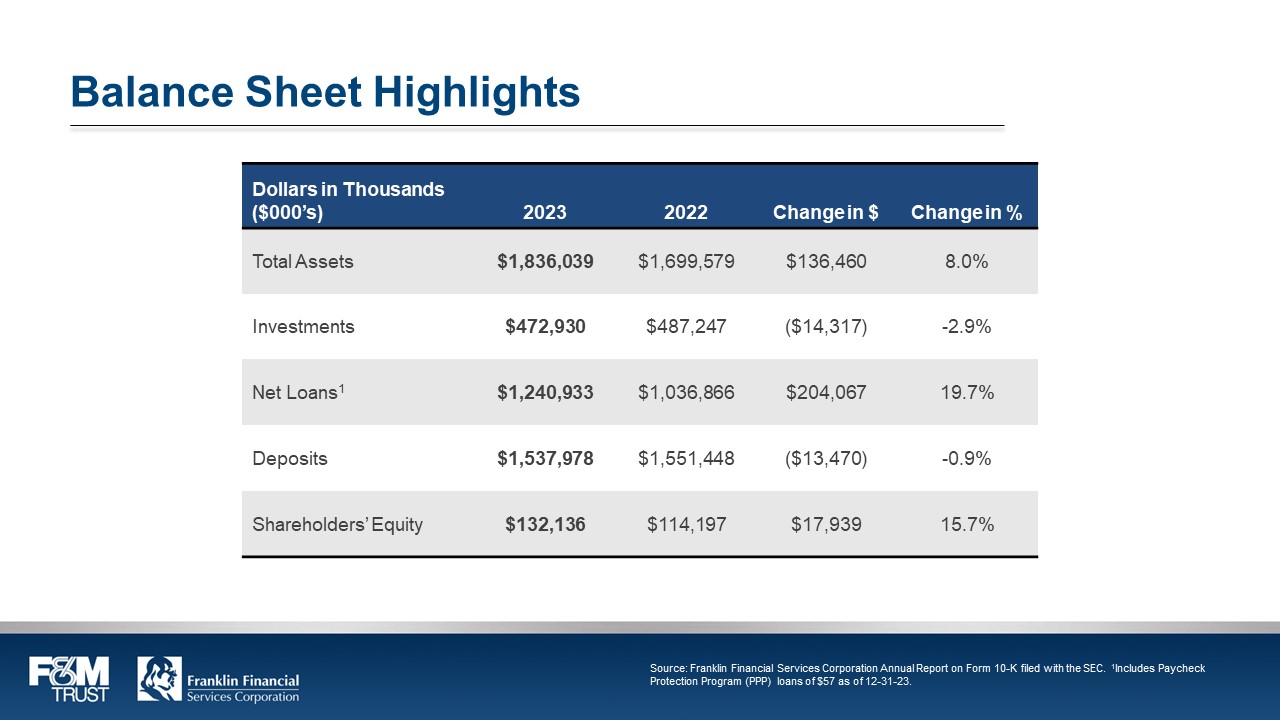
Balance Sheet HighlightsDollars in Thousands ($000’s) Total AssetsInvestmentsNet Loans1DepositsShareholders’ Equity2023$1,836,039$472,930$1,240,933$1,537,978$132,1362022$1,699,579$487,247$1,036,866$1,551,448$114,197Change in $$136,460($14,317) $204,067($13,470) $17,939Change in %8.0%-2.9%19.7%-0.9%15.7%
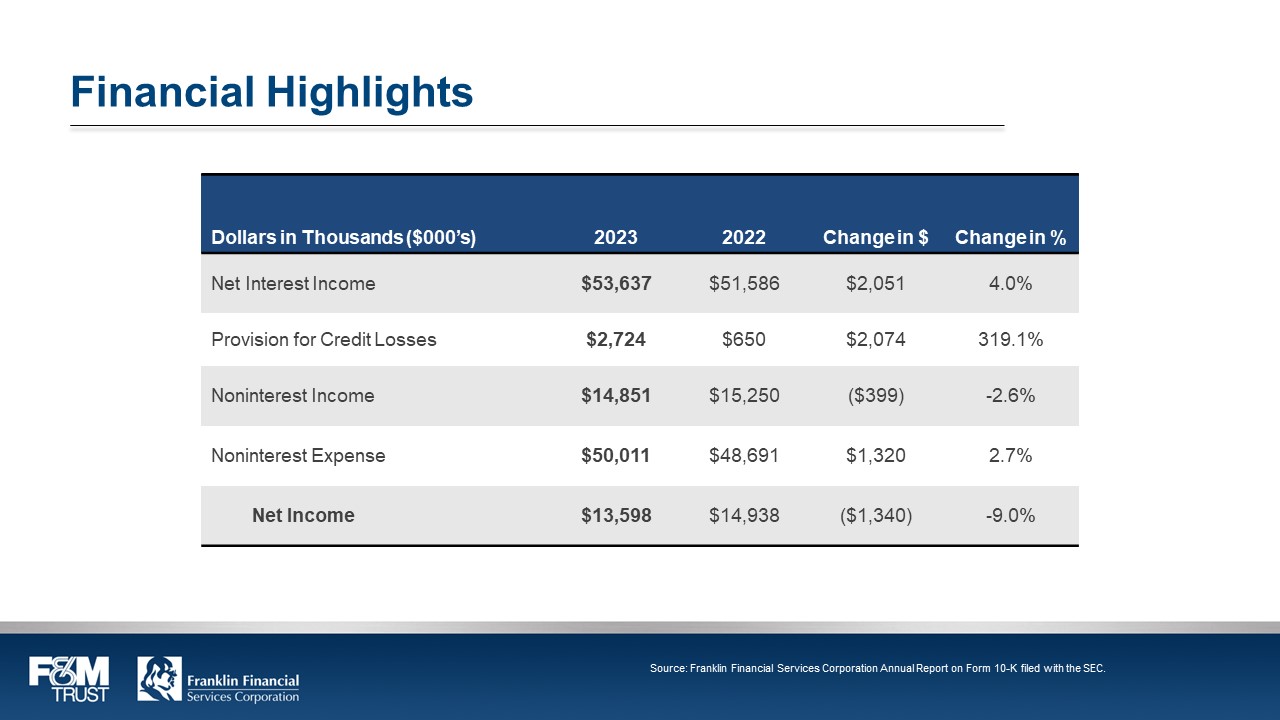
Financial HighlightsNet Interest IncomeProvision for Credit LossesNoninterest IncomeNoninterest Expense Net Income2023$53,637$2,724$14,851$50,011$13,5982022$51,586$650$15,250$48,691$14,938Change in $$2,051$2,074($399) $1,320($1,340) Change in %4.0%319.1%-2.6%2.7%-9.0%
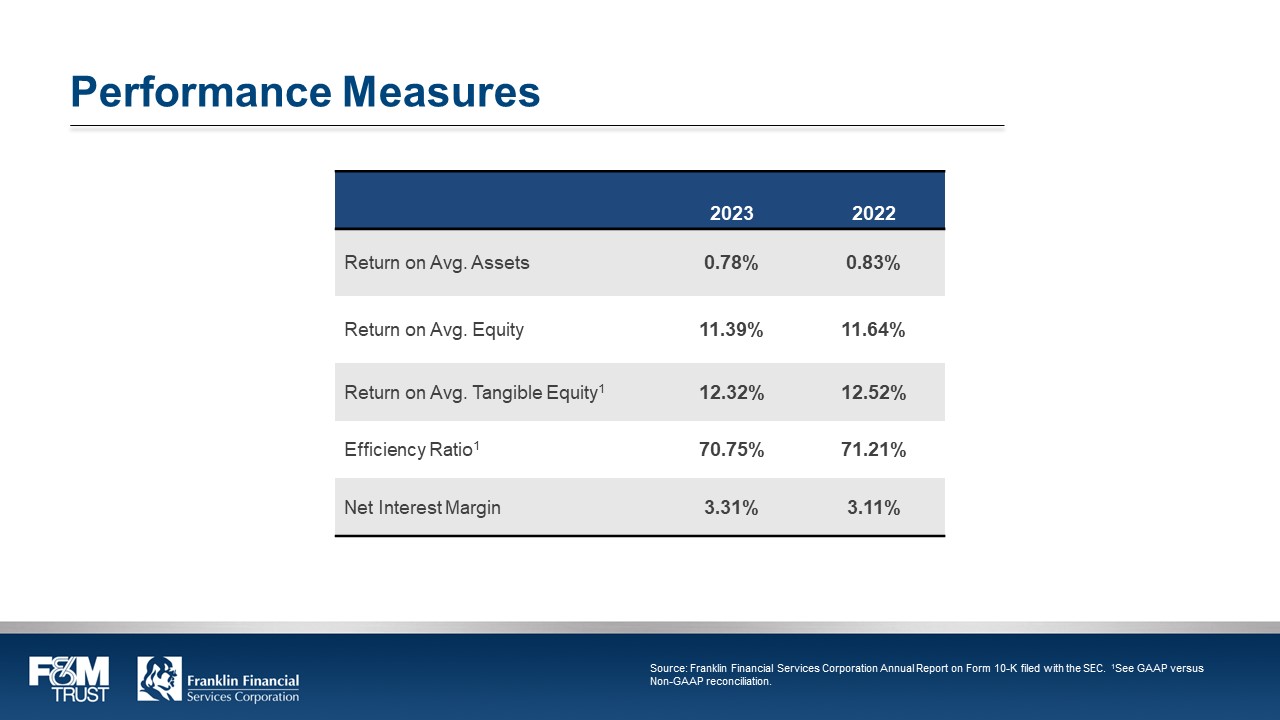
Performance MeasuresReturn on Avg. Assets20230.78%Return on Avg. Equity11.39%Return on Avg. Tangible Equity112.32%Efficiency Ratio170.75%Net Interest Margin3.31%20220.83%11.64%12.52%71.21%3.11%
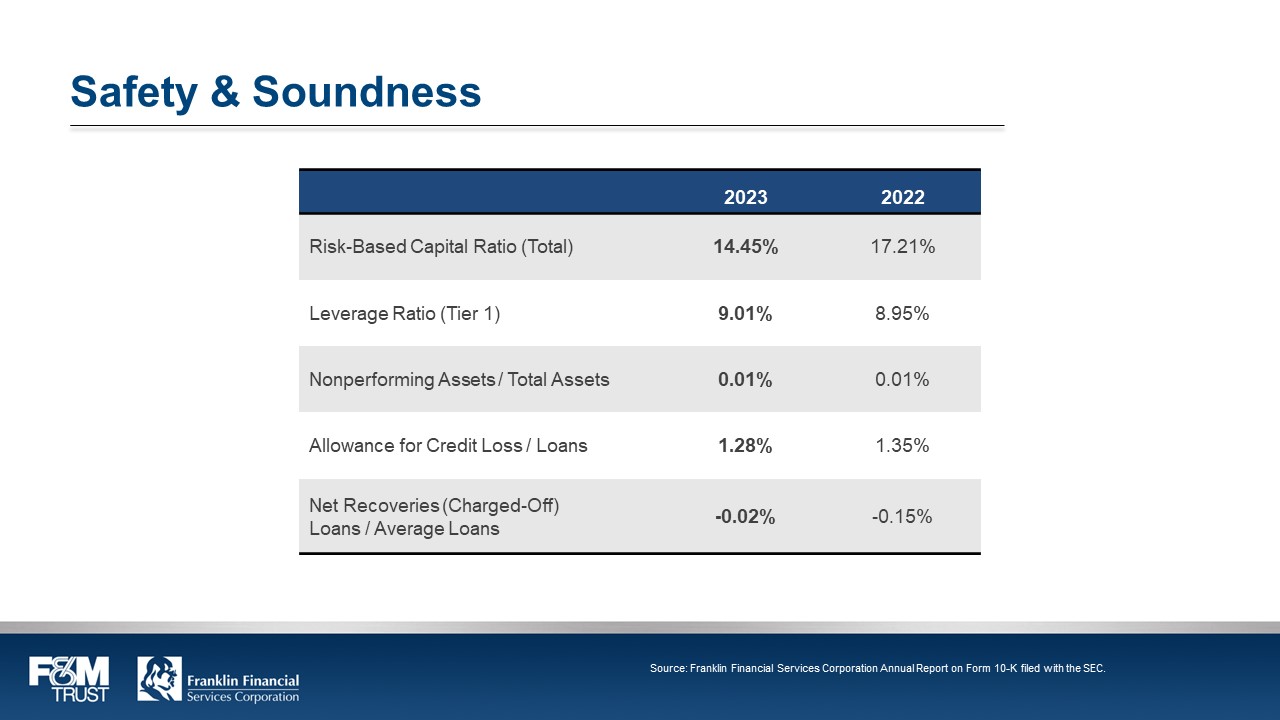
Safety & Soundness
Risk-Based Capital Ratio (Total) 20232022Leverage Ratio (Tier 1) 14.45%17.21%9.01%8.95%Nonperforming Assets / Total Assets0.01%0.01%Allowance for Credit Loss / Loans1.28%1.35%Net Recoveries (Charged-Off) Loans / Average Loans-0.02%-0.15%
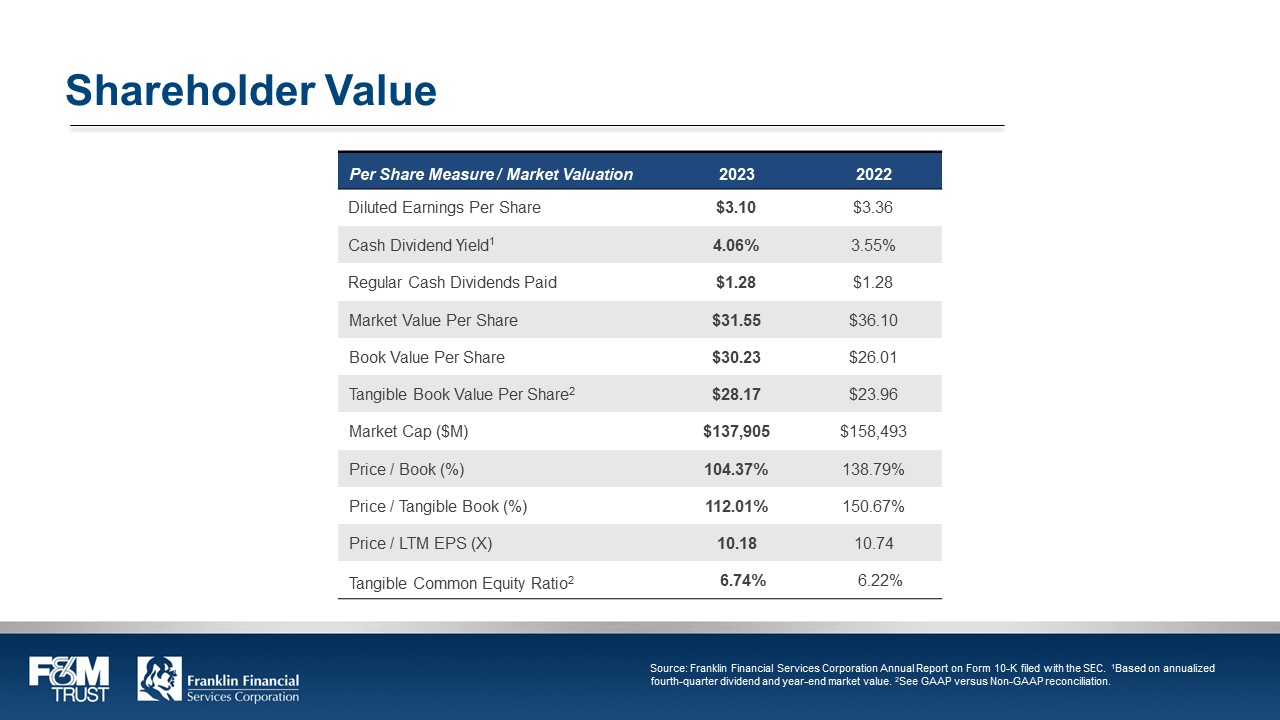
Shareholder ValuePer Share Measure / Market Valuation20232022 Diluted Earnings Per Share$3.10$3.36 Cash Dividend Yield14.06%3.55% Regular Cash Dividends Paid$1.28$1.28Market Value Per Share$31.55$36.10Book Value Per Share$30.23$26.01Tangible Book Value Per Share2$28.17$23.96Market Cap ($M) $137,905$158,493Price / Book (%104.37%)138.79%Price / Tangible Book (%)112.01%150.67%Price / LTM EPS (X) 10.1810.74Tangible Common Equity Ratio2 6.74% 6.22%
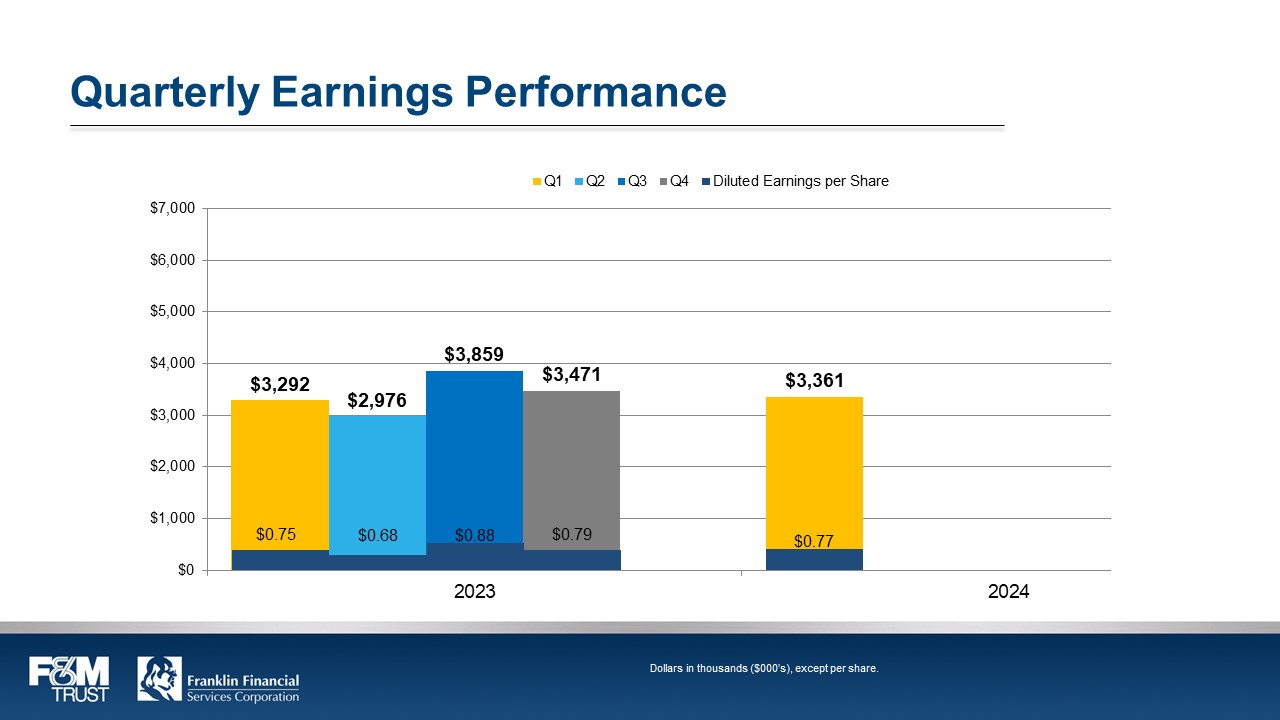
Quarterly Earnings PerformanceQ1Q2Q3Q4$7,000,$6,000,$5,000$4,000$3,000$2,000$1,000$0$3,292$0.75$2,976$0.68$3,859$0.88$3,859$0.88$3,471,$0.79$3,471$0.79$3,361$0.7720232024
President & CEO’s RemarksTimothy (Tim) G. Henry

Timothy (Tim) G. HenryPresident & CEO

QuestionsTimothy (Tim) G. Henry

Polls ClosedG. Warren Elliott

Report by Judge of ElectionZoe R. Clayton

AnnouncementG. Warren Elliott

Thank YouG. Warren Elliott

Meeting Adjourned
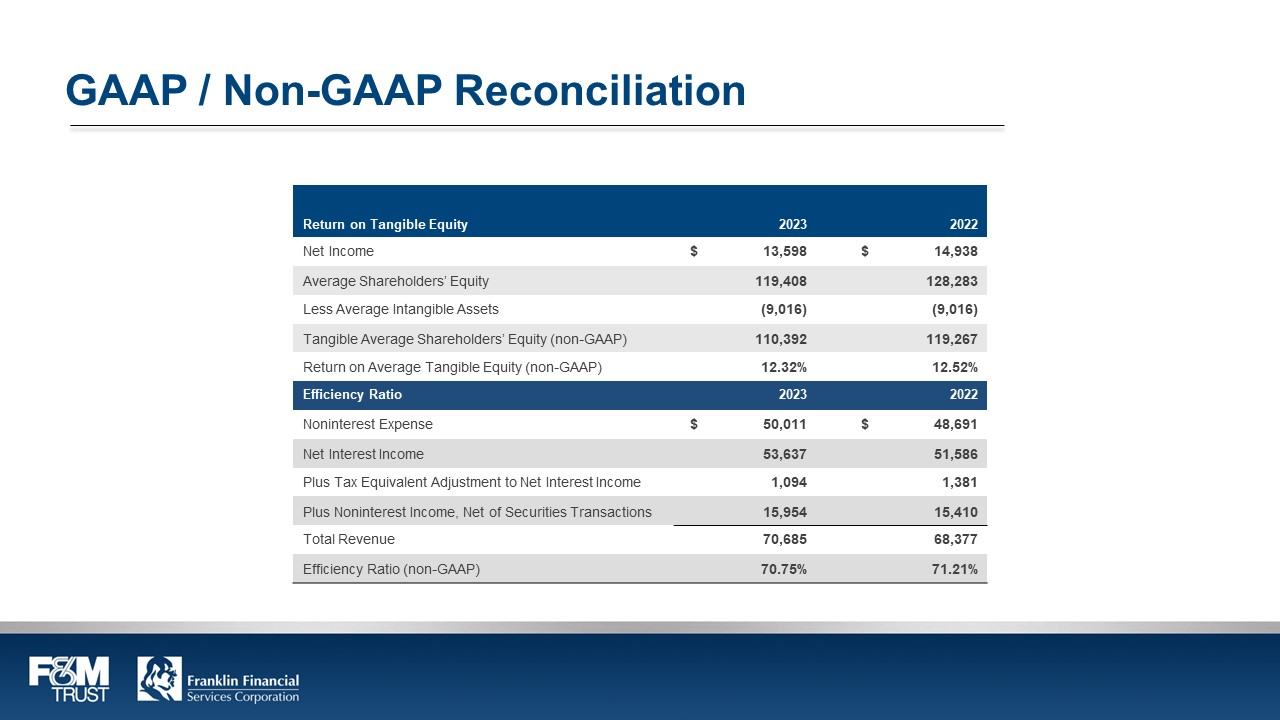
GAAP / Non-GAAP Reconciliation 20232022 Return on Tangible EquityNet Income$ 13,598$ 14,938Average Shareholders’ Equity119,408128,283Less Average Intangible Assets(9,016) (9,016) Tangible Average Shareholders’ Equity (non-GAAP) 110,392119,267Return on Average Tangible Equity (non-GAAP) 12.32%12.52%Efficiency RatioNoninterest Expense$ 50,011$ 48,691Net Interest Income53,63751,586Plus Tax Equivalent Adjustment to Net Interest Income1,0941,381Plus Noninterest Income, Net of Securities Transactions15,95415,410Total Revenue70,68568,377Efficiency Ratio (non-GAAP) 70.75%71.21%
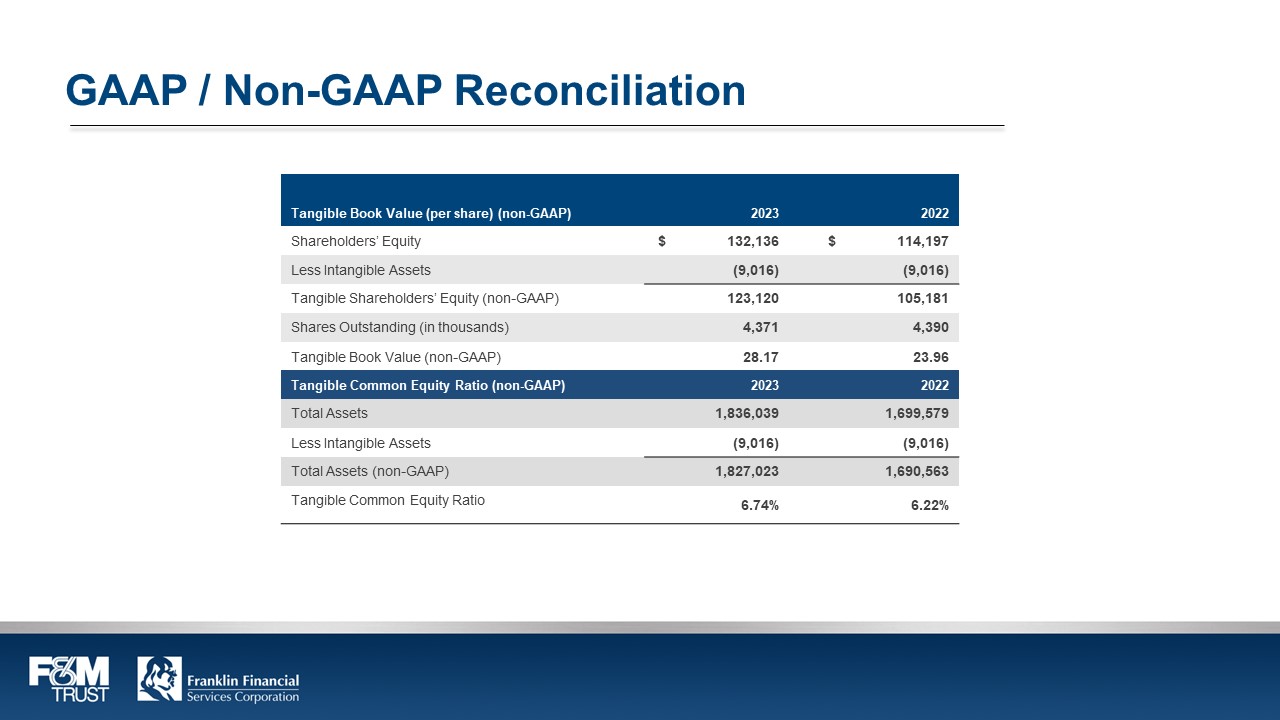
GAAP / Non-GAAP ReconciliationTangible Book Value (per share) (non-GAAP) 20232022Shareholders’ Equity132,136114,197Less Intangible Assets(9,016) (9,016) Tangible Shareholders’ Equity (non-GAAP) 123,120105,181Shares Outstanding (in thousands) 4,3714,390Tangible Book Value (non-GAAP) 28.1723.96Tangible Common Equity Ratio (non-GAAP) Total Assets1,836,0391,699,579Less Intangible Assets(9,016) (9,016) Total Assets (non-GAAP) 1,827,0231,690,563Tangible Common Equity Ratio6.74%6.22%