Exhibit 99.1
Investor Presentation Third Quarter 2024 Highlights F&M TRUST Franklin Financial Services Corporation
Forward Looking Statements Certain statements appearing herein which are not historical in nature are forward-looking statements within the meaning of the Private Securities Litigation Reform Act of 1995. Such forward-looking statements refer to a future period or periods, reflecting management’s current views as to likely future developments, and use words “may,” “will,” “expect,” “believe,” “estimate,” “anticipate,” or similar terms. Because forward-looking statements involve certain risks, uncertainties and other factors over which Franklin Financial Services Corporation has no direct control, actual results could differ materially from those contemplated in such statements. These factors include (but are not limited to) the following: general economic conditions particularly with regard to the negative impact of severe, wide-ranging and continuing disruptions caused by the spread of the coronavirus COVID-19 pandemic and responses thereto, changes in interest rates, changes in the Corporation’s cost of funds, changes in government monetary policy, changes in government regulation and taxation of financial institutions, changes in the rate of inflation, changes in technology, the intensification of competition within the Corporation’s market area, and other similar factors. We caution readers not to place undue reliance on these forward-looking statements. They only reflect management’s analysis as of this date. The Corporation does not revise or update these forward-looking statements to reflect events or changed circumstances. Please carefully review the risk factors described in other documents the Corporation files from time to time with the SEC, including the Annual Reports on Form 10-K, Quarterly Reports on Form 10-Q, and any Current Reports on Form 8-K. F&M TRUST Franklin Financial Services Corporation 2
CEO Comments We were able to post strong third quarter operating results with very little noise that moved the needle up or down. We are starting to see the benefits of the strong loan growth that we realized last year into this year, and we have been able, despite the headwinds of volatile interest rates, to continue to grow deposits, up 12% since the end of 2023, while maintaining a cost of deposits of 1.81%. As I noted in my second quarter comments, credit quality remains very good with minimal new issues. We continue to focus on maintaining strong underwriting standards to protect us should the credit cycle reverse on us. We had three key events at the beginning of the fourth quarter worth mentioning. One, we opened our new, 1700 sq. foot branch facility in Dauphin County, which supports our continued expansion into new markets. Two, we took actions to restructure our balance sheet, selling low-rate investments, at an after-tax cost of $3.4 million, and reinvesting the proceeds into higher rate investments. And three, I announced my intention to retire from the company at the end of April 2025. The company is currently undergoing a search for my replacement which we hope to announce in January. We continue to be focused on building shareholder value through growth and improved profitability and that focus will not waiver as we transition the leadership in the company over the next six months. Thank you for your continued support. Sincerely, F&M TRUST Franklin Financial Services Corporation 3
Why Invest in Franklin Financial? Franklin Financial Services Corporation (FRAF) is a premier, $2.2 billion, bank franchise located in South-Central Pennsylvania and the northern tier of Maryland Franklin Financial is a company… That is focused on building shareholder value by investing in technology and infrastructure to be positioned for growth and profitability improvement That continues to grow core, low-rate deposits With diversified revenue streams including a wealth management team that oversees $1.3 billion in assets With pristine credit quality With an above peer average dividend yield That offers an attractive valuation entry point F&M TRUST Franklin Financial Services Corporation 4
Mission, Vision & Core Values Mission Statement Delivering the right financial solutions from people you know and trust. Vision We are committed to remaining independent by growing our bank to meet the increasing needs of our employees, customers, communities, and shareholders. We strive to be a financial services leader in the markets we serve. Core Values The employees, officers and directors are committed to the core values of integrity, teamwork, excellence, accountability, and concern for our customers and the communities we serve. F&M TRUST Franklin Financial Services Corporation 5
Overview of Franklin Financial Franklin Financial, which was formed in 1983, is a holding company headquartered in Franklin County, PA Franklin Financial’s wholly-owned subsidiary, F&M Trust, was founded in Chambersburg, PA in 1906 Total assets of the Company were $2.15 billion as of September 30, 2024 As of September 30, 2024, Franklin Financial reported $1.32 billion in brokerage and trust assets under management Franklin Financial stock is trading on the Nasdaq Stock Market (NASDAQ: FRAF) F&M TRUST Franklin Financial Services Corporation 6
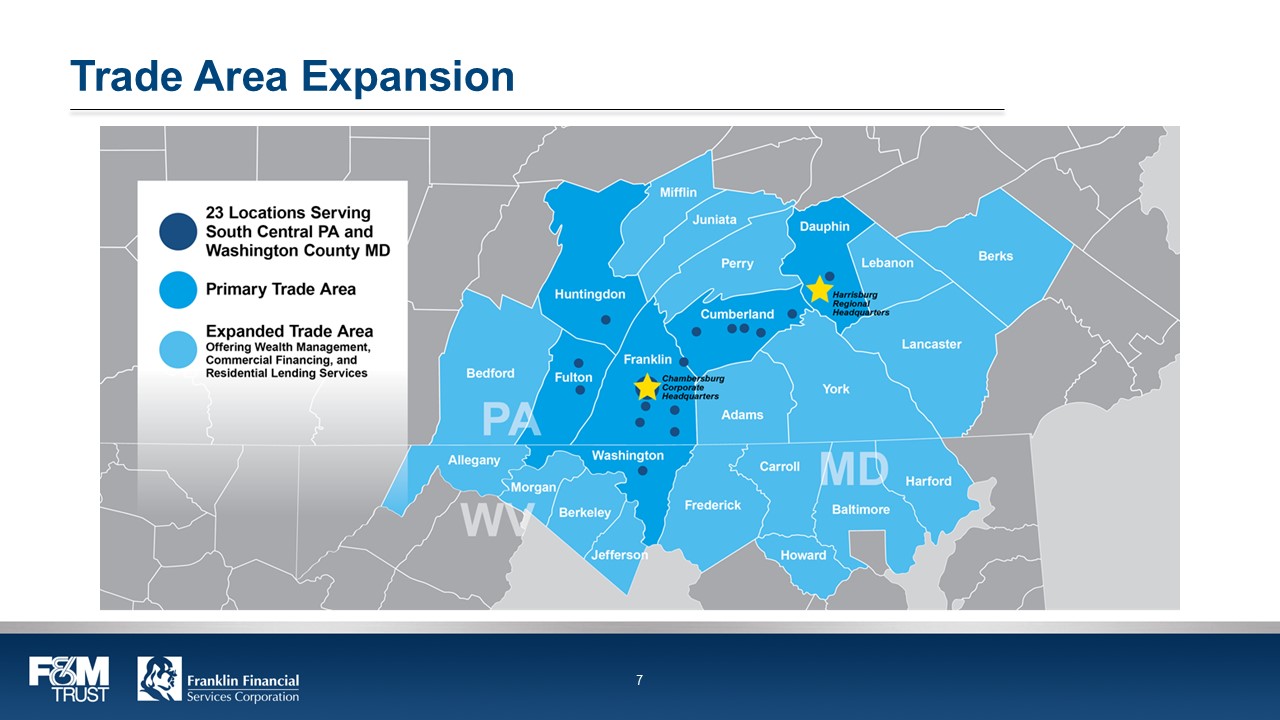
Trade Area Expansion 23 Locations Serving South Central PA and Washington County MD Primary Trade Area Expanded Trade Area Offering Wealth Management, Commercial Financing, and Residential Lending Services F&M TRUST Franklin Financial Services Corporation 7
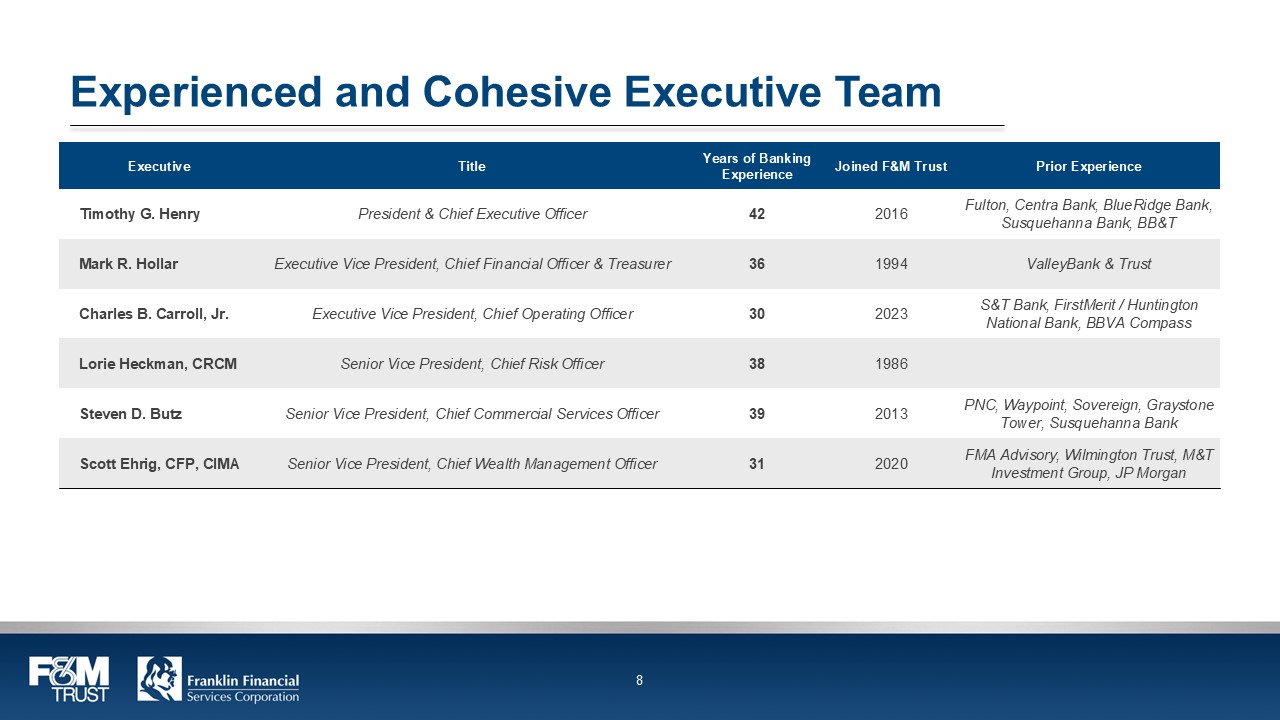
Experienced and Cohesive Executive Team Executive Title Years of Banking Experience Joined F&M Trust Prior Experience Timothy G. Henry President & Chief Executive Officer 42 2016 Fulton, Centra Bank, BlueRidge Bank, Susquehanna Bank, BB&T Mark R. Hollar Executive Vice President, Chief Financial Officer & Treasurer 36 1994 ValleyBank & Trust Charles B. Carroll, Jr. Executive Vice President, Chief Operating Officer 30 2023 S&T Bank, FirstMerit / Huntington National Bank, BBVA Compass Lorie Heckman, CRCM Senior Vice President, Chief Risk Officer 38 1986 Steven D. Butz Senior Vice President, Chief Commercial Services Officer 39 2013 PNC, Waypoint, Sovereign, Graystone Tower, Susquehanna Bank Scott Ehrig, CFP, CIMA Senior Vice President, Chief Wealth Management Officer 31 2020 FMA Advisory, Wilmington Trust, M&T Investment Group, JP Morgan F&M TRUST Franklin Financial Services Corporation 8
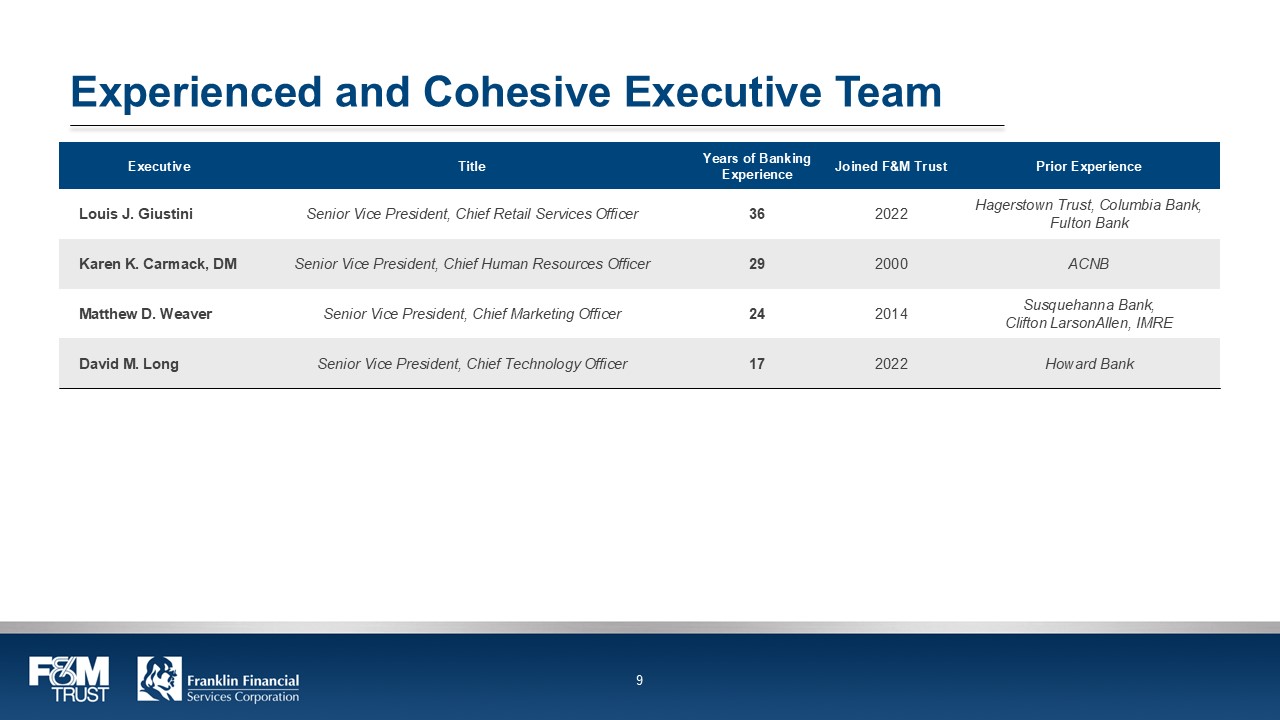
Experienced and Cohesive Executive Team Executive Title Years of Banking Experience Joined F&M Trust Prior Experience Louis J. Giustini Senior Vice President, Chief Retail Services Officer 36 2022 Hagerstown Trust, Columbia Bank, Fulton Bank Karen K. Carmack, DM Senior Vice President, Chief Human Resources Officer 29 2000 ACNB Matthew D. Weaver Senior Vice President, Chief Marketing Officer 24 2014 Susquehanna Bank, Clifton LarsonAllen, IMRE David M. Long Senior Vice President, Chief Technology Officer 17 2022 Howard Bank F&M TRUST Franklin Financial Services Corporation 9

A Year of Growth SELECTED HIGHLIGHTS KEY STATISTICS Total Assets $2.151 Billion as of 9/30/2024 $1.836 Billion as of 12/31/2023 Net Loans $1.348 Billion as of 9/30/2024 $1.241 Billion as of 12/31/2023 Total Deposits $1.724 Billion as of 9/30/2024 $1.538 Billion as of 12/31/2023 Assets Under Management $1.321 Billion as of 9/30/2024 $1.230 Billion as of 12/31/2023 +17.2% +8.7% +12.1% +7.4% F&M TRUST Franklin Financial Services Corporation 10
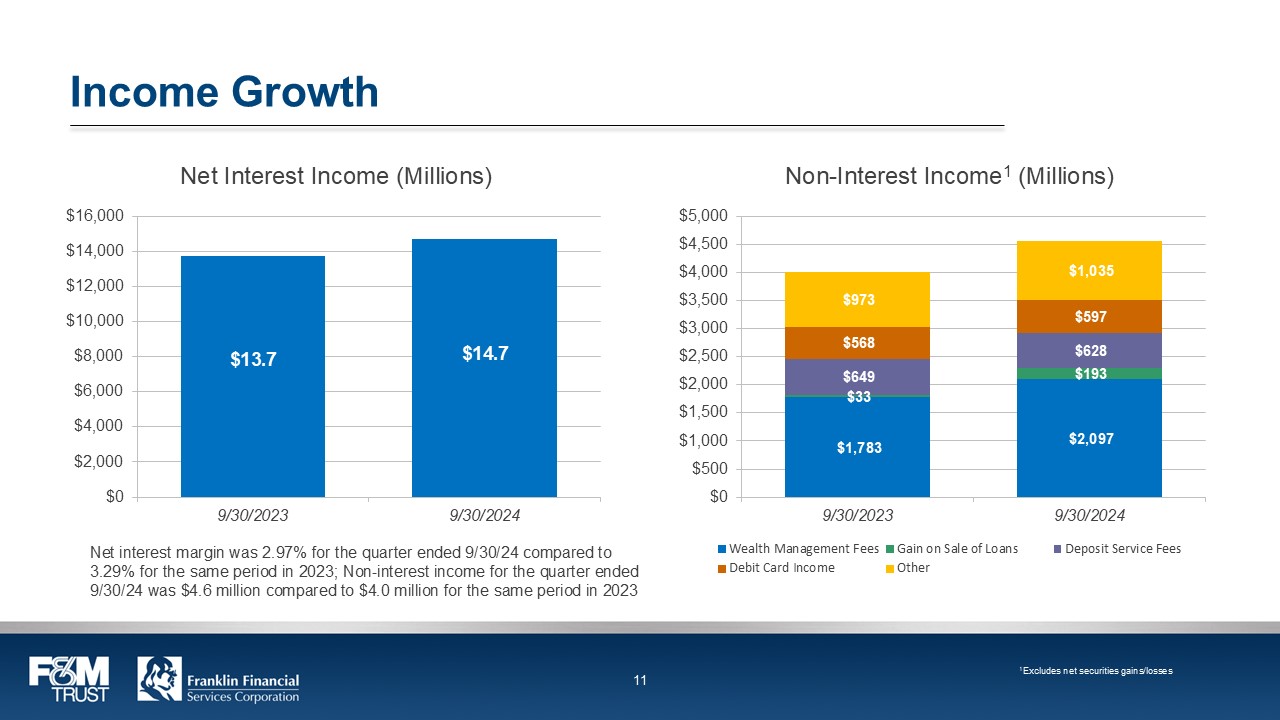
Income Growth Net Interest Income (Millions) $16,000 $14,000 $12,000 $10,000 $8,000 $6,000 $4,000 $2,000 $0 $13.7 $14.7 9/30/2023 9/30/2024 Net interest margin was 2.97% for the quarter ended 9/30/24 compared to 3.29% for the same period in 2023; Non-interest income for the quarter ended 9/30/24 was $4.6 million compared to $4.0 million for the same period in 2023 Non-Interest Income1 (Millions) $5,000 $4,500 $4,000 $3,500 $3,000 $2,500 $2,000 $973 $1,035 $1,500 $568 $597 $1,000 $649 $628 $500 $33 $193 $0 $1,783 $2,097 9/30/2023 9/30/2024 Wealth Management Fees Gain on Sale of Loans Debit Card Income Other Deposit Service Fees 1Excludes net securities gains/losses F&M TRUST Franklin Financial Services Corporation 11
Outlook The Company is continuing to grow by leveraging our past investments in human capital as well as our physical, technological, and sales infrastructure including: Integration of Salesforce into sales, operations, and marketing Expanding our presence in the Pennsylvania and Maryland markets Expanding the use of digitization in both customer interface and operational workflows to improve efficiencies and decrease costs across the company The focus on cross-selling between Commercial, Retail, and Wealth Management service lines of business, to the benefit of the bank’s customers, continues with improvement due to the adoption and use of Salesforce throughout the bank and senior management’s focus on the opportunities available to the company Commercial loan growth will continue due to the integration of new commercial relationship managers, improved underwriting processes, and growth into new regional markets for the bank F&M TRUST Franklin Financial Services Corporation 12
Outlook Deposit balances should continue to grow subject to the bank’s efforts to control interest expense and manage liquidity needs Market pressure on deposit rates and competition for high-quality lending relationships may have an adverse effect on NIM The negative effect of the Accumulated Other Comprehensive Income on book capital may fluctuate over time with changes in interest rates but will eventually decrease as investments move to maturity Fee income from the Wealth Management division should continue to grow due to focus on the addition of new clients and gathering new assets from existing clients; overall growth should only be moderated by the general performance of both the bond and equity markets Along with driving revenue, we are focused on finding operating efficiencies, both internally and with our external third-party vendors F&M TRUST Franklin Financial Services Corporation 13
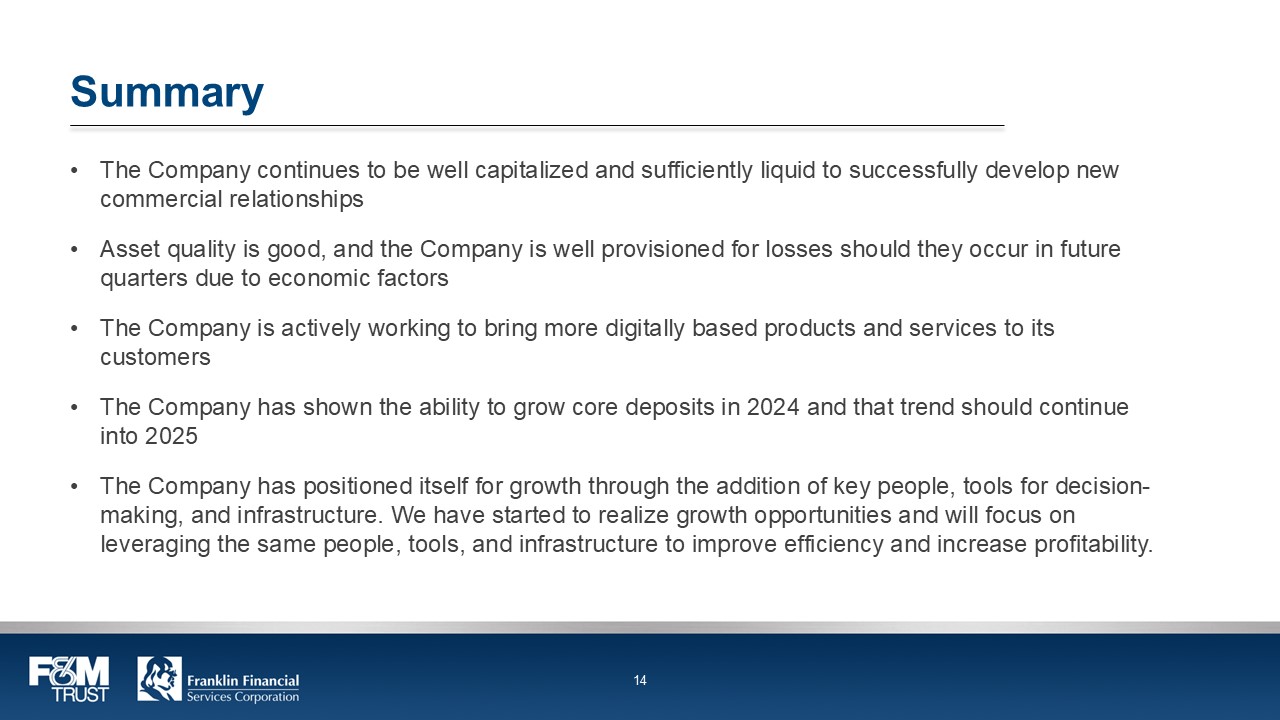
Summary The Company continues to be well capitalized and sufficiently liquid to successfully develop new commercial relationships Asset quality is good, and the Company is well provisioned for losses should they occur in future quarters due to economic factors The Company is actively working to bring more digitally based products and services to its customers The Company has shown the ability to grow core deposits in 2024 and that trend should continue into 2025 The Company has positioned itself for growth through the addition of key people, tools for decision-making, and infrastructure. We have started to realize growth opportunities and will focus on leveraging the same people, tools, and infrastructure to improve efficiency and increase profitability. F&M TRUST Franklin Financial Services Corporation 14
Financial Updates Third Quarter Ended September 30, 2024 F&M TRUST Franklin Financial Services Corporation 15
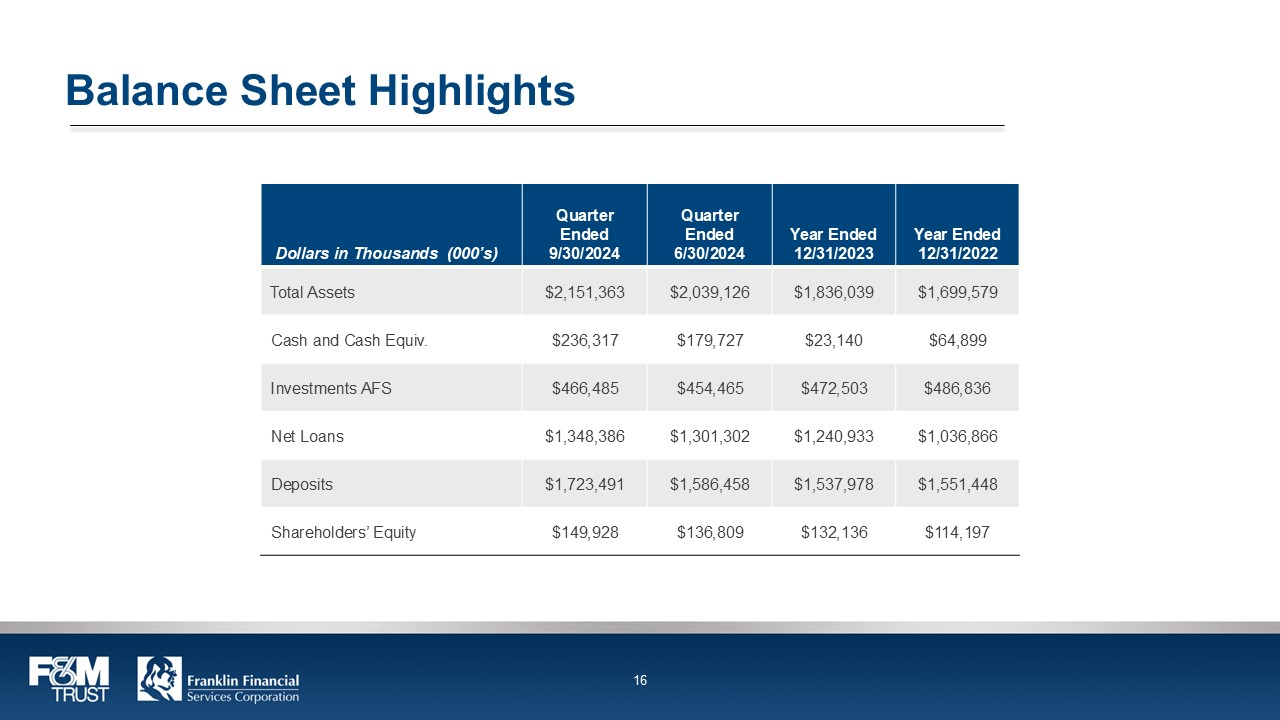
Balance Sheet Highlights Dollars in Thousands (000’s) Quarter Ended 9/30/2024 Quarter Ended 6/30/2024 Year Ended 12/31/2023 Year Ended 12/31/2022 Total Assets $2,151,363 $2,039,126 $1,836,039 $1,699,579 Cash and Cash Equiv. $236,317 $179,727 $23,140 $64,899 Investments AFS $466,485 $454,465 $472,503 $486,836 Net Loans $1,348,386 $1,301,302 $1,240,933 $1,036,866 Deposits $1,723,491 $1,586,458 $1,537,978 $1,551,448 Shareholders’ Equity $149,928 $136,809 $132,136 $114,197 F&M TRUST Franklin Financial Services Corporation 16
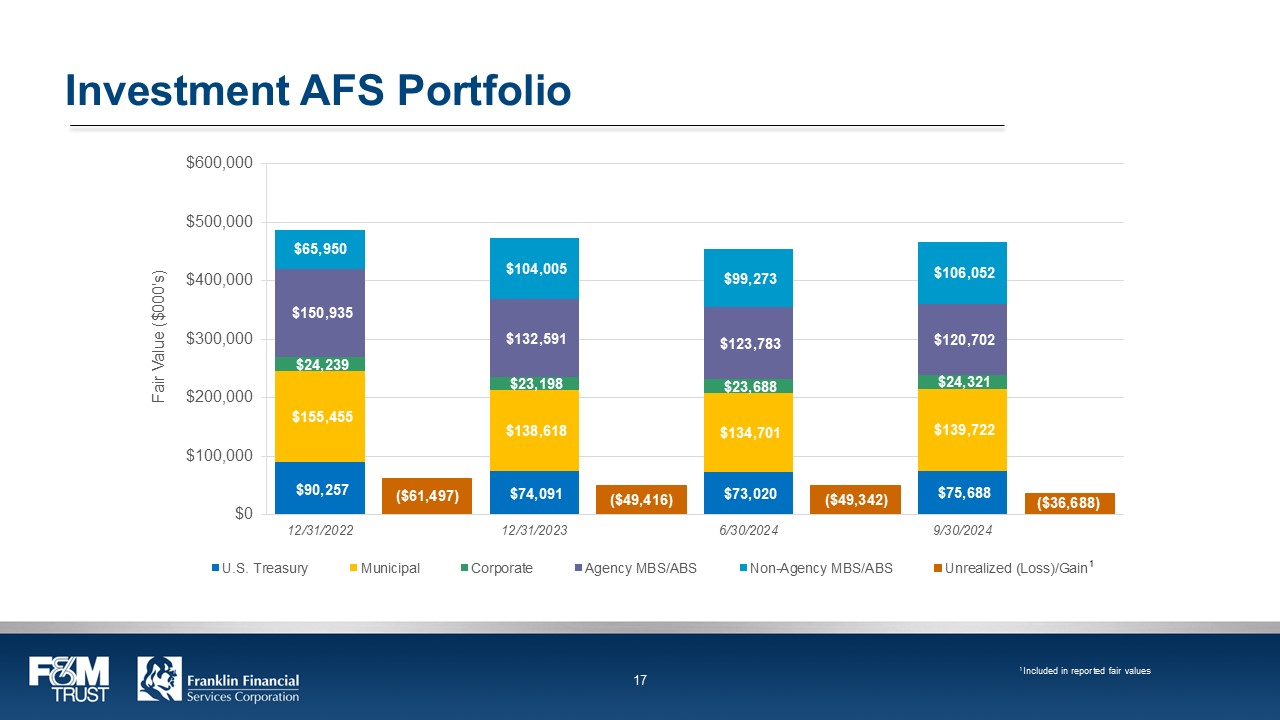
Investment AFS Portfolio $600,000 $500,000 $400,000 $65,950 $104,005 $99,273 $106,052 $300,000 $150,935 $132,591 123783` $120,702 $200,000 $24,239 $23,198 $23,688 $24,321 $100,000 $155,455 $138,618 $134,701 $139,722 $0 $90,257 ($61,497) $74,091 ($49,416) $73,020 ($49,342) $75,688 ($36,688) 12/31/2022 12/31/2023 12/31/2024 12/31/2025 U.S. Treasury Municipal Corporate Agency MBS/ABS Non-Agency MBS/ABS Unrealized (Loss)Gain1 F&M TRUST Franklin Financial Services Corporation 17
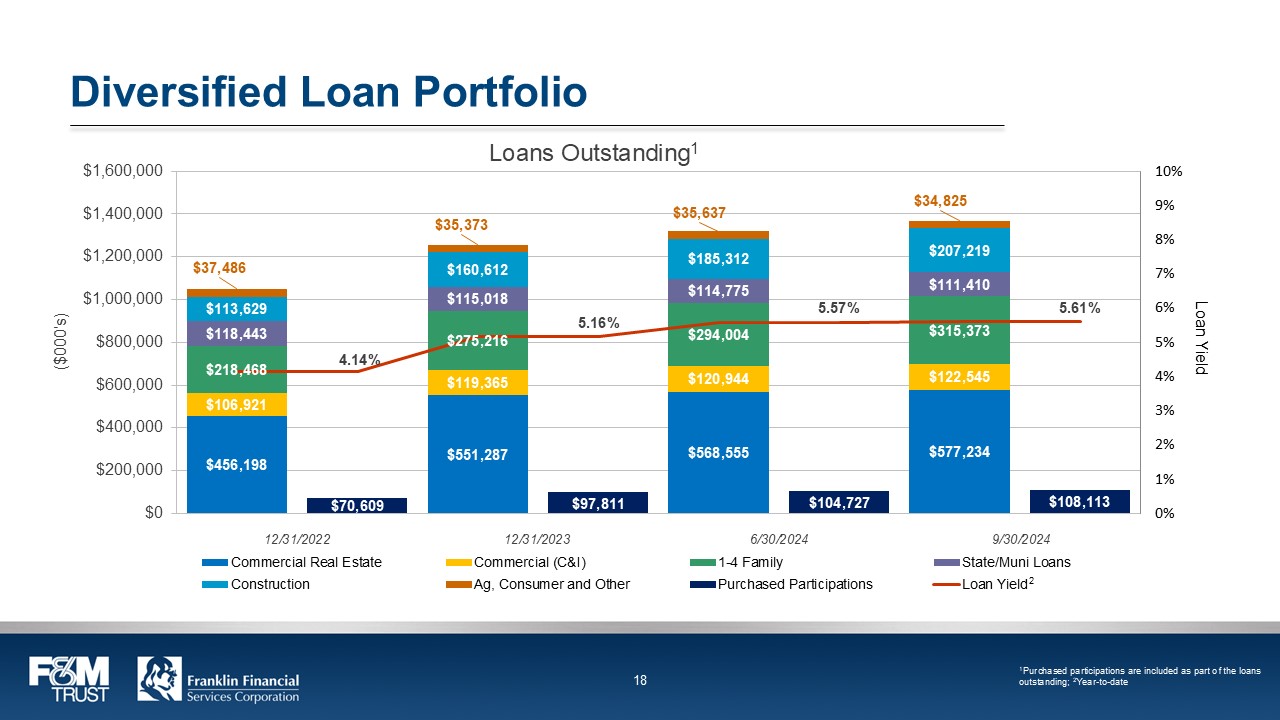
Diversified Loan Portfolio Loans Outstanding1 $1,600,000 $1,400,000 $1,200,000 $1,000,000 $37,486 $35,373 $35,373 $35,637 $34,825 $800,000 $113,629 $160,612 $185,312 $207,219 $600,000 $118,443 $115,018 $114,775 $111,410 $400,000 $218,468 4.14% $275,216 5.16% $294,004 5.57% $315,373 5.61% $200,000 $106,921 $119,365 $120,944 $122,545 $0 $456,198 $70,609 $551,287 $97,811 $568,555 $104,727 $577,234 $108,113 12/31/2022 12/31/2023 12/31/2024 12/31/2025 Commercial Real Estate Construction Commercial (C&l) 1-4 Family Ag, Consumer and Other . m Purchased Participations State/Muni Loans Loan Yield2 1Purchased participations are included as part of the loans outstanding; 2Year-to-date F&M TRUST Franklin Financial Services Corporation 18
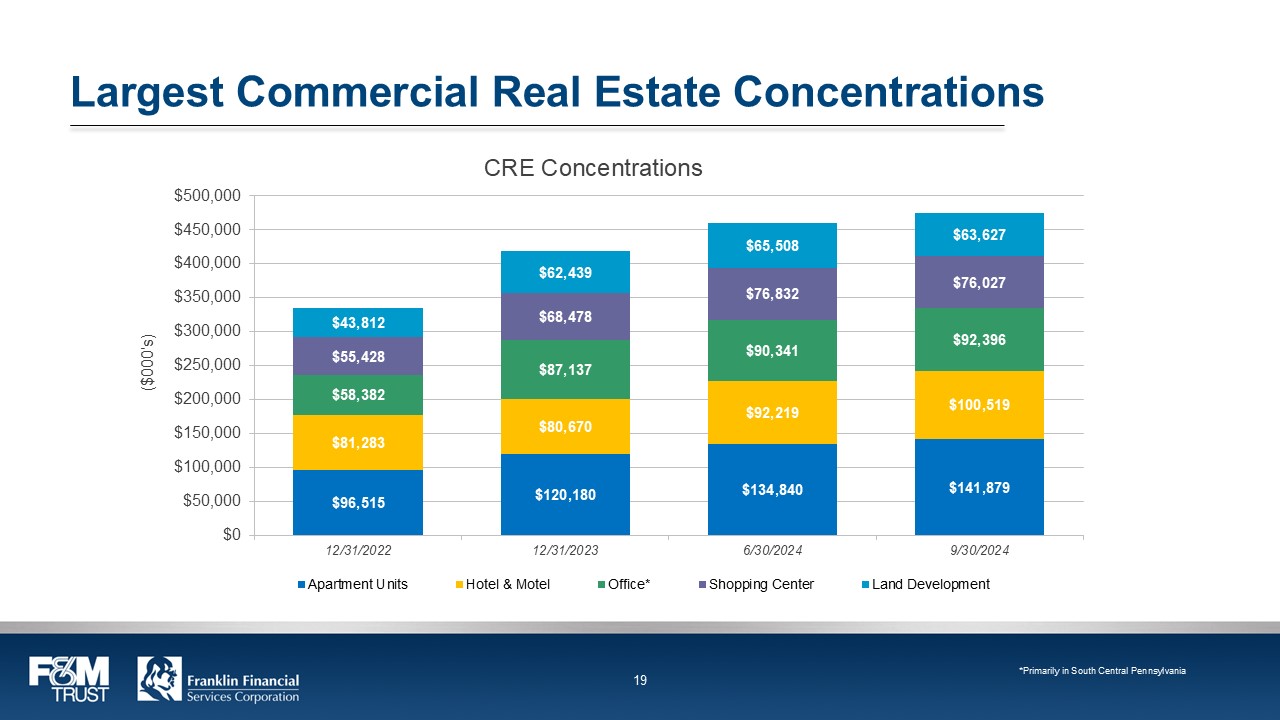
Largest Commercial Real Estate Concentrations CRE Concentrations $500,000 $450,000 $400,000 $350,000 $300,000 $250,000 $43,812 $62,439 $65,508 $63,627 $200,000 $55,428 $68,478 $76,832 $76,027 $150,000 $58,382 $87,137 $90,341 $92,396 $100,000 $81,283 $80,670 $92,219 $100,519 $50,000 $96,515 $120,180 $134,840 $141,879 $0 12/31/2022 12/31/2023 12/31/2024 12/31/2025 Apartment Units Hotel & Motel Office* Shopping Center Land Development *Primarily in South Central Pennsylvania F&M TRUST Franklin Financial Services Corporation 19
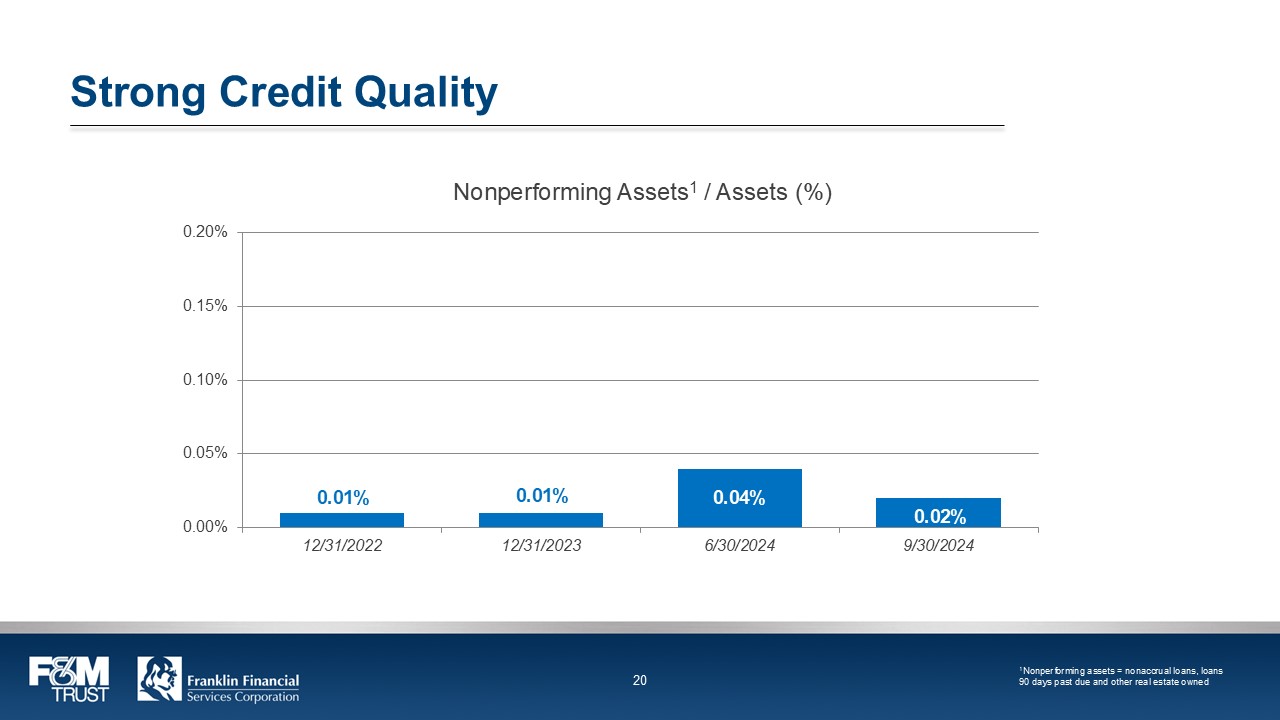
Strong Credit Quality Nonperforming Assets1 / Assets (%) 0.20% 0.15% 0.10% 0.05% 0.00% 0.01% 0.01% 0.00% 0.02% 12/31/2022 12/31/2023 6/30/2024 12/31/2024 1Nonperforming assets = nonaccrual loans, loans 90 days past due and other real estate owned F&M TRUST Franklin Financial Services Corporation 20
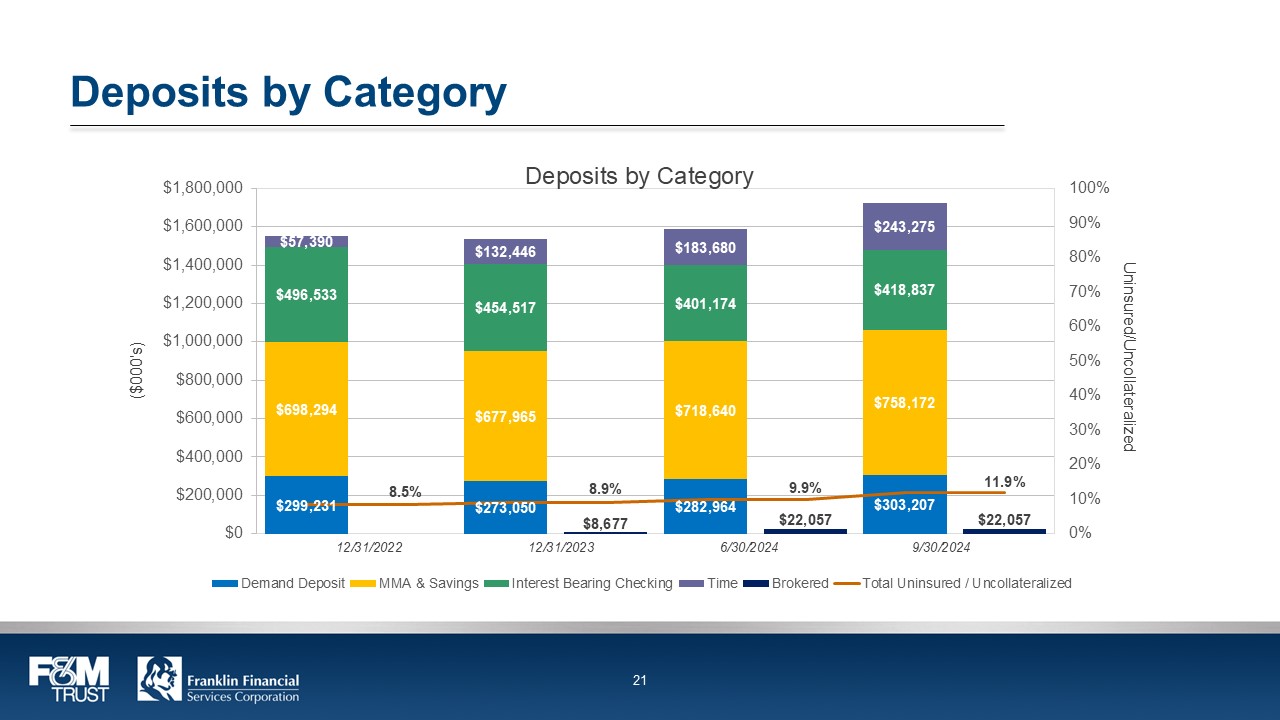
Deposits by Category Deposits by Category $1,800,000 $1,600,000 $1,400,000 $1,200,000 $1,000,000 $800,000 $600,000 $57,390 $132,446 $183,680 $243,725 $400,000 $496,533 $454,817 $401,174 $418,837 $200,000 $698,292 8.5% $677,965 839.0% $718,640 9.9% $758,172 11.9% $0 $299,231 $273,050 $8,677 $282,964 $22,057 $303,207 $22,057 12/31/2022 12/31/2023 6/30/2024 12/31/2024 Demand Deposit m MMA & Savings m Interest Bearing Checking m Time Brokered Total Uninsured / Uncollateralized F&M TRUST Franklin Financial Services Corporation 21
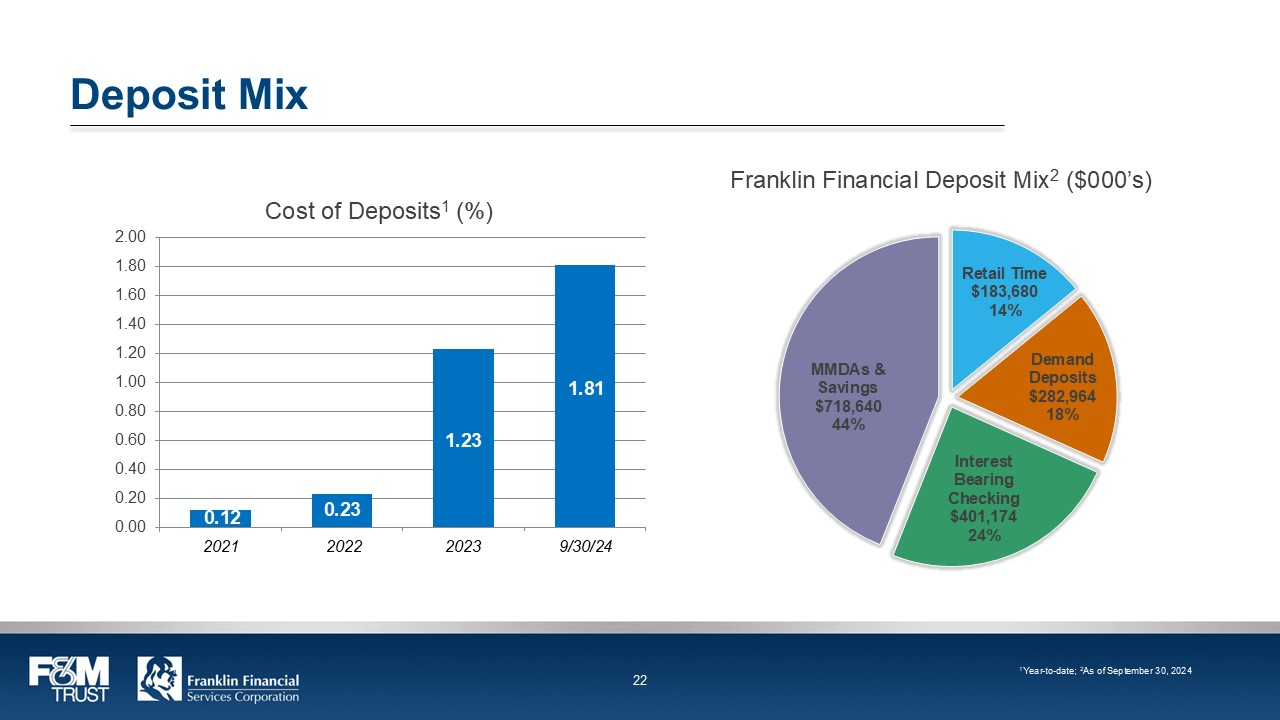
Deposit Mix Cost of Deposits1 (%) 2.00 1.80 1.60 1.40 1.20 1.00 0.80 0.60 0.40 0.20 0.00 0.12 0.23 1.23 1.81 2021 202 2023 2024 Franklin Financial Deposit Mix2 ($000’s) Retail Time $183,680 14% Demand Deposits $282,964 18% Interest Bearing Checking $401,174 24% MMDAs & Savings $718,640 44% 1Year-to-date; 2As of September 30, 2024 F&M TRUST Franklin Financial Services Corporation 22
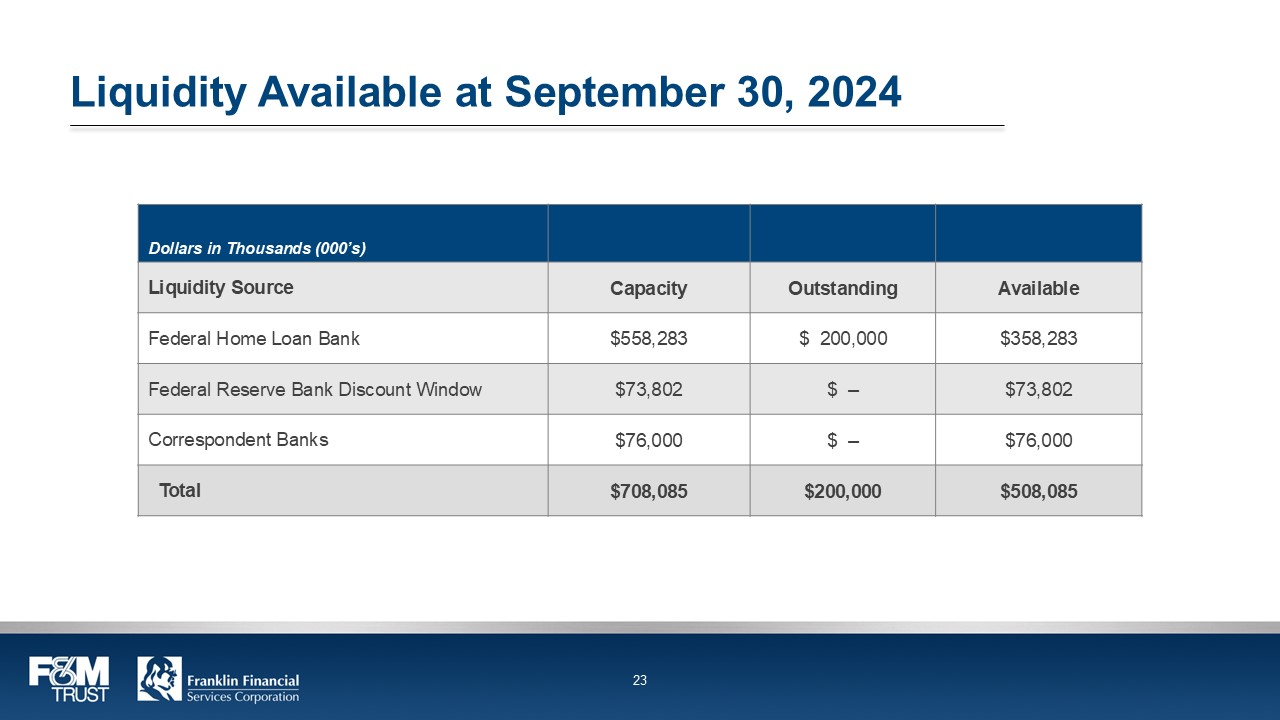
Liquidity Available at September 30, 2024 Dollars in Thousands (000’s) Liquidity Source Capacity Outstanding Available Federal Home Loan Bank $558,283 $ 200,000 $358,283 Federal Reserve Bank Discount Window $73,802 $ – $73,802 Correspondent Banks $76,000 $ – $76,000 Total $708,085 $200,000 $508,085 F&M TRUST Franklin Financial Services Corporation 23
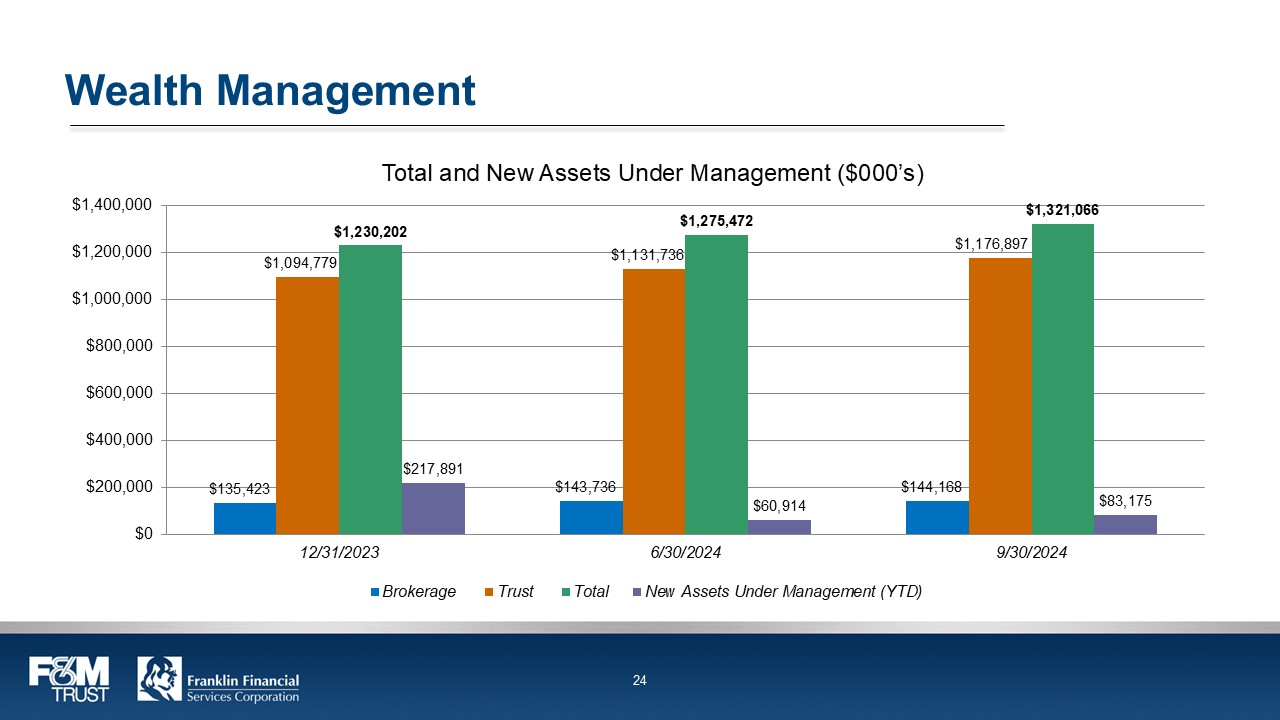
Wealth Management Total and New Assets Under Management ($000’s) $1,400,000 $1,200,000 $1,000,000 $800,000 $600,000 $400,000 $200,000 $0 $135,423 $1,094,779 $1,230,202 $217,891 $143,736 $1,131,736 $1,275,472 $60,914 $144,168 $1,176,897 $1,321,066 $83,175 12312023 6/30/2024 9/30/2024 Brokerage Trust Total New Assets Under Management (YTD) F&M TRUST Franklin Financial Services Corporation 24
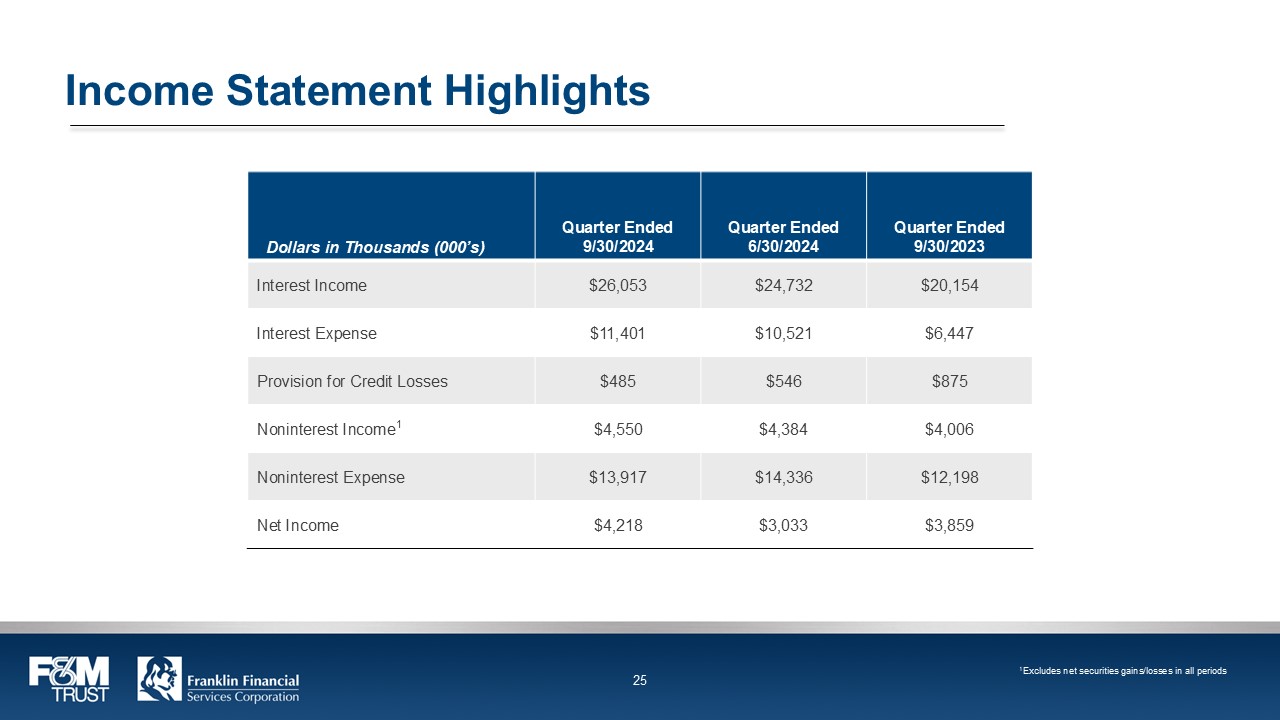
Income Statement Highlights Dollars in Thousands (000’s) Quarter Ended 9/30/2024 Quarter Ended 6/30/2024 Quarter Ended 9/30/2023 Interest Income $26,053 $24,732 $20,154 Interest Expense $11,401 $10,521 $6,447 Provision for Credit Losses $485 $546 $875 Noninterest Income1 $4,550 $4,384 $4,006 Noninterest Expense $13,917 $14,336 $12,198 Net Income $4,218 $3,033 $3,859 1Excludes net securities gains/losses in all periods F&M TRUST Franklin Financial Services Corporation 25
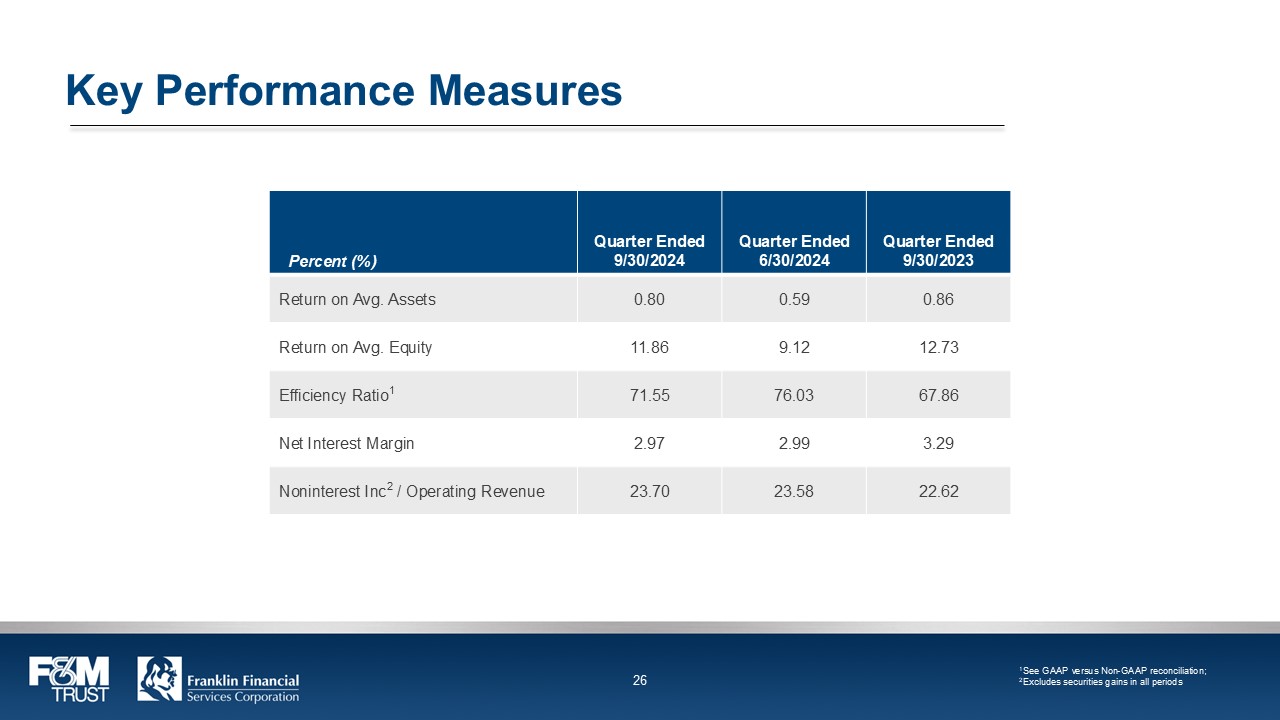
Key Performance Measures Percent (%) Quarter Ended 9/30/2024 Quarter Ended 6/30/2024 Quarter Ended 9/30/2023 Return on Avg. Assets 0.80 0.59 0.86 Return on Avg. Equity 11.86 9.12 12.73 Efficiency Ratio1 71.55 76.03 67.86 Net Interest Margin 2.97 2.99 3.29 Noninterest Inc2 / Operating Revenue 23.70 23.58 22.62 1See GAAP versus Non-GAAP reconciliation; 2Excludes securities gains in all periods F&M TRUST Franklin Financial Services Corporation 26
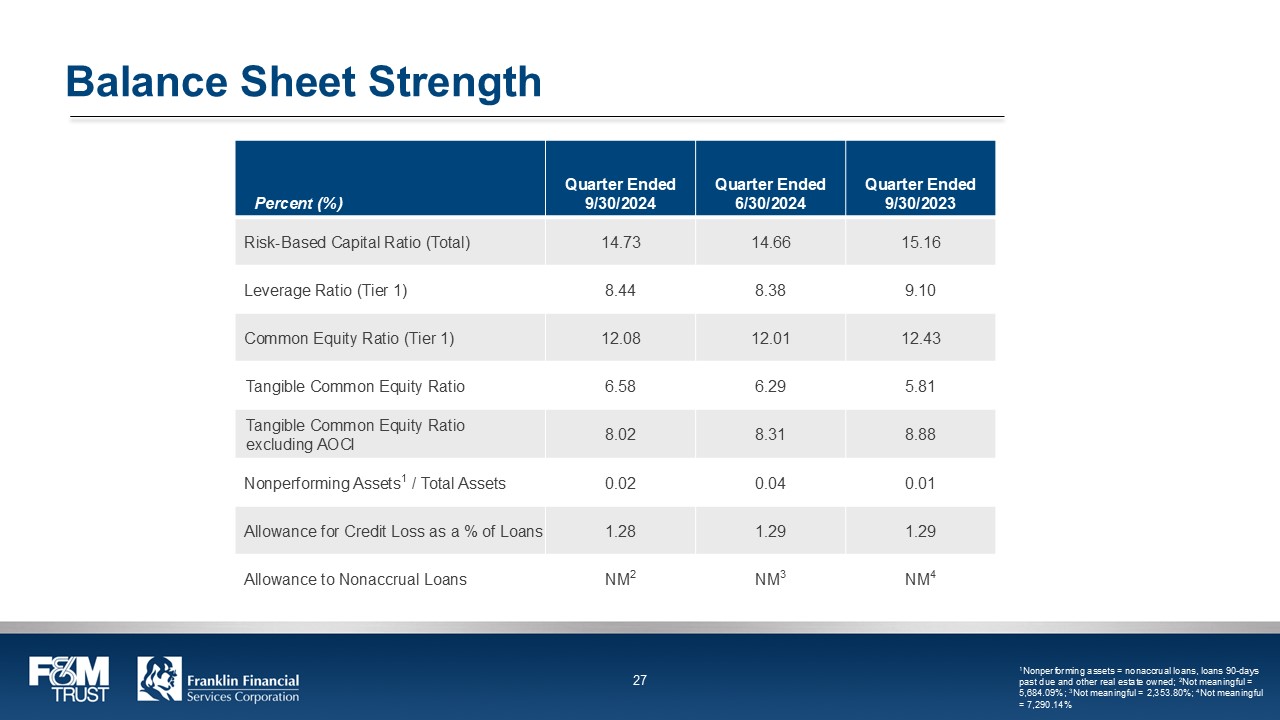
Balance Sheet Strength Percent (%) Quarter Ended 9/30/2024 Quarter Ended 6/30/2024 Quarter Ended 9/30/2023 Risk-Based Capital Ratio (Total) 14.73 14.66 15.16 Leverage Ratio (Tier 1) 8.44 8.38 9.10 Common Equity Ratio (Tier 1) 12.08 12.01 12.43 Tangible Common Equity Ratio 6.58 6.29 5.81 Tangible Common Equity Ratio excluding AOCI 8.02 8.31 8.88 Nonperforming Assets1 / Total Assets 0.02 0.04 0.01 Allowance for Credit Loss as a % of Loans 1.28 1.29 1.29 Allowance to Nonaccrual Loans NM2 NM3 NM4 1Nonperforming assets = nonaccrual loans, loans 90-days past due and other real estate owned; 2Not meaningful = 5,684.09%; 3Not meaningful = 2,353.80%; 4Not meaningful = 7,290.14% F&M TRUST Franklin Financial Services Corporation 27
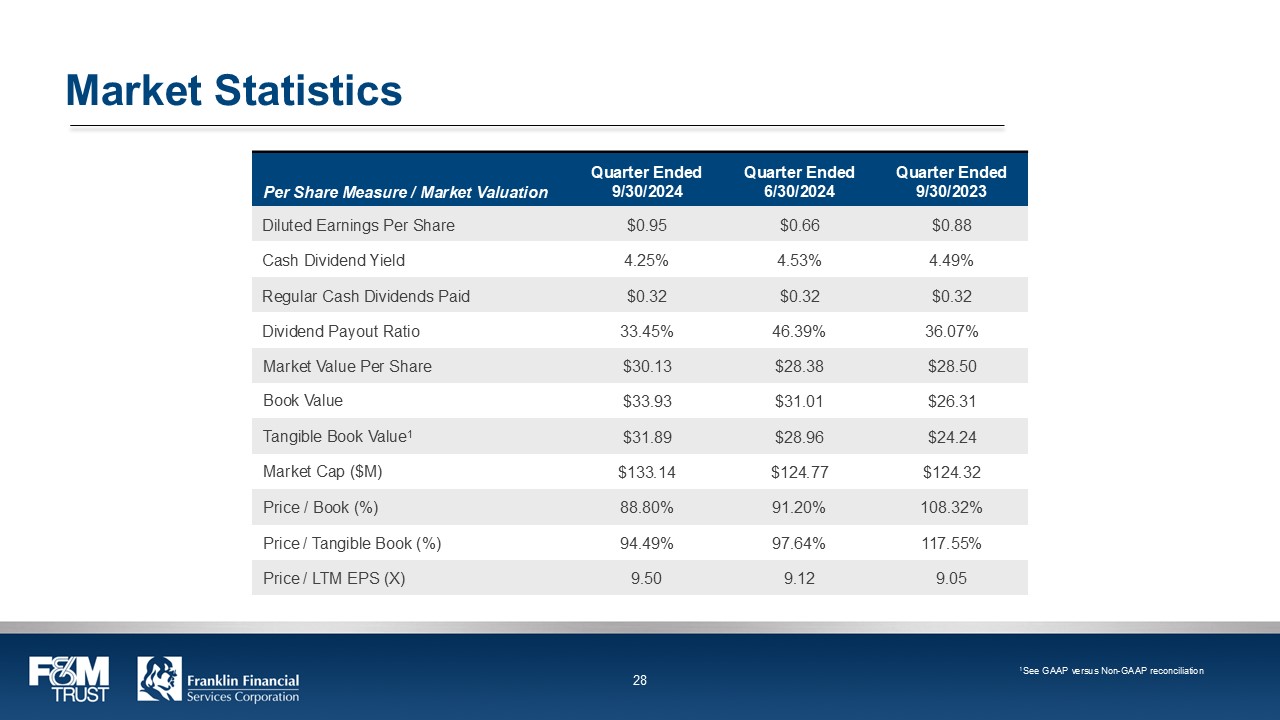
Market Statistics Per Share Measure / Market Valuation Quarter Ended 9/30/2024 Quarter Ended 6/30/2024 Quarter Ended 9/30/2023 Diluted Earnings Per Share $0.95 $0.66 $0.88 Cash Dividend Yield 4.25% 4.53% 4.49% Regular Cash Dividends Paid $0.32 $0.32 $0.32 Dividend Payout Ratio 33.45% 46.39% 36.07% Market Value Per Share $30.13 $28.38 $28.50 Book Value $33.93 $31.01 $26.31 Tangible Book Value1 $31.89 $28.96 $24.24 Market Cap ($M) $133.14 $124.77 $124.32 Price / Book (%) 88.80% 91.20% 108.32% Price / Tangible Book (%) 94.49% 97.64% 117.55% Price / LTM EPS (X) 9.50 9.12 9.05 1See GAAP versus Non-GAAP reconciliation F&M TRUST Franklin Financial Services Corporation 28
Stock Symbol: FRAF (Nasdaq) www.franklinfin.com www.fmtrust.bank F&M TRUST Franklin Financial Services Corporation 29

Appendix F&M TRUST Franklin Financial Services Corporation 30
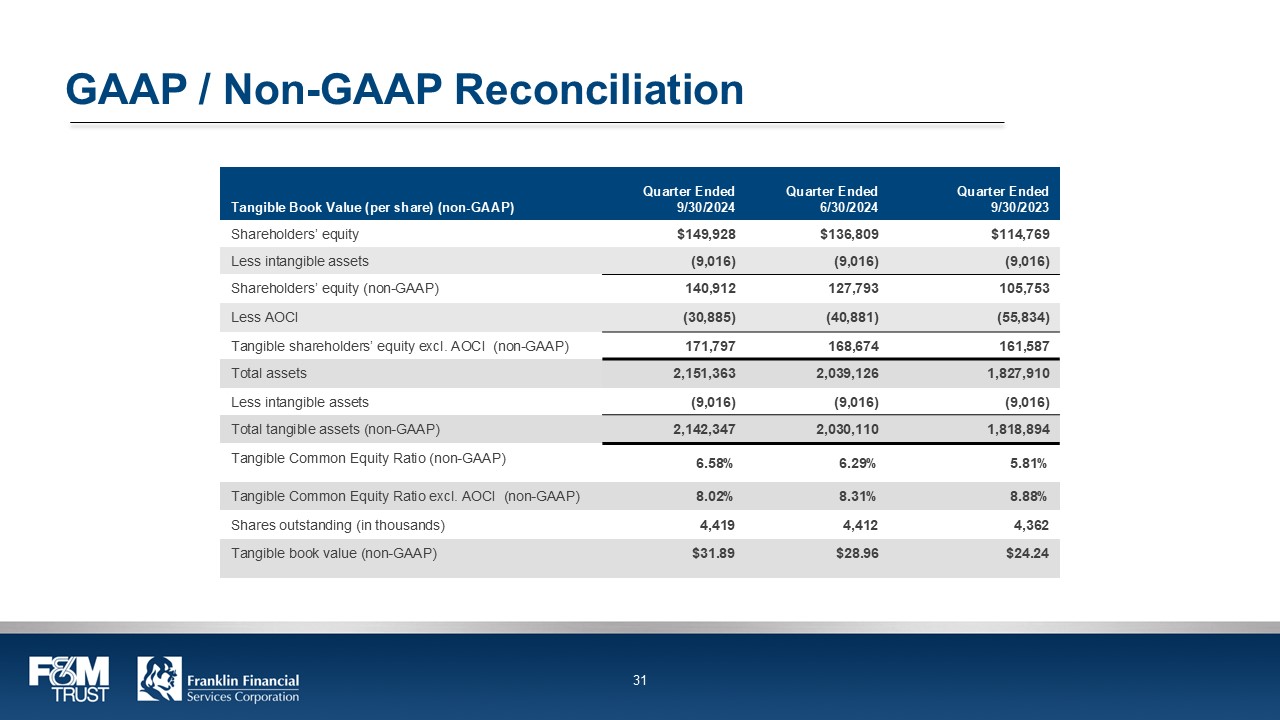
GAAP / Non-GAAP Reconciliation Tangible Book Value (per share) (non-GAAP) Quarter Ended 9/30/2024 Quarter Ended 6/30/2024 Quarter Ended 9/30/2023 Shareholders’ equity $149,928 $136,809 $114,769 Less intangible assets (9,016) (9,016) (9,016) Shareholders’ equity (non-GAAP) 140,912 127,793 105,753 Less AOCI (30,885) (40,881) (55,834) Tangible shareholders’ equity excl. AOCI (non-GAAP) 171,797 168,674 161,587 Total assets 2,151,363 2,039,126 1,827,910 Less intangible assets (9,016) (9,016) (9,016) Total tangible assets (non-GAAP) 2,142,347 2,030,110 1,818,894 Tangible Common Equity Ratio (non-GAAP) 6.58% 6.29% 5.81% Tangible Common Equity Ratio excl. AOCI (non-GAAP) 8.02% 8.31% 8.88% Shares outstanding (in thousands) 4,419 4,412 4,362 Tangible book value (non-GAAP) $31.89 $28.96 $24.24 F&M TRUST Franklin Financial Services Corporation 31
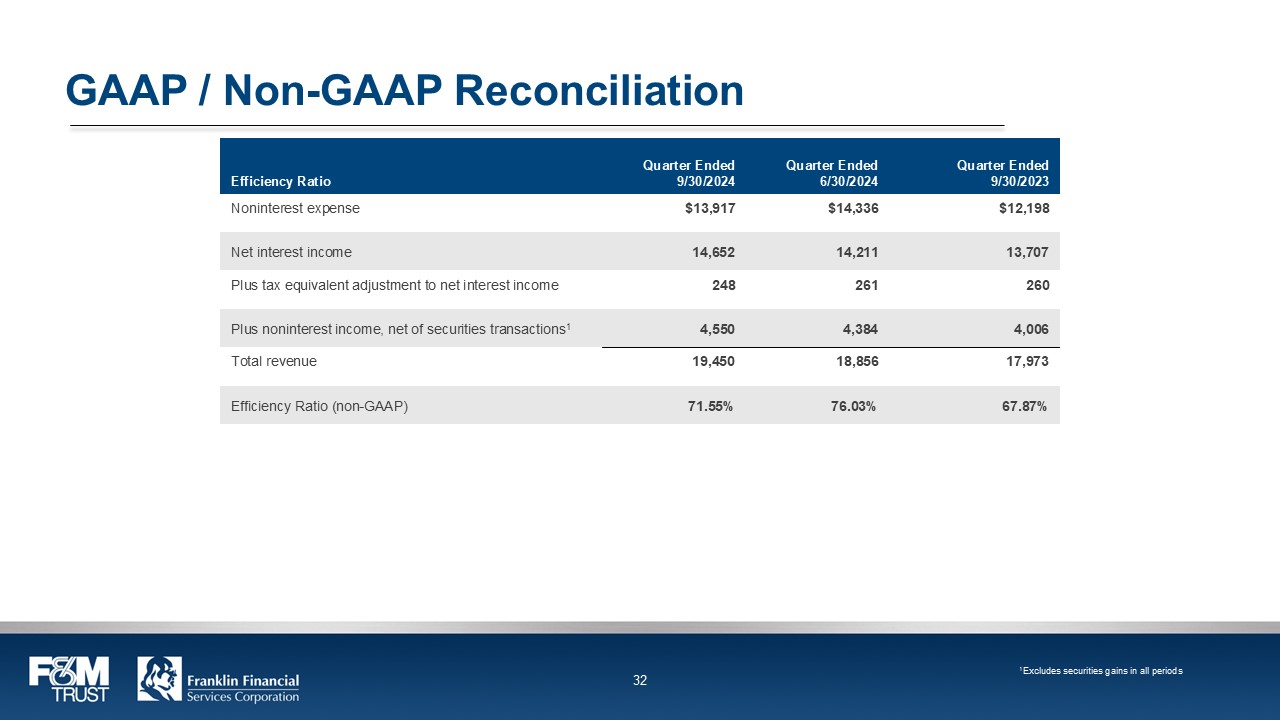
GAAP / Non-GAAP Reconciliation Efficiency Ratio Quarter Ended 9/30/2024 Quarter Ended 6/30/2024 Quarter Ended 9/30/2023 Noninterest expense $13,917 $14,336 $12,198 Net interest income 14,652 14,211 13,707 Plus tax equivalent adjustment to net interest income 248 261 260 Plus noninterest income, net of securities transactions1 4,550 4,384 4,006 Total revenue 19,450 18,856 17,973 Efficiency Ratio (non-GAAP) 71.55% 76.03% 67.87% 1Excludes securities gains in all periods F&M TRUST Franklin Financial Services Corporation 32