Exhibit (a)(3)
LETTER FROM SAINTS CAPITAL GRANITE, L.P.
July [ ], 2013 [DATE FIRST MAILED TO STOCKHOLDERS]
Dear stockholder of Merisel, Inc.
This letter supplements, amends and supersedes our previous letter (the “Prior Letter”) dated July 1, 2013, regarding Saints Capital Granite, L.P. (“Saints”) plan to take Merisel, Inc. (“MSEL”) private through a “short-form” merger. The purposes of this letter and the Schedule 13E-3 Transaction Statement that accompanied the Prior Letter are to:
● | tell you more about the merger, |
● | explain why we think that the $0.17 per share in cash, without interest, that you will receive in the merger is fair consideration for your shares, and |
● | let you know about your rights for an appraisal hearing under Delaware law. |
Included with this letter is important information that amends, supplements and, where indicated, replaces certain information contained in the Schedule 13E-3 Transaction Statement. This information consists of the following:
● | Exhibit A – Supplemental Disclosures |
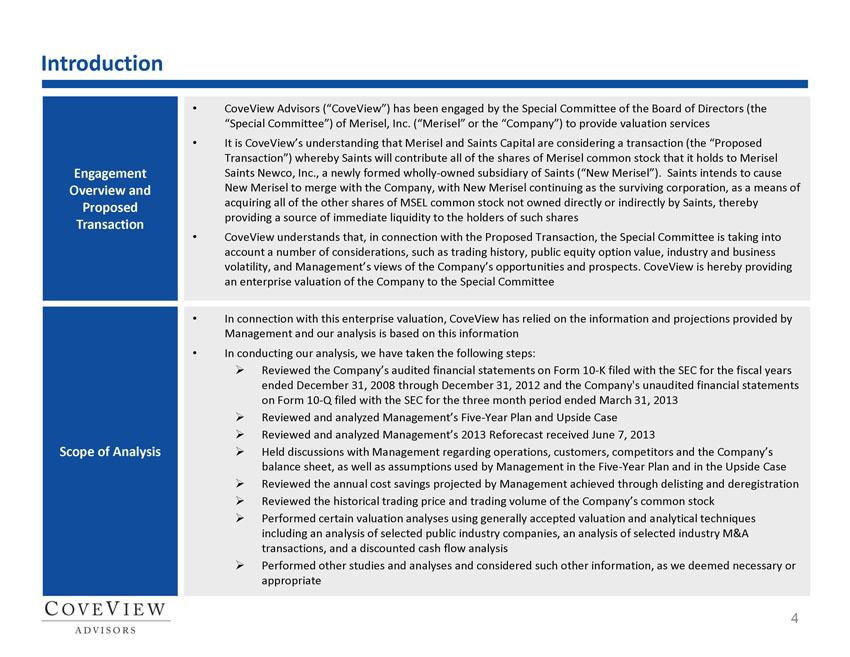
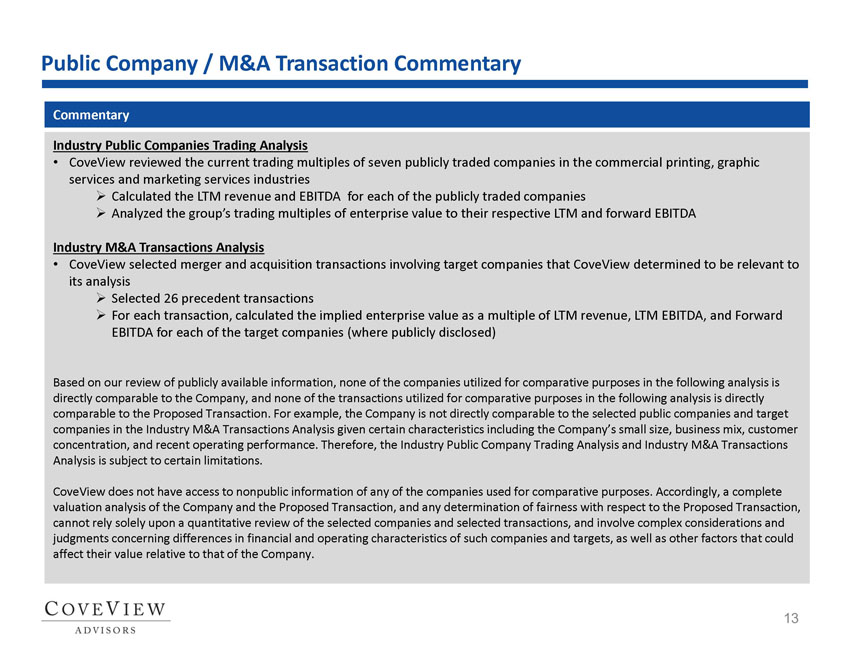
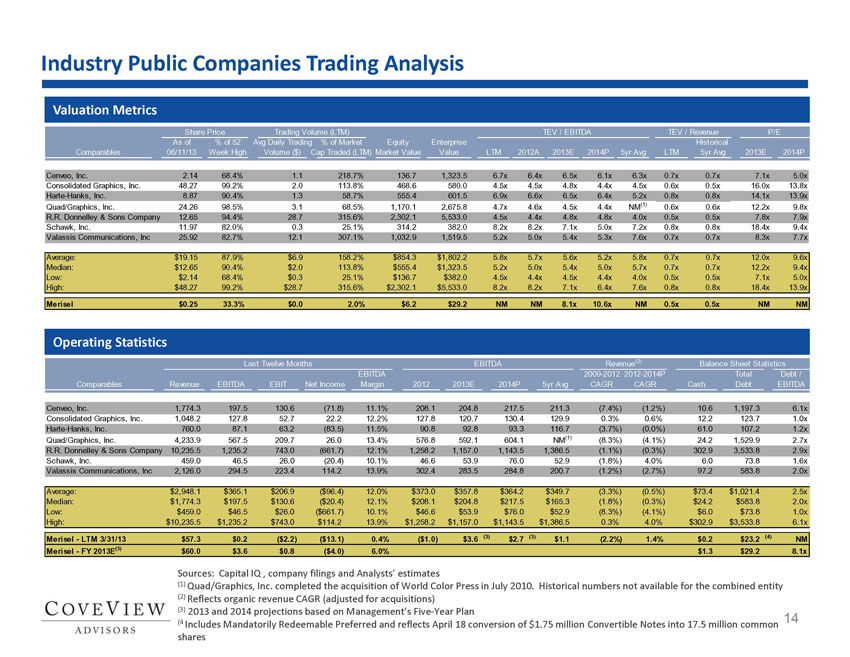
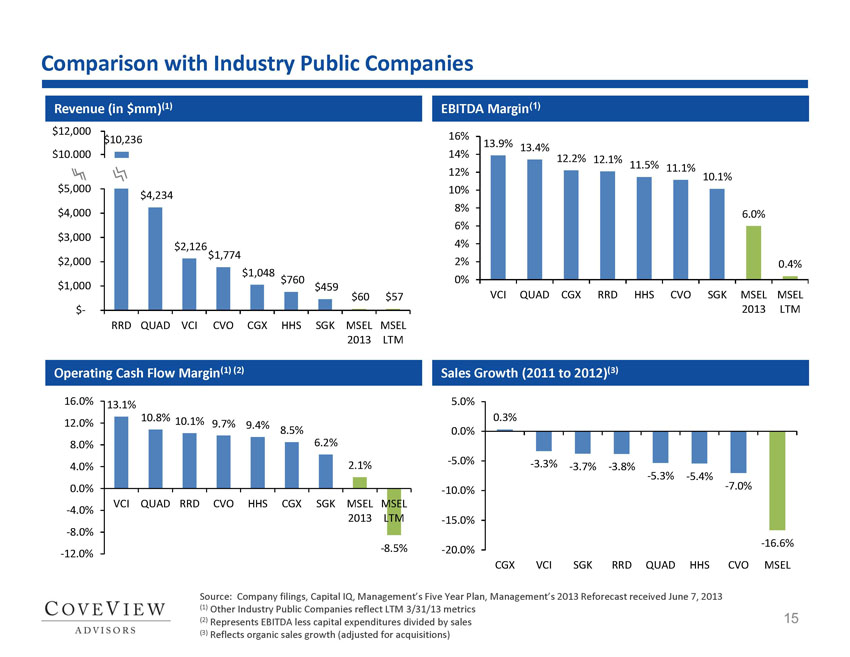
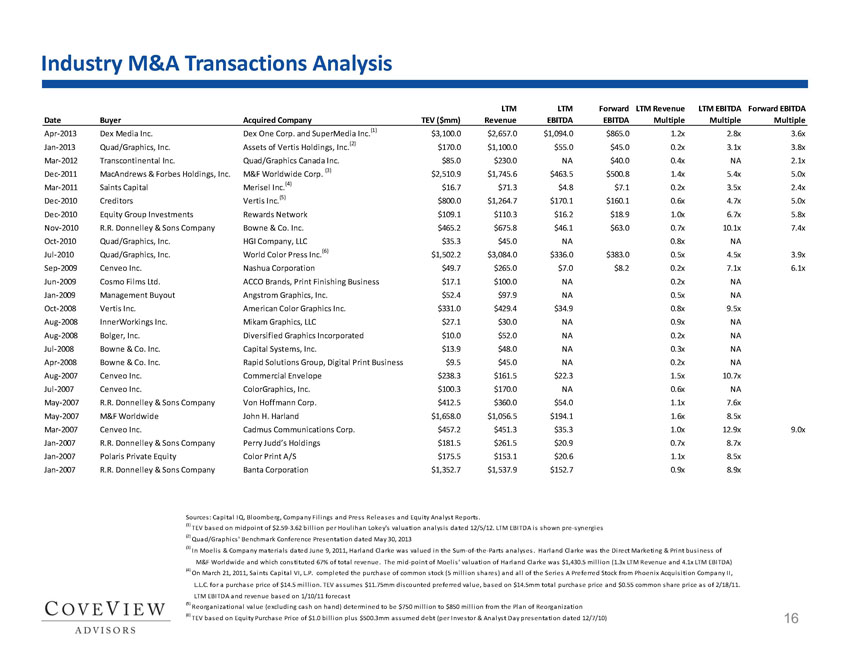
● | Exhibit B – A Valuation Letter from the Valuation Services Firm summarizing the company valuation performed by the Valuation Services Firm and Supplemental Information to the Valuation Letter. |
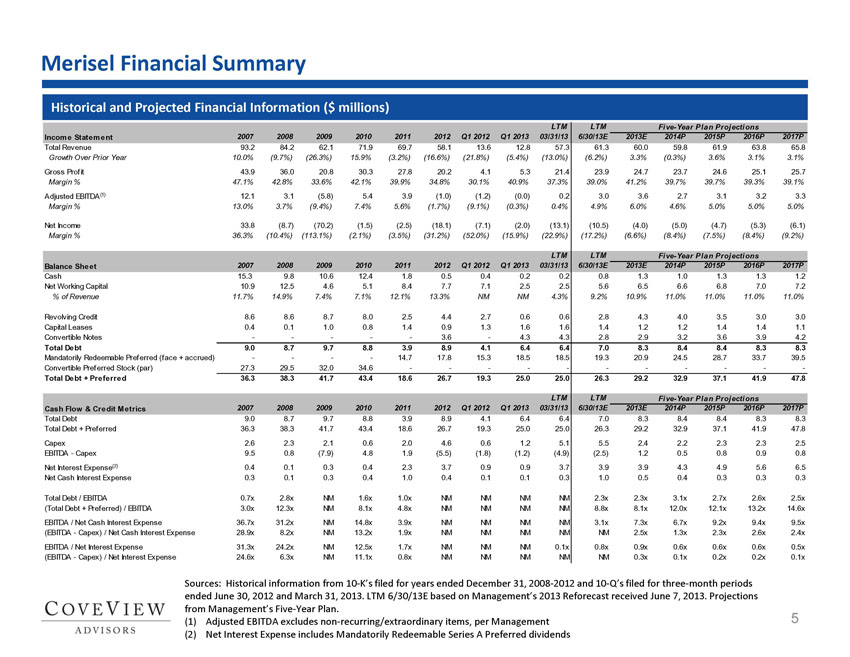
● | Exhibit C – Financial Projections prepared by MSEL management. |
Neither you nor the board of directors of MSEL is being asked to approve the merger. Immediately prior to the effective date of the “short-form” merger, under Delaware law, Merisel Saints Newco, Inc., a wholly owned subsidiary of Saints (“New Merisel”), will own a sufficient number of shares to cause the merger to occur. Upon the effectiveness of the merger, New Merisel will be merged with and into MSEL with MSEL being the surviving entity. As the surviving entity, MSEL will be a wholly owned subsidiary of Saints. In the merger, which we hope will occur on August [ ], 2013 [TEN BUSINESS DAYS AFTER THE ABOVE MAILING DATE] or as soon thereafter as possible, you will receive $0.17 in cash, without interest, for each share of MSEL common stock that you own as of that date. If you do not believe that $0.17 is a fair price for your shares, you can follow the procedures described in the Schedule 13E-3 Transaction Statement and exercise appraisal rights under Delaware law.You should read the Schedule 13E-3 Transaction Statement and the supplemental information included with this letter carefully before deciding whether to accept $0.17 per share or to have a Delaware court determine the fair value of your MSEL shares. The amount determined by such court may be higher or lower than $0.17 per share.
1
Stockholders of record on the date the merger becomes effective will be mailed a Notice of Merger and Appraisal Rights and a Letter of Transmittal. Stockholders receiving such documents should carefully read them. Detailed instructions for surrendering your stock certificates, together with a detailed description of statutory appraisal rights, will be set forth in the Notice of Merger and Appraisal Rights and the Letter of Transmittal. Please do not submit your stock certificates before you have received these documents.
After the merger, the MSEL common stock will not be publicly traded. MSEL also will not be required to file reports with the Securities and Exchange Commission. In addition, the merger will have federal income tax consequences for you, and you should consult with your tax adviser in order to understand fully how the merger will affect you.
| Sincerely, | |||
SAINTS CAPITAL GRANITE, L.P. | |||
| By: | /s/ Kenneth B. Sawyer | ||
| Name: | Kenneth B. Sawyer | ||
| Title: | Managing Member | ||
NEITHER THE SECURITIES EXCHANGE COMMISSION NOR ANY STATE SECURITIES COMMISSION HAS: APPROVED OR DISAPPROVED OF THE TRANSACTION, PASSED UPON THE MERITS OR FAIRNESS OF THE TRANSACTION OR PASSED UPON THE ADEQUACY OR ACCURACY OF THE DISCLOSURE IN THE DOCUMENT. ANY REPRESENTATION TO THE CONTRARY IS A CRIMINAL OFFENSE.
2
Exhibit A
Supplemental Disclosures
The information in this Exhibit A amends, supplements and, as indicated herein, replaces certain disclosures contained in the Schedule 13E-3 and related cover letter dated July 1, 2013 (together, the “Schedule 13E-3”) first mailed to stockholder of Merisel, Inc. on July 1, 2013. Capitalized terms used but not defined herein have the meaning given in the Schedule 13E-3.
The third paragraph under “Summary Term Sheet—Purposes of the Merger” on page 1 of the Schedule 13E-3 is replaced in its entirety with the following:
“Saints retains the right to not proceed with the merger at any time. More specifically, Saints may not proceed with the merger in the event of changes in the national or world economy or financial markets as a whole or changes in general economic conditions that affect the industries in which MSEL conducts its business, if such changes or conditions adversely affect MSEL, taken as a whole, in a materially disproportionate manner relative to other similarly situated participants in the industries or markets in which MSEL operates. Saints may also be unwilling to proceed with the transaction if there is a significant delay in closing the short-form merger or if there is a substantial increase in the costs associated with the transaction, whether as a result of litigation or otherwise, if Saints determines such delay or increased costs render the transaction undesirable from a financial, investment performance or economic perspective.”
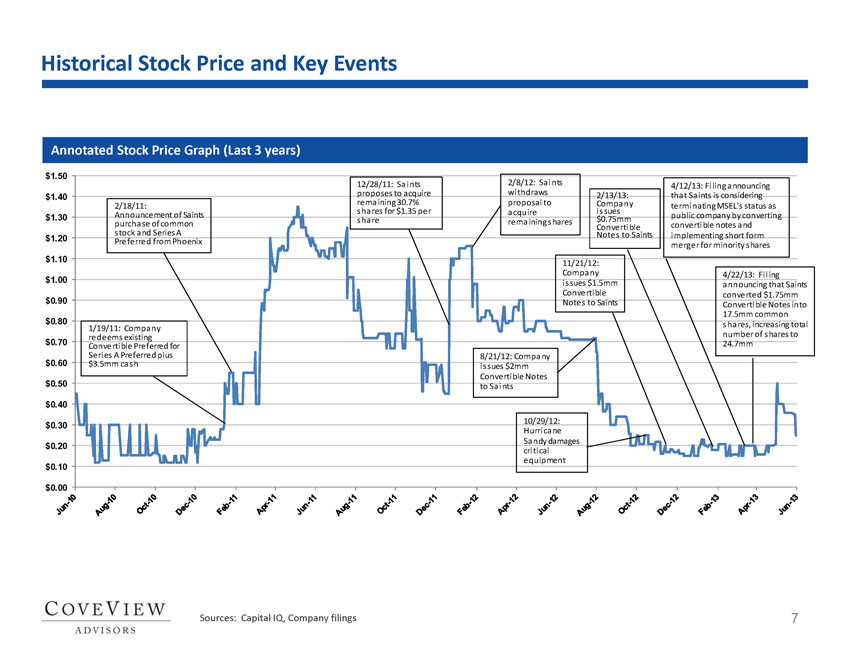
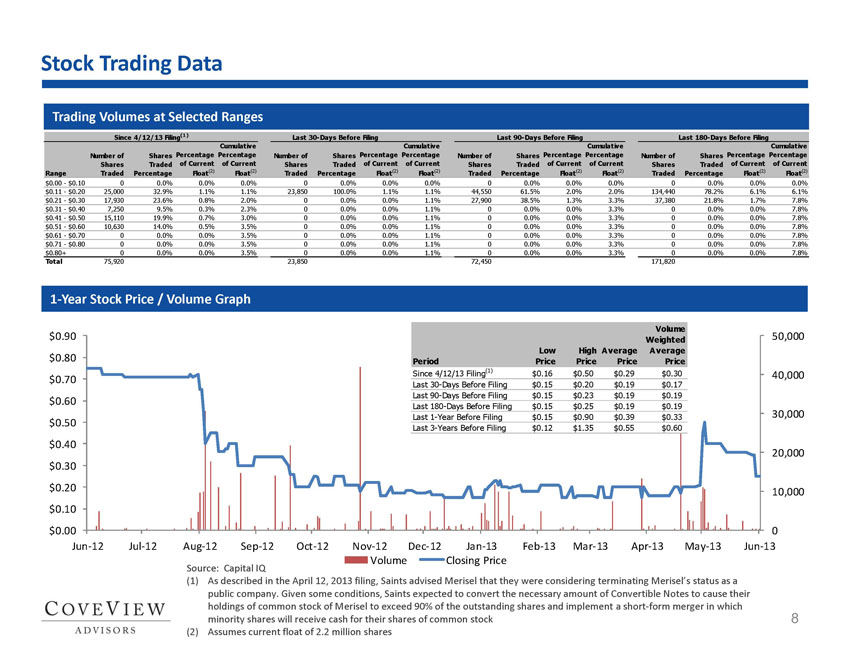
The disclosure in “Fairness of the Merger—Factors Considered in Determining Fairness—Current market prices and current market price trend” on page 13 of the Schedule 13E-3 is supplemented with the following:
“The price quoted for MSEL common stock from June 18, 2013 to June 21, 2013 (the date the Schedule 13E-3 was initially filed) was $0.26 per share.”
The disclosure in “Fairness of the Merger—Factors Considered in Determining Fairness—Other offers” on page 14 of the Schedule 13E-3 is supplemented with the following:
A-1
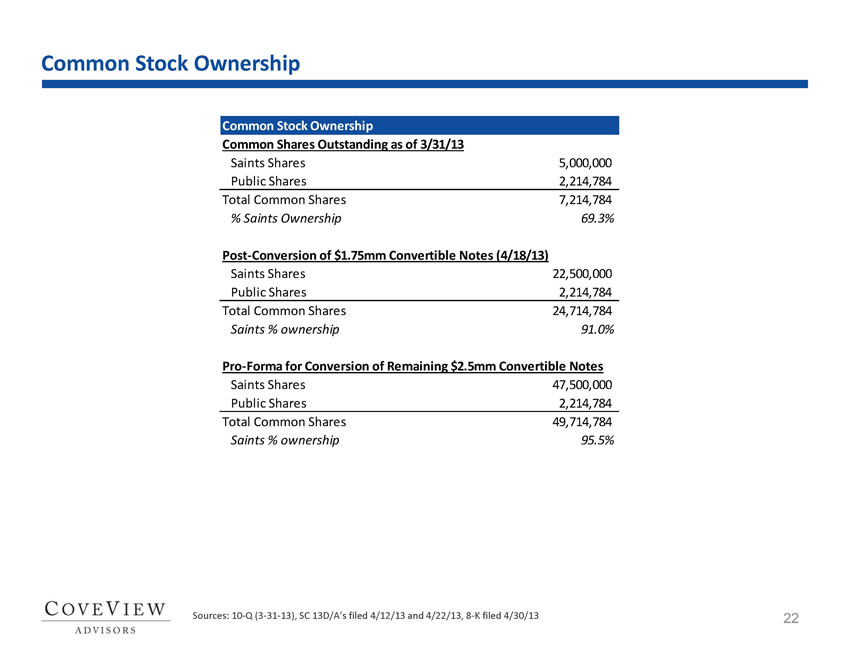
“In November 2011 Saints offered a price of $1.35 per share for the Shares it did not own, which offer was withdrawn in February 2012. The Filing Persons did not consider this price as they believe MSEL’s value has materially diminished since then, as reflected in its negative stockholders’ equity, net losses and cash used in operations for the year ended December 31, 2012 and three months ended March 31, 2013. Also, as disclosed in MSEL’s Form 10-K for the year ended December 31, 2012, MSEL lost two sales representatives in 2012 who accounted for $6.0 million in sales for 2011 and sales to such representatives’ customers in 2012 were down by 80.2% from 2011. Also as previously disclosed, Hurricane Sandy left more than three feet of water in MSEL’s New Jersey production facility and, while work was farmed out to other facilities so no deliveries were missed, the costs and management diversion caused by Hurricane Sandy were substantial. In addition, very significant dilution has resulted from the issuance and sale of the Convertible Notes, which, in turn, has materially decreased per share value of the MSEL common stock.”
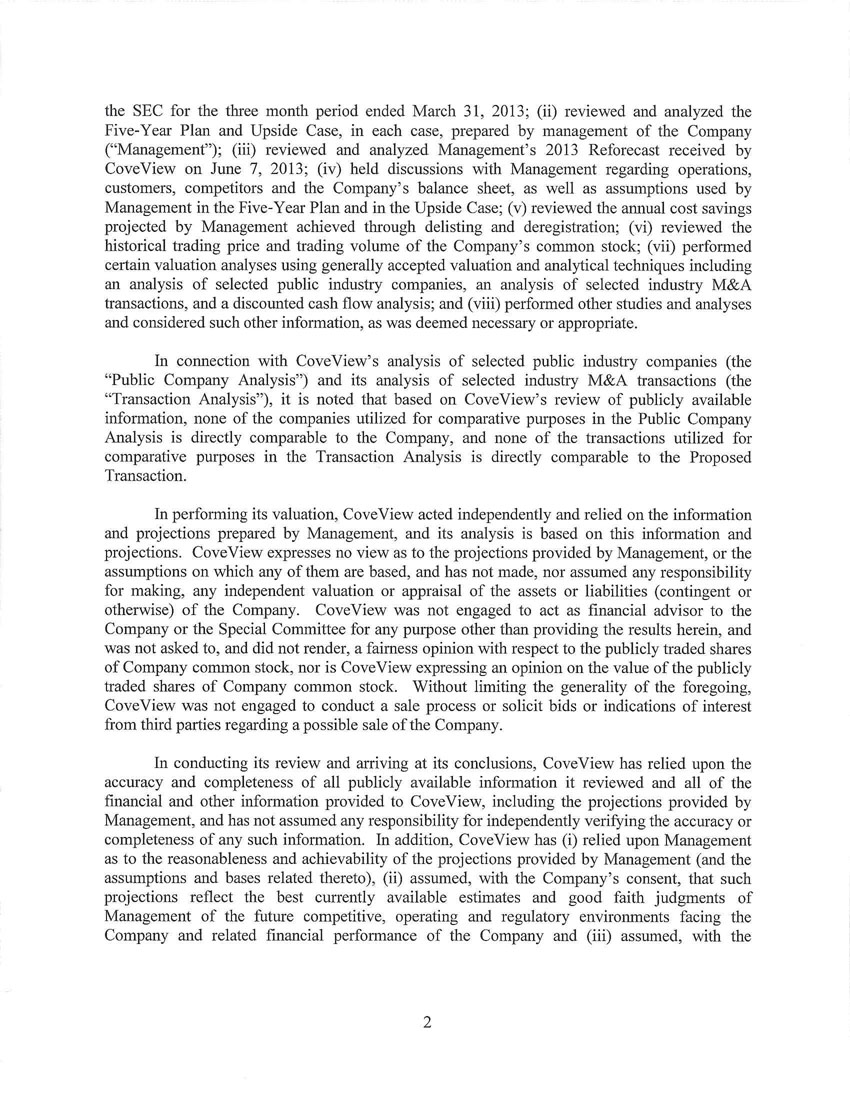
The third paragraph under “Reports, Opinions, Appraisals, and Negotiations—Preparer and Summary of the Report, Opinion or Appraisal,” beginning on page 16 of the Schedule 13E-3, is supplemented with the following:
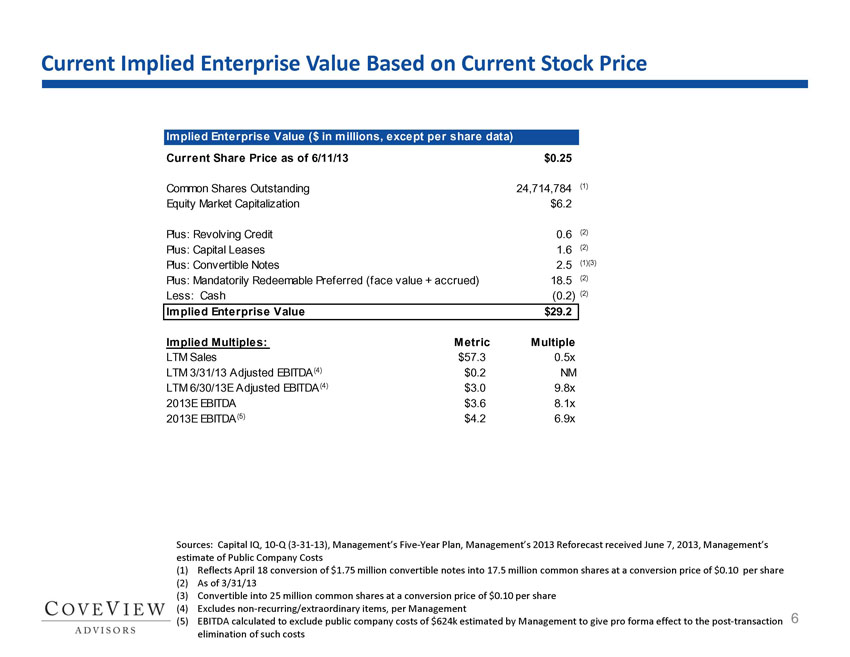
“The balance sheet items that were updated by the Special Committee consisted of accrued interest for the Convertible Notes and accrued dividends for the Series A Redeemable Preferred Stock. The Special Committee had previously used accrued interest and dividends as of March 31, 2013 for the purpose of calculating equity value per share. The update included accruals through May 31, 2013. The additional accrued interest and dividends increased net debt and by extension reduced the equity value and equity value per share.”
The disclosure under “Certain Financial Projections” on page 21 of the Schedule 13E-3 is replaced in its entirety with the following:
“MSEL’s management does not, as a matter of course, make available to the public future financial projections. However, MSEL’s management provided financial projections for the fiscal year ending December 31, 2013 through the fiscal year ending December 31, 2018 to the Valuation Services Firm. Certain of these financial projections are summarized on page 5 of the supplemental information to the valuation letter summarizing the company valuation performed by the Valuation Services Firm, which is filed as part of Exhibit B hereto. These projections were prepared during the second quarter of 2013 and were based on MSEL management’s projection of MSEL’s future financial performance as of the dates provided, were prepared for internal use by MSEL and to assist the Valuation Services Firm with its company valuation, and were not prepared with a view toward public disclosure or compliance with published guidelines of the SEC or the American Institute of Certified Public Accountants regarding forward-looking information or U.S. generally accepted accounting principles. These financial projections are included as Exhibit C hereto.
A-2
The financial projections are not a guarantee of performance. The projections reflect numerous estimates and assumptions with respect to industry performance, general business, economic, regulatory, market, and financial conditions, as well as other factors and matters specific to MSEL’s business, many of which are beyond MSEL’s control, which are summarized below. Since the projections cover multiple years, such information by its nature becomes less certain with each successive year. In addition, the projections do not take into account any circumstances or events occurring after the date that they were prepared and, accordingly, do not give effect to the merger or any changes to MSEL’s operations or strategy that may be implemented or that were not anticipated after the time the projections were prepared. As a result, there can be no assurance that the projections will be realized, and actual results may be materially different than those contained in the projections. Neither MSEL’s independent registered public accounting firm nor any other independent accountants have complied with, examined or performed any procedures with respect to these financial projections, nor have they expressed any opinion or given any form of assurance on the financial projections or their achievability. The inclusion of the projections in this Schedule 13E-3 is not intended to induce any MSEL stockholder to elect not to seek appraisal for his or her Shares.
The following is a summary of the assumptions and limitations underlying the projections:
Revenue
While MSEL has established supply relationships with customers in the retail, cosmetics and sports marketing industries, among others, industry practice is to operate without long term contracts. Further, the industry in which MSEL operates is marked by intense price and service competition. As such, year over year changes in revenues are driven in part by (i) macroeconomic conditions, (ii) changes in customers’ advertising budgets, as well as (iii) the ability to capture and maintain share of customer spend for digital printing and graphic arts services. Over the past five years, MSEL has experienced a negative trend in revenues due in part to weak macroeconomic conditions, reduction in advertising budgets as well as the loss of certain customer business due to the departure of certain key sales people. MSEL believes it has stabilized its operations and intends to seek to recruit sales talent from the industry during the projection period to add new customers as well as increase penetration of existing accounts.
Some of the key assumptions of the projections include:
1. Revenue from MSEL’s largest customer is projected to grow at 5.0% per year from 2013 through 2017. Certain one-time projects in 2013 have been excluded from the projection given the limited history of such activity and difficulty in forecasting repeat one-time activity.
2. Revenue growth from other customers is forecasted to grow at 3.0% annually in 2014 and 2015, and 2.5% annually in 2016 and 2017.
A-3
Costs of Goods Sold
MSEL is in the process of introducing new manufacturing techniques which are expected to improve productivity in the projection period in an attempt to maintain stable gross margins in spite of expected continued industry pricing pressure.
Some of the specific cost of goods sold assumptions underlying the projections include:
1. Raw material costs are expected to rise slightly during the projection period from 18.6% of revenues to 19.5% of revenues reflecting, in part, the inability to pass on 100% of materials inflation to the customers;
2. Non salaries and benefits cost components increase between 1.0% to 1.5% per year; and
3. Production related salaries and benefits increase by 3.0% per year.
A-4
Selling, General and Administrative (“SG&A”) Expenses
In response to declining revenues in 2011 and 2012, MSEL introduced a number of SG&A cost cutting measures beginning in the second half of 2012, including approximately $2.2 million in annual variable and fixed labor cost reductions. While these cost cuts are assumed to remain in place during the projection-period, MSEL projects that it will need to support annual cost of living labor increases.
A-5
The key assumptions in SG&A are outlined below:
1. Non-production salaries and benefits in 2013 are 7.0% lower than the prior year due to certain restructuring that took place in 2012 and 2013 (year to date).
2. Non-production salaries and benefits are assumed to increase by 5.0% in 2014 and 3.0% in years 2015 through 2017.
Capital Expenditure
Inherent in the commercial printing and digital graphics industry is the need to regularly invest in capital equipment to reflect the adoption of new technologies as well as the replacement of depreciated property, plant and equipment. In addition, certain capital expenditures are required to address the needs of key strategic accounts. While MSEL’s 2012 and 2013 (year to date) capital expenditures reflected significant rebuilding due to the major damages caused by Hurricane Sandy, during the projection period, MSEL assumes annual capital expenditures will approximate annual depreciation, subject to certain one-time requirements in 2014 through 2015 for its California operations.
2012 | 2013 | 2014 | 2015 | 2016 | 2017 | |||||||||||||||||||
Cash Capex | 1,067,069 | 1,400,000 | 1,300,000 | 1,300,000 | 1,450,000 | |||||||||||||||||||
Leased Capex | 1,287,551 | 800,000 | 1,000,000 | 1,000,000 | 1,000,000 | |||||||||||||||||||
PPE Net (Balance Sheet) | 7,181,783 | 7,364,675 | 7,270,787 | 7,261,688 | 7,225,129 | 7,223,988 | ||||||||||||||||||
Interest Expense
For the projection period, debt interest under MSEL’s revolving credit facility pursuant to the PNC Agreement (the “Revolver”) and capital lease payments are assumed to be paid in cash. MSEL forecasts that both the cash interest on the Convertible Notes and the dividends on the Series A Redeemable Preferred will be accrued and not paid in cash. Furthermore, MSEL assumes that the Revolver, the Convertible Notes and the Series A Redeemable Preferred will remain outstanding during the projection period.
A-6
Other Expenses
Other expenses included in the projection period consist of legal costs related to certain commercial disputes, amortization of financing fees and other ordinary course business activities.
Working Capital
Net working capital (excluding cash, revolver debt and capital leases) are projected as a percentage of revenue to range from 11.5% to 12.0% during the projection period.
Upside Case
Management prepared an upside five year case, which reflected higher revenue growth and profit margins during the projection period.
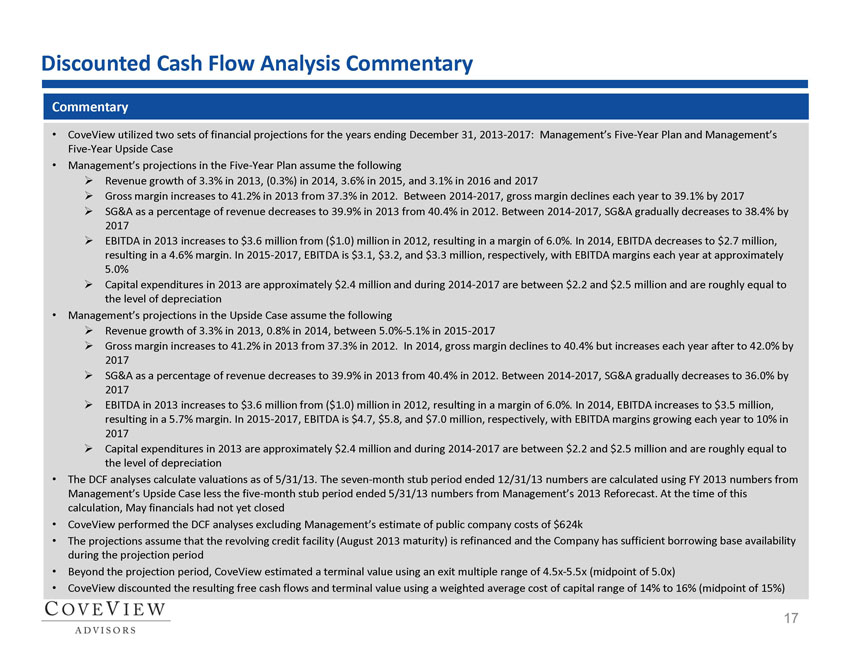
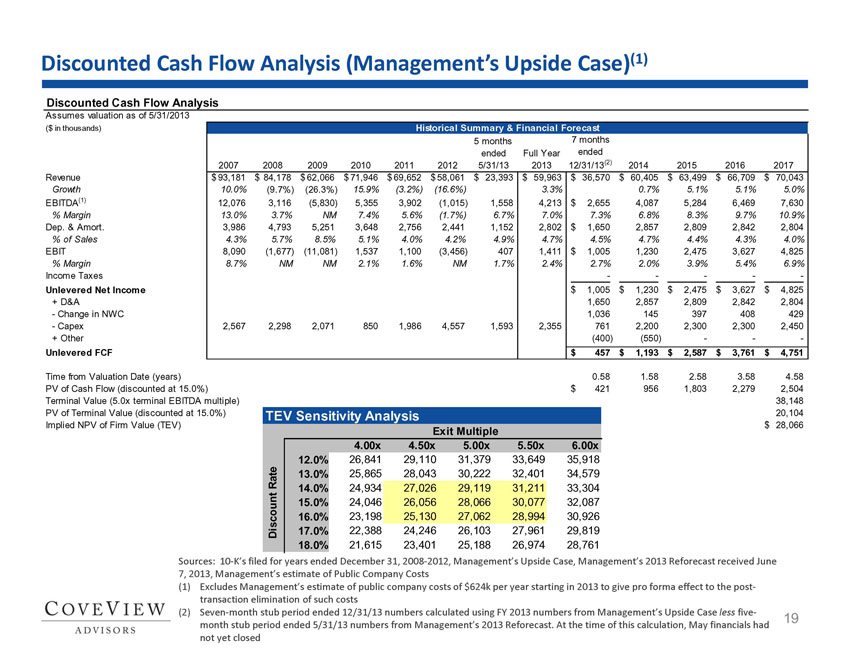
Management’s projections in the Upside Case assume the following:
● | Revenue Growth of 3.3% in 2013, 0.7% in 2014, and between 5.0% to 5.1% in 2015 through 2017. | |
● | Gross Margin increases to 41.2% in 2013 from 34.8% in 2012. In 2014, gross margin declines to 40.4% but increases each year after to 42.0% by 2017. |
● | SG&A as a percentage of revenue decreases to 39.9% in 2013 from 41.8% in 2012. Between 2014 and 2017, SG&A gradually decreases to 36.0% by 2017. |
● | EBITDA in 2013 increases to $3.6 million from ($1.0) million in 2012, resulting in a margin of 6.0%. In 2014, EBITDA increases to $3.5 million, resulting in a 5.7% margin. In 2015-2017, EBITDA is $4.7, $5.8, and $7.0 million, respectively, with EBITDA margins growing each year to 10.0% in 2017. |
● | Capital expenditures in 2013 are approximately $2.4 million and from 2014 through 2017 are between $2.2 and $2.5 million and are roughly equal to the level of depreciation. |
A more detailed presentation of the Upside Case is included as part of Exhibit C hereto.
A-7
Exhibit B
B-1
B-2
B-3

B-4

B-5

B-6
B-7
B-8
B-9
B-10
B-11
B-12
B-13
B-14
B-15

B-16
B-17
B-18
B-19
B-20
B-21
B-22

B-23
B-24
B-25
B-26
B-27
B-28
B-29
B-30
B-31
B-32
B-33
B-34

B-35
Exhibit C
MERISEL, INC.
STATEMENT OF INCOME PROJECTION
| 2010 | 2011 | 2012 | 2013 | 2014 | 2015 | 2016 | 2017 |
Net Sales | 71,946 | 69,652 | 58,061 | 59,963 | 59,755 | 61,893 | 63,835 | 65,806 |
Cost of Sales | 41,672 | 41,839 | 37,837 | 35,283 | 36,029 | 37,343 | 38,759 | 40,076 |
Gross Profit | 30,274 | 27,813 | 20,224 | 24,680 | 23,726 | 24,550 | 25,076 | 25,730 |
Selling, general and administrative expenses | 28,810 | 27,957 | 24,280 | 23,917 | 23,845 | 24,282 | 24,732 | 25,262 |
Intangible impairment |
|
| 6,190 |
|
|
|
|
|
Lease abandonment charge | 3,977 | |||||||
Restructuring charge |
|
| 809 | 232 |
|
|
|
|
Insurance proceeds, net | -422 | 150 | ||||||
Other charges |
|
|
| 509 | 594 | 44 | 44 | 44 |
Operating income (loss) | 1,464 | -144 | -14,610 | -128 | -713 | 224 | 300 | 424 |
Interest expense, net | 3,065 | 2,333 | 3,681 | 3,885 | 4,315 | 4,890 | 5,635 | 6,489 |
Income Tax Benefit | -126 | -26 | -160 |
|
|
|
|
|
Net Income (loss) | -1,475 | -2,451 | -18,131 | -4,013 | -5,028 | -4,666 | -5,335 | -6,065 |
Addbacks: |
|
|
|
|
|
|
|
|
Interest and extraordinary items | 3,113 | 3,352 | 14,554 | 4,776 | 4,909 | 4,934 | 5,680 | 6,533 |
Depreciation and Amortization | 3,717 | 3,001 | 2,447 | 2,802 | 2,857 | 2,809 | 2,842 | 2,804 |
Stock Compensation Expense | 115 | 24 | ||||||
Adjusted EBITDA | 5,355 | 3,902 | -1,015 | 3,589 | 2,738 | 3,077 | 3,187 | 3,272 |
C-1
MERISEL, INC.
BALANCE SHEET PROJECTION
2012 | 2013 | 2014 | 2015 | 2016 | 2017 | |
Cash and Cash Equivalents | 530 | 1,265 | 975 | 1,264 | 1,318 | 1,219 |
Accounts Receivable | 15,429 | 11,535 | 11,495 | 11,906 | 12,280 | 12,659 |
Inventories | 2,419 | 1,753 | 1,796 | 1,872 | 1,951 | 2,027 |
Prepaid and Other Current Assets | 4,058 | 1,638 | 1,612 | 1,642 | 1,673 | 1,704 |
Total Current Assets | 22,436 | 16,191 | 15,878 | 16,684 | 17,222 | 17,609 |
Property and Equipment, Net | 7,182 | 7,365 | 7,271 | 7,262 | 7,225 | 7,224 |
Restricted Cash | ||||||
Intangible Assets | 2,142 | 1,764 | 1,455 | 1,210 | 965 | 720 |
Other Assets | 771 | 754 | 499 | 244 | 264 | 156 |
Total Assets | 32,531 | 26,074 | 25,103 | 25.400 | 25,676 | 25,709 |
Accounts Payable | 7,719 | 4,951 | 4,990 | 5,157 | 5,333 | 5,497 |
Accrued Liabilities | 7,855 | 3,459 | 3,360 | 3,463 | 3,562 | 3,664 |
Capital lease obligations, current maturities | 425 | 824 | 841 | 988 | 1,000 | 713 |
Revolving Line of Credit | 4,352 | 4,253 | 4,000 | 3,500 | 3,000 | 3,000 |
Total Current Liabilities | 20,351 | 13,487 | 13,191 | 13,108 | 12,895 | 12,874 |
Redeemable Preferred Stock | 15,393 | 18,792 | 22,778 | 27,451 | 32,946 | 38,796 |
Convertible Subordinated Note | 3,590 | 2,912 | 3,219 | 3,555 | 3,891 | 4,233 |
Capital Lease Obligations | 498 | 356 | 372 | 388 | 388 | 388 |
Deferred Occupancy Costs | 2,703 | 2,770 | 2,814 | 2,835 | 2,828 | 2,755 |
Total Liabilities | 42,535 | 38,317 | 42,374 | 47,337 | 52,948 | 59,046 |
Common Stock | 84 | 259 | 259 | 259 | 259 | 259 |
APIC | 285,317 | 286,916 | 286,916 | 286,916 | 286,916 | 286,916 |
Accumulated Deficit | -293,461 | -297,474 | -302,502 | -307,168 | -312,503 | -318,568 |
Treasury Stock | -1,944 | -1,944 | -1,944 | -1,944 | -1,944 | -1,944 |
Total Equity | -10,004 | -12,242 | -17,270 | -21,937 | -27,272 | -33,337 |
Total Liabilities and Equity | 32,531 | 26,074 | 25,103 | 25,400 | 25,676 | 25,709 |
C-2
MERISEL, INC.
STATEMENT OF CASH FLOW PROJECTION
2013 | 2014 | 2015 | 2016 | 2017 | |
Net Income | -4,013 | -5,028 | -4,666 | -5,335 | -6,065 |
Adjustments to reconcile net loss to net cash used in operating activities: | |||||
Stock based compensation | 24 | ||||
Deferred occupancy costs | 67 | 44 | 21 | -7 | -73 |
Amortization of preferred stock discount | 329 | 386 | 454 | 533 | 48 |
Depreciation and amortization | 2,550 | 2,602 | 2,554 | 2,582 | 2,696 |
Preferred stock dividends paid in kind | 3,070 | 3,599 | 4,219 | 4,961 | 5,802 |
Convertible note interest paid in kind | 322 | 307 | 336 | 336 | 342 |
Change in operating assets and liabilities: | |||||
Accounts receivable | 3,895 | 40 | -411 | -374 | -379 |
Inventories | 666 | -43 | -76 | -79 | -75 |
Prepaid and other assets | 2,436 | 281 | 225 | -51 | 77 |
Accounts payable | -2,767 | 39 | 167 | 176 | 164 |
Accrued and other liabilities | -4,396 | -99 | 103 | 100 | 101 |
Net cash provided by operating activities | 2,183 | 2,128 | 2,926 | 2,842 | 2,638 |
Cash flows from investing activities | |||||
Capital expenditures | -2,355 | -2,200 | -2,300 | -2,300 | -2450 |
Total cash used in investing activities | -2,355 | -2,200 | -2,300 | -2,300 | -2450 |
Cash flows from financing activities | |||||
Capital lease payments | -1,030 | -766 | -837 | -988 | -1,287 |
Equipment financed with capital lease | 1,287 | 800 | 1,000 | 1,000 | 1,000 |
Issuance of convertible note | 750 | ||||
Borrowing on (repayment of) revolving credit line | -100 | -252 | -500 | -500 | 0 |
Total cash used in financing activities | 907 | -219 | -337 | -448 | -287 |
Net increase (decrease) in cash and cash equivalents | 735 | -291 | 289 | 54 | -99 |
Cash and cash equivalents, beginning of period | 530 | 1,265 | 975 | 1,264 | 1,318 |
Cash and cash equivalents, end of period | 1,265 | 975 | 1,264 | 1,318 | 1,219 |
C-3
MERISEL, INC.
STATEMENT OF INCOME PROJECTION (UPSIDE CASE SCENARIO)
| 2010 | 2011 | 2012 | 2013 | 2014 | 2015 | 2016 | 2017 |
Net Sales | 71,946 | 69,652 | 58,061 | 59,963 | 60,405 | 63,499 | 66,709 | 70,043 |
Cost of Sales | 41,672 | 41,839 | 37,837 | 35,283 | 35,989 | 37,422 | 39,017 | 40,597 |
Gross Profit | 30,274 | 27,813 | 20,224 | 24,680 | 24,416 | 26,076 | 27,692 | 29,446 |
Selling, general and administrative expenses | 28,810 | 27,957 | 24,280 | 23,916 | 23,810 | 24,226 | 24,689 | 25,244 |
Intangible impairment |
|
| 6,190 |
|
|
|
|
|
Lease abandonment charge | 3,977 | |||||||
Restructuring charge |
|
| 809 | 232 |
|
|
|
|
Insurance proceeds, net | -422 | 150 | ||||||
Other charges |
|
|
| 509 | 594 | 44 | 44 | 44 |
Operating income (loss) | 1,464 | -144 | -14,610 | -127 | 12 | 1,806 | 2,959 | 4,157 |
Interest expense, net | 3,065 | 2,333 | 3,681 | 3,885 | 4,315 | 4,890 | 5,635 | 6,489 |
Income Tax Benefit | -126 | -26 | -160 |
|
|
|
|
|
Net Income (loss) | -1,475 | -2,451 | -18,131 | -4,013 | -4,303 | -3,084 | -2,677 | -2,332 |
Addbacks: | ||||||||
Interest and extraordinary items | 3,113 | 3,352 | 14,554 | 4,800 | 4,909 | 4,934 | 5,680 | 6,533 |
Depreciation and Amortization | 3,717 | 3,001 | 2,447 | 2,802 | 2,857 | 2,809 | 2,842 | 2,804 |
Stock Compensation Expense | 115 | 24 | ||||||
Adjusted EBITDA | 5,355 | 3,902 | -1,015 | 3,613 | 3,463 | 4,660 | 5,845 | 7,006 |
C-4
MERISEL, INC.
BALANCE SHEET PROJECTION (UPSIDE CASE SCENARIO)
| 2012 | 2013 | 2014 | 2015 | 2016 | 2017 |
Cash and Cash Equivalents | 530 | 1,265 | 1,592 | 3,314 | 5,827 | 9,253 |
Accounts Receivable | 15,429 | 11,535 | 11,620 | 12,215 | 12,833 | 13,474 |
Inventories | 2,419 | 1,753 | 1,793 | 1,875 | 1,963 | 2,053 |
Prepaid and Other Current Assets | 4,058 | 1,638 | 1,614 | 1,647 | 1,682 | 1,718 |
Total Current Assets | 22,436 | 16,192 | 16,618 | 19,051 | 22,305 | 26,498 |
Property and Equipment, Net | 7,182 | 7,365 | 7,271 | 7,262 | 7,225 | 7,224 |
Restricted Cash |
| - | - | - | - | - |
Intangible Assets | 2,142 | 1,764 | 1,456 | 1,211 | 966 | 721 |
Other Assets | 771 | 754 | 499 | 244 | 264 | 156 |
Total Assets | 32,531 | 26,075 | 25,844 | 27,767 | 30,760 | 34,598 |
Accounts Payable | 7,719 | 4,951 | 4,994 | 5,187 | 5,397 | 5,609 |
Accrued Liabilities and Deferred Revenue | 7,855 | 3,459 | 3,372 | 3,493 | 3,615 | 3,741 |
Capital lease obligations, current maturities | 425 | 824 | 841 | 988 | 1000 | 713 |
Revolving Line of Credit | 4,352 | 4252 | 4000 | 3500 | 3000 | 3000 |
Total Current Liabilities | 20,351 | 13,487 | 13,207 | 13,167 | 13,012 | 13,064 |
Redeemable Preferred Stock | 15,393 | 18,792 | 22,778 | 27,451 | 32,945 | 38,796 |
Convertible Subordinated Note | 3,590 | 2,912 | 3,218 | 3,555 | 3,891 | 4,233 |
Capital Lease Obligations | 498 | 356 | 372 | 389 | 389 | 389 |
Deferred Occupancy Costs | 2,703 | 2,770 | 2,814 | 2,835 | 2,828 | 2,755 |
Total Liabilities | 42,535 | 38,317 | 42,389 | 47,396 | 53,065 | 59,236 |
Common Stock | 84 | 259 | 259 | 259 | 259 | 259 |
APIC | 285,317 | 286916 | 286916 | 286916 | 286916 | 286916 |
Accumulated Deficit | -293,461 | -297474 | -301777 | -304860 | -307537 | -309869 |
Treasury Stock | -1,944 | -1944 | -1944 | -1944 | -1944 | -1944 |
Total Equity | -10,004 | -12,242 | -16,545 | -19,629 | -22,306 | -24,637 |
Total Liabilities and Equity | 32,531 | 26,075 | 25,844 | 27,767 | 30,760 | 34,598 |
C-5
MERISEL, INC.
STATEMENT OF CASH FLOW PROJECTION (UPSIDE CASE SCENARIO)
| 2013 | 2014 | 2015 | 2016 | 2017 |
Net Income | -4,013 | -4,303 | -3,084 | -2,677 | -2,332 |
Adjustments to reconcile net loss to net cash used in operating activities: | |||||
Stock based compensation | 23.88 | - | - | - | - |
Deferred occupancy costs | 66.84 | 44.07 | 20.84 | (6.72) | (73.46) |
Amortization of preferred stock discount | 328.83 | 386.26 | 453.72 | 532.96 | 48.41 |
Depreciation and amortization | 2,550 | 2,602 | 2,554 | 2,582 | 2,696 |
Preferred stock dividends paid in kind | 3,070 | 3,599 | 4,220 | 4,961 | 5,802 |
Convertible note interest paid in kind | 321.66 | 306.64 | 336.32 | 336.32 | 342.13 |
Change in operating assets and liabilities: |
|
|
|
|
|
Accounts receivable | 3,895 | -85 | -595 | -618 | -641 |
Inventories | 665.92 | (40.04) | (81.90) | (88.21) | (89.83) |
Prepaid and other assets | 2,436 | 280 | 222 | -55 | 72 |
Accounts payable | -2,767 | 43 | 193 | 210 | 212 |
Accrued and other liabilities | -4,396 | -87 | 121 | 123 | 126 |
Net cash provided by operating activities | 2,183 | 2,746 | 4,359 | 5,301 | 6,163 |
Cash flows from investing activities | |||||
Capital expenditures | -2,355 | -2,200 | -2,300 | -2,300 | -2,450 |
Total cash used in investing activities | -2,355 | -2,200 | -2,300 | -2,300 | -2,450 |
Cash flows from financing activities |
|
|
|
|
|
Capital lease payments | -1,030 | -767 | -837 | -988 | -1,287 |
Equipment financed with capital lease | 1,288 | 800 | 1,000 | 1,000 | 1,000 |
Issuance of convertible note | 750.0 | - | - | - | - |
Borrowing on (repayment of) revolving credit line | (100.0) | (252.5) | (500.0) | (500.0) | - |
Total cash used in financing activities | 907 | -219 | -337 | -488 | -287 |
Net increase (decrease) in cash and cash equivalents | 735 | 327 | 1,722 | 2,513 | 3,426 |
Cash and cash equivalents, beginning of period | 530 | 1,265 | 1,592 | 3,314 | 5,827 |
Cash and cash equivalents, end of period | 1,265 | 1,592 | 3,314 | 5,827 | 9,253 |
C-6