Allianz Index Advantage ADV® Variable Annuity Prospectus – April 29, 2022
Appendix C
| Standard Annuity Features | Available Investment Options | Optional Features |
| • Five fixed annuitization options (Annuity Options)• Free withdrawal privilege allows you withdraw up to 10% of your total purchase payments during the six-year withdrawal charge period for withdrawals from the index-linked investment options. Withdrawals from the variable investment options are not subject to a withdrawal charge.• Systematic withdrawal program• Minimum distribution program for certain tax-qualified Contracts• Waiver of withdrawal charge benefit (not available in all states)• Guaranteed death benefit (Traditional Death Benefit) | • 22 index-linked investment options (Index Options) based on different combinations of four credit calculation methods (Crediting Methods), four nationally recognized third-party broad based equity securities indexes and an exchange-traded fund (Index or Indexes), and two time periods for measuring Index performance (Term)• Three variable investment options (Variable Options) | • Maximum Anniversary Value Death Benefit: Locks in any annual investment gains to potentially provide a death benefit greater than the Traditional Death Benefit. This optional benefit has an additional rider fee. |
| Crediting Methods Currently Available Only the Index Performance Strategy offers 1-year and 3-year Terms. All other Crediting Methods only offer 1-year Terms. | Indexes Currently Available with 1-year Terms | Indexes Currently Available with 3-year Terms (Index Performance Strategy only) |
| • Index Protection Strategy • Index Precision Strategy • Index Guard Strategy • Index Performance Strategy | • S&P 500® Index • Russell 2000® Index • Nasdaq-100® Index • EURO STOXX 50® • iShares® MSCI Emerging Markets ETF | • S&P 500® Index • Russell 2000® Index |
| Crediting Methods, Indexes, and the 3-year Terms may not be available in all states as detailed in Appendix G. | ||
| Crediting Method Highlights All Crediting Methods provide a level of protection against negative Credits from negative Index performance, and a limit on positive Credits from positive Index performance. Credits are the return you receive on the Term End Date when you allocate assets to an Index Option. | ||
| Negative Index Performance Protection | Positive Index Performance Participation Limit | |
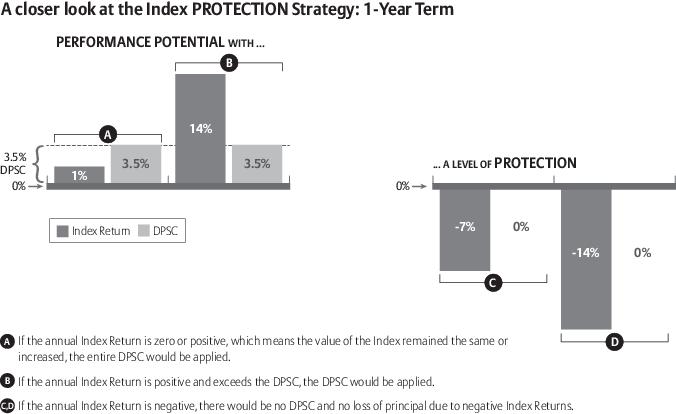
| Index Protection Strategy | • 100% – You will never receive a negative Credit | • Declared Protection Strategy Credits (DPSCs) (the return you receive if Index performance is zero or positive) – DPSCs cannot be less than 1.50% |
| Index Precision Strategy | • Buffers (the amount of negative Index performance we absorb over the duration of a Term before you receive a negative Credit) – Buffers are 10% | • Precision Rates (the return you receive if Index performance is zero or positive) – Precision Rates cannot be less than 1.50% |
| Index Guard Strategy | • Floors (the maximum amount of negative Index performance you absorb) – Floors are -10% | • Caps (the upper limit on positive Index performance) – Caps cannot be less than 1.50% |
| Crediting Method Highlights All Crediting Methods provide a level of protection against negative Credits from negative Index performance, and a limit on positive Credits from positive Index performance. Credits are the return you receive on the Term End Date when you allocate assets to an Index Option. | ||
| Negative Index Performance Protection | Positive Index Performance Participation Limit | |
| Index Performance Strategy | • Buffers – Buffers for 1-year Terms are 10% – Buffers for 3-year Terms are 20% | • 1-year Term: Caps – Caps cannot be less than 1.50% |
| • 3-year Term: Caps – Caps cannot be less than 5% – Can be uncapped | ||
| Variable Options Currently Available | ||
| AZL® MVP Growth Index Strategy Fund | AZL® MVP Balanced Index Strategy Fund | AZL® Government Money Market Fund |
| 8 | ||
| 14 | ||
| 18 | ||
| 18 | ||
| 18 | ||
| 19 | ||
| 20 | ||
| 20 | ||
| 21 | ||
| 23 | ||
| 26 | ||
| 26 | ||
| 27 | ||
| 28 | ||
| 29 | ||
| 30 | ||
| 30 | ||
| 31 | ||
| 31 | ||
| 31 | ||
| 32 | ||
| 32 | ||
| 33 | ||
| 34 | ||
| 35 | ||
| 36 | ||
| 36 | ||
| 36 | ||
| 38 | ||
| 38 | ||
| 38 | ||
| 38 | ||
| 1. | 39 | |
| 39 | ||
| 41 | ||
| FEES AND EXPENSES | Prospectus Location | |||
| Charges for Early Withdrawals | If you withdraw money from the Index Options within 6 years of your last Purchase Payment, you may be assessed a withdrawal charge of up to 6.5% of the Purchase Payment withdrawn, declining to 0% over that time period. There is no withdrawal charge applicable to amounts withdrawn from the Variable Options. For example, if you invest $100,000 in the Contract and make an early withdrawal, you could pay a withdrawal charge of up to $6,500. In addition, if you take a full or partial withdrawal (including financial adviser fees that you choose to have us pay from this Contract) from an Index Precision Strategy, Index Guard Strategy, and Index Performance Strategy Index Option on a date other than the Term End Date, a Daily Adjustment will apply to the Index Option Value available for withdrawal. The Daily Adjustment also applies if before the Term End Date you execute a Performance Lock, annuitize the Contract, we pay a death benefit, or we deduct Contract fees and expenses. The Daily Adjustment may be negative, and you will lose money if the Daily Adjustment is negative. • Index Precision Strategy, Index Guard Strategy, and Index Performance Strategy. Daily Adjustments under these Crediting Methods may be positive, negative, or equal to zero. A negative Daily Adjustment will result in loss. In extreme circumstances, a negative Daily Adjustment could result in a loss beyond the protection of the 10% or 20% Buffer, or -10% Floor, as applicable, but it cannot result in a total loss of -100%. • Index Protection Strategy. This Crediting Method is not subject to the Daily Adjustment. | Fee Tables 4. Valuing Your Contract – Daily Adjustment 6. Expenses – Withdrawal Charge Appendix B – Daily Adjustment | ||
| Transaction Charges | In addition to withdrawal charges, and Daily Adjustments that may apply to withdrawals and other transactions from the Index Precision Strategy, Index Guard Strategy, and Index Performance Strategy Index Options, we will also charge you a fee of $25 per transfer after you exceed 12 transfers between Variable Options (the variable investments available to you) in a Contract Year. | Fee Tables 6. Expenses – Transfer Fee | ||
| Ongoing Fees and Expenses (annual charges) | The table below describes the fees and expenses that you may pay each year, depending on the options you choose. Please refer to your Contract specifications page for information about the specific fees you will pay each year based on the options you have elected. These ongoing fees and expenses do not reflect any financial adviser fees paid to a Financial Professional from your Contract Value or other assets of the Owner. If such charges were reflected, these ongoing fees and expenses would be higher. | Fee Tables 6. Expenses Appendix H – Variable Options Under the Contract | ||
| Annual Fee | Minimum | Maximum | ||
| Base Contract(1) | 0.26% | 0.26% | ||
| Investment Options(2) (Variable Option fees and expenses) | 0.65% | 0.71% | ||
| Optional Benefits Available for an Additional Charge(3) (for a single optional benefit, if elected) | 0.20% | 0.20% | ||
| (1) As a percentage of the Charge Base, plus an amount attributable to the contract maintenance charge. | ||||
| (2) As a percentage of the Variable Option’s average daily net assets. | ||||
| (3) As a percentage of the Charge Base. This is the current charge for the Maximum Anniversary Value Death Benefit. | ||||
| FEES AND EXPENSES | Prospectus Location | |||
| Because your Contract is customizable, the choices you make affect how much you will pay. To help you understand the cost of owning your Contract, the following table shows the lowest and highest cost you could pay each year, based on current charges. This estimate assumes that you do not take withdrawals from the Contract, which if taken from the Index Precision Strategy, Index Guard Strategy, and Index Performance Strategy Index Options could result in substantial losses due to the application of negative Daily Adjustments. | ||||
| Lowest Annual Cost: $1,104 | Highest Annual Cost: $1,418 | |||
| Assumes: • Investment of $100,000 • Least expensive Variable Option fees and expenses • 5% annual appreciation • Traditional Death Benefit • No additional Purchase Payments, transfers, or withdrawals • No financial adviser fees | Assumes: • Investment of $100,000 • Most expensive Variable Option fees and expenses • 5% annual appreciation • Maximum Anniversary Value Death Benefit with a 0.20% rider fee • No additional Purchase Payments, transfers, or withdrawals • No financial adviser fees | |||
| RISKS | ||||
| Risk of Loss | You can lose money by investing in the Contract, including loss of principal and previous earnings. | Risk Factors | ||
| Not a Short-Term Investment | • This Contract is not a short-term investment and is not appropriate if you need ready access to cash.• Considering the benefits of tax deferral and long-term income, the Contract is generally more beneficial to investors with a long investment time horizon.• If within six years after we receive a Purchase Payment you take a full or partial withdrawal from the Index Options (including financial adviser fees that you choose to have us pay from this Contract), withdrawal charges may apply. A withdrawal charge may reduce your Contract Value or the amount of money that you actually receive. Withdrawals may reduce or end Contract guarantees.• Withdrawals may be subject to income taxes, including a 10% additional federal tax that may apply to withdrawals taken before age 59 1⁄2.• Amounts invested in an Index Option must be held in the Index Option for the full Term before they can receive a Credit. For Index Precision Strategy, Index Guard Strategy, and Index Performance Strategy Index Options, we apply a Daily Adjustment if before the Term End Date you take a full or partial withdrawal (including financial adviser fees that you choose to have us pay from this Contract), annuitize the Contract, execute a Performance Lock, we pay a death benefit, or we deduct Contract fees and expenses. The Daily Adjustment takes into account any Index gains subject to the applicable Precision Rate or Cap, or either any Index losses greater than the 10% or 20% Buffer, or Index losses down to the -10% Floor, but in the form of the estimated present value. Therefore, the Daily Adjustment could result in a loss beyond the protection of the Buffer or Floor. In extreme circumstances, a negative Daily Adjustment could result in a loss beyond the protection of the 10% or 20% Buffer, or -10% Floor, as applicable, but it cannot result in a total loss of -100%. Any losses as a result of a Daily Adjustment will be greater if the amount withdrawn is also subject to a withdrawal charge, or is a deduction of Contract fees and expenses. The Daily Adjustment does not apply to the Index Protection Strategy. | Risk Factors Summary of the Index Options 4. Valuing Your Contract | ||
| RISKS | Prospectus Location | |||
| Risks Associated with Investment Options | • An investment in the Contract is subject to the risk of poor investment performance and can vary depending on the performance of the Variable Options and the Index Options available under the Contract.• Each Variable Option and Index Option has its own unique risks.• You should review each Variable Option’s prospectus and disclosures, including risk factors, for each Index Option before making an investment decision. | Risk Factors | ||
| Insurance Company Risks | An investment in the Contract is subject to the risks related to us. All obligations, guarantees or benefits of the Contract are the obligations of Allianz Life and are subject to our claims-paying ability and financial strength. More information about Allianz Life, including our financial strength ratings, is available upon request by visiting allianzlife.com/about/financial-ratings, or contacting us at (800) 624-0197. | Risk Factors | ||
| RESTRICTIONS | ||||
| Investments | • Certain Index Options may not be available under your Contract.• The first 12 transfers between Variable Options every Contract Year are free. After that, we deduct a $25 transfer fee for each additional transfer. Your transfers between the Variable Options are also subject to policies designed to deter excessively frequent transfers and market timing.• We only allow assets to move into the Index Options on the Index Effective Date and on subsequent Index Anniversaries. We hold Purchase Payments in the AZL Government Money Market Fund until we transfer them to your selected Index Options according to your Purchase Payment default instructions. On the Index Effective Date we rebalance or reallocate your total Contract Value among all of your selected Allocation Options according to your Purchase Payment default instructions. For additional Purchase Payments we receive after the Index Effective Date, we transfer the amounts held in the AZL Government Money Market Fund to your selected Index Options on the next Index Anniversary. Therefore, additional Purchase Payments we receive after the Index Effective Date that you allocate to a 1-year Term Index Option are not eligible to receive a Credit until the second Index Anniversary after we receive them, or the fourth Index Anniversary after we receive them for allocations to a 3-year Term Index Option.• For a 1-year Term Index Option, you can transfer Index Option Value only on the Term End Date.• For a 3-year Term Index Option, you can transfer Index Option Value only (a) on the Term End Date, or (b) before the Term End Date by executing a Performance Lock on or before the second Index Anniversary of a 3-year Term.• We do not allow assets to move into an established Index Option until the Term End Date. If you request to transfer into an established Index Option on an Index Anniversary that is not a Term End Date, we will transfer those assets into the same Index Option with a new Term Start Date.• The Traditional Death Benefit may not be modified, but it will terminate if you take withdrawals that reduce both the Contract Value and Guaranteed Death Benefit Value to zero. Withdrawals may reduce the Traditional Death Benefit’s Guaranteed Death Benefit Value by more than the value withdrawn and could end the Traditional Death Benefit.• We reserve the right to close or substitute the Variable Options, and to limit the amount of Purchase Payments that can be held in a Variable Option. We also reserve the right to substitute Indexes. | Summary of the Index Options 5. Variable Options 6. Expenses – Transfer Fee Appendix A – Available Indexes | ||
| Optional Benefits | • The optional Maximum Anniversary Value Death Benefit may not be modified. Withdrawals may reduce the Maximum Anniversary Value Death Benefit’s Guaranteed Death Benefit Value by more than the value withdrawn and will end the Maximum Anniversary Value Death Benefit if the withdrawals reduce both the Contract Value and Guaranteed Death Benefit Value to zero. | 10. Death Benefit | ||
| TAXES | Prospectus Location | |||
| Tax Implications | • Consult with a tax professional to determine the tax implications of an investment in and withdrawals from or payments received under the Contract.• If you purchased the Contract through a tax-qualified plan or individual retirement account (IRA), you do not get any additional tax benefit under the Contract.• Earnings under the Contract may be taxed at ordinary income rates when withdrawn, and you may have to pay a 10% additional federal tax if you take a full or partial withdrawal before age 59 1⁄2. | 11. Taxes | ||
| CONFLICTS OF INTEREST | ||||
| Investment Professional Compensation | We do not pay sales commissions in connection with sales of the Contracts. Rather, you pay an investment advisory fee to your Financial Professional. We do not set your investment advisory fee or receive any part of it. However, Financial Professionals and their managers may be eligible for benefits from us or our wholly-owned subsidiary distributor, such as production incentive bonuses, insurance benefits, and non-cash compensation items. We and/or our wholly owned subsidiary distributor may also make marketing support payments to certain selling firms for marketing services and costs associated with Contract sales. This conflict of interest may influence your Financial Professional to recommend this Contract over another investment. | 12. Other Information – Distribution | ||
| Exchanges | Some Financial Professionals may have a financial incentive to offer you a new contract in place of the one you already own. You should only exchange your contract if you determine, after comparing the features, fees, and risks of both contracts, that it is better for you to purchase the new contract rather than continue to own your existing contract. | 12. Other Information – Distribution | ||
| • | Accumulation Phase. This is the first phase of your Contract, and it begins on the Issue Date. During the Accumulation Phase, your money is invested under the Contract on a tax-deferred basis. Tax deferral may not be available for certain non-individually owned contracts. Tax deferral means you are not taxed on any earnings or appreciation on the assets in your Contract until you take money out of your Contract. In addition, during this phase, you can make additional Purchase Payments, you can take withdrawals, and if you die we pay a death benefit to your named Beneficiary(s). |
| Your Contract Value may fluctuate up or down during the Accumulation Phase based on the performance of your selected Allocation Options. |
| – | Index Options. You may allocate your Purchase Payments to any or all of the Index Options available under your Contract. There are currently 22 Index Options based on different combinations of four credit calculation methods (Crediting Methods), four nationally recognized third-party broad based equity securities indexes and an exchange-traded fund (Indexes), and two time periods for measuring Index performance (Term). Each Index Option is the combination of an Index, a Crediting Method, and a Term. |
| The available Crediting Methods, Indexes, and Terms are included on the cover page of this prospectus. Please see “Summary of the Index Options” for an overview of how the Index Options work. More detailed information about the Index Options is included in section 4, Valuing Your Contract. |
| – | Variable Options. You can allocate your Purchase Payments to any or all of the Variable Options available under your Contract. We only allow assets to move into the Index Options on the Index Effective Date and on subsequent Index Anniversaries. As a result, we hold Purchase Payments you allocate to the Index Options in the AZL Government Money Market Fund until we transfer them to the Index Options in accordance with your instructions. The Variable Options are underlying mutual funds with their own investment objectives, strategies, and risks. |
| Please see Appendix H for more information about the Variable Options. |
| • | Annuity Phase. If you request Annuity Payments, the Accumulation Phase ends and the Annuity Phase begins. Annuity Payments are fixed payments we make based on the Annuity Option you select and your Contract Value (which reflects any previously deducted Contract fees and expenses) less final product and rider fees. Annuity Payments can provide a guaranteed lifetime fixed income stream with certain tax advantages. We designed the Annuity Payments for Owners who no longer need immediate access to Contract Value to meet their short-term income needs. |
| During the Annuity Phase, you will receive a stream of regular income in the form of Annuity Payments. You will be unable to take withdrawals upon demand, your selected death benefit ends, and no amounts will be payable upon death during the Annuity Phase unless your Annuity Option provides otherwise. |
| • | Accessing Your Money. During the Accumulation Phase, you can surrender (take a full withdrawal) the Contract or take partial withdrawals. Withdrawals may be subject to a withdrawal charge, negative Daily Adjustments, and income taxes, including a 10% additional federal tax if taken before age 59 1⁄2. |
| • | Additional Purchase Payments. Subject to the limitations described in this prospectus, we continue to accept additional Purchase Payments under the Contracts during the Accumulation Phase. However, we may terminate your ability to make additional Purchase Payments in the future. We only allow additional Purchase Payments to move into Index Options on Index Anniversaries. As a result, we hold Purchase Payments we receive on days other than an Index Anniversary in the AZL Government Money Market Fund and such Purchase Payments are not available to receive Credits until we transfer them to your selected Index Options. We do not allow assets to move into an established Index Option until the Term End Date. If you request to allocate a Purchase Payment into an established Index Option on an Index Anniversary that is not a Term End Date, we will allocate those assets to the same Index Option with a new Term Start Date. |
| • | Death Benefits. The Contract’s death benefit is paid upon the first death of any Determining Life during the Accumulation Phase. The Contract includes for no additional charge a standard death benefit (the Traditional Death Benefit). At the time of purchase, you may select the optional death benefit (the Maximum Anniversary Value Death Benefit) to replace the standard death benefit for an additional rider fee. Either death benefit is the greater of Contract Value, or the Guaranteed Death Benefit Value. Unlike the Traditional Death Benefit, however, the Maximum Anniversary Value Death Benefit locks in any annual investment gains as part of the Guaranteed Death Benefit Value to potentially provide a death benefit greater than the Traditional Death Benefit (which is based on Purchase Payments). The Maximum Anniversary Value Death Benefit cannot be less than the Traditional Death Benefit, but they can be equal. |
| • | Withdrawal Charge Waivers. Under the free withdrawal privilege, you may withdraw up to 10% of your total Purchase Payments from the Index Options each Contract Year during the Accumulation Phase without incurring a withdrawal charge. Upon a full withdrawal, the free withdrawal privilege is not available to you. The withdrawal charge does not apply to withdrawals from the Variable Options. We do not apply a withdrawal charge to deductions we make for Contract fees or expenses. In most states, the waiver of withdrawal charge benefit allows you to take a withdrawal without incurring a withdrawal charge if you are confined to a nursing home for a period of at least 90 consecutive days. Also, if you own an Individual Retirement Annuity (IRA) or Simplified Employee Pension (SEP) IRA Contract, payments you take under our minimum distribution program (RMD payments) are not subject to a withdrawal charge. |
| • | Deduction of Financial Adviser Fees. If you have a financial adviser and want to pay their financial adviser fees from this Contract, you can instruct us to withdraw the fee from your Contract and pay it to your Financial Professional or Financial Professional’s firm as instructed. The deduction of financial adviser fees is in addition to this Contract’s fees and expenses, and the deduction is treated the same as any other withdrawal under the Contract. As such, withdrawals to pay financial adviser fees may be subject to withdrawal charges, will reduce the Contract Value and Guaranteed Death Benefit Value (perhaps significantly), and may be subject to income taxes (including tax penalties if you are younger than age 59 1⁄2). Please consult with your Financial Professional before requesting us to pay financial adviser fees from this Contract compared to other assets you may have. |
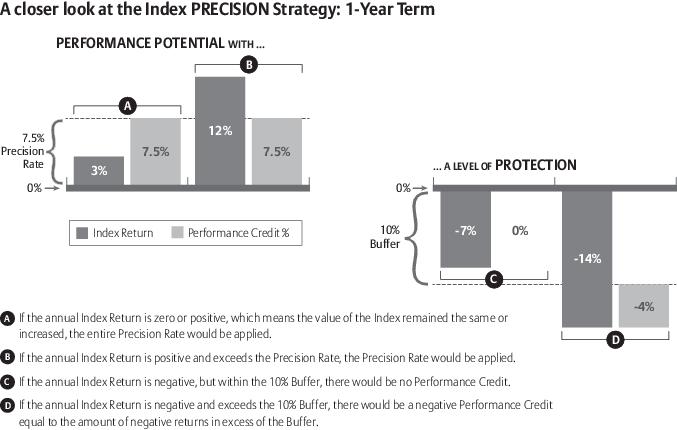
| • | If the Index Value on the Term End Date is equal to or greater than the Index Value on the Term Start Date, regardless of the amount of actual Index Return, the Performance Credit is equal to the Precision Rate. |
| • | If the Index Return is negative and the loss is: |
| – | less than or equal to the 10% Buffer, the Performance Credit is zero. We absorb any loss up to the 10% Buffer. |
| – | greater than the 10% Buffer, the negative Performance Credit is equal to the negative Index Return in excess of the 10% Buffer. You participate in any losses beyond the 10% Buffer. |
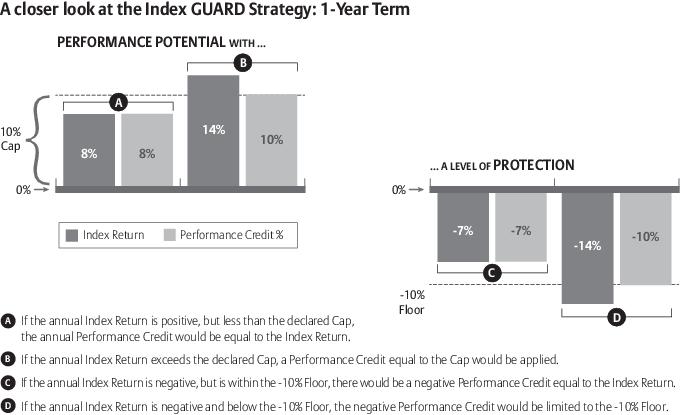
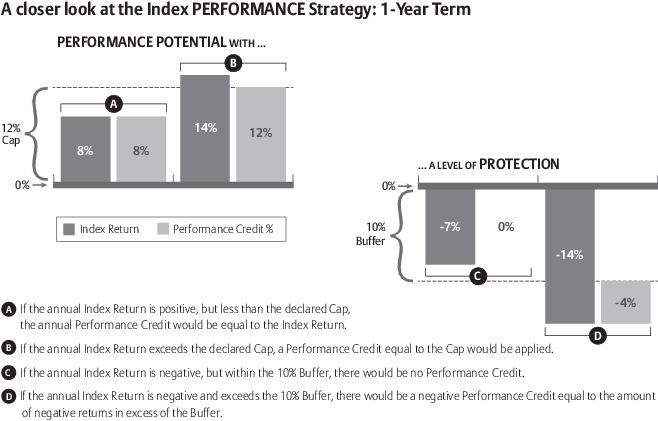
| • | If the Index Return is positive, the Performance Credit is equal to the Index Return up to the Cap. |
| • | If the Index Value on the Term End Date is equal to the Index Value on the Term Start Date, the Performance Credit is zero. |
| • | If the Index Return is negative, the negative Performance Credit is equal to the negative Index Return down to the -10% Floor. You participate in any losses down to the -10% Floor. We absorb any negative Index Return beyond the -10% Floor. |
| • | If the Index Return is positive, the Performance Credit is equal to: |
| – | the Index Return up to the Cap for a 1-year Term. |
| – | the Index Return up to the Cap for a 3-year Term. If a 3-year Term is uncapped, the Performance Credit is equal the Index Return. We apply the Cap for the entire Term length; we do not apply the Cap annually on a 3-year Term. |
| • | If the Index Value on the Term End Date is equal to the Index Value on the Term Start Date, the Performance Credit is zero. |
| • | If the Index Return is negative and the loss is: |
| – | less than or equal to the 10% or 20% Buffer, the Performance Credit is zero. We absorb any loss up to the 10% or 20% Buffer. We apply the Buffer for the entire Term length; we do not apply the Buffer annually on a 3-year Term Index Option. |
| – | greater than the 10% or 20% Buffer, the negative Performance Credit is equal to the negative Index Return in excess of the 10% or 20% Buffer. You participate in any losses beyond the 10% or 20% Buffer. |
| • The Index Precision Strategy, Index Guard Strategy, and Index Performance Strategy allow negative Performance Credits. A negative Performance Credit means you can lose principal and previous earnings. These losses could be significant. |
| • Because we calculate Index Returns only on a single date in time, you may experience negative or flat performance even though the Index you selected for a given Crediting Method experienced gains through some, or most, of the Term. |
| • If a 3-year Term Index Option is “uncapped” for one Term (i.e., we do not declare a Cap for that Term) it does not mean that we will not declare a Cap for it on future Term Start Dates. On the next Term Start Date we can declare a Cap for the next Term, or declare it to be uncapped. |
| What is the asset protection? | |
| Index Protection Strategy | • Most protection. • If the Index loses value, the Credit is zero. You do not receive a negative Credit. |
| Index Precision Strategy | • Less protection than the Index Protection Strategy and Index Guard Strategy. Protection may be equal to or less than what is available with the Index Performance Strategy depending on the Index Option. • Buffer absorbs 10% of loss, but you receive a negative Performance Credit for losses greater than 10%. • Potential for large losses in any Term. • More sensitive to large negative market movements because small negative market movements are absorbed by the 10% Buffer. In a period of extreme negative market performance, the risk of loss is greater with the Index Precision Strategy than with the Index Guard Strategy. |
| Index Guard Strategy | • Less protection than the Index Protection Strategy, but more than Index Precision Strategy and Index Performance Strategy. • Permits a negative Performance Credit down to the -10% Floor. • Protection from significant losses. • More sensitive to smaller negative market movements that persist over time because the -10% Floor reduces the impact of large negative market movements. • In an extended period of smaller negative market returns, the risk of loss is greater with the Index Guard Strategy than with the Index Performance Strategy and Index Precision Strategy. • Provides certainty regarding the maximum loss in any Term. |
| Index Performance Strategy | • Less protection than the Index Protection Strategy and Index Guard Strategy. 3-year Term Index Options with 20% Buffer have more protection than what is available with the Index Precision Strategy. • Buffer absorbs 10% or 20% of loss depending on the Index Option you select, but you receive a negative Performance Credit for losses greater than the Buffer. • Potential for large losses in any Term. • More sensitive to large negative market movements because small negative market movements are absorbed by the Buffer. In a period of extreme negative market performance, the risk of loss is greater with the Index Performance Strategy than with the Index Guard Strategy. • In extended periods of moderate to large negative market performance, 3-year Terms may provide less protection than the 1-year Terms because, in part, the Buffer is applied over a longer period of time. |
| What is the growth opportunity? | |
| Index Protection Strategy | • Growth opportunity limited by the DPSCs. • Least growth opportunity. • May perform best in periods of small positive market movements. • DPSCs will generally be less than the Precision Rates and Caps. |
| What is the growth opportunity? | |
| Index Precision Strategy | • Growth opportunity limited by the Precision Rates. • May perform best in periods of small positive market movements. • Generally more growth opportunity than the Index Protection Strategy, but less than the Index Performance Strategy. • Growth opportunity may be more or less than the Index Guard Strategy depending on Precision Rates and Caps. |
| Index Guard Strategy | • Growth opportunity limited by the Caps. • May perform best in a strong market. • Growth opportunity that generally may be matched or exceeded only by the Index Performance Strategy. However, growth opportunity may be more or less than the Index Precision Strategy or Index Performance Strategy depending on Precision Rates and Caps. |
| Index Performance Strategy | • Growth opportunity limited by the Caps. If we do not declare a Cap for a 3-year Term Index Option there is no maximum limit on the positive Index Return for that Index Option. • May perform best in a strong market. • Generally the most growth opportunity. However, growth opportunity may be less than the Index Precision Strategy or Index Guard Strategy depending on Precision Rates and Caps. |
| What can change within a Crediting Method? | |
| Index Protection Strategy | • Renewal DPSCs for existing Contracts can change on each Term Start Date. • DPSCs are subject to a 1.50% minimum. |
| Index Precision Strategy | • Renewal Precision Rates for existing Contracts can change on each Term Start Date. • The 10% Buffers for the currently available Index Options cannot change. However, if we add a new Index Option to your Contract after the Issue Date, we establish the Buffer for it on the date we add the Index Option to your Contract. • Precision Rates are subject to a 1.50% minimum. |
| Index Guard Strategy | • Renewal Caps for existing Contracts can change on each Term Start Date. • The -10% Floors for the currently available Index Options cannot change. However, if we add a new Index Option to your Contract after the Issue Date, we establish the Floor for it on the date we add the Index Option to your Contract. • Caps are subject to a 1.50% minimum. |
| Index Performance Strategy | • Renewal Caps for existing Contracts can change on each Term Start Date. • The 10% or 20% Buffers for the currently available Index Options cannot change. However, if we add a new Index Option to your Contract after the Issue Date, we establish the Buffer for it on the date we add the Index Option to your Contract. • Caps are subject to a 1.50% minimum for 1-year Terms, or 5% for 3-year Terms. |
| • For any Index Option with the Index Precision Strategy or Index Performance Strategy, you participate in any negative Index Return in excess of the Buffer, which reduces your Contract Value. For example, for a 10% Buffer we absorb the first -10% of Index Return and you could lose up to 90% of the Index Option Value. However, for any Index Option with the Index Guard Strategy, we absorb any negative Index Return in excess of the -10% Floor, so your maximum loss is limited to -10% of the Index Option Value due to negative Index Returns. |
| • DPSCs, Precision Rates, and Caps as set by us from time-to-time may vary substantially based on market conditions. However, in extreme market environments, it is possible that all DPSCs, Precision Rates, and Caps will be reduced to their respective minimums of 1.50%, or 5% as stated in the table above. |
| • DPSCs, Precision Rates, and Caps can be different from Index Option to Index Option. For example, Caps for the Index Performance Strategy 1-year Terms can be different between the S&P 500® Index and the Nasdaq-100® Index; and Caps for the S&P 500® Index can be different between 1-year and 3-year Terms on the Index Performance Strategy, and between the 1-year Terms for the Index Guard Strategy and Index Performance Strategy. They may also be different from Contract-to-Contract depending on the Index Effective Date and the state of issuance. |
| Historical information on the DPSCs, Precision Rates, and Caps is provided in Appendix C. This information is for historical purposes only and is not a representation as to future DPSCs, Precision Rates, and Caps. |
| • If your Contract is within its free look period you may be able to take advantage of any increase in initial DPSCs, Precision Rates, or Caps by cancelling your Contract and purchasing a new Contract. |
| • If the initial DPSCs, Precision Rates, or Caps available on the Index Effective Date are not acceptable you can: |
| – cancel your Contract if you are still within the free look period, |
| – request to extend your Index Effective Date if you have not reached your first Quarterly Contract Anniversary, |
| – on or before the Index Effective Date, cancel the Contract and request a full withdrawal of the money held in the AZL Government Money Market Fund and receive the Contract Value less final product and rider fees and contract maintenance charge; on or before the Index Effective Date you are not subject to the Daily Adjustment, or |
| – after the Index Effective Date, cancel the Contract and request a full withdrawal of the Contract Value less withdrawal charge, and final product and rider fees and contract maintenance charge; after the Index Effective Date, you will be subject to a withdrawal charge and the Daily Adjustment. |
| • DPSCs, Precision Rates, and Caps may be different between newly issued and existing Contracts, and between existing Contracts issued on the same month and day in different years. For example, assume that on May 3, 2019 we set Caps for the Index Performance Strategy 1-year Term with the S&P 500® Index as follows: |
| – 13% initial rate for new Contracts issued in 2019, |
| – 14% renewal rate for existing Contracts issued in 2018, and |
| – 12% renewal rate for existing Contracts issued in 2017. |
| • | The Contract Value is the sum of your Variable Account Value and Index Option Values. Contract Value reflects any previously deducted Contract fees and expenses, but does not reflect Contract fees and expenses that we would apply on liquidation. The cash surrender value reflects all Contract fees and expenses we would apply on liquidation. |
| • | Your Variable Account Value is the sum of the values in your selected Variable Options. It reflects deduction of Variable Option operating expenses, any previously assessed transfer fee, contract maintenance charge, product fee, and rider fee. It changes each Business Day based on the performance of the Variable Options. |
| • | Your total Index Option Value is the sum of the values in each of your selected Index Options. Each Index Option Value includes any Credits from previous Term End Dates, reduced proportionately for previous partial withdrawals you took and any financial adviser fees that you choose to have us pay from this Contract (including any withdrawal charges), and previous deductions we made for Contract fees and expenses. Amounts removed from the Index Options during the Term for withdrawals you take and deductions we make for fees and expenses do not receive a Credit on the Term End Date, but the amount remaining does receive a Credit subject to the applicable Buffer, Floor, DPSC, Precision Rate, or Cap. |
| – | On each Business Day during the Term other than the Term Start Date or Term End Date, we calculate the current Index Option Value for each Index Option with the Index Precision Strategy, Index Guard Strategy, and Index Performance Strategy by adding a Daily Adjustment to the Index Option Base. The Index Option Base is the amount you allocate to an Index Option. We reduce the Index Option Base proportionately for withdrawals you take and any financial adviser fees that you choose to have us pay from this Contract (including any withdrawal charges), and deductions we make for Contract fees and expenses; we increase/decrease it by the dollar amount of additional Purchase Payments allocated to, transfers into or out of the Index Option; and any Credit. |
| – | During the Term the Index Option Values for Index Options with the Index Protection Strategy do not change for Index performance, and do not receive the Daily Adjustment. |
| (i) | any Index gains during the Term subject to the applicable Precision Rate or Cap, |
| (ii) | either any Index losses greater than the 10% or 20% Buffer, or Index losses down to the -10% Floor, and |
| (iii) | the number of days until the Term End Date. |
| We will not provide advice or notify you regarding whether you should exercise a Performance Lock or the optimal time for doing so. We will not warn you if you exercise a Performance Lock at a sub-optimal time. We are not responsible for any losses related to your decision whether or not to exercise a Performance Lock. |
| Number of Complete Years Since Purchase Payment | Withdrawal Charge Amount | |
| 0 | 6.5% | |
| 1 | 6% | |
| 2 | 5% | |
| 3 | 4% | |
| 4 | 3% | |
| 5 | 2% | |
| 6 years or more | 0% |
Transfer Fee(3) | $25 |
| (for each transfer between Variable Options after twelve in a Contract Year) |
| Index Precision Strategy and Index Performance Strategy | Index Guard Strategy | ||
| Daily Adjustment Maximum Potential Loss | 99% | 35% | |
| (as a percentage of Index Option Value, applies for distributions from an Index Option before any Term End Date)(4) |
| (1) | The withdrawal charge does not apply to withdrawals from the Variable Options. The Contract provides a free withdrawal privilege that allows you to withdraw 10% of your total Purchase Payments annually from the Index Options without incurring a withdrawal charge, as discussed in section 7, Access to Your Money – Free Withdrawal Privilege. |
| (2) | The Withdrawal Charge Basis is the total amount under your Contract that is subject to a withdrawal charge, as discussed in section 6, Expenses – Withdrawal Charge. |
| (3) | We count all transfers made in the same Business Day as one transfer, as discussed in section 6, Expenses – Transfer Fee. The transfer fee does not apply to transfers to or from the Index Options and these transfers do not count against your free transfers. Transfers are subject to the policies discussed in section 5, Variable Options – Excessive Trading and Market Timing. |
| (4) | This shows the maximum potential loss due to the application of the Daily Adjustment (e.g., maximum loss could occur if there is a total distribution within a Term at a time when the Index price has declined to zero). The Daily Adjustment could result in a loss beyond the protection of the 10% or 20% Buffer, or -10% Floor. The Daily Adjustment applies if before the Term End Date you take a full or partial withdrawal (including any financial adviser fees that you choose to have us pay from this Contract), execute a Performance Lock, annuitize the Contract, we pay a death benefit, or when we deduct Contract fees or expenses. The actual Daily Adjustment calculation is determined by a formula described in Appendix B. |
| Administrative Expenses (or contract maintenance charge)(1) (per year) | $50 |
| Base Contract Expenses(2) (as a percentage of the Charge Base) | 0.25% |
| Optional Benefit Expenses – Maximum Anniversary Value Death Benefit (as a percentage of the Charge Base) | 0.20% |
| (1) | Referred to as the “contract maintenance charge” in the Contract and elsewhere in this prospectus. Waived if the Contract Value is at least $100,000. During the Annuity Phase, we deduct the contract maintenance charge proportionately from each Annuity Payment. See the section 6, Expenses – Contract Maintenance Charge (Administrative Expenses). |
| (2) | Referred to as the “product fee” in the Contract and elsewhere in this prospectus. See section 6, Expenses – Base Contract Expenses (Product Fee). |
| Minimum | Maximum | ||
| (expenses that are deducted from Variable Option assets, including management fees, distribution and/or service (12b-1) fees, and other expenses) | 0.65% | 0.71% |
| (1) | If you surrender your Contract (take a full withdrawal) at the end of the applicable time period: |
| 1 Year | 3 Years | 5 Years | 10 Years | |
| Maximum Variable Option expense | $7,029 | $8,182 | $9,091 | $14,180 |
| Minimum Variable Option expense | $6,969 | $7,995 | $8,770 | $13,488 |
| (2) | If you annuitize your Contract at the end of the applicable time period. |
| 1 Year | 3 Years | 5 Years | 10 Years | |
| Maximum Variable Option expense | N/A* | $3,682 | $6,391 | $14,180 |
| Minimum Variable Option expense | N/A* | $3,495 | $6,070 | $13,488 |
| * | The earliest available Annuity Date is the second Contract Anniversary. |
| (3) | If you do not surrender your Contract. |
| 1 Year | 3 Years | 5 Years | 10 Years | |
| Maximum Variable Option expense | $1,179 | $3,682 | $6,391 | $14,180 |
| Minimum Variable Option expense | $1,119 | $3,495 | $6,070 | $13,488 |
| The COVID-19 pandemic has at times led to significant volatility and negative returns in the financial markets. These market conditions have impacted the performance of the Indexes to which the Index Options are linked, as well as securities held by the Variable Options. If these market conditions continue or reoccur, and depending on your individual circumstances (e.g., your selected Allocation Options and the timing of any Purchase Payments, transfers, or withdrawals), you may experience (perhaps significant) negative returns under the Contract. The COVID-19 pandemic has contributed to an uncertain and evolving economic environment. The impact of the COVID-19 pandemic and other interrelated factors (e.g., changes in interest rates, rising inflation, actions of governmental authorities) on the economic environment cannot be predicted with certainty, but they could negatively affect the returns of an Index and the level of DPSCs, Precision Rates, and Caps, and other product features, and the overall performance of your Contract. The military invasion of Ukraine initiated by Russia in February 2022 and the resulting response by the United States and other countries have led to economic disruptions, as well as increased volatility and uncertainty in the financial markets. It is not possible to predict the ultimate duration and scope of the conflict, or the future impact on U.S. and global economies and financial markets. The performance of the Indexes to which the Index Options are linked, as well as securities held by the AZL Government Money Market Fund, may be adversely affected. This risk could be higher for Indexes with exposure to European or Russian markets, including EURO STOXX 50® and iShares® MSCI Emerging Markets ETF. Depending on your individual circumstances (e.g., your selected Index Options and the timing of any Purchase Payments, transfers, or withdrawals), you may experience (perhaps significant) negative returns under the Contract. You should consult with a Financial Professional about how the recent market conditions may impact your future investment decisions related to the Contract, such as purchasing the Contract or making Purchase Payments, transfers, or withdrawals, based on your individual circumstances. |
| • | interest rate decreases, |
| • | dividend rate increases, |
| • | poor market performance, and |
| • | the expected volatility of Index prices. Increases in the expected volatility of Index prices negatively affect the Index Precision Strategy and Index Performance Strategy with 1-year Terms, while decreases in the expected volatility of Index prices negatively affect the Index Guard Strategy. For the Index Performance Strategy with 3-year Terms, the impact of changes in the expected volatility of Index prices is dependent on the market environment and the applicable Caps and Participation Rates. |
| January 1, 2011 through December 31, 2021 | |||||||||
| S&P 500® Index | Nasdaq-100® Index | Russell 2000® Index | EURO STOXX 50® | iShares® MSCI Emerging Markets ETF | |||||
| Returns without dividends | 14.84% | 22.67% | 12.57% | 7.03% | 3.79% | ||||
| Returns with dividends | 17.11% | 24.05% | 14.07% | 10.88% | 5.90% | ||||
| • | You will no longer participate in Index performance, positive or negative, for the remainder of the Index Year for the locked Index Option. This means that under no circumstances will your Index Option Value increase during the remainder of the Index Year. An Index Year is a twelve-month period beginning on the Index Effective Date or a subsequent Index Anniversary. |
| • | You will not receive a Performance Credit on any locked Index Option on the Term End Date. |
| • | We use the Daily Adjustment calculated at the end of the current Business Day on the Lock Date to determine your locked Index Option Value. This means you will not be able to determine in advance your locked Index Option Value, and it may be higher or lower than it was at the point in time you requested a manual Performance Lock, or that your Index Option reached its target for an automatic Performance Lock. Through your account on our website you can request a Performance Lock based on upper and/or lower targets you set using Index Option Value returns. |
| • | If a Performance Lock is executed when your Daily Adjustment has declined, you will lock in any loss. It is possible that you would have realized less of a loss or no loss if the Performance Lock occurred at a later time, or if the Index Option was not locked. |
| • | We will not provide advice or notify you regarding whether you should exercise a Performance Lock or the optimal time for doing so. We will not warn you if you exercise a Performance Lock at a sub-optimal time. We are not responsible for any losses related to your decision whether or not to exercise a Performance Lock. |
| • | the Index is discontinued, |
| • | we are unable to use the Index because, for example, changes to an Index make it impractical or expensive to purchase derivative hedging instruments to hedge the Index, or we are not licensed to use the Index, or |
| • | the method of calculation of the Index Values changes substantially, resulting in significantly different Index Values and performance results. This could occur, for example, if an Index altered the types of securities tracked, or the weighting of different categories of securities. |
| • | we do not change the Charge Base we use to calculate the product and rider fees, and |
| • | the Buffers, Floors, DPSCs, Precision Rates, and Caps for the replaced Index will apply to the new Index. We do not change the Buffers and Floors applicable to your Contract, or the current DPSCs, Precision Rates, and Caps that we set on the Term Start Date. |
| You can only transfer Index Option Value to a Variable Option on a sixth Index Anniversary. |
| • | market volatility, |
| • | our hedging strategies and investment performance, |
| • | the availability of hedging instruments, |
| • | the amount of money available to us through Contract fees and expenses to purchase hedging instruments, |
| • | your Index Effective Date, |
| • | the level of interest rates, |
| • | utilization of Contract benefits by Owners, and |
| • | our profitability goals. |
| As a result of the COVID-19 pandemic and interrelated market factors (e.g., market volatility changes in interest rates, rising inflation, actions by governmental authorities), economic uncertainties have arisen which could negatively impact Allianz Life’s net income and surplus. The extent to which the COVID-19 pandemic and these other market factors will impact our business, net income, and surplus, as well as our capital and liquidity position, will depend on future developments, which are highly uncertain. For more information see section 13, Information on Allianz Life – Business and Operational Risks Relevant to the Contract. |
| • | The Business Day before the Annuity Date. |
| • | The Business Day we process your request for a full withdrawal. |
| • | Upon the death of any Owner (or the Annuitant if the Owner is a non-individual), the Business Day we first receive a Valid Claim from any one Beneficiary, unless the surviving spouse/Beneficiary continues the Contract. If there are multiple Beneficiaries, the remaining Contract Value continues to fluctuate with the performance of the Allocation Options until the complete distribution of the death benefit. A Valid Claim is the documents we require to be received in Good Order at our Service Center before we pay any death claim. |
| Financial Adviser Fee Withdrawal | Contract Value | Guaranteed Death Benefit Value for a Contract with the Traditional Death Benefit | Guaranteed Death Benefit Value for a Contract with the Maximum Anniversary Value Death Benefit | |||
| Prior to 1st years withdrawal | $ 100,000 | $ 90,000 | $ 105,000 | |||
| $5,000 withdrawal (subject to an | ||||||
| 8.5% withdrawal charge) | – [($5,000 ÷ (1 – 8.5%)] |
| Financial Adviser Fee Withdrawal | Contract Value | Guaranteed Death Benefit Value for a Contract with the Traditional Death Benefit | Guaranteed Death Benefit Value for a Contract with the Maximum Anniversary Value Death Benefit | |||
| Amount withdrawn | – $5,465 | – [($5,465 ÷ 100,000) x 90,000] | – [($5,465 ÷ 100,000) x 105,000] | |||
| = - $4,919 | = - $5,739 | |||||
| After 1st years withdrawal | $ 94,535 | $ 85,081 | $ 99,261 | |||
| Prior to 2nd years withdrawal | $ 97,000 | $ 85,081 | $ 99,261 | |||
| $5,000 withdrawal (not subject to a | ||||||
| withdrawal charge) | – $5,000 | – [($5,000 ÷ 97,000) x 85,081] | – [($5,000 ÷ 97,000) x 99,261] | |||
| = - $4,386 | = - $5,117 | |||||
| After 2nd years withdrawal | $ 92,000 | $ 80,695 | $ 94,414 | |||
| Prior to 3rd years withdrawal | $ 80,0000 | $ 80,695 | $ 94,414 | |||
| $5,000 withdrawal (not subject to a | – $5,000 | – [($5,000 ÷ 80,000) x 80,695] | – [($5,000 ÷ 80,000) x 94,414] | |||
| withdrawal charge) | = - $5,044 | = - $5,844 | ||||
| After 3rd years withdrawal | $ 75,000 | $ 75,651 | $ 88,260 |
| • | $94,535 Contract Value under the Traditional Death Benefit, or the $99,261 Guaranteed Death Benefit Value under the Maximum Anniversary Value Death Benefit after the first adviser fee. |
| • | $92,000 Contract Value under the Traditional Death Benefit, or the $94,414 Guaranteed Death Benefit Value under the Maximum Anniversary Value Death Benefit after the second adviser fee. |
| • | $75,651 Guaranteed Death Benefit Value under the Traditional Death Benefit, or the $88,260 Guaranteed Death Benefit Value under the Maximum Anniversary Value Death Benefit after the third adviser fee. |
| • | all applicable phases of the Contract (Accumulation Phase and/or Annuity Phase) have ended, and/or |
| • | if we received a Valid Claim, all applicable death benefit payments have been made. |
| • | We pay a death benefit to the Beneficiary unless the Beneficiary is the surviving spouse and continues the Contract. |
| • | If the deceased Owner was a Determining Life and the surviving spouse Beneficiary continues the Contract: |
| – | we increase the Contract Value to equal the Guaranteed Death Benefit Value if greater and available, and the death benefit ends, |
| – | the surviving spouse becomes the new Owner, |
| – | the Accumulation Phase continues, and |
| – | upon the surviving spouse’s death, his or her Beneficiary(s) receives the Contract Value. |
| • | If the deceased Owner was not a Determining Life, the Traditional Death Benefit or Maximum Anniversary Value Death Benefit are not available and the Beneficiary(s) receives the Contract Value. |
| • | The Beneficiary becomes the Payee. If we are still required to make Annuity Payments under the selected Annuity Option, the Beneficiary also becomes the new Owner. |
| • | If the deceased was not an Annuitant, Annuity Payments to the Payee continue. No death benefit is payable. |
| • | If the deceased was the only surviving Annuitant, Annuity Payments end or continue as follows. |
| – | Annuity Option 1 or 3, payments end. |
| – | Annuity Option 2 or 4, payments end when the guaranteed period ends. |
| – | Annuity Option 5, payments end and the Payee may receive a lump sum refund. |
| – | For more information on Annuity Options, please see section 8. |
| • | If the deceased was an Annuitant and there is a surviving joint Annuitant, Annuity Payments to the Payee continue during the lifetime of the surviving joint Annuitant. No death benefit is payable. |
| • | you remove a Joint Owner due to divorce, then we also remove that person as a Determining Life, or |
| • | you establish a jointly owned Non-Qualified Contract and change ownership to a Trust, then we remove the prior Owner who is not the Annuitant as a Determining Life. |
| FOR JOINTLY OWNED CONTRACTS: The sole primary Beneficiary is the surviving Joint Owner regardless of any other named primary Beneficiaries. If both Joint Owners die simultaneously as defined by applicable state law or regulation, we pay the death benefit to the named contingent Beneficiaries or equally to the estate of the Joint Owners if there are no named contingent Beneficiaries. |
| • An assignment may be a taxable event. In addition, there are other restrictions on changing the ownership of a Qualified Contract and Qualified Contracts generally cannot be assigned absolutely or on a limited basis. You should consult with your tax adviser before assigning this Contract. |
| • An assignment will only change the Determining Life (Lives) if it involves removing a Joint Owner due to divorce, or replacing Joint Owners with a Trust. |
| • | age 80 or younger, or |
| • | age 75 or younger if you select the Maximum Anniversary Value Death Benefit. |
| • | The minimum initial Purchase Payment due on the Issue Date is $10,000. |
| • | You can make additional Purchase Payments of $50 or more during the Accumulation Phase. |
| • | We do not accept additional Purchase Payments on or after the Annuity Date. |
| • | The maximum total Purchase Payments we accept without our prior approval is $1 million. |
| On your application if you select… | Your Index Effective Date will be either… |
| the earliest Index Effective Date | • your Issue Date, or • the first Business Day of the next month if the Issue Date is the 29th, 30th, or 31st of a month |
| the deferred Index Effective Date | • your first Quarterly Contract Anniversary, or • the next Business Day if the first Quarterly Contract Anniversary occurs on a non-Business Day, or the first Business Day of the next month if the first Quarterly Contract Anniversary is the 29th, 30th, or 31st of a month |
| • In order to apply Purchase Payments we receive after the Index Effective Date to your selected Index Option(s) on the next Index Anniversary, we must receive them before the end of the Business Day on the Index Anniversary (or before the end of the prior Business Day if the anniversary is a non-Business Day). |
| • Variable Options are subject to Contract fees and expenses (e.g. product fee), and market risk and assets you allocate to them may lose value, including any Purchase Payments we hold in the AZL Government Money Market before transferring them to your selected Index Options. |
| For Owners of Qualified Contracts, AIP is not available if you have an Inherited IRA Contract, an Inherited Roth IRA Contract, or if your Contract is funding a plan that is tax qualified under Section 401 of the Code. |
| • | cancel your Contract during this time, we return the greater of Purchase Payments less withdrawals, or Contract Value. We do not assess a withdrawal charge or deduct any other Contract fees or expenses if you cancel your Contract during the free look period. |
| • | do not cancel your Contract during this time, we re-allocate your Contract Value according to your Purchase Payment default instructions after the free look period as follows: |
| – | if your instructions include the Variable Options, we re-allocate this portion of your Contract Value on the next Business Day after the free look period. |
| – | if your instructions include the Index Options, we re-allocate this portion of your Contract Value on the Index Effective Date. |
| Variable Account Value increases when…. | Variable Account Value decreases when…. |
| • you add assets to a Variable Option by Purchase Payment or Contract Value transfer, or • there is positive Variable Option performance | • you take assets out of a Variable Option by withdrawal (including any financial adviser fees that you choose to have us pay from this Contract) or Contract Value transfer, • there is negative Variable Option performance, or • we deduct Contract fees and expenses |
| Contract fees and expenses we deduct from the Variable Options include the product fee, rider fee, contract maintenance charge and transfer fee as described in section 6, Expenses. Financial adviser fees that you choose to have us pay from this Contract are described in section 1, The Contract. Variable Options include Purchase Payments we hold in the AZL Government Money Market Fund before transferring them to your selected Index Options. | |
| Index Option Values increase when…. | Index Option Values decrease when…. |
| • you add assets to an Index Option by Purchase Payment or Contract Value transfer, or • you receive a positive Credit or Daily Adjustment | • you take assets out of an Index Option by withdrawal (including any financial adviser fees that you choose to have us pay from this Contract) or Contract Value transfer, • you receive a negative Credit or Daily Adjustment, or • we deduct Contract fees and expenses |
| Contract fees and expenses we deduct from the Index Options include the product fee, rider fee, contract maintenance charge and withdrawal charge as described in section 6, Expenses. Financial adviser fees that you choose to have us pay from this Contract are described in section 1, The Contract. | |
| * | Does not apply to RMD payments under our minimum distribution program. |
| • | increase when you add assets to a Variable Option by Purchase Payment or Contract Value transfer, and |
| • | decrease when assets are removed from a Variable Option by transfer, withdrawals you request (including any financial adviser fees that you choose to have us pay from this Contract), or when we deduct Contract fees and expenses. |
| • | We receive at our Service Center an additional Purchase Payment of $3,000 from you before the end of the Business Day. |
| • | When the New York Stock Exchange closes on that Business Day, we determine that the accumulation unit value is $13.25 for the subaccount of your selected Variable Option. |
| • | We then divide $3,000 by $13.25 and credit your Contract that night with 226.415094 subaccount accumulation units for your selected Variable Option. |
| • | any Purchase Payment received that day which you allocated to that Index Option, and |
| • | any Contract Value transferred into that Index Option. |
| • | the Daily Adjustment if this is not the Term End Date and this is an Index Option with the Index Precision Strategy, Index Guard Strategy, or Index Performance Strategy, or |
| • | a Credit if this is the Term End Date. |
| • | We multiply each Index Option Base by its Credit and add this amount to its Index Option Base. |
| • | Then we set each Index Option Value equal to its Index Option Base. |
| • | Additional Purchase Payments received on the Term End Date and allocated to this Index Option, and transfers of Variable Account Value or Index Option Value into this Index Option, increase these values by the dollar amount allocated or transferred. |
| • | Transfers out of this Index Option reduce these values by the dollar amount removed from the Index Option. |
| • | Partial withdrawals you take or financial adviser fees that you choose to have us pay from this Contract (including any withdrawal charge), and deductions we make for Contract fees and expenses reduce these values by the dollar amount withdrawn from the Index Option. |
| – | We deduct partial withdrawals you take or financial adviser fees that you choose to have us pay from this Contract (including any withdrawal charge), and deductions we make for Contract fees and expenses from the Index Options proportionately based on the percentage of Contract Value in each Index Option using values determined at the end of the Business Day before we process the withdrawal or deduct the Contract expense. However, if you specifically direct us to take a partial withdrawal from a specific Index Option we reduce that Index Option Value by the dollar amount you specify (including any withdrawal charge). |
| – | We then reduce each Index Option Base by the same percentage that the amount withdrawn reduced its associated Index Option Value. |
| • | Your Contract Value is $100,000 and you selected two Index Options. The first Index Option has an Index Option Value of $75,000 and an Index Option Base of $72,000. The second Index Option has an Index Option Value of $25,000 and an Index Option Base of $22,000. You take a $10,000 partial withdrawal (including any withdrawal charge). |
| • | This partial withdrawal reduces your Index Option Value by the percentage of Contract Value in each Index Option (Index Option Value ÷ Contract Value). |
| – | For the first Index Option this percentage is 75% ($75,000 ÷ $100,000) and the $10,000 partial withdrawal reduces this value by $7,500 ($10,000 x 75%). For the second Index Option this percentage is 25% ($25,000 ÷ $100,000) and the $10,000 partial withdrawal reduces this value by $2,500 ($10,000 x 25%). |
| • | We then reduce each Index Option Base by the same percentage that the amount withdrawn reduced its associated Index Option Value (amount withdrawn from Index Option Value ÷ Index Option Value). |
| – | For the first Index Option this percentage is 10% ($7,500 ÷ $75,000) and the $10,000 partial withdrawal reduces this value by $7,200 ($72,000 x 10%). For the second Index Option this percentage is also 10% ($2,500 ÷ $25,000) and the $10,000 partial withdrawal reduces this value by $2,200 ($22,000 x 10%). |
| • | Deductions we make for Contract fees and expenses also reduce these values proportionately in the same way as a partial withdrawal. |
| First Index Option | Second Index Option | ||||||
| Index Option Value | Index Option Base | Index Option Value | Index Option Base | ||||
| Prior to partial withdrawal | $ 75,000 | $ 72,000 | $ 25,000 | $ 22,000 | |||
| $10,000 partial withdrawal | – $7,500 | – $7,200 | – $2,500 | – $2,200 | |||
| After partial withdrawal | $ 67,500 | $ 64,800 | $ 22,500 | $ 19,800 | |||
| • Amounts removed from the Index Options during the Term for partial withdrawals you take (including any financial adviser fees that you choose to have us pay from this Contract) and deductions we make for Contract fees and expenses do not receive a Credit on the Term End Date. However, the remaining amount in the Index Options is eligible for a Credit on the Term End Date. |
| • You cannot specify from which Allocation Option we deduct the product fee, rider fee, and contract maintenance charge; we deduct these Contract fees and expenses from each Allocation Option proportionately based on the percentage of Contract Value in each Allocation Option. However, you can specify from which Allocation Option we deduct a partial withdrawal and any financial adviser fees that you choose to have us pay from this Contract. Because the withdrawal charge only applies to amounts withdrawn from the Index Options, there is a financial disadvantage to taking a withdrawal from the Index Options, compared to taking a withdrawal from the Variable Options. |
| Crediting Method | If Index Value is less than it was on the Term Start Date (i.e., Index Return is negative): | If Index Value is equal to or greater than it was on the Term Start Date (i.e., Index Return is zero or positive): |
| Index Protection Strategy | Credit is zero | Credit is equal to the DPSC set on the Term Start Date |
| Index Precision Strategy | Performance Credit is equal to the negative Index Return in excess of the 10% BufferIf the Index Return is… • -8%, the Performance Credit is zero. • -12%, the Performance Credit is -2%. | Performance Credit is equal to the Precision Rate set on the Term Start Date |
| Crediting Method | If Index Value is less than it was on the Term Start Date (i.e., Index Return is negative): | If Index Value is equal to or greater than it was on the Term Start Date (i.e., Index Return is zero or positive): |
| Index Guard Strategy | Performance Credit is equal to the negative Index Return subject to the -10% FloorIf the Index Return is… • -8%, the Performance Credit is -8%. • -12%, the Performance Credit is -10%. | Performance Credit is equal to the Index Return up to the Cap set on the Term Start DateAssume the Cap is 8%. If the Index Return is… • 0%, the Performance Credit is zero. • 6%, the Performance Credit is 6%. • 12%, the Performance Credit is 8%. |
| Index Performance Strategy – 1-year Term | Performance Credit is equal to the negative Index Return in excess of the 10% Buffer.If the Index Return for the year is… • -8%, the Performance Credit is zero. • -12%, the Performance Credit is -2%. | Performance Credit is equal to the Index Return up to the Cap set on the Term Start Date Assume the Cap for the 1-year Term is 8%. If the Index Return for the year is… • 0%, the Performance Credit is zero. • 6%, the Performance Credit is 6%. • 12%, the Performance Credit is 8%. |
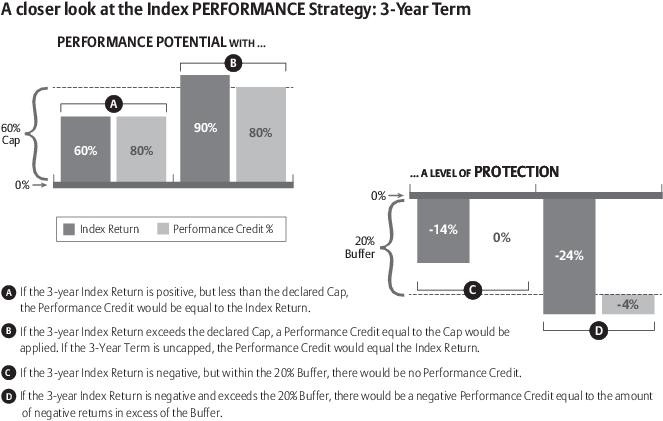
| Index Performance Strategy – 3-year Term | Performance Credit is equal to the negative Index Return in excess of the 20% Buffer.If the Index Return for the Term is… • -19%, the Performance Credit is zero. • -24%, the Performance Credit is -4%. | Performance Credit is equal to the Index Return up to any Cap set on the Term Start Date Assume the Cap for the 3-year Term is 80%. If the Index Return for the Term is… • 0%, the Performance Credit is zero. • 65%, the Performance Credit is 65%. • 90%, the Performance Credit is 80%. If instead, the 3-year Term were uncapped the Performance Credit would be 90%. |
| You cannot participate in the Optional Reallocation Program if you select a 3-year Term Index Option. If you are participating in this program and select a 3-year Term Index Option, on the Term Start Date your participation in this program ends and we will not reallocate your 1-year Term Index Option Values. |
| • | Your request for a transfer must clearly state the Variable Options involved and how much to transfer. |
| • | Your right to make transfers is subject to the Excessive Trading and Market Timing policy discussed later in this section. |
| • | Variable Account Value transfers between Variable Options do not change your Purchase Payment default instructions. |
| • | Dilution of the interests of long-term investors in a Variable Option, if market timers or others transfer into a Variable Option at prices that are below their true value, or transfer out at prices above their true value. |
| • | An adverse effect on portfolio management, such as causing a Variable Option to maintain a higher level of cash or causing a Variable Option to liquidate investments prematurely. |
| • | Increased brokerage and administrative expenses. |
| • | Limit transfer frequency (for example, prohibit more than one transfer a week, or more than two a month, etc.). |
| • | Restrict the transfer method (for example, requiring all transfers be sent by first-class U.S. mail and rescinding electronic transfer privileges). |
| • | Require a minimum time period between each transfer into or out of the same Variable Option. Our current Excessive Trading and Market Timing policy, which is subject to change without notice, prohibits “round trips” within 14 calendar days. We do not include transfers into and/or out of the AZL Government Money Market Fund when available in your Contract or any automatic transfers made under any of our programs or Contract features. Round trips are transfers into and back out of the same Variable Option, or transfers out of and back into the same Variable Option. |
| • | Refuse transfer requests made on your behalf by an asset allocation and/or market timing service. |
| • | Limit the dollar amount of any single Purchase Payment or transfer request to a Variable Option. |
| • | Prohibit transfers into specific Variable Options. |
| • | Impose other limitations or restrictions to the extent permitted by federal securities laws. |
| • | Our monitoring will be 100% successful in detecting all potentially disruptive trading activity. |
| • | Revoking electronic transfer privileges will successfully deter all potentially disruptive trading. |
| This Contract is not designed for professional market timing organizations, or other persons using programmed, large, or frequent transfers, and we may restrict excessive or inappropriate transfer activity. |
| • | You can provide voting instructions based on the dollar value of the Variable Option’s shares in your Contract’s subaccount. We calculate this value based on the number and value of accumulation units for your Contract on the record date. We count fractional units. |
| • | You receive proxy materials and a voting instruction form. |
| Base Contract Expenses (as a percentage of the Charge Base) | |
Product Fee(1) | 0.25% |
| (1) | Upon the death of the Owner, we continue to assess this product fee under death benefit payment Option B, and with optional payments under death benefit payment Option C, as noted in section 10, Death Benefit. |
| Issue Date | Non-Quarterly Contract Anniversaries | Quarterly Contract Anniversaries* |
| • The Charge Base is equal to your initial Purchase Payment.• We begin calculating and accruing the daily product fee, on the day after the Issue Date. | • First we calculate and accrue the daily product fee, using the Charge Base. If this is a non-Business Day we use the Charge Base from the end of the prior Business Day.• Then if this is a Business Day we increase/decrease the Charge Base as follows. – If we receive an additional Purchase Payment, we increase the Charge Base by the dollar amount we receive. – If you take a partial withdrawal or choose to have us pay financial adviser fees from this Contract, or we deduct Contract fees and expenses, we decrease the Charge Base by the percentage of Contract Value withdrawn (including any withdrawal charge). All withdrawals you take reduce the Charge Base, even Penalty-Free Withdrawals. | • First we process all daily transactions and determine your Contract Value. Daily transactions include any gains/losses due to Variable Option performance or application of any Daily Adjustment (or Credit if this is also the Term End Date), any additional Purchase Payment, any partial withdrawals you take or financial adviser fees that you choose to have us pay from this Contract (including any withdrawal charge), and deductions we make for Contract fees and expenses (including deduction of the accrued daily product fee for the prior quarter). All partial withdrawals you take reduce the Charge Base, even Penalty-Free Withdrawals. – We deduct the accrued product fee for the prior quarter on a dollar for dollar basis from the Contract Value, and proportionately from each Allocation Option.• Then we set the Charge Base equal to this Contract Value and we calculate and accrue the next quarter’s daily product fee using the newly set Charge Base.* Or the next Business Day if the Quarterly Contract Anniversary is a non-Business Day. |
| Example: Contract Value is $125,000; Charge Base is $127,000; a $10,000 partial withdrawal (including any withdrawal charge) would decrease the Charge Base by $10,160. [($10,000 ÷ $125,000) x $127,000] Any increase/decrease to the Charge Base will increase/decrease the daily product fee we calculate and accrue on the next day. | ||
| Examples of how we calculate the product fee are included in Appendix E. | ||
| We do not treat the deduction of the accrued product fee as a withdrawal when computing your Guaranteed Death Benefit Value (see section 10). |
| • | If you take a full withdrawal we deduct the final accrued product fee before processing the withdrawal. |
| • | If you annuitize the Contract, we deduct the final accrued product fee before calculating Annuity Payments. |
| • | Upon the death of an Owner (or Annuitant if the Owner is a non-individual), we deduct the final accrued product fee before calculating the death benefit if death benefit payment Option A or Annuity Payments under death benefit payment Option C is selected. For more information on the death benefit payment options see section 10, Death Benefit. |
| If on a Quarterly Contract Anniversary (or the next Business Day if the Quarterly Contract Anniversary is a non-Business Day) the Contract Value is less than the accrued product fee, we deduct your total remaining Contract Value to cover the accrued product fee and reduce your Contract Value to zero. If the deduction of the accrued product fee reduces your Contract Value to zero and your selected death benefit has ended, we treat this as a full withdrawal and your Contract ends. |
| When calculating the Maximum Anniversary Value, we deduct all Contract fees and expenses on the Index Anniversary (including the accrued product and rider fees if this is also a Quarterly Contract Anniversary) before we capture any annual investment gains. |
| • | During the Accumulation Phase, if the total Contract Value for all Allianz Index Advantage ADV® Contracts you own is at least $100,000 at the end of the last Business Day before the Contract Anniversary, or if the Contract Value for this single Allianz Index Advantage ADV® Contract is at least $100,000 on the Contract Anniversary. We determine the total Contract Value for all individually owned Allianz Index Advantage ADV® Contracts by using the Owner’s social security number, and for non-individually owned Allianz Index Advantage ADV® Contracts we use the Annuitant’s social security number. |
| • | During the Annuity Phase if the total Contract Value for all Allianz Index Advantage ADV® Contracts on the last Business Day before the Annuity Date is at least $100,000. |
| • | When paying death benefits. |
| • | on a dollar for dollar basis from the Contract Value on the Contract Anniversary (or the next Business Day if the Contract Anniversary is a non-Business Day), and |
| • | we deduct it proportionately from each Allocation Option. |
| Calculating a Withdrawal Charge | Example | |||
| For purposes of calculating any withdrawal charge for a withdrawal from the Index Options, we withdraw Purchase Payments on a “first-in-first-out” (FIFO) basis and we process withdrawal requests as follows. | You make an initial Purchase Payment of $30,000 and make another Purchase Payment in the first month of the second Contract Year of $70,000. All Purchase Payments are allocated to the Index Options. In the third month of the third Contract Year, your Contract Value is $110,000 and you request a $52,000 withdrawal. We withdraw money and compute the withdrawal charge as follows. | |||
| 1. First we withdraw from Purchase Payments that we have had for six or more complete years, which is your Contract’s withdrawal charge period. This withdrawal is not subject to a withdrawal charge and it reduces the Withdrawal Charge Basis dollar for dollar. | 1. Purchase Payments beyond the withdrawal charge period. All payments are still within the withdrawal charge period, so this does not apply. | |||
| 2. Amounts available as a Penalty-Free Withdrawal. This includes partial withdrawals you take during the Accumulation Phase under the free withdrawal privilege or waiver of withdrawal charge benefit, and RMD payments you take under our minimum distribution program. Penalty-Free Withdrawals are not subject to a withdrawal charge, and they do not reduce the Withdrawal Charge Basis. | 2. Amounts available as a Penalty-Free Withdrawal. You did not take any other withdrawals this year, so the entire free withdrawal privilege (10% of your total Purchase Payments, or $10,000) is available to you without incurring a withdrawal charge. | |||
| 3. Next, on a FIFO basis, we withdraw from Purchase Payments within your Contract’s withdrawal charge period and assess a withdrawal charge. Withdrawing payments on a FIFO basis may help reduce the total withdrawal charge because the charge declines over time. We determine your total withdrawal charge by multiplying each payment by its applicable withdrawal charge percentage and then totaling the charges. These withdrawals reduce the Withdrawal Charge Basis. The withdrawal charge as a percentage of each Purchase Payment withdrawn is as follows. | 3. Purchase Payments within the withdrawal charge period on a FIFO basis. The total amount we withdraw from the first Purchase Payment is $30,000, which is subject to a 5% withdrawal charge, and you receive $28,500. We determine this amount as follows: (amount withdrawn) x (1 – withdrawal charge) = the amount you receive, or: $30,000 x 0.95 = $28,500 Next we withdraw from the second Purchase Payment. So far, you received $38,500 ($10,000 under the free withdrawal privilege and $28,500 from the first Purchase Payment which is now reduced to zero), so we withdraw $13,500 from the second Purchase Payment to equal the $52,000 you requested. The second Purchase Payment is subject to an 6% withdrawal charge. We calculate the total amount withdrawn and its withdrawal charge as follows: (the amount you receive) ÷ (1 – withdrawal charge) = amount withdrawn, or: $13,500 ÷ 0.94 = $14,362. | |||
| Number of Complete Years Since Purchase Payment | Withdrawal Charge Amount | |||
| 0 1 2 3 4 5 6 years or more | 6.5% 6% 5% 5% 3% 2% 0% | |||
| Calculating a Withdrawal Charge | Example | |
| 4. Finally we withdraw any Contract earnings. This withdrawal is not subject to a withdrawal charge and it does not reduce the Withdrawal Charge Basis. | 4. Contract earnings. We already withdrew your requested amount, so this does not apply. In total we withdrew $54,326 from your Contract, of which you received $52,000 and paid a withdrawal charge of $2,326. We also reduced the 1st Purchase Payment from $30,000 to $0, and your 2nd Purchase Payment from $70,000 to $55,638 ($70,000 - $14,362). | |
| • Because there is no withdrawal charge applicable to the Variable Options, there is a financial disadvantage to directing us to withdraw Contract Value only from the Index Options during the withdrawal charge period, rather than the Variable Options. |
| • Any amount withdrawn from an Index Option is subject to both a Daily Adjustment (which may be negative) and any applicable withdrawal charge. |
| • Upon a full withdrawal the free withdrawal privilege is not available to you, and we apply a withdrawal charge against Purchase Payments that are still within the withdrawal charge period, including amounts previously withdrawn under the free withdrawal privilege. On a full withdrawal your Withdrawal Charge Basis may be greater than your Contract Value because the following reduce your Contract Value, but do not reduce your Withdrawal Charge Basis: |
| – prior Penalty-Free Withdrawals, |
| – prior withdrawals from the Variable Options, |
| – deductions we make for Contract fees and expenses other than the withdrawal charge, and/or |
| – poor performance. |
| This also means that upon a full withdrawal you may not receive any money. |
| • Withdrawals (including any financial adviser fees that you choose to have us pay from this Contract) may also be subject to ordinary income taxes, and a 10% additional federal tax if you are under age 59 1⁄2, and the amount of Contract Value available for withdrawal may be affected by the Daily Adjustment (which can be negative). Please consult with your Financial Professional before requesting us to pay financial adviser fees from this Contract compared to other assets you may have. |
| • For tax purposes in most instances, withdrawals from Non-Qualified Contracts are considered to come from earnings first, not Purchase Payments. |
| • | by taking a withdrawal (including financial adviser fees that you choose to have us pay from this Contract; withdrawals under the free withdrawal privilege, systematic withdrawal program, and waiver of withdrawal charge benefit; and for Qualified Contracts only, RMD payments under our minimum distribution program); |
| • | by taking Annuity Payments; or |
| • | when we pay a death benefit. |
| * | Does not apply to RMD payments under our minimum distribution program. |
| • | total Contract Value including any Daily Adjustment, |
| • | less any final product and rider fees, and contract maintenance charge, and |
| • | less any withdrawal charge. |
| • Withdrawals may be subject to a withdrawal charge, state and federal taxation, and a 10% additional federal tax if you are under age 59 1⁄2, and the amount of Contract Value available for withdrawal may be affected by the Daily Adjustment (which can be negative). Please consult with your Financial Professional before requesting us to pay financial adviser fees from this Contract compared to other assets you may have. |
| • Joint Owners: We send one check payable to both Joint Owners and tax report each Joint Owner individually. Tax reporting each Joint Owner individually can create a discrepancy in taxation if only one Joint Owner is under age 59 1⁄2 because that Joint Owner will be subject to the 10% additional federal tax. |
| • We may be required to provide information about you or your Contract to government regulators. We may also be required to stop Contract disbursements and thereby refuse any transfer requests, and refuse to pay any withdrawals (including a full withdrawal), or death benefits until we receive instructions from the appropriate regulator. If, pursuant to SEC rules, the AZL Government Money Market Fund suspends payment of redemption proceeds in connection with a fund liquidation, we will delay payment of any transfer, full or partial withdrawal, or death benefit from the AZL Government Money Market Fund subaccount until the fund is liquidated. |
| The free withdrawal privilege is not available upon a full withdrawal. |
| • Ordinary income taxes and tax penalties may apply to systematic withdrawals. |
| • The systematic withdrawal program is not available while you are receiving RMD payments. |
| • You should consult a tax adviser before purchasing a Qualified Contract that is subject to RMD payments. |
| • The minimum distribution program is not available while you are receiving systematic withdrawals. |
| • | the New York Stock Exchange is closed (other than customary weekend and holiday closings); |
| • | trading on the New York Stock Exchange is restricted; |
| • | an emergency (as determined by the SEC) exists as a result of which disposal of the Variable Option shares is not reasonably practicable or we cannot reasonably value the Variable Option shares; or |
| • | during any other period when the SEC, by order, so permits for the protection of Owners. |
| • | The Contract Value less the final product fee, and rider fee (if applicable) on the Annuity Date. |
| • | The age of the Annuitant and any joint Annuitant on the Annuity Date. |
| • | The gender of the Annuitant and any joint Annuitant where permitted. |
| • | The Annuity Option you select. |
| • | Your Contract’s interest rate (or current rates, if higher) and mortality table. |
| If you do not choose an Annuity Option before the Annuity Date, we make Annuity Payments to the Payee under Annuity Option 2 with ten years of guaranteed monthly payments. |
| If on the Annuity Date (which may occur as early as the second Contract Anniversary, or as late as age 100) your Contract Value is greater than zero, you must annuitize the Contract. We notify you of your available options in writing 60 days in advance, including the option to extend your Annuity Date if available. If on your Annuity Date you have not selected an Annuity Option, we make payments under Annuity Option 2 with ten years of guaranteed monthly payments. Upon annuitization you no longer have Contract Value or a death benefit, and you cannot receive any other periodic withdrawals or payments other than Annuity Payments. |
| Standard Benefits (No Additional Charge) | ||
| Name of Benefit | Purpose | Brief Description of Restrictions/Limitations |
| Free Withdrawal Privilege | Allows you to withdraw up to 10% of your total Purchase Payments from the Index Options each Contract Year without incurring a withdrawal charge. | • Only available during the Accumulation Phase. • Not available upon a full withdrawal. • Unused free withdrawal amounts not available in future years. • Program withdrawals may be subject to negative Daily Adjustments. • Program withdrawals may be subject to income taxes, including a 10% additional federal tax if taken before age 59 1⁄2. |
| Automatic Investment Plan (AIP) | Allows you to make automatic Purchase Payments by electronic money transfer from your savings, checking, or brokerage account. | • Only available during the Accumulation Phase. • Not available to certain Qualified Contracts. • Payments must be on a monthly or quarterly basis. • Subject to applicable Purchase Payment restrictions. • We reserve the right to discontinue or modify the program. |
| Optional Reallocation Program for the 1-year Term Index Options | Provides for automatic transfers among the 1-year Term Index Options to help you maintain your selected allocation percentages among these Index Options. | • Only available during the Accumulation Phase. • Not available if you select a 3-year Term Index Option. • We reserve the right to discontinue or modify the program. |
| Systematic Withdrawal Program | Allows you to take automatic withdrawals from your Contract. | • Only available during the Accumulation Phase. • Not available while you are participating in minimum distribution program. • Program withdrawals may be monthly, quarterly, semi-annual or annual, unless you have less than $25,000 in Contract Value, in which case only annual withdrawals are available. • Program withdrawals count against free withdrawal privilege. • Program withdrawals may be subject to negative Daily Adjustments. • Program withdrawals may be subject to withdrawal charges and income taxes, including a 10% additional federal tax if taken before age 59 1⁄2. • We reserve the right to discontinue or modify the program. |
| Minimum Distribution Program | Allows you to automatically take withdrawals to satisfy the minimum distribution requirements (RMD) imposed by the Internal Revenue Code. | • Only available during the Accumulation Phase. • Only available to IRA or SEP IRA Contracts. • Program withdrawals count against free withdrawal privilege. • Program withdrawals may be subject to negative Daily Adjustments. • Program withdrawals may be subject to income taxes. • Program withdrawals may be monthly, quarterly, semi-annual or annual, unless you have less than $25,000 in Contract Value, in which case only annual payments are available. • We reserve the right to discontinue or modify the program subject to the requirements of law. |
| Standard Benefits (No Additional Charge) | ||
| Name of Benefit | Purpose | Brief Description of Restrictions/Limitations |
| Financial Adviser Fees | If you have a financial adviser and want to pay their financial adviser fees from this Contract, you can instruct us to withdraw the fee from your Contract and pay it to your Financial Professional or Financial Professional’s firm as instructed. | • Only available during the Accumulation Phase. • Financial adviser fees are in addition to the Contract’s fees and expenses. • Deductions for financial adviser fees are treated as withdrawals under the Contract. • Program withdrawals count against free withdrawal privilege. • Program withdrawals may be subject to negative Daily Adjustments. • Program withdrawals may be subject to withdrawal charges and income taxes, including a 10% additional federal tax if taken before age 59 1⁄2. • We reserve the right to discontinue or modify the program. |
| Waiver of Withdrawal Charge Benefit | Waives withdrawal charges if you become confined to a nursing home. | • Only available during the Accumulation Phase. • Confinement must be for at least 90 consecutive days. • Requires physician certification. • Not available if any Owner was confined to a nursing home on the Issue Date. • Program withdrawals count against free withdrawal privilege. • Program withdrawals may be subject to negative Daily Adjustments. • Program withdrawals are not subject to withdrawal charges, but may be subject to income taxes, including a 10% additional federal tax if taken before age 59 1⁄2. • State variations may apply. |
| Traditional Death Benefit | Provides a death benefit equal to the greater of the Contract Value, or Guaranteed Death Benefit Value. The Guaranteed Death Benefit Value is total Purchase Payments adjusted for withdrawals. An example of the death benefit provided by the Traditional Death Benefit is included in section 10, Death Benefit. An example of the impact of withdrawals for financial adviser fees that you choose to have us pay from this Contract on the death benefit is included in section 1. | • Benefit only available during the Accumulation Phase. • Withdrawals, including any negative Daily Adjustments, may significantly reduce the benefit as indicated in section 1, Financial Adviser Fee Deduction Example. • Restrictions on Purchase Payments may limit the benefit. • Annuitizing the Contract will end the benefit. |
| Standard Benefits (No Additional Charge) | ||
| Name of Benefit | Purpose | Brief Description of Restrictions/Limitations |
| Performance Lock | Allows you to capture the current Index Option Value during the Term for an Index Option with the Index Precision Strategy, Index Guard Strategy, or Index Performance Strategy. Can help eliminate doubt about future Index performance and possibly limit the impact of negative performance. A Performance Lock example is included in section 4, Valuing Your Contract — Performance Locks. | • Available during the Accumulation Phase. • Not available with the Index Protection Strategy Index Options. • May be exercised before the Term End Date for an Index Option. • If exercised, will no longer participate in Index performance (positive or negative) for the remainder of the Term, and will not receive a Credit on the Term End Date. • You will not know your locked Index Option Value in advance. • The locked Index Option Value will reflect a Daily Adjustment. • If executed when Daily Adjustment has declined, will lock in any loss. • Can be executed only once each Term for each Index Option. • Cannot be exercised for only a portion of the Index Option Value. • Deductions (e.g. withdrawals, fees) decrease the locked Index Option Value. • Cannot transfer locked Index Option Value until the Term End Date, except when exercised for a 3-year Index Option, provided the Lock Date occurs on or before the second Index Anniversary of a 3-year Term. • We will not provide advice or notify you regarding whether you should exercise or the optimal time for doing so. • We will not warn you if you exercise at a sub-optimal time. |
| Optional Benefits | |||
| Name of Benefit | Purpose | Maximum Fee | Brief Description of Restrictions/Limitations |
| Maximum Anniversary Value Death Benefit | Provides a death benefit equal to the greater of the Contract Value, or Guaranteed Death Benefit Value. The Guaranteed Death Benefit Value is the Maximum Anniversary Value. An example of the death benefit provided by the Maximum Anniversary Value Death Benefit, and calculation of the Maximum Anniversary Value is included in section 10, Death Benefit. An example of the impact of withdrawals for financial adviser fees that you choose to have us pay from this Contract on the death benefit is included in section 1. | 0.20% (as a percentage of the Charge Base) | • Must be age 75 or younger to elect. • Can only be added to a Contract at issue. • Replaces the Traditional Death Benefit if elected. • Benefit cannot be removed from the Contract. • Only available during the Accumulation Phase. • Withdrawals, including any negative Daily Adjustment, may significantly reduce the benefit as indicated in section 1, Financial Adviser Fee Deduction Example. • Withdrawals reduce the likelihood of lock in. • Restrictions on Purchase Payments may limit the benefit. • Annuitizing the Contract will end the benefit. |
| • | We increase it by the dollar amount of any additional Purchase Payments. |
| • | We reduce it by the percentage of any Contract Value you withdraw (including any withdrawal charge). |
| • | its current value after processing any additional Purchase Payments, or withdrawals you take (including any withdrawal charge), or |
| • | the Contract Value determined at the end of the Business Day after we process all daily transactions including Credits, any additional Purchase Payments, withdrawals you take including any withdrawal charges, and deductions we make for other Contract fees and expenses. Contract Value reflects the Daily Adjustment if you select a 3-year Term Index Option and this anniversary is not a Term End Date. Negative Index Option performance, withdrawals you take, and deductions we make for Contract fees or expenses decrease the Contract Value and reduce the likelihood of receiving increases to the Maximum Anniversary Value. |
| • | the older Determining Life’s 91st birthday, or |
| • | the end of the Business Day we receive the first Valid Claim from any one Beneficiary. |
| Contract Value | Maximum Anniversary Value | |||
| Issue Date | $ 100,000 | $ 100,000 | ||
| 1st Quarterly Anniversary | $ 99,250 | $ 100,000 | ||
| 2nd Quarterly Anniversary | $ 99,975 | $ 100,000 | ||
| 3rd Quarterly Anniversary | $ 100,125 | $ 100,125 | ||
| 4th Quarterly Anniversary/Index Anniversary | $ 99,995 | $ 100,125 |
| • | On the Issue Date the Maximum Anniversary Value is equal to the initial Purchase Payment of $100,000. |
| • | On the 1st and 2nd Quarterly Anniversaries the Contract Value is less than the Maximum Anniversary Value, so the Maximum Anniversary Value neither increases, nor decreases. |
| • | On the 3rd Quarterly Anniversary the Contract Value is greater than the Maximum Anniversary Value, so we increase the Maximum Anniversary Value to equal the $100,125 Contract Value. The Maximum Anniversary Value will stay at $100,125 until the Contract Value on a Quarterly Anniversary is greater than this amount or you make an additional Purchase Payment (either of which will increase the Maximum Anniversary Value), or you take a withdrawal (which will decrease the Maximum Anniversary Value). |
| • | Guaranteed Death Benefit Value determined at the end of the Business Day we receive the first Valid Claim from any one Beneficiary, or |
| • | Contract Value determined at the end of the Business Day during which we receive his or her Valid Claim. |
| • | If a Determining Life dies before you, we do not pay a death benefit to the Beneficiary(s) but we may increase the Contract Value if the Traditional Death Benefit or Maximum Anniversary Value Death Benefit are still in effect. At the end of the Business Day we receive due proof of a Determining Life’s death we increase the Contract Value to equal the Guaranteed Death Benefit Value if greater, and your selected death benefit ends. We allocate any Contract Value increase to the Allocation Options according to your Purchase Payment default instructions. |
| • | Upon your death your Beneficiary(s) receive the Contract Value determined at the end of the Business Day during which we receive each Beneficiary’s Valid Claim. |
| • | The Business Day before the Annuity Date. |
| • | The Business Day that the Guaranteed Death Benefit Value and Contract Value are both zero. |
| • | Upon the death of a Determining Life, the end of the Business Day we receive a Valid Claim from all Beneficiaries if you and the Determining Life are the same individuals, or if you and the Determining Life (Lives) are different individuals and die simultaneously as defined by applicable state law or regulation. |
| • | Upon the death of a Determining Life, the end of the Business Day we receive due proof of the Determining Life’s death if you and the Determining Life (Lives) are different individuals and do not die simultaneously as defined by applicable state law or regulation. |
| • | Upon the death of an Owner (or Annuitant if the Owner is a non-individual), the end of the Business Day we receive the first Valid Claim from any one Beneficiary, if the Owner (or Annuitant) is no longer a Determining Life. |
| • | The Business Day the Contract ends. |
| We base the Guaranteed Death Benefit Value on the first death of a Determining Life (or Lives). This means that upon the death of an Owner (or Annuitant if the Owner is a non-individual), if a surviving spouse continues the Contract: |
| • the Guaranteed Death Benefit Value is no longer available, and |
| • if you selected the Maximum Anniversary Value Death Benefit, we no longer assess its 0.20% rider fee. |
| Also, if you and the Determining Life (Lives) are different individuals and you die first, the Guaranteed Death Benefit Value is not available to your Beneficiary(s). |
| • | he or she becomes the new Owner and may exercise all of the Owner’s rights, including naming a new Beneficiary or Beneficiaries; |
| • | he or she is subject to any remaining withdrawal charge; and |
| • | upon the surviving spouse’s death their Beneficiary(s) receive the Contract Value determined at the end of the Business Day during which we receive a Valid Claim from each Beneficiary. |
| • | Inherited IRA. The Code permits beneficiaries of investments that were issued under qualified retirement plans or IRAs to directly transfer the death benefit from that investment into a variable annuity contract (Inherited IRA or Inherited Roth IRA Contract). If you purchase this Contract as a transfer from another carrier, you will become the Owner of the new Inherited IRA Contract or Inherited Roth IRA Contract. The ownership of this Contract will also reflect the name of the deceased previous owner. Once an Inherited IRA or Inherited Roth IRA Contract is established, no further Purchase Payments can be made. We may choose not to allow this Contact to be purchased as an Inherited IRA or Inherited Roth IRA. |
| We may issue the following type of Qualified Contract to a qualified retirement plan. |
| Type of Contract | Persons and Entities that can own the Contract |
| IRA | Must have the same individual as Owner and Annuitant. |
| Roth IRA | Must have the same individual as Owner and Annuitant. |
| Simplified Employee Pension (SEP) IRA | Must have the same individual as Owner and Annuitant. |
| Certain Code Section 401 Plans | A qualified retirement plan is the Owner and the Annuitant must be an individual who is a participant in the plan. If the qualified retirement plan is a defined benefit plan, the individual must be the only participant in the plan. We may determine which types of qualified retirement plans are eligible to purchase this Contract. |
| Inherited IRA and Inherited Roth IRA | Must have the same individual as Owner and Annuitant. The deceased owner of the previously held tax-qualified arrangement will also be listed in the titling of the Contract. |
| 1) | distributions made on or after the date you (or the Annuitant as applicable) reach age 59 1⁄2; |
| 2) | distributions following your death or disability (or the Annuitant as applicable) (for this purpose disability is as defined in Section 72(m)(7) of the Code); |
| 3) | distributions paid in a series of substantially equal payments made annually (or more frequently) for your life (or life expectancy) or joint lives of you and your designated Beneficiary; |
| 4) | distributions made to you after separation from service after reaching age 55 (does not apply to IRAs); |
| 5) | distributions made to you to the extent such distributions do not exceed the amount allowed as a deduction under Code Section 213 for amounts paid during the tax year for medical care; |
| 6) | distributions made on account of an IRS levy upon the Qualified Contract; |
| 7) | distributions from an IRA for the purchase of medical insurance (as described in Section 213(d)(1)(D) of the Code) for you and your spouse and dependents if you have received unemployment compensation for at least 12 weeks (this exception will no longer apply after you have been re-employed for at least 60 days); |
| 8) | distributions from an IRA made to you, to the extent such distributions do not exceed your qualified higher education expenses (as defined in Section 72(t)(7) of the Code) for the tax year; |
| 9) | distributions from an IRA which are qualified first-time homebuyer distributions (as defined in Section 72(t)(8) of the Code); |
| 10) | distributions made to an alternate Payee pursuant to a qualified domestic relations order (does not apply to an IRA); |
| 11) | distributions made to a reservist called to active duty after September 11, 2001, for a period in excess of 179 days (or for an indefinite period), from IRAs or amounts attributable to elective deferrals under a 401(k) plan made during such active period; and |
| 12) | distributions made during the payment period starting on the birth of a child or the finalization of an adoption (up to $5,000). |
| 1) | paid on or after you reach age 59 1⁄2; |
| 2) | paid after you die; |
| 3) | paid if you become totally disabled (as that term is defined in Section 72(m)(7) of the Code); |
| 4) | paid in a series of substantially equal payments made annually (or more frequently) for your life (or life expectancy) or joint lives of you and your designated Beneficiary; |
| 5) | paid as annuity payments under an immediate annuity; or |
| 6) | that come from Purchase Payments made before August 14, 1982. |
| • | you might have to pay a withdrawal charge on your previous contract, |
| • | there is a new withdrawal charge period for this Contract, |
| • | other charges under this Contract may be higher (or lower), |
| • | the benefits may be different, and |
| • | you no longer have access to any benefits from your previous contract. |
| • | a series of substantially equal payments made at least annually for the life or life expectancy of the participant or joint and last survivor expectancy of the participant and a designated Beneficiary, or for a specified period of ten years or more; or |
| • | RMDs; or |
| • | any part of a distribution not included in gross income (for example, returns of after-tax contributions); or |
| • | hardship withdrawals. |
| • | overhead, |
| • | legal fees, |
| • | accounting fees, |
| • | Financial Professional training, |
| • | compensation for the ALFS management team, and |
| • | other expenses associated with the Contracts. |
| • | marketing services and increased access to their Financial Professionals; |
| • | sales promotions relating to the Contracts; |
| • | costs associated with sales conferences and educational seminars; |
| • | the cost of client meetings and presentations; and |
| • | other sales expenses incurred by them. |
| • | issuance and maintenance of the Contracts, |
| • | maintenance of Owner records, and |
| • | routine customer service including: |
| – | processing of Contract changes, |
| – | processing withdrawal requests (both partial and total), and |
| – | processing requests for fixed annuity payments. |
| • | Walter R. White, President and Chief Executive Officer(1) |
| • | Jasmine M. Jirele, President and Chief Executive Officer(2) |
| • | William E. Gaumond, Senior Vice President, Chief Financial Officer and Treasurer |
| • | Eric J. Thomes, Senior Vice President, Chief Distribution Officer |
| • | Neil H. McKay, Senior Vice President, Chief Actuary |
| • | Gretchen Cepek, Senior Vice President, General Counsel, and Secretary |
| (1) | Mr. White served as President and Chief Executive Officer until September 1, 2021, he then transitioned to Senior Advisor until his retirement on December 31, 2021. |
| (2) | Ms. Jirele has served as President and Chief Executive Officer since September 1, 2021, prior to that she was the Senior Vice President, Chief Growth Officer. |
| • | providing total compensation opportunities that are competitive with the levels of total compensation available at the large diversified financial services companies with which Allianz Life most directly competes in the marketplace; |
| • | setting performance metrics and objectives for variable compensation arrangements that reward executives for attaining both annual targets and long-term business objectives, thereby providing individual executives with the opportunity to earn above-average compensation by achieving above-average results; |
| • | establishing equity-based arrangements that align executives’ financial interests with those of Allianz SE by ensuring executives have a material financial stake in the equity value of Allianz SE and the business success of its affiliates; and |
| • | structuring compensation packages and outcomes to foster internal pay equity. |
| Compensation Element | Description | Objective |
| Base Salary | Fixed rate of pay that compensates employees for fulfilling their basic job responsibilities. For NEOs, increases are generally provided in the case of a significant increase in responsibilities or a significant discrepancy versus the market. | Attract and retain high-caliber leadership. |
| Annual Incentive Plan | Incentive compensation that promotes and rewards the achievement of annual performance objectives through awards under the Allianz Life Annual Incentive Plan (“AIP”). | • Link compensation to annual performance results. • Attract and motivate high-caliber leadership. • Align the interests of NEOs and our stockholder. |
| Performance-Based Equity Incentives | Incentive compensation through restricted stock unit awards made under the Allianz Equity Incentive Plan (“AEI”) that promotes and rewards the achievement of long term performance objectives. | • Retain high-caliber leadership with multi-year vesting. • Align the interests of NEOs and our stockholder. |
| Severance Arrangements | Severance payments to employees, including NEOs, under certain company-initiated termination events. | Compensate employees for situations where the employee’s employment is involuntarily terminated in a qualifying termination of employment. |
| Perquisites-Benefits | Perquisites provided to our NEOs include employer matching contributions to the NEOs’ accounts in the 401(k) plan and may also include the payment of life insurance premiums, relocation reimbursements, and reimbursements for financial planning, tax preparation services, and spousal travel expenses. | Provide market competitive total compensation package. |
| • | In general, establish the compensation philosophy and strategy of Allianz Life and oversee the development and implementation of compensation, benefit, and perquisite programs for corporate executives consistent with the principles of ensuring that leadership is compensated effectively in a manner consistent with the stated compensation strategy, internal equity considerations, competitive practices, shareholder interests, and the requirements of any applicable regulatory bodies in order to attract and retain high-quality leadership. This responsibility includes periodic review of Allianz Life’s compensation programs to pursue certain goals, with the expectation that changes will be made periodically to ensure these goals are attained. |
| • | Review and approve the establishment of, or material modification to, any executive incentive compensation plans or programs for Allianz Life. |
| • | Review and approve any special benefits or perquisites in effect for, or offered to, any prospective, current or former Allianz Life employee, regardless of the employee’s level or assignment within Allianz Life. Such benefits and perquisites are those that are unusual or different from the benefits offered to all similarly-situated employees. |
| • | Review and approve any employment agreements proposed to be made with any prospective or current employee of Allianz Life. |
| • | Review and approve any individual severance agreement with any Allianz Life officer. This does not include an arrangement where the employee receives severance or incentive payments under existing terms of a broad-based benefit or compensation plan. |
| • | Oversee Allianz Life’s compliance with regulations with respect to compensation matters and adopt and monitor adherence to global and local process requirements and timelines, including those required under the Corporate Rules (as defined under the Allianz Life Standard for Corporate Rules) mandated by Allianz SE. |
| • | evaluating the compensation data from industry groups, national executive pay surveys, and other sources for the NEOs and other executive officers as appropriate; |
| • | gathering and correlating performance ratings and reviews for individual executive officers, including the NEOs; |
| • | reviewing executive compensation recommendations against appropriate market data and for internal consistency and equity; and |
| • | reporting to, and answering requests for information from, the Compensation Committee. |
| • | reward the performance of participants who have made significant contributions to the achievement of annual goals and objectives; |
| • | provide an incentive that will encourage future superior individual performance; and |
| • | encourage the retention of employees who have demonstrated exceptional performance and/or are anticipated to significantly contribute to the long-term success of Allianz Life. |
| • | reward the performance of participants who have made significant contributions to the achievement of their company’s annual goals and objectives, |
| • | provide an incentive that will encourage future superior individual performance, and |
| • | encourage the retention of employees who have demonstrated exceptional performance and/or are anticipated to significantly contribute to the long-term success Allianz. |
| Name and Principal Position (a) | Year (b) | Salary (c) | Bonus (d) | Stock Awards (e)(3) | Non-Equity Incentive Plan Compensation (g) | All Other Compensation (i)(4) | Total (j) |
| Walter R. White President and Chief Executive Officer | 2021 | $865,100 | $300,000 | $2,335,770 | $1,557,180 | $22,665 | $5,080,715 |
| Jasmine M. Jirele(1,2) President and Chief Executive Officer | 2021 | $561,958 | $390,000 | $1,068,303 | $712,202 | $22,516 | $2,754,979 |
| William E. Gaumond Senior Vice President, Chief Financial Officer and Treasurer | 2021 | $475,900 | $300,000 | $770,958 | $513,972 | $22,437 | $2,083,267 |
| Eric J. Thomes Senior Vice President, Chief Distribution Officer | 2021 | $535,500 | $320,000 | $867,510 | $578,340 | $22,548 | $2,323,898 |
| Neil H. McKay Senior Vice President, Chief Actuary | 2021 | $510,000 | $50,000 | $926,200 | $550,800 | $24,397 | $2,061,397 |
| Gretchen Cepek Senior Vice President, General Counsel and Secretary | 2021 | $469,500 | $110,000 | $733,825 | $422,550 | $22,167 | $1,758,042 |
| (1) | Represents compensation paid during her time as Senior Vice President, Chief Growth Officer and President and Chief Executive Officer. |
| (2) | A retention bonus of $800,000 will be paid over four years in increments of $200,000 with the first payment paid in March 2019 and the final payment in 2022 so long as Ms. Jirele remains employed by Allianz Life. |
| (3) | Represents the grant date fair value of the RSUs issued pursuant to the AEI. The RSUs vest over a four-year period. The RSUs issued in 2022 for the 2021 performance year have a March 2026 exercise date. The grant price of the RSUs was the arithmetic average of the closing prices of an Allianz SE share in the electronic cash market trading system Xetra (or any successor system) on the date of grant and the nine immediately preceding trading days, less the present value of dividends expected to be paid on one Allianz SE share over the vesting period, and less the fair value of the payout restrictions deriving from the vesting period and the payout cap. These numbers show the amount realized for financial reporting purposes as calculated in accordance with the FASB ASC Topic 718. Under FASB ASC Topic 718, the grant date fair value is calculated using the closing market price of the common stock of Allianz SE on the date of grant, which is then recognized over the requisite service period of the award. |
| (4) | The following table provides additional details regarding compensation found in the “All Other Compensation” column. |
| Name | Year | Spousal Travel(5) | Milestone/ Anniversary/ Recognition(6) | Life Insurance Premiums | Employer Match to 401(k) Plan | ASAAP Contribution(7) | Total |
| Walter R. White | 2021 | -- | -- | $915 | $21,750 | -- | $22,665 |
| Jasmine M. Jirele | 2021 | -- | $350 | $416 | $19,500 | $2,250 | $22,516 |
| William E. Gaumond | 2021 | -- | -- | $687 | $19,500 | $2,250 | $22,437 |
| Eric J. Thomes | 2021 | -- | -- | $798 | $19,500 | $2,250 | $22,548 |
| Neil H. McKay | 2021 | $200 | $1,700 | $747 | $21,750 | -- | $24,397 |
| Gretchen Cepek | 2021 | -- | -- | $417 | $21,750 | -- | $22,167 |
| (5) | Represents reimbursement or payments made to defray the costs of a spouse’s travel. |
| (6) | Represents Milestone Anniversary Program, which pays a bonus at three and five year anniversaries, and then every five years thereafter. |
| (7) | Represents company matching contribution to the Allianz Supplemental Asset Accumulation Plan for deferrals in excess of IRS compensation limit. |
| Name (a) | Grant Date (b) | Estimated Future Payouts Under Non-Equity Incentive Plan Awards(1) | Estimated Future Payouts Under Equity Incentive Plan Awards(2,3) | ||||
| Threshold ($) (c) | Target ($) (d) | Maximum ($) (e) | Threshold ($) (f) | Target ($) (g) | Maximum ($) (h) | ||
| Walter R. White | 3/4/2022 | ||||||
| RSUs (under AEI) | $0 | $1,557,180 | $7,007,310 | ||||
| AIP Award | $0 | $1,038,120 | $1,557,180 | ||||
| Jasmine M. Jirele | 3/4/2022 | ||||||
| RSUs (under AEI) | $0 | $712,202 | $3,204,909 | ||||
| AIP Award | $0 | $474,802 | $949,604 | ||||
| William E. Gaumond | 3/4/2022 | ||||||
| RSUs (under AEI) | $0 | $513,972 | $2,312,874 | ||||
| AIP Award | $0 | $342,648 | $513,972 | ||||
| Eric J. Thomes | 3/4/2022 | ||||||
| RSUs (under AEI) | $0 | $578,340 | $2,602,530 | ||||
| AIP Award | $0 | $385,560 | $578,340 | ||||
| Neil H. McKay | 3/4/2022 | ||||||
| RSUs (under AEI) | $0 | $550,800 | $2,478,600 | ||||
| AIP Award | $0 | $367,200 | $550,800 | ||||
| Gretchen Cepek | 3/4/2022 | ||||||
| RSUs (under AEI) | $0 | $422,550 | $1,901,475 | ||||
| AIP Award | $0 | $281,700 | $422,550 | ||||
| (1) | The target and maximum columns show the target award and maximum award for 2021 for each NEO under the AIP. There is no threshold amount for any participant in the AIP. The actual 2021 awards granted to the NEOs are listed in the Non-Equity Incentive Compensation column of the Summary Compensation Table. AIP target and maximum awards are a pre-designated percentage of base salary determined at the executive’s level. |
| (2) | RSUs have a vesting schedule as disclosed in the footnotes to the Summary Compensation Table. See “Outstanding Equity Awards at December 31, 2021” for disclosure regarding the number of RSUs that are unvested as of December 31, 2021. |
| (3) | The target and maximum columns show the target award and maximum award for 2021 for each NEO under the AEI. There is no threshold amount for any participant in the AEI. The actual 2021 awards granted to the NEOs are listed in the Stock Awards column of the Summary Compensation Table. |
| Name (a) | RSUs | |
| Number of RSUs That Have Not Vested (g)(1,2) | Market Value of RSUs That Have Not Vested (h)(3) | |
| Walter R. White | ||
| 7,030 | $1,637,920 | |
| 5,239 | $1,220,635 | |
| 6,097 | $1,420,540 | |
| 8,139 | $1,896,306 | |
| Jasmine M. Jirele | ||
| 0 | $0 | |
| 1,467 | $341,796 | |
| 1,886 | $439,419 | |
| 2,407 | $560,807 | |
| William E. Gaumond | ||
| 2,039 | $475,067 | |
| 1,538 | $358,339 | |
| 1,948 | $453,865 | |
| 2,463 | $573,854 | |
| Eric J. Thomes | ||
| 492 | $114,631 | |
| 457 | $106,476 | |
| 1,474 | $343,427 | |
| 3,625 | $844,589 | |
| Neil H. McKay | ||
| 2,203 | $513,277 | |
| 1,731 | $403,306 | |
| 2,123 | $494,638 | |
| 2,503 | $583,174 | |
| Gretchen Cepek | ||
| 1,538 | $358,339 | |
| 1,413 | $329,215 | |
| 1,512 | $352,281 | |
| 1,789 | $416,819 | |
| (1) | Represents unvested RSUs issued pursuant to the AEI. RSUs issued under the AEI during 2021 are subject to a four-year vesting period from the grant date. At the end of the respective vesting period, the RSUs are exercised uniformly for all participants, provided they remain employed by Allianz Life or terminate after retirement or early retirement eligibility, or under certain other circumstances. Vesting and exercise may accelerate if a participant leaves employment under other “good leaver” circumstances set forth in the AEI. |
| (2) | For each of the NEOs, the number of RSUs listed on the first line were exercised in 2022, the RSUs listed on the second line will exercise in 2023, the RSUs listed on the third line will exercise in 2024, and the RSUs listed on the fourth line will exercise in 2025. |
| (3) | Based on an assumed stock price of $232.99 per share, which was the arithmetic average of the closing prices of an Allianz SE share in the electronic cash market trading system Xetra (or any successor system) on December 30, 2021 and the nine immediately preceding trading days, converted from Euros into U.S. dollars. |
| Name | Stock Awards | |
| Number of Shares Acquired on Vesting (#) | Value Realized on Vesting ($)(1) | |
| Walter R. White | 8,161 | $2,004,544 |
| Jasmine M. Jirele | - | $0 |
| William E. Gaumond | 1,452 | $356,647 |
| Eric J. Thomes | 617 | $151,551 |
| Neil H. McKay | 2,550 | $626,343 |
| Gretchen Cepek | 1,917 | $470,863 |
| (1) | Represents Allianz SE RSUs that were exercised during 2021 pursuant to the AEI. Amounts realized were paid in cash. |
| NEOs | Lump Sum Payment |
| Walter R. White(1) | $1,730,200 |
| Jasmine M. Jirele | $1,125,000 |
| William E. Gaumond | $713,850 |
| Eric J. Thomes | $803,250 |
| Neil H. McKay | $765,000 |
| Gretchen Cepek | $704,250 |
| (1) | Mr. White is not eligible to receive payments pursuant to the Executive Severance Plan. See “Allianz Life Executive Severance Agreement” for information regarding severance payments that Mr. White is eligible to receive upon termination of service. |
| Name | Fees Earned or Paid in Cash ($)(1) | Total ($) |
| (a) | (b) | (h) |
| Andreas G. Wimmer(2) Chair of the Board | N/A | N/A |
| Jasmine M. Jirele(3) President and Chief Executive Officer | N/A | N/A |
| William E. Gaumond(3) Senior Vice President, Chief Financial Officer and Treasurer | N/A | N/A |
| Walter R. White (3) Former President and Chief Executive Officer; Non-Independent Director | N/A | N/A |
| Anna Sophie Herken(2) Non-Independent Director | N/A | N/A |
| Howard E. Woolley Independent Director | $60,000 | $60,000 |
| Kevin E. Walker Independent Director | $60,000 | $60,000 |
| Udo Frank Independent Director | $90,000 | $90,000 |
| (1) | Represents cash compensation provided to our independent directors that is formalized in the Non-Employee Director Compensation Plan for the year ended December 31, 2021. |
| (2) | Mr. Wimmer (and his predecessor, Jacqueline Hunt) and Ms. Herken did not receive any compensation for their services as directors since they are employed by one of our affiliates. |
| (3) | As employee directors, Ms. Jirele and Messrs. White and Gaumond did not receive any compensation for their service as directors. The compensation Ms. Jirele and Messrs. White and Gaumond received as executive officers of Allianz Life is disclosed in the Summary Compensation Table as set forth herein. |
| • | Difficult Economic Conditions. Our financial condition is materially affected by conditions in the global capital markets and the economy generally. During an economic downturn, the demand for our financial insurance products and services could be adversely affected. In addition, an economic downturn could cause the number and amount of full and partial withdrawals under our insurance products to increase significantly, and owners of our insurance products may choose to defer making purchase payments or paying insurance premiums or stop them altogether. |
| • | Unfavorable Interest Rate Environments. During periods of declining interest rates, we may experience financial losses as the spread between interest rates that we credit to customers under our insurance products and returns on our investments tighten. The ongoing low interest rate environment presents challenges for us and other life insurance companies, as it has generally reduced investment returns, raised the value of future obligations, and challenged asset-liability matching. During periods of increasing interest rates, we may experience financial losses due to increases in full and partial withdrawals under our insurance products as our customers choose to forgo insurance protection in favor of potentially higher returns. Although we take measures to manage economic risks associated with different interest rate environments, we may not be able to fully mitigate those risks. |
| • | Losses on Fixed Maturity Investments. Our fixed maturity investments are subject to interest rate risk and credit risk. Interest rate risk refers to how the values of our fixed maturity investments fluctuate in response to changes in market interest rates. Increases and decreases in prevailing interest rates generally result in decreases and increases, respectively, in the values of our fixed maturity investments. Credit risk refers to the risk that a counterparty will default on its commitments to us under a fixed maturity investment. See “Defaults by Counterparties” below. |
| • | Losses on Equity Investments. Our equity investments are generally valued based on quoted market prices and are subject to market risk. Market risk refers to how market prices for equity investments are subject to fluctuation. A downward fluctuation in the market price for an equity investment could result in losses upon the sale of that investment. Fluctuations in market prices may result from, among other things, actual or perceived changes in the attractiveness of specific investments or in general market conditions. |
| • | Losses on Real Estate Investments. A portion of our investment portfolio consists of mortgage loans and mortgage-backed securities related to commercial, agricultural and residential real estate. The value of our real estate investments may be negatively impacted by general economic conditions in the real estate sector, including supply and demand, market volatility, interest rate fluctuations, and geographic and extreme weather risks, as well as the creditworthiness of obligors. |
| • | Losses upon the Sale of Illiquid Investments. We hold certain investments that may lack liquidity, such as privately placed fixed maturity investments, mortgage loans, collateralized debt obligations, commercial mortgage-backed securities, equity real estate and limited partnership interests. Although we seek to minimize the likelihood that we would need to sell illiquid investments, if we were required to liquidate these investments on short notice, we may have difficulty doing so and may be forced to sell them for less than their fair value. |
| • | Prolonged and Elevated Inflationary Periods. During inflationary periods, the value of our fixed maturity investments may fall, see Losses on Fixed Maturity Investments above. Inflation also increases expenses, which will negatively impact our financial condition in the event that such additional costs cannot be offset. Prolonged and elevated inflation could adversely affect the financial markets and the economy generally, and dispelling it may require governments to pursue a restrictive fiscal and monetary policy, which could constrain overall economic activity and our growth. |
| • | Loss of Market Share to Competitors. There is strong competition among insurers, banks, brokerage firms and other financial institutions and providers seeking clients for the types of products and services that we provide. A loss of market share to our competitors could result in financial losses to our business. Our ability to successfully compete is dependent on numerous factors, some of which include the successful implementation of our business strategy, our financial strength, the attractiveness of our products and services, our relationships with distributors, and our reputation. Our ability to compete may also be hindered if our competitors obtain or seek to enforce intellectual property rights against us, or if we are otherwise precluded from offering products or services that are in demand. Our ability to compete may also be hindered if we are not able to protect or enforce our own intellectual property rights. |
| • | Defaults by Counterparties. Third-parties that owe us money, securities, or other assets may not fulfill their obligations to us. These parties may include issuers of investments that we may hold, borrowers under loans that we may hold or extend, reinsurers, counterparties under swap and other derivative contracts and other third-parties (e.g., customers, trading counterparties, brokers, dealers, banks, investment funds, clearing agents, exchanges and clearing houses). In addition, with respect to secured transactions, the risk of default may be exacerbated when the collateral held by us cannot be liquidated or is liquidated at a price that is not sufficient to cover the full amount owed to us. A party may default on its obligations for a variety of reasons, including bankruptcy, lack of liquidity, downturns in the economy or real estate market and operational failure. General economic conditions and trends may also result in increased defaults. |
| • | Impairments of Other Financial Institutions. We routinely execute transactions with counterparties in the financial services industry, including brokers, dealers, commercial banks, investment banks, insurers, reinsurers and other investment and financial institutions. A disruption to, or decline in the financial condition of, such financial institutions may expose us to financial losses. |
| • | Payments through Guaranty Associations. When an insurance company becomes insolvent, state insurance guaranty associations have the right to assess other insurance companies doing business in their state for funds to pay obligations to policyholders of the insolvent company, up to the state-specified limit of coverage. The future failure of a large life, health or annuity insurer could trigger assessments which we would be obligated to pay. Further, amounts for historical insolvencies may be assessed over many years, and there can be significant uncertainty around the total obligation for a given insolvency. |
| • | Ineffectiveness of Risk Management Policies. Our risk management policies and procedures intended to identify, monitor and manage economic risks may not be fully effective at mitigating our risk exposure in all market environments or against all types of risk. This could cause us to incur investment losses or cause our hedging and other risk management strategies to be ineffective. |
| • | Impacts of Climate Change. We are exposed to economic risks related to climate change. Our financial condition could be negatively impacted by increased costs, or financial losses on investments, arising from various events related to climate change, such as changes in public policy (either contributing to the adverse effects of climate change or promoting adaption to climate change), short-term or long-term market distributions, changes in mortality/morbidity assumptions, changes in consumer behavior, business disruptions, extreme weather events, litigation, increased regulatory requirements, advancements in technology, and longer-term shifts in climate patterns. Climate change could also impact the types of assets in which we invest. For example, as the transition to a lower-carbon, more energy-efficient economy continues, regulators could require us (or we could voluntarily choose) to invest less in carbon-based industries, even though investments in carbon-based industries may have better returns in the short or long term. In addition, real estate investments may expose us to greater climate change risk, as climate change may negatively impact market prices or supply and demand, and may make extreme weather events more likely or frequent. Further, we may not be able to adequately predict and mitigate climate-change risk due to significant uncertainty and unknowns regarding the manifestations and timing of climate-change-driven events, absence of adequate historical data that captures this risk and the dependency of this risk on the extent of the actions taken in the short term by governments, corporations and communities around the world. |
| • | reductions in new sales of insurance products, annuities and other investment products; |
| • | increases in our cost of capital or limitations on our access to sources of capital; |
| • | harm to our relationships with distributors and sales specialists; |
| • | material increases in the number or amount of full and partial withdrawals under our insurance products; |
| • | pressure on us to reduce prices or increase crediting rates for many of our insurance products; and |
| • | harm to our ability to obtain reinsurance or obtain reasonable pricing for reinsurance. |
| • | training and educating our employees regarding our obligations relating to confidential information; |
| • | monitoring changes in state or federal privacy and compliance requirements; |
| • | drafting appropriate contractual provisions into any contract that raises proprietary and confidentiality issues; |
| • | maintaining secure storage facilities for tangible records; |
| • | limiting access to electronic information; and |
| • | in the event of a security breach, providing credit monitoring or other services to affected customers. |
| • | Economic conditions and uncertainties may negatively impact the value, cash flow, and liquidity of our general account investments due to, e.g., declines in markets, market volatility, reduced liquidity, changes in interest rates, economic shutdowns or slowdowns, prolonged elevated inflation period, government regulations, higher unemployment levels, and counterparty defaults. |
| • | Voluntary or government mandated hardship assistance that we provide to our customers in the form of, e.g., grace periods for failure to make timely payments, may reduce our net income and surplus. |
| • | Reductions in new sales of our financial products or reductions in fees collected by us, or increases in full withdrawals, cancellations, or defaults with respect to our customers’ existing financial products, as a result of economic conditions and uncertainties may reduce our net income and surplus. |
| • | Economic conditions and uncertainties may limit our access to sources of capital and our ability to obtain reinsurance. |
| • | Voluntary and government mandated pandemic mitigation efforts, such as prolonged remote working arrangements and economic shutdowns, and employees’ ability or willingness to fulfill their responsibilities during the pandemic, may disrupt our ability to administer our insurance contracts (including our ability to timely process applications, transactions, and payments and to calculate values) and may disrupt the services provided by third-parties upon which we rely to administer our insurance contracts. Extended periods of remote work arrangements could introduce additional operational risk, including but not limited to cybersecurity risks, and impair our ability to effectively manage our business. |
| • | Longer-term deviations from the mortality, customer behavior, expenses, and other assumptions that we use to price our products and support our obligations. |
| • | sponsor, endorse, sell or promote Allianz products. |
| • | recommend that any person invest in Allianz products or any other securities. |
| • | have any responsibility or liability for or make any decisions about the timing, amount or pricing of Allianz products. |
| • | have any responsibility or liability for the administration, management or marketing of Allianz products. |
| • | consider the needs of Allianz products or the owners of Allianz products in determining, composing or calculating the EURO STOXX 50 or have any obligation to do so. |
| • | STOXX, Deutsche Börse Group and their licensors, research partners or data providers do not give any warranty, express or implied, and exclude any liability about: |
| • | The results to be obtained by Allianz products, the owner of Allianz products or any other person in connection with the use of the EURO STOXX 50 and the data included in the EURO STOXX 50; |
| • | The accuracy, timeliness, and completeness of the EURO STOXX 50 and its data; |
| • | The merchantability and the fitness for a particular purpose or use of the EURO STOXX 50 and its data; |
| • | The performance of Allianz products generally. |
| • | STOXX, Deutsche Börse Group and their licensors, research partners or data providers give no warranty and exclude any liability, for any errors, omissions or interruptions in the EURO STOXX 50 or its data; |
| • | Under no circumstances will STOXX, Deutsche Börse Group or their licensors, research partners or data providers be liable (whether in negligence or otherwise) for any lost profits or indirect, punitive, special or consequential damages or losses, arising as a result of such errors, omissions or interruptions in the EURO STOXX 50 or its data or generally in relation to Allianz products, even in circumstances where STOXX, Deutsche Börse Group or their licensors, research partners or data providers are aware that such loss or damage may occur. |
| (i) | any Index gains during the Term subject to the applicable Precision Rate or Cap, |
| (ii) | either any Index losses greater than the 10% or 20% Buffer, or Index losses down to the -10% Floor, and |
| (iii) | the number of days until the Term End Date. |
| (a) | change in Proxy Value = (current Proxy Value – beginning Proxy Value) |
| (b) | proxy interest = beginning Proxy Value x (1 – time remaining during the Term) |
| • The iShares® MSCI Emerging Markets ETF first became available to newly issued Contracts on April 29, 2019, and became available to certain existing Contracts on the first Index Anniversary that occurred on or after August 20, 2019. |
| • The Index Performance Strategy 3-year Term Index Options first became available to newly issued Contracts on May 1, 2020, and became available to certain existing Contracts on the first Index Anniversary that occurred on or after November 23, 2020. |
| • For more information, please see Appendix G. |
| The S&P 500® Index was the only Index available with the Index Protection Strategy prior to May 1, 2018. The Index Protection Strategy with the Russell 2000® Index, Nasdaq-100® Index and EURO STOXX 50® first became available to newly issued Contracts on May 1, 2018, and became available to existing Contracts on the first Index Anniversary that occurred on or after June 4, 2018. For more information, please see Appendix G. |
| Indexes: | S&P 500® Index | Russell 2000® Index | Nasdaq-100® Index | EURO STOXX 50® | iShares® MSCI Emerging Markets ETF | |||||||||||||||
| DPSCs | Lowest | Highest | Lowest | Highest | Lowest | Highest | Lowest | Highest | Lowest | Highest | ||||||||||
| Initial DPSCs | 3.75% | 4.75% | NA | NA | NA | NA | NA | NA | NA | NA | ||||||||||
| 1st Anniversary Renewal DPSCs | 4.00% | 5.10% | 4.10% | 5.20% | 4.10% | 5.20% | 5.20% | 6.40% | NA | NA | ||||||||||
| 2nd Anniversary Renewal DPSCs | 4.10% | 5.30% | 4.10% | 5.40% | 3.90% | 5.30% | 5.30% | 6.50% | 4.30% | 5.60% | ||||||||||
| 3rd Anniversary Renewal DPSCs | 4.20% | 5.40% | 4.40% | 5.40% | 4.30% | 5.30% | 4.60% | 5.80% | 4.50% | 5.70% | ||||||||||
| 4th Anniversary Renewal DPSCs | 4.00% | 5.10% | 4.40% | 5.50% | 4.30% | 5.40% | 4.50% | 5.60% | 4.10% | 5.20% | ||||||||||
| Indexes: | S&P 500® Index | Russell 2000® Index | Nasdaq-100® Index | EURO STOXX 50® | iShares® MSCI Emerging Markets ETF | |||||||||||||||
| DPSCs | Lowest | Highest | Lowest | Highest | Lowest | Highest | Lowest | Highest | Lowest | Highest | ||||||||||
| Initial DPSCs1 | 3.75% | 5.40% | 4.20% | 5.50% | 4.10% | 5.50% | 5.20% | 7.10% | NA | NA | ||||||||||
| 1st Anniversary Renewal DPSCs2 | 4.00% | 5.20% | 4.00% | 5.30% | 4.10% | 5.30% | 4.90% | 6.90% | 4.40% | 5.60% | ||||||||||
| 2nd Anniversary Renewal DPSCs | 4.30% | 5.00% | 4.30% | 5.10% | 4.20% | 5.10% | 4.60% | 6.70% | 4.50% | 5.40% | ||||||||||
| 3rd Anniversary Renewal DPSCs | 4.10% | 4.60% | 4.40% | 5.10% | 4.40% | 4.90% | 4.60% | 5.60% | 4.20% | 4.80% | ||||||||||
| 1 | The initial DPSCs for the Russell 2000® Index, Nasdaq-100® Index and EURO STOXX 50® are for a partial period of June 4, 2018 through January 1, 2019. |
| 2 | The 1st Anniversary Renewal DPSCs for the iShares® MSCI Emerging Markets ETF are for a partial period of June 3, 2019 through January 1, 2020. |
| Indexes: | S&P 500® Index | Russell 2000® Index | Nasdaq-100® Index | EURO STOXX 50® | iShares® MSCI Emerging Markets ETF | |||||||||||||||
| DPSCs | Lowest | Highest | Lowest | Highest | Lowest | Highest | Lowest | Highest | Lowest | Highest | ||||||||||
| Initial DPSCs1 | 3.80% | 5.90% | 3.90% | 5.90% | 3.80% | 5.90% | 4.70% | 7.50% | 4.00% | 5.80% | ||||||||||
| 1st Anniversary Renewal DPSCs | 3.70% | 5.70% | 3.90% | 5.70% | 4.00% | 5.70% | 4.00% | 7.30% | 4.00% | 6.10% | ||||||||||
| 2nd Anniversary Renewal DPSCs | 3.60% | 5.50% | 3.90% | 5.50% | 3.80% | 5.50% | 4.00% | 6.40% | 3.70% | 5.90% | ||||||||||
| 1 | The initial DPSCs for the iShares® MSCI Emerging Markets ETF are for a partial period of April 29, 2019 through January 6, 2020. |
| Indexes: | S&P 500® Index | Russell 2000® Index | Nasdaq-100® Index | EURO STOXX 50® | iShares® MSCI Emerging Markets ETF | |||||||||||||||
| DPSCs | Lowest | Highest | Lowest | Highest | Lowest | Highest | Lowest | Highest | Lowest | Highest | ||||||||||
| Initial DPSCs | 2.30% | 3.80% | 2.40% | 3.80% | 2.30% | 3.70% | 2.40% | 4.50% | 2.40% | 3.90% | ||||||||||
| 1st Anniversary Renewal DPSCs | 1.90% | 3.50% | 2.10% | 3.90% | 2.10% | 3.80% | 2.10% | 4.00% | 2.00% | 3.90% | ||||||||||
| Indexes: | S&P 500® Index | Russell 2000® Index | Nasdaq-100® Index | EURO STOXX 50® | iShares® MSCI Emerging Markets ETF | |||||||||||||||
| DPSCs | Lowest | Highest | Lowest | Highest | Lowest | Highest | Lowest | Highest | Lowest | Highest | ||||||||||
| Initial DPSCs | 2.10% | 3.00% | 2.20% | 3.30% | 2.20% | 3.20% | 2.30% | 3.40% | 2.20% | 3.30% | ||||||||||
| The Index Precision Strategy first became available to newly issued Contracts on November 14, 2017, and became available to existing Contracts on the first Index Anniversary that occurred on or after January 15, 2018. For more information, please see Appendix G. |
| Indexes: | S&P 500® Index | Russell 2000® Index | Nasdaq-100® Index | EURO STOXX 50® | iShares® MSCI Emerging Markets ETF | |||||||||||||||
| Precision Rates | Lowest | Highest | Lowest | Highest | Lowest | Highest | Lowest | Highest | Lowest | Highest | ||||||||||
| Initial Precision Rates1 | 7.00% | 7.25% | 8.75% | 9.00% | 8.25% | 8.25% | 10.75% | 10.75% | NA | NA | ||||||||||
| 1st Anniversary Renewal Precision Rates | 7.60% | 9.95% | 8.20% | 10.45% | 8.80% | 11.50% | 11.00% | 12.70% | NA | NA | ||||||||||
| 2nd Anniversary Renewal Precision Rates | 8.00% | 10.10% | 9.10% | 10.90% | 9.20% | 11.60% | 11.20% | 13.40% | 10.50% | 11.80% | ||||||||||
| 3rd Anniversary Renewal Precision Rates | 11.10% | 14.70% | 12.30% | 16.90% | 12.70% | 17.40% | 11.10% | 15.10% | 11.40% | 15.40% | ||||||||||
| 4th Anniversary Renewal Precision Rates | 9.40% | 10.80% | 11.30% | 13.00% | 10.90% | 12.30% | 10.00% | 11.40% | 10.00% | 12.10% | ||||||||||
| 1 | The initial Precision Rates are for a partial period from November 14, 2017 through January 2, 2018. |
| Indexes: | S&P 500® Index | Russell 2000® Index | Nasdaq-100® Index | EURO STOXX 50® | iShares® MSCI Emerging Markets ETF | |||||||||||||||
| Precision Rates | Lowest | Highest | Lowest | Highest | Lowest | Highest | Lowest | Highest | Lowest | Highest | ||||||||||
| Initial Precision Rates | 7.05% | 10.20% | 8.30% | 11.00% | 8.35% | 12.10% | 10.75% | 13.80% | NA | NA | ||||||||||
| 1st Anniversary Renewal Precision Rates1 | 7.80% | 10.40% | 9.10% | 11.50% | 8.90% | 11.30% | 11.30% | 13.10% | 10.40% | 12.30% | ||||||||||
| 2nd Anniversary Renewal Precision Rates | 8.40% | 13.70% | 9.20% | 15.90% | 9.30% | 15.40% | 10.70% | 14.10% | 10.00% | 14.40% | ||||||||||
| 3rd Anniversary Renewal Precision Rates | 8.80% | 11.80% | 10.80% | 13.70% | 10.00% | 13.20% | 9.10% | 11.70% | 9.60% | 12.50% | ||||||||||
| 1 | The 1st Anniversary Renewal Precision Rates for the iShares® MSCI Emerging Markets ETF are for a partial period of June 3, 2019 through January 1, 2020. |
| Indexes: | S&P 500® Index | Russell 2000® Index | Nasdaq-100® Index | EURO STOXX 50® | iShares® MSCI Emerging Markets ETF | |||||||||||||||
| Precision Rates | Lowest | Highest | Lowest | Highest | Lowest | Highest | Lowest | Highest | Lowest | Highest | ||||||||||
| Initial Precision Rates1 | 8.70% | 11.30% | 9.90% | 11.60% | 9.70% | 13.40% | 11.70% | 14.20% | 10.90% | 12.30% | ||||||||||
| 1st Anniversary Renewal Precision Rates | 8.60% | 13.80% | 9.30% | 16.00% | 9.50% | 15.40% | 10.80% | 14.20% | 10.20% | 14.50% | ||||||||||
| 2nd Anniversary Renewal Precision Rates | 8.70% | 10.80% | 10.50% | 13.20% | 9.70% | 12.40% | 8.70% | 10.80% | 9.40% | 11.90% | ||||||||||
| 1 | The initial Precision Rates for the iShares® MSCI Emerging Markets ETF are for a partial period of April 29, 2019 through January 6, 2020. |
| Indexes: | S&P 500® Index | Russell 2000® Index | Nasdaq-100® Index | EURO STOXX 50® | iShares® MSCI Emerging Markets ETF | |||||||||||||||
| Precision Rates | Lowest | Highest | Lowest | Highest | Lowest | Highest | Lowest | Highest | Lowest | Highest | ||||||||||
| Initial Precision Rates | 8.60% | 13.80% | 9.30% | 16.00% | 9.50% | 15.40% | 10.80% | 14.20% | 10.20% | 14.50% | ||||||||||
| 1st Anniversary Renewal Precision Rates | 8.70% | 10.80% | 10.50% | 13.20% | 9.70% | 12.40% | 8.70% | 10.80% | 9.40% | 11.90% | ||||||||||
| Indexes: | S&P 500® Index | Russell 2000® Index | Nasdaq-100® Index | EURO STOXX 50® | iShares® MSCI Emerging Markets ETF | |||||||||||||||
| Precision Rates | Lowest | Highest | Lowest | Highest | Lowest | Highest | Lowest | Highest | Lowest | Highest | ||||||||||
| Initial Precision Rates | 8.70% | 10.80% | 10.50% | 13.20% | 9.70% | 12.40% | 8.70% | 10.80% | 9.40% | 11.90% | ||||||||||
| Indexes: | S&P 500® Index | Russell 2000® Index | Nasdaq-100® Index | EURO STOXX 50® | iShares® MSCI Emerging Markets ETF | |||||||||||||||
| Caps | Lowest | Highest | Lowest | Highest | Lowest | Highest | Lowest | Highest | Lowest | Highest | ||||||||||
| Initial Caps | 10.50% | 15.00% | 11.75% | 16.00% | 10.00% | 13.50% | 12.25% | 25.00% | NA | NA | ||||||||||
| 1st Anniversary Renewal Caps | 9.75% | 13.50% | 10.50% | 14.00% | 10.00% | 13.25% | 23.00% | 29.00% | NA | NA | ||||||||||
| 2nd Anniversary Renewal Caps | 10.50% | 15.00% | 11.25% | 15.50% | 10.75% | 14.50% | 23.50% | 29.00% | 12.75% | 16.75% | ||||||||||
| 3rd Anniversary Renewal Caps | 10.00% | 14.00% | 10.75% | 14.00% | 10.50% | 13.75% | 17.25% | 23.00% | 12.00% | 16.50% | ||||||||||
| 4th Anniversary Renewal Caps | 9.25% | 13.00% | 12.50% | 16.00% | 11.00% | 15.00% | 17.00% | 25.00% | 13.00% | 17.75% | ||||||||||
| Indexes: | S&P 500® Index | Russell 2000® Index | Nasdaq-100® Index | EURO STOXX 50® | iShares® MSCI Emerging Markets ETF | |||||||||||||||
| Caps | Lowest | Highest | Lowest | Highest | Lowest | Highest | Lowest | Highest | Lowest | Highest | ||||||||||
| Initial Caps | 9.75% | 12.50% | 10.50% | 12.75% | 10.00% | 12.50% | 22.00% | 26.00% | NA | NA | ||||||||||
| 1st Anniversary Renewal Caps1 | 10.50% | 13.75% | 11.25% | 14.00% | 10.75% | 12.75% | 24.50% | 26.50% | 12.75% | 16.00% | ||||||||||
| 2nd Anniversary Renewal Caps | 9.25% | 12.50% | 10.75% | 12.00% | 10.50% | 12.00% | 18.00% | 25.00% | 11.00% | 13.50% | ||||||||||
| 3rd Anniversary Renewal Caps | 8.25% | 10.75% | 11.25% | 13.25% | 10.00% | 12.50% | 14.50% | 22.00% | 11.50% | 14.75% | ||||||||||
| 1 | The 1st Anniversary Renewal Caps for the iShares® MSCI Emerging Markets ETF are for a partial period of June 3, 2019 through January 1, 2020. |
| Indexes: | S&P 500® Index | Russell 2000® Index | Nasdaq-100® Index | EURO STOXX 50® | iShares® MSCI Emerging Markets ETF | |||||||||||||||
| Caps | Lowest | Highest | Lowest | Highest | Lowest | Highest | Lowest | Highest | Lowest | Highest | ||||||||||
| Initial Caps1 | 12.75% | 15.25% | 12.75% | 14.50% | 11.25% | 13.50% | 24.50% | 28.00% | 14.50% | 16.75% | ||||||||||
| 1st Anniversary Renewal Caps | 9.25% | 13.00% | 10.50% | 12.50% | 10.25% | 12.00% | 18.00% | 26.00% | 11.00% | 14.50% | ||||||||||
| 2nd Anniversary Renewal Caps | 8.25% | 9.75% | 11.00% | 12.00% | 10.00% | 11.25% | 14.50% | 20.00% | 10.50% | 12.75% | ||||||||||
| 1 | The initial Caps for the iShares® MSCI Emerging Markets ETF are for a partial period of April 29, 2019 through January 6, 2020. |
| Indexes: | S&P 500® Index | Russell 2000® Index | Nasdaq-100® Index | EURO STOXX 50® | iShares® MSCI Emerging Markets ETF | |||||||||||||||
| Caps | Lowest | Highest | Lowest | Highest | Lowest | Highest | Lowest | Highest | Lowest | Highest | ||||||||||
| Initial Caps | 9.25% | 13.00% | 10.50% | 12.50% | 10.25% | 12.00% | 12.50% | 26.00% | 11.00% | 14.50% | ||||||||||
| 1st Anniversary Renewal Caps | 8.25% | 9.75% | 11.00% | 12.00% | 10.00% | 11.25% | 14.50% | 20.00% | 10.50% | 12.75% | ||||||||||
| Indexes: | S&P 500® Index | Russell 2000® Index | Nasdaq-100® Index | EURO STOXX 50® | iShares® MSCI Emerging Markets ETF | |||||||||||||||
| Caps | Lowest | Highest | Lowest | Highest | Lowest | Highest | Lowest | Highest | Lowest | Highest | ||||||||||
| Initial Caps | 8.25% | 9.75% | 11.00% | 12.00% | 10.00% | 11.25% | 12.50% | 16.50% | 10.50% | 12.75% | ||||||||||
| Indexes: | S&P 500® Index | Russell 2000® Index | Nasdaq-100® Index | EURO STOXX 50® | iShares® MSCI Emerging Markets ETF | |||||||||||||||
| Caps | Lowest | Highest | Lowest | Highest | Lowest | Highest | Lowest | Highest | Lowest | Highest | ||||||||||
| Initial Caps | 10.25% | 14.50% | 13.50% | 18.50% | 10.25% | 14.00% | 15.75% | 25.50% | NA | NA | ||||||||||
| 1st Anniversary Renewal Caps | 12.75% | 17.00% | 13.00% | 17.25% | 13.00% | 17.75% | 24.00% | 31.00% | NA | NA | ||||||||||
| 2nd Anniversary Renewal Caps | 12.50% | 17.75% | 13.75% | 18.00% | 13.25% | 17.75% | 25.50% | 31.00% | 15.50% | 20.00% | ||||||||||
| 3rd Anniversary Renewal Caps | 16.50% | 25.50% | 18.50% | 27.50% | 16.75% | 26.50% | 25.50% | 31.50% | 20.75% | 29.00% | ||||||||||
| 4th Anniversary Renewal Caps | 17.25% | 20.75% | 18.25% | 22.75% | 16.50% | 20.75% | 25.50% | 29.50% | 20.00% | 27.50% | ||||||||||
| Indexes: | S&P 500® Index | Russell 2000® Index | Nasdaq-100® Index | EURO STOXX 50® | iShares® MSCI Emerging Markets ETF | |||||||||||||||
| Caps | Lowest | Highest | Lowest | Highest | Lowest | Highest | Lowest | Highest | Lowest | Highest | ||||||||||
| Initial Caps | 11.50% | 16.25% | 14.25% | 16.75% | 12.00% | 17.00% | 24.00% | 28.00% | NA | NA | ||||||||||
| 1st Anniversary Renewal Caps1 | 12.50% | 16.00% | 13.50% | 17.75% | 12.25% | 16.50% | 26.25% | 28.00% | 15.50% | 23.00% | ||||||||||
| 2nd Anniversary Renewal Caps | 12.75% | 22.50% | 13.25% | 25.75% | 12.50% | 26.25% | 24.00% | 29.50% | 16.50% | 26.00% | ||||||||||
| 3rd Anniversary Renewal Caps | 16.50% | 21.50% | 17.75% | 23.75% | 15.50% | 22.25% | 25.00% | 29.00% | 18.50% | 27.50% | ||||||||||
| 1 | The 1st Anniversary Renewal Caps for the iShares® MSCI Emerging Markets ETF are for a partial period of June 3, 2019 through January 1, 2020. |
| Indexes: | S&P 500® Index | Russell 2000® Index | Nasdaq-100® Index | EURO STOXX 50® | iShares® MSCI Emerging Markets ETF | |||||||||||||||
| Caps | Lowest | Highest | Lowest | Highest | Lowest | Highest | Lowest | Highest | Lowest | Highest | ||||||||||
| Initial Caps1 | 14.25% | 17.25% | 15.00% | 17.75% | 14.25% | 18.50% | 26.50% | 29.00% | 19.00% | 23.00% | ||||||||||
| 1st Anniversary Renewal Caps | 13.75% | 22.25% | 14.00% | 25.75% | 13.50% | 26.25% | 25.00% | 29.50% | 17.50% | 26.00% | ||||||||||
| 2nd Anniversary Renewal Caps | 16.25% | 20.75% | 17.25% | 23.50% | 15.25% | 21.50% | 25.50% | 28.50% | 18.25% | 22.50% | ||||||||||
| 1 | The initial Caps for the iShares® MSCI Emerging Markets ETF are for a partial period of April 29, 2019 through January 6, 2020. |
| Indexes: | S&P 500® Index | Russell 2000® Index | Nasdaq-100® Index | EURO STOXX 50® | iShares® MSCI Emerging Markets ETF | |||||||||||||||
| Caps | Lowest | Highest | Lowest | Highest | Lowest | Highest | Lowest | Highest | Lowest | Highest | ||||||||||
| Initial Caps | 13.75% | 22.25% | 14.00% | 25.75% | 13.50% | 26.25% | 25.00% | 29.50% | 17.50% | 26.00% | ||||||||||
| 1st Anniversary Renewal Caps | 16.25% | 20.75% | 17.25% | 23.50% | 15.25% | 21.50% | 25.50% | 28.50% | 18.25% | 22.50% | ||||||||||
| Indexes: | S&P 500® Index | Russell 2000® Index | Nasdaq-100® Index | EURO STOXX 50® | iShares® MSCI Emerging Markets ETF | |||||||||||||||
| Caps | Lowest | Highest | Lowest | Highest | Lowest | Highest | Lowest | Highest | Lowest | Highest | ||||||||||
| Initial Caps | 16.25% | 20.75% | 17.25% | 23.50% | 15.25% | 21.50% | 25.50% | 28.50% | 18.25% | 22.50% | ||||||||||
| The Index Performance Strategy 3-year Term Index Options first became available to newly issued Contracts on May 1, 2020, and became available to certain existing Contracts on the first Index Anniversary that occurred on or after November 23, 2020. For more information, please see Appendix G. |
| Indexes: | S&P 500® Index | Russell 2000® Index | ||||||
| Caps | Lowest | Highest | Lowest | Highest | ||||
| 3rd Anniversary Renewal Caps1 | 100.00% | 100.00% | 55.00% | 55.00% | ||||
| 4th Anniversary Renewal Caps | 45.00% | 85.00% | 40.00% | 60.00% | ||||
| 1 | The 3rd Anniversary Renewal Caps are for a partial period of November 23, 2020 through January 2, 2021. |
| Indexes: | S&P 500® Index | Russell 2000® Index | ||||||
| Caps | Lowest | Highest | Lowest | Highest | ||||
| 2nd Anniversary Renewal Caps1 | 100.00% | 100.00% | 50.00% | 55.00% | ||||
| 3rd Anniversary Renewal Caps | 45.00% | 100.00% | 40.00% | 50.00% | ||||
| 1 | The 2nd Anniversary Renewal Caps are for a partial period of November 23, 2020 through January 1, 2021. |
| Indexes: | S&P 500® Index | Russell 2000® Index | ||||||
| Caps | Lowest | Highest | Lowest | Highest | ||||
| 1st Anniversary Renewal Caps1 | 100.00% | 100.00% | 50.00% | 55.00% | ||||
| 2nd Anniversary Renewal Caps | 45.00% | 90.00% | 40.00% | 50.00% | ||||
| 1 | The 1st Anniversary Renewal Caps are for a partial period of November 23, 2020 through January 6, 2021. |
| Indexes: | S&P 500® Index | Russell 2000® Index | ||||||
| Caps | Lowest | Highest | Lowest | Highest | ||||
| Initial Caps1 | 75.00% | 100.00% | 50.00% | 80.00% | ||||
| 1st Anniversary Renewal Caps | 45.00% | 90.00% | 40.00% | 50.00% | ||||
| 1 | The initial Caps are for a partial period of May 1, 2020 through January 6, 2021. |
| Indexes: | S&P 500® Index | Russell 2000® Index | ||||||
| Caps | Lowest | Highest | Lowest | Highest | ||||
| Initial Caps | 45.00% | 90.00% | 40.00% | 50.00% | ||||
| The Index Performance Strategy 3-year Term using the S&P 500® Index was not available before May 1, 2020. Therefore, no performance for this Index Option will be included here until after May 1, 2023. For more information, please see Appendix G. |
| Index Effective Date | 5/23/2017- 6/5/2017 | 6/6/2017- 7/4/2017 | 7/5/2017- 7/16/2017 | 7/17/2017- 7/31/2017 | 8/1/2017- 9/5/2017 | 9/6/2017- 10/2/2017 | 10/3/2017- 11/6/2017 | |||||||
| Initial DPSC | 3.75% | 3.75% | 3.75% | 4.75% | 4.75% | 3.75% | 3.75% | |||||||
| 1st Index Year Index Return | 10.12% to 15.40% | 11.29% to 14.71% | 12.50% to 15.09% | 13.28% to 14.89% | 13.61% to 18.57% | 15.54% to 17.16% | 2.33% to 15.42% | |||||||
| 1st Index Anniversary Credit | 3.75% | 3.75% | 3.75% | 4.75% | 4.75% | 3.75% | 3.75% | |||||||
| 1st Anniversary Renewal DPSC | 4.20% | 4.10% | 4.10% | 5.10% | 5.10% | 4.10% | 4.10% | |||||||
| 2nd Index Year Index Return | -0.09% to 12.01% | 2.57% to 10.42% | 6.89% to 9.27% | 5.54% to 7.79% | -0.63% to 4.98% | -1.23% to 4.18% | -0.51% to 15.08% | |||||||
| 2nd Index Anniversary Credit | 0% or 4.20% | 4.10% | 4.10% | 5.10% | 0% or 5.10% | 0% or 4.10% | 0% or 4.10% | |||||||
| 2nd Anniversary Renewal DPSC | 4.20% | 4.10% | 4.30% | 5.30% | 5.20% | 4.30% | 4.10% | |||||||
| 3rd Index Year Index Return | -3.49% to 13.01% | 3.27% to 13.68% | 4.68% to 6.85% | 6.49% to 9.25% | 11.55% to 21.47% | 9.12% to 15.96% | 7.54% to 20.29% | |||||||
| 3rd Index Anniversary Credit | 0% or 4.20% | 4.10% | 4.30% | 5.30% | 5.20% | 4.30% | 4.10% | |||||||
| 3rd Anniversary Renewal DPSC | 4.60% | 4.50% | 4.40% | 5.40% | 5.40% | 4.20% | 4.20% | |||||||
| 4th Index Year Index Return | 32.33% to 47.49% | 30.76% to 42.59% | 36.60% to 38.96% | 30.96% to 37.53% | 28.28% to 34.25% | 28.43% to 35.48% | 23.10% to 39.89% | |||||||
| 4th Index Anniversary Credit | 4.60% | 4.50% | 4.40% | 5.40% | 5.40% | 4.20% | 4.20% |
| Index Effective Date | 11/7/2017- 12/4/2017 | 12/5/2017- 1/2/2018 | 1/3/2018- 2/5/2018 | 2/6/2018- 3/5/2018 | 3/6/2018- 4/2/2018 | 4/3/2018- 4/30/2018 | 5/1/2018- 6/4/2018 | |||||||
| Initial DPSC | 3.75% | 3.75% | 3.75% | 3.85% | 3.90% | 3.95% | 4.20% | |||||||
| 1st Index Year Index Return | 1.37% to 8.62% | -12.38% to 2.68% | -9.77% to 3.35% | 0.51% to 4.92% | -0.12% to 11.05% | 7.17% to 11.18% | 0.36% to 12.01% | |||||||
| 1st Index Anniversary Credit | 3.75% | 0% or 3.75% | 0% or 3.75% | 3.85% | 0% or 3.90% | 3.95% | 4.20% | |||||||
| 1st Anniversary Renewal DPSC | 4.00% | 4.20% | 4.00% | 4.10% | 4.20% | 4.20% | 4.20% | |||||||
| 2nd Index Year Index Return | 9.64% to 19.03% | 15.46% to 37.13% | 19.23% to 32.15% | 6.10% to 23.79% | -21.63% to 7.25% | -13.39% to -0.89% | -3.49% to 11.34% | |||||||
| 2nd Index Anniversary Credit | 4.00% | 4.20% | 4.00% | 4.10% | 0% or 4.20% | 0% | 0% or 4.20% | |||||||
| 2nd Anniversary Renewal DPSC | 4.40% | 4.30% | 4.30% | 4.30% | 4.40% | 4.50% | 4.60% | |||||||
| 3rd Index Year Index Return | 14.17% to 18.84% | 13.59% to 18.43% | 13.17% to 18.86% | 14.92% to 32.08% | 28.56% to 76.12% | 44.83% to 63.86% | 35.91% to 48.11% | |||||||
| 3rd Index Anniversary Credit | 4.40% | 4.30% | 4.30% | 4.30% | 4.40% | 4.50% | 4.60% | |||||||
| 3rd Anniversary Renewal DPSC | 4.30% | 4.20% | ||||||||||||
| 4th Index Year Index Return | 23.22% to 32.42% | 23.15% to 29.61% | ||||||||||||
| 4th Index Anniversary Credit | 4.30% | 4.20% |
| The Index Precision Strategy was not available before November 14, 2017. The Buffer was 10% for all time periods. For Index Anniversaries with a range of Credits, any positive Credit cannot be less than the stated positive number. |
| Index Effective Date | 11/14/2017- 12/4/2017 | 12/5/2017- 1/2/2018 | 1/3/2018- 2/5/2018 | 2/6/2018- 3/5/2018 | 3/6/2018- 4/2/2018 | 4/3/2018- 4/30/2018 | 5/1/2018- 6/4/2018 | |||||||
| Initial Precision Rate | 7.00% | 7.25% | 7.25% | 7.05% | 8.70% | 8.35% | 9.95% | |||||||
| 1st Index Year Index Return | 1.37% to 8.62% | -12.38% to 2.68% | -9.77% to 3.35% | 0.51% to 4.92% | -0.12% to 11.05% | 7.17% to 11.18% | 0.36% to 12.01% | |||||||
| 1st Index Anniversary Credit | 7.00% | -2.38% to 7.25% | 0% or 7.25% | 7.05% | 0% or 8.70% | 8.35% | 9.95% | |||||||
| 1st Anniversary Renewal Precision Rate | 8.20% | 9.20% | 9.30% | 9.00% | 8.80% | 8.20% | 8.00% | |||||||
| 2nd Index Year Index Return | 9.64% to 19.03% | 15.46% to 37.13% | 19.23% to 32.15% | 6.10% to 23.79% | -21.63% to 7.25% | -13.39% to -0.89% | -3.49% to 11.34% | |||||||
| 2nd Index Anniversary Credit | 8.20% | 9.20% | 9.30% | 9.00% | -11.63% to 8.80% | -3.39% to 0.00% | 0% or 8.00% | |||||||
| 2nd Anniversary Renewal Precision Rate | 9.70% | 9.00% | 9.20% | 8.40% | 8.50% | 11.20% | 13.00% | |||||||
| 3rd Index Year Index Return | 14.17% to 18.84% | 13.59% to 18.43% | 13.17% to 18.86% | 14.92% to 32.08% | 28.56% to 76.12% | 44.83% to 63.86% | 35.91% to 48.11% | |||||||
| 3rd Index Anniversary Credit | 9.70% | 9.00% | 9.20% | 8.40% | 8.50% | 11.20% | 13.00% | |||||||
| 3rd Anniversary Renewal Precision Rate | 13.60% | 11.10% | ||||||||||||
| 4th Index Year Index Return | 23.22% to 32.42% | 23.15% to 29.61% | ||||||||||||
| 4th Index Anniversary Credit | 13.60% | 11.10% |
| Index Effective Date | 6/5/2018- 7/2/2018 | 7/3/2018- 8/6/2018 | 8/7/2018- 9/4/2018 | 9/5/2018- 10/1/2018 | 10/2/2018- 11/5/2018 | 11/6/2018- 12/3/2018 | ||||||
| Initial Precision Rate | 8.60% | 8.00% | 8.00% | 8.20% | 8.50% | 8.90% | ||||||
| 1st Index Year Index Return | 2.57% to 9.03% | 0.15% to 10.42% | -0.95% to 3.70% | 0.54% to 4.18% | -1.23% to 14.32% | 9.64% to 19.03% | ||||||
| 1st Index Anniversary Credit | 8.60% | 8.00% | 0% or 8.00% | 8.20% | 0% or 8.50% | 8.90% | ||||||
| 1st Anniversary Renewal Precision Rate | 8.40% | 9.10% | 7.80% | 9.80% | 10.40% | 10.10% | ||||||
| 2nd Index Year Index Return | 3.27% to 13.68% | 4.48% to 16.22% | 14.38% to 21.47% | 9.12% to 15.15% | 7.54% to 20.29% | 14.06% to 18.54% | ||||||
| 2nd Index Anniversary Credit | 8.40% | 9.10% | 7.80% | 9.80% | 10.40% | 10.10% | ||||||
| 2nd Anniversary Renewal Precision Rate | 13.00% | 12.90% | 13.70% | 12.70% | 13.20% | 13.40% | ||||||
| 3rd Index Year Index Return | 30.76% to 42.59% | 30.96% to 39.05% | 29.10% to 32.82% | 28.88% to 37.24% | 23.10% to 39.89% | 23.77% to 33.97% | ||||||
| 3rd Index Anniversary Credit | 13.00% | 12.90% | 13.70% | 12.70% | 13.20% | 13.40% |
| The Floor was -10% for all time periods |
| Index Effective Date | 5/23/2017- 6/5/2017 | 6/6/2017- 7/4/2017 | 7/5/2017- 7/16/2017 | 7/17/2017- 7/31/2017 | 8/1/2017- 9/5/2017 | 9/6/2017- 10/2/2017 | 10/3/2017- 11/6/2017 | |||||||
| Initial Cap | 11.50% | 12.00% | 12.00% | 15.00% | 15.00% | 12.25% | 10.75% | |||||||
| 1st Index Year Index Return | 10.12% to 15.40% | 11.29% to 14.71% | 12.50% to 15.09% | 13.28% to 14.89% | 13.61% to 18.57% | 15.54% to 17.16% | 2.33% to 15.42% | |||||||
| 1st Index Anniversary Credit | 10.12% to 11.50% | 11.29% to 12.00% | 12.00% | 13.28% to 14.89% | 13.61% to 15.00% | 12.25% | 2.33% to 10.75% | |||||||
| 1st Anniversary Renewal Cap | 10.75% | 10.75% | 10.50% | 13.50% | 13.25% | 10.25% | 10.00% | |||||||
| 2nd Index Year Index Return | -0.09% to 12.01% | 2.57% to 10.42% | 6.89% to 9.27% | 5.54% to 7.79% | -0.63% to 4.98% | -1.23% to 4.18% | -0.51% to 15.08% | |||||||
| 2nd Index Anniversary Credit | -0.09% to 10.75% | 2.57% to 10.42% | 6.89% to 9.27% | 5.54% to 7.79% | -0.63% to 4.98% | -1.23% to 4.18% | -0.51% to 10.00% | |||||||
| 2nd Anniversary Renewal Cap | 11.00% | 10.50% | 12.00% | 15.00% | 14.25% | 11.75% | 12.00% | |||||||
| 3rd Index Year Index Return | -3.49% to 13.01% | 3.27% to 13.68% | 4.68% to 6.85% | 6.49% to 9.25% | 11.55% to 21.47% | 9.12% to 15.96% | 7.54% to 20.29% | |||||||
| 3rd Index Anniversary Credit | -3.49% to 11.00% | 3.27% to 10.50% | 4.68% to 6.85% | 6.49% to 9.25% | 11.55% to 14.25% | 9.12% to 11.75% | 7.54% to 12.00% | |||||||
| 3rd Anniversary Renewal Cap | 11.50% | 11.00% | 10.75% | 13.75% | 14.00% | 10.25% | 10.00% | |||||||
| 4th Index Year Index Return | 32.33% to 47.49% | 30.76% to 42.59% | 36.60% to 38.96% | 30.96% to 37.53% | 28.28% to 34.25% | 28.43% to 35.48% | 23.10% to 39.89% | |||||||
| 4th Index Anniversary Credit | 11.50% | 11.00% | 10.75% | 13.75% | 14.00% | 10.25% | 10.00% |
| Index Effective Date | 11/7/2017- 12/4/2017 | 12/5/2017- 1/2/2018 | 1/3/2018- 2/5/2018 | 2/6/2018- 3/5/2018 | 3/6/2018- 4/2/2018 | 4/3/2018- 4/30/2018 | 5/1/2018- 6/4/2018 | |||||||
| Initial Cap | 11.00% | 10.50% | 10.25% | 10.50% | 10.00% | 9.75% | 10.75% | |||||||
| 1st Index Year Index Return | 1.37% to 8.62% | -12.38% to 2.68% | -9.77% to 3.35% | 0.51% to 4.92% | -0.12% to 11.05% | 7.17% to 11.18% | 0.36% to 12.01% | |||||||
| 1st Index Anniversary Credit | 1.37% to 8.62% | -10.00% to 2.68% | -9.77% to 3.35% | 0.51% to 4.92% | -0.12% to 10.00% | 7.17% to 9.75% | 0.36% to 10.75% | |||||||
| 1st Anniversary Renewal Cap | 9.75% | 10.50% | 10.75% | 11.00% | 11.50% | 11.00% | 11.00% | |||||||
| 2nd Index Year Index Return | 9.64% to 19.03% | 15.46% to 37.13% | 19.23% to 32.15% | 6.10% to 23.79% | -21.63% to 7.25% | -13.39% to -0.89% | -3.49% to 11.34% | |||||||
| 2nd Index Anniversary Credit | 9.64% to 9.75% | 10.50% | 10.75% | 6.10% to 11.00% | -10.00% to 7.25% | -10.00% to -0.89% | -3.49% to 11.00% | |||||||
| 2nd Anniversary Renewal Cap | 11.75% | 11.75% | 11.50% | 11.00% | 12.50% | 11.75% | 11.50% | |||||||
| 3rd Index Year Index Return | 14.17% to 18.84% | 13.59% to 18.43% | 13.17% to 18.86% | 14.92% to 32.08% | 28.56% to 76.12% | 44.83% to 63.86% | 35.91% to 48.11% | |||||||
| 3rd Index Anniversary Credit | 11.75% | 11.75% | 11.50% | 11.00% | 12.50% | 11.75% | 11.50% | |||||||
| 3rd Anniversary Renewal Cap | 10.50% | 10.50% | ||||||||||||
| 4th Index Year Index Return | 23.22% to 32.42% | 23.15% to 29.61% | ||||||||||||
| 4th Index Anniversary Credit | 10.50% | 10.50% |
| The Buffer was 10% for all time periods. |
| Index Effective Date | 5/23/2017- 6/5/2017 | 6/6/2017- 7/4/2017 | 7/5/2017- 7/16/2017 | 7/17/2017- 7/31/2017 | 8/1/2017- 9/5/2017 | 9/6/2017- 10/2/2017 | 10/3/2017- 11/6/2017 | |||||||
| Initial Cap | 11.75% | 11.50% | 11.50% | 14.50% | 14.50% | 10.25% | 11.25% | |||||||
| 1st Index Year Index Return | 10.12% to 15.40% | 11.29% to 14.71% | 12.50% to 15.09% | 13.28% to 14.89% | 13.61% to 18.57% | 15.54% to 17.16% | 2.33% to 15.42% | |||||||
| 1st Index Anniversary Credit | 10.12% to 11.75% | 11.29% to 11.50% | 11.50% | 13.28% to 14.50% | 13.61% to 14.50% | 10.25% | 2.33% to 11.25% | |||||||
| 1st Anniversary Renewal Cap | 15.50% | 15.00% | 14.00% | 17.00% | 17.00% | 12.75% | 13.00% | |||||||
| 2nd Index Year Index Return | -0.09% to 12.01% | 2.57% to 10.42% | 6.89% to 9.27% | 5.54% to 7.79% | -0.63% to 4.98% | -1.23% to 4.18% | -0.51% to 15.08% | |||||||
| 2nd Index Anniversary Credit | 0% to 12.01% | 2.57% to 10.42% | 6.89% to 9.27% | 5.54% to 7.79% | 0% to 4.98% | 0% to 4.18% | 0% to 13.00% | |||||||
| 2nd Anniversary Renewal Cap | 12.50% | 13.25% | 14.75% | 17.75% | 16.25% | 13.00% | 13.50% | |||||||
| 3rd Index Year Index Return | -3.49% to 13.01% | 3.27% to 13.68% | 4.68% to 6.85% | 6.49% to 9.25% | 11.55% to 21.47% | 9.12% to 15.96% | 7.54% to 20.29% | |||||||
| 3rd Index Anniversary Credit | 0% to 12.50% | 3.27% to 13.25% | 4.68% to 6.85% | 6.49% to 9.25% | 11.55% to 16.25% | 9.12% to 13.00% | 7.54% to 13.50% | |||||||
| 3rd Anniversary Renewal Cap | 16.50% | 17.00% | 19.75% | 22.75% | 25.50% | 21.50% | 21.75% | |||||||
| 4th Index Year Index Return | 32.33% to 47.49% | 30.76% to 42.59% | 36.60% to 38.96% | 30.96% to 37.53% | 28.28% to 34.25% | 28.43% to 35.48% | 23.10% to 39.89% | |||||||
| 4th Index Anniversary Credit | 16.50% | 17.00% | 19.75% | 22.75% | 25.50% | 21.50% | 21.75% |
| Index Effective Date | 11/7/2017- 12/4/2017 | 12/5/2017- 1/2/2018 | 1/3/2018- 2/5/2018 | 2/6/2018- 3/5/2018 | 3/6/2018- 4/2/2018 | 4/3/2018- 4/30/2018 | 5/1/2018- 6/4/2018 | |||||||
| Initial Cap | 11.50% | 11.50% | 11.50% | 11.50% | 13.75% | 13.25% | 15.50% | |||||||
| 1st Index Year Index Return | 1.37% to 8.62% | -12.38% to 2.68% | -9.77% to 3.35% | 0.51% to 4.92% | -0.12% to 11.05% | 7.17% to 11.18% | 0.36% to 12.01% | |||||||
| 1st Index Anniversary Credit | 1.37% to 8.62% | -2.38% to 2.68% | 0% to 3.35% | 0.51% to 4.92% | 0% to 11.05% | 7.17% to 11.18% | 0.36% to 12.01% | |||||||
| 1st Anniversary Renewal Cap | 13.00% | 13.50% | 13.00% | 14.25% | 12.75% | 12.50% | 12.50% | |||||||
| 2nd Index Year Index Return | 9.64% to 19.03% | 15.46% to 37.13% | 19.23% to 32.15% | 6.10% to 23.79% | -21.63% to 7.25% | -13.39% to -0.89% | -3.49% to 11.34% | |||||||
| 2nd Index Anniversary Credit | 9.64% to 13.00% | 13.50% | 13.00% | 6.10% to 14.25% | -11.63% to 7.25% | -3.39% to 0.00% | 0% to 11.34% | |||||||
| 2nd Anniversary Renewal Cap | 14.25% | 14.25% | 13.75% | 13.25% | 12.75% | 15.25% | 16.50% | |||||||
| 3rd Index Year Index Return | 14.17% to 18.84% | 13.59% to 18.43% | 13.17% to 18.86% | 14.92% to 32.08% | 28.56% to 76.12% | 44.83% to 63.86% | 35.91% to 48.11% | |||||||
| 3rd Index Anniversary Credit | 14.17% to 14.25% | 13.59% to 14.25% | 13.17% to 13.75% | 13.25% | 12.75% | 15.25% | 16.50% | |||||||
| 3rd Anniversary Renewal Cap | 22.25% | 20.50% | ||||||||||||
| 4th Index Year Index Return | 23.22% to 32.42% | 23.15% to 29.61% | ||||||||||||
| 4th Index Anniversary Credit | 22.25% | 20.50% |
| The Alternate Minimum Value continues to be available to Contracts issued in Pennsylvania. For all other states, the Alternate Minimum Value became unavailable to Contracts: |
| • issued in California, Hawaii, Indiana, Montana, Nebraska, and Rhode Island on or after January 27, 2020; and |
| • issued in all other states on or after November 18, 2019. |
| We use 70% if your Contract was issued in …. | We use 87.5% if your Contract was issued in …. |
| • Pennsylvania from April 29, 2019 to February 21, 2020, • California and Montana on or after July 22, 2019 • New Hampshire on or after June 24, 2019 • any other state on or after April 29, 2019 | • Pennsylvania before April 29, 2019, or on or after February 24, 2020, • California and Montana before July 22, 2019 • New Hampshire before June 24, 2019 • any other state before April 29, 2019 |
| Crediting Method / Index Options | Availability Restrictions: | |
| Index Protection Strategy | – Not available to Contracts issued in Washington or Missouri on or before November 15, 2019 | |
| Index Protection Strategy with the Russell 2000® Index, Nasdaq-100® Index, and EURO STOXX 50® | – These first became available to newly issued Contracts on May 1, 2018, and to inforce Contracts on the first Index Anniversary that occurred on or after June 4, 2018. | |
| Index Precision Strategy | – This first became available to newly issued Contracts on November 14, 2017, and to inforce Contracts on the first Index Anniversary that occurred on or after January 15, 2018. | |
| iShares® MSCI Emerging Markets ETF with the Index Protection Strategy, Index Precision Strategy, Index Guard Strategy, and Index Performance Strategy 1-year Term | – For Contracts issued in California and Montana, these first became available to newly issued Contracts on July 22, 2019. – For Contracts issued in New Hampshire, these first became available to newly issued Contracts on June 24, 2019. – For Contracts issued in all other states, these first became available to newly issued Contracts on April 29, 2019. – For Contracts issued before April 29, 2019, these first became available on the first Index Anniversary that occurred on or after June 3, 2019. | |
| Index Performance Strategy 3-year Term | – For Contracts issued in Virginia, these first became available to newly issued Contracts on May 19, 2020. – For Contracts issued in Montana, these first became available to newly issued Contracts on June 23, 2020. – For Contracts issued in Pennsylvania, these first became available to newly issued Contracts on July 21, 2020. – For Contracts issued in all other states, it first became available to newly issued Contracts on May 1, 2020. – For Contracts issued in New Hampshire these first became available to newly issued Contracts on June 21, 2021, and became available to inforce Contracts on the first Index Anniversary that occurred on or after June 21, 2021. – For Contracts issued before May 1, 2020, in all other states these first became available on the first Index Anniversary that occurred on or after November 23, 2020. |
| CONTRACTS WITHOUT THE INDEX PROTECTION STRATEGY: If in future years the renewal Cap and Precision Rates are not acceptable to you, you will not be able to transfer into the Index Protection Strategy and take advantage of its principal protection. This would subject you to ongoing market risk and you could lose principal and previous earnings. |
| ISSUE STATE | FEATURE AND BENEFITS | VARIATION |
| California | Assignments, Changes of Ownership and Other Transfers of Contract Rights See section 2 | We cannot restrict assignments or changes of ownership • We do not change the Determining Life (Lives) following an assignment or ownership change. If you assign the Contract and the Determining Life (Lives) are no longer an Owner (or Annuitant if the Owner is a non-individual) the Traditional Death Benefit or Maximum Anniversary Value Death Benefit may not be available and on the Owner’s death the Beneficiary(s) will only receive the Contract Value. |
| Free Look/Right to Examine Period See section 3 | For Owners age 60 or older (or Annuitants age 60 or older for non-individually owned Contracts), we are required to allocate your initial Purchase Payment to the AZL Government Money Market Fund during the 30 day free look period unless you specify otherwise on the appropriate form. If you want to immediately apply your Purchase Payment to the Index Options or other Variable Options you must opt out of this allocation. If you do not opt out of this allocation to the AZL Government Money Market Fund your Index Effective Date cannot occur until the free look period has ended. | |
| Connecticut | Assignments, Changes of Ownership and Other Transfers of Contract Rights See section 2 | We can only restrict assignments to settlement companies and institutional investors as described in your Contract. • We do not change the Determining Life (Lives) following an assignment or ownership change. If you assign the Contract and the Determining Life (Lives) are no longer an Owner (or Annuitant if the Owner is a non-individual) the Traditional Death Benefit or Maximum Anniversary Value Death Benefit may not be available and on the Owner’s death the Beneficiary(s) will only receive the Contract Value. |
| Delaware | Our Unregistered Separate Account See section 12 | All of the assets backing the Index Precision Strategy, Index Guard Strategy and Index Performance Strategy Index Options are allocated to Separate Account IANA. We do not move assets between the general account and Separate Account IANA for Contracts issued in Delaware. |
| Florida | Withdrawal Charges See Fee Tables and section 6 | The total withdrawal charge on a partial or full withdrawal cannot be greater than 10% of the Contract Value withdrawn. |
| Assignments, Changes of Ownership and Other Transfers of Contract Rights See section 2 | We cannot restrict assignments or changes of ownership • We do not change the Determining Life (Lives) following an assignment or ownership change. If you assign the Contract and the Determining Life (Lives) are no longer an Owner (or Annuitant if the Owner is a non-individual) the Traditional Death Benefit or Maximum Anniversary Value Death Benefit may not be available and on the Owner’s death the Beneficiary(s) will only receive the Contract Value. | |
| Purchase Requirements See section 3 | We can only decline a Purchase Payment if it would cause total Purchase Payments to be more than $1 million, or if it would otherwise violate the Purchase Payment restrictions of your Contract (for example, we do not allow additional Purchase Payments on or after the Annuity Date). | |
| When Annuity Payments Begin See section 8 | The earliest acceptable Annuity Date is one year after the Issue Date. | |
| Maryland | Purchase Requirements See section 3 | We can only decline a Purchase Payment if it would cause total Purchase Payments to be more than $1 million, or if it would otherwise violate the Purchase Payment restrictions of your Contract (for example, we do not allow additional Purchase Payments on or after the Annuity Date). |
| ISSUE STATE | FEATURE AND BENEFITS | VARIATION |
| Massachusetts | Waiver of Withdrawal Charge Benefit See section 7 | The waiver of withdrawal charge benefit is not available. |
| Mississippi | Purchase Requirements See section 3 | • For Contracts issued before November 18, 2019: We do not accept additional Purchase Payments on or after the first Contract Anniversary. We also limit the amount of additional Purchase Payments you can make on or after the first Quarterly Contract Anniversary to the amount of total Purchase Payments we received before the first Quarterly Contract Anniversary. • For Contracts issued on or after November 18, 2019: Each Contract Year that we allow additional Purchase Payments you cannot add more than your initial amount without our prior approval. Your initial amount is all Purchase Payments received before the first Quarterly Contract Anniversary of the first Contract Year. We do not allow additional Purchase Payments on or after the tenth Contract Anniversary. However, we allow you to add up to the initial amount in the remainder of the first Contract Year (the first Quarterly Contract Anniversary to the last Business Day before the first Contract Anniversary). |
| Missouri | Our Unregistered Separate Account See section 12 | All of the assets backing the Index Precision Strategy, Index Guard Strategy and Index Performance Strategy Index Options are allocated to Separate Account IANA. We do not move assets between the general account and Separate Account IANA for Contracts issued in Missouri. |
| Montana | Access to Your Money See section 7 | If you take a partial withdrawal that reduces the Contract Value below $2,000, we contact you by phone and give you the option of modifying your withdrawal request. If we cannot reach you, we process your request as a full withdrawal. |
| New Hampshire | Waiver of Withdrawal Charge Benefit See section 7 | The definition of nursing home is an institution operated in accordance with state law. |
| New Jersey | Assignments, Changes of Ownership and Other Transfers of Contract Rights See section 2 | We cannot restrict assignments or changes of ownership. • We do not change the Determining Life (Lives) following an assignment or ownership change. If you assign the Contract and the Determining Life (Lives) are no longer an Owner (or Annuitant if the Owner is a non-individual) the Traditional Death Benefit or Maximum Anniversary Value Death Benefit may not be available and on the Owner’s death the Beneficiary(s) will only receive the Contract Value. |
| Purchase Requirements See section 3 | The maximum total Purchase Payments that we can accept is $1 million. We can only decline a Purchase Payment if it would cause total Purchase Payments to be more than $1 million, or if it would otherwise violate the Purchase Payment restrictions of your Contract (for example, we do not allow additional Purchase Payments on or after the Annuity Date). | |
| Ohio | Assignments, Changes of Ownership and Other Transfers of Contract Rights See section 2 | We cannot restrict assignments or changes of ownership. • We do not change the Determining Life (Lives) following an assignment or ownership change. If you assign the Contract and the Determining Life (Lives) are no longer an Owner (or Annuitant if the Owner is a non-individual) the Traditional Death Benefit or Maximum Anniversary Value Death Benefit may not be available and on the Owner’s death the Beneficiary(s) will only receive the Contract Value. |
| ISSUE STATE | FEATURE AND BENEFITS | VARIATION |
| Pennsylvania | Waiver of Withdrawal Charge Benefit See section 7 | The waiver is not available if on the Issue Date, an Owner was confined to a nursing home or was already diagnosed with a terminal illness. Also, the nursing home confinement requirement is a total of 90 days within a six month period. These 90 days do not need to be consecutive. |
| Assignments, Changes of Ownership and Other Transfers of Contract Rights See section 2 | We cannot restrict assignments or changes of ownership. • We do not change the Determining Life (Lives) following an assignment or ownership change. If you assign the Contract and the Determining Life (Lives) are no longer an Owner (or Annuitant if the Owner is a non-individual) the Traditional Death Benefit or Maximum Anniversary Value Death Benefit may not be available and on the Owner’s death the Beneficiary(s) will only receive the Contract Value. | |
| Texas | Purchase Requirements See section 3 | • For Contracts issued from April 29, 2019 through November 15, 2019: We do not accept additional Purchase Payments on or after the first Contract Anniversary. • For Contracts issued on or after November 18, 2019: We do not accept additional Purchase Payments on or after the tenth Contract Anniversary. |
| Access to Your Money See section 7 | We only treat a partial withdrawal that reduces the Contract Value below $2,000 as a full withdrawal if you have not made an additional Purchase Payment in the past two calendar years. | |
| Our Unregistered Separate Account See section 12 | For Contracts issued before May 1, 2020: We hold all assets that you allocate to the Index Precision Strategy, Index Guard Strategy and Index Performance Strategy Index Options that are not invested in the general account in an unregistered, non-unitized, insulated separate account (Separate Account IATX). Separate Account IATX is structured differently from Separate Account IANA. Unlike Separate Account IANA, Separate Account IATX is for the exclusive benefit of persons purchasing a Contract in the State of Texas. Separate Account IATX is insulated from the claims of creditors and Contract purchasers are given priority with regard to Separate Account IATX’s assets over Contract purchasers from other states as well as general creditors. Separate Account IATX was established under Minnesota law for the benefit of Texas Contract purchasers. Separate Account IATX supports our obligations to pay Performance Credits to Texas Contract Owners. Allocations and reallocations to and from the Separate Account IATX are managed in the same manner as Separate Account IANA. Neither Texas Contract purchasers nor these Index Options participate in any way in the performance of assets held in Separate Account IATX. | |
| Utah | Purchase Requirements See section 3 | • For Contracts issued before November 18, 2019: We do not accept additional Purchase Payments on or after the first Contract Anniversary. • For Contracts issued on or after November 18, 2019: We do not accept additional Purchase Payments on or after the tenth Contract Anniversary. |
| Washington | Assignments, Changes of Ownership and Other Transfers of Contract Rights See section 2 | We cannot restrict assignments or changes of ownership. • We do not change the Determining Life (Lives) following an assignment or ownership change. If you assign the Contract and the Determining Life (Lives) are no longer an Owner (or Annuitant if the Owner is a non-individual) the Traditional Death Benefit or Maximum Anniversary Value Death Benefit may not be available and on the Owner’s death the Beneficiary(s) will only receive the Contract Value. |
| ISSUE STATE | FEATURE AND BENEFITS | VARIATION |
| Washington (continued) | Our Unregistered Separate Account See section 12 | All of the assets backing the Index Precision Strategy, Index Guard Strategy and Index Performance Strategy Index Options are allocated to Separate Account IANA. We do not move assets between the general account and Separate Account IANA for Contracts issued in Washington. |
| Wisconsin | Assignments, Changes of Ownership and Other Transfers of Contract Rights See section 2 | We cannot restrict assignments or changes of ownership. • We do not change the Determining Life (Lives) following an assignment or ownership change. If you assign the Contract and the Determining Life (Lives) are no longer an Owner (or Annuitant if the Owner is a non-individual) the Traditional Death Benefit or Maximum Anniversary Value Death Benefit may not be available and on the Owner’s death the Beneficiary(s) will only receive the Contract Value. |
| Investment Objectives | Variable Option and Adviser/Subadviser | Current Expenses | Average Annual Total Returns (as of December 31, 2021) | ||
| 1 Year | 5 Years | 10 Years | |||
| Current income consistent with stability of principal | AZL® Government Money Market Fund(1) Adviser: Allianz Investment Management LLC Subadviser: BlackRock Advisors, LLC | 0.64% | 0.00% | 0.53% | 0.27% |
| Long-term capital appreciation with preservation of capital as an important consideration | AZL® MVP Balanced Index Strategy Fund(2) Adviser: Allianz Investment Management LLC | 0.71% | 10.02% | 7.73% | 7.20% |
| Long-term capital appreciation | AZL® MVP Growth Index Strategy Fund(2) Adviser: Allianz Investment Management LLC | 0.68% | 16.40% | 9.77% | 9.23% |
| (1) | The AZL® Government Money Market Fund’s annual expenses reflect a temporary fee reduction. Please see the AZL® Government Money Market Fund’s prospectus for information regarding the expense reimbursement or fee waiver arrangement. |
| (2) | This Variable Option is managed in a way that is intended to minimize volatility of returns (referred to as a “managed volatility strategy”). Please see “Principal Risks – Managed Volatility Fund Risk” in the prospectus and the Investment Option’s prospectus for more information. |
| Part I | ||||||||
| Year ended December 31, | ||||||||||||||||||||||||||||||||
| Selected income data | 2021 | 2020 | 2019 | 2018 | 2017 | |||||||||||||||||||||||||||
| Premium and annuity considerations* | $ | 14,291 | 10,542 | 13,029 | 12,193 | 10,231 | ||||||||||||||||||||||||||
| Net investment income | 4,866 | 4,864 | 4,839 | 4,593 | 4,504 | |||||||||||||||||||||||||||
| Ceded reinsurance reserve and expense adjustments | 639 | (45) | 329 | 245 | 612 | |||||||||||||||||||||||||||
| Fees from separate accounts | 574 | 567 | 613 | 676 | 719 | |||||||||||||||||||||||||||
| Other income | (32) | 694 | (13) | (3) | 150 | |||||||||||||||||||||||||||
| Total income | 20,338 | 16,622 | 18,797 | 17,704 | 16,216 | |||||||||||||||||||||||||||
| Policyholder benefits and surrenders | 10,876 | 10,343 | 10,368 | 9,436 | 8,649 | |||||||||||||||||||||||||||
| Change in aggregate reserves | 4,316 | 2,465 | 1,034 | 7,299 | 10,628 | |||||||||||||||||||||||||||
| General and administrative and commission | 2,195 | 1,739 | 1,878 | 1,770 | 1,616 | |||||||||||||||||||||||||||
| Net transfers to separate accounts | 2,424 | 1,460 | 5,254 | (2,009) | (1,851) | |||||||||||||||||||||||||||
| Total benefits and other expenses | 19,811 | 16,007 | 18,534 | 16,496 | 19,042 | |||||||||||||||||||||||||||
| Income tax expense (benefit) | 1,091 | 18 | 773 | (51) | 24 | |||||||||||||||||||||||||||
| Net realized capital gain (loss) | 1,856 | 142 | 1,053 | (490) | 3,655 | |||||||||||||||||||||||||||
| Net income (loss) | $ | 1,292 | 739 | 543 | 769 | 805 | ||||||||||||||||||||||||||
| Capital and Surplus: | ||||||||||||||||||||||||||||||||
| Change in unrealized capital gain (loss) | $ | (142) | (61) | 719 | (230) | (78) | ||||||||||||||||||||||||||
| Dividends to parent | (900) | (750) | (325) | — | (780) | |||||||||||||||||||||||||||
| Other change in capital & surplus | 2,794 | (220) | 441 | 26 | (101) | |||||||||||||||||||||||||||
| Net change in capital & surplus | $ | 3,044 | (292) | 1,378 | 565 | (154) | ||||||||||||||||||||||||||
| *Includes premiums and annuity and supplementary contract considerations. | ||||||||||||||||||||||||||||||||
| As of December 31, | ||||||||||||||||||||||||||||||||
| Selected balance sheet data | 2021 | 2020 | 2019 | 2018 | 2017 | |||||||||||||||||||||||||||
| Total cash and invested assets | $ | 122,829 | 125,229 | 121,870 | 117,203 | 109,328 | ||||||||||||||||||||||||||
| Investment income due and accrued | 947 | 1,040 | 1,031 | 1,047 | 1,004 | |||||||||||||||||||||||||||
| Other admitted assets | 1,480 | 1,218 | 945 | 951 | 982 | |||||||||||||||||||||||||||
| Separate account assets | 48,279 | 45,901 | 34,638 | 22,835 | 26,755 | |||||||||||||||||||||||||||
| Total admitted assets | 173,535 | 173,388 | 158,484 | 142,036 | 138,069 | |||||||||||||||||||||||||||
| Total policyholder liabilities | 103,933 | 109,353 | 107,098 | 107,118 | 100,433 | |||||||||||||||||||||||||||
| Other liabilities | 10,618 | 10,473 | 8,794 | 5,507 | 4,869 | |||||||||||||||||||||||||||
| Separate account liabilities | 48,279 | 45,901 | 34,638 | 22,835 | 26,755 | |||||||||||||||||||||||||||
| Total liabilities | 162,830 | 165,727 | 150,530 | 135,460 | 132,057 | |||||||||||||||||||||||||||
| Total capital and surplus | 10,705 | 7,661 | 7,954 | 6,576 | 6,011 | |||||||||||||||||||||||||||
| Year ended December 31, | Increase (decrease) and % change | Increase (decrease) and % change | |||||||||||||||||||||||||||||||||||||||
| 2021 | 2020 | 2019 | 2021 - 2020 | 2020 - 2019 | |||||||||||||||||||||||||||||||||||||
| Income: | |||||||||||||||||||||||||||||||||||||||||
| Premium and annuity considerations* | $ | 14,291 | 10,542 | 13,029 | 3,749 | 35.6 | % | $ | (2,487) | (19.1) | % | ||||||||||||||||||||||||||||||
| Net investment income | 4,866 | 4,864 | 4,839 | 2 | — | 25 | 0.5 | ||||||||||||||||||||||||||||||||||
| Ceded reinsurance reserve and expense adjustments | 639 | (45) | 329 | 684 | (1,520.0) | (374) | (113.7) | ||||||||||||||||||||||||||||||||||
| Fees from separate accounts | 574 | 567 | 613 | 7 | 1.2 | (46) | (7.5) | ||||||||||||||||||||||||||||||||||
| Other income | (32) | 694 | (13) | (726) | (104.6) | 707 | 5,438.5 | ||||||||||||||||||||||||||||||||||
| Total income | 20,338 | 16,622 | 18,797 | 3,716 | 22.4 | % | (2,175) | (11.6) | % | ||||||||||||||||||||||||||||||||
| Benefits and other expenses: | |||||||||||||||||||||||||||||||||||||||||
| Policyholder benefits and surrenders | 10,876 | 10,343 | 10,368 | 533 | 5.2 | % | (25) | (0.2) | % | ||||||||||||||||||||||||||||||||
| Change in aggregate reserves | 4,316 | 2,465 | 1,034 | 1,851 | 75.1 | 1,431 | 138.4 | ||||||||||||||||||||||||||||||||||
| General and administrative and commission | 2,195 | 1,739 | 1,878 | 456 | 26.2 | (139) | (7.4) | ||||||||||||||||||||||||||||||||||
| Net transfers to separate accounts | 2,424 | 1,460 | 5,254 | 964 | 66.0 | (3,794) | (72.2) | ||||||||||||||||||||||||||||||||||
| Total benefits and other expenses | 19,811 | 16,007 | 18,534 | 3,804 | 23.8 | (2,527) | (13.6) | ||||||||||||||||||||||||||||||||||
| Pretax income (loss) | 527 | 615 | 263 | (88) | (14.3) | 352 | 133.8 | ||||||||||||||||||||||||||||||||||
| Income tax expense (benefit) | 1,091 | 18 | 773 | 1,073 | 5,961.1 | (755) | (97.7) | ||||||||||||||||||||||||||||||||||
| Net realized capital gain (loss) | 1,856 | 142 | 1,053 | 1,714 | 1,207.0 | (911) | (86.5) | ||||||||||||||||||||||||||||||||||
| Net income (loss) | $ | 1,292 | 739 | 543 | 553 | 74.8 | % | $ | 196 | 36.1 | % | ||||||||||||||||||||||||||||||
| Capital and Surplus: | |||||||||||||||||||||||||||||||||||||||||
| Change in unrealized capital gain (loss) | $ | (142) | (61) | 719 | (81) | (132.8) | % | $ | (780) | (108.5) | % | ||||||||||||||||||||||||||||||
| Dividends to parent | (900) | (750) | (325) | (150) | (20.0) | (425) | (130.8) | ||||||||||||||||||||||||||||||||||
| Other change in capital & surplus | 2,794 | (220) | 441 | 3,014 | 1,370.0 | (661) | (149.9) | ||||||||||||||||||||||||||||||||||
| Net change in capital & surplus | $ | 3,044 | (292) | 1,378 | 3,336 | 1,142.5 | % | $ | (1,670) | (121.2) | % | ||||||||||||||||||||||||||||||
| *Includes premiums and annuity and supplementary contract considerations. | |||||||||||||||||||||||||||||||||||||||||
| **Not meaningful | |||||||||||||||||||||||||||||||||||||||||
| Year ended December 31, | Increase (decrease) and % change | Increase (decrease) and % change | |||||||||||||||||||||||||||||||||||||||
| 2021 | 2020 | 2019 | 2021 - 2020 | 2020 - 2019 | |||||||||||||||||||||||||||||||||||||
| Income: | |||||||||||||||||||||||||||||||||||||||||
| Premium and annuity considerations* | $ | 12,766 | 9,268 | 11,969 | $ | 3,498 | 37.7 | % | $ | (2,701) | (22.6) | % | |||||||||||||||||||||||||||||
| Net investment income | 4,467 | 4,531 | 4,551 | (64) | (1.4) | (20) | (0.4) | ||||||||||||||||||||||||||||||||||
| Ceded reinsurance reserve and expense adjustments | 656 | (54) | 321 | 710 | 1,314.8 | (375) | (116.8) | ||||||||||||||||||||||||||||||||||
| Fees from separate accounts | 574 | 567 | 613 | 7 | 1.2 | (46) | (7.5) | ||||||||||||||||||||||||||||||||||
| Other income | (37) | 691 | (17) | (728) | (105.4) | 708 | 4,164.7 | ||||||||||||||||||||||||||||||||||
| Total income | 18,426 | 15,003 | 17,437 | 3,423 | 22.8 | (2,434) | (14.0) | ||||||||||||||||||||||||||||||||||
| Benefits and other expenses: | |||||||||||||||||||||||||||||||||||||||||
| Policyholder benefits and surrenders | 10,584 | 10,073 | 10,078 | 511 | 5.1 | (5) | — | ||||||||||||||||||||||||||||||||||
| Change in aggregate reserves | 2,789 | 1,474 | 289 | 1,315 | 89.2 | 1,185 | 410.0 | ||||||||||||||||||||||||||||||||||
| General and administrative and commission | 1,756 | 1,369 | 1,591 | 387 | 28.3 | (222) | (14.0) | ||||||||||||||||||||||||||||||||||
| Net transfers to separate accounts | 2,426 | 1,462 | 5,258 | 964 | 65.9 | (3,796) | (72.2) | ||||||||||||||||||||||||||||||||||
| Total benefits and other expenses | 17,555 | 14,378 | 17,216 | 3,177 | 22.1 | (2,838) | (16.5) | ||||||||||||||||||||||||||||||||||
| Pretax income (loss) | 871 | 625 | 221 | 246 | 39.4 | 404 | 182.8 | ||||||||||||||||||||||||||||||||||
| Income tax expense (benefit) | 1,802 | 18 | 649 | 1,784 | 9,911.1 | (631) | (97.2) | ||||||||||||||||||||||||||||||||||
| Net realized capital gain (loss) | 1,519 | 67 | 922 | 1,452 | 2,167.2 | (855) | (92.7) | ||||||||||||||||||||||||||||||||||
| Net income (loss) | $ | 588 | 674 | 494 | $ | (86) | (12.8) | % | $ | 180 | 36.4 | % | |||||||||||||||||||||||||||||
| Capital and Surplus: | |||||||||||||||||||||||||||||||||||||||||
| Change in unrealized capital gain (loss) | $ | (125) | (79) | 588 | $ | (46) | (58.2) | % | $ | (667) | (113.4) | % | |||||||||||||||||||||||||||||
| Other change in capital & surplus | 2,792 | (220) | 439 | 3,012 | 1,369.1 | (659) | (150.1) | ||||||||||||||||||||||||||||||||||
| Net change in capital & surplus | $ | 3,255 | 375 | 1,521 | $ | 2,880 | 768.0 | % | $ | (1,146) | (75.3) | % | |||||||||||||||||||||||||||||
| *Includes premiums and annuity and supplementary contract considerations. | |||||||||||||||||||||||||||||||||||||||||
| Year ended December 31, | Increase (decrease) and % change | Increase (decrease) and % change | |||||||||||||||||||||||||||||||||||||||
| 2021 | 2020 | 2019 | 2021 - 2020 | 2020 - 2019 | |||||||||||||||||||||||||||||||||||||
| Individual Annuities | |||||||||||||||||||||||||||||||||||||||||
| Deposits | $ | 13,226 | 9,474 | 12,135 | 3,752 | 39.6 | % | (2,661) | (21.9) | % | |||||||||||||||||||||||||||||||
| In-force | 141,131 | 131,228 | 126,936 | 9,903 | 7.5 | % | 4,292 | 3.4 | % | ||||||||||||||||||||||||||||||||
| Year ended December 31, | % change | ||||||||||||||||||||||||||||
| 2021 | 2020 | 2019 | 2020 - 2019 | 2019 - 2018 | |||||||||||||||||||||||||
| Stock Index | |||||||||||||||||||||||||||||
| S&P 500 | 26.89% | 16.26% | 28.88% | 10.63% | (12.62)% | ||||||||||||||||||||||||
| NASDAQ 100 | 26.63% | 47.58% | 37.96% | (20.95)% | 9.62% | ||||||||||||||||||||||||
| BUDBI | 6.35% | 9.08% | 13.23% | (2.73)% | (4.15)% | ||||||||||||||||||||||||
| BUDBI II | 4.60% | 6.15% | 14.05% | (1.55)% | (7.90)% | ||||||||||||||||||||||||
| As of December 31, | Basis point (bps) change | ||||||||||||||||||||||||||||
| 2021 | 2020 | 2019 | 2020- 2019 | 2019 - 2018 | |||||||||||||||||||||||||
| Interest Rates | |||||||||||||||||||||||||||||
| Swap rate - 10 year | 1.58% | 0.93% | 1.90% | 65bps | (97bps) | ||||||||||||||||||||||||
| Swap rate - 20 year | 1.76% | 1.32% | 2.07% | 44bps | (75bps) | ||||||||||||||||||||||||
| Year ended December 31, | Increase (decrease) and % change | Increase (decrease) and % change | |||||||||||||||||||||||||||||||||||||||
| 2021 | 2020 | 2019 | 2021 - 2020 | 2020 - 2019 | |||||||||||||||||||||||||||||||||||||
| Income: | |||||||||||||||||||||||||||||||||||||||||
| Premium and annuity considerations | $ | 1,363 | 1,115 | 906 | $ | 248 | 22.2 | % | $ | 209 | 23.1 | % | |||||||||||||||||||||||||||||
| Net investment income | 259 | 210 | 177 | 49 | 23.3 | 33 | 18.6 | ||||||||||||||||||||||||||||||||||
| Ceded reinsurance reserve and expense adjustments | (23) | 3 | 2 | (26) | (866.7) | 1 | 50.0 | ||||||||||||||||||||||||||||||||||
| Other income | 3 | 2 | 3 | 1 | 50.0 | (1) | (33.3) | ||||||||||||||||||||||||||||||||||
| Total income | 1,602 | 1,330 | 1,088 | 272 | 20.5 | 242 | 22.2 | ||||||||||||||||||||||||||||||||||
| Benefits and other expenses: | |||||||||||||||||||||||||||||||||||||||||
| Policyholder benefits and surrenders | 194 | 173 | 199 | 21 | 12.1 | (26) | (13.1) | ||||||||||||||||||||||||||||||||||
| Change in aggregate reserves | 1,216 | 824 | 611 | 392 | 47.6 | 213 | 34.9 | ||||||||||||||||||||||||||||||||||
| General and administrative and commission | 386 | 343 | 258 | 43 | 12.5 | 85 | 32.9 | ||||||||||||||||||||||||||||||||||
| Total benefits and other expenses | 1,796 | 1,340 | 1,068 | 456 | 34.0 | 272 | 25.5 | ||||||||||||||||||||||||||||||||||
| Pretax income (loss) | (194) | (10) | 20 | (184) | (1,840.0) | (30) | (150.0) | ||||||||||||||||||||||||||||||||||
| Income tax expense (benefit) | (401) | — | 59 | (401) | — | (59) | — | ||||||||||||||||||||||||||||||||||
| Net realized capital gain (loss) | 337 | 77 | 131 | 260 | 337.7 | (54) | (41.2) | ||||||||||||||||||||||||||||||||||
| Net income (loss) | $ | 544 | 67 | 92 | $ | 477 | 711.9 | % | $ | (25) | (27.2) | % | |||||||||||||||||||||||||||||
| Capital and Surplus: | |||||||||||||||||||||||||||||||||||||||||
| Change in unrealized capital gain (loss) | $ | (9) | 23 | 130 | $ | (32) | (139.1) | % | $ | (107) | (82.3) | % | |||||||||||||||||||||||||||||
| Other change in capital & surplus | 1 | (4) | 4 | 5 | 125.0 | (8) | (200.0) | ||||||||||||||||||||||||||||||||||
| Net change in capital & surplus | $ | 536 | 86 | 226 | $ | 450 | 523.3 | % | $ | (140) | (61.9) | % | |||||||||||||||||||||||||||||
| *Not meaningful | |||||||||||||||||||||||||||||||||||||||||
| Year ended December 31, | Increase (decrease) and % change | Increase (decrease) and % change | |||||||||||||||||||||||||||||||||||||||
| 2021 | 2020 | 2019 | 2021 - 2020 | 2020 - 2019 | |||||||||||||||||||||||||||||||||||||
| Life | |||||||||||||||||||||||||||||||||||||||||
| First year and renewal premiums | $ | 1,426 | 1,170 | 960 | $ | 256 | 21.9 | % | $ | 210 | 21.9 | % | |||||||||||||||||||||||||||||
| In-force | 62,372 | 50,485 | 42,700 | 11,887 | 23.5 | 7,785 | 18.2 | ||||||||||||||||||||||||||||||||||
| Year ended December 31, | Increase (decrease) and % change | Increase (decrease) and % change | |||||||||||||||||||||||||||||||||||||||
| 2021 | 2020 | 2019 | 2021 - 2020 | 2020 - 2019 | |||||||||||||||||||||||||||||||||||||
| Income: | |||||||||||||||||||||||||||||||||||||||||
| Premium and annuity considerations | $ | 162 | 158 | 154 | $ | 4 | 2.5 | % | $ | 4 | 2.6 | % | |||||||||||||||||||||||||||||
| Net investment income | 140 | 123 | 110 | 17 | 13.8 | 13 | 11.8 | ||||||||||||||||||||||||||||||||||
| Ceded reinsurance reserve and expense adjustments | 6 | 6 | 7 | — | — | (1) | (14.3) | ||||||||||||||||||||||||||||||||||
| Other income | 2 | 2 | 2 | — | — | — | — | ||||||||||||||||||||||||||||||||||
| Total income | 310 | 289 | 273 | 21 | 7.3 | 16 | 5.9 | ||||||||||||||||||||||||||||||||||
| Benefits and other expenses: | |||||||||||||||||||||||||||||||||||||||||
| Policyholder benefits and surrenders | 98 | 97 | 91 | 1 | 1.0 | 6 | 6.6 | ||||||||||||||||||||||||||||||||||
| Change in aggregate reserves | 311 | 167 | 134 | 144 | 86.2 | 33 | 24.6 | ||||||||||||||||||||||||||||||||||
| General and administrative and commission | 52 | 27 | 29 | 25 | 92.6 | (2) | (6.9) | ||||||||||||||||||||||||||||||||||
| Net transfers to separate accounts | (2) | (2) | (3) | — | — | 1 | 33.3 | ||||||||||||||||||||||||||||||||||
| Total benefits and other expenses | 459 | 289 | 251 | 170 | 58.8 | 38 | 15.1 | ||||||||||||||||||||||||||||||||||
| Pretax income (loss) | (149) | — | 22 | (149) | NM* | (22) | (100.0) | ||||||||||||||||||||||||||||||||||
| Income tax expense (benefit) | (310) | — | 65 | (310) | NM* | (65) | (100.0) | ||||||||||||||||||||||||||||||||||
| Net realized capital gain (loss) | — | (2) | — | 2 | 100.0 | % | (2) | NM* | |||||||||||||||||||||||||||||||||
| Net income (loss) | $ | 161 | (2) | (43) | $ | 163 | 8,150.0 | % | $ | 41 | 95.3 | % | |||||||||||||||||||||||||||||
| Capital and Surplus: | |||||||||||||||||||||||||||||||||||||||||
| Change in unrealized capital gain (loss) | $ | (8) | (5) | 1 | $ | (3) | (60.0) | % | $ | (6) | (600.0) | % | |||||||||||||||||||||||||||||
| Other change in capital & surplus | 1 | 2 | (2) | (1) | (50.0) | 4 | 200.0 | ||||||||||||||||||||||||||||||||||
| Net change in capital & surplus | $ | 154 | (5) | (44) | $ | 159 | 3,180.0 | % | $ | 39 | 88.6 | % | |||||||||||||||||||||||||||||
| *Not meaningful | |||||||||||||||||||||||||||||||||||||||||
| Year ended December 31, | Increase (decrease) and % change | Increase (decrease) and % change | |||||||||||||||||||||||||||||||||||||||
| 2021 | 2020 | 2019 | 2021 - 2020 | 2020 - 2019 | |||||||||||||||||||||||||||||||||||||
| Legacy Products | |||||||||||||||||||||||||||||||||||||||||
| Gross premiums written | $ | 258 | 257 | 254 | $ | 1 | 0.4 | % | $ | 3 | 1.2 | % | |||||||||||||||||||||||||||||
| In-force | 2,611 | 2,796 | 2,993 | (185) | (6.6) | (197) | (6.6) | ||||||||||||||||||||||||||||||||||
| Year ended December 31, | Increase (decrease) and % change | Increase (decrease) and % change | |||||||||||||||||||||||||||||||||||||||
| 2021 | 2020 | 2019 | 2021 - 2020 | 2020 - 2019 | |||||||||||||||||||||||||||||||||||||
| Capital and Surplus: | |||||||||||||||||||||||||||||||||||||||||
| Dividends to parent | $ | (900) | (750) | (325) | $ | (150) | 120.0 | % | $ | (425) | (230.8) | % | |||||||||||||||||||||||||||||
| 2021 | 2020 | ||||||||||||||||||||||
| Carrying value | % of total | Carrying value | % of total | ||||||||||||||||||||
| Bonds | $ | 93,817 | 76.4 | % | $ | 99,088 | 79.1 | % | |||||||||||||||
| Stocks | 303 | 0.2 | 274 | 0.2 | |||||||||||||||||||
| Investment in subsidiaries | 1,477 | 1.2 | 1,329 | 1.1 | |||||||||||||||||||
| Mortgage loans on real estate | 17,154 | 14.0 | 15,634 | 12.5 | |||||||||||||||||||
| Real estate | 80 | 0.1 | 69 | 0.1 | |||||||||||||||||||
| Cash and cash equivalents | 3,215 | 2.6 | 910 | 0.7 | |||||||||||||||||||
| Policy loans | 267 | 0.2 | 255 | 0.2 | |||||||||||||||||||
| Derivative assets | 2,682 | 2.2 | 4,114 | 3.3 | |||||||||||||||||||
| Other invested assets | 3,834 | 3.1 | 3,556 | 2.8 | |||||||||||||||||||
| Total cash and invested assets | $ | 122,829 | 100.0 | % | $ | 125,229 | 100.0 | % | |||||||||||||||
| 2021 | |||||||||||||||||||||||
| NAIC Classes | Fair Value | % of Total | Amortized Cost | % of Total | |||||||||||||||||||
| 1 | $ | 57,937 | 55.5 | % | $ | 52,287 | 55.7 | % | |||||||||||||||
| 2 | 43,792 | 41.9 | 39,053 | 41.7 | |||||||||||||||||||
| Investment grade | 101,729 | 97.4 | 91,340 | 97.4 | |||||||||||||||||||
| 3 | 2,470 | 2.4 | 2,242 | 2.4 | |||||||||||||||||||
| 4 | 187 | 0.2 | 208 | 0.2 | |||||||||||||||||||
| 5 | 1 | — | 1 | — | |||||||||||||||||||
| 6 | 26 | — | 26 | — | |||||||||||||||||||
| Below investment grade | 2,684 | 2.6 | 2,477 | 2.6 | |||||||||||||||||||
| Total | $ | 104,413 | 100.0 | % | $ | 93,817 | 100.0 | % | |||||||||||||||
| 2020 | |||||||||||||||||||||||
| NAIC Classes | Fair Value | % of Total | Amortized Cost | % of Total | |||||||||||||||||||
| 1 | 64,466 | 55.7 | % | $ | 55,379 | 55.9 | % | ||||||||||||||||
| 2 | 47,679 | 41.2 | $ | 40,472 | 40.9 | ||||||||||||||||||
| Investment grade | 112,145 | 96.9 | $ | 95,851 | 96.8 | ||||||||||||||||||
| 3 | 3,323 | 2.9 | $ | 2,982 | 3.0 | ||||||||||||||||||
| 4 | 221 | 0.2 | $ | 232 | 0.2 | ||||||||||||||||||
| 5 | 18 | — | $ | 20 | — | ||||||||||||||||||
| 6 | 3 | — | $ | 3 | — | ||||||||||||||||||
| Below investment grade | 3,565 | 3.1 | $ | 3,237 | 3.2 | ||||||||||||||||||
| Total | $ | 115,710 | 100.0 | % | $ | 99,088 | 100.0 | % | |||||||||||||||
| 2021 | ||||||||||||||||||||||||||
| NAIC Classes | % of total CMBS | Vintage | ||||||||||||||||||||||||
| 1 | $ | 9,725 | 100.0 | % | 2021 | $ | 597 | 6.1 | % | |||||||||||||||||
| 2 | 1 | — | 2020 | 365 | 3.8 | |||||||||||||||||||||
| 3 | 3 | — | 2019 | 1,426 | 14.7 | |||||||||||||||||||||
| 4 | — | — | 2018 | 1,405 | 14.4 | |||||||||||||||||||||
| 5 | — | — | 2017 and prior | 5,936 | 61.0 | |||||||||||||||||||||
| 6 | — | — | $ | 9,729 | 100.0 | % | ||||||||||||||||||||
| $ | 9,729 | 100.0 | % | |||||||||||||||||||||||
| 2020 | ||||||||||||||||||||||||||
| NAIC Classes | % of total CMBS | Vintage | ||||||||||||||||||||||||
| 1 | $ | 11,234 | 99.5 | % | 2020 | $ | 335 | 3.0 | % | |||||||||||||||||
| 2 | 1 | — | 2019 | 1,607 | 14.2 | |||||||||||||||||||||
| 3 | 47 | 0.4 | 2018 | 1,845 | 16.3 | |||||||||||||||||||||
| 4 | 15 | 0.1 | 2017 | 1,627 | 14.4 | |||||||||||||||||||||
| 5 | — | — | 2016 and prior | 5,883 | 52.1 | |||||||||||||||||||||
| 6 | — | — | $ | 11,297 | 100.0 | % | ||||||||||||||||||||
| $ | 11,297 | 100.0 | % | |||||||||||||||||||||||
| 2021 | ||||||||||||||||||||||||||
| NAIC Classes | % of total other ABS | Vintage | ||||||||||||||||||||||||
| 1 | $ | 4,823 | 74.0 | % | 2021 | $ | 3,600 | 55.3 | % | |||||||||||||||||
| 2 | 1,470 | 22.6 | 2020 | 610 | 9.4 | |||||||||||||||||||||
| 3 | 74 | 1.1 | 2019 | 583 | 8.8 | |||||||||||||||||||||
| 4 | 147 | 2.3 | 2018 | 903 | 13.9 | |||||||||||||||||||||
| 5 | — | — | 2017 and prior | 818 | 12.6 | |||||||||||||||||||||
| 6 | — | — | $ | 6,514 | 100.0 | % | ||||||||||||||||||||
| $ | 6,514 | 100.0 | % | |||||||||||||||||||||||
| 2020 | ||||||||||||||||||||||||||
| NAIC Classes | % of total other ABS | Vintage | ||||||||||||||||||||||||
| 1 | $ | 2,883 | 70.6 | % | 2020 | $ | 758 | 18.6 | % | |||||||||||||||||
| 2 | 976 | 23.9 | 2019 | 1,264 | 30.9 | |||||||||||||||||||||
| 3 | 74 | 1.8 | 2018 | 1,094 | 26.8 | |||||||||||||||||||||
| 4 | 134 | 3.3 | 2017 | 302 | 7.4 | |||||||||||||||||||||
| 5 | 18 | 0.4 | 2016 and prior | 667 | 16.3 | |||||||||||||||||||||
| 6 | — | — | $ | 4,085 | 100.0 | % | ||||||||||||||||||||
| $ | 4,085 | 100.0 | % | |||||||||||||||||||||||
| 2021 | ||||||||||||||||||||||||||
| NAIC Classes | % of total NA RMBS | Vintage | ||||||||||||||||||||||||
| 1 | $ | 206 | 96.3 | % | 2021 | $ | — | — | % | |||||||||||||||||
| 2 | — | — | 2020 | — | — | |||||||||||||||||||||
| 3 | 2 | 0.9 | 2019 | — | — | |||||||||||||||||||||
| 4 | 3 | 1.4 | 2018 | — | — | |||||||||||||||||||||
| 5 | — | — | 2017 and prior | 214 | 100.0 | |||||||||||||||||||||
| 6 | 3 | 1.4 | $ | 214 | 100.0 | % | ||||||||||||||||||||
| $ | 214 | 100.0 | % | |||||||||||||||||||||||
| 2020 | ||||||||||||||||||||||||||
| NAIC Classes | % of total NA RMBS | Vintage | ||||||||||||||||||||||||
| 1 | $ | 222 | 95.3 | % | 2020 | $ | — | — | % | |||||||||||||||||
| 2 | $ | — | — | 2019 | $ | — | — | |||||||||||||||||||
| 3 | $ | 4 | 1.7 | 2018 | $ | — | — | |||||||||||||||||||
| 4 | $ | 4 | 1.7 | 2017 | $ | — | — | |||||||||||||||||||
| 5 | $ | — | — | 2016 and prior | $ | 233 | 100.0 | |||||||||||||||||||
| 6 | $ | 3 | 1.3 | $ | 233 | 100.0 | % | |||||||||||||||||||
| $ | 233 | 100.0 | % | |||||||||||||||||||||||
| 2021 | |||||||||||||||||||||||
| Investment Grade | % of Total | Below Investment Grade | % of Total | ||||||||||||||||||||
| Twelve months or less below carrying value | $ | 239 | 66.1 | % | $ | 21 | 5.9 | % | |||||||||||||||
| More than twelve months below carrying value | 79 | 21.9 | 22 | 6.1 | |||||||||||||||||||
| Total | $ | 318 | 88.0 | % | $ | 43 | 12.0 | % | |||||||||||||||
| 2020 | |||||||||||||||||||||||
| Investment Grade | % of Total | Below Investment Grade | % of Total | ||||||||||||||||||||
| Twelve months or less below carrying value | $ | 66 | 58.8 | % | $ | 31 | 27.6 | % | |||||||||||||||
| More than twelve months below carrying value | 10 | 9.3 | 5 | 4.3 | |||||||||||||||||||
| Total | $ | 76 | 68.1 | % | $ | 36 | 31.9 | % | |||||||||||||||
| 2021 | 2020 | ||||||||||||||||||||||
| Impairment | No. of Securities | Impairment | No. of Securities | ||||||||||||||||||||
| Partnerships | $ | 6 | 2 | $ | 1 | 1 | |||||||||||||||||
| Commercial mortgage loans | 8 | 1 | 34 | 1 | |||||||||||||||||||
| Corporate securities | 13 | 8 | 254 | 83 | |||||||||||||||||||
| Total | $ | 27 | 11 | $ | 289 | 85 | |||||||||||||||||
| 2021 | 2020 | ||||||||||||||||||||||
| Gross Carry Value | % of Total | Gross Carry Value | % of Total | ||||||||||||||||||||
| Commerical Mortgage Loans by region | |||||||||||||||||||||||
| East North Central | $ | 1,442 | 9.2 | % | $ | 1,244 | 8.4 | % | |||||||||||||||
| East South Central | 399 | 2.5 | 375 | 2.5 | |||||||||||||||||||
| Middle Atlantic | 1,352 | 8.6 | 1,249 | 8.4 | |||||||||||||||||||
| Mountain | 1,539 | 9.8 | 1,506 | 10.1 | |||||||||||||||||||
| New England | 678 | 4.3 | 652 | 4.4 | |||||||||||||||||||
| Pacific | 4,493 | 28.5 | 4,258 | 28.6 | |||||||||||||||||||
| South Atlantic | 3,520 | 22.4 | 3,599 | 24.2 | |||||||||||||||||||
| West North Central | 887 | 5.6 | 674 | 4.5 | |||||||||||||||||||
| West South Central | 1,438 | 9.1 | 1,314 | 8.8 | |||||||||||||||||||
| Total commercial mortgage loans | $ | 15,748 | 100.0 | % | $ | 14,871 | 100.0 | % | |||||||||||||||
| 2021 | 2020 | ||||||||||||||||||||||
| Gross Carry Value | % of Total | Gross Carry Value | % of Total | ||||||||||||||||||||
| Residential Mortgage Loans by region | |||||||||||||||||||||||
| East North Central | $ | 80 | 5.7 | % | $ | 21 | 2.8 | % | |||||||||||||||
| East South Central | 27 | 1.9 | 8 | 1.0 | |||||||||||||||||||
| Middle Atlantic | 233 | 16.6 | 91 | 11.9 | |||||||||||||||||||
| Mountain | 176 | 12.5 | 76 | 10.0 | |||||||||||||||||||
| New England | 68 | 4.8 | 15 | 2.0 | |||||||||||||||||||
| Pacific | 543 | 38.6 | 394 | 51.6 | |||||||||||||||||||
| South Atlantic | 211 | 15.0 | 125 | 16.4 | |||||||||||||||||||
| West North Central | 12 | 0.8 | 9 | 1.2 | |||||||||||||||||||
| West South Central | 55 | 3.9 | 24 | 3.1 | |||||||||||||||||||
| Total residential mortgage loans | $ | 1,406 | 100.0 | % | $ | 763 | 100.0 | % | |||||||||||||||
| 2021 | 2020 | ||||||||||||||||||||||
| Gross Carry Value | % of Total | Gross Carry Value | % of Total | ||||||||||||||||||||
| Mortgage loans by property type | |||||||||||||||||||||||
| Industrial | $ | 2,985 | 19.0 | % | $ | 3,182 | 21.4 | % | |||||||||||||||
| Retail | 2,549 | 16.2 | 2,765 | 18.6 | |||||||||||||||||||
| Office | 4,927 | 31.3 | 4,771 | 32.1 | |||||||||||||||||||
| Apartments | 5,287 | 33.5 | 4,153 | 27.9 | |||||||||||||||||||
| Total | $ | 15,748 | 100.0 | % | $ | 14,871 | 100.0 | % | |||||||||||||||
| 2021 | 2020 | 2019 | ||||||||||||||||||
| Net cash (used in) provided by operating activities | $ | (4,241) | 3,701 | 1,511 | ||||||||||||||||
| Net cash provided by (used in) investing activities | 5,538 | (3,240) | 955 | |||||||||||||||||
| Net cash provided by (used in) financing and miscellaneous activities | 1,008 | (1,419) | (1,524) | |||||||||||||||||
| Net change in cash, cash equivalents, and short-term investments | $ | 2,305 | (958) | 942 | ||||||||||||||||
| 1 of 67 | ||||||||
| 2 of 67 | ||||||||
| Admitted Assets | 2021 | 2020 | ||||||||||||
| Cash and invested assets: | ||||||||||||||
| Bonds | $ | 93,817 | 99,088 | |||||||||||
| Stocks | 303 | 274 | ||||||||||||
| Investment in subsidiaries | 1,477 | 1,329 | ||||||||||||
| Mortgage loans on real estate | 17,154 | 15,634 | ||||||||||||
| Real estate | 80 | 69 | ||||||||||||
| Cash, cash equivalents and short-term investments | 3,215 | 910 | ||||||||||||
| Policy loans | 267 | 255 | ||||||||||||
| Derivative assets | 2,682 | 4,114 | ||||||||||||
| Other invested assets | 3,834 | 3,556 | ||||||||||||
| Total cash and invested assets | 122,829 | 125,229 | ||||||||||||
| Investment income due and accrued | 947 | 1,040 | ||||||||||||
| Current federal and foreign income tax recoverable | — | 200 | ||||||||||||
| Deferred tax asset, net | 487 | 273 | ||||||||||||
| Other assets | 993 | 745 | ||||||||||||
| Admitted assets, exclusive of separate account assets | 125,256 | 127,487 | ||||||||||||
| Separate account assets | 48,279 | 45,901 | ||||||||||||
| Total admitted assets | $ | 173,535 | 173,388 | |||||||||||
| 3 of 67 | ||||||||
| Liabilities and Capital and Surplus | 2021 | 2020 | ||||||||||||
| Policyholder liabilities: | ||||||||||||||
| Life policies and annuity contracts | $ | 96,980 | 102,549 | |||||||||||
| Accident and health policies | 2,227 | 1,912 | ||||||||||||
| Deposit-type contracts | 4,577 | 4,749 | ||||||||||||
| Life policy and contract claims | 8 | 8 | ||||||||||||
| Accident and health policy and contract claims | 19 | 18 | ||||||||||||
| Other policyholder funds | 122 | 117 | ||||||||||||
| Total policyholder liabilities | 103,933 | 109,353 | ||||||||||||
| Interest maintenance reserve | 267 | 18 | ||||||||||||
| General expenses due and accrued | 245 | 157 | ||||||||||||
| Due from separate accounts | (635) | (294) | ||||||||||||
| Current income taxes payable | 482 | 35 | ||||||||||||
| Borrowed money | 2,001 | 1,501 | ||||||||||||
| Asset valuation reserve | 1,148 | 983 | ||||||||||||
| Derivative liabilities | 2,023 | 3,262 | ||||||||||||
| Other liabilities | 5,087 | 4,811 | ||||||||||||
| Liabilities, exclusive of separate account liabilities | 114,551 | 119,826 | ||||||||||||
| Separate account liabilities | 48,279 | 45,901 | ||||||||||||
| Total liabilities | 162,830 | 165,727 | ||||||||||||
| Capital and surplus: | ||||||||||||||
| Class A, Series A preferred stock, $1 par value. Authorized, issued, and outstanding, 8,909,195 shares; liquidation preference of $4 and $3 at December 31, 2021 and 2020, respectively | 9 | 9 | ||||||||||||
| Class A, Series B preferred stock, $1 par value. Authorized, 10,000,000 shares; issued and outstanding, 9,994,289 shares; liquidation preference of $5 and $4 at December 31, 2021 and 2020, respectively | 10 | 10 | ||||||||||||
| Common stock, $1 par value. Authorized, 40,000,000 shares; issued and outstanding, 20,000,001 shares at December 31, 2021 and 2020, respectively | 20 | 20 | ||||||||||||
| Additional paid-in capital | 3,676 | 3,676 | ||||||||||||
| Special surplus funds | (1,437) | (1,844) | ||||||||||||
| Unassigned surplus | 8,427 | 5,790 | ||||||||||||
| Total capital and surplus | 10,705 | 7,661 | ||||||||||||
| Total liabilities and capital and surplus | $ | 173,535 | 173,388 | |||||||||||
| See accompanying notes to statutory financial statements. | ||||||||||||||
| 4 of 67 | ||||||||
| 2021 | 2020 | 2019 | ||||||||||||||||||
| Income: | ||||||||||||||||||||
| Premiums and annuity considerations | $ | 14,125 | 10,346 | 12,805 | ||||||||||||||||
| Consideration for supplementary contracts | 166 | 196 | 224 | |||||||||||||||||
| Net investment income | 4,866 | 4,864 | 4,839 | |||||||||||||||||
| Commissions and expense allowances on reinsurance ceded | 1,093 | (38) | 338 | |||||||||||||||||
| Reserve adjustments related to reinsurance ceded | (454) | (7) | (9) | |||||||||||||||||
| Fees from separate accounts | 574 | 567 | 613 | |||||||||||||||||
| Other | (32) | 694 | (13) | |||||||||||||||||
| Total income | 20,338 | 16,622 | 18,797 | |||||||||||||||||
| Benefits and other expenses: | ||||||||||||||||||||
| Policyholder benefits | 2,076 | 1,926 | 1,809 | |||||||||||||||||
| Surrenders | 8,800 | 8,417 | 8,559 | |||||||||||||||||
| Change in aggregate reserves and deposit funds | 4,316 | 2,465 | 1,034 | |||||||||||||||||
| Commissions and other agent compensation | 1,480 | 1,139 | 1,284 | |||||||||||||||||
| General and administrative expenses | 715 | 600 | 594 | |||||||||||||||||
| Net transfers to separate accounts | 2,424 | 1,460 | 5,254 | |||||||||||||||||
| Total benefits and other expenses | 19,811 | 16,007 | 18,534 | |||||||||||||||||
| Income from operations before federal income taxes and net realized capital gain | 527 | 615 | 263 | |||||||||||||||||
| Income tax expense | 1,091 | 18 | 773 | |||||||||||||||||
| Net (loss) income from operations before net realized capital gain | (564) | 597 | (510) | |||||||||||||||||
| Net realized capital gain, net of taxes and interest maintenance reserve | 1,856 | 142 | 1,053 | |||||||||||||||||
| Net income | $ | 1,292 | 739 | 543 | ||||||||||||||||
| See accompanying notes to statutory financial statements. | ||||||||||||||||||||
| 5 of 67 | ||||||||
| 2021 | 2020 | 2019 | ||||||||||||||||||
| Capital and surplus at beginning of year | $ | 7,661 | 7,954 | 6,576 | ||||||||||||||||
| Change due to correction of accounting error (Note 3) | 40 | — | — | |||||||||||||||||
| Change in reserve on account of change in valuation basis (Note 3) | — | (1) | — | |||||||||||||||||
| Adjusted balance at beginning of year | 7,701 | 7,953 | 6,576 | |||||||||||||||||
| Net income | 1,292 | 739 | 543 | |||||||||||||||||
| Change in unrealized capital (loss) gain | (142) | (61) | 719 | |||||||||||||||||
| Change in net deferred income tax | 215 | 42 | 330 | |||||||||||||||||
| Change in asset valuation reserve | (165) | (88) | (131) | |||||||||||||||||
| Dividends paid to parent | (900) | (750) | (325) | |||||||||||||||||
| Change in unamortized gain on reinsurance transactions | 2,737 | (162) | 248 | |||||||||||||||||
| Other changes in capital and surplus | (33) | (12) | (6) | |||||||||||||||||
| Capital and surplus at end of year | $ | 10,705 | 7,661 | 7,954 | ||||||||||||||||
| See accompanying notes to statutory financial statements. | ||||||||||||||||||||
| 6 of 67 | ||||||||
| 2021 | 2020 | 2019 | ||||||||||||||||||
| Cash flow from operating activities: | ||||||||||||||||||||
| Revenues: | ||||||||||||||||||||
| Premiums and annuity considerations, net | $ | 14,291 | 10,543 | 13,030 | ||||||||||||||||
| Net investment income | 5,069 | 4,990 | 5,000 | |||||||||||||||||
| Commissions and expense allowances on reinsurance ceded | 385 | 36 | 86 | |||||||||||||||||
| Fees from separate accounts | 574 | 567 | 613 | |||||||||||||||||
| Other | 256 | 217 | 71 | |||||||||||||||||
| Cash provided by operating activities | 20,575 | 16,353 | 18,800 | |||||||||||||||||
| Benefits and expenses paid: | ||||||||||||||||||||
| Benefit and loss-related payments | 19,238 | 9,513 | 9,469 | |||||||||||||||||
| Net transfers to separate accounts | 2,766 | 1,128 | 5,534 | |||||||||||||||||
| Commissions, expenses paid, and aggregate write-ins for deductions | 2,119 | 1,727 | 1,881 | |||||||||||||||||
| Income tax paid, net | 709 | 290 | 338 | |||||||||||||||||
| Other | (16) | (6) | 67 | |||||||||||||||||
| Cash used in operating activities | 24,816 | 12,652 | 17,289 | |||||||||||||||||
| Net cash (used in) provided by operating activities | (4,241) | 3,701 | 1,511 | |||||||||||||||||
| Cash flow from investing activities: | ||||||||||||||||||||
| Proceeds from investments sold, matured or repaid: | ||||||||||||||||||||
| Bonds | 30,622 | 8,935 | 15,892 | |||||||||||||||||
| Stocks | 282 | 147 | 113 | |||||||||||||||||
| Mortgage loans | 1,806 | 1,024 | 1,356 | |||||||||||||||||
| Real estate | 3 | — | — | |||||||||||||||||
| Other invested assets | 81 | 60 | 32 | |||||||||||||||||
| Derivatives | 1,213 | 861 | 1,429 | |||||||||||||||||
| Miscellaneous proceeds | 35 | 2 | 1,572 | |||||||||||||||||
| Cash provided by investing activities | 34,042 | 11,029 | 20,394 | |||||||||||||||||
| Cost of investments acquired: | ||||||||||||||||||||
| Bonds | 24,350 | 10,885 | 15,976 | |||||||||||||||||
| Stocks | 292 | 230 | 145 | |||||||||||||||||
| Mortgage loans | 3,347 | 2,482 | 2,283 | |||||||||||||||||
| Real estate | 17 | 10 | 11 | |||||||||||||||||
| Other invested assets | 408 | 156 | 192 | |||||||||||||||||
| Miscellaneous applications | 78 | 485 | 812 | |||||||||||||||||
| Cash used in investing activities | 28,492 | 14,248 | 19,419 | |||||||||||||||||
| Net increase in policy loans and premium notes | 12 | 21 | 20 | |||||||||||||||||
| Net cash provided by (used in) investing activities | 5,538 | (3,240) | 955 | |||||||||||||||||
| Cash flow from financing and miscellaneous activities: | ||||||||||||||||||||
| Change in borrowed money | 500 | 500 | 500 | |||||||||||||||||
| Payments on deposit-type contracts and other insurance liabilities, net of deposits | (1,264) | (1,290) | (1,333) | |||||||||||||||||
| Dividends paid to parent | (900) | (750) | (325) | |||||||||||||||||
| Other cash provided (used) | 2,672 | 121 | (366) | |||||||||||||||||
| Net cash provided by (used in) financing and miscellaneous activities | 1,008 | (1,419) | (1,524) | |||||||||||||||||
| Net change in cash, cash equivalents, and short-term investments | 2,305 | (958) | 942 | |||||||||||||||||
| Cash, cash equivalents, and short-term investments: | ||||||||||||||||||||
| Beginning of year | 910 | 1,868 | 926 | |||||||||||||||||
| End of year | $ | 3,215 | 910 | 1,868 | ||||||||||||||||
| See accompanying notes to statutory financial statements. | ||||||||||||||||||||
| 7 of 67 | ||||||||
| 8 of 67 | ||||||||
| 9 of 67 | ||||||||
| 10 of 67 | ||||||||
| 11 of 67 | ||||||||
| 12 of 67 | ||||||||
| 13 of 67 | ||||||||
| 14 of 67 | ||||||||
| 15 of 67 | ||||||||
| 16 of 67 | ||||||||
| 2021 | 2020 | |||||||
| Hedge adjustment balance - beginning of year | $ | 513 | $ | 582 | ||||
| Amount amortized into earnings during the year | (58) | (69) | ||||||
| Hedge adjustment balance - end of year | $ | 455 | $ | 513 | ||||
| 2021 | 2020 | |||||||
| Net deferred balance - beginning of year | $ | 1,844 | $ | 1,435 | ||||
| Amortization | (240) | (214) | ||||||
| Additional amounts deferred | (167) | 623 | ||||||
| Net deferred balance - end of year | $ | 1,437 | $ | 1,844 | ||||
| 17 of 67 | ||||||||
| Amortization year | Deferred assets | Deferred liabilities | |||||||||||||||
| 2022 | $ | (189) | $ | 501 | |||||||||||||
| 2023 | (189) | 501 | |||||||||||||||
| 2024 | (189) | 501 | |||||||||||||||
| 2025 | (189) | 501 | |||||||||||||||
| 2026 | (96) | 255 | |||||||||||||||
| 2027 | (3) | 9 | |||||||||||||||
| 2028 | (3) | 9 | |||||||||||||||
| 2029 | (3) | 9 | |||||||||||||||
| 2030 | (3) | 9 | |||||||||||||||
| 2031 | (3) | $ | 9 | ||||||||||||||
| Total | $ | (867) | $ | 2,304 | |||||||||||||
| 18 of 67 | ||||||||
| 19 of 67 | ||||||||
| 20 of 67 | ||||||||
| 21 of 67 | ||||||||
| 22 of 67 | ||||||||
| 23 of 67 | ||||||||
| 24 of 67 | ||||||||
| 25 of 67 | ||||||||
| 26 of 67 | ||||||||
| 27 of 67 | ||||||||
| 2021 | ||||||||||||||||||||||||||
| Amortized cost | Gross unrealized gains | Gross unrealized losses | Fair value | |||||||||||||||||||||||
| Bonds: | ||||||||||||||||||||||||||
| U.S. government | $ | 3,644 | 147 | 39 | 3,752 | |||||||||||||||||||||
| Agencies not backed by the full faith and credit of the U.S. government | 299 | — | — | 299 | ||||||||||||||||||||||
| States and political subdivisions | 9,119 | 1,973 | 6 | 11,086 | ||||||||||||||||||||||
| Foreign governments | 1,619 | 75 | 16 | 1,678 | ||||||||||||||||||||||
| Corporate securities | 68,444 | 8,191 | 275 | 76,360 | ||||||||||||||||||||||
| Mortgage-backed securities | 11,645 | 564 | 26 | 12,183 | ||||||||||||||||||||||
| Collateralized debt obligations | 12 | 8 | — | 20 | ||||||||||||||||||||||
| Total bonds | 94,782 | 10,958 | 362 | 105,378 | ||||||||||||||||||||||
| Common stocks | 278 | 27 | 2 | 303 | ||||||||||||||||||||||
| Preferred stocks | — | — | — | — | ||||||||||||||||||||||
| Total | $ | 95,060 | 10,985 | 364 | 105,681 | |||||||||||||||||||||
| 2020 | ||||||||||||||||||||||||||
| Amortized cost | Gross unrealized gains | Gross unrealized losses | Fair value | |||||||||||||||||||||||
| Bonds: | ||||||||||||||||||||||||||
| U.S. government | $ | 3,318 | 300 | 10 | 3,608 | |||||||||||||||||||||
| Agencies not backed by the full faith and credit of the U.S. government | 3 | 1 | — | 4 | ||||||||||||||||||||||
| States and political subdivisions | 9,536 | 2,335 | 2 | 11,869 | ||||||||||||||||||||||
| Foreign governments | 1,138 | 125 | 2 | 1,261 | ||||||||||||||||||||||
| Corporate securities | 70,975 | 12,730 | 90 | 83,615 | ||||||||||||||||||||||
| Mortgage-backed securities | 14,126 | 1,232 | 9 | 15,349 | ||||||||||||||||||||||
| Collateralized debt obligations | 17 | 12 | — | 29 | ||||||||||||||||||||||
| Total bonds | 99,113 | 16,735 | 113 | 115,735 | ||||||||||||||||||||||
| Common stocks | 217 | 18 | 1 | 234 | ||||||||||||||||||||||
| Preferred stocks | 41 | 2 | — | 43 | ||||||||||||||||||||||
| Total | $ | 99,371 | 16,755 | 114 | 116,012 | |||||||||||||||||||||
| 28 of 67 | ||||||||
| Carrying value | Fair value | ||||||||||
| Due in 1 year or less | $ | 1,707 | $ | 1,716 | |||||||
| Due after 1 year through 5 years | 9,030 | 9,592 | |||||||||
| Due after 5 years through 10 years | 17,877 | 19,148 | |||||||||
| Due after 10 years through 20 years | 25,696 | 29,965 | |||||||||
| Due after 20 years | 27,949 | 31,836 | |||||||||
| No maturity date | 866 | 918 | |||||||||
| Mortgage-backed and other structured securities | 11,657 | 12,203 | |||||||||
| Total bonds and other assets receiving bond treatment | $ | 94,782 | $ | 105,378 | |||||||
| 2021 | 2020 | 2019 | ||||||||||||||||||
| Proceeds from sales | $ | 30,577 | 8,677 | 15,892 | ||||||||||||||||
| Gross gains | 1,313 | 162 | 75 | |||||||||||||||||
| Gross losses | 101 | 28 | 34 | |||||||||||||||||
| 2021 | 2020 | 2019 | ||||||||||||||||||
| Proceeds from sales | $ | 241 | 147 | 111 | ||||||||||||||||
| Gross gains | 11 | 3 | 2 | |||||||||||||||||
| Gross losses | — | 2 | 2 | |||||||||||||||||
| 2021 | 2020 | 2019 | ||||||||||||||||||
| Proceeds from sales | $ | 40 | — | 2 | ||||||||||||||||
| Gross gains | 1 | — | — | |||||||||||||||||
| Gross losses | — | — | — | |||||||||||||||||
| 29 of 67 | ||||||||
| 2021 | ||||||||||||||||||||||||||||||||||||||
| 12 months or less | Greater than 12 months | Total | ||||||||||||||||||||||||||||||||||||
| Fair value | Unrealized losses | Fair value | Unrealized losses | Fair value | Unrealized losses | |||||||||||||||||||||||||||||||||
| Bonds: | ||||||||||||||||||||||||||||||||||||||
| U.S. government | $ | 396 | 17 | 272 | 22 | 668 | 39 | |||||||||||||||||||||||||||||||
| Foreign government | 513 | 13 | 41 | 3 | 554 | 16 | ||||||||||||||||||||||||||||||||
| States and political subdivisions | 208 | 5 | 21 | 1 | 229 | 6 | ||||||||||||||||||||||||||||||||
| Corporate securities | 9,417 | 207 | 1,083 | 68 | 10,500 | 275 | ||||||||||||||||||||||||||||||||
| Mortgage-backed securities | 977 | 19 | 124 | 7 | 1,101 | 26 | ||||||||||||||||||||||||||||||||
| Total bonds | 11,511 | 261 | 1,541 | 101 | 13,052 | 362 | ||||||||||||||||||||||||||||||||
| Common stock | 53 | 2 | 3 | — | 56 | 2 | ||||||||||||||||||||||||||||||||
| Total temporarily impaired securities | $ | 11,564 | 263 | 1,544 | 101 | 13,108 | 364 | |||||||||||||||||||||||||||||||
| 2020 | ||||||||||||||||||||||||||||||||||||||
| 12 months or less | Greater than 12 months | Total | ||||||||||||||||||||||||||||||||||||
| Fair value | Unrealized losses | Fair value | Unrealized losses | Fair value | Unrealized losses | |||||||||||||||||||||||||||||||||
| Bonds: | ||||||||||||||||||||||||||||||||||||||
| U.S. government | $ | 374 | 10 | — | — | 374 | 10 | |||||||||||||||||||||||||||||||
| Foreign government | 51 | 2 | — | — | 51 | 2 | ||||||||||||||||||||||||||||||||
| States and political subdivisions | 85 | 2 | — | — | 85 | 2 | ||||||||||||||||||||||||||||||||
| Corporate securities | 2,085 | 78 | 578 | 12 | 2,663 | 90 | ||||||||||||||||||||||||||||||||
| Mortgage-backed securities | 158 | 5 | 41 | 4 | 199 | 9 | ||||||||||||||||||||||||||||||||
| Total bonds | 2,753 | 97 | 619 | 16 | 3,372 | 113 | ||||||||||||||||||||||||||||||||
| Common stock | 7 | — | 9 | 1 | 16 | 1 | ||||||||||||||||||||||||||||||||
| Total temporarily impaired securities | $ | 2,760 | 97 | 628 | 17 | 3,388 | 114 | |||||||||||||||||||||||||||||||
| 30 of 67 | ||||||||
| 2021 | 2020 | 2019 | |||||||||||||||
| Bonds | $ | 1,199 | (120) | 13 | |||||||||||||
| Stocks | 11 | 2 | — | ||||||||||||||
| Mortgage Loans | (8) | (34) | — | ||||||||||||||
| Derivatives | 1,883 | 202 | 1,062 | ||||||||||||||
| Other | (39) | (1) | (2) | ||||||||||||||
| Total realized capital gains (losses) | 3,046 | 49 | 1,073 | ||||||||||||||
| Income tax benefit (expense) on net realized gains (losses) | (249) | — | 11 | ||||||||||||||
| Total realized capital gains (losses), net of taxes | 2,797 | 49 | 1,084 | ||||||||||||||
| Net gains (losses) transferred to IMR, net of taxes | 941 | (93) | 31 | ||||||||||||||
| Net realized gains (losses), net of taxes and IMR | $ | 1,856 | 142 | 1,053 | |||||||||||||
| 2021 | 2020 | 2019 | |||||||||||||||
| Interest: | |||||||||||||||||
| Bonds | $ | 4,233 | 4,189 | 4,319 | |||||||||||||
| Mortgage loans on real estate | 682 | 647 | 617 | ||||||||||||||
| Policy loans | 12 | 12 | 11 | ||||||||||||||
| Cash, cash equivalents, and short-term investments | — | 7 | 23 | ||||||||||||||
| Dividends: | |||||||||||||||||
| Stocks | 13 | 7 | 7 | ||||||||||||||
| Investment in subsidiaries | 51 | 50 | 67 | ||||||||||||||
| Rental income on real estate | 20 | 20 | 13 | ||||||||||||||
| Derivatives | 37 | (14) | (109) | ||||||||||||||
| Other | (92) | 47 | (7) | ||||||||||||||
| Gross investment income | 4,956 | 4,965 | 4,941 | ||||||||||||||
| Investment expenses | (137) | (138) | (146) | ||||||||||||||
| Net investment income before amortization of IMR | 4,819 | 4,827 | 4,795 | ||||||||||||||
| Amortization of IMR | 47 | 37 | 44 | ||||||||||||||
| Net investment income | $ | 4,866 | 4,864 | 4,839 | |||||||||||||
| 2021 | 2020 | ||||||||||||||||
| Concentration Amount | Concentration % | Concentration Amount | Concentration % | ||||||||||||||
| California | $ | 3,605 | 22.9 | % | $ | 3,356 | 22.6 | % | |||||||||
| 31 of 67 | ||||||||
| 2021 | 2020 | ||||||||||||||||
| Concentration Amount | Concentration % | Concentration Amount | Concentration % | ||||||||||||||
| California | $ | 500 | 35.6 | % | $ | 353 | 46.3 | % | |||||||||
| Florida | — | — | % | 80 | 10.4 | % | |||||||||||
| 2021 | 2020 | ||||||||||||||||
| Residential | Commercial | Residential | Commercial | ||||||||||||||
| Current | $ | 1,364 | 15,732 | 693 | 14,813 | ||||||||||||
| 30-59 Days Past Due | 14 | — | 18 | — | |||||||||||||
| 60-89 Days Past Due | 2 | — | 2 | — | |||||||||||||
| 90-179 Days Past Due | 11 | — | 4 | — | |||||||||||||
| 180+ Days Past Due | 15 | 16 | 47 | 57 | |||||||||||||
| Total | $ | 1,406 | 15,748 | 764 | 14,870 | ||||||||||||
| 2021 | 2020 | ||||||||||||||||
| Residential | Commercial | Residential | Commercial | ||||||||||||||
| Accruing Interest 90-179 Days Past Due | |||||||||||||||||
| Recorded Investment | $ | — | — | 2 | — | ||||||||||||
| Interest Accrued | — | — | — | — | |||||||||||||
| Accruing Interest 180+ Days Past Due | |||||||||||||||||
| Recorded Investment | — | — | — | — | |||||||||||||
| Interest Accrued | — | — | — | — | |||||||||||||
| 32 of 67 | ||||||||
| Debt Service Coverage Ratios | |||||||||||||||||||||||||||||||||||
| 2021: | Greater than 1.4x | 1.2x – 1.4x | 1.0x – 1.2x | Less than 1.0x | Total | Percent of Total | |||||||||||||||||||||||||||||
| Loan-to-value ratios: | |||||||||||||||||||||||||||||||||||
| Less than 50% | $ | 4,528 | 59 | 98 | 663 | 5,348 | 34.0 | % | |||||||||||||||||||||||||||
| 50% – 60% | 4,459 | 775 | 249 | 824 | 6,307 | 40.0 | % | ||||||||||||||||||||||||||||
| 60% – 70% | 2,077 | 1,099 | 281 | 444 | 3,901 | 24.8 | % | ||||||||||||||||||||||||||||
| 70% – 80% | 23 | 89 | 35 | 29 | 176 | 1.1 | % | ||||||||||||||||||||||||||||
| 80% – 90% | — | — | — | — | — | — | % | ||||||||||||||||||||||||||||
| 90% – 100% | — | — | — | — | — | — | % | ||||||||||||||||||||||||||||
| Greater than 100% | — | — | 16 | — | 16 | 0.1 | % | ||||||||||||||||||||||||||||
| Total | $ | 11,087 | 2,022 | 679 | 1,960 | 15,748 | 100.0 | % | |||||||||||||||||||||||||||
| Debt Service Coverage Ratios | |||||||||||||||||||||||||||||||||||
| 2020: | Greater than 1.4x | 1.2x – 1.4x | 1.0x – 1.2x | Less than 1.0x | Total | Percent of Total | |||||||||||||||||||||||||||||
| Loan-to-value ratios: | |||||||||||||||||||||||||||||||||||
| Less than 50% | $ | 3,992 | 73 | 52 | 622 | 4,739 | 31.9 | % | |||||||||||||||||||||||||||
| 50% – 60% | 4,477 | 770 | 132 | 359 | 5,738 | 38.6 | % | ||||||||||||||||||||||||||||
| 60% – 70% | 2,288 | 905 | 273 | 582 | 4,048 | 27.2 | % | ||||||||||||||||||||||||||||
| 70% – 80% | — | 163 | 102 | 35 | 300 | 2.0 | % | ||||||||||||||||||||||||||||
| 80% – 90% | — | — | 21 | — | 21 | 0.1 | % | ||||||||||||||||||||||||||||
| 90% – 100% | — | — | — | — | — | — | % | ||||||||||||||||||||||||||||
| Greater than 100% | — | — | 25 | — | 25 | 0.2 | % | ||||||||||||||||||||||||||||
| Total | $ | 10,757 | 1,911 | 605 | 1,598 | 14,871 | 100.0 | % | |||||||||||||||||||||||||||
| 33 of 67 | ||||||||
| 2021 | 2020 | ||||||||||||||||||||||
| Total | Percent of Total | Total | Percent of Total | ||||||||||||||||||||
| Loan-to-value ratios: | |||||||||||||||||||||||
| Below 70% | $ | 353 | 25.1 | % | $ | 165 | 21.6 | % | |||||||||||||||
| 71% to 80% | 705 | 50.1 | % | 381 | 49.9 | % | |||||||||||||||||
| 81% to 90% | 316 | 22.5 | % | 206 | 27.0 | % | |||||||||||||||||
| 91% to 95% | 33 | 2.3 | % | 12 | 1.6 | % | |||||||||||||||||
| Above 95% | — | — | % | — | — | % | |||||||||||||||||
| Total | $ | 1,407 | 100.0 | % | $ | 764 | 100.0 | % | |||||||||||||||
| 2021 | |||||||||||||||||||||||
| OTTI Recognized in Loss | |||||||||||||||||||||||
| Amortized Cost Basis Before OTTI | Interest | Non-Interest | Fair Value | ||||||||||||||||||||
| OTTI Recognized: | |||||||||||||||||||||||
| Intent to sell | $ | 41 | 3 | — | 38 | ||||||||||||||||||
| Annual aggregate total | $ | 41 | 3 | — | 38 | ||||||||||||||||||
| 34 of 67 | ||||||||
| 35 of 67 | ||||||||
| 2021 | 2020 | |||||||||||||||||||||||||||||||||||||
| Gross Fair Value | Gross Fair Value | |||||||||||||||||||||||||||||||||||||
Notional (1) | Assets | Liabilities | Notional (1) | Assets | Liabilities | |||||||||||||||||||||||||||||||||
| Cash flow hedging instruments | ||||||||||||||||||||||||||||||||||||||
| Foreign currency swaps | $ | 1,583 | 81 | (33) | 1,341 | 56 | (76) | |||||||||||||||||||||||||||||||
| Total cash flow hedging instruments | $ | 81 | (33) | 56 | (76) | |||||||||||||||||||||||||||||||||
| Fair value hedging instruments | ||||||||||||||||||||||||||||||||||||||
| IRS | $ | 2,696 | 305 | 3,511 | 2,709 | 472 | (40) | |||||||||||||||||||||||||||||||
| Total fair value hedging instruments | $ | 305 | 3,511 | $ | 472 | (40) | ||||||||||||||||||||||||||||||||
| Nonqualifying hedging instruments | ||||||||||||||||||||||||||||||||||||||
| OTC options | $ | 55,270 | 2,174 | (1,822) | 51,430 | 3,433 | (3,013) | |||||||||||||||||||||||||||||||
| ETO | 19,388 | 114 | (119) | 15,224 | 136 | (96) | ||||||||||||||||||||||||||||||||
| TBA securities | 1,987 | — | — | 1,331 | 1 | (1) | ||||||||||||||||||||||||||||||||
| IRS | 2,233 | 8 | (3,545) | 2,631 | 9 | (18) | ||||||||||||||||||||||||||||||||
| Futures | 19,591 | — | — | 19,312 | — | — | ||||||||||||||||||||||||||||||||
| TRS | 6,633 | — | (15) | 11,653 | 7 | (18) | ||||||||||||||||||||||||||||||||
| Total nonqualifying hedging instruments | 2,296 | (5,501) | 3,586 | (3,146) | ||||||||||||||||||||||||||||||||||
| Total derivative instruments | $ | 2,682 | (2,023) | 4,114 | (3,262) | |||||||||||||||||||||||||||||||||
(1) Notional amounts are presented on an absolute basis. | ||||||||||||||||||||||||||||||||||||||
| 36 of 67 | ||||||||
| Fair Value | ||||||||||||||
| 2021 | 2020 | |||||||||||||
| Cash | ||||||||||||||
| Open | 2,594 | 2,587 | ||||||||||||
| 30 days or less | — | — | ||||||||||||
| 31 to 60 days | — | — | ||||||||||||
| 61 to 90 days | — | — | ||||||||||||
| Greater than 90 days | — | — | ||||||||||||
| Subtotal | 2,594 | 2,587 | ||||||||||||
| Securities received | 500 | 86 | ||||||||||||
| Total collateral received | $ | 3,094 | 2,673 | |||||||||||
| 2021 | 2020 | |||||||||||||||||||||||||
| Amortized cost | Fair value | Amortized cost | Fair value | |||||||||||||||||||||||
| Open | — | — | — | — | ||||||||||||||||||||||
| 30 days or less | 949 | 949 | 950 | 950 | ||||||||||||||||||||||
| 31 to 60 days | 837 | 837 | 955 | 955 | ||||||||||||||||||||||
| 61 to 90 days | 61 | 61 | 66 | 66 | ||||||||||||||||||||||
| 91 to 120 days | 162 | 162 | — | — | ||||||||||||||||||||||
| 121 to 180 days | 308 | 308 | 143 | 143 | ||||||||||||||||||||||
| 181 to 365 days | 277 | 277 | 473 | 473 | ||||||||||||||||||||||
| Greater than 1 year | — | — | — | — | ||||||||||||||||||||||
| Total collateral reinvested | $ | 2,594 | 2,594 | 2,587 | 2,587 | |||||||||||||||||||||
| 2021 | 2020 | ||||||||||
| Cash and cash equivalents | $ | 1,665 | 1,630 | ||||||||
| Short-term investments | 929 | 957 | |||||||||
| Total | $ | 2,594 | 2,587 | ||||||||
| 37 of 67 | ||||||||
| As of year end | 2021 | 2020 | ||||||||||||||||||
| 1. Maturity | ||||||||||||||||||||
| a. Overnight | $ | 1,161 | 430 | |||||||||||||||||
| b. 2 Days to 1 Week | — | — | ||||||||||||||||||
| 2. Collateral Pledged and Securities Acquired Under Repo | ||||||||||||||||||||
| a. Cash Collateral Pledged - Secured Borrowing | $ | 1,161 | 430 | |||||||||||||||||
| b. Fair Value of Securities Acquired Under Repo - Secured Borrowing | 1,161 | 435 | ||||||||||||||||||
| Maximum Amount | 2021 | 2020 | ||||||||||||||||||
| 1. Maturity | ||||||||||||||||||||
| a. Overnight | $ | 1,161 | 2,878 | |||||||||||||||||
| b. 2 Days to 1 Week | — | — | ||||||||||||||||||
| 2. Collateral Pledged and Securities Acquired Under Repo | ||||||||||||||||||||
| a. Cash Collateral Pledged - Secured Borrowing | $ | 1,161 | 2,878 | |||||||||||||||||
| b. Fair Value of Securities Acquired Under Repo - Secured Borrowing | 1,161 | 2,906 | ||||||||||||||||||
| SCA Name | Gross Asset | Non-Admitted Asset | Net Admitted Assets | NAIC Filing Date | NAIC Filing Type | NAIC Filing Balance | Re-submission Required? | |||||||||||||||||||||||||||||||||||||
| AZLPF | $ | 789 | — | 789 | 5/25/2021 | S2 | 777 | N | ||||||||||||||||||||||||||||||||||||
| Total | $ | 789 | — | 789 | XXX | XXX | 777 | XXX | ||||||||||||||||||||||||||||||||||||
| 2021 | 2020 | |||||||||||||
| Carrying value | $ | 1,988 | 1,336 | |||||||||||
| Fair value | 2,381 | 1,736 | ||||||||||||
| 2021 | 2020 | |||||||||||||
| Carrying value | $ | 4,290 | 1,994 | |||||||||||
| Fair value | 5,052 | 2,254 | ||||||||||||
| 38 of 67 | ||||||||
| Gross Restricted | Percentage | |||||||||||||||||||||||||||||||||||||
| Total general account | Total from prior year | Increase (decrease) | Total current year admitted restricted | Gross restricted to total assets | Admitted restricted to total admitted assets | |||||||||||||||||||||||||||||||||
| Collateral held under security lending arrangements | $ | 3,094 | 2,673 | 421 | 3,094 | 1.8 | % | 1.8 | % | |||||||||||||||||||||||||||||
| FHLB Capital Stock | 90 | 70 | 20 | 90 | — | — | ||||||||||||||||||||||||||||||||
| On deposit with states | 4 | 4 | — | 4 | — | — | ||||||||||||||||||||||||||||||||
| On deposit with other regulatory bodies | 27 | 19 | 8 | 27 | — | — | ||||||||||||||||||||||||||||||||
| Pledged as collateral to FHLB (including assets backing funding agreements) | 1,988 | 1,336 | 652 | 1,988 | 1.1 | 1.1 | ||||||||||||||||||||||||||||||||
| Derivative collateral | 2,338 | 2,266 | 72 | 2,338 | 1.3 | 1.3 | ||||||||||||||||||||||||||||||||
| Modco Assets | 25,773 | — | 25,773 | 25,773 | 14.8 | 14.9 | ||||||||||||||||||||||||||||||||
| Total restricted assets | $ | 33,314 | 6,368 | 26,946 | 33,314 | 19.0 | % | 19.1 | % | |||||||||||||||||||||||||||||
| 2021 | 2020 | ||||||||||||||||||||||
| Number of Securities | Aggregate Book Adjusted Carrying Value | Aggregate Fair Value | Number of Securities | Aggregate Book Adjusted Carrying Value | Aggregate Fair Value | ||||||||||||||||||
| Bonds | — | $ | — | — | — | $ | — | — | |||||||||||||||
| Loan-backed and structured securities | — | — | — | 1 | 1 | 1 | |||||||||||||||||
| Total | — | $ | — | — | 1 | $ | 1 | 1 | |||||||||||||||
| 39 of 67 | ||||||||
| 2021 | ||||||||||||||||||||||||||
| Level 1 | Level 2 (a) | Level 3 | Total | |||||||||||||||||||||||
| Assets at fair value: | ||||||||||||||||||||||||||
| Bonds | $ | — | 3 | — | 3 | |||||||||||||||||||||
| Common stocks | $ | 213 | — | — | 213 | |||||||||||||||||||||
| Derivative assets | 114 | 2,644 | — | 2,758 | ||||||||||||||||||||||
| Separate account assets | 21,319 | 7,043 | — | 28,362 | ||||||||||||||||||||||
| Total assets reported at fair value | 21,646 | 9,690 | — | 31,336 | ||||||||||||||||||||||
| Liabilities at fair value: | ||||||||||||||||||||||||||
| Derivative liabilities | 119 | 1,894 | 15 | 2,028 | ||||||||||||||||||||||
| Separate account derivative liabilities | — | 5,329 | — | 5,329 | ||||||||||||||||||||||
| Total liabilities reported at fair value | $ | 119 | 7,223 | 15 | 7,357 | |||||||||||||||||||||
(a) The Company does not have any assets or liabilities measured at net asset value (NAV) that are included in Level 2 within this table. | ||||||||||||||||||||||||||
| 40 of 67 | ||||||||
| 2020 | ||||||||||||||||||||||||||
| Level 1 | Level 2 (a) | Level 3 | Total | |||||||||||||||||||||||
| Assets at fair value: | ||||||||||||||||||||||||||
| Bonds | $ | — | 4 | — | 4 | |||||||||||||||||||||
| Common stocks | 163 | — | 1 | 164 | ||||||||||||||||||||||
| Derivative assets | 136 | 4,036 | 7 | 4,179 | ||||||||||||||||||||||
| Separate account assets | 21,789 | 11,408 | — | 33,197 | ||||||||||||||||||||||
| Total assets reported at fair value | 22,088 | 15,448 | 8 | 37,544 | ||||||||||||||||||||||
| Liabilities at fair value: | ||||||||||||||||||||||||||
| Derivative liabilities | 96 | 3,161 | 18 | 3,275 | ||||||||||||||||||||||
| Separate account derivative liabilities | — | 10,332 | — | 10,332 | ||||||||||||||||||||||
| Total liabilities reported at fair value | $ | 96 | 13,493 | 18 | 13,607 | |||||||||||||||||||||
(a) The Company does not have any assets or liabilities measured at NAV that are included in Level 2 within this table. | ||||||||||||||||||||||||||
| 41 of 67 | ||||||||
| 42 of 67 | ||||||||
| January 1, 2021 | Transfers into Level 3 | Transfers out of Level 3 | Total gains and (losses) included in Net Income | Total gains and (losses) included in Surplus | Purchases, issuances, sales and settlements | December 31, 2021 | |||||||||||||||||
| Preferred stocks | — | 41 | — | — | — | (41) | — | ||||||||||||||||
| Common stocks | 1 | — | — | — | — | (1) | — | ||||||||||||||||
| TRS assets | 7 | — | — | 297 | (7) | (297) | — | ||||||||||||||||
| Total Level 3 Assets | 8 | — | — | 297 | (7) | (298) | — | ||||||||||||||||
| TRS liabilities | (18) | — | — | (423) | 3 | 423 | (15) | ||||||||||||||||
| Total Level 3 Liabilities | $ | (18) | — | — | (423) | 3 | 423 | (15) | |||||||||||||||
| January 1, 2020 | Transfers into Level 3 | Transfers out of Level 3 | Total gains and (losses) included in Net Income | Total gains and (losses) included in Surplus | Purchases, issuances, sales and settlements | December 31, 2020 | |||||||||||||||||
| Common stocks | 1 | — | — | — | — | 1 | |||||||||||||||||
| TRS assets | 1 | — | — | 960 | 6 | (960) | 7 | ||||||||||||||||
| Total Level 3 Assets | 2 | — | — | 960 | 6 | (960) | 8 | ||||||||||||||||
| TRS liabilities | (13) | — | — | (568) | (5) | 568 | (18) | ||||||||||||||||
| Total Level 3 Liabilities | $ | (13) | — | — | (568) | (5) | 568 | (18) | |||||||||||||||
| 43 of 67 | ||||||||
| 2021 | ||||||||||||||||||||||||||||||||
| Fair Value | ||||||||||||||||||||||||||||||||
| Aggregate Fair Value | Admitted Assets/ Carrying Value | Level 1 | Level 2 | Level 3 | ||||||||||||||||||||||||||||
| Financial Assets | ||||||||||||||||||||||||||||||||
| Bonds | $ | 104,413 | 93,817 | 4,062 | 81,773 | 18,578 | ||||||||||||||||||||||||||
| Common stocks, unaffiliated | 303 | 303 | 213 | — | 90 | |||||||||||||||||||||||||||
| Mortgage loans on real estate | 17,673 | 17,154 | — | — | 17,673 | |||||||||||||||||||||||||||
| Cash equivalents | 3,210 | 3,210 | 1,694 | 1,516 | — | |||||||||||||||||||||||||||
| Derivative assets | 2,758 | 2,682 | 114 | 2,644 | — | |||||||||||||||||||||||||||
| Securities lending reinvested collateral assets | 2,594 | 2,594 | — | 2,594 | — | |||||||||||||||||||||||||||
| Other invested assets | 1,052 | 1,052 | — | 102 | 950 | |||||||||||||||||||||||||||
| COLI | 713 | 713 | — | 713 | — | |||||||||||||||||||||||||||
| Separate account assets | 49,082 | 48,279 | 22,298 | 26,784 | — | |||||||||||||||||||||||||||
| Financial Liabilities | ||||||||||||||||||||||||||||||||
| Deposit-type contracts | $ | 5,056 | 4,577 | — | — | 5,056 | ||||||||||||||||||||||||||
| Other investment contracts | 97,132 | 88,311 | — | — | 97,132 | |||||||||||||||||||||||||||
| Borrowed money | 1,976 | 2,001 | — | — | 1,976 | |||||||||||||||||||||||||||
| Derivative liabilities | 2,028 | 2,023 | 119 | 1,894 | 15 | |||||||||||||||||||||||||||
| Payable for securities lending | 2,594 | 2,594 | — | 2,594 | — | |||||||||||||||||||||||||||
| Payable for securities | 271 | 271 | — | — | 271 | |||||||||||||||||||||||||||
| Separate account liabilities | 49,082 | 48,279 | 22,298 | 26,784 | — | |||||||||||||||||||||||||||
(b) The Company does not have any assets or liabilities measured at NAV that are included in Level 2 in this table. In addition, the Company has no assets or liabilities for which it is not practicable to measure at fair value. | ||||||||||||||||||||||||||||||||
| 44 of 67 | ||||||||
| 2020 | ||||||||||||||||||||||||||||||||
| Fair Value | ||||||||||||||||||||||||||||||||
| Aggregate Fair Value | Admitted Assets/ Carrying Value | Level 1 | Level 2 | Level 3 | ||||||||||||||||||||||||||||
| Financial Assets | ||||||||||||||||||||||||||||||||
| Bonds | $ | 115,710 | 99,088 | 4,995 | 93,714 | 17,001 | ||||||||||||||||||||||||||
| Preferred stocks, unaffiliated | 43 | 41 | — | — | 43 | |||||||||||||||||||||||||||
| Common stocks, unaffiliated | 234 | 234 | 163 | — | 71 | |||||||||||||||||||||||||||
| Mortgage loans on real estate | 17,117 | 15,634 | — | — | 17,117 | |||||||||||||||||||||||||||
| Cash equivalents | 878 | 878 | 448 | 430 | — | |||||||||||||||||||||||||||
| Derivative assets | 4,179 | 4,114 | 136 | 4,036 | 7 | |||||||||||||||||||||||||||
| Securities lending reinvested collateral assets | 2,587 | 2,587 | — | 2,587 | — | |||||||||||||||||||||||||||
| Other invested assets | 757 | 757 | — | 23 | 734 | |||||||||||||||||||||||||||
| COLI | 653 | 653 | — | 653 | — | |||||||||||||||||||||||||||
| Separate account assets | 46,886 | 45,901 | 22,732 | 24,154 | — | |||||||||||||||||||||||||||
| Financial Liabilities | ||||||||||||||||||||||||||||||||
| Deposit-type contracts | $ | 5,395 | 4,749 | — | — | 5,395 | ||||||||||||||||||||||||||
| Other investment contracts | 103,518 | 95,083 | — | — | 103,518 | |||||||||||||||||||||||||||
| Borrowed money | 1,516 | 1,501 | — | — | 1,516 | |||||||||||||||||||||||||||
| Derivative liabilities | 3,275 | 3,262 | 96 | 3,161 | 18 | |||||||||||||||||||||||||||
| Payable for securities lending | 2,587 | 2,587 | — | 2,587 | — | |||||||||||||||||||||||||||
| Payable for securities | 199 | 199 | — | — | 199 | |||||||||||||||||||||||||||
| Separate account liabilities | 46,886 | 45,901 | 22,732 | 24,154 | — | |||||||||||||||||||||||||||
(b) The Company does not have any assets or liabilities measured at NAV that are included in Level 2 in this table. In addition, the Company has no assets or liabilities for which it is not practicable to measure at fair value. | ||||||||||||||||||||||||||||||||
| 45 of 67 | ||||||||
| 2021 | 2020 | |||||||
| Bonds | 47.0 | % | 80.0 | % | ||||
| Stocks | 21.0 | % | 20.0 | % | ||||
| Other Invested Assets | 32.0 | % | — | % | ||||
| 46 of 67 | ||||||||
| 2022 | $ | 11 | |||
| 2023 | 12 | ||||
| 2024 | 8 | ||||
| 2025 | — | ||||
| 2026 | — | ||||
| 2027 and beyond | — | ||||
| Total | $ | 31 | |||
| 47 of 67 | ||||||||
| 2021 | 2020 | ||||||||||
| Amortization: | |||||||||||
| Software amortization | 8 | 7 | |||||||||
| Net EDP balance, by major classes of assets: | |||||||||||
| Servers, computers and peripherals | — | 2 | |||||||||
| Software | 53 | 38 | |||||||||
| Net EDP balance | 53 | 40 | |||||||||
| Nonadmitted | (53) | (38) | |||||||||
| Net admitted EDP balance | $ | — | 2 | ||||||||
| December 31, 2021 | |||||||||||||||||
| Ordinary | Capital | Total | |||||||||||||||
| Total gross deferred tax assets | $ | 998 | 48 | 1,046 | |||||||||||||
| Statutory valuation allowance adjustments | — | — | — | ||||||||||||||
| Adjusted gross deferred tax assets | 998 | 48 | 1,046 | ||||||||||||||
| Deferred tax assets nonadmitted | (6) | — | (6) | ||||||||||||||
| Subtotal net admitted deferred tax assets | 992 | 48 | 1,040 | ||||||||||||||
| Deferred tax liabilities | (536) | (17) | (553) | ||||||||||||||
| Net admitted deferred tax assets (liabilities) | $ | 456 | 31 | 487 | |||||||||||||
| December 31, 2020 | |||||||||||||||||
| Ordinary | Capital | Total | |||||||||||||||
| Total gross deferred tax assets | $ | 911 | 52 | 963 | |||||||||||||
| Statutory valuation allowance adjustments | — | — | — | ||||||||||||||
| Adjusted gross deferred tax assets | 911 | 52 | 963 | ||||||||||||||
| Deferred tax assets nonadmitted | — | — | — | ||||||||||||||
| Subtotal net admitted deferred tax assets | 911 | 52 | 963 | ||||||||||||||
| Deferred tax liabilities | (684) | (6) | (690) | ||||||||||||||
| Net admitted deferred tax assets (liabilities) | $ | 227 | 46 | 273 | |||||||||||||
| 48 of 67 | ||||||||
| Change | |||||||||||||||||
| Ordinary | Capital | Total | |||||||||||||||
| Total gross deferred tax assets | $ | 87 | (4) | 83 | |||||||||||||
| Statutory valuation allowance adjustments | — | — | — | ||||||||||||||
| Adjusted gross deferred tax assets | 87 | (4) | 83 | ||||||||||||||
| Deferred tax assets nonadmitted | (6) | — | (6) | ||||||||||||||
| Subtotal net admitted deferred tax assets | 81 | (4) | 77 | ||||||||||||||
| Deferred tax liabilities | 147 | (10) | 137 | ||||||||||||||
| Net admitted deferred tax assets (liabilities) | $ | 228 | (14) | 214 | |||||||||||||
| December 31, 2021 | |||||||||||||||||
| Ordinary | Capital | Total | |||||||||||||||
| Federal income taxes paid in prior years recoverable through loss carrybacks (11.a) | $ | — | 48 | 48 | |||||||||||||
| Adjusted gross DTAs expected to be realized after application of the threshold limitations | — | — | — | ||||||||||||||
| Lesser of 11.b.i or 11.b.ii: | — | — | — | ||||||||||||||
| Adjusted gross DTAs expected to be realized following the balance sheet date (11.b.i.) | 456 | — | 456 | ||||||||||||||
| Adjusted gross DTAs allowed per limitation threshold (11.b.ii) | N/A | N/A | 1,533 | ||||||||||||||
| Lesser of 11.b.i or 11.b.ii | 456 | — | 456 | ||||||||||||||
| Adjusted gross DTAs offset by gross DTLs (11.c) | 536 | — | 536 | ||||||||||||||
| Deferred tax assets admitted | $ | 992 | 48 | 1,040 | |||||||||||||
| December 31, 2020 | |||||||||||||||||
| Ordinary | Capital | Total | |||||||||||||||
| Federal income taxes paid in prior years recoverable through loss carrybacks (11.a) | $ | — | 3 | 3 | |||||||||||||
| Adjusted gross DTAs expected to be realized after application of the threshold limitations | — | — | — | ||||||||||||||
| Lesser of 11.b.i or 11.b.ii: | — | — | — | ||||||||||||||
| Adjusted gross DTAs expected to be realized following the balance sheet date (11.b.i.) | 419 | 49 | 468 | ||||||||||||||
| Adjusted gross DTAs allowed per limitation threshold (11.b.ii) | N/A | N/A | 1,108 | ||||||||||||||
| Lesser of 11.b.i or 11.b.ii | 419 | 49 | 468 | ||||||||||||||
| Adjusted gross DTAs offset by gross DTLs (11.c) | 492 | — | 492 | ||||||||||||||
| Deferred tax assets admitted | $ | 911 | 52 | 963 | |||||||||||||
| 49 of 67 | ||||||||
| Change | |||||||||||||||||
| Ordinary | Capital | Total | |||||||||||||||
| Federal income taxes paid in prior years recoverable through loss carrybacks (11.a) | $ | — | 44 | 44 | |||||||||||||
| Adjusted gross DTAs expected to be realized after application of the threshold limitations | — | — | — | ||||||||||||||
| Lesser of 11.b.i or 11.b.ii: | — | — | — | ||||||||||||||
| Adjusted gross DTAs expected to be realized following the balance sheet date (11.b.i.) | 37 | (49) | (12) | ||||||||||||||
| Adjusted gross DTAs allowed per limitation threshold (11.b.ii) | N/A | N/A | 425 | ||||||||||||||
| Lesser of 11.b.i or 11.b.ii | 37 | (49) | (12) | ||||||||||||||
| Adjusted gross DTAs offset by gross DTLs (11.c) | 44 | — | 44 | ||||||||||||||
| Deferred tax assets admitted | $ | 81 | (5) | 76 | |||||||||||||
| December 31 | ||||||||||||||||||||||||||
| 2021 | 2020 | Change | ||||||||||||||||||||||||
| Ratio percentage used to determine recovery period and threshold limitation amount | 1,082 | % | 705 | % | 377 | % | ||||||||||||||||||||
| Amount of adjusted capital and surplus used to determine recovery period threshold limitation | $ | 10,218 | 7,386 | 2,832 | ||||||||||||||||||||||
| December 31, 2021 | |||||||||||||||||
| Ordinary | Capital | Total | |||||||||||||||
| Net admitted adjusted gross DTAs - (percentage of total net admitted adjusted gross DTAs) | — | % | — | % | — | % | |||||||||||
| December 31, 2020 | |||||||||||||||||
| Ordinary | Capital | Total | |||||||||||||||
| Net admitted adjusted gross DTAs - (percentage of total net admitted adjusted gross DTAs) | — | % | 93.7 | % | 93.7 | % | |||||||||||
| Change | |||||||||||||||||
| Ordinary | Capital | Total | |||||||||||||||
| Net admitted adjusted gross DTAs - (percentage of total net admitted adjusted gross DTAs) | — | % | (93.7) | % | (93.7) | % | |||||||||||
| 50 of 67 | ||||||||
| December 31 | 2021-2020 Change | 2020-2019 Change | |||||||||||||||||||||||||||
| 2021 | 2020 | 2019 | |||||||||||||||||||||||||||
| Current year federal tax expense (benefit) - ordinary income | $ | 1,091 | 18 | 773 | 1,073 | (755) | |||||||||||||||||||||||
| Current year foreign tax expense (benefit) - ordinary income | — | — | — | — | — | ||||||||||||||||||||||||
| Subtotal | 1,091 | 18 | 773 | 1,073 | (755) | ||||||||||||||||||||||||
| Current year tax expense - net realized capital gains (losses) | 249 | — | (11) | 249 | 11 | ||||||||||||||||||||||||
| Federal and foreign income taxes incurred | $ | 1,340 | 18 | 762 | 1,322 | (744) | |||||||||||||||||||||||
| December 31 | ||||||||||||||||||||
| Deferred tax assets | 2021 | 2020 | Change | |||||||||||||||||
| Ordinary: | ||||||||||||||||||||
| Unrealized losses | $ | 14 | — | 14 | ||||||||||||||||
| Deferred acquisition costs | 186 | 169 | 17 | |||||||||||||||||
| Expense accruals | 82 | 63 | 19 | |||||||||||||||||
| Policyholder reserves | 701 | 666 | 35 | |||||||||||||||||
| Fixed assets | — | — | — | |||||||||||||||||
| Nonadmitted assets | 15 | 13 | 2 | |||||||||||||||||
| Subtotal | 998 | 911 | 87 | |||||||||||||||||
| Statutory valuation allowance adjustment | — | — | — | |||||||||||||||||
| Nonadmitted ordinary deferred tax assets | (6) | — | (6) | |||||||||||||||||
| Admitted ordinary tax assets | 992 | 911 | 81 | |||||||||||||||||
| Capital: | ||||||||||||||||||||
| Impaired assets | 48 | 51 | (3) | |||||||||||||||||
| Unrealized losses | — | 1 | (1) | |||||||||||||||||
| Subtotal | 48 | 52 | (4) | |||||||||||||||||
| Statutory valuation allowance adjustment | — | — | — | |||||||||||||||||
| Nonadmitted capital deferred tax assets | — | — | — | |||||||||||||||||
| Admitted capital deferred tax assets | 48 | 52 | (4) | |||||||||||||||||
| Admitted deferred tax assets | $ | 1,040 | 963 | 77 | ||||||||||||||||
| 51 of 67 | ||||||||
| December 31 | ||||||||||||||||||||
| Deferred tax liabilities | 2021 | 2020 | Change | |||||||||||||||||
| Ordinary: | ||||||||||||||||||||
| Investments | $ | (53) | (54) | 1 | ||||||||||||||||
| Fixed assets | (4) | (5) | 1 | |||||||||||||||||
| Policyholder reserves | (356) | (445) | 89 | |||||||||||||||||
| Software capitalization | (11) | (7) | (4) | |||||||||||||||||
| Unrealized gains | (64) | (79) | 15 | |||||||||||||||||
| Other | (48) | (94) | 46 | |||||||||||||||||
| Subtotal | (536) | (684) | 148 | |||||||||||||||||
| Capital: | ||||||||||||||||||||
| Unrealized gains | (17) | (6) | (11) | |||||||||||||||||
| Subtotal | (17) | (6) | (11) | |||||||||||||||||
| Deferred tax liabilities | $ | (553) | (690) | 137 | ||||||||||||||||
| Net deferred tax assets (liabilities) | $ | 487 | 273 | 214 | ||||||||||||||||
| December 31 | |||||||||||||||||
| 2021 | 2020 | Change | |||||||||||||||
| Net deferred tax assets (liabilities) | $ | 493 | 273 | 220 | |||||||||||||
| Statutory valuation allowance adjustment | — | — | — | ||||||||||||||
| Net deferred tax assets (liabilities) after statutory valuation allowance | 493 | 273 | 220 | ||||||||||||||
| Tax effect of unrealized gains (losses) | 149 | 154 | (5) | ||||||||||||||
| Statutory valuation allowance adjustment allocated to unrealized gains (losses) | — | — | — | ||||||||||||||
| Change in net deferred income tax | $ | 215 | |||||||||||||||
| 52 of 67 | ||||||||
| December 31, 2021 | December 31, 2020 | December 31, 2019 | |||||||||||||||
| Federal income tax rate | 21.0 | % | 21.0 | % | 21.0 | % | |||||||||||
| Amortization of IMR | (1.9) | (1.3) | (3.6) | ||||||||||||||
| Dividends received deduction | (1.3) | (1.7) | (4.2) | ||||||||||||||
| Nondeductible expenses | 0.1 | — | 0.9 | ||||||||||||||
| Affiliated LLC income | (0.2) | (2.4) | — | ||||||||||||||
| COLI | (2.4) | (1.0) | (5.5) | ||||||||||||||
| Tax hedges | (6.5) | 0.2 | 65.8 | ||||||||||||||
| Tax hedge reclassification | 73.7 | 6.8 | 84.7 | ||||||||||||||
| Tax credits | (9.6) | (7.2) | (13.6) | ||||||||||||||
| Prior period adjustments | (1.2) | (0.6) | (0.4) | ||||||||||||||
| Change in deferred taxes on impairments | 0.6 | (5.0) | 3.6 | ||||||||||||||
| Change in deferred taxes on nonadmitted assets | (0.4) | (0.6) | (0.7) | ||||||||||||||
| Reinsurance | 83.5 | (5.5) | 19.8 | ||||||||||||||
| Correction of Error | 2.0 | — | — | ||||||||||||||
| NOL Carryback Benefit | — | (12.2) | — | ||||||||||||||
| Tax Contingencies | 10.6 | 5.5 | — | ||||||||||||||
| Realized Capital Gains Tax | 47.4 | (0.1) | — | ||||||||||||||
| Other | (1.4) | — | 0.6 | ||||||||||||||
| Effective tax rate | 214.0 | % | (4.1) | % | 168.4 | % | |||||||||||
Federal and foreign income taxes incurred (1) | 207.4 | % | 2.9 | % | 293.7 | % | |||||||||||
| Realized Capital Gains Tax | 47.4 | (0.1) | — | ||||||||||||||
| Change in net deferred tax | (40.8) | (6.9) | (125.3) | ||||||||||||||
| Effective tax rate | 214.0 | % | (4.1) | % | 168.4 | % | |||||||||||
(1) Prior to 2020, tax on capital gains (losses) was excluded from federal and foreign income taxes incurred and detailed in Note 5(c). | |||||||||||||||||
| 53 of 67 | ||||||||
| Members of Consolidated Tax Group | |||||
| Allianz Life Insurance Company of North America | Allianz Life Insurance Company of Missouri | ||||
| Allianz Life Insurance Company of New York | Allianz Underwriters Insurance Company | ||||
| AZOA Services Corporation | AGCS Marine Insurance Company | ||||
| Allianz Global Risks US Insurance Company | William H. McGee & Co., Inc. | ||||
| Allianz Reinsurance of America, Inc. | Allianz Reinsurance Management Services, Inc. | ||||
| Allianz Technology of America, Inc. | Fireman’s Fund Insurance Company | ||||
| Allianz Renewable Energy Partners of America LLC | Fireman’s Fund Indemnity Corporation | ||||
| Allianz Renewable Energy Partners of America 2 LLC | National Surety Corporation | ||||
| PFP Holdings, Inc. | Chicago Insurance Company | ||||
| AZL PF Investments, Inc. | Interstate Fire & Casualty Company | ||||
| Dresdner Kleinwort Pfandbriefe Investments II, Inc. | Associated Indemnity Corporation | ||||
| Allianz Fund Investments, Inc. | American Automobile Insurance Company | ||||
| Yorktown Financial Companies, Inc. | The American Insurance Company | ||||
| Questar Capital Corporation | Allianz Risk Transfer, Inc. | ||||
| Questar Agency, Inc. | Allianz Risk Transfer (Bermuda), Ltd. | ||||
| 54 of 67 | ||||||||
| 2021 | 2020 | 2019 | ||||||||||||||||||
| Balance at January 1, net of reinsurance recoverables of $665, $654, and $574, respectively | $ | 337 | 335 | 299 | ||||||||||||||||
| Incurred related to: | ||||||||||||||||||||
| Current year | 189 | 139 | 143 | |||||||||||||||||
| Prior years | (47) | (46) | (24) | |||||||||||||||||
| Total incurred | 142 | 93 | 119 | |||||||||||||||||
| Paid related to: | ||||||||||||||||||||
| Current year | 10 | 7 | 7 | |||||||||||||||||
| Prior years | 84 | 84 | 76 | |||||||||||||||||
| Total paid | 94 | 91 | 83 | |||||||||||||||||
| Balance at December 31, net of reinsurance recoverables of $734, $665, and $654, respectively | $ | 385 | 337 | 335 | ||||||||||||||||
| 55 of 67 | ||||||||
| For the years ended December 31, | ||||||||||||||
| Reduction in: | 2021 | 2020 | ||||||||||||
| Aggregate reserves | $ | 16,141 | 6,636 | |||||||||||
| Deposit-type contracts | 132 | 99 | ||||||||||||
| Policy and contract claims | 28 | 29 | ||||||||||||
| Year ended | Direct amount | Ceded to other companies | Assumed from other companies | Net amount | ||||||||||||||||||||||
| December 31, 2021 | ||||||||||||||||||||||||||
| Life insurance in-force | $ | 65,088 | 41,500 | 50 | 23,638 | |||||||||||||||||||||
| Premiums: | ||||||||||||||||||||||||||
| Life | 1,453 | 94 | 1 | 1,360 | ||||||||||||||||||||||
| Annuities | 13,226 | 623 | — | 12,603 | ||||||||||||||||||||||
| Accident and health | 168 | 68 | 62 | 162 | ||||||||||||||||||||||
| Total premiums | $ | 14,847 | 785 | 63 | 14,125 | |||||||||||||||||||||
| December 31, 2020 | ||||||||||||||||||||||||||
| Life insurance in-force | $ | 53,399 | 34,345 | 54 | 19,108 | |||||||||||||||||||||
| Premiums: | ||||||||||||||||||||||||||
| Life | 1,200 | 88 | 1 | 1,113 | ||||||||||||||||||||||
| Annuities | 9,473 | 398 | — | 9,075 | ||||||||||||||||||||||
| Accident and health | 170 | 68 | 56 | 158 | ||||||||||||||||||||||
| Total premiums | $ | 10,843 | 554 | 57 | 10,346 | |||||||||||||||||||||
| December 31, 2019 | ||||||||||||||||||||||||||
| Life insurance in-force | $ | 45,817 | 30,060 | 58 | 15,815 | |||||||||||||||||||||
| Premiums: | ||||||||||||||||||||||||||
| Life | 989 | 88 | 1 | 902 | ||||||||||||||||||||||
| Annuities | 12,135 | 387 | — | 11,748 | ||||||||||||||||||||||
| Accident and health | 172 | 70 | 53 | 155 | ||||||||||||||||||||||
| Total premiums | $ | 13,296 | 545 | 54 | 12,805 | |||||||||||||||||||||
| 56 of 67 | ||||||||
| 57 of 67 | ||||||||
| 2021 | Percentage of total | 2020 | Percentage of total | |||||||||||||||||||||||
| Subject to discretionary withdrawal: | ||||||||||||||||||||||||||
| With market value adjustment | $ | 48,992 | 33 | % | $ | 43,198 | 31 | % | ||||||||||||||||||
| At book value less current surrender charges of 5% or more | 37,866 | 25 | 36,364 | 26 | ||||||||||||||||||||||
| At market value | 20,998 | 13 | 21,361 | 14 | ||||||||||||||||||||||
| Total with adjustment or at market value | 107,856 | 71 | 100,923 | 71 | ||||||||||||||||||||||
| At book value without adjustment (minimal or no charge or adjustment) | 33,967 | 23 | 30,641 | 22 | ||||||||||||||||||||||
| Not subject to discretionary withdrawal | 7,380 | 5 | 8,133 | 6 | ||||||||||||||||||||||
| Total gross | 149,203 | 100 | % | 139,697 | 100 | % | ||||||||||||||||||||
| Reinsurance ceded | 11,960 | 2,523 | ||||||||||||||||||||||||
| Total net | $ | 137,243 | $ | 137,174 | ||||||||||||||||||||||
| Amount included in At book value less current charges of 5% or more that will move to At book value without adjustment in the year after the statement date: | $ | 2,798 | $ | 6,776 | ||||||||||||||||||||||
| Reconciliation of total annuity actuarial reserves and deposit fund liabilities: | 2021 | 2020 | ||||||||||||
| Life, Accident and Health Annual Statement: | ||||||||||||||
| Annuities, net (excluding supplementary contracts with life contingencies) | $ | 88,413 | 95,185 | |||||||||||
| Supplemental contracts with life contingencies, net | 2,083 | 2,091 | ||||||||||||
| Deposit-type contracts | 4,577 | 4,749 | ||||||||||||
| Subtotal | 95,073 | 102,025 | ||||||||||||
| Separate Accounts Annual Statement: | ||||||||||||||
| Annuities, net (excluding supplementary contracts with life contingencies) | 42,155 | 35,137 | ||||||||||||
| Supplemental contracts with life contingencies, net | 15 | 11 | ||||||||||||
| Subtotal | 42,170 | 35,148 | ||||||||||||
| Total annuity actuarial reserves and deposit fund liabilities | $ | 137,243 | 137,174 | |||||||||||
| 58 of 67 | ||||||||
| 2021 | |||||||||||
| General Account | Account value | Cash value | Reserve | ||||||||
| Subject to discretionary withdrawal, surrender values, or policy loans: | |||||||||||
| Universal life | $ | 817 | 816 | 822 | |||||||
| Universal life with secondary guarantees | 59 | 53 | 144 | ||||||||
| Indexed life | 6,871 | 5,945 | 5,989 | ||||||||
| Other permanent cash value life insurance | 105 | 105 | 105 | ||||||||
| Variable universal life | 2 | 2 | 2 | ||||||||
| Not subject to discretionary withdrawal or no cash values: | |||||||||||
| Term policies without cash value | XXX | XXX | 199 | ||||||||
| Disability, active lives | XXX | XXX | 49 | ||||||||
| Disability, disabled lives | XXX | XXX | 6 | ||||||||
| Miscellaneous reserves | XXX | XXX | 46 | ||||||||
| Total gross | 7,854 | 6,921 | 7,362 | ||||||||
| Reinsurance ceded | 616 | 616 | 878 | ||||||||
| Total net | $ | 7,238 | 6,305 | 6,484 | |||||||
| 2020 | |||||||||||
| General Account | Account value | Cash value | Reserve | ||||||||
| Subject to discretionary withdrawal, surrender values, or policy loans: | |||||||||||
| Universal life | $ | 845 | 844 | 851 | |||||||
| Universal life with secondary guarantees | 61 | 54 | 158 | ||||||||
| Indexed life | 5,458 | 4,701 | 4,738 | ||||||||
| Other permanent cash value life insurance | 115 | 115 | 115 | ||||||||
| Variable universal life | 3 | 3 | 3 | ||||||||
| Not subject to discretionary withdrawal or no cash values: | |||||||||||
| Term policies without cash value | XXX | XXX | 204 | ||||||||
| Disability, active lives | XXX | XXX | 48 | ||||||||
| Disability, disabled lives | XXX | XXX | 6 | ||||||||
| Miscellaneous reserves | XXX | XXX | 54 | ||||||||
| Total gross | 6,482 | 5,717 | 6,177 | ||||||||
| Reinsurance ceded | 645 | 644 | 904 | ||||||||
| Total net | $ | 5,837 | 5,073 | 5,273 | |||||||
| The Company does not have any Life policies with guarantees in the separate account. | |||||||||||
| 2021 | |||||||||||
| Separate Account Nonguaranteed | Account value | Cash value | Reserve | ||||||||
| Subject to discretionary withdrawal, surrender values, or policy loans: | |||||||||||
| Variable universal life | $ | 21 | 21 | 21 | |||||||
| Total gross | 21 | 21 | 21 | ||||||||
| 59 of 67 | ||||||||
| Reinsurance ceded | — | — | — | ||||||||
| Total net | $ | 21 | 21 | 21 | |||||||
| 2020 | |||||||||||
| Separate Account Nonguaranteed | Account Value | Cash Value | Reserve | ||||||||
| Subject to discretionary withdrawal, surrender values, or policy loans: | |||||||||||
| Variable universal life | $ | 19 | 18 | 18 | |||||||
| Total gross | 19 | 18 | 18 | ||||||||
| Reinsurance ceded | — | — | — | ||||||||
| Total net | $ | 19 | 18 | 18 | |||||||
| Reconciliation of total life actuarial reserves: | 2021 | 2020 | ||||||
| Life, Accident, and Health Annual Statement: | ||||||||
| Life insurance, net | $ | 6,412 | $ | 5,210 | ||||
| Disability, active lives, net | 47 | 47 | ||||||
| Disability, disabled lives, net | 1 | 1 | ||||||
| Miscellaneous reserves, net | 24 | 14 | ||||||
| Subtotal | 6,484 | 5,273 | ||||||
| Separate Accounts Annual Statement: | ||||||||
| Life insurance, net | 21 | 18 | ||||||
| Subtotal | 21 | 18 | ||||||
| Total life actuarial reserves | $ | 6,505 | $ | 5,291 | ||||
| 2021 | 2020 | ||||||||||
| Premiums, considerations, or deposits | 5,927 | 4,149 | |||||||||
| Reserves for accounts with assets at fair value | 21,209 | 21,574 | |||||||||
| Reserves for accounts with assets at amortized cost | 20,982 | 13,592 | |||||||||
| Total reserves | 42,191 | 35,166 | |||||||||
| By withdrawal characteristics: | |||||||||||
| At book value without MV adjustment and with current surrender charge of 5% or more | 18,665 | 12,643 | |||||||||
| At fair value | 21,166 | 21,535 | |||||||||
| At book value without MV adjustment and with current surrender charge of less than 5% | 2,326 | 959 | |||||||||
| Subtotal | 42,157 | 35,137 | |||||||||
| Not subject to discretionary withdrawal | 34 | 29 | |||||||||
| Total | 42,191 | 35,166 | |||||||||
| 60 of 67 | ||||||||
| 2021 | 2020 | |||||||||||||||||||
| Product/transaction | Legally insulated | Not legally insulated | Legally insulated | Not legally insulated | ||||||||||||||||
| Variable Annuities | $ | 21,158 | — | 21,602 | — | |||||||||||||||
| Variable Life | 21 | — | 19 | — | ||||||||||||||||
| Variable Annuities (Non-Unitized Insulated) | 524 | — | 998 | — | ||||||||||||||||
| Variable Annuities (Non-Unitized Non-Insulated) | — | 26,548 | — | 23,244 | ||||||||||||||||
| Variable Annuities (MN MVA) | — | 28 | — | 38 | ||||||||||||||||
| Total | $ | 21,703 | 26,576 | 22,619 | 23,282 | |||||||||||||||
| 2021 | 2020 | 2019 | |||||||||||||||
| Transfers as reported in the Summary of Operations of the Separate Accounts Annual Statement: | |||||||||||||||||
| Transfers to separate accounts | $ | 5,927 | 4,149 | 1,277 | |||||||||||||
| Transfers from separate accounts | (3,507) | (2,689) | 3,975 | ||||||||||||||
| Net transfers to separate accounts | 2,420 | 1,460 | 5,252 | ||||||||||||||
| Reconciling adjustments: | |||||||||||||||||
| Other adjustments | 4 | — | 2 | ||||||||||||||
| Transfers as reported in the Statutory Statements of Operations | $ | 2,424 | 1,460 | 5,254 | |||||||||||||
| 61 of 67 | ||||||||
| 62 of 67 | ||||||||
| 2021 | 2020 | 2019 | ||||||||||||||||||
| Allianz Investment Management, LLC | $ | 41 | 51 | 56 | ||||||||||||||||
| ALFS | — | — | 2 | |||||||||||||||||
| AZL PF Investments, Inc. | — | 50 | — | |||||||||||||||||
| Allianz Individual Insurance Group, LLC (AIIG) | 4 | — | — | |||||||||||||||||
| Yorktown | — | — | 9 | |||||||||||||||||
| Total | $ | 45 | 101 | 67 | ||||||||||||||||
| 2021 | 2020 | 2019 | ||||||||||||||||||
| Yorktown | $ | — | — | 1 | ||||||||||||||||
| Allianz Investment Management U.S. LLC (AIM US) | 8 | 1 | — | |||||||||||||||||
| ALFS | 48 | 20 | 8 | |||||||||||||||||
| ASI | $ | 66 | $ | — | $ | — | ||||||||||||||
| Total | $ | 122 | 21 | 9 | ||||||||||||||||
| 63 of 67 | ||||||||
| 64 of 67 | ||||||||
| Authorized | Issued and outstanding | Par value, per share | Redemption and liquidation rights | |||||||||||||||||||||||
| Common stock | 40,000,000 | 20,000,001 | $ | 1.00 | None | |||||||||||||||||||||
| Preferred stock: | ||||||||||||||||||||||||||
| Class A (consisting of Series A and B below) | 200,000,000 | 18,903,484 | $ | 1.00 | Designated by Board for each series issued | |||||||||||||||||||||
| Class A, Series A | 8,909,195 | 8,909,195 | $ | 1.00 | $35.02 per share plus an amount to yield a compounded annual return of 6%, after actual dividends paid | |||||||||||||||||||||
| Class A, Series B | 10,000,000 | 9,994,289 | $ | 1.00 | $35.02 per share plus an amount to yield a compounded annual return of 6%, after actual dividends paid | |||||||||||||||||||||
| Class B | 400,000,000 | — | $ | 1.00 | Designated by Board for each series issued | |||||||||||||||||||||
| 65 of 67 | ||||||||
| 66 of 67 | ||||||||
| 67 of 67 | ||||||||
| To send an application, a check for an additional Purchase Payment, or for general customer service, please mail to the appropriate address as follows: |
| REGULAR MAIL |
| Allianz Life Insurance Company of North America P.O. Box 59060 Minneapolis, MN 55459-0060 |
| OVERNIGHT, CERTIFIED, OR REGISTERED MAIL |
| Allianz Life Insurance Company of North America 5701 Golden Hills Drive Golden Valley, MN 55416-1297 |
| Checks sent to the wrong address for applications or additional Purchase Payments are forwarded to the 5701 Golden Hills Drive address listed above, which may delay processing. |