| | | |
| | OMB APPROVAL | |
| | OMB Number: 3235-0570 | |
| | Expires: January 31, 2014 | |
| | Estimated average burden hours per response: 20.6 | |
| |
UNITED STATES
SECURITIES AND EXCHANGE COMMISSION
Washington, D.C. 20549
FORM N-CSR
CERTIFIED SHAREHOLDER REPORT OF REGISTERED MANAGEMENT
INVESTMENT COMPANIES
Investment Company Act file number 811-03826
AIM Sector Funds (Invesco Sector Funds)*
(Exact name of registrant as specified in charter)
11 Greenway Plaza, Suite 2500 Houston, Texas 77046
(Address of principal executive offices) (Zip code)
Philip A. Taylor 11 Greenway Plaza, Suite 2500 Houston, Texas 77046
(Name and address of agent for service)
Registrant’s telephone number, including area code: (713) 626-1919
Date of fiscal year end: 3/31
Date of reporting period: 3/31/11
*Funds included are: Invesco Technology Sector Fund and Invesco Van Kampen Utility Fund.
Item 1. Reports to Stockholders.
| | |
| Annual Report to Shareholders | | March 31, 2011 |
Invesco Technology Sector Fund
Nasdaq:
A: IFOAX n B: IFOBX n C: IFOCX n Y: IFODX
| | |
|
| 2 | | Letters to Shareholders |
| 4 | | Performance Summary |
| 4 | | Management Discussion |
| 6 | | Long-Term Fund Performance |
| 8 | | Supplemental Information |
| 9 | | Schedule of Investments |
| 11 | | Financial Statements |
| 13 | | Notes to Financial Statements |
| 20 | | Financial Highlights |
| 21 | | Auditor’s Report |
| 22 | | Fund Expenses |
| T-1 | | Trustees and Officers |
Letters to Shareholders

Philip Taylor
Dear Shareholders:
Enclosed is important information about your Fund and its performance.
I’ve always believed that companies have an obligation to communicate regularly with their clients, and I believe that obligation is especially critical in the investment industry.
Our website – invesco.com/us – offers timely market updates and commentary from many of our portfolio managers and other investment professionals, as well as quarterly messages from me. At invesco.com/us, you also can obtain information about your account at any hour of the day or night. I invite you to visit and explore the tools and information we offer.
Invesco’s commitment to investment excellence
Invesco’s 2010 acquisition of Morgan Stanley’s retail asset management business, including Van Kampen Investments, broadened our range of investment products available to you. As a strong organization with a single focus – investment management – Invesco today offers investment capabilities and products to meet the needs of virtually any investor. In addition to traditional mutual funds, we manage a broad range of other solutions, including single-country, regional and global investments spanning major equity, fixed income and alternative asset classes.
Investment excellence is our goal across our product line. Let me explain what that means. All of our funds are managed by specialized teams of investment professionals. Each team has a discrete investment perspective and philosophy, and all follow disciplined, repeatable processes governed by strong risk oversight. Our investment-centric culture provides an environment that seeks to reduce distractions, allowing our fund managers to concentrate on what they do best – manage your money.
The importance of a broad product line and investment management expertise is obvious given the markets we’ve experienced over the last two to three years. We’ve seen that investment strategies can outperform or underperform their benchmark indexes for a variety of reasons, including where we are in the market cycle, and whether prevailing economic conditions are favorable or unfavorable for that strategy. That’s why no investment strategy can guarantee top-tier performance at all times. What investors can expect, and what Invesco offers, are funds that are managed according to their stated investment objectives and strategies, with robust risk oversight using consistent, repeatable investment processes that don’t change as short-term external conditions change – investments managed for the long term. This disciplined approach can’t guarantee a profit; no investment can do that, since all involve some measure of risk. But it can ensure that your money is managed the way we said it would be.
This adherence to stated investment objectives and strategies allows your financial advisor to build a diversified portfolio that meets your individual risk tolerance and financial goals. It also means that when your goals change, your financial advisor will be able to find an appropriate investment option to meet your needs.
Invesco’s commitment to you
Invesco’s commitment to you remains stronger than ever. It’s one of the reasons we’ve grown to become one of the world’s leading asset managers.
If you have questions about your account, please contact one of our client service representatives at 800 959 4246. If you have a general Invesco-related question or comment for me, I invite you to email me directly at phil@invesco.com.
I want to thank you for placing your trust in us. All of us at Invesco look forward to serving your investment management needs for many years to come. Thank you for investing with us.
Sincerely,
Philip Taylor
Senior Managing Director
Invesco Ltd.
2 Invesco Technology Sector Fund

Bruce Crockett
Dear Fellow Shareholders:
With 2010 behind us, now is a good time to review our portfolios and ensure that we are adhering to a long-term, diversified investment strategy, which I’ve mentioned in previous letters. The year was notable for a number of reasons, but I’m sure most of us are grateful for a return to more stable markets and growing signs that the worst of the economic crisis is behind us.
Your Board continued to oversee the Invesco Funds with a strong sense of responsibility for your savings and a deep appreciation for your continued trust. As always, we worked throughout 2010 to manage costs and ensure Invesco continued to place investor interests first.
I’m pleased to report that the latest report from Morningstar affirmed the work we’ve done and included a number of positive comments regarding your Board’s oversight of the Invesco Funds. As background, Morningstar is a leading independent provider of investment research in North America, Europe, Australia and Asia. Morningstar stated, “A fund board’s duty is to represent the interests of fund shareholders, ensuring that the funds that it oversees charge reasonable fees and are run by capable advisors with a sound investment process.”
Morningstar maintained your Fund Board’s “A” grade for Board Quality, praising the Board for taking “meaningful steps in recent years to act in fund shareholders’ interests.”1 These steps included becoming much more proactive and vocal in overseeing how Invesco votes the funds’ shareholders’ proxies and requiring each fund trustee to invest more than one year’s board compensation in Invesco funds, further aligning our interests with those of our shareholders. Morningstar also cited the work I’ve done to make myself more available to fund shareholders via email.
I am also pleased that Morningstar recognized the effort and the Fund Board’s efforts over the past several years to work together with management at Invesco to enhance performance and sharpen the focus on investors.
As always, you’re welcome to contact me at bruce@brucecrockett.com with any questions or concerns you have. We look forward to representing and serving you.
Sincerely,

Bruce L. Crockett
Independent Chair
Invesco Funds Board of Trustees
| | |
| 1 | | Among the criteria Morningstar considers when evaluating a fund board are the degree to which the board is independent of the fund company; board members’ financial interests are aligned with those of fund shareholders; the board acts in fund shareholders’ interests; and the board works constructively with company management and investment personnel. Morningstar first awarded an “A” rating to the Invesco Funds board on September 13, 2007; that rating has been maintained in subsequent reports, the most recent of which was released December 17, 2010. Ratings are subject to change, usually every 12 to 24 months. Morningstar ratings range from “A” to “F.” |
3 Invesco Technology Sector Fund
Management’s Discussion of Fund Performance
Performance summary
The economy continued to show signs of improvement during the fiscal year ended March 31, 2011, helping to boost equity markets. Invesco Technology Sector Fund underperformed the S&P 500 Index and the New York Stock Exchange (NYSE) Arca Tech 100 Index, its broad market and style-specific indexes, respectively, during the reporting period. Relative to the NYSE Arca Tech 100 Index, the Fund’s security selection in the semiconductors and semiconductor equipment and technology hardware and equipment industries negatively affected performance.
Your Fund’s long-term performance appears later in this report.
Fund vs. Indexes
Total returns, 3/31/10 to 3/31/11, at net asset value (NAV). Performance shown does not include applicable contingent deferred sales charges (CDSC) or front-end sales charges, which would have reduced performance.
| | | | | |
|
| Class A Shares | | | 14.02 | % |
| |
| Class B Shares | | | 13.17 | |
| |
| Class C Shares | | | 13.30 | |
| |
| Class Y Shares | | | 14.35 | |
| |
S&P 500 Index▼ (Broad Market Index) | | | 15.66 | |
| |
NYSE Arca Tech 100 Index (price only)▼ (Style-Specific Index) | | | 24.51 | |
| |
Lipper Science & Technology Funds Index▼ (Peer Group Index) | | | 21.20 | |
| |
How we invest
Effective June 25, 2010, the management team for Invesco Technology Sector Fund changed. Following is the new team’s investment process.
We seek to grow capital by investing in companies we believe generate sustainable, superior earnings and cash flow growth that is not fully reflected in investor expectations or equity valuations. The Fund emphasizes companies believed to have a strategic advantage over their competition and operating in industries believed to be beneficiaries of secular trends. The Fund invests in industries such as hardware, software, telecommunications equipment and services, and semiconductors – and in service-related companies in the information technology (IT) sector. We use a research-oriented, bottom-up investment approach focusing on company fundamentals and growth prospects.
We place great emphasis on companies exhibiting high returns on invested capital and generating free cash flow, metrics we believe are good indicators of financial health and growth potential. We seek companies with management teams that maintain high quality balance sheets and manageable debt levels. Valuation also plays a critical role in stock selection.
Risk management is an integral part of our portfolio construction process as we attempt to limit volatility and downside risk. Only stocks that exhibit a proper balance of risk and reward are chosen for inclusion in the portfolio. We seek to accomplish this goal by thoroughly understanding the key business drivers of companies in which we invest. The portfolio is constructed with the goal of holding approximately 40 to 60 individual stocks we believe are best suited to capitalize on secular trends prevalent in the IT sector.
We may reduce or eliminate our holding in a stock when:
| n | | A stock’s price reaches its valuation target. |
| |
| n | | A company’s fundamentals change or deteriorate. |
| |
| n | | It no longer meets our investment criteria. |
Market conditions and your Fund
Equity markets were choppy during the fiscal year as investors weighed the competing issues of solid corporate profits, soft macroeconomic data and geopolitical uncertainty. Corporate earnings were largely positive but often overshadowed by concerns about high unemployment, a lack of consumer spending, soft housing data and the possibility of additional U.S. Federal Reserve accommodation. After rising through April, major equity indexes sold off precipitously in May as the sovereign debt crisis unfolded in the eurozone while U.S. economic indicators remained weak, prompting concerns of a “double-dip” recession. Uncertainty created by the debt crisis combined with subdued employment, consumer spending and housing data added to concerns that the recovery was slowing to a subnormal growth rate. Just as abruptly, the markets reversed course and rallied from September to February on modestly better economic news. However, unrest in the Middle East/North Africa region and natural disasters in Japan stalled the rally during most of March. Despite these events, the broad market ended the fiscal year with double-digit gains.
Major equity indexes garnered positive returns for the fiscal year, and all 10 sectors of the S&P 500 Index posted gains.1 Investors favored the energy, telecommunication services and materials sectors. Conversely, financials, health care and consumer staples were the
Portfolio Composition
By sector
| | | | | |
|
| Information Technology | | | 95.2 | % |
| |
| Consumer Discretionary | | | 2.9 | |
| |
| Materials | | | 1.2 | |
| |
Money Market Funds | | | | |
Plus Other Assets Less Liabilities | | | 0.7 | |
Top 10 Equity Holdings*
| | | | | | | | | |
|
| | 1. | | | Apple, Inc. | | | 6.7 | % |
| |
| | 2. | | | Check Point Software Technologies Ltd. | | | 3.9 | |
| |
| | 3. | | | Novellus Systems, Inc. | | | 3.5 | |
| |
| | 4. | | | Google, Inc.–Class A | | | 3.5 | |
| |
| | 5. | | | QUALCOMM, Inc. | | | 3.3 | |
| |
| | 6. | | | MasterCard, Inc.–Class A | | | 3.1 | |
| |
| | 7. | | | EMC Corp. | | | 2.9 | |
| |
| | 8. | | | SanDisk Corp. | | | 2.9 | |
| |
| | 9. | | | TE Connectivity Ltd. | | | 2.7 | |
| |
| | 10. | | | Oracle Corp. | | | 2.4 | |
| | | | |
|
| Total Net Assets | | $126.2 million | |
| | | | | |
| Total Number of Holdings* | | | 63 | |
The Fund’s holdings are subject to change, and there is no assurance that the Fund will continue to hold any particular security.
*Excluding money market fund holdings.
4 Invesco Technology Sector Fund
worst-performing market sectors. Despite strong returns in the 2009 calendar year, the IT sector underperformed the broad market for the Fund’s fiscal year.1
Relative to the NYSE Arca Tech 100 Index, the Fund’s underweight position in the health care equipment and services industry and lack of exposure to the capital goods industry enhanced performance during the reporting period. On the other hand, the Fund’s security selection in the semiconductors and semiconductor equipment and technology hardware and equipment industries detracted from relative performance.
Top contributors to the Fund’s absolute performance during the fiscal year were innovative device maker Apple and security software developer Check Point Software Technologies. Top detractors included Research in Motion, a communications equipment company, and Western Digital, a hard disk drive producer. We sold our positions in Research in Motion and Western Digital during the reporting period.
During the Fund’s fiscal year, IT had more exposure to domestic financial services firms than any other market sector. As such, we remained conscious of the headwinds affecting business and consumer spending on IT products. Longer term, we continue to see positive trends in the IT sector because we believe three key secular themes, which are independent of short-term catalysts, continue to offer support:
| n | | Globalization. Productivity gains support increasing technology use in international markets. |
| |
| n | | Consumerization. Technology demand is consumer driven. |
| |
| n | | Proliferation. Technology continues to penetrate products ranging from automobiles and industrial controls to sporting gear and alternative energy. As always, we thank you for your continued investment in Invesco Technology Sector Fund. |
1 Lipper Inc.
The views and opinions expressed in management’s discussion of Fund performance are those of Invesco Advisers, Inc. These views and opinions are subject to change at any time based on factors such as market and economic conditions. These views and opinions may not be relied upon as investment advice or recommendations, or as an offer for a particular security. The information is not a complete analysis of every aspect of any market, country, industry, security or the Fund. Statements of fact are from sources considered reliable, but Invesco Advisers, Inc. makes no representation or warranty as to their completeness or accuracy. Although historical performance is no guarantee of future results, these insights may help you understand our investment management philosophy.
See important Fund and, if applicable, index disclosures later in this report.
Warren Tennant
Chartered Financial Analyst, portfolio manager, is lead manager of Invesco Technology Sector Fund. He joined Invesco in 2000. Mr. Tennant earned a B.B.A. in finance and an M.B.A. from The University of Texas at Austin.
Brian Nelson
Chartered Financial Analyst, portfolio manager, is manager of Invesco Technology Sector Fund. He joined Invesco in 2004. Mr. Nelson earned a B.A. from the University of California Santa Barbara.
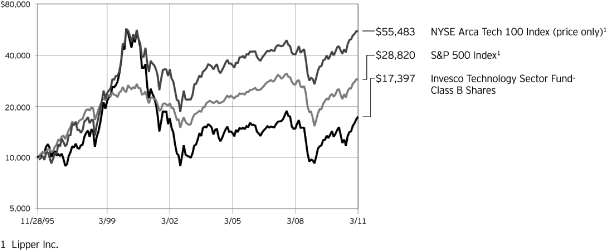
5 Invesco Technology Sector Fund
Your Fund’s Long-Term Performance
Results of a $10,000 Investment – Oldest Share Class since Inception
Fund data from 11/28/95, index data from 11/30/95
Past performance cannot guarantee comparable future results.
The data shown in the chart include reinvested distributions, applicable sales charges and Fund expenses including management fees. Results for Class B shares are calculated as if a hypothetical shareholder had liquidated his entire investment in the Fund at the close of the reporting period and paid the applicable contingent deferred sales charges. Index results include reinvested dividends, but they do not reflect sales charges.
Performance of the peer group, if applicable, reflects fund expenses and management fees; performance of a market index does not. Performance shown in the chart and table(s) does not reflect deduction of taxes a shareholder would pay on Fund distributions or sale of Fund shares.
This chart, which is a logarithmic chart, presents the fluctuations in the value of the Fund and its indexes. We believe that a logarithmic chart is more effective than other types of charts in illustrating
changes in value during the early years shown in the chart. The vertical axis, the one that indicates the dollar value of an investment, is constructed with each segment representing a percent change in the value of the investment. In this chart, each segment represents a doubling, or 100% change, in the value of the investment. In other words, the space between $5,000 and $10,000 is the same size as the space between $10,000 and $20,000, and so on.
6 Invesco Technology Sector Fund
Average Annual Total Returns
As of 3/31/11, including maximum applicable sales charges
| | | | | | | | | |
|
| Class A Shares | | | | |
| |
| Inception (7/28/97) | | | 3.04 | % |
| |
| | 10 | | | Years | | | -2.79 | |
| |
| | 5 | | | Years | | | 0.72 | |
| |
| | 1 | | | Year | | | 7.73 | |
| |
| | | | | | | | | |
| Class B Shares | | | | |
| |
| Inception (11/28/95) | | | 3.68 | % |
| |
| | 10 | | | Years | | | -2.86 | |
| |
| | 5 | | | Years | | | 0.72 | |
| |
| | 1 | | | Year | | | 8.17 | |
| |
| | | | | | | | | |
| Class C Shares | | | | |
| |
| Inception (7/28/97) | | | 2.69 | % |
| |
| | 10 | | | Years | | | -2.97 | |
| |
| | 5 | | | Years | | | 1.10 | |
| |
| | 1 | | | Year | | | 12.30 | |
| |
| | | | | | | | | |
| Class Y Shares | | | | |
| |
| Inception (7/28/97) | | | 3.70 | % |
| |
| | 10 | | | Years | | | -2.03 | |
| |
| | 5 | | | Years | | | 2.11 | |
| |
| | 1 | | | Year | | | 14.35 | |
Effective June 1, 2010, Class A, Class B, Class C and Class I shares of the predecessor fund advised by Morgan Stanley Investment Advisors Inc. were reorganized into Class A, Class B, Class C and Class Y shares, respectively, of Invesco Technology Sector Fund. Returns shown above for Class A, Class B, Class C and Class Y shares are blended returns of the predecessor fund and Invesco Technology Sector Fund. Share class returns will differ from the predecessor fund because of different expenses.
The performance data quoted represent past performance and cannot guarantee comparable future results; current performance may be lower or higher. Please visit invesco.com/performance for the most recent month-end performance. Performance figures reflect reinvested distributions, changes in net asset value and the effect of the maximum sales charge unless otherwise stated. Investment return and principal value will fluctuate so that you may have a gain or loss when you sell shares.
The total annual Fund operating expense ratio set forth in the most recent Fund prospectus as of the date of this report for Class A, Class B, Class C and Class Y shares was 1.95%, 2.70%, 2.70% and 1.70%, respectively. The expense ratios presented above may vary from the expense ratios presented in other sections of this report that are based on expenses incurred during the period covered by this report.
Class A share performance reflects the maximum 5.50% sales charge, and Class B and Class C share performance reflects the applicable contingent deferred sales charge (CDSC) for the period involved. The CDSC on Class B shares declines from 5% beginning at the time of purchase to 0% at the beginning of the seventh year. The CDSC on Class C shares is 1% for the first year after purchase. Class Y shares do not have a front-end sales charge or a CDSC; therefore, performance is at net asset value.
The performance of the Fund’s share classes will differ primarily due to different sales charge structures and class expenses.
continued from page 8
| n | | The Fund is not managed to track the performance of any particular index, including the index(es) defined here, and consequently, the performance of the Fund may deviate significantly from the performance of the index(es). |
| |
| n | | A direct investment cannot be made in an index. Unless otherwise indicated, index results include reinvested dividends, and they do not reflect sales charges. Performance of the peer group, if applicable, reflects fund expenses; performance of a market index does not. |
Other information
| n | | The Chartered Financial Analyst® (CFA®) designation is globally recognized and attests to a charterholder’s success in a rigorous and comprehensive study program in the field of investment management and research analysis. |
| |
| n | | The returns shown in management’s discussion of Fund performance are based on net asset values calculated for shareholder transactions. Generally accepted accounting principles require adjustments to be made to the net assets of the Fund at period end for |
| | | financial reporting purposes, and as such, the net asset values for shareholder transactions and the returns based on those net asset values may differ from the net asset values and returns reported in the Financial Highlights. |
| |
| n | | Industry classifications used in this report are generally according to the Global Industry Classification Standard, which was developed by and is the exclusive property and a service mark of MSCI Inc. and Standard & Poor’s. |
7 Invesco Technology Sector Fund
Invesco Technology Sector Fund’s investment objective is long-term capital appreciation.
| n | | Unless otherwise stated, information presented in this report is as of March 31, 2011, and is based on total net assets. |
| |
| n | | Unless otherwise noted, all data provided by Invesco. |
| |
| n | | To access your Fund’s reports/prospectus, visit invesco.com/fundreports. |
About share classes
| n | | Class B or Class B5 shares may not be purchased or acquired by exchange from share classes other than Class B or Class B5 shares. Please see the prospectus for more information. |
| |
| n | | Class Y shares are available to only certain investors. Please see the prospectus for more information. |
Principal risks of investing in the Fund
| n | | Active trading risk. The Fund may engage in frequent trading of portfolio securities. Active trading results in added expenses and may result in a lower return and increased tax liability. |
| n | | Technology companies risk. Common stock and other equity securities of companies that rely extensively on technology, science or communications in their product development or operations may be more volatile than the overall stock market due to the fact that these companies operate in rapidly changing fields, and the stocks of these companies may be subject to abrupt or erratic market movements. These companies may have limited product lines, markets or financial resources and management may be more dependent upon one or a few key people. |
| n | | Common stock and other equity securities risk. In general, stock and other equity security values fluctuate, and sometimes widely fluctuate, in response to activities specific to the company as well as general market, economic and political conditions. Investments in convertible securities subject the Fund to the risks associated with both fixed-income securities, including credit risk and interest rate risk, and common stocks. To the extent that a convertible security’s investment value is greater than its conversion value, its price will be likely to increase when interest rates fall and decrease when interest rates rise. If the conversion value exceeds the investment value, |
| | | the price of the convertible security will tend to fluctuate directly with the price of the underlying equity security. |
| |
| n | | Foreign and emerging market securities risk. Investments in foreign markets entail special risks such as currency, political, economic and market risks. There also may be greater market volatility, less reliable financial information, higher transaction and custody costs, decreased market liquidity and less government and exchange regulation associated with investments in foreign markets. The risks of investing in emerging market countries are greater than risks associated with investments in foreign developed countries. Emerging market or developing countries may have relatively unstable governments, economies based on only a few industries and securities markets that trade a small number of securities. Securities issued by companies located in these countries tend to be especially volatile and may be less liquid than securities traded in developed countries. In connection with its investment in foreign securities, the Fund also may enter into contracts with banks, brokers or dealers to purchase or sell securities or foreign currencies at a future date (forward contracts). Hedging the Fund’s currency risks involves the risk of mismatching the Fund’s objectives under a forward or futures contract with the value of securities denominated in a particular currency. There is additional risk that such transactions reduce or preclude the opportunity for gain and that currency contracts create exposure to currencies in which the Fund’s securities are not denominated. |
| |
| n | | Derivatives risk. A derivative instrument often has risks similar to its underlying instrument and may have additional risks, including imperfect correlation between the value of the derivative and the underlying instrument, risks of default by the other |
| | | party to certain transactions, magnification of losses incurred due to changes in the market value of the securities, instruments, indices or interest rates to which they relate, and risks that the transactions may not be liquid. Certain derivative transactions may give rise to a form of leverage. |
| |
| n | | Options and futures risk. A decision as to whether, when and how to use options and futures involves the exercise of skill and judgment and even a well conceived options or futures transaction may be unsuccessful because of market behavior or unexpected events. Options and futures can be highly volatile and the potential loss from futures can exceed the Fund’s initial investment in such contracts. In addition, the use of options can lower total returns. |
| |
| n | | Swaps risk. Swap contracts are subject to credit risk or the risk of default or non-performance by the counterparty to the contract. Swaps could result in losses if interest rates or foreign currency exchange rates or credit quality changes are not correctly anticipated by the Fund or if the reference index, security or investments do not perform as expected. |
About indexes used in this report
| n | | The S&P 500® Index is an unmanaged index considered representative of the U.S. stock market. |
| |
| n | | The NYSE Arca Tech 100 Index (price only) is a price-weighted index composed of common stocks and American Depositary Receipts of technology-related companies listed on U.S. exchanges. |
| |
| n | | The Lipper Science & Technology Funds Index is an unmanaged index considered representative of science and technology funds tracked by Lipper. |
continued on page 7
This report must be accompanied or preceded by a currently effective Fund prospectus, which contains more complete information, including sales charges and expenses. Investors should read it carefully before investing.
NOT FDIC INSURED | MAY LOSE VALUE | NO BANK GUARANTEE
Fund Nasdaq Symbols
| | | | | |
|
| Class A Shares | | IFOAX |
| Class B Shares | | IFOBX |
| Class C Shares | | IFOCX |
| Class Y Shares | | IFODX |
8 Invesco Technology Sector Fund
Schedule of Investments(a)
March 31, 2011
| | | | | | | | | |
| | | Shares | | Value |
| |
Common Stocks & Other Equity Interests–99.28%
| | | | |
Application Software–7.76%
| | | | |
Autodesk, Inc.(b) | | | 48,254 | | | $ | 2,128,484 | |
| |
Citrix Systems, Inc.(b) | | | 35,096 | | | | 2,578,152 | |
| |
NICE Systems Ltd.–ADR (Israel)(b) | | | 47,342 | | | | 1,748,813 | |
| |
Quest Software, Inc.(b) | | | 55,854 | | | | 1,418,133 | |
| |
TIBCO Software Inc.(b) | | | 70,702 | | | | 1,926,630 | |
| |
| | | | | | | | 9,800,212 | |
| |
Communications Equipment–13.31%
| | | | |
Acme Packet, Inc.(b) | | | 26,995 | | | | 1,915,565 | |
| |
Ciena Corp.(b) | | | 97,959 | | | | 2,543,016 | |
| |
Finisar Corp.(b) | | | 48,408 | | | | 1,190,837 | |
| |
JDS Uniphase Corp.(b) | | | 107,919 | | | | 2,249,032 | |
| |
Juniper Networks, Inc.(b) | | | 29,605 | | | | 1,245,778 | |
| |
| Plantronics, Inc. | | | 27,801 | | | | 1,018,073 | |
| |
Polycom, Inc.(b) | | | 27,493 | | | | 1,425,512 | |
| |
| QUALCOMM, Inc. | | | 75,991 | | | | 4,166,586 | |
| |
Sonus Networks, Inc.(b) | | | 162,097 | | | | 609,485 | |
| |
| Sycamore Networks, Inc. | | | 17,826 | | | | 435,489 | |
| |
| | | | | | | | 16,799,373 | |
| |
Computer Hardware–8.68%
| | | | |
Apple, Inc.(b) | | | 24,448 | | | | 8,518,906 | |
| |
| Hewlett-Packard Co. | | | 24,268 | | | | 994,260 | |
| |
| International Business Machines Corp. | | | 8,833 | | | | 1,440,397 | |
| |
| | | | | | | | 10,953,563 | |
| |
Computer Storage & Peripherals–6.86%
| | | | |
EMC Corp.(b) | | | 138,909 | | | | 3,688,034 | |
| |
NetApp, Inc.(b) | | | 15,583 | | | | 750,789 | |
| |
SanDisk Corp.(b) | | | 79,444 | | | | 3,661,574 | |
| |
STEC Inc.(b)(c) | | | 27,988 | | | | 562,279 | |
| |
| | | | | | | | 8,662,676 | |
| |
Data Processing & Outsourced Services–6.32%
| | | | |
Alliance Data Systems Corp.(b)(c) | | | 17,179 | | | | 1,475,504 | |
| |
| MasterCard, Inc.–Class A | | | 15,578 | | | | 3,921,294 | |
| |
| Visa, Inc.–Class A | | | 7,901 | | | | 581,672 | |
| |
Wright Express Corp.(b) | | | 38,508 | | | | 1,996,255 | |
| |
| | | | | | | | 7,974,725 | |
| |
Electronic Components–1.16%
| | | | |
| Corning Inc. | | | 71,065 | | | | 1,466,071 | |
| |
Electronic Manufacturing Services–5.13%
| | | | |
Flextronics International Ltd. (Singapore)(b) | | | 315,010 | | | | 2,353,125 | |
| |
| Jabil Circuit, Inc. | | | 34,471 | | | | 704,243 | |
| |
| TE Connectivity Ltd. (Switzerland) | | | 98,381 | | | | 3,425,626 | |
| |
| | | | | | | | 6,482,994 | |
| |
Fertilizers & Agricultural Chemicals–1.21%
| | | | |
| Monsanto Co. | | | 21,106 | | | | 1,525,118 | |
| |
Internet Retail–2.90%
| | | | |
Amazon.com, Inc.(b) | | | 10,310 | | | | 1,857,140 | |
| |
Netflix, Inc.(b) | | | 7,595 | | | | 1,802,522 | |
| |
| | | | | | | | 3,659,662 | |
| |
Internet Software & Services–4.76%
| | | | |
Google, Inc.–Class A(b) | | | 7,537 | | | | 4,418,265 | |
| |
Velti PLC (Ireland)(b) | | | 39,069 | | | | 491,879 | |
| |
| VeriSign, Inc. | | | 30,298 | | | | 1,097,090 | |
| |
| | | | | | | | 6,007,234 | |
| |
IT Consulting & Other Services–3.66%
| | | | |
| Accenture PLC–Class A (Ireland) | | | 43,533 | | | | 2,393,009 | |
| |
Cognizant Technology Solutions Corp.–Class A(b) | | | 27,300 | | | | 2,222,220 | |
| |
| | | | | | | | 4,615,229 | |
| |
Semiconductor Equipment–6.54%
| | | | |
Advanced Energy Industries, Inc.(b) | | | 51,192 | | | | 836,989 | |
| |
| ASML Holding N.V.–New York Shares (Netherlands) | | | 34,646 | | | | 1,541,747 | |
| |
Cymer, Inc.(b) | | | 25,633 | | | | 1,450,315 | |
| |
Novellus Systems, Inc.(b) | | | 119,211 | | | | 4,426,305 | |
| |
| | | | | | | | 8,255,356 | |
| |
Semiconductors–16.85%
| | | | |
| ARM Holdings PLC–ADR (United Kingdom) | | | 8,365 | | | | 235,642 | |
| |
Atmel Corp.(b) | | | 141,727 | | | | 1,931,739 | |
| |
| Avago Technologies Ltd. | | | 68,009 | | | | 2,115,080 | |
| |
| Broadcom Corp.–Class A | | | 51,695 | | | | 2,035,749 | |
| |
Cirrus Logic, Inc.(b) | | | 45,012 | | | | 946,602 | |
| |
Cypress Semiconductor Corp.(b) | | | 46,571 | | | | 902,546 | |
| |
| Intel Corp. | | | 105,681 | | | | 2,131,586 | |
| |
Marvell Technology Group Ltd. (Bermuda)(b) | | | 47,670 | | | | 741,269 | |
| |
Micron Technology, Inc.(b) | | | 158,620 | | | | 1,817,785 | |
| |
Microsemi Corp.(b) | | | 144,492 | | | | 2,992,429 | |
| |
ON Semiconductor Corp.(b) | | | 181,411 | | | | 1,790,527 | |
| |
Semtech Corp.(b) | | | 73,365 | | | | 1,835,592 | |
| |
See accompanying Notes to Financial Statements which are an integral part of the financial statements.
9 Invesco Technology Sector Fund
| | | | | | | | | |
| | | Shares | | Value |
| |
Semiconductors–(continued)
| | | | |
| | | | | | | | | |
Skyworks Solutions, Inc.(b) | | | 34,776 | | | $ | 1,127,438 | |
| |
| Xilinx, Inc. | | | 20,524 | | | | 673,187 | |
| |
| | | | | | | | 21,277,171 | |
| |
Systems Software–14.14%
| | | | |
Ariba Inc.(b) | | | 66,190 | | | | 2,259,727 | |
| |
Check Point Software Technologies Ltd. (Israel)(b) | | | 95,223 | | | | 4,861,134 | |
| |
CommVault Systems, Inc.(b) | | | 20,648 | | | | 823,442 | |
| |
| Microsoft Corp. | | | 88,046 | | | | 2,232,847 | |
| |
| Oracle Corp. | | | 89,809 | | | | 2,996,926 | |
| |
Red Hat, Inc.(b) | | | 46,325 | | | | 2,102,692 | |
| |
Rovi Corp.(b) | | | 48,053 | | | | 2,578,043 | |
| |
| | | | | | | | 17,854,811 | |
| |
| Total Common Stocks & Other Equity Interests (Cost $94,740,872) | | | | | | | 125,334,195 | |
| |
Money Market Funds–0.85%
| | | | |
Liquid Assets Portfolio–Institutional Class(d) | | | 536,316 | | | | 536,316 | |
| |
Premier Portfolio–Institutional Class(d) | | | 536,316 | | | | 536,316 | |
| |
| Total Money Market Funds (Cost $1,072,632) | | | | | | | 1,072,632 | |
| |
| TOTAL INVESTMENTS (excluding investments purchased with cash collateral from securities on loan)–100.13% (Cost $95,813,504) | | | | | | | 126,406,827 | |
| |
Investments Purchased with Cash Collateral from Securities on Loan
| | | | |
Money Market Funds–1.22%
| | | | |
Liquid Assets Portfolio–Institutional Class (Cost $1,537,790)(d)(e) | | | 1,537,790 | | | | 1,537,790 | |
| |
| TOTAL INVESTMENTS–101.35% (Cost $97,351,294) | | | | | | | 127,944,617 | |
| |
| OTHER ASSETS LESS LIABILITIES–(1.35)% | | | | | | | (1,702,736 | ) |
| |
| NET ASSETS–100.00% | | | | | | $ | 126,241,881 | |
| |
Investment Abbreviations:
| | | |
| ADR | | – American Depositary Receipt |
Notes to Schedule of Investments:
| | |
| (a) | | Industry and/or sector classifications used in this report are generally according to the Global Industry Classification Standard, which was developed by and is the exclusive property and a service mark of MSCI Inc. and Standard & Poor’s. |
| (b) | | Non-income producing security. |
| (c) | | All or a portion of this security was out on loan at March 31, 2011. |
| (d) | | The money market fund and the Fund are affiliated by having the same investment adviser. |
| (e) | | The security has been segregated to satisfy the commitment to return the cash collateral received in securities lending transactions upon the borrower’s return of the securities loaned. See Note 1J. |
See accompanying Notes to Financial Statements which are an integral part of the financial statements.
10 Invesco Technology Sector Fund
Statement of Assets and Liabilities
March 31, 2011
| | | | | |
Assets:
|
| Investments, at value (Cost $94,740,872)* | | $ | 125,334,195 | |
| |
| Investments in affiliated money market funds, at value and cost | | | 2,610,422 | |
| |
| Total investments, at value (Cost $97,351,294) | | | 127,944,617 | |
| |
| Foreign currencies, at value (Cost $112) | | | 118 | |
| |
| Receivable for: | | | | |
| Investments sold | | | 335,963 | |
| |
| Fund shares sold | | | 62,183 | |
| |
| Dividends | | | 2,267 | |
| |
| Investment for trustee deferred compensation and retirement plans | | | 1,276 | |
| |
| Other assets | | | 25,862 | |
| |
| Total assets | | | 128,372,286 | |
| |
Liabilities:
|
| Payable for: | | | | |
| Fund shares reacquired | | | 261,377 | |
| |
| Collateral upon return of securities loaned | | | 1,537,790 | |
| |
| Accrued fees to affiliates | | | 266,410 | |
| |
| Accrued other operating expenses | | | 62,317 | |
| |
| Trustee deferred compensation and retirement plans | | | 2,511 | |
| |
| Total liabilities | | | 2,130,405 | |
| |
| Net assets applicable to shares outstanding | | $ | 126,241,881 | |
| |
Net assets consist of:
|
| Shares of beneficial interest | | $ | 166,390,259 | |
| |
| Undistributed net investment income (loss) | | | (2,313 | ) |
| |
| Undistributed net realized gain (loss) | | | (70,739,394 | ) |
| |
| Unrealized appreciation | | | 30,593,329 | |
| |
| | | $ | 126,241,881 | |
| |
Net Assets:
|
| Class A | | $ | 106,661,404 | |
| |
| Class B | | $ | 8,417,578 | |
| |
| Class C | | $ | 10,794,028 | |
| |
| Class Y | | $ | 368,871 | |
| |
Shares outstanding, $0.01 par value per share, with an unlimited number of shares authorized:
|
| Class A | | | 9,117,263 | |
| |
| Class B | | | 804,302 | |
| |
| Class C | | | 1,031,485 | |
| |
| Class Y | | | 30,489 | |
| |
| Class A: | | | | |
| Net asset value per share | | $ | 11.70 | |
| |
| Maximum offering price per share | | | | |
| (Net asset value of $11.70 divided by 94.50%) | | $ | 12.38 | |
| |
| Class B: | | | | |
| Net asset value and offering price per share | | $ | 10.47 | |
| |
| Class C: | | | | |
| Net asset value and offering price per share | | $ | 10.46 | |
| |
| Class Y: | | | | |
| Net asset value and offering price per share | | $ | 12.10 | |
| |
| |
| * | At March 31, 2011, securities with an aggregate value of $1,519,273 were on loan to brokers. |
See accompanying Notes to Financial Statements which are an integral part of the financial statements.
11 Invesco Technology Sector Fund
Statement of Operations
For the year ended March 31, 2011
| | | | | |
Investment income:
|
| Dividends (net of foreign withholding taxes of $679) | | $ | 679,255 | |
| |
| Dividends from affiliated money market funds (includes securities lending income of $65,011) | | | 68,118 | |
| |
| Total investment income | | | 747,373 | |
| |
Expenses:
|
| Advisory fees | | | 802,845 | |
| |
| Administrative services fees | | | 59,057 | |
| |
| Custodian fees | | | 17,412 | |
| |
| Distribution fees: | | | | |
| Class A | | | 247,958 | |
| |
| Class B | | | 103,314 | |
| |
| Class C | | | 99,760 | |
| |
| Transfer agent fees | | | 633,707 | |
| |
| Trustees’ and officers’ fees and benefits | | | 15,493 | |
| |
| Other | | | 214,916 | |
| |
| Total expenses | | | 2,194,462 | |
| |
| Less: Fees waived | | | (4,260 | ) |
| |
| Net expenses | | | 2,190,202 | |
| |
| Net investment income (loss) | | | (1,442,829 | ) |
| |
Realized and unrealized gain (loss) from:
|
| Net realized gain (loss) from: | | | | |
| Investment securities | | | (12,859,298 | ) |
| |
| Foreign currencies | | | 194,425 | |
| |
| | | | (12,664,873 | ) |
| |
| Change in net unrealized appreciation (depreciation) of: | | | | |
| Investment securities | | | 28,903,487 | |
| |
| Foreign currencies | | | 31,427 | |
| |
| Foreign currency contracts | | | (364 | ) |
| |
| | | | 28,934,550 | |
| |
| Net realized and unrealized gain | | | 16,269,677 | |
| |
| Net increase in net assets resulting from operations | | $ | 14,826,848 | |
| |
See accompanying Notes to Financial Statements which are an integral part of the financial statements.
12 Invesco Technology Sector Fund
Statement of Changes in Net Assets
For the years ended March 31, 2011 and 2010
| | | | | | | | | |
| | | 2011 | | 2010 |
| |
Operations:
| | | | |
| Net investment income (loss) | | $ | (1,442,829 | ) | | $ | (1,784,399 | ) |
| |
| Net realized gain (loss) | | | (12,664,873 | ) | | | 11,100,075 | |
| |
| Change in net unrealized appreciation | | | 28,934,550 | | | | 35,661,296 | |
| |
| Net increase in net assets resulting from operations | | | 14,826,848 | | | | 44,976,972 | |
| |
Share transactions–net:
| | | | |
| Class A | | | (12,499,979 | ) | | | (6,706,103 | ) |
| |
| Class B | | | (6,678,345 | ) | | | (12,170,321 | ) |
| |
| Class C | | | (1,372,987 | ) | | | (1,614,067 | ) |
| |
| Class Y | | | 76,095 | | | | (1,928 | ) |
| |
| Net increase (decrease) in net assets resulting from share transactions | | | (20,475,216 | ) | | | (20,492,419 | ) |
| |
| Net increase (decrease) in net assets | | | (5,648,368 | ) | | | 24,484,553 | |
| |
Net assets:
| | | | |
| Beginning of year | | | 131,890,249 | | | | 107,405,696 | |
| |
| End of year (includes undistributed net investment income (loss) of $(2,313) and $(1,162), respectively) | | $ | 126,241,881 | | | $ | 131,890,249 | |
| |
Notes to Financial Statements
March 31, 2011
NOTE 1—Significant Accounting Policies
Invesco Technology Sector Fund, (the “Fund”) is a series portfolio of AIM Sector Funds (Invesco Sector Funds) (the “Trust”). The Trust is a Delaware statutory trust registered under the Investment Company Act of 1940, as amended (the “1940 Act”), as an open-end series management investment company consisting of twenty-four separate portfolios, each authorized to issue an unlimited number of shares of beneficial interest. The assets, liabilities and operations of each portfolio are accounted for separately. Information presented in these financial statements pertains only to the Fund. Matters affecting each portfolio or class will be voted on exclusively by the shareholders of such portfolio or class.
Prior to June 1, 2010, the Fund operated as Morgan Stanley Technology Fund (the “Acquired Fund”). The Acquired Fund was reorganized on June 1, 2010 (the “Reorganization Date”) through the transfer of all of its assets and liabilities to the Fund (the “Reorganization”).
Upon closing of the Reorganization, holders of the Acquired Fund’s Class A, Class B, Class C and Class I shares received Class A, Class B, Class C and Class Y shares, respectively, of the Fund.
Information for the Acquired Fund’s Class I shares prior to the Reorganization is included with Class Y shares, respectively, of the Fund throughout this report.
The Fund’s investment objective is long-term capital appreciation.
The Fund currently consists of four different classes of shares: Class A, Class B, Class C and Class Y. Class A shares are sold with a front-end sales charge unless certain waiver criteria are met and under certain circumstances load waived shares may be subject to contingent deferred sales charges (“CDSC”). Class C shares are sold with a CDSC. Class Y shares are sold at net asset value. Effective November 30, 2010, new or additional investments in Class B shares are no longer permitted. Existing shareholders of Class B shares may continue to reinvest dividends and capital gains distributions in Class B shares until they convert. Also, shareholders in Class B shares will be able to exchange those shares for Class B shares of other Invesco Funds offering such shares until they convert. Generally, Class B shares will automatically convert to Class A shares on or about the month-end which is at least eight years after the date of purchase. Redemption of Class B shares prior to conversion date will be subject to a CDSC.
The following is a summary of the significant accounting policies followed by the Fund in the preparation of its financial statements.
| | |
| A. | | Security Valuations — Securities, including restricted securities, are valued according to the following policy. |
| | A security listed or traded on an exchange (except convertible bonds) is valued at its last sales price or official closing price as of the close of the customary trading session on the exchange where the security is principally traded, or lacking any sales or official closing price on a particular day, the security may be valued at the closing bid price on that day. Securities traded in the over-the-counter market are valued based on prices furnished by independent pricing services or market makers. When such securities are valued by an independent pricing service they may be considered fair valued. Futures contracts are valued at the final settlement price set by an exchange on which they are principally traded. Listed options are valued at the mean between the last bid and ask prices from the exchange on which they are principally traded. Options not listed on an exchange are valued by an |
13 Invesco Technology Sector Fund
| | |
| | independent source at the mean between the last bid and ask prices. For purposes of determining net asset value per share, futures and option contracts generally are valued 15 minutes after the close of the customary trading session of the New York Stock Exchange (“NYSE”). |
| | Investments in open-end and closed-end registered investment companies that do not trade on an exchange are valued at the end of day net asset value per share. Investments in open-end and closed-end registered investment companies that trade on an exchange are valued at the last sales price or official closing price as of the close of the customary trading session on the exchange where the security is principally traded. |
| | Debt obligations (including convertible bonds) and unlisted equities are fair valued using an evaluated quote provided by an independent pricing service. Evaluated quotes provided by the pricing service may be determined without exclusive reliance on quoted prices, and may reflect appropriate factors such as institution-size trading in similar groups of securities, developments related to specific securities, dividend rate, yield, quality, type of issue, coupon rate, maturity, individual trading characteristics and other market data. Short-term obligations, including commercial paper, having 60 days or less to maturity are recorded at amortized cost which approximates value. Debt securities are subject to interest rate and credit risks. In addition, all debt securities involve some risk of default with respect to interest and/or principal payments. |
| | Foreign securities (including foreign exchange contracts) are converted into U.S. dollar amounts using the applicable exchange rates as of the close of the NYSE. If market quotations are available and reliable for foreign exchange traded equity securities, the securities will be valued at the market quotations. Because trading hours for certain foreign securities end before the close of the NYSE, closing market quotations may become unreliable. If between the time trading ends on a particular security and the close of the customary trading session on the NYSE, events occur that are significant and make the closing price unreliable, the Fund may fair value the security. If the event is likely to have affected the closing price of the security, the security will be valued at fair value in good faith using procedures approved by the Board of Trustees. Adjustments to closing prices to reflect fair value may also be based on a screening process of an independent pricing service to indicate the degree of certainty, based on historical data, that the closing price in the principal market where a foreign security trade is not the current value as of the close of the NYSE. Foreign securities meeting the approved degree of certainty that the price is not reflective of current value will be priced at the indication of fair value from the independent pricing service. Multiple factors may be considered by the independent pricing service in determining adjustments to reflect fair value and may include information relating to sector indices, American Depositary Receipts and domestic and foreign index futures. Foreign securities may have additional risks including exchange rate changes, potential for sharply devalued currencies and high inflation, political and economical upheaval, the relative lack of issuer information, relatively low market liquidity and the potential lack of strict financial and accounting controls and standards. |
| | Securities for which market prices are not provided by any of the above methods may be valued based upon quotes furnished by independent sources. The last bid price may be used to value equity securities. The mean between the last bid and asked prices is used to value debt obligations, including Corporate Loans. |
| | Securities for which market quotations are not readily available or are unreliable are valued at fair value as determined in good faith by or under the supervision of the Trust’s officers following procedures approved by the Board of Trustees. Issuer specific events, market trends, bid/ask quotes of brokers and information providers and other market data may be reviewed in the course of making a good faith determination of a security’s fair value. |
| | Valuations change in response to many factors including the historical and prospective earnings of the issuer, the value of the issuer’s assets, general economic conditions, interest rates, investor perceptions and market liquidity. Because of the inherent uncertainties of valuation, the values reflected in the financial statements may materially differ from the value received upon actual sale of those investments. |
| B. | | Securities Transactions and Investment Income — Securities transactions are accounted for on a trade date basis. Realized gains or losses on sales are computed on the basis of specific identification of the securities sold. Interest income is recorded on the accrual basis from settlement date. Dividend income (net of withholding tax, if any) is recorded on the ex-dividend date. |
| | The Fund may periodically participate in litigation related to Fund investments. As such, the Fund may receive proceeds from litigation settlements. Any proceeds received are included in the Statement of Operations as realized gain (loss) for investments no longer held and as unrealized gain (loss) for investments still held. |
| | Brokerage commissions and mark ups are considered transaction costs and are recorded as an increase to the cost basis of securities purchased and/or a reduction of proceeds on a sale of securities. Such transaction costs are included in the determination of net realized and unrealized gain (loss) from investment securities reported in the Statement of Operations and the Statement of Changes in Net Assets and the net realized and unrealized gains (losses) on securities per share in the Financial Highlights. Transaction costs are included in the calculation of the Fund’s net asset value and, accordingly, they reduce the Fund’s total returns. These transaction costs are not considered operating expenses and are not reflected in net investment income reported in the Statement of Operations and Statement of Changes in Net Assets, or the net investment income per share and ratios of expenses and net investment income reported in the Financial Highlights, nor are they limited by any expense limitation arrangements between the Fund and the investment adviser. |
| | The Fund allocates income and realized and unrealized capital gains and losses to a class based on the relative net assets of each class. |
| C. | | Country Determination — For the purposes of making investment selection decisions and presentation in the Schedule of Investments, the investment adviser may determine the country in which an issuer is located and/or credit risk exposure based on various factors. These factors include the laws of the country under which the issuer is organized, where the issuer maintains a principal office, the country in which the issuer derives 50% or more of its total revenues and the country that has the primary market for the issuer’s securities, as well as other criteria. Among the other criteria that may be evaluated for making this determination are the country in which the issuer maintains 50% or more of its assets, the type of security, financial guarantees and enhancements, the nature of the collateral and the sponsor organization. Country of issuer and/or credit risk exposure has been determined to be the United States of America, unless otherwise noted. |
| D. | | Distributions — Distributions from income and net realized capital gain, if any, are generally paid annually and recorded on ex-dividend date. The Fund may elect to treat a portion of the proceeds from redemptions as distributions for federal income tax purposes. |
| E. | | Federal Income Taxes — The Fund intends to comply with the requirements of Subchapter M of the Internal Revenue Code necessary to qualify as a regulated investment company and to distribute substantially all of the Fund’s taxable earnings to shareholders. As such, the Fund will not be subject to |
14 Invesco Technology Sector Fund
| | |
| | federal income taxes on otherwise taxable income (including net realized capital gain) that is distributed to shareholders. Therefore, no provision for federal income taxes is recorded in the financial statements. |
| | The Fund files tax returns in the U.S. Federal jurisdiction and certain other jurisdictions. Generally the Fund is subject to examinations by such taxing authorities for up to three years after the filing of the return for the tax period. |
| F. | | Expenses — Fees provided for under the Rule 12b-1 plan of a particular class of the Fund and which are directly attributable to that class are charged to the operations of such class. All other expenses are allocated among the classes based on relative net assets. |
| G. | | Accounting Estimates — The preparation of financial statements in conformity with accounting principles generally accepted in the United States of America (“GAAP”) requires management to make estimates and assumptions that affect the reported amounts of assets and liabilities at the date of the financial statements and the reported amounts of revenues and expenses during the reporting period including estimates and assumptions related to taxation. Actual results could differ from those estimates by a significant amount. In addition, the Fund monitors for material events or transactions that may occur or become known after the period-end date and before the date the financial statements are released to print. |
| H. | | Indemnifications — Under the Trust’s organizational documents, each Trustee, officer, employee or other agent of the Trust is indemnified against certain liabilities that may arise out of performance of their duties to the Fund. Additionally, in the normal course of business, the Fund enters into contracts, including the Fund’s servicing agreements that contain a variety of indemnification clauses. The Fund’s maximum exposure under these arrangements is unknown as this would involve future claims that may be made against the Fund that have not yet occurred. The risk of material loss as a result of such indemnification claims is considered remote. |
| I. | | Other Risks — The Fund’s investments are concentrated in a comparatively narrow segment of the economy, which may make the Fund more volatile. |
| | Many products and services offered in technology-related industries are subject to rapid obsolescence, which may lower the value of the issuers in this sector. |
| J. | | Securities Lending — The Fund may lend portfolio securities having a market value up to one-third of the Fund’s total assets. Such loans are secured by collateral equal to no less than the market value of the loaned securities determined daily by the securities lending provider. Such collateral will be cash or debt securities issued or guaranteed by the U.S. Government or any of its sponsored agencies. Cash collateral received in connection with these loans is invested in short-term money market instruments or affiliated money market funds and is shown as such on the Schedule of Investments. It is the Fund’s policy to obtain additional collateral from or return excess collateral to the borrower by the end of the next business day, following the valuation date of the securities loaned. Therefore, the value of the collateral held may be temporarily less than the value of the securities on loan. Lending securities entails a risk of loss to the Fund if and to the extent that the market value of the securities loaned were to increase and the borrower did not increase the collateral accordingly, and the borrower fails to return the securities. Upon the failure of the borrower to return the securities, collateral may be liquidated and the securities may be purchased on the open market to replace the loaned securities. The Fund could experience delays and costs in gaining access to the collateral. The Fund bears the risk of any deficiency in the amount of the collateral available for return to the borrower due to any loss on the collateral invested. Dividends received on cash collateral investments for securities lending transactions, which are net of compensation to counterparties, is included in Dividends from affiliates on the Statement of Operations. The aggregate value of securities out on loan is shown as a footnote on the Statement of Assets and Liabilities, if any. |
| K. | | Foreign Currency Translations — Foreign currency is valued at the close of the NYSE based on quotations posted by banks and major currency dealers. Portfolio securities and other assets and liabilities denominated in foreign currencies are translated into U.S. dollar amounts at date of valuation. Purchases and sales of portfolio securities (net of foreign taxes withheld on disposition) and income items denominated in foreign currencies are translated into U.S. dollar amounts on the respective dates of such transactions. The Fund does not separately account for the portion of the results of operations resulting from changes in foreign exchange rates on investments and the fluctuations arising from changes in market prices of securities held. The combined results of changes in foreign exchange rates and the fluctuation of market prices on investments (net of estimated foreign tax withholding) are included with the net realized and unrealized gain or loss from investments in the Statement of Operations. Reported net realized foreign currency gains or losses arise from (1) sales of foreign currencies, (2) currency gains or losses realized between the trade and settlement dates on securities transactions, and (3) the difference between the amounts of dividends, interest, and foreign withholding taxes recorded on the Fund’s books and the U.S. dollar equivalent of the amounts actually received or paid. Net unrealized foreign currency gains and losses arise from changes in the fair values of assets and liabilities, other than investments in securities at fiscal period end, resulting from changes in exchange rates. |
| | The Fund may invest in foreign securities which may be subject to foreign taxes on income, gains on investments or currency repatriation, a portion of which may be recoverable. |
| L. | | Foreign Currency Contracts — The Fund may enter into foreign currency contracts to manage or minimize currency or exchange rate risk. The Fund may also enter into foreign currency contracts for the purchase or sale of a security denominated in a foreign currency in order to “lock in” the U.S. dollar price of that security. A foreign currency contract is an obligation to purchase or sell a specific currency for an agreed-upon price at a future date. The use of foreign currency contracts does not eliminate fluctuations in the price of the underlying securities the Fund owns or intends to acquire but establishes a rate of exchange in advance. Fluctuations in the value of these contracts are measured by the difference in the contract date and reporting date exchange rates and are recorded as unrealized appreciation (depreciation) until the contracts are closed. When the contracts are closed, realized gains (losses) are recorded. Realized and unrealized gains (losses) on the contracts are included in the Statement of Operations. The primary risks associated with foreign currency contracts include failure of the counterparty to meet the terms of the contract and the value of the foreign currency changing unfavorably. These risks may be in excess of the amounts reflected in the Statement of Assets and Liabilities. |
15 Invesco Technology Sector Fund
NOTE 2—Advisory Fees and Other Fees Paid to Affiliates
The Trust has entered into a master investment advisory agreement with Invesco Advisers, Inc. (the “Adviser” or “Invesco”). Under the terms of the investment advisory agreement, the Fund pays an advisory fee to the Adviser based on the annual rate of the Fund’s average daily net assets as follows:
| | | | | |
| Average Net Assets | | Rate |
| |
| First $500 million | | | 0 | .67% |
| |
| Next $2.5 billion | | | 0 | .645% |
| |
| Over $3 billion | | | 0 | .62% |
| |
Prior to the Reorganization, the Acquired Fund paid an advisory fee of $146,258 to Morgan Stanley Investment Advisers, Inc. (“MSIA”) based on the annual rate above of the Acquired Fund’s average daily net assets.
Under the terms of a master sub-advisory agreement between the Adviser and each of Invesco Asset Management Deutschland GmbH, Invesco Asset Management Limited, Invesco Asset Management (Japan) Limited, Invesco Australia Limited, Invesco Hong Kong Limited, Invesco Senior Secured Management, Inc. and Invesco Trimark Ltd. (collectively, the “Affiliated Sub-Advisers”) the Adviser, not the Fund, may pay 40% of the fees paid to the Adviser to any such Affiliated Sub-Adviser(s) that provide(s) discretionary investment management services to the Fund based on the percentage of assets allocated to such Sub-Adviser(s).
Effective on the Reorganization date, the Adviser has contractually agreed, through at least June 30, 2012, to waive advisory fees and/or reimburse expenses of all shares to the extent necessary to limit total annual fund operating expenses after fee waiver and/or expense reimbursement (excluding certain items discussed below) of Class A, Class B, Class C, and Class Y shares to 2.00%, 2.75%, 2.75%, and 1.75%, respectively, of average daily net assets. In determining the Adviser’s obligation to waive advisory fees and/or reimburse expenses, the following expenses are not taken into account, and could cause the total annual fund operating expenses after fee waiver and/or expense reimbursement to exceed the numbers reflected above: (1) interest, facilities and maintenance fees; (2) taxes; (3) dividend expense on short sales; (4) extraordinary or non-routine items; and (5) expenses that the Fund has incurred but did not actually pay because of an expense offset arrangement. Unless the Board of the Trustees and Invesco mutually agree to amend or continue the fee waiver agreement, it will terminate on June 30, 2012. The Adviser did not waive fees and/or reimburse expenses during the period under this expense limitation.
Further, the Adviser has contractually agreed, through at least June 30, 2011, to waive the advisory fee payable by the Fund in an amount equal to 100% of the net advisory fees the Adviser receives from the affiliated money market funds on investments by the Fund of uninvested cash (excluding investments of cash collateral from securities lending) in such affiliated money market funds. Prior to the Reorganization, investment advisory fees paid by the Acquired Fund were reduced by an amount equal to advisory and administrative service fees paid by Morgan Stanley Institutional Liquidity Funds — Money Market Portfolio — Institutional Class.
For the year ended March 31, 2011, the Adviser and MSIA waived advisory fees of $4,100 and $160, respectively.
The Trust has entered into a master administrative services agreement with Invesco pursuant to which the Fund has agreed to pay Invesco for certain administrative costs incurred in providing accounting services to the Fund. For the year ended March 31, 2011, expenses incurred under the agreement are shown in the Statement of Operations as administrative services fees. Prior to the Reorganization, the Acquired Fund paid an administrative fee of $17,413 to Morgan Stanley Services Company, Inc. based on an annual rate of 0.08% of the Acquired Fund’s average daily net assets.
Also, Invesco has entered into service agreements whereby State Street Bank and Trust Company (“SSB”) serves as the custodian, fund accountant and provides certain administrative services to the Fund.
The Trust has entered into a transfer agency and service agreement with Invesco Investment Services, Inc. (“IIS”) pursuant to which the Fund has agreed to pay IIS a fee for providing transfer agency and shareholder services to the Fund and reimburse IIS for certain expenses incurred by IIS in the course of providing such services. IIS may make payments to intermediaries that provide omnibus account services, sub-accounting services and/or networking services. All fees payable by IIS to intermediaries that provide omnibus account services or sub-accounting are charged back to the Fund, subject to certain limitations approved by the Trust’s Board of Trustees. Prior to the Reorganization, the Acquired Fund paid $211,888 to Morgan Stanley Trust, which served as the Acquired Fund’s transfer agent. For the year ended March 31, 2011, the expenses incurred under the agreement are shown in the Statement of Operations as transfer agent fees.
Shares of the Fund are distributed by Invesco Distributors, Inc. (“IDI”), an affiliate of the Adviser. The Fund has adopted a Plan of Distribution (the “Plan”) pursuant to Rule 12b-1 under the 1940 Act. The Plan provides that the Fund will reimburse IDI for distribution related expenses that IDI incurs up to a maximum of the following annual rates; (1) Class A — up to 0.25% of the average daily net assets of Class A shares; (2) Class B — up to 1.00% of the average daily net assets of Class B shares and (3) Class C — up to 1.00% of the average daily net assets of Class C shares.
In the case of Class B shares, provided that the Plan continues in effect, any cumulative expenses incurred by IDI, but not yet reimbursed to IDI may be recovered through the payment of future distribution fees from the Fund pursuant to the Plan and contingent deferred sales charges paid by investors upon redemption of Class B shares.
Prior to the Reorganization, the Acquired Fund had entered into master distribution agreements with Morgan Stanley Distributors Inc. (“MSDI”) to serve as the distributor for the Class A, Class B and Class C shares. Pursuant to such agreements, the Acquired Fund paid $132,322 to MSDI.
For the year ended March 31, 2011, expenses incurred under these agreements are shown in the Statement of Operations as distribution fees.
Front-end sales commissions and CDSC (collectively the “sales charges”) are not recorded as expenses of the Fund. Front-end sales commissions are deducted from proceeds from the sales of Fund shares prior to investment in Class A shares of the Fund. CDSC are deducted from redemption proceeds prior to remittance to the shareholder. For the period June 1, 2010 to March 31, 2011, IDI advised the Fund that IDI retained $1,610 in front-end sales commissions from the sale of Class A shares and $0, $9,961 and $178 from Class A, Class B and Class C shares, respectively, for CDSC imposed on redemptions by shareholders. For the period April 1, 2010 to May 31, 2010, MSDI retained $1,513 in front-end sales commissions from the sale of Class A shares and $0, $2,269 and $74 from Class A, Class B and Class C shares, respectively, for CDSC imposed on redemptions by shareholders.
Certain officers and trustees of the Trust are officers and directors of Invesco, IIS and/or IDI.
16 Invesco Technology Sector Fund
NOTE 3—Additional Valuation Information
GAAP defines fair value as the price that would be received to sell an asset or paid to transfer a liability in an orderly transaction between market participants at the measurement date, under current market conditions. GAAP establishes a hierarchy that prioritizes the inputs to valuation methods giving the highest priority to readily available unadjusted quoted prices in an active market for identical assets (Level 1) and the lowest priority to significant unobservable inputs (Level 3) generally when market prices are not readily available or are unreliable. Based on the valuation inputs, the securities or other investments are tiered into one of three levels. Changes in valuation methods may result in transfers in or out of an investment’s assigned level:
| | |
| | Level 1 — | Prices are determined using quoted prices in an active market for identical assets. |
| | Level 2 — | Prices are determined using other significant observable inputs. Observable inputs are inputs that other market participants may use in pricing a security. These may include quoted prices for similar securities, interest rates, prepayment speeds, credit risk, yield curves, loss severities, default rates, discount rates, volatilities and others. |
| | Level 3 — | Prices are determined using significant unobservable inputs. In situations where quoted prices or observable inputs are unavailable (for example, when there is little or no market activity for an investment at the end of the period), unobservable inputs may be used. Unobservable inputs reflect the Fund’s own assumptions about the factors market participants would use in determining fair value of the securities or instruments and would be based on the best available information. |
The following is a summary of the tiered valuation input levels, as of March 31, 2011. The level assigned to the securities valuations may not be an indication of the risk or liquidity associated with investing in those securities. Because of the inherent uncertainties of valuation, the values reflected in the financial statements may materially differ from the value received upon actual sale of those investments.
During the year ended March 31, 2011, there were no significant transfers between investment levels.
| | | | | | | | | | | | | | | | | |
| | | Level 1 | | Level 2 | | Level 3 | | Total |
| |
| Equity Securities | | $ | 127,944,617 | | | $ | — | | | $ | — | | | $ | 127,944,617 | |
| |
NOTE 4—Derivative Instruments
The Fund has implemented the required disclosures about derivative instruments and hedging activities in accordance with GAAP. This disclosure is intended to improve financial reporting about derivative instruments and hedging activities by requiring enhanced disclosures to enable investors to better understand their effects on an entity’s financial position and financial performance. The enhanced disclosure has no impact on the results of operations reported in the financial statements.
Effect of Derivative Instruments for the year ended March 31, 2010.
The Table below summarizes the gains (losses) on derivative instruments, detailed by primary risk exposure, recognized in earnings during the period:
| | | | | |
| | | Location of Gain (Loss) on
|
| | | Statement of Operations |
| | | Foreign Currency Contracts |
| |
| Change in Unrealized Appreciation (Depreciation) | | | | |
| Currency risk | | $ | (364 | ) |
| |
NOTE 5—Trustees’ and Officers’ Fees and Benefits
“Trustees’ and Officers’ Fees and Benefits” include amounts accrued by the Fund to pay remuneration to certain Trustees and Officers of the Fund. Trustees have the option to defer compensation payable by the Fund, and “Trustees’ and Officers’ Fees and Benefits” also include amounts accrued by the Fund to fund such deferred compensation amounts. Those Trustees who defer compensation have the option to select various Invesco Funds in which their deferral accounts shall be deemed to be invested. Finally, certain current Trustees are eligible to participate in a retirement plan that provides for benefits to be paid upon retirement to Trustees over a period of time based on the number of years of service. The Fund may have certain former Trustees who also participate in a retirement plan and receive benefits under such plan. “Trustees’ and Officers’ Fees and Benefits” include amounts accrued by the Fund to fund such retirement benefits. Obligations under the deferred compensation and retirement plans represent unsecured claims against the general assets of the Fund.
During the period June 1, 2010 to March 31, 2011, the Fund paid legal fees of $851 for services rendered by Kramer, Levin, Naftalis & Frankel LLP as counsel to the Independent Trustees. A member of that firm is a Trustee of the Trust.
NOTE 6—Cash Balances
The Fund is permitted to temporarily carry a negative or overdrawn balance in its account with SSB, the custodian bank. To compensate the custodian bank for such overdrafts, the overdrawn Fund may either (1) leave funds as a compensating balance in the account so the custodian bank can be compensated by earning the additional interest; or (2) compensate by paying the custodian bank at a rate agreed upon by the custodian bank and Invesco, not to exceed the contractually agreed upon rate.
NOTE 7—Distributions to Shareholders and Tax Components of Net Assets
Distributions to Shareholders:
There were no ordinary income or long term gain distributions paid during the years ended March 31, 2011 and 2010.
17 Invesco Technology Sector Fund
Tax Components of Net Assets at Period-End:
| | | | | |
| | | 2011 |
| |
| Net unrealized appreciation — investments | | $ | 30,363,431 | |
| |
| Net unrealized appreciation — other investments | | | 6 | |
| |
| Temporary book/tax differences | | | (2,313 | ) |
| |
| Capital loss carryforward | | | (70,509,502 | ) |
| |
| Shares of beneficial interest | | | 166,390,259 | |
| |
| Total net assets | | $ | 126,241,881 | |
| |
The difference between book-basis and tax-basis unrealized appreciation (depreciation) is due to differences in the timing of recognition of gains and losses on investments for tax and book purposes. The Fund’s net unrealized appreciation difference is attributable primarily to wash sales.
The temporary book/tax differences are a result of timing differences between book and tax recognition of income and/or expenses. The Fund’s temporary book/tax differences are the result of the trustee deferral of compensation and retirement plan benefits.
Capital loss carryforward is calculated and reported as of a specific date. Results of transactions and other activity after that date may affect the amount of capital loss carryforward actually available for the Fund to utilize. The ability to utilize capital loss carryforward in the future may be limited under the Internal Revenue Code and related regulations based on the results of future transactions.
The Fund has a capital loss carryforward as of March 31, 2011 which expires as follows:
| | | | | |
| | | Capital Loss
|
| Expiration | | Carryforward* |
| |
| March 31, 2012 | | $ | 25,113,400 | |
| |
| March 31, 2015 | | | 19,506,592 | |
| |
| March 31, 2017 | | | 12,866,974 | |
| |
| March 31, 2019 | | | 13,022,536 | |
| |
| Total capital loss carryforward | | $ | 70,509,502 | |
| |
| |
| * | Capital loss carryforward as of the date listed above is reduced for limitations, if any, to the extent required by the Internal Revenue Code. |
NOTE 8—Investment Securities
The aggregate amount of investment securities (other than short-term securities, U.S. Treasury obligations and money market funds, if any) purchased and sold by the Fund during the year ended March 31, 2011 was $255,441,735 and $277,972,410, respectively. Cost of investments on a tax basis includes the adjustments for financial reporting purposes as of the most recently completed Federal income tax reporting period-end.
| | | | | |
| Unrealized Appreciation (Depreciation) of Investment Securities on a Tax Basis |
| |
| Aggregate unrealized appreciation of investment securities | | $ | 31,117,907 | |
| |
| Aggregate unrealized (depreciation) of investment securities | | | (754,476 | ) |
| |
| Net unrealized appreciation of investment securities | | $ | 30,363,431 | |
| |
| Cost of investments for tax purposes is $97,581,186. |
NOTE 9—Reclassification of Permanent Differences
Primarily as a result of differing book/tax treatment of expired capital loss carryforward, foreign currency transactions and net operating losses, on March 31, 2011, undistributed net investment income (loss) was increased by $1,441,678, undistributed net realized gain (loss) was increased by $670,257,813 and shares of beneficial interest decreased by $671,699,491. This reclassification had no effect on the net assets of the Fund.
18 Invesco Technology Sector Fund
NOTE 10—Share Information
| | | | | | | | | | | | | | | | | |
| | | Summary of Share Activity |
| |
| | | Year ended March 31, |
| | | 2011(a) | | 2010 |
| | | Shares | | Amount | | Shares | | Amount |
| |
| Sold: | | | | | | | | | | | | | | | | |
| Class A | | | 551,426 | | | $ | 5,887,514 | | | | 1,170,836 | | | $ | 10,535,463 | |
| |
| Class B | | | 29,945 | | | | 272,976 | | | | 80,193 | | | | 643,525 | |
| |
| Class C | | | 59,766 | | | | 610,322 | | | | 27,871 | | | | 233,706 | |
| |
| Class Y | | | 68,325 | | | | 855,902 | | | | 3,380 | | | | 35,130 | |
| |
| Automatic conversion of Class B shares to Class A shares: | | | | | | | | | | | | | | | | |
| Class A | | | 325,775 | | | | 3,326,723 | | | | 160,626 | | | | 1,442,683 | |
| |
| Class B | | | (362,987 | ) | | | (3,326,723 | ) | | | (177,428 | ) | | | (1,442,683 | ) |
| |
| Reacquired: | | | | | | | | | | | | | | | | |
| Class A | | | (2,116,262 | ) | | | (21,714,216 | ) | | | (2,030,189 | ) | | | (18,684,249 | ) |
| |
| Class B | | | (403,345 | ) | | | (3,624,598 | ) | | | (1,386,221 | ) | | | (11,371,163 | ) |
| |
| Class C | | | (214,910 | ) | | | (1,983,309 | ) | | | (222,148 | ) | | | (1,847,773 | ) |
| |
| Class Y | | | (67,301 | ) | | | (779,807 | ) | | | (3,679 | ) | | | (37,058 | ) |
| |
| Net increase (decrease) in share activity | | | (2,129,568 | ) | | $ | (20,475,216 | ) | | | (2,376,759 | ) | | $ | (20,492,419 | ) |
| |
| | |
| (a) | | There are entities that are record owners of more than 5% of the outstanding shares of the Fund and in the aggregate own 76% of the outstanding shares of the Fund. IDI has an agreement with these entities to sell Fund shares. The Fund, Invesco and/or Invesco affiliates may make payments to these entities, which are considered to be related to the Fund, for providing services to the Fund, Invesco and/or Invesco affiliates including but not limited to services such as securities brokerage, distribution, third party record keeping and account servicing. The Trust has no knowledge as to whether all or any portion of the shares owned of record by these entities are also owned beneficially. |
19 Invesco Technology Sector Fund
NOTE 11—Financial Highlights
The following schedule presents financial highlights for a share of the Fund outstanding throughout the periods indicated.
| | | | | | | | | | | | | | | | | | | | | | | | | | | | | | | | | | | | | | | | | | | | | |
| | | | | | | | | | | | | | | | | Ratio of
| | Ratio of
| | | | |
| | | | | | | Net gains
| | | | | | | | | | expenses
| | expenses
| | Ratio of net
| | |
| | | | | | | (losses)
| | | | | | | | | | to average
| | to average net
| | investment
| | |
| | | Net asset
| | Net
| | on securities
| | | | | | | | | | net assets
| | assets without
| | income
| | |
| | | value,
| | investment
| | (both
| | Total from
| | Net asset
| | | | Net assets,
| | with fee waivers
| | fee waivers
| | (loss)
| | |
| | | beginning
| | income
| | realized and
| | investment
| | value, end
| | Total
| | end of period
| | and/or expenses
| | and/or expenses
| | to average
| | Portfolio
|
| | | of period | | (loss)(a) | | unrealized) | | operations | | of period | | return(b) | | (000s omitted) | | absorbed | | absorbed | | net assets | | turnover(c) |
| |
| Class A |
| Year ended 03/31/11 | | $ | 10.27 | | | $ | (0.11 | ) | | $ | 1.54 | | | $ | 1.43 | | | $ | 11.70 | | | | 13.92 | % | | $ | 106,661 | | | | 1.70 | %(d) | | | 1.70 | %(d) | | | (1.08 | )%(d) | | | 214 | % |
| Year ended 03/31/10 | | | 7.12 | | | | (0.11 | ) | | | 3.26 | | | | 3.15 | | | | 10.27 | | | | 44.24 | | | | 106.337 | | | | 1.92 | (e) | | | 1.92 | (e) | | | (1.23 | )(e) | | | 113 | |
| Year ended 03/31/09 | | | 10.32 | | | | (0.11 | ) | | | (3.09 | ) | | | (3.20 | ) | | | 7.12 | | | | (31.01 | ) | | | 78,705 | | | | 2.00 | (e) | | | 2.00 | (e) | | | (1.32 | )(e) | | | 81 | |
| Year ended 03/31/08 | | | 10.42 | | | | (0.13 | ) | | | 0.03 | | | | (0.10 | ) | | | 10.32 | | | | (0.96 | ) | | | 94,361 | | | | 1.72 | (e) | | | 1.72 | (e) | | | (1.18 | )(e) | | | 122 | |
| Year ended 03/31/07 | | | 10.68 | | | | (0.13 | ) | | | (0.13 | ) | | | (0.26 | ) | | | 10.42 | | | | (2.43 | ) | | | 86,308 | | | | 1.80 | | | | 1.80 | | | | (1.27 | ) | | | 100 | |
| |
| Class B |
| Year ended 03/31/11 | | | 9.26 | | | | (0.17 | ) | | | 1.38 | | | | 1.21 | | | | 10.47 | | | | 13.07 | | | | 8,418 | | | | 2.45 | (d) | | | 2.45 | (d) | | | (1.83 | )(d) | | | 214 | |
| Year ended 03/31/10 | | | 6.47 | | | | (0.16 | ) | | | 2.95 | | | | 2.79 | | | | 9.26 | | | | 43.12 | | | | 14,261 | | | | 2.67 | (e) | | | 2.67 | (e) | | | (1.98 | )(e) | | | 113 | |
| Year ended 03/31/09 | | | 9.45 | | | | (0.17 | ) | | | (2.81 | ) | | | (2.98 | ) | | | 6.47 | | | | (31.53 | ) | | | 19,556 | | | | 2.75 | (e) | | | 2.75 | (e) | | | (2.07 | )(e) | | | 81 | |
| Year ended 03/31/08 | | | 9.61 | | | | (0.20 | ) | | | 0.04 | | | | (0.16 | ) | | | 9.45 | | | | (1.66 | ) | | | 81,609 | | | | 2.47 | (e) | | | 2.47 | (e) | | | (1.93 | )(e) | | | 122 | |
| Year ended 03/31/07 | | | 9.92 | | | | (0.19 | ) | | | (0.12 | ) | | | (0.31 | ) | | | 9.61 | | | | (3.13 | ) | | | 144,588 | | | | 2.55 | | | | 2.55 | | | | (2.02 | ) | | | 100 | |
| |
| Class C |
| Year ended 03/31/11 | | | 9.25 | | | | (0.17 | ) | | | 1.38 | | | | 1.21 | | | | 10.46 | | | | 13.08 | | | | 10,794 | | | | 2.45 | (d) | | | 2.45 | (d) | | | (1.83 | )(d) | | | 214 | |
| Year ended 03/31/10 | | | 6.46 | | | | (0.16 | ) | | | 2.95 | | | | 2.79 | | | | 9.25 | | | | 43.19 | | | | 10,981 | | | | 2.67 | (e) | | | 2.67 | (e) | | | (1.98 | )(e) | | | 113 | |
| Year ended 03/31/09 | | | 9.44 | | | | (0.17 | ) | | | (2.81 | ) | | | (2.98 | ) | | | 6.46 | | | | (31.57 | ) | | | 8,927 | | | | 2.75 | (e) | | | 2.75 | (e) | | | (2.07 | )(e) | | | 81 | |
| Year ended 03/31/08 | | | 9.60 | | | | (0.20 | ) | | | 0.04 | | | | (0.16 | ) | | | 9.44 | | | | (1.67 | ) | | | 15,835 | | | | 2.47 | (e) | | | 2.47 | (e) | | | (1.93 | )(e) | | | 122 | |
| Year ended 03/31/07 | | | 9.92 | | | | (0.19 | ) | | | (0.13 | ) | | | (0.32 | ) | | | 9.60 | | | | (3.23 | ) | | | 19,823 | | | | 2.55 | | | | 2.55 | | | | (2.02 | ) | | | 100 | |
| |
| Class Y |
| Year ended 03/31/11 | | | 10.59 | | | | (0.09 | ) | | | 1.60 | | | | 1.51 | | | | 12.10 | | | | 14.26 | | | | 369 | | | | 1.45 | (d) | | | 1.45 | (d) | | | (0.83 | )(d) | | | 214 | |
| Year ended 03/31/10 | | | 7.33 | | | | (0.09 | ) | | | 3.35 | | | | 3.26 | | | | 10.59 | | | | 44.47 | | | | 312 | | | | 1.67 | (e) | | | 1.67 | (e) | | | (0.98 | )(e) | | | 113 | |
| Year ended 03/31/09 | | | 10.60 | | | | (0.09 | ) | | | (3.18 | ) | | | (3.27 | ) | | | 7.33 | | | | (30.85 | ) | | | 218 | | | | 1.75 | (e) | | | 1.75 | (e) | | | (1.07 | )(e) | | | 81 | |
| Year ended 03/31/08 | | | 10.67 | | | | (0.11 | ) | | | 0.04 | | | | (0.07 | ) | | | 10.60 | | | | (0.66 | ) | | | 860 | | | | 1.47 | (e) | | | 1.47 | (e) | | | (0.93 | )(e) | | | 122 | |
| Year ended 03/31/07 | | | 10.91 | | | | (0.10 | ) | | | (0.14 | ) | | | (0.24 | ) | | | 10.67 | | | | (2.20 | ) | | | 1,809 | | | | 1.55 | | | | 1.55 | | | | (1.02 | ) | | | 100 | |
| |
| | |
| (a) | | Calculated using average shares outstanding. |
| (b) | | Includes adjustments in accordance with accounting principles generally accepted in the United States of America and as such, the net asset value for financial reporting purposes and the returns based upon those net asset values may differ from the net asset value and returns for shareholder transactions. Does not include sales charges and is not annualized for periods less than one year, if applicable. |
| (c) | | Portfolio turnover is calculated at the fund level and is not annualized for periods less than one year, if applicable. |
| (d) | | Ratios are based on average daily net assets (000’s) of $99,183, $10,331, $9,976 and $337 for Class A, Class B, Class C and Class Y shares, respectively. |
| (e) | | The ratios reflect the rebate of certain Fund expenses in connection with investments from a Morgan Stanley affiliate during the period. The effect of the rebate on the ratios was less than 0.005% for each of the years ended March 31, 2010, 2009 and 2008, respectively. |
NOTE 12—Subsequent Event
The Board of Trustees unanimously approved an Agreement and Plan of Reorganization (the “Agreement”) pursuant to which the Fund would transfer all of its assets and liabilities to Invesco Technology Fund (the “Acquiring Fund”).
The Agreement requires approval of the Fund’s shareholders. The Agreement was submitted to the shareholders for their consideration at meetings held in April and May, 2011, which have been further adjourned until June 30, 2011.
NOTE 13—Change in Independent Public Accounting Firm (unaudited)
In connection with the Reorganization of the Fund, the Audit Committee of the Board of Trustees of the Trust appointed, and the Board of Trustees ratified and approved, PricewaterhouseCoopers LLP (“PWC”) as the independent registered public accounting firm of the Fund for the fiscal year following May 31, 2010. The predecessor fund’s financial statements were audited by a different independent registered public accounting firm (the “Prior Auditor”). Concurrent with the closing of the Reorganization, the Prior Auditor resigned as the independent registered public accounting firm of the predecessor fund. The Prior Auditor’s report on the financial statements of the Fund for the past two years did not contain an adverse opinion or a disclaimer of opinion, and was not qualified or modified as to uncertainty, audit scope or accounting principles. During the period the Prior Auditor was engaged, there were no disagreements with the Prior Auditor on any matter of accounting principles or practices, financial statement disclosure, or auditing scope or procedure which, if not resolved to the Prior Auditor’s satisfaction, would have caused it to make reference to that matter in connection with its report.
20 Invesco Technology Sector Fund
Report of Independent Registered Public Accounting Firm
To the Board of Trustees of AIM Sector Funds (Invesco Sector Funds)
and Shareholders of Invesco Technology Sector Fund:
In our opinion, the accompanying statement of assets and liabilities, including the schedule of investments, and the related statements of operations and of changes in net assets and the financial highlights present fairly, in all material respects, the financial position of Invesco Technology Sector Fund (formerly known as Morgan Stanley Technology Fund; one of the funds constituting AIM Sector Funds (Invesco Sector Funds), hereafter referred to as the “Fund”) at March 31, 2011, the results of its operations, the changes in its net assets and the financial highlights for the year then ended, in conformity with accounting principles generally accepted in the United States of America. These financial statements and financial highlights (hereafter referred to as “financial statements”) are the responsibility of the Fund’s management; our responsibility is to express an opinion on these financial statements based on our audit. We conducted our audit of these financial statements in accordance with the standards of the Public Company Accounting Oversight Board (United States). Those standards require that we plan and perform the audit to obtain reasonable assurance about whether the financial statements are free of material misstatement. An audit includes examining, on a test basis, evidence supporting the amounts and disclosures in the financial statements, assessing the accounting principles used and significant estimates made by management, and evaluating the overall financial statement presentation. We believe that our audit, which included confirmation of securities at March 31, 2011 by correspondence with the custodian and brokers, provides a reasonable basis for our opinion. The statement of changes in net assets and the financial highlights of the Fund for the periods ended March 31, 2010 and prior were audited by other independent auditors whose report dated May 26, 2010 expressed an unqualified opinion on those financial statements.
PRICEWATERHOUSECOOPERS LLP
May 19, 2011
Houston, Texas
21 Invesco Technology Sector Fund
Calculating your ongoing Fund expenses
Example
As a shareholder of the Fund, you incur two types of costs: (1) transaction costs, which may include sales charges (loads) on purchase payments or contingent deferred sales charges on redemptions, and redemption fees, if any; and (2) ongoing costs, including management fees; distribution and/or service (12b-1) fees; and other Fund expenses. This example is intended to help you understand your ongoing costs (in dollars) of investing in the Fund and to compare these costs with ongoing costs of investing in other mutual funds. The example is based on an investment of $1,000 invested at the beginning of the period and held for the entire period October 1, 2010 through March 31, 2011.
Actual expenses
The table below provides information about actual account values and actual expenses. You may use the information in this table, together with the amount you invested, to estimate the expenses that you paid over the period. Simply divide your account value by $1,000 (for example, an $8,600 account value divided by $1,000 = 8.6), then multiply the result by the number in the table under the heading entitled “Actual Expenses Paid During Period” to estimate the expenses you paid on your account during this period.
Hypothetical example for comparison purposes
The table below also provides information about hypothetical account values and hypothetical expenses based on the Fund’s actual expense ratio and an assumed rate of return of 5% per year before expenses, which is not the Fund’s actual return.
The hypothetical account values and expenses may not be used to estimate the actual ending account balance or expenses you paid for the period. You may use this information to compare the ongoing costs of investing in the Fund and other funds. To do so, compare this 5% hypothetical example with the 5% hypothetical examples that appear in the shareholder reports of the other funds.
Please note that the expenses shown in the table are meant to highlight your ongoing costs only and do not reflect any transaction costs, such as sales charges (loads) on purchase payments, contingent deferred sales charges on redemptions, and redemption fees, if any. Therefore, the hypothetical information is useful in comparing ongoing costs only, and will not help you determine the relative total costs of owning different funds. In addition, if these transaction costs were included, your costs would have been higher.
| | | | | | | | | | | | | | | | | | | | | | | | | | | | | | | |
| | | | | | | | | | HYPOTHETICAL
| | | |
| | | | | | | | | | (5% annual return before
| | | |
| | | | | | | ACTUAL | | | expenses) | | | |
| | | | Beginning
| | | Ending
| | | Expenses
| | | Ending
| | | Expenses
| | | Annualized
|
| | | | Account Value
| | | Account Value
| | | Paid During
| | | Account Value
| | | Paid During
| | | Expense
|
| Class | | | (10/01/10) | | | (03/31/11)1 | | | Period2 | | | (03/31/11) | | | Period2 | | | Ratio |
| A | | | $ | 1,000.00 | | | | $ | 1,233.90 | | | | $ | 9.80 | | | | $ | 1,016.16 | | | | $ | 8.85 | | | | | 1.76 | % |
| | | | | | | | | | | | | | | | | | | | | | | | | | | | | | | |
| B | | | | 1,000.00 | | | | | 1,230.00 | | | | | 13.95 | | | | | 1,012.42 | | | | | 12.59 | | | | | 2.51 | |
| | | | | | | | | | | | | | | | | | | | | | | | | | | | | | | |
| C | | | | 1,000.00 | | | | | 1,230.00 | | | | | 13.95 | | | | | 1,012.42 | | | | | 12.59 | | | | | 2.51 | |
| | | | | | | | | | | | | | | | | | | | | | | | | | | | | | | |
| Y | | | | 1,000.00 | | | | | 1,235.70 | | | | | 8.42 | | | | | 1,017.40 | | | | | 7.59 | | | | | 1.51 | |
| | | | | | | | | | | | | | | | | | | | | | | | | | | | | | | |
| |
| 1 | The actual ending account value is based on the actual total return of the Fund for the period October 1, 2010 through March 31, 2011, after actual expenses and will differ from the hypothetical ending account value which is based on the Fund’s expense ratio and a hypothetical annual return of 5% before expenses. |
| 2 | Expenses are equal to the Fund’s annualized expense ratio as indicated above multiplied by the average account value over the period, multiplied by 182/365 to reflect the most recent fiscal half year. |
22 Invesco Technology Sector Fund
Trustees and Officers
The address of each trustee and officer is AIM Sector Funds (Invesco Sector Funds) (the “Trust”), 11 Greenway Plaza, Suite 2500, Houston, Texas 77046-1173. The trustees serve for the life of the Trust, subject to their earlier death, incapacitation, resignation, retirement or removal as more specifically provided in the Trust’s organizational documents. Each officer serves for a one year term or until their successors are elected and qualified. Column two below includes length of time served with predecessor entities, if any.
| | | | | | | | | | | | | | | |
| | | | | | | | | | Number of | | | |
| | | | | | | | | | Funds In | | | |
| | | | | | | | | | Fund Complex | | | |
| | Name, Year of Birth and | | Trustee and | | Principal Occupation(s) | | Overseen by | | Other Directorship(s) | |
| | Position(s) Held with the Trust | | /or Officer Since | | During Past 5 Years | | Trustee | | Held by Trustee | |
| | | | | | | |
| | Martin L. Flanagan1 — 1960
Trustee | | 2007 | | | | Executive Director, Chief Executive Officer and President, Invesco Ltd. (ultimate parent of Invesco and a global investment management firm); Advisor to the Board, Invesco Advisers, Inc. (formerly known as Invesco Institutional (N.A.), Inc.); Trustee, The Invesco Funds; Vice Chair, Investment Company Institute; and Member of Executive Board, SMU Cox School of Business | | 194 | | | | None | |
| | | | | | | | | | | | | | | |
| | | | | | | | Formerly: Chairman, Invesco Advisers, Inc. (registered investment adviser); Director, Chairman, Chief Executive Officer and President, IVZ Inc. (holding company), INVESCO Group Services, Inc. (service provider) and Invesco North American Holdings, Inc. (holding company); Director, Chief Executive Officer and President, Invesco Holding Company Limited (parent of Invesco and a global investment management firm); Director, Invesco Ltd.; Chairman, Investment Company Institute and President, Co-Chief Executive Officer, Co-President, Chief Operating Officer and Chief Financial Officer, Franklin Resources, Inc. (global investment management organization) | | | | | | | |
| | | | | | | |
| | Philip A. Taylor2 — 1954
Trustee, President and
Principal Executive Officer | | 2006 | | | | Head of North American Retail and Senior Managing Director, Invesco Ltd.; Director, Co-Chairman, Co-President and Co-Chief Executive Officer, Invesco Advisers, Inc. (formerly known as Invesco Institutional (N.A.), Inc.) (registered investment adviser); Director, Chief Executive Officer and President, 1371 Preferred Inc. (holding company); Director, Chairman, Chief Executive Officer and President, Invesco Management Group, Inc. (formerly Invesco Aim Management Group, Inc.) (financial services holding company); Director and President, INVESCO Funds Group, Inc. (registered investment adviser and registered transfer agent) and AIM GP Canada Inc. (general partner for limited partnerships); Director and Chairman, Invesco Investment Services, Inc. (formerly known as Invesco Aim Investment Services, Inc.) (registered transfer agent) and IVZ Distributors, Inc. (formerly known as INVESCO Distributors, Inc.) (registered broker dealer); Director, President and Chairman, Invesco Inc. (holding company) and Invesco Canada Holdings Inc. (holding company); Chief Executive Officer, Invesco Trimark Corporate Class Inc. (corporate mutual fund company) and Invesco Trimark Canada Fund Inc. (corporate mutual fund company); Director and Chief Executive Officer, Invesco Trimark Ltd./Invesco Trimark Ltèe (registered investment adviser and registered transfer agent) and Invesco Trimark Dealer Inc. (registered broker dealer); Trustee, President and Principal Executive Officer, The Invesco Funds (other than AIM Treasurer’s Series Trust (Invesco Treasurer’s Series Trust) and Short-Term Investments Trust); Trustee and Executive Vice President, The Invesco Funds (AIM Treasurer’s Series Trust (Invesco Treasurer’s Series Trust) and Short-Term Investments Trust only); and Director, Van Kampen Asset Management; Director, Chief Executive Officer and President, Van Kampen Investments Inc. and Van Kampen Exchange Corp.; Director and Chairman, Van Kampen Investor Services Inc. and Director and President, Van Kampen Advisors, Inc. | | 194 | | | | None | |
| | | | | | | | | | | | | | | |
| | | | | | | | Formerly: Director, Invesco Distributors, Inc. (formerly known as Invesco Aim Distributors, Inc.) (registered broker dealer); Manager, Invesco PowerShares Capital Management LLC; Director, Chief Executive Officer and President, Invesco Advisers, Inc.; Director, Chairman, Chief Executive Officer and President, Invesco Aim Capital Management, Inc.; President, Invesco Trimark Dealer Inc. and Invesco Trimark Ltd./Invesco Trimark Ltèe; Director and President, AIM Trimark Corporate Class Inc. and AIM Trimark Canada Fund Inc.; Senior Managing Director, Invesco Holding Company Limited; Trustee and Executive Vice President, Tax-Free Investments Trust; Director and Chairman, Fund Management Company (former registered broker dealer); President and Principal Executive Officer, The Invesco Funds (AIM Treasurer’s Series Trust (Invesco Treasurer’s Series Trust), Short-Term Investments Trust and Tax-Free Investments Trust only); President, AIM Trimark Global Fund Inc. and AIM Trimark Canada Fund Inc. | | | | | | | |
| | | | | | | |
| | Wayne M. Whalen3 — 1939
Trustee | | 2010 | | | | Of Counsel, and prior to 2010, partner in the law firm of Skadden, Arps, Slate, Meagher & Flom LLP, legal counsel to funds in the Fund Complex | | 212 | | | | Director of the Abraham Lincoln Presidential Library Foundation | |
| | | | | | | |
| | Independent Trustees | | | | | | | | | | | | | |
| | | | | | | |
| | Bruce L. Crockett — 1944
Trustee and Chair | | 2003 | | | | Chairman, Crockett Technology Associates (technology consulting company) Formerly: Director, Captaris (unified messaging provider); Director, President and Chief Executive Officer COMSAT Corporation; and Chairman, Board of Governors of INTELSAT (international communications company) | | 194 | | | | ACE Limited (insurance company); and Investment Company Institute | |
| | | | | | | |
| | David C. Arch — 1945
Trustee | | 2010 | | | | Chairman and Chief Executive Officer of Blistex Inc., a consumer health care products manufacturer. | | 212 | | | | Member of the Heartland Alliance Advisory Board, a nonprofit organization serving human needs based in Chicago. Board member of the Illinois Manufacturers’ Association. Member of the Board of Visitors, Institute for the Humanities, University of Michigan | |
| | | | | | | |
| | |
| 1 | | Mr. Flanagan is considered an interested person of the Trust because he is an officer of the adviser to the Trust, and an officer and a director of Invesco Ltd., ultimate parent of the adviser to the Trust. |
| |
| 2 | | Mr. Taylor is considered an interested person of the Trust because he is an officer and a director of the adviser to, and a director of the principal underwriter of, the Trust. |
| |
| 3 | | Mr. Whalen is considered an “interested person” (within the meaning of Section 2(a)(19) of the 1940 Act) of certain Funds in the Fund Complex by reason of he and his firm currently providing legal services as legal counsel to such Funds in the Fund Complex. |
T-1
Trustees and Officers — (continued)
| | | | | | | | | | | | | | | |
| | | | | | | | | | Number of | | | |
| | | | | | | | | | Funds In | | | |
| | | | | | | | | | Fund Complex | | | |
| | Name, Year of Birth and | | Trustee and | | Principal Occupation(s) | | Overseen by | | Other Directorship(s) | |
| | Position(s) Held with the Trust | | /or Officer Since | | During Past 5 Years | | Trustee | | Held by Trustee | |
| | | | | | | |
| | Independent Trustees | | | | | | | | | | | | | |
| | | | | | | |
| | Bob R. Baker — 1936
Trustee | | 1983 | | | | Retired
Formerly: President and Chief Executive Officer, AMC Cancer Research Center; and Chairman and Chief Executive Officer, First Columbia Financial Corporation | | 194 | | | | None | |
| | | | | | | |
| | Frank S. Bayley — 1939
Trustee | | 2003 | | | | Retired
Formerly: Director, Badgley Funds, Inc. (registered investment company) (2 portfolios) and Partner, law firm of Baker & McKenzie | | 194 | | | | Director and Chairman, C.D. Stimson Company (a real estate investment company) | |
| | | | | | | |
| | James T. Bunch — 1942
Trustee | | 2000 | | | | Founder, Green, Manning & Bunch Ltd. (investment banking firm)
Formerly: Executive Committee, United States Golf Association; and Director, Policy Studies, Inc. and Van Gilder Insurance Corporation | | 194 | | | | Vice Chairman, Board of Governors, Western Golf Association/Evans Scholars Foundation and Director, Denver Film Society | |
| | | | | | | |
| | Rodney Dammeyer — 1940
Trustee | | 2010 | | | | President of CAC, LLC, a private company offering capital investment and management advisory services.
Formerly: Prior to January 2004, Director of TeleTech Holdings Inc.; Prior to 2002, Director of Arris Group, Inc.; Prior to 2001, Managing Partner at Equity Group Corporate Investments. Prior to 1995, Vice Chairman of Anixter International. Prior to 1985, experience includes Senior Vice President and Chief Financial Officer of Household International, Inc, Executive Vice President and Chief Financial Officer of Northwest Industries, Inc. and Partner of Arthur Andersen & Co. | | 212 | | | | Director of Quidel Corporation and Stericycle, Inc. Prior to May 2008, Trustee of The Scripps Research Institute. Prior to February 2008, Director of Ventana Medical Systems, Inc. Prior to April 2007, Director of GATX Corporation. Prior to April 2004, Director of TheraSense, Inc. | |
| | | | | | | |
| | Albert R. Dowden — 1941
Trustee | | 2003 | | | | Director of a number of public and private business corporations, including the Boss Group, Ltd. (private investment and management); Reich & Tang Funds (5 portfolios) (registered investment company); and Homeowners of America Holding Corporation/ Homeowners of America Insurance Company (property casualty company) | | 194 | | | | Board of Nature’s Sunshine Products, Inc. | |
| | | | | | | | | | | | | | | |
| | | | | | | | Formerly: Director, Continental Energy Services, LLC (oil and gas pipeline service); Director, CompuDyne Corporation (provider of product and services to the public security market) and Director, Annuity and Life Re (Holdings), Ltd. (reinsurance company); Director, President and Chief Executive Officer, Volvo Group North America, Inc.; Senior Vice President, AB Volvo; Director of various public and private corporations; Chairman, DHJ Media, Inc.; Director Magellan Insurance Company; and Director, The Hertz Corporation, Genmar Corporation (boat manufacturer), National Media Corporation; Advisory Board of Rotary Power International (designer, manufacturer, and seller of rotary power engines); and Chairman, Cortland Trust, Inc. (registered investment company) | | | | | | | |
| | | | | | | |
| | Jack M. Fields — 1952
Trustee | | 2003 | | | | Chief Executive Officer, Twenty First Century Group, Inc. (government affairs company); and Owner and Chief Executive Officer, Dos Angelos Ranch, L.P. (cattle, hunting, corporate entertainment), Discovery Global Education Fund (non-profit) and Cross Timbers Quail Research Ranch (non-profit) | | 194 | | | | Administaff | |
| | | | | | | | | | | | | | | |
| | | | | | | | Formerly: Chief Executive Officer, Texana Timber LP (sustainable forestry company) and member of the U.S. House of Representatives | | | | | | | |
| | | | | | | |
| | Carl Frischling — 1937
Trustee | | 2003 | | | | Partner, law firm of Kramer Levin Naftalis and Frankel LLP | | 194 | | | | Director, Reich &
Tang Funds (6
portfolios) | |
| | | | | | | |
| | Prema Mathai-Davis — 1950
Trustee | | 2003 | | | | Retired
Formerly: Chief Executive Officer, YWCA of the U.S.A. | | 194 | | | | None | |
| | | | | | | |
| | Larry Soll — 1942
Trustee | | 1997 | | | | Retired
Formerly, Chairman, Chief Executive Officer and President, Synergen Corp. (a biotechnology company) | | 194 | | | | None | |
| | | | | | | |
| | Hugo F. Sonnenschein — 1940
Trustee | | 2010 | | | | President Emeritus and Honorary Trustee of the University of Chicago and the Adam Smith Distinguished Service Professor in the Department of Economics at the University of Chicago. Prior to July 2000, President of the University of Chicago. | | 212 | | | | Trustee of the University of Rochester and a member of its investment committee. Member of the National Academy of Sciences, the American Philosophical Society and a fellow of the American Academy of Arts and Sciences | |
| | | | | | | |
| | Raymond Stickel, Jr. — 1944
Trustee | | 2005 | | | | Retired
Formerly: Director, Mainstay VP Series Funds, Inc. (25 portfolios) and Partner, Deloitte & Touche | | 194 | | | | None | |
| | | | | | | |
T-2
Trustees and Officers — (continued)
| | | | | | | | | | | | | |
| | | | | | | | | | Number of | | | |
| | | | | | | | | | Funds In | | | |
| | | | | | | | | | Fund Complex | | | |
| | Name, Year of Birth and | | Trustee and | | Principal Occupation(s) | | Overseen by | | Other Directorship(s) | |
| | Position(s) Held with the Trust | | /or Officer Since | | During Past 5 Years | | Trustee | | Held by Trustee | |
| | | | | | | |
| | Other Officers | | | | | | | | | | | |
| | | | | | | |
| | Russell C. Burk — 1958
Senior Vice President and
Senior Officer | | 2005 | | | | Senior Vice President and Senior Officer of Invesco Funds | | N/A | | N/A | |
| | | | | | | |
| | John M. Zerr — 1962
Senior Vice President, Chief Legal Officer and Secretary | | 2006 | | | | Director, Senior Vice President, Secretary and General Counsel, Invesco Management Group, Inc. (formerly known as Invesco Aim Management Group, Inc.), Van Kampen Investments Inc. and Van Kampen Exchange Corp., Senior Vice President, Invesco Advisers, Inc. formerly known as Invesco Institutional (N.A.), Inc.) (registered investment adviser); Senior Vice President and Secretary, Invesco Distributors, Inc. (formerly known as Invesco Aim Distributors, Inc.); Director, Vice President and Secretary, Invesco Investment Services, Inc. (formerly known as Invesco Aim Investment Services, Inc.) and IVZ Distributors, Inc. (formerly known as INVESCO Distributors, Inc.); Director and Vice President, INVESCO Funds Group, Inc.; Senior Vice President, Chief Legal Officer and Secretary, The Invesco Funds; Manager, Invesco PowerShares Capital Management LLC; Director, Secretary and General Counsel, Van Kampen Asset Management; Director and Secretary, Van Kampen Advisors Inc.; Secretary and General Counsel, Van Kampen Funds Inc.; and Director, Vice President, Secretary and General Counsel, Van Kampen Investor Services Inc.; and Chief Legal Officer, PowerShares Exchange-Traded Fund Trust, PowerShares Exchange-Traded Fund Trust II, PowerShares India Exchange-Traded Fund Trust and PowerShares Actively Managed Exchange-Traded Fund Trust | | N/A | | N/A | |
| | | | | | | | | | | | | |
| | | | | | | | Formerly: Director, Invesco Distributors, Inc. (formerly known as Invesco Aim Distributors, Inc.); Director, Senior Vice President, General Counsel and Secretary, Invesco Advisers, Inc.; Director, Vice President and Secretary, Fund Management Company; Director, Senior Vice President, Secretary, General Counsel and Vice President, Invesco Aim Capital Management, Inc.; Chief Operating Officer and General Counsel, Liberty Ridge Capital, Inc. (an investment adviser); Vice President and Secretary, PBHG Funds (an investment company) and PBHG Insurance Series Fund (an investment company); Chief Operating Officer, General Counsel and Secretary, Old Mutual Investment Partners (a broker-dealer); General Counsel and Secretary, Old Mutual Fund Services (an administrator) and Old Mutual Shareholder Services (a shareholder servicing center); Executive Vice President, General Counsel and Secretary, Old Mutual Capital, Inc. (an investment adviser); and Vice President and Secretary, Old Mutual Advisors Funds (an investment company) | | | | | |
| | | | | | | |
| | Lisa O. Brinkley — 1959
Vice President | | 2004 | | | | Global Compliance Director, Invesco Ltd.; Chief Compliance Officer, Invesco Investment Services, Inc.(formerly known as Invesco Aim Investment Services, Inc.) and Van Kampen Investor Services Inc.; and Vice President, The Invesco Funds | | N/A | | N/A | |
| | | | | | | | | | | | | |
| | | | | | | | Formerly: Chief Compliance Officer, Invesco Distributors, Inc. (formerly known as Invesco Aim Distributors, Inc.), Senior Vice President, Invesco Management Group, Inc.; Senior Vice President and Chief Compliance Officer, Invesco Advisers, Inc. and The Invesco Funds; Vice President and Chief Compliance Officer, Invesco Aim Capital Management, Inc. and Invesco Distributors, Inc.; Vice President, Invesco Investment Services, Inc. and Fund Management Company | | | | | |
| | | | | | | |
| | Sheri Morris — 1964
Vice President, Treasurer and
Principal Financial Officer | | 2003 | | | | Vice President, Treasurer and Principal Financial Officer, The Invesco Funds; and Vice President, Invesco Advisers, Inc. (formerly known as Invesco Institutional (N.A.), Inc.) (registered investment adviser) | | N/A | | N/A | |
| | | | | | | | | | | | | |
| | | | | | | | Formerly: Vice President, Invesco Advisers, Inc., Invesco Aim Capital Management, Inc. and Invesco Aim Private Asset Management, Inc.; Assistant Vice President and Assistant Treasurer, The Invesco Funds and Assistant Vice President, Invesco Advisers, Inc., Invesco Aim Capital Management, Inc. and Invesco Aim Private Asset Management, Inc. | | | | | |
| | | | | | | |
| | Karen Dunn Kelley — 1960
Vice President | | 2003 | | | | Head of Invesco’s World Wide Fixed Income and Cash Management Group; Senior Vice President, Invesco Advisers, Inc. (formerly known as Invesco Institutional (N.A.), Inc.) (registered investment adviser) and Van Kampen Investments Inc.; Executive Vice President, Invesco Distributors, Inc. (formerly known as Invesco Aim Distributors, Inc.); Senior Vice President, Invesco Management Group, Inc. (formerly known as Invesco Aim Management Group, Inc.); and Director, Invesco Mortgage Capital Inc.; Vice President, The Invesco Funds (other than AIM Treasurer’s Series Trust (Invesco Treasurer’s Series Trust) and Short-Term Investments Trust); President and Principal Executive Officer, The Invesco Funds (AIM Treasurer’s Series Trust (Invesco Treasurer’s Series Trust) and Short-Term Investments Trust only). | | N/A | | N/A | |
| | | | | | | | | | | | | |
| | | | | | | | Formerly: Vice President, Invesco Advisers, Inc. (formerly known as Invesco Institutional (N.A.), Inc.); Director of Cash Management and Senior Vice President, Invesco Advisers, Inc. and Invesco Aim Capital Management, Inc.; President and Principal Executive Officer, Tax-Free Investments Trust; Director and President, Fund Management Company; Chief Cash Management Officer, Director of Cash Management, Senior Vice President, and Managing Director, Invesco Aim Capital Management, Inc.; Director of Cash Management, Senior Vice President, and Vice President, Invesco Advisers, Inc. and The Invesco Funds (AIM Treasurer’s Series Trust (Invesco Treasurer’s Series Trust), Short-Term Investments Trust and Tax-Free Investments Trust only) | | | | | |
| | | | | | | |
| | Lance A. Rejsek — 1967
Anti-Money Laundering Compliance Officer | | 2005 | | | | Anti-Money Laundering Compliance Officer, Invesco Advisers, Inc. (formerly known as Invesco Institutional (N.A.), Inc.) (registered investment adviser); Invesco Distributors, Inc. (formerly known as Invesco Aim Distributors, Inc.), Invesco Investment Services, Inc. (formerly known as Invesco Aim Investment Services, Inc.), The Invesco Funds, PowerShares Exchange-Traded Fund Trust, PowerShares Exchange-Traded Fund Trust II, PowerShares India Exchange-Traded Fund Trust, PowerShares Actively Managed Exchange-Traded Fund Trust, Van Kampen Asset Management, Van Kampen Investor Services Inc., and Van Kampen Funds Inc. | | N/A | | N/A | |
| | | | | | | | | | | | | |
| | | | | | | | Formerly: Anti-Money Laundering Compliance Officer, Fund Management Company, Invesco Advisers, Inc., Invesco Aim Capital Management, Inc. and Invesco Aim Private Asset Management, Inc. | | | | | |
| | | | | | | |
T-3
Trustees and Officers — (continued)
| | | | | | | | | | | | | |
| | | | | | | | | | Number of | | | |
| | | | | | | | | | Funds In | | | |
| | | | | | | | | | Fund Complex | | | |
| | Name, Year of Birth and | | Trustee and | | Principal Occupation(s) | | Overseen by | | Other Directorship(s) | |
| | Position(s) Held with the Trust | | /or Officer Since | | During Past 5 Years | | Trustee | | Held by Trustee | |
| | | | | | | |
| | Other Officers | | | | | | | | | | | |
| | | | | | | |
| | Todd L. Spillane — 1958
Chief Compliance Officer | | 2006 | | | | Senior Vice President, Invesco Management Group, Inc. (formerly known as Invesco Aim Management Group, Inc.), Van Kampen Investments Inc. and Van Kampen Exchange Corp.; Senior Vice President and Chief Compliance Officer, Invesco Advisers, Inc. (registered investment adviser) (formerly known as Invesco Institutional (N.A.), Inc.); Chief Compliance Officer, The Invesco Funds, PowerShares Exchange-Traded Fund Trust, PowerShares Exchange- Traded Fund Trust II, PowerShares India Exchange-Traded Fund Trust, PowerShares Actively Managed Exchange- Traded Fund Trust, INVESCO Private Capital Investments, Inc. (holding company), and Invesco Private Capital, Inc. (registered investment adviser); Vice President, Invesco Distributors, Inc. (formerly known as Invesco Aim Distributors, Inc.), Invesco Investment Services, Inc. (formerly known as Invesco Aim Investment Services, Inc.) and Van Kampen Investor Services Inc. | | N/A | | N/A | |
| | | | | | | | | | | | | |
| | | | | | | | Formerly: Senior Vice President and Chief Compliance Officer, Invesco Advisers, Inc. and Invesco Aim Capital Management, Inc.; Chief Compliance Officer, Invesco Global Asset Management (N.A.), Inc. and Invesco Senior Secured Management, Inc. (registered investment adviser); Vice President, Invesco Aim Capital Management, Inc. and Fund Management Company | | | | | |
| | | | | | | |
The Statement of Additional Information of the Trust includes additional information about the Fund’s Trustees and is available upon request, without charge, by calling 1.800.959.4246. Please refer to the Fund’s prospectus for information on the Fund’s sub-advisers.
| | | | | | | |
|
Office of the Fund | | Investment Adviser | | Distributor | | Auditors |
| 11 Greenway Plaza, Suite 2500 | | Invesco Advisers, Inc. | | Invesco Distributors, Inc. | | PricewaterhouseCoopers LLP |
| Houston, TX 77046-1173 | | 1555 Peachtree Street, N.E. | | 11 Greenway Plaza, Suite 2500 | | 1201 Louisiana Street, Suite 2900 |
| | | Atlanta, GA 30309 | | Houston, TX 77046-1173 | | Houston, TX 77002-5678 |
| | | | | | | |
Counsel to the Fund | | Counsel to the Independent Trustees | | Transfer Agent | | Custodian |
| Stradley Ronon Stevens & Young, LLP | | Kramer, Levin, Naftalis & Frankel LLP | | Invesco Investment Services, Inc. | | State Street Bank and Trust Company |
| 2600 One Commerce Square | | 1177 Avenue of the Americas | | 11 Greenway Plaza, Suite 2500 | | 225 Franklin |
| Philadelphia, PA 19103 | | New York, NY 10036-2714 | | Houston, TX 77046-1173 | | Boston, MA 02110-2801 |
T-4
Invesco mailing information
Send general correspondence to Invesco Investment Services, Inc., P.O. Box 219078, Kansas City, MO 64121-9078.
Invesco privacy policy
You share personal and financial information with us that is necessary for your transactions and your account records. We take very seriously the obligation to keep that information confidential and private.
Invesco collects nonpublic personal information about you from account applications or other forms you complete and from your transactions with us or our affiliates. We do not disclose information about you or our former customers to service providers or other third parties except to the extent necessary to service your account and in other limited circumstances as permitted by law. For example, we use this information to facilitate the delivery of transaction confirmations, financial reports, prospectuses and tax forms.
Even within Invesco, only people involved in the servicing of your accounts and compliance monitoring have access to your information. To ensure the highest level of confidentiality and security, Invesco maintains physical, electronic and procedural safeguards that meet or exceed federal standards. Special measures, such as data encryption and authentication, apply to your communications with us on our website. More detail is available to you at invesco.com/privacy.
Important notice regarding delivery of security holder documents
To reduce Fund expenses, only one copy of most shareholder documents may be mailed to shareholders with multiple accounts at the same address (Householding). Mailing of your shareholder documents may be householded indefinitely unless you instruct us otherwise. If you do not want the mailing of these documents to be combined with those for other members of your household, please contact Invesco Investment Services, Inc. at 800 959 4246 or contact your financial institution. We will begin sending you individual copies for each account within 30 days after receiving your request.
Fund holdings and proxy voting information
The Fund provides a complete list of its holdings four times in each fiscal year, at the quarter-ends. For the second and fourth quarters, the lists appear in the Fund’s semiannual and annual reports to shareholders. For the first and third quarters, the Fund files the lists with the Securities and Exchange Commission (SEC) on Form N-Q. The most recent list of portfolio holdings is available at invesco.com/completeqtrholdings. Shareholders can also look up the Fund’s Forms N-Q on the SEC website at sec.gov. Copies of the Fund’s Forms N-Q may be reviewed and copied at the SEC Public Reference Room in Washington, D.C. You can obtain information on the operation of the Public Reference Room, including information about duplicating fee charges, by calling 202 551 8090 or 800 732 0330, or by electronic request at the following email address: publicinfo@sec.gov. The SEC file numbers for the Fund are 811-03826 and 002-85905.
A description of the policies and procedures that the Fund uses to determine how to vote proxies relating to portfolio securities is available without charge, upon request, from our Client Services department at 800 959 4246 or at invesco.com/proxyguidelines. The information is also available on the SEC website, sec.gov.
Information regarding how the Fund voted proxies related to its portfolio securities during the period between June 1, 2010, and June 30, 2010, is available at invesco.com/proxysearch. In addition, this information is available on the SEC website, sec.gov. Proxy voting information for the predecessor fund prior to its reorganization with the Fund on June 1, 2010, is not available on the Invesco website but is or will be available on the SEC website under the predecessor fund.
Invesco Advisers, Inc. is an investment adviser; it provides investment advisory services to individual and institutional clients and does not sell securities. Invesco Distributors, Inc. is the U.S. distributor for Invesco Ltd.’s retail mutual funds, exchange-traded funds and institutional money market funds. Both are wholly owned, indirect subsidiaries of Invesco Ltd.
| | | | | |
|
| | | MS-TECH-AR-1 | | Invesco Distributors, Inc |
| | | | | |
|
| |
Annual Report to Shareholders | | March 31, 2011 |
| | | | | |
| |
| Invesco Van Kampen Utility Fund |
Nasdaq:
A: VKUAX § B: VKUBX § C: VKUCX § Y: VKUIX
| | | |
|
| |
| 2 | | Letters to Shareholders |
| 4 | | Performance Summary |
| 4 | | Management Discussion |
| 6 | | Long-Term Fund Performance |
| 8 | | Supplemental Information |
| 9 | | Schedule of Investments |
| 10 | | Financial Statements |
| 13 | | Financial Highlights |
| 16 | | Notes to Financial Statements |
| 23 | | Auditor’s Report |
| 24 | | Fund Expenses |
| 25 | | Tax Information |
| T-1 | | Trustees and Officers |
Letters to Shareholders

Philip Taylor
Dear Shareholders:
Enclosed is important information about your Fund and its performance.
I’ve always believed that companies have an obligation to communicate regularly with their clients, and I believe that obligation is especially critical in the investment industry.
Our website – invesco.com/us – offers timely market updates and commentary from many of our portfolio managers and other investment professionals, as well as quarterly messages from me. At invesco.com/us, you also can obtain information about your account at any hour of the day or night. I invite you to visit and explore the tools and information we offer.
Invesco’s commitment to investment excellence
Invesco’s 2010 acquisition of Morgan Stanley’s retail asset management business, including Van Kampen Investments, broadened our range of investment products available to you. As a strong organization with a single focus – investment management – Invesco today offers investment capabilities and products to meet the needs of virtually any investor. In addition to traditional mutual funds, we manage a broad range of other solutions, including single-country, regional and global investments spanning major equity, fixed income and alternative asset classes.
Investment excellence is our goal across our product line. Let me explain what that means. All of our funds are managed by specialized teams of investment professionals. Each team has a discrete investment perspective and philosophy, and all follow disciplined, repeatable processes governed by strong risk oversight. Our investment-centric culture provides an environment that seeks to reduce distractions, allowing our fund managers to concentrate on what they do best – manage your money.
The importance of a broad product line and investment management expertise is obvious given the markets we’ve experienced over the last two to three years. We’ve seen that investment strategies can outperform or underperform their benchmark indexes for a variety of reasons, including where we are in the market cycle, and whether prevailing economic conditions are favorable or unfavorable for that strategy. That’s why no investment strategy can guarantee top-tier performance at all times. What investors can expect, and what Invesco offers, are funds that are managed according to their stated investment objectives and strategies, with robust risk oversight using consistent, repeatable investment processes that don’t change as short-term external conditions change – investments managed for the long term. This disciplined approach can’t guarantee a profit; no investment can do that, since all involve some measure of risk. But it can ensure that your money is managed the way we said it would be.
This adherence to stated investment objectives and strategies allows your financial advisor to build a diversified portfolio that meets your individual risk tolerance and financial goals. It also means that when your goals change, your financial advisor will be able to find an appropriate investment option to meet your needs.
Invesco’s commitment to you
Invesco’s commitment to you remains stronger than ever. It’s one of the reasons we’ve grown to become one of the world’s leading asset managers.
If you have questions about your account, please contact one of our client service representatives at 800 959 4246. If you have a general Invesco-related question or comment for me, I invite you to email me directly at phil@invesco.com.
I want to thank you for placing your trust in us. All of us at Invesco look forward to serving your investment management needs for many years to come. Thank you for investing with us.
Sincerely,
Philip Taylor
Senior Managing Director
Invesco Ltd.
2 Invesco Van Kampen Utility Fund

Bruce Crockett
Dear Fellow Shareholders:
With 2010 behind us, now is a good time to review our portfolios and ensure that we are adhering to a long-term, diversified investment strategy, which I’ve mentioned in previous letters. The year was notable for a number of reasons, but I’m sure most of us are grateful for a return to more stable markets and growing signs that the worst of the economic crisis is behind us.
Your Board continued to oversee the Invesco Funds with a strong sense of responsibility for your savings and a deep appreciation for your continued trust. As always, we worked throughout 2010 to manage costs and ensure Invesco continued to place investor interests first.
I’m pleased to report that the latest report from Morningstar affirmed the work we’ve done and included a number of positive comments regarding your Board’s oversight of the Invesco Funds. As background, Morningstar is a leading independent provider of investment research in North America, Europe, Australia and Asia. Morningstar stated, “A fund board’s duty is to represent the interests of fund shareholders, ensuring that the funds that it oversees charge reasonable fees and are run by capable advisors with a sound investment process.”
Morningstar maintained your Fund Board’s “A” grade for Board Quality, praising the Board for taking “meaningful steps in recent years to act in fund shareholders’ interests.”1 These steps included becoming much more proactive and vocal in overseeing how Invesco votes the funds’ shareholders’ proxies and requiring each fund trustee to invest more than one year’s board compensation in Invesco funds, further aligning our interests with those of our shareholders. Morningstar also cited the work I’ve done to make myself more available to fund shareholders via email.
I am also pleased that Morningstar recognized the effort and the Fund Board’s efforts over the past several years to work together with management at Invesco to enhance performance and sharpen the focus on investors.
As always, you’re welcome to contact me at bruce@brucecrockett.com with any questions or concerns you have. We look forward to representing and serving you.
Sincerely,
Bruce L. Crockett
Independent Chair
Invesco Funds Board of Trustees
| | |
| 1 | | Among the criteria Morningstar considers when evaluating a fund board are the degree to which the board is independent of the fund company; board members’ financial interests are aligned with those of fund shareholders; the board acts in fund shareholders’ interests; and the board works constructively with company management and investment personnel. Morningstar first awarded an “A” rating to the Invesco Funds board on September 13, 2007; that rating has been maintained in subsequent reports, the most recent of which was released December 17, 2010. Ratings are subject to change, usually every 12 to 24 months. Morningstar ratings range from “A” to “F.” |
3 Invesco Van Kampen Utility Fund
Management’s Discussion of Fund Performance
Performance summary
Effective June 25, 2010, Meggan Walsh assumed management of Invesco Van Kampen Utility Fund as lead portfolio manager and was joined by a team of equity analysts with extensive industry experience.
For the 12 months ended March 31, 2011, Invesco Van Kampen Utility Fund delivered a positive return but underperformed its style-specific benchmark, the S&P 500 Utilities Index. In turn, the utilities sector slightly lagged the broad market, as measured by the S&P 500 Index. While we managed the Fund for only part of this time, our comments will encompass the entire period. During the reporting period, the Fund’s return relative to the benchmark benefited from our holdings in the electric and multi-utilities industries, while holdings in the construction and engineering industry detracted from relative results.
Your Fund’s long-term performance appears later in this report.
Fund vs. Indexes
Total returns, 3/31/10 to 3/31/11, at net asset value (NAV). Performance shown does not include applicable contingent deferred sales charges (CDSC) or front-end sales charges, which would have reduced performance.
| | | | | |
|
| Class A Shares | | | 11.38 | % |
| |
| Class B Shares | | | 10.50 | |
| |
| Class C Shares | | | 10.51 | |
| |
| Class Y Shares | | | 11.60 | |
| |
S&P 500 Index▼ (Broad Market Index) | | | 15.66 | |
| |
S&P 500 Utilities Index▼ (Style-Specific Index) | | | 12.32 | |
| |
How we invest
In selecting investments, we focus primarily on companies within the electric utility, natural gas, water and telecommunications industries. We emphasize companies with solid balance sheets and operational cash flows that support sustained or increasing dividends.
Fundamental research and financial statement analysis are the backbone of our bottom-up investment process. Using a variety of valuation techniques, we estimate the potential return of holdings over a two-year investment period. We then construct the portfolio to provide the best combination of price appreciation potential, dividend income and risk profile while maintaining full sector exposure. We manage risk by maintaining an average of 30 to 50 positions, low turnover and a rigorous sell discipline.
We are committed to providing strategic exposure to a traditionally defensive and income-oriented asset class by using a total return approach to managing the Fund, emphasizing capital appreciation, current income and capital preservation.
Market conditions and your Fund
Equity markets delivered strong returns but were choppy during the fiscal year as investors weighed the competing issues of solid corporate profitability and soft, albeit improving, macroeconomic data. Corporate earnings improved considerably over the past year as high productivity growth and cost cutting measures made during the economic downturn led to a rebound in margins and profits. However, persistently high unemployment, consumer deleveraging and tepid housing data remained as
headwinds to the recovery. The sovereign debt crisis also contributed to market volatility as European countries began implementing austerity programs. During the second half of the reporting period, however, the market reversed course and rallied again on better economic news, ending the fiscal year with double-digit gains.
All 10 sectors of the S&P 500 Index posted gains for the year.1 The energy sector had the highest return, while financials had the lowest. The utilities sector returned 12.32% for the period, as compared to 15.66% for the overall S&P 500 Index.1
Since taking over the Fund in June, we made a number of changes to the portfolio. We decreased the number of Fund holdings by eliminating exposure to construction and engineering and transportation stocks. We also trimmed positions in telecommunication services and independent power producers. Conversely, we initiated new positions in the electric utilities industry and modestly increased our gas utilities exposure. We continued to emphasize regulated over nonregulated utilities. At the end of the fiscal year, the Fund’s largest industry allocations were in the electric and multi-utilities industries.
The largest contributor to results was Southern Company, which serves the southeastern U.S. primarily as a regulated utility, but also has a small merchant generation business. The company has gradually reduced its overall reliance on coal as a fuel source and has installed environmental controls on the majority of its coal fleet in anticipation of tighter environmental standards. Southern Company has raised its dividend for the last several years. Portland General Electric also had a positive effect on Fund results. While residential demand in the company’s service territory continued to lag national trends, industrial sales
Portfolio Composition
By sector
| | | | | |
|
| Utilities | | | 88.6 | % |
| |
| Telecommunication Services | | | 5.4 | |
| |
Money Market Funds Plus
Other Assets Less Liabilities | | | 6.0 | |
| |
Top 10 Equity Holdings*
| | | | | |
|
| 1. Southern Co. | | | 6.9 | % |
| |
| 2. American Electric Power Co., Inc. | | | 5.2 | |
| |
| 3. Dominion Resources, Inc. | | | 5.2 | |
| |
| 4. Progress Energy, Inc. | | | 5.1 | |
| |
| 5. Exelon Corp. | | | 5.1 | |
| |
| 6. National Grid PLC | | | 4.9 | |
| |
| 7. Portland General Electric Co. | | | 4.8 | |
| |
| 8. Edison International, Inc. | | | 3.4 | |
| |
| 9. Entergy Corp. | | | 3.4 | |
| |
| 10. DTE Energy Co. | | | 3.2 | |
| | | | | |
|
| Total Net Assets | | $109.1 million | |
| | | | | |
| Total Number of Holdings* | | | 36 | |
The Fund’s holdings are subject to change, and there is no assurance that the Fund will continue to hold any particular security.
| | |
| * | | Excluding money market fund holdings. |
4 Invesco Van Kampen Utility Fund
increased driven by demand from technology and solar businesses.
Entergy, one of largest nuclear operators in the U.S., was the leading detractor from the Fund’s returns for the reporting period. Following the devastating earthquake in Japan and ensuing nuclear concerns, investors anticipated increased scrutiny and higher operating expenses for U.S. nuclear power producers. In October 2010, Entergy announced plans to return $4 billion to $5 billion to shareholders through dividends and share repurchases from 2010 through 2014. Sempra Energy, a diversified utility based in California, also detracted from performance as low natural gas prices negatively affected earnings expectations for its generation and liquid natural gas segments. The company has since exited the commodities business, which investors expect will lower its volatility profile.
At the end of the Fund’s fiscal year, power providers experienced an improvement in industrial demand trends, though overall consumption had not fully recovered from the economic downturn. The lack of transparency in proposed new emissions requirements issued by the U.S. Environmental Protection Agency – and the accompanying level of capital expenditures required to comply with the new standards – remained a focus for investors. In broad terms, valuations for the sector continue to be modestly attractive relative to historical levels.
In closing, we’d like to thank you for your investment in Invesco Van Kampen Utility Fund, and we reiterate our commitment to providing investors strategic exposure to a traditionally defensive and income-oriented asset class through our total return approach.
The views and opinions expressed in management’s discussion of Fund performance are those of Invesco Advisers, Inc. These views and opinions are subject to change at any time based on factors such as market and economic conditions. These views and opinions may not be relied upon as investment advice or recommendations, or as an offer for a particular security. The information is not a complete analysis of every aspect of any market, country, industry, security or the Fund. Statements of fact are from sources considered reliable, but Invesco Advisers, Inc. makes no representation or warranty as to their completeness or accuracy. Although historical performance is no guarantee of future results, these insights may help you understand our investment management philosophy.
See important Fund and, if applicable, index disclosures later in this report.
Meggan Walsh
Chartered Financial Analyst, portfolio manager, is lead manager of Invesco Van Kampen Utility Fund. She joined Invesco in 1991. Ms. Walsh earned a B.S. in finance from the University of Maryland and an M.B.A. from Loyola University Maryland.
Robert Botard joined the management team after the close of the reporting period, effective May 2, 2011.
Davis Paddock left the management team after the close of the reporting period, effective May 2, 2011.
5 Invesco Van Kampen Utility Fund
Your Fund’s Long-Term Performance
Results of a $10,000 Investment – Oldest Share Classes since Inception
Past performance cannot guarantee comparable future results.
The data shown in the chart include reinvested distributions, applicable sales charges and Fund expenses including management fees. Results for Class B shares are calculated as if a hypothetical shareholder had liquidated his entire investment in the Fund at the close of the reporting period and paid the applicable contingent deferred sales charges. Index results include reinvested dividends, but they do not reflect sales charges.
Performance of the peer group, if applicable, reflects fund expenses and management fees; performance of a market index does not. Performance shown in the chart and table(s) does not reflect deduction of taxes a shareholder would pay on Fund distributions or sale of Fund shares.
This chart, which is a logarithmic chart, presents the fluctuations in the value of the Fund and its indexes. We believe that a logarithmic chart is more effective than other types of charts in illustrating
changes in value during the early years shown in the chart. The vertical axis, the one that indicates the dollar value of an investment, is constructed with each segment representing a percent change in the value of the investment. In this chart, each segment represents a doubling, or 100% change, in the value of the investment. In other words, the space between $5,000 and $10,000 is the same size as the space between $10,000 and $20,000, and so on.
6 Invesco Van Kampen Utility Fund
Average Annual Total Returns
As of 3/31/11, including maximum applicable
sales charges
| | | | | |
|
Class A Shares | | | | |
| |
| Inception (7/28/93) | | | 6.30 | % |
| |
| 10 Years | | | 1.85 | |
| |
| 5 Years | | | 1.06 | |
| |
| 1 Year | | | 5.26 | |
| |
| | | | | |
Class B Shares | | | | |
| |
| Inception (7/28/93) | | | 6.27 | % |
| |
| 10 Years | | | 1.81 | |
| |
| 5 Years | | | 1.09 | |
| |
| 1 Year | | | 5.50 | |
| |
| | | | | |
Class C Shares | | | | |
| |
| Inception (8/13/93) | | | 5.78 | % |
| |
| 10 Years | | | 1.65 | |
| |
| 5 Years | | | 1.44 | |
| |
| 1 Year | | | 9.51 | |
| |
| | | | | |
Class Y Shares | | | | |
| |
| Inception (1/14/09) | | | 9.54 | % |
| |
| 1 Year | | | 11.60 | |
| |
Effective June 1, 2010, Class A, Class B, Class C and Class I shares of the predecessor fund advised by Van Kampen Asset Management were reorganized into Class A, Class B, Class C and Class Y shares, respectively, of Invesco Van Kampen Utility Fund. Returns shown above for Class A, Class B, Class C and Class Y shares are blended returns of the predecessor fund and Invesco Van Kampen Utility Fund. Share class returns will differ from the predecessor fund because of different expenses.
The performance data quoted represent past performance and cannot guarantee comparable future results; current performance may be lower or higher. Please visit invesco.com/performance for the most recent month-end performance. Performance figures reflect reinvested distributions, changes in net asset value and the effect of the maximum sales charge unless otherwise stated. Investment return and principal value will fluctuate so that you may have a gain or loss when you sell shares.
The net annual Fund operating expense ratio set forth in the most recent Fund prospectus as of the date of this report for Class A, Class B, Class C and Class Y shares was 1.32%, 2.07%, 2.07% and 1.07%, respectively.1 The total annual Fund operating expense ratio set forth in the most recent Fund prospectus as of the date of this report for Class A, Class B, Class C and Class Y shares was 1.45%, 2.20%, 2.20% and 1.20%, respectively. The expense ratios presented above may vary from the expense ratios presented in other sections of this report that are based on expenses incurred during the period covered by this report.
Class A share performance reflects the maximum 5.50% sales charge, and Class B and Class C share performance reflects the applicable contingent deferred sales charge (CDSC) for the
period involved. For shares purchased prior to June 1, 2010, the CDSC on Class B shares declines from 4% at the time of purchase to 0% at the beginning of the seventh year. For shares purchased on or after June 1, 2010, the CDSC on Class B shares declines from 5% at the time of purchase to 0% at the beginning of the seventh year. The CDSC on Class C shares is 1% for the first year after purchase. Class Y shares do not have a front-end sales charge or a CDSC; therefore, performance is at net asset value.
The performance of the Fund’s share classes will differ primarily due to different sales charge structures and class expenses.
| | |
| 1 | | Total annual Fund operating expenses after any contractual fee waivers and/or expense reimbursements by the adviser in effect through at least June 30, 2012. See current prospectus for more information. |
continued from page 8
| | | returns based on those net asset values may differ from the net asset values and returns reported in the Financial Highlights. |
| |
| n | | Industry classifications used in this report are generally according to the |
Global Industry Classification Standard, which was developed by and is the exclusive property and a service mark of MSCI Inc. and Standard & Poor’s.
7 Invesco Van Kampen Utility Fund
Invesco Van Kampen Utility Fund’s investment objective is to seek to provide its shareholders with capital appreciation and current income.
| n | | Unless otherwise stated, information presented in this report is as of March 31, 2011, and is based on total net assets. |
| |
| n | | Unless otherwise noted, all data provided by Invesco. |
| |
| n | | To access your Fund’s reports/prospectus, visit invesco.com/fundreports. |
About share classes
| n | | Class B or Class B5 shares may not be purchased or acquired by exchange from share classes other than Class B or Class B5 shares. Please see the prospectus for more information. |
| |
| n | | Class Y shares are available to only certain investors. Please see the prospectus for more information. |
Principal risks of investing in the Fund
| n | | Market risk. Market risk is the possibility that the market values of securities owned by the Fund will decline. Investments in common stocks and other equity securities generally are affected by changes in the stock markets, which fluctuate substantially over time, sometimes suddenly and sharply. Investments in income securities generally are affected by changes in interest rates and the credit-worthiness of the issuer. Generally, the market prices of debt securities tend to fall as interest rates rise, and such declines tend to be greater among debt securities with longer maturities. The value of a convertible security tends to decline as interest rates rise and, because of the conversion feature, tends to vary with fluctuations in the market value of the underlying equity security. |
| |
| n | | Risks of investing in a utilities industry- concentrated fund. The Fund is susceptible to economic, political or regulatory (or deregulatory) risks or other occurrences associated with the utilities industry, which may directly impact utility companies’ growth and distributions. These risks can include increases in fuel and other operating costs; high interest expenses for capital construction programs; failure of regulatory authorities to approve rate changes; regulatory compliance costs; service interruption; the effects of economic slowdowns; surplus capacity |
| | | and competition; changes in the overall regulatory climate that may result in increased costs or the impairment of operations; or deregulation of certain utilities creating competitive challenges. |
| |
| n | | Credit risk. Credit risk refers to an issuer’s ability to make timely payments of interest and principal. Noninvestment grade securities or junk bonds are considered speculative by recognized rating agencies with respect to the issuer’s continuing ability to pay interest and principal, and such securities have less liquidity and a higher incidence of default than investments in higher-grade securities. |
| |
| n | | Income risk. The ability of the Fund’s common stocks and preferred stocks to generate income generally depends on the earnings and the continuing declaration of dividends by the issuers of such securities. The interest on the Fund’s debt securities, including convertible bonds, is generally affected by prevailing interest rates, which can vary widely over the short and long term. |
| |
| n | | High yield bond (junk bond) risk. Junk bonds involve a greater risk of default or price changes due to changes in the credit quality of the issuer. The values of junk bonds fluctuate more than those of high-quality bonds in response to company, political, regulatory or economic developments. Values of junk bonds can decline significantly over short periods of time. |
| |
| n | | Foreign risks. The risks of investing in securities of foreign issuers, including emerging market issuers, can include fluctuations in foreign currencies, foreign currency exchange controls, political and economic instability, differences in securities regulation and trading, and foreign taxation issues. |
| |
| n | | Limited number of holdings risk. The Fund may invest a large percentage of its assets in a limited number of securities or other instruments, which could negatively affect the value of the Fund. |
| n | | Risks of derivatives. Risks of derivatives include the possible imperfect correlation between the value of the instruments and the underlying assets; risks of default by the other party to the transaction; risks that the transactions may result in losses that partially or completely offset gains in portfolio positions; and risks that the instruments may not be liquid. |
About indexes used in this report
| n | | The S&P 500® Index is an unmanaged index considered representative of the U.S. stock market. |
| |
| n | | The S&P 500 Utilities Index is an unmanaged index considered representative of the utilities market. |
| |
| n | | The Fund is not managed to track the performance of any particular index, including the index(es) defined here, and consequently, the performance of the Fund may deviate significantly from the performance of the index(es). |
| |
| n | | A direct investment cannot be made in an index. Unless otherwise indicated, index results include reinvested dividends, and they do not reflect sales charges. Performance of the peer group, if applicable, reflects fund expenses; performance of a market index does not. |
Other information
| n | | The Chartered Financial Analyst® (CFA®) designation is globally recognized and attests to a charterholder’s success in a rigorous and comprehensive study program in the field of investment management and research analysis. |
| |
| n | | The returns shown in management’s discussion of Fund performance are based on net asset values calculated for shareholder transactions. Generally accepted accounting principles require adjustments to be made to the net assets of the Fund at period end for financial reporting purposes, and as such, the net asset values for shareholder transactions and the |
continued on page 7
This report must be accompanied or preceded by a currently effective Fund prospectus, which contains more complete information, including sales charges and expenses. Investors should read it carefully before investing.
NOT FDIC INSURED | MAY LOSE VALUE | NO BANK GUARANTEE
| | | |
|
| |
Fund Nasdaq Symbols | | |
| | | |
| Class A Shares | | VKUAX |
| Class B Shares | | VKUBX |
| Class C Shares | | VKUCX |
| Class Y Shares | | VKUIX |
8 Invesco Van Kampen Utility Fund
Schedule of Investments
March 31, 2011
| | | | | | | | | |
| | | Shares | | Value |
| |
Common Stocks–94.0%
| | | | |
Electric Utilities–46.6%
| | | | |
| American Electric Power Co., Inc. | | | 162,514 | | | $ | 5,710,742 | |
| |
| Duke Energy Corp. | | | 167,682 | | | | 3,043,428 | |
| |
| Edison International, Inc. | | | 102,785 | | | | 3,760,903 | |
| |
| Entergy Corp. | | | 55,541 | | | | 3,732,911 | |
| |
| Exelon Corp. | | | 133,897 | | | | 5,521,912 | |
| |
| FirstEnergy Corp. | | | 89,412 | | | | 3,316,291 | |
| |
| NextEra Energy, Inc. | | | 28,675 | | | | 1,580,566 | |
| |
| Northeast Utilities | | | 30,376 | | | | 1,051,010 | |
| |
| Pepco Holdings, Inc. | | | 59,225 | | | | 1,104,546 | |
| |
| Pinnacle West Capital Corp. | | | 18,405 | | | | 787,550 | |
| |
| Portland General Electric Co. | | | 221,995 | | | | 5,276,821 | |
| |
| PPL Corp. | | | 116,145 | | | | 2,938,469 | |
| |
| Progress Energy, Inc. | | | 119,873 | | | | 5,530,940 | |
| |
| Southern Co. | | | 196,531 | | | | 7,489,796 | |
| |
| | | | | | | | 50,845,885 | |
| |
Gas Utilities–4.1%
| | | | |
| AGL Resources, Inc. | | | 55,166 | | | | 2,197,813 | |
| |
| Atmos Energy Corp. | | | 29,236 | | | | 996,948 | |
| |
| ONEOK, Inc. | | | 7,085 | | | | 473,845 | |
| |
| UGI Corp. | | | 25,037 | | | | 823,717 | |
| |
| | | | | | | | 4,492,323 | |
| |
Independent Power Producers & Energy Traders–7.4%
| | | | |
Calpine Corp.(a) | | | 170,584 | | | | 2,707,168 | |
| |
| Constellation Energy Group, Inc. | | | 68,201 | | | | 2,123,097 | |
| |
NRG Energy, Inc.(a) | | | 150,678 | | | | 3,245,604 | |
| |
| | | | | | | | 8,075,869 | |
| |
Integrated Telecommunication Services–5.4%
| | | | |
| AT&T, Inc. | | | 51,819 | | | | 1,585,661 | |
| |
| Qwest Communications International, Inc. | | | 198,449 | | | | 1,355,407 | |
| |
| Verizon Communications, Inc. | | | 77,713 | | | | 2,995,059 | |
| |
| | | | | | | | 5,936,127 | |
| |
Multi-Utilities–28.6%
| | | | |
| CMS Energy Corp. | | | 55,378 | | | | 1,087,624 | |
| |
| Consolidated Edison, Inc. | | | 29,204 | | | | 1,481,227 | |
| |
| Dominion Resources, Inc. | | | 126,261 | | | | 5,643,867 | |
| |
| DTE Energy Co. | | | 70,220 | | | | 3,437,971 | |
| |
| National Grid PLC (United Kingdom) | | | 554,042 | | | | 5,292,136 | |
| |
| NiSource, Inc. | | | 133,490 | | | | 2,560,338 | |
| |
| PG&E Corp. | | | 57,394 | | | | 2,535,667 | |
| |
| Public Service Enterprise Group, Inc. | | | 98,389 | | | | 3,100,238 | |
| |
| Sempra Energy | | | 40,900 | | | | 2,188,150 | |
| |
| TECO Energy, Inc. | | | 45,121 | | | | 846,470 | |
| |
| Xcel Energy, Inc. | | | 126,145 | | | | 3,013,604 | |
| |
| | | | | | | | 31,187,292 | |
| |
Oil & Gas Storage & Transportation–1.9%
| | | | |
| Southern Union Co. | | | 71,101 | | | | 2,034,911 | |
| |
| Total Long-Term Investments 94.0% (Cost $95,728,792) | | | | | | | 102,572,407 | |
| |
Money Market Funds–5.9%
| | | | |
Liquid Assets Portfolio–Institutional Class(b) | | | 3,192,006 | | | | 3,192,006 | |
| |
Premier Portfolio–Institutional Class(b) | | | 3,192,006 | | | | 3,192,006 | |
| |
| Total Money Market Funds 5.9% | | | | | | | 6,384,012 | |
| |
| TOTAL INVESTMENTS–99.9% (Cost $102,112,804) | | | | | | | 108,956,419 | |
| |
| OTHER ASSETS IN EXCESS OF LIABILITIES–0.1% | | | | | | | 128,210 | |
| |
| NET ASSETS–100.0% | | | | | | $ | 109,084,629 | |
| |
Notes to Schedule of Investments:
| | |
| (a) | | Non-income producing security. |
| (b) | | The money market fund and the Fund are affiliated by having the same investment adviser. |
See accompanying Notes to Financial Statements which are an integral part of the financial statements.
9 Invesco Van Kampen Utility Fund
Statement of Assets and Liabilities
March 31, 2011
| | | | | |
Assets:
|
| Investments, at value (Cost $95,728,792) | | $ | 102,572,407 | |
| |
| Investments in affiliated money market funds, at value and cost | | | 6,384,012 | |
| |
| Total Investments (Cost $102,112,804) | | | 108,956,419 | |
| |
| Receivables: | | | | |
| Investments sold | | | 383,108 | |
| |
| Dividends | | | 285,427 | |
| |
| Fund shares sold | | | 80,254 | |
| |
| Prepaid expenses | | | 4,335 | |
| |
| Investments for trustee deferred compensation and retirement plans | | | 2,269 | |
| |
| Other | | | 2,232 | |
| |
| Total assets | | | 109,714,044 | |
| |
Liabilities:
|
| Payables: | | | | |
| Fund shares repurchased | | | 338,399 | |
| |
| Accrued fees to affiliates | | | 98,249 | |
| |
| Accrued other operating expenses | | | 190,498 | |
| |
| Trustees’ deferred compensation and retirement plans | | | 2,269 | |
| |
| Total liabilities | | | 629,415 | |
| |
| Net assets | | $ | 109,084,629 | |
| |
Net assets consist of:
|
| Shares of beneficial interest (Par value of $0.01 per share with an unlimited number of shares authorized) | | $ | 115,803,844 | |
| |
| Unrealized appreciation | | | 6,843,874 | |
| |
| Undistributed net investment income | | | 212,694 | |
| |
| Undistributed net realized gain (loss) | | | (13,775,783 | ) |
| |
| Net assets | | $ | 109,084,629 | |
| |
Maximum Offering Price Per Share:
|
| Class A Shares: | | | | |
| Net asset value and redemption price per share (based on net assets of $91,652,962 and 5,116,513 shares of beneficial interest issued and outstanding) | | $ | 17.91 | |
| |
| Maximum sales charge (5.50% of offering price) | | | 1.04 | |
| |
| Maximum offering price to public | | $ | 18.95 | |
| |
| Class B Shares: | | | | |
| Net asset value and offering price per share (based on net assets of $8,963,950 and 502,931 shares of beneficial interest issued and outstanding) | | $ | 17.82 | |
| |
| Class C Shares: | | | | |
| Net asset value and offering price per share (based on net assets of $8,180,600 and 459,161 shares of beneficial interest issued and outstanding) | | $ | 17.82 | |
| |
| Class Y Shares: | | | | |
| Net asset value and offering price per share (based on net assets of $287,117 and 16,035 shares of beneficial interest issued and outstanding) | | $ | 17.91 | |
| |
See accompanying Notes to Financial Statements which are an integral part of the financial statements.
10 Invesco Van Kampen Utility Fund
Statement of Operations
For the year ended March 31, 2011
| | | | | |
Investment income:
|
| Dividends (net of foreign withholding taxes of $16,009) | | $ | 4,458,760 | |
| |
| Dividends from affiliated money market funds | | | 5,226 | |
| |
| Interest | | | 165 | |
| |
| Total income | | | 4,464,151 | |
| |
Expenses:
|
| Advisory fee | | | 732,040 | |
| |
| Distribution fees | | | | |
| Class A | | | 233,616 | |
| |
| Class B | | | 104,727 | |
| |
| Class C | | | 83,288 | |
| |
| Transfer agent fees | | | 287,180 | |
| |
| Custodian fees | | | 91,316 | |
| |
| Administrative services fees | | | 52,567 | |
| |
| Trustees’ and officers’ fees and benefits | | | 18,661 | |
| |
| Other | | | 150,768 | |
| |
| Total expenses | | | 1,754,163 | |
| |
| Less: Fees waived and expenses reimbursed | | | 122,319 | |
| |
| Net expenses | | | 1,631,844 | |
| |
| Net investment income | | | 2,832,307 | |
| |
Realized and unrealized gain (loss):
|
| Realized gain (loss): | | | | |
| Investments | | | (4,686,121 | ) |
| |
| Foreign currency transactions | | | (8,642 | ) |
| |
| Forward foreign currency contracts | | | 277,199 | |
| |
| Net realized gain (loss) | | | (4,417,564 | ) |
| |
| Unrealized appreciation (depreciation): | | | | |
| Beginning of the period | | | (6,605,331 | ) |
| |
| End of the period: | | | | |
| Investments | | | 6,843,615 | |
| |
| Foreign currency translation | | | 259 | |
| |
| | | | 6,843,874 | |
| |
| Net unrealized appreciation during the period | | | 13,449,205 | |
| |
| Net realized and unrealized gain | | | 9,031,641 | |
| |
| Net increase in net assets from operations | | $ | 11,863,948 | |
| |
See accompanying Notes to Financial Statements which are an integral part of the financial statements.
11 Invesco Van Kampen Utility Fund
Statement of Changes in Net Assets
| | | | | | | | | |
| | | Year ended
| | Year ended
|
| | | March 31,
| | March 31,
|
| | | 2011 | | 2010 |
| |
From investment activities:
| | | | |
Operations:
| | | | |
| Net investment income | | $ | 2,832,307 | | | $ | 4,040,129 | |
| |
| Net realized gain (loss) | | | (4,417,564 | ) | | | 6,623,344 | |
| |
| Net unrealized appreciation during the period | | | 13,449,205 | | | | 10,019,830 | |
| |
| Change in net assets from operations | | | 11,863,948 | | | | 20,683,303 | |
| |
Distributions from net investment income:
| | | | |
| Class A | | | (3,436,290 | ) | | | (3,394,031 | ) |
| |
| Class B | | | (301,562 | ) | | | (382,584 | ) |
| |
| Class C | | | (245,144 | ) | | | (246,410 | ) |
| |
| Class Y | | | (15,781 | ) | | | (10,897 | ) |
| |
| Total distributions | | | (3,998,777 | ) | | | (4,033,922 | ) |
| |
| Net change in net assets from investment activities | | | 7,865,171 | | | | 16,649,381 | |
| |
From capital transactions:
| | | | |
| Proceeds from shares sold | | | 9,549,930 | | | | 13,011,988 | |
| |
| Net asset value of shares issued through dividend reinvestment | | | 3,648,114 | | | | 3,701,876 | |
| |
| Cost of shares repurchased | | | (31,212,235 | ) | | | (34,986,729 | ) |
| |
| Net change in net assets from capital transactions | | | (18,014,191 | ) | | | (18,272,865 | ) |
| |
| Total increase (decrease) in net assets | | | (10,149,020 | ) | | | (1,623,484 | ) |
| |
Net assets:
| | | | |
| Beginning of the period | | | 119,233,649 | | | | 120,857,133 | |
| |
| End of the period (including undistributed net investment income of $212,694 and $1,037,227, respectively) | | $ | 109,084,629 | | | $ | 119,233,649 | |
| |
See accompanying Notes to Financial Statements which are an integral part of the financial statements.
12 Invesco Van Kampen Utility Fund
Financial Highlights
The following schedules present financial highlights for one share of the Fund outstanding throughout the periods indicated.
| | | | | | | | | | | | | | | | | | | | | |
| | | Class A Shares |
| | | Year ended March 31, |
| | | 2011 | | 2010 | | 2009 | | 2008 | | 2007 |
| |
| Net asset value, beginning of the period | | $ | 16.70 | | | $ | 14.63 | | | $ | 22.87 | | | $ | 23.86 | | | $ | 18.90 | |
| |
Net investment income(a) | | | 0.45 | | | | 0.55 | | | | 0.45 | | | | 0.40 | | | | 0.31 | |
| |
| Net realized and unrealized gain (loss) | | | 1.40 | | | | 2.09 | | | | (7.79 | ) | | | (1.03 | ) | | | 5.15 | |
| |
| Total from investment operations | | | 1.85 | | | | 2.64 | | | | (7.34 | ) | | | (0.63 | ) | | | 5.46 | |
| |
| Less | | | | | | | | | | | | | | | | | | | | |
| Distributions from net investment income | | | 0.64 | | | | 0.57 | | | | 0.36 | | | | 0.36 | | | | 0.50 | |
| |
| Distributions from net realized gain | | | -0- | | | | -0- | | | | 0.54 | | | | -0- | | | | -0- | |
| |
| Total distributions | | | 0.64 | | | | 0.57 | | | | 0.90 | | | | 0.36 | | | | 0.50 | |
| |
| Net asset value, end of the period | | $ | 17.91 | | | $ | 16.70 | | | $ | 14.63 | | | $ | 22.87 | | | $ | 23.86 | |
| |
| Total return | | | 11.38 | %(b) | | | 18.05 | %(c) | | | (32.56 | )%(c) | | | (2.71 | )%(c) | | | 29.30 | %(c) |
| |
| Net assets at end of the period (000’s omitted) | | $ | 91,653 | | | $ | 97,519 | | | $ | 94,527 | | | $ | 156,116 | | | $ | 159,738 | |
| |
| Ratio of expenses to average net assets with fee waivers and/or expenses reimbursed | | | 1.33 | %(d) | | | 1.45 | % | | | 1.32 | % | | | 1.21 | % | | | 1.27 | % |
| |
| Ratio of expenses to average net assets without fee waivers and/or expenses reimbursed | | | 1.44 | %(d) | | | N/A | | | | N/A | | | | N/A | | | | N/A | |
| |
| Ratio of net investment income to average net assets | | | 2.64 | %(d) | | | 3.37 | % | | | 2.29 | % | | | 1.65 | % | | | 1.50 | % |
| |
Portfolio turnover(e) | | | 99 | % | | | 325 | % | | | 120 | % | | | 36 | % | | | 30 | % |
| |
| | |
| (a) | | Based on average shares outstanding. |
| (b) | | Includes adjustments in accordance with accounting principles generally accepted in the United States of America and as such, the net asset value for financial reporting purposes and the returns based upon those net asset values may differ from the net asset value and returns for shareholder transactions. Does not include sales charges and is not annualized for periods less than one year, if applicable. |
| (c) | | Assumes reinvestment of all distributions for the period and does not include payment of the maximum sales charge of 5.75% or contingent deferred sales charge (CDSC). On purchases of $1 million or more, a CDSC of 1% may be imposed on certain redemptions made within eighteen months of purchase. If the sales charges were included, total returns would be lower. These returns include combined Rule 12b-1 fees and service fees of up to 0.25% and do not reflect the deduction of taxes that a shareholder would pay on Fund distributions or the redemption of Fund shares. |
| (d) | | Ratios are annualized and based on average daily net assets (000’s omitted) of $93,429. |
| (e) | | Portfolio turnover is calculated at the fund level and is not annualized for periods less than one year, if applicable. |
See accompanying Notes to Financial Statements which are an integral part of the financial statements.
13 Invesco Van Kampen Utility Fund
Financial Highlights—(continued)
| | | | | | | | | | | | | | | | | | | | | |
| | | Class B Shares |
| | | Year ended March 31, |
| | | 2011 | | 2010 | | 2009 | | 2008 | | 2007 |
| |
| Net asset value, beginning of the period | | $ | 16.62 | | | $ | 14.56 | | | $ | 22.77 | | | $ | 23.76 | | | $ | 18.85 | |
| |
Net investment income(a) | | | 0.32 | | | | 0.43 | | | | 0.28 | | | | 0.22 | | | | 0.15 | |
| |
| Net realized and unrealized gain (loss) | | | 1.39 | | | | 2.08 | | | | (7.73 | ) | | | (1.03 | ) | | | 5.14 | |
| |
| Total from investment operations | | | 1.71 | | | | 2.51 | | | | (7.45 | ) | | | (0.81 | ) | | | 5.29 | |
| |
| Less | | | | | | | | | | | | | | | | | | | | |
| Distributions from net investment income | | | 0.51 | | | | 0.45 | | | | 0.22 | | | | 0.18 | | | | 0.38 | |
| |
| Distributions from net realized gain | | | -0- | | | | -0- | | | | 0.54 | | | | -0- | | | | -0- | |
| |
| Total distributions | | | 0.51 | | | | 0.45 | | | | 0.76 | | | | 0.18 | | | | 0.38 | |
| |
| Net asset value, end of the period | | $ | 17.82 | | | $ | 16.62 | | | $ | 14.56 | | | $ | 22.77 | | | $ | 23.76 | |
| |
| Total return | | | 10.50 | %(b) | | | 17.25 | %(c) | | | (33.09 | )%(c) | | | (3.45 | )%(c) | | | 28.40 | %(c) |
| |
| Net assets at end of the period (000’s omitted) | | $ | 8,964 | | | $ | 12,329 | | | $ | 16,920 | | | $ | 41,096 | | | $ | 47,492 | |
| |
| Ratio of expenses to average net assets with fee waivers and/or expenses reimbursed | | | 2.08 | %(d) | | | 2.20 | % | | | 2.07 | % | | | 1.96 | % | | | 2.03 | % |
| |
| Ratio of expenses to average net assets without fee waivers and/or expenses reimbursed | | | 2.19 | %(d) | | | N/A | | | | N/A | | | | N/A | | | | N/A | |
| |
| Ratio of net investment income to average net assets | | | 1.89 | %(d) | | | 2.63 | % | | | 1.42 | % | | | 0.89 | % | | | 0.74 | % |
| |
Portfolio turnover(e) | | | 99 | % | | | 325 | % | | | 120 | % | | | 36 | % | | | 30 | % |
| |
| | |
| (a) | | Based on average shares outstanding. |
| (b) | | Includes adjustments in accordance with accounting principles generally accepted in the United States of America and as such, the net asset value for financial reporting purposes and the returns based upon those net asset values may differ from the net asset value and returns for shareholder transactions. Does not include sales charges and is not annualized for periods less than one year, if applicable. |
| (c) | | Assumes reinvestment of all distributions for the period and does not include payment of the maximum CDSC of 4%, charged on certain redemptions made within one year of purchase and declining to 0% after the sixth year. If the sales charge was included, total returns would be lower. These returns include combined Rule 12b-1 fees and service fees of up to 1% and do not reflect the deduction of taxes that a shareholder would pay on Fund distributions or the redemption of Fund shares. |
| (d) | | Ratios are annualized and based on average daily net assets (000’s omitted) of $10,460. |
| (e) | | Portfolio turnover is calculated at the fund level and is not annualized for periods less than one year, if applicable. |
See accompanying Notes to Financial Statements which are an integral part of the financial statements.
14 Invesco Van Kampen Utility Fund
Financial Highlights—(continued)
| | | | | | | | | | | | | | | | | | | | | |
| | | Class C Shares |
| | | Year ended March 31, |
| | | 2011 | | 2010 | | 2009 | | 2008 | | 2007 |
| |
| Net asset value, beginning of the period | | $ | 16.61 | | | $ | 14.56 | | | $ | 22.76 | | | $ | 23.75 | | | $ | 18.85 | |
| |
Net investment income(a) | | | 0.32 | | | | 0.43 | | | | 0.30 | | | | 0.22 | | | | 0.15 | |
| |
| Net realized and unrealized gain (loss) | | | 1.40 | | | | 2.07 | | | | (7.74 | ) | | | (1.03 | ) | | | 5.13 | |
| |
| Total from investment operations | | | 1.72 | | | | 2.50 | | | | (7.44 | ) | | | (0.81 | ) | | | 5.28 | |
| |
| Less | | | | | | | | | | | | | | | | | | | | |
| Distributions from net investment income | | | 0.51 | | | | 0.45 | | | | 0.22 | | | | 0.18 | | | | 0.38 | |
| |
| Distributions from net realized gain | | | -0- | | | | -0- | | | | 0.54 | | | | -0- | | | | -0- | |
| |
| Total distributions | | | 0.51 | | | | 0.45 | | | | 0.76 | | | | 0.18 | | | | 0.38 | |
| |
| Net asset value, end of the period | | $ | 17.82 | | | $ | 16.61 | | | $ | 14.56 | | | $ | 22.76 | | | $ | 23.75 | |
| |
| Total return | | | 10.57 | %(b) | | | 17.18 | %(c) | | | (33.06 | )%(c) | | | (3.46 | )%(c) | | | 28.34 | %(c) |
| |
| Net assets at end of the period (000’s omitted) | | $ | 8,181 | | | $ | 8,600 | | | $ | 9,402 | | | $ | 16,825 | | | $ | 17,036 | |
| |
| Ratio of expenses to average net assets with fee waivers and/or expenses reimbursed | | | 2.08 | %(d) | | | 2.20 | % | | | 2.07 | % | | | 1.96 | % | | | 2.03 | % |
| |
| Ratio of expenses to average net assets without fee waivers and/or expenses reimbursed | | | 2.19 | %(d) | | | N/A | | | | N/A | | | | N/A | | | | N/A | |
| |
| Ratio of net investment income to average net assets | | | 1.89 | %(d) | | | 2.63 | % | | | 1.51 | % | | | 0.89 | % | | | 0.74 | % |
| |
Portfolio turnover(e) | | | 99 | % | | | 325 | % | | | 120 | % | | | 36 | % | | | 30 | % |
| |
| | |
| (a) | | Based on average shares outstanding. |
| (b) | | Includes adjustments in accordance with accounting principles generally accepted in the United States of America and as such, the net asset value for financial reporting purposes and the returns based upon those net asset values may differ from the net asset value and returns for shareholder transactions. Does not include sales charges and is not annualized for periods less than one year, if applicable. |
| (c) | | Assumes reinvestment of all distributions for the period and does not include payment of the maximum CDSC of 1%, charged on certain redemptions made within one year of purchase. If the sales charge was included, total returns would be lower. These returns include combined Rule 12b-1 fees and service fees of up to 1% and do not reflect the deduction of taxes that a shareholder would pay on Fund distributions or the redemption of Fund shares. |
| (d) | | Ratios are annualized and based on average daily net assets (000’s omitted) of $8,328. |
| (e) | | Portfolio turnover is calculated at the fund level and is not annualized for periods less than one year, if applicable. |
See accompanying Notes to Financial Statements which are an integral part of the financial statements.
15 Invesco Van Kampen Utility Fund
Financial Highlights—(continued)
| | | | | | | | | | | | | |
| | | Class Y Shares |
| | | | | | | January 14, 2009
|
| | | | | | | (Commencement of
|
| | | Year ended
| | Year ended
| | Operations) to
|
| | | March 31,
| | March 31,
| | March 31,
|
| | | 2011 | | 2010 | | 2009 |
| |
| Net asset value, beginning of the period | | $ | 16.70 | | | $ | 14.62 | | | $ | 15.92 | |
| |
Net investment income(a) | | | 0.49 | | | | 0.57 | | | | 0.15 | |
| |
| Net realized and unrealized gain (loss) | | | 1.40 | | | | 2.12 | | | | (1.35 | ) |
| |
| Total from investment operations | | | 1.89 | | | | 2.69 | | | | (1.20 | ) |
| |
| Less distributions from net investment income | | | 0.68 | | | | 0.61 | | | | 0.10 | |
| |
| Net asset value, end of the period | | $ | 17.91 | | | $ | 16.70 | | | $ | 14.62 | |
| |
| Total return | | | 11.66 | %(b) | | | 18.42 | %(c) | | | (7.48 | )%(c)* |
| |
| Net assets at end of the period (000’s omitted) | | $ | 287 | | | $ | 785 | | | $ | 9 | |
| |
| Ratio of expenses to average net assets with fee waivers and/or expenses reimbursed | | | 1.08 | %(d) | | | 1.20 | % | | | 1.19 | % |
| |
| Ratio of expenses to average net assets without fee waivers and/or expenses reimbursed | | | 1.19 | %(d) | | | N/A | | | | N/A | |
| |
| Ratio of net investment income to average net assets | | | 2.89 | %(d) | | | 3.38 | % | | | 4.64 | % |
| |
Portfolio turnover(e) | | | 99 | % | | | 325 | % | | | 120 | %* |
| |
| | |
| (a) | | Based on average shares outstanding. |
| (b) | | Includes adjustments in accordance with accounting principles generally accepted in the United States of America and as such, the net asset value for financial reporting purposes and the returns based upon those net asset values may differ from the net asset value and returns for shareholder transactions. Does not include sales charges and is not annualized for periods less than one year, if applicable. |
| (c) | | Assumes reinvestment of all distributions for the period. These returns do not reflect the deduction of taxes that a shareholder would pay on Fund distributions or the redemption of Fund shares. |
| (d) | | Ratios are annualized and based on average daily net assets (000’s omitted) of $372. |
| (e) | | Portfolio turnover is calculated at the fund level and is not annualized for periods less than one year, if applicable. |
| | |
| ˆ | | On June 1, 2010, the Fund’s former Class I Shares were reorganized into Class Y Shares. |
Notes to Financial Statements
March 31, 2011
NOTE 1—Significant Accounting Policies
Invesco Van Kampen Utility Fund (the “Fund”) is a series portfolio of AIM Sector Funds (Invesco Sector Funds) (the “Trust”). The Trust is a Delaware statutory trust registered under the Investment Company Act of 1940, as amended (the “1940 Act”), as an open-end series management investment company consisting of twenty-four separate portfolios, each authorized to issue an unlimited number of shares of beneficial interest. The assets, liabilities and operations of each portfolio are accounted for separately. Information presented in these financial statements pertains only to the Fund. Matters affecting each portfolio or class will be voted on exclusively by the shareholders of such portfolio or class.
Prior to June 1, 2010, the Fund operated as Van Kampen Utility Fund (the “Acquired Fund”), an investment portfolio of Van Kampen Equity Trust. The Acquired Fund was reorganized on June 1, 2010 (the “Reorganization Date”) through the transfer of all of its assets and liabilities to the Fund (the “Reorganization”).
Upon closing of the Reorganization, holders of the Acquired Fund’s Class A, Class B, Class C and Class I shares received Class A, Class B, Class C and Class Y shares, respectively, of the Fund.
Information for the Acquired Fund’s Class I shares prior to the Reorganization is included with Class Y shares of the Fund throughout this report.
The Fund’s investment objective is to seek to provide its shareholders with capital appreciation and current income.
The Fund currently consists of four different classes of shares: Class A, Class B, Class C and Class Y. Class A shares are sold with a front-end sales charge unless certain waiver criteria are met and under certain circumstances load waived shares may be subject to contingent deferred sales charges (“CDSC”). Class C shares are sold with a CDSC. Class Y shares are sold at net asset value. Effective November 30, 2010, new or additional investments in Class B shares are no longer permitted. Existing shareholders of Class B shares may continue to reinvest dividends and capital gains distributions in Class B shares until they convert. Also, shareholders in Class B shares will be able to exchange those shares for Class B shares of other Invesco Funds offering such shares until they convert. Generally, Class B shares will automatically convert to Class A shares on or about the month-end which is at least eight years after the date of purchase. Redemption of Class B shares prior to conversion date will be subject to a CDSC.
The following is a summary of the significant accounting policies followed by the Fund in the preparation of its financial statements.
| | |
| A. | | Security Valuations — Securities, including restricted securities, are valued according to the following policy. |
16 Invesco Van Kampen Utility Fund
| | |
| | A security listed or traded on an exchange (except convertible bonds) is valued at its last sales price or official closing price as of the close of the customary trading session on the exchange where the security is principally traded, or lacking any sales or official closing price on a particular day, the security may be valued at the closing bid price on that day. Securities traded in the over-the-counter market are valued based on prices furnished by independent pricing services or market makers. When such securities are valued by an independent pricing service they may be considered fair valued. Futures contracts are valued at the final settlement price set by an exchange on which they are principally traded. Listed options are valued at the mean between the last bid and ask prices from the exchange on which they are principally traded. Options not listed on an exchange are valued by an independent source at the mean between the last bid and ask prices. For purposes of determining net asset value per share, futures and option contracts generally are valued 15 minutes after the close of the customary trading session of the New York Stock Exchange (“NYSE”). |
| | Investments in open-end and closed-end registered investment companies that do not trade on an exchange are valued at the end of day net asset value per share. Investments in open-end and closed-end registered investment companies that trade on an exchange are valued at the last sales price or official closing price as of the close of the customary trading session on the exchange where the security is principally traded. |
| | Debt obligations (including convertible bonds) and unlisted equities are fair valued using an evaluated quote provided by an independent pricing service. Evaluated quotes provided by the pricing service may be determined without exclusive reliance on quoted prices, and may reflect appropriate factors such as institution-size trading in similar groups of securities, developments related to specific securities, dividend rate, yield, quality, type of issue, coupon rate, maturity, individual trading characteristics and other market data. Short-term obligations, including commercial paper, having 60 days or less to maturity are recorded at amortized cost which approximates value. Debt securities are subject to interest rate and credit risks. In addition, all debt securities involve some risk of default with respect to interest and/or principal payments. |
| | Foreign securities (including foreign exchange contracts) are converted into U.S. dollar amounts using the applicable exchange rates as of the close of the NYSE. If market quotations are available and reliable for foreign exchange traded equity securities, the securities will be valued at the market quotations. Because trading hours for certain foreign securities end before the close of the NYSE, closing market quotations may become unreliable. If between the time trading ends on a particular security and the close of the customary trading session on the NYSE, events occur that are significant and make the closing price unreliable, the Fund may fair value the security. If the event is likely to have affected the closing price of the security, the security will be valued at fair value in good faith using procedures approved by the Board of Trustees. Adjustments to closing prices to reflect fair value may also be based on a screening process of an independent pricing service to indicate the degree of certainty, based on historical data, that the closing price in the principal market where a foreign security trade is not the current value as of the close of the NYSE. Foreign securities meeting the approved degree of certainty that the price is not reflective of current value will be priced at the indication of fair value from the independent pricing service. Multiple factors may be considered by the independent pricing service in determining adjustments to reflect fair value and may include information relating to sector indices, American Depositary Receipts and domestic and foreign index futures. Foreign securities may have additional risks including exchange rate changes, potential for sharply devalued currencies and high inflation, political and economical upheaval, the relative lack of issuer information, relatively low market liquidity and the potential lack of strict financial and accounting controls and standards. |
| | Securities for which market prices are not provided by any of the above methods may be valued based upon quotes furnished by independent sources. The last bid price may be used to value equity securities. The mean between the last bid and asked prices is used to value debt obligations, including Corporate Loans. |
| | Securities for which market quotations are not readily available or are unreliable are valued at fair value as determined in good faith by or under the supervision of the Trust’s officers following procedures approved by the Board of Trustees. Issuer specific events, market trends, bid/ask quotes of brokers and information providers and other market data may be reviewed in the course of making a good faith determination of a security’s fair value. |
| | Valuations change in response to many factors including the historical and prospective earnings of the issuer, the value of the issuer’s assets, general economic conditions, interest rates, investor perceptions and market liquidity. Because of the inherent uncertainties of valuation, the values reflected in the financial statements may materially differ from the value received upon actual sale of those investments. |
| B. | | Securities Transactions and Investment Income — Securities transactions are accounted for on a trade date basis. Realized gains or losses on sales are computed on the basis of specific identification of the securities sold. Interest income is recorded on the accrual basis from settlement date. Dividend income (net of withholding tax, if any) is recorded on the ex-dividend date. |
| | The Fund may periodically participate in litigation related to Fund investments. As such, the Fund may receive proceeds from litigation settlements. Any proceeds received are included in the Statement of Operations as realized gain (loss) for investments no longer held and as unrealized gain (loss) for investments still held. |
| | Brokerage commissions and mark ups are considered transaction costs and are recorded as an increase to the cost basis of securities purchased and/or a reduction of proceeds on a sale of securities. Such transaction costs are included in the determination of net realized and unrealized gain (loss) from investment securities reported in the Statement of Operations and the Statement of Changes in Net Assets and the net realized and unrealized gains (losses) on securities per share in the Financial Highlights. Transaction costs are included in the calculation of the Fund’s net asset value and, accordingly, they reduce the Fund’s total returns. These transaction costs are not considered operating expenses and are not reflected in net investment income reported in the Statement of Operations and Statement of Changes in Net Assets, or the net investment income per share and ratios of expenses and net investment income reported in the Financial Highlights, nor are they limited by any expense limitation arrangements between the Fund and the investment adviser. |
| | The Fund allocates income and realized and unrealized capital gains and losses to a class based on the relative net assets of each class. |
| C. | | Country Determination — For the purposes of making investment selection decisions and presentation in the Schedule of Investments, the investment adviser may determine the country in which an issuer is located and/or credit risk exposure based on various factors. These factors include the laws of the country under which the issuer is organized, where the issuer maintains a principal office, the country in which the issuer derives 50% or more of its total revenues and the country that has the primary market for the issuer’s securities, as well as other criteria. Among the other criteria that may be evaluated for making this determination are the country in which the issuer maintains 50% or more of its assets, the type of security, financial guarantees |
17 Invesco Van Kampen Utility Fund
| | |
| | and enhancements, the nature of the collateral and the sponsor organization. Country of issuer and/or credit risk exposure has been determined to be the United States of America, unless otherwise noted. |
| D. | | Distributions — Distributions from income are paid quarterly and net realized capital gain, if any, are generally paid annually and recorded on ex-dividend date. The Fund may elect to treat a portion of the proceeds from redemptions as distributions for federal income tax purposes. |
| E. | | Federal Income Taxes — The Fund intends to comply with the requirements of Subchapter M of the Internal Revenue Code necessary to qualify as a regulated investment company and to distribute substantially all of the Fund’s taxable earnings to shareholders. As such, the Fund will not be subject to federal income taxes on otherwise taxable income (including net realized capital gain) that is distributed to shareholders. Therefore, no provision for federal income taxes is recorded in the financial statements. |
| | The Fund files tax returns in the U.S. Federal jurisdiction and certain other jurisdictions. Generally the Fund is subject to examinations by such taxing authorities for up to three years after the filing of the return for the tax period. |
| F. | | Securities Lending — The Fund may lend portfolio securities having a market value up to one-third of the Fund’s total assets. Such loans are secured by collateral equal to no less than the market value of the loaned securities determined daily by the securities lending provider. Such collateral will be cash or debt securities issued or guaranteed by the U.S. Government or any of its sponsored agencies. Cash collateral received in connection with these loans is invested in short-term money market instruments or affiliated money market funds and is shown as such on the Schedule of Investments. It is the Fund’s policy to obtain additional collateral from or return excess collateral to the borrower by the end of the next business day, following the valuation date of the securities loaned. Therefore, the value of the collateral held may be temporarily less than the value of the securities on loan. Lending securities entails a risk of loss to the Fund if and to the extent that the market value of the securities loaned were to increase and the borrower did not increase the collateral accordingly, and the borrower fails to return the securities. Upon the failure of the borrower to return the securities, collateral may be liquidated and the securities may be purchased on the open market to replace the loaned securities. The Fund could experience delays and costs in gaining access to the collateral. The Fund bears the risk of any deficiency in the amount of the collateral available for return to the borrower due to any loss on the collateral invested. Dividends received on cash collateral investments for securities lending transactions, which are net of compensation to counterparties, is included in Dividends from affiliates on the Statement of Operations. The aggregate value of securities out on loan is shown as a footnote on the Statement of Assets and Liabilities, if any. |
| G. | | Expenses — Fees provided for under the Rule 12b-1 plan of a particular class of the Fund and which are directly attributable to that class are charged to the operations of such class. All other expenses are allocated among the classes based on relative net assets. Prior to the Reorganization, incremental transfer agency fees which are unique to each class of shares of the Acquired Fund were charged to the operations of such class. |
| H. | | Accounting Estimates — The preparation of financial statements in conformity with accounting principles generally accepted in the United States of America (“GAAP”) requires management to make estimates and assumptions that affect the reported amounts of assets and liabilities at the date of the financial statements and the reported amounts of revenues and expenses during the reporting period including estimates and assumptions related to taxation. Actual results could differ from those estimates by a significant amount. In addition, the Fund monitors for material events or transactions that may occur or become known after the period-end date and before the date the financial statements are released to print. |
| I. | | Indemnifications — Under the Trust’s organizational documents, each Trustee, officer, employee or other agent of the Trust is indemnified against certain liabilities that may arise out of performance of their duties to the Fund. Additionally, in the normal course of business, the Fund enters into contracts, including the Fund’s servicing agreements that contain a variety of indemnification clauses. The Fund’s maximum exposure under these arrangements is unknown as this would involve future claims that may be made against the Fund that have not yet occurred. The risk of material loss as a result of such indemnification claims is considered remote. |
| J. | | Foreign Currency Translations — Foreign currency is valued at the close of the NYSE based on quotations posted by banks and major currency dealers. Portfolio securities and other assets and liabilities denominated in foreign currencies are translated into U.S. dollar amounts at date of valuation. Purchases and sales of portfolio securities (net of foreign taxes withheld on disposition) and income items denominated in foreign currencies are translated into U.S. dollar amounts on the respective dates of such transactions. The Fund does not separately account for the portion of the results of operations resulting from changes in foreign exchange rates on investments and the fluctuations arising from changes in market prices of securities held. The combined results of changes in foreign exchange rates and the fluctuation of market prices on investments (net of estimated foreign tax withholding) are included with the net realized and unrealized gain or loss from investments in the Statement of Operations. Reported net realized foreign currency gains or losses arise from (i) sales of foreign currencies, (ii) currency gains or losses realized between the trade and settlement dates on securities transactions, and (iii) the difference between the amounts of dividends, interest, and foreign withholding taxes recorded on the Fund’s books and the U.S. dollar equivalent of the amounts actually received or paid. Net unrealized foreign currency gains and losses arise from changes in the fair values of assets and liabilities, other than investments in securities at fiscal period end, resulting from changes in exchange rates. |
| | The Fund may invest in foreign securities which may be subject to foreign taxes on income, gains on investments or currency repatriation, a portion of which may be recoverable. |
| K. | | Foreign Currency Contracts — The Fund may enter into foreign currency contracts to manage or minimize currency or exchange rate risk. The Fund may also enter into foreign currency contracts for the purchase or sale of a security denominated in a foreign currency in order to “lock in” the U.S. dollar price of that security. A foreign currency contract is an obligation to purchase or sell a specific currency for an agreed-upon price at a future date. The use of foreign currency contracts does not eliminate fluctuations in the price of the underlying securities the Fund owns or intends to acquire but establishes a rate of exchange in advance. Fluctuations in the value of these contracts are measured by the difference in the contract date and reporting date exchange rates and are recorded as unrealized appreciation (depreciation) until the contracts are closed. When the contracts are closed, realized gains (losses) are recorded. Realized and unrealized gains (losses) on the contracts are included in the Statement of Operations. The primary risks associated with foreign currency contracts include failure of the counterparty to meet the terms of the contract and the value of the foreign currency changing unfavorably. These risks may be in excess of the amounts reflected in the Statement of Assets and Liabilities. |
18 Invesco Van Kampen Utility Fund
| | |
| L. | | Other Risks — The Fund’s investments are concentrated in a comparatively narrow segment of the economy. Consequently, the Fund may tend to be more volatile than other mutual funds, and the value of the Fund’s investments may tend to rise and fall more rapidly. |
| | The Fund may invest a large percentage of assets in securities of a limited number of companies, such that each investment may have a greater effect on the Fund’s overall performance, and any change in the value of those securities could significantly affect the value of your investment in the Fund. |
| | Government regulation, difficulties in obtaining adequate financing and investment return, environmental issues, prices of fuel for generation of electricity, availability of natural gas, risks associated with power marketing and trading, and risks associated with nuclear power facilities may adversely affect the market value of the Fund’s holdings. |
NOTE 2—Advisory Fees and Other Fees Paid to Affiliates
The Trust has entered into a master investment advisory agreement with Invesco Advisers, Inc. (the “Adviser” or “Invesco”). Under the terms of the investment advisory agreement, the Fund pays an advisory fee to the Adviser based on the annual rate of the Fund’s average daily net assets as follows:
| | | | | |
| Average Net Assets | | Rate |
| |
| First $500 million | | | 0 | .65% |
| |
| Next $500 million | | | 0 | .60% |
| |
| Over $1 billion | | | 0 | .55% |
| |
Prior to the Reorganization, the Acquired Fund paid an advisory fee of $127,254 to Van Kampen Asset Management (“Van Kampen”) based on the annual rates above of the Acquired Fund’s average daily net assets.
Under the terms of a master sub-advisory agreement between the Adviser and each of Invesco Asset Management Deutschland GmbH, Invesco Asset Management Limited, Invesco Asset Management (Japan) Limited, Invesco Australia Limited, Invesco Hong Kong Limited, Invesco Senior Secured Management, Inc. and Invesco Trimark Ltd. (collectively, the “Affiliated Sub-Advisers”) the Adviser, not the Fund, may pay 40% of the fees paid to the Adviser to any such Affiliated Sub-Adviser(s) that provides discretionary investment management services to the Fund based on the percentage of assets allocated to such Sub-Adviser(s). Prior to the Reorganization, Morgan Stanley Investment Management Limited served as sub-adviser to the Acquired Fund.
The Adviser has contractually agreed, through at least June 30, 2012, to waive advisory fees and/or reimburse expenses of all shares to the extent necessary to limit total annual fund operating expenses after fee waiver and /or expense reimbursements (excluding certain items discussed below) of Class A, Class B, Class C, and Class Y shares to 1.32%, 2.07%, 2.07%, and 1.07%, respectively, of average daily net assets. In determining the Adviser’s obligation to waive advisory fees and/or reimburse expenses, the following expenses are not taken into account, and could cause the total annual fund operating expenses after fee waiver and/or expense reimbursements to exceed the numbers reflected above: (1) interest; (2) taxes; (3) dividend expense on short sales; (4) extraordinary or non-routine items; and (5) expenses that the Fund has incurred but did not actually pay because of an expense offset arrangement. Unless the Board of Trustees and Invesco mutually agree to amend or continue the fee waiver agreement, it will terminate on June 30, 2012. For the year ended March 31, 2011, the Advisor waived advisory fees of $115,832 under this expense limitation.
Further, the Adviser has contractually agreed, through at least June 30, 2011, to waive the advisory fee payable by the Fund in an amount equal to 100% of the net advisory fees the Adviser receives from the affiliated money market funds on investments by the Fund of uninvested cash in such affiliated money market funds. For the period ended March 31, 2011, the Adviser waived advisory fees of $6,487.
The Trust has entered into a master administrative services agreement with Invesco pursuant to which the Fund has agreed to pay Invesco for certain administrative costs incurred in providing accounting services to the Fund. Prior to the Reorganization, under separate accounting services and chief compliance officer (“CCO”) employment agreements, Van Kampen Investments Inc. (“VKII”) provided accounting services and the CCO provided compliance services to the Acquired Fund. Pursuant to such agreements, the Acquired Fund paid $4,636 to VKII. For the year ended March 31, 2011, expenses incurred under these agreements are shown in the Statement of Operations as administrative services fees. Also, Invesco has entered into service agreements whereby State Street Bank and Trust Company (“SSB”) serves as the custodian and fund accountant and provides certain administrative services to the Fund.
Prior to the Reorganization, under a legal services agreement, VKII provided legal services to the Acquired Fund. Pursuant to such agreement, the Acquired Fund paid $4,323 to VKII.
The Trust has entered into a transfer agency and service agreement with Invesco Investment Services, Inc. (“IIS”) pursuant to which the Fund has agreed to pay IIS a fee for providing transfer agency and shareholder services to the Fund and reimburse IIS for certain expenses incurred by IIS in the course of providing such services. IIS may make payments to intermediaries that provide omnibus account services, sub-accounting services and/or networking services. All fees payable by IIS to intermediaries that provide omnibus account services or sub-accounting are charged back to the Fund, subject to certain limitations approved by the Trust’s Board of Trustees. Pursuant to such agreement, for the period ended March 31, 2011, IIS was paid $247,211 for providing such services. Prior to the Reorganization, the Acquired Fund paid $28,192 to Van Kampen Investor Services Inc., which served as the Acquired Fund’s transfer agent. For the year ended March 31, 2011, expenses incurred under these agreements are shown in the Statement of Operations as transfer agent fees.
Shares of the Fund are distributed by Invesco Distributors, Inc. (“IDI”). The Fund has adopted a distribution plan pursuant to Rule 12b-1 under the 1940 Act, and a service plan (collectively, the “Plans”) for Class A shares, Class B shares and Class C shares to compensate IDI for the sale, distribution, shareholder servicing and maintenance of shareholder accounts for these shares. Under the Plans, the Fund will incur annual fees of up to 0.25% of Class A average daily net assets and up to 1.00% each of Class B and Class C average daily net assets.
With respect to Class B and Class C shares, the Fund is authorized to reimburse in future years any distribution related expenses that exceed the maximum annual reimbursement rate for such class, so long as such reimbursement does not cause the Fund to exceed the Class B and Class C maximum annual reimbursement rate, respectively. With respect to Class A shares, distribution related expenses that exceed the maximum annual reimbursement rate for such class are not carried forward to future years and the Fund will not reimburse IDI for any such expenses.
Prior to the Reorganization, the Acquired Fund had entered into master distribution agreements with Van Kampen Funds Inc. (“VKFI”) to serve as the distributor for the Class A, Class B and Class C shares. Pursuant to such agreements, the Acquired Fund paid $73,949 to VKFI.
19 Invesco Van Kampen Utility Fund
For the year ended March 31, 2011, expenses incurred under these agreements are shown in the Statement of Operations as distribution fees.
Front-end sales commissions and CDSC (collectively the “sales charges”) are not recorded as expenses of the Fund. Front-end sales commissions are deducted from proceeds from the sales of Fund shares prior to investment in Class A shares of the Fund. CDSC are deducted from redemption proceeds prior to remittance to the shareholder. For the period June 1, 2010 to March 31, 2011, IDI advised the Fund that IDI retained $8,970 in front-end sales commissions from the sale of Class A shares and $43, $16,692 and $642 from Class A, Class B and Class C shares, respectively, for CDSC imposed on redemptions by shareholders. Prior to the Reorganization, VKFI retained $2,970 in front-end sales commissions from the sale of Class A shares and $4,568, for CDSC imposed on redemptions by shareholders.
Certain officers and trustees of the Trust are officers and directors of Invesco, IIS and/or IDI.
NOTE 3—Additional Valuation Information
GAAP defines fair value as the price that would be received to sell an asset or paid to transfer a liability in an orderly transaction between market participants at the measurement date, under current market conditions. GAAP establishes a hierarchy that prioritizes the inputs to valuation methods giving the highest priority to readily available unadjusted quoted prices in an active market for identical assets (Level 1) and the lowest priority to significant unobservable inputs (Level 3) generally when market prices are not readily available or are unreliable. Based on the valuation inputs, the securities or other investments are tiered into one of three levels. Changes in valuation methods may result in transfers in or out of an investment’s assigned level:
| | |
| | Level 1 — | Prices are determined using quoted prices in an active market for identical assets. |
| | Level 2 — | Prices are determined using other significant observable inputs. Observable inputs are inputs that other market participants may use in pricing a security. These may include quoted prices for similar securities, interest rates, prepayment speeds, credit risk, yield curves, loss severities, default rates, discount rates, volatilities and others. |
| | Level 3 — | Prices are determined using significant unobservable inputs. In situations where quoted prices or observable inputs are unavailable (for example, when there is little or no market activity for an investment at the end of the period), unobservable inputs may be used. Unobservable inputs reflect the Fund’s own assumptions about the factors market participants would use in determining fair value of the securities or instruments and would be based on the best available information. |
The following is a summary of the tiered valuation input levels, as of March 31, 2011. The level assigned to the securities valuations may not be an indication of the risk or liquidity associated with investing in those securities. Because of the inherent uncertainties of valuation, the values reflected in the financial statements may materially differ from the value received upon actual sale of those investments.
During the year ended March 31, 2011, there were no significant transfers between investment levels.
| | | | | | | | | | | | | | | | | |
| | | Level 1 | | Level 2 | | Level 3 | | Total |
| |
| Equity Securities | | $ | 103,664,283 | | | $ | 5,292,136 | | | $ | — | | | $ | 108,956,419 | |
| |
NOTE 4—Trustees’ and Officers’ Fees and Benefits
“Trustees’ and Officers’ Fees and Benefits” include amounts accrued by the Fund to pay remuneration to certain Trustees and Officers of the Fund. Trustees have the option to defer compensation payable by the Fund, and “Trustees’ and Officers’ Fees and Benefits” also include amounts accrued by the Fund to fund such deferred compensation amounts. Those Trustees who defer compensation have the option to select various Invesco Funds in which their deferral accounts shall be deemed to be invested. Finally, certain current Trustees are eligible to participate in a retirement plan that provides for benefits to be paid upon retirement to Trustees over a period of time based on the number of years of service. The Fund may have certain former Trustees who also participate in a retirement plan and receive benefits under such plan. “Trustees’ and Officers’ Fees and Benefits” include amounts accrued by the Fund to fund such retirement benefits. Obligations under the deferred compensation and retirement plans represent unsecured claims against the general assets of the Fund.
For the period ended March 31, 2011, the Fund paid legal fees of $851 for services rendered by Kramer, Levin, Naftalis & Frankel LLP as counsel to the Independent Trustees. A member of that firm is a Trustee of the Trust. Prior to the Reorganization, the Acquired Fund recognized expense of $1,899 representing legal services provided by Skadden, Arps, Slate, Meagher & Flom LLP, of which a director of the Acquired Fund was a partner of such firm and he and his law firm provided legal services as legal counsel to the Acquired Fund.
NOTE 5—Cash Balances
The Fund is permitted to temporarily carry a negative or overdrawn balance in its account with SSB, the custodian bank. To compensate the custodian bank for such overdrafts, the overdrawn Fund may either (1) leave funds as a compensating balance in the account so the custodian bank can be compensated by earning the additional interest; or (2) compensate by paying the custodian bank at a rate agreed upon by the custodian bank and Invesco, not to exceed the contractually agreed upon rate.
20 Invesco Van Kampen Utility Fund
NOTE 6—Distributions to Shareholders and Tax Components of Net Assets
Tax Character of Distributions to Shareholders Paid During the Years Ended March 31, 2011 and 2010:
| | | | | | | | | |
| | | 2011 | | 2010 |
| |
| Ordinary income | | $ | 3,998,777 | | | $ | 4,033,922 | |
| |
| Long-term capital gain | | | -0- | | | | -0- | |
| |
| Total distributions | | $ | 3,998,777 | | | $ | 4,033,922 | |
| |
Tax Components of Net Assets at Period-End:
| | | | | |
| | | 2011 |
| |
| Undistributed ordinary income | | $ | 214,963 | |
| |
| Net unrealized appreciation — investments | | | 6,762,641 | |
| |
| Net unrealized appreciation — other investments | | | 259 | |
| |
| Temporary book/tax differences | | | (2,269 | ) |
| |
| Capital loss carryforward | | | (13,672,580 | ) |
| |
| Post-October capital loss deferral | | | (22,229 | ) |
| |
| Shares of beneficial interest | | | 115,803,844 | |
| |
| Total net assets | | $ | 109,084,629 | |
| |
The difference between book-basis and tax-basis unrealized appreciation (depreciation) is due to differences in the timing of recognition of gains and losses on investments for tax and book purposes. The Fund’s net unrealized appreciation (depreciation) difference is attributable primarily to wash sales.
The temporary book/tax differences are a result of timing differences between book and tax recognition of income and/or expenses. The Fund’s temporary book/tax differences are the result of the trustee deferral of compensation and retirement plan benefits.
Capital loss carryforward is calculated and reported as of a specific date. Results of transactions and other activity after that date may affect the amount of capital loss carryforward actually available for the Fund to utilize. The ability to utilize capital loss carryforward in the future may be limited under the Internal Revenue Code and related regulations based on the results of future transactions.
The Fund utilized $0 of capital loss carryforward in the current period to offset net realized capital gain for federal income tax purposes. The Fund has a capital loss carryforward as of March 31, 2011 which expires as follows:
| | | | | |
| | | Capital Loss
|
| Expiration | | Carryforward* |
| |
| March 31, 2017 | | $ | 2,855,517 | |
| |
| March 31, 2018 | | | 4,918,631 | |
| |
| March 31, 2019 | | | 5,898,432 | |
| |
| Total capital loss carryforward | | $ | 13,672,580 | |
| |
| |
| * | Capital loss carryforward as of the date listed above is reduced for limitations, if any, to the extent required by the Internal Revenue Code. |
NOTE 7—Investment Securities
The aggregate amount of investment securities (other than short-term securities, U.S. Treasury obligations and money market funds, if any) purchased and sold by the Fund during the year ended March 31, 2011 was $106,896,373 and $132,664,804, respectively. Cost of investments on a tax basis includes the adjustments for financial reporting purposes as of the most recently completed Federal income tax reporting period-end.
| | | | | |
| Unrealized Appreciation (Depreciation) of Investment Securities on a Tax Basis |
| |
| Aggregate unrealized appreciation of investment securities | | $ | 9,957,372 | |
| |
| Aggregate unrealized (depreciation) of investment securities | | | (3,194,731 | ) |
| |
| Net unrealized appreciation of investment securities | | $ | 6,762,641 | |
| |
| Cost of investments for tax purposes is $102,193,778. |
NOTE 8 — Reclassification of Permanent Differences
Primarily as a result of differing book/tax treatment of foreign currency transactions, on March 31, 2011, undistributed net investment income (loss) was increased by $341,937, undistributed net realized gain (loss) was decreased by $341,935 and shares of beneficial interest decreased by $2. This reclassification had no effect on the net assets of the Fund.
21 Invesco Van Kampen Utility Fund
NOTE 9—Share Information
| | | | | | | | | | | | | | | | | |
| | | For the years ended March 31, |
| | | 2011(a) | | 2010 |
| | | Shares | | Amount | | Shares | | Amount |
| |
| Sales: | | | | | | | | | | | | | | | | |
| Class A | | | 420,839 | (b) | | $ | 7,234,176 | (b) | | | 598,187 | | | $ | 9,814,477 | |
| |
| Class B | | | 51,789 | | | | 882,074 | | | | 86,756 | | | | 1,414,720 | |
| |
| Class C | | | 70,975 | | | | 1,206,718 | | | | 49,672 | | | | 820,132 | |
| |
| Class Y | | | 13,130 | | | | 226,962 | | | | 55,032 | | | | 962,659 | |
| |
| Total sales | | | 556,733 | | | $ | 9,549,930 | | | | 789,647 | | | $ | 13,011,988 | |
| |
| Dividend reinvestment: | | | | | | | | | | | | | | | | |
| Class A | | | 187,389 | | | $ | 3,149,906 | | | | 187,142 | | | $ | 3,131,732 | |
| |
| Class B | | | 16,938 | | | | 282,709 | | | | 21,638 | | | | 360,459 | |
| |
| Class C | | | 12,528 | | | | 209,663 | | | | 12,432 | | | | 207,385 | |
| |
| Class Y | | | 344 | | | | 5,836 | | | | 137 | | | | 2,300 | |
| |
| Total dividend reinvestment | | | 217,199 | | | $ | 3,648,114 | | | | 221,349 | | | $ | 3,701,876 | |
| |
| Repurchases: | | | | | | | | | | | | | | | | |
| Class A | | | (1,329,661 | ) | | $ | (22,810,482 | ) | | | (1,408,644 | ) | | $ | (23,156,466 | ) |
| |
| Class B | | | (307,687 | )(b) | | | (5,241,101 | )(b) | | | (528,192 | ) | | | (8,566,019 | ) |
| |
| Class C | | | (142,048 | ) | | | (2,435,355 | ) | | | (190,192 | ) | | | (3,116,400 | ) |
| |
| Class Y | | | (44,438 | ) | | | (725,297 | ) | | | (8,765 | ) | | | (147,844 | ) |
| |
| Total repurchases | | | (1,823,834 | ) | | $ | (31,212,235 | ) | | | (2,135,793 | ) | | $ | (34,986,729 | ) |
| |
| | |
| (a) | | There are entities that are record owners of more than 5% of the outstanding shares of the Fund and in the aggregate own 31% of the outstanding shares of the Fund. IDI has an agreement with these entities to sell Fund shares. The Fund, Invesco and/or Invesco affiliates may make payments to these entities, which are considered to be related to the Fund, for providing services to the Fund, Invesco and/or Invesco affiliates including but not limited to services such as securities brokerage, distribution, third party record keeping and account servicing. The Trust has no knowledge as to whether all or any portion of the shares owned of record by these entities are also owned beneficially. |
| (b) | | Includes automatic conversion of 106,685 Class B shares into 106,071 Class A shares at a value of $1,836,513. |
NOTE 10—Change in Independent Registered Public Accounting Firm (unaudited)
In connection with the Reorganization of the Fund, the Audit Committee of the Board of Trustees of the Trust appointed, and the Board of Trustees ratified and approved, PricewaterhouseCoopers LLP (“PWC”) as the independent registered public accounting firm of the Fund for the fiscal year following May 31, 2010. The predecessor fund’s financial statements were audited by a different independent registered public accounting firm (the “Prior Auditor”). Concurrent with the closing of the Reorganization, the Prior Auditor resigned as the independent registered public accounting firm of the predecessor fund. The Prior Auditor’s report on the financial statements of the Fund for the past two years did not contain an adverse opinion or a disclaimer of opinion, and was not qualified or modified as to uncertainty, audit scope or accounting principles. During the period the Prior Auditor was engaged, there were no disagreements with the Prior Auditor on any matter of accounting principles or practices, financial statement disclosure, or auditing scope or procedure which, if not resolved to the Prior Auditor’s satisfaction, would have caused it to make reference to that matter in connection with its report.
NOTE 11—Subsequent Event
The Board of Trustees unanimously approved an Agreement and Plan of Reorganization (the “Agreement”) pursuant to which the Fund would transfer all of its assets and liabilities to Invesco Utilities Fund (the “Acquiring Fund”).
The Fund’s shareholders approved the Agreement on April 14, 2011 and the reorganization was consummated on May 23, 2011. Upon closing of the reorganization, shareholders of the Fund received a corresponding class of shares of the Acquiring Fund in exchange for their shares of the Fund and the Fund liquidated and ceased operations.
22 Invesco Van Kampen Utility Fund
Report of Independent Registered Public Accounting Firm
To the Board of Trustees of AIM Sector Funds (Invesco Sector Funds)
and Shareholders of Invesco Van Kampen Utility Fund:
In our opinion, the accompanying statement of assets and liabilities, including the schedule of investments, and the related statements of operations and of changes in net assets and the financial highlights present fairly, in all material respects, the financial position of Invesco Van Kampen Utility Fund (formerly known as Van Kampen Utility Fund; one of the funds constituting AIM Sector Funds (Invesco Sector Funds), hereafter referred to as the “Fund”) at March 31, 2011, the results of its operations, the changes in its net assets and the financial highlights for the year then ended, in conformity with accounting principles generally accepted in the United States of America. These financial statements and financial highlights (hereafter referred to as “financial statements”) are the responsibility of the Fund’s management; our responsibility is to express an opinion on these financial statements based on our audit. We conducted our audit of these financial statements in accordance with the standards of the Public Company Accounting Oversight Board (United States). Those standards require that we plan and perform the audit to obtain reasonable assurance about whether the financial statements are free of material misstatement. An audit includes examining, on a test basis, evidence supporting the amounts and disclosures in the financial statements, assessing the accounting principles used and significant estimates made by management, and evaluating the overall financial statement presentation. We believe that our audit, which included confirmation of securities at March 31, 2011 by correspondence with the custodian and brokers, provides a reasonable basis for our opinion. The statement of changes in net assets and the financial highlights of the Fund for the periods ended March 31, 2010 and prior were audited by other independent auditors whose report dated May 18, 2010 expressed an unqualified opinion on those financial statements.
PRICEWATERHOUSECOOPERS LLP
May 19, 2011
Houston, Texas
23 Invesco Van Kampen Utility Fund
Calculating your ongoing Fund expenses
Example
As a shareholder of the Fund, you incur two types of costs: (1) transaction costs, which may include sales charges (loads) on purchase payments or contingent deferred sales charges on redemptions, and redemption fees, if any; and (2) ongoing costs, including management fees; distribution and/or service (12b-1) fees; and other Fund expenses. This example is intended to help you understand your ongoing costs (in dollars) of investing in the Fund and to compare these costs with ongoing costs of investing in other mutual funds. The example is based on an investment of $1,000 invested at the beginning of the period and held for the entire period October 1, 2010 through March 31, 2011.
Actual expenses
The table below provides information about actual account values and actual expenses. You may use the information in this table, together with the amount you invested, to estimate the expenses that you paid over the period. Simply divide your account value by $1,000 (for example, an $8,600 account value divided by $1,000 = 8.6), then multiply the result by the number in the table under the heading entitled “Actual Expenses Paid During Period” to estimate the expenses you paid on your account during this period.
Hypothetical example for comparison purposes
The table below also provides information about hypothetical account values and hypothetical expenses based on the Fund’s actual expense ratio and an assumed rate of return of 5% per year before expenses, which is not the Fund’s actual return.
The hypothetical account values and expenses may not be used to estimate the actual ending account balance or expenses you paid for the period. You may use this information to compare the ongoing costs of investing in the Fund and other funds. To do so, compare this 5% hypothetical example with the 5% hypothetical examples that appear in the shareholder reports of the other funds.
Please note that the expenses shown in the table are meant to highlight your ongoing costs only and do not reflect any transaction costs, such as sales charges (loads) on purchase payments, contingent deferred sales charges on redemptions, and redemption fees, if any. Therefore, the hypothetical information is useful in comparing ongoing costs only, and will not help you determine the relative total costs of owning different funds. In addition, if these transaction costs were included, your costs would have been higher.
| | | | | | | | | | | | | | | | | | | | | | | | | | | | | | | |
| | | | | | | | | | HYPOTHETICAL
| | | |
| | | | | | | | | | (5% annual return before
| | | |
| | | | | | | ACTUAL | | | expenses) | | | |
| | | | Beginning
| | | Ending
| | | Expenses
| | | Ending
| | | Expenses
| | | Annualized
|
| | | | Account Value
| | | Account Value
| | | Paid During
| | | Account Value
| | | Paid During
| | | Expense
|
| Class | | | (10/01/10) | | | (03/31/11)1 | | | Period2 | | | (03/31/11) | | | Period2 | | | Ratio |
| A | | | $ | 1,000.00 | | | | $ | 1,051.51 | | | | $ | 6.75 | | | | $ | 1,018.35 | | | | $ | 6.64 | | | | | 1.32 | % |
| | | | | | | | | | | | | | | | | | | | | | | | | | | | | | | |
| B | | | | 1,000.00 | | | | | 1,047.64 | | | | | 10.57 | | | | | 1,014.61 | | | | | 10.40 | | | | | 2.07 | |
| | | | | | | | | | | | | | | | | | | | | | | | | | | | | | | |
| C | | | | 1,000.00 | | | | | 1,047.67 | | | | | 10.57 | | | | | 1,014.61 | | | | | 10.40 | | | | | 2.07 | |
| | | | | | | | | | | | | | | | | | | | | | | | | | | | | | | |
| Y | | | | 1,000.00 | | | | | 1,052.89 | | | | | 5.48 | | | | | 1,019.60 | | | | | 5.39 | | | | | 1.07 | |
| | | | | | | | | | | | | | | | | | | | | | | | | | | | | | | |
| |
| 1 | The actual ending account value is based on the actual total return of the Fund for the period October 1, 2010 through March 31, 2011, after actual expenses and will differ from the hypothetical ending account value which is based on the Fund’s expense ratio and a hypothetical annual return of 5% before expenses. |
| 2 | Expenses are equal to the Fund’s annualized expense ratio as indicated above multiplied by the average account value over the period, multiplied by 182/365 to reflect the most recent fiscal half year. |
24 Invesco Van Kampen Utility Fund
Tax Information
Form 1099-DIV, Form 1042-S and other year-end tax information provide shareholders with actual calendar year amounts that should be included in their tax returns. Shareholders should consult their tax advisors.
The following distribution information is being provided as required by the Internal Revenue Code or to meet a specific state’s requirement.
The Fund designates the following amounts or, if subsequently determined to be different, the maximum amount allowable for its fiscal year ended March 31, 2011:
| | | | | |
Federal and State Income Tax | | |
| |
| Qualified Dividend Income* | | | 100% | |
| Corporate Dividends Received Deduction* | | | 100% | |
| | |
| | * | The above percentages are based on ordinary income dividends paid to shareholders during the Fund’s fiscal year. |
25 Invesco Van Kampen Utility Fund
Trustees and Officers
The address of each trustee and officer is AIM Sector Funds (Invesco Sector Funds) (the “Trust”), 11 Greenway Plaza, Suite 2500, Houston, Texas 77046-1173. The trustees serve for the life of the Trust, subject to their earlier death, incapacitation, resignation, retirement or removal as more specifically provided in the Trust’s organizational documents. Each officer serves for a one year term or until their successors are elected and qualified. Column two below includes length of time served with predecessor entities, if any.
| | | | | | | | | | | | | | | |
| | | | | | | | | | Number of | | | |
| | | | | | | | | | Funds In | | | |
| | | | | | | | | | Fund Complex | | | |
| | Name, Year of Birth and | | Trustee and | | Principal Occupation(s) | | Overseen by | | Other Directorship(s) | |
| | Position(s) Held with the Trust | | /or Officer Since | | During Past 5 Years | | Trustee | | Held by Trustee | |
| | | | | | | |
| | Martin L. Flanagan1 — 1960
Trustee | | 2007 | | | | Executive Director, Chief Executive Officer and President, Invesco Ltd. (ultimate parent of Invesco and a global investment management firm); Advisor to the Board, Invesco Advisers, Inc. (formerly known as Invesco Institutional (N.A.), Inc.); Trustee, The Invesco Funds; Vice Chair, Investment Company Institute; and Member of Executive Board, SMU Cox School of Business | | 194 | | | | None | |
| | | | | | | | | | | | | | | |
| | | | | | | | Formerly: Chairman, Invesco Advisers, Inc. (registered investment adviser); Director, Chairman, Chief Executive Officer and President, IVZ Inc. (holding company), INVESCO Group Services, Inc. (service provider) and Invesco North American Holdings, Inc. (holding company); Director, Chief Executive Officer and President, Invesco Holding Company Limited (parent of Invesco and a global investment management firm); Director, Invesco Ltd.; Chairman, Investment Company Institute and President, Co-Chief Executive Officer, Co-President, Chief Operating Officer and Chief Financial Officer, Franklin Resources, Inc. (global investment management organization) | | | | | | | |
| | | | | | | |
| | Philip A. Taylor2 — 1954
Trustee, President and
Principal Executive Officer | | 2006 | | | | Head of North American Retail and Senior Managing Director, Invesco Ltd.; Director, Co-Chairman, Co-President and Co-Chief Executive Officer, Invesco Advisers, Inc. (formerly known as Invesco Institutional (N.A.), Inc.) (registered investment adviser); Director, Chief Executive Officer and President, 1371 Preferred Inc. (holding company); Director, Chairman, Chief Executive Officer and President, Invesco Management Group, Inc. (formerly Invesco Aim Management Group, Inc.) (financial services holding company); Director and President, INVESCO Funds Group, Inc. (registered investment adviser and registered transfer agent) and AIM GP Canada Inc. (general partner for limited partnerships); Director and Chairman, Invesco Investment Services, Inc. (formerly known as Invesco Aim Investment Services, Inc.) (registered transfer agent) and IVZ Distributors, Inc. (formerly known as INVESCO Distributors, Inc.) (registered broker dealer); Director, President and Chairman, Invesco Inc. (holding company) and Invesco Canada Holdings Inc. (holding company); Chief Executive Officer, Invesco Trimark Corporate Class Inc. (corporate mutual fund company) and Invesco Trimark Canada Fund Inc. (corporate mutual fund company); Director and Chief Executive Officer, Invesco Trimark Ltd./Invesco Trimark Ltèe (registered investment adviser and registered transfer agent) and Invesco Trimark Dealer Inc. (registered broker dealer); Trustee, President and Principal Executive Officer, The Invesco Funds (other than AIM Treasurer’s Series Trust (Invesco Treasurer’s Series Trust) and Short-Term Investments Trust); Trustee and Executive Vice President, The Invesco Funds (AIM Treasurer’s Series Trust (Invesco Treasurer’s Series Trust) and Short-Term Investments Trust only); and Director, Van Kampen Asset Management; Director, Chief Executive Officer and President, Van Kampen Investments Inc. and Van Kampen Exchange Corp.; Director and Chairman, Van Kampen Investor Services Inc. and Director and President, Van Kampen Advisors, Inc. | | 194 | | | | None | |
| | | | | | | | | | | | | | | |
| | | | | | | | Formerly: Director, Invesco Distributors, Inc. (formerly known as Invesco Aim Distributors, Inc.) (registered broker dealer); Manager, Invesco PowerShares Capital Management LLC; Director, Chief Executive Officer and President, Invesco Advisers, Inc.; Director, Chairman, Chief Executive Officer and President, Invesco Aim Capital Management, Inc.; President, Invesco Trimark Dealer Inc. and Invesco Trimark Ltd./Invesco Trimark Ltèe; Director and President, AIM Trimark Corporate Class Inc. and AIM Trimark Canada Fund Inc.; Senior Managing Director, Invesco Holding Company Limited; Trustee and Executive Vice President, Tax-Free Investments Trust; Director and Chairman, Fund Management Company (former registered broker dealer); President and Principal Executive Officer, The Invesco Funds (AIM Treasurer’s Series Trust (Invesco Treasurer’s Series Trust), Short-Term Investments Trust and Tax-Free Investments Trust only); President, AIM Trimark Global Fund Inc. and AIM Trimark Canada Fund Inc. | | | | | | | |
| | | | | | | |
| | Wayne M. Whalen3 — 1939
Trustee | | 2010 | | | | Of Counsel, and prior to 2010, partner in the law firm of Skadden, Arps, Slate, Meagher & Flom LLP, legal counsel to funds in the Fund Complex | | 212 | | | | Director of the Abraham Lincoln Presidential Library Foundation | |
| | | | | | | |
| | Independent Trustees | | | | | | | | | | | | | |
| | | | | | | |
| | Bruce L. Crockett — 1944
Trustee and Chair | | 2003 | | | | Chairman, Crockett Technology Associates (technology consulting company) Formerly: Director, Captaris (unified messaging provider); Director, President and Chief Executive Officer COMSAT Corporation; and Chairman, Board of Governors of INTELSAT (international communications company) | | 194 | | | | ACE Limited (insurance company); and Investment Company Institute | |
| | | | | | | |
| | David C. Arch — 1945
Trustee | | 2010 | | | | Chairman and Chief Executive Officer of Blistex Inc., a consumer health care products manufacturer. | | 212 | | | | Member of the Heartland Alliance Advisory Board, a nonprofit organization serving human needs based in Chicago. Board member of the Illinois Manufacturers’ Association. Member of the Board of Visitors, Institute for the Humanities, University of Michigan | |
| | | | | | | |
| | |
| 1 | | Mr. Flanagan is considered an interested person of the Trust because he is an officer of the adviser to the Trust, and an officer and a director of Invesco Ltd., ultimate parent of the adviser to the Trust. |
| |
| 2 | | Mr. Taylor is considered an interested person of the Trust because he is an officer and a director of the adviser to, and a director of the principal underwriter of, the Trust. |
| |
| 3 | | Mr. Whalen is considered an “interested person” (within the meaning of Section 2(a)(19) of the 1940 Act) of certain Funds in the Fund Complex by reason of he and his firm currently providing legal services as legal counsel to such Funds in the Fund Complex. |
T-1
Trustees and Officers — (continued)
| | | | | | | | | | | | | | | |
| | | | | | | | | | Number of | | | |
| | | | | | | | | | Funds In | | | |
| | | | | | | | | | Fund Complex | | | |
| | Name, Year of Birth and | | Trustee and | | Principal Occupation(s) | | Overseen by | | Other Directorship(s) | |
| | Position(s) Held with the Trust | | /or Officer Since | | During Past 5 Years | | Trustee | | Held by Trustee | |
| | | | | | | |
| | Independent Trustees | | | | | | | | | | | | | |
| | | | | | | |
| | Bob R. Baker — 1936
Trustee | | 1983 | | | | Retired
Formerly: President and Chief Executive Officer, AMC Cancer Research Center; and Chairman and Chief Executive Officer, First Columbia Financial Corporation | | 194 | | | | None | |
| | | | | | | |
| | Frank S. Bayley — 1939
Trustee | | 2003 | | | | Retired
Formerly: Director, Badgley Funds, Inc. (registered investment company) (2 portfolios) and Partner, law firm of Baker & McKenzie | | 194 | | | | Director and Chairman, C.D. Stimson Company (a real estate investment company) | |
| | | | | | | |
| | James T. Bunch — 1942
Trustee | | 2000 | | | | Founder, Green, Manning & Bunch Ltd. (investment banking firm)
Formerly: Executive Committee, United States Golf Association; and Director, Policy Studies, Inc. and Van Gilder Insurance Corporation | | 194 | | | | Vice Chairman, Board of Governors, Western Golf Association/Evans Scholars Foundation and Director, Denver Film Society | |
| | | | | | | |
| | Rodney Dammeyer — 1940
Trustee | | 2010 | | | | President of CAC, LLC, a private company offering capital investment and management advisory services.
Formerly: Prior to January 2004, Director of TeleTech Holdings Inc.; Prior to 2002, Director of Arris Group, Inc.; Prior to 2001, Managing Partner at Equity Group Corporate Investments. Prior to 1995, Vice Chairman of Anixter International. Prior to 1985, experience includes Senior Vice President and Chief Financial Officer of Household International, Inc, Executive Vice President and Chief Financial Officer of Northwest Industries, Inc. and Partner of Arthur Andersen & Co. | | 212 | | | | Director of Quidel Corporation and Stericycle, Inc. Prior to May 2008, Trustee of The Scripps Research Institute. Prior to February 2008, Director of Ventana Medical Systems, Inc. Prior to April 2007, Director of GATX Corporation. Prior to April 2004, Director of TheraSense, Inc. | |
| | | | | | | |
| | Albert R. Dowden — 1941
Trustee | | 2003 | | | | Director of a number of public and private business corporations, including the Boss Group, Ltd. (private investment and management); Reich & Tang Funds (5 portfolios) (registered investment company); and Homeowners of America Holding Corporation/ Homeowners of America Insurance Company (property casualty company) | | 194 | | | | Board of Nature’s Sunshine Products, Inc. | |
| | | | | | | | | | | | | | | |
| | | | | | | | Formerly: Director, Continental Energy Services, LLC (oil and gas pipeline service); Director, CompuDyne Corporation (provider of product and services to the public security market) and Director, Annuity and Life Re (Holdings), Ltd. (reinsurance company); Director, President and Chief Executive Officer, Volvo Group North America, Inc.; Senior Vice President, AB Volvo; Director of various public and private corporations; Chairman, DHJ Media, Inc.; Director Magellan Insurance Company; and Director, The Hertz Corporation, Genmar Corporation (boat manufacturer), National Media Corporation; Advisory Board of Rotary Power International (designer, manufacturer, and seller of rotary power engines); and Chairman, Cortland Trust, Inc. (registered investment company) | | | | | | | |
| | | | | | | |
| | Jack M. Fields — 1952
Trustee | | 2003 | | | | Chief Executive Officer, Twenty First Century Group, Inc. (government affairs company); and Owner and Chief Executive Officer, Dos Angelos Ranch, L.P. (cattle, hunting, corporate entertainment), Discovery Global Education Fund (non-profit) and Cross Timbers Quail Research Ranch (non-profit) | | 194 | | | | Administaff | |
| | | | | | | | | | | | | | | |
| | | | | | | | Formerly: Chief Executive Officer, Texana Timber LP (sustainable forestry company) and member of the U.S. House of Representatives | | | | | | | |
| | | | | | | |
| | Carl Frischling — 1937
Trustee | | 2003 | | | | Partner, law firm of Kramer Levin Naftalis and Frankel LLP | | 194 | | | | Director, Reich &
Tang Funds (6
portfolios) | |
| | | | | | | |
| | Prema Mathai-Davis — 1950
Trustee | | 2003 | | | | Retired
Formerly: Chief Executive Officer, YWCA of the U.S.A. | | 194 | | | | None | |
| | | | | | | |
| | Larry Soll — 1942
Trustee | | 1997 | | | | Retired
Formerly, Chairman, Chief Executive Officer and President, Synergen Corp. (a biotechnology company) | | 194 | | | | None | |
| | | | | | | |
| | Hugo F. Sonnenschein — 1940
Trustee | | 2010 | | | | President Emeritus and Honorary Trustee of the University of Chicago and the Adam Smith Distinguished Service Professor in the Department of Economics at the University of Chicago. Prior to July 2000, President of the University of Chicago. | | 212 | | | | Trustee of the University of Rochester and a member of its investment committee. Member of the National Academy of Sciences, the American Philosophical Society and a fellow of the American Academy of Arts and Sciences | |
| | | | | | | |
| | Raymond Stickel, Jr. — 1944
Trustee | | 2005 | | | | Retired
Formerly: Director, Mainstay VP Series Funds, Inc. (25 portfolios) and Partner, Deloitte & Touche | | 194 | | | | None | |
| | | | | | | |
T-2
Trustees and Officers — (continued)
| | | | | | | | | | | | | |
| | | | | | | | | | Number of | | | |
| | | | | | | | | | Funds In | | | |
| | | | | | | | | | Fund Complex | | | |
| | Name, Year of Birth and | | Trustee and | | Principal Occupation(s) | | Overseen by | | Other Directorship(s) | |
| | Position(s) Held with the Trust | | /or Officer Since | | During Past 5 Years | | Trustee | | Held by Trustee | |
| | | | | | | |
| | Other Officers | | | | | | | | | | | |
| | | | | | | |
| | Russell C. Burk — 1958
Senior Vice President and
Senior Officer | | 2005 | | | | Senior Vice President and Senior Officer of Invesco Funds | | N/A | | N/A | |
| | | | | | | |
| | John M. Zerr — 1962
Senior Vice President, Chief Legal Officer and Secretary | | 2006 | | | | Director, Senior Vice President, Secretary and General Counsel, Invesco Management Group, Inc. (formerly known as Invesco Aim Management Group, Inc.), Van Kampen Investments Inc. and Van Kampen Exchange Corp., Senior Vice President, Invesco Advisers, Inc. formerly known as Invesco Institutional (N.A.), Inc.) (registered investment adviser); Senior Vice President and Secretary, Invesco Distributors, Inc. (formerly known as Invesco Aim Distributors, Inc.); Director, Vice President and Secretary, Invesco Investment Services, Inc. (formerly known as Invesco Aim Investment Services, Inc.) and IVZ Distributors, Inc. (formerly known as INVESCO Distributors, Inc.); Director and Vice President, INVESCO Funds Group, Inc.; Senior Vice President, Chief Legal Officer and Secretary, The Invesco Funds; Manager, Invesco PowerShares Capital Management LLC; Director, Secretary and General Counsel, Van Kampen Asset Management; Director and Secretary, Van Kampen Advisors Inc.; Secretary and General Counsel, Van Kampen Funds Inc.; and Director, Vice President, Secretary and General Counsel, Van Kampen Investor Services Inc.; and Chief Legal Officer, PowerShares Exchange-Traded Fund Trust, PowerShares Exchange-Traded Fund Trust II, PowerShares India Exchange-Traded Fund Trust and PowerShares Actively Managed Exchange-Traded Fund Trust | | N/A | | N/A | |
| | | | | | | | | | | | | |
| | | | | | | | Formerly: Director, Invesco Distributors, Inc. (formerly known as Invesco Aim Distributors, Inc.); Director, Senior Vice President, General Counsel and Secretary, Invesco Advisers, Inc.; Director, Vice President and Secretary, Fund Management Company; Director, Senior Vice President, Secretary, General Counsel and Vice President, Invesco Aim Capital Management, Inc.; Chief Operating Officer and General Counsel, Liberty Ridge Capital, Inc. (an investment adviser); Vice President and Secretary, PBHG Funds (an investment company) and PBHG Insurance Series Fund (an investment company); Chief Operating Officer, General Counsel and Secretary, Old Mutual Investment Partners (a broker-dealer); General Counsel and Secretary, Old Mutual Fund Services (an administrator) and Old Mutual Shareholder Services (a shareholder servicing center); Executive Vice President, General Counsel and Secretary, Old Mutual Capital, Inc. (an investment adviser); and Vice President and Secretary, Old Mutual Advisors Funds (an investment company) | | | | | |
| | | | | | | |
| | Lisa O. Brinkley — 1959
Vice President | | 2004 | | | | Global Compliance Director, Invesco Ltd.; Chief Compliance Officer, Invesco Investment Services, Inc.(formerly known as Invesco Aim Investment Services, Inc.) and Van Kampen Investor Services Inc.; and Vice President, The Invesco Funds | | N/A | | N/A | |
| | | | | | | | | | | | | |
| | | | | | | | Formerly: Chief Compliance Officer, Invesco Distributors, Inc. (formerly known as Invesco Aim Distributors, Inc.), Senior Vice President, Invesco Management Group, Inc.; Senior Vice President and Chief Compliance Officer, Invesco Advisers, Inc. and The Invesco Funds; Vice President and Chief Compliance Officer, Invesco Aim Capital Management, Inc. and Invesco Distributors, Inc.; Vice President, Invesco Investment Services, Inc. and Fund Management Company | | | | | |
| | | | | | | |
| | Sheri Morris — 1964
Vice President, Treasurer and
Principal Financial Officer | | 2003 | | | | Vice President, Treasurer and Principal Financial Officer, The Invesco Funds; and Vice President, Invesco Advisers, Inc. (formerly known as Invesco Institutional (N.A.), Inc.) (registered investment adviser) | | N/A | | N/A | |
| | | | | | | | | | | | | |
| | | | | | | | Formerly: Vice President, Invesco Advisers, Inc., Invesco Aim Capital Management, Inc. and Invesco Aim Private Asset Management, Inc.; Assistant Vice President and Assistant Treasurer, The Invesco Funds and Assistant Vice President, Invesco Advisers, Inc., Invesco Aim Capital Management, Inc. and Invesco Aim Private Asset Management, Inc. | | | | | |
| | | | | | | |
| | Karen Dunn Kelley — 1960
Vice President | | 2003 | | | | Head of Invesco’s World Wide Fixed Income and Cash Management Group; Senior Vice President, Invesco Advisers, Inc. (formerly known as Invesco Institutional (N.A.), Inc.) (registered investment adviser) and Van Kampen Investments Inc.; Executive Vice President, Invesco Distributors, Inc. (formerly known as Invesco Aim Distributors, Inc.); Senior Vice President, Invesco Management Group, Inc. (formerly known as Invesco Aim Management Group, Inc.); and Director, Invesco Mortgage Capital Inc.; Vice President, The Invesco Funds (other than AIM Treasurer’s Series Trust (Invesco Treasurer’s Series Trust) and Short-Term Investments Trust); President and Principal Executive Officer, The Invesco Funds (AIM Treasurer’s Series Trust (Invesco Treasurer’s Series Trust) and Short-Term Investments Trust only). | | N/A | | N/A | |
| | | | | | | | | | | | | |
| | | | | | | | Formerly: Vice President, Invesco Advisers, Inc. (formerly known as Invesco Institutional (N.A.), Inc.); Director of Cash Management and Senior Vice President, Invesco Advisers, Inc. and Invesco Aim Capital Management, Inc.; President and Principal Executive Officer, Tax-Free Investments Trust; Director and President, Fund Management Company; Chief Cash Management Officer, Director of Cash Management, Senior Vice President, and Managing Director, Invesco Aim Capital Management, Inc.; Director of Cash Management, Senior Vice President, and Vice President, Invesco Advisers, Inc. and The Invesco Funds (AIM Treasurer’s Series Trust (Invesco Treasurer’s Series Trust), Short-Term Investments Trust and Tax-Free Investments Trust only) | | | | | |
| | | | | | | |
| | Lance A. Rejsek — 1967
Anti-Money Laundering Compliance Officer | | 2005 | | | | Anti-Money Laundering Compliance Officer, Invesco Advisers, Inc. (formerly known as Invesco Institutional (N.A.), Inc.) (registered investment adviser); Invesco Distributors, Inc. (formerly known as Invesco Aim Distributors, Inc.), Invesco Investment Services, Inc. (formerly known as Invesco Aim Investment Services, Inc.), The Invesco Funds, PowerShares Exchange-Traded Fund Trust, PowerShares Exchange-Traded Fund Trust II, PowerShares India Exchange-Traded Fund Trust, PowerShares Actively Managed Exchange-Traded Fund Trust, Van Kampen Asset Management, Van Kampen Investor Services Inc., and Van Kampen Funds Inc. | | N/A | | N/A | |
| | | | | | | | | | | | | |
| | | | | | | | Formerly: Anti-Money Laundering Compliance Officer, Fund Management Company, Invesco Advisers, Inc., Invesco Aim Capital Management, Inc. and Invesco Aim Private Asset Management, Inc. | | | | | |
| | | | | | | |
T-3
Trustees and Officers — (continued)
| | | | | | | | | | | | | |
| | | | | | | | | | Number of | | | |
| | | | | | | | | | Funds In | | | |
| | | | | | | | | | Fund Complex | | | |
| | Name, Year of Birth and | | Trustee and | | Principal Occupation(s) | | Overseen by | | Other Directorship(s) | |
| | Position(s) Held with the Trust | | /or Officer Since | | During Past 5 Years | | Trustee | | Held by Trustee | |
| | | | | | | |
| | Other Officers | | | | | | | | | | | |
| | | | | | | |
| | Todd L. Spillane — 1958
Chief Compliance Officer | | 2006 | | | | Senior Vice President, Invesco Management Group, Inc. (formerly known as Invesco Aim Management Group, Inc.), Van Kampen Investments Inc. and Van Kampen Exchange Corp.; Senior Vice President and Chief Compliance Officer, Invesco Advisers, Inc. (registered investment adviser) (formerly known as Invesco Institutional (N.A.), Inc.); Chief Compliance Officer, The Invesco Funds, PowerShares Exchange-Traded Fund Trust, PowerShares Exchange- Traded Fund Trust II, PowerShares India Exchange-Traded Fund Trust, PowerShares Actively Managed Exchange- Traded Fund Trust, INVESCO Private Capital Investments, Inc. (holding company), and Invesco Private Capital, Inc. (registered investment adviser); Vice President, Invesco Distributors, Inc. (formerly known as Invesco Aim Distributors, Inc.), Invesco Investment Services, Inc. (formerly known as Invesco Aim Investment Services, Inc.) and Van Kampen Investor Services Inc. | | N/A | | N/A | |
| | | | | | | | | | | | | |
| | | | | | | | Formerly: Senior Vice President and Chief Compliance Officer, Invesco Advisers, Inc. and Invesco Aim Capital Management, Inc.; Chief Compliance Officer, Invesco Global Asset Management (N.A.), Inc. and Invesco Senior Secured Management, Inc. (registered investment adviser); Vice President, Invesco Aim Capital Management, Inc. and Fund Management Company | | | | | |
| | | | | | | |
The Statement of Additional Information of the Trust includes additional information about the Fund’s Trustees and is available upon request, without charge, by calling 1.800.959.4246. Please refer to the Fund’s prospectus for information on the Fund’s sub-advisers.
| | | | | | | |
|
Office of the Fund | | Investment Adviser | | Distributor | | Auditors |
| 11 Greenway Plaza, Suite 2500 | | Invesco Advisers, Inc. | | Invesco Distributors, Inc. | | PricewaterhouseCoopers LLP |
| Houston, TX 77046-1173 | | 1555 Peachtree Street, N.E. | | 11 Greenway Plaza, Suite 2500 | | 1201 Louisiana Street, Suite 2900 |
| | | Atlanta, GA 30309 | | Houston, TX 77046-1173 | | Houston, TX 77002-5678 |
| | | | | | | |
Counsel to the Fund | | Counsel to the Independent Trustees | | Transfer Agent | | Custodian |
| Stradley Ronon Stevens & Young, LLP | | Kramer, Levin, Naftalis & Frankel LLP | | Invesco Investment Services, Inc. | | State Street Bank and Trust Company |
| 2600 One Commerce Square | | 1177 Avenue of the Americas | | 11 Greenway Plaza, Suite 2500 | | 225 Franklin |
| Philadelphia, PA 19103 | | New York, NY 10036-2714 | | Houston, TX 77046-1173 | | Boston, MA 02110-2801 |
T-4
Invesco mailing information
Send general correspondence to Invesco Investment Services, Inc., P.O. Box 219078, Kansas City, MO 64121-9078.
Invesco privacy policy
You share personal and financial information with us that is necessary for your transactions and your account records. We take very seriously the obligation to keep that information confidential and private.
Invesco collects nonpublic personal information about you from account applications or other forms you complete and from your transactions with us or our affiliates. We do not disclose information about you or our former customers to service providers or other third parties except to the extent necessary to service your account and in other limited circumstances as permitted by law. For example, we use this information to facilitate the delivery of transaction confirmations, financial reports, prospectuses and tax forms.
Even within Invesco, only people involved in the servicing of your accounts and compliance monitoring have access to your information. To ensure the highest level of confidentiality and security, Invesco maintains physical, electronic and procedural safeguards that meet or exceed federal standards. Special measures, such as data encryption and authentication, apply to your communications with us on our website. More detail is available to you at invesco.com/privacy.
Important notice regarding delivery of security holder documents
To reduce Fund expenses, only one copy of most shareholder documents may be mailed to shareholders with multiple accounts at the same address (Householding). Mailing of your shareholder documents may be householded indefinitely unless you instruct us otherwise. If you do not want the mailing of these documents to be combined with those for other members of your household, please contact Invesco Investment Services, Inc. at 800 959 4246 or contact your financial institution. We will begin sending you individual copies for each account within 30 days after receiving your request.
Fund holdings and proxy voting information
The Fund provides a complete list of its holdings four times in each fiscal year, at the quarter-ends. For the second and fourth quarters, the lists appear in the Fund’s semiannual and annual reports to shareholders. For the first and third quarters, the Fund files the lists with the Securities and Exchange Commission (SEC) on Form N-Q. The most recent list of portfolio holdings is available at invesco.com/completeqtrholdings. Shareholders can also look up the Fund’s Forms N-Q on the SEC website at sec.gov. Copies of the Fund’s Forms N-Q may be reviewed and copied at the SEC Public Reference Room in Washington, D.C. You can obtain information on the operation of the Public Reference Room, including information about duplicating fee charges, by calling 202 551 8090 or 800 732 0330, or by electronic request at the following email address: publicinfo@sec.gov. The SEC file numbers for the Fund are 811-03826 and 002-85905.
A description of the policies and procedures that the Fund uses to determine how to vote proxies relating to portfolio securities is available without charge, upon request, from our Client Services department at 800 959 4246 or at invesco.com/proxyguidelines. The information is also available on the SEC website, sec.gov.
Information regarding how the Fund voted proxies related to its portfolio securities during the period between June 1, 2010, and June 30, 2010, is available at invesco.com/proxysearch. In addition, this information is available on the SEC website, sec.gov. Proxy voting information for the predecessor fund prior to its reorganization with the Fund on June 1, 2010, is not available on the Invesco website but is or will be available on the SEC website under the predecessor fund.
Invesco Advisers, Inc. is an investment adviser; it provides investment advisory services to individual and institutional clients and does not sell securities. Invesco Distributors, Inc. is the U.S. distributor for Invesco Ltd.’s retail mutual funds, exchange-traded funds and institutional money market funds. Both are wholly owned, indirect subsidiaries of Invesco Ltd.
| | | |
|
| VK-UTL-AR-1 | | Invesco Distributors, Inc. |
ITEM 2. CODE OF ETHICS.
| | | There were no amendments to the Code of Ethics (the “Code”) that applies to the Registrant’s Principal Executive Officer (“PEO”) and Principal Financial Officer (“PFO”) during the period covered by the report. The Registrant did not grant any waivers, including implicit waivers, from any provisions of the Code to the PEO or PFO during the period covered by this report. |
ITEM 3. AUDIT COMMITTEE FINANCIAL EXPERT.
| | | The Board of Trustees has determined that the Registrant has at least one audit committee financial expert serving on its Audit Committee. The Audit Committee financial expert is Raymond Stickel, Jr. Mr. Stickel is “independent” within the meaning of that term as used in Form N-CSR. |
ITEM 4. PRINCIPAL ACCOUNTANT FEES AND SERVICES.
Fees Billed by Principal Accountant Related to the Registrant
The following information relates to the series funds of the Registrant covered by this report and includes information pertaining to principal accountant fees and services rendered to such funds for the two most recently completed fiscal years or, if shorter, since a fund’s commencement of operations:
| | | | | | | | | |
| | | | | | | Percentage of Fees Billed Applicable | |
| | | | | | | to Non-Audit Services Provided for | |
| | | Fees Billed for Services Rendered to | | | fiscal year end 3/31/2011 Pursuant to | |
| | | the Registrant for fiscal year end | | | Waiver of Pre-Approval | |
| | | 3/31/2011 | | | Requirement(1) | |
| Audit Fees | | $ | 142,700 | | | | N/A | |
| Audit-Related Fees | | $ | 0 | | | | 0 | % |
Tax Fees(2) | | $ | 31,500 | | | | 0 | % |
| All Other Fees | | $ | 0 | | | | 0 | % |
| | | | | | | | |
| Total Fees | | $ | 174,200 | | | | 0 | % |
PWC billed the Registrant aggregate non-audit fees of $31,500 for the fiscal year ended March 31, 2011.
| | |
| (1) | | With respect to the provision of non-audit services, the pre-approval requirement is waived pursuant to a de minimis exception if (i) such services were not recognized as non-audit services by the Registrant at the time of engagement, (ii) the aggregate amount of all such services provided is no more than 5% of the aggregate audit and non-audit fees paid by the Registrant to PWC during a fiscal year; and (iii) such services are promptly brought to the attention of the Registrant’s Audit Committee and approved by the Registrant’s Audit Committee prior to the completion of the audit. |
| |
| (2) | | Tax fees for the fiscal year end March 31, 2011 includes fees billed for reviewing tax returns. |
Fees Billed by PWC Related to Invesco and Invesco Affiliates
PWC billed Invesco Advisers, Inc. (“Invesco”), the Registrant’s adviser, and any entity controlling, controlled by or under common control with Invesco that provides ongoing services to the Registrant (“Invesco Affiliates”) aggregate fees for pre-approved non-audit services rendered to Invesco and Invesco Affiliates for the last two fiscal years or, if shorter, since a fund’s commencement of operations as follows:
| | | | | | | | | |
| | | Fees Billed for Non-Audit Services | | |
| | | Rendered to Invesco and Invesco | | |
| | | Affiliates for fiscal year end 3/31/2011 | | Percentage of Fees Billed |
| | | That Were Required | | Applicable to Non-Audit Services |
| | | to be Pre-Approved | | Provided for fiscal year end |
| | | by the Registrant’s | | 3/31/2011 Pursuant to Waiver of |
| | | Audit Committee | | Pre-Approval Requirement(1) |
| Audit-Related Fees | | $ | 0 | | | 0 | % |
| Tax Fees | | $ | 0 | | | 0 | % |
| All Other Fees | | $ | 0 | | | 0 | % |
Total Fees(2) | | $ | 0 | | | 0 | % |
| | |
| (1) | | With respect to the provision of non-audit services, the pre-approval requirement is waived pursuant to a de minimis exception if (i) such services were not recognized as non-audit services by the Registrant at the time of engagement, (ii) the aggregate amount of all such services provided is no more than 5% of the aggregate audit and non-audit fees paid by the Registrant, Invesco and Invesco Affiliates to PWC during a fiscal year; and (iii) such services are promptly brought to the attention of the Registrant’s Audit Committee and approved by the Registrant’s Audit Committee prior to the completion of the audit. |
| |
| (2) | | Including the fees for services not required to be pre-approved by the registrant’s audit committee, PWC billed Invesco and Invesco Affiliates aggregate non-audit fees of $0 for the fiscal year ended March 31, 2011. |
| |
| | | The Audit Committee also has considered whether the provision of non-audit services that were rendered to Invesco and Invesco Affiliates that were not required to be pre-approved pursuant to SEC regulations, if any, is compatible with maintaining PWC’s independence. To the extent that such services were provided, the Audit Committee determined that the provision of such services is compatible with PWC maintaining independence with respect to the Registrant. |
PRE-APPROVAL OF AUDIT AND NON-AUDIT SERVICES
POLICIES AND PROCEDURES
As adopted by the Audit Committees of
the Invesco Funds (the “Funds”)
Last Amended May 4, 2010
Statement of Principles
Under the Sarbanes-Oxley Act of 2002 and rules adopted by the Securities and Exchange Commission (“SEC”) (“Rules”), the Audit Committees of the Funds’ (the “Audit Committees”) Board of Trustees (the “Board”) are responsible for the appointment, compensation and oversight of the work of independent accountants (an “Auditor”). As part of this responsibility and to assure that the Auditor’s independence is not impaired, the Audit Committees pre-approve the audit and non-audit services provided to the Funds by each Auditor, as well as all non-audit services provided by the Auditor to the Funds’ investment adviser and to affiliates of the adviser that provide ongoing services to the Funds (“Service Affiliates”) if the services directly impact the Funds’ operations or financial reporting. The SEC Rules also specify the types of services that an Auditor may not provide to its audit client. The following policies and procedures comply with the requirements for pre-approval and provide a mechanism by which management of the Funds may request and secure pre-approval of audit and non-audit services in an orderly manner with minimal disruption to normal business operations.
Proposed services either may be pre-approved without consideration of specific case-by-case services by the Audit Committees (“general pre-approval”) or require the specific pre-approval of the Audit Committees (“specific pre-approval”). As set forth in these policies and procedures, unless a type of service has received general pre-approval, it will require specific pre-approval by the Audit Committees. Additionally, any fees exceeding 110% of estimated pre-approved fee levels provided at the time the service was pre-approved will also require specific approval by the Audit Committees before payment is made. The Audit Committees will also consider the impact of additional fees on the Auditor’s independence when determining whether to approve any additional fees for previously pre-approved services.
The Audit Committees will annually review and generally pre-approve the services that may be provided by each Auditor without obtaining specific pre-approval from the Audit Committee generally on an annual basis. The term of any general pre-approval runs from the date of such pre-approval through September 30th of the following year, unless the Audit Committees consider a different period and state otherwise. The Audit Committees will add to or subtract from the list of general pre-approved services from time to time, based on subsequent determinations.
The purpose of these policies and procedures is to set forth the guidelines to assist the Audit Committees in fulfilling their responsibilities.
Delegation
The Audit Committees may from time to time delegate pre-approval authority to one or more of its members who are Independent Trustees. All decisions to pre-approve a service by a delegated member shall be reported to the Audit Committees at the next quarterly meeting.
Audit Services
The annual audit services engagement terms will be subject to specific pre-approval of the Audit Committees. Audit services include the annual financial statement audit and other procedures such as tax provision work that is required to be performed by the independent auditor to be able to form an opinion on the Funds’ financial statements. The Audit Committees will obtain, review and consider sufficient information concerning the proposed Auditor to make a reasonable evaluation of the Auditor’s qualifications and independence.
In addition to the annual Audit services engagement, the Audit Committees may grant either general or specific pre-approval of other audit services, which are those services that only the independent auditor reasonably can provide. Other Audit services may include services such as issuing consents for the
inclusion of audited financial statements with SEC registration statements, periodic reports and other documents filed with the SEC or other documents issued in connection with securities offerings.
Non-Audit Services
The Audit Committees may provide either general or specific pre-approval of any non-audit services to the Funds and its Service Affiliates if the Audit Committees believe that the provision of the service will not impair the independence of the Auditor, is consistent with the SEC’s Rules on auditor independence, and otherwise conforms to the Audit Committees’ general principles and policies as set forth herein.
Audit-Related Services
“Audit-related services” are assurance and related services that are reasonably related to the performance of the audit or review of the Fund’s financial statements or that are traditionally performed by the independent auditor. Audit-related services include, among others, accounting consultations related to accounting, financial reporting or disclosure matters not classified as “Audit services”; assistance with understanding and implementing new accounting and financial reporting guidance from rulemaking authorities; and agreed-upon procedures related to mergers, compliance with ratings agency requirements and interfund lending activities.
Tax Services
“Tax services” include, but are not limited to, the review and signing of the Funds’ federal tax returns, the review of required distributions by the Funds and consultations regarding tax matters such as the tax treatment of new investments or the impact of new regulations. The Audit Committees will scrutinize carefully the retention of the Auditor in connection with a transaction initially recommended by the Auditor, the major business purpose of which may be tax avoidance or the tax treatment of which may not be supported in the Internal Revenue Code and related regulations. The Audit Committees will consult with the Funds’ Treasurer (or his or her designee) and may consult with outside counsel or advisors as necessary to ensure the consistency of Tax services rendered by the Auditor with the foregoing policy.
No Auditor shall represent any Fund or any Service Affiliate before a tax court, district court or federal court of claims.
Under rules adopted by the Public Company Accounting Oversight Board and approved by the SEC, in connection with seeking Audit Committees’ pre-approval of permissible Tax services, the Auditor shall:
| | 1. | | Describe in writing to the Audit Committees, which writing may be in the form of the proposed engagement letter: |
| | a. | | The scope of the service, the fee structure for the engagement, and any side letter or amendment to the engagement letter, or any other agreement between the Auditor and the Fund, relating to the service; and |
| |
| | b. | | Any compensation arrangement or other agreement, such as a referral agreement, a referral fee or fee-sharing arrangement, between the Auditor and any person (other than the Fund) with respect to the promoting, marketing, or recommending of a transaction covered by the service; |
| | 2. | | Discuss with the Audit Committees the potential effects of the services on the independence of the Auditor; and |
| |
| | 3. | | Document the substance of its discussion with the Audit Committees. |
All Other Auditor Services
The Audit Committees may pre-approve non-audit services classified as “All other services” that are not categorically prohibited by the SEC, as listed in Exhibit 1 to this policy.
Pre-Approval Fee Levels or Established Amounts
Pre-approval of estimated fees or established amounts for services to be provided by the Auditor under general or specific pre-approval policies will be set periodically by the Audit Committees. Any proposed fees exceeding 110% of the maximum estimated pre-approved fees or established amounts for pre-approved audit and non-audit services will be reported to the Audit Committees at the quarterly Audit Committees meeting and will require specific approval by the Audit Committees before payment is made. The Audit Committees will always factor in the overall relationship of fees for audit and non-audit services in determining whether to pre-approve any such services and in determining whether to approve any additional fees exceeding 110% of the maximum pre-approved fees or established amounts for previously pre-approved services.
Procedures
Generally on an annual basis, Invesco Advisers, Inc. (“Invesco”) will submit to the Audit Committees for general pre-approval, a list of non-audit services that the Funds or Service Affiliates of the Funds may request from the Auditor. The list will describe the non-audit services in reasonable detail and will include an estimated range of fees and such other information as the Audit Committee may request.
Each request for services to be provided by the Auditor under the general pre-approval of the Audit Committees will be submitted to the Funds’ Treasurer (or his or her designee) and must include a detailed description of the services to be rendered. The Treasurer or his or her designee will ensure that such services are included within the list of services that have received the general pre-approval of the Audit Committees. The Audit Committees will be informed at the next quarterly scheduled Audit Committees meeting of any such services for which the Auditor rendered an invoice and whether such services and fees had been pre-approved and if so, by what means.
Each request to provide services that require specific approval by the Audit Committees shall be submitted to the Audit Committees jointly by the Fund’s Treasurer or his or her designee and the Auditor, and must include a joint statement that, in their view, such request is consistent with the policies and procedures and the SEC Rules.
Each request to provide tax services under either the general or specific pre-approval of the Audit Committees will describe in writing: (i) the scope of the service, the fee structure for the engagement, and any side letter or amendment to the engagement letter, or any other agreement between the Auditor and the audit client, relating to the service; and (ii) any compensation arrangement or other agreement between the Auditor and any person (other than the audit client) with respect to the promoting, marketing, or recommending of a transaction covered by the service. The Auditor will discuss with the Audit Committees the potential effects of the services on the Auditor’s independence and will document the substance of the discussion.
Non-audit services pursuant to the de minimis exception provided by the SEC Rules will be promptly brought to the attention of the Audit Committees for approval, including documentation that each of the conditions for this exception, as set forth in the SEC Rules, has been satisfied.
On at least an annual basis, the Auditor will prepare a summary of all the services provided to any entity in the investment company complex as defined in section 2-01(f)(14) of Regulation S-X in sufficient detail as to the nature of the engagement and the fees associated with those services.
The Audit Committees have designated the Funds’ Treasurer to monitor the performance of all services provided by the Auditor and to ensure such services are in compliance with these policies and procedures. The Funds’ Treasurer will report to the Audit Committees on a periodic basis as to the results of such monitoring. Both the Funds’ Treasurer and management of Invesco will immediately report to the chairman of the Audit Committees any breach of these policies and procedures that comes to the attention of the Funds’ Treasurer or senior management of Invesco.
Exhibit 1 to Pre-Approval of Audit and Non-Audit Services Policies and Procedures
Conditionally Prohibited Non-Audit Services (not prohibited if the Fund can reasonably conclude that the results of the service would not be subject to audit procedures in connection with the audit of the Fund’s financial statements)
| | • | | Bookkeeping or other services related to the accounting records or financial statements of the audit client |
| |
| | • | | Financial information systems design and implementation |
| |
| | • | | Appraisal or valuation services, fairness opinions, or contribution-in-kind reports |
| |
| | • | | Actuarial services |
| |
| | • | | Internal audit outsourcing services |
Categorically Prohibited Non-Audit Services
| | • | | Management functions |
| |
| | • | | Human resources |
| |
| | • | | Broker-dealer, investment adviser, or investment banking services |
| |
| | • | | Legal services |
| |
| | • | | Expert services unrelated to the audit |
| |
| | • | | Any service or product provided for a contingent fee or a commission |
| |
| | • | | Services related to marketing, planning, or opining in favor of the tax treatment of confidential transactions or aggressive tax position transactions, a significant purpose of which is tax avoidance |
| |
| | • | | Tax services for persons in financial reporting oversight roles at the Fund |
| |
| | • | | Any other service that the Public Company Oversight Board determines by regulation is impermissible. |
ITEM 5. AUDIT COMMITTEE OF LISTED REGISTRANTS.
ITEM 6. SCHEDULE OF INVESTMENTS.
| | | | Investments in securities of unaffiliated issuers is included as part of the reports to stockholders filed under Item 1 of this Form. |
ITEM 7. DISCLOSURE OF PROXY VOTING POLICIES AND PROCEDURES FOR CLOSED-END MANAGEMENT INVESTMENT COMPANIES.
ITEM 8. PORTFOLIO MANAGERS OF CLOSED-END MANAGEMENT COMPANIES.
ITEM 9. PURCHASES OF EQUITY SECURITIES BY CLOSED-END MANAGEMENT INVESTMENT COMPANY AND AFFILIATED PURCHASERS.
ITEM 10. SUBMISSION OF MATTERS TO A VOTE OF SECURITY HOLDERS.
ITEM 11. CONTROLS AND PROCEDURES.
| (a) | | As of March 21, 2011, an evaluation was performed under the supervision and with the participation of the officers of the Registrant, including the PEO and PFO, to assess the effectiveness of the Registrant’s disclosure controls and procedures, as that term is |
| | | | defined in Rule 30a-3(c) under the Investment Company Act of 1940 (the “Act”), as amended. Based on that evaluation, the Registrant’s officers, including the PEO and PFO, concluded that, as of March 21, 2011, the Registrant’s disclosure controls and procedures were reasonably designed to ensure: (1) that information required to be disclosed by the Registrant on Form N-CSR is recorded, processed, summarized and reported within the time periods specified by the rules and forms of the Securities and Exchange Commission; and (2) that material information relating to the Registrant is made known to the PEO and PFO as appropriate to allow timely decisions regarding required disclosure. |
| (b) | | There have been no changes in the Registrant’s internal control over financial reporting (as defined in Rule 30a-3(d) under the Act) that occurred during the second fiscal quarter of the period covered by this report that have materially affected, or are reasonably likely to materially affect, the Registrant’s internal control over financial reporting. |
ITEM 12. EXHIBITS.
| | | |
|
| 12(a) (1) | | Code of Ethics. |
| | | |
| 12(a) (2) | | Certifications of principal executive officer and principal financial officer as required by Rule 30a-2(a) under the Investment Company Act of 1940. |
| | | |
| 12(a) (3) | | Not applicable. |
| | | |
| 12(b) | | Certifications of principal executive officer and principal financial officer as required by Rule 30a-2(b) under the Investment Company Act of 1940. |
SIGNATURES
Pursuant to the requirements of the Securities Exchange Act of 1934 and the Investment Company Act of 1940, the Registrant has duly caused this report to be signed on its behalf by the undersigned, thereunto duly authorized.
Registrant: AIM Sector Funds (Invesco Sector Funds)
| | | | | |
| | | |
| | By: | /s/ Philip A. Taylor | |
| | | Philip A. Taylor | |
| | | Principal Executive Officer | |
Date: June 6, 2011
Pursuant to the requirements of the Securities and Exchange Act of 1934 and the Investment Company Act of 1940, this report has been signed below by the following persons on behalf of the Registrant and in the capacities and on the dates indicated.
| | | | |
| |
| | By: | /s/ Philip A. Taylor | |
| | | Philip A. Taylor | |
| | | Principal Executive Officer | |
Date: June 6, 2011
| | | | |
| |
| | By: | /s/ Sheri Morris | |
| | | Sheri Morris | |
| | | Principal Financial Officer | |
Date: June 6, 2011
EXHIBIT INDEX
| | | |
| 12(a)(1) | | Code of Ethics. |
| | | |
| 12(a)(2) | | Certifications of principal executive officer and principal Financial officer as required by Rule 30a-2(a) under the Investment Company Act of 1940. |
| | | |
| 12(a)(3) | | Not applicable. |
| | | |
| 12(b) | | Certifications of principal executive officer and principal financial officer as required by Rule 30a-2(b) under the Investment Company Act of 1940. |