UNITED STATES
SECURITIES AND EXCHANGE COMMISSION
Washington, D.C. 20549
FORM N-CSR
CERTIFIED SHAREHOLDER REPORT OF REGISTERED
MANAGEMENT INVESTMENT COMPANIES
Investment Company Act file number 811-03826
AIM Sector Funds (Invesco Sector Funds)
(Exact name of registrant as specified in charter)
11 Greenway Plaza, Suite 1000 Houston, Texas 77046
(Address of principal executive offices) (Zip code)
Glenn Brightman 11 Greenway Plaza, Suite 1000 Houston, Texas 77046
(Name and address of agent for service)
Registrant’s telephone number, including area code: (713) 626-1919
Date of fiscal year end: 4/30
Date of reporting period: 4/30/2024
| ITEM 1. | REPORTS TO STOCKHOLDERS. |
(a) The Registrant’s annual report transmitted to shareholders pursuant to Rule 30e-1 under the Investment Company Act of 1940 is as follows:

| | |
| | |
| Annual Report to Shareholders | | April 30, 2024 |
Invesco Comstock Fund
Nasdaq:
A: ACSTX ∎ C: ACSYX ∎ R: ACSRX ∎ Y: ACSDX ∎ R5: ACSHX ∎ R6: ICSFX
| | |
Beginning in July 2024, amendments adopted by the Securities and Exchange Commission will substantially impact the design, content, and delivery of shareholder reports. These newly designed shareholder reports will highlight key fund information in a clear and concise format and must be mailed to each shareholder that has not elected to receive the reports electronically. Other information, including financial statements, will no longer be included in the shareholder report but will be available at invesco.com/reports, delivered upon request, and filed on a semiannual basis on Form N-CSR. If you would like to receive shareholder reports and other communications electronically instead of by mail, you may make that request by contacting your financial intermediary (such as a broker-dealer or bank) or, if you are a direct investor, by enrolling at invesco.com/edelivery. If you do not make this request or enroll in e-delivery, you will receive future shareholder reports and other communications by mail. | | |
Management’s Discussion of Fund Performance
| | | | |
| |
Performance summary | |
For the fiscal year ended April 30, 2024, Class A shares of Invesco Comstock Fund (the Fund), at net asset value (NAV), outperformed the Russell 1000 Value Index, the Fund’s style-specific benchmark. | |
Your Fund’s long-term performance appears later in this report. | |
| |
Fund vs. Indexes | |
Total returns, 4/30/23 to 4/30/24, at net asset value (NAV). Performance shown does not include applicable contingent deferred sales charges (CDSC) or front-end sales charges, which would have reduced performance. | |
Class A Shares | | | 17.20 | % |
Class C Shares | | | 16.30 | |
Class R Shares | | | 16.91 | |
Class Y Shares | | | 17.46 | |
Class R5 Shares | | | 17.52 | |
Class R6 Shares | | | 17.61 | |
S&P 500 Index▼ (Broad Market Index) | | | 22.66 | |
Russell 1000 Value Index▼ (Style-Specific Index) | | | 13.42 | |
Lipper Large-Cap Value Funds Index∎ (Peer Group Index) | | | 18.17 | |
Source(s): ▼RIMES Technologies Corp.; ∎Lipper Inc. | | | | |
Market conditions and your Fund
The US economy and equity markets remained resilient in the second quarter of 2023, as milder inflation data and better-than-expected corporate earnings supported equities, with most major indexes posting gains for the quarter and with some big tech names providing optimistic future guidance. Following the March 2023 banking crisis, markets stabilized in April, as corporate earnings season got underway with many companies exceeding earnings and revenue estimates. Facing persistently strong employment data, the US Federal Reserve (the Fed) raised the federal funds rate by 0.25% at its May 2023 meeting,1 but left rates unchanged at its June meeting, giving investors the long-awaited “pause” in rate hikes, which sent equities broadly higher.
Equity markets declined in the third quarter and into October 2023 as a resilient US economy complicated the Fed’s efforts to tame inflation. While inflation has slowed from its peak in 2022, in July 2023, the Consumer Price Index (CPI) rose by 0.2% and the 12-month headline inflation rate rose to 3.2% from 3% in June.2 Due to the persistence of inflation, the Fed raised the federal funds rate again in July by 0.25%.1 The CPI data released in September was higher-than-expected and the overall US labor market remained tight with unemployment near historic lows. At the same time the third quarter year-over-year Gross Domestic Product (GDP) estimate was 4.9%, far above expectations.2 Despite the higher-than-expected GDP for the third quarter of 2023, the Fed held interest rates steady at its September and October meetings, but left open the possibility of another rate hike before the end of the calendar year.1
US equity markets posted strong gains in the fourth quarter of 2023 as investors
anticipated the potential end of interest rate hikes by the Fed. Inflation slowed during the period as the CPI 12-month headline inflation rate fell to 3.1% in November from 3.7% in September, significantly below the 2022 peak of 9.1%.2 The Fed kept rates steady at its mid-December meeting and indicated that three rate cuts are expected in 2024. Fed chairman Powell noted that “the Fed’s policy rate is likely at or near its peak for this tightening cycle,”1 which prompted a strong equity rally into 2023 year-end and the yield on the 10-year US Treasury to fall from nearly 5% in October to below 4%.3
US equity markets rallied in the first quarter of 2024. In February, the S&P 500 Index closed above the 5,000 milestone for the first time.3 The US economy defied recession predictions, achieving a growth rate of 2.5% in 2023 and the labor market remained robust, with continued payroll gains and unemployment still historically low – below 4%.2 Inflation, however, remained persistent. January and February increases in the CPI were higher than expected, leading the Fed to defer its proposed interest rate cuts to the second half of 2024.1 Still, investors were mostly pleased by corporate earnings growth, except for three of the so-called “Magnificent Seven” stocks. Apple, Alphabet and Tesla’s stock prices suffered due to disappointing earnings, sales and revenue, or weak forward guidance. Although the stock market had a strong start in 2024, the stock market retreated in April. As consumer spending and a strong labor market were driving economic activity, inflation and interest rate concerns persisted and investors feared another delay in expected rate cuts by the Fed, or worse, rate hikes.
Despite continued higher rates and increased market volatility, US stocks for the fiscal year had strong positive returns of 22.66%, as measured by the S&P 500 Index.4
For the fiscal year ended April 30, 2024, the Invesco Comstock Fund (the Fund) out-performed the Russell 1000 Value Index, the Fund’s style-specific benchmark.
Some key contributors to the Fund’s performance during the fiscal year were stock selection in industrials, communication services and financial sectors, while an under-weight in utilities and an overweight in information technology (IT) also boosted relative returns. In industrials, General Electric, FedEx, Eaton and Caterpillar were top contributors on an absolute and relative basis. FedEx rallied after reporting positive results from merging the Ground and Express divisions to achieve economies of scale. Within IT, Microsoft was a top performer, followed by semiconductor stocks, NXP Semiconductors, Qualcomm and Intel. Semiconductor companies benefited from a PC (personal computer) recovery cycle and a growing pipeline for Artificial Intelligence. In communications services, Meta Platforms (formerly Facebook) and Alphabet (formerly Google) were key contributors on an absolute and relative basis. With utilities being the worst performing sector for the fiscal year, having a material underweight benefited relative returns.
Some key detractors from the Fund’s performance during the fiscal year were stock selection in health care, consumer staples and the cash held in the Fund. In health care, managed health care provider Elevance Health and health care services, CVS Health, hurt relative performance. CVS Health’s key issues included higher-than-expected costs in its insurance business, lower Medicare Advantage reimbursement rates, and a decline in the health care benefits segment’s operating results. Additionally, the company revised its full-year 2024 guidance due to potential for continued elevated medical cost trends. In consumer staples, household products companies, Kimberly-Clark and Reckitt Benckiser lagged their industry peers and the sector, detracting from relative performance. Kimberly-Clark suffered from negative earnings estimate revisions and an increase in operating expenses, while the effective tax rate of the company also increased. Although cash averaged less than 3% for the fiscal year, cash was a drag on relative performance, as would be expected in a positive equity market.
We used currency-forward contracts during the fiscal year to hedge currency exposure of non-US-based companies held in the Fund’s portfolio. Derivatives were used solely for the purpose of hedging. The use of currency-forward contracts had a negligible impact (neither positive nor negative) on the Fund’s relative performance.
The Fund’s notable overweight exposures were in IT, communication services and to a lesser extent energy and consumer staples sectors. The Fund was mostly underweight real estate, utilities, materials, industrials and financials sectors.
Looking further into 2024, we believe investors are focused on the Fed’ s response to inflation and hopeful for rate cuts. Internationally, geopolitical risks from the Russia/ Ukraine and Israel/Hamas wars are also major concerns, particularly if these wars spread to other countries in Eastern Europe and the Middle East. Given these factors, we believe stocks are likely to see continued volatility for the foreseeable future. In our view, market volatility may create opportunities for patient, disciplined long-term investors.
Thank you for your investment in the invesco Comstock Fund and for sharing our long-term investment horizon.
| 1 | Source: US Federal Reserve |
| 2 | Source: US Bureau of Labor Statistics |
4 Source: Morningstar Direct
Portfolio manager(s):
Devin Armstrong - Lead
Kevin Holt - Lead
James Warwick
The views and opinions expressed in management’s discussion of Fund performance are those of Invesco Advisers, Inc. and its affiliates. These views and opinions are subject to change at any time based on factors such as market and economic conditions. These views and opinions may not be relied upon as investment advice or recommendations, or as an offer for a particular security. The information is not a complete analysis of every aspect of any market, country, industry, security or the Fund. Statements of fact are from sources considered reliable, but Invesco Advisers, Inc. makes no representation or warranty as to their completeness or accuracy. Although historical performance is no guarantee of future results, these insights may help you understand our investment management philosophy.
See important Fund and, if applicable, index disclosures later in this report.
Your Fund’s Long-Term Performance
Results of a $10,000 Investment – Oldest Share Class(es)
Fund and index data from 4/30/14
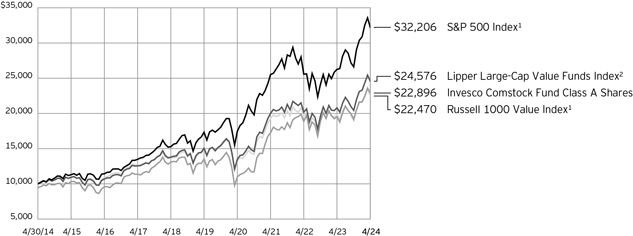
| 1 | Source: RIMES Technologies Corp. |
Past performance cannot guarantee future results.
The data shown in the chart include reinvested distributions, applicable sales charges and Fund expenses including management
fees. Index results include reinvested dividends, but they do not reflect sales charges. Performance of the peer group, if applicable, reflects fund expenses and management fees;
performance of a market index does not. Performance shown in the chart does not reflect deduction of taxes a shareholder would pay on Fund distributions or sale of Fund shares.
| | | | |
| |
Average Annual Total Returns | |
As of 4/30/24, including maximum applicable sales charges | |
| |
Class A Shares | | | | |
Inception (10/7/68) | | | 10.72 | % |
10 Years | | | 8.64 | |
5 Years | | | 9.82 | |
1 Year | | | 10.77 | |
| |
Class C Shares | | | | |
Inception (10/26/93) | | | 9.82 | % |
10 Years | | | 8.61 | |
5 Years | | | 10.26 | |
1 Year | | | 15.30 | |
| |
Class R Shares | | | | |
Inception (10/1/02) | | | 9.47 | % |
10 Years | | | 8.98 | |
5 Years | | | 10.80 | |
1 Year | | | 16.91 | |
| |
Class Y Shares | | | | |
Inception (10/29/04) | | | 8.68 | % |
10 Years | | | 9.53 | |
5 Years | | | 11.35 | |
1 Year | | | 17.46 | |
| |
Class R5 Shares | | | | |
Inception (6/1/10) | | | 12.09 | % |
10 Years | | | 9.60 | |
5 Years | | | 11.42 | |
1 Year | | | 17.52 | |
| |
Class R6 Shares | | | | |
Inception (9/24/12) | | | 11.57 | % |
10 Years | | | 9.69 | |
5 Years | | | 11.50 | |
1 Year | | | 17.61 | |
Effective June 1, 2010, Class A, Class C, Class I and Class R shares of the predecessor fund, Van Kampen Comstock Fund, advised by Van Kampen Asset Management were reorganized into Class A, Class C, Class Y and Class R shares, respectively, of Invesco Van Kampen Comstock Fund (renamed Invesco Comstock Fund). Returns shown above, prior to June 1, 2010, for Class A, Class C, Class R and Class Y shares are those of Class A, Class C, Class R and Class I shares of the predecessor fund. Share class returns will differ from the predecessor fund because of different expenses.
The performance data quoted represent past performance and cannot guarantee future results; current performance may be lower or higher. Please visit invesco.com/ performance for the most recent month-end performance. Performance figures reflect reinvested distributions, changes in net asset value and the effect of the maxi-mum sales charge unless otherwise stated. Performance figures do not reflect deduction of taxes a shareholder would pay on Fund distributions or sale of Fund shares. Investment return and principal value will fluctuate so that you may have a gain or loss when you sell shares.
Class A share performance reflects the maximum 5.50% sales charge, and Class C share performance reflects the applicable contingent deferred sales charge (CDSC) for the period involved. The CDSC on Class C shares is 1% for the first year after purchase. Class R, Class Y, Class R5 and Class R6 shares do not have a front-end sales charge or a CDSC; therefore, performance is at net asset value.
The performance of the Fund’s share classes will differ primarily due to different sales charge structures and class expenses.
Fund performance reflects any applicable fee waivers and/or expense reimbursements. Had the adviser not waived fees and/or reimbursed expenses currently or in the past, returns would have been lower. See current prospectus for more information.
Supplemental Information
Invesco Comstock Fund’s investment objective is total return through growth of capital and current income.
| ∎ | Unless otherwise stated, information presented in this report is as of April 30, 2024, and is based on total net assets. |
| ∎ | Unless otherwise noted, all data is provided by Invesco. |
| ∎ | To access your Fund’s reports/prospectus, visit invesco.com/fundreports. |
About indexes used in this report
| ∎ | The S&P 500® Index is an unmanaged index considered representative of the US stock market. |
| ∎ | The Russell 1000® Value Index is an unmanaged index considered representative of large-cap value stocks. The Russell 1000 Value Index is a trademark/service mark of the Frank Russell Co. Russell® is a trademark of the Frank Russell Co. |
| ∎ | The Lipper Large-Cap Value Funds Index is an unmanaged index considered representative of large-cap value funds tracked by Lipper. |
| ∎ | The Fund is not managed to track the performance of any particular index, including the index(es) described here, and consequently, the performance of the Fund may deviate significantly from the performance of the index(es). |
| ∎ | A direct investment cannot be made in an index. Unless otherwise indicated, index results include reinvested dividends, and they do not reflect sales charges. Performance of the peer group, if applicable, reflects fund expenses; performance of a market index does not. |
Liquidity Risk Management Program
| | In compliance with Rule 22e-4 under the Investment Company Act of 1940, as amended (the “Liquidity Rule”), the Fund has adopted and implemented a liquidity risk management program in accordance with the Liquidity Rule (the “Program”). The Program is reasonably designed to assess and manage the Fund’s liquidity risk, which is the risk that the Fund could not meet redemption requests without significant dilution of remaining investors’ interests in the Fund. The Board of Trustees of the Fund (the “Board”) has appointed Invesco Advisers, Inc. (“Invesco”), the Fund’s investment adviser, as the Program’s administrator, and Invesco has delegated oversight of the Program to the Liquidity Risk Management Committee (the “Committee”), which is composed of senior representatives from relevant busi-ness groups at Invesco. |
| | As required by the Liquidity Rule, the Program includes policies and procedures |
| | providing for an assessment, no less frequently than annually, of the Fund’s liquidity risk that takes into account, as relevant to the Fund’s liquidity risk: (1) the Fund’s investment strategy and liquidity of portfolio investments during both normal and reasonably foreseeable stressed conditions; (2) short-term and long-term cash flow projections for the Fund during both normal and reasonably foreseeable stressed conditions; and (3) the Fund’s holdings of cash and cash equivalents and any borrowing arrangements. The Liquidity Rule also requires the classification of the Fund’s investments into categories that reflect the assessment of their relative liquidity under current market conditions. The Fund classifies its investments into one of four categories defined in the Liquidity Rule: “Highly Liquid,” “Moderately Liquid,” “Less Liquid,” and “Illiquid.” Funds that are not invested primarily in “Highly Liquid Investments” that are assets (cash or investments that are reasonably expected to be convertible into cash within three business days without significantly changing the market value of the investment) are required to establish a “Highly Liquid Investment Minimum” (“HLIM”), which is the minimum percentage of net assets that must be invested in Highly Liquid Investments. Funds with HLIMs have procedures for addressing HLIM shortfalls, including reporting to the Board and the SEC (on a non-public basis) as required by the Program and the Liquidity Rule. In addition, the Fund may not acquire an investment if, immediately after the acquisition, over 15% of the Fund’s net assets would consist of “Illiquid Investments” that are assets (an investment that cannot reasonably be expected to be sold or disposed of in current market conditions in seven calendar days or less without the sale or disposition significantly changing the market value of the investment). The Liquidity Rule and the Program also require reporting to the Board and the SEC (on a non-public basis) if a Fund’s holdings of Illiquid Investments exceed 15% of the Fund’s assets. |
| | At a meeting held on March 25-27, 2024, the Committee presented a report to the Board that addressed the operation of the |
| | Program and assessed the Program’s adequacy and effectiveness of implementation (the “Report”). The Report covered the period from January 1, 2023 through December 31, 2023 (the “Program Reporting Period”). The Report discussed notable events affecting liquidity over the Program Reporting Period, including the impact of the end of an aggressive rate hike cycle, signs that inflation was abating and market liquidity was reverting to normal, and the overall market. The Report noted that there were no material changes to the Program during the Program Reporting Period. |
| | The Report stated, in relevant part, that during the Program Reporting Period: |
| ∎ | The Program, as adopted and implemented, remained reasonably designed to assess and manage the Fund’s liquidity risk and was operated effectively to achieve that goal; |
| ∎ | The Fund’s investment strategy remained appropriate for an open-end fund; |
| ∎ | The Fund was able to meet requests for redemption without significant dilution of remaining investors’ interests in the Fund; |
| ∎ | The Fund did not breach the 15% limit on Illiquid Investments; and |
| ∎ | The Fund primarily held Highly Liquid In-vestments and therefore has not adopted an HLIM. |
|
|
This report must be accompanied or preceded by a currently effective Fund prospectus, which contains more complete information, including sales charges and expenses. Investors should read it carefully before investing. |
|
| NOT FDIC INSURED | MAY LOSE VALUE | NO BANK GUARANTEE |
Fund Information
Portfolio Composition
| | | | | |
| By sector | | % of total net assets |
| |
Financials | | | | 19.48 | % |
| |
Health Care | | | | 15.89 | |
| |
Industrials | | | | 12.47 | |
| |
Information Technology | | | | 11.01 | |
| |
Energy | | | | 10.04 | |
| |
Consumer Staples | | | | 9.58 | |
| |
Communication Services | | | | 8.03 | |
| |
Consumer Discretionary | | | | 4.24 | |
| |
Materials | | | | 3.04 | |
| |
Other Sectors, Each Less than 2% of Net Assets | | | | 1.66 | |
| |
| Money Market Funds Plus Other Assets Less Liabilities | | | | 4.56 | |
Top 10 Equity Holdings*
| | | | | | | |
| | | | | % of total net assets |
| | |
| 1. | | Wells Fargo & Co. | | | | 3.25 | % |
| | |
| 2. | | Bank of America Corp. | | | | 2.65 | |
| | |
| 3. | | Philip Morris International, Inc. | | | | 2.49 | |
| | |
| 4. | | Microsoft Corp. | | | | 2.45 | |
| | |
| 5. | | Elevance Health, Inc. | | | | 2.24 | |
| | |
| 6. | | Chevron Corp. | | | | 2.20 | |
| | |
| 7. | | Meta Platforms, Inc., Class A | | | | 2.11 | |
| | |
| 8. | | Johnson Controls International PLC | | | | 2.10 | |
| | |
| 9. | | Suncor Energy, Inc. | | | | 2.08 | |
| | |
| 10. | | FedEx Corp. | | | | 1.91 | |
The Fund’s holdings are subject to change, and there is no assurance that the Fund will continue to hold any particular security.
| * | Excluding money market fund holdings, if any. |
Data presented here are as of April 30, 2024.
Schedule of Investments(a)
April 30, 2024
| | | | | | | | |
| | | Shares | | | Value | |
|
| |
Common Stocks & Other Equity Interests–95.44% | |
Aerospace & Defense–2.36% | | | | | | | | |
General Electric Co. | | | 917,486 | | | $ | 148,467,584 | |
|
| |
Textron, Inc.(b) | | | 1,350,267 | | | | 114,219,086 | |
|
| |
| | | | | | | 262,686,670 | |
|
| |
| | |
Air Freight & Logistics–1.91% | | | | | | | | |
FedEx Corp. | | | 812,748 | | | | 212,761,171 | |
|
| |
| |
Apparel, Accessories & Luxury Goods–0.03% | | | | | |
Ralph Lauren Corp.(b) | | | 20,312 | | | | 3,323,856 | |
|
| |
| |
Asset Management & Custody Banks–1.39% | | | | | |
State Street Corp. | | | 2,142,782 | | | | 155,330,267 | |
|
| |
| |
Automobile Manufacturers–0.60% | | | | | |
General Motors Co. | | | 1,498,442 | | | | 66,725,622 | |
|
| |
| | |
Biotechnology–0.44% | | | | | | | | |
AbbVie, Inc.(b) | | | 302,710 | | | | 49,232,754 | |
|
| |
| | |
Broadline Retail–1.22% | | | | | | | | |
eBay, Inc. | | | 2,626,729 | | | | 135,381,613 | |
|
| |
| | |
Building Products–2.10% | | | | | | | | |
Johnson Controls International PLC | | | 3,596,325 | | | | 234,012,868 | |
|
| |
| | |
Cable & Satellite–2.01% | | | | | | | | |
Charter Communications, Inc., Class A(b)(c) | | | 473,728 | | | | 121,245,945 | |
|
| |
Comcast Corp., Class A | | | 2,679,630 | | | | 102,120,699 | |
|
| |
| | | | | | | 223,366,644 | |
|
| |
| | |
Casinos & Gaming–1.09% | | | | | | | | |
Las Vegas Sands Corp. | | | 2,739,857 | | | | 121,540,057 | |
|
| |
| |
Communications Equipment–2.70% | | | | | |
Cisco Systems, Inc. | | | 3,888,507 | | | | 182,682,059 | |
|
| |
F5, Inc.(c) | | | 715,837 | | | | 118,335,014 | |
|
| |
| | | | | | | 301,017,073 | |
|
| |
Construction Machinery & Heavy Transportation
Equipment–2.65% | |
Caterpillar, Inc. | | | 420,966 | | | | 140,842,594 | |
|
| |
Wabtec Corp. | | | 954,660 | | | | 153,776,633 | |
|
| |
| | | | | | | 294,619,227 | |
|
| |
| | |
Diversified Banks–8.73% | | | | | | | | |
Bank of America Corp. | | | 7,965,671 | | | | 294,809,484 | |
|
| |
Citigroup, Inc. | | | 2,654,597 | | | | 162,806,434 | |
|
| |
Fifth Third Bancorp | | | 4,207,209 | | | | 153,394,840 | |
|
| |
Wells Fargo & Co. | | | 6,098,922 | | | | 361,788,053 | |
|
| |
| | | | | | | 972,798,811 | |
|
| |
| |
Electrical Components & Equipment–3.45% | | | | | |
Eaton Corp. PLC | | | 666,514 | | | | 212,124,746 | |
|
| |
Emerson Electric Co. | | | 1,598,139 | | | | 172,247,421 | |
|
| |
| | | | | | | 384,372,167 | |
|
| |
| |
Fertilizers & Agricultural Chemicals–1.78% | | | | | |
CF Industries Holdings, Inc. | | | 1,320,196 | | | | 104,255,878 | |
|
| |
| | | | | | | | |
| | | Shares | | | Value | |
|
| |
Fertilizers & Agricultural Chemicals–(continued) | | | | | |
Corteva, Inc. | | | 1,737,290 | | | $ | 94,039,508 | |
|
| |
| | | | | | | 198,295,386 | |
|
| |
| | |
Food Distributors–1.24% | | | | | | | | |
Sysco Corp. | | | 1,851,095 | | | | 137,573,380 | |
|
| |
| | |
Health Care Distributors–0.93% | | | | | | | | |
Henry Schein, Inc.(c) | | | 1,487,184 | | | | 103,032,108 | |
|
| |
| | |
Health Care Equipment–2.34% | | | | | | | | |
Baxter International, Inc. | | | 1,589,698 | | | | 64,176,108 | |
|
| |
Becton, Dickinson and Co. | | | 386,874 | | | | 90,760,641 | |
|
| |
Medtronic PLC | | | 1,321,351 | | | | 106,025,204 | |
|
| |
| | | | | | | 260,961,953 | |
|
| |
| | |
Health Care Facilities–1.08% | | | | | | | | |
Universal Health Services, Inc., Class B | | | 703,519 | | | | 119,900,743 | |
|
| |
| | |
Health Care Services–1.44% | | | | | | | | |
CVS Health Corp. | | | 2,370,883 | | | | 160,532,488 | |
|
| |
| | |
Health Care Supplies–0.38% | | | | | | | | |
DENTSPLY SIRONA, Inc. | | | 1,390,286 | | | | 41,722,483 | |
|
| |
| | |
Household Products–2.28% | | | | | | | | |
Kimberly-Clark Corp.(b) | | | 1,072,301 | | | | 146,401,255 | |
|
| |
Reckitt Benckiser Group PLC (United Kingdom) | | | 1,923,898 | | | | 107,559,370 | |
|
| |
| | | | | | | 253,960,625 | |
|
| |
| | |
Integrated Oil & Gas–5.90% | | | | | | | | |
Chevron Corp. | | | 1,519,592 | | | | 245,064,602 | |
|
| |
Exxon Mobil Corp. | | | 1,142,555 | | | | 135,129,980 | |
|
| |
Shell PLC, ADR | | | 631,191 | | | | 45,231,147 | |
|
| |
Suncor Energy, Inc. (Canada) | | | 6,073,906 | | | | 231,962,470 | |
|
| |
| | | | | | | 657,388,199 | |
|
| |
| |
Interactive Media & Services–3.98% | | | | | |
Alphabet, Inc., Class A(c) | | | 1,279,952 | | | | 208,350,587 | |
|
| |
Meta Platforms, Inc., Class A | | | 547,141 | | | | 235,363,644 | |
|
| |
| | | | | | | 443,714,231 | |
|
| |
| |
Investment Banking & Brokerage–1.95% | | | | | |
Goldman Sachs Group, Inc. (The) | | | 344,317 | | | | 146,923,507 | |
|
| |
Morgan Stanley | | | 773,463 | | | | 70,261,379 | |
|
| |
| | | | | | | 217,184,886 | |
|
| |
| |
IT Consulting & Other Services–1.78% | | | | | |
Cognizant Technology Solutions Corp., Class A | | | 1,643,920 | | | | 107,972,665 | |
|
| |
DXC Technology Co.(b)(c) | | | 4,643,271 | | | | 90,497,352 | |
|
| |
| | | | | | | 198,470,017 | |
|
| |
| | |
Life & Health Insurance–0.96% | | | | | | | | |
MetLife, Inc. | | | 1,506,782 | | | | 107,102,065 | |
|
| |
| | |
Managed Health Care–2.97% | | | | | | | | |
Elevance Health, Inc. | | | 471,032 | | | | 248,978,095 | |
|
| |
Humana, Inc. | | | 268,966 | | | | 81,251,939 | |
|
| |
| | | | | | | 330,230,034 | |
|
| |
See accompanying Notes to Financial Statements which are an integral part of the financial statements.
| | | | | | | | |
| | | Shares | | | Value | |
|
| |
Movies & Entertainment–1.29% | |
Walt Disney Co. (The) | | | 1,016,536 | | | $ | 112,937,150 | |
|
| |
Warner Bros. Discovery, Inc.(c) | | | 4,132,521 | | | | 30,415,354 | |
|
| |
| | | | | | | 143,352,504 | |
|
| |
|
Multi-line Insurance–1.73% | |
American International Group, Inc. | | | 2,560,272 | | | | 192,814,084 | |
|
| |
|
Multi-Utilities–1.32% | |
Dominion Energy, Inc.(b) | | | 2,892,292 | | | | 147,449,046 | |
|
| |
|
Oil & Gas Exploration & Production–3.49% | |
ConocoPhillips | | | 834,357 | | | | 104,811,926 | |
|
| |
Hess Corp. | | | 661,564 | | | | 104,189,714 | |
|
| |
Marathon Oil Corp. | | | 3,704,044 | | | | 99,453,582 | |
|
| |
Pioneer Natural Resources Co.(b) | | | 296,427 | | | | 79,833,720 | |
|
| |
| | | | | | | 388,288,942 | |
|
| |
|
Oil & Gas Storage & Transportation–0.65% | |
Cheniere Energy, Inc. | | | 458,431 | | | | 72,349,580 | |
|
| |
|
Packaged Foods & Meats–1.48% | |
Kraft Heinz Co. (The) | | | 3,208,810 | | | | 123,892,154 | |
|
| |
Tyson Foods, Inc., Class A | | | 677,878 | | | | 41,113,301 | |
|
| |
| | | | | | | 165,005,455 | |
|
| |
|
Paper & Plastic Packaging Products & Materials–1.26% | |
International Paper Co. | | | 4,029,965 | | | | 140,806,977 | |
|
| |
|
Pharmaceuticals–6.31% | |
AstraZeneca PLC (United Kingdom) | | | 817,505 | | | | 123,646,703 | |
|
| |
Bristol-Myers Squibb Co. | | | 1,527,921 | | | | 67,136,849 | |
|
| |
Johnson & Johnson | | | 975,451 | | | | 141,040,460 | |
|
| |
Merck & Co., Inc. | | | 1,456,168 | | | | 188,166,029 | |
|
| |
Sanofi S.A., ADR(b) | | | 3,711,269 | | | | 182,705,773 | |
|
| |
| | | | | | | 702,695,814 | |
|
| |
|
Property & Casualty Insurance–1.10% | |
Allstate Corp. (The) | | | 722,451 | | | | 122,860,017 | |
|
| |
|
Regional Banks–3.62% | |
Citizens Financial Group, Inc. | | | 4,375,545 | | | | 149,249,840 | |
|
| |
Huntington Bancshares, Inc. | | | 10,377,052 | | | | 139,778,891 | |
|
| |
M&T Bank Corp.(b) | | | 794,329 | | | | 114,693,164 | |
|
| |
| | | | | | | 403,721,895 | |
|
| |
|
Restaurants–1.30% | |
Starbucks Corp. | | | 1,638,701 | | | | 145,008,652 | |
|
| |
|
Semiconductors–4.08% | |
Intel Corp. | | | 3,180,359 | | | | 96,905,539 | |
|
| |
NXP Semiconductors N.V. (China) | | | 748,481 | | | | 191,753,347 | |
|
| |
QUALCOMM, Inc. | | | 1,001,285 | | | | 166,063,117 | |
|
| |
| | | | | | | 454,722,003 | |
|
| |
Investment Abbreviations:
ADR – American Depositary Receipt
REIT – Real Estate Investment Trust
| | | | | | | | |
| | | Shares | | | Value | |
|
| |
Soft Drinks & Non-alcoholic Beverages–2.09% | |
Coca-Cola Co. (The) | | | 1,591,477 | | | $ | 98,305,534 | |
|
| |
Keurig Dr Pepper, Inc.(b) | | | 3,990,563 | | | | 134,481,973 | |
|
| |
| | | | | | | 232,787,507 | |
|
| |
|
Systems Software–2.45% | |
Microsoft Corp. | | | 700,868 | | | | 272,868,938 | |
|
| |
|
Telecom Tower REITs–0.34% | |
SBA Communications Corp., Class A | | | 205,655 | | | | 38,276,509 | |
|
| |
|
Tobacco–2.49% | |
Philip Morris International, Inc. | | | 2,917,371 | | | | 276,975,203 | |
|
| |
|
Wireless Telecommunication Services–0.75% | |
T-Mobile US, Inc.(b) | | | 511,781 | | | | 84,019,087 | |
|
| |
Total Common Stocks & Other Equity Interests
(Cost $7,040,889,935) | | | | 10,631,239,611 | |
|
| |
|
Money Market Funds–4.61% | |
Invesco Government & Agency Portfolio, Institutional Class, 5.23%(d)(e) | | | 180,012,256 | | | | 180,012,256 | |
|
| |
Invesco Liquid Assets Portfolio, Institutional Class, 5.34%(d)(e) | | | 128,177,298 | | | | 128,215,751 | |
|
| |
Invesco Treasury Portfolio, Institutional Class, 5.22%(d)(e) | | | 205,728,292 | | | | 205,728,292 | |
|
| |
Total Money Market Funds (Cost $513,954,575) | | | | 513,956,299 | |
|
| |
TOTAL INVESTMENTS IN SECURITIES
(excluding investments purchased with cash collateral from securities on loan)-100.05%
(Cost $7,554,844,510) | | | | 11,145,195,910 | |
|
| |
|
Investments Purchased with Cash Collateral from Securities on Loan | |
Money Market Funds–1.12% | |
Invesco Private Government Fund, 5.29%(d)(e)(f) | | | 36,428,191 | | | | 36,428,191 | |
|
| |
Invesco Private Prime Fund, 5.46%(d)(e)(f) | | | 87,947,200 | | | | 87,973,584 | |
|
| |
Total Investments Purchased with Cash Collateral from Securities on Loan (Cost $124,406,649) | | | | 124,401,775 | |
|
| |
TOTAL INVESTMENTS IN SECURITIES–101.17%
(Cost $7,679,251,159) | | | | 11,269,597,685 | |
|
| |
OTHER ASSETS LESS LIABILITIES–(1.17)% | | | | (129,988,638 | ) |
|
| |
NET ASSETS–100.00% | | | $ | 11,139,609,047 | |
|
| |
See accompanying Notes to Financial Statements which are an integral part of the financial statements.
Notes to Schedule of Investments:
| (a) | Industry and/or sector classifications used in this report are generally according to the Global Industry Classification Standard, which was developed by and is the exclusive property and a service mark of MSCI Inc. and Standard & Poor’s. |
| (b) | All or a portion of this security was out on loan at April 30, 2024. |
| (c) | Non-income producing security. |
| (d) | Affiliated holding. Affiliated holdings are investments in entities which are under common ownership or control of Invesco Ltd. or are investments in entities in which the Fund owns 5% or more of the outstanding voting securities. The table below shows the Fund’s transactions in, and earnings from, its investments in affiliates for the fiscal year ended April 30, 2024. |
| | | | | | | | | | | | | | | | | | | | | | | | | | | | |
| | | Value
April 30, 2023 | | | Purchases
at Cost | | | Proceeds
from Sales | | | Change in
Unrealized
Appreciation
(Depreciation) | | Realized
Gain
(Loss) | | | Value
April 30, 2024 | | | Dividend Income |
| |
| Investments in Affiliated Money Market Funds: | | | | | | | | | | | | | | | | | | | | | | | | | | | | |
| |
Invesco Government & Agency Portfolio, Institutional Class | | $ | 140,569,059 | | | $ | 502,431,656 | | | $ | (462,988,459 | ) | | | $ - | | | $ | - | | | $ | 180,012,256 | | | | $ 5,213,924 | |
| |
Invesco Liquid Assets Portfolio, Institutional Class | | | 100,056,598 | | | | 358,879,755 | | | | (330,706,044 | ) | | | (48,887 | ) | | | 34,329 | | | | 128,215,751 | | | | 3,781,406 | |
| |
Invesco Treasury Portfolio, Institutional Class | | | 160,650,353 | | | | 574,207,607 | | | | (529,129,668 | ) | | | - | | | | - | | | | 205,728,292 | | | | 5,916,967 | |
| |
| Investments Purchased with Cash Collateral from Securities on Loan: | | | | | | | | | | | | | | | | | | | | | | | | | | | | |
| |
Invesco Private Government Fund | | | 29,449,199 | | | | 761,533,853 | | | | (754,554,861 | ) | | | - | | | | - | | | | 36,428,191 | | | | 1,423,099* | |
| |
Invesco Private Prime Fund | | | 68,502,855 | | | | 1,748,925,235 | | | | (1,729,448,415 | ) | | | (4,874 | ) | | | (1,217 | ) | | | 87,973,584 | | | | 3,806,247* | |
| |
Total | | $ | 499,228,064 | | | $ | 3,945,978,106 | | | $ | (3,806,827,447 | ) | | | $(53,761 | ) | | $ | 33,112 | | | $ | 638,358,074 | | | | $20,141,643 | |
| |
| | * | Represents the income earned on the investment of cash collateral, which is included in securities lending income on the Statement of Operations. Does not include rebates and fees paid to lending agent or premiums received from borrowers, if any. |
| (e) | The rate shown is the 7-day SEC standardized yield as of April 30, 2024. |
| (f) | The security has been segregated to satisfy the commitment to return the cash collateral received in securities lending transactions upon the borrower’s return of the securities loaned. See Note 1J. |
| | | | | | | | | | | | |
| Open Forward Foreign Currency Contracts |
| | | | | | | | Unrealized |
| Settlement | | | | Contract to | | | Appreciation |
| | | | | | | | |
| Date | | Counterparty | | Deliver | | | Receive | | | (Depreciation) |
Currency Risk | | | | | | | | | | |
|
| 05/17/2024 | | Deutsche Bank AG | | EUR | 5,036,370 | | | USD | 5,392,488 | | | $ 14,700 |
|
| 05/17/2024 | | Royal Bank of Canada | | CAD | 165,695,726 | | | USD | 120,820,967 | | | 429,550 |
|
| 05/17/2024 | | Royal Bank of Canada | | EUR | 2,228,512 | | | USD | 2,387,073 | | | 7,489 |
|
| 05/17/2024 | | Royal Bank of Canada | | GBP | 3,352,334 | | | USD | 4,192,905 | | | 3,686 |
|
Subtotal–Appreciation | | | | | | | | | | 455,425 |
|
| | | |
Currency Risk | | | | | | | | | | |
|
| 05/17/2024 | | Goldman Sachs International | | GBP | 4,004,014 | | | USD | 5,002,935 | | | (650) |
|
| 05/17/2024 | | Royal Bank of Canada | | EUR | 80,566,276 | | | USD | 85,867,860 | | | (160,053) |
|
| 05/17/2024 | | Royal Bank of Canada | | GBP | 103,107,278 | | | USD | 127,276,814 | | | (1,570,404) |
|
| 05/17/2024 | | Royal Bank of Canada | | USD | 2,265,284 | | | EUR | 2,109,007 | | | (13,306) |
|
Subtotal–Depreciation | | | | | | | | | | (1,744,413) |
|
Total Forward Foreign Currency Contracts | | | | | | | | | | $(1,288,988) |
|
Abbreviations:
CAD – Canadian Dollar
EUR – Euro
GBP – British Pound Sterling
USD – U.S. Dollar
See accompanying Notes to Financial Statements which are an integral part of the financial statements.
Statement of Assets and Liabilities
April 30, 2024
| | | | |
Assets: | | | | |
| |
Investments in unaffiliated securities, at value (Cost $7,040,889,935)* | | $ | 10,631,239,611 | |
|
| |
Investments in affiliated money market funds, at value
(Cost $638,361,224) | | | 638,358,074 | |
| |
Other investments: | | | | |
Unrealized appreciation on forward foreign currency contracts outstanding | | | 455,425 | |
|
| |
Foreign currencies, at value (Cost $497) | | | 492 | |
|
| |
Receivable for: | | | | |
Investments sold | | | 6,681,821 | |
|
| |
Fund shares sold | | | 6,288,138 | |
|
| |
Dividends | | | 10,682,286 | |
|
| |
Investment for trustee deferred compensation and retirement plans | | | 697,497 | |
|
| |
Other assets | | | 124,827 | |
|
| |
Total assets | | | 11,294,528,171 | |
|
| |
| |
Liabilities: | | | | |
| |
Other investments: | | | | |
Unrealized depreciation on forward foreign currency contracts outstanding | | | 1,744,413 | |
|
| |
Payable for: | | | | |
Investments purchased | | | 12,259,392 | |
|
| |
Fund shares reacquired | | | 10,832,187 | |
|
| |
Collateral upon return of securities loaned | | | 124,406,649 | |
|
| |
Accrued fees to affiliates | | | 4,627,944 | |
|
| |
Accrued other operating expenses | | | 283,126 | |
|
| |
Trustee deferred compensation and retirement plans | | | 765,413 | |
|
| |
Total liabilities | | | 154,919,124 | |
|
| |
Net assets applicable to shares outstanding | | $ | 11,139,609,047 | |
|
| |
| |
Net assets consist of: | | | | |
Shares of beneficial interest | | $ | 7,149,456,882 | |
|
| |
Distributable earnings | | | 3,990,152,165 | |
|
| |
| | $ | 11,139,609,047 | |
|
| |
| | | | |
Net Assets: | | | | |
Class A | | $ | 6,478,638,616 | |
|
| |
Class C | | $ | 98,086,818 | |
|
| |
Class R | | $ | 138,767,400 | |
|
| |
Class Y | | $ | 2,223,285,732 | |
|
| |
Class R5 | | $ | 409,991,012 | |
|
| |
Class R6 | | $ | 1,790,839,469 | |
|
| |
|
Shares outstanding, no par value, with an unlimited number of shares authorized: | |
Class A | | | 224,891,595 | |
|
| |
Class C | | | 3,402,904 | |
|
| |
Class R | | | 4,815,035 | |
|
| |
Class Y | | | 77,190,992 | |
|
| |
Class R5 | | | 14,251,724 | |
|
| |
Class R6 | | | 62,285,073 | |
|
| |
Class A: | | | | |
Net asset value per share | | $ | 28.81 | |
|
| |
Maximum offering price per share
(Net asset value of $28.81 ÷ 94.50%) | | $ | 30.49 | |
|
| |
Class C: | | | | |
Net asset value and offering price per share | | $ | 28.82 | |
|
| |
Class R: | | | | |
Net asset value and offering price per share | | $ | 28.82 | |
|
| |
Class Y: | | | | |
Net asset value and offering price per share | | $ | 28.80 | |
|
| |
Class R5: | | | | |
Net asset value and offering price per share | | $ | 28.77 | |
|
| |
Class R6: | | | | |
Net asset value and offering price per share | | $ | 28.75 | |
|
| |
| * | At April 30, 2024, securities with an aggregate value of $120,666,523 were on loan to brokers. |
See accompanying Notes to Financial Statements which are an integral part of the financial statements.
Statement of Operations
For the year ended April 30, 2024
| | | | |
Investment income: | | | | |
Interest | | $ | 370,854 | |
|
| |
Dividends (net of foreign withholding taxes of $2,839,589) | | | 246,833,446 | |
|
| |
Dividends from affiliated money market funds (includes net securities lending income of $488,715) | | | 15,401,012 | |
|
| |
Foreign withholding tax claims | | | 1,560,482 | |
|
| |
Total investment income | | | 264,165,794 | |
|
| |
| |
Expenses: | | | | |
Advisory fees | | | 39,101,549 | |
|
| |
Administrative services fees | | | 1,462,048 | |
|
| |
Custodian fees | | | 147,881 | |
|
| |
Distribution fees: | | | | |
Class A | | | 15,368,569 | |
|
| |
Class C | | | 957,861 | |
|
| |
Class R | | | 660,066 | |
|
| |
Transfer agent fees – A, C, R and Y | | | 11,908,318 | |
|
| |
Transfer agent fees – R5 | | | 387,977 | |
|
| |
Transfer agent fees – R6 | | | 492,526 | |
|
| |
Trustees’ and officers’ fees and benefits | | | 125,748 | |
|
| |
Registration and filing fees | | | 354,249 | |
|
| |
Reports to shareholders | | | 1,441,616 | |
|
| |
Professional services fees | | | 137,244 | |
|
| |
Other | | | 122,543 | |
|
| |
Total expenses | | | 72,668,195 | |
|
| |
Less: Fees waived and/or expense offset arrangement(s) | | | (372,018 | ) |
|
| |
Net expenses | | | 72,296,177 | |
|
| |
Net investment income | | | 191,869,617 | |
|
| |
| |
Realized and unrealized gain (loss) from: | | | | |
Net realized gain from: | | | | |
Unaffiliated investment securities | | | 846,498,876 | |
|
| |
Affiliated investment securities | | | 33,112 | |
|
| |
Foreign currencies | | | 762,721 | |
|
| |
Forward foreign currency contracts | | | 11,673,881 | |
|
| |
| | | 858,968,590 | |
|
| |
Change in net unrealized appreciation (depreciation) of: | | | | |
Unaffiliated investment securities | | | 611,617,669 | |
|
| |
Affiliated investment securities | | | (53,761 | ) |
|
| |
Foreign currencies | | | (50,521 | ) |
|
| |
Forward foreign currency contracts | | | (1,384,355 | ) |
|
| |
| | | 610,129,032 | |
|
| |
Net realized and unrealized gain | | | 1,469,097,622 | |
|
| |
Net increase in net assets resulting from operations | | $ | 1,660,967,239 | |
|
| |
See accompanying Notes to Financial Statements which are an integral part of the financial statements.
Statement of Changes in Net Assets
For the years ended April 30, 2024 and 2023
| | | | | | | | |
| | | 2024 | | | 2023 | |
|
| |
Operations: | | | | | | | | |
| | |
Net investment income | | $ | 191,869,617 | | | $ | 184,778,077 | |
|
| |
Net realized gain | | | 858,968,590 | | | | 714,979,975 | |
|
| |
Change in net unrealized appreciation (depreciation) | | | 610,129,032 | | | | (548,753,335 | ) |
|
| |
Net increase in net assets resulting from operations | | | 1,660,967,239 | | | | 351,004,717 | |
|
| |
| | |
Distributions to shareholders from distributable earnings: | | | | | | | | |
| | |
Class A | | | (501,274,753 | ) | | | (717,802,335 | ) |
|
| |
Class C | | | (7,051,805 | ) | | | (11,193,908 | ) |
|
| |
Class R | | | (10,314,743 | ) | | | (15,359,958 | ) |
|
| |
Class Y | | | (161,698,544 | ) | | | (203,571,979 | ) |
|
| |
Class R5 | | | (32,180,601 | ) | | | (47,541,834 | ) |
|
| |
Class R6 | | | (140,513,004 | ) | | | (180,493,564 | ) |
|
| |
Total distributions from distributable earnings | | | (853,033,450 | ) | | | (1,175,963,578 | ) |
|
| |
| | |
Share transactions-net: | | | | | | | | |
| | |
Class A | | | (26,631,236 | ) | | | 453,340,136 | |
|
| |
Class C | | | (7,991,448 | ) | | | 13,456,075 | |
|
| |
Class R | | | (5,252,982 | ) | | | 11,182,732 | |
|
| |
Class Y | | | 328,395,376 | | | | 297,608,254 | |
|
| |
Class R5 | | | (11,265,938 | ) | | | 15,548,187 | |
|
| |
Class R6 | | | 99,406,262 | | | | 247,465,077 | |
|
| |
Net increase in net assets resulting from share transactions | | | 376,660,034 | | | | 1,038,600,461 | |
|
| |
Net increase in net assets | | | 1,184,593,823 | | | | 213,641,600 | |
|
| |
| | |
Net assets: | | | | | | | | |
| | |
Beginning of year | | | 9,955,015,224 | | | | 9,741,373,624 | |
|
| |
| | |
End of year | | $ | 11,139,609,047 | | | $ | 9,955,015,224 | |
|
| |
See accompanying Notes to Financial Statements which are an integral part of the financial statements.
Financial Highlights
The following schedule presents financial highlights for a share of the Fund outstanding throughout the periods indicated.
| | | | | | | | | | | | | | | | | | | | | | | | | | | | | | | | | | | | | | | | | | | | | | | | | | | | | | | | |
| | | Net asset
value,
beginning
of period | | | Net
investment
income(a) | | | Net gains
(losses)
on securities
(both
realized and
unrealized) | | | Total from
investment
operations | | | Dividends
from net
investment
income | | | Distributions
from net
realized
gains | | | Total
distributions | | | Net asset
value, end
of period | | | Total
return(b) | | | Net assets,
end of period
(000’s omitted) | | | Ratio of
expenses
to average
net assets
with
fee waivers
and/or
expenses
absorbed | | | Ratio of
expenses
to average net
assets without
fee waivers
and/or
expenses
absorbed | | | Ratio of net
investment
income to
average
net assets | | | Portfolio
turnover (c) | |
Class A | | | | | | | | | | | | | | | | | | | | | | | | | | | | | | | | | | | | | | | | | | | | | | | | | | | | | | | | |
Year ended 04/30/24 | | | $26.71 | | | | $0.48 | | | | $ 3.92 | | | | $ 4.40 | | | | $(0.47 | ) | | | $(1.83 | ) | | | $(2.30 | ) | | | $28.81 | | | | 17.20 | % | | | $6,478,639 | | | | 0.81 | % | | | 0.81 | % | | | 1.75 | % | | | 18 | % |
Year ended 04/30/23 | | | 29.17 | | | | 0.50 | | | | 0.50 | | | | 1.00 | | | | (0.52 | ) | | | (2.94 | ) | | | (3.46 | ) | | | 26.71 | | | | 3.54 | | | | 6,023,409 | | | | 0.81 | | | | 0.81 | | | | 1.79 | | | | 21 | |
Year ended 04/30/22 | | | 29.09 | | | | 0.46 | | | | 2.19 | | | | 2.65 | | | | (0.42 | ) | | | (2.15 | ) | | | (2.57 | ) | | | 29.17 | | | | 9.29 | | | | 6,077,682 | | | | 0.80 | | | | 0.80 | | | | 1.52 | | | | 20 | |
Year ended 04/30/21 | | | 18.95 | | | | 0.40 | | | | 10.24 | | | | 10.64 | | | | (0.50 | ) | | | – | | | | (0.50 | ) | | | 29.09 | | | | 56.89 | | | | 5,900,704 | | | | 0.82 | | | | 0.82 | | | | 1.74 | | | | 19 | |
Year ended 04/30/20 | | | 25.18 | | | | 0.51 | | | | (4.88 | ) | | | (4.37 | ) | | | (0.52 | ) | | | (1.34 | ) | | | (1.86 | ) | | | 18.95 | | | | (18.76 | ) | | | 4,512,553 | | | | 0.82 | | | | 0.83 | | | | 2.16 | | | | 30 | |
Class C | | | | | | | | | | | | | | | | | | | | | | | | | | | | | | | | | | | | | | | | | | | | | | | | | | | | | | | | |
Year ended 04/30/24 | | | 26.74 | | | | 0.28 | | | | 3.91 | | | | 4.19 | | | | (0.28 | ) | | | (1.83 | ) | | | (2.11 | ) | | | 28.82 | | | | 16.30 | | | | 98,087 | | | | 1.56 | | | | 1.56 | | | | 1.00 | | | | 18 | |
Year ended 04/30/23 | | | 29.18 | | | | 0.29 | | | | 0.51 | | | | 0.80 | | | | (0.30 | ) | | | (2.94 | ) | | | (3.24 | ) | | | 26.74 | | | | 2.78 | | | | 98,735 | | | | 1.56 | | | | 1.56 | | | | 1.04 | | | | 21 | |
Year ended 04/30/22 | | | 29.10 | | | | 0.23 | | | | 2.19 | | | | 2.42 | | | | (0.19 | ) | | | (2.15 | ) | | | (2.34 | ) | | | 29.18 | | | | 8.46 | | | | 93,877 | | | | 1.55 | | | | 1.55 | | | | 0.77 | | | | 20 | |
Year ended 04/30/21 | | | 18.95 | | | | 0.23 | | | | 10.25 | | | | 10.48 | | | | (0.33 | ) | | | – | | | | (0.33 | ) | | | 29.10 | | | | 55.82 | (d) | | | 91,597 | | | | 1.56 | (d) | | | 1.56 | (d) | | | 1.00 | (d) | | | 19 | |
Year ended 04/30/20 | | | 25.16 | | | | 0.35 | | | | (4.87 | ) | | | (4.52 | ) | | | (0.35 | ) | | | (1.34 | ) | | | (1.69 | ) | | | 18.95 | | | | (19.32 | )(d) | | | 96,492 | | | | 1.49 | (d) | | | 1.50 | (d) | | | 1.49 | (d) | | | 30 | |
Class R | | | | | | | | | | | | | | | | | | | | | | | | | | | | | | | | | | | | | | | | | | | | | | | | | | | | | | | | |
Year ended 04/30/24 | | | 26.72 | | | | 0.41 | | | | 3.92 | | | | 4.33 | | | | (0.40 | ) | | | (1.83 | ) | | | (2.23 | ) | | | 28.82 | | | | 16.91 | | | | 138,767 | | | | 1.06 | | | | 1.06 | | | | 1.50 | | | | 18 | |
Year ended 04/30/23 | | | 29.17 | | | | 0.43 | | | | 0.51 | | | | 0.94 | | | | (0.45 | ) | | | (2.94 | ) | | | (3.39 | ) | | | 26.72 | | | | 3.30 | | | | 133,624 | | | | 1.06 | | | | 1.06 | | | | 1.54 | | | | 21 | |
Year ended 04/30/22 | | | 29.09 | | | | 0.39 | | | | 2.18 | | | | 2.57 | | | | (0.34 | ) | | | (2.15 | ) | | | (2.49 | ) | | | 29.17 | | | | 9.01 | | | | 133,669 | | | | 1.05 | | | | 1.05 | | | | 1.27 | | | | 20 | |
Year ended 04/30/21 | | | 18.95 | | | | 0.34 | | | | 10.24 | | | | 10.58 | | | | (0.44 | ) | | | – | | | | (0.44 | ) | | | 29.09 | | | | 56.50 | | | | 139,451 | | | | 1.07 | | | | 1.07 | | | | 1.49 | | | | 19 | |
Year ended 04/30/20 | | | 25.17 | | | | 0.45 | | | | (4.87 | ) | | | (4.42 | ) | | | (0.46 | ) | | | (1.34 | ) | | | (1.80 | ) | | | 18.95 | | | | (18.95 | ) | | | 133,186 | | | | 1.07 | | | | 1.08 | | | | 1.91 | | | | 30 | |
Class Y | | | | | | | | | | | | | | | | | | | | | | | | | | | | | | | | | | | | | | | | | | | | | | | | | | | | | | | | |
Year ended 04/30/24 | | | 26.71 | | | | 0.55 | | | | 3.91 | | | | 4.46 | | | | (0.54 | ) | | | (1.83 | ) | | | (2.37 | ) | | | 28.80 | | | | 17.46 | | | | 2,223,286 | | | | 0.56 | | | | 0.56 | | | | 2.00 | | | | 18 | |
Year ended 04/30/23 | | | 29.17 | | | | 0.57 | | | | 0.50 | | | | 1.07 | | | | (0.59 | ) | | | (2.94 | ) | | | (3.53 | ) | | | 26.71 | | | | 3.81 | | | | 1,744,439 | | | | 0.56 | | | | 0.56 | | | | 2.04 | | | | 21 | |
Year ended 04/30/22 | | | 29.09 | | | | 0.54 | | | | 2.19 | | | | 2.73 | | | | (0.50 | ) | | | (2.15 | ) | | | (2.65 | ) | | | 29.17 | | | | 9.57 | | | | 1,589,325 | | | | 0.55 | | | | 0.55 | | | | 1.77 | | | | 20 | |
Year ended 04/30/21 | | | 18.95 | | | | 0.45 | | | | 10.25 | | | | 10.70 | | | | (0.56 | ) | | | – | | | | (0.56 | ) | | | 29.09 | | | | 57.28 | | | | 1,511,312 | | | | 0.57 | | | | 0.57 | | | | 1.99 | | | | 19 | |
Year ended 04/30/20 | | | 25.18 | | | | 0.57 | | | | (4.88 | ) | | | (4.31 | ) | | | (0.58 | ) | | | (1.34 | ) | | | (1.92 | ) | | | 18.95 | | | | (18.54 | ) | | | 1,179,055 | | | | 0.57 | | | | 0.58 | | | | 2.41 | | | | 30 | |
Class R5 | | | | | | | | | | | | | | | | | | | | | | | | | | | | | | | | | | | | | | | | | | | | | | | | | | | | | | | | |
Year ended 04/30/24 | | | 26.68 | | | | 0.56 | | | | 3.91 | | | | 4.47 | | | | (0.55 | ) | | | (1.83 | ) | | | (2.38 | ) | | | 28.77 | | | | 17.52 | | | | 409,991 | | | | 0.52 | | | | 0.52 | | | | 2.04 | | | | 18 | |
Year ended 04/30/23 | | | 29.14 | | | | 0.58 | | | | 0.50 | | | | 1.08 | | | | (0.60 | ) | | | (2.94 | ) | | | (3.54 | ) | | | 26.68 | | | | 3.88 | | | | 390,922 | | | | 0.51 | | | | 0.51 | | | | 2.09 | | | | 21 | |
Year ended 04/30/22 | | | 29.06 | | | | 0.55 | | | | 2.19 | | | | 2.74 | | | | (0.51 | ) | | | (2.15 | ) | | | (2.66 | ) | | | 29.14 | | | | 9.63 | | | | 408,406 | | | | 0.50 | | | | 0.50 | | | | 1.82 | | | | 20 | |
Year ended 04/30/21 | | | 18.93 | | | | 0.47 | | | | 10.23 | | | | 10.70 | | | | (0.57 | ) | | | – | | | | (0.57 | ) | | | 29.06 | | | | 57.39 | | | | 529,916 | | | | 0.50 | | | | 0.50 | | | | 2.06 | | | | 19 | |
Year ended 04/30/20 | | | 25.16 | | | | 0.58 | | | | (4.87 | ) | | | (4.29 | ) | | | (0.60 | ) | | | (1.34 | ) | | | (1.94 | ) | | | 18.93 | | | | (18.50 | ) | | | 440,298 | | | | 0.50 | | | | 0.51 | | | | 2.48 | | | | 30 | |
Class R6 | | | | | | | | | | | | | | | | | | | | | | | | | | | | | | | | | | | | | | | | | | | | | | | | | | | | | | | | |
Year ended 04/30/24 | | | 26.66 | | | | 0.58 | | | | 3.91 | | | | 4.49 | | | | (0.57 | ) | | | (1.83 | ) | | | (2.40 | ) | | | 28.75 | | | | 17.61 | | | | 1,790,839 | | | | 0.45 | | | | 0.45 | | | | 2.11 | | | | 18 | |
Year ended 04/30/23 | | | 29.13 | | | | 0.60 | | | | 0.49 | | | | 1.09 | | | | (0.62 | ) | | | (2.94 | ) | | | (3.56 | ) | | | 26.66 | | | | 3.91 | | | | 1,563,887 | | | | 0.44 | | | | 0.44 | | | | 2.16 | | | | 21 | |
Year ended 04/30/22 | | | 29.05 | | | | 0.57 | | | | 2.19 | | | | 2.76 | | | | (0.53 | ) | | | (2.15 | ) | | | (2.68 | ) | | | 29.13 | | | | 9.72 | | | | 1,438,415 | | | | 0.43 | | | | 0.43 | | | | 1.89 | | | | 20 | |
Year ended 04/30/21 | | | 18.92 | | | | 0.48 | | | | 10.24 | | | | 10.72 | | | | (0.59 | ) | | | – | | | | (0.59 | ) | | | 29.05 | | | | 57.56 | | | | 1,538,111 | | | | 0.42 | | | | 0.42 | | | | 2.14 | | | | 19 | |
Year ended 04/30/20 | | | 25.16 | | | | 0.60 | | | | (4.88 | ) | | | (4.28 | ) | | | (0.62 | ) | | | (1.34 | ) | | | (1.96 | ) | | | 18.92 | | | | (18.46 | ) | | | 2,268,887 | | | | 0.41 | | | | 0.42 | | | | 2.57 | | | | 30 | |
| (a) | Calculated using average shares outstanding. |
| (b) | Includes adjustments in accordance with accounting principles generally accepted in the United States of America and as such, the net asset value for financial reporting purposes and the returns based upon those net asset values may differ from the net asset value and returns for shareholder transactions. Does not include sales charges and is not annualized for periods less than one year, if applicable. |
| (c) | Portfolio turnover is calculated at the fund level and is not annualized for periods less than one year, if applicable. |
| (d) | The total return, ratio of expenses to average net assets and ratio of net investment income (loss) to average net assets reflect actual 12b-1 fees of 0.99% and 0.92% for the years ended April 30, 2021 and 2020, respectively. |
See accompanying Notes to Financial Statements which are an integral part of the financial statements.
Notes to Financial Statements
April 30, 2024
NOTE 1–Significant Accounting Policies
Invesco Comstock Fund (the “Fund”) is a series portfolio of AIM Sector Funds (Invesco Sector Funds) (the “Trust”). The Trust is a Delaware statutory trust registered under the Investment Company Act of 1940, as amended (the “1940 Act”), as an open-end series management investment company authorized to issue an unlimited number of shares of beneficial interest. Information presented in these financial statements pertains only to the Fund. Matters affecting the Fund or each class will be voted on exclusively by the shareholders of the Fund or each class.
The Fund’s investment objective is total return through growth of capital and current income.
The Fund currently consists of six different classes of shares: Class A, Class C, Class R, Class Y, Class R5 and Class R6. Class Y shares are available only to certain investors. Class A shares are sold with a front-end sales charge unless certain waiver criteria are met. Under certain circumstances, load waived shares may be subject to contingent deferred sales charges (“CDSC”). Class C shares are sold with a CDSC. Class R, Class Y, Class R5 and Class R6 shares are sold at net asset value. Class C shares held for eight years after purchase are eligible for automatic conversion into Class A shares of the same Fund (the “Conversion Feature”). The automatic conversion pursuant to the Conversion Feature will generally occur at the end of the month following the eighth anniversary after a purchase of Class C shares.
The Fund is an investment company and accordingly follows the investment company accounting and reporting guidance in accordance with Financial Accounting Standards Board Accounting Standards Codification Topic 946, Financial Services – Investment Companies.
The following is a summary of the significant accounting policies followed by the Fund in the preparation of its financial statements.
| A. | Security Valuations – Securities, including restricted securities, are valued according to the following policy. |
A security listed or traded on an exchange is generally valued at its trade price or official closing price that day as of the close of the exchange where the security is principally traded, or lacking any trades or official closing price on a particular day, the security may be valued at the closing bid or ask price on that day. Securities traded in the over-the-counter market are valued based on prices furnished by independent pricing services or market makers. When such securities are valued using prices provided by an independent pricing service they may be considered fair valued. Futures contracts are valued at the daily settlement price set by an exchange on which they are principally traded. Where a final settlement price exists, exchange-traded options are valued at the final settlement price from the exchange where the option principally trades. Where a final settlement price does not exist, exchange-traded options are valued at the mean between the last bid and ask price generally from the exchange where the option principally trades.
Securities of investment companies that are not exchange-traded (e.g., open-end mutual funds) are valued using such company’s end-of-business-day net asset value per share.
Deposits, other obligations of U.S. and non-U.S. banks and financial institutions are valued at their daily account value.
Fixed income securities (including convertible debt securities) generally are valued on the basis of prices provided by independent pricing services. Prices provided by the pricing service may be determined without exclusive reliance on quoted prices, and may reflect appropriate factors such as institution-size trading in similar groups of securities, developments related to specific securities, dividend rate (for unlisted equities), yield (for debt obligations), quality, type of issue, coupon rate (for debt obligations), maturity (for debt obligations), individual trading characteristics and other market data. Pricing services generally value debt obligations assuming orderly transactions of institutional round lot size, but a fund may hold or transact in the same securities in smaller, odd lot sizes. Odd lots often trade at lower prices than institutional round lots, and their value may be adjusted accordingly. Debt obligations are subject to interest rate and credit risks. In addition, all debt obligations involve some risk of default with respect to interest and/or principal payments.
Foreign securities’ (including foreign exchange contracts) prices are converted into U.S. dollar amounts using the applicable exchange rates as of the close of the New York Stock Exchange (“NYSE”). If market quotations are available and reliable for foreign exchange-traded equity securities, the securities will be valued at the market quotations. Invesco Advisers, Inc. (the “Adviser” or “Invesco”) may use various pricing services to obtain market quotations as well as fair value prices. Because trading hours for certain foreign securities end before the close of the NYSE, closing market quotations may become not representative of market value in the Adviser’s judgment (“unreliable”). If, between the time trading ends on a particular security and the close of the customary trading session on the NYSE, a significant event occurs that makes the closing price of the security unreliable, the Adviser may fair value the security. If the event is likely to have affected the closing price of the security, the security will be valued at fair value in good faith in accordance with Board- approved policies and related Adviser procedures (“Valuation Procedures”). Adjustments to closing prices to reflect fair value may also be based on a screening process of an independent pricing service to indicate the degree of certainty, based on historical data, that the closing price in the principal market where a foreign security trades is not the current value as of the close of the NYSE. Foreign securities’ prices meeting the degree of certainty that the price is not reflective of current value will be priced at the indication of fair value from the independent pricing service. Multiple factors may be considered by the independent pricing service in determining adjustments to reflect fair value and may include information relating to sector indices, American Depositary Receipts and domestic and foreign index futures. Foreign securities may have additional risks including exchange rate changes, potential for sharply devalued currencies and high inflation, political and economic upheaval, the relative lack of issuer information, relatively low market liquidity and the potential lack of strict financial and accounting controls and standards.
Unlisted securities will be valued using prices provided by independent pricing services or by another method that the Adviser, in its judgment, believes better reflects the security’s fair value in accordance with the Valuation Procedures.
Non-traded rights and warrants shall be valued at intrinsic value if the terms of the rights and warrants are available, specifically the subscription or exercise price and the ratio. Intrinsic value is calculated as the daily market closing price of the security to be received less the subscription price, which is then adjusted by the exercise ratio. In the case of warrants, an option pricing model supplied by an independent pricing service may be used based on market data such as volatility, stock price and interest rate from the independent pricing service and strike price and exercise period from verified terms.
Securities for which market prices are not provided by any of the above methods may be valued based upon quotes furnished by independent sources. The mean between the last bid and ask prices may be used to value debt obligations, including corporate loans.
Securities for which market quotations are not readily available are fair valued by the Adviser in accordance with the Valuation Procedures. If a fair value price provided by a pricing service is unreliable, the Adviser will fair value the security using the Valuation Procedures. Issuer specific events, market trends, bid/ask quotes of brokers and information providers and other market data may be reviewed in the course of making a good faith determination of a security’s fair value.
The Fund may invest in securities that are subject to interest rate risk, meaning the risk that the prices will generally fall as interest rates rise and, conversely, the prices will generally rise as interest rates fall. Specific securities differ in their sensitivity to changes in interest rates depending on their individual characteristics. Changes in interest rates may result in increased market volatility, which may affect the value and/or liquidity of certain Fund investments.
Valuations change in response to many factors including the historical and prospective earnings of the issuer, the value of the issuer’s assets, general market conditions which are not specifically related to the particular issuer, such as real or perceived adverse economic conditions, changes in the general outlook for revenues or corporate earnings, changes in interest or currency rates, regional or global instability, natural or environmental disasters, widespread disease or other public health issues, war, acts of terrorism, significant governmental actions or adverse investor sentiment generally and market liquidity. Because of the inherent uncertainties of valuation, the values reflected in the financial statements may materially differ from the value received upon actual sale of those investments.
The price the Fund could receive upon the sale of any investment may differ from the Adviser’s valuation of the investment, particularly for securities that are valued using a fair valuation technique. When fair valuation techniques are applied, the Adviser uses available information, including both observable and
| | unobservable inputs and assumptions, to determine a methodology that will result in a valuation that the Adviser believes approximates market value. Fund securities that are fair valued may be subject to greater fluctuation in their value from one day to the next than would be the case if market quotations were used. Because of the inherent uncertainties of valuation, and the degree of subjectivity in such decisions, the Fund could realize a greater or lesser than expected gain or loss upon the sale of the investment. |
| B. | Securities Transactions and Investment Income – Securities transactions are accounted for on a trade date basis. Realized gains or losses on sales are computed on the basis of specific identification of the securities sold. Interest income (net of withholding tax, if any) is recorded on an accrual basis from settlement date and includes coupon interest and amortization of premium and accretion of discount on debt securities as applicable. Pay-in-kind interest income and non-cash dividend income received in the form of securities in lieu of cash are recorded at the fair value of the securities received. Dividend income (net of withholding tax, if any) is recorded on the ex-dividend date. |
The Fund may periodically participate in litigation related to Fund investments. As such, the Fund may receive proceeds from litigation settlements. Any proceeds received are included in the Statement of Operations as realized gain (loss) for investments no longer held and as unrealized gain (loss) for investments still held.
Brokerage commissions and mark ups are considered transaction costs and are recorded as an increase to the cost basis of securities purchased and/or a reduction of proceeds on a sale of securities. Such transaction costs are included in the determination of net realized and unrealized gain (loss) from investment securities reported in the Statement of Operations and the Statement of Changes in Net Assets and the net realized and unrealized gains (losses) on securities per share in the Financial Highlights. Transaction costs are included in the calculation of the Fund’s net asset value and, accordingly, they reduce the Fund’s total returns. These transaction costs are not considered operating expenses and are not reflected in net investment income reported in the Statement of Operations and the Statement of Changes in Net Assets, or the net investment income per share and the ratios of expenses and net investment income reported in the Financial Highlights, nor are they limited by any expense limitation arrangements between the Fund and the investment adviser.
The Fund allocates income and realized and unrealized capital gains and losses to a class based on the relative net assets of each class.
| C. | Country Determination – For the purposes of making investment selection decisions and presentation in the Schedule of Investments, the investment adviser may determine the country in which an issuer is located and/or credit risk exposure based on various factors. These factors include the laws of the country under which the issuer is organized, where the issuer maintains a principal office, the country in which the issuer derives 50% or more of its total revenues, the country that has the primary market for the issuer’s securities and its “country of risk” as determined by a third party service provider, as well as other criteria. Among the other criteria that may be evaluated for making this determination are the country in which the issuer maintains 50% or more of its assets, the type of security, financial guarantees and enhancements, the nature of the collateral and the sponsor organization. Country of issuer and/or credit risk exposure has been determined to be the United States of America, unless otherwise noted. |
| D. | Distributions – Distributions from net investment income, if any, are declared and paid quarterly and are recorded on the ex-dividend date. Distributions from net realized capital gain, if any, are generally declared and paid annually and recorded on the ex-dividend date. The Fund may elect to treat a portion of the proceeds from redemptions as distributions for federal income tax purposes. |
| E. | Federal Income Taxes – The Fund intends to comply with the requirements of Subchapter M of the Internal Revenue Code of 1986, as amended (the “Internal Revenue Code”), necessary to qualify as a regulated investment company and to distribute substantially all of the Fund’s taxable earnings to shareholders. As such, the Fund will not be subject to federal income taxes on otherwise taxable income (including net realized capital gain) that is distributed to shareholders. Therefore, no provision for federal income taxes is recorded in the financial statements. |
The Fund recognizes the tax benefits of uncertain tax positions only when the position is more likely than not to be sustained. Management has analyzed the Fund’s uncertain tax positions and concluded that no liability for unrecognized tax benefits should be recorded related to uncertain tax positions. Management is not aware of any tax positions for which it is reasonably possible that the total amounts of unrecognized tax benefits will change materially in the next 12 months.
The Fund files tax returns in the U.S. Federal jurisdiction and certain other jurisdictions. Generally, the Fund is subject to examinations by such taxing authorities for up to three years after the filing of the return for the tax period.
| F. | Foreign Withholding Taxes – The Fund is subject to foreign withholding tax imposed by certain foreign countries in which the Fund may invest. Withholding taxes are incurred on certain foreign dividends and are accrued at the time the dividend is recognized based on applicable foreign tax laws. The Fund may file withholding tax refunds in certain jurisdictions to seek to recover a portion of amounts previously withheld. The Fund will record a receivable for such tax refunds based on several factors including; an assessment of a jurisdiction’s legal obligation to pay reclaims, administrative practices and payment history. Any receivables recorded will be shown under receivables for Foreign withholding tax claims on the Statement of Assets and Liabilities. There is no guarantee that the Fund will receive refunds applied for in a timely manner or at all. |
As a result of recent court rulings in certain countries across the European Union, tax refunds for previously withheld taxes on dividends earned in those countries have been received by investment companies. Any tax refund payments are reflected as Foreign withholding tax claims in the Statement of Operations, and any related interest is included in Interest income. The Fund may incur fees paid to third party providers that assist in the recovery of the tax reclaims. These fees are reflected on the Statement of Operations as Professional services fees, if any. In the event tax refunds received by the Fund during the fiscal year exceed the foreign withholding taxes paid by the Fund for the year, and the Fund previously passed foreign tax credits on to its shareholders, the Fund intends to enter into a closing agreement with the Internal Revenue Service in order to pay the associated liability on behalf of the Funds’ shareholders. For the year ended April 30, 2024, the Fund did not enter into any closing agreements.
| G. | Expenses – Fees provided for under the Rule 12b-1 plan of a particular class of the Fund are charged to the operations of such class. Transfer agency fees and expenses and other shareholder recordkeeping fees and expenses attributable to Class R5 and Class R6 are allocated based on relative net assets of Class R5 and Class R6. Sub-accounting fees attributable to Class R5 are charged to the operations of the class. Transfer agency fees and expenses and other shareholder recordkeeping fees and expenses relating to all other classes are allocated among those classes based on relative net assets. All other expenses are allocated among the classes based on relative net assets. |
| H. | Accounting Estimates – The preparation of financial statements in conformity with accounting principles generally accepted in the United States of America (“GAAP”) requires management to make estimates and assumptions that affect the reported amounts of assets and liabilities at the date of the financial statements and the reported amounts of revenues and expenses during the reporting period including estimates and assumptions related to taxation. Actual results could differ from those estimates by a significant amount. In addition, the Fund monitors for material events or transactions that may occur or become known after the period-end date and before the date the financial statements are released to print. |
| I. | Indemnifications – Under the Trust’s organizational documents, each Trustee, officer, employee or other agent of the Trust is indemnified against certain liabilities that may arise out of the performance of their duties to the Fund. Additionally, in the normal course of business, the Fund enters into contracts, including the Fund’s servicing agreements, that contain a variety of indemnification clauses. The Fund’s maximum exposure under these arrangements is unknown as this would involve future claims that may be made against the Fund that have not yet occurred. The risk of material loss as a result of such indemnification claims is considered remote. |
| J. | Securities Lending – The Fund may lend portfolio securities having a market value up to one-third of the Fund’s total assets. Such loans are secured by collateral equal to no less than the market value of the loaned securities determined daily by the securities lending provider. Such collateral will be cash or debt securities issued or guaranteed by the U.S. Government or any of its sponsored agencies. Cash collateral received in connection with these loans is invested in short-term money market instruments or affiliated, unregistered investment companies that comply with Rule 2a-7 under the 1940 Act and money market funds (collectively, “affiliated money market funds”) and is shown as such on the Schedule of Investments. The Fund bears the risk of loss with respect to the investment |
of collateral. It is the Fund’s policy to obtain additional collateral from or return excess collateral to the borrower by the end of the next business day, following the valuation date of the securities loaned. Therefore, the value of the collateral held may be temporarily less than the value of the securities on loan. When loaning securities, the Fund retains certain benefits of owning the securities, including the economic equivalent of dividends or interest generated by the security. Lending securities entails a risk of loss to the Fund if, and to the extent that, the market value of the securities loaned were to increase and the borrower did not increase the collateral accordingly, and the borrower failed to return the securities. The securities loaned are subject to termination at the option of the borrower or the Fund. Upon termination, the borrower will return to the Fund the securities loaned and the Fund will return the collateral. Upon the failure of the borrower to return the securities, collateral may be liquidated and the securities may be purchased on the open market to replace the loaned securities. The Fund could experience delays and costs in gaining access to the collateral and the securities may lose value during the delay which could result in potential losses to the Fund. Some of these losses may be indemnified by the lending agent. The Fund bears the risk of any deficiency in the amount of the collateral available for return to the borrower due to any loss on the collateral invested. Dividends received on cash collateral investments for securities lending transactions, which are net of compensation to counterparties, are included in Dividends from affiliated money market funds on the Statement of Operations. The aggregate value of securities out on loan, if any, is shown as a footnote on the Statement of Assets and Liabilities.
The Adviser serves as an affiliated securities lending agent for the Fund. The Bank of New York Mellon also serves as a securities lending agent. To the extent the Fund utilizes the Adviser as an affiliated securities lending agent, the Fund conducts its securities lending in accordance with, and in reliance upon, no-action letters issued by the SEC staff that provide guidance on how an affiliate may act as a direct agent lender and receive compensation for those services in a manner consistent with the federal securities laws. For the year ended April 30, 2024, the Fund paid the Adviser $21,278 in fees for securities lending agent services.
| | Fees paid to the Adviser for securities lending agent services, if any, are included in Dividends from affiliated money market funds on the Statement of Operations. |
| K. | Foreign Currency Translations – Foreign currency is valued at the close of the NYSE based on quotations posted by banks and major currency dealers. Portfolio securities and other assets and liabilities denominated in foreign currencies are translated into U.S. dollar amounts at the date of valuation. Purchases and sales of portfolio securities (net of foreign taxes withheld on disposition) and income items denominated in foreign currencies are translated into U.S. dollar amounts on the respective dates of such transactions. The Fund does not separately account for the portion of the results of operations resulting from changes in foreign exchange rates on investments and the fluctuations arising from changes in market prices of securities held. The combined results of changes in foreign exchange rates and the fluctuation of market prices on investments (net of estimated foreign tax withholding) are included with the net realized and unrealized gain or loss from investments in the Statement of Operations. Reported net realized foreign currency gains or losses arise from (1) sales of foreign currencies, (2) currency gains or losses realized between the trade and settlement dates on securities transactions, and (3) the difference between the amounts of dividends, interest, and foreign withholding taxes recorded on the Fund’s books and the U.S. dollar equivalent of the amounts actually received or paid. Net unrealized foreign currency gains and losses arise from changes in the fair values of assets and liabilities, other than investments in securities at fiscal period end, resulting from changes in exchange rates. |
The Fund may invest in foreign securities, which may be subject to foreign taxes on income, gains on investments or currency repatriation, a portion of which may be recoverable. Foreign taxes, if any, are recorded based on the tax regulations and rates that exist in the foreign markets in which the Fund invests and are shown in the Statement of Operations.
The performance of the Fund may be materially affected positively or negatively by foreign currency strength or weakness relative to the U.S. dollar. Currency rates in foreign countries may fluctuate for a number of reasons, including changes in interest rates, political, economic, or social instability and development, and imposition of currency controls. Currency controls in certain foreign jurisdictions may cause the Fund to experience significant delays in its ability to repatriate its assets in U.S. dollars at quoted spot rates, and it is possible that the Fund’s ability to convert certain foreign currencies into U.S. dollars may be limited and may occur at discounts to quoted rates. As a result, the value of the Fund’s assets and liabilities denominated in such currencies that would ultimately be realized could differ from those reported on the Statement of Assets and Liabilities. Certain foreign companies may be subject to sanctions, embargoes, or other governmental actions that may limit the ability to invest in, receive, hold, or sell the securities of such companies, all of which affect the market and/or credit risk of the investments. Because of the inherent uncertainties of valuation, the values reflected in the financial statements may materially differ from the value received upon actual sale of those investments.
| L. | Forward Foreign Currency Contracts – The Fund may engage in foreign currency transactions either on a spot (i.e. for prompt delivery and settlement) basis, or through forward foreign currency contracts, to manage or minimize currency or exchange rate risk. |
The Fund may also enter into forward foreign currency contracts for the purchase or sale of a security denominated in a foreign currency in order to “lock in” the U.S. dollar price of that security, or the Fund may also enter into forward foreign currency contracts that do not provide for physical exchange of the two currencies on the settlement date, but instead are settled by a single cash payment calculated as the difference between the agreed upon exchange rate and the spot rate at settlement based upon an agreed upon notional amount (non-deliverable forwards).
A forward foreign currency contract is an obligation between two parties (“Counterparties”) to purchase or sell a specific currency for an agreed-upon price at a future date. The use of forward foreign currency contracts for hedging does not eliminate fluctuations in the price of the underlying securities the Fund owns or intends to acquire but establishes a rate of exchange in advance. Fluctuations in the value of these contracts are measured by the difference in the contract date and reporting date exchange rates and are recorded as unrealized appreciation (depreciation) until the contracts are closed. When the contracts are closed, realized gains (losses) are recorded. Realized and unrealized gains (losses) on the contracts are included in the Statement of Operations. The primary risks associated with forward foreign currency contracts include failure of the Counterparty to meet the terms of the contract and the value of the foreign currency changing unfavorably. These risks may be in excess of the amounts reflected in the Statement of Assets and Liabilities.
NOTE 2–Advisory Fees and Other Fees Paid to Affiliates
The Trust has entered into a master investment advisory agreement with the Adviser. Under the terms of the investment advisory agreement, the Fund accrues daily and pays monthly an advisory fee to the Adviser based on the annual rate of the Fund’s average daily net assets as follows:
| | | | |
| Average Daily Net Assets | | Rate | |
|
| |
First $1 billion | | | 0.500 | % |
|
| |
Next $1 billion | | | 0.450 | % |
|
| |
Next $1 billion | | | 0.400 | % |
|
| |
Over $3 billion | | | 0.350 | % |
|
| |
For the year ended April 30, 2024, the effective advisory fee rate incurred by the Fund was 0.38%.
Under the terms of a master sub-advisory agreement between the Adviser and each of Invesco Asset Management Deutschland GmbH, Invesco Asset Management Limited, Invesco Asset Management (Japan) Limited, Invesco Hong Kong Limited, Invesco Senior Secured Management, Inc. and Invesco Canada Ltd. (collectively, the “Affiliated Sub-Advisers”) the Adviser, not the Fund, will pay 40% of the fees paid to the Adviser to any such Affiliated Sub-Adviser(s) that provide(s) discretionary investment management services to the Fund based on the percentage of assets allocated to such Affiliated Sub-Adviser(s).
Effective July 1, 2023, the Adviser has agreed, for an indefinite period, to waive advisory fees and/or reimburse expenses of all shares to the extent necessary to limit total annual fund operating expenses after fee waiver and/or expense reimbursement (excluding certain items discussed below) of Class A, Class C, Class R,
Class Y, Class R5 and Class R6 shares to 2.00%, 2.75%, 2.25%, 1.75%, 1.75% and 1.75%, respectively, of the Fund’s average daily net assets (the “boundary limits”). Prior to July 1, 2023, the same boundary limits were in effect with an expiration date of June 30, 2023. In determining the Adviser’s obligation to waive advisory fees and/or reimburse expenses, the following expenses are not taken into account, and could cause the total annual fund operating expenses after fee waiver and/or expense reimbursement to exceed the numbers reflected above: (1) interest; (2) taxes; (3) dividend expense on short sales; (4) extraordinary or non-routine items, including litigation expenses; and (5) expenses that the Fund has incurred but did not actually pay because of an expense offset arrangement. Invesco may amend and/or terminate these boundary limits at any time in its sole discretion and will inform the Board of Trustees of any such changes. The Adviser did not waive fees and/or reimburse expenses during the period under these boundary limits.
Further, the Adviser has contractually agreed, through at least June 30, 2025, to waive the advisory fee payable by the Fund in an amount equal to 100% of the net advisory fees the Adviser receives from the affiliated money market funds on investments by the Fund of uninvested cash (excluding investments of cash collateral from securities lending) in such affiliated money market funds.
For the year ended April 30, 2024, the Adviser waived advisory fees of $300,991.
The Trust has entered into a master administrative services agreement with Invesco pursuant to which the Fund has agreed to pay Invesco for certain administrative costs incurred in providing accounting services to the Fund. For the year ended April 30, 2024, expenses incurred under the agreement are shown in the Statement of Operations as Administrative services fees. Invesco has entered into a sub-administration agreement whereby State Street Bank and Trust Company (“SSB”) serves as fund accountant and provides certain administrative services to the Fund. Pursuant to a custody agreement with the Trust on behalf of the Fund, SSB also serves as the Fund’s custodian.
The Trust has entered into a transfer agency and service agreement with Invesco Investment Services, Inc. (“IIS”) pursuant to which the Fund has agreed to pay IIS a fee for providing transfer agency and shareholder services to the Fund and reimburse IIS for certain expenses incurred by IIS in the course of providing such services. IIS may make payments to intermediaries that provide omnibus account services, sub-accounting services and/or networking services. All fees payable by IIS to intermediaries that provide omnibus account services or sub-accounting services are charged back to the Fund, subject to certain limitations approved by the Trust’s Board of Trustees. For the year ended April 30, 2024, expenses incurred under the agreement are shown in the Statement of Operations as Transfer agent fees.
The Trust has entered into master distribution agreements with Invesco Distributors, Inc. (“IDI”) to serve as the distributor for the Class A, Class C, Class R, Class Y, Class R5 and Class R6 shares of the Fund. The Trust has adopted plans pursuant to Rule 12b-1 under the 1940 Act with respect to the Fund’s Class A, Class C and Class R shares (collectively, the “Plans”). The Fund, pursuant to the Plans, reimburses IDI for its allocated share of expenses incurred for the period, up to a maximum annual rate of 0.25% of the average daily net assets of Class A shares, up to 1.00% of the average daily net assets of Class C shares, and up to 0.50% of the average daily net assets of Class R shares. The fees are accrued daily and paid monthly. Of the Plans payments, up to 0.25% of the average daily net assets of each class of shares may be paid to furnish continuing personal shareholder services to customers who purchase and own shares of such classes. Any amounts not paid as a service fee under the Plans would constitute an asset-based sales charge. Rules of the Financial Industry Regulatory Authority (“FINRA”) impose a cap on the total sales charges, including asset-based sales charges, that may be paid by any class of shares of the Fund. For the year ended April 30, 2024, expenses incurred under the Plans are shown in the Statement of Operations as Distribution fees.
Front-end sales commissions and CDSC (collectively, the “sales charges”) are not recorded as expenses of the Fund. Front-end sales commissions are deducted from proceeds from the sales of Fund shares prior to investment in Class A shares of the Fund. CDSC are deducted from redemption proceeds prior to remittance to the shareholder. During the year ended April 30, 2024, IDI advised the Fund that IDI retained $615,955 in front-end sales commissions from the sale of Class A shares and $17,211 and $5,415 from Class A and Class C shares, respectively, for CDSC imposed upon redemptions by shareholders.
For the year ended April 30, 2024, the Fund incurred $55,520 in brokerage commissions with Invesco Capital Markets, Inc., an affiliate of the Adviser and IDI, for portfolio transactions executed on behalf of the Fund.
Certain officers and trustees of the Trust are officers and directors of the Adviser, IIS and/or IDI.
NOTE 3–Additional Valuation Information
GAAP defines fair value as the price that would be received to sell an asset or paid to transfer a liability in an orderly transaction between market participants at the measurement date, under current market conditions. GAAP establishes a hierarchy that prioritizes the inputs to valuation methods, giving the highest priority to readily available unadjusted quoted prices in an active market for identical assets (Level 1) and the lowest priority to significant unobservable inputs (Level 3), generally when market prices are not readily available. Based on the valuation inputs, the securities or other investments are tiered into one of three levels. Changes in valuation methods may result in transfers in or out of an investment’s assigned level:
| | |
| Level 1 - | | Prices are determined using quoted prices in an active market for identical assets. |
| Level 2 - | | Prices are determined using other significant observable inputs. Observable inputs are inputs that other market participants may use in pricing a security. These may include quoted prices for similar securities, interest rates, prepayment speeds, credit risk, yield curves, loss severities, default rates, discount rates, volatilities and others. |
| Level 3 - | | Prices are determined using significant unobservable inputs. In situations where quoted prices or observable inputs are unavailable (for example, when there is little or no market activity for an investment at the end of the period), unobservable inputs may be used. Unobservable inputs reflect the Adviser’s assumptions about the factors market participants would use in determining fair value of the securities or instruments and would be based on the best available information. |
The following is a summary of the tiered valuation input levels, as of April 30, 2024. The level assigned to the securities valuations may not be an indication of the risk or liquidity associated with investing in those securities. Because of the inherent uncertainties of valuation, the values reflected in the financial statements may materially differ from the value received upon actual sale of those investments.
| | | | | | | | | | | | | | | | | | | | | | | | | | | | | | | | | | | | | | | | |
| | | Level 1 | | | | | | | | | Level 2 | | | | | | | | | Level 3 | | | | | | | | | Total | |
|
| |
Investments in Securities | | | | | | | | | | | | | | | | | | | | | | | | | | | | | | | | | | | | | | | | |
|
| |
Common Stocks & Other Equity Interests | | $ | 10,400,033,538 | | | | | | | | | | | $ | 231,206,073 | | | | | | | | | | | $ | – | | | | | | | | | | | $ | 10,631,239,611 | |
|
| |
Money Market Funds | | | 513,956,299 | | | | | | | | | | | | 124,401,775 | | | | | | | | | | | | – | | | | | | | | | | | | 638,358,074 | |
|
| |
Total Investments in Securities | | | 10,913,989,837 | | | | | | | | | | | | 355,607,848 | | | | | | | | | | | | – | | | | | | | | | | | | 11,269,597,685 | |
|
| |
Other Investments–Assets* | | | | | | | | | | | | | | | | | | | | | | | | | | | | | | | | | | | | | | | | |
|
| |
Forward Foreign Currency Contracts | | | – | | | | | | | | | | | | 455,425 | | | | | | | | | | | | – | | | | | | | | | | | | 455,425 | |
|
| |
|
| |
| | | | | | | | | | | | | | | | | | | | | | | | | | | | | | | | | | | | | | | | |
| | | Level 1 | | | | | | | | | Level 2 | | | | | | | | | Level 3 | | | | | | | | | Total | |
|
| |
Other Investments - Liabilities* | | | | | | | | | | | | | | | | | | | | | | | | | | | | | | | | | | | | | | | | |
|
| |
Forward Foreign Currency Contracts | | $ | – | | | | | | | | | | | $ | (1,744,413 | ) | | | | | | | | | | | $– | | | | | | | | | | | $ | (1,744,413 | ) |
|
| |
Total Other Investments | | | – | | | | | | | | | | | | (1,288,988 | ) | | | | | | | | | | | – | | | | | | | | | | | | (1,288,988 | ) |
|
| |
Total Investments | | $ | 10,913,989,837 | | | | | | | | | | | $ | 354,318,860 | | | | | | | | | | | | $– | | | | | | | | | | | $ | 11,268,308,697 | |
|
| |
| * | Unrealized appreciation (depreciation). |
NOTE 4–Derivative Investments
The Fund may enter into an International Swaps and Derivatives Association Master Agreement (“ISDA Master Agreement”) under which a fund may trade OTC derivatives. An OTC transaction entered into under an ISDA Master Agreement typically involves a collateral posting arrangement, payment netting provisions and close-out netting provisions. These netting provisions allow for reduction of credit risk through netting of contractual obligations. The enforceability of the netting provisions of the ISDA Master Agreement depends on the governing law of the ISDA Master Agreement, among other factors.
For financial reporting purposes, the Fund does not offset OTC derivative assets or liabilities that are subject to ISDA Master Agreements in the Statement of Assets and Liabilities.
Value of Derivative Investments at Period-End
The table below summarizes the value of the Fund’s derivative investments, detailed by primary risk exposure, held as of April 30, 2024:
| | | | |
| | | Value | |
| Derivative Assets | | Currency
Risk | |
|
| |
Unrealized appreciation on forward foreign currency contracts outstanding | | $ | 455,425 | |
|
| |
Derivatives not subject to master netting agreements | | | – | |
|
| |
Total Derivative Assets subject to master netting agreements | | $ | 455,425 | |
|
| |
| | | | |
| | | Value | |
| Derivative Liabilities | | Currency
Risk | |
|
| |
Unrealized depreciation on forward foreign currency contracts outstanding | | $ | (1,744,413 | ) |
|
| |
Derivatives not subject to master netting agreements | | | – | |
|
| |
Total Derivative Liabilities subject to master netting agreements | | $ | (1,744,413 | ) |
|
| |
Offsetting Assets and Liabilities
The table below reflects the Fund’s exposure to Counterparties subject to either an ISDA Master Agreement or other agreement for OTC derivative transactions as of April 30, 2024.
| | | | | | | | | | | | | | | | | | | | |
| | | Financial
Derivative
Assets | | | Financial
Derivative
Liabilities | | | | | | Collateral
(Received)/Pledged | | | |
| Counterparty | | Forward Foreign
Currency Contracts | | | Forward Foreign
Currency Contracts | | | Net Value of
Derivatives | | | Non-Cash | | Cash | | Net Amount | |
|
| |
Deutsche Bank AG | | $ | 14,700 | | | $ | – | | | $ | 14,700 | | | $– | | $– | | $ | 14,700 | |
|
| |
Goldman Sachs International | | | – | | | | (650 | ) | | | (650 | ) | | – | | – | | | (650 | ) |
|
| |
Royal Bank of Canada | | | 440,725 | | | | (1,743,763 | ) | | | (1,303,038 | ) | | – | | – | | | (1,303,038 | ) |
|
| |
Total | | $ | 455,425 | | | $ | (1,744,413 | ) | | $ | (1,288,988 | ) | | $– | | $– | | $ | (1,288,988 | ) |
|
| |
Effect of Derivative Investments for the year ended April 30, 2024
The table below summarizes the gains (losses) on derivative investments, detailed by primary risk exposure, recognized in earnings during the period:
| | | | |
| | | Location of Gain (Loss) on
Statement of Operations | |
| | | Currency
Risk | |
|
| |
Realized Gain: | | | | |
Forward foreign currency contracts | | | $11,673,881 | |
|
| |
Change in Net Unrealized Appreciation (Depreciation): | | | | |
Forward foreign currency contracts | | | (1,384,355) | |
|
| |
Total | | | $10,289,526 | |
|
| |
The table below summarizes the average notional value of derivatives held during the period.
| | | | |
| | | Forward
Foreign Currency
Contracts | |
|
| |
Average notional value | | | $309,339,732 | |
|
| |
NOTE 5–Expense Offset Arrangement(s)
The expense offset arrangement is comprised of transfer agency credits which result from balances in demand deposit accounts used by the transfer agent for clearing shareholder transactions. For the year ended April 30, 2024, the Fund received credits from this arrangement, which resulted in the reduction of the Fund’s total expenses of $71,027.
NOTE 6–Trustees’ and Officers’ Fees and Benefits
Trustees’ and Officers’ Fees and Benefits include amounts accrued by the Fund to pay remuneration to certain Trustees and Officers of the Fund. Trustees have the option to defer compensation payable by the Fund, and Trustees’ and Officers’ Fees and Benefits also include amounts accrued by the Fund to fund such deferred compensation amounts. Those Trustees who defer compensation have the option to select various Invesco Funds in which their deferral accounts shall be deemed to be invested. Finally, certain current Trustees were eligible to participate in a retirement plan that provided for benefits to be paid upon retirement to Trustees over a period of time based on the number of years of service. The Fund may have certain former Trustees who also participate in a retirement plan and receive benefits under such plan. Trustees’ and Officers’ Fees and Benefits include amounts accrued by the Fund to fund such retirement benefits. Obligations under the deferred compensation and retirement plans represent unsecured claims against the general assets of the Fund.
NOTE 7–Cash Balances
The Fund is permitted to temporarily carry a negative or overdrawn balance in its account with SSB, the custodian bank. Such balances, if any at period-end, are shown in the Statement of Assets and Liabilities under the payable caption Amount due custodian. To compensate the custodian bank for such overdrafts, the overdrawn Fund may either (1) leave funds as a compensating balance in the account so the custodian bank can be compensated by earning the additional interest; or (2) compensate by paying the custodian bank at a rate agreed upon by the custodian bank and Invesco, not to exceed the contractually agreed upon rate.
NOTE 8–Distributions to Shareholders and Tax Components of Net Assets
Tax Character of Distributions to Shareholders Paid During the Fiscal Years Ended April 30, 2024 and 2023:
| | | | | | | | | | | | |
| | | 2024 | | | | | | 2023 | |
|
| |
Ordinary income* | | $ | 237,960,927 | | | | | | | $ | 241,654,450 | |
|
| |
Long-term capital gain | | | 615,072,523 | | | | | | | | 934,309,128 | |
|
| |
Total distributions | | $ | 853,033,450 | | | | | | | $ | 1,175,963,578 | |
|
| |
| * | Includes short-term capital gain distributions, if any. |
Tax Components of Net Assets at Period-End:
| | | | |
| | | 2024 | |
|
| |
Undistributed ordinary income | | $ | 41,997,102 | |
|
| |
Undistributed long-term capital gain | | | 429,553,573 | |
|
| |
Net unrealized appreciation – investments | | | 3,519,143,612 | |
|
| |
Net unrealized appreciation (depreciation) – foreign currencies | | | (26,980 | ) |
|
| |
Temporary book/tax differences | | | (515,142 | ) |
|
| |
Shares of beneficial interest | | | 7,149,456,882 | |
|
| |
Total net assets | | $ | 11,139,609,047 | |
|
| |
The difference between book-basis and tax-basis unrealized appreciation (depreciation) is due to differences in the timing of recognition of gains and losses on investments for tax and book purposes. The Fund’s net unrealized appreciation (depreciation) difference is attributable primarily to wash sales.
The temporary book/tax differences are a result of timing differences between book and tax recognition of income and/or expenses. The Fund’s temporary book/tax differences are the result of the trustee deferral of compensation and retirement plan benefits.
Capital loss carryforward is calculated and reported as of a specific date. Results of transactions and other activity after that date may affect the amount of capital loss carryforward actually available for the Fund to utilize. The ability to utilize capital loss carryforward in the future may be limited under the Internal Revenue Code and related regulations based on the results of future transactions.
The Fund does not have a capital loss carryforward as of April 30, 2024.
NOTE 9–Investment Transactions
The aggregate amount of investment securities (other than short-term securities, U.S. Government obligations and money market funds, if any) purchased and sold by the Fund during the year ended April 30, 2024 was $1,764,513,087 and $2,165,992,135, respectively. Cost of investments, including any derivatives, on a tax basis includes the adjustments for financial reporting purposes as of the most recently completed federal income tax reporting period-end.
| | | | |
Unrealized Appreciation (Depreciation) of Investments on a Tax Basis | |
Aggregate unrealized appreciation of investments | | | $3,848,219,662 | |
|
| |
Aggregate unrealized (depreciation) of investments | | | (329,076,050 | ) |
|
| |
Net unrealized appreciation of investments | | | $3,519,143,612 | |
|
| |
Cost of investments for tax purposes is $7,749,165,085.
NOTE 10–Reclassification of Permanent Differences
Primarily as a result of differing book/tax treatment of equalization, on April 30, 2024, undistributed net investment income was increased by $72,898, undistributed net realized gain was decreased by $39,629,898 and shares of beneficial interest was increased by $39,557,000. This reclassification had no effect on the net assets of the Fund.
NOTE 11–Share Information
| | | | | | | | | | | | | | | | |
| | | Summary of Share Activity | |
|
| |
| | |
| | | Year ended | | | Year ended | |
| | | April 30, 2024(a) | | | April 30, 2023 | |
| | | Shares | | | Amount | | | Shares | | | Amount | |
|
| |
Sold: | | | | | | | | | | | | | | | | |
Class A | | | 13,033,988 | | | $ | 359,002,012 | | | | 17,238,616 | | | $ | 481,081,312 | |
|
| |
Class C | | | 584,469 | | | | 16,152,114 | | | | 1,196,491 | | | | 33,599,312 | |
|
| |
Class R | | | 987,319 | | | | 27,197,661 | | | | 1,189,118 | | | | 33,169,894 | |
|
| |
Class Y | | | 25,999,838 | | | | 719,905,490 | | | | 21,825,600 | | | | 609,727,823 | |
|
| |
Class R5 | | | 1,807,726 | | | | 50,112,629 | | | | 1,906,241 | | | | 53,163,516 | |
|
| |
Class R6 | | | 16,338,716 | | | | 451,109,353 | | | | 19,207,625 | | | | 534,469,338 | |
|
| |
| | | | |
Issued as reinvestment of dividends: | | | | | | | | | | | | | | | | |
Class A | | | 17,792,473 | | | | 478,726,024 | | | | 24,529,238 | | | | 657,005,818 | |
|
| |
Class C | | | 253,440 | | | | 6,817,672 | | | | 390,349 | | | | 10,482,679 | |
|
| |
Class R | | | 383,132 | | | | 10,312,192 | | | | 572,851 | | | | 15,357,697 | |
|
| |
Class Y | | | 5,248,828 | | | | 141,256,921 | | | | 6,215,736 | | | | 166,364,562 | |
|
| |
Class R5 | | | 1,192,097 | | | | 32,057,041 | | | | 1,775,373 | | | | 47,451,853 | |
|
| |
Class R6 | | | 5,120,356 | | | | 137,608,632 | | | | 6,495,386 | | | | 173,505,725 | |
|
| |
| | | | |
Automatic conversion of Class C shares to Class A shares: | | | | | | | | | | | | | | | | |
Class A | | | 317,202 | | | | 8,713,290 | | | | 418,692 | | | | 11,548,349 | |
|
| |
Class C | | | (316,916 | ) | | | (8,713,290 | ) | | | (418,383 | ) | | | (11,548,349 | ) |
|
| |
| | | | |
Reacquired: | | | | | | | | | | | | | | | | |
Class A | | | (31,733,306 | ) | | | (873,072,562 | ) | | | (25,071,795 | ) | | | (696,295,343 | ) |
|
| |
Class C | | | (810,133 | ) | | | (22,247,944 | ) | | | (693,550 | ) | | | (19,077,567 | ) |
|
| |
Class R | | | (1,555,431 | ) | | | (42,762,835 | ) | | | (1,343,816 | ) | | | (37,344,859 | ) |
|
| |
Class Y | | | (19,371,412 | ) | | | (532,767,035 | ) | | | (17,214,667 | ) | | | (478,484,131 | ) |
|
| |
Class R5 | | | (3,401,326 | ) | | | (93,435,608 | ) | | | (3,043,428 | ) | | | (85,067,182 | ) |
|
| |
Class R6 | | | (17,824,401 | ) | | | (489,311,723 | ) | | | (16,435,127 | ) | | | (460,509,986 | ) |
|
| |
Net increase in share activity | | | 14,046,659 | | | $ | 376,660,034 | | | | 38,740,550 | | | $ | 1,038,600,461 | |
|
| |
| (a) | There are entities that are record owners of more than 5% of the outstanding shares of the Fund and in the aggregate own 42% of the outstanding shares of the Fund. IDI has an agreement with these entities to sell Fund shares. The Fund, Invesco and/or Invesco affiliates may make payments to these entities, which are considered to be related to the Fund, for providing services to the Fund, Invesco and/or Invesco affiliates including but not limited to services such as securities brokerage, distribution, third party record keeping and account servicing. The Fund has no knowledge as to whether all or any portion of the shares owned of record by these entities are also owned beneficially. |
Report of Independent Registered Public Accounting Firm
To the Board of Trustees of AIM Sector Funds (Invesco Sector Funds) and Shareholders of Invesco Comstock Fund
Opinion on the Financial Statements
We have audited the accompanying statement of assets and liabilities, including the schedule of investments, of Invesco Comstock Fund (one of the funds constituting AIM Sector Funds (Invesco Sector Funds), referred to hereafter as the “Fund”) as of April 30, 2024, the related statement of operations for the year ended April 30, 2024, the statement of changes in net assets for each of the two years in the period ended April 30, 2024, including the related notes, and the financial highlights for each of the five years in the period ended April 30, 2024 (collectively referred to as the “financial statements”). In our opinion, the financial statements present fairly, in all material respects, the financial position of the Fund as of April 30, 2024, the results of its operations for the year then ended, the changes in its net assets for each of the two years in the period ended April 30, 2024 and the financial highlights for each of the five years in the period ended April 30, 2024 in conformity with accounting principles generally accepted in the United States of America.
Basis for Opinion
These financial statements are the responsibility of the Fund’s management. Our responsibility is to express an opinion on the Fund’s financial statements based on our audits. We are a public accounting firm registered with the Public Company Accounting Oversight Board (United States) (PCAOB) and are required to be independent with respect to the Fund in accordance with the U.S. federal securities laws and the applicable rules and regulations of the Securities and Exchange Commission and the PCAOB.
We conducted our audits of these financial statements in accordance with the standards of the PCAOB. Those standards require that we plan and perform the audit to obtain reasonable assurance about whether the financial statements are free of material misstatement, whether due to error or fraud.
Our audits included performing procedures to assess the risks of material misstatement of the financial statements, whether due to error or fraud, and performing procedures that respond to those risks. Such procedures included examining, on a test basis, evidence regarding the amounts and disclosures in the financial statements. Our audits also included evaluating the accounting principles used and significant estimates made by management, as well as evaluating the overall presentation of the financial statements. Our procedures included confirmation of securities owned as of April 30, 2024 by correspondence with the custodian, transfer agent and brokers. We believe that our audits provide a reasonable basis for our opinion.
/s/PricewaterhouseCoopers LLP
Houston, Texas
June 20, 2024
We have served as the auditor of one or more of the investment companies in the Invesco group of investment companies since at least 1995. We have not been able to determine the specific year we began serving as auditor.
Calculating your ongoing Fund expenses
Example
As a shareholder of the Fund, you incur two types of costs: (1) transaction costs, which may include sales charges (loads) on purchase payments or contingent deferred sales charges on redemptions, if any; and (2) ongoing costs, including management fees, distribution and/or service (12b-1) fees, and other Fund expenses. This example is intended to help you understand your ongoing costs (in dollars) of investing in the Fund and to compare these costs with ongoing costs of investing in other mutual funds. The example is based on an investment of $1,000 invested at the beginning of the period and held for the entire period November 1, 2023 through April 30, 2024.
Actual expenses
The table below provides information about actual account values and actual expenses. You may use the information in this table, together with the amount you invested, to estimate the expenses that you paid over the period. Simply divide your account value by $1,000 (for example, an $8,600 account value divided by $1,000 = 8.6), then multiply the result by the number in the table under the heading entitled “Actual Expenses Paid During Period” to estimate the expenses you paid on your account during this period.
Hypothetical example for comparison purposes
The table below also provides information about hypothetical account values and hypothetical expenses based on the Fund’s actual expense ratio and an assumed rate of return of 5% per year before expenses, which is not the Fund’s actual return.
The hypothetical account values and expenses may not be used to estimate the actual ending account balance or expenses you paid for the period. You may use this information to compare the ongoing costs of investing in the Fund and other funds. To do so, compare this 5% hypothetical example with the 5% hypothetical examples that appear in the shareholder reports of the other funds.
Please note that the expenses shown in the table are meant to highlight your ongoing costs only and do not reflect any transaction costs, such as sales charges (loads) on purchase payments or contingent deferred sales charges on redemptions, if any. Therefore, the hypothetical information is useful in comparing ongoing costs only, and will not help you determine the relative total costs of owning different funds. In addition, if these transaction costs were included, your costs would have been higher.
| | | | | | | | | | | | |
| | | | | ACTUAL | | HYPOTHETICAL (5% annual return before expenses) | | |
| | | Beginning Account Value
(11/01/23) | | Ending Account Value
(04/30/24)1 | | Expenses Paid During
Period2 | | Ending Account Value
(04/30/24) | | Expenses Paid During
Period2 | | Annualized
Expense Ratio |
Class A | | $1,000.00 | | $1,193.10 | | $4.42 | | $1,020.84 | | $4.07 | | 0.81% |
Class C | | 1,000.00 | | 1,188.00 | | 8.49 | | 1,017.11 | | 7.82 | | 1.56 |
Class R | | 1,000.00 | | 1,191.50 | | 5.78 | | 1,019.59 | | 5.32 | | 1.06 |
Class Y | | 1,000.00 | | 1,194.20 | | 3.06 | | 1,022.08 | | 2.82 | | 0.56 |
Class R5 | | 1,000.00 | | 1,194.60 | | 2.84 | | 1,022.28 | | 2.61 | | 0.52 |
Class R6 | | 1,000.00 | | 1,195.20 | | 2.46 | | 1,022.63 | | 2.26 | | 0.45 |
| 1 | The actual ending account value is based on the actual total return of the Fund for the period November 1, 2023 through April 30, 2024, after actual expenses and will differ from the hypothetical ending account value which is based on the Fund’s expense ratio and a hypothetical annual return of 5% before expenses. |
| 2 | Expenses are equal to the Fund’s annualized expense ratio as indicated above multiplied by the average account value over the period, multiplied by 182/366 to reflect the most recent fiscal half year. |
Tax Information
Form 1099-DIV, Form 1042-S and other year–end tax information provide shareholders with actual calendar year amounts that should be included in their tax returns. Shareholders should consult their tax advisers.
The following distribution information is being provided as required by the Internal Revenue Code or to meet a specific state’s requirement.
The Fund designates the following amounts or, if subsequently determined to be different, the maximum amount allowable for its fiscal year ended April 30, 2024:
| | | | | | | | |
Federal and State Income Tax | | | | | | |
Long-Term Capital Gain Distributions | | $ | 654,629,523 | | | | | |
Qualified Dividend Income* | | | 100.00% | | | | | |
Corporate Dividends Received Deduction* | | | 90.12% | | | | | |
U.S. Treasury Obligations* | | | 0.00% | | | | | |
Qualified Business Income* | | | 0.00% | | | | | |
Business Interest Income* | | | 2.42% | | | | | |
|
* The above percentages are based on ordinary income dividends paid to shareholders during the Fund’s fiscal year. | |
| | |
Non-Resident Alien Shareholders | | | | | | |
Short-Term Capital Gain Distributions | | $ | 52,644,240 | | | | | |
Trustees and Officers
The address of each trustee and officer is AIM Sector Funds (Invesco Sector Funds) (the “Trust”), 11 Greenway Plaza, Houston, Texas 77046-1173. The trustees serve for the life of the Trust, subject to their earlier death, incapacitation, resignation, retirement or removal as more specifically provided in the Trust’s organizational documents. Each officer serves for a one year term or until their successors are elected and qualified. Column two below includes length of time served with predecessor entities, if any.
| | | | | | | | |
Name, Year of Birth and
Position(s) Held with the Trust | | Trustee and/or
Officer Since | | Principal Occupation(s) During Past 5 Years | | Number of
Funds in Fund Complex
Overseen by
Trustee | | Other Directorship(s) Held by Trustee
During At Least The Past 5 Years |
| Interested Trustees | | | | | | | | |
| Jeffrey H. Kupor1 - 1968 Trustee | | 2024 | | Senior Managing Director and General Counsel, Invesco Ltd.; Trustee, Invesco Foundation, Inc.; Director, Invesco Advisers, Inc.; Executive Vice President, Invesco Asset Management (Bermuda), Ltd., Invesco Investments (Bermuda) Ltd.; and Vice President, Invesco Group Services, Inc. Formerly: Head of Legal of the Americas, Invesco Ltd.; Senior Vice President and Secretary, Invesco Advisers, Inc. (formerly known as Invesco Institutional (N.A.), Inc.) (registered investment adviser); Secretary, Invesco Distributors, Inc. (formerly known as Invesco AIM Distributors, Inc.); Vice President and Secretary, Invesco Investment Services, Inc. (formerly known as Invesco AIM Investment Services, Inc.); Senior Vice President, Chief Legal Officer and Secretary, The Invesco Funds; Secretary and General Counsel, Invesco Investment Advisers LLC (formerly known as Van Kampen Asset Management); Secretary and General Counsel, Invesco Capital Markets, Inc. (formerly known as Van Kampen Funds Inc.) and Chief Legal Officer, Invesco Exchange-Traded Fund Trust, Invesco Exchange-Traded Fund Trust II, Invesco India Exchange-Traded Fund Trust, Invesco Actively Managed Exchange-Traded Fund Trust, Invesco Actively Managed Exchange-Traded Commodity Fund Trust and Invesco Exchange-Traded Self-Indexed Fund Trust; Secretary and Vice President, Harbourview Asset Management Corporation; Secretary and Vice President, OppenheimerFunds, Inc. and Invesco Managed Accounts, LLC; Secretary and Senior Vice President, OFI Global Institutional, Inc.; Secretary and Vice President, OFI SteelPath, Inc.; Secretary and Vice President, Oppenheimer Acquisition Corp.; Secretary and Vice President, Shareholder Services, Inc.; Secretary and Vice President, Trinity Investment Management Corporation, Senior Vice President, Invesco Distributors, Inc.; Secretary and Vice President, Jemstep, Inc.; Head of Legal, Worldwide Institutional, Invesco Ltd.; Secretary and General Counsel, INVESCO Private Capital Investments, Inc.; Senior Vice President, Secretary and General Counsel, Invesco Management Group, Inc. (formerly known as Invesco AIM Management Group, Inc.); Assistant Secretary, INVESCO Asset Management (Bermuda) Ltd.; Secretary and General Counsel, Invesco Private Capital, Inc.; Assistant Secretary and General Counsel, INVESCO Realty, Inc.; Secretary and General Counsel, Invesco Senior Secured Management, Inc.; Secretary, Sovereign G./P. Holdings Inc.; Secretary, Invesco Indexing LLC; and Secretary, W.L. Ross & Co., LLC | | 164 | | None |
| Douglas Sharp1 - 1974 Trustee | | 2024 | | Senior Managing Director and Head of Americas & EMEA, Invesco Ltd. Formerly: Director and Chairman Invesco UK Limited; Director, Chairman and Chief Executive, Invesco Fund Managers Limited | | 164 | | None |
| 1 | Mr. Kupor and Mr. Sharp are considered interested persons (within the meaning of Section 2(a)(19) of the 1940 Act) of the Trust because they are officers of the Adviser to the Trust, and officers of Invesco Ltd., ultimate parent of the Adviser. |
| | |
| T-1 | | Invesco Comstock Fund |
Trustees and Officers–(continued)
| | | | | | | | |
Name, Year of Birth and
Position(s) Held with the Trust | | Trustee and/or
Officer Since | | Principal Occupation(s) During Past 5 Years | | Number of
Funds in Fund Complex
Overseen by
Trustee | | Other Directorship(s) Held by Trustee
During At Least The Past 5 Years |
| Independent Trustees | | | | | | | | |
| Beth Ann Brown - 1968 Trustee (2019) and Chair (2022) | | 2019 | | Independent Consultant Formerly: Head of Intermediary Distribution, Managing Director, Strategic Relations, Managing Director, Head of National Accounts, Senior Vice President, National Account Manager and Senior Vice President, Key Account Manager, Columbia Management Investment Advisers LLC; and Vice President, Key Account Manager, Liberty Funds Distributor, Inc. | | 164 | | Director, Board of Directors of Caron Engineering Inc.; Formerly: Advisor, Board of Advisors of Caron Engineering Inc.; President and Director, Acton Shapleigh Youth Conservation Corps (non-profit); President and Director Director of Grahamtastic Connection (non-profit); and Trustee of certain Oppenheimer Funds |
Carol Deckbar - 1962 Trustee | | 2024 | | Formerly: Executive Vice President and Chief Product Officer, TIAA Financial Services; Executive Vice President and Principal, College Retirement Equities Fund at TIAA; Executive Vice President and Head of Institutional Investments and Endowment Services, TIAA | | 164 | | Formerly: Board Member, TIAA Asset Management, Inc.; and Board Member, TH Real Estate Group Holdings Company |
| Cynthia Hostetler - 1962 Trustee | | 2017 | | Non-Executive Director and Trustee of a number of public and private business corporations Formerly: Director, Aberdeen Investment Funds (4 portfolios); Director, Artio Global Investment LLC (mutual fund complex); Director, Edgen Group, Inc. (specialized energy and infrastructure products distributor); Director, Genesee & Wyoming, Inc. (railroads); Head of Investment Funds and Private Equity, Overseas Private Investment Corporation; President, First Manhattan Bancorporation, Inc.; and Attorney, Simpson Thacher & Bartlett LLP | | 164 | | Resideo Technologies, Inc. (smart home technology); Vulcan Materials Company (construction materials company); Trilinc Global Impact Fund; Investment Company Institute (professional organization); and Independent Directors Council (professional organization) |
Eli Jones - 1961 Trustee | | 2016 | | Professor and Dean Emeritus, Mays Business School - Texas A&M University Formerly: Dean of Mays Business School-Texas A&M University; Professor and Dean, Walton College of Business, University of Arkansas and E.J. Ourso College of Business, Louisiana State University; and Director, Arvest Bank | | 164 | | Insperity, Inc. (formerly known as Administaff) (human resources provider); Board Member of the regional board, First Financial Bank Texas; and Boad Member, First Financial Bankshares, Inc. Texas |
| Elizabeth Krentzman - 1959 Trustee | | 2019 | | Formerly: Principal and Chief Regulatory Advisor for Asset Management Services and U.S. Mutual Fund Leader of Deloitte & Touche LLP; General Counsel of the Investment Company Institute (trade association); National Director of the Investment Management Regulatory Consulting Practice, Principal, Director and Senior Manager of Deloitte & Touche LLP; Assistant Director of the Division of Investment Management - Office of Disclosure and Investment Adviser Regulation of the U.S. Securities and Exchange Commission and various positions with the Division of Investment Management – Office of Regulatory Policy of the U.S. Securities and Exchange Commission; and Associate at Ropes & Gray LLP | | 164 | | Formerly: Member of the Cartica Funds Board of Directors (private investment fund); Trustee of the University of Florida National Board Foundation; Member of the University of Florida Law Center Association, Inc. Board of Trustees, Audit Committee and Membership Committee; and Trustee of certain Oppenheimer Funds |
Anthony J. LaCava, Jr. -1956 Trustee | | 2019 | | Formerly: Director and Member of the Audit Committee, Blue Hills Bank (publicly traded financial institution) and Managing Partner, KPMG LLP | | 164 | | Member and Chairman, of the Bentley University, Business School Advisory Council; Formerly: Board Member and Chair of the Audit and Finance Committee and Nominating Committee, KPMG LLP |
| James “Jim” Liddy - 1959 Trustee | | 2024 | | Formerly: Chairman, Global Financial Services, Americas and Retired Partner, KPMG LLP | | 164 | | Director and Treasurer, Gulfside Place Condominium Association, Inc. and Non-Executive Director, Kellenberg Memorial High School |
| | |
| T-2 | | Invesco Comstock Fund |
Trustees and Officers–(continued)
| | | | | | | | |
Name, Year of Birth and
Position(s) Held with the Trust | | Trustee and/or
Officer Since | | Principal Occupation(s) During Past 5 Years | | Number of
Funds in Fund Complex
Overseen by
Trustee | | Other Directorship(s) Held by Trustee
During At Least The Past 5 Years |
| Independent Trustees–(continued) | | | | | | |
| Prema Mathai-Davis - 1950 Trustee | | 2003 | | Formerly: Co-Founder & Partner of Quantalytics Research, LLC, (a FinTech Investment Research Platform for the Self-Directed Investor); Trustee of YWCA Retirement Fund; CEO of YWCA of the USA; Board member of the NY Metropolitan Transportation Authority; Commissioner of the NYC Department of Aging; and Board member of Johns Hopkins Bioethics Institute | | 164 | | Member of Board of Positive Planet US (non-profit) and HealthCare Chaplaincy Network (non-profit) |
Joel W. Motley - 1952 Trustee | | 2019 | | Director of Office of Finance, Federal Home Loan Bank System; Managing Director of Carmona Motley Inc. (privately held financial advisor); Member of the Council on Foreign Relations and its Finance and Budget Committee; Chairman Emeritus of Board of Human Rights Watch and Member of its Investment Committee; and Member of Investment Committee Board of Historic Hudson Valley (non-profit cultural organization); and Member of the Vestry and the Investment Committee of Trinity Church Wall Street. Formerly: Managing Director of Public Capital Advisors, LLC (privately held financial advisor); Managing Director of Carmona Motley Hoffman, Inc. (privately held financial advisor); and Director of Columbia Equity Financial Corp. (privately held financial advisor) | | 164 | | Member of Board of Trust for Mutual Understanding (non-profit promoting the arts and environment); Member of Board of Greenwall Foundation (bioethics research foundation) and its Investment Committee; Member of Board of Friends of the LRC (non- profit legal advocacy); and Board Member and Investment Committee Member of Pulitzer Center for Crisis Reporting (non-profit journalism); and Trustee of certain Oppenheimer Funds; |
| Teresa M. Ressel - 1962 Trustee | | 2017 | | Non-executive director and trustee of a number of public and private business corporations Formerly: Chief Executive Officer, UBS Securities LLC (investment banking); Group Chief Operating Officer, UBS AG Americas (investment banking); Sr. Management Team Olayan America, The Olayan Group (international investor/commercial/industrial); and Assistant Secretary for Management & Budget and Designated Chief Financial Officer, U.S. Department of Treasury | | 164 | | None |
| Robert C. Troccoli - 1949 Trustee | | 2016 | | Formerly: Adjunct Professor, University of Denver – Daniels College of Business; and Managing Partner, KPMG LLP | | 164 | | None |
| Daniel S. Vandivort -1954 Trustee | | 2019 | | President, Flyway Advisory Services LLC (consulting and property management) and Member, Investment Committee of Historic Charleston Foundation Formerly: President and Chief Investment Officer, previously Head of Fixed Income, Weiss Peck and Greer/Robeco Investment Management; Trustee and Chair, Weiss Peck and Greer Funds Board; and various capacities at CS First Boston including Head of Fixed Income at First Boston Asset Management. | | 164 | | Formerly: Trustee and Governance Chair, Oppenheimer Funds; Treasurer, Chairman of the Audit and Finance Committee, Huntington Disease Foundation of America |
| | |
| T-3 | | Invesco Comstock Fund |
Trustees and Officers–(continued)
| | | | | | | | |
Name, Year of Birth and
Position(s) Held with the Trust | | Trustee and/or
Officer Since | | Principal Occupation(s) During Past 5 Years | | Number of
Funds in Fund Complex
Overseen by
Trustee | | Other Directorship(s) Held by Trustee
During At Least The Past 5 Years |
| Officers | | | | | | |
| Glenn Brightman - 1972 President and Principal Executive Officer | | 2023 | | Chief Operating Officer, Americas, Invesco Ltd.; Senior Vice President, Invesco Advisers, Inc.; President and Principal Executive Officer, The Invesco Funds; Manager, Invesco Investment Advisers LLC. Formerly: Global Head of Finance, Invesco Ltd; Executive Vice President and Chief Financial Officer, Nuveen | | N/A | | N/A |
Melanie Ringold - 1975 Senior Vice President, Chief Legal Officer and Secretary | | 2023 | | Head of Legal of the Americas, Invesco Ltd.; Senior Vice President and Secretary, Invesco Advisers, Inc. (formerly known as Invesco Institutional (N.A.), Inc.) (registered investment adviser); Secretary, Invesco Distributors, Inc. (formerly known as Invesco AIM Distributors, Inc.); Secretary, Invesco Investment Services, Inc. (formerly known as Invesco AIM Investment Services, Inc.); Senior Vice President, Chief Legal Officer and Secretary, The Invesco Funds; Secretary, Invesco Investment Advisers LLC, Invesco Capital Markets, Inc.; Chief Legal Officer, Invesco Exchange-Traded Fund Trust, Invesco Exchange-Traded Fund Trust II, Invesco India Exchange-Traded Fund Trust, Invesco Actively Managed Exchange-Traded Fund Trust, Invesco Actively Secretary and Vice President, Harbourview Asset Management Corporation; Secretary and Senior Vice President, OppenheimerFunds, Inc. and Invesco Managed Accounts, LLC; Secretary and Senior Vice President, Oppenheimer Acquisition Corp.; Secretary, SteelPath Funds Remediation LLC; and Secretary and Senior Vice President, Trinity Investment Management Corporation Formerly: Secretary and Senior Vice President, OFI SteelPath, Inc., Assistant Secretary, Invesco Distributors, Inc., Invesco Advisers, Inc., Invesco Investment Services, Inc., Invesco Capital Markets, Inc., Invesco Capital Management LLC and Invesco Investment Advisers LLC; and Assistant Secretary and Assistant Vice President, Invesco Funds | | N/A | | N/A |
John M. Zerr - 1962 Senior Vice President | | 2006 | | Chief Operating Officer of the Americas; Senior Vice President, Invesco Advisers, Inc. (formerly known as Invesco Institutional (N.A.), Inc.) (registered investment adviser); Senior Vice President, Invesco Distributors, Inc. (formerly known as Invesco AIM Distributors, Inc.); Director and Vice President, Invesco Investment Services, Inc. (formerly known as Invesco AIM Investment Services, Inc.) Senior Vice President, The Invesco Funds; Managing Director, Invesco Capital Management LLC; Senior Vice President, Invesco Capital Markets, Inc. (formerly known as Van Kampen Funds Inc.); Manager, Invesco Specialized Products, LLC; Member, Invesco Canada Funds Advisory Board; Director, President and Chief Executive Officer, Invesco Corporate Class Inc. (corporate mutual fund company); Director, Chairman, President and Chief Executive Officer, Invesco Canada Ltd. (formerly known as Invesco Trimark Ltd./Invesco Trimark Ltèe) (registered investment adviser and registered transfer agent); President, Invesco, Inc.; President, Invesco Global Direct Real Estate Feeder GP Ltd.; President, Invesco IP Holdings (Canada) Ltd; President, Invesco Global Direct Real Estate GP Ltd.; and President Invesco Financial Services Ltd. / Services Financiers Invesco Ltée Formerly: Director and Chairman, Invesco Trust Company, Manager, Invesco Indexing LLC; Director, Invesco Investment Advisers LLC (formerly known as Van Kampen Asset Management); President, Trimark Investments Ltd/Services Financiers Invesco Ltee; Director and Senior Vice President, Invesco Insurance Agency, Inc.; Director and Senior Vice President, Invesco Management Group, Inc. (formerly known as Invesco AIM Management Group, Inc.); Secretary and General Counsel, Invesco Management Group, Inc. (formerly known as Invesco AIM Management Group, Inc.); Secretary, Invesco Investment Services, Inc. (formerly known as Invesco AIM Investment Services, Inc.); Chief Legal Officer and Secretary, The Invesco Funds; Secretary and General Counsel, Invesco Investment Advisers LLC (formerly known as Van Kampen Asset Management); Secretary and General Counsel, Invesco Capital Markets, Inc. (formerly known as Van Kampen Funds Inc.); Chief Legal Officer, Invesco Exchange-Traded Fund Trust, Invesco Exchange-Traded Fund Trust II, Invesco India Exchange-Traded Fund Trust, Invesco Actively Managed Exchange-Traded Fund Trust, Invesco Actively Managed Exchange-Traded Commodity Fund Trust and Invesco Exchange-Traded Self-Indexed Fund Trust; Secretary, Invesco Indexing LLC; Director, Secretary, General Counsel and Senior Vice President, Van Kampen Exchange Corp.; Director, Vice President and Secretary, IVZ Distributors, Inc. (formerly known as INVESCO Distributors, Inc.); Director and Vice President, INVESCO Funds Group, Inc.; Director and Vice President, Van Kampen Advisors Inc.; Director, Vice President, Secretary and General Counsel, Van Kampen Investor Services Inc.;Director and Secretary, Invesco Distributors, Inc. (formerly known as Invesco AIM Distributors, Inc.); Director, Senior Vice President, General Counsel and Secretary, Invesco AIM Advisers, Inc. and Van Kampen Investments Inc.; Director, Vice President and Secretary, Fund Management Company; Director, Senior Vice President, Secretary, General Counsel and Vice President, Invesco AIM Capital Management, Inc.; and Chief Operating Officer and General Counsel, Liberty Ridge Capital, Inc. (an investment adviser) | | N/A | | N/A |
| | |
| T-4 | | Invesco Comstock Fund |
Trustees and Officers–(continued)
| | | | | | | | |
Name, Year of Birth and
Position(s) Held with the Trust | | Trustee and/or
Officer Since | | Principal Occupation(s) During Past 5 Years | | Number of
Funds in Fund Complex
Overseen by
Trustee | | Other Directorship(s) Held by Trustee
During At Least The Past 5 Years |
| Officers–(continued) | | | | | | |
Tony Wong - 1973 Senior Vice President | | 2023 | | Senior Managing Director, Invesco Ltd.; Director, Chairman, Chief Executive Officer and President, Invesco Advisers, Inc.; Director and Chairman, Invesco Private Capital, Inc., INVESCO Private Capital Investments, Inc. and INVESCO Realty, Inc.; Director, Invesco Senior Secured Management, Inc.; President, Invesco Managed Accounts, LLC and SNW Asset Management Corporation; and Senior Vice President, The Invesco Funds Formerly: Assistant Vice President, The Invesco Funds; and Vice President, Invesco Advisers, Inc. | | N/A | | N/A |
| Stephanie C. Butcher - 1971 Senior Vice President | | 2023 | | Senior Managing Director, Invesco Ltd.; Senior Vice President, The Invesco Funds; Director and Chief Executive Officer, Invesco Asset Management Limited | | N/A | | N/A |
| Adrien Deberghes - 1967 Principal Financial Officer, Treasurer and Senior Vice President | | 2020 | | Head of the Fund Office of the CFO and Fund Administration; Vice President, Invesco Advisers, Inc.; Director, Invesco Trust Company; Principal Financial Officer, Treasurer and Senior Vice President, The Invesco Funds; Vice President, Invesco Exchange-Traded Fund Trust, Invesco Exchange-Traded Fund Trust II, Invesco India Exchange-Traded Fund Trust, Invesco Actively Managed Exchange-Traded Fund Trust, Invesco Actively Managed Exchange-Traded Commodity Fund Trust and Invesco Exchange-Traded Self-Indexed Fund Trust Formerly: Vice President, The Invesco Funds; Senior Vice President and Treasurer, Fidelity Investments | | N/A | | N/A |
| Crissie M. Wisdom - 1969 Anti-Money Laundering Compliance Officer | | 2013 | | Anti-Money Laundering and OFAC Compliance Officer for Invesco U.S. entities including: Invesco Advisers, Inc. and its affiliates, Invesco Capital Markets, Inc., Invesco Distributors, Inc., Invesco Investment Services, Inc., The Invesco Funds, Invesco Capital Management, LLC, Invesco Trust Company; and Fraud Prevention Manager for Invesco Investment Services, Inc. | | N/A | | N/A |
Todd F. Kuehl - 1969 Chief Compliance Officer and Senior Vice President | | 2020 | | Chief Compliance Officer, Invesco Advisers, Inc. (registered investment adviser); and Chief Compliance Officer and Senior Vice President, The Invesco Funds Formerly: Managing Director and Chief Compliance Officer, Legg Mason (Mutual Funds); Chief Compliance Officer, Legg Mason Private Portfolio Group (registered investment adviser) | | N/A | | N/A |
| James Bordewick, Jr. - 1959 Senior Vice President and Senior Officer | | 2022 | | Senior Vice President and Senior Officer, The Invesco Funds Formerly: Chief Legal Officer, KingsCrowd, Inc. (research and analytical platform for investment in private capital markets); Chief Operating Officer and Head of Legal and Regulatory, Netcapital (private capital investment platform); Managing Director, General Counsel of asset management and Chief Compliance Officer for asset management and private banking, Bank of America Corporation; Chief Legal Officer, Columbia Funds and BofA Funds; Senior Vice President and Associate General Counsel, MFS Investment Management; Chief Legal Officer, MFS Funds; Associate, Ropes & Gray; and Associate, Gaston Snow & Ely Bartlett | | N/A | | N/A |
The Statement of Additional Information of the Trust includes additional information about the Fund’s Trustees and is available upon request, without charge, by calling 1.800.959.4246. Please refer to the Fund’s Statement of Additional Information for information on the Fund’s sub-advisers.
| | | | | | |
| Office of the Fund | | Investment Adviser | | Distributor | | Auditors |
| 11 Greenway Plaza | | Invesco Advisers, Inc. | | Invesco Distributors, Inc. | | PricewaterhouseCoopers LLP |
| Houston, TX 77046-1173 | | 1331 Spring Street, NW, Suite 2500 | | 11 Greenway Plaza | | 1000 Louisiana Street, Suite 5800 |
| | Atlanta, GA 30309 | | Houston, TX 77046-1173 | | Houston, TX 77002-5021 |
| | | |
| Counsel to the Fund | | Counsel to the Independent Trustees | | Transfer Agent | | Custodian |
| Stradley Ronon Stevens & Young, LLP | | Sidley Austin LLP | | Invesco Investment Services, Inc. | | State Street Bank and Trust Company |
| 2005 Market Street, Suite 2600 | | 787 Seventh Avenue | | 11 Greenway Plaza | | 225 Franklin Street |
| Philadelphia, PA 19103-7018 | | New York, NY 10019 | | Houston, TX 77046-1173 | | Boston, MA 02110-2801 |
| | |
| T-5 | | Invesco Comstock Fund |
Proxy Results
A Special Joint Meeting (“Meeting”) of Shareholders of AIM Sector Funds (Invesco Sector Funds), a Delaware statutory trust (“Trust”), was held on January 16, 2024. The Meeting was held for the following purpose:
| (1) | Elect 14 trustees to the Board of Trustees of the Trust, each of whom will serve until his or her successor is duly elected and qualified. |
The results of the voting on the above matter were as follows:
| | | | | | |
| | | Matter | | Votes For | | Votes Against/Withheld |
(1)* | | Beth Ann Brown | | 595,446,022.84 | | 16,915,661.31 |
| | Carol Deckbar | | 595,102,087.25 | | 17,259,596.89 |
| | Cynthia Hostetler | | 595,359,921.21 | | 17,001,762.94 |
| | Dr. Eli Jones | | 594,949,311.14 | | 17,412,373.00 |
| | Elizabeth Krentzman | | 595,453,833.65 | | 16,907,850.50 |
| | Jeffrey H. Kupor | | 595,342,690.51 | | 17,018,993.64 |
| | Anthony J. LaCava, Jr. | | 595,293,865.38 | | 17,067,818.77 |
| | James Liddy | | 594,980,026.97 | | 17,381,657.17 |
| | Dr. Prema Mathai-Davis | | 594,031,204.04 | | 18,330,480.11 |
| | Joel W. Motley | | 594,381,710.91 | | 17,979,973.23 |
| | Teresa M. Ressel | | 595,821,958.43 | | 16,539,725.72 |
| | Douglas Sharp | | 595,715,711.66 | | 16,645,972.48 |
| | Robert C. Troccoli | | 594,748,318.91 | | 17,613,365.24 |
| | Daniel S. Vandivort | | 595,002,691.19 | | 17,358,992.96 |
* Proposal 1 required approval by a combined vote of all the portfolios of AIM Sector Funds (Invesco Sector Funds).
| | |
| T-6 | | Invesco Comstock Fund |

Go paperless with eDelivery
Visit invesco.com/edelivery to enjoy the convenience and security of anytime electronic access to your investment documents.
With eDelivery, you can elect to have any or all of the following materials delivered straight to your inbox to download, save and print from your own computer:
∎ Fund reports and prospectuses
∎ Quarterly statements
∎ Daily confirmations
∎ Tax forms
Invesco mailing information
Send general correspondence to Invesco Investment Services, Inc., P.O. Box 219078, Kansas City, MO 64121-9078.
Important notice regarding delivery of security holder documents
To reduce Fund expenses, only one copy of most shareholder documents may be mailed to shareholders with multiple accounts at the same address (Householding). Mailing of your shareholder documents may be householded indefinitely unless you instruct us otherwise. If you do not want the mailing of these documents to be combined with those for other members of your household, please contact Invesco Investment Services, Inc. at 800 959 4246 or contact your financial institution. We will begin sending you individual copies for each account within 30 days after receiving your request.
Fund holdings and proxy voting information
The Fund provides a complete list of its portfolio holdings four times each year, at the end of each fiscal quarter. For the second and fourth quarters, the list appears, respectively, in the Fund’s semiannual and annual reports to shareholders. For the first and third quarters, the Fund files the list with the Securities and Exchange Commission (SEC) as an exhibit to its reports on Form N-PORT. The most recent list of portfolio holdings is available at invesco.com/completeqtrholdings. Shareholders can also look up the Fund’s Form N-PORT filings on the SEC website, sec.gov. The SEC file numbers for the Fund are shown below.
A description of the policies and procedures that the Fund uses to determine how to vote proxies relating to portfolio securities is available without charge, upon request, from our Client Services department at 800 959 4246, or at invesco.com/ corporate/about-us/esg. The information is also available on the SEC website, sec.gov.
Information regarding how the Fund voted proxies related to its portfolio securities during the most recent 12-month period ended June 30 is available at invesco.com/proxysearch. This information is also available on the SEC website, sec.gov.
Invesco Advisers, Inc. is an investment adviser; it provides investment advisory services to individual and institutional clients and does not sell securities. Invesco Distributors, Inc. is the US distributor for Invesco Ltd.’s retail mutual funds, exchange-traded funds and institutional money market funds. Both are wholly owned, indirect subsidiaries of Invesco Ltd.

| | | | |
| SEC file number(s): 811-03826 and 002-85905 | | Invesco Distributors, Inc. | | VK-COM-AR-1 |

| | |
| | |
| Annual Report to Shareholders | | April 30, 2024 |
Invesco Comstock Select Fund
Nasdaq:
A: CGRWX ∎ C: CGRCX ∎ R: CGRNX ∎ Y: CGRYX ∎ R5: IOVVX ∎ R6: OGRIX
| | |
Beginning in July 2024, amendments adopted by the Securities and Exchange Commission will substantially impact the design, content, and delivery of shareholder reports. These newly designed shareholder reports will highlight key fund information in a clear and concise format and must be mailed to each shareholder that has not elected to receive the reports electronically. Other information, including financial statements, will no longer be included in the shareholder report but will be available at invesco.com/reports, delivered upon request, and filed on a semi-annual basis on Form N-CSR. If you would like to receive shareholder reports and other communications electronically instead of by mail, you may make that request by contacting your financial intermediary (such as a broker-dealer or bank) or, if you are a direct investor, by enrolling at invesco.com/edelivery. If you do not make this request or enroll in e-delivery, you will receive future shareholder reports and other communications by mail. | | |
Management’s Discussion of Fund Performance
| | | | |
| |
Performance summary | |
For the fiscal year ended April 30, 2024, Class A shares of Invesco Comstock Select Fund (the Fund), at net asset value (NAV), underperformed the Russell 1000 Value Index. | |
Your Fund’s long-term performance appears later in this report. | |
| |
Fund vs. Indexes | |
Total returns, 4/30/23 to 4/30/24, at net asset value (NAV). Performance shown does not include applicable contingent deferred sales charges (CDSC) or front-end sales charges, which would have reduced performance. | |
Class A Shares | | | 13.00 | % |
Class C Shares | | | 12.16 | |
Class R Shares | | | 12.71 | |
Class Y Shares | | | 13.27 | |
Class R5 Shares | | | 13.39 | |
Class R6 Shares | | | 13.39 | |
S&P 500 Index▼* | | | 22.66 | |
Russell 1000 Value Index▼* | | | 13.42 | |
| |
Source(s): ▼RIMES Technologies Corp. | | | | |
*Effective August 28, 2023, the Fund changed its broad-based securities market benchmark from the Russell 1000 Value Index to the S&P 500 Index. The Fund believes the S&P 500 Index is an appropriate benchmark for evaluating the Fund’s performance against the overall applicable market. | |
Market conditions and your Fund
The US economy and equity markets remained resilient in the second quarter of 2023, as milder inflation data and better-than-expected corporate earnings supported equities, with most major indexes posting gains for the quarter and with some big tech names providing optimistic future guidance. Following the March 2023 banking crisis, markets stabilized in April, as corporate earnings season got underway with many companies exceeding earnings and revenue estimates. Facing persistently strong employment data, the US Federal Reserve (the Fed) raised the federal funds rate by 0.25% at its May 2023 meeting,1 but left rates unchanged at its June meeting, giving investors the long-awaited “pause” in rate hikes, which sent equities broadly higher.
Equity markets declined in the third quarter and into October 2023 as a resilient US economy complicated the Fed’s efforts to tame inflation. While inflation has slowed from its peak in 2022, in July 2023, the Consumer Price Index (CPI) rose by 0.2% and the 12-month headline inflation rate rose to 3.2% from 3% in June.2 Due to the persistence of inflation, the Fed raised the federal funds rate again in July by 0.25%.1 The CPI data released in September was higher-than-expected and the overall US labor market remained tight with unemployment near historic lows. At the same time the third quarter year-over-year Gross Domestic Product (GDP) estimate was 4.9%, far above expectations.2 Despite the higher-than-expected GDP for the third quarter of 2023, the Fed held interest rates steady at its September and October meetings, but left open the possibility of another rate hike before the end of the calendar year.1
US equity markets posted strong gains in the fourth quarter of 2023 as investors anticipated the potential end of interest rate hikes by the Fed. Inflation slowed during the period as the CPI 12-month headline inflation rate fell to 3.1% in November from 3.7% in September, significantly below the 2022 peak of 9.1%.2 The Fed kept rates steady at its mid-December meeting and indicated that three rate cuts are expected in 2024. Fed chairman Powell noted that “the Fed’s policy rate is likely at or near its peak for this tightening cycle,”1 which prompted a strong equity rally into 2023 year-end and the yield on the 10-year US Treasury to fall from nearly 5% in October to below 4%.3
US equity markets rallied in the first quarter of 2024. In February, the S&P 500 Index closed above the 5,000 milestone for the first time.3 The US economy defied recession predictions, achieving a growth rate of 2.5% in 2023 and the labor market remained robust, with continued payroll gains and unemployment still historically low - below 4%.2 Inflation, however, remained persistent. January and February increases in the CPI were higher than expected, leading the Fed to defer its proposed interest rate cuts to the second half of 2024.1 Still, investors were mostly pleased by corporate earnings growth, except for three of the so-called “Magnificent Seven” stocks. Apple, Alphabet and Tesla’s stock prices suffered due to disappointing earnings, sales and revenue, or weak forward guidance. Although the stock market had a strong start in 2024, the stock market retreated in April. As consumer spending and a strong labor market were driving economic activity, inflation and interest rate concerns persisted and investors feared another delay in expected rate cuts by the Fed, or worse, rate hikes.
Despite continued higher rates and increased market volatility, US stocks for the fiscal year had strong positive returns of 22.66%, as measured by the S&P 500 Index.4
On the positive side, stock selection in financials and communication services, followed by having no exposure to utilities and real estate sectors were key contributors. Within financials, notably banks, holdings Bank of America and regional bank, Citizens Financial, were top performers on an absolute and relative basis. Bank of America benefited from their strategy of responsible growth due to having tighter underwriting standards and strong credit quality, as evidenced by lower loan loss ratios than peers under the annual Fed stress test. Within insurance, American International Group materially outperformed based on revenues and earnings continually exceeding expectations. In communications services, Alphabet (formerly Google) and Meta Platforms (formerly Facebook) were stand out contributors within the sector. Meta Platforms outperformed during much of 2023 as investors celebrated a pivot to focus on efficiency and returns, while revenue and engagement trends were improving via cost reductions. Having no exposure in real estate and utilities enhanced relative return, as those sectors were among the worst returning sectors for the fiscal year.
On the negative side, weak stock selection within consumer discretionary, health care, information technology (IT) and industrials were key detractors to the Fund’s relative performance. In consumer discretionary, casinos and gaming company, Las Vegas Sands, materially underperformed, negatively impacting relative returns. The stock price suffered due to the pace of recovery post COVID-19 being slower than expected with uneven reopening in China. However, the company reinstated its quarterly dividend, a positive sign. In health care, Baxter Interna-tional and Universal Health Services, were top detractors. Universal Health Services underperformed after reporting weaker than expected volumes and resulting revenues from the behavioral service division. Weak stock selection within IT also detracted from the Fund’s relative performance. DXC Tech-nology underperformed due to a marked slowdown in their pass-through hardware sales, declining bookings and delayed or halted projects.
The Fund’s overweight exposures were in health care, consumer staples, consume discretionary, communication services and energy sectors. The Fund currently has no exposure to utilities, materials or real estate sectors and is underweight in industrials.
Investors are focusing on the Fed’s response to inflation hoping for rate cuts in 2024. Geopolitical risks from the Russia/ Ukraine and Israel/Hamas wars are also major concerns, particularly if these wars spread to other countries in Eastern Europe and the
| | |
| 2 | | Invesco Comstock Select Fund |
Middle East. Given these factors, we believe stocks are likely to see continued volatility for the foreseeable future. In our view, market volatility may create opportunities for patient, disciplined long-term investors.
Thank you for your investment in Invesco Comstock Select Fund and for sharing our long-term investment horizon.
| 1 | Source: US Federal Reserve |
| 2 | Source: US Bureau of Labor Statistics |
| 4 | Source: Morningstar Direct |
Portfolio manager(s):
Devin Armstrong - Lead
Kevin Holt - Lead
James Warwick
The views and opinions expressed in management’s discussion of Fund performance are those of Invesco Advisers, Inc. and its affiliates. These views and opinions are subject to change at any time based on factors such as market and economic conditions. These views and opinions may not be relied upon as investment advice or recommendations, or as an offer for a particular security. The information is not a complete analysis of every aspect of any market, country, industry, security or the Fund. Statements of fact are from sources considered reliable, but Invesco Advisers, Inc. makes no representation or warranty as to their completeness or accuracy. Although historical performance is no guarantee of future results, these insights may help you understand our investment management philosophy.
See important Fund and, if applicable, index disclosures later in this report.
| | |
| 3 | | Invesco Comstock Select Fund |
Your Fund’s Long-Term Performance
Results of a $10,000 Investment – Oldest Share Class(es)
Fund and index data from 4/30/14
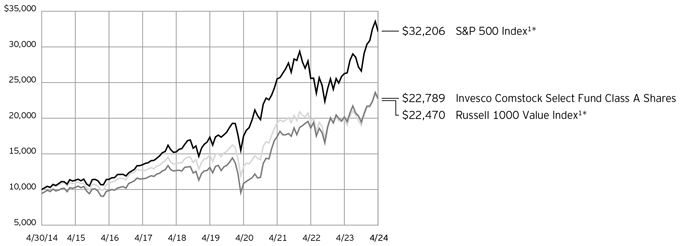
| 1 | Source: RIMES Technologies Corp. |
| * | Effective August 28, 2023, the Fund changed its broad-based securities market benchmark from the Russell 1000 Value Index to the S&P 500 Index. The Fund believes the S&P 500 Index is an appropriate benchmark for evaluating the Fund’s performance against the overall applicable market. |
Past performance cannot guarantee future results.
The data shown in the chart include reinvested distributions, applicable sales charges and Fund expenses including management
fees. Index results include reinvested dividends, but they do not reflect sales charges. Performance of the peer group, if applicable, reflects fund expenses and management fees;
performance of a market index does not. Performance shown in the chart does not reflect deduction of taxes a shareholder would pay on Fund distributions or sale of Fund shares.
| | |
| 4 | | Invesco Comstock Select Fund |
| | | | |
| |
Average Annual Total Returns | |
As of 4/30/24, including maximum applicable sales charges | |
| |
Class A Shares | | | | |
Inception (9/16/85) | | | 9.62 | % |
10 Years | | | 8.59 | |
5 Years | | | 10.45 | |
1 Year | | | 6.78 | |
| |
Class C Shares | | | | |
Inception (5/1/96) | | | 7.42 | % |
10 Years | | | 8.55 | |
5 Years | | | 10.87 | |
1 Year | | | 11.16 | |
| |
Class R Shares | | | | |
Inception (3/1/01) | | | 7.16 | % |
10 Years | | | 8.93 | |
5 Years | | | 11.42 | |
1 Year | | | 12.71 | |
| |
Class Y Shares | | | | |
Inception (12/16/96) | | | 7.82 | % |
10 Years | | | 9.46 | |
5 Years | | | 11.97 | |
1 Year | | | 13.27 | |
| |
Class R5 Shares | | | | |
10 Years | | | 9.39 | % |
5 Years | | | 12.09 | |
1 Year | | | 13.39 | |
| |
Class R6 Shares | | | | |
Inception (2/28/12) | | | 10.98 | % |
10 Years | | | 9.64 | |
5 Years | | | 12.11 | |
1 Year | | | 13.39 | |
Effective May 24, 2019, Class A, Class C, Class R, Class Y and Class I shares of the Oppenheimer Value Fund, (the predecessor fund), were reorganized into Class A, Class C, Class R, Class Y and Class R6 shares, respectively, of the Invesco Oppen-heimer Value Fund. Note: The Fund was subsequently renamed the Invesco Comstock Select Fund (the Fund). Returns shown above, for periods ending on or prior to May 24, 2019, for Class A, Class C, Class R, Class Y and Class R6 shares are those for Class A, Class C, Class R, Class Y and Class I shares of the predecessor fund. Share class returns will differ from the predecessor fund because of different expenses.
Class R5 shares incepted on May 24, 2019. Performance shown on and prior to that date is that of the predecessor fund’s Class A shares at net asset value and includes the 12b-1 fees applicable to Class A shares.
The performance data quoted represent past performance and cannot guarantee future results; current performance may be lower or higher. Please visit invesco.com/ performance for the most recent month-end performance. Performance figures reflect reinvested distributions, changes in net asset value and the effect of the maximum sales charge unless otherwise stated.
Performance figures do not reflect deduction of taxes a shareholder would pay on Fund distributions or sale of Fund shares. Investment return and principal value will fluctuate so that you may have a gain or loss when you sell shares.
Class A share performance reflects the maximum 5.50% sales charge, and Class C share performance reflects the applicable contingent deferred sales charge (CDSC) for the period involved. The CDSC on Class C shares is 1% for the first year after purchase. Class R, Class Y, Class R5 and Class R6 shares do not have a front-end sales charge or a CDSC; therefore, performance is at net asset value.
The performance of the Fund’s share classes will differ primarily due to different sales charge structures and class expenses.
Fund performance reflects any applicable fee waivers and/or expense reimbursements. Had the adviser not waived fees and/or reimbursed expenses currently or in the past, returns would have been lower. See current prospectus for more information.
| | |
| 5 | | Invesco Comstock Select Fund |
Supplemental Information
Invesco Comstock Select Fund’s investment objective is to seek capital appreciation.
| ∎ | Unless otherwise stated, information presented in this report is as of April 30, 2024, and is based on total net assets. |
| ∎ | Unless otherwise noted, all data is provided by Invesco. |
| ∎ | To access your Fund’s reports/prospectus, visit invesco.com/fundreports. |
About indexes used in this report
| ∎ | The Russell 1000® Value Index is an unmanaged index considered representative of large-cap value stocks. The Russell 1000 Value Index is a trademark/service mark of the Frank Russell Co. Russell® is a trademark of the Frank Russell Co. |
| ∎ | The S&P 500® Index is an unmanaged index considered representative of the US stock market. |
| ∎ | The Fund is not managed to track the performance of any particular index, including the index(es) described here, and consequently, the performance of the Fund may deviate significantly from the performance of the index(es). |
| ∎ | A direct investment cannot be made in an index. Unless otherwise indicated, index results include reinvested dividends, and they do not reflect sales charges. Performance of the peer group, if applicable, reflects fund expenses; performance of a market index does not. |
Liquidity Risk Management Program
| | In compliance with Rule 22e-4 under the Investment Company Act of 1940, as amended (the “Liquidity Rule”), the Fund has adopted and implemented a liquidity risk management program in accordance with the Liquidity Rule (the “Program”). The Program is reasonably designed to assess and manage the Fund’s liquidity risk, which is the risk that the Fund could not meet redemption requests without significant dilution of remaining investors’ interests in the Fund. The Board of Trustees of the Fund (the “Board”) has appointed Invesco Advisers, Inc. (“Invesco”), the Fund’s investment adviser, as the Program’s administrator, and Invesco has delegated oversight of the Program to the Liquidity Risk Management Committee (the “Committee”), which is composed of senior representatives from relevant business groups at Invesco. |
| | As required by the Liquidity Rule, the Program includes policies and procedures providing for an assessment, no less frequently than annually, of the Fund’s liquidity risk that takes into account, as relevant to the Fund’s liquidity risk: (1) the Fund’s investment strategy and liquidity of |
| | portfolio investments during both normal and reasonably foreseeable stressed conditions; (2) short-term and long-term cash flow projections for the Fund during both normal and reasonably foreseeable stressed conditions; and (3) the Fund’s holdings of cash and cash equivalents and any borrowing arrangements. The Liquidity Rule also requires the classification of the Fund’s investments into categories that reflect the assessment of their relative liquidity under current market conditions. The Fund classifies its investments into one of four categories defined in the Liquidity Rule: “Highly Liquid,” “Moderately Liquid,” “Less Liquid,” and “Illiquid.” Funds that are not invested primarily in “Highly Liquid Investments” that are assets (cash or investments that are reasonably expected to be convertible into cash within three business days without significantly changing the market value of the investment) are required to establish a “Highly Liquid Investment Minimum” (“HLIM”), which is the minimum percentage of net assets that must be invested in Highly Liquid Investments. Funds with HLIMs have procedures for addressing HLIM shortfalls, including reporting to the Board and the SEC (on a non-public basis) as required by the Program and the Liquidity Rule. In addition, the Fund may not acquire an investment if, immediately after the acquisition, over 15% of the Fund’s net assets would consist of “Illiquid Investments” that are assets (an investment that cannot reasonably be expected to be sold or disposed of in current market conditions in seven calendar days or less without the sale or disposition significantly changing the market value of the investment). The Liquidity Rule and the Program also require reporting to the Board and the SEC (on a non-public basis) if a Fund’s holdings of Illiquid Investments exceed 15% of the Fund’s assets. |
| | At a meeting held on March 25-27, 2024, the Committee presented a report to the Board that addressed the operation of the Program and assessed the Program’s adequacy and effectiveness of implementation (the “Report”). The Report covered the period from January 1, 2023 through December 31, 2023 (the “Program Reporting Period”). The Report discussed |
| | notable events affecting liquidity over the Program Reporting Period, including the impact of the end of an aggressive rate hike cycle, signs that inflation was abating and market liquidity was reverting to normal, and the overall market. The Report noted that there were no material changes to the Program during the Program Reporting Period. |
| | The Report stated, in relevant part, that during the Program Reporting Period: |
| ∎ | The Program, as adopted and implemented, remained reasonably designed to assess and manage the Fund’s liquidity risk and was operated effectively to achieve that goal; |
| ∎ | The Fund’s investment strategy remained appropriate for an open-end fund; |
| ∎ | The Fund was able to meet requests for redemption without significant dilution of remaining investors’ interests in the Fund; |
| ∎ | The Fund did not breach the 15% limit on Illiquid Investments; and |
| ∎ | The Fund primarily held Highly Liquid Investments and therefore has not adopted an HLIM. |
|
|
This report must be accompanied or preceded by a currently effective Fund prospectus, which contains more complete information, including sales charges and expenses. Investors should read it carefully before investing. |
|
| NOT FDIC INSURED | MAY LOSE VALUE | NO BANK GUARANTEE |
| | |
| 6 | | Invesco Comstock Select Fund |
Fund Information
Portfolio Composition
| | | | | |
| By sector | | % of total net assets |
| |
Financials | | | | 22.84 | % |
| |
Health Care | | | | 18.74 | |
| |
Industrials | | | | 13.07 | |
| |
Consumer Staples | | | | 11.99 | |
| |
Energy | | | | 9.64 | |
| |
Information Technology | | | | 8.50 | |
| |
Consumer Discretionary | | | | 7.17 | |
| |
Communication Services | | | | 6.29 | |
| |
| Money Market Funds Plus Other Assets Less Liabilities | | | | 1.76 | |
Top 10 Equity Holdings*
| | | | | | | |
| | | | | % of total net assets |
| | |
| 1. | | Wells Fargo & Co. | | | | 5.99 | % |
| | |
| 2. | | Citizens Financial Group, Inc. | | | | 5.54 | |
| | |
| 3. | | Bank of America Corp. | | | | 4.92 | |
| | |
| 4. | | Suncor Energy, Inc. | | | | 4.84 | |
| | |
| 5. | | Sanofi S.A., ADR | | | | 4.59 | |
| | |
| 6. | | Merck & Co., Inc. | | | | 4.28 | |
| | |
| 7. | | Elevance Health, Inc. | | | | 3.96 | |
| | |
| 8. | | Johnson Controls International PLC | | | | 3.91 | |
| | |
| 9. | | Keurig Dr Pepper, Inc. | | | | 3.74 | |
| | |
| 10. | | eBay, Inc. | | | | 3.67 | |
The Fund’s holdings are subject to change, and there is no assurance that the Fund will continue to hold any particular security.
| * | Excluding money market fund holdings, if any. |
Data presented here are as of April 30, 2024.
| | |
| 7 | | Invesco Comstock Select Fund |
Schedule of Investments(a)
April 30, 2024
| | | | | | | | |
| | | Shares | | | Value | |
|
| |
Common Stocks & Other Equity Interests–98.24% | |
Aerospace & Defense–2.13% | |
Textron, Inc. | | | 197,810 | | | $ | 16,732,748 | |
|
| |
|
Air Freight & Logistics–3.37% | |
FedEx Corp. | | | 100,937 | | | | 26,423,288 | |
|
| |
|
Broadline Retail–3.67% | |
eBay, Inc. | | | 558,156 | | | | 28,767,360 | |
|
| |
|
Building Products–3.91% | |
Johnson Controls International PLC | | | 471,974 | | | | 30,711,348 | |
|
| |
|
Cable & Satellite–1.14% | |
Charter Communications, Inc., Class A(b)(c) | | | 34,863 | | | | 8,922,836 | |
|
| |
|
Casinos & Gaming–3.50% | |
Las Vegas Sands Corp. | | | 618,546 | | | | 27,438,701 | |
|
| |
|
Communications Equipment–2.76% | |
Cisco Systems, Inc. | | | 461,192 | | | | 21,666,800 | |
|
| |
|
Diversified Banks–13.89% | |
Bank of America Corp. | | | 1,043,577 | | | | 38,622,785 | |
|
| |
Fifth Third Bancorp | | | 640,162 | | | | 23,340,307 | |
|
| |
Wells Fargo & Co. | | | 792,676 | | | | 47,021,540 | |
|
| |
| | | | | | | 108,984,632 | |
|
| |
|
Electrical Components & Equipment–3.66% | |
Emerson Electric Co. | | | 266,390 | | | | 28,711,514 | |
|
| |
|
Food Distributors–3.55% | |
Sysco Corp. | | | 374,380 | | | | 27,823,922 | |
|
| |
|
Health Care Equipment–3.21% | |
Medtronic PLC | | | 313,701 | | | | 25,171,368 | |
|
| |
|
Health Care Services–2.72% | |
CVS Health Corp. | | | 315,419 | | | | 21,357,020 | |
|
| |
|
Household Products–2.38% | |
Kimberly-Clark Corp. | | | 137,100 | | | | 18,718,263 | |
|
| |
|
Integrated Oil & Gas–9.64% | |
Chevron Corp. | | | 155,875 | | | | 25,137,961 | |
|
| |
Shell PLC, ADR | | | 175,136 | | | | 12,550,246 | |
|
| |
Suncor Energy, Inc. (Canada) | | | 994,536 | | | | 37,981,330 | |
|
| |
| | | | | | | 75,669,537 | |
|
| |
|
Interactive Media & Services–5.15% | |
Alphabet, Inc., Class A(b) | | | 113,958 | | | | 18,550,083 | |
|
| |
Meta Platforms, Inc., Class A | | | 50,858 | | | | 21,877,586 | |
|
| |
| | | | | | | 40,427,669 | |
|
| |
|
IT Consulting & Other Services–1.45% | |
DXC Technology Co.(b) | | | 583,644 | | | | 11,375,222 | |
|
| |
Investment Abbreviations:
ADR - American Depositary Receipt
| | | | | | | | |
| | | Shares | | | Value | |
|
| |
Managed Health Care–3.95% | |
Elevance Health, Inc. | | | 58,706 | | | $ | 31,030,817 | |
|
| |
|
Multi-line Insurance–3.41% | |
American International Group, Inc. | | | 355,381 | | | | 26,763,743 | |
|
| |
|
Packaged Foods & Meats–2.32% | |
Kraft Heinz Co. (The) | | | 471,814 | | | | 18,216,738 | |
|
| |
|
Pharmaceuticals–8.86% | |
Merck & Co., Inc. | | | 259,854 | | | | 33,578,334 | |
|
| |
Sanofi S.A., ADR | | | 731,105 | | | | 35,992,299 | |
|
| |
| | | | | | | 69,570,633 | |
|
| |
|
Regional Banks–5.54% | |
Citizens Financial Group, Inc. | | | 1,274,962 | | | | 43,488,954 | |
|
| |
|
Semiconductors–1.34% | |
Intel Corp. | | | 344,621 | | | | 10,500,602 | |
|
| |
|
Soft Drinks & Non-alcoholic Beverages–3.74% | |
Keurig Dr Pepper, Inc. | | | 870,250 | | | | 29,327,425 | |
|
| |
|
Systems Software–2.95% | |
Microsoft Corp. | | | 59,391 | | | | 23,122,698 | |
|
| |
Total Common Stocks & Other Equity Interests
(Cost $627,639,767) | | | | 770,923,838 | |
|
| |
|
Money Market Funds–1.65% | |
Invesco Government & Agency
Portfolio, Institutional Class,
5.23%(d)(e) | | | 4,518,130 | | | | 4,518,130 | |
|
| |
Invesco Liquid Assets Portfolio, Institutional Class, 5.34%(d)(e) | | | 3,243,381 | | | | 3,244,354 | |
|
| |
Invesco Treasury Portfolio, Institutional Class, 5.22%(d)(e) | | | 5,163,577 | | | | 5,163,577 | |
|
| |
Total Money Market Funds (Cost $12,924,391) | | | | 12,926,061 | |
|
| |
TOTAL INVESTMENTS IN SECURITIES (excluding investments purchased with cash collateral from securities on loan)-99.89% (Cost $640,564,158) | | | | 783,849,899 | |
|
| |
Investments Purchased with Cash Collateral from Securities on Loan | |
Money Market Funds–1.16% | |
Invesco Private Government Fund,
5.29%(d)(e)(f) | | | 2,579,145 | | | | 2,579,145 | |
|
| |
Invesco Private Prime Fund,
5.46%(d)(e)(f) | | | 6,563,495 | | | | 6,565,464 | |
|
| |
Total Investments Purchased with Cash Collateral from Securities on Loan (Cost $9,144,841) | | | | 9,144,609 | |
|
| |
TOTAL INVESTMENTS IN SECURITIES–101.05% (Cost $649,708,999) | | | | 792,994,508 | |
|
| |
OTHER ASSETS LESS LIABILITIES–(1.05)% | | | | (8,275,791 | ) |
|
| |
NET ASSETS–100.00% | | | $ | 784,718,717 | |
|
| |
See accompanying Notes to Financial Statements which are an integral part of the financial statements.
| | |
| 8 | | Invesco Comstock Select Fund |
Notes to Schedule of Investments:
| (a) | Industry and/or sector classifications used in this report are generally according to the Global Industry Classification Standard, which was developed by and is the exclusive property and a service mark of MSCI Inc. and Standard & Poor’s. |
| (b) | Non-income producing security. |
| (c) | All or a portion of this security was out on loan at April 30, 2024. |
| (d) | Affiliated holding. Affiliated holdings are investments in entities which are under common ownership or control of Invesco Ltd. or are investments in entities in which the Fund owns 5% or more of the outstanding voting securities. The table below shows the Fund’s transactions in, and earnings from, its investments in affiliates for the fiscal year ended April 30, 2024. |
| | | | | | | | | | | | | | | | | | | | | | | | | | | | |
| | | Value April 30, 2023 | | | Purchases at Cost | | | Proceeds from Sales | | | Change in Unrealized Appreciation (Depreciation) | | | Realized Gain | | | Value April 30, 2024 | | | Dividend Income | |
| Investments in Affiliated Money Market Funds: | |
Invesco Government & Agency Portfolio, Institutional Class | | $ | 9,164,368 | | | $ | 52,662,257 | | | $ | (57,308,495 | ) | | $ | - | | | $ | - | | | $ | 4,518,130 | | | $ | 632,695 | |
Invesco Liquid Assets Portfolio, Institutional Class | | | 6,560,689 | | | | 37,615,898 | | | | (40,934,640 | ) | | | (868) | | | | 3,275 | | | | 3,244,354 | | | | 459,657 | |
Invesco Treasury Portfolio, Institutional Class | | | 10,473,564 | | | | 60,185,436 | | | | (65,495,423 | ) | | | - | | | | - | | | | 5,163,577 | | | | 712,936 | |
| Investments Purchased with Cash Collateral from Securities on Loan: | | | | | | | | | | | | | | | | | | | | | | | | | | | | |
Invesco Private Government Fund | | | - | | | | 65,637,020 | | | | (63,057,875 | ) | | | - | | | | - | | | | 2,579,145 | | | | 58,939* | |
Invesco Private Prime Fund | | | - | | | | 156,008,227 | | | | (149,442,720 | ) | | | (232) | | | | 189 | | | | 6,565,464 | | | | 160,208* | |
Total | | $ | 26,198,621 | | | $ | 372,108,838 | | | $ | (376,239,153 | ) | | $ | (1,100) | | | $ | 3,464 | | | $ | 22,070,670 | | | $ | 2,024,435 | |
| | * | Represents the income earned on the investment of cash collateral, which is included in securities lending income on the Statement of Operations. Does not include rebates and fees paid to lending agent or premiums received from borrowers, if any. |
| (e) | The rate shown is the 7-day SEC standardized yield as of April 30, 2024. |
| (f) | The security has been segregated to satisfy the commitment to return the cash collateral received in securities lending transactions upon the borrower’s return of the securities loaned. See Note 1I. |
See accompanying Notes to Financial Statements which are an integral part of the financial statements.
| | |
| 9 | | Invesco Comstock Select Fund |
Statement of Assets and Liabilities
April 30, 2024
| | | | |
Assets: | | | | |
| |
Investments in unaffiliated securities, at value
(Cost $627,639,767)* | | $ | 770,923,838 | |
|
| |
Investments in affiliated money market funds, at value (Cost $22,069,232) | | | 22,070,670 | |
|
| |
Cash | | | 1,000,000 | |
|
| |
Foreign currencies, at value (Cost $152) | | | 149 | |
|
| |
Receivable for: | | | | |
Fund shares sold | | | 312,830 | |
|
| |
Dividends | | | 810,132 | |
|
| |
Investment for trustee deferred compensation and retirement plans | | | 116,754 | |
|
| |
Other assets | | | 30,474 | |
|
| |
Total assets | | | 795,264,847 | |
|
| |
| |
Liabilities: | | | | |
| |
Payable for: | | | | |
Dividends | | | 66 | |
|
| |
Fund shares reacquired | | | 870,373 | |
|
| |
Collateral upon return of securities loaned | | | 9,144,841 | |
|
| |
Accrued fees to affiliates | | | 332,479 | |
|
| |
Accrued trustees’ and officers’ fees and benefits | | | 59,995 | |
|
| |
Accrued other operating expenses | | | 21,622 | |
|
| |
Trustee deferred compensation and retirement plans | | | 116,754 | |
|
| |
Total liabilities | | | 10,546,130 | |
|
| |
Net assets applicable to shares outstanding | | $ | 784,718,717 | |
|
| |
| |
Net assets consist of: | | | | |
| |
Shares of beneficial interest | | $ | 624,195,627 | |
|
| |
Distributable earnings | | | 160,523,090 | |
|
| |
| | $ | 784,718,717 | |
|
| |
| | | | |
Net Assets: | | | | |
| |
Class A | | $ | 587,947,454 | |
|
| |
Class C | | $ | 28,366,454 | |
|
| |
Class R | | $ | 46,539,668 | |
|
| |
Class Y | | $ | 86,777,399 | |
|
| |
Class R5 | | $ | 10,602 | |
|
| |
Class R6 | | $ | 35,077,140 | |
|
| |
|
Shares outstanding, no par value, with an unlimited number of shares authorized: | |
| |
Class A | | | 17,329,205 | |
|
| |
Class C | | | 910,586 | |
|
| |
Class R | | | 1,421,977 | |
|
| |
Class Y | | | 2,459,440 | |
|
| |
Class R5 | | | 313 | |
|
| |
Class R6 | | | 997,680 | |
|
| |
Class A: | | | | |
Net asset value per share | | $ | 33.93 | |
|
| |
Maximum offering price per share
(Net asset value of $33.93 ÷ 94.50%) | | $ | 35.90 | |
|
| |
Class C: | | | | |
Net asset value and offering price per share | | $ | 31.15 | |
|
| |
Class R: | | | | |
Net asset value and offering price per share | | $ | 32.73 | |
|
| |
Class Y: | | | | |
Net asset value and offering price per share | | $ | 35.28 | |
|
| |
Class R5: | | | | |
Net asset value and offering price per share | | $ | 33.87 | |
|
| |
Class R6: | | | | |
Net asset value and offering price per share | | $ | 35.16 | |
|
| |
| * | At April 30, 2024, security with a value of $8,833,513 was on loan to brokers. |
See accompanying Notes to Financial Statements which are an integral part of the financial statements.
| | |
| 10 | | Invesco Comstock Select Fund |
Statement of Operations
For the year ended April 30, 2024
| | | | |
Investment income: | | | | |
| |
Dividends (net of foreign withholding taxes of $345,663) | | $ | 17,914,707 | |
|
| |
Dividends from affiliated money market funds (includes net securities lending income of $29,521) | | | 1,834,809 | |
|
| |
Total investment income | | | 19,749,516 | |
|
| |
| |
Expenses: | | | | |
| |
Advisory fees | | | 3,804,658 | |
|
| |
Administrative services fees | | | 106,469 | |
|
| |
Custodian fees | | | 5,905 | |
|
| |
Distribution fees: | | | | |
Class A | | | 1,350,094 | |
|
| |
Class C | | | 293,823 | |
|
| |
Class R | | | 219,641 | |
|
| |
Transfer agent fees – A, C, R and Y | | | 932,354 | |
|
| |
Transfer agent fees – R5 | | | 3 | |
|
| |
Transfer agent fees – R6 | | | 8,060 | |
|
| |
Trustees’ and officers’ fees and benefits | | | 37,454 | |
|
| |
Registration and filing fees | | | 113,033 | |
|
| |
Reports to shareholders | | | 51,704 | |
|
| |
Professional services fees | | | 24,217 | |
|
| |
Other | | | 17,649 | |
|
| |
Total expenses | | | 6,965,064 | |
|
| |
Less: Fees waived and/or expense offset arrangement(s) | | | (76,140 | ) |
|
| |
Net expenses | | | 6,888,924 | |
|
| |
Net investment income | | | 12,860,592 | |
|
| |
| |
Realized and unrealized gain (loss) from: | | | | |
| |
Net realized gain (loss) from: | | | | |
Unaffiliated investment securities | | | 24,981,533 | |
|
| |
Affiliated investment securities | | | 3,464 | |
|
| |
Foreign currencies | | | 100,479 | |
|
| |
Forward foreign currency contracts | | | (89,814 | ) |
|
| |
| | | 24,995,662 | |
|
| |
Change in net unrealized appreciation (depreciation) of: | | | | |
Unaffiliated investment securities | | | 53,920,611 | |
|
| |
Affiliated investment securities | | | (1,100 | ) |
|
| |
Foreign currencies | | | (6 | ) |
|
| |
| | | 53,919,505 | |
|
| |
Net realized and unrealized gain | | | 78,915,167 | |
|
| |
Net increase in net assets resulting from operations | | $ | 91,775,759 | |
|
| |
See accompanying Notes to Financial Statements which are an integral part of the financial statements.
| | |
| 11 | | Invesco Comstock Select Fund |
Statement of Changes in Net Assets
For the years ended April 30, 2024 and 2023
| | | | | | | | |
| | | 2024 | | | 2023 | |
|
| |
Operations: | | | | | | | | |
| | |
Net investment income | | $ | 12,860,592 | | | $ | 8,965,899 | |
|
| |
Net realized gain | | | 24,995,662 | | | | 70,908,163 | |
|
| |
Change in net unrealized appreciation (depreciation) | | | 53,919,505 | | | | (25,260,343 | ) |
|
| |
Net increase in net assets resulting from operations | | | 91,775,759 | | | | 54,613,719 | |
|
| |
| | |
Distributions to shareholders from distributable earnings: | | | | | | | | |
| | |
Class A | | | (28,539,326 | ) | | | (78,352,475 | ) |
Class C | | | (1,339,814 | ) | | | (4,667,309 | ) |
Class R | | | (2,182,952 | ) | | | (6,002,660 | ) |
Class Y | | | (4,471,286 | ) | | | (8,560,097 | ) |
Class R5 | | | (560 | ) | | | (1,643 | ) |
Class R6 | | | (1,529,873 | ) | | | (2,122,214 | ) |
|
| |
Total distributions from distributable earnings | | | (38,063,811 | ) | | | (99,706,398 | ) |
|
| |
| | |
Share transactions–net: | | | | | | | | |
| | |
Class A | | | (1,022,744 | ) | | | 54,311,924 | |
Class C | | | (4,230,255 | ) | | | 2,016,797 | |
Class R | | | 978,169 | | | | 5,796,323 | |
Class Y | | | 13,186,360 | | | | 19,704,735 | |
Class R6 | | | 12,551,654 | | | | 11,427,606 | |
|
| |
Net increase in net assets resulting from share transactions | | | 21,463,184 | | | | 93,257,385 | |
|
| |
Net increase in net assets | | | 75,175,132 | | | | 48,164,706 | |
|
| |
| | |
Net assets: | | | | | | | | |
| | |
Beginning of year | | | 709,543,585 | | | | 661,378,879 | |
|
| |
| | |
End of year | | $ | 784,718,717 | | | $ | 709,543,585 | |
|
| |
See accompanying Notes to Financial Statements which are an integral part of the financial statements.
| | |
| 12 | | Invesco Comstock Select Fund |
Financial Highlights
The following schedule presents financial highlights for a share of the Fund outstanding throughout the periods indicated.
| | | | | | | | | | | | | | | | | | | | | | | | | | | | | | | | | | | | | | | | | | | | | | | | | | | | | | | | |
| | | Net asset value, beginning of period | | Net investment income(a) | | Net gains (losses) on securities (both realized and unrealized) | | Total from investment operations | | Dividends from net investment income | | Distributions from net realized gains | | Total distributions | | Net asset value, end of period | | Total return(b) | | Net assets, end of period (000’s omitted) | | Ratio of expenses to average net assets with fee waivers and/or expenses absorbed | | Ratio of expenses to average net assets without fee waivers and/or expenses absorbed(c) | | Ratio of net investment income to average net assets | | Portfolio turnover (d) |
Class A | | | | | | | | | | | | | | | | | | | | | | | | | | | | | | | | | | | | | | | | | | | | | | | | | | | | | | | | |
Year ended 04/30/24 | | | $31.62 | | | | $0.56 | | | | $ 3.43 | | | | $ 3.99 | | | | $(0.52 | ) | | | $(1.16 | ) | | | $(1.68 | ) | | | $33.93 | | | | 13.00 | %(e) | | | $ 587,947 | | | | 0.91 | %(e) | | | 0.93 | %(e) | | | 1.75 | %(e) | | | 104 | % |
Year ended 04/30/23 | | | 34.11 | | | | 0.45 | | | | 2.19 | | | | 2.64 | | | | (0.45 | ) | | | (4.68 | ) | | | (5.13 | ) | | | 31.62 | | | | 8.36 | (e) | | | 548,500 | | | | 1.01 | (e) | | | 1.02 | (e) | | | 1.37 | (e) | | | 57 | |
Year ended 04/30/22 | | | 33.66 | | | | 0.40 | | | | 1.87 | | | | 2.27 | | | | (0.38 | ) | | | (1.44 | ) | | | (1.82 | ) | | | 34.11 | | | | 6.88 | (e) | | | 530,151 | | | | 0.91 | (e) | | | 0.92 | (e) | | | 1.15 | (e) | | | 54 | |
Year ended 04/30/21 | | | 21.50 | | | | 0.46 | | | | 12.39 | | | | 12.85 | | | | (0.69 | ) | | | – | | | | (0.69 | ) | | | 33.66 | | | | 60.66 | (e) | | | 546,503 | | | | 0.93 | (e) | | | 1.04 | (e) | | | 1.75 | (e) | | | 46 | |
Six months ended 04/30/20 | | | 33.81 | | | | 0.29 | | | | (5.00 | ) | | | (4.71 | ) | | | (0.29 | ) | | | (7.31 | ) | | | (7.60 | ) | | | 21.50 | | | | (19.00 | ) | | | 388,558 | | | | 0.93 | (f) | | | 0.97 | (f) | | | 2.17 | (f) | | | 11 | |
Year ended 10/31/19 | | | 35.63 | | | | 0.58 | | | | 2.00 | | | | 2.58 | | | | (0.56 | ) | | | (3.84 | ) | | | (4.40 | ) | | | 33.81 | | | | 8.66 | | | | 524,705 | | | | 0.93 | | | | 0.95 | | | | 1.79 | | | | 129 | |
Class C | | | | | | | | | | | | | | | | | | | | | | | | | | | | | | | | | | | | | | | | | | | | | | | | | | | | | | | | |
Year ended 04/30/24 | | | 29.12 | | | | 0.29 | | | | 3.15 | | | | 3.44 | | | | (0.25 | ) | | | (1.16 | ) | | | (1.41 | ) | | | 31.15 | | | | 12.16 | | | | 28,366 | | | | 1.67 | | | | 1.69 | | | | 0.99 | | | | 104 | |
Year ended 04/30/23 | | | 31.76 | | | | 0.18 | | | | 2.04 | | | | 2.22 | | | | (0.18 | ) | | | (4.68 | ) | | | (4.86 | ) | | | 29.12 | | | | 7.51 | | | | 30,601 | | | | 1.77 | | | | 1.78 | | | | 0.61 | | | | 57 | |
Year ended 04/30/22 | | | 31.44 | | | | 0.13 | | | | 1.74 | | | | 1.87 | | | | (0.11 | ) | | | (1.44 | ) | | | (1.55 | ) | | | 31.76 | | | | 6.05 | | | | 31,095 | | | | 1.67 | | | | 1.68 | | | | 0.39 | | | | 54 | |
Year ended 04/30/21 | | | 20.08 | | | | 0.24 | | | | 11.58 | | | | 11.82 | | | | (0.46 | ) | | | – | | | | (0.46 | ) | | | 31.44 | | | | 59.49 | | | | 30,455 | | | | 1.68 | | | | 1.80 | | | | 1.00 | | | | 46 | |
Six months ended 04/30/20 | | | 32.01 | | | | 0.18 | | | | (4.64 | ) | | | (4.46 | ) | | | (0.16 | ) | | | (7.31 | ) | | | (7.47 | ) | | | 20.08 | | | | (19.29 | ) | | | 27,325 | | | | 1.68 | (f) | | | 1.73 | (f) | | | 1.41 | (f) | | | 11 | |
Year ended 10/31/19 | | | 33.95 | | | | 0.32 | | | | 1.89 | | | | 2.21 | | | | (0.31 | ) | | | (3.84 | ) | | | (4.15 | ) | | | 32.01 | | | | 7.86 | | | | 40,759 | | | | 1.68 | | | | 1.69 | | | | 1.03 | | | | 129 | |
Class R | | | | | | | | | | | | | | | | | | | | | | | | | | | | | | | | | | | | | | | | | | | | | | | | | | | | | | | | |
Year ended 04/30/24 | | | 30.54 | | | | 0.46 | | | | 3.31 | | | | 3.77 | | | | (0.42 | ) | | | (1.16 | ) | | | (1.58 | ) | | | 32.73 | | | | 12.71 | | | | 46,540 | | | | 1.17 | | | | 1.19 | | | | 1.49 | | | | 104 | |
Year ended 04/30/23 | | | 33.10 | | | | 0.35 | | | | 2.12 | | | | 2.47 | | | | (0.35 | ) | | | (4.68 | ) | | | (5.03 | ) | | | 30.54 | | | | 8.05 | | | | 42,402 | | | | 1.27 | | | | 1.28 | | | | 1.11 | | | | 57 | |
Year ended 04/30/22 | | | 32.70 | | | | 0.30 | | | | 1.82 | | | | 2.12 | | | | (0.28 | ) | | | (1.44 | ) | | | (1.72 | ) | | | 33.10 | | | | 6.62 | | | | 39,500 | | | | 1.17 | | | | 1.18 | | | | 0.89 | | | | 54 | |
Year ended 04/30/21 | | | 20.89 | | | | 0.38 | | | | 12.04 | | | | 12.42 | | | | (0.61 | ) | | | – | | | | (0.61 | ) | | | 32.70 | | | | 60.24 | | | | 39,590 | | | | 1.18 | | | | 1.30 | | | | 1.50 | | | | 46 | |
Six months ended 04/30/20 | | | 33.04 | | | | 0.25 | | | | (4.85 | ) | | | (4.60 | ) | | | (0.24 | ) | | | (7.31 | ) | | | (7.55 | ) | | | 20.89 | | | | (19.11 | ) | | | 27,340 | | | | 1.18 | (f) | | | 1.23 | (f) | | | 1.92 | (f) | | | 11 | |
Year ended 10/31/19 | | | 34.91 | | | | 0.49 | | | | 1.96 | | | | 2.45 | | | | (0.48 | ) | | | (3.84 | ) | | | (4.32 | ) | | | 33.04 | | | | 8.41 | | | | 36,469 | | | | 1.18 | | | | 1.20 | | | | 1.54 | | | | 129 | |
Class Y | | | | | | | | | | | | | | | | | | | | | | | | | | | | | | | | | | | | | | | | | | | | | | | | | | | | | | | | |
Year ended 04/30/24 | | | 32.83 | | | | 0.67 | | | | 3.56 | | | | 4.23 | | | | (0.62 | ) | | | (1.16 | ) | | | (1.78 | ) | | | 35.28 | | | | 13.27 | | | | 86,777 | | | | 0.67 | | | | 0.69 | | | | 1.99 | | | | 104 | |
Year ended 04/30/23 | | | 35.26 | | | | 0.54 | | | | 2.26 | | | | 2.80 | | | | (0.55 | ) | | | (4.68 | ) | | | (5.23 | ) | | | 32.83 | | | | 8.58 | | | | 67,601 | | | | 0.77 | | | | 0.78 | | | | 1.61 | | | | 57 | |
Year ended 04/30/22 | | | 34.75 | | | | 0.50 | | | | 1.93 | | | | 2.43 | | | | (0.48 | ) | | | (1.44 | ) | | | (1.92 | ) | | | 35.26 | | | | 7.13 | | | | 50,894 | | | | 0.67 | | | | 0.68 | | | | 1.39 | | | | 54 | |
Year ended 04/30/21 | | | 22.19 | | | | 0.54 | | | | 12.80 | | | | 13.34 | | | | (0.78 | ) | | | – | | | | (0.78 | ) | | | 34.75 | | | | 61.10 | | | | 45,879 | | | | 0.68 | | | | 0.80 | | | | 2.00 | | | | 46 | |
Six months ended 04/30/20 | | | 34.70 | | | | 0.34 | | | | (5.21 | ) | | | (4.87 | ) | | | (0.33 | ) | | | (7.31 | ) | | | (7.64 | ) | | | 22.19 | | | | (18.95 | ) | | | 29,843 | | | | 0.68 | (f) | | | 0.73 | (f) | | | 2.41 | (f) | | | 11 | |
Year ended 10/31/19 | | | 36.44 | | | | 0.68 | | | | 2.07 | | | | 2.75 | | | | (0.65 | ) | | | (3.84 | ) | | | (4.49 | ) | | | 34.70 | | | | 8.97 | | | | 70,677 | | | | 0.68 | | | | 0.71 | | | | 2.03 | | | | 129 | |
Class R5 | | | | | | | | | | | | | | | | | | | | | | | | | | | | | | | | | | | | | | | | | | | | | | | | | | | | | | | | |
Year ended 04/30/24 | | | 31.56 | | | | 0.67 | | | | 3.43 | | | | 4.10 | | | | (0.63 | ) | | | (1.16 | ) | | | (1.79 | ) | | | 33.87 | | | | 13.39 | | | | 11 | | | | 0.58 | | | | 0.59 | | | | 2.08 | | | | 104 | |
Year ended 04/30/23 | | | 34.07 | | | | 0.56 | | | | 2.18 | | | | 2.74 | | | | (0.57 | ) | | | (4.68 | ) | | | (5.25 | ) | | | 31.56 | | | | 8.71 | | | | 10 | | | | 0.66 | | | | 0.67 | | | | 1.72 | | | | 57 | |
Year ended 04/30/22 | | | 33.62 | | | | 0.52 | | | | 1.87 | | | | 2.39 | | | | (0.50 | ) | | | (1.44 | ) | | | (1.94 | ) | | | 34.07 | | | | 7.24 | | | | 11 | | | | 0.57 | | | | 0.58 | | | | 1.49 | | | | 54 | |
Year ended 04/30/21 | | | 21.47 | | | | 0.55 | | | | 12.38 | | | | 12.93 | | | | (0.78 | ) | | | – | | | | (0.78 | ) | | | 33.62 | | | | 61.27 | | | | 11 | | | | 0.57 | | | | 0.60 | | | | 2.11 | | | | 46 | |
Six months ended 04/30/20 | | | 33.80 | | | | 0.34 | | | | (5.02 | ) | | | (4.68 | ) | | | (0.34 | ) | | | (7.31 | ) | | | (7.65 | ) | | | 21.47 | | | | (18.88 | ) | | | 7 | | | | 0.57 | (f) | | | 0.57 | (f) | | | 2.52 | (f) | | | 11 | |
Period ended 10/31/19(g) | | | 31.94 | | | | 0.31 | | | | 1.93 | | | | 2.24 | | | | (0.38 | ) | | | – | | | | (0.38 | ) | | | 33.80 | | | | 7.03 | | | | 11 | | | | 0.57 | (f) | | | 0.57 | (f) | | | 2.15 | (f) | | | 129 | |
Class R6 | | | | | | | | | | | | | | | | | | | | | | | | | | | | | | | | | | | | | | | | | | | | | | | | | | | | | | | | |
Year ended 04/30/24 | | | 32.72 | | | | 0.70 | | | | 3.55 | | | | 4.25 | | | | (0.65 | ) | | | (1.16 | ) | | | (1.81 | ) | | | 35.16 | | | | 13.39 | | | | 35,077 | | | | 0.58 | | | | 0.59 | | | | 2.08 | | | | 104 | |
Year ended 04/30/23 | | | 35.16 | | | | 0.57 | | | | 2.25 | | | | 2.82 | | | | (0.58 | ) | | | (4.68 | ) | | | (5.26 | ) | | | 32.72 | | | | 8.70 | | | | 20,430 | | | | 0.66 | | | | 0.67 | | | | 1.72 | | | | 57 | |
Year ended 04/30/22 | | | 34.65 | | | | 0.54 | | | | 1.93 | | | | 2.47 | | | | (0.52 | ) | | | (1.44 | ) | | | (1.96 | ) | | | 35.16 | | | | 7.26 | | | | 9,729 | | | | 0.55 | | | | 0.58 | | | | 1.51 | | | | 54 | |
Year ended 04/30/21 | | | 22.13 | | | | 0.51 | | | | 12.83 | | | | 13.34 | | | | (0.82 | ) | | | – | | | | (0.82 | ) | | | 34.65 | | | | 61.33 | | | | 6,606 | | | | 0.52 | | | | 0.58 | | | | 2.16 | | | | 46 | |
Six months ended 04/30/20 | | | 34.63 | | | | 0.36 | | | | (5.19 | ) | | | (4.83 | ) | | | (0.36 | ) | | | (7.31 | ) | | | (7.67 | ) | | | 22.13 | | | | (18.88 | ) | | | 444,138 | | | | 0.52 | (f) | | | 0.54 | (f) | | | 2.58 | (f) | | | 11 | |
Year ended 10/31/19 | | | 36.38 | | | | 0.73 | | | | 2.06 | | | | 2.79 | | | | (0.70 | ) | | | (3.84 | ) | | | (4.54 | ) | | | 34.63 | | | | 9.13 | | | | 656,678 | | | | 0.52 | | | | 0.52 | | | | 2.20 | | | | 129 | |
| (a) | Calculated using average shares outstanding. |
| (b) | Includes adjustments in accordance with accounting principles generally accepted in the United States of America and as such, the net asset value for financial reporting purposes and the returns based upon those net asset values may differ from the net asset value and returns for shareholder transactions. Does not include sales charges and is not annualized for periods less than one year, if applicable. |
| (c) | Does not include indirect expenses from affiliated fund fees and expenses of 0.00% for the six months ended April 30, 2020 and for the years ended October 31, 2019, respectively. |
| (d) | Portfolio turnover is calculated at the fund level and is not annualized for periods less than one year, if applicable. |
| (e) | The total return, ratio of expenses to average net assets and ratio of net investment income to average net assets reflect actual 12b-1 fees of 0.24% for the years ended April 30, 2024, 2023, 2022 and 2021. |
| (g) | Commencement date after the close of business on May 24, 2019. |
See accompanying Notes to Financial Statements which are an integral part of the financial statements.
| | |
| 13 | | Invesco Comstock Select Fund |
Notes to Financial Statements
April 30, 2024
NOTE 1–Significant Accounting Policies
Invesco Comstock Select Fund (the “Fund”) is a series portfolio of AIM Sector Funds (Invesco Sector Funds) (the “Trust”). The Trust is a Delaware statutory trust registered under the Investment Company Act of 1940, as amended (the “1940 Act”), as an open-end series management investment company authorized to issue an unlimited number of shares of beneficial interest. Information presented in these financial statements pertains only to the Fund. Matters affecting the Fund or each class will be voted on exclusively by the shareholders of the Fund or each class.
The Fund’s investment objective is to seek capital appreciation.
The Fund currently consists of six different classes of shares: Class A, Class C, Class R, Class Y, Class R5 and Class R6. Class Y shares are available only to certain investors. Class A shares are sold with a front-end sales charge unless certain waiver criteria are met. Under certain circumstances, load waived shares may be subject to contingent deferred sales charges (“CDSC”). Class C shares are sold with a CDSC. Class R, Class Y, Class R5 and Class R6 shares are sold at net asset value. Class C shares held for eight years after purchase are eligible for automatic conversion into Class A shares of the same Fund (the “Conversion Feature”). The automatic conversion pursuant to the Conversion Feature will generally occur at the end of the month following the eighth anniversary after a purchase of Class C shares.
The Fund is an investment company and accordingly follows the investment company accounting and reporting guidance in accordance with Financial Accounting Standards Board Accounting Standards Codification Topic 946, Financial Services – Investment Companies.
The following is a summary of the significant accounting policies followed by the Fund in the preparation of its financial statements.
| A. | Security Valuations - Securities, including restricted securities, are valued according to the following policy. |
A security listed or traded on an exchange is generally valued at its trade price or official closing price that day as of the close of the exchange where the security is principally traded, or lacking any trades or official closing price on a particular day, the security may be valued at the closing bid or ask price on that day. Securities traded in the over-the-counter market are valued based on prices furnished by independent pricing services or market makers. When such securities are valued using prices provided by an independent pricing service they may be considered fair valued. Futures contracts are valued at the daily settlement price set by an exchange on which they are principally traded. Where a final settlement price exists, exchange-traded options are valued at the final settlement price from the exchange where the option principally trades. Where a final settlement price does not exist, exchange-traded options are valued at the mean between the last bid and ask price generally from the exchange where the option principally trades.
Securities of investment companies that are not exchange-traded (e.g., open-end mutual funds) are valued using such company’s end-of-business-day net asset value per share.
Deposits, other obligations of U.S. and non-U.S. banks and financial institutions are valued at their daily account value.
Fixed income securities (including convertible debt securities) generally are valued on the basis of prices provided by independent pricing services. Prices provided by the pricing service may be determined without exclusive reliance on quoted prices, and may reflect appropriate factors such as institution-size trading in similar groups of securities, developments related to specific securities, dividend rate (for unlisted equities), yield (for debt obligations), quality, type of issue, coupon rate (for debt obligations), maturity (for debt obligations), individual trading characteristics and other market data. Pricing services generally value debt obligations assuming orderly transactions of institutional round lot size, but a fund may hold or transact in the same securities in smaller, odd lot sizes. Odd lots often trade at lower prices than institutional round lots, and their value may be adjusted accordingly. Debt obligations are subject to interest rate and credit risks. In addition, all debt obligations involve some risk of default with respect to interest and/or principal payments.
Foreign securities’ (including foreign exchange contracts) prices are converted into U.S. dollar amounts using the applicable exchange rates as of the close of the New York Stock Exchange (“NYSE”). If market quotations are available and reliable for foreign exchange-traded equity securities, the securities will be valued at the market quotations. Invesco Advisers, Inc. (the “Adviser” or “Invesco”) may use various pricing services to obtain market quotations as well as fair value prices. Because trading hours for certain foreign securities end before the close of the NYSE, closing market quotations may become not representative of market value in the Adviser’s judgment (“unreliable”). If, between the time trading ends on a particular security and the close of the customary trading session on the NYSE, a significant event occurs that makes the closing price of the security unreliable, the Adviser may fair value the security. If the event is likely to have affected the closing price of the security, the security will be valued at fair value in good faith in accordance with Board- approved policies and related Adviser procedures (“Valuation Procedures”). Adjustments to closing prices to reflect fair value may also be based on a screening process of an independent pricing service to indicate the degree of certainty, based on historical data, that the closing price in the principal market where a foreign security trades is not the current value as of the close of the NYSE. Foreign securities’ prices meeting the degree of certainty that the price is not reflective of current value will be priced at the indication of fair value from the independent pricing service. Multiple factors may be considered by the independent pricing service in determining adjustments to reflect fair value and may include information relating to sector indices, American Depositary Receipts and domestic and foreign index futures. Foreign securities may have additional risks including exchange rate changes, potential for sharply devalued currencies and high inflation, political and economic upheaval, the relative lack of issuer information, relatively low market liquidity and the potential lack of strict financial and accounting controls and standards.
Unlisted securities will be valued using prices provided by independent pricing services or by another method that the Adviser, in its judgment, believes better reflects the security’s fair value in accordance with the Valuation Procedures.
Non-traded rights and warrants shall be valued at intrinsic value if the terms of the rights and warrants are available, specifically the subscription or exercise price and the ratio. Intrinsic value is calculated as the daily market closing price of the security to be received less the subscription price, which is then adjusted by the exercise ratio. In the case of warrants, an option pricing model supplied by an independent pricing service may be used based on market data such as volatility, stock price and interest rate from the independent pricing service and strike price and exercise period from verified terms.
Securities for which market prices are not provided by any of the above methods may be valued based upon quotes furnished by independent sources. The mean between the last bid and ask prices may be used to value debt obligations, including corporate loans.
Securities for which market quotations are not readily available are fair valued by the Adviser in accordance with the Valuation Procedures. If a fair value price provided by a pricing service is unreliable, the Adviser will fair value the security using the Valuation Procedures. Issuer specific events, market trends, bid/ask quotes of brokers and information providers and other market data may be reviewed in the course of making a good faith determination of a security’s fair value.
The Fund may invest in securities that are subject to interest rate risk, meaning the risk that the prices will generally fall as interest rates rise and, conversely, the prices will generally rise as interest rates fall. Specific securities differ in their sensitivity to changes in interest rates depending on their individual characteristics. Changes in interest rates may result in increased market volatility, which may affect the value and/or liquidity of certain Fund investments.
Valuations change in response to many factors including the historical and prospective earnings of the issuer, the value of the issuer’s assets, general market conditions which are not specifically related to the particular issuer, such as real or perceived adverse economic conditions, changes in the general outlook for revenues or corporate earnings, changes in interest or currency rates, regional or global instability, natural or environmental disasters, widespread disease or other public health issues, war, acts of terrorism, significant governmental actions or adverse investor sentiment generally and market liquidity. Because of the inherent uncertainties of valuation, the values reflected in the financial statements may materially differ from the value received upon actual sale of those investments.
The price the Fund could receive upon the sale of any investment may differ from the Adviser’s valuation of the investment, particularly for securities that are valued using a fair valuation technique. When fair valuation techniques are applied, the Adviser uses available information, including both observable and
| | |
| 14 | | Invesco Comstock Select Fund |
unobservable inputs and assumptions, to determine a methodology that will result in a valuation that the Adviser believes approximates market value. Fund securities that are fair valued may be subject to greater fluctuation in their value from one day to the next than would be the case if market quotations were used. Because of the inherent uncertainties of valuation, and the degree of subjectivity in such decisions, the Fund could realize a greater or lesser than expected gain or loss upon the sale of the investment.
| B. | Securities Transactions and Investment Income - Securities transactions are accounted for on a trade date basis. Realized gains or losses on sales are computed on the basis of specific identification of the securities sold. Interest income (net of withholding tax, if any) is recorded on an accrual basis from settlement date and includes coupon interest and amortization of premium and accretion of discount on debt securities as applicable. Pay-in-kind interest income and non-cash dividend income received in the form of securities in lieu of cash are recorded at the fair value of the securities received. Dividend income (net of withholding tax, if any) is recorded on the ex-dividend date. |
The Fund may periodically participate in litigation related to Fund investments. As such, the Fund may receive proceeds from litigation settlements. Any proceeds received are included in the Statement of Operations as realized gain (loss) for investments no longer held and as unrealized gain (loss) for investments still held.
Brokerage commissions and mark ups are considered transaction costs and are recorded as an increase to the cost basis of securities purchased and/or a reduction of proceeds on a sale of securities. Such transaction costs are included in the determination of net realized and unrealized gain (loss) from investment securities reported in the Statement of Operations and the Statement of Changes in Net Assets and the net realized and unrealized gains (losses) on securities per share in the Financial Highlights. Transaction costs are included in the calculation of the Fund’s net asset value and, accordingly, they reduce the Fund’s total returns. These transaction costs are not considered operating expenses and are not reflected in net investment income reported in the Statement of Operations and the Statement of Changes in Net Assets, or the net investment income per share and the ratios of expenses and net investment income reported in the Financial Highlights, nor are they limited by any expense limitation arrangements between the Fund and the investment adviser.
The Fund allocates income and realized and unrealized capital gains and losses to a class based on the relative net assets of each class.
| C. | Country Determination – For the purposes of making investment selection decisions and presentation in the Schedule of Investments, the investment adviser may determine the country in which an issuer is located and/or credit risk exposure based on various factors. These factors include the laws of the country under which the issuer is organized, where the issuer maintains a principal office, the country in which the issuer derives 50% or more of its total revenues, the country that has the primary market for the issuer’s securities and its “country of risk” as determined by a third party service provider, as well as other criteria. Among the other criteria that may be evaluated for making this determination are the country in which the issuer maintains 50% or more of its assets, the type of security, financial guarantees and enhancements, the nature of the collateral and the sponsor organization. Country of issuer and/or credit risk exposure has been determined to be the United States of America, unless otherwise noted. |
| D. | Distributions - Distributions from net investment income, if any, are declared and paid quarterly and are recorded on the ex-dividend date. Distributions from net realized capital gain, if any, are generally declared and paid annually and recorded on the ex-dividend date. The Fund may elect to treat a portion of the proceeds from redemptions as distributions for federal income tax purposes. |
| E. | Federal Income Taxes – The Fund intends to comply with the requirements of Subchapter M of the Internal Revenue Code of 1986, as amended (the “Internal Revenue Code”), necessary to qualify as a regulated investment company and to distribute substantially all of the Fund’s taxable earnings to shareholders. As such, the Fund will not be subject to federal income taxes on otherwise taxable income (including net realized capital gain) that is distributed to shareholders. Therefore, no provision for federal income taxes is recorded in the financial statements. |
The Fund recognizes the tax benefits of uncertain tax positions only when the position is more likely than not to be sustained. Management has analyzed the Fund’s uncertain tax positions and concluded that no liability for unrecognized tax benefits should be recorded related to uncertain tax positions. Management is not aware of any tax positions for which it is reasonably possible that the total amounts of unrecognized tax benefits will change materially in the next 12 months.
The Fund files tax returns in the U.S. Federal jurisdiction and certain other jurisdictions. Generally, the Fund is subject to examinations by such taxing authorities for up to three years after the filing of the return for the tax period.
| F. | Expenses – Fees provided for under the Rule 12b-1 plan of a particular class of the Fund are charged to the operations of such class. Transfer agency fees and expenses and other shareholder recordkeeping fees and expenses attributable to Class R5 and Class R6 are allocated based on relative net assets of Class R5 and Class R6. Sub-accounting fees attributable to Class R5 are charged to the operations of the class. Transfer agency fees and expenses and other shareholder recordkeeping fees and expenses relating to all other classes are allocated among those classes based on relative net assets. All other expenses are allocated among the classes based on relative net assets. |
| G. | Accounting Estimates – The preparation of financial statements in conformity with accounting principles generally accepted in the United States of America (“GAAP”) requires management to make estimates and assumptions that affect the reported amounts of assets and liabilities at the date of the financial statements and the reported amounts of revenues and expenses during the reporting period including estimates and assumptions related to taxation. Actual results could differ from those estimates by a significant amount. In addition, the Fund monitors for material events or transactions that may occur or become known after the period-end date and before the date the financial statements are released to print. |
| H. | Indemnifications – Under the Trust’s organizational documents, each Trustee, officer, employee or other agent of the Trust is indemnified against certain liabilities that may arise out of the performance of their duties to the Fund. Additionally, in the normal course of business, the Fund enters into contracts, including the Fund’s servicing agreements, that contain a variety of indemnification clauses. The Fund’s maximum exposure under these arrangements is unknown as this would involve future claims that may be made against the Fund that have not yet occurred. The risk of material loss as a result of such indemnification claims is considered remote. |
| I. | Securities Lending – The Fund may lend portfolio securities having a market value up to one-third of the Fund’s total assets. Such loans are secured by collateral equal to no less than the market value of the loaned securities determined daily by the securities lending provider. Such collateral will be cash or debt securities issued or guaranteed by the U.S. Government or any of its sponsored agencies. Cash collateral received in connection with these loans is invested in short-term money market instruments or affiliated, unregistered investment companies that comply with Rule 2a-7 under the 1940 Act and money market funds (collectively, “affiliated money market funds”) and is shown as such on the Schedule of Investments. The Fund bears the risk of loss with respect to the investment of collateral. It is the Fund’s policy to obtain additional collateral from or return excess collateral to the borrower by the end of the next business day, following the valuation date of the securities loaned. Therefore, the value of the collateral held may be temporarily less than the value of the securities on loan. When loaning securities, the Fund retains certain benefits of owning the securities, including the economic equivalent of dividends or interest generated by the security. Lending securities entails a risk of loss to the Fund if, and to the extent that, the market value of the securities loaned were to increase and the borrower did not increase the collateral accordingly, and the borrower failed to return the securities. The securities loaned are subject to termination at the option of the borrower or the Fund. Upon termination, the borrower will return to the Fund the securities loaned and the Fund will return the collateral. Upon the failure of the borrower to return the securities, collateral may be liquidated and the securities may be purchased on the open market to replace the loaned securities. The Fund could experience delays and costs in gaining access to the collateral and the securities may lose value during the delay which could result in potential losses to the Fund. Some of these losses may be indemnified by the lending agent. The Fund bears the risk of any deficiency in the amount of the collateral available for return to the borrower due to any loss on the collateral invested. Dividends received on cash collateral investments for securities lending transactions, which are net of |
| | |
| 15 | | Invesco Comstock Select Fund |
| | compensation to counterparties, are included in Dividends from affiliated money market funds on the Statement of Operations. The aggregate value of securities out on loan, if any, is shown as a footnote on the Statement of Assets and Liabilities. |
The Adviser serves as an affiliated securities lending agent for the Fund. The Bank of New York Mellon also serves as a securities lending agent. To the extent the Fund utilizes the Adviser as an affiliated securities lending agent, the Fund conducts its securities lending in accordance with, and in reliance upon, no-action letters issued by the SEC staff that provide guidance on how an affiliate may act as a direct agent lender and receive compensation for those services in a manner consistent with the federal securities laws. For the year ended April 30, 2024, the Fund paid the Adviser $3,199 in fees for securities lending agent services.
Fees paid to the Adviser for securities lending agent services, if any, are included in Dividends from affiliated money market funds on the Statement of Operations.
| J. | Foreign Currency Translations – Foreign currency is valued at the close of the NYSE based on quotations posted by banks and major currency dealers. Portfolio securities and other assets and liabilities denominated in foreign currencies are translated into U.S. dollar amounts at the date of valuation. Purchases and sales of portfolio securities (net of foreign taxes withheld on disposition) and income items denominated in foreign currencies are translated into U.S. dollar amounts on the respective dates of such transactions. The Fund does not separately account for the portion of the results of operations resulting from changes in foreign exchange rates on investments and the fluctuations arising from changes in market prices of securities held. The combined results of changes in foreign exchange rates and the fluctuation of market prices on investments (net of estimated foreign tax withholding) are included with the net realized and unrealized gain or loss from investments in the Statement of Operations. Reported net realized foreign currency gains or losses arise from (1) sales of foreign currencies, (2) currency gains or losses realized between the trade and settlement dates on securities transactions, and (3) the difference between the amounts of dividends, interest, and foreign withholding taxes recorded on the Fund’s books and the U.S. dollar equivalent of the amounts actually received or paid. Net unrealized foreign currency gains and losses arise from changes in the fair values of assets and liabilities, other than investments in securities at fiscal period end, resulting from changes in exchange rates. |
The Fund may invest in foreign securities, which may be subject to foreign taxes on income, gains on investments or currency repatriation, a portion of which may be recoverable. Foreign taxes, if any, are recorded based on the tax regulations and rates that exist in the foreign markets in which the Fund invests and are shown in the Statement of Operations.
The performance of the Fund may be materially affected positively or negatively by foreign currency strength or weakness relative to the U.S. dollar. Currency rates in foreign countries may fluctuate for a number of reasons, including changes in interest rates, political, economic, or social instability and development, and imposition of currency controls. Currency controls in certain foreign jurisdictions may cause the Fund to experience significant delays in its ability to repatriate its assets in U.S. dollars at quoted spot rates, and it is possible that the Fund’s ability to convert certain foreign currencies into U.S. dollars may be limited and may occur at discounts to quoted rates. As a result, the value of the Fund’s assets and liabilities denominated in such currencies that would ultimately be realized could differ from those reported on the Statement of Assets and Liabilities. Certain foreign companies may be subject to sanctions, embargoes, or other governmental actions that may limit the ability to invest in, receive, hold, or sell the securities of such companies, all of which affect the market and/or credit risk of the investments. Because of the inherent uncertainties of valuation, the values reflected in the financial statements may materially differ from the value received upon actual sale of those investments.
| K. | Forward Foreign Currency Contracts – The Fund may engage in foreign currency transactions either on a spot (i.e. for prompt delivery and settlement) basis, or through forward foreign currency contracts, to manage or minimize currency or exchange rate risk. |
The Fund may also enter into forward foreign currency contracts for the purchase or sale of a security denominated in a foreign currency in order to “lock in” the U.S. dollar price of that security, or the Fund may also enter into forward foreign currency contracts that do not provide for physical exchange of the two currencies on the settlement date, but instead are settled by a single cash payment calculated as the difference between the agreed upon exchange rate and the spot rate at settlement based upon an agreed upon notional amount (non-deliverable forwards).
A forward foreign currency contract is an obligation between two parties (“Counterparties”) to purchase or sell a specific currency for an agreed-upon price at a future date. The use of forward foreign currency contracts for hedging does not eliminate fluctuations in the price of the underlying securities the Fund owns or intends to acquire but establishes a rate of exchange in advance. Fluctuations in the value of these contracts are measured by the difference in the contract date and reporting date exchange rates and are recorded as unrealized appreciation (depreciation) until the contracts are closed. When the contracts are closed, realized gains (losses) are recorded. Realized and unrealized gains (losses) on the contracts are included in the Statement of Operations. The primary risks associated with forward foreign currency contracts include failure of the Counterparty to meet the terms of the contract and the value of the foreign currency changing unfavorably. These risks may be in excess of the amounts reflected in the Statement of Assets and Liabilities.
| L. | Other Risks – The Fund is non-diversified and may invest in securities of fewer issuers than if it were diversified. Thus, the value of the Fund’s shares may vary more widely and the Fund may be subject to greater market and credit risk than if the Fund invested more broadly. |
Active trading of portfolio securities may result in added expenses, a lower return and increased tax liability.
NOTE 2–Advisory Fees and Other Fees Paid to Affiliates
The Trust has entered into a master investment advisory agreement with the Adviser. Under the terms of the investment advisory agreement, the Fund accrues daily and pays monthly an advisory fee to the Adviser based on the annual rate of the Fund’s average daily net assets as follows:
| | |
| Average Daily Net Assets | | Rate* |
|
|
First $300 million | | 0.625% |
|
|
Next $100 million | | 0.500% |
|
|
Next $4.6 billion | | 0.450% |
|
|
Over $5 billion | | 0.430% |
|
|
| * | The advisory fee paid by the Fund shall be reduced by any amounts paid by the Fund under the administrative services agreement with the Adviser. |
For the year ended April 30, 2024, the effective advisory fee rate incurred by the Fund was 0.51%.
Under the terms of a master sub-advisory agreement between the Adviser and each of Invesco Asset Management Deutschland GmbH, Invesco Asset Management Limited, Invesco Asset Management (Japan) Limited, Invesco Hong Kong Limited, Invesco Senior Secured Management, Inc. and Invesco Canada Ltd. and separate sub-advisory agreements with Invesco Capital Management LLC and Invesco Asset Management (India) Private Limited (collectively, the “Affiliated Sub-Advisers”) the Adviser, not the Fund, will pay 40% of the fees paid to the Adviser to any such Affiliated Sub-Adviser(s) that provide(s) discretionary investment management services to the Fund based on the percentage of assets allocated to such Affiliated Sub-Adviser(s). Invesco has also entered into a sub-advisory agreement with OppenheimerFunds, Inc. to provide discretionary management services to the Fund.
Effective July 1, 2023, the Adviser has agreed, for an indefinite period, to waive advisory fees and/or reimburse expenses of all shares to the extent necessary to limit total annual fund operating expenses after fee waiver and/or expense reimbursement (excluding certain items discussed below) of Class A, Class C, Class R, Class Y, Class R5 and Class R6 shares to 2.00%, 2.75%, 2.25%, 1.75%, 1.75% and 1.75%, respectively, of the Fund’s average daily net assets (the “boundary limits”). Prior to July 1, 2023, the same boundary limits were in effect with an expiration date of June 30, 2023. In determining the Adviser’s obligation to waive advisory fees and/or reimburse expenses, the following expenses are not taken into account, and could cause the total annual fund operating expenses after fee waiver and/or expense reimbursement to exceed the numbers reflected above: (1) interest; (2) taxes; (3) dividend expense on short sales; (4) extraordinary or non-routine
| | |
| 16 | | Invesco Comstock Select Fund |
items, including litigation expenses; and (5) expenses that the Fund has incurred but did not actually pay because of an expense offset arrangement. Invesco may amend and/or terminate these boundary limits at any time in its sole discretion and will inform the Board of Trustees of any such changes. The Adviser did not waive fees and/or reimburse expenses during the period under these boundary limits.
Further, the Adviser has contractually agreed, through at least June 30, 2025, to waive the advisory fee payable by the Fund in an amount equal to 100% of the net advisory fees the Adviser receives from the affiliated money market funds on investments by the Fund of uninvested cash (excluding investments of cash collateral from securities lending) in such affiliated money market funds.
For the year ended April 30, 2024, the Adviser waived advisory fees of $37,462.
The Trust has entered into a master administrative services agreement with Invesco pursuant to which the Fund has agreed to pay Invesco for certain administrative costs incurred in providing accounting services to the Fund. For the year ended April 30, 2024, expenses incurred under the agreement are shown in the Statement of Operations as Administrative services fees. Invesco has entered into a sub-administration agreement whereby State Street Bank and Trust Company (“SSB”) serves as fund accountant and provides certain administrative services to the Fund. Pursuant to a custody agreement with the Trust on behalf of the Fund, SSB also serves as the Fund’s custodian.
The Trust has entered into a transfer agency and service agreement with Invesco Investment Services, Inc. (“IIS”) pursuant to which the Fund has agreed to pay IIS a fee for providing transfer agency and shareholder services to the Fund and reimburse IIS for certain expenses incurred by IIS in the course of providing such services. IIS may make payments to intermediaries that provide omnibus account services, sub-accounting services and/or networking services. All fees payable by IIS to intermediaries that provide omnibus account services or sub-accounting services are charged back to the Fund, subject to certain limitations approved by the Trust’s Board of Trustees. For the year ended April 30, 2024, expenses incurred under the agreement are shown in the Statement of Operations as Transfer agent fees.
The Trust has entered into master distribution agreements with Invesco Distributors, Inc. (“IDI”) to serve as the distributor for the Class A, Class C, Class R, Class Y, Class R5 and Class R6 shares of the Fund. The Trust has adopted plans pursuant to Rule 12b-1 under the 1940 Act with respect to the Fund’s Class A, Class C and Class R shares (collectively, the “Plans”). The Fund, pursuant to the Class A Plan, reimburses IDI for its allocated share of expenses incurred for the period, up to a maximum annual rate of 0.25% of the average daily net assets of Class A shares. The Fund, pursuant to the Class C and Class R Plans, pays IDI compensation at the annual rate of 1.00% of the average daily net assets of Class C shares and 0.50% of the average daily net assets of Class R shares. The fees are accrued daily and paid monthly. Of the Plans payments, up to 0.25% of the average daily net assets of each class of shares may be paid to furnish continuing personal shareholder services to customers who purchase and own shares of such classes. Any amounts not paid as a service fee under the Plans would constitute an asset-based sales charge. Rules of the Financial Industry Regulatory Authority (“FINRA”) impose a cap on the total sales charges, including asset-based sales charges, that may be paid by any class of shares of the Fund. For the year ended April 30, 2024, expenses incurred under the Plans are shown in the Statement of Operations as Distribution fees.
Front-end sales commissions and CDSC (collectively, the “sales charges”) are not recorded as expenses of the Fund. Front-end sales commissions are deducted from proceeds from the sales of Fund shares prior to investment in Class A shares of the Fund. CDSC are deducted from redemption proceeds prior to remittance to the shareholder. During the year ended April 30, 2024, IDI advised the Fund that IDI retained $71,785 in front-end sales commissions from the sale of Class A shares and $644 and $1,009 from Class A and Class C shares, respectively, for CDSC imposed upon redemptions by shareholders.
For the year ended April 30, 2024, the Fund incurred $87,384 in brokerage commissions with Invesco Capital Markets, Inc., an affiliate of the Adviser and IDI, for portfolio transactions executed on behalf of the Fund.
Certain officers and trustees of the Trust are officers and directors of the Adviser, IIS and/or IDI.
NOTE 3–Additional Valuation Information
GAAP defines fair value as the price that would be received to sell an asset or paid to transfer a liability in an orderly transaction between market participants at the measurement date, under current market conditions. GAAP establishes a hierarchy that prioritizes the inputs to valuation methods, giving the highest priority to readily available unadjusted quoted prices in an active market for identical assets (Level 1) and the lowest priority to significant unobservable inputs (Level 3), generally when market prices are not readily available. Based on the valuation inputs, the securities or other investments are tiered into one of three levels. Changes in valuation methods may result in transfers in or out of an investment’s assigned level:
| | |
| Level 1 - | | Prices are determined using quoted prices in an active market for identical assets. |
| Level 2 - | | Prices are determined using other significant observable inputs. Observable inputs are inputs that other market participants may use in pricing a security. These may include quoted prices for similar securities, interest rates, prepayment speeds, credit risk, yield curves, loss severities, default rates, discount rates, volatilities and others. |
| Level 3 - | | Prices are determined using significant unobservable inputs. In situations where quoted prices or observable inputs are unavailable (for example, when there is little or no market activity for an investment at the end of the period), unobservable inputs may be used. Unobservable inputs reflect the Adviser’s assumptions about the factors market participants would use in determining fair value of the securities or instruments and would be based on the best available information. |
The following is a summary of the tiered valuation input levels, as of April 30, 2024. The level assigned to the securities valuations may not be an indication of the risk or liquidity associated with investing in those securities. Because of the inherent uncertainties of valuation, the values reflected in the financial statements may materially differ from the value received upon actual sale of those investments.
| | | | | | | | | | | | | | | | | | | | | | | | | | | | | | | | | | | | | | | | |
| | | Level 1 | | | | | | | | | Level 2 | | | | | | | | | Level 3 | | | | | | | | | Total | |
|
| |
Investments in Securities | | | | | | | | | | | | | | | | | | | | | | | | | | | | | | | | | | | | | | | | |
|
| |
Common Stocks & Other Equity Interests | | $ | 770,923,838 | | | | | | | | | | | $ | – | | | | | | | | | | | | $– | | | | | | | | | | | $ | 770,923,838 | |
|
| |
Money Market Funds | | | 12,926,061 | | | | | | | | | | | | 9,144,609 | | | | | | | | | | | | – | | | | | | | | | | | | 22,070,670 | |
|
| |
Total Investments | | $ | 783,849,899 | | | | | | | | | | | $ | 9,144,609 | | | | | | | | | | | | $– | | | | | | | | | | | $ | 792,994,508 | |
|
| |
NOTE 4–Derivative Investments
The Fund may enter into an International Swaps and Derivatives Association Master Agreement (“ISDA Master Agreement”) under which a fund may trade OTC derivatives. An OTC transaction entered into under an ISDA Master Agreement typically involves a collateral posting arrangement, payment netting provisions and close-out netting provisions. These netting provisions allow for reduction of credit risk through netting of contractual obligations. The enforceability of the netting provisions of the ISDA Master Agreement depends on the governing law of the ISDA Master Agreement, among other factors.
For financial reporting purposes, the Fund does not offset OTC derivative assets or liabilities that are subject to ISDA Master Agreements in the Statement of Assets and Liabilities.
| | |
| 17 | | Invesco Comstock Select Fund |
Effect of Derivative Investments for the year ended April 30, 2024
The table below summarizes the gains (losses) on derivative investments, detailed by primary risk exposure, recognized in earnings during the period:
| | | | |
| | | Location of Gain (Loss) on
Statement of Operations | |
| | | Currency Risk | |
|
| |
Realized Gain (Loss): | | | | |
Forward foreign currency contracts | | | $(89,814) | |
|
| |
The table below summarizes the average notional value of derivatives held during the period.
| | |
| | | Forward Foreign Currency Contracts |
|
|
Average notional value | | $8,956,090 |
|
|
NOTE 5–Expense Offset Arrangement(s)
The expense offset arrangement is comprised of transfer agency credits which result from balances in demand deposit accounts used by the transfer agent for clearing shareholder transactions. For the year ended April 30, 2024, the Fund received credits from this arrangement, which resulted in the reduction of the Fund’s total expenses of $38,678.
NOTE 6–Trustees’ and Officers’ Fees and Benefits
Trustees’ and Officers’ Fees and Benefits include amounts accrued by the Fund to pay remuneration to certain Trustees and Officers of the Fund. Trustees have the option to defer compensation payable by the Fund, and Trustees’ and Officers’ Fees and Benefits also include amounts accrued by the Fund to fund such deferred compensation amounts. Those Trustees who defer compensation have the option to select various Invesco Funds in which their deferral accounts shall be deemed to be invested. Finally, certain current Trustees were eligible to participate in a retirement plan that provided for benefits to be paid upon retirement to Trustees over a period of time based on the number of years of service. The Fund may have certain former Trustees who also participate in a retirement plan and receive benefits under such plan. Trustees’ and Officers’ Fees and Benefits include amounts accrued by the Fund to fund such retirement benefits. Obligations under the deferred compensation and retirement plans represent unsecured claims against the general assets of the Fund.
NOTE 7–Cash Balances
The Fund is permitted to temporarily carry a negative or overdrawn balance in its account with SSB, the custodian bank. Such balances, if any at period-end, are shown in the Statement of Assets and Liabilities under the payable caption Amount due custodian. To compensate the custodian bank for such overdrafts, the overdrawn Fund may either (1) leave funds as a compensating balance in the account so the custodian bank can be compensated by earning the additional interest; or (2) compensate by paying the custodian bank at a rate agreed upon by the custodian bank and Invesco, not to exceed the contractually agreed upon rate.
NOTE 8–Distributions to Shareholders and Tax Components of Net Assets
Tax Character of Distributions to Shareholders Paid During the Fiscal Years Ended April 30, 2024 and 2023:
| | | | | | | | | | | | |
| | | 2024 | | | | | | 2023 | |
|
| |
Ordinary income* | | $ | 22,448,112 | | | | | | | $ | 24,229,493 | |
|
| |
Long-term capital gain | | | 15,615,699 | | | | | | | | 75,476,905 | |
|
| |
Total distributions | | $ | 38,063,811 | | | | | | | $ | 99,706,398 | |
|
| |
| * | Includes short-term capital gain distributions, if any. |
Tax Components of Net Assets at Period-End:
| | | | |
| | | 2024 | |
|
| |
Undistributed ordinary income | | $ | 13,385,293 | |
|
| |
Undistributed long-term capital gain | | | 4,027,718 | |
|
| |
Net unrealized appreciation – investments | | | 143,281,148 | |
|
| |
Net unrealized appreciation (depreciation) - foreign currencies | | | (4 | ) |
|
| |
Temporary book/tax differences | | | (171,065 | ) |
|
| |
Shares of beneficial interest | | | 624,195,627 | |
|
| |
Total net assets | | $ | 784,718,717 | |
|
| |
The difference between book-basis and tax-basis unrealized appreciation (depreciation) is due to differences in the timing of recognition of gains and losses on investments for tax and book purposes. The Fund’s net unrealized appreciation (depreciation) difference is attributable primarily to wash sales.
The temporary book/tax differences are a result of timing differences between book and tax recognition of income and/or expenses. The Fund’s temporary book/tax differences are the result of the trustee deferral of compensation and retirement plan benefits.
Capital loss carryforward is calculated and reported as of a specific date. Results of transactions and other activity after that date may affect the amount of capital loss carryforward actually available for the Fund to utilize. The ability to utilize capital loss carryforward in the future may be limited under the Internal Revenue Code and related regulations based on the results of future transactions.
The Fund does not have a capital loss carryforward as of April 30, 2024.
| | |
| 18 | | Invesco Comstock Select Fund |
NOTE 9–Investment Transactions
The aggregate amount of investment securities (other than short-term securities, U.S. Government obligations and money market funds, if any) purchased and sold by the Fund during the year ended April 30, 2024 was $744,954,510 and $735,392,318, respectively. Cost of investments, including any derivatives, on a tax basis includes the adjustments for financial reporting purposes as of the most recently completed federal income tax reporting period-end.
| | | | |
Unrealized Appreciation (Depreciation) of Investments on a Tax Basis | |
Aggregate unrealized appreciation of investments | | | $160,466,807 | |
|
| |
Aggregate unrealized (depreciation) of investments | | | (17,185,659 | ) |
|
| |
Net unrealized appreciation of investments | | | $143,281,148 | |
|
| |
Cost of investments for tax purposes is $649,713,360.
NOTE 10–Reclassification of Permanent Differences
Primarily as a result of differing book/tax treatment of equalization, on April 30, 2024, undistributed net investment income was increased by $11,309, undistributed net realized gain was decreased by $4,697,309 and shares of beneficial interest was increased by $4,686,000. This reclassification had no effect on the net assets of the Fund.
NOTE 11–Share Information
| | | | | | | | | | | | | | | | |
| | | Summary of Share Activity | |
|
| |
| | |
| | | Year ended | | | Year ended | |
| | | April 30, 2024(a) | | | April 30, 2023 | |
| | | Shares | | | Amount | | | Shares | | | Amount | |
|
| |
Sold: | | | | | | | | | | | | | | | | |
Class A | | | 1,973,469 | | | $ | 63,934,589 | | | | 1,586,678 | | | $ | 51,386,921 | |
|
| |
Class C | | | 209,931 | | | | 6,241,060 | | | | 219,346 | | | | 6,676,668 | |
|
| |
Class R | | | 261,430 | | | | 8,138,918 | | | | 229,855 | | | | 7,224,026 | |
|
| |
Class Y | | | 1,693,027 | | | | 57,004,372 | | | | 1,159,693 | | | | 38,046,106 | |
|
| |
Class R6 | | | 627,989 | | | | 21,156,194 | | | | 469,934 | | | | 15,551,913 | |
|
| |
| | | | |
Issued as reinvestment of dividends: | | | | | | | | | | | | | | | | |
Class A | | | 865,161 | | | | 27,639,392 | | | | 2,444,925 | | | | 75,045,448 | |
|
| |
Class C | | | 45,400 | | | | 1,328,726 | | | | 163,203 | | | | 4,617,392 | |
|
| |
Class R | | | 70,707 | | | | 2,177,932 | | | | 201,700 | | | | 5,981,536 | |
|
| |
Class Y | | | 116,856 | | | | 3,882,572 | | | | 169,752 | | | | 5,405,107 | |
|
| |
Class R6 | | | 44,509 | | | | 1,475,449 | | | | 63,109 | | | | 2,002,369 | |
|
| |
| | | | |
Automatic conversion of Class C shares to Class A shares: | | | | | | | | | | | | | | | | |
Class A | | | 106,569 | | | | 3,481,907 | | | | 89,090 | | | | 2,866,421 | |
|
| |
Class C | | | (115,906 | ) | | | (3,481,907 | ) | | | (96,230 | ) | | | (2,866,421 | ) |
|
| |
| | | | |
Reacquired: | | | | | | | | | | | | | | | | |
Class A | | | (2,964,887 | ) | | | (96,078,632 | ) | | | (2,312,576 | ) | | | (74,986,866 | ) |
|
| |
Class C | | | (279,557 | ) | | | (8,318,134 | ) | | | (214,580 | ) | | | (6,410,842 | ) |
|
| |
Class R | | | (298,524 | ) | | | (9,338,681 | ) | | | (236,518 | ) | | | (7,409,239 | ) |
|
| |
Class Y | | | (1,409,455 | ) | | | (47,700,584 | ) | | | (713,888 | ) | | | (23,746,478 | ) |
|
| |
Class R6 | | | (299,209 | ) | | | (10,079,989 | ) | | | (185,393 | ) | | | (6,126,676 | ) |
|
| |
Net increase in share activity | | | 647,510 | | | $ | 21,463,184 | | | | 3,038,100 | | | $ | 93,257,385 | |
|
| |
| (a) | There are entities that are record owners of more than 5% of the outstanding shares of the Fund and in the aggregate own 6% of the outstanding shares of the Fund. IDI has an agreement with these entities to sell Fund shares. The Fund, Invesco and/or Invesco affiliates may make payments to these entities, which are considered to be related to the Fund, for providing services to the Fund, Invesco and/or Invesco affiliates including but not limited to services such as securities brokerage, distribution, third party record keeping and account servicing. The Fund has no knowledge as to whether all or any portion of the shares owned of record by these entities are also owned beneficially. |
| | |
| 19 | | Invesco Comstock Select Fund |
Report of Independent Registered Public Accounting Firm
To the Board of Trustees of AIM Sector Funds (Invesco Sector Funds) and Shareholders of Invesco Comstock Select Fund
Opinion on the Financial Statements
We have audited the accompanying statement of assets and liabilities, including the schedule of investments, of Invesco Comstock Select Fund (one of the funds constituting AIM Sector Funds (Invesco Sector Funds), referred to hereafter as the “Fund”) as of April 30, 2024, the related statement of operations for the year ended April 30, 2024, the statement of changes in net assets for each of the two years in the period ended April 30, 2024, including the related notes, and the financial highlights for each of the periods indicated therein (collectively referred to as the “financial statements”). In our opinion, the financial statements present fairly, in all material respects, the financial position of the Fund as of April 30, 2024, the results of its operations for the year then ended, the changes in its net assets for each of the two years in the period ended April 30, 2024 and the financial highlights for each of the periods indicated therein in conformity with accounting principles generally accepted in the United States of America.
Basis for Opinion
These financial statements are the responsibility of the Fund’s management. Our responsibility is to express an opinion on the Fund’s financial statements based on our audits. We are a public accounting firm registered with the Public Company Accounting Oversight Board (United States) (PCAOB) and are required to be independent with respect to the Fund in accordance with the U.S. federal securities laws and the applicable rules and regulations of the Securities and Exchange Commission and the PCAOB.
We conducted our audits of these financial statements in accordance with the standards of the PCAOB. Those standards require that we plan and perform the audit to obtain reasonable assurance about whether the financial statements are free of material misstatement, whether due to error or fraud.
Our audits included performing procedures to assess the risks of material misstatement of the financial statements, whether due to error or fraud, and performing procedures that respond to those risks. Such procedures included examining, on a test basis, evidence regarding the amounts and disclosures in the financial statements. Our audits also included evaluating the accounting principles used and significant estimates made by management, as well as evaluating the overall presentation of the financial statements. Our procedures included confirmation of securities owned as of April 30, 2024 by correspondence with the custodian, transfer agent and broker. We believe that our audits provide a reasonable basis for our opinion.
/s/PricewaterhouseCoopers LLP
Houston, Texas
June 20, 2024
We have served as the auditor of one or more of the investment companies in the Invesco group of investment companies since at least 1995. We have not been able to determine the specific year we began serving as auditor.
| | |
| 20 | | Invesco Comstock Select Fund |
Calculating your ongoing Fund expenses
Example
As a shareholder of the Fund, you incur two types of costs: (1) transaction costs, which may include sales charges (loads) on purchase payments or contingent deferred sales charges on redemptions, if any; and (2) ongoing costs, including management fees, distribution and/or service (12b-1) fees, and other Fund expenses. This example is intended to help you understand your ongoing costs (in dollars) of investing in the Fund and to compare these costs with ongoing costs of investing in other mutual funds. The example is based on an investment of $1,000 invested at the beginning of the period and held for the entire period November 1, 2023 through April 30, 2024.
Actual expenses
The table below provides information about actual account values and actual expenses. You may use the information in this table, together with the amount you invested, to estimate the expenses that you paid over the period. Simply divide your account value by $1,000 (for example, an $8,600 account value divided by $1,000 = 8.6), then multiply the result by the number in the table under the heading entitled “Actual Expenses Paid During Period” to estimate the expenses you paid on your account during this period.
Hypothetical example for comparison purposes
The table below also provides information about hypothetical account values and hypothetical expenses based on the Fund’s actual expense ratio and an assumed rate of return of 5% per year before expenses, which is not the Fund’s actual return.
The hypothetical account values and expenses may not be used to estimate the actual ending account balance or expenses you paid for the period. You may use this information to compare the ongoing costs of investing in the Fund and other funds. To do so, compare this 5% hypothetical example with the 5% hypothetical examples that appear in the shareholder reports of the other funds.
Please note that the expenses shown in the table are meant to highlight your ongoing costs only and do not reflect any transaction costs, such as sales charges (loads) on purchase payments or contingent deferred sales charges on redemptions, if any. Therefore, the hypothetical information is useful in comparing ongoing costs only, and will not help you determine the relative total costs of owning different funds. In addition, if these transaction costs were included, your costs would have been higher.
| | | | | | | | | | | | |
| | | | | ACTUAL | | HYPOTHETICAL (5% annual return before
expenses) | | |
| | | Beginning Account Value
(11/01/23) | | Ending Account Value
(04/30/24)1 | | Expenses Paid During
Period2 | | Ending Account Value
(04/30/24) | | Expenses Paid During
Period2 | | Annualized
Expense Ratio |
Class A | | $1,000.00 | | $1,172.10 | | $5.02 | | $1,020.24 | | $4.67 | | 0.93% |
Class C | | 1,000.00 | | 1,167.50 | | 9.11 | | 1,016.46 | | 8.47 | | 1.69 |
Class R | | 1,000.00 | | 1,170.50 | | 6.42 | | 1,018.95 | | 5.97 | | 1.19 |
Class Y | | 1,000.00 | | 1,173.20 | | 3.73 | | 1,021.43 | | 3.47 | | 0.69 |
Class R5 | | 1,000.00 | | 1,173.60 | | 3.24 | | 1,021.88 | | 3.02 | | 0.60 |
Class R6 | | 1,000.00 | | 1,174.10 | | 3.24 | | 1,021.88 | | 3.02 | | 0.60 |
| 1 | The actual ending account value is based on the actual total return of the Fund for the period November 1, 2023 through April 30, 2024, after actual expenses and will differ from the hypothetical ending account value which is based on the Fund’s expense ratio and a hypothetical annual return of 5% before expenses. |
| 2 | Expenses are equal to the Fund’s annualized expense ratio as indicated above multiplied by the average account value over the period, multiplied by 182/366 to reflect the most recent fiscal half year. |
| | |
| 21 | | Invesco Comstock Select Fund |
Tax Information
Form 1099-DIV, Form 1042-S and other year–end tax information provide shareholders with actual calendar year amounts that should be included in their tax returns. Shareholders should consult their tax advisers.
The following distribution information is being provided as required by the Internal Revenue Code or to meet a specific state’s requirement.
The Fund designates the following amounts or, if subsequently determined to be different, the maximum amount allowable for its fiscal year ended April 30, 2024:
| | | | | | | | |
Federal and State Income Tax | | | | | | |
Long-Term Capital Gain Distributions | | | $20,301,699 | | | | | |
Qualified Dividend Income* | | | 72.05 | % | | | | |
Corporate Dividends Received Deduction* | | | 62.20 | % | | | | |
U.S. Treasury Obligations* | | | 0.00 | % | | | | |
Qualified Business Income* | | | 0.00 | % | | | | |
Business Interest Income* | | | 2.48 | % | | | | |
| | | | | | | | |
* The above percentages are based on ordinary income dividends paid to shareholders during the Fund’s fiscal year. | | | | | | | | |
| | | | | | | | |
Non-Resident Alien Shareholders | | | | | | |
Short-Term Capital Gain Distributions | | | $10,646,520 | | | | | |
| | |
| 22 | | Invesco Comstock Select Fund |
Trustees and Officers
The address of each trustee and officer is AIM Sector Funds (Invesco Sector Funds) (the “Trust”), 11 Greenway Plaza, Houston, Texas 77046-1173. The trustees serve for the life of the Trust, subject to their earlier death, incapacitation, resignation, retirement or removal as more specifically provided in the Trust’s organizational documents. Each officer serves for a one year term or until their successors are elected and qualified. Column two below includes length of time served with predecessor entities, if any.
| | | | | | | | |
Name, Year of Birth and Position(s) Held with the Trust | | Trustee and/or Officer Since | | Principal Occupation(s) During Past 5 Years | | Number of Funds in Fund Complex Overseen by Trustee | | Other Directorship(s) Held by Trustee During At Least The Past 5 Years |
| Interested Trustees | | | | | | | | |
Jeffrey H. Kupor1 - 1968 Trustee | | 2024 | | Senior Managing Director and General Counsel, Invesco Ltd.; Trustee, Invesco Foundation, Inc.; Director, Invesco Advisers, Inc.; Executive Vice President, Invesco Asset Management (Bermuda), Ltd., Invesco Investments (Bermuda) Ltd.; and Vice President, Invesco Group Services, Inc. Formerly: Head of Legal of the Americas, Invesco Ltd.; Senior Vice President and Secretary, Invesco Advisers, Inc. (formerly known as Invesco Institutional (N.A.), Inc.) (registered investment adviser); Secretary, Invesco Distributors, Inc. (formerly known as Invesco AIM Distributors, Inc.); Vice President and Secretary, Invesco Investment Services, Inc. (formerly known as Invesco AIM Investment Services, Inc.); Senior Vice President, Chief Legal Officer and Secretary, The Invesco Funds; Secretary and General Counsel, Invesco Investment Advisers LLC (formerly known as Van Kampen Asset Management); Secretary and General Counsel, Invesco Capital Markets, Inc. (formerly known as Van Kampen Funds Inc.) and Chief Legal Officer, Invesco Exchange-Traded Fund Trust, Invesco Exchange-Traded Fund Trust II, Invesco India Exchange-Traded Fund Trust, Invesco Actively Managed Exchange-Traded Fund Trust, Invesco Actively Managed Exchange-Traded Commodity Fund Trust and Invesco Exchange-Traded Self-Indexed Fund Trust; Secretary and Vice President, Harbourview Asset Management Corporation; Secretary and Vice President, OppenheimerFunds, Inc. and Invesco Managed Accounts, LLC; Secretary and Senior Vice President, OFI Global Institutional, Inc.; Secretary and Vice President, OFI SteelPath, Inc.; Secretary and Vice President, Oppenheimer Acquisition Corp.; Secretary and Vice President, Shareholder Services, Inc.; Secretary and Vice President, Trinity Investment Management Corporation, Senior Vice President, Invesco Distributors, Inc.; Secretary and Vice President, Jemstep, Inc.; Head of Legal, Worldwide Institutional, Invesco Ltd.; Secretary and General Counsel, INVESCO Private Capital Investments, Inc.; Senior Vice President, Secretary and General Counsel, Invesco Management Group, Inc. (formerly known as Invesco AIM Management Group, Inc.); Assistant Secretary, INVESCO Asset Management (Bermuda) Ltd.; Secretary and General Counsel, Invesco Private Capital, Inc.; Assistant Secretary and General Counsel, INVESCO Realty, Inc.; Secretary and General Counsel, Invesco Senior Secured Management, Inc.; Secretary, Sovereign G./P. Holdings Inc.; Secretary, Invesco Indexing LLC; and Secretary, W.L. Ross & Co., LLC | | 164 | | None |
Douglas Sharp1 - 1974 Trustee | | 2024 | | Senior Managing Director and Head of Americas & EMEA, Invesco Ltd. Formerly: Director and Chairman Invesco UK Limited; Director, Chairman and Chief Executive, Invesco Fund Managers Limited | | 164 | | None |
| 1 | Mr. Kupor and Mr. Sharp are considered interested persons (within the meaning of Section 2(a)(19) of the 1940 Act) of the Trust because they are officers of the Adviser to the Trust, and officers of Invesco Ltd., ultimate parent of the Adviser. |
| | |
| T-1 | | Invesco Comstock Select Fund |
Trustees and Officers–(continued)
| | | | | | | | |
Name, Year of Birth and Position(s) Held with the Trust | | Trustee and/or Officer Since | | Principal Occupation(s) During Past 5 Years | | Number of Funds in Fund Complex Overseen by Trustee | | Other Directorship(s) Held by Trustee During At Least The Past 5 Years |
| Independent Trustees | | | | | | | | |
Beth Ann Brown - 1968 Trustee (2019) and Chair (2022) | | 2019 | | Independent Consultant Formerly: Head of Intermediary Distribution, Managing Director, Strategic Relations, Managing Director, Head of National Accounts, Senior Vice President, National Account Manager and Senior Vice President, Key Account Manager, Columbia Management Investment Advisers LLC; and Vice President, Key Account Manager, Liberty Funds Distributor, Inc. | | 164 | | Director, Board of Directors of Caron Engineering Inc.; Formerly: Advisor, Board of Advisors of Caron Engineering Inc.; President and Director, Acton Shapleigh Youth Conservation Corps (non-profit); President and Director Director of Grahamtastic Connection (non-profit); and Trustee of certain Oppenheimer Funds |
Carol Deckbar - 1962 Trustee | | 2024 | | Formerly: Executive Vice President and Chief Product Officer, TIAA Financial Services; Executive Vice President and Principal, College Retirement Equities Fund at TIAA; Executive Vice President and Head of Institutional Investments and Endowment Services, TIAA | | 164 | | Formerly: Board Member, TIAA Asset Management, Inc.; and Board Member, TH Real Estate Group Holdings Company |
Cynthia Hostetler - 1962 Trustee | | 2017 | | Non-Executive Director and Trustee of a number of public and private business corporations Formerly: Director, Aberdeen Investment Funds (4 portfolios); Director, Artio Global Investment LLC (mutual fund complex); Director, Edgen Group, Inc. (specialized energy and infrastructure products distributor); Director, Genesee & Wyoming, Inc. (railroads); Head of Investment Funds and Private Equity, Overseas Private Investment Corporation; President, First Manhattan Bancorporation, Inc.; and Attorney, Simpson Thacher & Bartlett LLP | | 164 | | Resideo Technologies, Inc. (smart home technology); Vulcan Materials Company (construction materials company); Trilinc Global Impact Fund; Investment Company Institute (professional organization); and Independent Directors Council (professional organization) |
Eli Jones - 1961 Trustee | | 2016 | | Professor and Dean Emeritus, Mays Business School - Texas A&M University Formerly: Dean of Mays Business School-Texas A&M University; Professor and Dean, Walton College of Business, University of Arkansas and E.J. Ourso College of Business, Louisiana State University; and Director, Arvest Bank | | 164 | | Insperity, Inc. (formerly known as Administaff) (human resources provider); Board Member of the regional board, First Financial Bank Texas; and Boad Member, First Financial Bankshares, Inc. Texas |
Elizabeth Krentzman - 1959 Trustee | | 2019 | | Formerly: Principal and Chief Regulatory Advisor for Asset Management Services and U.S. Mutual Fund Leader of Deloitte & Touche LLP; General Counsel of the Investment Company Institute (trade association); National Director of the Investment Management Regulatory Consulting Practice, Principal, Director and Senior Manager of Deloitte & Touche LLP; Assistant Director of the Division of Investment Management - Office of Disclosure and Investment Adviser Regulation of the U.S. Securities and Exchange Commission and various positions with the Division of Investment Management – Office of Regulatory Policy of the U.S. Securities and Exchange Commission; and Associate at Ropes & Gray LLP | | 164 | | Formerly: Member of the Cartica Funds Board of Directors (private investment fund); Trustee of the University of Florida National Board Foundation; Member of the University of Florida Law Center Association, Inc. Board of Trustees, Audit Committee and Membership Committee; and Trustee of certain Oppenheimer Funds |
Anthony J. LaCava, Jr. –1956 Trustee | | 2019 | | Formerly: Director and Member of the Audit Committee, Blue Hills Bank (publicly traded financial institution) and Managing Partner, KPMG LLP | | 164 | | Member and Chairman, of the Bentley University, Business School Advisory Council; Formerly: Board Member and Chair of the Audit and Finance Committee and Nominating Committee, KPMG LLP |
James “Jim” Liddy - 1959 Trustee | | 2024 | | Formerly: Chairman, Global Financial Services, Americas and Retired Partner, KPMG LLP | | 164 | | Director and Treasurer, Gulfside Place Condominium Association, Inc. and Non-Executive Director, Kellenberg Memorial High School |
| | |
| T-2 | | Invesco Comstock Select Fund |
Trustees and Officers–(continued)
| | | | | | | | |
Name, Year of Birth and Position(s) Held with the Trust | | Trustee and/or Officer Since | | Principal Occupation(s) During Past 5 Years | | Number of Funds in Fund Complex Overseen by Trustee | | Other Directorship(s) Held by Trustee During At Least The Past 5 Years |
| Independent Trustees–(continued) | | | | | | |
Prema Mathai-Davis - 1950 Trustee | | 2003 | | Formerly: Co-Founder & Partner of Quantalytics Research, LLC, (a FinTech Investment Research Platform for the Self-Directed Investor); Trustee of YWCA Retirement Fund; CEO of YWCA of the USA; Board member of the NY Metropolitan Transportation Authority; Commissioner of the NYC Department of Aging; and Board member of Johns Hopkins Bioethics Institute | | 164 | | Member of Board of Positive Planet US (non-profit) and HealthCare Chaplaincy Network (non-profit) |
Joel W. Motley - 1952 Trustee | | 2019 | | Director of Office of Finance, Federal Home Loan Bank System; Managing Director of Carmona Motley Inc. (privately held financial advisor); Member of the Council on Foreign Relations and its Finance and Budget Committee; Chairman Emeritus of Board of Human Rights Watch and Member of its Investment Committee; and Member of Investment Committee Board of Historic Hudson Valley (non-profit cultural organization); and Member of the Vestry and the Investment Committee of Trinity Church Wall Street. Formerly: Managing Director of Public Capital Advisors, LLC (privately held financial advisor); Managing Director of Carmona Motley Hoffman, Inc. (privately held financial advisor); and Director of Columbia Equity Financial Corp. (privately held financial advisor) | | 164 | | Member of Board of Trust for Mutual Understanding (non-profit promoting the arts and environment); Member of Board of Greenwall Foundation (bioethics research foundation) and its Investment Committee; Member of Board of Friends of the LRC (non-profit legal advocacy); and Board Member and Investment Committee Member of Pulitzer Center for Crisis Reporting (non-profit journalism); and Trustee of certain Oppenheimer Funds; |
Teresa M. Ressel - 1962 Trustee | | 2017 | | Non-executive director and trustee of a number of public and private business corporations Formerly: Chief Executive Officer, UBS Securities LLC (investment banking); Group Chief Operating Officer, UBS AG Americas (investment banking); Sr. Management Team Olayan America, The Olayan Group (international investor/commercial/industrial); and Assistant Secretary for Management & Budget and Designated Chief Financial Officer, U.S. Department of Treasury | | 164 | | None |
Robert C. Troccoli - 1949 Trustee | | 2016 | | Formerly: Adjunct Professor, University of Denver – Daniels College of Business; and Managing Partner, KPMG LLP | | 164 | | None |
Daniel S. Vandivort - 1954 Trustee | | 2019 | | President, Flyway Advisory Services LLC (consulting and property management) and Member, Investment Committee of Historic Charleston Foundation Formerly: President and Chief Investment Officer, previously Head of Fixed Income, Weiss Peck and Greer/Robeco Investment Management; Trustee and Chair, Weiss Peck and Greer Funds Board; and various capacities at CS First Boston including Head of Fixed Income at First Boston Asset Management. | | 164 | | Formerly: Trustee and Governance Chair, Oppenheimer Funds; Treasurer, Chairman of the Audit and Finance Committee, Huntington Disease Foundation of America |
| | |
| T-3 | | Invesco Comstock Select Fund |
Trustees and Officers–(continued)
| | | | | | | | |
Name, Year of Birth and Position(s) Held with the Trust | | Trustee and/or Officer Since | | Principal Occupation(s) During Past 5 Years | | Number of Funds in Fund Complex Overseen by Trustee | | Other Directorship(s) Held by Trustee During At Least The Past 5 Years |
| Officers | | | | | | |
Glenn Brightman - 1972 President and Principal Executive Officer | | 2023 | | Chief Operating Officer, Americas, Invesco Ltd.; Senior Vice President, Invesco Advisers, Inc.; President and Principal Executive Officer, The Invesco Funds; Manager, Invesco Investment Advisers LLC. Formerly: Global Head of Finance, Invesco Ltd; Executive Vice President and Chief Financial Officer, Nuveen | | N/A | | N/A |
Melanie Ringold - 1975 Senior Vice President, Chief Legal Officer and Secretary | | 2023 | | Head of Legal of the Americas, Invesco Ltd.; Senior Vice President and Secretary, Invesco Advisers, Inc. (formerly known as Invesco Institutional (N.A.), Inc.) (registered investment adviser); Secretary, Invesco Distributors, Inc. (formerly known as Invesco AIM Distributors, Inc.); Secretary, Invesco Investment Services, Inc. (formerly known as Invesco AIM Investment Services, Inc.); Senior Vice President, Chief Legal Officer and Secretary, The Invesco Funds; Secretary, Invesco Investment Advisers LLC, Invesco Capital Markets, Inc.; Chief Legal Officer, Invesco Exchange-Traded Fund Trust, Invesco Exchange-Traded Fund Trust II, Invesco India Exchange-Traded Fund Trust, Invesco Actively Managed Exchange-Traded Fund Trust, Invesco Actively Secretary and Vice President, Harbourview Asset Management Corporation; Secretary and Senior Vice President, OppenheimerFunds, Inc. and Invesco Managed Accounts, LLC; Secretary and Senior Vice President, Oppenheimer Acquisition Corp.; Secretary, SteelPath Funds Remediation LLC; and Secretary and Senior Vice President, Trinity Investment Management Corporation Formerly: Secretary and Senior Vice President, OFI SteelPath, Inc., Assistant Secretary, Invesco Distributors, Inc., Invesco Advisers, Inc., Invesco Investment Services, Inc., Invesco Capital Markets, Inc., Invesco Capital Management LLC and Invesco Investment Advisers LLC; and Assistant Secretary and Assistant Vice President, Invesco Funds | | N/A | | N/A |
John M. Zerr - 1962 Senior Vice President | | 2006 | | Chief Operating Officer of the Americas; Senior Vice President, Invesco Advisers, Inc. (formerly known as Invesco Institutional (N.A.), Inc.) (registered investment adviser); Senior Vice President, Invesco Distributors, Inc. (formerly known as Invesco AIM Distributors, Inc.); Director and Vice President, Invesco Investment Services, Inc. (formerly known as Invesco AIM Investment Services, Inc.) Senior Vice President, The Invesco Funds; Managing Director, Invesco Capital Management LLC; Senior Vice President, Invesco Capital Markets, Inc. (formerly known as Van Kampen Funds Inc.); Manager, Invesco Specialized Products, LLC; Member, Invesco Canada Funds Advisory Board; Director, President and Chief Executive Officer, Invesco Corporate Class Inc. (corporate mutual fund company); Director, Chairman, President and Chief Executive Officer, Invesco Canada Ltd. (formerly known as Invesco Trimark Ltd./Invesco Trimark Ltèe) (registered investment adviser and registered transfer agent); President, Invesco, Inc.; President, Invesco Global Direct Real Estate Feeder GP Ltd.; President, Invesco IP Holdings (Canada) Ltd; President, Invesco Global Direct Real Estate GP Ltd.; and President Invesco Financial Services Ltd. / Services Financiers Invesco Ltée | | N/A | | N/A |
| | | | | Formerly: Director and Chairman, Invesco Trust Company, Manager, Invesco Indexing LLC; Director, Invesco Investment Advisers LLC (formerly known as Van Kampen Asset Management); President, Trimark Investments Ltd/Services Financiers Invesco Ltee; Director and Senior Vice President, Invesco Insurance Agency, Inc.; Director and Senior Vice President, Invesco Management Group, Inc. (formerly known as Invesco AIM Management Group, Inc.); Secretary and General Counsel, Invesco Management Group, Inc. (formerly known as Invesco AIM Management Group, Inc.); Secretary, Invesco Investment Services, Inc. (formerly known as Invesco AIM Investment Services, Inc.); Chief Legal Officer and Secretary, The Invesco Funds; Secretary and General Counsel, Invesco Investment Advisers LLC (formerly known as Van Kampen Asset Management); Secretary and General Counsel, Invesco Capital Markets, Inc. (formerly known as Van Kampen Funds Inc.); Chief Legal Officer, Invesco Exchange-Traded Fund Trust, Invesco Exchange-Traded Fund Trust II, Invesco India Exchange-Traded Fund Trust, Invesco Actively Managed Exchange-Traded Fund Trust, Invesco Actively Managed Exchange-Traded Commodity Fund Trust and Invesco Exchange-Traded Self-Indexed Fund Trust; Secretary, Invesco Indexing LLC; Director, Secretary, General Counsel and Senior Vice President, Van Kampen Exchange Corp.; Director, Vice President and Secretary, IVZ Distributors, Inc. (formerly known as INVESCO Distributors, Inc.); Director and Vice President, INVESCO Funds Group, Inc.; Director and Vice President, Van Kampen Advisors Inc.; Director, Vice President, Secretary and General Counsel, Van Kampen Investor Services Inc.;Director and Secretary, Invesco Distributors, Inc. (formerly known as Invesco AIM Distributors, Inc.); Director, Senior Vice President, General Counsel and Secretary, Invesco AIM Advisers, Inc. and Van Kampen Investments Inc.; Director, Vice President and Secretary, Fund Management Company; Director, Senior Vice President, Secretary, General Counsel and Vice President, Invesco AIM Capital Management, Inc.; and Chief Operating Officer and General Counsel, Liberty Ridge Capital, Inc. (an investment adviser) | | | | |
| | |
| T-4 | | Invesco Comstock Select Fund |
Trustees and Officers–(continued)
| | | | | | | | |
Name, Year of Birth and Position(s) Held with the Trust | | Trustee and/or Officer Since | | Principal Occupation(s) During Past 5 Years | | Number of Funds in Fund Complex Overseen by Trustee | | Other Directorship(s) Held by Trustee During At Least The Past 5 Years |
| Officers-(continued) | | | | | | |
Tony Wong - 1973 Senior Vice President | | 2023 | | Senior Managing Director, Invesco Ltd.; Director, Chairman, Chief Executive Officer and President, Invesco Advisers, Inc.; Director and Chairman, Invesco Private Capital, Inc., INVESCO Private Capital Investments, Inc. and INVESCO Realty, Inc.; Director, Invesco Senior Secured Management, Inc.; President, Invesco Managed Accounts, LLC and SNW Asset Management Corporation; and Senior Vice President, The Invesco Funds Formerly: Assistant Vice President, The Invesco Funds; and Vice President, Invesco Advisers, Inc. | | N/A | | N/A |
Stephanie C. Butcher - 1971 Senior Vice President | | 2023 | | Senior Managing Director, Invesco Ltd.; Senior Vice President, The Invesco Funds; Director and Chief Executive Officer, Invesco Asset Management Limited | | N/A | | N/A |
Adrien Deberghes - 1967 Principal Financial Officer, Treasurer and Senior Vice President | | 2020 | | Head of the Fund Office of the CFO and Fund Administration; Vice President, Invesco Advisers, Inc.; Director, Invesco Trust Company; Principal Financial Officer, Treasurer and Senior Vice President, The Invesco Funds; Vice President, Invesco Exchange-Traded Fund Trust, Invesco Exchange-Traded Fund Trust II, Invesco India Exchange-Traded Fund Trust, Invesco Actively Managed Exchange-Traded Fund Trust, Invesco Actively Managed Exchange-Traded Commodity Fund Trust and Invesco Exchange-Traded Self-Indexed Fund Trust Formerly: Vice President, The Invesco Funds; Senior Vice President and Treasurer, Fidelity Investments | | N/A | | N/A |
Crissie M. Wisdom - 1969 Anti-Money Laundering Compliance Officer | | 2013 | | Anti-Money Laundering and OFAC Compliance Officer for Invesco U.S. entities including: Invesco Advisers, Inc. and its affiliates, Invesco Capital Markets, Inc., Invesco Distributors, Inc., Invesco Investment Services, Inc., The Invesco Funds, Invesco Capital Management, LLC, Invesco Trust Company; and Fraud Prevention Manager for Invesco Investment Services, Inc. | | N/A | | N/A |
Todd F. Kuehl - 1969 Chief Compliance Officer and Senior Vice President | | 2020 | | Chief Compliance Officer, Invesco Advisers, Inc. (registered investment adviser); and Chief Compliance Officer and Senior Vice President, The Invesco Funds Formerly: Managing Director and Chief Compliance Officer, Legg Mason (Mutual Funds); Chief Compliance Officer, Legg Mason Private Portfolio Group (registered investment adviser) | | N/A | | N/A |
James Bordewick, Jr. - 1959 Senior Vice President and Senior Officer | | 2022 | | Senior Vice President and Senior Officer, The Invesco Funds Formerly: Chief Legal Officer, KingsCrowd, Inc. (research and analytical platform for investment in private capital markets); Chief Operating Officer and Head of Legal and Regulatory, Netcapital (private capital investment platform); Managing Director, General Counsel of asset management and Chief Compliance Officer for asset management and private banking, Bank of America Corporation; Chief Legal Officer, Columbia Funds and BofA Funds; Senior Vice President and Associate General Counsel, MFS Investment Management; Chief Legal Officer, MFS Funds; Associate, Ropes & Gray; and Associate, Gaston Snow & Ely Bartlett | | N/A | | N/A |
The Statement of Additional Information of the Trust includes additional information about the Fund’s Trustees and is available upon request, without charge, by calling 1.800.959.4246. Please refer to the Fund’s Statement of Additional Information for information on the Fund’s sub-advisers.
| | | | | | |
| Office of the Fund | | Investment Adviser | | Distributor | | Auditors |
| 11 Greenway Plaza | | Invesco Advisers, Inc. | | Invesco Distributors, Inc. | | PricewaterhouseCoopers LLP |
| Houston, TX 77046-1173 | | 1331 Spring Street, NW, Suite 2500 | | 11 Greenway Plaza | | 1000 Louisiana Street, Suite 5800 |
| | Atlanta, GA 30309 | | Houston, TX 77046-1173 | | Houston, TX 77002-5021 |
| | | |
| Counsel to the Fund | | Counsel to the Independent Trustees | | Transfer Agent | | Custodian |
| Stradley Ronon Stevens & Young, LLP | | Sidley Austin LLP | | Invesco Investment Services, Inc. | | State Street Bank and Trust Company |
| 2005 Market Street, Suite 2600 | | 787 Seventh Avenue | | 11 Greenway Plaza | | 225 Franklin Street |
| Philadelphia, PA 19103-7018 | | New York, NY 10019 | | Houston, TX 77046-1173 | | Boston, MA 02110-2801 |
| | |
| T-5 | | Invesco Comstock Select Fund |
Proxy Results
A Special Joint Meeting (“Meeting”) of Shareholders of AIM Sector Funds (Invesco Sector Funds), a Delaware statutory trust (“Trust”), was held on January 16, 2024. The Meeting was held for the following purpose:
(1) Elect 14 trustees to the Board of Trustees of the Trust, each of whom will serve until his or her successor is duly elected and qualified.
The results of the voting on the above matter were as follows:
| | | | | | |
| | | | | | | Votes |
| | | Matter | | Votes For | | Against/Withheld |
(1)* | | Beth Ann Brown | | 595,446,022.84 | | 16,915,661.31 |
| | Carol Deckbar | | 595,102,087.25 | | 17,259,596.89 |
| | Cynthia Hostetler | | 595,359,921.21 | | 17,001,762.94 |
| | Dr. Eli Jones | | 594,949,311.14 | | 17,412,373.00 |
| | Elizabeth Krentzman | | 595,453,833.65 | | 16,907,850.50 |
| | Jeffrey H. Kupor | | 595,342,690.51 | | 17,018,993.64 |
| | Anthony J. LaCava, Jr. | | 595,293,865.38 | | 17,067,818.77 |
| | James Liddy | | 594,980,026.97 | | 17,381,657.17 |
| | Dr. Prema Mathai-Davis | | 594,031,204.04 | | 18,330,480.11 |
| | Joel W. Motley | | 594,381,710.91 | | 17,979,973.23 |
| | Teresa M. Ressel | | 595,821,958.43 | | 16,539,725.72 |
| | Douglas Sharp | | 595,715,711.66 | | 16,645,972.48 |
| | Robert C. Troccoli | | 594,748,318.91 | | 17,613,365.24 |
| | Daniel S. Vandivort | | 595,002,691.19 | | 17,358,992.96 |
* Proposal 1 required approval by a combined vote of all the portfolios of AIM Sector Funds (Invesco Sector Funds).
| | |
| T-6 | | Invesco Comstock Select Fund |

Go paperless with eDelivery
Visit invesco.com/edelivery to enjoy the convenience and security of anytime electronic access to your investment documents.
With eDelivery, you can elect to have any or all of the following materials delivered straight to your inbox to download, save and print from your own computer:
∎ Fund reports and prospectuses
∎ Quarterly statements
∎ Daily confirmations
∎ Tax forms
Invesco mailing information
Send general correspondence to Invesco Investment Services, Inc., P.O. Box 219078, Kansas City, MO 64121-9078.
Important notice regarding delivery of security holder documents
To reduce Fund expenses, only one copy of most shareholder documents may be mailed to shareholders with multiple accounts at the same address (Householding). Mailing of your shareholder documents may be householded indefinitely unless you instruct us otherwise. If you do not want the mailing of these documents to be combined with those for other members of your household, please contact Invesco Investment Services, Inc. at 800 959 4246 or contact your financial institution. We will begin sending you individual copies for each account within 30 days after receiving your request.
Fund holdings and proxy voting information
The Fund provides a complete list of its portfolio holdings four times each year, at the end of each fiscal quarter. For the second and fourth quarters, the list appears, respectively, in the Fund’s semiannual and annual reports to shareholders. For the first and third quarters, the Fund files the list with the Securities and Exchange Commission (SEC) as an exhibit to its reports on Form N-PORT. The most recent list of portfolio holdings is available at invesco.com/completeqtrholdings. Shareholders can also look up the Fund’s Form N-PORT filings on the SEC website, sec.gov. The SEC file numbers for the Fund are shown below.
A description of the policies and procedures that the Fund uses to determine how to vote proxies relating to portfolio securities is available without charge, upon request, from our Client Services department at 800 959 4246, or at invesco.com/ corporate/about-us/esg. The information is also available on the SEC website, sec.gov.
Information regarding how the Fund voted proxies related to its portfolio securities during the most recent 12-month period ended June 30 is available at invesco.com/proxysearch. This information is also available on the SEC website, sec.gov.
Invesco Advisers, Inc. is an investment adviser; it provides investment advisory services to individual and institutional clients and does not sell securities. Invesco Distributors, Inc. is the US distributor for Invesco Ltd.’s retail mutual funds, exchange-traded funds and institutional money market funds. Both are wholly owned, indirect subsidiaries of Invesco Ltd.
| | | | |
| SEC file number(s): 811-03826 and 002-85905 | | Invesco Distributors, Inc. | | O-VAL-AR-1 |

| | |
| | |
| Annual Report to Shareholders | | April 30, 2024 |
Invesco Dividend Income Fund
Nasdaq:
A: IAUTX ∎ C: IUTCX ∎ R: IRTCX ∎ Y: IAUYX ∎ Investor: FSTUX ∎ R5: FSIUX ∎ R6: IFUTX
| | |
Beginning in July 2024, amendments adopted by the Securities and Exchange Commission will substantially impact the design, content, and delivery of shareholder reports. These newly designed shareholder reports will highlight key fund information in a clear and concise format and must be mailed to each shareholder that has not elected to receive the reports electronically. Other information, including financial statements, will no longer be included in the shareholder report but will be available at invesco.com/reports, delivered upon request, and filed on a semi-annual basis on Form N-CSR. If you would like to receive shareholder reports and other communications electronically instead of by mail, you may make that request by contacting your financial intermediary (such as a broker-dealer or bank) or, if you are a direct investor, by enrolling at invesco.com/edelivery. If you do not make this request or enroll in e-delivery, you will receive future shareholder reports and other communications by mail. | | |
Management’s Discussion of Fund Performance
| | | | |
| |
Performance summary | |
For the fiscal year ended April 30, 2024, Class A shares of Invesco Dividend Income Fund (the Fund), at net asset value (NAV), underperformed the Russell 1000 Value Index, the Fund’s style-specific benchmark. | |
Your Fund’s long-term performance appears later in this report. | |
| |
Fund vs. Indexes | |
Total returns, 4/30/23 to 4/30/24, at net asset value (NAV). Performance shown does not include applicable contingent deferred sales charges (CDSC) or front-end sales charges, which would have reduced performance. | |
| |
Class A Shares | | | 9.21 | % |
Class C Shares | | | 8.39 | |
Class R Shares | | | 8.92 | |
Class Y Shares | | | 9.51 | |
Investor Class Shares | | | 9.24 | |
Class R5 Shares | | | 9.49 | |
Class R6 Shares | | | 9.60 | |
S&P 500 Index▼ (Broad Market Index) | | | 22.66 | |
Russell 1000 Value Index▼ (Style-Specific Index) | | | 13.42 | |
Lipper Equity Income Funds Index∎ (Peer Group Index) | | | 12.46 | |
| |
Source(s): ▼RIMES Technologies Corp.; ∎Lipper Inc. | | | | |
Market conditions and your Fund
The US economy and equity markets remained resilient in the second quarter of 2023, as milder inflation data and better-than-expected corporate earnings supported equities, with most major indexes posting gains for the quarter and with some big tech names providing optimistic future guidance. Following the March 2023 banking crisis, markets stabilized in April, as corporate earnings season got underway with many companies exceeding earnings and revenue estimates. Facing persistently strong employment data, the US Federal Reserve (the Fed) raised the federal funds rate by 0.25% at its May 2023 meeting,1 but left rates unchanged at its June meeting, giving investors the long-awaited “pause” in rate hikes, which sent equities broadly higher.
Equity markets declined in the third quarter and into October 2023 as a resilient US economy complicated the Fed’s efforts to tame inflation. While inflation has slowed from its peak in 2022, in July 2023, the Consumer Price Index (CPI) rose by 0.2% and the 12-month headline inflation rate rose to 3.2% from 3% in June.2 Due to the persistence of inflation, the Fed raised the federal funds rate again in July by 0.25%.1 The CPI data released in September was higher-than-expected and the overall US labor market remained tight with unemployment near historic lows. At the same time the third quarter year-over-year Gross Domestic Product (GDP) estimate was 4.9%, far above expectations.2 Despite the higher-than-expected GDP for the third quarter of 2023, the Fed held interest rates steady at its September and October meetings, but left open the possibility of another rate hike before the end of the calendar year.1
US equity markets posted strong gains in the fourth quarter of 2023 as investors anticipated the potential end of interest rate hikes by the Fed. Inflation slowed during the period as the CPI 12-month headline inflation rate fell to 3.1% in November from 3.7% in September, significantly below the 2022 peak of 9.1%.2 The Fed kept rates steady at its mid-December meeting and indicated that three rate cuts are expected in 2024. Fed chairman Powell noted that “the Fed’s policy rate is likely at or near its peak for this tightening cycle,”1 which prompted a strong equity rally into 2023 year-end and the yield on the 10-year US Treasury to fall from nearly 5% in October to below 4%.3
US equity markets rallied in the first quarter of 2024. In February, the S&P 500 Index closed above the 5,000 milestone for the first time.3 The US economy defied recession predictions, achieving a growth rate of 2.5% in 2023 and the labor market remained robust, with continued payroll gains and unemployment still historically low – below 4%.2 Inflation, however, remained persistent. January and February increases in the CPI were higher than expected, leading the Fed to defer its proposed interest rate cuts to the second half of 2024.1 Still, investors were mostly pleased by corporate earnings growth, except for three of the so-called “Magnificent Seven” stocks. Apple, Alphabet and Tesla’s stock prices suffered due to disappointing earnings, sales and revenue, or weak forward guidance. Although the stock market had a strong start in 2024, the stock market retreated in April. As consumer spending and a strong labor market were driving economic activity, inflation and interest rate concerns persisted and investors feared another delay in expected rate cuts by the Fed, or worse, rate hikes.
Despite continued higher rates and increased market volatility, US stocks for the
fiscal year had strong positive returns of 22.66%, as measured by the S&P 500 Index.4
During the fiscal year, our management discipline remained unchanged, however the style-specific benchmark was changed from the Dow Jones U.S. Select Dividend Index to the Russell 1000 Value Index as the previous index was no longer well-aligned to the Fund’s sector exposures. The Fund continued to prioritize current income and long-term growth of capital by investing in above-market-yielding stocks that we believe may help investors earn income, preserve assets and build capital. We believe that dividend-paying stocks may provide a conservative foundation for investors’ portfolios and we seek to enhance the value of dividend investing by identifying above-market-yielding stocks with consistent and defensible dividends.
Within the Russell 1000 Value Index, the financials, industrials, and information technology sectors were the best-performing sectors during the fiscal year, while health care and utilities were the worst. The Fund under- performed the Russell 1000 Value Index during the fiscal year, driven primarily by stock selection in the energy, industrials, consumer discretionary and communication services sectors. A slight overweight in the health care sector and an underweight in the financials sector were also headwinds. The portfolio’s cash position also detracted given market strength during the fiscal year.
Alternatively, stock selection in the information technology sector was the leading contributor to relative results compared to the Russell 1000 Value Index and was driven by strong performance in semiconductors and semiconductor equipment as well as software and services. A relative underweight to the real estate sector was also a tailwind to fiscal year-end results.
The Fund’s sector exposure compared to the Russell 1000 Value Index was generally balanced during the fiscal year. The largest overweights were in consumer staples and health care sectors. The largest underweights were in financials and industrials sectors.
The top contributors on an absolute basis included JPMorgan Chase, Parker-Hannifin, and Hartford Financial Services.
Shares of JPMorgan Chase benefited from investor enthusiasm for the acquisition of First Republic Bank (not a fund holding). Strong fundamental results that exceeded analyst expectations later in 2023 also drove the share price higher along with general financial sector strength.
Parker-Hannifin reported strong fundamental results reflecting strength across every segment, especially in aerospace with 25% after market growth. The management team has executed at a high level to improve the quality of the business through divestitures and mergers and acquisitions. Margins continued to improve and the acquisition of Meggitt
| | |
| 2 | | Invesco Dividend Income Fund |
gave them a sizable footprint into aerospace at an opportune time.
Financial services company, Hartford, benefited from strong fundamental results during the fiscal year reflecting strong earnings and revenue growth driven by solid premiums collected in the property and casualty and group benefits space and growing AUM in its fund business.
The largest absolute detractors from performance were RTX Corporation, ExxonMobil, and Nestle.
RTX Corporation, formerly Raytheon, experienced issues with its Pratt & Whitney Geared Turbofan jet engines that resulted in a huge recall. Since RTX agreed to compensate airlines for engine repairs and down time due to the grounding of more than 600 Airbus jets for inspections over the next several years, the news created significant headwinds for the stock price. We exited our position in the stock during the fiscal year to avoid further headwinds.
ExxonMobil shares lagged as crude oil and natural gas prices weakened during part of the fiscal year. We exited our position in the stock to take advantage of better opportunities.
Shares of food and beverage manufacturer Nestle experienced headwinds after the company reported that sales growth is expected to moderate as higher prices force customers to reduce spending. Concerns that growing use of GLP-1’s for weight loss would be an overhang on the snack and beverage company’s fundamentals also created weakness during the fiscal year. Given Nestle’s sales are primarily derived from coffee, pet food, and nutritional health products, we viewed the GLP-1 concerns as transitory. We took advantage of this short-term price weakness and added to the Fund’s position during the fiscal year.
Though the market is at a crossroads as investors try to determine when the Fed will begin to reduce interest rates, the driving principles of our investment process remain rooted in a total return approach that seeks to deliver appreciation, income, and preservation over a full market cycle. No matter the backdrop, we focus on companies generating attractive free cash flow and we analyze their drivers and ability to support future dividend growth, as well as their balance sheet strength and flexibility. We continue to emphasize the growth and sustainability of a company’s dividend as we believe companies with these characteristics have historically outperformed over a full market cycle. We believe investors may place greater focus on dividend paying stocks in 2024. Historically, dividends have accounted for a larger part of total return than they have in the last decade due to outsized price gains.5 If we enter a period of more normal returns, we believe dividends should make up a much larger portion of total return.
It has been our privilege to manage Invesco Dividend Income Fund, and we thank you for your investment.
| 1 | Source: US Federal Reserve |
| 2 | Source: US Bureau of Labor Statistics |
| 4 | Source: Morningstar Direct |
| 5 | Source: Ned Davis Research |
Portfolio manager(s):
Caroline Le Feuvre
Craig Leopold
Chris McMeans
Peter Santoro - Lead
The views and opinions expressed in management’s discussion of Fund performance are those of Invesco Advisers, Inc. and its affiliates. These views and opinions are subject to change at any time based on factors such as market and economic conditions. These views and opinions may not be relied upon as investment advice or recommendations, or as an offer for a particular security. The information is not a complete analysis of every aspect of any market, country, industry, security or the Fund. Statements of fact are from sources considered reliable, but Invesco Advisers, Inc. makes no representation or warranty as to their completeness or accuracy. Although historical performance is no guarantee of future results, these insights may help you understand our investment management philosophy.
See important Fund and, if applicable, index disclosures later in this report.
| | |
| 3 | | Invesco Dividend Income Fund |
Your Fund’s Long-Term Performance
Results of a $10,000 Investment – Oldest Share Class(es)
Fund and index data from 4/30/14
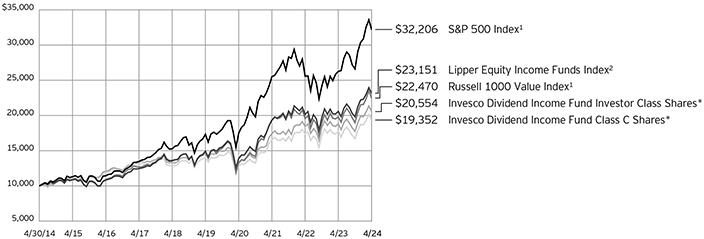
| 1 | Source: RIMES Technologies Corp. |
| *It | is Invesco’s policy to chart the Fund’s oldest share class(es). Because Investor Class shares do not have a sales charge, we also show the oldest share class with a sales charge, Class C shares. |
| | | | |
Past performance cannot guarantee future results. The data shown in the chart include reinvested distributions, applicable sales charges and Fund expenses including management | | fees. Index results include reinvested dividends, but they do not reflect sales charges. Performance of the peer group, if applicable, reflects fund expenses and management fees; | | performance of a market index does not. Performance shown in the chart does not reflect deduction of taxes a shareholder would pay on Fund distributions or sale of Fund shares. |
| | |
| 4 | | Invesco Dividend Income Fund |
| | | | |
Average Annual Total Returns | |
As of 4/30/24, including maximum applicable sales charges | |
| |
Class A Shares | | | | |
Inception (3/28/02) | | | 7.83 | % |
10 Years | | | 6.86 | |
5 Years | | | 5.90 | |
1 Year | | | 3.18 | |
| |
Class C Shares | | | | |
Inception (2/14/00) | | | 4.71 | % |
10 Years | | | 6.82 | |
5 Years | | | 6.30 | |
1 Year | | | 7.39 | |
| |
Class R Shares | | | | |
10 Years | | | 7.20 | % |
5 Years | | | 6.84 | |
1 Year | | | 8.92 | |
| |
Class Y Shares | | | | |
Inception (10/3/08) | | | 8.75 | % |
10 Years | | | 7.74 | |
5 Years | | | 7.37 | |
1 Year | | | 9.51 | |
| |
Investor Class Shares | | | | |
Inception (6/2/86) | | | 8.29 | % |
10 Years | | | 7.47 | |
5 Years | | | 7.11 | |
1 Year | | | 9.24 | |
| |
Class R5 Shares | | | | |
Inception (10/25/05) | | | 8.17 | % |
10 Years | | | 7.78 | |
5 Years | | | 7.41 | |
1 Year | | | 9.49 | |
| |
Class R6 Shares | | | | |
Inception (9/24/12) | | | 9.06 | % |
10 Years | | | 7.87 | |
5 Years | | | 7.49 | |
1 Year | | | 9.60 | |
Class R shares incepted on April 17, 2020. Performance shown prior to that date is that of Investor Class shares restated to reflect the higher 12b-1 fees applicable to Class R shares.
The performance data quoted represent past performance and cannot guarantee future results; current performance may be lower or higher. Please visit invesco.com/ performance for the most recent month-end performance. Performance figures reflect reinvested distributions, changes in net asset value and the effect of the maximum sales charge unless otherwise stated. Performance figures do not reflect deduction of taxes a shareholder would pay on Fund distributions or sale of Fund shares. Investment return and principal value will fluctuate so that you may have a gain or loss when you sell shares.
Class A share performance reflects the maximum 5.50% sales charge, and Class C share performance reflects the applicable contingent deferred sales charge (CDSC) for the period involved. The CDSC on Class C shares is 1% for the first year after purchase. Class R, Class Y, Investor Class,
Class R5 and Class R6 shares do not have a front-end sales charge or a CDSC; therefore, performance is at net asset value.
The performance of the Fund’s share classes will differ primarily due to different sales charge structures and class expenses.
Fund performance reflects any applicable fee waivers and/or expense reimbursements. Had the adviser not waived fees and/or reimbursed expenses currently or in the past, returns would have been lower. See current prospectus for more information.
| | |
| 5 | | Invesco Dividend Income Fund |
Supplemental Information
Invesco Dividend Income Fund’s investment objective is current income and long-term growth of capital.
| ∎ | Unless otherwise stated, information presented in this report is as of April 30, 2024, and is based on total net assets. |
| ∎ | Unless otherwise noted, all data is provided by Invesco. |
| ∎ | To access your Fund’s reports/prospectus, visit invesco.com/fundreports. |
About indexes used in this report
| ∎ | The S&P 500® Index is an unmanaged index considered representative of the US stock market. |
| ∎ | The Russell 1000® Value Index is an unmanaged index considered representative of large-cap value stocks. The Russell 1000 Value Index is a trademark/service mark of the Frank Russell Co. Russell® is a trademark of the Frank Russell Co. |
| ∎ | The Lipper Equity Income Funds Index is an unmanaged index considered representative of equity income funds tracked by Lipper. |
| ∎ | The Fund is not managed to track the performance of any particular index, including the index(es) described here, and consequently, the performance of the Fund may deviate significantly from the performance of the index(es). |
| ∎ | A direct investment cannot be made in an index. Unless otherwise indicated, index results include reinvested dividends, and they do not reflect sales charges. Performance of the peer group, if applicable, reflects fund expenses; performance of a market index does not. |
Liquidity Risk Management Program
| | In compliance with Rule 22e-4 under the Investment Company Act of 1940, as amended (the “Liquidity Rule”), the Fund has adopted and implemented a liquidity risk management program in accordance with the Liquidity Rule (the “Program”). The Program is reasonably designed to assess and manage the Fund’s liquidity risk, which is the risk that the Fund could not meet redemption requests without significant dilution of remaining investors’ interests in the Fund. The Board of Trustees of the Fund (the “Board”) has appointed Invesco Advisers, Inc. (“Invesco”), the Fund’s investment adviser, as the Program’s administrator, and Invesco has delegated oversight of the Program to the Liquidity Risk Management Committee (the “Committee”), which is composed of senior representatives from relevant business groups at Invesco. |
As required by the Liquidity Rule, the Program includes policies and procedures providing for an assessment, no less frequently
than annually, of the Fund’s liquidity risk that takes into account, as relevant to the Fund’s liquidity risk: (1) the Fund’s investment strategy and liquidity of portfolio investments during both normal and reasonably foreseeable stressed conditions; (2) short-term and long-term cash flow projections for the Fund during both normal and reasonably foreseeable stressed conditions; and (3) the Fund’s holdings of cash and cash equivalents and any borrowing arrangements. The Liquidity Rule also requires the classification of the Fund’s investments into categories that reflect the assessment of their relative liquidity under current market conditions. The Fund classifies its investments into one of four categories defined in the Liquidity Rule: “Highly Liquid,” “Moderately Liquid,” “Less Liquid,” and “Illiquid.” Funds that are not invested primarily in “Highly Liquid Investments” that are assets (cash or investments that are reasonably expected to be convertible into cash within three business days without significantly changing the market value of the investment) are required to establish a “Highly Liquid Investment Minimum” (“HLIM”), which is the minimum percentage of net assets that must be invested in Highly Liquid Investments. Funds with HLIMs have procedures for addressing HLIM shortfalls, including reporting to the Board and the SEC (on a non-public basis) as required by the Program and the Liquidity Rule. In addition, the Fund may not acquire an investment if, immediately after the acquisition, over 15% of the Fund’s net assets would consist of “Illiquid Investments” that are assets (an investment that cannot reasonably be expected to be sold or disposed of in current market conditions in seven calendar days or less without the sale or disposition significantly changing the market value of the investment). The Liquidity Rule and the Program also require reporting to the Board and the SEC (on a non-public basis) if a Fund’s holdings of Illiquid Investments exceed 15% of the Fund’s assets.
At a meeting held on March 25-27, 2024, the Committee presented a report to the Board that addressed the operation of the Program and assessed the Program’s adequacy and effectiveness of implementation
| | (the “Report”). The Report covered the period from January 1, 2023 through December 31, 2023 (the “Program Reporting Period”). The Report discussed notable events affecting liquidity over the Program Reporting Period, including the impact of the end of an aggressive rate hike cycle, signs that inflation was abating and market liquidity was reverting to normal, and the overall market. The Report noted that there were no material changes to the Program during the Program Reporting Period. |
| | The Report stated, in relevant part, that during the Program Reporting Period: |
| ∎ | The Program, as adopted and implemented, remained reasonably designed to assess and manage the Fund’s liquidity risk and was operated effectively to achieve that goal; |
| ∎ | The Fund’s investment strategy remained appropriate for an open-end fund; |
| ∎ | The Fund was able to meet requests for redemption without significant dilution of remaining investors’ interests in the Fund; |
| ∎ | The Fund did not breach the 15% limit on Illiquid Investments; and |
| ∎ | The Fund primarily held Highly Liquid Investments and therefore has not adopted an HLIM. |
|
|
This report must be accompanied or preceded by a currently effective Fund prospectus, which contains more complete information, including sales charges and expenses. Investors should read it carefully before investing. |
|
| NOT FDIC INSURED | MAY LOSE VALUE | NO BANK GUARANTEE |
| | |
| 6 | | Invesco Dividend Income Fund |
Fund Information
Portfolio Composition
| | | | | |
| By sector | | % of total net assets |
| |
Financials | | | | 18.94 | % |
| |
Health Care | | | | 15.03 | |
| |
Consumer Staples | | | | 12.48 | |
| |
Industrials | | | | 11.86 | |
| |
Information Technology | | | | 9.62 | |
| |
Energy | | | | 7.38 | |
| |
Consumer Discretionary | | | | 5.52 | |
| |
Utilities | | | | 5.10 | |
| |
Materials | | | | 3.93 | |
| |
Communication Services | | | | 3.43 | |
| |
Real Estate | | | | 3.19 | |
| |
Money Market Funds Plus Other Assets Less Liabilities | | | | 3.52 | |
Top 10 Equity Holdings*
| | | | | | | |
| | | | | % of total net assets |
| | |
| 1. | | Merck & Co., Inc. | | | | 3.52 | % |
| | |
| 2. | | JPMorgan Chase & Co. | | | | 3.33 | |
| | |
| 3. | | Chevron Corp. | | | | 3.07 | |
| | |
| 4. | | Walmart, Inc. | | | | 2.80 | |
| | |
| 5. | | Philip Morris International, Inc. | | | | 2.52 | |
| | |
| 6. | | Morgan Stanley | | | | 2.45 | |
| | |
| 7. | | Johnson & Johnson | | | | 2.43 | |
| | |
| 8. | | McDonald’s Corp. | | | | 2.30 | |
| | |
| 9. | | Becton, Dickinson and Co. | | | | 2.24 | |
| | |
| 10. | | American International Group, Inc. | | | | 2.22 | |
The Fund’s holdings are subject to change, and there is no assurance that the Fund will continue to hold any particular security.
| * | Excluding money market fund holdings, if any. |
| Data | presented here are as of April 30, 2024. |
| | |
| 7 | | Invesco Dividend Income Fund |
Schedule of Investments(a)
April 30, 2024
| | | | | | | | |
| | | Shares | | | Value | |
|
| |
Common Stocks & Other Equity Interests–96.48% | |
Aerospace & Defense–1.33% | |
Northrop Grumman Corp. | | | 98,239 | | | $ | 47,648,862 | |
|
| |
|
Air Freight & Logistics–1.40% | |
United Parcel Service, Inc., Class B | | | 341,881 | | | | 50,420,610 | |
|
| |
|
Asset Management & Custody Banks–1.11% | |
BlackRock, Inc. | | | 52,643 | | | | 39,726,514 | |
|
| |
|
Building Products–1.61% | |
Fortune Brands Innovations, Inc. | | | 225,793 | | | | 16,505,468 | |
|
| |
Johnson Controls International PLC | | | 637,076 | | | | 41,454,536 | |
|
| |
| | | | | | | 57,960,004 | |
|
| |
|
Construction Machinery & Heavy Transportation Equipment– 0.84% | |
Caterpillar, Inc. | | | 89,872 | | | | 30,068,475 | |
|
| |
|
Construction Materials–1.10% | |
CRH PLC | | | 511,555 | | | | 39,604,588 | |
|
| |
|
Consumer Staples Merchandise Retail–2.80% | |
Walmart, Inc. | | | 1,696,855 | | | | 100,708,344 | |
|
| |
|
Distributors–0.49% | |
LKQ Corp. | | | 411,962 | | | | 17,767,921 | |
|
| |
|
Diversified Banks–6.37% | |
Fifth Third Bancorp | | | 1,149,067 | | | | 41,894,983 | |
|
| |
JPMorgan Chase & Co. | | | 623,229 | | | | 119,497,928 | |
|
| |
PNC Financial Services Group, Inc. (The) | | | 439,784 | | | | 67,401,296 | |
|
| |
| | | | | | | 228,794,207 | |
|
| |
|
Electric Utilities–2.03% | |
Entergy Corp. | | | 335,914 | | | | 35,831,947 | |
|
| |
PPL Corp. | | | 1,350,692 | | | | 37,090,002 | |
|
| |
| | | | | | | 72,921,949 | |
|
| |
|
Electrical Components & Equipment–2.36% | |
ABB Ltd. (Switzerland) | | | 831,962 | | | | 40,423,733 | |
|
| |
Emerson Electric Co. | | | 413,137 | | | | 44,527,906 | |
|
| |
| | | | | | | 84,951,639 | |
|
| |
|
Electronic Manufacturing Services–0.95% | |
TE Connectivity Ltd. | | | 242,367 | | | | 34,290,083 | |
|
| |
|
Financial Exchanges & Data–0.94% | |
CME Group, Inc., Class A | | | 161,892 | | | | 33,939,039 | |
|
| |
|
Food Distributors–1.15% | |
Sysco Corp. | | | 556,512 | | | | 41,359,972 | |
|
| |
|
Health Care Equipment–4.71% | |
Becton, Dickinson and Co. | | | 342,477 | | | | 80,345,104 | |
|
| |
Medtronic PLC | | | 538,861 | | | | 43,238,206 | |
|
| |
Zimmer Biomet Holdings, Inc. | | | 381,131 | | | | 45,842,437 | |
|
| |
| | | | | | | 169,425,747 | |
|
| |
|
Health Care Services–0.99% | |
CVS Health Corp. | | | 525,918 | | | | 35,609,908 | |
|
| |
| | | | | | | | |
| | | Shares | | | Value | |
|
| |
Home Improvement Retail–1.84% | |
Lowe’s Cos., Inc. | | | 290,846 | | | $ | 66,309,980 | |
|
| |
|
Household Products–1.44% | |
Colgate-Palmolive Co. | | | 562,834 | | | | 51,735,701 | |
|
| |
|
Human Resource & Employment Services–0.78% | |
Automatic Data Processing, Inc. | | | 115,980 | | | | 28,054,402 | |
|
| |
|
Industrial Machinery & Supplies & Components–1.80% | |
Parker-Hannifin Corp. | | | 118,870 | | | | 64,773,452 | |
|
| |
|
Industrial REITs–1.52% | |
Prologis, Inc. | | | 536,302 | | | | 54,729,619 | |
|
| |
|
Integrated Oil & Gas–3.07% | |
Chevron Corp.(b) | | | 683,777 | | | | 110,272,717 | |
|
| |
|
Integrated Telecommunication Services–1.62% | |
Deutsche Telekom AG (Germany) | | | 2,539,844 | | | | 58,176,558 | |
|
| |
|
Investment Banking & Brokerage–3.76% | |
Charles Schwab Corp. (The) | | | 639,458 | | | | 47,287,919 | |
|
| |
Morgan Stanley | | | 967,564 | | | | 87,893,514 | |
|
| |
| | | | | | | 135,181,433 | |
|
| |
|
IT Consulting & Other Services–2.20% | |
Accenture PLC, Class A | | | 97,705 | | | | 29,400,411 | |
|
| |
International Business Machines Corp. | | | 297,984 | | | | 49,524,941 | |
|
| |
| | | | | | | 78,925,352 | |
|
| |
|
Managed Health Care–1.71% | |
UnitedHealth Group, Inc. | | | 127,018 | | | | 61,438,607 | |
|
| |
|
Movies & Entertainment–1.81% | |
Walt Disney Co. (The) | | | 585,810 | | | | 65,083,491 | |
|
| |
|
Multi-Family Residential REITs–0.63% | |
Mid-America Apartment Communities, Inc. | | | 173,002 | | | | 22,490,260 | |
|
| |
|
Multi-line Insurance–2.22% | |
American International Group, Inc. | | | 1,061,204 | | | | 79,919,273 | |
|
| |
|
Multi-Utilities–3.07% | |
Ameren Corp. | | | 449,020 | | | | 33,169,107 | |
|
| |
Public Service Enterprise Group, Inc. | | | 1,115,924 | | | | 77,088,030 | |
|
| |
| | | | | | | 110,257,137 | |
|
| |
|
Oil & Gas Exploration & Production–3.68% | |
ConocoPhillips | | | 581,594 | | | | 73,059,838 | |
|
| |
Marathon Oil Corp. | | | 2,210,204 | | | | 59,343,978 | |
|
| |
| | | | | | | 132,403,816 | |
|
| |
|
Oil & Gas Storage & Transportation–0.63% | |
Enbridge, Inc. (Canada) | | | 635,355 | | | | 22,591,528 | |
|
| |
|
Packaged Foods & Meats–2.62% | |
Kraft Heinz Co. (The) | | | 933,781 | | | | 36,053,285 | |
|
| |
Nestle S.A. (Switzerland) | | | 577,640 | | | | 57,995,147 | |
|
| |
| | | | | | | 94,048,432 | |
|
| |
|
Paper & Plastic Packaging Products & Materials–0.64% | |
Sonoco Products Co. | | | 410,222 | | | | 22,992,943 | |
|
| |
See accompanying Notes to Financial Statements which are an integral part of the financial statements.
| | |
| 8 | | Invesco Dividend Income Fund |
| | | | | | | | |
| | | Shares | | | Value | |
|
| |
Personal Care Products–0.53% | | | | | | | | |
Estee Lauder Cos., Inc. (The), Class A | | | 128,963 | | | $ | 18,920,162 | |
|
| |
| |
Pharmaceuticals–7.62% | | | | | |
AstraZeneca PLC (United Kingdom) | | | 395,794 | | | | 59,863,393 | |
|
| |
Johnson & Johnson | | | 604,850 | | | | 87,455,262 | |
|
| |
Merck & Co., Inc. | | | 978,300 | | | | 126,415,926 | |
|
| |
| | | | | | | 273,734,581 | |
|
| |
|
Property & Casualty Insurance–3.86% | |
Chubb Ltd. | | | 305,240 | | | | 75,894,874 | |
|
| |
Hartford Financial Services Group, Inc. (The) | | | 649,735 | | | | 62,952,824 | |
|
| |
| | | | | | | 138,847,698 | |
|
| |
|
Rail Transportation–1.74% | |
Union Pacific Corp. | | | 263,614 | | | | 62,518,696 | |
|
| |
|
Regional Banks–0.68% | |
M&T Bank Corp. | | | 169,410 | | | | 24,461,110 | |
|
| |
| |
Restaurants–3.19% | | | | | |
McDonald’s Corp. | | | 302,947 | | | | 82,716,649 | |
|
| |
Starbucks Corp. | | | 362,015 | | | | 32,034,707 | |
|
| |
| | | | | | | 114,751,356 | |
|
| |
|
Semiconductor Materials & Equipment–1.22% | |
Lam Research Corp. | | | 49,095 | | | | 43,911,059 | |
|
| |
| |
Semiconductors–2.40% | | | | | |
Analog Devices, Inc. | | | 297,218 | | | | 59,624,903 | |
|
| |
Broadcom, Inc. | | | 20,372 | | | | 26,489,100 | |
|
| |
| | | | | | | 86,114,003 | |
|
| |
|
Soft Drinks & Non-alcoholic Beverages–1.42% | |
PepsiCo, Inc. | | | 289,499 | | | | 50,925,769 | |
|
| |
| |
Specialty Chemicals–2.19% | | | | | |
DuPont de Nemours, Inc. | | | 544,859 | | | | 39,502,277 | |
|
| |
PPG Industries, Inc. | | | 304,791 | | | | 39,318,039 | |
|
| |
| | | | | | | 78,820,316 | |
|
| |
| | | | | | | | |
| | | Shares | | | Value | |
|
| |
Systems Software–1.78% | | | | | | | | |
Microsoft Corp. | | | 164,586 | | | $ | 64,078,267 | |
|
| |
| |
Technology Hardware, Storage & Peripherals–1.07% | | | | | |
Dell Technologies, Inc., Class C | | | 307,418 | | | | 38,316,580 | |
|
| |
| |
Timber REITs–1.04% | | | | | |
Weyerhaeuser Co. | | | 1,233,317 | | | | 37,209,174 | |
|
| |
| |
Tobacco–2.52% | | | | | |
Philip Morris International, Inc. | | | 953,935 | | | | 90,566,589 | |
|
| |
Total Common Stocks & Other Equity Interests (Cost $2,684,738,708) | | | | 3,467,757,923 | |
|
| |
| |
Money Market Funds–3.44% | | | | | |
Invesco Government & Agency Portfolio, Institutional Class, 5.23%(c)(d) | | | 43,232,681 | | | | 43,232,681 | |
|
| |
Invesco Liquid Assets Portfolio, Institutional Class, 5.34%(c)(d) | | | 30,862,300 | | | | 30,871,559 | |
|
| |
Invesco Treasury Portfolio, Institutional Class, 5.22%(c)(d) | | | 49,408,779 | | | | 49,408,779 | |
|
| |
Total Money Market Funds (Cost $123,514,847) | | | | 123,513,019 | |
|
| |
TOTAL INVESTMENTS IN SECURITIES (excluding investments purchased with cash collateral from securities on loan)-99.92% (Cost $2,808,253,555) | | | | 3,591,270,942 | |
|
| |
|
Investments Purchased with Cash Collateral from Securities on Loan | |
Money Market Funds–0.57% | | | | | | | | |
Invesco Private Government Fund, 5.29%(c)(d)(e) | | | 5,773,791 | | | | 5,773,791 | |
|
| |
Invesco Private Prime Fund, 5.46%(c)(d)(e) | | | 14,842,437 | | | | 14,846,890 | |
|
| |
Total Investments Purchased with Cash Collateral from Securities on Loan
(Cost $20,620,681) | | | | 20,620,681 | |
|
| |
TOTAL INVESTMENTS IN SECURITIES–100.49%
(Cost $2,828,874,236) | | | | 3,611,891,623 | |
|
| |
OTHER ASSETS LESS LIABILITIES–(0.49)% | | | | (17,558,678 | ) |
|
| |
NET ASSETS–100.00% | | | $ | 3,594,332,945 | |
|
| |
Investment Abbreviations:
REIT – Real Estate Investment Trust
Notes to Schedule of Investments:
| (a) | Industry and/or sector classifications used in this report are generally according to the Global Industry Classification Standard, which was developed by and is the exclusive property and a service mark of MSCI Inc. and Standard & Poor’s. |
| (b) | All or a portion of this security was out on loan at April 30, 2024. |
| (c) | Affiliated holding. Affiliated holdings are investments in entities which are under common ownership or control of Invesco Ltd. or are investments in entities in which the Fund owns 5% or more of the outstanding voting securities. The table below shows the Fund’s transactions in, and earnings from, its investments in affiliates for the fiscal year ended April 30, 2024. |
| | | | | | | | | | | | | | | | | | | | | | | | | | | | |
| | | Value April 30, 2023 | | | Purchases at Cost | | | Proceeds from Sales | | | Change in
Unrealized
Appreciation
(Depreciation) | | | Realized
Gain
(Loss) | | | Value
April 30, 2024 | | | Dividend Income | |
| Investments in Affiliated Money Market Funds: | | | | | | | | | | | | | | | | | | | | | | | | | | | | |
Invesco Government & Agency Portfolio, Institutional Class | | $ | 39,324,600 | | | $ | 291,890,128 | | | $ | (287,982,047) | | | | $ - | | | $ | - | | | $ | 43,232,681 | | | | $1,557,223 | |
Invesco Liquid Assets Portfolio, Institutional Class | | | 28,085,718 | | | | 208,492,949 | | | | (205,701,462 | ) | | | (2,189) | | | | (3,457) | | | | 30,871,559 | | | | 1,135,318 | |
Invesco Treasury Portfolio, Institutional Class | | | 44,942,400 | | | | 333,588,717 | | | | (329,122,338 | ) | | | - | | | | - | | | | 49,408,779 | | | | 1,769,702 | |
See accompanying Notes to Financial Statements which are an integral part of the financial statements.
| | |
| 9 | | Invesco Dividend Income Fund |
| | | | | | | | | | | | | | | | | | | | | | | | | | | | |
| | | Value
April 30, 2023 | | | Purchases at Cost | | | Proceeds from Sales | | | Change in
Unrealized
Appreciation
(Depreciation) | | | Realized
Gain
(Loss) | | | Value
April 30, 2024 | | | Dividend Income | |
| Investments Purchased with Cash Collateral from Securities on Loan: | | | | | | | | | | | | | | | | | | | | | | | | | | | | |
Invesco Private Government Fund | | $ | 26,609,123 | | | $ | 248,972,224 | | | $ | (269,807,556 | ) | | | $ - | | | $ | - | | | $ | 5,773,791 | | | | $ 341,682* | |
Invesco Private Prime Fund | | | 68,423,459 | | | | 594,559,710 | | | | (648,141,920 | ) | | | - | | | | 5,641 | | | | 14,846,890 | | | | 918,689* | |
Total | | $ | 207,385,300 | | | $ | 1,677,503,728 | | | $ | (1,740,755,323 | ) | | | $(2,189) | | | $ | 2,184 | | | $ | 144,133,700 | | | | $5,722,614 | |
| | * | Represents the income earned on the investment of cash collateral, which is included in securities lending income on the Statement of Operations. Does not include rebates and fees paid to lending agent or premiums received from borrowers, if any. |
| (d) | The rate shown is the 7-day SEC standardized yield as of April 30, 2024. |
| (e) | The security has been segregated to satisfy the commitment to return the cash collateral received in securities lending transactions upon the borrower’s return of the securities loaned. See Note 1J. |
See accompanying Notes to Financial Statements which are an integral part of the financial statements.
| | |
| 10 | | Invesco Dividend Income Fund |
Statement of Assets and Liabilities
April 30, 2024
| | | | |
Assets: | | | | |
| |
Investments in unaffiliated securities, at value (Cost $2,684,738,708)* | | $ | 3,467,757,923 | |
| |
Investments in affiliated money market funds, at value (Cost $144,135,528) | | | 144,133,700 | |
| |
Foreign currencies, at value (Cost $2,224) | | | 1,703 | |
| |
Receivable for: | | | | |
Fund shares sold | | | 1,164,744 | |
| |
Dividends | | | 6,735,993 | |
| |
Investment for trustee deferred compensation and retirement plans | | | 265,722 | |
| |
Other assets | | | 88,829 | |
| |
Total assets | | | 3,620,148,614 | |
| |
| |
Liabilities: | | | | |
Payable for: | | | | |
Dividends | | | 518 | |
| |
Fund shares reacquired | | | 3,178,893 | |
| |
Collateral upon return of securities loaned | | | 20,620,681 | |
| |
Accrued fees to affiliates | | | 1,535,874 | |
| |
Accrued trustees’ and officers’ fees and benefits | | | 46,212 | |
| |
Accrued other operating expenses | | | 106,850 | |
| |
Trustee deferred compensation and retirement plans | | | 326,641 | |
| |
Total liabilities | | | 25,815,669 | |
| |
Net assets applicable to shares outstanding | | $ | 3,594,332,945 | |
| |
| |
Net assets consist of: | | | | |
Shares of beneficial interest | | $ | 2,654,654,680 | |
| |
Distributable earnings | | | 939,678,265 | |
| |
| | $ | 3,594,332,945 | |
| |
| | | | |
Net Assets: | | | | |
| |
Class A | | $ | 2,750,797,422 | |
| |
Class C | | $ | 142,969,288 | |
| |
Class R | | $ | 102,155,415 | |
| |
Class Y | | $ | 330,813,269 | |
| |
Investor Class | | $ | 68,712,365 | |
| |
Class R5 | | $ | 1,758,230 | |
| |
Class R6 | | $ | 197,126,956 | |
|
Shares outstanding, no par value, with an unlimited number of shares authorized: | |
Class A | | | 108,798,391 | |
Class C | | | 5,569,117 | |
Class R | | | 4,040,691 | |
Class Y | | | 12,927,787 | |
Investor Class | | | 2,684,436 | |
Class R5 | | | 69,509 | |
Class R6 | | | 7,786,049 | |
Class A: | | | | |
Net asset value per share | | $ | 25.28 | |
Maximum offering price per share
(Net asset value of $25.28 ÷ 94.50%) | | $ | 26.75 | |
Class C: | | | | |
Net asset value and offering price per share | | $ | 25.67 | |
Class R: | | | | |
Net asset value and offering price per share | | $ | 25.28 | |
Class Y: | | | | |
Net asset value and offering price per share | | $ | 25.59 | |
Investor Class: | | | | |
Net asset value and offering price per share | | $ | 25.60 | |
Class R5: | | | | |
Net asset value and offering price per share | | $ | 25.29 | |
Class R6: | | | | |
Net asset value and offering price per share | | $ | 25.32 | |
| * | At April 30, 2024, security with a value of $19,595,434 was on loan to brokers. |
See accompanying Notes to Financial Statements which are an integral part of the financial statements.
| | |
| 11 | | Invesco Dividend Income Fund |
Statement of Operations
For the year ended April 30, 2024
| | | | |
Investment income: | | | | |
| |
Interest | | $ | 138,149 | |
|
| |
Dividends (net of foreign withholding taxes of $1,105,122) | | | 95,969,669 | |
|
| |
Dividends from affiliated money market funds (includes net securities lending income of $245,350) | | | 4,707,593 | |
|
| |
Foreign withholding tax claims | | | 1,001,150 | |
|
| |
Total investment income | | | 101,816,561 | |
|
| |
| |
Expenses: | | | | |
| |
Advisory fees | | | 19,064,386 | |
|
| |
Administrative services fees | | | 508,420 | |
|
| |
Custodian fees | | | 36,391 | |
|
| |
Distribution fees: | | | | |
Class A | | | 6,517,761 | |
|
| |
Class C | | | 1,619,927 | |
|
| |
Class R | | | 515,344 | |
|
| |
Investor Class | | | 167,769 | |
|
| |
Transfer agent fees – A, C, R, Y and Investor Class | | | 4,180,563 | |
|
| |
Transfer agent fees – R5 | | | 1,762 | |
|
| |
Transfer agent fees – R6 | | | 60,091 | |
|
| |
Trustees’ and officers’ fees and benefits | | | 73,304 | |
|
| |
Registration and filing fees | | | 165,610 | |
|
| |
Reports to shareholders | | | 428,316 | |
|
| |
Professional services fees | | | 104,274 | |
|
| |
Other | | | 80,839 | |
|
| |
Total expenses | | | 33,524,757 | |
|
| |
Less: Fees waived and/or expense offset arrangement(s) | | | (235,058 | ) |
|
| |
Net expenses | | | 33,289,699 | |
|
| |
Net investment income | | | 68,526,862 | |
|
| |
| |
Realized and unrealized gain (loss) from: | | | | |
| |
Net realized gain from: | | | | |
Unaffiliated investment securities | | | 225,430,767 | |
|
| |
Affiliated investment securities | | | 2,184 | |
|
| |
Foreign currencies | | | 53,508 | |
|
| |
| | | 225,486,459 | |
|
| |
Change in net unrealized appreciation (depreciation) of: | | | | |
Unaffiliated investment securities | | | 18,473,100 | |
|
| |
Affiliated investment securities | | | (2,189 | ) |
|
| |
Foreign currencies | | | (93,650 | ) |
|
| |
| | | 18,377,261 | |
|
| |
Net realized and unrealized gain | | | 243,863,720 | |
|
| |
Net increase in net assets resulting from operations | | $ | 312,390,582 | |
|
| |
See accompanying Notes to Financial Statements which are an integral part of the financial statements.
| | |
| 12 | | Invesco Dividend Income Fund |
Statement of Changes in Net Assets
For the years ended April 30, 2024 and 2023
| | | | | | | | |
| | | 2024 | | | 2023 | |
|
| |
Operations: | | | | | | | | |
Net investment income | | $ | 68,526,862 | | | $ | 68,728,985 | |
|
| |
Net realized gain | | | 225,486,459 | | | | 120,710,304 | |
|
| |
Change in net unrealized appreciation (depreciation) | | | 18,377,261 | | | | (119,631,776 | ) |
|
| |
Net increase in net assets resulting from operations | | | 312,390,582 | | | | 69,807,513 | |
|
| |
| | |
Distributions to shareholders from distributable earnings: | | | | | | | | |
Class A | | | (152,180,406 | ) | | | (158,822,155 | ) |
|
| |
Class C | | | (7,630,774 | ) | | | (9,749,575 | ) |
|
| |
Class R | | | (5,503,919 | ) | | | (5,849,789 | ) |
|
| |
Class Y | | | (18,751,787 | ) | | | (19,369,867 | ) |
|
| |
Investor Class | | | (3,746,695 | ) | | | (3,888,879 | ) |
|
| |
Class R5 | | | (105,465 | ) | | | (92,826 | ) |
|
| |
Class R6 | | | (11,788,412 | ) | | | (13,170,241 | ) |
|
| |
Total distributions from distributable earnings | | | (199,707,458 | ) | | | (210,943,332 | ) |
|
| |
| | |
Share transactions–net: | | | | | | | | |
Class A | | | (141,600,485 | ) | | | 23,874,589 | |
|
| |
Class C | | | (45,718,784 | ) | | | (36,937,633 | ) |
|
| |
Class R | | | (9,188,379 | ) | | | 393,670 | |
|
| |
Class Y | | | (11,603,158 | ) | | | 8,563,525 | |
|
| |
Investor Class | | | (1,965,307 | ) | | | (1,130,168 | ) |
|
| |
Class R5 | | | (6,163 | ) | | | 334,978 | |
|
| |
Class R6 | | | (21,784,687 | ) | | | (1,503,594 | ) |
|
| |
Net increase (decrease) in net assets resulting from share transactions | | | (231,866,963 | ) | | | (6,404,633 | ) |
|
| |
Net increase (decrease) in net assets | | | (119,183,839 | ) | | | (147,540,452 | ) |
|
| |
| | |
Net assets: | | | | | | | | |
Beginning of year | | | 3,713,516,784 | | | | 3,861,057,236 | |
|
| |
End of year | | $ | 3,594,332,945 | | | $ | 3,713,516,784 | |
|
| |
See accompanying Notes to Financial Statements which are an integral part of the financial statements.
| | |
| 13 | | Invesco Dividend Income Fund |
Financial Highlights
The following schedule presents financial highlights for a share of the Fund outstanding throughout the periods indicated.
| | | | | | | | | | | | | | | | | | | | | | | | | | | | | | | | | | | | | | | | | | | | | | | | | | | | | | | | |
| | | Net asset value, beginning of period | | Net investment income(a) | | Net gains (losses) on securities (both realized and unrealized) | | Total from investment operations | | Dividends from net investment income | | Distributions from net realized gains | | Total distributions | | Net asset value, end of period | | Total return (b) | | Net assets, end of period (000’s omitted) | | Ratio of expenses to average net assets with fee waivers and/or expenses absorbed | | Ratio of expenses to average net assets without fee waivers and/or expenses absorbed | | Ratio of net investment income to average net assets | | Portfolio turnover (c) |
Class A | | | | | | | | | | | | | | | | | | | | | | | | | | | | | | | | | | | | | | | | | | | | | | | | | | | | | | | | |
Year ended 04/30/24 | | | $24.50 | | | | $0.47 | | | | $1.70 | | | | $2.17 | | | | $(0.51 | ) | | | $(0.88 | ) | | | $(1.39 | ) | | | $25.28 | | | | 9.21 | %(d) | | | $2,750,797 | | | | 0.93 | %(d) | | | 0.93 | %(d) | | | 1.91 | %(d) | | | 40 | % |
Year ended 04/30/23 | | | 25.42 | | | | 0.46 | | | | 0.03 | | | | 0.49 | | | | (0.44 | ) | | | (0.97 | ) | | | (1.41 | ) | | | 24.50 | | | | 2.01 | (d) | | | 2,806,537 | | | | 0.92 | (d) | | | 0.92 | (d) | | | 1.85 | (d) | | | 17 | |
Year ended 04/30/22 | | | 25.62 | | | | 0.48 | | | | 1.00 | | | | 1.48 | | | | (0.47 | ) | | | (1.21 | ) | | | (1.68 | ) | | | 25.42 | | | | 5.95 | (d) | | | 2,887,737 | | | | 0.93 | (d) | | | 0.93 | (d) | | | 1.84 | (d) | | | 38 | |
Year ended 04/30/21 | | | 20.11 | | | | 0.47 | | | | 5.53 | | | | 6.00 | | | | (0.49 | ) | | | – | | | | (0.49 | ) | | | 25.62 | | | | 30.23 | (d) | | | 2,921,798 | | | | 0.97 | (d) | | | 0.97 | (d) | | | 2.10 | (d) | | | 4 | |
Year ended 04/30/20 | | | 22.70 | | | | 0.51 | | | | (2.33 | ) | | | (1.82 | ) | | | (0.52 | ) | | | (0.25 | ) | | | (0.77 | ) | | | 20.11 | | | | (8.30 | ) | | | 2,506,397 | | | | 1.05 | | | | 1.06 | | | | 2.31 | | | | 47 | |
Class C | | | | | | | | | | | | | | | | | | | | | | | | | | | | | | | | | | | | | | | | | | | | | | | | | | | | | | | | |
Year ended 04/30/24 | | | 24.86 | | | | 0.29 | | | | 1.73 | | | | 2.02 | | | | (0.33 | ) | | | (0.88 | ) | | | (1.21 | ) | | | 25.67 | | | | 8.39 | | | | 142,969 | | | | 1.69 | | | | 1.69 | | | | 1.15 | | | | 40 | |
Year ended 04/30/23 | | | 25.78 | | | | 0.27 | | | | 0.04 | | | | 0.31 | | | | (0.26 | ) | | | (0.97 | ) | | | (1.23 | ) | | | 24.86 | | | | 1.23 | | | | 184,187 | | | | 1.68 | | | | 1.68 | | | | 1.09 | | | | 17 | |
Year ended 04/30/22 | | | 25.97 | | | | 0.29 | | | | 1.01 | | | | 1.30 | | | | (0.28 | ) | | | (1.21 | ) | | | (1.49 | ) | | | 25.78 | | | | 5.13 | | | | 229,596 | | | | 1.69 | | | | 1.69 | | | | 1.08 | | | | 38 | |
Year ended 04/30/21 | | | 20.38 | | | | 0.30 | | | | 5.61 | | | | 5.91 | | | | (0.32 | ) | | | – | | | | (0.32 | ) | | | 25.97 | | | | 29.29 | | | | 285,321 | | | | 1.73 | | | | 1.73 | | | | 1.34 | | | | 4 | |
Year ended 04/30/20 | | | 23.01 | | | | 0.35 | | | | (2.37 | ) | | | (2.02 | ) | | | (0.36 | ) | | | (0.25 | ) | | | (0.61 | ) | | | 20.38 | | | | (9.02 | ) | | | 385,968 | | | | 1.80 | | | | 1.81 | | | | 1.56 | | | | 47 | |
Class R | | | | | | | | | | | | | | | | | | | | | | | | | | | | | | | | | | | | | | | | | | | | | | | | | | | | | | | | |
Year ended 04/30/24 | | | 24.50 | | | | 0.41 | | | | 1.70 | | | | 2.11 | | | | (0.45 | ) | | | (0.88 | ) | | | (1.33 | ) | | | 25.28 | | | | 8.92 | | | | 102,155 | | | | 1.19 | | | | 1.19 | | | | 1.65 | | | | 40 | |
Year ended 04/30/23 | | | 25.42 | | | | 0.39 | | | | 0.04 | | | | 0.43 | | | | (0.38 | ) | | | (0.97 | ) | | | (1.35 | ) | | | 24.50 | | | | 1.74 | | | | 108,030 | | | | 1.18 | | | | 1.18 | | | | 1.59 | | | | 17 | |
Year ended 04/30/22 | | | 25.62 | | | | 0.42 | | | | 1.00 | | | | 1.42 | | | | (0.41 | ) | | | (1.21 | ) | | | (1.62 | ) | | | 25.42 | | | | 5.68 | | | | 111,671 | | | | 1.19 | | | | 1.19 | | | | 1.58 | | | | 38 | |
Year ended 04/30/21 | | | 20.11 | | | | 0.41 | | | | 5.53 | | | | 5.94 | | | | (0.43 | ) | | | – | | | | (0.43 | ) | | | 25.62 | | | | 29.89 | | | | 110,667 | | | | 1.23 | | | | 1.23 | | | | 1.84 | | | | 4 | |
Period ended 04/30/20(e) | | | 20.18 | | | | 0.01 | | | | (0.08 | ) | | | (0.07 | ) | | | – | | | | – | | | | – | | | | 20.11 | | | | (0.35 | ) | | | 97,560 | | | | 1.20 | (f) | | | 1.21 | (f) | | | 2.16 | (f) | | | 47 | |
Class Y | | | | | | | | | | | | | | | | | | | | | | | | | | | | | | | | | | | | | | | | | | | | | | | | | | | | | | | | |
Year ended 04/30/24 | | | 24.78 | | | | 0.53 | | | | 1.73 | | | | 2.26 | | | | (0.57 | ) | | | (0.88 | ) | | | (1.45 | ) | | | 25.59 | | | | 9.51 | | | | 330,813 | | | | 0.69 | | | | 0.69 | | | | 2.15 | | | | 40 | |
Year ended 04/30/23 | | | 25.71 | | | | 0.52 | | | | 0.03 | | | | 0.55 | | | | (0.51 | ) | | | (0.97 | ) | | | (1.48 | ) | | | 24.78 | | | | 2.22 | | | | 331,823 | | | | 0.68 | | | | 0.68 | | | | 2.09 | | | | 17 | |
Year ended 04/30/22 | | | 25.89 | | | | 0.55 | | | | 1.02 | | | | 1.57 | | | | (0.54 | ) | | | (1.21 | ) | | | (1.75 | ) | | | 25.71 | | | | 6.24 | | | | 335,608 | | | | 0.69 | | | | 0.69 | | | | 2.08 | | | | 38 | |
Year ended 04/30/21 | | | 20.32 | | | | 0.52 | | | | 5.59 | | | | 6.11 | | | | (0.54 | ) | | | – | | | | (0.54 | ) | | | 25.89 | | | | 30.55 | | | | 344,755 | | | | 0.73 | | | | 0.73 | | | | 2.34 | | | | 4 | |
Year ended 04/30/20 | | | 22.94 | | | | 0.57 | | | | (2.36 | ) | | | (1.79 | ) | | | (0.58 | ) | | | (0.25 | ) | | | (0.83 | ) | | | 20.32 | | | | (8.09 | ) | | | 330,421 | | | | 0.81 | | | | 0.82 | | | | 2.55 | | | | 47 | |
Investor Class | | | | | | | | | | | | | | | | | | | | | | | | | | | | | | | | | | | | | | | | | | | | | | | | | | | | | | | | |
Year ended 04/30/24 | | | 24.79 | | | | 0.47 | | | | 1.73 | | | | 2.20 | | | | (0.51 | ) | | | (0.88 | ) | | | (1.39 | ) | | | 25.60 | | | | 9.24 | | | | 68,712 | | | | 0.94 | | | | 0.94 | | | | 1.90 | | | | 40 | |
Year ended 04/30/23 | | | 25.71 | | | | 0.46 | | | | 0.03 | | | | 0.49 | | | | (0.44 | ) | | | (0.97 | ) | | | (1.41 | ) | | | 24.79 | | | | 1.99 | | | | 68,495 | | | | 0.93 | | | | 0.93 | | | | 1.84 | | | | 17 | |
Year ended 04/30/22 | | | 25.89 | | | | 0.48 | | | | 1.02 | | | | 1.50 | | | | (0.47 | ) | | | (1.21 | ) | | | (1.68 | ) | | | 25.71 | | | | 5.96 | | | | 72,230 | | | | 0.94 | | | | 0.94 | | | | 1.83 | | | | 38 | |
Year ended 04/30/21 | | | 20.31 | | | | 0.47 | | | | 5.59 | | | | 6.06 | | | | (0.48 | ) | | | – | | | | (0.48 | ) | | | 25.89 | | | | 30.25 | | | | 73,628 | | | | 0.98 | | | | 0.98 | | | | 2.09 | | | | 4 | |
Year ended 04/30/20 | | | 22.93 | | | | 0.52 | | | | (2.37 | ) | | | (1.85 | ) | | | (0.52 | ) | | | (0.25 | ) | | | (0.77 | ) | | | 20.31 | | | | (8.32 | ) | | | 62,298 | | | | 1.06 | | | | 1.07 | | | | 2.30 | | | | 47 | |
Class R5 | | | | | | | | | | | | | | | | | | | | | | | | | | | | | | | | | | | | | | | | | | | | | | | | | | | | | | | | |
Year ended 04/30/24 | | | 24.51 | | | | 0.53 | | | | 1.70 | | | | 2.23 | | | | (0.57 | ) | | | (0.88 | ) | | | (1.45 | ) | | | 25.29 | | | | 9.49 | | | | 1,758 | | | | 0.67 | | | | 0.67 | | | | 2.17 | | | | 40 | |
Year ended 04/30/23 | | | 25.43 | | | | 0.52 | | | | 0.04 | | | | 0.56 | | | | (0.51 | ) | | | (0.97 | ) | | | (1.48 | ) | | | 24.51 | | | | 2.30 | | | | 1,709 | | | | 0.65 | | | | 0.65 | | | | 2.12 | | | | 17 | |
Year ended 04/30/22 | | | 25.63 | | | | 0.55 | | | | 1.00 | | | | 1.55 | | | | (0.54 | ) | | | (1.21 | ) | | | (1.75 | ) | | | 25.43 | | | | 6.24 | | | | 1,425 | | | | 0.66 | | | | 0.66 | | | | 2.11 | | | | 38 | |
Year ended 04/30/21 | | | 20.11 | | | | 0.53 | | | | 5.54 | | | | 6.07 | | | | (0.55 | ) | | | – | | | | (0.55 | ) | | | 25.63 | | | | 30.66 | | | | 2,337 | | | | 0.66 | | | | 0.66 | | | | 2.41 | | | | 4 | |
Year ended 04/30/20 | | | 22.71 | | | | 0.58 | | | | (2.34 | ) | | | (1.76 | ) | | | (0.59 | ) | | | (0.25 | ) | | | (0.84 | ) | | | 20.11 | | | | (8.05 | ) | | | 2,159 | | | | 0.75 | | | | 0.76 | | | | 2.61 | | | | 47 | |
Class R6 | | | | | | | | | | | | | | | | | | | | | | | | | | | | | | | | | | | | | | | | | | | | | | | | | | | | | | | | |
Year ended 04/30/24 | | | 24.53 | | | | 0.55 | | | | 1.71 | | | | 2.26 | | | | (0.59 | ) | | | (0.88 | ) | | | (1.47 | ) | | | 25.32 | | | | 9.60 | | | | 197,127 | | | | 0.60 | | | | 0.60 | | | | 2.24 | | | | 40 | |
Year ended 04/30/23 | | | 25.45 | | | | 0.54 | | | | 0.04 | | | | 0.58 | | | | (0.53 | ) | | | (0.97 | ) | | | (1.50 | ) | | | 24.53 | | | | 2.36 | | | | 212,736 | | | | 0.58 | | | | 0.58 | | | | 2.19 | | | | 17 | |
Year ended 04/30/22 | | | 25.65 | | | | 0.57 | | | | 1.00 | | | | 1.57 | | | | (0.56 | ) | | | (1.21 | ) | | | (1.77 | ) | | | 25.45 | | | | 6.31 | | | | 222,790 | | | | 0.59 | | | | 0.59 | | | | 2.18 | | | | 38 | |
Year ended 04/30/21 | | | 20.13 | | | | 0.55 | | | | 5.54 | | | | 6.09 | | | | (0.57 | ) | | | – | | | | (0.57 | ) | | | 25.65 | | | | 30.75 | | | | 241,970 | | | | 0.58 | | | | 0.58 | | | | 2.49 | | | | 4 | |
Year ended 04/30/20 | | | 22.73 | | | | 0.60 | | | | (2.34 | ) | | | (1.74 | ) | | | (0.61 | ) | | | (0.25 | ) | | | (0.86 | ) | | | 20.13 | | | | (7.97 | ) | | | 245,526 | | | | 0.66 | | | | 0.67 | | | | 2.70 | | | | 47 | |
| (a) | Calculated using average shares outstanding. |
| (b) | Includes adjustments in accordance with accounting principles generally accepted in the United States of America and as such, the net asset value for financial reporting purposes and the returns based upon those net asset values may differ from the net asset value and returns for shareholder transactions. Does not include sales charges and is not annualized for periods less than one year, if applicable. |
| (c) | Portfolio turnover is calculated at the fund level and is not annualized for periods less than one year, if applicable. For the year ended April 30, 2020, the portfolio turnover calculation excludes the value of securities purchased of $2,372,954,426 in connection with the acquisitions of Invesco Oppenheimer Dividend Opportunity Fund and Invesco Oppenheimer Equity Income Fund into the Fund. |
| (d) | The total return, ratio of expenses to average net assets and ratio of net investment income to average net assets reflect actual 12b-1 fees of 0.24% for the years ended April 30, 2024, 2023, 2022 and 2021. |
| (e) | Commencement date of April 17, 2020. |
See accompanying Notes to Financial Statements which are an integral part of the financial statements.
| | |
| 14 | | Invesco Dividend Income Fund |
Notes to Financial Statements
April 30, 2024
NOTE 1–Significant Accounting Policies
Invesco Dividend Income Fund (the “Fund”) is a series portfolio of AIM Sector Funds (Invesco Sector Funds) (the “Trust”). The Trust is a Delaware statutory trust registered under the Investment Company Act of 1940, as amended (the “1940 Act”), as an open-end series management investment company authorized to issue an unlimited number of shares of beneficial interest. Information presented in these financial statements pertains only to the Fund. Matters affecting the Fund or each class will be voted on exclusively by the shareholders of the Fund or each class.
The Fund’s investment objective is current income and long-term growth of capital.
The Fund currently consists of seven different classes of shares: Class A, Class C, Class R, Class Y, Investor Class, Class R5 and Class R6. Class Y and Investor Class shares are available only to certain investors. Class A shares are sold with a front-end sales charge unless certain waiver criteria are met. Under certain circumstances, load waived shares may be subject to contingent deferred sales charges (“CDSC”). Class C shares are sold with a CDSC. Class R, Class Y, Investor Class, Class R5 and Class R6 shares are sold at net asset value. Class C shares held for eight years after purchase are eligible for automatic conversion into Class A shares of the same Fund (the “Conversion Feature”). The automatic conversion pursuant to the Conversion Feature will generally occur at the end of the month following the eighth anniversary after a purchase of Class C shares.
The Fund is an investment company and accordingly follows the investment company accounting and reporting guidance in accordance with Financial Accounting Standards Board Accounting Standards Codification Topic 946, Financial Services – Investment Companies.
The following is a summary of the significant accounting policies followed by the Fund in the preparation of its financial statements.
| A. | Security Valuations – Securities, including restricted securities, are valued according to the following policy. |
A security listed or traded on an exchange is generally valued at its trade price or official closing price that day as of the close of the exchange where the security is principally traded, or lacking any trades or official closing price on a particular day, the security may be valued at the closing bid or ask price on that day. Securities traded in the over-the-counter market are valued based on prices furnished by independent pricing services or market makers. When such securities are valued using prices provided by an independent pricing service they may be considered fair valued. Futures contracts are valued at the daily settlement price set by an exchange on which they are principally traded. Where a final settlement price exists, exchange-traded options are valued at the final settlement price from the exchange where the option principally trades. Where a final settlement price does not exist, exchange-traded options are valued at the mean between the last bid and ask price generally from the exchange where the option principally trades.
Securities of investment companies that are not exchange-traded (e.g., open-end mutual funds) are valued using such company’s end-of-business-day net asset value per share.
Deposits, other obligations of U.S. and non-U.S. banks and financial institutions are valued at their daily account value.
Fixed income securities (including convertible debt securities) generally are valued on the basis of prices provided by independent pricing services. Prices provided by the pricing service may be determined without exclusive reliance on quoted prices, and may reflect appropriate factors such as institution-size trading in similar groups of securities, developments related to specific securities, dividend rate (for unlisted equities), yield (for debt obligations), quality, type of issue, coupon rate (for debt obligations), maturity (for debt obligations), individual trading characteristics and other market data. Pricing services generally value debt obligations assuming orderly transactions of institutional round lot size, but a fund may hold or transact in the same securities in smaller, odd lot sizes. Odd lots often trade at lower prices than institutional round lots, and their value may be adjusted accordingly. Debt obligations are subject to interest rate and credit risks. In addition, all debt obligations involve some risk of default with respect to interest and/or principal payments.
Foreign securities’ (including foreign exchange contracts) prices are converted into U.S. dollar amounts using the applicable exchange rates as of the close of the New York Stock Exchange (“NYSE”). If market quotations are available and reliable for foreign exchange-traded equity securities, the securities will be valued at the market quotations. Invesco Advisers, Inc. (the “Adviser” or “Invesco”) may use various pricing services to obtain market quotations as well as fair value prices. Because trading hours for certain foreign securities end before the close of the NYSE, closing market quotations may become not representative of market value in the Adviser’s judgment (“unreliable”). If, between the time trading ends on a particular security and the close of the customary trading session on the NYSE, a significant event occurs that makes the closing price of the security unreliable, the Adviser may fair value the security. If the event is likely to have affected the closing price of the security, the security will be valued at fair value in good faith in accordance with Board- approved policies and related Adviser procedures (“Valuation Procedures”). Adjustments to closing prices to reflect fair value may also be based on a screening process of an independent pricing service to indicate the degree of certainty, based on historical data, that the closing price in the principal market where a foreign security trades is not the current value as of the close of the NYSE. Foreign securities’ prices meeting the degree of certainty that the price is not reflective of current value will be priced at the indication of fair value from the independent pricing service. Multiple factors may be considered by the independent pricing service in determining adjustments to reflect fair value and may include information relating to sector indices, American Depositary Receipts and domestic and foreign index futures. Foreign securities may have additional risks including exchange rate changes, potential for sharply devalued currencies and high inflation, political and economic upheaval, the relative lack of issuer information, relatively low market liquidity and the potential lack of strict financial and accounting controls and standards.
Unlisted securities will be valued using prices provided by independent pricing services or by another method that the Adviser, in its judgment, believes better reflects the security’s fair value in accordance with the Valuation Procedures.
Non-traded rights and warrants shall be valued at intrinsic value if the terms of the rights and warrants are available, specifically the subscription or exercise price and the ratio. Intrinsic value is calculated as the daily market closing price of the security to be received less the subscription price, which is then adjusted by the exercise ratio. In the case of warrants, an option pricing model supplied by an independent pricing service may be used based on market data such as volatility, stock price and interest rate from the independent pricing service and strike price and exercise period from verified terms.
Securities for which market prices are not provided by any of the above methods may be valued based upon quotes furnished by independent sources. The mean between the last bid and ask prices may be used to value debt obligations, including corporate loans.
Securities for which market quotations are not readily available are fair valued by the Adviser in accordance with the Valuation Procedures. If a fair value price provided by a pricing service is unreliable, the Adviser will fair value the security using the Valuation Procedures. Issuer specific events, market trends, bid/ask quotes of brokers and information providers and other market data may be reviewed in the course of making a good faith determination of a security’s fair value.
The Fund may invest in securities that are subject to interest rate risk, meaning the risk that the prices will generally fall as interest rates rise and, conversely, the prices will generally rise as interest rates fall. Specific securities differ in their sensitivity to changes in interest rates depending on their individual characteristics. Changes in interest rates may result in increased market volatility, which may affect the value and/or liquidity of certain Fund investments.
Valuations change in response to many factors including the historical and prospective earnings of the issuer, the value of the issuer’s assets, general market conditions which are not specifically related to the particular issuer, such as real or perceived adverse economic conditions, changes in the general outlook for revenues or corporate earnings, changes in interest or currency rates, regional or global instability, natural or environmental disasters, widespread disease or other public health issues, war, acts of terrorism, significant governmental actions or adverse investor sentiment generally and market liquidity. Because of the inherent uncertainties of valuation, the values reflected in the financial statements may materially differ from the value received upon actual sale of those investments.
| | |
| 15 | | Invesco Dividend Income Fund |
The price the Fund could receive upon the sale of any investment may differ from the Adviser’s valuation of the investment, particularly for securities that are valued using a fair valuation technique. When fair valuation techniques are applied, the Adviser uses available information, including both observable and unobservable inputs and assumptions, to determine a methodology that will result in a valuation that the Adviser believes approximates market value. Fund securities that are fair valued may be subject to greater fluctuation in their value from one day to the next than would be the case if market quotations were used. Because of the inherent uncertainties of valuation, and the degree of subjectivity in such decisions, the Fund could realize a greater or lesser than expected gain or loss upon the sale of the investment.
| B. | Securities Transactions and Investment Income – Securities transactions are accounted for on a trade date basis. Realized gains or losses on sales are computed on the basis of specific identification of the securities sold. Interest income (net of withholding tax, if any) is recorded on an accrual basis from settlement date and includes coupon interest and amortization of premium and accretion of discount on debt securities as applicable. Pay-in-kind interest income and non-cash dividend income received in the form of securities in lieu of cash are recorded at the fair value of the securities received. Dividend income (net of withholding tax, if any) is recorded on the ex-dividend date. |
The Fund may periodically participate in litigation related to Fund investments. As such, the Fund may receive proceeds from litigation settlements. Any proceeds received are included in the Statement of Operations as realized gain (loss) for investments no longer held and as unrealized gain (loss) for investments still held.
Brokerage commissions and mark ups are considered transaction costs and are recorded as an increase to the cost basis of securities purchased and/or a reduction of proceeds on a sale of securities. Such transaction costs are included in the determination of net realized and unrealized gain (loss) from investment securities reported in the Statement of Operations and the Statement of Changes in Net Assets and the net realized and unrealized gains (losses) on securities per share in the Financial Highlights. Transaction costs are included in the calculation of the Fund’s net asset value and, accordingly, they reduce the Fund’s total returns. These transaction costs are not considered operating expenses and are not reflected in net investment income reported in the Statement of Operations and the Statement of Changes in Net Assets, or the net investment income per share and the ratios of expenses and net investment income reported in the Financial Highlights, nor are they limited by any expense limitation arrangements between the Fund and the investment adviser.
The Fund allocates income and realized and unrealized capital gains and losses to a class based on the relative net assets of each class.
| C. | Country Determination – For the purposes of making investment selection decisions and presentation in the Schedule of Investments, the investment adviser may determine the country in which an issuer is located and/or credit risk exposure based on various factors. These factors include the laws of the country under which the issuer is organized, where the issuer maintains a principal office, the country in which the issuer derives 50% or more of its total revenues, the country that has the primary market for the issuer’s securities and its “country of risk” as determined by a third party service provider, as well as other criteria. Among the other criteria that may be evaluated for making this determination are the country in which the issuer maintains 50% or more of its assets, the type of security, financial guarantees and enhancements, the nature of the collateral and the sponsor organization. Country of issuer and/or credit risk exposure has been determined to be the United States of America, unless otherwise noted. |
| D. | Distributions – Distributions from net investment income, if any, are declared and paid monthly. Distributions from net realized capital gain, if any, are generally declared and paid annually and recorded on the ex-dividend date. The Fund may elect to treat a portion of the proceeds from redemptions as distributions for federal income tax purposes. |
| E. | Federal Income Taxes – The Fund intends to comply with the requirements of Subchapter M of the Internal Revenue Code of 1986, as amended (the “Internal Revenue Code”), necessary to qualify as a regulated investment company and to distribute substantially all of the Fund’s taxable earnings to shareholders. As such, the Fund will not be subject to federal income taxes on otherwise taxable income (including net realized capital gain) that is distributed to shareholders. Therefore, no provision for federal income taxes is recorded in the financial statements. |
The Fund recognizes the tax benefits of uncertain tax positions only when the position is more likely than not to be sustained. Management has analyzed the Fund’s uncertain tax positions and concluded that no liability for unrecognized tax benefits should be recorded related to uncertain tax positions. Management is not aware of any tax positions for which it is reasonably possible that the total amounts of unrecognized tax benefits will change materially in the next 12 months.
The Fund files tax returns in the U.S. Federal jurisdiction and certain other jurisdictions. Generally, the Fund is subject to examinations by such taxing authorities for up to three years after the filing of the return for the tax period.
| F. | Foreign Withholding Taxes – The Fund is subject to foreign withholding tax imposed by certain foreign countries in which the Fund may invest. Withholding taxes are incurred on certain foreign dividends and are accrued at the time the dividend is recognized based on applicable foreign tax laws. The Fund may file withholding tax refunds in certain jurisdictions to seek to recover a portion of amounts previously withheld. The Fund will record a receivable for such tax refunds based on several factors including; an assessment of a jurisdiction’s legal obligation to pay reclaims, administrative practices and payment history. Any receivables recorded will be shown under receivables for Foreign withholding tax claims on the Statement of Assets and Liabilities. There is no guarantee that the Fund will receive refunds applied for in a timely manner or at all. |
As a result of recent court rulings in certain countries across the European Union, tax refunds for previously withheld taxes on dividends earned in those countries have been received by investment companies. Any tax refund payments are reflected as Foreign withholding tax claims in the Statement of Operations, and any related interest is included in Interest income. The Fund may incur fees paid to third party providers that assist in the recovery of the tax reclaims. These fees are reflected on the Statement of Operations as Professional services fees, if any. In the event tax refunds received by the Fund during the fiscal year exceed the foreign withholding taxes paid by the Fund for the year, and the Fund previously passed foreign tax credits on to its shareholders, the Fund intends to enter into a closing agreement with the Internal Revenue Service in order to pay the associated liability on behalf of the Funds’ shareholders. For the year ended April 30, 2024, the Fund did not enter into any closing agreements.
| G. | Expenses – Fees provided for under the Rule 12b-1 plan of a particular class of the Fund are charged to the operations of such class. Transfer agency fees and expenses and other shareholder recordkeeping fees and expenses attributable to Class R5 and Class R6 are allocated based on relative net assets of Class R5 and Class R6. Sub-accounting fees attributable to Class R5 are charged to the operations of the class. Transfer agency fees and expenses and other shareholder recordkeeping fees and expenses relating to all other classes are allocated among those classes based on relative net assets. All other expenses are allocated among the classes based on relative net assets. |
| H. | Accounting Estimates – The preparation of financial statements in conformity with accounting principles generally accepted in the United States of America (“GAAP”) requires management to make estimates and assumptions that affect the reported amounts of assets and liabilities at the date of the financial statements and the reported amounts of revenues and expenses during the reporting period including estimates and assumptions related to taxation. Actual results could differ from those estimates by a significant amount. In addition, the Fund monitors for material events or transactions that may occur or become known after the period-end date and before the date the financial statements are released to print. |
| I. | Indemnifications – Under the Trust’s organizational documents, each Trustee, officer, employee or other agent of the Trust is indemnified against certain liabilities that may arise out of the performance of their duties to the Fund. Additionally, in the normal course of business, the Fund enters into contracts, including the Fund’s servicing agreements, that contain a variety of indemnification clauses. The Fund’s maximum exposure under these arrangements is unknown as this would involve future claims that may be made against the Fund that have not yet occurred. The risk of material loss as a result of such indemnification claims is considered remote. |
| J. | Securities Lending – The Fund may lend portfolio securities having a market value up to one-third of the Fund’s total assets. Such loans are secured by collateral equal to no less than the market value of the loaned securities determined daily by the securities lending provider. Such collateral will be cash or debt securities issued or guaranteed by the U.S. Government or any of its sponsored agencies. Cash collateral received in connection with these loans is invested in |
| | |
| 16 | | Invesco Dividend Income Fund |
short-term money market instruments or affiliated, unregistered investment companies that comply with Rule 2a-7 under the 1940 Act and money market funds (collectively, “affiliated money market funds”) and is shown as such on the Schedule of Investments. The Fund bears the risk of loss with respect to the investment of collateral. It is the Fund’s policy to obtain additional collateral from or return excess collateral to the borrower by the end of the next business day, following the valuation date of the securities loaned. Therefore, the value of the collateral held may be temporarily less than the value of the securities on loan. When loaning securities, the Fund retains certain benefits of owning the securities, including the economic equivalent of dividends or interest generated by the security. Lending securities entails a risk of loss to the Fund if, and to the extent that, the market value of the securities loaned were to increase and the borrower did not increase the collateral accordingly, and the borrower failed to return the securities. The securities loaned are subject to termination at the option of the borrower or the Fund. Upon termination, the borrower will return to the Fund the securities loaned and the Fund will return the collateral. Upon the failure of the borrower to return the securities, collateral may be liquidated and the securities may be purchased on the open market to replace the loaned securities. The Fund could experience delays and costs in gaining access to the collateral and the securities may lose value during the delay which could result in potential losses to the Fund. Some of these losses may be indemnified by the lending agent. The Fund bears the risk of any deficiency in the amount of the collateral available for return to the borrower due to any loss on the collateral invested. Dividends received on cash collateral investments for securities lending transactions, which are net of compensation to counterparties, are included in Dividends from affiliated money market funds on the Statement of Operations. The aggregate value of securities out on loan, if any, is shown as a footnote on the Statement of Assets and Liabilities.
The Adviser serves as an affiliated securities lending agent for the Fund. The Bank of New York Mellon also serves as a securities lending agent. To the extent the Fund utilizes the Adviser as an affiliated securities lending agent, the Fund conducts its securities lending in accordance with, and in reliance upon, no-action letters issued by the SEC staff that provide guidance on how an affiliate may act as a direct agent lender and receive compensation for those services in a manner consistent with the federal securities laws. For the year ended April 30, 2024, the Fund paid the Adviser $9,352 in fees for securities lending agent services. Fees paid to the Adviser for securities lending agent services, if any, are included in Dividends from affiliated money market funds on the Statement of Operations.
| K. | Foreign Currency Translations – Foreign currency is valued at the close of the NYSE based on quotations posted by banks and major currency dealers. Portfolio securities and other assets and liabilities denominated in foreign currencies are translated into U.S. dollar amounts at the date of valuation. Purchases and sales of portfolio securities (net of foreign taxes withheld on disposition) and income items denominated in foreign currencies are translated into U.S. dollar amounts on the respective dates of such transactions. The Fund does not separately account for the portion of the results of operations resulting from changes in foreign exchange rates on investments and the fluctuations arising from changes in market prices of securities held. The combined results of changes in foreign exchange rates and the fluctuation of market prices on investments (net of estimated foreign tax withholding) are included with the net realized and unrealized gain or loss from investments in the Statement of Operations. Reported net realized foreign currency gains or losses arise from (1) sales of foreign currencies, (2) currency gains or losses realized between the trade and settlement dates on securities transactions, and (3) the difference between the amounts of dividends, interest, and foreign withholding taxes recorded on the Fund’s books and the U.S. dollar equivalent of the amounts actually received or paid. Net unrealized foreign currency gains and losses arise from changes in the fair values of assets and liabilities, other than investments in securities at fiscal period end, resulting from changes in exchange rates. |
The Fund may invest in foreign securities, which may be subject to foreign taxes on income, gains on investments or currency repatriation, a portion of which may be recoverable. Foreign taxes, if any, are recorded based on the tax regulations and rates that exist in the foreign markets in which the Fund invests and are shown in the Statement of Operations.
The performance of the Fund may be materially affected positively or negatively by foreign currency strength or weakness relative to the U.S. dollar. Currency rates in foreign countries may fluctuate for a number of reasons, including changes in interest rates, political, economic, or social instability and development, and imposition of currency controls. Currency controls in certain foreign jurisdictions may cause the Fund to experience significant delays in its ability to repatriate its assets in U.S. dollars at quoted spot rates, and it is possible that the Fund’s ability to convert certain foreign currencies into U.S. dollars may be limited and may occur at discounts to quoted rates. As a result, the value of the Fund’s assets and liabilities denominated in such currencies that would ultimately be realized could differ from those reported on the Statement of Assets and Liabilities. Certain foreign companies may be subject to sanctions, embargoes, or other governmental actions that may limit the ability to invest in, receive, hold, or sell the securities of such companies, all of which affect the market and/or credit risk of the investments. Because of the inherent uncertainties of valuation, the values reflected in the financial statements may materially differ from the value received upon actual sale of those investments.
| L. | Forward Foreign Currency Contracts – The Fund may engage in foreign currency transactions either on a spot (i.e. for prompt delivery and settlement) basis, or through forward foreign currency contracts, to manage or minimize currency or exchange rate risk. |
The Fund may also enter into forward foreign currency contracts for the purchase or sale of a security denominated in a foreign currency in order to “lock in” the U.S. dollar price of that security, or the Fund may also enter into forward foreign currency contracts that do not provide for physical exchange of the two currencies on the settlement date, but instead are settled by a single cash payment calculated as the difference between the agreed upon exchange rate and the spot rate at settlement based upon an agreed upon notional amount (non-deliverable forwards).
A forward foreign currency contract is an obligation between two parties (“Counterparties”) to purchase or sell a specific currency for an agreed-upon price at a future date. The use of forward foreign currency contracts for hedging does not eliminate fluctuations in the price of the underlying securities the Fund owns or intends to acquire but establishes a rate of exchange in advance. Fluctuations in the value of these contracts are measured by the difference in the contract date and reporting date exchange rates and are recorded as unrealized appreciation (depreciation) until the contracts are closed. When the contracts are closed, realized gains (losses) are recorded. Realized and unrealized gains (losses) on the contracts are included in the Statement of Operations. The primary risks associated with forward foreign currency contracts include failure of the Counterparty to meet the terms of the contract and the value of the foreign currency changing unfavorably. These risks may be in excess of the amounts reflected in the Statement of Assets and Liabilities.
NOTE 2–Advisory Fees and Other Fees Paid to Affiliates
The Trust has entered into a master investment advisory agreement with the Adviser. Under the terms of the investment advisory agreement, the Fund accrues daily and pays monthly an advisory fee to the Adviser based on the annual rate of the Fund’s average daily net assets as follows:
| | | | |
| Average Daily Net Assets | | Rate | |
|
| |
First $500 million | | | 0.6325 | % |
|
| |
Next $500 million | | | 0.6125 | % |
|
| |
Next $600 million | | | 0.6000 | % |
|
| |
Next $400 million | | | 0.5325 | % |
|
| |
Next $2 billion | | | 0.4500 | % |
|
| |
Next $2 billion | | | 0.4000 | % |
|
| |
Next $2 billion | | | 0.3750 | % |
|
| |
Over $8 billion | | | 0.3500 | % |
|
| |
For the year ended April 30, 2024, the effective advisory fee rate incurred by the Fund was 0.53%.
| | |
| 17 | | Invesco Dividend Income Fund |
Under the terms of a master sub-advisory agreement between the Adviser and each of Invesco Asset Management Deutschland GmbH, Invesco Asset Management Limited, Invesco Asset Management (Japan) Limited, Invesco Hong Kong Limited, Invesco Senior Secured Management, Inc. and Invesco Canada Ltd. (collectively, the “Affiliated Sub-Advisers”) the Adviser, not the Fund, will pay 40% of the fees paid to the Adviser to any such Affiliated Sub-Adviser(s) that provide(s) discretionary investment management services to the Fund based on the percentage of assets allocated to such Affiliated Sub-Adviser(s).
Effective July 1, 2023, the Adviser has agreed, for an indefinite period, to waive advisory fees and/or reimburse expenses of all shares to the extent necessary to limit total annual fund operating expenses after fee waiver and/or expense reimbursement (excluding certain items discussed below) of Class A, Class C, Class R, Class Y, Investor Class, Class R5 and Class R6 shares to 2.00%, 2.75%, 2.25%, 1.75%, 2.00%, 1.75% and 1.75%, respectively, of the Fund’s average daily net assets (the “boundary limits”). Prior to July 1, 2023, the same boundary limits were in effect with an expiration date of June 30, 2023. In determining the Adviser’s obligation to waive advisory fees and/or reimburse expenses, the following expenses are not taken into account, and could cause the total annual fund operating expenses after fee waiver and/or expense reimbursement to exceed the numbers reflected above: (1) interest; (2) taxes; (3) dividend expense on short sales; (4) extraordinary or non-routine items, including litigation expenses; and (5) expenses that the Fund has incurred but did not actually pay because of an expense offset arrangement. Invesco may amend and/or terminate these boundary limits at any time in its sole discretion and will inform the Board of Trustees of any such changes. The Adviser did not waive fees and/or reimburse expenses during the period under these boundary limits.
Further, the Adviser has contractually agreed, through at least June 30, 2025, to waive the advisory fee payable by the Fund in an amount equal to 100% of the net advisory fees the Adviser receives from the affiliated money market funds on investments by the Fund of uninvested cash (excluding investments of cash collateral from securities lending) in such affiliated money market funds.
For the year ended April 30, 2024, the Adviser waived advisory fees of $93,938.
The Trust has entered into a master administrative services agreement with Invesco pursuant to which the Fund has agreed to pay Invesco for certain administrative costs incurred in providing accounting services to the Fund. For the year ended April 30, 2024, expenses incurred under the agreement are shown in the Statement of Operations as Administrative services fees. Invesco has entered into a sub-administration agreement whereby State Street Bank and Trust Company (“SSB”) serves as fund accountant and provides certain administrative services to the Fund. Pursuant to a custody agreement with the Trust on behalf of the Fund, SSB also serves as the Fund’s custodian.
The Trust has entered into a transfer agency and service agreement with Invesco Investment Services, Inc. (“IIS”) pursuant to which the Fund has agreed to pay IIS a fee for providing transfer agency and shareholder services to the Fund and reimburse IIS for certain expenses incurred by IIS in the course of providing such services. IIS may make payments to intermediaries that provide omnibus account services, sub-accounting services and/or networking services. All fees payable by IIS to intermediaries that provide omnibus account services or sub-accounting services are charged back to the Fund, subject to certain limitations approved by the Trust’s Board of Trustees. For the year ended April 30, 2024, expenses incurred under the agreement are shown in the Statement of Operations as Transfer agent fees.
The Trust has entered into master distribution agreements with Invesco Distributors, Inc. (“IDI”) to serve as the distributor for the Class A, Class C, Class R, Class Y, Investor Class, Class R5 and Class R6 shares of the Fund. The Trust has adopted plans pursuant to Rule 12b-1 under the 1940 Act with respect to the Fund’s Class A, Class C, Class R and Investor Class shares (collectively, the “Plans”). The Fund, pursuant to the Class A Plan, reimburses IDI for its allocated share of expenses incurred for the period, up to a maximum annual rate of 0.25% of the average daily net assets of Class A shares. The Fund pursuant to the Class C Plan, the Class R Plan and the Investor Class Plan, pays IDI compensation at the annual rate of 1.00% of the average daily net assets of Class C shares, at the annual rate of 0.50% of the average daily net assets of Class R shares and at the annual rate of 0.25% of the average daily net assets of the Investor Class shares, respectively. The fees are accrued daily and paid monthly. Of the Plans payments, up to 0.25% of the average daily net assets of each class of shares may be paid to furnish continuing personal shareholder services to customers who purchase and own shares of such classes. Any amounts not paid as a service fee under the Plans would constitute an asset-based sales charge. Rules of the Financial Industry Regulatory Authority (“FINRA”) impose a cap on the total sales charges, including asset-based sales charges, that may be paid by any class of shares of the Fund. For the year ended April 30, 2024, expenses incurred under the Plans are shown in the Statement of Operations as Distribution fees.
Front-end sales commissions and CDSC (collectively, the “sales charges”) are not recorded as expenses of the Fund. Front-end sales commissions are deducted from proceeds from the sales of Fund shares prior to investment in Class A shares of the Fund. CDSC are deducted from redemption proceeds prior to remittance to the shareholder. During the year ended April 30, 2024, IDI advised the Fund that IDI retained $229,608 in front-end sales commissions from the sale of Class A shares and $4,906 and $7,914 from Class A and Class C shares, respectively, for CDSC imposed upon redemptions by shareholders.
For the year ended April 30, 2024, the Fund incurred $20,998 in brokerage commissions with Invesco Capital Markets, Inc., an affiliate of the Adviser and IDI, for portfolio transactions executed on behalf of the Fund.
Certain officers and trustees of the Trust are officers and directors of the Adviser, IIS and/or IDI.
NOTE 3–Additional Valuation Information
GAAP defines fair value as the price that would be received to sell an asset or paid to transfer a liability in an orderly transaction between market participants at the measurement date, under current market conditions. GAAP establishes a hierarchy that prioritizes the inputs to valuation methods, giving the highest priority to readily available unadjusted quoted prices in an active market for identical assets (Level 1) and the lowest priority to significant unobservable inputs (Level 3), generally when market prices are not readily available. Based on the valuation inputs, the securities or other investments are tiered into one of three levels. Changes in valuation methods may result in transfers in or out of an investment’s assigned level:
| | |
| Level 1 - | | Prices are determined using quoted prices in an active market for identical assets. |
| Level 2 - | | Prices are determined using other significant observable inputs. Observable inputs are inputs that other market participants may use in pricing a security. These may include quoted prices for similar securities, interest rates, prepayment speeds, credit risk, yield curves, loss severities, default rates, discount rates, volatilities and others. |
| Level 3 - | | Prices are determined using significant unobservable inputs. In situations where quoted prices or observable inputs are unavailable (for example, when there is little or no market activity for an investment at the end of the period), unobservable inputs may be used. Unobservable inputs reflect the Adviser’s assumptions about the factors market participants would use in determining fair value of the securities or instruments and would be based on the best available information. |
The following is a summary of the tiered valuation input levels, as of April 30, 2024. The level assigned to the securities valuations may not be an indication of the risk or liquidity associated with investing in those securities. Because of the inherent uncertainties of valuation, the values reflected in the financial statements may materially differ from the value received upon actual sale of those investments.
| | | | | | | | | | | | | | | | |
| | | Level 1 | | | Level 2 | | | Level 3 | | | Total | |
|
| |
Investments in Securities | | | | | | | | | | | | | | | | |
|
| |
Common Stocks & Other Equity Interests | | | $3,251,299,092 | | | | $216,458,831 | | | | $– | | | | $3,467,757,923 | |
|
| |
Money Market Funds | | | 123,513,019 | | | | 20,620,681 | | | | – | | | | 144,133,700 | |
|
| |
Total Investments | | | $3,374,812,111 | | | | $237,079,512 | | | | $– | | | | $3,611,891,623 | |
|
| |
| | |
| 18 | | Invesco Dividend Income Fund |
NOTE 4–Expense Offset Arrangement(s)
The expense offset arrangement is comprised of transfer agency credits which result from balances in demand deposit accounts used by the transfer agent for clearing shareholder transactions. For the year ended April 30, 2024, the Fund received credits from this arrangement, which resulted in the reduction of the Fund’s total expenses of $141,120.
NOTE 5–Trustees’ and Officers’ Fees and Benefits
Trustees’ and Officers’ Fees and Benefits include amounts accrued by the Fund to pay remuneration to certain Trustees and Officers of the Fund. Trustees have the option to defer compensation payable by the Fund, and Trustees’ and Officers’ Fees and Benefits also include amounts accrued by the Fund to fund such deferred compensation amounts. Those Trustees who defer compensation have the option to select various Invesco Funds in which their deferral accounts shall be deemed to be invested. Finally, certain current Trustees were eligible to participate in a retirement plan that provided for benefits to be paid upon retirement to Trustees over a period of time based on the number of years of service. The Fund may have certain former Trustees who also participate in a retirement plan and receive benefits under such plan. Trustees’ and Officers’ Fees and Benefits include amounts accrued by the Fund to fund such retirement benefits. Obligations under the deferred compensation and retirement plans represent unsecured claims against the general assets of the Fund.
NOTE 6–Cash Balances
The Fund is permitted to temporarily carry a negative or overdrawn balance in its account with SSB, the custodian bank. Such balances, if any at period-end, are shown in the Statement of Assets and Liabilities under the payable caption Amount due custodian. To compensate the custodian bank for such overdrafts, the overdrawn Fund may either (1) leave funds as a compensating balance in the account so the custodian bank can be compensated by earning the additional interest; or (2) compensate by paying the custodian bank at a rate agreed upon by the custodian bank and Invesco, not to exceed the contractually agreed upon rate.
NOTE 7–Distributions to Shareholders and Tax Components of Net Assets
Tax Character of Distributions to Shareholders Paid During the Fiscal Years Ended April 30, 2024 and 2023:
| | | | | | |
| | | 2024 | | | | 2023 |
|
|
Ordinary income* | | $ 74,178,193 | | | | $ 66,431,724 |
|
|
Long-term capital gain | | 125,529,265 | | | | 144,511,608 |
|
|
Total distributions | | $199,707,458 | | | | $210,943,332 |
|
|
| * | Includes short-term capital gain distributions, if any. |
Tax Components of Net Assets at Period-End:
| | | | |
| | | 2024 | |
|
| |
Undistributed ordinary income | | $ | 14,941,669 | |
|
| |
Undistributed long-term capital gain | | | 153,539,796 | |
|
| |
Net unrealized appreciation – investments | | | 771,540,724 | |
|
| |
Net unrealized appreciation (depreciation) – foreign currencies | | | (5,584 | ) |
|
| |
Temporary book/tax differences | | | (338,340 | ) |
|
| |
Shares of beneficial interest | | | 2,654,654,680 | |
|
| |
Total net assets | | $ | 3,594,332,945 | |
|
| |
The difference between book-basis and tax-basis unrealized appreciation (depreciation) is due to differences in the timing of recognition of gains and losses on investments for tax and book purposes. The Fund’s net unrealized appreciation (depreciation) difference is attributable primarily to wash sales and straddles.
The temporary book/tax differences are a result of timing differences between book and tax recognition of income and/or expenses. The Fund’s temporary book/tax differences are the result of the trustee deferral of compensation and retirement plan benefits.
Capital loss carryforward is calculated and reported as of a specific date. Results of transactions and other activity after that date may affect the amount of capital loss carryforward actually available for the Fund to utilize. The ability to utilize capital loss carryforward in the future may be limited under the Internal Revenue Code and related regulations based on the results of future transactions.
The Fund does not have a capital loss carryforward as of April 30, 2024.
NOTE 8–Investment Transactions
The aggregate amount of investment securities (other than short-term securities, U.S. Government obligations and money market funds, if any) purchased and sold by the Fund during the year ended April 30, 2024 was $1,382,485,658 and $1,699,089,262, respectively. Cost of investments, including any derivatives, on a tax basis includes the adjustments for financial reporting purposes as of the most recently completed federal income tax reporting period-end.
| | | | |
| Unrealized Appreciation (Depreciation) of Investments on a Tax Basis | |
|
| |
Aggregate unrealized appreciation of investments | | $ | 822,670,430 | |
|
| |
Aggregate unrealized (depreciation) of investments | | | (51,129,706 | ) |
|
| |
Net unrealized appreciation of investments | | $ | 771,540,724 | |
|
| |
Cost of investments for tax purposes is $2,840,350,899.
NOTE 9–Reclassification of Permanent Differences
Primarily as a result of differing book/tax treatment of equalization, on April 30, 2024, undistributed net investment income was increased by $93,419, undistributed net realized gain was decreased by $13,642,419 and shares of beneficial interest was increased by $13,549,000. This reclassification had no effect on the net assets of the Fund.
| | |
| 19 | | Invesco Dividend Income Fund |
NOTE 10–Share Information
| | | | | | | | | | | | | | | | |
| | | Summary of Share Activity | |
|
| |
| | | Year ended
April 30, 2024(a) | | | Year ended
April 30, 2023 | |
| | | Shares | | | Amount | | | Shares | | | Amount | |
|
| |
| | | | |
Sold: | | | | | | | | | | | | | | | | |
Class A | | | 4,385,488 | | | $ | 107,435,697 | | | | 8,181,316 | | | $ | 200,683,459 | |
|
| |
Class C | | | 538,898 | | | | 13,372,645 | | | | 972,600 | | | | 24,236,210 | |
|
| |
Class R | | | 435,538 | | | | 10,673,749 | | | | 656,699 | | | | 16,075,677 | |
|
| |
Class Y | | | 2,811,581 | | | | 69,705,754 | | | | 2,635,776 | | | | 65,539,290 | |
|
| |
Investor Class | | | 40,253 | | | | 997,644 | | | | 58,743 | | | | 1,461,846 | |
|
| |
Class R5 | | | 6,084 | | | | 149,498 | | | | 45,834 | | | | 1,124,670 | |
|
| |
Class R6 | | | 1,116,172 | | | | 27,409,814 | | | | 1,930,894 | | | | 47,461,479 | |
|
| |
| | | | |
Issued as reinvestment of dividends: | | | | | | | | | | | | | | | | |
Class A | | | 5,876,008 | | | | 142,534,504 | | | | 5,915,820 | | | | 145,153,119 | |
|
| |
Class C | | | 297,027 | | | | 7,309,676 | | | | 368,543 | | | | 9,190,731 | |
|
| |
Class R | | | 225,893 | | | | 5,478,247 | | | | 237,176 | | | | 5,821,671 | |
|
| |
Class Y | | | 615,289 | | | | 15,103,370 | | | | 615,182 | | | | 15,267,997 | |
|
| |
Investor Class | | | 136,088 | | | | 3,341,819 | | | | 140,333 | | | | 3,483,582 | |
|
| |
Class R5 | | | 4,319 | | | | 104,820 | | | | 3,758 | | | | 92,172 | |
|
| |
Class R6 | | | 466,884 | | | | 11,341,704 | | | | 507,581 | | | | 12,463,250 | |
|
| |
| | | | |
Automatic conversion of Class C shares to Class A shares: | | | | | | | | | | | | | | | | |
Class A | | | 1,354,748 | | | | 33,170,144 | | | | 1,413,759 | | | | 34,438,742 | |
|
| |
Class C | | | (1,334,710 | ) | | | (33,170,144 | ) | | | (1,393,440 | ) | | | (34,438,742 | ) |
|
| |
| | | | |
Reacquired: | | | | | | | | | | | | | | | | |
Class A | | | (17,373,593 | ) | | | (424,740,830 | ) | | | (14,553,365 | ) | | | (356,400,731 | ) |
|
| |
Class C | | | (1,340,321 | ) | | | (33,230,961 | ) | | | (1,444,857 | ) | | | (35,925,832 | ) |
|
| |
Class R | | | (1,030,624 | ) | | | (25,340,375 | ) | | | (877,380 | ) | | | (21,503,678 | ) |
|
| |
Class Y | | | (3,887,145 | ) | | | (96,412,282 | ) | | | (2,918,473 | ) | | | (72,243,762 | ) |
|
| |
Investor Class | | | (254,702 | ) | | | (6,304,770 | ) | | | (245,831 | ) | | | (6,075,596 | ) |
|
| |
Class R5 | | | (10,628 | ) | | | (260,481 | ) | | | (35,884 | ) | | | (881,864 | ) |
|
| |
Class R6 | | | (2,468,816 | ) | | | (60,536,205 | ) | | | (2,519,174 | ) | | | (61,428,323 | ) |
|
| |
Net increase (decrease) in share activity | | | (9,390,269 | ) | | $ | (231,866,963 | ) | | | (304,390 | ) | | $ | (6,404,633 | ) |
|
| |
| (a) | There are entities that are record owners of more than 5% of the outstanding shares of the Fund and in the aggregate own 22% of the outstanding shares of the Fund. IDI has an agreement with these entities to sell Fund shares. The Fund, Invesco and/or Invesco affiliates may make payments to these entities, which are considered to be related to the Fund, for providing services to the Fund, Invesco and/or Invesco affiliates including but not limited to services such as securities brokerage, distribution, third party record keeping and account servicing. The Fund has no knowledge as to whether all or any portion of the shares owned of record by these entities are also owned beneficially. |
| | |
| 20 | | Invesco Dividend Income Fund |
Report of Independent Registered Public Accounting Firm
To the Board of Trustees of AIM Sector Funds (Invesco Sector Funds) and Shareholders of Invesco Dividend Income Fund
Opinion on the Financial Statements
We have audited the accompanying statement of assets and liabilities, including the schedule of investments, of Invesco Dividend Income Fund (one of the funds constituting AIM Sector Funds (Invesco Sector Funds), referred to hereafter as the “Fund”) as of April 30, 2024, the related statement of operations for the year ended April 30, 2024, the statement of changes in net assets for each of the two years in the period ended April 30, 2024, including the related notes, and the financial highlights for each of the periods indicated therein (collectively referred to as the “financial statements”). In our opinion, the financial statements present fairly, in all material respects, the financial position of the Fund as of April 30, 2024, the results of its operations for the year then ended, the changes in its net assets for each of the two years in the period ended April 30, 2024 and the financial highlights for each of the periods indicated therein in conformity with accounting principles generally accepted in the United States of America.
Basis for Opinion
These financial statements are the responsibility of the Fund’s management. Our responsibility is to express an opinion on the Fund’s financial statements based on our audits. We are a public accounting firm registered with the Public Company Accounting Oversight Board (United States) (PCAOB) and are required to be independent with respect to the Fund in accordance with the U.S. federal securities laws and the applicable rules and regulations of the Securities and Exchange Commission and the PCAOB.
We conducted our audits of these financial statements in accordance with the standards of the PCAOB. Those standards require that we plan and perform the audit to obtain reasonable assurance about whether the financial statements are free of material misstatement, whether due to error or fraud.
Our audits included performing procedures to assess the risks of material misstatement of the financial statements, whether due to error or fraud, and performing procedures that respond to those risks. Such procedures included examining, on a test basis, evidence regarding the amounts and disclosures in the financial statements. Our audits also included evaluating the accounting principles used and significant estimates made by management, as well as evaluating the overall presentation of the financial statements. Our procedures included confirmation of securities owned as of April 30, 2024 by correspondence with the custodian, transfer agent and broker. We believe that our audits provide a reasonable basis for our opinion.
/s/PricewaterhouseCoopers LLP
Houston, Texas
June 20, 2024
We have served as the auditor of one or more of the investment companies in the Invesco group of investment companies since at least 1995. We have not been able to determine the specific year we began serving as auditor.
| | |
| 21 | | Invesco Dividend Income Fund |
Calculating your ongoing Fund expenses
Example
As a shareholder of the Fund, you incur two types of costs: (1) transaction costs, which may include sales charges (loads) on purchase payments or contingent deferred sales charges on redemptions, if any; and (2) ongoing costs, including management fees, distribution and/or service (12b-1) fees, and other Fund expenses. This example is intended to help you understand your ongoing costs (in dollars) of investing in the Fund and to compare these costs with ongoing costs of investing in other mutual funds. The example is based on an investment of $1,000 invested at the beginning of the period and held for the entire period November 1, 2023 through April 30, 2024.
Actual expenses
The table below provides information about actual account values and actual expenses. You may use the information in this table, together with the amount you invested, to estimate the expenses that you paid over the period. Simply divide your account value by $1,000 (for example, an $8,600 account value divided by $1,000 = 8.6), then multiply the result by the number in the table under the heading entitled “Actual Expenses Paid During Period” to estimate the expenses you paid on your account during this period.
Hypothetical example for comparison purposes
The table below also provides information about hypothetical account values and hypothetical expenses based on the Fund’s actual expense ratio and an assumed rate of return of 5% per year before expenses, which is not the Fund’s actual return.
The hypothetical account values and expenses may not be used to estimate the actual ending account balance or expenses you paid for the period. You may use this information to compare the ongoing costs of investing in the Fund and other funds. To do so, compare this 5% hypothetical example with the 5% hypothetical examples that appear in the shareholder reports of the other funds.
Please note that the expenses shown in the table are meant to highlight your ongoing costs only and do not reflect any transaction costs, such as sales charges (loads) on purchase payments or contingent deferred sales charges on redemptions, if any. Therefore, the hypothetical information is useful in comparing ongoing costs only, and will not help you determine the relative total costs of owning different funds. In addition, if these transaction costs were included, your costs would have been higher.
| | | | | | | | | | | | |
| | | | | ACTUAL | | HYPOTHETICAL (5% annual return before expenses) | | |
| | Beginning
Account Value
(11/01/23) | | Ending Account Value
(04/30/24)1 | | Expenses Paid During
Period2 | | Ending Account Value
(04/30/24) | | Expenses Paid During
Period2 | | Annualized
Expense Ratio |
Class A | | $1,000.00 | | $1,158.40 | | $5.04 | | $1,020.19 | | $4.72 | | 0.94% |
Class C | | 1,000.00 | | 1,154.50 | | 9.11 | | 1,016.41 | | 8.52 | | 1.70 |
Class R | | 1,000.00 | | 1,157.40 | | 6.44 | | 1,018.90 | | 6.02 | | 1.20 |
Class Y | | 1,000.00 | | 1,160.30 | | 3.76 | | 1,021.38 | | 3.52 | | 0.70 |
Investor Class | | 1,000.00 | | 1,158.80 | | 5.10 | | 1,020.14 | | 4.77 | | 0.95 |
Class R5 | | 1,000.00 | | 1,159.80 | | 3.65 | | 1,021.48 | | 3.42 | | 0.68 |
Class R6 | | 1,000.00 | | 1,160.50 | | 3.28 | | 1,021.83 | | 3.07 | | 0.61 |
| 1 | The actual ending account value is based on the actual total return of the Fund for the period November 1, 2023 through April 30, 2024, after actual expenses and will differ from the hypothetical ending account value which is based on the Fund’s expense ratio and a hypothetical annual return of 5% before expenses. |
| 2 | Expenses are equal to the Fund’s annualized expense ratio as indicated above multiplied by the average account value over the period, multiplied by 182/366 to reflect the most recent fiscal half year. |
| | |
| 22 | | Invesco Dividend Income Fund |
Tax Information
Form 1099-DIV, Form 1042-S and other year–end tax information provide shareholders with actual calendar year amounts that should be included in their tax returns. Shareholders should consult their tax advisers.
The following distribution information is being provided as required by the Internal Revenue Code or to meet a specific state’s requirement.
The Fund designates the following amounts or, if subsequently determined to be different, the maximum amount allowable for its fiscal year ended April 30, 2024:
| | | | | | |
Federal and State Income Tax | | | | | |
Long-Term Capital Gain Distributions | | | $139,078,265 | | | |
Qualified Dividend Income* | | | 100.00 | % | | |
Corporate Dividends Received Deduction* | | | 96.09 | % | | |
U.S. Treasury Obligations* | | | 0.00 | % | | |
Qualified Business Income* | | | 0.00 | % | | |
Business Interest Income* | | | 0.00 | % | | |
|
* The above percentages are based on ordinary income dividends paid to shareholders during the Fund’s fiscal year. |
| | |
Non-Resident Alien Shareholders | | | | | |
Short-Term Capital Gain Distributions | | | $39,795 | | | |
| | |
| 23 | | Invesco Dividend Income Fund |
Trustees and Officers
The address of each trustee and officer is AIM Sector Funds (Invesco Sector Funds) (the “Trust”), 11 Greenway Plaza, Houston, Texas 77046-1173. The trustees serve for the life of the Trust, subject to their earlier death, incapacitation, resignation, retirement or removal as more specifically provided in the Trust’s organizational documents. Each officer serves for a one year term or until their successors are elected and qualified. Column two below includes length of time served with predecessor entities, if any.
| | | | | | | | |
Name, Year of Birth and
Position(s) Held with the Trust | | Trustee and/or Officer Since | | Principal Occupation(s) During Past 5 Years | | Number of
Funds in Fund Complex
Overseen by
Trustee | | Other Directorship(s) Held by Trustee During At Least The Past 5 Years |
| Interested Trustees | | | | | | | | |
| Jeffrey H. Kupor1 – 1968 Trustee | | 2024 | | Senior Managing Director and General Counsel, Invesco Ltd.; Trustee, Invesco Foundation, Inc.; Director, Invesco Advisers, Inc.; Executive Vice President, Invesco Asset Management (Bermuda), Ltd., Invesco Investments (Bermuda) Ltd.; and Vice President, Invesco Group Services, Inc. Formerly: Head of Legal of the Americas, Invesco Ltd.; Senior Vice President and Secretary, Invesco Advisers, Inc. (formerly known as Invesco Institutional (N.A.), Inc.) (registered investment adviser); Secretary, Invesco Distributors, Inc. (formerly known as Invesco AIM Distributors, Inc.); Vice President and Secretary, Invesco Investment Services, Inc. (formerly known as Invesco AIM Investment Services, Inc.); Senior Vice President, Chief Legal Officer and Secretary, The Invesco Funds; Secretary and General Counsel, Invesco Investment Advisers LLC (formerly known as Van Kampen Asset Management); Secretary and General Counsel, Invesco Capital Markets, Inc. (formerly known as Van Kampen Funds Inc.) and Chief Legal Officer, Invesco Exchange-Traded Fund Trust, Invesco Exchange-Traded Fund Trust II, Invesco India Exchange-Traded Fund Trust, Invesco Actively Managed Exchange-Traded Fund Trust, Invesco Actively Managed Exchange-Traded Commodity Fund Trust and Invesco Exchange-Traded Self-Indexed Fund Trust; Secretary and Vice President, Harbourview Asset Management Corporation; Secretary and Vice President, OppenheimerFunds, Inc. and Invesco Managed Accounts, LLC; Secretary and Senior Vice President, OFI Global Institutional, Inc.; Secretary and Vice President, OFI SteelPath, Inc.; Secretary and Vice President, Oppenheimer Acquisition Corp.; Secretary and Vice President, Shareholder Services, Inc.; Secretary and Vice President, Trinity Investment Management Corporation, Senior Vice President, Invesco Distributors, Inc.; Secretary and Vice President, Jemstep, Inc.; Head of Legal, Worldwide Institutional, Invesco Ltd.; Secretary and General Counsel, INVESCO Private Capital Investments, Inc.; Senior Vice President, Secretary and General Counsel, Invesco Management Group, Inc. (formerly known as Invesco AIM Management Group, Inc.); Assistant Secretary, INVESCO Asset Management (Bermuda) Ltd.; Secretary and General Counsel, Invesco Private Capital, Inc.; Assistant Secretary and General Counsel, INVESCO Realty, Inc.; Secretary and General Counsel, Invesco Senior Secured Management, Inc.; Secretary, Sovereign G./P. Holdings Inc.; Secretary, Invesco Indexing LLC; and Secretary, W.L. Ross & Co., LLC | | 164 | | None |
Douglas Sharp1 – 1974 Trustee | | 2024 | | Senior Managing Director and Head of Americas & EMEA, Invesco Ltd. Formerly: Director and Chairman Invesco UK Limited; Director, Chairman and Chief Executive, Invesco Fund Managers Limited | | 164 | | None |
| 1 | Mr. Kupor and Mr. Sharp are considered interested persons (within the meaning of Section 2(a)(19) of the 1940 Act) of the Trust because they are officers of the Adviser to the Trust, and officers of Invesco Ltd., ultimate parent of the Adviser. |
| | |
| T-1 | | Invesco Dividend Income Fund |
Trustees and Officers–(continued)
| | | | | | | | |
Name, Year of Birth and
Position(s) Held with the Trust | | Trustee and/or Officer Since | | Principal Occupation(s) During Past 5 Years | | Number of
Funds in Fund
Complex
Overseen by
Trustee | | Other Directorship(s) Held by Trustee During At Least The Past 5 Years |
| Independent Trustees | | | | |
Beth Ann Brown – 1968
Trustee (2019) and Chair (2022) | | 2019 | | Independent Consultant Formerly: Head of Intermediary Distribution, Managing Director, Strategic Relations, Managing Director, Head of National Accounts, Senior Vice President, National Account Manager and Senior Vice President, Key Account Manager, Columbia Management Investment Advisers LLC; and Vice President, Key Account Manager, Liberty Funds Distributor, Inc. | | 164 | | Director, Board of Directors of Caron Engineering Inc.; Formerly: Advisor, Board of Advisors of Caron Engineering Inc.; President and Director, Acton Shapleigh Youth Conservation Corps (non-profit); President and Director Director of Grahamtastic Connection (non-profit); and Trustee of certain Oppenheimer Funds |
Carol Deckbar – 1962
Trustee | | 2024 | | Formerly: Executive Vice President and Chief Product Officer, TIAA Financial Services; Executive Vice President and Principal, College Retirement Equities Fund at TIAA; Executive Vice President and Head of Institutional Investments and Endowment Services, TIAA | | 164 | | Formerly: Board Member, TIAA Asset Management, Inc.; and Board Member, TH Real Estate Group Holdings Company |
Cynthia Hostetler –1962
Trustee | | 2017 | | Non-Executive Director and Trustee of a number of public and private business corporations Formerly: Director, Aberdeen Investment Funds (4 portfolios); Director, Artio Global Investment LLC (mutual fund complex); Director, Edgen Group, Inc. (specialized energy and infrastructure products distributor); Director, Genesee & Wyoming, Inc. (railroads); Head of Investment Funds and Private Equity, Overseas Private Investment Corporation; President, First Manhattan Bancorporation, Inc.; and Attorney, Simpson Thacher & Bartlett LLP | | 164 | | Resideo Technologies, Inc. (smart home technology); Vulcan Materials Company (construction materials company); Trilinc Global Impact Fund; Investment Company Institute (professional organization); and Independent Directors Council (professional organization) |
Eli Jones – 1961
Trustee | | 2016 | | Professor and Dean Emeritus, Mays Business School - Texas A&M University Formerly: Dean of Mays Business School-Texas A&M University; Professor and Dean, Walton College of Business, University of Arkansas and E.J. Ourso College of Business, Louisiana State University; and Director, Arvest Bank | | 164 | | Insperity, Inc. (formerly known as Administaff) (human resources provider); Board Member of the regional board, First Financial Bank Texas; and Boad Member, First Financial Bankshares, Inc. Texas |
Elizabeth Krentzman – 1959
Trustee | | 2019 | | Formerly: Principal and Chief Regulatory Advisor for Asset Management Services and U.S. Mutual Fund Leader of Deloitte & Touche LLP; General Counsel of the Investment Company Institute (trade association); National Director of the Investment Management Regulatory Consulting Practice, Principal, Director and Senior Manager of Deloitte & Touche LLP; Assistant Director of the Division of Investment Management - Office of Disclosure and Investment Adviser Regulation of the U.S. Securities and Exchange Commission and various positions with the Division of Investment Management – Office of Regulatory Policy of the U.S. Securities and Exchange Commission; and Associate at Ropes & Gray LLP | | 164 | | Formerly: Member of the Cartica Funds Board of Directors (private investment fund); Trustee of the University of Florida National Board Foundation; Member of the University of Florida Law Center Association, Inc. Board of Trustees, Audit Committee and Membership Committee; and Trustee of certain Oppenheimer Funds |
Anthony J. LaCava, Jr. – 1956
Trustee | | 2019 | | Formerly: Director and Member of the Audit Committee, Blue Hills Bank (publicly traded financial institution) and Managing Partner, KPMG LLP | | 164 | | Member and Chairman, of the Bentley University, Business School Advisory Council; Formerly: Board Member and Chair of the Audit and Finance Committee and Nominating Committee, KPMG LLP |
James “Jim” Liddy – 1959
Trustee | | 2024 | | Formerly: Chairman, Global Financial Services, Americas and Retired Partner, KPMG LLP | | 164 | | Director and Treasurer, Gulfside Place Condominium Association, Inc. and Non-Executive Director, Kellenberg Memorial High School |
| | |
| T-2 | | Invesco Dividend Income Fund |
Trustees and Officers–(continued)
| | | | | | | | |
Name, Year of Birth and
Position(s) Held with the Trust | | Trustee and/or Officer Since | | Principal Occupation(s) During Past 5 Years | | Number of
Funds in Fund Complex
Overseen by
Trustee | | Other Directorship(s) Held by Trustee During At Least The Past 5 Years |
| Independent Trustees–(continued) |
Prema Mathai-Davis – 1950
Trustee | | 2003 | | Formerly: Co-Founder & Partner of Quantalytics Research, LLC, (a FinTech Investment Research Platform for the Self-Directed Investor); Trustee of YWCA Retirement Fund; CEO of YWCA of the USA; Board member of the NY Metropolitan Transportation Authority; Commissioner of the NYC Department of Aging; and Board member of Johns Hopkins Bioethics Institute | | 164 | | Member of Board of Positive Planet US (non-profit) and HealthCare Chaplaincy Network (non-profit) |
Joel W. Motley – 1952 Trustee | | 2019 | | Director of Office of Finance, Federal Home Loan Bank System; Managing Director of Carmona Motley Inc. (privately held financial advisor); Member of the Council on Foreign Relations and its Finance and Budget Committee; Chairman Emeritus of Board of Human Rights Watch and Member of its Investment Committee; and Member of Investment Committee Board of Historic Hudson Valley (non-profit cultural organization); and Member of the Vestry and the Investment Committee of Trinity Church Wall Street. Formerly: Managing Director of Public Capital Advisors, LLC (privately held financial advisor); Managing Director of Carmona Motley Hoffman, Inc. (privately held financial advisor); and Director of Columbia Equity Financial Corp. (privately held financial advisor) | | 164 | | Member of Board of Trust for Mutual Understanding (non-profit promoting the arts and environment); Member of Board of Greenwall Foundation (bioethics research foundation) and its Investment Committee; Member of Board of Friends of the LRC (non- profit legal advocacy); and Board Member and Investment Committee Member of Pulitzer Center for Crisis Reporting (non-profit journalism); and Trustee of certain Oppenheimer Funds; |
Teresa M. Ressel – 1962 Trustee | | 2017 | | Non-executive director and trustee of a number of public and private business corporations Formerly: Chief Executive Officer, UBS Securities LLC (investment banking); Group Chief Operating Officer, UBS AG Americas (investment banking); Sr. Management Team Olayan America, The Olayan Group (international investor/commercial/industrial); and Assistant Secretary for Management & Budget and Designated Chief Financial Officer, U.S. Department of Treasury | | 164 | | None |
Robert C. Troccoli – 1949 Trustee | | 2016 | | Formerly: Adjunct Professor, University of Denver – Daniels College of Business; and Managing Partner, KPMG LLP | | 164 | | None |
Daniel S. Vandivort –1954 Trustee | | 2019 | | President, Flyway Advisory Services LLC (consulting and property management) and Member, Investment Committee of Historic Charleston Foundation Formerly: President and Chief Investment Officer, previously Head of Fixed Income, Weiss Peck and Greer/Robeco Investment Management; Trustee and Chair, Weiss Peck and Greer Funds Board; and various capacities at CS First Boston including Head of Fixed Income at First Boston Asset Management. | | 164 | | Formerly: Trustee and Governance Chair, Oppenheimer Funds; Treasurer, Chairman of the Audit and Finance Committee, Huntington Disease Foundation of America |
| | |
| T-3 | | Invesco Dividend Income Fund |
Trustees and Officers–(continued)
| | | | | | | | |
Name, Year of Birth and
Position(s)
Held with the Trust | | Trustee and/or Officer Since | | Principal Occupation(s) During Past 5 Years | | Number of
Funds in Fund Complex
Overseen by
Trustee | | Other Directorship(s) Held by Trustee During At Least The Past 5 Years |
| Officers | | | | |
| Glenn Brightman – 1972 President and Principal Executive Officer | | 2023 | | Chief Operating Officer, Americas, Invesco Ltd.; Senior Vice President, Invesco Advisers, Inc.; President and Principal Executive Officer, The Invesco Funds; Manager, Invesco Investment Advisers LLC. Formerly: Global Head of Finance, Invesco Ltd; Executive Vice President and Chief Financial Officer, Nuveen | | N/A | | N/A |
Melanie Ringold – 1975 Senior Vice President, Chief Legal Officer and Secretary | | 2023 | | Head of Legal of the Americas, Invesco Ltd.; Senior Vice President and Secretary, Invesco Advisers, Inc. (formerly known as Invesco Institutional (N.A.), Inc.) (registered investment adviser); Secretary, Invesco Distributors, Inc. (formerly known as Invesco AIM Distributors, Inc.); Secretary, Invesco Investment Services, Inc. (formerly known as Invesco AIM Investment Services, Inc.); Senior Vice President, Chief Legal Officer and Secretary, The Invesco Funds; Secretary, Invesco Investment Advisers LLC, Invesco Capital Markets, Inc.; Chief Legal Officer, Invesco Exchange-Traded Fund Trust, Invesco Exchange-Traded Fund Trust II, Invesco India Exchange-Traded Fund Trust, Invesco Actively Managed Exchange-Traded Fund Trust, Invesco Actively Secretary and Vice President, Harbourview Asset Management Corporation; Secretary and Senior Vice President, OppenheimerFunds, Inc. and Invesco Managed Accounts, LLC; Secretary and Senior Vice President, Oppenheimer Acquisition Corp.; Secretary, SteelPath Funds Remediation LLC; and Secretary and Senior Vice President, Trinity Investment Management Corporation Formerly: Secretary and Senior Vice President, OFI SteelPath, Inc., Assistant Secretary, Invesco Distributors, Inc., Invesco Advisers, Inc., Invesco Investment Services, Inc., Invesco Capital Markets, Inc., Invesco Capital Management LLC and Invesco Investment Advisers LLC; and Assistant Secretary and Assistant Vice President, Invesco Funds | | N/A | | N/A |
John M. Zerr – 1962 Senior Vice President | | 2006 | | Chief Operating Officer of the Americas; Senior Vice President, Invesco Advisers, Inc. (formerly known as Invesco Institutional (N.A.), Inc.) (registered investment adviser); Senior Vice President, Invesco Distributors, Inc. (formerly known as Invesco AIM Distributors, Inc.); Director and Vice President, Invesco Investment Services, Inc. (formerly known as Invesco AIM Investment Services, Inc.) Senior Vice President, The Invesco Funds; Managing Director, Invesco Capital Management LLC; Senior Vice President, Invesco Capital Markets, Inc. (formerly known as Van Kampen Funds Inc.); Manager, Invesco Specialized Products, LLC; Member, Invesco Canada Funds Advisory Board; Director, President and Chief Executive Officer, Invesco Corporate Class Inc. (corporate mutual fund company); Director, Chairman, President and Chief Executive Officer, Invesco Canada Ltd. (formerly known as Invesco Trimark Ltd./Invesco Trimark Ltèe) (registered investment adviser and registered transfer agent); President, Invesco, Inc.; President, Invesco Global Direct Real Estate Feeder GP Ltd.; President, Invesco IP Holdings (Canada) Ltd; President, Invesco Global Direct Real Estate GP Ltd.; and President Invesco Financial Services Ltd. / Services Financiers Invesco Ltée Formerly: Director and Chairman, Invesco Trust Company, Manager, Invesco Indexing LLC; Director, Invesco Investment Advisers LLC (formerly known as Van Kampen Asset Management); President, Trimark Investments Ltd/Services Financiers Invesco Ltee; Director and Senior Vice President, Invesco Insurance Agency, Inc.; Director and Senior Vice President, Invesco Management Group, Inc. (formerly known as Invesco AIM Management Group, Inc.); Secretary and General Counsel, Invesco Management Group, Inc. (formerly known as Invesco AIM Management Group, Inc.); Secretary, Invesco Investment Services, Inc. (formerly known as Invesco AIM Investment Services, Inc.); Chief Legal Officer and Secretary, The Invesco Funds; Secretary and General Counsel, Invesco Investment Advisers LLC (formerly known as Van Kampen Asset Management); Secretary and General Counsel, Invesco Capital Markets, Inc. (formerly known as Van Kampen Funds Inc.); Chief Legal Officer, Invesco Exchange-Traded Fund Trust, Invesco Exchange-Traded Fund Trust II, Invesco India Exchange-Traded Fund Trust, Invesco Actively Managed Exchange-Traded Fund Trust, Invesco Actively Managed Exchange-Traded Commodity Fund Trust and Invesco Exchange-Traded Self-Indexed Fund Trust; Secretary, Invesco Indexing LLC; Director, Secretary, General Counsel and Senior Vice President, Van Kampen Exchange Corp.; Director, Vice President and Secretary, IVZ Distributors, Inc. (formerly known as INVESCO Distributors, Inc.); Director and Vice President, INVESCO Funds Group, Inc.; Director and Vice President, Van Kampen Advisors Inc.; Director, Vice President, Secretary and General Counsel, Van Kampen Investor Services Inc.;Director and Secretary, Invesco Distributors, Inc. (formerly known as Invesco AIM Distributors, Inc.); Director, Senior Vice President, General Counsel and Secretary, Invesco AIM Advisers, Inc. and Van Kampen Investments Inc.; Director, Vice President and Secretary, Fund Management Company; Director, Senior Vice President, Secretary, General Counsel and Vice President, Invesco AIM Capital Management, Inc.; and Chief Operating Officer and General Counsel, Liberty Ridge Capital, Inc. (an investment adviser) | | N/A | | N/A |
| | |
| T-4 | | Invesco Dividend Income Fund |
Trustees and Officers–(continued)
| | | | | | | | |
Name, Year of Birth and
Position(s) Held with the Trust | | Trustee and/or Officer Since | | Principal Occupation(s) During Past 5 Years | | Number of
Funds in Fund Complex
Overseen by
Trustee | | Other Directorship(s) Held by Trustee During At Least The Past 5 Years |
| Officers–(continued) | | | | | | | | |
Tony Wong – 1973 Senior Vice President | | 2023 | | Senior Managing Director, Invesco Ltd.; Director, Chairman, Chief Executive Officer and President, Invesco Advisers, Inc.; Director and Chairman, Invesco Private Capital, Inc., INVESCO Private Capital Investments, Inc. and INVESCO Realty, Inc.; Director, Invesco Senior Secured Management, Inc.; President, Invesco Managed Accounts, LLC and SNW Asset Management Corporation; and Senior Vice President, The Invesco Funds Formerly: Assistant Vice President, The Invesco Funds; and Vice President, Invesco Advisers, Inc. | | N/A | | N/A |
Stephanie C. Butcher – 1971
Senior Vice President | | 2023 | | Senior Managing Director, Invesco Ltd.; Senior Vice President, The Invesco Funds; Director and Chief Executive Officer, Invesco Asset Management Limited | | N/A | | N/A |
Adrien Deberghes - 1967 Principal Financial Officer,
Treasurer and Senior Vice
President | | 2020 | | Head of the Fund Office of the CFO and Fund Administration; Vice President, Invesco Advisers, Inc.; Director, Invesco Trust Company; Principal Financial Officer, Treasurer and Senior Vice President, The Invesco Funds; Vice President, Invesco Exchange-Traded Fund Trust, Invesco Exchange-Traded Fund Trust II, Invesco India Exchange-Traded Fund Trust, Invesco Actively Managed Exchange-Traded Fund Trust, Invesco Actively Managed Exchange-Traded Commodity Fund Trust and Invesco Exchange-Traded Self-Indexed Fund Trust Formerly: Vice President, The Invesco Funds; Senior Vice President and Treasurer, Fidelity Investments | | N/A | | N/A |
Crissie M. Wisdom – 1969 Anti-Money Laundering
Compliance Officer | | 2013 | | Anti-Money Laundering and OFAC Compliance Officer for Invesco U.S. entities including: Invesco Advisers, Inc. and its affiliates, Invesco Capital Markets, Inc., Invesco Distributors, Inc., Invesco Investment Services, Inc., The Invesco Funds, Invesco Capital Management, LLC, Invesco Trust Company; and Fraud Prevention Manager for Invesco Investment Services, Inc. | | N/A | | N/A |
Todd F. Kuehl – 1969 Chief Compliance Officer and
Senior Vice President | | 2020 | | Chief Compliance Officer, Invesco Advisers, Inc. (registered investment adviser); and Chief Compliance Officer and Senior Vice President, The Invesco Funds Formerly: Managing Director and Chief Compliance Officer, Legg Mason (Mutual Funds); Chief Compliance Officer, Legg Mason Private Portfolio Group (registered investment adviser) | | N/A | | N/A |
James Bordewick, Jr. – 1959 Senior Vice President and Senior Officer | | 2022 | | Senior Vice President and Senior Officer, The Invesco Funds Formerly: Chief Legal Officer, KingsCrowd, Inc. (research and analytical platform for investment in private capital markets); Chief Operating Officer and Head of Legal and Regulatory, Netcapital (private capital investment platform); Managing Director, General Counsel of asset management and Chief Compliance Officer for asset management and private banking, Bank of America Corporation; Chief Legal Officer, Columbia Funds and BofA Funds; Senior Vice President and Associate General Counsel, MFS Investment Management; Chief Legal Officer, MFS Funds; Associate, Ropes & Gray; and Associate, Gaston Snow & Ely Bartlett | | N/A | | N/A |
The Statement of Additional Information of the Trust includes additional information about the Fund’s Trustees and is available upon request, without charge, by calling 1.800.959.4246. Please refer to the Fund’s Statement of Additional Information for information on the Fund’s sub-advisers.
| | | | | | |
| Office of the Fund | | Investment Adviser | | Distributor | | Auditors |
| 11 Greenway Plaza | | Invesco Advisers, Inc. | | Invesco Distributors, Inc. | | PricewaterhouseCoopers LLP |
| Houston, TX 77046-1173 | | 1331 Spring Street, NW, Suite 2500 | | 11 Greenway Plaza | | 1000 Louisiana Street, Suite 5800 |
| | Atlanta, GA 30309 | | Houston, TX 77046-1173 | | Houston, TX 77002-5021 |
| | | |
| Counsel to the Fund | | Counsel to the Independent Trustees | | Transfer Agent | | Custodian |
| Stradley Ronon Stevens & Young, LLP | | Sidley Austin LLP | | Invesco Investment Services, Inc. | | State Street Bank and Trust Company |
| 2005 Market Street, Suite 2600 | | 787 Seventh Avenue | | 11 Greenway Plaza | | 225 Franklin Street |
| Philadelphia, PA 19103-7018 | | New York, NY 10019 | | Houston, TX 77046-1173 | | Boston, MA 02110-2801 |
| | |
| T-5 | | Invesco Dividend Income Fund |
Proxy Results
A Special Joint Meeting (“Meeting”) of Shareholders of AIM Sector Funds (Invesco Sector Funds), a Delaware statutory trust (“Trust”), was held on January 16, 2024. The Meeting was held for the following purpose:
| (1) | Elect 14 trustees to the Board of Trustees of the Trust, each of whom will serve until his or her successor is duly elected and qualified. |
The results of the voting on the above matter were as follows:
| | | | | | | | | | |
| | | Matter | | Votes For | | | Votes
Against/Withheld | |
|
| |
| (1)* | | Beth Ann Brown | | | 595,446,022.84 | | | | 16,915,661.31 | |
| | Carol Deckbar | | | 595,102,087.25 | | | | 17,259,596.89 | |
| | Cynthia Hostetler | | | 595,359,921.21 | | | | 17,001,762.94 | |
| | Dr. Eli Jones | | | 594,949,311.14 | | | | 17,412,373.00 | |
| | Elizabeth Krentzman | | | 595,453,833.65 | | | | 16,907,850.50 | |
| | Jeffrey H. Kupor | | | 595,342,690.51 | | | | 17,018,993.64 | |
| | Anthony J. LaCava, Jr. | | | 595,293,865.38 | | | | 17,067,818.77 | |
| | James Liddy | | | 594,980,026.97 | | | | 17,381,657.17 | |
| | Dr. Prema Mathai-Davis | | | 594,031,204.04 | | | | 18,330,480.11 | |
| | Joel W. Motley | | | 594,381,710.91 | | | | 17,979,973.23 | |
| | Teresa M. Ressel | | | 595,821,958.43 | | | | 16,539,725.72 | |
| | Douglas Sharp | | | 595,715,711.66 | | | | 16,645,972.48 | |
| | Robert C. Troccoli | | | 594,748,318.91 | | | | 17,613,365.24 | |
| | Daniel S. Vandivort | | | 595,002,691.19 | | | | 17,358,992.96 | |
| * | Proposal 1 required approval by a combined vote of all the portfolios of AIM Sector Funds (Invesco Sector Funds). |
| | |
| T-6 | | Invesco Dividend Income Fund |

Go paperless with eDelivery
Visit invesco.com/edelivery to enjoy the convenience and security of anytime electronic access to your investment documents.
With eDelivery, you can elect to have any or all of the following materials delivered straight to your inbox to download, save and print from your own computer:
∎ Fund reports and prospectuses
∎ Quarterly statements
∎ Daily confirmations
∎ Tax forms
Invesco mailing information
Send general correspondence to Invesco Investment Services, Inc., P.O. Box 219078, Kansas City, MO 64121-9078.
Important notice regarding delivery of security holder documents
To reduce Fund expenses, only one copy of most shareholder documents may be mailed to shareholders with multiple accounts at the same address (Householding). Mailing of your shareholder documents may be householded indefinitely unless you instruct us otherwise. If you do not want the mailing of these documents to be combined with those for other members of your household, please contact Invesco Investment Services, Inc. at 800 959 4246 or contact your financial institution. We will begin sending you individual copies for each account within 30 days after receiving your request.
Fund holdings and proxy voting information
The Fund provides a complete list of its portfolio holdings four times each year, at the end of each fiscal quarter. For the second and fourth quarters, the list appears, respectively, in the Fund’s semiannual and annual reports to shareholders. For the first and third quarters, the Fund files the list with the Securities and Exchange Commission (SEC) as an exhibit to its reports on Form N-PORT. The most recent list of portfolio holdings is available at invesco.com/completeqtrholdings. Shareholders can also look up the Fund’s Form N-PORT filings on the SEC website, sec.gov. The SEC file numbers for the Fund are shown below.
A description of the policies and procedures that the Fund uses to determine how to vote proxies relating to portfolio securities is available without charge, upon request, from our Client Services department at 800 959 4246, or at invesco.com/ corporate/about-us/esg. The information is also available on the SEC website, sec.gov.
Information regarding how the Fund voted proxies related to its portfolio securities during the most recent 12-month period ended June 30 is available at invesco.com/proxysearch. This information is also available on the SEC website, sec.gov.
Invesco Advisers, Inc. is an investment adviser; it provides investment advisory services to individual and institutional clients and does not sell securities. Invesco Distributors, Inc. is the US distributor for Invesco Ltd.’s retail mutual funds, exchange-traded funds and institutional money market funds. Both are wholly owned, indirect subsidiaries of Invesco Ltd.
| | | | |
| SEC file number(s): 811-03826 and 002-85905 | | Invesco Distributors, Inc. | | I-DIVI-AR-1 |

| | |
| | |
| Annual Report to Shareholders | | April 30, 2024 |
Invesco Energy Fund
Nasdaq:
A: IENAX ∎ C: IEFCX ∎ Y: IENYX ∎ Investor: FSTEX ∎ R5: IENIX ∎ R6: IENSX
Beginning in July 2024, amendments adopted by the Securities and Exchange Commission will substantially impact the design, content, and delivery of shareholder reports. These newly designed shareholder reports will highlight key fund information in a clear and concise format and must be mailed to each shareholder that has not elected to receive the reports electronically. Other information, including financial statements, will no longer be included in the shareholder report but will be available at invesco.com/reports, delivered upon request, and filed on a semi-annual basis on Form N-CSR.
If you would like to receive shareholder reports and other communications electronically instead of by mail, you may make that request by contacting your financial intermediary (such as a broker-dealer or bank) or, if you are a direct investor, by enrolling at invesco.com/edelivery. If you do not make this request or enroll in e-delivery, you will receive future shareholder reports and other communications by mail.
Management’s Discussion of Fund Performance
| | | | |
| |
Performance summary | |
For the fiscal year ended April 30, 2024, Class A shares of Invesco Energy Fund (the Fund), at net asset value (NAV), outperformed the MSCI World Energy Index, the Fund’s style-specific benchmark. | |
Your Fund’s long-term performance appears later in this report. | |
| |
Fund vs. Indexes | |
Total returns, 4/30/23 to 4/30/24, at net asset value (NAV). Performance shown does not include applicable contingent deferred sales charges (CDSC) or front-end sales charges, which would have reduced performance. | |
Class A Shares | | | 13.03 | % |
Class C Shares | | | 12.20 | |
Class Y Shares | | | 13.29 | |
Investor Class Shares | | | 13.05 | |
Class R5 Shares | | | 13.42 | |
Class R6 Shares | | | 13.50 | |
S&P 500 Index▼ (Broad Market Index) | | | 22.66 | |
MSCI World Energy Index▼ (Style-Specific Index) | | | 12.58 | |
Lipper Natural Resource Funds Index∎ (Peer Group Index) | | | 17.14 | |
| |
Source(s): ▼RIMES Technologies Corp.; ∎Lipper Inc. | | | | |
Market conditions and your Fund
The US economy and equity markets remained resilient in the second quarter of 2023, as milder inflation data and better-than-expected corporate earnings supported equities, with most major indexes posting gains for the quarter and with some big tech names providing optimistic future guidance. Following the March 2023 banking crisis, markets stabilized in April, as corporate earnings season got underway with many companies exceeding earnings and revenue estimates. Facing persistently strong employment data, the US Federal Reserve (the Fed) raised the federal funds rate by 0.25% at its May 2023 meeting,1 but left rates unchanged at its June meeting, giving investors the long-awaited “pause” in rate hikes, which sent equities broadly higher.
Equity markets declined in the third quarter and into October 2023 as a resilient US economy complicated the Fed’s efforts to tame inflation. While inflation has slowed from its peak in 2022, in July 2023, the Consumer Price Index (CPI) rose by 0.2% and the 12-month headline inflation rate rose to 3.2% from 3% in June.2 Due to the persistence of inflation, the Fed raised the federal funds rate again in July by 0.25%.1 The CPI data released in September was higher-than-expected and the overall US labor market remained tight with unemployment near historic lows. At the same time the third quarter year-over-year Gross Domestic Product (GDP) estimate was 4.9%, far above expectations.2 Despite the higher-than-expected GDP for the third quarter of 2023, the Fed held interest rates steady at its September and October meetings, but left open the possibility of another rate hike before the end of the calendar year.1
US equity markets posted strong gains in the fourth quarter of 2023 as investors
anticipated the potential end of interest rate hikes by the Fed. Inflation slowed during the period as the CPI 12-month headline inflation rate fell to 3.1% in November from 3.7% in September, significantly below the 2022 peak of 9.1%.2 The Fed kept rates steady at its mid-December meeting and indicated that three rate cuts are expected in 2024. Fed chairman Powell noted that “the Fed’s policy rate is likely at or near its peak for this tightening cycle,“1 which prompted a strong equity rally into 2023 year-end and the yield on the 10-year US Treasury to fall from nearly 5% in October to below 4%.3
US equity markets rallied in the first quarter of 2024. In February, the S&P 500 Index closed above the 5,000 milestone for the first time.3 The US economy defied recession predictions, achieving a growth rate of 2.5% in 2023 and the labor market remained robust, with continued payroll gains and unemployment still historically low – below 4%.2 Inflation, however, remained persistent. January and February increases in the CPI were higher than expected, leading the Fed to defer its proposed interest rate cuts to the second half of 2024.1 Still, investors were mostly pleased by corporate earnings growth, except for three of the so-called “Magnificent Seven” stocks. Apple, Alphabet and Tesla’s stock prices suffered due to disappointing earnings, sales and revenue, or weak forward guidance. Although the stock market had a strong start in 2024, the stock market retreated in April. As consumer spending and a strong labor market were driving economic activity, inflation and interest rate concerns persisted and investors feared another delay in expected rate cuts by the Fed, or worse, rate hikes.
Despite continued higher rates and increased market volatility, US stocks for the fiscal year had strong positive returns of 22.66%, as measured by the S&P 500 Index.4
The period from May 2023 to April 2024 was marked by significant developments in the oil and energy sectors. Oil prices experienced volatility, with Brent crude futures reaching a six-month high of $90/BBL (barrel of crude oil) in early April 2024, influenced by geopolitical tensions and OPEC in addition to output cuts.3 The average price for Brent crude was projected to decline from $83/BBL in 2023 to $78/BBL in 2024, down from $101/BBL in 2022, as global oil production was expected to outpace consumption.5 In the energy sector, renewable capacity additions saw an unprecedented increase by nearly 50% in 2023, driven largely by China’s solar market growth.5 The American Clean Power Association reported a 28% year-over-year increase in new clean power capacity in the first quarter of 2024, with significant milestones such as the commissioning of the South Fork Wind project.6 These trends reflect a dynamic period where the energy transition and market forces are reshaping the landscape, with renewable energy sources gaining momentum and oil markets adjusting to new realities of supply and demand.
On the positive side, stock selection within integrated oil and gas and exploration and production companies were large contributors. Suncor Energy and ConocoPhillips were top contributors on a relative and absolute basis. Within oil and gas refining and marketing, owning Marathon Petroleum and not owning Neste were top contributors to relative return versus the style-specific benchmark. Not owning oil and gas equipment services company, Schlumberger also contributed to relative return, as the stock materially underperformed for the fiscal year.
On the negative side, owning utilities company Dominion Energy was a key detractor to absolute and relative return. In the materials sector, owning CF Industries, a chemical and fertilizer company, and metals and mining companies, Southern Copper and Glen-core, were detractors to relative return. Cash also detracted from relative returns, as expected in a strong equity market.
We continue to focus on companies with solid balance sheets and free cash flow, trading at a relatively low valuation. We remain cautiously optimistic about the longer-term outlook for the US and global economies. Investors are focusing on the Fed’s response to inflation hoping for rate cuts in 2024. Geopolitical risks from the Russia/Ukraine and Israel/Hamas wars are also major concerns, particularly if these wars spread to other countries in Eastern Europe and the Middle East. Given these factors, we believe stocks are likely to see continued volatility for the foreseeable future. In our view, market volatility may create opportunities for patient, disciplined long-term investors.
While oil prices may be headline news, the Fund should be considered a long-term investment. As always, thank you for your continued investment in Invesco Energy Fund.
| 1 | Source: US Federal Reserve |
| 2 | Source: US Bureau of Labor Statistics |
| 4 | Source: Morningstar Direct |
| 5 | Source: US Energy Information Administration |
| 6 | Source: American Clean Power – |
Portfolio manager(s):
Kevin Holt - Lead
Umang Khetan
The views and opinions expressed in management’s discussion of Fund performance are those of Invesco Advisers, Inc. and its affiliates. These views and opinions are subject to change at any time based on factors such as market and economic conditions. These views and opinions may not be relied upon as investment advice or recommendations, or as an offer for a particular security. The information is not a complete analysis of every aspect of any market, country, industry, security or the Fund. Statements of fact are from sources considered reliable, but Invesco Advisers, Inc. makes no representation or warranty as to their completeness or accuracy. Although historical performance is no guarantee of future results, these insights may help you understand our investment management philosophy.
See important Fund and, if applicable, index disclosures later in this report.
Your Fund’s Long-Term Performance
Results of a $10,000 Investment – Oldest Share Class(es)
Fund and index data from 4/30/14
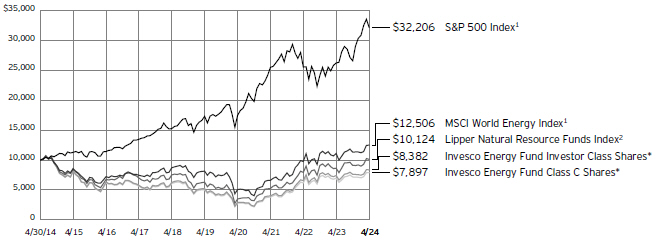
| 1 | Source: RIMES Technologies Corp. |
| * | It is Invesco’s policy to chart the Fund’s oldest share class(es). Because Investor Class shares do not have a sales charge, we also show the oldest share class with a sales charge, Class C shares. |
Past performance cannot guarantee future results.
The data shown in the chart include reinvested distributions, applicable sales charges and Fund expenses including management
fees. Index results include reinvested dividends, but they do not reflect sales charges. Performance of the peer group, if applicable, reflects fund expenses and management fees;
performance of a market index does not. Performance shown in the chart does not reflect deduction of taxes a shareholder would pay on Fund distributions or sale of Fund shares.
| | | | |
| |
Average Annual Total Returns | |
As of 4/30/24, including maximum applicable sales charges | |
| |
Class A Shares | | | | |
Inception (3/28/02) | | | 5.43 | % |
10 Years | | | -2.31 | |
5 Years | | | 8.66 | |
1 Year | | | 6.81 | |
| |
Class C Shares | | | | |
Inception (2/14/00) | | | 6.58 | % |
10 Years | | | -2.33 | |
5 Years | | | 9.10 | |
1 Year | | | 11.20 | |
| |
Class Y Shares | | | | |
Inception (10/3/08) | | | 2.32 | % |
10 Years | | | -1.51 | |
5 Years | | | 10.18 | |
1 Year | | | 13.29 | |
| |
Investor Class Shares | | | | |
Inception (1/19/84) | | | 6.99 | % |
10 Years | | | -1.75 | |
5 Years | | | 9.91 | |
1 Year | | | 13.05 | |
| |
Class R5 Shares | | | | |
Inception (1/31/06) | | | 2.02 | % |
10 Years | | | -1.33 | |
5 Years | | | 10.39 | |
1 Year | | | 13.42 | |
| |
Class R6 Shares | | | | |
10 Years | | | -1.42 | % |
5 Years | | | 10.45 | |
1 Year | | | 13.50 | |
Class R6 shares incepted on April 4, 2017. Performance shown prior to that date is that of Class A shares at net asset value and includes the 12b-1 fees applicable to Class A shares.
The performance data quoted represent past performance and cannot guarantee future results; current performance may be lower or higher. Please visit invesco.com/performance for the most recent month-end performance. Performance figures reflect reinvested distributions, changes in net asset value and the effect of the maximum sales charge unless otherwise stated. Performance figures do not reflect deduction of taxes a shareholder would pay on Fund distributions or sale of Fund shares. Investment return and principal value will fluctuate so that you may have a gain or loss when you sell shares.
Class A share performance reflects the maximum 5.50% sales charge, and Class C share performance reflects the applicable contingent deferred sales charge (CDSC) for the period involved. The CDSC on Class C shares is 1% for the first year after purchase. Class Y, Investor Class, Class R5 and Class R6 shares do not have a front-end sales charge or a CDSC; therefore, performance is at net asset value.
The performance of the Fund’s share classes will differ primarily due to different sales charge structures and class expenses.
Fund performance reflects any applicable fee waivers and/or expense reimbursements. Had the adviser not waived fees and/or reimbursed expenses currently or in the past, returns would have been lower. See current prospectus for more information.
Supplemental Information
Invesco Energy Fund’s investment objective is long-term growth of capital.
| ∎ | Unless otherwise stated, information presented in this report is as of April 30, 2024, and is based on total net assets. |
| ∎ | Unless otherwise noted, all data is provided by Invesco. |
| ∎ | To access your Fund’s reports/prospectus, visit invesco.com/fundreports. |
About indexes used in this report
| ∎ | The S&P 500® Index is an unmanaged index considered representative of the US stock market. |
| ∎ | The MSCI World Energy Index is designed to capture the performance of energy stocks across developed market countries. The index is computed using the net return, which withholds applicable taxes for non-resident investors. |
| ∎ | The Lipper Natural Resource Funds Index is an unmanaged index considered representative of natural resource funds tracked by Lipper. |
| ∎ | The Fund is not managed to track the performance of any particular index, including the index(es) described here, and consequently, the performance of the Fund may deviate significantly from the performance of the index(es). |
| ∎ | A direct investment cannot be made in an index. Unless otherwise indicated, index results include reinvested dividends, and they do not reflect sales charges. Performance of the peer group, if applicable, reflects fund expenses; performance of a market index does not. |
Liquidity Risk Management Program
| | In compliance with Rule 22e-4 under the Investment Company Act of 1940, as amended (the “Liquidity Rule”), the Fund has adopted and implemented a liquidity risk management program in accordance with the Liquidity Rule (the “Program”). The Program is reasonably designed to assess and manage the Fund’s liquidity risk, which is the risk that the Fund could not meet redemption requests without significant dilution of remaining investors’ interests in the Fund. The Board of Trustees of the Fund (the “Board”) has appointed Invesco Advisers, Inc. (“Invesco”), the Fund’s investment adviser, as the Program’s administrator, and Invesco has delegated oversight of the Program to the Liquidity Risk Management Committee (the “Committee”), which is composed of senior representatives from relevant business groups at Invesco. |
| | As required by the Liquidity Rule, the Program includes policies and procedures providing for an assessment, no less frequently |
than annually, of the Fund’s liquidity risk that takes into account, as relevant to the Fund’s liquidity risk: (1) the Fund’s investment strategy and liquidity of portfolio investments during both normal and reasonably foreseeable stressed conditions; (2) short-term and long-term cash flow projections for the Fund during both normal and reasonably foreseeable stressed conditions; and (3) the Fund’s holdings of cash and cash equivalents and any borrowing arrangements. The Liquidity Rule also requires the classification of the Fund’s investments into categories that reflect the assessment of their relative liquidity under current market conditions. The Fund classifies its investments into one of four categories defined in the Liquidity Rule: “Highly Liquid,” “Moderately Liquid,” “Less Liquid,” and “Illiquid.” Funds that are not invested primarily in “Highly Liquid Investments” that are assets (cash or investments that are reasonably expected to be convertible into cash within three business days without significantly changing the market value of the investment) are required to establish a “Highly Liquid Investment Minimum” (“HLIM”), which is the minimum percentage of net assets that must be invested in Highly Liquid Investments. Funds with HLIMs have procedures for addressing HLIM shortfalls, including reporting to the Board and the SEC (on a non-public basis) as required by the Program and the Liquidity Rule. In addition, the Fund may not acquire an investment if, immediately after the acquisition, over 15% of the Fund’s net assets would consist of “Illiquid Investments” that are assets (an investment that cannot reasonably be expected to be sold or disposed of in current market conditions in seven calendar days or less without the sale or disposition significantly changing the market value of the investment). The Liquidity Rule and the Program also require reporting to the Board and the SEC (on a non-public basis) if a Fund’s holdings of Illiquid Investments exceed 15% of the Fund’s assets.
At a meeting held on March 25-27, 2024, the Committee presented a report to the Board that addressed the operation of the Program and assessed the Program’s adequacy and effectiveness of implementation
| | (the “Report”). The Report covered the period from January 1, 2023 through December 31, 2023 (the “Program Reporting Period”). The Report discussed notable events affecting liquidity over the Program Reporting Period, including the impact of the end of an aggressive rate hike cycle, signs that inflation was abating and market liquidity was reverting to normal, and the overall market. The Report noted that there were no material changes to the Program during the Program Reporting Period. |
| | The Report stated, in relevant part, that during the Program Reporting Period: |
| ∎ | The Program, as adopted and implemented, remained reasonably designed to assess and manage the Fund’s liquidity risk and was operated effectively to achieve that goal; |
| ∎ | The Fund’s investment strategy remained appropriate for an open-end fund; |
| ∎ | The Fund was able to meet requests for redemption without significant dilution of remaining investors’ interests in the Fund; |
| ∎ | The Fund did not breach the 15% limit on Illiquid Investments; and |
| ∎ | The Fund primarily held Highly Liquid Investments and therefore has not adopted an HLIM. |
|
|
This report must be accompanied or preceded by a currently effective Fund prospectus, which contains more complete information, including sales charges and expenses. Investors should read it carefully before investing. |
|
| NOT FDIC INSURED | MAY LOSE VALUE | NO BANK GUARANTEE |
Fund Information
Portfolio Composition
| | |
| By industry | | % of total net assets |
| |
Integrated Oil & Gas | | 42.74% |
| |
Oil & Gas Exploration & Production | | 31.64 |
| |
Oil & Gas Refining & Marketing | | 6.89 |
| |
Oil & Gas Equipment & Services | | 6.30 |
| |
Fertilizers & Agricultural Chemicals | | 3.92 |
| |
Oil & Gas Storage & Transportation | | 3.38 |
| |
Oil & Gas Drilling | | 2.69 |
| |
Multi-Utilities | | 1.93 |
| |
Money Market Funds Plus Other Assets Less Liabilities | | 0.51 |
Top 10 Equity Holdings*
| | | | |
| | | | | % of total net assets |
| | |
| 1. | | Chevron Corp. | | 9.74% |
| | |
| 2. | | Exxon Mobil Corp. | | 9.27 |
| | |
| 3. | | Shell PLC, ADR | | 9.03 |
| | |
| 4. | | Suncor Energy, Inc. | | 6.94 |
| | |
| 5. | | Canadian Natural Resources Ltd. | | 5.22 |
| | |
| 6. | | ConocoPhillips | | 5.13 |
| | |
| 7. | | Marathon Oil Corp. | | 4.71 |
| | |
| 8. | | TotalEnergies SE | | 4.52 |
| | |
| 9. | | CF Industries Holdings, Inc. | | 3.92 |
| | |
| 10. | | Hess Corp. | | 3.65 |
The Fund’s holdings are subject to change, and there is no assurance that the Fund will continue to hold any particular security.
| * | Excluding money market fund holdings, if any. |
Data presented here are as of April 30, 2024.
Schedule of Investments(a)
April 30, 2024
| | | | | | | | |
| | | Shares | | | Value | |
|
| |
Common Stocks & Other Equity Interests–99.49% | |
Fertilizers & Agricultural Chemicals–3.92% | |
CF Industries Holdings, Inc. | | | 248,305 | | | $ | 19,608,646 | |
|
| |
| | |
Integrated Oil & Gas–42.74% | | | | | | | | |
BP PLC, ADR | | | 418,643 | | | | 16,230,789 | |
|
| |
Chevron Corp. | | | 302,089 | | | | 48,717,893 | |
|
| |
Exxon Mobil Corp. | | | 392,178 | | | | 46,382,892 | |
|
| |
Shell PLC, ADR | | | 630,679 | | | | 45,194,457 | |
|
| |
Suncor Energy, Inc. (Canada) | | | 909,430 | | | | 34,701,891 | |
|
| |
TotalEnergies SE (France) | | | 311,512 | | | | 22,615,384 | |
|
| |
| | | | | | | 213,843,306 | |
|
| |
|
Multi-Utilities–1.93% | |
Dominion Energy, Inc. | | | 189,204 | | | | 9,645,620 | |
|
| |
|
Oil & Gas Drilling–2.69% | |
Diamond Offshore Drilling, Inc.(b) | | | 478,526 | | | | 5,857,158 | |
|
| |
Helmerich & Payne, Inc.(c) | | | 193,605 | | | | 7,614,485 | |
|
| |
| | | | | | | 13,471,643 | |
|
| |
|
Oil & Gas Equipment & Services–6.30% | |
Atlas Energy Solutions, Inc.(c) | | | 329,949 | | | | 7,328,167 | |
|
| |
Baker Hughes Co., Class A | | | 420,562 | | | | 13,718,732 | |
|
| |
Halliburton Co.(c) | | | 280,193 | | | | 10,498,832 | |
|
| |
| | | | | | | 31,545,731 | |
|
| |
|
Oil & Gas Exploration & Production–31.64% | |
Canadian Natural Resources Ltd. (Canada)(c) | | | 344,413 | | | | 26,098,983 | |
|
| |
Chesapeake Energy Corp. | | | 120,535 | | | | 10,833,686 | |
|
| |
ConocoPhillips | | | 204,534 | | | | 25,693,561 | |
|
| |
Devon Energy Corp. | | | 200,615 | | | | 10,267,476 | |
|
| |
Diamondback Energy, Inc. | | | 25,347 | | | | 5,098,042 | |
|
| |
EOG Resources, Inc. | | | 95,307 | | | | 12,592,914 | |
|
| |
Hess Corp. | | | 115,858 | | | | 18,246,476 | |
|
| |
Marathon Oil Corp. | | | 877,399 | | | | 23,558,163 | |
|
| |
Pioneer Natural Resources Co. | | | 67,011 | | | | 18,047,403 | |
|
| |
Tourmaline Oil Corp. (Canada) | | | 160,819 | | | | 7,859,588 | |
|
| |
| | | | | | | 158,296,292 | |
|
| |
Investment Abbreviations:
ADR – American Depositary Receipt
| | | | | | | | |
| | | Shares | | | Value | |
|
| |
Oil & Gas Refining & Marketing–6.89% | |
Marathon Petroleum Corp. | | | 90,684 | | | $ | 16,479,097 | |
|
| |
Phillips 66 | | | 125,606 | | | | 17,988,035 | |
|
| |
| | | | | | | 34,467,132 | |
|
| |
|
Oil & Gas Storage & Transportation–3.38% | |
Cheniere Energy, Inc. | | | 107,271 | | | | 16,929,509 | |
|
| |
Total Common Stocks & Other Equity Interests
(Cost $434,368,716) | | | | 497,807,879 | |
|
| |
|
Money Market Funds–0.56% | |
Invesco Government & Agency Portfolio, Institutional Class,
5.23%(d)(e) | | | 979,744 | | | | 979,744 | |
|
| |
Invesco Liquid Assets Portfolio, Institutional Class, 5.34%(d)(e) | | | 699,858 | | | | 700,068 | |
|
| |
Invesco Treasury Portfolio, Institutional Class, 5.22%(d)(e) | | | 1,119,707 | | | | 1,119,707 | |
|
| |
Total Money Market Funds (Cost $2,799,742) | | | | 2,799,519 | |
|
| |
TOTAL INVESTMENTS IN SECURITIES
(excluding investments purchased with cash collateral from securities on loan)-100.05%
(Cost $437,168,458) | | | | | | | 500,607,398 | |
|
| |
|
Investments Purchased with Cash Collateral from Securities on Loan | |
Money Market Funds–4.98% | |
Invesco Private Government Fund, 5.29%(d)(e)(f) | | | 6,980,129 | | | | 6,980,129 | |
|
| |
Invesco Private Prime Fund,
5.46%(d)(e)(f) | | | 17,948,366 | | | | 17,953,750 | |
|
| |
Total Investments Purchased with Cash Collateral from Securities on Loan
(Cost $24,935,514) | | | | 24,933,879 | |
|
| |
TOTAL INVESTMENTS IN SECURITIES–105.03%
(Cost $462,103,972) | | | | 525,541,277 | |
|
| |
OTHER ASSETS LESS LIABILITIES–(5.03)% | | | | (25,173,848 | ) |
|
| |
NET ASSETS–100.00% | | | | | | $ | 500,367,429 | |
|
| |
See accompanying Notes to Financial Statements which are an integral part of the financial statements.
Notes to Schedule of Investments:
| (a) | Industry and/or sector classifications used in this report are generally according to the Global Industry Classification Standard, which was developed by and is the exclusive property and a service mark of MSCI Inc. and Standard & Poor’s. |
| (b) | Non-income producing security. |
| (c) | All or a portion of this security was out on loan at April 30, 2024. |
| (d) | Affiliated holding. Affiliated holdings are investments in entities which are under common ownership or control of Invesco Ltd. or are investments in entities in which the Fund owns 5% or more of the outstanding voting securities. The table below shows the Fund’s transactions in, and earnings from, its investments in affiliates for the fiscal year ended April 30, 2024. |
| | | | | | | | | | | | | | | | | | | | | | | | | | | | |
| | | Value April 30, 2023 | | | Purchases at Cost | | | Proceeds from Sales | | | Change in
Unrealized
Appreciation
(Depreciation) | | | Realized
Gain (Loss) | | | Value April 30, 2024 | | | Dividend Income | |
| Investments in Affiliated Money Market Funds: | | | | | | | | | | | | | | | | | | | | | | | | | | | | |
Invesco Government & Agency Portfolio, Institutional Class | | $ | 1,233,295 | | | $ | 38,919,134 | | | $ | (39,172,685) | | | $ | - | | | $ | - | | | $ | 979,744 | | | $ | 91,068 | |
Invesco Liquid Assets Portfolio, Institutional Class | | | 880,190 | | | | 27,799,381 | | | | (27,979,719) | | | | (236) | | | | 452 | | | | 700,068 | | | | 65,758 | |
Invesco Treasury Portfolio, Institutional Class | | | 1,409,480 | | | | 44,479,010 | | | | (44,768,783) | | | | - | | | | - | | | | 1,119,707 | | | | 102,576 | |
| Investments Purchased with Cash Collateral from Securities on Loan: | | | | | | | | | | | | | | | | | | | | | | | | | | | | |
Invesco Private Government Fund | | | 425,430 | | | | 168,479,878 | | | | (161,925,179) | | | | - | | | | - | | | | 6,980,129 | | | | 155,917* | |
Invesco Private Prime Fund | | | 1,093,963 | | | | 393,157,295 | | | | (376,295,177) | | | | (1,635) | | | | (696) | | | | 17,953,750 | | | | 417,341* | |
Total | | $ | 5,042,358 | | | $ | 672,834,698 | | | $ | (650,141,543) | | | $ | (1,871) | | | $ | (244) | | | $ | 27,733,398 | | | $ | 832,660 | |
| | * | Represents the income earned on the investment of cash collateral, which is included in securities lending income on the Statement of Operations. Does not include rebates and fees paid to lending agent or premiums received from borrowers, if any. |
| (e) | The rate shown is the 7-day SEC standardized yield as of April 30, 2024. |
| (f) | The security has been segregated to satisfy the commitment to return the cash collateral received in securities lending transactions upon the borrower’s return of the securities loaned. See Note 1J. |
See accompanying Notes to Financial Statements which are an integral part of the financial statements.
Statement of Assets and Liabilities
April 30, 2024
| | | | |
Assets: | | | | |
Investments in unaffiliated securities, at value (Cost $434,368,716)* | | $ | 497,807,879 | |
|
| |
Investments in affiliated money market funds, at value (Cost $27,735,256) | | | 27,733,398 | |
|
| |
Foreign currencies, at value (Cost $327,222) | | | 315,743 | |
|
| |
Receivable for: | | | | |
Fund shares sold | | | 141,553 | |
|
| |
Dividends | | | 34,013 | |
|
| |
Investment for trustee deferred compensation and retirement plans | | | 175,367 | |
|
| |
Other assets | | | 54,616 | |
|
| |
Total assets | | | 526,262,569 | |
|
| |
| |
Liabilities: | | | | |
Payable for: | | | | |
Fund shares reacquired | | | 373,553 | |
|
| |
Collateral upon return of securities loaned | | | 24,935,514 | |
|
| |
Accrued fees to affiliates | | | 332,937 | |
|
| |
Accrued trustees’ and officers’ fees and benefits | | | 321 | |
|
| |
Accrued other operating expenses | | | 69,457 | |
|
| |
Trustee deferred compensation and retirement plans | | | 183,358 | |
|
| |
Total liabilities | | | 25,895,140 | |
|
| |
Net assets applicable to shares outstanding | | $ | 500,367,429 | |
|
| |
| |
Net assets consist of: | | | | |
Shares of beneficial interest | | $ | 677,164,893 | |
|
| |
Distributable earnings (loss) | | | (176,797,464 | ) |
|
| |
| | $ | 500,367,429 | |
|
| |
| | | | |
Net Assets: | | | | |
Class A | | $ | 309,926,224 | |
|
| |
Class C | | $ | 23,365,874 | |
|
| |
Class Y | | $ | 62,430,102 | |
|
| |
Investor Class | | $ | 90,997,463 | |
|
| |
Class R5 | | $ | 6,421,534 | |
|
| |
Class R6 | | $ | 7,226,232 | |
|
| |
|
Shares outstanding, no par value, with an unlimited number of shares authorized: | |
Class A | | | 9,997,531 | |
|
| |
Class C | | | 909,048 | |
|
| |
Class Y | | | 2,007,809 | |
|
| |
Investor Class | | | 2,948,818 | |
|
| |
Class R5 | | | 200,604 | |
|
| |
Class R6 | | | 225,671 | |
|
| |
Class A: | | | | |
|
| |
Net asset value per share | | $ | 31.00 | |
|
| |
Maximum offering price per share
(Net asset value of $31.00 ÷ 94.50%) | | $ | 32.80 | |
|
| |
Class C: | | | | |
Net asset value and offering price per share | | $ | 25.70 | |
|
| |
Class Y: | | | | |
Net asset value and offering price per share | | $ | 31.09 | |
|
| |
Investor Class: | | | | |
Net asset value and offering price per share | | $ | 30.86 | |
|
| |
Class R5: | | | | |
Net asset value and offering price per share | | $ | 32.01 | |
|
| |
Class R6: | | | | |
Net asset value and offering price per share | | $ | 32.02 | |
|
| |
| * | At April 30, 2024, securities with an aggregate value of $23,386,342 were on loan to brokers. |
See accompanying Notes to Financial Statements which are an integral part of the financial statements.
Statement of Operations
For the year ended April 30, 2024
| | | | |
Investment income: | | | | |
Interest | | $ | 9,235 | |
|
| |
Dividends (net of foreign withholding taxes of $589,337) | | | 18,230,061 | |
|
| |
Dividends from affiliated money market funds (includes net securities lending income of $39,673) | | | 299,075 | |
|
| |
Foreign withholding tax claims | | | 164,871 | |
|
| |
Total investment income | | | 18,703,242 | |
|
| |
| |
Expenses: | | | | |
Advisory fees | | | 3,581,235 | |
|
| |
Administrative services fees | | | 70,312 | |
|
| |
Custodian fees | | | 12,176 | |
|
| |
Distribution fees: | | | | |
Class A | | | 780,820 | |
|
| |
Class C | | | 258,410 | |
|
| |
Investor Class | | | 221,497 | |
|
| |
Transfer agent fees – A, C, Y and Investor Class | | | 1,011,025 | |
|
| |
Transfer agent fees – R5 | | | 6,556 | |
|
| |
Transfer agent fees – R6 | | | 2,222 | |
|
| |
Trustees’ and officers’ fees and benefits | | | 25,804 | |
|
| |
Registration and filing fees | | | 114,341 | |
|
| |
Reports to shareholders | | | 185,934 | |
|
| |
Professional services fees | | | 81,246 | |
|
| |
Other | | | 16,520 | |
|
| |
Total expenses | | | 6,368,098 | |
|
| |
Less: Fees waived and/or expense offset arrangement(s) | | | (31,810 | ) |
|
| |
Net expenses | | | 6,336,288 | |
|
| |
Net investment income | | | 12,366,954 | |
|
| |
| |
Realized and unrealized gain (loss) from: | | | | |
Net realized gain (loss) from: | | | | |
Unaffiliated investment securities | | | 53,292,065 | |
|
| |
Affiliated investment securities | | | (244 | ) |
|
| |
Foreign currencies | | | 11,700 | |
|
| |
| | | 53,303,521 | |
|
| |
Change in net unrealized appreciation (depreciation) of: | | | | |
Unaffiliated investment securities | | | (9,715,825 | ) |
|
| |
Affiliated investment securities | | | (1,871 | ) |
|
| |
Foreign currencies | | | (3,200 | ) |
|
| |
| | | (9,720,896 | ) |
|
| |
Net realized and unrealized gain | | | 43,582,625 | |
|
| |
Net increase in net assets resulting from operations | | $ | 55,949,579 | |
|
| |
See accompanying Notes to Financial Statements which are an integral part of the financial statements.
Statement of Changes in Net Assets
For the years ended April 30, 2024 and 2023
| | | | | | | | |
| | | 2024 | | | 2023 | |
|
| |
Operations: | | | | | | | | |
Net investment income | | $ | 12,366,954 | | | $ | 14,672,377 | |
|
| |
Net realized gain | | | 53,303,521 | | | | 97,722,330 | |
|
| |
Change in net unrealized appreciation (depreciation) | | | (9,720,896 | ) | | | (54,921,241 | ) |
|
| |
Net increase in net assets resulting from operations | | | 55,949,579 | | | | 57,473,466 | |
|
| |
| | |
Distributions to shareholders from distributable earnings: | | | | | | | | |
Class A | | | (6,263,374 | ) | | | (3,341,210 | ) |
|
| |
Class C | | | (522,311 | ) | | | (264,688 | ) |
|
| |
Class Y | | | (1,269,677 | ) | | | (833,212 | ) |
|
| |
Investor Class | | | (1,785,068 | ) | | | (917,828 | ) |
|
| |
Class R5 | | | (137,331 | ) | | | (98,706 | ) |
|
| |
Class R6 | | | (169,649 | ) | | | (104,548 | ) |
|
| |
Total distributions from distributable earnings | | | (10,147,410 | ) | | | (5,560,192 | ) |
|
| |
| | |
Share transactions–net: | | | | | | | | |
Class A | | | (71,901,582 | ) | | | 19,371,103 | |
|
| |
Class C | | | (10,409,244 | ) | | | 3,098,926 | |
|
| |
Class Y | | | (7,093,769 | ) | | | (26,668,416 | ) |
|
| |
Investor Class | | | (13,210,427 | ) | | | (11,218,126 | ) |
|
| |
Class R5 | | | (2,516,483 | ) | | | 1,100,040 | |
|
| |
Class R6 | | | (2,383,600 | ) | | | 925,000 | |
|
| |
Net increase (decrease) in net assets resulting from share transactions | | | (107,515,105 | ) | | | (13,391,473 | ) |
|
| |
Net increase (decrease) in net assets | | | (61,712,936 | ) | | | 38,521,801 | |
|
| |
| | |
Net assets: | | | | | | | | |
Beginning of year | | | 562,080,365 | | | | 523,558,564 | |
|
| |
End of year | | $ | 500,367,429 | | | $ | 562,080,365 | |
|
| |
See accompanying Notes to Financial Statements which are an integral part of the financial statements.
Financial Highlights
The following schedule presents financial highlights for a share of the Fund outstanding throughout the periods indicated.
| | | | | | | | | | | | | | | | | | | | | | | | | | | | | | | | | | | | | | | | | | | | | | | | | | | | | | | | | | | | | | | | | | | | | | | | | | | | | | | | | | | | | | | | | | | | |
| | | Net asset value, beginning of period | | | | Net investment income(a) | | | | Net gains (losses) on securities (both realized and unrealized) | | | | Total from investment operations | | | | Dividends from net investment income | | | | Net asset value, end of period | | | | Total return(b) | | | | Net assets, end of period (000’s omitted) | | | | Ratio of expenses to average net assets with fee waivers and/or expenses absorbed | | | | Ratio of expenses to average net assets without fee waivers and/or expenses absorbed | | | | Ratio of net investment income to average net assets | | | | Portfolio turnover (c) |
Class A | | | | | | | | | | | | | | | | | | | | | | | | | | | | | | | | | | | | | | | | | | | | | | | | | | | | | | | | | | | | | | | | | | | | | | | | | | | | | | | | | | | | | | | | | | | | |
Year ended 04/30/24 | | | $28.01 | | | | | | | | $0.71 | | | | | | | | $2.87 | | | | | | | | $3.58 | | | | | | | | $(0.59 | ) | | | | | | | $31.00 | | | | | | | | 13.03 | % | | | | | | | $309,926 | | | | | | | | 1.27 | % | | | | | | | 1.28 | % | | | | | | | 2.49 | % | | | | | | | 28 | % |
Year ended 04/30/23 | | | 25.05 | | | | | | | | 0.69 | | | | | | | | 2.52 | | | | | | | | 3.21 | | | | | | | | (0.25 | ) | | | | | | | 28.01 | | | | | | | | 12.85 | | | | | | | | 353,050 | | | | | | | | 1.29 | | | | | | | | 1.29 | | | | | | | | 2.52 | | | | | | | | 52 | |
Year ended 04/30/22 | | | 15.57 | | | | | | | | 0.43 | | | | | | | | 9.39 | | | | | | | | 9.82 | | | | | | | | (0.34 | ) | | | | | | | 25.05 | | | | | | | | 63.83 | | | | | | | | 301,546 | | | | | | | | 1.36 | | | | | | | | 1.36 | | | | | | | | 2.22 | | | | | | | | 18 | |
Year ended 04/30/21 | | | 11.54 | | | | | | | | 0.25 | | | | | | | | 4.05 | | | | | | | | 4.30 | | | | | | | | (0.27 | ) | | | | | | | 15.57 | | | | | | | | 37.77 | | | | | | | | 166,204 | | | | | | | | 1.56 | | | | | | | | 1.56 | | | | | | | | 2.00 | | | | | | | | 68 | |
Year ended 04/30/20 | | | 21.05 | | | | | | | | 0.41 | | | | | | | | (9.64 | ) | | | | | | | (9.23 | ) | | | | | | | (0.28 | ) | | | | | | | 11.54 | | | | | | | | (44.30 | ) | | | | | | | 121,102 | | | | | | | | 1.45 | | | | | | | | 1.45 | | | | | | | | 2.42 | | | | | | | | 16 | |
Class C | | | | | | | | | | | | | | | | | | | | | | | | | | | | | | | | | | | | | | | | | | | | | | | | | | | | | | | | | | | | | | | | | | | | | | | | | | | | | | | | | | | | | | | | | | | | |
Year ended 04/30/24 | | | 23.40 | | | | | | | | 0.41 | | | | | | | | 2.39 | | | | | | | | 2.80 | | | | | | | | (0.50 | ) | | | | | | | 25.70 | | | | | | | | 12.20 | | | | | | | | 23,366 | | | | | | | | 2.02 | | | | | | | | 2.03 | | | | | | | | 1.74 | | | | | | | | 28 | |
Year ended 04/30/23 | | | 21.06 | | | | | | | | 0.41 | | | | | | | | 2.11 | | | | | | | | 2.52 | | | | | | | | (0.18 | ) | | | | | | | 23.40 | | | | | | | | 11.99 | | | | | | | | 31,807 | | | | | | | | 2.04 | | | | | | | | 2.04 | | | | | | | | 1.77 | | | | | | | | 52 | |
Year ended 04/30/22 | | | 13.18 | | | | | | | | 0.24 | | | | | | | | 7.91 | | | | | | | | 8.15 | | | | | | | | (0.27 | ) | | | | | | | 21.06 | | | | | | | | 62.54 | | | | | | | | 26,493 | | | | | | | | 2.11 | | | | | | | | 2.11 | | | | | | | | 1.47 | | | | | | | | 18 | |
Year ended 04/30/21 | | | 9.82 | | | | | | | | 0.13 | | | | | | | | 3.44 | | | | | | | | 3.57 | | | | | | | | (0.21 | ) | | | | | | | 13.18 | | | | | | | | 36.87 | | | | | | | | 12,763 | | | | | | | | 2.31 | | | | | | | | 2.31 | | | | | | | | 1.25 | | | | | | | | 68 | |
Year ended 04/30/20 | | | 17.99 | | | | | | | | 0.24 | | | | | | | | (8.22 | ) | | | | | | | (7.98 | ) | | | | | | | (0.19 | ) | | | | | | | 9.82 | | | | | | | | (44.72 | ) | | | | | | | 13,868 | | | | | | | | 2.20 | | | | | | | | 2.20 | | | | | | | | 1.67 | | | | | | | | 16 | |
Class Y | | | | | | | | | | | | | | | | | | | | | | | | | | | | | | | | | | | | | | | | | | | | | | | | | | | | | | | | | | | | | | | | | | | | | | | | | | | | | | | | | | | | | | | | | | | | |
Year ended 04/30/24 | | | 28.10 | | | | | | | | 0.78 | | | | | | | | 2.88 | | | | | | | | 3.66 | | | | | | | | (0.67 | ) | | | | | | | 31.09 | | | | | | | | 13.29 | | | | | | | | 62,430 | | | | | | | | 1.02 | | | | | | | | 1.03 | | | | | | | | 2.74 | | | | | | | | 28 | |
Year ended 04/30/23 | | | 25.10 | | | | | | | | 0.76 | | | | | | | | 2.54 | | | | | | | | 3.30 | | | | | | | | (0.30 | ) | | | | | | | 28.10 | | | | | | | | 13.16 | | | | | | | | 64,238 | | | | | | | | 1.04 | | | | | | | | 1.04 | | | | | | | | 2.77 | | | | | | | | 52 | |
Year ended 04/30/22 | | | 15.59 | | | | | | | | 0.49 | | | | | | | | 9.39 | | | | | | | | 9.88 | | | | | | | | (0.37 | ) | | | | | | | 25.10 | | | | | | | | 64.20 | | | | | | | | 85,631 | | | | | | | | 1.11 | | | | | | | | 1.11 | | | | | | | | 2.47 | | | | | | | | 18 | |
Year ended 04/30/21 | | | 11.54 | | | | | | | | 0.28 | | | | | | | | 4.06 | | | | | | | | 4.34 | | | | | | | | (0.29 | ) | | | | | | | 15.59 | | | | | | | | 38.14 | | | | | | | | 29,497 | | | | | | | | 1.31 | | | | | | | | 1.31 | | | | | | | | 2.25 | | | | | | | | 68 | |
Year ended 04/30/20 | | | 21.04 | | | | | | | | 0.45 | | | | | | | | (9.64 | ) | | | | | | | (9.19 | ) | | | | | | | (0.31 | ) | | | | | | | 11.54 | | | | | | | | (44.17 | ) | | | | | | | 14,398 | | | | | | | | 1.20 | | | | | | | | 1.20 | | | | | | | | 2.67 | | | | | | | | 16 | |
Investor Class | | | | | | | | | | | | | | | | | | | | | | | | | | | | | | | | | | | | | | | | | | | | | | | | | | | | | | | | | | | | | | | | | | | | | | | | | | | | | | | | | | | | | | | | | | | | |
Year ended 04/30/24 | | | 27.88 | | | | | | | | 0.71 | | | | | | | | 2.86 | | | | | | | | 3.57 | | | | | | | | (0.59 | ) | | | | | | | 30.86 | | | | | | | | 13.05 | | | | | | | | 90,997 | | | | | | | | 1.27 | | | | | | | | 1.28 | | | | | | | | 2.49 | | | | | | | | 28 | |
Year ended 04/30/23 | | | 24.94 | | | | | | | | 0.69 | | | | | | | | 2.50 | | | | | | | | 3.19 | | | | | | | | (0.25 | ) | | | | | | | 27.88 | | | | | | | | 12.82 | | | | | | | | 95,589 | | | | | | | | 1.29 | | | | | | | | 1.29 | | | | | | | | 2.52 | | | | | | | | 52 | |
Year ended 04/30/22 | | | 15.51 | | | | | | | | 0.43 | | | | | | | | 9.34 | | | | | | | | 9.77 | | | | | | | | (0.34 | ) | | | | | | | 24.94 | | | | | | | | 63.76 | | | | | | | | 96,027 | | | | | | | | 1.36 | | | | | | | | 1.36 | | | | | | | | 2.22 | | | | | | | | 18 | |
Year ended 04/30/21 | | | 11.49 | | | | | | | | 0.25 | | | | | | | | 4.04 | | | | | | | | 4.29 | | | | | | | | (0.27 | ) | | | | | | | 15.51 | | | | | | | | 37.85 | | | | | | | | 61,754 | | | | | | | | 1.56 | | | | | | | | 1.56 | | | | | | | | 2.00 | | | | | | | | 68 | |
Year ended 04/30/20 | | | 20.96 | | | | | | | | 0.40 | | | | | | | | (9.59 | ) | | | | | | | (9.19 | ) | | | | | | | (0.28 | ) | | | | | | | 11.49 | | | | | | | | (44.30 | ) | | | | | | | 47,046 | | | | | | | | 1.45 | | | | | | | | 1.45 | | | | | | | | 2.42 | | | | | | | | 16 | |
Class R5 | | | | | | | | | | | | | | | | | | | | | | | | | | | | | | | | | | | | | | | | | | | | | | | | | | | | | | | | | | | | | | | | | | | | | | | | | | | | | | | | | | | | | | | | | | | | |
Year ended 04/30/24 | | | 28.91 | | | | | | | | 0.83 | | | | | | | | 2.97 | | | | | | | | 3.80 | | | | | | | | (0.70 | ) | | | | | | | 32.01 | | | | | | | | 13.42 | | | | | | | | 6,422 | | | | | | | | 0.92 | | | | | | | | 0.92 | | | | | | | | 2.84 | | | | | | | | 28 | |
Year ended 04/30/23 | | | 25.81 | | | | | | | | 0.81 | | | | | | | | 2.60 | | | | | | | | 3.41 | | | | | | | | (0.31 | ) | | | | | | | 28.91 | | | | | | | | 13.26 | | | | | | | | 8,359 | | | | | | | | 0.95 | | | | | | | | 0.95 | | | | | | | | 2.86 | | | | | | | | 52 | |
Year ended 04/30/22 | | | 16.02 | | | | | | | | 0.53 | | | | | | | | 9.65 | | | | | | | | 10.18 | | | | | | | | (0.39 | ) | | | | | | | 25.81 | | | | | | | | 64.39 | | | | | | | | 6,352 | | | | | | | | 0.97 | | | | | | | | 0.97 | | | | | | | | 2.61 | | | | | | | | 18 | |
Year ended 04/30/21 | | | 11.83 | | | | | | | | 0.32 | | | | | | | | 4.19 | | | | | | | | 4.51 | | | | | | | | (0.32 | ) | | | | | | | 16.02 | | | | | | | | 38.69 | | | | | | | | 2,488 | | | | | | | | 0.99 | | | | | | | | 0.99 | | | | | | | | 2.57 | | | | | | | | 68 | |
Year ended 04/30/20 | | | 21.54 | | | | | | | | 0.50 | | | | | | | | (9.87 | ) | | | | | | | (9.37 | ) | | | | | | | (0.34 | ) | | | | | | | 11.83 | | | | | | | | (44.03 | ) | | | | | | | 2,371 | | | | | | | | 0.96 | | | | | | | | 0.96 | | | | | | | | 2.91 | | | | | | | | 16 | |
Class R6 | | | | | | | | | | | | | | | | | | | | | | | | | | | | | | | | | | | | | | | | | | | | | | | | | | | | | | | | | | | | | | | | | | | | | | | | | | | | | | | | | | | | | | | | | | | | |
Year ended 04/30/24 | | | 28.92 | | | | | | | | 0.86 | | | | | | | | 2.96 | | | | | | | | 3.82 | | | | | | | | (0.72 | ) | | | | | | | 32.02 | | | | | | | | 13.50 | | | | | | | | 7,226 | | | | | | | | 0.85 | | | | | | | | 0.85 | | | | | | | | 2.91 | | | | | | | | 28 | |
Year ended 04/30/23 | | | 25.82 | | | | | | | | 0.83 | | | | | | | | 2.60 | | | | | | | | 3.43 | | | | | | | | (0.33 | ) | | | | | | | 28.92 | | | | | | | | 13.30 | | | | | | | | 9,037 | | | | | | | | 0.88 | | | | | | | | 0.88 | | | | | | | | 2.93 | | | | | | | | 52 | |
Year ended 04/30/22 | | | 16.02 | | | | | | | | 0.56 | | | | | | | | 9.63 | | | | | | | | 10.19 | | | | | | | | (0.39 | ) | | | | | | | 25.82 | | | | | | | | 64.51 | | | | | | | | 7,509 | | | | | | | | 0.91 | | | | | | | | 0.91 | | | | | | | | 2.67 | | | | | | | | 18 | |
Year ended 04/30/21 | | | 11.83 | | | | | | | | 0.34 | | | | | | | | 4.17 | | | | | | | | 4.51 | | | | | | | | (0.32 | ) | | | | | | | 16.02 | | | | | | | | 38.69 | | | | | | | | 1,050 | | | | | | | | 0.99 | | | | | | | | 0.99 | | | | | | | | 2.57 | | | | | | | | 68 | |
Year ended 04/30/20 | | | 21.53 | | | | | | | | 0.49 | | | | | | | | (9.85 | ) | | | | | | | (9.36 | ) | | | | | | | (0.34 | ) | | | | | | | 11.83 | | | | | | | | (44.00 | ) | | | | | | | 357 | | | | | | | | 0.96 | | | | | | | | 0.96 | | | | | | | | 2.91 | | | | | | | | 16 | |
| (a) | Calculated using average shares outstanding. |
| (b) | Includes adjustments in accordance with accounting principles generally accepted in the United States of America and as such, the net asset value for financial reporting purposes and the returns based upon those net asset values may differ from the net asset value and returns for shareholder transactions. Does not include sales charges and is not annualized for periods less than one year, if applicable. |
| (c) | Portfolio turnover is calculated at the fund level and is not annualized for periods less than one year, if applicable. |
See accompanying Notes to Financial Statements which are an integral part of the financial statements.
Notes to Financial Statements
April 30, 2024
NOTE 1–Significant Accounting Policies
Invesco Energy Fund (the “Fund”) is a series portfolio of AIM Sector Funds (Invesco Sector Funds) (the “Trust”). The Trust is a Delaware statutory trust registered under the Investment Company Act of 1940, as amended (the “1940 Act”), as an open-end series management investment company authorized to issue an unlimited number of shares of beneficial interest. Information presented in these financial statements pertains only to the Fund. Matters affecting the Fund or each class will be voted on exclusively by the shareholders of the Fund or each class.
The Fund’s investment objective is long-term growth of capital.
The Fund currently consists of six different classes of shares: Class A, Class C, Class Y, Investor Class, Class R5 and Class R6. Class Y and Investor Class shares are available only to certain investors. Class A shares are sold with a front-end sales charge unless certain waiver criteria are met and under certain circumstances load waived shares may be subject to contingent deferred sales charges (“CDSC”). Class C shares are sold with a CDSC. Class Y, Investor Class, Class R5 and Class R6 shares are sold at net asset value. Class C shares held for eight years after purchase are eligible for automatic conversion into Class A shares of the same Fund (the “Conversion Feature”). The automatic conversion pursuant to the Conversion Feature will generally occur at the end of the month following the eighth anniversary after a purchase of Class C shares.
The Fund is an investment company and accordingly follows the investment company accounting and reporting guidance in accordance with Financial Accounting Standards Board Accounting Standards Codification Topic 946, Financial Services – Investment Companies.
The following is a summary of the significant accounting policies followed by the Fund in the preparation of its financial statements.
| A. | Security Valuations – Securities, including restricted securities, are valued according to the following policy. |
A security listed or traded on an exchange is generally valued at its trade price or official closing price that day as of the close of the exchange where the security is principally traded, or lacking any trades or official closing price on a particular day, the security may be valued at the closing bid or ask price on that day. Securities traded in the over-the-counter market are valued based on prices furnished by independent pricing services or market makers. When such securities are valued using prices provided by an independent pricing service they may be considered fair valued. Futures contracts are valued at the daily settlement price set by an exchange on which they are principally traded. Where a final settlement price exists, exchange-traded options are valued at the final settlement price from the exchange where the option principally trades. Where a final settlement price does not exist, exchange-traded options are valued at the mean between the last bid and ask price generally from the exchange where the option principally trades.
Securities of investment companies that are not exchange-traded (e.g., open-end mutual funds) are valued using such company’s end-of-business-day net asset value per share.
Deposits, other obligations of U.S. and non-U.S. banks and financial institutions are valued at their daily account value.
Fixed income securities (including convertible debt securities) generally are valued on the basis of prices provided by independent pricing services. Prices provided by the pricing service may be determined without exclusive reliance on quoted prices, and may reflect appropriate factors such as institution-size trading in similar groups of securities, developments related to specific securities, dividend rate (for unlisted equities), yield (for debt obligations), quality, type of issue, coupon rate (for debt obligations), maturity (for debt obligations), individual trading characteristics and other market data. Pricing services generally value debt obligations assuming orderly transactions of institutional round lot size, but a fund may hold or transact in the same securities in smaller, odd lot sizes. Odd lots often trade at lower prices than institutional round lots, and their value may be adjusted accordingly. Debt obligations are subject to interest rate and credit risks. In addition, all debt obligations involve some risk of default with respect to interest and/or principal payments.
Foreign securities’ (including foreign exchange contracts) prices are converted into U.S. dollar amounts using the applicable exchange rates as of the close of the New York Stock Exchange (“NYSE”). If market quotations are available and reliable for foreign exchange-traded equity securities, the securities will be valued at the market quotations. Invesco Advisers, Inc. (the “Adviser” or “Invesco”) may use various pricing services to obtain market quotations as well as fair value prices. Because trading hours for certain foreign securities end before the close of the NYSE, closing market quotations may become not representative of market value in the Adviser’s judgment (“unreliable”). If, between the time trading ends on a particular security and the close of the customary trading session on the NYSE, a significant event occurs that makes the closing price of the security unreliable, the Adviser may fair value the security. If the event is likely to have affected the closing price of the security, the security will be valued at fair value in good faith in accordance with Board-approved policies and related Adviser procedures (“Valuation Procedures”). Adjustments to closing prices to reflect fair value may also be based on a screening process of an independent pricing service to indicate the degree of certainty, based on historical data, that the closing price in the principal market where a foreign security trades is not the current value as of the close of the NYSE. Foreign securities’ prices meeting the degree of certainty that the price is not reflective of current value will be priced at the indication of fair value from the independent pricing service. Multiple factors may be considered by the independent pricing service in determining adjustments to reflect fair value and may include information relating to sector indices, American Depositary Receipts and domestic and foreign index futures. Foreign securities may have additional risks including exchange rate changes, potential for sharply devalued currencies and high inflation, political and economic upheaval, the relative lack of issuer information, relatively low market liquidity and the potential lack of strict financial and accounting controls and standards.
Unlisted securities will be valued using prices provided by independent pricing services or by another method that the Adviser, in its judgment, believes better reflects the security’s fair value in accordance with the Valuation Procedures.
Non-traded rights and warrants shall be valued at intrinsic value if the terms of the rights and warrants are available, specifically the subscription or exercise price and the ratio. Intrinsic value is calculated as the daily market closing price of the security to be received less the subscription price, which is then adjusted by the exercise ratio. In the case of warrants, an option pricing model supplied by an independent pricing service may be used based on market data such as volatility, stock price and interest rate from the independent pricing service and strike price and exercise period from verified terms.
Securities for which market prices are not provided by any of the above methods may be valued based upon quotes furnished by independent sources. The mean between the last bid and ask prices may be used to value debt obligations, including corporate loans.
Securities for which market quotations are not readily available are fair valued by the Adviser in accordance with the Valuation Procedures. If a fair value price provided by a pricing service is unreliable, the Adviser will fair value the security using the Valuation Procedures. Issuer specific events, market trends, bid/ask quotes of brokers and information providers and other market data may be reviewed in the course of making a good faith determination of a security’s fair value.
The Fund may invest in securities that are subject to interest rate risk, meaning the risk that the prices will generally fall as interest rates rise and, conversely, the prices will generally rise as interest rates fall. Specific securities differ in their sensitivity to changes in interest rates depending on their individual characteristics. Changes in interest rates may result in increased market volatility, which may affect the value and/or liquidity of certain Fund investments.
Valuations change in response to many factors including the historical and prospective earnings of the issuer, the value of the issuer’s assets, general market conditions which are not specifically related to the particular issuer, such as real or perceived adverse economic conditions, changes in the general outlook for revenues or corporate earnings, changes in interest or currency rates, regional or global instability, natural or environmental disasters, widespread disease or other public health issues, war, acts of terrorism, significant governmental actions or adverse investor sentiment generally and market liquidity. Because of the inherent uncertainties of valuation, the values reflected in the financial statements may materially differ from the value received upon actual sale of those investments.
The price the Fund could receive upon the sale of any investment may differ from the Adviser’s valuation of the investment, particularly for securities that are valued using a fair valuation technique. When fair valuation techniques are applied, the Adviser uses available information, including both observable and unobservable inputs and assumptions, to determine a methodology that will result in a valuation that the Adviser believes approximates market value. Fund securities that are fair valued may be subject to greater fluctuation in their value from one day to the next than would be the case if market quotations were used. Because of the inherent uncertainties of valuation, and the degree of subjectivity in such decisions, the Fund could realize a greater or lesser than expected gain or loss upon the sale of the investment.
| B. | Securities Transactions and Investment Income – Securities transactions are accounted for on a trade date basis. Realized gains or losses on sales are computed on the basis of specific identification of the securities sold. Interest income (net of withholding tax, if any) is recorded on an accrual basis from settlement date and includes coupon interest and amortization of premium and accretion of discount on debt securities as applicable. Pay-in-kind interest income and non-cash dividend income received in the form of securities in lieu of cash are recorded at the fair value of the securities received. Dividend income (net of withholding tax, if any) is recorded on the ex-dividend date. |
The Fund may periodically participate in litigation related to Fund investments. As such, the Fund may receive proceeds from litigation settlements. Any proceeds received are included in the Statement of Operations as realized gain (loss) for investments no longer held and as unrealized gain (loss) for investments still held.
Brokerage commissions and mark ups are considered transaction costs and are recorded as an increase to the cost basis of securities purchased and/or a reduction of proceeds on a sale of securities. Such transaction costs are included in the determination of net realized and unrealized gain (loss) from investment securities reported in the Statement of Operations and the Statement of Changes in Net Assets and the net realized and unrealized gains (losses) on securities per share in the Financial Highlights. Transaction costs are included in the calculation of the Fund’s net asset value and, accordingly, they reduce the Fund’s total returns. These transaction costs are not considered operating expenses and are not reflected in net investment income reported in the Statement of Operations and the Statement of Changes in Net Assets, or the net investment income per share and the ratios of expenses and net investment income reported in the Financial Highlights, nor are they limited by any expense limitation arrangements between the Fund and the investment adviser.
The Fund allocates income and realized and unrealized capital gains and losses to a class based on the relative net assets of each class.
| C. | Country Determination – For the purposes of making investment selection decisions and presentation in the Schedule of Investments, the investment adviser may determine the country in which an issuer is located and/or credit risk exposure based on various factors. These factors include the laws of the country under which the issuer is organized, where the issuer maintains a principal office, the country in which the issuer derives 50% or more of its total revenues, the country that has the primary market for the issuer’s securities and its “country of risk” as determined by a third party service provider, as well as other criteria. Among the other criteria that may be evaluated for making this determination are the country in which the issuer maintains 50% or more of its assets, the type of security, financial guarantees and enhancements, the nature of the collateral and the sponsor organization. Country of issuer and/or credit risk exposure has been determined to be the United States of America, unless otherwise noted. |
| D. | Distributions – Distributions from net investment income and net realized capital gain, if any, are generally declared and paid annually and recorded on the ex-dividend date. The Fund may elect to treat a portion of the proceeds from redemptions as distributions for federal income tax purposes. |
| E. | Federal Income Taxes – The Fund intends to comply with the requirements of Subchapter M of the Internal Revenue Code of 1986, as amended (the “Internal Revenue Code”), necessary to qualify as a regulated investment company and to distribute substantially all of the Fund’s taxable earnings to shareholders. As such, the Fund will not be subject to federal income taxes on otherwise taxable income (including net realized capital gain) that is distributed to shareholders. Therefore, no provision for federal income taxes is recorded in the financial statements. |
The Fund recognizes the tax benefits of uncertain tax positions only when the position is more likely than not to be sustained. Management has analyzed the Fund’s uncertain tax positions and concluded that no liability for unrecognized tax benefits should be recorded related to uncertain tax positions. Management is not aware of any tax positions for which it is reasonably possible that the total amounts of unrecognized tax benefits will change materially in the next 12 months.
The Fund files tax returns in the U.S. Federal jurisdiction and certain other jurisdictions. Generally, the Fund is subject to examinations by such taxing authorities for up to three years after the filing of the return for the tax period.
| F. | Foreign Withholding Taxes – The Fund is subject to foreign withholding tax imposed by certain foreign countries in which the Fund may invest. Withholding taxes are incurred on certain foreign dividends and are accrued at the time the dividend is recognized based on applicable foreign tax laws. The Fund may file withholding tax refunds in certain jurisdictions to seek to recover a portion of amounts previously withheld. The Fund will record a receivable for such tax refunds based on several factors including; an assessment of a jurisdiction’s legal obligation to pay reclaims, administrative practices and payment history. Any receivables recorded will be shown under receivables for Foreign withholding tax claims on the Statement of Assets and Liabilities. There is no guarantee that the Fund will receive refunds applied for in a timely manner or at all. |
As a result of recent court rulings in certain countries across the European Union, tax refunds for previously withheld taxes on dividends earned in those countries have been received by investment companies. Any tax refund payments are reflected as Foreign withholding tax claims in the Statement of Operations, and any related interest is included in Interest income. The Fund may incur fees paid to third party providers that assist in the recovery of the tax reclaims. These fees are reflected on the Statement of Operations as Professional services fees, if any. In the event tax refunds received by the Fund during the fiscal year exceed the foreign withholding taxes paid by the Fund for the year, and the Fund previously passed foreign tax credits on to its shareholders, the Fund intends to enter into a closing agreement with the Internal Revenue Service in order to pay the associated liability on behalf of the Funds’ shareholders. For the year ended April 30, 2024, the Fund did not enter into any closing agreements.
| G. | Expenses – Fees provided for under the Rule 12b-1 plan of a particular class of the Fund are charged to the operations of such class. Transfer agency fees and expenses and other shareholder recordkeeping fees and expenses attributable to Class R5 and Class R6 are allocated based on relative net assets of Class R5 and Class R6. Sub-accounting fees attributable to Class R5 are charged to the operations of the class. Transfer agency fees and expenses and other shareholder recordkeeping fees and expenses relating to all other classes are allocated among those classes based on relative net assets. All other expenses are allocated among the classes based on relative net assets. |
| H. | Accounting Estimates – The preparation of financial statements in conformity with accounting principles generally accepted in the United States of America (“GAAP”) requires management to make estimates and assumptions that affect the reported amounts of assets and liabilities at the date of the financial statements and the reported amounts of revenues and expenses during the reporting period including estimates and assumptions related to taxation. Actual results could differ from those estimates by a significant amount. In addition, the Fund monitors for material events or transactions that may occur or become known after the period-end date and before the date the financial statements are released to print. |
| I. | Indemnifications – Under the Trust’s organizational documents, each Trustee, officer, employee or other agent of the Trust is indemnified against certain liabilities that may arise out of the performance of their duties to the Fund. Additionally, in the normal course of business, the Fund enters into contracts, including the Fund’s servicing agreements, that contain a variety of indemnification clauses. The Fund’s maximum exposure under these arrangements is unknown as this would involve future claims that may be made against the Fund that have not yet occurred. The risk of material loss as a result of such indemnification claims is considered remote. |
| J. | Securities Lending – The Fund may lend portfolio securities having a market value up to one-third of the Fund’s total assets. Such loans are secured by collateral equal to no less than the market value of the loaned securities determined daily by the securities lending provider. Such collateral will be cash or debt securities issued or guaranteed by the U.S. Government or any of its sponsored agencies. Cash collateral received in connection with these loans is invested in short-term money market instruments or affiliated, unregistered investment companies that comply with Rule 2a-7 under the 1940 Act and money market funds |
| | (collectively, “affiliated money market funds”) and is shown as such on the Schedule of Investments. The Fund bears the risk of loss with respect to the investment of collateral. It is the Fund’s policy to obtain additional collateral from or return excess collateral to the borrower by the end of the next business day, following the valuation date of the securities loaned. Therefore, the value of the collateral held may be temporarily less than the value of the securities on loan. When loaning securities, the Fund retains certain benefits of owning the securities, including the economic equivalent of dividends or interest generated by the security. Lending securities entails a risk of loss to the Fund if, and to the extent that, the market value of the securities loaned were to increase and the borrower did not increase the collateral accordingly, and the borrower failed to return the securities. The securities loaned are subject to termination at the option of the borrower or the Fund. Upon termination, the borrower will return to the Fund the securities loaned and the Fund will return the collateral. Upon the failure of the borrower to return the securities, collateral may be liquidated and the securities may be purchased on the open market to replace the loaned securities. The Fund could experience delays and costs in gaining access to the collateral and the securities may lose value during the delay which could result in potential losses to the Fund. Some of these losses may be indemnified by the lending agent. The Fund bears the risk of any deficiency in the amount of the collateral available for return to the borrower due to any loss on the collateral invested. Dividends received on cash collateral investments for securities lending transactions, which are net of compensation to counterparties, are included in Dividends from affiliated money market funds on the Statement of Operations. The aggregate value of securities out on loan, if any, is shown as a footnote on the Statement of Assets and Liabilities. |
The Adviser serves as an affiliated securities lending agent for the Fund. The Bank of New York Mellon also serves as a securities lending agent. To the extent the Fund utilizes the Adviser as an affiliated securities lending agent, the Fund conducts its securities lending in accordance with, and in reliance upon, no-action letters issued by the SEC staff that provide guidance on how an affiliate may act as a direct agent lender and receive compensation for those services in a manner consistent with the federal securities laws. For the year ended April 30, 2024, the Fund paid the Adviser $1,180 in fees for securities lending agent services. Fees paid to the Adviser for securities lending agent services, if any, are included in Dividends from affiliated money market funds on the Statement of Operations.
| K. | Foreign Currency Translations – Foreign currency is valued at the close of the NYSE based on quotations posted by banks and major currency dealers. Portfolio securities and other assets and liabilities denominated in foreign currencies are translated into U.S. dollar amounts at the date of valuation. Purchases and sales of portfolio securities (net of foreign taxes withheld on disposition) and income items denominated in foreign currencies are translated into U.S. dollar amounts on the respective dates of such transactions. The Fund does not separately account for the portion of the results of operations resulting from changes in foreign exchange rates on investments and the fluctuations arising from changes in market prices of securities held. The combined results of changes in foreign exchange rates and the fluctuation of market prices on investments (net of estimated foreign tax withholding) are included with the net realized and unrealized gain or loss from investments in the Statement of Operations. Reported net realized foreign currency gains or losses arise from (1) sales of foreign currencies, (2) currency gains or losses realized between the trade and settlement dates on securities transactions, and (3) the difference between the amounts of dividends, interest, and foreign withholding taxes recorded on the Fund’s books and the U.S. dollar equivalent of the amounts actually received or paid. Net unrealized foreign currency gains and losses arise from changes in the fair values of assets and liabilities, other than investments in securities at fiscal period end, resulting from changes in exchange rates. |
The Fund may invest in foreign securities, which may be subject to foreign taxes on income, gains on investments or currency repatriation, a portion of which may be recoverable. Foreign taxes, if any, are recorded based on the tax regulations and rates that exist in the foreign markets in which the Fund invests and are shown in the Statement of Operations.
The performance of the Fund may be materially affected positively or negatively by foreign currency strength or weakness relative to the U.S. dollar. Currency rates in foreign countries may fluctuate for a number of reasons, including changes in interest rates, political, economic, or social instability and development, and imposition of currency controls. Currency controls in certain foreign jurisdictions may cause the Fund to experience significant delays in its ability to repatriate its assets in U.S. dollars at quoted spot rates, and it is possible that the Fund’s ability to convert certain foreign currencies into U.S. dollars may be limited and may occur at discounts to quoted rates. As a result, the value of the Fund’s assets and liabilities denominated in such currencies that would ultimately be realized could differ from those reported on the Statement of Assets and Liabilities. Certain foreign companies may be subject to sanctions, embargoes, or other governmental actions that may limit the ability to invest in, receive, hold, or sell the securities of such companies, all of which affect the market and/or credit risk of the investments. Because of the inherent uncertainties of valuation, the values reflected in the financial statements may materially differ from the value received upon actual sale of those investments.
| L. | Forward Foreign Currency Contracts – The Fund may engage in foreign currency transactions either on a spot (i.e. for prompt delivery and settlement) basis, or through forward foreign currency contracts, to manage or minimize currency or exchange rate risk. |
The Fund may also enter into forward foreign currency contracts for the purchase or sale of a security denominated in a foreign currency in order to “lock in” the U.S. dollar price of that security, or the Fund may also enter into forward foreign currency contracts that do not provide for physical exchange of the two currencies on the settlement date, but instead are settled by a single cash payment calculated as the difference between the agreed upon exchange rate and the spot rate at settlement based upon an agreed upon notional amount (non-deliverable forwards).
A forward foreign currency contract is an obligation between two parties (“Counterparties”) to purchase or sell a specific currency for an agreed-upon price at a future date. The use of forward foreign currency contracts for hedging does not eliminate fluctuations in the price of the underlying securities the Fund owns or intends to acquire but establishes a rate of exchange in advance. Fluctuations in the value of these contracts are measured by the difference in the contract date and reporting date exchange rates and are recorded as unrealized appreciation (depreciation) until the contracts are closed. When the contracts are closed, realized gains (losses) are recorded. Realized and unrealized gains (losses) on the contracts are included in the Statement of Operations. The primary risks associated with forward foreign currency contracts include failure of the Counterparty to meet the terms of the contract and the value of the foreign currency changing unfavorably. These risks may be in excess of the amounts reflected in the Statement of Assets and Liabilities.
| M. | Other Risks – Changes in worldwide energy prices, exploration and production spending, government regulation, war, world events, local and international politics, economic conditions, exchange rates, transportation and storage costs and labor relations can affect companies in the energy sector. In addition, these companies are at an increased risk of civil liability and environmental damage claims, and are also subject to the risk of loss from terrorism and natural disasters. Commodity price volatility, imposition of import controls, increased competition, depletion of resources, development of alternative energy sources, and technological developments may also impact the energy sector. Investments in the energy sector may be cyclical and/or highly volatile and subject to swift price fluctuations. Energy markets are subject to both short- and long-term trends that impact demand for and supply of energy commodities. A decrease in the production of energy commodities or a decrease in the volume of such commodities available may adversely impact the financial performance of companies operating in the energy sector. In addition, significant declines in the price of oil may contribute to significant market volatility, which may adversely affect the Fund’s performance. |
The Fund is non-diversified and may invest in securities of fewer issuers than if it were diversified. Thus, the value of the Fund’s shares may vary more widely and the Fund may be subject to greater market and credit risk than if the Fund invested more broadly.
NOTE 2–Advisory Fees and Other Fees Paid to Affiliates
The Trust has entered into a master investment advisory agreement with the Adviser. Under the terms of the investment advisory agreement, the Fund accrues daily and pays monthly an advisory fee to the Adviser based on the annual rate of the Fund’s average daily net assets as follows:
| | |
| Average Daily Net Assets | | Rate |
| |
First $ 350 million | | 0.750% |
| |
Next $350 million | | 0.650% |
| |
Next $1.3 billion | | 0.550% |
| |
Next $2 billion | | 0.450% |
| |
Next $2 billion | | 0.400% |
| |
Next $2 billion | | 0.375% |
| |
Over $8 billion | | 0.350% |
For the year ended April 30, 2024, the effective advisory fee rate incurred by the Fund was 0.72%.
Under the terms of a master sub-advisory agreement between the Adviser and each of Invesco Asset Management Deutschland GmbH, Invesco Asset Management Limited, Invesco Asset Management (Japan) Limited, Invesco Hong Kong Limited, Invesco Senior Secured Management, Inc. and Invesco Canada Ltd. (collectively, the “Affiliated Sub-Advisers”) the Adviser, not the Fund, will pay 40% of the fees paid to the Adviser to any such Affiliated Sub-Adviser(s) that provide(s) discretionary investment management services to the Fund based on the percentage of assets allocated to such Affiliated Sub-Adviser(s).
Effective July 1, 2023, the Adviser has agreed, for an indefinite period, to waive advisory fees and/or reimburse expenses of all shares to the extent necessary to limit total annual fund operating expenses after fee waiver and/or expense reimbursement (excluding certain items discussed below) of Class A, Class C, Class Y, Investor Class, Class R5 and Class R6 shares to 2.00%, 2.75%, 1.75%, 2.00%, 1.75% and 1.75%, respectively, of the Fund’s average daily net assets (the “boundary limits”). Prior to July 1, 2023, the same boundary limits were in effect with an expiration date of June 30, 2023. In determining the Adviser’s obligation to waive advisory fees and/or reimburse expenses, the following expenses are not taken into account, and could cause the total annual fund operating expenses after fee waiver and/or expense reimbursement to exceed the numbers reflected above: (1) interest; (2) taxes; (3) dividend expense on short sales; (4) extraordinary or non-routine items, including litigation expenses; and (5) expenses that the Fund has incurred but did not actually pay because of an expense offset arrangement. Invesco may amend and/or terminate these boundary limits at any time in its sole discretion and will inform the Board of Trustees of any such changes. The Adviser did not waive fees and/or reimburse expenses during the period under these boundary limits.
Further, the Adviser has contractually agreed, through at least June 30, 2025, to waive the advisory fee payable by the Fund in an amount equal to 100% of the net advisory fees the Adviser receives from the affiliated money market funds on investments by the Fund of uninvested cash (excluding investments of cash collateral from securities lending) in such affiliated money market funds.
For the year ended April 30, 2024, the Adviser waived advisory fees of $5,302.
The Trust has entered into a master administrative services agreement with Invesco pursuant to which the Fund has agreed to pay Invesco for certain administrative costs incurred in providing accounting services to the Fund. For the year ended April 30, 2024, expenses incurred under the agreement are shown in the Statement of Operations as Administrative services fees. Invesco has entered into a sub-administration agreement whereby State Street Bank and Trust Company (“SSB”) serves as fund accountant and provides certain administrative services to the Fund. Pursuant to a custody agreement with the Trust on behalf of the Fund, SSB also serves as the Fund’s custodian.
The Trust has entered into a transfer agency and service agreement with Invesco Investment Services, Inc. (“IIS”) pursuant to which the Fund has agreed to pay IIS a fee for providing transfer agency and shareholder services to the Fund and reimburse IIS for certain expenses incurred by IIS in the course of providing such services. IIS may make payments to intermediaries that provide omnibus account services, sub-accounting services and/or networking services. All fees payable by IIS to intermediaries that provide omnibus account services or sub-accounting services are charged back to the Fund, subject to certain limitations approved by the Trust’s Board of Trustees. For the year ended April 30, 2024, expenses incurred under the agreement are shown in the Statement of Operations as Transfer agent fees.
The Trust has entered into master distribution agreements with Invesco Distributors, Inc. (“IDI”) to serve as the distributor for the Class A, Class C, Class Y, Investor Class, Class R5 and Class R6 shares of the Fund. The Trust has adopted plans pursuant to Rule 12b-1 under the 1940 Act with respect to the Fund’s Class A, Class C and Investor Class shares (collectively, the “Plans”). The Fund, pursuant to the Plans, pays IDI compensation at the annual rate of 0.25% of the Fund’s average daily net assets of Class A shares, 1.00% of the average daily net assets of Class C shares and 0.25% of the average daily net assets of Investor Class shares. The fees are accrued daily and paid monthly. Of the Plans payments, up to 0.25% of the average daily net assets of each class of shares may be paid to furnish continuing personal shareholder services to customers who purchase and own shares of such classes. Any amounts not paid as a service fee under the Plans would constitute an asset-based sales charge. Rules of the Financial Industry Regulatory Authority (“FINRA”) impose a cap on the total sales charges, including asset-based sales charges, that may be paid by any class of shares of the Fund. For the year ended April 30, 2024, expenses incurred under the Plans are shown in the Statement of Operations as Distribution fees.
Front-end sales commissions and CDSC (collectively, the “sales charges”) are not recorded as expenses of the Fund. Front-end sales commissions are deducted from proceeds from the sales of Fund shares prior to investment in Class A shares of the Fund. CDSC are deducted from redemption proceeds prior to remittance to the shareholder. During the year ended April 30, 2024, IDI advised the Fund that IDI retained $46,271 in front-end sales commissions from the sale of Class A shares and $7,577 and $3,469 from Class A and Class C shares, respectively, for CDSC imposed upon redemptions by shareholders.
For the year ended April 30, 2024, the Fund incurred $4,152 in brokerage commissions with Invesco Capital Markets, Inc., an affiliate of the Adviser and IDI, for portfolio transactions executed on behalf of the Fund.
Certain officers and trustees of the Trust are officers and directors of the Adviser, IIS and/or IDI.
NOTE 3–Additional Valuation Information
GAAP defines fair value as the price that would be received to sell an asset or paid to transfer a liability in an orderly transaction between market participants at the measurement date, under current market conditions. GAAP establishes a hierarchy that prioritizes the inputs to valuation methods, giving the highest priority to readily available unadjusted quoted prices in an active market for identical assets (Level 1) and the lowest priority to significant unobservable inputs (Level 3), generally when market prices are not readily available. Based on the valuation inputs, the securities or other investments are tiered into one of three levels. Changes in valuation methods may result in transfers in or out of an investment’s assigned level:
| | |
| Level 1 - | | Prices are determined using quoted prices in an active market for identical assets. |
| Level 2 - | | Prices are determined using other significant observable inputs. Observable inputs are inputs that other market participants may use in pricing a security. These may include quoted prices for similar securities, interest rates, prepayment speeds, credit risk, yield curves, loss severities, default rates, discount rates, volatilities and others. |
| Level 3 - | | Prices are determined using significant unobservable inputs. In situations where quoted prices or observable inputs are unavailable (for example, when there is little or no market activity for an investment at the end of the period), unobservable inputs may be used. Unobservable inputs reflect the Adviser’s |
| | |
| | assumptions about the factors market participants would use in determining fair value of the securities or instruments and would be based on the best available information. |
The following is a summary of the tiered valuation input levels, as of April 30, 2024. The level assigned to the securities valuations may not be an indication of the risk or liquidity associated with investing in those securities. Because of the inherent uncertainties of valuation, the values reflected in the financial statements may materially differ from the value received upon actual sale of those investments.
| | | | | | | | | | | | | | |
| | | Level 1 | | | Level 2 | | | Level 3 | | | Total |
| | | | |
Investments in Securities | | | | | | | | | | | | | | |
| | | | |
Common Stocks & Other Equity Interests | | $ | 475,192,495 | | | $ | 22,615,384 | | | | $– | | | $497,807,879 |
| | | | |
Money Market Funds | | | 2,799,519 | | | | 24,933,879 | | | | – | | | 27,733,398 |
| | | | |
Total Investments | | $ | 477,992,014 | | | $ | 47,549,263 | | | | $– | | | $525,541,277 |
NOTE 4–Expense Offset Arrangement(s)
The expense offset arrangement is comprised of transfer agency credits which result from balances in demand deposit accounts used by the transfer agent for clearing shareholder transactions. For the year ended April 30, 2024, the Fund received credits from this arrangement, which resulted in the reduction of the Fund’s total expenses of $26,508.
NOTE 5–Trustees’ and Officers’ Fees and Benefits
Trustees’ and Officers’ Fees and Benefits include amounts accrued by the Fund to pay remuneration to certain Trustees and Officers of the Fund. Trustees have the option to defer compensation payable by the Fund, and Trustees’ and Officers’ Fees and Benefits also include amounts accrued by the Fund to fund such deferred compensation amounts. Those Trustees who defer compensation have the option to select various Invesco Funds in which their deferral accounts shall be deemed to be invested. Finally, certain current Trustees were eligible to participate in a retirement plan that provided for benefits to be paid upon retirement to Trustees over a period of time based on the number of years of service. The Fund may have certain former Trustees who also participate in a retirement plan and receive benefits under such plan. Trustees’ and Officers’ Fees and Benefits include amounts accrued by the Fund to fund such retirement benefits. Obligations under the deferred compensation and retirement plans represent unsecured claims against the general assets of the Fund.
NOTE 6–Cash Balances
The Fund is permitted to temporarily carry a negative or overdrawn balance in its account with SSB, the custodian bank. Such balances, if any at period-end, are shown in the Statement of Assets and Liabilities under the payable caption Amount due custodian. To compensate the custodian bank for such overdrafts, the overdrawn Fund may either (1) leave funds as a compensating balance in the account so the custodian bank can be compensated by earning the additional interest; or (2) compensate by paying the custodian bank at a rate agreed upon by the custodian bank and Invesco, not to exceed the contractually agreed upon rate.
NOTE 7–Distributions to Shareholders and Tax Components of Net Assets
Tax Character of Distributions to Shareholders Paid During the Fiscal Years Ended April 30, 2024 and 2023:
| | | | | | | | | | |
| | | 2024 | | | | | | 2023 |
Ordinary income* | | $ | 10,147,410 | | | | | | | $5,560,192 |
| * | Includes short-term capital gain distributions, if any. |
Tax Components of Net Assets at Period-End:
| | | | |
| | | 2024 | |
|
| |
Undistributed ordinary income | | $ | 16,378,731 | |
|
| |
Net unrealized appreciation – investments | | | 63,420,411 | |
|
| |
Net unrealized appreciation (depreciation) – foreign currencies | | | (11,542 | ) |
|
| |
Temporary book/tax differences | | | (119,416 | ) |
|
| |
Capital loss carryforward | | | (256,465,648 | ) |
|
| |
Shares of beneficial interest | | | 677,164,893 | |
|
| |
Total net assets | | $ | 500,367,429 | |
|
| |
The difference between book-basis and tax-basis unrealized appreciation (depreciation) is due to differences in the timing of recognition of gains and losses on investments for tax and book purposes. The Fund’s net unrealized appreciation (depreciation) difference is attributable primarily to wash sales.
The temporary book/tax differences are a result of timing differences between book and tax recognition of income and/or expenses. The Fund’s temporary book/tax differences are the result of the trustee deferral of compensation and retirement plan benefits.
Capital loss carryforward is calculated and reported as of a specific date. Results of transactions and other activity after that date may affect the amount of capital loss carryforward actually available for the Fund to utilize. The ability to utilize capital loss carryforward in the future may be limited under the Internal Revenue Code and related regulations based on the results of future transactions.
The Fund has a capital loss carryforward as of April 30, 2024, as follows:
| | | | | | | | | | | | | | | | | | |
| Capital Loss Carryforward* | |
|
| |
| Expiration | | Short-Term | | | | | Long-Term | | | | | | Total | |
|
| |
Not subject to expiration | | $674,730 | | | | | | | $255,790,918 | | | | | | | | $256,465,648 | |
|
| |
| * | Capital loss carryforward is reduced for limitations, if any, to the extent required by the Internal Revenue Code and may be further limited depending upon a variety of factors, including the realization of net unrealized gains or losses as of the date of any reorganization. |
NOTE 8–Investment Transactions
The aggregate amount of investment securities (other than short-term securities, U.S. Government obligations and money market funds, if any) purchased and sold by the Fund during the year ended April 30, 2024 was $139,835,708 and $245,164,460, respectively. Cost of investments, including any derivatives, on a tax basis includes the adjustments for financial reporting purposes as of the most recently completed federal income tax reporting period-end.
| | | | |
Unrealized Appreciation (Depreciation) of Investments on a Tax Basis | |
Aggregate unrealized appreciation of investments | | | $76,666,945 | |
|
| |
Aggregate unrealized (depreciation) of investments | | | (13,246,534 | ) |
|
| |
Net unrealized appreciation of investments | | | $63,420,411 | |
|
| |
Cost of investments for tax purposes is $462,120,866.
NOTE 9–Reclassification of Permanent Differences
Primarily as a result of differing book/tax treatment of partnerships, on April 30, 2024, undistributed net investment income was increased by $4,381,811, undistributed net realized gain (loss) was decreased by $4,380,586 and shares of beneficial interest was decreased by $1,225. This reclassification had no effect on the net assets of the Fund.
NOTE 10–Share Information
| | | | | | | | | | | | | | | | |
| | | Summary of Share Activity | |
|
| |
| | |
| | | Year ended | | | Year ended | |
| | | April 30, 2024(a) | | | April 30, 2023 | |
| | | Shares | | | Amount | | | Shares | | | Amount | |
|
| |
Sold: | | | | | | | | | | | | | | | | |
Class A | | | 1,374,805 | | | $ | 39,691,636 | | | | 5,202,207 | | | $ | 143,039,733 | |
|
| |
Class C | | | 112,842 | | | | 2,699,173 | | | | 762,031 | | | | 17,633,468 | |
|
| |
Class Y | | | 861,794 | | | | 24,825,051 | | | | 2,338,989 | | | | 64,185,403 | |
|
| |
Investor Class | | | 374,687 | | | | 10,669,124 | | | | 1,570,683 | | | | 42,120,094 | |
|
| |
Class R5 | | | 48,284 | | | | 1,438,034 | | | | 196,129 | | | | 5,385,830 | |
|
| |
Class R6 | | | 101,933 | | | | 3,010,390 | | | | 224,880 | | | | 6,366,684 | |
|
| |
| | | | |
Issued as reinvestment of dividends: | | | | | | | | | | | | | | | | |
Class A | | | 209,606 | | | | 5,816,539 | | | | 113,992 | | | | 3,118,777 | |
|
| |
Class C | | | 20,847 | | | | 480,931 | | | | 10,704 | | | | 245,326 | |
|
| |
Class Y | | | 36,497 | | | | 1,014,978 | | | | 24,611 | | | | 674,832 | |
|
| |
Investor Class | | | 59,732 | | | | 1,649,790 | | | | 31,416 | | | | 855,764 | |
|
| |
Class R5 | | | 4,752 | | | | 135,989 | | | | 3,496 | | | | 98,628 | |
|
| |
Class R6 | | | 5,354 | | | | 153,240 | | | | 3,382 | | | | 95,413 | |
|
| |
| | | | |
Automatic conversion of Class C shares to Class A shares: | | | | | | | | | | | | | | | | |
Class A | | | 85,993 | | | | 2,473,848 | | | | 118,325 | | | | 3,278,354 | |
|
| |
Class C | | | (103,371 | ) | | | (2,473,848 | ) | | | (141,333 | ) | | | (3,278,354 | ) |
|
| |
| | | | |
Reacquired: | | | | | | | | | | | | | | | | |
Class A | | | (4,279,032 | ) | | | (119,883,605 | ) | | | (4,867,160 | ) | | | (130,065,761 | ) |
|
| |
Class C | | | (480,393 | ) | | | (11,115,500 | ) | | | (530,214 | ) | | | (11,501,514 | ) |
|
| |
Class Y | | | (1,176,875 | ) | | | (32,933,798 | ) | | | (3,488,118 | ) | | | (91,528,651 | ) |
|
| |
Investor Class | | | (914,011 | ) | | | (25,529,341 | ) | | | (2,024,491 | ) | | | (54,193,984 | ) |
|
| |
Class R5 | | | (141,590 | ) | | | (4,090,506 | ) | | | (156,519 | ) | | | (4,384,418 | ) |
|
| |
Class R6 | | | (194,138 | ) | | | (5,547,230 | ) | | | (206,573 | ) | | | (5,537,097 | ) |
|
| |
Net increase (decrease) in share activity | | | (3,992,284 | ) | | $ | (107,515,105 | ) | | | (813,563 | ) | | $ | (13,391,473 | ) |
|
| |
| (a) | There are entities that are record owners of more than 5% of the outstanding shares of the Fund and in the aggregate own 23% of the outstanding shares of the Fund. IDI has an agreement with these entities to sell Fund shares. The Fund, Invesco and/or Invesco affiliates may make payments to these entities, which are considered to be related to the Fund, for providing services to the Fund, Invesco and/or Invesco affiliates including but not limited to services such as securities brokerage, distribution, third party record keeping and account servicing. The Fund has no knowledge as to whether all or any portion of the shares owned of record by these entities are also owned beneficially. |
Report of Independent Registered Public Accounting Firm
To the Board of Trustees of AIM Sector Funds (Invesco Sector Funds) and Shareholders of Invesco Energy Fund
Opinion on the Financial Statements
We have audited the accompanying statement of assets and liabilities, including the schedule of investments, of Invesco Energy Fund (one of the funds constituting AIM Sector Funds (Invesco Sector Funds), referred to hereafter as the “Fund”) as of April 30, 2024, the related statement of operations for the year ended April 30, 2024, the statement of changes in net assets for each of the two years in the period ended April 30, 2024, including the related notes, and the financial highlights for each of the five years in the period ended April 30, 2024 (collectively referred to as the “financial statements”). In our opinion, the financial statements present fairly, in all material respects, the financial position of the Fund as of April 30, 2024, the results of its operations for the year then ended, the changes in its net assets for each of the two years in the period ended April 30, 2024 and the financial highlights for each of the five years in the period ended April 30, 2024 in conformity with accounting principles generally accepted in the United States of America.
Basis for Opinion
These financial statements are the responsibility of the Fund’s management. Our responsibility is to express an opinion on the Fund’s financial statements based on our audits. We are a public accounting firm registered with the Public Company Accounting Oversight Board (United States) (PCAOB) and are required to be independent with respect to the Fund in accordance with the U.S. federal securities laws and the applicable rules and regulations of the Securities and Exchange Commission and the PCAOB.
We conducted our audits of these financial statements in accordance with the standards of the PCAOB. Those standards require that we plan and perform the audit to obtain reasonable assurance about whether the financial statements are free of material misstatement, whether due to error or fraud.
Our audits included performing procedures to assess the risks of material misstatement of the financial statements, whether due to error or fraud, and performing procedures that respond to those risks. Such procedures included examining, on a test basis, evidence regarding the amounts and disclosures in the financial statements. Our audits also included evaluating the accounting principles used and significant estimates made by management, as well as evaluating the overall presentation of the financial statements. Our procedures included confirmation of securities owned as of April 30, 2024 by correspondence with the custodian, transfer agent and broker. We believe that our audits provide a reasonable basis for our opinion.
/s/PricewaterhouseCoopers LLP
Houston, Texas
June 20, 2024
We have served as the auditor of one or more of the investment companies in the Invesco group of investment companies since at least 1995. We have not been able to determine the specific year we began serving as auditor.
Calculating your ongoing Fund expenses
Example
As a shareholder of the Fund, you incur two types of costs: (1) transaction costs, which may include sales charges (loads) on purchase payments or contingent deferred sales charges on redemptions, if any; and (2) ongoing costs, including management fees, distribution and/or service (12b-1) fees, and other Fund expenses. This example is intended to help you understand your ongoing costs (in dollars) of investing in the Fund and to compare these costs with ongoing costs of investing in other mutual funds. The example is based on an investment of $1,000 invested at the beginning of the period and held for the entire period November 1, 2023 through April 30, 2024.
Actual expenses
The table below provides information about actual account values and actual expenses. You may use the information in this table, together with the amount you invested, to estimate the expenses that you paid over the period. Simply divide your account value by $1,000 (for example, an $8,600 account value divided by $1,000 = 8.6), then multiply the result by the number in the table under the heading entitled “Actual Expenses Paid During Period” to estimate the expenses you paid on your account during this period.
Hypothetical example for comparison purposes
The table below also provides information about hypothetical account values and hypothetical expenses based on the Fund’s actual expense ratio and an assumed rate of return of 5% per year before expenses, which is not the Fund’s actual return.
The hypothetical account values and expenses may not be used to estimate the actual ending account balance or expenses you paid for the period. You may use this information to compare the ongoing costs of investing in the Fund and other funds. To do so, compare this 5% hypothetical example with the 5% hypothetical examples that appear in the shareholder reports of the other funds.
Please note that the expenses shown in the table are meant to highlight your ongoing costs only and do not reflect any transaction costs, such as sales charges (loads) on purchase payments or contingent deferred sales charges on redemptions, if any. Therefore, the hypothetical information is useful in comparing ongoing costs only, and will not help you determine the relative total costs of owning different funds. In addition, if these transaction costs were included, your costs would have been higher.
| | | | | | | | | | | | |
| | | | | ACTUAL | | HYPOTHETICAL (5% annual return before expenses) | | |
| | | Beginning
Account Value
(11/01/23) | | Ending
Account Value (04/30/24)1 | | Expenses
Paid During Period2 | | Ending
Account Value
(04/30/24) | | Expenses
Paid During
Period2 | | Annualized
Expense Ratio |
Class A | | $1,000.00 | | $1,100.00 | | $6.58 | | $1,018.60 | | $6.32 | | 1.26% |
Class C | | 1,000.00 | | 1,095.80 | | 10.47 | | 1,014.87 | | 10.07 | | 2.01 |
Class Y | | 1,000.00 | | 1,101.50 | | 5.28 | | 1,019.84 | | 5.07 | | 1.01 |
Investor Class | | 1,000.00 | | 1,100.10 | | 6.58 | | 1,018.60 | | 6.32 | | 1.26 |
Class R5 | | 1,000.00 | | 1,101.80 | | 4.81 | | 1,020.29 | | 4.62 | | 0.92 |
Class R6 | | 1,000.00 | | 1,102.30 | | 4.44 | | 1,020.64 | | 4.27 | | 0.85 |
| 1 | The actual ending account value is based on the actual total return of the Fund for the period November 1, 2023 through April 30, 2024, after actual expenses and will differ from the hypothetical ending account value which is based on the Fund’s expense ratio and a hypothetical annual return of 5% before expenses. |
| 2 | Expenses are equal to the Fund’s annualized expense ratio as indicated above multiplied by the average account value over the period, multiplied by 182/366 to reflect the most recent fiscal half year. |
Tax Information
Form 1099-DIV, Form 1042-S and other year–end tax information provide shareholders with actual calendar year amounts that should be included in their tax returns. Shareholders should consult their tax advisers.
The following distribution information is being provided as required by the Internal Revenue Code or to meet a specific state’s requirement.
The Fund designates the following amounts or, if subsequently determined to be different, the maximum amount allowable for its fiscal year ended April 30, 2024:
| | | | | | |
Federal and State Income Tax | | | | | |
Qualified Dividend Income* | | | 99.93 | % |
Corporate Dividends Received Deduction* | | | 98.91 | % |
U.S. Treasury Obligations* | | | 0.00 | % |
Qualified Business Income* | | | 0.00 | % |
Business Interest Income* | | | 0.00 | % |
| | * | The above percentages are based on ordinary income dividends paid to shareholders during the Fund’s fiscal year. |
Trustees and Officers
The address of each trustee and officer is AIM Sector Funds (Invesco Sector Funds) (the “Trust”), 11 Greenway Plaza, Houston, Texas 77046-1173. The trustees serve for the life of the Trust, subject to their earlier death, incapacitation, resignation, retirement or removal as more specifically provided in the Trust’s organizational documents. Each officer serves for a one year term or until their successors are elected and qualified. Column two below includes length of time served with predecessor entities, if any.
| | | | | | | | |
Name, Year of Birth and Position(s) Held with the Trust | | Trustee and/or Officer Since | | Principal Occupation(s) During Past 5 Years | | Number of Funds in Fund Complex Overseen by Trustee | | Other Directorship(s) Held by Trustee During At Least The Past 5 Years |
| Interested Trustees | | | | | | | | |
Jeffrey H. Kupor1 – 1968 Trustee | | 2024 | | Senior Managing Director and General Counsel, Invesco Ltd.; Trustee, Invesco Foundation, Inc.; Director, Invesco Advisers, Inc.; Executive Vice President, Invesco Asset Management (Bermuda), Ltd., Invesco Investments (Bermuda) Ltd.; and Vice President, Invesco Group Services, Inc. Formerly: Head of Legal of the Americas, Invesco Ltd.; Senior Vice President and Secretary, Invesco Advisers, Inc. (formerly known as Invesco Institutional (N.A.), Inc.) (registered investment adviser); Secretary, Invesco Distributors, Inc. (formerly known as Invesco AIM Distributors, Inc.); Vice President and Secretary, Invesco Investment Services, Inc. (formerly known as Invesco AIM Investment Services, Inc.); Senior Vice President, Chief Legal Officer and Secretary, The Invesco Funds; Secretary and General Counsel, Invesco Investment Advisers LLC (formerly known as Van Kampen Asset Management); Secretary and General Counsel, Invesco Capital Markets, Inc. (formerly known as Van Kampen Funds Inc.) and Chief Legal Officer, Invesco Exchange-Traded Fund Trust, Invesco Exchange-Traded Fund Trust II, Invesco India Exchange-Traded Fund Trust, Invesco Actively Managed Exchange-Traded Fund Trust, Invesco Actively Managed Exchange-Traded Commodity Fund Trust and Invesco Exchange-Traded Self-Indexed Fund Trust; Secretary and Vice President, Harbourview Asset Management Corporation; Secretary and Vice President, OppenheimerFunds, Inc. and Invesco Managed Accounts, LLC; Secretary and Senior Vice President, OFI Global Institutional, Inc.; Secretary and Vice President, OFI SteelPath, Inc.; Secretary and Vice President, Oppenheimer Acquisition Corp.; Secretary and Vice President, Shareholder Services, Inc.; Secretary and Vice President, Trinity Investment Management Corporation, Senior Vice President, Invesco Distributors, Inc.; Secretary and Vice President, Jemstep, Inc.; Head of Legal, Worldwide Institutional, Invesco Ltd.; Secretary and General Counsel, INVESCO Private Capital Investments, Inc.; Senior Vice President, Secretary and General Counsel, Invesco Management Group, Inc. (formerly known as Invesco AIM Management Group, Inc.); Assistant Secretary, INVESCO Asset Management (Bermuda) Ltd.; Secretary and General Counsel, Invesco Private Capital, Inc.; Assistant Secretary and General Counsel, INVESCO Realty, Inc.; Secretary and General Counsel, Invesco Senior Secured Management, Inc.; Secretary, Sovereign G./P. Holdings Inc.; Secretary, Invesco Indexing LLC; and Secretary, W.L. Ross & Co., LLC | | 164 | | None |
Douglas Sharp1 – 1974 Trustee | | 2024 | | Senior Managing Director and Head of Americas & EMEA, Invesco Ltd. Formerly: Director and Chairman Invesco UK Limited; Director, Chairman and Chief Executive, Invesco Fund Managers Limited | | 164 | | None |
| 1 | Mr. Kupor and Mr. Sharp are considered interested persons (within the meaning of Section 2(a)(19) of the 1940 Act) of the Trust because they are officers of the Adviser to the Trust, and officers of Invesco Ltd., ultimate parent of the Adviser. |
Trustees and Officers–(continued)
| | | | | | | | |
Name, Year of Birth and Position(s) Held with the Trust | | Trustee and/or Officer Since | | Principal Occupation(s) During Past 5 Years | | Number of
Funds in Fund Complex Overseen by
Trustee | | Other Directorship(s) Held by Trustee During At Least The Past 5 Years |
| Independent Trustees | | | | | | | | |
Beth Ann Brown – 1968 Trustee (2019) and Chair (2022) | | 2019 | | Independent Consultant Formerly: Head of Intermediary Distribution, Managing Director, Strategic Relations, Managing Director, Head of National Accounts, Senior Vice President, National Account Manager and Senior Vice President, Key Account Manager, Columbia Management Investment Advisers LLC; and Vice President, Key Account Manager, Liberty Funds Distributor, Inc. | | 164 | | Director, Board of Directors of Caron Engineering Inc.; Formerly: Advisor, Board of Advisors of Caron Engineering Inc.; President and Director, Acton Shapleigh Youth Conservation Corps (non-profit); President and Director Director of Grahamtastic Connection (non-profit); and Trustee of certain Oppenheimer Funds |
Carol Deckbar – 1962 Trustee | | 2024 | | Formerly: Executive Vice President and Chief Product Officer, TIAA Financial Services; Executive Vice President and Principal, College Retirement Equities Fund at TIAA; Executive Vice President and Head of Institutional Investments and Endowment Services, TIAA | | 164 | | Formerly: Board Member, TIAA Asset Management, Inc.; and Board Member, TH Real Estate Group Holdings Company |
Cynthia Hostetler – 1962 Trustee | | 2017 | | Non-Executive Director and Trustee of a number of public and private business corporations Formerly: Director, Aberdeen Investment Funds (4 portfolios); Director, Artio Global Investment LLC (mutual fund complex); Director, Edgen Group, Inc. (specialized energy and infrastructure products distributor); Director, Genesee & Wyoming, Inc. (railroads); Head of Investment Funds and Private Equity, Overseas Private Investment Corporation; President, First Manhattan Bancorporation, Inc.; and Attorney, Simpson Thacher & Bartlett LLP | | 164 | | Resideo Technologies, Inc. (smart home technology); Vulcan Materials Company (construction materials company); Trilinc Global Impact Fund; Investment Company Institute (professional organization); and Independent Directors Council (professional organization) |
Eli Jones – 1961 Trustee | | 2016 | | Professor and Dean Emeritus, Mays Business School - Texas A&M University Formerly: Dean of Mays Business School-Texas A&M University; Professor and Dean, Walton College of Business, University of Arkansas and E.J. Ourso College of Business, Louisiana State University; and Director, Arvest Bank | | 164 | | Insperity, Inc. (formerly known as Administaff) (human resources provider); Board Member of the regional board, First Financial Bank Texas; and Boad Member, First Financial Bankshares, Inc. Texas |
Elizabeth Krentzman – 1959 Trustee | | 2019 | | Formerly: Principal and Chief Regulatory Advisor for Asset Management Services and U.S. Mutual Fund Leader of Deloitte & Touche LLP; General Counsel of the Investment Company Institute (trade association); National Director of the Investment Management Regulatory Consulting Practice, Principal, Director and Senior Manager of Deloitte & Touche LLP; Assistant Director of the Division of Investment Management - Office of Disclosure and Investment Adviser Regulation of the U.S. Securities and Exchange Commission and various positions with the Division of Investment Management – Office of Regulatory Policy of the U.S. Securities and Exchange Commission; and Associate at Ropes & Gray LLP | | 164 | | Formerly: Member of the Cartica Funds Board of Directors (private investment fund); Trustee of the University of Florida National Board Foundation; Member of the University of Florida Law Center Association, Inc. Board of Trustees, Audit Committee and Membership Committee; and Trustee of certain Oppenheimer Funds |
Anthony J. LaCava, Jr. – 1956 Trustee | | 2019 | | Formerly: Director and Member of the Audit Committee, Blue Hills Bank (publicly traded financial institution) and Managing Partner, KPMG LLP | | 164 | | Member and Chairman, of the Bentley University, Business School Advisory Council; Formerly: Board Member and Chair of the Audit and Finance Committee and Nominating Committee, KPMG LLP |
James “Jim” Liddy – 1959 Trustee | | 2024 | | Formerly: Chairman, Global Financial Services, Americas and Retired Partner, KPMG LLP | | 164 | | Director and Treasurer, Gulfside Place Condominium Association, Inc. and Non-Executive Director, Kellenberg Memorial High School |
Trustees and Officers–(continued)
| | | | | | | | |
Name, Year of Birth and Position(s) Held with the Trust | | Trustee and/or Officer Since | | Principal Occupation(s) During Past 5 Years | | Number of Funds in Fund Complex Overseen by Trustee | | Other Directorship(s) Held by Trustee During At Least The Past 5 Years |
| Independent Trustees–(continued) |
Prema Mathai-Davis – 1950 Trustee | | 2003 | | Formerly: Co-Founder & Partner of Quantalytics Research, LLC, (a FinTech Investment Research Platform for the Self-Directed Investor); Trustee of YWCA Retirement Fund; CEO of YWCA of the USA; Board member of the NY Metropolitan Transportation Authority; Commissioner of the NYC Department of Aging; and Board member of Johns Hopkins Bioethics Institute | | 164 | | Member of Board of Positive Planet US (non-profit) and HealthCare Chaplaincy Network (non-profit) |
Joel W. Motley – 1952 Trustee | | 2019 | | Director of Office of Finance, Federal Home Loan Bank System; Managing Director of Carmona Motley Inc. (privately held financial advisor); Member of the Council on Foreign Relations and its Finance and Budget Committee; Chairman Emeritus of Board of Human Rights Watch and Member of its Investment Committee; and Member of Investment Committee Board of Historic Hudson Valley (non-profit cultural organization); and Member of the Vestry and the Investment Committee of Trinity Church Wall Street. Formerly: Managing Director of Public Capital Advisors, LLC (privately held financial advisor); Managing Director of Carmona Motley Hoffman, Inc. (privately held financial advisor); and Director of Columbia Equity Financial Corp. (privately held financial advisor) | | 164 | | Member of Board of Trust for Mutual Understanding (non-profit promoting the arts and environment); Member of Board of Greenwall Foundation (bioethics research foundation) and its Investment Committee; Member of Board of Friends of the LRC (non-profit legal advocacy); and Board Member and Investment Committee Member of Pulitzer Center for Crisis Reporting (non-profit journalism); and Trustee of certain Oppenheimer Funds; |
Teresa M. Ressel – 1962 Trustee | | 2017 | | Non-executive director and trustee of a number of public and private business corporations Formerly: Chief Executive Officer, UBS Securities LLC (investment banking); Group Chief Operating Officer, UBS AG Americas (investment banking); Sr. Management Team Olayan America, The Olayan Group (international investor/commercial/industrial); and Assistant Secretary for Management & Budget and Designated Chief Financial Officer, U.S. Department of Treasury | | 164 | | None |
Robert C. Troccoli – 1949 Trustee | | 2016 | | Formerly: Adjunct Professor, University of Denver – Daniels College of Business; and Managing Partner, KPMG LLP | | 164 | | None |
Daniel S. Vandivort – 1954 Trustee | | 2019 | | President, Flyway Advisory Services LLC (consulting and property management) and Member, Investment Committee of Historic Charleston Foundation Formerly: President and Chief Investment Officer, previously Head of Fixed Income, Weiss Peck and Greer/Robeco Investment Management; Trustee and Chair, Weiss Peck and Greer Funds Board; and various capacities at CS First Boston including Head of Fixed Income at First Boston Asset Management. | | 164 | | Formerly: Trustee and Governance Chair, Oppenheimer Funds; Treasurer, Chairman of the Audit and Finance Committee, Huntington Disease Foundation of America |
Trustees and Officers–(continued)
| | | | | | | | |
Name, Year of Birth and Position(s) Held with the Trust | | Trustee and/or Officer Since | | Principal Occupation(s) During Past 5 Years | | Number of
Funds in
Fund Complex
Overseen by
Trustee | | Other Directorship(s)
Held by Trustee During
At Least
The Past 5 Years |
| Officers | | | | | | | | |
| Glenn Brightman – 1972 President and Principal Executive Officer | | 2023 | | Chief Operating Officer, Americas, Invesco Ltd.; Senior Vice President, Invesco Advisers, Inc.; President and Principal Executive Officer, The Invesco Funds; Manager, Invesco Investment Advisers LLC. Formerly: Global Head of Finance, Invesco Ltd; Executive Vice President and Chief Financial Officer, Nuveen | | N/A | | N/A |
Melanie Ringold – 1975 Senior Vice President, Chief Legal Officer and Secretary | | 2023 | | Head of Legal of the Americas, Invesco Ltd.; Senior Vice President and Secretary, Invesco Advisers, Inc. (formerly known as Invesco Institutional (N.A.), Inc.) (registered investment adviser); Secretary, Invesco Distributors, Inc. (formerly known as Invesco AIM Distributors, Inc.); Secretary, Invesco Investment Services, Inc. (formerly known as Invesco AIM Investment Services, Inc.); Senior Vice President, Chief Legal Officer and Secretary, The Invesco Funds; Secretary, Invesco Investment Advisers LLC, Invesco Capital Markets, Inc.; Chief Legal Officer, Invesco Exchange-Traded Fund Trust, Invesco Exchange-Traded Fund Trust II, Invesco India Exchange-Traded Fund Trust, Invesco Actively Managed Exchange-Traded Fund Trust, Invesco Actively Secretary and Vice President, Harbourview Asset Management Corporation; Secretary and Senior Vice President, OppenheimerFunds, Inc. and Invesco Managed Accounts, LLC; Secretary and Senior Vice President, Oppenheimer Acquisition Corp.; Secretary, SteelPath Funds Remediation LLC; and Secretary and Senior Vice President, Trinity Investment Management Corporation Formerly: Secretary and Senior Vice President, OFI SteelPath, Inc., Assistant Secretary, Invesco Distributors, Inc., Invesco Advisers, Inc., Invesco Investment Services, Inc., Invesco Capital Markets, Inc., Invesco Capital Management LLC and Invesco Investment Advisers LLC; and Assistant Secretary and Assistant Vice President, Invesco Funds | | N/A | | N/A |
John M. Zerr – 1962 Senior Vice President | | 2006 | | Chief Operating Officer of the Americas; Senior Vice President, Invesco Advisers, Inc. (formerly known as Invesco Institutional (N.A.), Inc.) (registered investment adviser); Senior Vice President, Invesco Distributors, Inc. (formerly known as Invesco AIM Distributors, Inc.); Director and Vice President, Invesco Investment Services, Inc. (formerly known as Invesco AIM Investment Services, Inc.) Senior Vice President, The Invesco Funds; Managing Director, Invesco Capital Management LLC; Senior Vice President, Invesco Capital Markets, Inc. (formerly known as Van Kampen Funds Inc.); Manager, Invesco Specialized Products, LLC; Member, Invesco Canada Funds Advisory Board; Director, President and Chief Executive Officer, Invesco Corporate Class Inc. (corporate mutual fund company); Director, Chairman, President and Chief Executive Officer, Invesco Canada Ltd. (formerly known as Invesco Trimark Ltd./Invesco Trimark Ltèe) (registered investment adviser and registered transfer agent); President, Invesco, Inc.; President, Invesco Global Direct Real Estate Feeder GP Ltd.; President, Invesco IP Holdings (Canada) Ltd; President, Invesco Global Direct Real Estate GP Ltd.; and President Invesco Financial Services Ltd. / Services Financiers Invesco Ltée Formerly: Director and Chairman, Invesco Trust Company, Manager, Invesco Indexing LLC; Director, Invesco Investment Advisers LLC (formerly known as Van Kampen Asset Management); President, Trimark Investments Ltd/Services Financiers Invesco Ltee; Director and Senior Vice President, Invesco Insurance Agency, Inc.; Director and Senior Vice President, Invesco Management Group, Inc. (formerly known as Invesco AIM Management Group, Inc.); Secretary and General Counsel, Invesco Management Group, Inc. (formerly known as Invesco AIM Management Group, Inc.); Secretary, Invesco Investment Services, Inc. (formerly known as Invesco AIM Investment Services, Inc.); Chief Legal Officer and Secretary, The Invesco Funds; Secretary and General Counsel, Invesco Investment Advisers LLC (formerly known as Van Kampen Asset Management); Secretary and General Counsel, Invesco Capital Markets, Inc. (formerly known as Van Kampen Funds Inc.); Chief Legal Officer, Invesco Exchange-Traded Fund Trust, Invesco Exchange-Traded Fund Trust II, Invesco India Exchange-Traded Fund Trust, Invesco Actively Managed Exchange-Traded Fund Trust, Invesco Actively Managed Exchange-Traded Commodity Fund Trust and Invesco Exchange-Traded Self-Indexed Fund Trust; Secretary, Invesco Indexing LLC; Director, Secretary, General Counsel and Senior Vice President, Van Kampen Exchange Corp.; Director, Vice President and Secretary, IVZ Distributors, Inc. (formerly known as INVESCO Distributors, Inc.); Director and Vice President, INVESCO Funds Group, Inc.; Director and Vice President, Van Kampen Advisors Inc.; Director, Vice President, Secretary and General Counsel, Van Kampen Investor Services Inc.; Director and Secretary, Invesco Distributors, Inc. (formerly known as Invesco AIM Distributors, Inc.); Director, Senior Vice President, General Counsel and Secretary, Invesco AIM Advisers, Inc. and Van Kampen Investments Inc.; Director, Vice President and Secretary, Fund Management Company; Director, Senior Vice President, Secretary, General Counsel and Vice President, Invesco AIM Capital Management, Inc.; and Chief Operating Officer and General Counsel, Liberty Ridge Capital, Inc. (an investment adviser) | | N/A | | N/A |
Trustees and Officers–(continued)
| | | | | | | | |
Name, Year of Birth and Position(s) Held with the Trust | | Trustee and/or Officer Since | | Principal Occupation(s) During Past 5 Years | | Number of
Funds in
Fund Complex
Overseen by
Trustee | | Other Directorship(s)
Held by Trustee
During At Least
The Past 5 Years |
| Officers–(continued) | | | | | | | | |
Tony Wong – 1973 Senior Vice President | | 2023 | | Senior Managing Director, Invesco Ltd.; Director, Chairman, Chief Executive Officer and President, Invesco Advisers, Inc.; Director and Chairman, Invesco Private Capital, Inc., INVESCO Private Capital Investments, Inc. and INVESCO Realty, Inc.; Director, Invesco Senior Secured Management, Inc.; President, Invesco Managed Accounts, LLC and SNW Asset Management Corporation; and Senior Vice President, The Invesco Funds Formerly: Assistant Vice President, The Invesco Funds; and Vice President, Invesco Advisers, Inc. | | N/A | | N/A |
Stephanie C. Butcher – 1971 Senior Vice President | | 2023 | | Senior Managing Director, Invesco Ltd.; Senior Vice President, The Invesco Funds; Director and Chief Executive Officer, Invesco Asset Management Limited | | N/A | | N/A |
Adrien Deberghes – 1967 Principal Financial Officer, Treasurer and Senior Vice President | | 2020 | | Head of the Fund Office of the CFO and Fund Administration; Vice President, Invesco Advisers, Inc.; Director, Invesco Trust Company; Principal Financial Officer, Treasurer and Senior Vice President, The Invesco Funds; Vice President, Invesco Exchange-Traded Fund Trust, Invesco Exchange-Traded Fund Trust II, Invesco India Exchange-Traded Fund Trust, Invesco Actively Managed Exchange-Traded Fund Trust, Invesco Actively Managed Exchange-Traded Commodity Fund Trust and Invesco Exchange-Traded Self-Indexed Fund Trust Formerly: Vice President, The Invesco Funds; Senior Vice President and Treasurer, Fidelity Investments | | N/A | | N/A |
Crissie M. Wisdom – 1969 Anti-Money Laundering Compliance Officer | | 2013 | | Anti-Money Laundering and OFAC Compliance Officer for Invesco U.S. entities including: Invesco Advisers, Inc. and its affiliates, Invesco Capital Markets, Inc., Invesco Distributors, Inc., Invesco Investment Services, Inc., The Invesco Funds, Invesco Capital Management, LLC, Invesco Trust Company; and Fraud Prevention Manager for Invesco Investment Services, Inc. | | N/A | | N/A |
Todd F. Kuehl – 1969 Chief Compliance Officer and Senior Vice President | | 2020 | | Chief Compliance Officer, Invesco Advisers, Inc. (registered investment adviser); and Chief Compliance Officer and Senior Vice President, The Invesco Funds Formerly: Managing Director and Chief Compliance Officer, Legg Mason (Mutual Funds); Chief Compliance Officer, Legg Mason Private Portfolio Group (registered investment adviser) | | N/A | | N/A |
James Bordewick, Jr. – 1959 Senior Vice President and Senior Officer | | 2022 | | Senior Vice President and Senior Officer, The Invesco Funds Formerly: Chief Legal Officer, KingsCrowd, Inc. (research and analytical platform for investment in private capital markets); Chief Operating Officer and Head of Legal and Regulatory, Netcapital (private capital investment platform); Managing Director, General Counsel of asset management and Chief Compliance Officer for asset management and private banking, Bank of America Corporation; Chief Legal Officer, Columbia Funds and BofA Funds; Senior Vice President and Associate General Counsel, MFS Investment Management; Chief Legal Officer, MFS Funds; Associate, Ropes & Gray; and Associate, Gaston Snow & Ely Bartlett | | N/A | | N/A |
The Statement of Additional Information of the Trust includes additional information about the Fund’s Trustees and is available upon request, without charge, by calling 1.800.959.4246. Please refer to the Fund’s Statement of Additional Information for information on the Fund’s sub-advisers.
| | | | | | |
| Office of the Fund | | Investment Adviser | | Distributor | | Auditors |
| 11 Greenway Plaza | | Invesco Advisers, Inc. | | Invesco Distributors, Inc. | | PricewaterhouseCoopers LLP |
| Houston, TX 77046-1173 | | 1331 Spring Street, NW, Suite 2500 | | 11 Greenway Plaza | | 1000 Louisiana Street, Suite 5800 |
| | Atlanta, GA 30309 | | Houston, TX 77046-1173 | | Houston, TX 77002-5021 |
| | | |
| Counsel to the Fund | | Counsel to the Independent Trustees | | Transfer Agent | | Custodian |
| Stradley Ronon Stevens & Young, LLP | | Sidley Austin LLP | | Invesco Investment Services, Inc. | | State Street Bank and Trust Company |
| 2005 Market Street, Suite 2600 | | 787 Seventh Avenue | | 11 Greenway Plaza | | 225 Franklin Street |
| Philadelphia, PA 19103-7018 | | New York, NY 10019 | | Houston, TX 77046-1173 | | Boston, MA 02110-2801 |
Proxy Results
A Special Joint Meeting (“Meeting”) of Shareholders of AIM Sector Funds (Invesco Sector Funds), a Delaware statutory trust (“Trust”), was held on January 16, 2024. The Meeting was held for the following purpose:
(1) Elect 14 trustees to the Board of Trustees of the Trust, each of whom will serve until his or her successor is duly elected and qualified.
The results of the voting on the above matter were as follows:
| | | | | | | | | | |
| | | Matter | | Votes For | | | Votes
Against/Withheld | |
|
| |
(1)* | | Beth Ann Brown | | | 595,446,022.84 | | | | 16,915,661.31 | |
| | Carol Deckbar | | | 595,102,087.25 | | | | 17,259,596.89 | |
| | Cynthia Hostetler | | | 595,359,921.21 | | | | 17,001,762.94 | |
| | Dr. Eli Jones | | | 594,949,311.14 | | | | 17,412,373.00 | |
| | Elizabeth Krentzman | | | 595,453,833.65 | | | | 16,907,850.50 | |
| | Jeffrey H. Kupor | | | 595,342,690.51 | | | | 17,018,993.64 | |
| | Anthony J. LaCava, Jr. | | | 595,293,865.38 | | | | 17,067,818.77 | |
| | James Liddy | | | 594,980,026.97 | | | | 17,381,657.17 | |
| | Dr. Prema Mathai-Davis | | | 594,031,204.04 | | | | 18,330,480.11 | |
| | Joel W. Motley | | | 594,381,710.91 | | | | 17,979,973.23 | |
| | Teresa M. Ressel | | | 595,821,958.43 | | | | 16,539,725.72 | |
| | Douglas Sharp | | | 595,715,711.66 | | | | 16,645,972.48 | |
| | Robert C. Troccoli | | | 594,748,318.91 | | | | 17,613,365.24 | |
| | Daniel S. Vandivort | | | 595,002,691.19 | | | | 17,358,992.96 | |
* Proposal 1 required approval by a combined vote of all the portfolios of AIM Sector Funds (Invesco Sector Funds).

Go paperless with eDelivery
Visit invesco.com/edelivery to enjoy the convenience and security of anytime electronic access to your investment documents.
With eDelivery, you can elect to have any or all of the following materials delivered straight to your inbox to download, save and print from your own computer:
∎ Fund reports and prospectuses
∎ Quarterly statements
∎ Daily confirmations
∎ Tax forms
Invesco mailing information
Send general correspondence to Invesco Investment Services, Inc., P.O. Box 219078, Kansas City, MO 64121-9078.
Important notice regarding delivery of security holder documents
To reduce Fund expenses, only one copy of most shareholder documents may be mailed to shareholders with multiple accounts at the same address (Householding). Mailing of your shareholder documents may be householded indefinitely unless you instruct us otherwise. If you do not want the mailing of these documents to be combined with those for other members of your household, please contact Invesco Investment Services, Inc. at 800 959 4246 or contact your financial institution. We will begin sending you individual copies for each account within 30 days after receiving your request.
Fund holdings and proxy voting information
The Fund provides a complete list of its portfolio holdings four times each year, at the end of each fiscal quarter. For the second and fourth quarters, the list appears, respectively, in the Fund’s semiannual and annual reports to shareholders. For the first and third quarters, the Fund files the list with the Securities and Exchange Commission (SEC) as an exhibit to its reports on Form N-PORT. The most recent list of portfolio holdings is available at invesco.com/completeqtrholdings. Shareholders can also look up the Fund’s Form N-PORT filings on the SEC website, sec.gov. The SEC file numbers for the Fund are shown below.
A description of the policies and procedures that the Fund uses to determine how to vote proxies relating to portfolio securities is available without charge, upon request, from our Client Services department at 800 959 4246, or at invesco.com/corporate/about-us/esg. The information is also available on the SEC website, sec.gov.
Information regarding how the Fund voted proxies related to its portfolio securities during the most recent 12-month period ended June 30 is available at invesco.com/proxysearch. This information is also available on the SEC website, sec.gov.
Invesco Advisers, Inc. is an investment adviser; it provides investment advisory services to individual and institutional clients and does not sell securities. Invesco Distributors, Inc. is the US distributor for Invesco Ltd.’s retail mutual funds, exchange-traded funds and institutional money market funds. Both are wholly owned, indirect subsidiaries of Invesco Ltd.
| | | | |
| SEC file number(s): 811-03826 and 002-85905 | | Invesco Distributors, Inc. | | I-ENE-AR-1 |

| | |
| | |
| Annual Report to Shareholders | | April 30, 2024 |
Invesco Gold & Special Minerals Fund
Nasdaq:
A: OPGSX ∎ C: OGMCX ∎ R: OGMNX ∎ Y: OGMYX ∎ R5: IOGYX ∎ R6: OGMIX
| | |
Beginning in July 2024, amendments adopted by the Securities and Exchange Commission will substantially impact the design, content, and delivery of shareholder reports. These newly designed shareholder reports will highlight key fund information in a clear and concise format and must be mailed to each shareholder that has not elected to receive the reports electronically. Other information, including financial statements, will no longer be included in the shareholder report but will be available at invesco.com/reports, delivered upon request, and filed on a semi-annual basis on Form N-CSR. If you would like to receive shareholder reports and other communications electronically instead of by mail, you may make that request by contacting your financial intermediary (such as a broker-dealer or bank) or, if you are a direct investor, by enrolling at invesco.com/edelivery. If you do not make this request or enroll in e-delivery, you will receive future shareholder reports and other communications by mail. | | |
Management’s Discussion of Fund Performance
| | | | |
| |
Performance summary | |
For the fiscal year ended April 30, 2024, Class A shares of Invesco Gold & Special Minerals Fund (the Fund), at net asset value (NAV), underperformed the MSCI World Index. | |
Your Fund’s long-term performance appears later in this report. | |
| |
Fund vs. Indexes | |
Total returns, 4/30/23 to 4/30/24, at net asset value (NAV). Performance shown does not include applicable contingent deferred sales charges (CDSC) or front-end sales charges, which would have reduced performance. | |
Class A Shares | | | -0.04 | % |
Class C Shares | | | -0.77 | |
Class R Shares | | | -0.31 | |
Class Y Shares | | | 0.21 | |
Class R5 Shares | | | 0.31 | |
Class R6 Shares | | | 0.38 | |
MSCI World Index▼ | | | 18.39 | |
| |
Source(s): ▼RIMES Technologies Corp. | | | | |
Market conditions and your Fund
Risk assets performed well during the fiscal year ended April 30, 2024, as US economic growth surprised to the upside while inflation cooled during 2023, followed by the US Federal Reserve’s (Fed’s) unexpected pivot in December away from additional monetary policy tightening. Several factors helped to keep a lid on the gold price and downward pressure on gold mining equities during the first 10 months of the fiscal year, including rising interest rates and a rising US dollar. Beginning on March 1, 2024, however, and without much warning, gold started rising sharply, climbing 12% in the next two months while making an all-time high of $2,391 per ounce on April 19, 2024. The gold mining equities followed suit, rising an impressive 27% in the final two months of the fiscal year.
Against this backdrop, the Fund’s Class A shares (without sales charge) were essentially flat in the fiscal year, generating a total return of -0.04% and underperforming the 18.39% return of the benchmark MSCI World Index.1 Focusing on the first four months of calendar year 2024, the Fund climbed 6.47%, outpacing the 5.02% rise in the MSCI World Index by 145 basis points (bps). The Fund also outperformed the S&P 500 Index by 43 bps and the Bloomberg US Aggregate Bond Index by 975 bps during this period. The Fund won the 2023 Refinitiv Lipper Fund Award for Best Fund Over 3 Years in the Precious Metals Equity category. We focus on firms with high-quality reserves, solid growth prospects, attractive cost structures, sound balance sheets and talented management teams.
The gold price oscillated within a wide $621 range during the fiscal year before climbing to $2,286 at fiscal year-end for a gain of 14.9% (up $223/oz).1 The gold mining equities, as represented by the Philadelphia Gold & Silver Index (XAU Index), followed
a similar pattern, oscillating within a wide band before ending the fiscal year marginally higher with a gain of 1.44%.1 Year to date through April 30, 2024, the XAU Index has climbed 6.77%, outpacing the MSCI World Index as well as US stocks and bonds.1 We believe some investors view gold and other precious metals as potential hedges against inflation, rapidly accumulating US debt, geopolitical risk and/or competitive currency debasement.
The top contributors to the Fund’s performance during the fiscal year included Ivanhoe Mines, Agnico Eagle Mines and Freeport-McMoRan.
Our holdings in Ivanhoe Mines, a Canadian copper producer with operations in the Democratic Republic of the Congo, contributed to performance as the share price climbed 57% during the fiscal year.2 The company benefited from strong operational performance as it ramped up production at its Kamoa-Kakula project. It also benefited from higher copper prices along with good cost control in an inflationary environment.
Our position in Agnico Eagle Mines, a large Canadian gold producer, also contributed to performance as the share price appreciated 15% during the fiscal year.2 The company benefited from its acquisition of the remainder of the Canadian Malartic Mine that it did not own as well as solid operational performance combined with good cost control relative to peers.
Our position in Freeport-McMoRan, a US-based copper and gold producer, contributed to performance as the stock climbed 33% in the fiscal year.2 The share price outperformed as the company delivered on its operational guidance while managing costs well in an inflationary environment. The company also benefited from rising copper prices.
The biggest detractors from performance during the reporting period included Chalice Mining, SSR Mining and Piedmont Lithium.
Our holdings in Chalice Mining, a preproduction Australian precious metals developer, detracted from performance as the stock fell 84% during the fiscal year.2 The share price dropped after the company released a scoping study for its Gonneville project that showed higher costs and weaker-than-expected economics for that development project. We have exited our position in the company.
Our position in SSR Mining, a gold and precious metals producer with operations in the US, Canada and Turkey, detracted from performance as the stock fell 62% during the fiscal year.2 The share price collapsed in the wake of a landslide at SSRM’s Copler Mine in Turkey that resulted in numerous fatalities and a halt to mining operations at that site. We have exited our position in the company.
Finally, our position in Piedmont Lithium, a pre-production US-based lithium developer, also detracted from performance as the stock declined 78% during the fiscal year.2 The company’s share price was negatively impacted by the 62% drop in the price of lithium during the fiscal year.
There were numerous crosswinds in the macroeconomic environment that impacted gold during the fiscal year. Several factors that tended to support the gold price included heightened geopolitical turmoil from wars in the Middle East and Ukraine, prospects for slowing economic growth, inflation remaining above the Fed’s target level and rapidly growing US government debt. However, several factors that tended to exert downward pressure on the gold price were also in play, including a stronger US dollar, rising Treasury yields and rising real interest rates.
Gold is a hard asset that tends to do well in slower growth environments when equities are volatile, geopolitical turmoil is brewing, real interest rates are stable or falling and/or investors fear weakening currencies. Investor focus has shifted to slowing economic growth and the prospects for rate cuts by the Fed. We note that gold has performed well relative to other risk assets during the five most recent US recessions dating back to 1981. We believe gold could eventually trade higher from current levels and mining equities could perform well from here, but we do not believe the path will be smooth. Accordingly, we favor a longer-term strategic allocation to the Fund that allows investors to look beyond high day-to-day volatility of the physical metal and gold mining equities.
The portfolio has a growth-at-a-reasonable-price tilt. We favor companies with more resources in the ground, higher quality ore bodies and lower cost structures than Wall Street appreciates, partly because these characteristics can lead to upside surprises in production growth, revenue, cash flow and earnings, which in turn can lead to rising net asset values and (potentially) rising stock prices. We like growth, but we will not overpay for it, and
| | |
| 2 | | Invesco Gold & Special Minerals Fund |
we do not chase stocks. We maintain a diversified portfolio across gold and other precious metals as well as a number of base metals and special minerals. We also own companies that operate in different geographic regions and that are in different stages of development. We continue to use a contrarian growth strategy, which means we tend to buy companies that we like when they are on sale, and we tend to trim or sell positions when others are buying aggressively.
The Fund manager remains focused on the growth potential of companies, the quality and size of their ore bodies in the ground, their cost structures, the strength of their balance sheets, their need for additional capital and the quality of their management teams. Moreover, we concentrate our efforts on analyzing the gold and precious metals mining equities, and we tend to stay fully invested. Unlike many competitors, we typically do not hold large positions in cash or bullion, and we do not own Treasuries in an effort to dampen portfolio volatility. The reasons are simple. We are investors, not short-term traders or market timers. In fact, we believe it is extremely difficult to time the precious metals markets well on a consistent basis. In addition, our skill is in analyzing ore bodies, mines and management teams, and investing in mining companies, not government fixed-income securities.
Consistent with our disciplined and contrarian growth strategy, we continue to look for opportunities to buy companies with assets, cost structures and production/cash flow/ earnings growth profiles that we like at valuations that we consider attractive. We believe the core holdings in the portfolio are well-capitalized senior and intermediate producers. The Fund manager expects to continue to hold most of the Fund’s assets in gold, special minerals and mining-related equities that the investment team believes offer attractive revenue, cash flow and earnings growth at a reasonable price.
Thank you for investing in Invesco Gold & Special Minerals Fund and sharing our long-term investment horizon.
| 1 | Source: Bloomberg LP, 5/14/24. US stocks are represented by the S&P 500 Index, and US bonds are represented by the Bloomberg US Aggregate Bond Index. |
| 2 | Source: Bloomberg LP, 5/14/23. |
Portfolio manager(s):
Shanquan Li
The views and opinions expressed in management’s discussion of Fund performance are those of Invesco Advisers, Inc. and its affiliates. These views and opinions are subject to change at any time based on factors such as market and economic conditions. These views and opinions may not be relied upon as investment advice or recommendations, or as an offer for a particular security. The information is not a complete analysis of every aspect of any market, country, industry, security or the Fund. Statements of fact are from sources considered reliable, but Invesco Advisers, Inc. makes no representation or warranty as to their
completeness or accuracy. Although historical performance is no guarantee of future results, these insights may help you understand our investment management philosophy.
See important Fund and, if applicable, index disclosures later in this report.
| | |
| 3 | | Invesco Gold & Special Minerals Fund |
Your Fund’s Long-Term Performance
Results of a $10,000 Investment – Oldest Share Class(es)
Fund and index data from 4/30/14
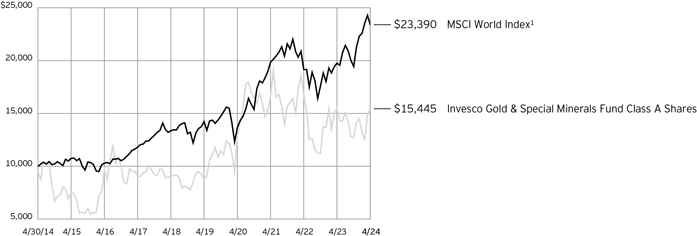
| 1 | Source: RIMES Technologies Corp. |
Past performance cannot guarantee future results.
The data shown in the chart include reinvested distributions, applicable sales charges and Fund expenses including management
fees. Index results include reinvested dividends, but they do not reflect sales charges. Performance of the peer group, if applicable, reflects fund expenses and management fees;
performance of a market index does not. Performance shown in the chart does not reflect deduction of taxes a shareholder would pay on Fund distributions or sale of Fund shares.
| | |
| 4 | | Invesco Gold & Special Minerals Fund |
| | | | |
| |
Average Annual Total Returns | |
As of 4/30/24, including maximum applicable sales charges | |
| |
Class A Shares | | | | |
Inception (7/19/83) | | | 5.79 | % |
10 Years | | | 4.44 | |
5 Years | | | 10.80 | |
1 Year | | | -5.53 | |
| |
Class C Shares | | | | |
Inception (11/1/95) | | | 5.65 | % |
10 Years | | | 4.40 | |
5 Years | | | 11.22 | |
1 Year | | | -1.76 | |
| |
Class R Shares | | | | |
Inception (3/1/01) | | | 8.10 | % |
10 Years | | | 4.77 | |
5 Years | | | 11.77 | |
1 Year | | | -0.31 | |
| |
Class Y Shares | | | | |
Inception (9/7/10) | | | -1.66 | % |
10 Years | | | 5.28 | |
5 Years | | | 12.32 | |
1 Year | | | 0.21 | |
| |
Class R5 Shares | | | | |
10 Years | | | 5.22 | % |
5 Years | | | 12.45 | |
1 Year | | | 0.31 | |
| |
Class R6 Shares | | | | |
Inception (10/26/12) | | | -1.11 | % |
10 Years | | | 5.48 | |
5 Years | | | 12.52 | |
1 Year | | | 0.38 | |
Effective May 24, 2019, Class A, Class C, Class R, Class Y and Class I shares of the Oppenheimer Gold & Special Minerals Fund, (the predecessor fund), were reorganized into Class A, Class C, Class R, Class Y and Class R6 shares, respectively, of the Invesco Oppenheimer Gold & Special Minerals Fund. The Fund was subsequently renamed the Invesco Gold & Special Minerals Fund (the Fund). Returns shown above, for periods ending on or prior to May 24, 2019, for Class A, Class C, Class R, Class Y and Class R6 shares are those for Class A, Class C, Class R, Class Y and Class I shares of the predecessor fund. Share class returns will differ from the predecessor fund because of different expenses.
Class R5 shares incepted on May 24, 2019. Performance shown on and prior to that date is that of the predecessor fund’s Class A shares at net asset value and includes the 12b-1 fees applicable to Class A shares.
The performance data quoted represent past performance and cannot guarantee future results; current performance may be lower or higher. Please visit invesco.com/ performance for the most recent month-end performance. Performance figures reflect reinvested distributions, changes in net asset value and the effect of the maximum sales charge unless otherwise stated.
Performance figures do not reflect deduction of taxes a shareholder would pay on Fund distributions or sale of Fund shares. Investment return and principal value will fluctuate so that you may have a gain or loss when you sell shares.
Class A share performance reflects the maximum 5.50% sales charge, and Class C share performance reflects the applicable contingent deferred sales charge (CDSC) for the period involved. The CDSC on Class C shares is 1% for the first year after purchase. Class R, Class Y, Class R5 and Class R6 shares do not have a front-end sales charge or a CDSC; therefore, performance is at net asset value.
The performance of the Fund’s share classes will differ primarily due to different sales charge structures and class expenses.
Fund performance reflects any applicable fee waivers and/or expense reimbursements. Had the adviser not waived fees and/or reimbursed expenses currently or in the past, returns would have been lower. See current prospectus for more information.
| | |
| 5 | | Invesco Gold & Special Minerals Fund |
Supplemental Information
Invesco Gold & Special Minerals Fund’s investment objective is to seek capital appreciation.
| ∎ | Unless otherwise stated, information presented in this report is as of April 30, 2024, and is based on total net assets. |
| ∎ | Unless otherwise noted, all data is provided by Invesco. |
| ∎ | To access your Fund’s reports/prospectus, visit invesco.com/fundreports. |
About indexes used in this report
| ∎ | The MSCI World IndexSM is an unmanaged index considered representative of stocks of developed countries. The index is computed using the net return, which withholds applicable taxes for non-resident investors. |
| ∎ | The Fund is not managed to track the performance of any particular index, including the index(es) described here, and consequently, the performance of the Fund may deviate significantly from the performance of the index(es). |
| ∎ | A direct investment cannot be made in an index. Unless otherwise indicated, index results include reinvested dividends, and they do not reflect sales charges. Performance of the peer group, if applicable, reflects fund expenses; performance of a market index does not. |
Liquidity Risk Management Program
| | In compliance with Rule 22e-4 under the Investment Company Act of 1940, as amended (the “Liquidity Rule”), the Fund has adopted and implemented a liquidity risk management program in accordance with the Liquidity Rule (the “Program”). The Program is reasonably designed to assess and manage the Fund’s liquidity risk, which is the risk that the Fund could not meet redemption requests without significant dilution of remaining investors’ interests in the Fund. The Board of Trustees of the Fund (the “Board”) has appointed Invesco Advisers, Inc. (“Invesco”), the Fund’s investment adviser, as the Program’s administrator, and Invesco has delegated oversight of the Program to the Liquidity Risk Management Committee (the “Committee”), which is composed of senior representatives from relevant business groups at Invesco. |
| | As required by the Liquidity Rule, the Program includes policies and procedures providing for an assessment, no less frequently than annually, of the Fund’s liquidity risk that takes into account, as relevant to the Fund’s liquidity risk: (1) the Fund’s investment strategy and liquidity of portfolio investments during both normal and reasonably foreseeable stressed conditions; (2) short-term and long-term cash |
flow projections for the Fund during both normal and reasonably foreseeable stressed conditions; and (3) the Fund’s holdings of cash and cash equivalents and any borrowing arrangements. The Liquidity Rule also requires the classification of the Fund’s investments into categories that reflect the assessment of their relative liquidity under current market conditions. The Fund classifies its investments into one of four categories defined in the Liquidity Rule: “Highly Liquid,” “Moderately Liquid,” “Less Liquid,” and “Illiquid.” Funds that are not invested primarily in “Highly Liquid Investments” that are assets (cash or investments that are reasonably expected to be convertible into cash within three business days without significantly changing the market value of the investment) are required to establish a “Highly Liquid Investment Minimum” (“HLIM”), which is the minimum percentage of net assets that must be invested in Highly Liquid Investments. Funds with HLIMs have procedures for addressing HLIM shortfalls, including reporting to the Board and the SEC (on a non-public basis) as required by the Program and the Liquidity Rule. In addition, the Fund may not acquire an investment if, immediately after the acquisition, over 15% of the Fund’s net assets would consist of “Illiquid Investments” that are assets (an investment that cannot reasonably be expected to be sold or disposed of in current market conditions in seven calendar days or less without the sale or disposition significantly changing the market value of the investment). The Liquidity Rule and the Program also require reporting to the Board and the SEC (on a non-public basis) if a Fund’s holdings of Illiquid Investments exceed 15% of the Fund’s assets.
At a meeting held on March 25-27, 2024, the Committee presented a report to the Board that addressed the operation of the Program and assessed the Program’s ad-equacy and effectiveness of implementation (the “Report”). The Report covered the period from January 1, 2023 through December 31, 2023 (the “Program Reporting Period”). The Report discussed notable events affecting liquidity over the Program Reporting Period, including the impact of the end of an aggressive rate
| | hike cycle, signs that inflation was abating and market liquidity was reverting to normal, and the overall market. The Report noted that there were no material changes to the Program during the Program Reporting Period. |
| | The Report stated, in relevant part, that during the Program Reporting Period: |
| ∎ | The Program, as adopted and implemented, remained reasonably designed to assess and manage the Fund’s liquidity risk and was operated effectively to achieve that goal; |
| ∎ | The Fund’s investment strategy remained appropriate for an openend fund; |
| ∎ | The Fund was able to meet requests for redemption without significant dilution of remaining investors’ interests in the Fund; |
| ∎ | The Fund did not breach the 15% limit on Illiquid Investments; and |
| ∎ | The Fund primarily held Highly Liquid Investments and therefore has not adopted an HLIM. |
|
|
This report must be accompanied or preceded by a currently effective Fund prospectus, which contains more complete information, including sales charges and expenses. Investors should read it carefully before investing. |
|
| NOT FDIC INSURED | MAY LOSE VALUE | NO BANK GUARANTEE |
| | |
| 6 | | Invesco Gold & Special Minerals Fund |
Fund Information
Portfolio Composition
| | | | |
| By industry | | % of total net assets |
| |
Gold | | | 80.27 | % |
| |
Diversified Metals & Mining | | | 8.20 | |
| |
Copper | | | 4.67 | |
| |
Silver | | | 3.09 | |
| |
| Other Industries, Each Less Than 2% of Net Assets | | | 4.25 | |
| |
| Money Market Funds Plus Other Assets Less Liabilities | | | (0.48 | ) |
Top 10 Equity Holdings*
| | | | | | |
| | | | | % of total net assets |
| | |
| 1. | | Agnico Eagle Mines Ltd. | | | 4.96 | % |
| | |
| 2. | | Northern Star Resources Ltd. | | | 4.85 | |
| | |
| 3. | | Barrick Gold Corp. | | | 4.72 | |
| | |
| 4. | | Ivanhoe Mines Ltd., Class A | | | 4.65 | |
| | |
| 5. | | Newmont Corp. | | | 4.29 | |
| | |
| 6. | | Evolution Mining Ltd. | | | 3.35 | |
| | |
| 7. | | Alamos Gold, Inc., Class A | | | 3.13 | |
| | |
| 8. | | Bellevue Gold Ltd. | | | 3.01 | |
| | |
| 9. | | De Grey Mining Ltd. | | | 2.80 | |
| | |
| 10. | | Wheaton Precious Metals Corp. | | | 2.80 | |
The Fund’s holdings are subject to change, and there is no assurance that the Fund will continue to hold any particular security.
| * | Excluding money market fund holdings, if any. |
Data presented here are as of April 30, 2024.
| | |
| 7 | | Invesco Gold & Special Minerals Fund |
Consolidated Schedule of Investments
April 30, 2024
| | | | | | | | |
| | | Shares | | | Value | |
Common Stocks & Other Equity Interests–100.47% | |
Australia–21.95% | |
| | |
Bellevue Gold Ltd.(a) | | | 49,643,252 | | | $ | 56,091,563 | |
| | |
Capricorn Metals Ltd.(a) | | | 2,710,000 | | | | 8,578,786 | |
| | |
De Grey Mining Ltd.(a) | | | 62,887,305 | | | | 52,332,758 | |
| | |
Emerald Resources NL(a) | | | 6,920,000 | | | | 15,577,578 | |
| | |
Evolution Mining Ltd. | | | 24,228,806 | | | | 62,480,814 | |
| | |
Firefinch Ltd.(a)(b) | | | 12,910,104 | | | | 585,422 | |
| | |
Genesis Minerals Ltd.(a) | | | 13,200,000 | | | | 14,761,038 | |
| | |
Gold Road Resources Ltd. | | | 28,883,275 | | | | 29,889,418 | |
| | |
Northern Star Resources Ltd. | | | 9,548,895 | | | | 90,511,448 | |
| | |
OceanaGold Corp. | | | 17,040,300 | | | | 36,886,713 | |
| | |
Ora Banda Mining Ltd.(a) | | | 3,700,000 | | | | 799,449 | |
| | |
Ramelius Resources Ltd. | | | 27,018,612 | | | | 35,840,461 | |
| | |
West African Resources Ltd.(a) | | | 3,000,000 | | | | 2,542,059 | |
| | |
Westgold Resources Ltd. | | | 2,070,000 | | | | 2,957,263 | |
| | | |
| | | | | | | | 409,834,770 | |
| | |
Bosnia Hercegovina–0.43% | | | | | | | | |
| | |
Adriatic Metals PLC, CDI(a) | | | 2,720,000 | | | | 7,949,649 | |
| | |
Brazil–2.80% | | | | | | | | |
| | |
Wheaton Precious Metals Corp. | | | 1,003,035 | | | | 52,298,245 | |
| | |
Burkina Faso–2.23% | | | | | | | | |
| | |
Endeavour Mining PLC | | | 1,988,966 | | | | 41,566,521 | |
| | |
Canada–50.18% | | | | | | | | |
| | |
Agnico Eagle Mines Ltd.(c)(d) | | | 1,461,395 | | | | 92,579,373 | |
| | |
Agnico Eagle Mines Ltd.(c)(d) | | | 400,000 | | | | 25,331,057 | |
| | |
Alamos Gold, Inc., Class A | | | 3,971,108 | | | | 58,414,999 | |
| | |
Allied Gold Corp.(a) | | | 2,404,771 | | | | 6,463,264 | |
| | |
Artemis Gold, Inc.(a) | | | 5,354,241 | | | | 34,887,257 | |
| | |
Aya Gold & Silver, Inc.(a) | | | 3,425,082 | | | | 32,940,897 | |
| | |
B2Gold Corp. | | | 10,692,000 | | | | 27,264,600 | |
| | |
Barrick Gold Corp.(c) | | | 5,291,499 | | | | 88,050,544 | |
| | |
Calibre Mining Corp., Class C(a) | | | 14,634,883 | | | | 20,623,741 | |
| | |
Capstone Copper Corp.(a) | | | 3,620,000 | | | | 25,059,819 | |
| | |
Centerra Gold, Inc. | | | 1,580,000 | | | | 9,617,840 | |
| | |
Coppernico Metals, Inc.(a) | | | 3,028,200 | | | | 454,230 | |
| | |
Dundee Precious Metals, Inc. | | | 1,395,000 | | | | 10,558,893 | |
| | |
enCore Energy Corp.(a) | | | 260,000 | | | | 1,189,845 | |
| | |
Equinox Gold Corp.(a) | | | 3,566,381 | | | | 19,294,121 | |
| | |
Filo Corp.(a) | | | 300,000 | | | | 5,376,094 | |
| | |
Foran Mining Corp.(a) | | | 1,080,000 | | | | 3,310,645 | |
| | |
Franco-Nevada Corp. | | | 127,302 | | | | 15,327,161 | |
| | |
G Mining Ventures Corp.(a) | | | 4,480,000 | | | | 6,833,981 | |
| | |
Galiano Gold, Inc.(a) | | | 2,120,000 | | | | 3,392,000 | |
| | |
Hudbay Minerals, Inc. | | | 1,330,000 | | | | 11,198,600 | |
| | |
i-80 Gold Corp.(a) | | | 4,960,000 | | | | 5,908,837 | |
| | |
IAMGOLD Corp.(a) | | | 6,740,000 | | | | 23,994,400 | |
| | |
Ivanhoe Mines Ltd., Class A(a) | | | 6,405,365 | | | | 86,822,439 | |
| | |
K92 Mining, Inc.(a) | | | 8,202,630 | | | | 43,615,481 | |
| | |
Karora Resources, Inc.(a) | | | 3,464,956 | | | | 13,490,839 | |
| | |
Kinross Gold Corp. | | | 5,645,925 | | | | 36,416,216 | |
| | |
Lundin Gold, Inc. | | | 2,653,815 | | | | 36,067,903 | |
| | |
MAG Silver Corp.(a) | | | 438,522 | | | | 5,385,050 | |
| | |
New Found Gold Corp.(a) | | | 90,000 | | | | 322,958 | |
| | | | | | | | |
| | | Shares | | | Value | |
Canada–(continued) | | | | | | | | |
| | |
New Gold, Inc.(a) | | | 12,340,000 | | | $ | 21,471,600 | |
| | |
Novagold Resources, Inc.(a) | | | 2,060,000 | | | | 5,974,000 | |
| | |
Orla Mining Ltd.(a) | | | 6,111,621 | | | | 23,751,260 | |
| | |
Osisko Development Corp.(a) | | | 600,000 | | | | 1,250,863 | |
| | |
Osisko Gold Royalties Ltd. | | | 2,325,339 | | | | 35,786,967 | |
| | |
Osisko Mining, Inc.(a) | | | 4,800,000 | | | | 10,599,644 | |
| | |
Pan American Silver Corp. | | | 500,000 | | | | 9,220,000 | |
| | |
Pan American Silver Corp., Rts., expiring 02/22/2029(a) | | | 2,300,100 | | | | 1,173,281 | |
| | |
Seabridge Gold, Inc.(a) | | | 10,000 | | | | 150,000 | |
| | |
SilverCrest Metals, Inc.(a) | | | 1,756,667 | | | | 14,381,024 | |
| | |
Southern Cross Gold Ltd.(a) | | | 275,000 | | | | 462,550 | |
| | |
Torex Gold Resources, Inc.(a) | | | 791,000 | | | | 11,146,915 | |
| | |
Triple Flag Precious Metals Corp. | | | 1,626,682 | | | | 26,232,042 | |
| | |
Wesdome Gold Mines Ltd.(a) | | | 3,330,000 | | | | 24,914,830 | |
| | | |
| | | | | | | | 936,708,060 | |
| | |
Colombia–0.63% | | | | | | | | |
| | |
Aris Mining Corp.(a) | | | 2,920,060 | | | | 11,835,931 | |
| | |
Egypt–0.36% | | | | | | | | |
| | |
Centamin PLC | | | 4,400,000 | | | | 6,644,320 | |
| | |
South Africa–3.42% | | | | | | | | |
| | |
DRDGOLD Ltd., ADR | | | 58,910 | | | | 459,498 | |
| | |
Gold Fields Ltd., ADR | | | 2,667,241 | | | | 43,129,287 | |
| | |
Sibanye Stillwater Ltd., ADR | | | 4,352,587 | | | | 20,239,529 | |
| | | |
| | | | | | | | 63,828,314 | |
| | |
Turkey–1.52% | | | | | | | | |
| | |
Eldorado Gold Corp.(a) | | | 1,991,502 | | | | 28,398,819 | |
| | |
United Kingdom–2.62% | | | | | | | | |
| | |
AngloGold Ashanti PLC | | | 2,132,100 | | | | 49,016,979 | |
| | |
United States–13.47% | | | | | | | | |
| | |
A-Mark Precious Metals, Inc. | | | 624,042 | | | | 25,005,363 | |
| | |
Aura Minerals, Inc. | | | 2,190,025 | | | | 16,465,157 | |
| | |
Freeport-McMoRan, Inc. | | | 917,000 | | | | 45,794,980 | |
| | |
Hecla Mining Co. | | | 1,915,304 | | | | 9,059,388 | |
| | |
Ivanhoe Electric, Inc.(a) | | | 2,643,183 | | | | 26,696,149 | |
| | |
MP Materials Corp.(a) | | | 243,500 | | | | 3,896,000 | |
| | |
Newmont Corp.(c) | | | 1,967,914 | | | | 79,976,025 | |
| | |
Ormat Technologies, Inc. | | | 291,300 | | | | 18,593,679 | |
| | |
Piedmont Lithium, Inc.(a) | | | 621,585 | | | | 7,614,416 | |
| | |
Royal Gold, Inc. | | | 152,300 | | | | 18,295,799 | |
| | | |
| | | | | | | | 251,396,956 | |
| | |
Zambia–0.86% | | | | | | | | |
| | |
First Quantum Minerals Ltd. | | | 1,267,000 | | | | 16,087,720 | |
Total Common Stocks & Other Equity Interests
(Cost $1,226,933,840) | | | | 1,875,566,284 | |
| |
Exchange-Traded Funds–0.01% | |
United States–0.01% | | | | | | | | |
| | |
SPDR® Gold Trust–ETF(a)
(Cost $155,059) | | | 1,000 | | | | 211,870 | |
See accompanying Notes to Consolidated Financial Statements which are an integral part of the financial statements.
| | |
| 8 | | Invesco Gold & Special Minerals Fund |
| | | | | | | | |
| | | Shares | | | Value | |
Money Market Funds–1.39% | | | | | | | | |
Invesco Government & Agency Portfolio, Institutional Class, 5.23%(e)(f) | | | 9,041,999 | | | $ | 9,041,999 | |
|
| |
Invesco Liquid Assets Portfolio, Institutional Class, 5.34%(e)(f) | | | 6,456,112 | | | | 6,458,048 | |
|
| |
Invesco Treasury Portfolio, Institutional Class, 5.22%(e)(f) | | | 10,333,714 | | | | 10,333,714 | |
|
| |
Total Money Market Funds (Cost $25,834,343) | | | | 25,833,761 | |
|
| |
TOTAL INVESTMENTS IN SECURITIES–101.87%
(Cost $1,252,923,242) | | | | 1,901,611,915 | |
|
| |
OTHER ASSETS LESS LIABILITIES–(1.87)% | | | | (34,852,936 | ) |
|
| |
NET ASSETS–100.00% | | | | | | $ | 1,866,758,979 | |
|
| |
| | |
| Investment Abbreviations: |
| |
| ADR | | – American Depositary Receipt |
| CDI | | – CREST Depository Interest |
| Rts. | | – Rights |
| SPDR | | – Standard & Poor’s Depositary Receipt |
Notes to Consolidated Schedule of Investments:
| (a) | Non-income producing security. |
| (b) | Security valued using significant unobservable inputs (Level 3). See Note 3. |
| (c) | All or a portion of the value pledged and/or designated as collateral to cover margin requirements for open options contracts. See Note 1K and Note 1L. |
| (d) | The Fund holds securities which have been issued by the same entity and that trade on separate exchanges. |
| (e) | Affiliated holding. Affiliated holdings are investments in entities which are under common ownership or control of Invesco Ltd. or are investments in entities in which the Fund owns 5% or more of the outstanding voting securities. The table below shows the Fund’s transactions in, and earnings from, its investments in affiliates for the fiscal year ended April 30, 2024. |
| | | | | | | | | | | | | | | | | | | | | | | | | | | | |
| | | Value April 30, 2023 | | | Purchases at Cost | | | Proceeds from Sales | | | Change in
Unrealized
Appreciation
(Depreciation) | | | Realized
Gain | | | Value April 30, 2024 | | | Dividend Income | |
| Investments in Affiliated Money Market Funds: | | | | | | | | | | | | | | | | | | | | | | | | | | | | |
Invesco Government & Agency Portfolio, Institutional Class | | $ | 15,954,071 | | | $ | 118,182,907 | | | $ | (125,094,979) | | | $ | - | | | $ | - | | | $ | 9,041,999 | | | $ | 399,128 | |
Invesco Liquid Assets Portfolio, Institutional Class | | | 11,395,882 | | | | 84,416,364 | | | | (89,353,557) | | | | (1,924) | | | | 1,283 | | | | 6,458,048 | | | | 289,527 | |
Invesco Treasury Portfolio, Institutional Class | | | 18,233,224 | | | | 135,066,181 | | | | (142,965,691) | | | | - | | | | - | | | | 10,333,714 | | | | 452,665 | |
| Investments in Other Affiliates: | | | | | | | | | | | | | | | | | | | | | | | | | | | | |
Karora Resources, Inc.* | | | 41,429,428 | | | | 125,100 | | | | (29,503,344) | | | | (3,258,114) | | | | 4,697,769 | | | | 13,490,839 | | | | - | |
Total | | $ | 87,012,605 | | | $ | 337,790,552 | | | $ | (386,917,571) | | | $ | (3,260,038) | | | $ | 4,699,052 | | | $ | 39,324,600 | | | $ | 1,141,320 | |
| | * | At April 30, 2024, this security was no longer an affiliate of the Fund. |
| (f) | The rate shown is the 7-day SEC standardized yield as of April 30, 2024. |
| | | | | | | | | | | | | | | | | | | | | | | | | | | | | | | | |
| Open Exchange-Traded Equity Options Written(a) | |
|
| |
| | | Type of | | | Expiration | | | Number of | | Exercise | | | Notional | | | | |
| Description | | Contract | | | Date | | | Contracts | | Price | | | Value* | | | Value | |
|
| |
Equity Risk | | | | | | | | | | | | | | | | | | | | | | | | | | | | | | | | |
|
| |
Agnico Eagle Mines Ltd. | | | Call | | | | 06/21/2024 | | | | 4,000 | | | | CAD | | | | 85.00 | | | | CAD | | | | 34,000,000 | | | $ | (1,460,066 | ) |
|
| |
Agnico Eagle Mines Ltd. | | | Call | | | | 08/16/2024 | | | | 2,000 | | | | USD | | | | 65.00 | | | | USD | | | | 13,000,000 | | | | (770,000 | ) |
|
| |
Alamos Gold, Inc. | | | Call | | | | 09/20/2024 | | | | 5,000 | | | | USD | | | | 15.00 | | | | USD | | | | 7,500,000 | | | | (675,000 | ) |
|
| |
A-Mark Precious Metals, Inc. | | | Call | | | | 09/20/2024 | | | | 6,240 | | | | USD | | | | 35.00 | | | | USD | | | | 21,840,000 | | | | (4,680,000 | ) |
|
| |
AngloGold Ashanti Ltd. | | | Call | | | | 07/19/2024 | | | | 3,000 | | | | USD | | | | 23.00 | | | | USD | | | | 6,900,000 | | | | (600,000 | ) |
|
| |
AngloGold Ashanti Ltd. | | | Call | | | | 10/18/2024 | | | | 3,000 | | | | USD | | | | 25.00 | | | | USD | | | | 7,500,000 | | | | (675,000 | ) |
|
| |
Endeavour Mining PLC | | | Call | | | | 07/19/2024 | | | | 3,000 | | | | CAD | | | | 29.00 | | | | CAD | | | | 8,700,000 | | | | (471,798 | ) |
|
| |
Endeavour Mining PLC | | | Call | | | | 09/20/2024 | | | | 2,000 | | | | CAD | | | | 32.00 | | | | CAD | | | | 6,400,000 | | | | (246,976 | ) |
|
| |
Filo Corp. | | | Call | | | | 06/21/2024 | | | | 2,900 | | | | CAD | | | | 25.00 | | | | CAD | | | | 7,250,000 | | | | (315,985 | ) |
|
| |
First Quantum Minerals Ltd. | | | Call | | | | 07/19/2024 | | | | 7,000 | | | | CAD | | | | 16.00 | | | | CAD | | | | 11,200,000 | | | | (1,461,882 | ) |
|
| |
Franco-Nevada Corp. | | | Call | | | | 10/18/2024 | | | | 1,000 | | | | USD | | | | 150.00 | | | | USD | | | | 15,000,000 | | | | (245,000 | ) |
|
| |
Freeport-McMoRan, Inc. | | | Call | | | | 05/17/2024 | | | | 5,950 | | | | USD | | | | 42.00 | | | | USD | | | | 24,990,000 | | | | (4,983,125 | ) |
|
| |
Freeport-McMoRan, Inc. | | | Call | | | | 07/19/2024 | | | | 2,000 | | | | USD | | | | 55.00 | | | | USD | | | | 11,000,000 | | | | (327,000 | ) |
|
| |
Gold Fields Ltd. | | | Call | | | | 07/19/2024 | | | | 3,000 | | | | USD | | | | 19.00 | | | | USD | | | | 5,700,000 | | | | (150,000 | ) |
|
| |
See accompanying Notes to Consolidated Financial Statements which are an integral part of the financial statements.
| | |
| 9 | | Invesco Gold & Special Minerals Fund |
| | | | | | | | | | | | | | | | | | | | | | | | | | | | | | | | |
| Open Exchange-Traded Equity Options Written(a)–(continued) | |
|
| |
| | | Type of | | | Expiration | | | Number of | | Exercise | | | Notional | | | | |
| Description | | Contract | | | Date | | | Contracts | | Price | | | Value* | | | Value | |
|
| |
Hecla Mining Co. | | | Call | | | | 09/20/2024 | | | | 8,000 | | | | USD | | | | 5.50 | | | | USD | | | | 4,400,000 | | | $ | (304,000 | ) |
|
| |
Hudbay Minerals, Inc. | | | Call | | | | 10/18/2024 | | | | 2,000 | | | | USD | | | | 7.50 | | | | USD | | | | 1,500,000 | | | | (325,000 | ) |
|
| |
IAMGOLD Corp. | | | Call | | | | 09/20/2024 | | | | 5,000 | | | | USD | | | | 5.00 | | | | USD | | | | 2,500,000 | | | | (100,000 | ) |
|
| |
Ivanhoe Mines Ltd. | | | Call | | | | 07/19/2024 | | | | 4,000 | | | | CAD | | | | 16.50 | | | | CAD | | | | 6,600,000 | | | | (761,268 | ) |
|
| |
Ivanhoe Mines Ltd. | | | Call | | | | 08/16/2024 | | | | 2,000 | | | | CAD | | | | 21.00 | | | | CAD | | | | 4,200,000 | | | | (102,423 | ) |
|
| |
MAG Silver Corp. | | | Call | | | | 05/17/2024 | | | | 3,000 | | | | USD | | | | 15.00 | | | | USD | | | | 4,500,000 | | | | (15,000 | ) |
|
| |
MP Materials Corp. | | | Call | | | | 05/17/2024 | | | | 2,000 | | | | USD | | | | 15.00 | | | | USD | | | | 3,000,000 | | | | (300,000 | ) |
|
| |
Newmont Corp. | | | Call | | | | 06/21/2024 | | | | 2,000 | | | | USD | | | | 37.50 | | | | USD | | | | 7,500,000 | | | | (790,000 | ) |
|
| |
Newmont Corp. | | | Call | | | | 09/20/2024 | | | | 3,000 | | | | USD | | | | 42.50 | | | | USD | | | | 12,750,000 | | | | (852,000 | ) |
|
| |
Ormat Technologies, Inc. | | | Call | | | | 06/21/2024 | | | | 2,900 | | | | USD | | | | 75.00 | | | | USD | | | | 21,750,000 | | | | (130,500 | ) |
|
| |
Osisko Gold Royalties Ltd. | | | Call | | | | 07/19/2024 | | | | 3,000 | | | | USD | | | | 17.50 | | | | USD | | | | 5,250,000 | | | | (105,000 | ) |
|
| |
Pan American Silver Corp. | | | Call | | | | 10/18/2024 | | | | 5,000 | | | | USD | | | | 15.00 | | | | USD | | | | 7,500,000 | | | | (2,150,000 | ) |
|
| |
Piedmont Lithium, Inc. | | | Call | | | | 05/17/2024 | | | | 2,000 | | | | USD | | | | 19.00 | | | | USD | | | | 3,800,000 | | | | (10,000 | ) |
|
| |
Piedmont Lithium, Inc. | | | Call | | | | 08/16/2024 | | | | 4,000 | | | | USD | | | | 21.00 | | | | USD | | | | 8,400,000 | | | | (190,000 | ) |
|
| |
Royal Gold, Inc. | | | Call | | | | 07/19/2024 | | | | 1,000 | | | | USD | | | | 145.00 | | | | USD | | | | 14,500,000 | | | | (97,500 | ) |
|
| |
Torex Gold Resources, Inc. | | | Call | | | | 07/19/2024 | | | | 7,000 | | | | CAD | | | | 19.00 | | | | CAD | | | | 13,300,000 | | | | (927,977 | ) |
|
| |
Wheaton Precious Metals Corp. | | | Call | | | | 09/20/2024 | | | | 2,000 | | | | USD | | | | 60.00 | | | | USD | | | | 12,000,000 | | | | (370,000 | ) |
|
| |
Wheaton Precious Metals Corp. | | | Call | | | | 09/20/2024 | | | | 6,000 | | | | USD | | | | 55.00 | | | | USD | | | | 33,000,000 | | | | (2,010,000 | ) |
|
| |
Subtotal – Equity Call Options Written | | | | | | | | | | | | | | | | | | | | | | | | | | | | | | | (26,602,500 | ) |
|
| |
Equity Risk | | | | | | | | | | | | | | | | | | | | | | | | | | | | | | | | |
|
| |
Agnico Eagle Mines Ltd. | | | Put | | | | 08/16/2024 | | | | 1,000 | | | | USD | | | | 50.00 | | | | USD | | | | 5,000,000 | | | | (40,000 | ) |
|
| |
Albemarle Corp. | | | Put | | | | 06/21/2024 | | | | 1,000 | | | | USD | | | | 90.00 | | | | USD | | | | 9,000,000 | | | | (80,500 | ) |
|
| |
A-Mark Precious Metals, Inc. | | | Put | | | | 09/20/2024 | | | | 1,000 | | | | USD | | | | 25.00 | | | | USD | | | | 2,500,000 | | | | (32,500 | ) |
|
| |
AngloGold Ashanti Ltd. | | | Put | | | | 10/18/2024 | | | | 1,000 | | | | USD | | | | 18.00 | | | | USD | | | | 1,800,000 | | | | (92,500 | ) |
|
| |
Barrick Gold Corp. | | | Put | | | | 09/20/2024 | | | | 1,000 | | | | USD | | | | 16.00 | | | | USD | | | | 1,600,000 | | | | (96,500 | ) |
|
| |
Cameco Corp. | | | Put | | | | 06/21/2024 | | | | 2,000 | | | | USD | | | | 37.00 | | | | USD | | | | 7,400,000 | | | | (77,000 | ) |
|
| |
DRDGOLD Ltd. | | | Put | | | | 05/17/2024 | | | | 2,000 | | | | USD | | | | 7.50 | | | | USD | | | | 1,500,000 | | | | (30,000 | ) |
|
| |
Eldorado Gold Corp. | | | Put | | | | 07/19/2024 | | | | 2,000 | | | | USD | | | | 9.00 | | | | USD | | | | 1,800,000 | | | | (75,000 | ) |
|
| |
Endeavour Mining PLC | | | Put | | | | 09/20/2024 | | | | 2,000 | | | | CAD | | | | 24.50 | | | | CAD | | | | 4,900,000 | | | | (192,496 | ) |
|
| |
Filo Corp. | | | Put | | | | 06/21/2024 | | | | 1,000 | | | | CAD | | | | 18.50 | | | | CAD | | | | 1,850,000 | | | | (11,259 | ) |
|
| |
Franco-Nevada Corp. | | | Put | | | | 10/18/2024 | | | | 1,000 | | | | USD | | | | 95.00 | | | | USD | | | | 9,500,000 | | | | (130,000 | ) |
|
| |
Freeport-McMoRan, Inc. | | | Put | | | | 08/16/2024 | | | | 1,000 | | | | USD | | | | 39.00 | | | | USD | | | | 3,900,000 | | | | (40,000 | ) |
|
| |
Hudbay Minerals, Inc. | | | Put | | | | 10/18/2024 | | | | 2,000 | | | | USD | | | | 7.50 | | | | USD | | | | 1,500,000 | | | | (105,000 | ) |
|
| |
IAMGOLD Corp. | | | Put | | | | 09/20/2024 | | | | 3,000 | | | | USD | | | | 3.00 | | | | USD | | | | 900,000 | | | | (75,000 | ) |
|
| |
MP Materials Corp. | | | Put | | | | 05/17/2024 | | | | 1,000 | | | | USD | | | | 15.00 | | | | USD | | | | 1,500,000 | | | | (42,500 | ) |
|
| |
Newmont Corp. | | | Put | | | | 09/20/2024 | | | | 2,000 | | | | USD | | | | 32.50 | | | | USD | | | | 6,500,000 | | | | (116,000 | ) |
|
| |
Novagold Resources, Inc. | | | Put | | | | 09/20/2024 | | | | 3,000 | | | | USD | | | | 3.00 | | | | USD | | | | 900,000 | | | | (150,000 | ) |
|
| |
Ormat Technologies, Inc. | | | Put | | | | 06/21/2024 | | | | 1,500 | | | | USD | | | | 60.00 | | | | USD | | | | 9,000,000 | | | | (236,250 | ) |
|
| |
Pan American Silver Corp. | | | Put | | | | 10/18/2024 | | | | 1,000 | | | | USD | | | | 12.00 | | | | USD | | | | 1,200,000 | | | | (17,500 | ) |
|
| |
Piedmont Lithium, Inc. | | | Put | | | | 11/15/2024 | | | | 2,000 | | | | USD | | | | 10.00 | | | | USD | | | | 2,000,000 | | | | (340,000 | ) |
|
| |
Royal Gold, Inc. | | | Put | | | | 07/19/2024 | | | | 1,000 | | | | USD | | | | 95.00 | | | | USD | | | | 9,500,000 | | | | (45,000 | ) |
|
| |
Seabridge Gold, Inc. | | | Put | | | | 07/19/2024 | | | | 1,000 | | | | USD | | | | 11.00 | | | | USD | | | | 1,100,000 | | | | (10,000 | ) |
|
| |
SPDR Gold Shares | | | Put | | | | 06/21/2024 | | | | 200 | | | | USD | | | | 192.00 | | | | USD | | | | 3,840,000 | | | | (3,200 | ) |
|
| |
Wesdome Gold Mines Ltd. | | | Put | | | | 07/19/2024 | | | | 3,000 | | | | CAD | | | | 8.50 | | | | CAD | | | | 2,550,000 | | | | (32,688 | ) |
|
| |
Wheaton Precious Metals Corp. | | | Put | | | | 09/20/2024 | | | | 1,000 | | | | USD | | | | 39.00 | | | | USD | | | | 3,900,000 | | | | (40,000 | ) |
|
| |
Subtotal – Equity Put Options Written | | | | | | | | | | | | | | | | | | | | | | | | | | | | | | | (2,110,893 | ) |
|
| |
Total Open Exchange-Traded Equity Options Written | | | | | | | | | | | | | | | | | | | | | | | $ | (28,713,393 | ) |
|
| |
| (a) | Open Exchange-Traded Options Written collateralized by $79,714 cash held with Morgan Stanley. |
| * | Notional Value is calculated by multiplying the Number of Contracts by the Exercise Price by the multiplier. |
See accompanying Notes to Consolidated Financial Statements which are an integral part of the financial statements.
| | |
| 10 | | Invesco Gold & Special Minerals Fund |
|
| Abbreviations: |
|
| CAD –Canadian Dollar |
|
| SPDR –Standard & Poor’s Depositary Receipt |
|
| USD –U.S. Dollar |
See accompanying Notes to Consolidated Financial Statements which are an integral part of the financial statements.
| | |
| 11 | | Invesco Gold & Special Minerals Fund |
Consolidated Statement of Assets and Liabilities
April 30, 2024
| | | | |
Assets: | | | | |
| |
Investments in unaffiliated securities, at value (Cost $1,227,088,899) | | $ | 1,875,778,154 | |
|
| |
Investments in affiliated money market funds, at value
(Cost $25,834,343) | | | 25,833,761 | |
|
| |
Deposits with brokers:
Cash collateral – OTC Derivatives | | | 79,714 | |
|
| |
Cash | | | 1,210,028 | |
|
| |
Foreign currencies, at value (Cost $3,741,936) | | | 3,722,280 | |
|
| |
Receivable for: | | | | |
Investments sold | | | 1,044,459 | |
|
| |
Fund shares sold | | | 2,194,211 | |
|
| |
Dividends | | | 957,587 | |
|
| |
Investment for trustee deferred compensation and retirement plans | | | 138,910 | |
|
| |
Other assets | | | 51,030 | |
|
| |
Total assets | | | 1,911,010,134 | |
|
| |
| |
Liabilities: | | | | |
| |
Other investments: | | | | |
Options written, at value (premiums received $19,043,398) | | | 28,713,393 | |
|
| |
| |
Payable for: | | | | |
Investments purchased | | | 11,573,826 | |
|
| |
Fund shares reacquired | | | 2,731,731 | |
|
| |
Accrued fees to affiliates | | | 915,133 | |
|
| |
Accrued trustees’ and officers’ fees and benefits | | | 34,288 | |
|
| |
Accrued other operating expenses | | | 134,639 | |
|
| |
Trustee deferred compensation and retirement plans | | | 148,145 | |
|
| |
Total liabilities | | | 44,251,155 | |
|
| |
Net assets applicable to shares outstanding | | $ | 1,866,758,979 | |
|
| |
| |
Net assets consist of: | | | | |
| |
Shares of beneficial interest | | $ | 2,977,021,907 | |
|
| |
Distributable earnings (loss) | | | (1,110,262,928 | ) |
|
| |
| | $ | 1,866,758,979 | |
|
| |
| | | | |
Net Assets: | | | | |
| |
Class A | | $ | 831,276,341 | |
|
| |
Class C | | $ | 73,420,131 | |
|
| |
Class R | | $ | 123,912,054 | |
|
| |
Class Y | | $ | 494,604,017 | |
|
| |
Class R5 | | $ | 1,246,433 | |
|
| |
Class R6 | | $ | 342,300,003 | |
|
| |
|
Shares outstanding, no par value, with an unlimited number of shares authorized: | |
| |
Class A | | | 34,116,061 | |
|
| |
Class C | | | 3,391,069 | |
|
| |
Class R | | | 5,376,171 | |
|
| |
Class Y | | | 20,270,509 | |
|
| |
Class R5 | | | 51,047 | |
|
| |
Class R6 | | | 13,887,785 | |
|
| |
Class A: | | | | |
Net asset value per share | | $ | 24.37 | |
|
| |
Maximum offering price per share
(Net asset value of $24.37 ÷ 94.50%) | | $ | 25.79 | |
|
| |
Class C: | | | | |
Net asset value and offering price per share | | $ | 21.65 | |
|
| |
Class R: | | | | |
Net asset value and offering price per share | | $ | 23.05 | |
|
| |
Class Y: | | | | |
Net asset value and offering price per share | | $ | 24.40 | |
|
| |
Class R5: | | | | |
Net asset value and offering price per share | | $ | 24.42 | |
|
| |
Class R6: | | | | |
Net asset value and offering price per share | | $ | 24.65 | |
|
| |
See accompanying Notes to Consolidated Financial Statements which are an integral part of the financial statements.
| | |
| 12 | | Invesco Gold & Special Minerals Fund |
Consolidated Statement of Operations
For the year ended April 30, 2024
| | | | |
Investment income: | | | | |
| |
Dividends (net of foreign withholding taxes of $2,880,019) | | $ | 23,371,482 | |
|
| |
Dividends from affiliates | | | 1,141,320 | |
|
| |
Total investment income | | | 24,512,802 | |
|
| |
| |
Expenses: | | | | |
| |
Advisory fees | | | 10,870,042 | |
|
| |
Administrative services fees | | | 258,425 | |
|
| |
Custodian fees | | | 127,996 | |
|
| |
Distribution fees: | | | | |
Class A | | | 1,931,245 | |
|
| |
Class C | | | 763,463 | |
|
| |
Class R | | | 594,875 | |
|
| |
Transfer agent fees – A, C, R and Y | | | 2,929,448 | |
|
| |
Transfer agent fees – R5 | | | 1,309 | |
|
| |
Transfer agent fees – R6 | | | 97,801 | |
|
| |
Trustees’ and officers’ fees and benefits | | | 45,822 | |
|
| |
Registration and filing fees | | | 124,844 | |
|
| |
Reports to shareholders | | | 350,734 | |
|
| |
Professional services fees | | | 84,976 | |
|
| |
Other | | | 31,690 | |
|
| |
Total expenses | | | 18,212,670 | |
|
| |
Less: Fees waived and/or expense offset arrangement(s) | | | (25,292 | ) |
|
| |
Net expenses | | | 18,187,378 | |
|
| |
Net investment income | | | 6,325,424 | |
|
| |
| |
Realized and unrealized gain (loss) from: | | | | |
| |
Net realized gain (loss) from: | | | | |
Unaffiliated investment securities | | | (126,663,803 | ) |
|
| |
Affiliated investment securities | | | 4,699,052 | |
|
| |
Foreign currencies | | | (93,523 | ) |
|
| |
Forward foreign currency contracts | | | (29,736 | ) |
|
| |
Option contracts written | | | 43,409,704 | |
|
| |
| | | (78,678,306 | ) |
|
| |
Change in net unrealized appreciation (depreciation) of: | | | | |
Unaffiliated investment securities | | | 69,754,345 | |
|
| |
Affiliated investment securities | | | (3,260,038 | ) |
|
| |
Foreign currencies | | | (13,585 | ) |
|
| |
Option contracts written | | | (15,812,449 | ) |
|
| |
| | | 50,668,273 | |
|
| |
Net realized and unrealized gain (loss) | | | (28,010,033 | ) |
|
| |
Net increase (decrease) in net assets resulting from operations | | $ | (21,684,609 | ) |
|
| |
See accompanying Notes to Consolidated Financial Statements which are an integral part of the financial statements.
| | |
| 13 | | Invesco Gold & Special Minerals Fund |
Consolidated Statement of Changes in Net Assets
For the years ended April 30, 2024 and 2023
| | | | | | | | |
| | | 2024 | | | 2023 | |
|
| |
Operations: | | | | | | | | |
| | |
Net investment income | | $ | 6,325,424 | | | $ | 9,438,773 | |
|
| |
Net realized gain (loss) | | | (78,678,306 | ) | | | (256,121,886 | ) |
|
| |
Change in net unrealized appreciation | | | 50,668,273 | | | | 34,155,590 | |
|
| |
Net increase (decrease) in net assets resulting from operations | | | (21,684,609 | ) | | | (212,527,523 | ) |
|
| |
| | |
Distributions to shareholders from distributable earnings: | | | | | | | | |
| | |
Class A | | | (6,582,803 | ) | | | (3,777,806 | ) |
|
| |
| | |
Class C | | | (38,982 | ) | | | – | |
|
| |
| | |
Class R | | | (715,526 | ) | | | (185,799 | ) |
|
| |
| | |
Class Y | | | (5,211,617 | ) | | | (3,820,437 | ) |
|
| |
| | |
Class R5 | | | (14,338 | ) | | | (4,070 | ) |
|
| |
| | |
Class R6 | | | (4,140,261 | ) | | | (2,622,908 | ) |
|
| |
Total distributions from distributable earnings | | | (16,703,527 | ) | | | (10,411,020 | ) |
|
| |
| | |
Share transactions–net: | | | | | | | | |
Class A | | | (77,119,299 | ) | | | (49,378,469 | ) |
|
| |
Class C | | | (16,861,360 | ) | | | (10,841,252 | ) |
|
| |
Class R | | | (10,805,631 | ) | | | (5,748,846 | ) |
|
| |
Class Y | | | (59,905,707 | ) | | | (38,913,355 | ) |
|
| |
Class R5 | | | (28,092 | ) | | | (701,763 | ) |
|
| |
Class R6 | | | 5,473,440 | | | | 15,804,056 | |
|
| |
Net increase (decrease) in net assets resulting from share transactions | | | (159,246,649 | ) | | | (89,779,629 | ) |
|
| |
Net increase (decrease) in net assets | | | (197,634,785 | ) | | | (312,718,172 | ) |
|
| |
| | |
Net assets: | | | | | | | | |
| | |
Beginning of year | | | 2,064,393,764 | | | | 2,377,111,936 | |
|
| |
| | |
End of year | | $ | 1,866,758,979 | | | $ | 2,064,393,764 | |
|
| |
See accompanying Notes to Consolidated Financial Statements which are an integral part of the financial statements.
| | |
| 14 | | Invesco Gold & Special Minerals Fund |
Consolidated Financial Highlights
The following schedule presents financial highlights for a share of the Fund outstanding throughout the periods indicated.
| | | | | | | | | | | | | | | | | | | | | | | | | | | | | | | | | | | | | | | | | | | | | | | | |
| | | Net asset value, beginning of period | | Net investment income (loss)(a) | | Net gains (losses) on securities (both realized and unrealized) | | Total from investment operations | | Dividends from net investment income | | Net asset value, end of period | | Total return(b) | | Net assets, end of period (000’s omitted) | | Ratio of expenses to average net assets with fee waivers and/or expenses absorbed | | Ratio of expenses to average net assets without fee waivers and/or expenses absorbed | | Ratio of net investment income (loss) to average net assets | | Portfolio turnover (c) |
Class A | | | | | | | | | | | | | | | | | | | | | | | | | | | | | | | | | | | | | | | | | | | | | | | | |
Year ended 04/30/24 | | | $24.58 | | | | $ 0.06 | | | | $(0.08 | ) | | | $(0.02 | ) | | | $(0.19 | ) | | | $24.37 | | | | (0.04 | )%(d) | | | $ 831,276 | | | | 1.10 | %(d) | | | 1.10 | %(d) | | | 0.26 | %(d) | | | 30 | % |
Year ended 04/30/23 | | | 26.81 | | | | 0.09 | | | | (2.22 | ) | | | (2.13 | ) | | | (0.10 | ) | | | 24.58 | | | | (7.90 | )(d) | | | 924,057 | | | | 1.06 | (d) | | | 1.06 | (d) | | | 0.43 | (d) | | | 30 | |
Year ended 04/30/22 | | | 27.70 | | | | 0.05 | | | | (0.01 | ) | | | 0.04 | | | | (0.93 | ) | | | 26.81 | | | | 0.43 | (d) | | | 1,070,962 | | | | 1.05 | (d) | | | 1.05 | (d) | | | 0.19 | (d) | | | 32 | |
Year ended 04/30/21 | | | 21.77 | | | | 0.06 | | | | 6.30 | | | | 6.36 | | | | (0.43 | ) | | | 27.70 | | | | 29.28 | (d) | | | 1,098,007 | | | | 1.05 | (d) | | | 1.05 | (d) | | | 0.21 | (d) | | | 43 | |
Ten months ended 04/30/20 | | | 17.87 | | | | 0.02 | | | | 3.94 | | | | 3.96 | | | | (0.06 | ) | | | 21.77 | | | | 22.21 | | | | 705,341 | | | | 1.17 | (e) | | | 1.20 | (e) | | | 0.13 | (e) | | | 44 | |
Year ended 06/30/19 | | | 15.51 | | | | 0.00 | | | | 2.36 | | | | 2.36 | | | | – | | | | 17.87 | | | | 15.22 | | | | 532,925 | | | | 1.17 | | | | 1.18 | | | | 0.00 | | | | 35 | |
Class C | | | | | | | | | | | | | | | | | | | | | | | | | | | | | | | | | | | | | | | | | | | | | | | | |
Year ended 04/30/24 | | | 21.84 | | | | (0.10 | ) | | | (0.08 | ) | | | (0.18 | ) | | | (0.01 | ) | | | 21.65 | | | | (0.82 | ) | | | 73,420 | | | | 1.86 | | | | 1.86 | | | | (0.50 | ) | | | 30 | |
Year ended 04/30/23 | | | 23.89 | | | | (0.06 | ) | | | (1.99 | ) | | | (2.05 | ) | | | – | | | | 21.84 | | | | (8.58 | ) | | | 93,031 | | | | 1.82 | | | | 1.82 | | | | (0.33 | ) | | | 30 | |
Year ended 04/30/22 | | | 24.98 | | | | (0.14 | ) | | | (0.02 | ) | | | (0.16 | ) | | | (0.93 | ) | | | 23.89 | | | | (0.34 | ) | | | 116,380 | | | | 1.81 | | | | 1.81 | | | | (0.57 | ) | | | 32 | |
Year ended 04/30/21 | | | 19.68 | | | | (0.14 | ) | | | 5.70 | | | | 5.56 | | | | (0.26 | ) | | | 24.98 | | | | 28.27 | | | | 128,089 | | | | 1.81 | | | | 1.81 | | | | (0.55 | ) | | | 43 | |
Ten months ended 04/30/20 | | | 16.20 | | | | (0.09 | ) | | | 3.57 | | | | 3.48 | | | | – | | | | 19.68 | | | | 21.48 | | | | 99,528 | | | | 1.92 | (e) | | | 1.96 | (e) | | | (0.62 | )(e) | | | 44 | |
Year ended 06/30/19 | | | 14.17 | | | | (0.10 | ) | | | 2.13 | | | | 2.03 | | | | – | | | | 16.20 | | | | 14.33 | | | | 88,904 | | | | 1.92 | | | | 1.93 | | | | (0.76 | ) | | | 35 | |
Class R | | | | | | | | | | | | | | | | | | | | | | | | | | | | | | | | | | | | | | | | | | | | | | | | |
Year ended 04/30/24 | | | 23.26 | | | | 0.00 | | | | (0.08 | ) | | | (0.08 | ) | | | (0.13 | ) | | | 23.05 | | | | (0.31 | ) | | | 123,912 | | | | 1.36 | | | | 1.36 | | | | 0.00 | | | | 30 | |
Year ended 04/30/23 | | | 25.35 | | | | 0.04 | | | | (2.10 | ) | | | (2.06 | ) | | | (0.03 | ) | | | 23.26 | | | | (8.10 | ) | | | 136,937 | | | | 1.32 | | | | 1.32 | | | | 0.17 | | | | 30 | |
Year ended 04/30/22 | | | 26.32 | | | | (0.02 | ) | | | (0.02 | ) | | | (0.04 | ) | | | (0.93 | ) | | | 25.35 | | | | 0.14 | | | | 157,476 | | | | 1.31 | | | | 1.31 | | | | (0.07 | ) | | | 32 | |
Year ended 04/30/21 | | | 20.69 | | | | (0.01 | ) | | | 5.98 | | | | 5.97 | | | | (0.34 | ) | | | 26.32 | | | | 28.90 | | | | 153,232 | | | | 1.31 | | | | 1.31 | | | | (0.05 | ) | | | 43 | |
Ten months ended 04/30/20 | | | 16.98 | | | | (0.02 | ) | | | 3.75 | | | | 3.73 | | | | (0.02 | ) | | | 20.69 | | | | 21.99 | | | | 125,316 | | | | 1.42 | (e) | | | 1.46 | (e) | | | (0.12 | )(e) | | | 44 | |
Year ended 06/30/19 | | | 14.77 | | | | (0.04 | ) | | | 2.25 | | | | 2.21 | | | | – | | | | 16.98 | | | | 14.96 | | | | 113,589 | | | | 1.42 | | | | 1.43 | | | | (0.25 | ) | | | 35 | |
Class Y | | | | | | | | | | | | | | | | | | | | | | | | | | | | | | | | | | | | | | | | | | | | | | | | |
Year ended 04/30/24 | | | 24.61 | | | | 0.11 | | | | (0.08 | ) | | | 0.03 | | | | (0.24 | ) | | | 24.40 | | | | 0.21 | | | | 494,604 | | | | 0.86 | | | | 0.86 | | | | 0.50 | | | | 30 | |
Year ended 04/30/23 | | | 26.86 | | | | 0.15 | | | | (2.24 | ) | | | (2.09 | ) | | | (0.16 | ) | | | 24.61 | | | | (7.68 | ) | | | 568,856 | | | | 0.82 | | | | 0.82 | | | | 0.67 | | | | 30 | |
Year ended 04/30/22 | | | 27.69 | | | | 0.12 | | | | (0.02 | ) | | | 0.10 | | | | (0.93 | ) | | | 26.86 | | | | 0.64 | | | | 675,653 | | | | 0.81 | | | | 0.81 | | | | 0.43 | | | | 32 | |
Year ended 04/30/21 | | | 21.78 | | | | 0.12 | | | | 6.31 | | | | 6.43 | | | | (0.52 | ) | | | 27.69 | | | | 29.57 | | | | 600,958 | | | | 0.81 | | | | 0.81 | | | | 0.45 | | | | 43 | |
Ten months ended 04/30/20 | | | 17.88 | | | | 0.06 | | | | 3.93 | | | | 3.99 | | | | (0.09 | ) | | | 21.78 | | | | 22.41 | | | | 349,290 | | | | 0.92 | (e) | | | 0.96 | (e) | | | 0.38 | (e) | | | 44 | |
Year ended 06/30/19 | | | 15.48 | | | | 0.04 | | | | 2.36 | | | | 2.40 | | | | – | | | | 17.88 | | | | 15.50 | | | | 229,569 | | | | 0.92 | | | | 0.93 | | | | 0.24 | | | | 35 | |
Class R5 | | | | | | | | | | | | | | | | | | | | | | | | | | | | | | | | | | | | | | | | | | | | | | | | |
Year ended 04/30/24 | | | 24.63 | | | | 0.13 | | | | (0.08 | ) | | | 0.05 | | | | (0.26 | ) | | | 24.42 | | | | 0.31 | | | | 1,246 | | | | 0.76 | | | | 0.76 | | | | 0.60 | | | | 30 | |
Year ended 04/30/23 | | | 26.89 | | | | 0.17 | | | | (2.24 | ) | | | (2.07 | ) | | | (0.19 | ) | | | 24.63 | | | | (7.60 | ) | | | 1,144 | | | | 0.73 | | | | 0.73 | | | | 0.76 | | | | 30 | |
Year ended 04/30/22 | | | 27.69 | | | | 0.14 | | | | (0.01 | ) | | | 0.13 | | | | (0.93 | ) | | | 26.89 | | | | 0.75 | | | | 2,164 | | | | 0.72 | | | | 0.72 | | | | 0.52 | | | | 32 | |
Year ended 04/30/21 | | | 21.79 | | | | 0.16 | | | | 6.31 | | | | 6.47 | | | | (0.57 | ) | | | 27.69 | | | | 29.75 | | | | 141 | | | | 0.69 | | | | 0.69 | | | | 0.57 | | | | 43 | |
Ten months ended 04/30/20 | | | 17.87 | | | | 0.08 | | | | 3.95 | | | | 4.03 | | | | (0.11 | ) | | | 21.79 | | | | 22.65 | | | | 30 | | | | 0.77 | (e) | | | 0.77 | (e) | | | 0.53 | (e) | | | 44 | |
Period ended 06/30/19(f) | | | 14.75 | | | | 0.01 | | | | 3.11 | | | | 3.12 | | | | – | | | | 17.87 | | | | 21.15 | | | | 12 | | | | 0.80 | (e) | | | 0.80 | (e) | | | 0.35 | (e) | | | 35 | |
Class R6 | | | | | | | | | | | | | | | | | | | | | | | | | | | | | | | | | | | | | | | | | | | | | | | | |
Year ended 04/30/24 | | | 24.87 | | | | 0.15 | | | | (0.08 | ) | | | 0.07 | | | | (0.29 | ) | | | 24.65 | | | | 0.38 | | | | 342,300 | | | | 0.69 | | | | 0.69 | | | | 0.67 | | | | 30 | |
Year ended 04/30/23 | | | 27.15 | | | | 0.18 | | | | (2.25 | ) | | | (2.07 | ) | | | (0.21 | ) | | | 24.87 | | | | (7.52 | ) | | | 340,370 | | | | 0.66 | | | | 0.66 | | | | 0.83 | | | | 30 | |
Year ended 04/30/22 | | | 27.94 | | | | 0.16 | | | | (0.02 | ) | | | 0.14 | | | | (0.93 | ) | | | 27.15 | | | | 0.78 | | | | 354,476 | | | | 0.65 | | | | 0.65 | | | | 0.59 | | | | 32 | |
Year ended 04/30/21 | | | 21.98 | | | | 0.16 | | | | 6.37 | | | | 6.53 | | | | (0.57 | ) | | | 27.94 | | | | 29.79 | | | | 293,817 | | | | 0.66 | | | | 0.66 | | | | 0.60 | | | | 43 | |
Ten months ended 04/30/20 | | | 18.03 | | | | 0.09 | | | | 3.98 | | | | 4.07 | | | | (0.12 | ) | | | 21.98 | | | | 22.65 | | | | 197,933 | | | | 0.74 | (e) | | | 0.74 | (e) | | | 0.56 | (e) | | | 44 | |
Year ended 06/30/19 | | | 15.58 | | | | 0.06 | | | | 2.39 | | | | 2.45 | | | | – | | | | 18.03 | | | | 15.73 | | | | 133,853 | | | | 0.75 | | | | 0.76 | | | | 0.41 | | | | 35 | |
| (a) | Calculated using average shares outstanding. |
| (b) | Includes adjustments in accordance with accounting principles generally accepted in the United States of America and as such, the net asset value for financial reporting purposes and the returns based upon those net asset values may differ from the net asset value and returns for shareholder transactions. Does not include sales charges and is not annualized for periods less than one year, if applicable. |
| (c) | Portfolio turnover is calculated at the fund level and is not annualized for periods less than one year, if applicable. For the year ended April 30, 2021, the portfolio turnover calculation excludes the value of securities purchased of $210,653,892 and sold of $9,084,044 in the effort to realign the Fund’s portfolio holdings after the reorganization of Invesco Gold & Precious Metals Fund into the Fund. |
| (d) | The total return, ratio of expenses to average net assets and ratio of net investment income (loss) to average net assets reflect actual 12b-1 fees of 0.24% for the years ended April 30, 2024, 2023, 2022 and 2021, respectively. |
| (f) | Commencement date after the close of business on May 24, 2019. |
See accompanying Notes to Consolidated Financial Statements which are an integral part of the financial statements.
| | |
| 15 | | Invesco Gold & Special Minerals Fund |
Notes to Consolidated Financial Statements
April 30, 2024
NOTE 1–Significant Accounting Policies
Invesco Gold & Special Minerals Fund (the “Fund”) is a series portfolio of AIM Sector Funds (Invesco Sector Funds) (the “Trust”). The Trust is a Delaware statutory trust registered under the Investment Company Act of 1940, as amended (the “1940 Act”), as an open-end series management investment company authorized to issue an unlimited number of shares of beneficial interest. Information presented in these consolidated financial statements pertains only to the Fund and the Invesco Gold & Special Minerals Fund (Cayman) Ltd. (the “Subsidiary”), a wholly-owned and controlled subsidiary by the Fund organized under the laws of the Cayman Islands. Matters affecting the Fund or each class will be voted on exclusively by the shareholders of the Fund or each class.
The Fund will seek to gain exposure to the commodity market through investments in the Subsidiary. The Subsidiary was organized by the Fund to invest in gold bullion and other precious metals, shares of exchange-traded funds that invest in gold bullion (Gold ETFs), commodity linked derivatives related to gold or other special mineral (including commodity futures, financial futures, options and swap contracts, and certain fixed-income securities and other investments that may serve as margin or collateral for its derivatives positions). The Fund may invest up to 25% of its total assets in the Subsidiary.
The Fund’s investment objective is to seek capital appreciation.
The Fund currently consists of six different classes of shares: Class A, Class C, Class R, Class Y, Class R5 and Class R6. Class Y shares are available only to certain investors. Class A shares are sold with a front-end sales charge unless certain waiver criteria are met. Under certain circumstances, load waived shares may be subject to contingent deferred sales charges (“CDSC”). Class C shares are sold with a CDSC. Class R, Class Y, Class R5 and Class R6 shares are sold at net asset value. Class C shares held for eight years after purchase are eligible for automatic conversion into Class A shares of the same Fund (the “Conversion Feature”). The automatic conversion pursuant to the Conversion Feature will generally occur at the end of the month following the eighth anniversary after a purchase of Class C shares.
The Fund is an investment company and accordingly follows the investment company accounting and reporting guidance in accordance with Financial Accounting Standards Board Accounting Standards Codification Topic 946, Financial Services – Investment Companies.
The following is a summary of the significant accounting policies followed by the Fund in the preparation of its consolidated financial statements.
| A. | Security Valuations – Securities, including restricted securities, are valued according to the following policy. |
A security listed or traded on an exchange is generally valued at its trade price or official closing price that day as of the close of the exchange where the security is principally traded, or lacking any trades or official closing price on a particular day, the security may be valued at the closing bid or ask price on that day. Securities traded in the over-the-counter market are valued based on prices furnished by independent pricing services or market makers. When such securities are valued using prices provided by an independent pricing service they may be considered fair valued. Futures contracts are valued at the daily settlement price set by an exchange on which they are principally traded. Where a final settlement price exists, exchange-traded options are valued at the final settlement price from the exchange where the option principally trades. Where a final settlement price does not exist, exchange-traded options are valued at the mean between the last bid and ask price generally from the exchange where the option principally trades.
Securities of investment companies that are not exchange-traded (e.g., open-end mutual funds) are valued using such company’s end-of-business-day net asset value per share.
Deposits, other obligations of U.S. and non-U.S. banks and financial institutions are valued at their daily account value.
Swap agreements are fair valued using an evaluated quote, if available, provided by an independent pricing service. Evaluated quotes provided by the pricing service are valued based on a model which may include end-of-day net present values, spreads, ratings, industry, company performance and returns of referenced assets. Centrally cleared swap agreements are valued at the daily settlement price determined by the relevant exchange or clearinghouse.
Fixed income securities (including convertible debt securities) generally are valued on the basis of prices provided by independent pricing services. Prices provided by the pricing service may be determined without exclusive reliance on quoted prices, and may reflect appropriate factors such as institution-size trading in similar groups of securities, developments related to specific securities, dividend rate (for unlisted equities), yield (for debt obligations), quality, type of issue, coupon rate (for debt obligations), maturity (for debt obligations), individual trading characteristics and other market data. Pricing services generally value debt obligations assuming orderly transactions of institutional round lot size, but a fund may hold or transact in the same securities in smaller, odd lot sizes. Odd lots often trade at lower prices than institutional round lots, and their value may be adjusted accordingly. Debt obligations are subject to interest rate and credit risks. In addition, all debt obligations involve some risk of default with respect to interest and/or principal payments.
Foreign securities’ (including foreign exchange contracts) prices are converted into U.S. dollar amounts using the applicable exchange rates as of the close of the New York Stock Exchange (“NYSE”). If market quotations are available and reliable for foreign exchange-traded equity securities, the securities will be valued at the market quotations. Invesco Advisers, Inc. (the “Adviser” or “Invesco”) may use various pricing services to obtain market quotations as well as fair value prices. Because trading hours for certain foreign securities end before the close of the NYSE, closing market quotations may become not representative of market value in the Adviser’s judgment (“unreliable”). If, between the time trading ends on a particular security and the close of the customary trading session on the NYSE, a significant event occurs that makes the closing price of the security unreliable, the Adviser may fair value the security. If the event is likely to have affected the closing price of the security, the security will be valued at fair value in good faith in accordance with Board-approved policies and related Adviser procedures (“Valuation Procedures”). Adjustments to closing prices to reflect fair value may also be based on a screening process of an independent pricing service to indicate the degree of certainty, based on historical data, that the closing price in the principal market where a foreign security trades is not the current value as of the close of the NYSE. Foreign securities’ prices meeting the degree of certainty that the price is not reflective of current value will be priced at the indication of fair value from the independent pricing service. Multiple factors may be considered by the independent pricing service in determining adjustments to reflect fair value and may include information relating to sector indices, American Depositary Receipts and domestic and foreign index futures. Foreign securities may have additional risks including exchange rate changes, potential for sharply devalued currencies and high inflation, political and economic upheaval, the relative lack of issuer information, relatively low market liquidity and the potential lack of strict financial and accounting controls and standards.
Unlisted securities will be valued using prices provided by independent pricing services or by another method that the Adviser, in its judgment, believes better reflects the security’s fair value in accordance with the Valuation Procedures.
Non-traded rights and warrants shall be valued at intrinsic value if the terms of the rights and warrants are available, specifically the subscription or exercise price and the ratio. Intrinsic value is calculated as the daily market closing price of the security to be received less the subscription price, which is then adjusted by the exercise ratio. In the case of warrants, an option pricing model supplied by an independent pricing service may be used based on market data such as volatility, stock price and interest rate from the independent pricing service and strike price and exercise period from verified terms.
Securities for which market prices are not provided by any of the above methods may be valued based upon quotes furnished by independent sources. The mean between the last bid and ask prices may be used to value debt obligations, including corporate loans.
Securities for which market quotations are not readily available are fair valued by the Adviser in accordance with the Valuation Procedures. If a fair value price provided by a pricing service is unreliable, the Adviser will fair value the security using the Valuation Procedures. Issuer specific events, market trends, bid/ask quotes of brokers and information providers and other market data may be reviewed in the course of making a good faith determination of a security’s fair value.
The Fund may invest in securities that are subject to interest rate risk, meaning the risk that the prices will generally fall as interest rates rise and, conversely, the prices will generally rise as interest rates fall. Specific securities differ in their sensitivity to changes in interest rates depending on their individual characteristics. Changes in interest rates may result in increased market volatility, which may affect the value and/or liquidity of certain Fund investments.
| | |
| 16 | | Invesco Gold & Special Minerals Fund |
Valuations change in response to many factors including the historical and prospective earnings of the issuer, the value of the issuer’s assets, general market conditions which are not specifically related to the particular issuer, such as real or perceived adverse economic conditions, changes in the general outlook for revenues or corporate earnings, changes in interest or currency rates, regional or global instability, natural or environmental disasters, widespread disease or other public health issues, war, acts of terrorism, significant governmental actions or adverse investor sentiment generally and market liquidity. Because of the inherent uncertainties of valuation, the values reflected in the consolidated financial statements may materially differ from the value received upon actual sale of those investments.
The price the Fund could receive upon the sale of any investment may differ from the Adviser’s valuation of the investment, particularly for securities that are valued using a fair valuation technique. When fair valuation techniques are applied, the Adviser uses available information, including both observable and unobservable inputs and assumptions, to determine a methodology that will result in a valuation that the Adviser believes approximates market value. Fund securities that are fair valued may be subject to greater fluctuation in their value from one day to the next than would be the case if market quotations were used. Because of the inherent uncertainties of valuation, and the degree of subjectivity in such decisions, the Fund could realize a greater or lesser than expected gain or loss upon the sale of the investment.
| B. | Securities Transactions and Investment Income – Securities transactions are accounted for on a trade date basis. Realized gains or losses on sales are computed on the basis of specific identification of the securities sold. Interest income (net of withholding tax, if any) is recorded on an accrual basis from settlement date and includes coupon interest and amortization of premium and accretion of discount on debt securities as applicable. Pay-in-kind interest income and non-cash dividend income received in the form of securities in lieu of cash are recorded at the fair value of the securities received. Dividend income (net of withholding tax, if any) is recorded on the ex-dividend date. |
The Fund may periodically participate in litigation related to Fund investments. As such, the Fund may receive proceeds from litigation settlements. Any proceeds received are included in the Consolidated Statement of Operations as realized gain (loss) for investments no longer held and as unrealized gain (loss) for investments still held.
Brokerage commissions and mark ups are considered transaction costs and are recorded as an increase to the cost basis of securities purchased and/or a reduction of proceeds on a sale of securities. Such transaction costs are included in the determination of net realized and unrealized gain (loss) from investment securities reported in the Consolidated Statement of Operations and the Consolidated Statement of Changes in Net Assets and the net realized and unrealized gains (losses) on securities per share in the Consolidated Financial Highlights. Transaction costs are included in the calculation of the Fund’s net asset value and, accordingly, they reduce the Fund’s total returns. These transaction costs are not considered operating expenses and are not reflected in net investment income reported in the Consolidated Statement of Operations and the Consolidated Statement of Changes in Net Assets, or the net investment income per share and the ratios of expenses and net investment income reported in the Consolidated Financial Highlights, nor are they limited by any expense limitation arrangements between the Fund and the investment adviser.
The Fund allocates income and realized and unrealized capital gains and losses to a class based on the relative net assets of each class.
| C. | Country Determination – For the purposes of making investment selection decisions and presentation in the Consolidated Schedule of Investments, the investment adviser may determine the country in which an issuer is located and/or credit risk exposure based on various factors. These factors include the laws of the country under which the issuer is organized, where the issuer maintains a principal office, the country in which the issuer derives 50% or more of its total revenues, the country that has the primary market for the issuer’s securities and its “country of risk” as determined by a third party service provider, as well as other criteria. Among the other criteria that may be evaluated for making this determination are the country in which the issuer maintains 50% or more of its assets, the type of security, financial guarantees and enhancements, the nature of the collateral and the sponsor organization. Country of issuer and/or credit risk exposure has been determined to be the United States of America, unless otherwise noted. |
| D. | Distributions – Distributions from net investment income and net realized capital gain, if any, are generally declared and paid annually and recorded on the ex-dividend date. The Fund may elect to treat a portion of the proceeds from redemptions as distributions for federal income tax purposes. |
| E. | Federal Income Taxes – The Fund intends to comply with the requirements of Subchapter M of the Internal Revenue Code of 1986, as amended (the “Internal Revenue Code”), necessary to qualify as a regulated investment company and to distribute substantially all of the Fund’s taxable earnings to shareholders. As such, the Fund will not be subject to federal income taxes on otherwise taxable income (including net realized capital gain) that is distributed to shareholders. Therefore, no provision for federal income taxes is recorded in the consolidated financial statements. |
The Fund recognizes the tax benefits of uncertain tax positions only when the position is more likely than not to be sustained. Management has analyzed the Fund’s uncertain tax positions and concluded that no liability for unrecognized tax benefits should be recorded related to uncertain tax positions. Management is not aware of any tax positions for which it is reasonably possible that the total amounts of unrecognized tax benefits will change materially in the next 12 months.
The Subsidiary is classified as a controlled foreign corporation under Subchapter N of the Internal Revenue Code. Therefore, the Fund is required to increase its taxable income by its share of the Subsidiary’s income. Net investment losses of the Subsidiary cannot be deducted by the Fund in the current period nor carried forward to offset taxable income in future periods.
The Fund files tax returns in the U.S. Federal jurisdiction and certain other jurisdictions. Generally the Fund is subject to examinations by such taxing authorities for up to three years after the filing of the return for the tax period.
| F. | Expenses – Fees provided for under the Rule 12b-1 plan of a particular class of the Fund are charged to the operations of such class. Transfer agency fees and expenses and other shareholder recordkeeping fees and expenses attributable to Class R5 and Class R6 are allocated based on relative net assets of Class R5 and Class R6. Sub-accounting fees attributable to Class R5 are charged to the operations of the class. Transfer agency fees and expenses and other shareholder recordkeeping fees and expenses relating to all other classes are allocated among those classes based on relative net assets. All other expenses are allocated among the classes based on relative net assets. |
| G. | Accounting Estimates – The financial statements are prepared on a consolidated basis in conformity with accounting principles generally accepted in the United States of America (“GAAP”), which requires management to make estimates and assumptions that affect the reported amounts of assets and liabilities at the date of the financial statements and the reported amounts of revenues and expenses during the reporting period including estimates and assumptions related to taxation. Actual results could differ from those estimates by a significant amount. The accompanying financial statements reflect the financial position of the Fund and its Subsidiary and the results of operations on a consolidated basis. All inter-company accounts and transactions have been eliminated in consolidation. |
In addition, the Fund monitors for material events or transactions that may occur or become known after the period-end date and before the date the consolidated financial statements are released to print.
| H. | Indemnifications – Under the Trust’s organizational documents, each Trustee, officer, employee or other agent of the Trust is indemnified against certain liabilities that may arise out of the performance of their duties to the Fund. Additionally, in the normal course of business, the Fund enters into contracts, including the Fund’s servicing agreements, that contain a variety of indemnification clauses. The Fund’s maximum exposure under these arrangements is unknown as this would involve future claims that may be made against the Fund that have not yet occurred. The risk of material loss as a result of such indemnification claims is considered remote. |
| I. | Foreign Currency Translations – Foreign currency is valued at the close of the NYSE based on quotations posted by banks and major currency dealers. Portfolio securities and other assets and liabilities denominated in foreign currencies are translated into U.S. dollar amounts at the date of valuation. Purchases and sales of portfolio securities (net of foreign taxes withheld on disposition) and income items denominated in foreign currencies are translated into U.S. dollar amounts on the respective dates of such transactions. The Fund does not separately account for the portion of the results of operations resulting from changes in foreign exchange rates on investments and the fluctuations arising from changes in market prices of securities held. The combined results of changes in foreign |
| | |
| 17 | | Invesco Gold & Special Minerals Fund |
exchange rates and the fluctuation of market prices on investments (net of estimated foreign tax withholding) are included with the net realized and unrealized gain or loss from investments in the Consolidated Statement of Operations. Reported net realized foreign currency gains or losses arise from (1) sales of foreign currencies, (2) currency gains or losses realized between the trade and settlement dates on securities transactions, and (3) the difference between the amounts of dividends, interest, and foreign withholding taxes recorded on the Fund’s books and the U.S. dollar equivalent of the amounts actually received or paid. Net unrealized foreign currency gains and losses arise from changes in the fair values of assets and liabilities, other than investments in securities at fiscal period end, resulting from changes in exchange rates.
The Fund may invest in foreign securities, which may be subject to foreign taxes on income, gains on investments or currency repatriation, a portion of which may be recoverable. Foreign taxes, if any, are recorded based on the tax regulations and rates that exist in the foreign markets in which the Fund invests and are shown in the Consolidated Statement of Operations.
The performance of the Fund may be materially affected positively or negatively by foreign currency strength or weakness relative to the U.S. dollar. Currency rates in foreign countries may fluctuate for a number of reasons, including changes in interest rates, political, economic, or social instability and development, and imposition of currency controls. Currency controls in certain foreign jurisdictions may cause the Fund to experience significant delays in its ability to repatriate its assets in U.S. dollars at quoted spot rates, and it is possible that the Fund’s ability to convert certain foreign currencies into U.S. dollars may be limited and may occur at discounts to quoted rates. As a result, the value of the Fund’s assets and liabilities denominated in such currencies that would ultimately be realized could differ from those reported on the Consolidated Statement of Assets and Liabilities. Certain foreign companies may be subject to sanctions, embargoes, or other governmental actions that may limit the ability to invest in, receive, hold, or sell the securities of such companies, all of which affect the market and/or credit risk of the investments. Because of the inherent uncertainties of valuation, the values reflected in the consolidated financial statements may materially differ from the value received upon actual sale of those investments.
| J. | Forward Foreign Currency Contracts – The Fund may engage in foreign currency transactions either on a spot (i.e. for prompt delivery and settlement) basis, or through forward foreign currency contracts, to manage or minimize currency or exchange rate risk. |
The Fund may also enter into forward foreign currency contracts for the purchase or sale of a security denominated in a foreign currency in order to “lock in” the U.S. dollar price of that security, or the Fund may also enter into forward foreign currency contracts that do not provide for physical exchange of the two currencies on the settlement date, but instead are settled by a single cash payment calculated as the difference between the agreed upon exchange rate and the spot rate at settlement based upon an agreed upon notional amount (non-deliverable forwards).
A forward foreign currency contract is an obligation between two parties (“Counterparties”) to purchase or sell a specific currency for an agreed-upon price at a future date. The use of forward foreign currency contracts for hedging does not eliminate fluctuations in the price of the underlying securities the Fund owns or intends to acquire but establishes a rate of exchange in advance. Fluctuations in the value of these contracts are measured by the difference in the contract date and reporting date exchange rates and are recorded as unrealized appreciation (depreciation) until the contracts are closed. When the contracts are closed, realized gains (losses) are recorded. Realized and unrealized gains (losses) on the contracts are included in the Consolidated Statement of Operations. The primary risks associated with forward foreign currency contracts include failure of the Counterparty to meet the terms of the contract and the value of the foreign currency changing unfavorably. These risks may be in excess of the amounts reflected in the Consolidated Statement of Assets and Liabilities.
| K. | Call Options Purchased and Written – The Fund may write covered call options and/or buy call options. A covered call option gives the purchaser of such option the right to buy, and the writer the obligation to sell, the underlying security or foreign currency at the stated exercise price during the option period. Options written by the Fund normally will have expiration dates between three and nine months from the date written. The exercise price of a call option may be below, equal to, or above the current market value of the underlying security at the time the option is written. |
Additionally, the Fund may enter into an option on a swap agreement, also called a “swaption”. A swaption is an option that gives the buyer the right, but not the obligation, to enter into a swap on a future date in exchange for paying a market-based premium. A receiver swaption gives the owner the right to receive the total return of a specified asset, reference rate or index. Swaptions also include options that allow an existing swap to be terminated or extended by one of the Counterparties.
When the Fund writes a covered call option, an amount equal to the premium received by the Fund is recorded as an asset and an equivalent liability in the Consolidated Statement of Assets and Liabilities. The amount of the liability is subsequently “marked-to-market” to reflect the current market value of the option written. If a written covered call option expires on the stipulated expiration date, or if the Fund enters into a closing purchase transaction, the Fund realizes a gain (or a loss if the closing purchase transaction exceeds the premium received when the option was written) without regard to any unrealized gain or loss on the underlying security, and the liability related to such option is extinguished. If a written covered call option is exercised, the Fund realizes a gain or a loss from the sale of the underlying security and the proceeds of the sale are increased by the premium originally received. Realized and unrealized gains and losses on call options written are included in the Consolidated Statement of Operations as Net realized gain (loss) from and Change in net unrealized appreciation (depreciation) of Option contracts written. A risk in writing a covered call option is that the Fund gives up the opportunity for profit if the market price of the security increases and the option is exercised.
When the Fund buys a call option, an amount equal to the premium paid by the Fund is recorded as an investment on the Consolidated Statement of Assets and Liabilities. The amount of the investment is subsequently “marked-to-market” to reflect the current value of the option purchased. Realized and unrealized gains and losses on call options purchased are included in the Consolidated Statement of Operations as Net realized gain (loss) from and Change in net unrealized appreciation (depreciation) of Investment securities. A risk in buying an option is that the Fund pays a premium whether or not the option is exercised. In addition, there can be no assurance that a liquid secondary market will exist for any option purchased.
| L. | Put Options Purchased and Written – The Fund may purchase and write put options including options on securities indexes, or foreign currency and/or futures contracts. By purchasing a put option, the Fund obtains the right (but not the obligation) to sell the option’s underlying instrument at a fixed strike price. In return for this right, the Fund pays an option premium. The option’s underlying instrument may be a security, securities index, or a futures contract. Put options may be used by the Fund to hedge securities it owns by locking in a minimum price at which the Fund can sell. If security prices fall, the put option could be exercised to offset all or a portion of the Fund’s resulting losses. At the same time, because the maximum the Fund has at risk is the cost of the option, purchasing put options does not eliminate the potential for the Fund to profit from an increase in the value of the underlying portfolio securities. The Fund may write put options to earn additional income in the form of option premiums if it expects the price of the underlying instrument to remain stable or rise during the option period so that the option will not be exercised. The risk in this strategy is that the price of the underlying securities may decline by an amount greater than the premium received. Put options written are reported as a liability in the Consolidated Statement of Assets and Liabilities. Realized and unrealized gains and losses on put options purchased and put options written are included in the Consolidated Statement of Operations as Net realized gain (loss) from and Change in net unrealized appreciation (depreciation) of Investment securities and Option contracts written, respectively. A risk in buying an option is that the Fund pays a premium whether or not the option is exercised. In addition, there can be no assurance that a liquid secondary market will exist for any option purchased. |
| M. | Other Risks – The Subsidiary will seek to gain exposure to gold bullion and other precious metals, Gold ETFs, commodity-linked derivatives related to gold or other special minerals (including commodity futures, financial futures, options and swap contracts), and certain fixed income securities and other investments that may serve as margin or collateral for its derivatives positions. The Fund is indirectly exposed to the risks associated with the Subsidiary’s investments. |
The Fund is classified as a “non-diversified” fund under the Investment Company Act of 1940. Accordingly, the Fund may invest a greater portion of its assets in the securities of a single issuer or limited number of issuers than a “diversified” fund. To the extent that the Fund invests a higher percentage of its assets in the securities of a single issuer or limited number of issuers, the Fund is more subject to the risks associated with and developments affecting that issuer or limited number of issuers than a fund that invests more widely.
| | |
| 18 | | Invesco Gold & Special Minerals Fund |
NOTE 2–Advisory Fees and Other Fees Paid to Affiliates
The Trust has entered into a master investment advisory agreement with the Adviser. Under the terms of the investment advisory agreement, the Fund accrues daily and pays monthly an advisory fee to the Adviser based on the annual rate of the Fund’s average daily net assets as follows:
| | | | |
| Average Daily Net Assets | | Rate* | |
|
| |
Up to $200 million | | | 0.750% | |
|
| |
Next $150 million | | | 0.720% | |
|
| |
Next $350 million | | | 0.680% | |
|
| |
Next $1.3 billion | | | 0.560% | |
|
| |
Next $2 billion | | | 0.460% | |
|
| |
Next $2 billion | | | 0.410% | |
|
| |
Next $2 billion | | | 0.385% | |
|
| |
Next $8 billion | | | 0.360% | |
|
| |
| * | The advisory fee paid by the Fund shall be reduced by any amounts paid by the Fund under the administrative services agreement with the Adviser. |
For the year ended April 30, 2024, the effective advisory fee rate incurred by the Fund was 0.60%.
Under the terms of a master sub-advisory agreement between the Adviser and each of Invesco Asset Management Deutschland GmbH, Invesco Asset Management Limited, Invesco Asset Management (Japan) Limited, Invesco Hong Kong Limited, Invesco Senior Secured Management, Inc. and Invesco Canada Ltd. and separate sub-advisory agreements with Invesco Capital Management LLC and Invesco Asset Management (India) Private Limited (collectively, the “Affiliated Sub-Advisers”) the Adviser, not the Fund, will pay 40% of the fees paid to the Adviser to any such Affiliated Sub-Adviser(s) that provide(s) discretionary investment management services to the Fund based on the percentage of assets allocated to such Affiliated Sub-Adviser(s). Invesco has also entered into a sub-advisory agreement with OppenheimerFunds, Inc. to provide discretionary management services to the Fund.
Effective July 1, 2023, the Adviser has agreed, for an indefinite period, to waive advisory fees and/or reimburse expenses of all shares to the extent necessary to limit total annual fund operating expenses after fee waiver and/or expense reimbursement (excluding certain items discussed below) of Class A, Class C, Class R, Class Y, Class R5 and Class R6 shares to 2.00%, 2.75%, 2.25%, 1.75%, 1.75% and 1.75%, respectively, of the Fund’s average daily net assets (the “boundary limits”). Prior to July 1, 2023, the same boundary limits were in effect with an expiration date of June 30, 2023. In determining the Adviser’s obligation to waive advisory fees and/or reimburse expenses, the following expenses are not taken into account, and could cause the total annual fund operating expenses after fee waiver and/or expense reimbursement to exceed the numbers reflected above: (1) interest; (2) taxes; (3) dividend expense on short sales; (4) extraordinary or non-routine items, including litigation expenses; and (5) expenses that the Fund has incurred but did not actually pay because of an expense offset arrangement. Invesco may amend and/or terminate these boundary limits at any time in its sole discretion and will inform the Board of Trustees of any such changes. The Adviser did not waive fees and/or reimburse expenses during the period under these boundary limits.
Further, the Adviser has contractually agreed, through at least June 30, 2025, to waive the advisory fee payable by the Fund in an amount equal to 100% of the net advisory fees the Adviser receives from the affiliated money market funds on investments by the Fund of uninvested cash in such affiliated money market funds.
For the year ended April 30, 2024, the Adviser waived advisory fees of $23,889.
The Trust has entered into a master administrative services agreement with Invesco pursuant to which the Fund has agreed to pay Invesco for certain administrative costs incurred in providing accounting services to the Fund. For the year ended April 30, 2024, expenses incurred under the agreement are shown in the Consolidated Statement of Operations as Administrative services fees. Invesco has entered into a sub-administration agreement whereby State Street Bank and Trust Company (“SSB”) serves as fund accountant and provides certain administrative services to the Fund. Pursuant to a custody agreement with the Trust on behalf of the Fund, SSB also serves as the Fund’s custodian.
The Trust has entered into a transfer agency and service agreement with Invesco Investment Services, Inc. (“IIS”) pursuant to which the Fund has agreed to pay IIS a fee for providing transfer agency and shareholder services to the Fund and reimburse IIS for certain expenses incurred by IIS in the course of providing such services. IIS may make payments to intermediaries that provide omnibus account services, sub-accounting services and/or networking services. All fees payable by IIS to intermediaries that provide omnibus account services or sub-accounting services are charged back to the Fund, subject to certain limitations approved by the Trust’s Board of Trustees. For the year ended April 30, 2024, expenses incurred under the agreement are shown in the Consolidated Statement of Operations as Transfer agent fees.
The Trust has entered into master distribution agreements with Invesco Distributors, Inc. (“IDI”) to serve as the distributor for the Class A, Class C, Class R, Class Y, Class R5 and Class R6 shares of the Fund. The Trust has adopted plans pursuant to Rule 12b-1 under the 1940 Act with respect to the Fund’s Class A, Class C and Class R shares (collectively, the “Plans”). The Fund, pursuant to the Class A Plan, reimburses IDI for its allocated share of expenses incurred for the period, up to a maximum annual rate of 0.25% of the average daily net assets of Class A shares. The Fund, pursuant to the Class C and Class R Plans, pays IDI compensation at the annual rate of 1.00% of the average daily net assets of Class C shares and 0.50% of the average daily net assets of Class R shares. The fees are accrued daily and paid monthly. Of the Plans payments, up to 0.25% of the average daily net assets of each class of shares may be paid to furnish continuing personal shareholder services to customers who purchase and own shares of such classes. Any amounts not paid as a service fee under the Plans would constitute an asset-based sales charge. Rules of the Financial Industry Regulatory Authority (“FINRA”) impose a cap on the total sales charges, including asset-based sales charges, that may be paid by any class of shares of the Fund. For the year ended April 30, 2024, expenses incurred under the Plans are shown in the Consolidated Statement of Operations as Distribution fees.
Front-end sales commissions and CDSC (collectively, the “sales charges”) are not recorded as expenses of the Fund. Front-end sales commissions are deducted from proceeds from the sales of Fund shares prior to investment in Class A shares of the Fund. CDSC are deducted from redemption proceeds prior to remittance to the shareholder. During the year ended April 30, 2024, IDI advised the Fund that IDI retained $94,865 in front-end sales commissions from the sale of Class A shares and $2,655 and $7,473 from Class A and Class C shares, respectively, for CDSC imposed upon redemptions by shareholders.
For the year ended April 30, 2024, the Fund incurred $115,849 in brokerage commissions with Invesco Capital Markets, Inc., an affiliate of the Adviser and IDI, for portfolio transactions executed on behalf of the Fund.
Certain officers and trustees of the Trust are officers and directors of the Adviser, IIS and/or IDI.
NOTE 3–Additional Valuation Information
GAAP defines fair value as the price that would be received to sell an asset or paid to transfer a liability in an orderly transaction between market participants at the measurement date, under current market conditions. GAAP establishes a hierarchy that prioritizes the inputs to valuation methods, giving the highest priority to readily available unadjusted quoted prices in an active market for identical assets (Level 1) and the lowest priority to significant unobservable inputs (Level 3), generally when market prices are not readily available. Based on the valuation inputs, the securities or other investments are tiered into one of three levels. Changes in valuation methods may result in transfers in or out of an investment’s assigned level:
| | |
| Level 1 - | | Prices are determined using quoted prices in an active market for identical assets. |
| | |
| 19 | | Invesco Gold & Special Minerals Fund |
| | |
| Level 2 - | | Prices are determined using other significant observable inputs. Observable inputs are inputs that other market participants may use in pricing a security. These may include quoted prices for similar securities, interest rates, prepayment speeds, credit risk, yield curves, loss severities, default rates, discount rates, volatilities and others. |
| Level 3 - | | Prices are determined using significant unobservable inputs. In situations where quoted prices or observable inputs are unavailable (for example, when there is little or no market activity for an investment at the end of the period), unobservable inputs may be used. Unobservable inputs reflect the Adviser’s assumptions about the factors market participants would use in determining fair value of the securities or instruments and would be based on the best available information. |
The following is a summary of the tiered valuation input levels, as of April 30, 2024. The level assigned to the securities valuations may not be an indication of the risk or liquidity associated with investing in those securities. Because of the inherent uncertainties of valuation, the values reflected in the consolidated financial statements may materially differ from the value received upon actual sale of those investments.
| | | | | | | | | | | | | | | | |
| | | Level 1 | | | Level 2 | | | Level 3 | | | Total | |
|
| |
Investments in Securities | | | | | | | | | | | | | | | | |
|
| |
Australia | | $ | 36,886,713 | | | $ | 372,362,635 | | | $ | 585,422 | | | $ | 409,834,770 | |
|
| |
Bosnia Hercegovina | | | – | | | | 7,949,649 | | | | – | | | | 7,949,649 | |
|
| |
Brazil | | | 52,298,245 | | | | – | | | | – | | | | 52,298,245 | |
|
| |
Burkina Faso | | | 41,566,521 | | | | – | | | | – | | | | 41,566,521 | |
|
| |
Canada | | | 936,245,510 | | | | 462,550 | | | | – | | | | 936,708,060 | |
|
| |
Colombia | | | 11,835,931 | | | | – | | | | – | | | | 11,835,931 | |
|
| |
Egypt | | | – | | | | 6,644,320 | | | | – | | | | 6,644,320 | |
|
| |
South Africa | | | 63,828,314 | | | | – | | | | – | | | | 63,828,314 | |
|
| |
Turkey | | | 28,398,819 | | | | – | | | | – | | | | 28,398,819 | |
|
| |
United Kingdom | | | 49,016,979 | | | | – | | | | – | | | | 49,016,979 | |
|
| |
United States | | | 251,608,826 | | | | – | | | | – | | | | 251,608,826 | |
|
| |
Zambia | | | 16,087,720 | | | | – | | | | – | | | | 16,087,720 | |
|
| |
Money Market Funds | | | 25,833,761 | | | | – | | | | – | | | | 25,833,761 | |
|
| |
Total Investments in Securities | | | 1,513,607,339 | | | | 387,419,154 | | | | 585,422 | | | | 1,901,611,915 | |
|
| |
| | | | |
Other Investments - Liabilities* | | | | | | | | | | | | | | | | |
|
| |
Options Written | | | (28,713,393 | ) | | | – | | | | – | | | | (28,713,393 | ) |
|
| |
Total Investments | | $ | 1,484,893,946 | | | $ | 387,419,154 | | | $ | 585,422 | | | $ | 1,872,898,522 | |
|
| |
| * | Options written are shown at value. |
NOTE 4–Derivative Investments
The Fund may enter into an ISDA Master Agreement under which a fund may trade OTC derivatives. An OTC transaction entered into under an ISDA Master Agreement typically involves a collateral posting arrangement, payment netting provisions and close-out netting provisions. These netting provisions allow for reduction of credit risk through netting of contractual obligations. The enforceability of the netting provisions of the ISDA Master Agreement depends on the governing law of the ISDA Master Agreement, among other factors.
For financial reporting purposes, the Fund does not offset OTC derivative assets or liabilities that are subject to ISDA Master Agreements in the Consolidated Statement of Assets and Liabilities.
Value of Derivative Investments at Period-End
The table below summarizes the value of the Fund’s derivative investments, detailed by primary risk exposure, held as of April 30, 2024:
| | | | |
| | | Value | |
| Derivative Liabilities | | Equity
Risk | |
|
| |
Options written, at value – Exchange-Traded | | $ | (28,713,393 | ) |
|
| |
Derivatives not subject to master netting agreements | | | 28,713,393 | |
|
| |
Total Derivative Liabilities subject to master netting agreements | | $ | – | |
|
| |
Effect of Derivative Investments for the year ended April 30, 2024
The table below summarizes the gains (losses) on derivative investments, detailed by primary risk exposure, recognized in earnings during the period:
| | | | | | | | | | | | |
| | | Location of Gain (Loss) on
Consolidated Statement of Operations | |
| | | Currency
Risk | | | Equity Risk | | | Total | |
|
| |
| | | | | | | | | | |
Realized Gain (Loss): | | | | | | | | | | | | |
Forward foreign currency contracts | | $ | (29,736 | ) | | $ | – | | | $ | (29,736 | ) |
|
| |
Options written | | | – | | | | 43,409,704 | | | | 43,409,704 | |
|
| |
Change in Net Unrealized Appreciation (Depreciation): | | | | | | | | | | | | |
Options written | | | – | | | | (15,812,449 | ) | | | (15,812,449 | ) |
|
| |
Total | | $ | (29,736 | ) | | $ | 27,597,255 | | | $ | 27,567,519 | |
|
| |
| | |
| 20 | | Invesco Gold & Special Minerals Fund |
The table below summarizes the average notional value of derivatives held during the period.
| | | | | | | | | | | | |
| | | Forward | | | | | | Equity | |
| | | Foreign Currency | | | | | | Options | |
| | | Contracts | | | | | | Written | |
|
| |
Average notional value | | | $4,075,326 | | | | | | | | $407,999,749 | |
|
| |
Average contracts | | | – | | | | | | | | 142,627 | |
|
| |
NOTE 5–Security Transactions with Affiliated Funds
The Fund is permitted to purchase securities from or sell securities to certain other affiliated funds under specified conditions outlined in procedures adopted by the Board of Trustees of the Trust. The procedures have been designed to ensure that any purchase or sale of securities by the Fund from or to another fund that is or could be considered an “affiliated person” by virtue of having a common investment adviser (or affiliated investment advisers), common Trustees and/or common officers is made in reliance on Rule 17a-7 of the 1940 Act and, to the extent applicable, related SEC staff positions. Each such transaction is effected at the security’s “current market price”, as provided for in these procedures and Rule 17a-7. Pursuant to these procedures, for the year ended April 30, 2024, the Fund engaged in securities purchases of $8,136,864.
NOTE 6–Expense Offset Arrangement(s)
The expense offset arrangement is comprised of transfer agency credits which result from balances in demand deposit accounts used by the transfer agent for clearing shareholder transactions. For the year ended April 30, 2024, the Fund received credits from this arrangement, which resulted in the reduction of the Fund’s total expenses of $1,403.
NOTE 7–Trustees’ and Officers’ Fees and Benefits
Trustees’ and Officers’ Fees and Benefits include amounts accrued by the Fund to pay remuneration to certain Trustees and Officers of the Fund. Trustees have the option to defer compensation payable by the Fund, and Trustees’ and Officers’ Fees and Benefits also include amounts accrued by the Fund to fund such deferred compensation amounts. Those Trustees who defer compensation have the option to select various Invesco Funds in which their deferral accounts shall be deemed to be invested. Finally, certain current Trustees were eligible to participate in a retirement plan that provided for benefits to be paid upon retirement to Trustees over a period of time based on the number of years of service. The Fund may have certain former Trustees who also participate in a retirement plan and receive benefits under such plan. Trustees’ and Officers’ Fees and Benefits include amounts accrued by the Fund to fund such retirement benefits. Obligations under the deferred compensation and retirement plans represent unsecured claims against the general assets of the Fund.
NOTE 8–Cash Balances
The Fund is permitted to temporarily carry a negative or overdrawn balance in its account with SSB, the custodian bank. Such balances, if any at period-end, are shown in the Consolidated Statement of Assets and Liabilities under the payable caption Amount due custodian. To compensate the custodian bank for such overdrafts, the overdrawn Fund may either (1) leave funds as a compensating balance in the account so the custodian bank can be compensated by earning the additional interest; or (2) compensate by paying the custodian bank at a rate agreed upon by the custodian bank and Invesco, not to exceed the contractually agreed upon rate.
NOTE 9–Distributions to Shareholders and Tax Components of Net Assets
Tax Character of Distributions to Shareholders Paid During the Fiscal Years Ended April 30, 2024 and 2023:
| | | | | | | | | | | | |
| | | 2024 | | | | | | 2023 | |
|
| |
Ordinary income* | | $ | 16,703,527 | | | | | | | $ | 10,411,020 | |
|
| |
| * | Includes short-term capital gain distributions, if any. |
Tax Components of Net Assets at Period-End:
| | | | |
| | | 2024 | |
|
| |
Undistributed ordinary income | | $ | 16,849,092 | |
|
| |
Net unrealized appreciation – investments | | | 545,477,375 | |
|
| |
Net unrealized appreciation (depreciation) – foreign currencies | | | (24,922 | ) |
|
| |
Temporary book/tax differences | | | (155,072 | ) |
|
| |
Capital loss carryforward | | | (1,672,409,401 | ) |
|
| |
Shares of beneficial interest | | | 2,977,021,907 | |
|
| |
Total net assets | | $ | 1,866,758,979 | |
|
| |
The difference between book-basis and tax-basis unrealized appreciation (depreciation) is due to differences in the timing of recognition of gains and losses on investments for tax and book purposes. The Fund’s net unrealized appreciation (depreciation) difference is attributable primarily to passive foreign investment companies.
The temporary book/tax differences are a result of timing differences between book and tax recognition of income and/or expenses. The Fund’s temporary book/tax differences are the result of the trustee deferral of compensation and retirement plan benefits.
Capital loss carryforward is calculated and reported as of a specific date. Results of transactions and other activity after that date may affect the amount of capital loss carryforward actually available for the Fund to utilize. The ability to utilize capital loss carryforward in the future may be limited under the Internal Revenue Code and related regulations based on the results of future transactions.
| | |
| 21 | | Invesco Gold & Special Minerals Fund |
The Fund has a capital loss carryforward as of April 30, 2024, as follows:
| | | | | | | | | | | | |
| Capital Loss Carryforward* | |
|
| |
| Expiration | | Short-Term | | | Long-Term | | | Total | |
|
| |
Not subject to expiration | | | $236,578,877 | | | | $1,435,830,524 | | | | $1,672,409,401 | |
|
| |
| * | Capital loss carryforward is reduced for limitations, if any, to the extent required by the Internal Revenue Code and may be further limited depending upon a variety of factors, including the realization of net unrealized gains or losses as of the date of any reorganization. |
NOTE 10–Investment Transactions
The aggregate amount of investment securities (other than short-term securities, U.S. Government obligations and money market funds, if any) purchased and sold by the Fund during the year ended April 30, 2024 was $548,347,287 and $655,810,374, respectively. Cost of investments, including any derivatives, on a tax basis includes the adjustments for financial reporting purposes as of the most recently completed federal income tax reporting period-end.
| | | | |
Unrealized Appreciation (Depreciation) of Investments on a Tax Basis | |
Aggregate unrealized appreciation of investments | | $ | 625,975,867 | |
|
| |
Aggregate unrealized (depreciation) of investments | | | (80,498,492 | ) |
|
| |
Net unrealized appreciation of investments | | $ | 545,477,375 | |
|
| |
Cost of investments for tax purposes is $1,327,421,147.
NOTE 11–Reclassification of Permanent Differences
Primarily as a result of differing book/tax treatment of passive foreign investment companies, on April 30, 2024, undistributed net investment income was increased by $3,147,396, undistributed net realized gain (loss) was decreased by $3,144,021 and shares of beneficial interest was decreased by $3,375. This reclassification had no effect on the net assets of the Fund.
NOTE 12–Share Information
| | | | | | | | | | | | | | | | |
| | | Summary of Share Activity | |
|
| |
| | | Year ended | | | Year ended | |
| | | April 30, 2024(a) | | | April 30, 2023 | |
| | | Shares | | | Amount | | | Shares | | | Amount | |
|
| |
Sold: | | | | | | | | | | | | | | | | |
Class A | | | 5,506,560 | | | $ | 123,711,403 | | | | 7,174,707 | | | $ | 156,993,090 | |
|
| |
Class C | | | 466,657 | | | | 9,352,347 | | | | 752,893 | | | | 14,825,588 | |
|
| |
Class R | | | 1,504,943 | | | | 31,679,165 | | | | 1,679,267 | | | | 34,709,397 | |
|
| |
Class Y | | | 5,174,484 | | | | 115,305,282 | | | | 9,661,675 | | | | 210,274,225 | |
|
| |
Class R5 | | | 95,524 | | | | 2,051,778 | | | | 32,221 | | | | 775,134 | |
|
| |
Class R6 | | | 5,781,465 | | | | 130,542,828 | | | | 6,728,378 | | | | 148,650,412 | |
|
| |
| | | | |
Issued as reinvestment of dividends: | | | | | | | | | | | | | | | | |
Class A | | | 268,361 | | | | 6,040,773 | | | | 160,276 | | | | 3,421,902 | |
|
| |
Class C | | | 1,715 | | | | 34,398 | | | | - | | | | - | |
|
| |
Class R | | | 33,537 | | | | 714,677 | | | | 9,168 | | | | 185,372 | |
|
| |
Class Y | | | 182,307 | | | | 4,105,545 | | | | 139,194 | | | | 2,973,187 | |
|
| |
Class R5 | | | 632 | | | | 14,240 | | | | 187 | | | | 4,000 | |
|
| |
Class R6 | | | 174,584 | | | | 3,968,283 | | | | 119,172 | | | | 2,570,535 | |
|
| |
| | | | |
Automatic conversion of Class C shares to Class A shares: | | | | | | | | | | | | | | | | |
Class A | | | 377,474 | | | | 8,306,972 | | | | 327,581 | | | | 7,079,647 | |
|
| |
Class C | | | (425,189 | ) | | | (8,306,972 | ) | | | (368,386 | ) | | | (7,079,647 | ) |
|
| |
| | | | |
Reacquired: | | | | | | | | | | | | | | | | |
Class A | | | (9,633,845 | ) | | | (215,178,447 | ) | | | (10,015,837 | ) | | | (216,873,108 | ) |
|
| |
Class C | | | (912,611 | ) | | | (17,941,133 | ) | | | (996,151 | ) | | | (18,587,193 | ) |
|
| |
Class R | | | (2,050,621 | ) | | | (43,199,473 | ) | | | (2,011,492 | ) | | | (40,643,615 | ) |
|
| |
Class Y | | | (8,198,300 | ) | | | (179,316,534 | ) | | | (11,841,667 | ) | | | (252,160,767 | ) |
|
| |
Class R5 | | | (91,540 | ) | | | (2,094,110 | ) | | | (66,464 | ) | | | (1,480,897 | ) |
|
| |
Class R6 | | | (5,754,160 | ) | | | (129,037,671 | ) | | | (6,217,403 | ) | | | (135,416,891 | ) |
|
| |
Net increase (decrease) in share activity | | | (7,498,023 | ) | | $ | (159,246,649 | ) | | | (4,732,681 | ) | | $ | (89,779,629 | ) |
|
| |
| (a) | There are entities that are record owners of more than 5% of the outstanding shares of the Fund and in the aggregate own 23% of the outstanding shares of the Fund. IDI has an agreement with these entities to sell Fund shares. The Fund, Invesco and/or Invesco affiliates may make payments to these entities, which are considered to be related to the Fund, for providing services to the Fund, Invesco and/or Invesco affiliates including but not limited to services such as securities brokerage, distribution, third party record keeping and account servicing. The Fund has no knowledge as to whether all or any portion of the shares owned of record by these entities are also owned beneficially. |
| | |
| 22 | | Invesco Gold & Special Minerals Fund |
Report of Independent Registered Public Accounting Firm
To the Board of Trustees of AIM Sector Funds (Invesco Sector Funds) and Shareholders of Invesco Gold & Special Minerals Fund
Opinion on the Consolidated Financial Statements
We have audited the accompanying consolidated statement of assets and liabilities, including the consolidated schedule of investments, of Invesco Gold & Special Minerals Fund and its subsidiary (one of the funds constituting AIM Sector Funds (Invesco Sector Funds), referred to hereafter as the “Fund”) as of April 30, 2024, the related consolidated statement of operations for the year ended April 30, 2024, the consolidated statement of changes in net assets for each of the two years in the period ended April 30, 2024, including the related notes, and the consolidated financial highlights for each of the periods indicated therein (collectively referred to as the “consolidated financial statements”). In our opinion, the consolidated financial statements present fairly, in all material respects, the financial position of the Fund as of April 30, 2024, the results of its operations for the year then ended, the changes in its net assets for each of the two years in the period ended April 30, 2024 and the financial highlights for each of the periods indicated therein in conformity with accounting principles generally accepted in the United States of America.
Basis for Opinion
These consolidated financial statements are the responsibility of the Fund’s management. Our responsibility is to express an opinion on the Fund’s consolidated financial statements based on our audits. We are a public accounting firm registered with the Public Company Accounting Oversight Board (United States) (PCAOB) and are required to be independent with respect to the Fund in accordance with the U.S. federal securities laws and the applicable rules and regulations of the Securities and Exchange Commission and the PCAOB.
We conducted our audits of these consolidated financial statements in accordance with the standards of the PCAOB. Those standards require that we plan and perform the audit to obtain reasonable assurance about whether the consolidated financial statements are free of material misstatement, whether due to error or fraud.
Our audits included performing procedures to assess the risks of material misstatement of the consolidated financial statements, whether due to error or fraud, and performing procedures that respond to those risks. Such procedures included examining, on a test basis, evidence regarding the amounts and disclosures in the consolidated financial statements. Our audits also included evaluating the accounting principles used and significant estimates made by management, as well as evaluating the overall presentation of the consolidated financial statements. Our procedures included confirmation of securities owned as of April 30, 2024 by correspondence with the custodian, transfer agent and brokers; when replies were not received from brokers, we performed other auditing procedures. We believe that our audits provide a reasonable basis for our opinion.
/s/PricewaterhouseCoopers LLP
Houston, Texas
June 20, 2024
We have served as the auditor of one or more of the investment companies in the Invesco group of investment companies since at least 1995. We have not been able to determine the specific year we began serving as auditor.
| | |
| 23 | | Invesco Gold & Special Minerals Fund |
Calculating your ongoing Fund expenses
Example
As a shareholder of the Fund, you incur two types of costs: (1) transaction costs, which may include sales charges (loads) on purchase payments or contingent deferred sales charges on redemptions, if any; and (2) ongoing costs, including management fees, distribution and/or service (12b-1) fees, and other Fund expenses. This example is intended to help you understand your ongoing costs (in dollars) of investing in the Fund and to compare these costs with ongoing costs of investing in other mutual funds. The example is based on an investment of $1,000 invested at the beginning of the period and held for the entire period November 1, 2023 through April 30, 2024.
Actual expenses
The table below provides information about actual account values and actual expenses. You may use the information in this table, together with the amount you invested, to estimate the expenses that you paid over the period. Simply divide your account value by $1,000 (for example, an $8,600 account value divided by $1,000 = 8.6), then multiply the result by the number in the table under the heading entitled “Actual Expenses Paid During Period” to estimate the expenses you paid on your account during this period.
Hypothetical example for comparison purposes
The table below also provides information about hypothetical account values and hypothetical expenses based on the Fund’s actual expense ratio and an assumed rate of return of 5% per year before expenses, which is not the Fund’s actual return.
The hypothetical account values and expenses may not be used to estimate the actual ending account balance or expenses you paid for the period. You may use this information to compare the ongoing costs of investing in the Fund and other funds. To do so, compare this 5% hypothetical example with the 5% hypothetical examples that appear in the shareholder reports of the other funds.
Please note that the expenses shown in the table are meant to highlight your ongoing costs only and do not reflect any transaction costs, such as sales charges (loads) on purchase payments or contingent deferred sales charges on redemptions, if any. Therefore, the hypothetical information is useful in comparing ongoing costs only, and will not help you determine the relative total costs of owning different funds. In addition, if these transaction costs were included, your costs would have been higher.
| | | | | | | | | | | | |
| | | | | ACTUAL | | HYPOTHETICAL (5% annual return before expenses) | | |
| | | Beginning Account Value
(11/01/23) | | Ending Account Value (04/30/24)1 | | Expenses Paid During Period | | Ending Account Value
(04/30/24)2 | | Expenses Paid During
Period2 | | Annualized Expense Ratio |
Class A | | $1,000.00 | | $1,215.20 | | $6.11 | | $1,019.34 | | $5.57 | | 1.11% |
Class C | | 1,000.00 | | 1,210.70 | | 10.28 | | 1,015.56 | | 9.37 | | 1.87 |
Class R | | 1,000.00 | | 1,213.40 | | 7.54 | | 1,018.05 | | 6.87 | | 1.37 |
Class Y | | 1,000.00 | | 1,216.70 | | 4.79 | | 1,020.54 | | 4.37 | | 0.87 |
Class R5 | | 1,000.00 | | 1,217.00 | | 4.24 | | 1,021.03 | | 3.87 | | 0.77 |
Class R6 | | 1,000.00 | | 1,217.80 | | 3.86 | | 1,021.38 | | 3.52 | | 0.70 |
| 1 | The actual ending account value is based on the actual total return of the Fund for the period November 1, 2023 through April 30, 2024, after actual expenses and will differ from the hypothetical ending account value which is based on the Fund’s expense ratio and a hypothetical annual return of 5% before expenses. |
| 2 | Expenses are equal to the Fund’s annualized expense ratio as indicated above multiplied by the average account value over the period, multiplied by 182/366 to reflect the most recent fiscal half year. |
| | |
| 24 | | Invesco Gold & Special Minerals Fund |
Tax Information
Form 1099-DIV, Form 1042-S and other year–end tax information provide shareholders with actual calendar year amounts that should be included in their tax returns. Shareholders should consult their tax advisers.
The following distribution information is being provided as required by the Internal Revenue Code or to meet a specific state’s requirement.
The Fund designates the following amounts or, if subsequently determined to be different, the maximum amount allowable for its fiscal year ended April 30, 2024:
| | | | | | | | |
Federal and State Income Tax | | | | | | |
Qualified Dividend Income* | | | 100.00 | % | | | | |
Corporate Dividends Received Deduction* | | | 26.79 | % | | | | |
U.S. Treasury Obligations* | | | 0.00 | % | | | | |
Qualified Business Income* | | | 0.00 | % | | | | |
Business Interest Income* | | | 0.00 | % | | | | |
|
| * The above percentages are based on ordinary income dividends paid to shareholders during the Fund’s fiscal year. | |
| | |
| 25 | | Invesco Gold & Special Minerals Fund |
Trustees and Officers
The address of each trustee and officer is AIM Sector Funds (Invesco Sector Funds) (the “Trust”), 11 Greenway Plaza, Houston, Texas 77046-1173. The trustees serve for the life of the Trust, subject to their earlier death, incapacitation, resignation, retirement or removal as more specifically provided in the Trust’s organizational documents. Each officer serves for a one year term or until their successors are elected and qualified. Column two below includes length of time served with predecessor entities, if any.
| | | | | | | | |
Name, Year of Birth and
Position(s) Held with the Trust | | Trustee and/or
Officer Since | | Principal Occupation(s) During Past 5 Years | | Number of
Funds in Fund Complex
Overseen by
Trustee | | Other Directorship(s) Held by Trustee
During At Least The Past 5 Years |
| Interested Trustees | | | | | | | | |
| Jeffrey H. Kupor1 - 1968 Trustee | | 2024 | | Senior Managing Director and General Counsel, Invesco Ltd.; Trustee, Invesco Foundation, Inc.; Director, Invesco Advisers, Inc.; Executive Vice President, Invesco Asset Management (Bermuda), Ltd., Invesco Investments (Bermuda) Ltd.; and Vice President, Invesco Group Services, Inc. Formerly: Head of Legal of the Americas, Invesco Ltd.; Senior Vice President and Secretary, Invesco Advisers, Inc. (formerly known as Invesco Institutional (N.A.), Inc.) (registered investment adviser); Secretary, Invesco Distributors, Inc. (formerly known as Invesco AIM Distributors, Inc.); Vice President and Secretary, Invesco Investment Services, Inc. (formerly known as Invesco AIM Investment Services, Inc.); Senior Vice President, Chief Legal Officer and Secretary, The Invesco Funds; Secretary and General Counsel, Invesco Investment Advisers LLC (formerly known as Van Kampen Asset Management); Secretary and General Counsel, Invesco Capital Markets, Inc. (formerly known as Van Kampen Funds Inc.) and Chief Legal Officer, Invesco Exchange-Traded Fund Trust, Invesco Exchange-Traded Fund Trust II, Invesco India Exchange-Traded Fund Trust, Invesco Actively Managed Exchange-Traded Fund Trust, Invesco Actively Managed Exchange-Traded Commodity Fund Trust and Invesco Exchange-Traded Self-Indexed Fund Trust; Secretary and Vice President, Harbourview Asset Management Corporation; Secretary and Vice President, OppenheimerFunds, Inc. and Invesco Managed Accounts, LLC; Secretary and Senior Vice President, OFI Global Institutional, Inc.; Secretary and Vice President, OFI SteelPath, Inc.; Secretary and Vice President, Oppenheimer Acquisition Corp.; Secretary and Vice President, Shareholder Services, Inc.; Secretary and Vice President, Trinity Investment Management Corporation, Senior Vice President, Invesco Distributors, Inc.; Secretary and Vice President, Jemstep, Inc.; Head of Legal, Worldwide Institutional, Invesco Ltd.; Secretary and General Counsel, INVESCO Private Capital Investments, Inc.; Senior Vice President, Secretary and General Counsel, Invesco Management Group, Inc. (formerly known as Invesco AIM Management Group, Inc.); Assistant Secretary, INVESCO Asset Management (Bermuda) Ltd.; Secretary and General Counsel, Invesco Private Capital, Inc.; Assistant Secretary and General Counsel, INVESCO Realty, Inc.; Secretary and General Counsel, Invesco Senior Secured Management, Inc.; Secretary, Sovereign G./P. Holdings Inc.; Secretary, Invesco Indexing LLC; and Secretary, W.L. Ross & Co., LLC | | 164 | | None |
| Douglas Sharp1 - 1974 Trustee | | 2024 | | Senior Managing Director and Head of Americas & EMEA, Invesco Ltd. Formerly: Director and Chairman Invesco UK Limited; Director, Chairman and Chief Executive, Invesco Fund Managers Limited | | 164 | | None |
| 1 | Mr. Kupor and Mr. Sharp are considered interested persons (within the meaning of Section 2(a)(19) of the 1940 Act) of the Trust because they are officers of the Adviser to the Trust, and officers of Invesco Ltd., ultimate parent of the Adviser. |
| | |
| T-1 | | Invesco Gold & Special Minerals Fund |
Trustees and Officers–(continued)
| | | | | | | | |
Name, Year of Birth and
Position(s) Held with the Trust | | Trustee and/or
Officer Since | | Principal Occupation(s) During Past 5 Years | | Number of
Funds in Fund Complex
Overseen by
Trustee | | Other Directorship(s) Held by Trustee
During At Least The Past 5 Years |
| Independent Trustees | | | | | | | | |
Beth Ann Brown - 1968 Trustee (2019) and Chair (2022) | | 2019 | | Independent Consultant Formerly: Head of Intermediary Distribution, Managing Director, Strategic Relations, Managing Director, Head of National Accounts, Senior Vice President, National Account Manager and Senior Vice President, Key Account Manager, Columbia Management Investment Advisers LLC; and Vice President, Key Account Manager, Liberty Funds Distributor, Inc. | | 164 | | Director, Board of Directors of Caron Engineering Inc.; Formerly: Advisor, Board of Advisors of Caron Engineering Inc.; President and Director, Acton Shapleigh Youth Conservation Corps (non-profit); President and Director Director of Grahamtastic Connection (non-profit); and Trustee of certain Oppenheimer Funds |
Carol Deckbar - 1962 Trustee | | 2024 | | Formerly: Executive Vice President and Chief Product Officer, TIAA Financial Services; Executive Vice President and Principal, College Retirement Equities Fund at TIAA; Executive Vice President and Head of Institutional Investments and Endowment Services, TIAA | | 164 | | Formerly: Board Member, TIAA Asset Management, Inc.; and Board Member, TH Real Estate Group Holdings Company |
Cynthia Hostetler - 1962 Trustee | | 2017 | | Non-Executive Director and Trustee of a number of public and private business corporations Formerly: Director, Aberdeen Investment Funds (4 portfolios); Director, Artio Global Investment LLC (mutual fund complex); Director, Edgen Group, Inc. (specialized energy and infrastructure products distributor); Director, Genesee & Wyoming, Inc. (railroads); Head of Investment Funds and Private Equity, Overseas Private Investment Corporation; President, First Manhattan Bancorporation, Inc.; and Attorney, Simpson Thacher & Bartlett LLP | | 164 | | Resideo Technologies, Inc. (smart home technology); Vulcan Materials Company (construction materials company); Trilinc Global Impact Fund; Investment Company Institute (professional organization); and Independent Directors Council (professional organization) |
Eli Jones - 1961 Trustee | | 2016 | | Professor and Dean Emeritus, Mays Business School - Texas A&M University Formerly: Dean of Mays Business School-Texas A&M University; Professor and Dean, Walton College of Business, University of Arkansas and E.J. Ourso College of Business, Louisiana State University; and Director, Arvest Bank | | 164 | | Insperity, Inc. (formerly known as Administaff) (human resources provider); Board Member of the regional board, First Financial Bank Texas; and Boad Member, First Financial Bankshares, Inc. Texas |
Elizabeth Krentzman - 1959 Trustee | | 2019 | | Formerly: Principal and Chief Regulatory Advisor for Asset Management Services and U.S. Mutual Fund Leader of Deloitte & Touche LLP; General Counsel of the Investment Company Institute (trade association); National Director of the Investment Management Regulatory Consulting Practice, Principal, Director and Senior Manager of Deloitte & Touche LLP; Assistant Director of the Division of Investment Management - Office of Disclosure and Investment Adviser Regulation of the U.S. Securities and Exchange Commission and various positions with the Division of Investment Management – Office of Regulatory Policy of the U.S. Securities and Exchange Commission; and Associate at Ropes & Gray LLP | | 164 | | Formerly: Member of the Cartica Funds Board of Directors (private investment fund); Trustee of the University of Florida National Board Foundation; Member of the University of Florida Law Center Association, Inc. Board of Trustees, Audit Committee and Membership Committee; and Trustee of certain Oppenheimer Funds |
Anthony J. LaCava, Jr. - 1956
Trustee | | 2019 | | Formerly: Director and Member of the Audit Committee, Blue Hills Bank (publicly traded financial institution) and Managing Partner, KPMG LLP | | 164 | | Member and Chairman, of the Bentley University, Business School Advisory Council; Formerly: Board Member and Chair of the Audit and Finance Committee and Nominating Committee, KPMG LLP |
James “Jim” Liddy - 1959 Trustee | | 2024 | | Formerly: Chairman, Global Financial Services, Americas and Retired Partner, KPMG LLP | | 164 | | Director and Treasurer, Gulfside Place Condominium Association, Inc. and Non-Executive Director, Kellenberg Memorial High School |
| | |
| T-2 | | Invesco Gold & Special Minerals Fund |
Trustees and Officers–(continued)
| | | | | | | | |
Name, Year of Birth and
Position(s) Held with the Trust | | Trustee and/or
Officer Since | | Principal Occupation(s) During Past 5 Years | | Number of
Funds in Fund Complex
Overseen by
Trustee | | Other Directorship(s) Held by Trustee
During At Least The Past 5 Years |
| Independent Trustees–(continued) | | | | | | |
Prema Mathai-Davis - 1950 Trustee | | 2003 | | Formerly: Co-Founder & Partner of Quantalytics Research, LLC, (a FinTech Investment Research Platform for the Self-Directed Investor); Trustee of YWCA Retirement Fund; CEO of YWCA of the USA; Board member of the NY Metropolitan Transportation Authority; Commissioner of the NYC Department of Aging; and Board member of Johns Hopkins Bioethics Institute | | 164 | | Member of Board of Positive Planet US (non-profit) and HealthCare Chaplaincy Network (non-profit) |
Joel W. Motley - 1952 Trustee | | 2019 | | Director of Office of Finance, Federal Home Loan Bank System; Managing Director of Carmona Motley Inc. (privately held financial advisor); Member of the Council on Foreign Relations and its Finance and Budget Committee; Chairman Emeritus of Board of Human Rights Watch and Member of its Investment Committee; and Member of Investment Committee Board of Historic Hudson Valley (non-profit cultural organization); and Member of the Vestry and the Investment Committee of Trinity Church Wall Street. Formerly: Managing Director of Public Capital Advisors, LLC (privately held financial advisor); Managing Director of Carmona Motley Hoffman, Inc. (privately held financial advisor); and Director of Columbia Equity Financial Corp. (privately held financial advisor) | | 164 | | Member of Board of Trust for Mutual Understanding (non-profit promoting the arts and environment); Member of Board of Greenwall Foundation (bioethics research foundation) and its Investment Committee; Member of Board of Friends of the LRC (non- profit legal advocacy); and Board Member and Investment Committee Member of Pulitzer Center for Crisis Reporting (non-profit journalism); and Trustee of certain Oppenheimer Funds; |
Teresa M. Ressel - 1962 Trustee | | 2017 | | Non-executive director and trustee of a number of public and private business corporations Formerly: Chief Executive Officer, UBS Securities LLC (investment banking); Group Chief Operating Officer, UBS AG Americas (investment banking); Sr. Management Team Olayan America, The Olayan Group (international investor/commercial/industrial); and Assistant Secretary for Management & Budget and Designated Chief Financial Officer, U.S. Department of Treasury | | 164 | | None |
Robert C. Troccoli - 1949 Trustee | | 2016 | | Formerly: Adjunct Professor, University of Denver – Daniels College of Business; and Managing Partner, KPMG LLP | | 164 | | None |
Daniel S. Vandivort -1954 Trustee | | 2019 | | President, Flyway Advisory Services LLC (consulting and property management) and Member, Investment Committee of Historic Charleston Foundation Formerly: President and Chief Investment Officer, previously Head of Fixed Income, Weiss Peck and Greer/Robeco Investment Management; Trustee and Chair, Weiss Peck and Greer Funds Board; and various capacities at CS First Boston including Head of Fixed Income at First Boston Asset Management. | | 164 | | Formerly: Trustee and Governance Chair, Oppenheimer Funds; Treasurer, Chairman of the Audit and Finance Committee, Huntington Disease Foundation of America |
| | |
| T-3 | | Invesco Gold & Special Minerals Fund |
Trustees and Officers–(continued)
| | | | | | | | |
Name, Year of Birth and
Position(s) Held with the Trust | | Trustee and/or
Officer Since | | Principal Occupation(s) During Past 5 Years | | Number of
Funds in Fund Complex
Overseen by
Trustee | | Other Directorship(s) Held by Trustee
During At Least The Past 5 Years |
| Officers | | | | | | |
Glenn Brightman - 1972 President and Principal Executive Officer | | 2023 | | Chief Operating Officer, Americas, Invesco Ltd.; Senior Vice President, Invesco Advisers, Inc.; President and Principal Executive Officer, The Invesco Funds; Manager, Invesco Investment Advisers LLC. Formerly: Global Head of Finance, Invesco Ltd; Executive Vice President and Chief Financial Officer, Nuveen | | N/A | | N/A |
Melanie Ringold - 1975 Senior Vice President, Chief Legal Officer and Secretary | | 2023 | | Head of Legal of the Americas, Invesco Ltd.; Senior Vice President and Secretary, Invesco Advisers, Inc. (formerly known as Invesco Institutional (N.A.), Inc.) (registered investment adviser); Secretary, Invesco Distributors, Inc. (formerly known as Invesco AIM Distributors, Inc.); Secretary, Invesco Investment Services, Inc. (formerly known as Invesco AIM Investment Services, Inc.); Senior Vice President, Chief Legal Officer and Secretary, The Invesco Funds; Secretary, Invesco Investment Advisers LLC, Invesco Capital Markets, Inc.; Chief Legal Officer, Invesco Exchange-Traded Fund Trust, Invesco Exchange-Traded Fund Trust II, Invesco India Exchange-Traded Fund Trust, Invesco Actively Managed Exchange-Traded Fund Trust, Invesco Actively Secretary and Vice President, Harbourview Asset Management Corporation; Secretary and Senior Vice President, OppenheimerFunds, Inc. and Invesco Managed Accounts, LLC; Secretary and Senior Vice President, Oppenheimer Acquisition Corp.; Secretary, SteelPath Funds Remediation LLC; and Secretary and Senior Vice President, Trinity Investment Management Corporation Formerly: Secretary and Senior Vice President, OFI SteelPath, Inc., Assistant Secretary, Invesco Distributors, Inc., Invesco Advisers, Inc., Invesco Investment Services, Inc., Invesco Capital Markets, Inc., Invesco Capital Management LLC and Invesco Investment Advisers LLC; and Assistant Secretary and Assistant Vice President, Invesco Funds | | N/A | | N/A |
John M. Zerr - 1962 Senior Vice President | | 2006 | | Chief Operating Officer of the Americas; Senior Vice President, Invesco Advisers, Inc. (formerly known as Invesco Institutional (N.A.), Inc.) (registered investment adviser); Senior Vice President, Invesco Distributors, Inc. (formerly known as Invesco AIM Distributors, Inc.); Director and Vice President, Invesco Investment Services, Inc. (formerly known as Invesco AIM Investment Services, Inc.) Senior Vice President, The Invesco Funds; Managing Director, Invesco Capital Management LLC; Senior Vice President, Invesco Capital Markets, Inc. (formerly known as Van Kampen Funds Inc.); Manager, Invesco Specialized Products, LLC; Member, Invesco Canada Funds Advisory Board; Director, President and Chief Executive Officer, Invesco Corporate Class Inc. (corporate mutual fund company); Director, Chairman, President and Chief Executive Officer, Invesco Canada Ltd. (formerly known as Invesco Trimark Ltd./Invesco Trimark Ltèe) (registered investment adviser and registered transfer agent); President, Invesco, Inc.; President, Invesco Global Direct Real Estate Feeder GP Ltd.; President, Invesco IP Holdings (Canada) Ltd; President, Invesco Global Direct Real Estate GP Ltd.; and President Invesco Financial Services Ltd. / Services Financiers Invesco Ltée Formerly: Director and Chairman, Invesco Trust Company, Manager, Invesco Indexing LLC; Director, Invesco Investment Advisers LLC (formerly known as Van Kampen Asset Management); President, Trimark Investments Ltd/Services Financiers Invesco Ltee; Director and Senior Vice President, Invesco Insurance Agency, Inc.; Director and Senior Vice President, Invesco Management Group, Inc. (formerly known as Invesco AIM Management Group, Inc.); Secretary and General Counsel, Invesco Management Group, Inc. (formerly known as Invesco AIM Management Group, Inc.); Secretary, Invesco Investment Services, Inc. (formerly known as Invesco AIM Investment Services, Inc.); Chief Legal Officer and Secretary, The Invesco Funds; Secretary and General Counsel, Invesco Investment Advisers LLC (formerly known as Van Kampen Asset Management); Secretary and General Counsel, Invesco Capital Markets, Inc. (formerly known as Van Kampen Funds Inc.); Chief Legal Officer, Invesco Exchange-Traded Fund Trust, Invesco Exchange-Traded Fund Trust II, Invesco India Exchange-Traded Fund Trust, Invesco Actively Managed Exchange-Traded Fund Trust, Invesco Actively Managed Exchange-Traded Commodity Fund Trust and Invesco Exchange-Traded Self-Indexed Fund Trust; Secretary, Invesco Indexing LLC; Director, Secretary, General Counsel and Senior Vice President, Van Kampen Exchange Corp.; Director, Vice President and Secretary, IVZ Distributors, Inc. (formerly known as INVESCO Distributors, Inc.); Director and Vice President, INVESCO Funds Group, Inc.; Director and Vice President, Van Kampen Advisors Inc.; Director, Vice President, Secretary and General Counsel, Van Kampen Investor Services Inc.;Director and Secretary, Invesco Distributors, Inc. (formerly known as Invesco AIM Distributors, Inc.); Director, Senior Vice President, General Counsel and Secretary, Invesco AIM Advisers, Inc. and Van Kampen Investments Inc.; Director, Vice President and Secretary, Fund Management Company; Director, Senior Vice President, Secretary, General Counsel and Vice President, Invesco AIM Capital Management, Inc.; and Chief Operating Officer and General Counsel, Liberty Ridge Capital, Inc. (an investment adviser) | | N/A | | N/A |
| | |
| T-4 | | Invesco Gold & Special Minerals Fund |
Trustees and Officers–(continued)
| | | | | | | | |
Name, Year of Birth and
Position(s) Held with the Trust | | Trustee and/or
Officer Since | | Principal Occupation(s) During Past 5 Years | | Number of
Funds in Fund Complex
Overseen by
Trustee | | Other Directorship(s) Held by Trustee
During At Least The Past 5 Years |
| Officers–(continued) | | | | | | |
Tony Wong - 1973 Senior Vice President | | 2023 | | Senior Managing Director, Invesco Ltd.; Director, Chairman, Chief Executive Officer and President, Invesco Advisers, Inc.; Director and Chairman, Invesco Private Capital, Inc., INVESCO Private Capital Investments, Inc. and INVESCO Realty, Inc.; Director, Invesco Senior Secured Management, Inc.; President, Invesco Managed Accounts, LLC and SNW Asset Management Corporation; and Senior Vice President, The Invesco Funds Formerly: Assistant Vice President, The Invesco Funds; and Vice President, Invesco Advisers, Inc. | | N/A | | N/A |
Stephanie C. Butcher - 1971 Senior Vice President | | 2023 | | Senior Managing Director, Invesco Ltd.; Senior Vice President, The Invesco Funds; Director and Chief Executive Officer, Invesco Asset Management Limited | | N/A | | N/A |
Adrien Deberghes - 1967 Principal Financial Officer, Treasurer and Senior Vice President | | 2020 | | Head of the Fund Office of the CFO and Fund Administration; Vice President, Invesco Advisers, Inc.; Director, Invesco Trust Company; Principal Financial Officer, Treasurer and Senior Vice President, The Invesco Funds; Vice President, Invesco Exchange-Traded Fund Trust, Invesco Exchange-Traded Fund Trust II, Invesco India Exchange-Traded Fund Trust, Invesco Actively Managed Exchange-Traded Fund Trust, Invesco Actively Managed Exchange-Traded Commodity Fund Trust and Invesco Exchange-Traded Self-Indexed Fund Trust Formerly: Vice President, The Invesco Funds; Senior Vice President and Treasurer, Fidelity Investments | | N/A | | N/A |
Crissie M. Wisdom - 1969 Anti-Money Laundering Compliance Officer | | 2013 | | Anti-Money Laundering and OFAC Compliance Officer for Invesco U.S. entities including: Invesco Advisers, Inc. and its affiliates, Invesco Capital Markets, Inc., Invesco Distributors, Inc., Invesco Investment Services, Inc., The Invesco Funds, Invesco Capital Management, LLC, Invesco Trust Company; and Fraud Prevention Manager for Invesco Investment Services, Inc. | | N/A | | N/A |
Todd F. Kuehl - 1969 Chief Compliance Officer and Senior Vice President | | 2020 | | Chief Compliance Officer, Invesco Advisers, Inc. (registered investment adviser); and Chief Compliance Officer and Senior Vice President, The Invesco Funds Formerly: Managing Director and Chief Compliance Officer, Legg Mason (Mutual Funds); Chief Compliance Officer, Legg Mason Private Portfolio Group (registered investment adviser) | | N/A | | N/A |
James Bordewick, Jr. - 1959 Senior Vice President and Senior Officer | | 2022 | | Senior Vice President and Senior Officer, The Invesco Funds Formerly: Chief Legal Officer, KingsCrowd, Inc. (research and analytical platform for investment in private capital markets); Chief Operating Officer and Head of Legal and Regulatory, Netcapital (private capital investment platform); Managing Director, General Counsel of asset management and Chief Compliance Officer for asset management and private banking, Bank of America Corporation; Chief Legal Officer, Columbia Funds and BofA Funds; Senior Vice President and Associate General Counsel, MFS Investment Management; Chief Legal Officer, MFS Funds; Associate, Ropes & Gray; and Associate, Gaston Snow & Ely Bartlett | | N/A | | N/A |
The Statement of Additional Information of the Trust includes additional information about the Fund’s Trustees and is available upon request, without charge, by calling 1.800.959.4246. Please refer to the Fund’s Statement of Additional Information for information on the Fund’s sub-advisers.
| | | | | | |
| Office of the Fund | | Investment Adviser | | Distributor | | Auditors |
| 11 Greenway Plaza | | Invesco Advisers, Inc. | | Invesco Distributors, Inc. | | PricewaterhouseCoopers LLP |
| Houston, TX 77046-1173 | | 1331 Spring Street, NW, Suite 2500 | | 11 Greenway Plaza | | 1000 Louisiana Street, Suite 5800 |
| | Atlanta, GA 30309 | | Houston, TX 77046-1173 | | Houston, TX 77002-5021 |
| | | |
| Counsel to the Fund | | Counsel to the Independent Trustees | | Transfer Agent | | Custodian |
| Stradley Ronon Stevens & Young, LLP | | Sidley Austin LLP | | Invesco Investment Services, Inc. | | State Street Bank and Trust Company |
| 2005 Market Street, Suite 2600 | | 787 Seventh Avenue | | 11 Greenway Plaza | | 225 Franklin Street |
| Philadelphia, PA 19103-7018 | | New York, NY 10019 | | Houston, TX 77046-1173 | | Boston, MA 02110-2801 |
| | |
| T-5 | | Invesco Gold & Special Minerals Fund |
Proxy Results
A Special Joint Meeting (“Meeting”) of Shareholders of AIM Sector Funds (Invesco Sector Funds), a Delaware statutory trust (“Trust”), was held on January 16, 2024. The Meeting was held for the following purpose:
| (1) | Elect 14 trustees to the Board of Trustees of the Trust, each of whom will serve until his or her successor is duly elected and qualified. |
The results of the voting on the above matter were as follows:
| | | | | | |
| | | Matter | | Votes For | | Votes Against/Withheld |
(1)* | | Beth Ann Brown | | 595,446,022.84 | | 16,915,661.31 |
| | Carol Deckbar | | 595,102,087.25 | | 17,259,596.89 |
| | Cynthia Hostetler | | 595,359,921.21 | | 17,001,762.94 |
| | Dr. Eli Jones | | 594,949,311.14 | | 17,412,373.00 |
| | Elizabeth Krentzman | | 595,453,833.65 | | 16,907,850.50 |
| | Jeffrey H. Kupor | | 595,342,690.51 | | 17,018,993.64 |
| | Anthony J. LaCava, Jr. | | 595,293,865.38 | | 17,067,818.77 |
| | James Liddy | | 594,980,026.97 | | 17,381,657.17 |
| | Dr. Prema Mathai-Davis | | 594,031,204.04 | | 18,330,480.11 |
| | Joel W. Motley | | 594,381,710.91 | | 17,979,973.23 |
| | Teresa M. Ressel | | 595,821,958.43 | | 16,539,725.72 |
| | Douglas Sharp | | 595,715,711.66 | | 16,645,972.48 |
| | Robert C. Troccoli | | 594,748,318.91 | | 17,613,365.24 |
| | Daniel S. Vandivort | | 595,002,691.19 | | 17,358,992.96 |
* Proposal 1 required approval by a combined vote of all the portfolios of AIM Sector Funds (Invesco Sector Funds).
| | |
| T-6 | | Invesco Gold & Special Minerals Fund |

Go paperless with eDelivery
Visit invesco.com/edelivery to enjoy the convenience and security of anytime electronic access to your investment documents.
With eDelivery, you can elect to have any or all of the following materials delivered straight to your inbox to download, save and print from your own computer:
∎ Fund reports and prospectuses
∎ Quarterly statements
∎ Daily confirmations
∎ Tax forms
Invesco mailing information
Send general correspondence to Invesco Investment Services, Inc., P.O. Box 219078, Kansas City, MO 64121-9078.
Important notice regarding delivery of security holder documents
To reduce Fund expenses, only one copy of most shareholder documents may be mailed to shareholders with multiple accounts at the same address (Householding). Mailing of your shareholder documents may be householded indefinitely unless you instruct us otherwise. If you do not want the mailing of these documents to be combined with those for other members of your household, please contact Invesco Investment Services, Inc. at 800 959 4246 or contact your financial institution. We will begin sending you individual copies for each account within 30 days after receiving your request.
Fund holdings and proxy voting information
The Fund provides a complete list of its portfolio holdings four times each year, at the end of each fiscal quarter. For the second and fourth quarters, the list appears, respectively, in the Fund’s semiannual and annual reports to shareholders. For the first and third quarters, the Fund files the list with the Securities and Exchange Commission (SEC) as an exhibit to its reports on Form N-PORT. The most recent list of portfolio holdings is available at invesco.com/completeqtrholdings. Shareholders can also look up the Fund’s Form N-PORT filings on the SEC website, sec.gov. The SEC file numbers for the Fund are shown below.
A description of the policies and procedures that the Fund uses to determine how to vote proxies relating to portfolio securities is available without charge, upon request, from our Client Services department at 800 959 4246, or at invesco.com/ corporate/about-us/esg. The information is also available on the SEC website, sec.gov.
Information regarding how the Fund voted proxies related to its portfolio securities during the most recent 12-month period ended June 30 is available at invesco.com/proxysearch. This information is also available on the SEC website, sec.gov.
Invesco Advisers, Inc. is an investment adviser; it provides investment advisory services to individual and institutional clients and does not sell securities. Invesco Distributors, Inc. is the US distributor for Invesco Ltd.’s retail mutual funds, exchange-traded funds and institutional money market funds. Both are wholly owned, indirect subsidiaries of Invesco Ltd.

| | | | |
| SEC file number(s): 811-03826 and 002-85905 | | Invesco Distributors, Inc. | | O-GSM-AR-1 |

| | |
| Annual Report to Shareholders | | April 30, 2024 |
Invesco Small Cap Value Fund
Nasdaq:
A: VSCAX ∎ C: VSMCX ∎ R: VSRAX ∎ Y: VSMIX ∎ R6: SMVSX
Beginning in July 2024, amendments adopted by the Securities and Exchange Commission will substantially impact the design, content, and delivery of shareholder reports. These newly designed shareholder reports will highlight key fund information in a clear and concise format and must be mailed to each shareholder that has not elected to receive the reports electronically. Other information, including financial statements, will no longer be included in the shareholder report but will be available at invesco.com/reports, delivered upon request, and filed on a semi-annual basis on Form N-CSR.
If you would like to receive shareholder reports and other communications electronically instead of by mail, you may make that request by contacting your financial intermediary (such as a broker-dealer or bank) or, if you are a direct investor, by enrolling at invesco.com/edelivery. If you do not make this request or enroll in e-delivery, you will receive future shareholder reports and other communications by mail.
Management’s Discussion of Fund Performance
|
| |
Performance summary |
For the fiscal year ended April 30, 2024, Class A shares of Invesco Small Cap Value Fund (the Fund), at net asset value (NAV), outperformed the Russell 2000 Value Index, the Fund’s style-specific benchmark. Your Fund’s long-term performance appears later in this report. |
Fund vs. Indexes |
Total returns, 4/30/23 to 4/30/24, at net asset value (NAV). Performance shown does not include applicable contingent deferred sales charges (CDSC) or front-end sales charges, which would have reduced performance. |
| | | | |
Class A Shares | | | 33.73 | % |
Class C Shares | | | 32.74 | |
Class R Shares | | | 33.37 | |
Class Y Shares | | | 34.06 | |
Class R6 Shares | | | 34.20 | |
S&P 500 Index▼ (Broad Market Index) | | | 22.66 | |
Russell 2000 Value Index▼ (Style-Specific Index) | | | 14.03 | |
Lipper Small-Cap Value Funds Index∎ (Peer Group Index) | | | 16.95 | |
| |
Source(s): ▼RIMES Technologies Corp.; ∎Lipper Inc. | | | | |
Market conditions and your Fund
The US economy and equity markets remained resilient in the second quarter of 2023, as milder inflation data and better-than-expected corporate earnings supported equities, with most major indexes posting gains for the quarter and with some big tech names providing optimistic future guidance. Following the March 2023 banking crisis, markets stabilized in April, as corporate earnings season got underway with many companies exceeding earnings and revenue estimates. Facing persistently strong employment data, the US Federal Reserve (the Fed) raised the federal funds rate by 0.25% at its May 2023 meeting,1 but left rates unchanged at its June meeting, giving investors the long-awaited “pause” in rate hikes, which sent equities broadly higher.
Equity markets declined in the third quarter and into October 2023 as a resilient US economy complicated the Fed’s efforts to tame inflation. While inflation has slowed from its peak in 2022, in July 2023, the Consumer Price Index (CPI) rose by 0.2% and the 12-month headline inflation rate rose to 3.2% from 3% in June.2 Due to the persistence of inflation, the Fed raised the federal funds rate again in July by 0.25%.1 The CPI data released in September was higher-than-expected and the overall US labor market remained tight with unemployment near historic lows. At the same time the third quarter year-over-year Gross Domestic Product (GDP) estimate was 4.9%, far above expectations.2 Despite the higher-than-expected GDP for the third quarter of 2023, the Fed held interest rates steady at its September and October meetings, but left open the possibility of another rate hike before the end of the calendar year.1
US equity markets posted strong gains in the fourth quarter of 2023 as investors anticipated the potential end of interest rate
hikes by the Fed. Inflation slowed during the period as the CPI 12-month headline inflation rate fell to 3.1% in November from 3.7% in September, significantly below the 2022 peak of 9.1%.2 The Fed kept rates steady at its mid-December meeting and indicated that three rate cuts are expected in 2024. Fed chairman Powell noted that “the Fed’s policy rate is likely at or near its peak for this tightening cycle,“1 which prompted a strong equity rally into 2023 year-end and the yield on the 10-year US Treasury to fall from nearly 5% in October to below 4%.3
US equity markets rallied in the first quarter of 2024. In February, the S&P 500 Index closed above the 5,000 milestone for the first time.3 The US economy defied recession predictions, achieving a growth rate of 2.5% in 2023 and the labor market remained robust, with continued payroll gains and unemployment still historically low – below 4%.2 Inflation, however, remained persistent. January and February increases in the CPI were higher than expected, leading the Fed to defer its proposed interest rate cuts to the second half of 2024.1 Still, investors were mostly pleased by corporate earnings growth, except for three of the so-called “Magnificent Seven” stocks. Apple, Alphabet and Tesla’s stock prices suffered due to disappointing earnings, sales and revenue, or weak forward guidance. Although the stock market had a strong start in 2024, the stock market retreated in April. As consumer spending and a strong labor market were driving economic activity, inflation and interest rate concerns persisted and investors feared another delay in expected rate cuts by the Fed, or worse, rate hikes.
Despite continued higher rates and increased market volatility, US stocks for the fiscal year had strong positive returns of 22.66%, as measured by the S&P 500 Index.4
During the fiscal year we continued to use our intrinsic value strategy, seeking to create
wealth by maintaining a long-term investment horizon and investing in companies selling at a significant discount to our estimate of their intrinsic value. We believe intrinsic value represents the fair economic worth of a business. Since our application of this strategy is highly disciplined and relatively unique, it is important to understand the benefits and limitations of our process. First, the investment strategy is intended to preserve your capital while growing it at above-market rates over the long-term. Second, our investments have little in common with popular stock market indexes and most of our peers. And third, the Fund’s short-term relative performance will naturally be different from stock market indexes and peers since we typically structure the portfolio significantly differently than these benchmarks.
The Fund outperformed the Russell 2000 Value Index during the fiscal year. Drivers of relative Fund performance were mainly stock-specific. However, the Fund’s overweight positions in the industrials and energy sectors helped relative performance as these were the best performing sectors within the index for the fiscal year. An underweight position in the health care sector and the Fund’s avoidance of investments in the communication services sector also aided relative performance versus the Russell 2000 Value Index, as these sectors lagged. Select holdings in the industrials and utilities sectors were among the largest contributors on an absolute basis, while select holdings in the financials and information technology (IT) sectors were among the largest detractors from absolute Fund performance.
Vertiv Holdings in the industrials sector and Vistra Corporation in the utilities sector were the largest contributors to absolute Fund performance during the fiscal year. Vertiv is a manufacturer of electrical power, thermal management and other equipment for data centers. Shares were up after the company reported strong performance for 2023, driven by increased spending in data centers as a result of artificial intelligence (AI) investments. Vistra is one of the largest power producers and retail energy providers in the US. Shares of the company rose during the fiscal year due to an enhanced long-term demand growth outlook driven by the build out of energy-intensive AI data centers as well as strong financial results for 2023.
Western Alliance Bancorporation was the largest detractor from absolute performance for the fiscal year. The company is one of the largest regional banks in the US, primarily servicing the western and midwestern states, and it was a new purchase during the fiscal year. Shares pulled back at the beginning of 2024 following a weaker than expected earnings report, which gave us the opportunity to invest at an attractive discount to our estimate of intrinsic value. Specifically, the bank traded at a historically low price to tangible book value despite an attractive return on
2 Invesco Small Cap Value Fund
equity and a solid capital position. IT company Lumentum Holdings was also a large detractor from absolute Fund performance during the fiscal year. The company is a market-leading designer and manufacturer of innovative optical and photonic products for the communications and electronics end-markets. Shares fell during the fiscal year as the company continues to deal with low end-market demand due to the customer inventory correction in the telecommunications market.
We believe the single most important indicator of how the Fund is positioned for potential future success is not our recent investment results or popular statistical measures, but rather the difference between current market prices and the Fund’s estimated intrinsic value — the aggregate business value of the portfolio based on our estimate of intrinsic value for each individual holding.
At the end of the fiscal year, the difference between the market price and the estimated intrinsic value of the Fund was attractive according to our estimation. While there is no assurance that market value will ever reflect our estimate of the Fund’s intrinsic value, we believe the gap between price and estimated intrinsic value may provide above-average capital appreciation.
We will continue to work hard to protect and grow the Fund’s estimated intrinsic value. We thank you for your investment in Invesco Small Cap Value Fund and for sharing our long-term investment perspective.
| 1 | Source: US Federal Reserve |
| 2 | Source: US Bureau of Labor Statistics |
| 4 | Source: Morningstar Direct |
Portfolio manager(s):
Jonathan Edwards - Lead
Jonathan Mueller
The views and opinions expressed in management’s discussion of Fund performance are those of Invesco Advisers, Inc. and its affiliates. These views and opinions are subject to change at any time based on factors such as market and economic conditions. These views and opinions may not be relied upon as investment advice or recommendations, or as an offer for a particular security. The information is not a complete analysis of every aspect of any market, country, industry, security or the Fund. Statements of fact are from sources considered reliable, but Invesco Advisers, Inc. makes no representation or warranty as to their completeness or accuracy. Although historical performance is no guarantee of future results, these insights may help you understand our investment management philosophy.
See important Fund and, if applicable, index disclosures later in this report.
3 Invesco Small Cap Value Fund
Your Fund’s Long-Term Performance
Results of a $10,000 Investment — Oldest Share Class(es)
Fund and index data from 4/30/14
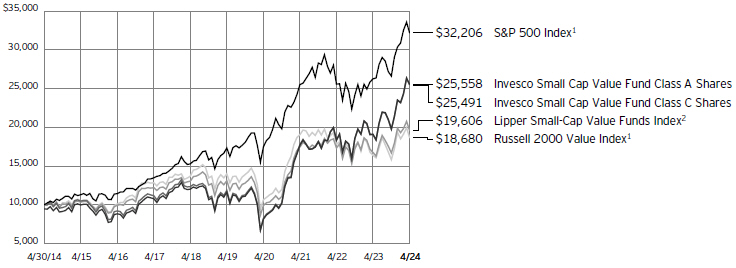
| 1 | Source: RIMES Technologies Corp. |
Past performance cannot guarantee future results.
The data shown in the chart include reinvested distributions, applicable sales charges and Fund expenses including management
fees. Index results include reinvested dividends, but they do not reflect sales charges. Performance of the peer group, if applicable, reflects fund expenses and management fees;
performance of a market index does not. Performance shown in the chart does not reflect deduction of taxes a shareholder would pay on Fund distributions or sale of Fund shares.
4 Invesco Small Cap Value Fund
| | | | |
| |
Average Annual Total Returns | |
As of 4/30/24, including maximum applicable sales charges | |
Class A Shares | | | | |
Inception (6/21/99) | | | 11.15 | % |
10 Years | | | 9.84 | |
5 Years | | | 15.72 | |
1 Year | | | 26.36 | |
| |
Class C Shares | | | | |
Inception (6/21/99) | | | 11.14 | % |
10 Years | | | 9.81 | |
5 Years | | | 16.22 | |
1 Year | | | 31.74 | |
| |
Class R Shares | | | | |
10 Years | | | 10.18 | % |
5 Years | | | 16.73 | |
1 Year | | | 33.37 | |
| |
Class Y Shares | | | | |
Inception (8/12/05) | | | 11.34 | % |
10 Years | | | 10.73 | |
5 Years | | | 17.35 | |
1 Year | | | 34.06 | |
| |
Class R6 Shares | | | | |
10 Years | | | 10.77 | % |
5 Years | | | 17.51 | |
1 Year | | | 34.20 | |
Effective June 1, 2010, Class A, Class C and Class I shares of the predecessor fund, Van Kampen Small Cap Value Fund, advised by Van Kampen Asset Management were reorganized into Class A, Class C and Class Y shares, respectively, of Invesco Van Kampen Small Cap Value Fund (renamed Invesco Small Cap Value Fund). Returns shown above, prior to June 1, 2010, for Class A, Class C and Class Y shares are those for Class A, Class C and Class I shares of the predecessor fund. Share class returns will differ from the predecessor fund because of different expenses.
Class R shares incepted on April 17, 2020. Performance shown prior to that date is that of the Fund’s Class A shares at net asset value restated to reflect the higher 12b-1 fees applicable to Class R shares.
Class R6 shares incepted on February 7, 2017. Performance shown prior to that date is that of the Fund’s Class A shares at net asset value and includes the 12b-1 fees applicable to Class A shares.
The performance data quoted represent past performance and cannot guarantee future results; current performance may be lower or higher. Please visit invesco.com/performance for the most recent month-end performance. Performance figures reflect reinvested distributions, changes in net asset value and the effect of the maximum sales charge unless otherwise stated. Performance figures do not reflect deduction of taxes a shareholder would pay on Fund distributions or sale of Fund shares. Investment return and principal value will
fluctuate so that you may have a gain or loss when you sell shares.
Class A share performance reflects the maximum 5.50% sales charge, and Class C share performance reflects the applicable contingent deferred sales charge (CDSC) for the period involved. The CDSC on Class C shares is 1% for the first year after purchase. Class Y, Class R and Class R6 shares do not have a front-end sales charge or a CDSC; therefore, performance is at net asset value.
The performance of the Fund’s share classes will differ primarily due to different sales charge structures and class expenses.
Fund performance reflects any applicable fee waivers and/or expense reimbursements. Had the adviser not waived fees and/or reimbursed expenses currently or in the past, returns would have been lower. See current prospectus for more information.
5 Invesco Small Cap Value Fund
Supplemental Information
Invesco Small Cap Value Fund’s investment objective is long-term growth of capital.
| ∎ | Unless otherwise stated, information presented in this report is as of April 30, 2024, and is based on total net assets. |
| ∎ | Unless otherwise noted, all data is provided by Invesco. |
| ∎ | To access your Fund’s reports/prospectus, visit invesco.com/fundreports. |
About indexes used in this report
| ∎ | The S&P 500® Index is an unmanaged index considered representative of the US stock market. |
| ∎ | The Russell 2000® Value Index is an unmanaged index considered representative of small-cap value stocks. The Russell 2000 Value Index is a trademark/service mark of the Frank Russell Co. Russell® is a trademark of the Frank Russell Co. |
| ∎ | The Lipper Small-Cap Value Funds Index is an unmanaged index considered representative of small-cap value funds tracked by Lipper. |
| ∎ | The Fund is not managed to track the performance of any particular index, including the index(es) described here, and consequently, the performance of the Fund may deviate significantly from the performance of the index(es). |
| ∎ | A direct investment cannot be made in an index. Unless otherwise indicated, index results include reinvested dividends, and they do not reflect sales charges. Performance of the peer group, if applicable, reflects fund expenses; performance of a market index does not. |
Liquidity Risk Management Program
In compliance with Rule 22e-4 under the Investment Company Act of 1940, as amended (the “Liquidity Rule”), the Fund has adopted and implemented a liquidity risk management program in accordance with the Liquidity Rule (the “Program”). The Program is reasonably designed to assess and manage the Fund’s liquidity risk, which is the risk that the Fund could not meet redemption requests without significant dilution of remaining investors’ interests in the Fund. The Board of Trustees of the Fund (the “Board”) has appointed Invesco Advisers, Inc. (“Invesco”), the Fund’s investment adviser, as the Program’s administrator, and Invesco has delegated oversight of the Program to the Liquidity Risk Management Committee (the “Committee”), which is composed of senior representatives from relevant business groups at Invesco.
As required by the Liquidity Rule, the Program includes policies and procedures providing for an assessment, no less
frequently than annually, of the Fund’s liquidity risk that takes into account, as relevant to the Fund’s liquidity risk: (1) the Fund’s investment strategy and liquidity of portfolio investments during both normal and reasonably foreseeable stressed conditions; (2) short-term and long-term cash flow projections for the Fund during both normal and reasonably foreseeable stressed conditions; and (3) the Fund’s holdings of cash and cash equivalents and any borrowing arrangements. The Liquidity Rule also requires the classification of the Fund’s investments into categories that reflect the assessment of their relative liquidity under current market conditions. The Fund classifies its investments into one of four categories defined in the Liquidity Rule: “Highly Liquid,” “Moderately Liquid,” “Less Liquid,” and “Illiquid.” Funds that are not invested primarily in “Highly Liquid Investments” that are assets (cash or investments that are reasonably expected to be convertible into cash within three business days without significantly changing the market value of the investment) are required to establish a “Highly Liquid Investment Minimum” (“HLIM”), which is the minimum percentage of net assets that must be invested in Highly Liquid Investments. Funds with HLIMs have procedures for addressing HLIM shortfalls, including reporting to the Board and the SEC (on a non-public basis) as required by the Program and the Liquidity Rule. In addition, the Fund may not acquire an investment if, immediately after the acquisition, over 15% of the Fund’s net assets would consist of “Illiquid Investments” that are assets (an investment that cannot reasonably be expected to be sold or disposed of in current market conditions in seven calendar days or less without the sale or disposition significantly changing the market value of the investment). The Liquidity Rule and the Program also require reporting to the Board and the SEC (on a non-public basis) if a Fund’s holdings of Illiquid Investments exceed 15% of the Fund’s assets.
At a meeting held on March 25-27, 2024, the Committee presented a report to the Board that addressed the operation of the Program and assessed the Program’s adequacy and effectiveness of implementation
(the “Report”). The Report covered the period from January 1, 2023 through December 31, 2023 (the “Program Reporting Period”). The Report discussed notable events affecting liquidity over the Program Reporting Period, including the impact of the end of an aggressive rate hike cycle, signs that inflation was abating and market liquidity was reverting to normal, and the overall market. The Report noted that there were no material changes to the Program during the Program Reporting Period.
The Report stated, in relevant part, that during the Program Reporting Period:
| ∎ | The Program, as adopted and implemented, remained reasonably designed to assess and manage the Fund’s liquidity risk and was operated effectively to achieve that goal; |
| ∎ | The Fund’s investment strategy remained appropriate for an open-end fund; |
| ∎ | The Fund was able to meet requests for redemption without significant dilution of remaining investors’ interests in the Fund; |
| ∎ | The Fund did not breach the 15% limit on Illiquid Investments; and |
| ∎ | The Fund primarily held Highly Liquid Investments and therefore has not adopted an HLIM. |
|
|
This report must be accompanied or preceded by a currently effective Fund prospectus, which contains more complete information, including sales charges and expenses. Investors should read it carefully before investing. |
|
|
| NOT FDIC INSURED | MAY LOSE VALUE | NO BANK GUARANTEE |
6 Invesco Small Cap Value Fund
Fund Information
Portfolio Composition
| | |
| By sector | | % of total net assets |
| |
Industrials | | 23.13% |
Information Technology | | 16.43 |
Financials | | 13.78 |
Materials | | 11.36 |
Energy | | 9.89 |
Health Care | | 6.81 |
Consumer Discretionary | | 6.48 |
Utilities | | 5.48 |
Consumer Staples | | 3.51 |
Exchange-Traded Funds | | 1.66 |
Money Market Funds Plus Other Assets Less Liabilities | | 1.47 |
Top 10 Equity Holdings*
| | | | | | |
| | | | | | % of total net assets |
| | |
| | 1. | | | Vertiv Holdings Co., Class A | | 3.15% |
| | 2. | | | Coherent Corp. | | 3.02 |
| | 3. | | | Lumentum Holdings, Inc. | | 2.97 |
| | 4. | | | Vistra Corp. | | 2.93 |
| | 5. | | | NRG Energy, Inc. | | 2.54 |
| | 6. | | | Western Alliance Bancorporation | | 2.50 |
| | 7. | | | Expedia Group, Inc. | | 2.39 |
| | 8. | | | MaxLinear, Inc. | | 2.19 |
| | 9. | | | MasTec, Inc. | | 2.00 |
| | 10. | | | Huntington Bancshares, Inc. | | 1.98 |
The Fund’s holdings are subject to change, and there is no assurance that the Fund will continue to hold any particular security.
| * | Excluding money market fund holdings, if any. | |
Data presented here are as of April 30, 2024.
7 Invesco Small Cap Value Fund
Schedule of Investments(a)
April 30, 2024
| | | | | | | | |
| | | Shares | | | Value | |
| |
Common Stocks & Other Equity Interests–96.87% | |
Aerospace & Defense–2.61% | |
Hensoldt AG (Germany) | | | 1,005,508 | | | $ | 39,613,960 | |
| |
Leonardo S.p.A. (Italy) | | | 3,202,400 | | | | 73,597,713 | |
| |
Theon International PLC
(Cyprus)(b) | | | 510,500 | | | | 6,047,345 | |
| |
| | | | | | | 119,259,018 | |
| |
|
Asset Management & Custody Banks–0.50% | |
WisdomTree, Inc. | | | 2,575,900 | | | | 22,925,509 | |
| |
|
Automotive Parts & Equipment–0.44% | |
Dana, Inc. | | | 1,620,496 | | | | 20,142,765 | |
| |
| | |
Biotechnology–1.95% | | | | | | | | |
Amicus Therapeutics, Inc.(b) | | | 1,187,600 | | | | 11,864,124 | |
| |
Apellis Pharmaceuticals, Inc.(b)(c) | | | 260,500 | | | | 11,511,495 | |
| |
Ascendis Pharma A/S, ADR (Denmark)(b) | | | 94,100 | | | | 13,027,204 | |
| |
Ionis Pharmaceuticals, Inc.(b) | | | 326,100 | | | | 13,454,886 | |
| |
Mirum Pharmaceuticals, Inc.(b)(c) | | | 270,400 | | | | 6,789,744 | |
| |
Neurocrine Biosciences, Inc.(b) | | | 100,500 | | | | 13,822,770 | |
| |
Rhythm Pharmaceuticals, Inc.(b)(c) | | | 167,600 | | | | 6,663,776 | |
| |
Ultragenyx Pharmaceutical, Inc.(b) | | | 279,000 | | | | 11,868,660 | |
| |
| | | | | | | 89,002,659 | |
| |
|
Commodity Chemicals–1.15% | |
Cabot Corp.(c) | | | 302,700 | | | | 27,615,321 | |
| |
Orion S.A. (Germany) | | | 1,057,500 | | | | 25,020,450 | |
| |
| | | | | | | 52,635,771 | |
| |
|
Communications Equipment–3.94% | |
Harmonic, Inc.(b) | | | 4,144,600 | | | | 44,513,004 | |
| |
Lumentum Holdings, Inc.(b)(c) | | | 3,098,382 | | | | 135,585,196 | |
| |
| | | | 180,098,200 | |
| |
|
Construction & Engineering–4.68% | |
AECOM | | | 524,218 | | | | 48,416,775 | |
| |
Concrete Pumping Holdings,
Inc.(b) | | | 551,100 | | | | 3,664,815 | |
| |
MasTec, Inc.(b) | | | 1,032,300 | | | | 91,554,687 | |
| |
Orion Group Holdings, Inc.(b) | | | 685,800 | | | | 4,876,038 | |
| |
Primoris Services Corp. | | | 1,406,534 | | | | 65,544,484 | |
| |
| | | | 214,056,799 | |
| |
|
Construction Machinery & Heavy Transportation Equipment–2.29% | |
Astec Industries, Inc. | | | 221,378 | | | | 9,253,600 | |
| |
Manitowoc Co., Inc. (The)(b) | | | 989,100 | | | | 11,968,110 | |
| |
Oshkosh Corp. | | | 472,700 | | | | 53,070,029 | |
| |
REV Group, Inc. | | | 738,400 | | | | 16,141,424 | |
| |
Terex Corp.(c) | | | 254,500 | | | | 14,264,725 | |
| |
| | | | 104,697,888 | |
| |
| | |
Copper–2.02% | | | | | | | | |
Capstone Copper Corp.
(Canada)(b) | | | 9,665,400 | | | | 66,909,717 | |
| |
ERO Copper Corp. (Brazil)(b) | | | 1,249,900 | | | | 25,485,558 | |
| |
| | | | 92,395,275 | |
| |
| | |
Diversified Chemicals–0.96% | | | | | | | | |
Huntsman Corp. | | | 1,847,363 | | | | 44,078,081 | |
| |
| | | | | | | | |
| | | Shares | | | Value | |
| |
Diversified Metals & Mining–3.39% | |
Hudbay Minerals, Inc. (Canada) | | | 8,030,100 | | | $ | 67,613,442 | |
| |
MP Materials Corp.(b)(c) | | | 1,411,300 | | | | 22,580,800 | |
| |
Teck Resources Ltd., Class B (Canada) | | | 1,317,500 | | | | 64,807,825 | |
| |
| | | | | | | 155,002,067 | |
| |
|
Education Services–1.30% | |
Adtalem Global Education, Inc.(b)(c) | | | 1,195,000 | | | | 59,295,900 | |
| |
|
Electric Utilities–2.55% | |
NRG Energy, Inc. | | | 1,600,200 | | | | 116,286,534 | |
| |
|
Electrical Components & Equipment–4.46% | |
EnerSys | | | 666,000 | | | | 60,239,700 | |
| |
Vertiv Holdings Co., Class A | | | 1,546,022 | | | | 143,780,046 | |
| |
| | | | | | | 204,019,746 | |
| |
|
Electronic Components–3.28% | |
Bel Fuse, Inc., Class B(c) | | | 201,600 | | | | 11,837,952 | |
| |
Coherent Corp.(b)(c) | | | 2,529,069 | | | | 138,163,039 | |
| |
| | | | | | | 150,000,991 | |
| |
|
Electronic Manufacturing Services–1.43% | |
Benchmark Electronics, Inc. | | | 627,100 | | | | 18,944,691 | |
| |
Flex Ltd.(b) | | | 1,615,300 | | | | 46,278,345 | |
| |
| | | | | | | 65,223,036 | |
| |
| | |
Food Distributors–2.08% | | | | | | | | |
Performance Food Group Co.(b) | | | 687,600 | | | | 46,674,289 | |
| |
US Foods Holding Corp.(b) | | | 959,271 | | | | 48,203,368 | |
| |
| | | | | | | 94,877,657 | |
| |
| | |
Gold–0.21% | | | | | | | | |
Kinross Gold Corp. (Canada) | | | 1,470,800 | | | | 9,486,660 | |
| |
|
Health Care Distributors–0.92% | |
Henry Schein, Inc.(b) | | | 606,200 | | | | 41,997,536 | |
| |
|
Health Care Facilities–0.24% | |
Select Medical Holdings Corp. | | | 388,545 | | | | 11,023,022 | |
| |
|
Health Care Services–0.38% | |
Fresenius Medical Care AG (Germany) | | | 413,703 | | | | 17,418,015 | |
| |
|
Hotels, Resorts & Cruise Lines–3.92% | |
Expedia Group, Inc.(b) | | | 811,400 | | | | 109,238,782 | |
| |
Travel + Leisure Co. | | | 1,608,076 | | | | 70,015,629 | |
| |
| | | | | | | 179,254,411 | |
| |
| | |
Household Products–1.43% | | | | | | | | |
Spectrum Brands Holdings, Inc.(c) | | | 796,759 | | | | 65,230,659 | |
| |
|
Human Resource & Employment Services–1.72% | |
Kelly Services, Inc., Class A | | | 367,710 | | | | 8,435,267 | |
| |
ManpowerGroup, Inc. | | | 748,700 | | | | 56,489,415 | |
| |
TrueBlue, Inc.(b) | | | 1,304,100 | | | | 13,588,722 | |
| |
| | | | | | | 78,513,404 | |
| |
|
Independent Power Producers & Energy Traders–2.93% | |
Vistra Corp. | | | 1,766,300 | | | | 133,956,192 | |
| |
See accompanying Notes to Financial Statements which are an integral part of the financial statements.
8 Invesco Small Cap Value Fund
| | | | | | |
| | | Shares | | | Value |
|
Industrial Machinery & Supplies & Components–2.23% |
Chart Industries, Inc.(b)(c) | | | 430,600 | | | $ 62,032,236 |
Gates Industrial Corp. PLC(b) | | | 2,264,100 | | | 39,893,442 |
| | | | | | | 101,925,678 |
|
IT Consulting & Other Services–2.07% |
Converge Technology Solutions Corp. (Canada) | | | 8,080,600 | | | 31,403,196 |
Endava PLC, ADR (United Kingdom)(b)(d) | | | 2,180,600 | | | 63,237,400 |
| | | | | | | 94,640,596 |
|
Life & Health Insurance–1.40% |
Globe Life, Inc.(c) | | | 839,400 | | | 63,937,098 |
|
Life Sciences Tools & Services–1.67% |
Avantor, Inc.(b) | | | 3,143,200 | | | 76,159,736 |
|
Managed Health Care–0.87% |
Molina Healthcare, Inc.(b) | | | 116,500 | | | 39,854,650 |
|
Office Services & Supplies–0.78% |
Interface, Inc. | | | 351,920 | | | 5,380,857 |
MillerKnoll, Inc.(c) | | | 1,196,400 | | | 30,424,452 |
| | | | | | | 35,805,309 |
|
Oil & Gas Drilling–0.61% |
Patterson-UTI Energy, Inc. | | | 2,586,187 | | | 27,982,543 |
|
Oil & Gas Exploration & Production–8.48% |
Advantage Energy Ltd. (Canada)(b) | | | 3,517,500 | | | 27,441,942 |
APA Corp. | | | 1,049,500 | | | 32,996,280 |
ARC Resources Ltd. (Canada) | | | 3,721,700 | | | 67,396,928 |
Crescent Point Energy Corp. (Canada) | | | 4,881,900 | | | 43,051,078 |
Kosmos Energy Ltd. (Ghana)(b)(c) | | | 6,836,900 | | | 38,765,223 |
Northern Oil and Gas, Inc.(c) | | | 1,715,780 | | | 69,986,666 |
Ovintiv, Inc. | | | 603,300 | | | 30,961,356 |
Southwestern Energy Co.(b) | | | 8,436,500 | | | 63,189,385 |
Tamarack Valley Energy Ltd. (Canada)(c) | | | 5,093,200 | | | 13,799,903 |
| | | | 387,588,761 |
|
Oil & Gas Storage & Transportation–0.80% |
New Fortress Energy, Inc.(c) | | | 1,388,923 | | | 36,389,783 |
|
Paper & Plastic Packaging Products & Materials–0.60% |
Sealed Air Corp. | | | 864,200 | | | 27,205,016 |
|
Passenger Ground Transportation–0.05% |
Mobico Group PLC (United Kingdom) | | | 3,446,760 | | | 2,376,780 |
| | |
Pharmaceuticals–0.78% | | | | | | |
Axsome Therapeutics, Inc.(b)(c) | | | 194,400 | | | 14,338,944 |
Intra-Cellular Therapies, Inc.(b) | | | 207,000 | | | 14,864,670 |
Tarsus Pharmaceuticals, Inc.(b)(c) | | | 199,000 | | | 6,254,570 |
| | | | | | | 35,458,184 |
| | |
Regional Banks–10.82% | | | | | | |
East West Bancorp, Inc. | | | 1,097,700 | | | 81,767,673 |
Five Star Bancorp | | | 338,454 | | | 7,317,376 |
Huntington Bancshares, Inc. | | | 6,699,858 | | | 90,247,087 |
Independent Bank Group, Inc. | | | 538,800 | | | 20,064,912 |
Pinnacle Financial Partners, Inc. | | | 1,077,000 | | | 82,605,900 |
Texas Capital Bancshares, Inc.(b) | | | 420,200 | | | 24,119,480 |
Webster Financial Corp. | | | 1,689,300 | | | 74,042,019 |
| | | | | | |
| | | Shares | | | Value |
| | |
Regional Banks–(continued) | | | | | | |
Western Alliance Bancorporation | | | 2,008,700 | | | $ 114,154,421 |
| | | | | | | 494,318,868 |
| |
Research & Consulting Services–1.93% | | | |
KBR, Inc. | | | 1,358,800 | | | 88,240,472 |
| | |
Restaurants–0.82% | | | | | | |
Cheesecake Factory, Inc. (The)(c) | | | 1,010,147 | | | 34,870,274 |
Marston’s PLC (United Kingdom)(b) | | | 7,349,549 | | | 2,561,994 |
| | | | | | | 37,432,268 |
|
Semiconductor Materials & Equipment–3.09% |
Ichor Holdings Ltd.(b)(c) | | | 509,780 | | | 19,769,268 |
MKS Instruments, Inc. | | | 696,713 | | | 82,894,913 |
Ultra Clean Holdings, Inc.(b) | | | 923,700 | | | 38,638,371 |
| | | | | | | 141,302,552 |
| | |
Semiconductors–2.62% | | | | | | |
MaxLinear, Inc.(b)(c)(d) | | | 4,806,550 | | | 99,928,175 |
Silicon Motion Technology Corp., ADR (Taiwan) | | | 268,118 | | | 19,789,790 |
| | | | | | | 119,717,965 |
| | |
Silver–1.23% | | | | | | |
Pan American Silver Corp. (Canada) | | | 3,040,313 | | | 56,063,372 |
| | |
Specialized Finance–1.06% | | | | | | |
Burford Capital Ltd. | | | 3,178,026 | | | 48,592,018 |
| | |
Specialty Chemicals–0.77% | | | | | | |
Element Solutions, Inc. | | | 1,530,300 | | | 35,395,839 |
| | |
Steel–1.03% | | | | | | |
Carpenter Technology Corp.(c) | | | 550,730 | | | 47,197,561 |
| |
Trading Companies & Distributors–2.38% | | | |
Air Lease Corp., Class A(c) | | | 909,900 | | | 45,713,376 |
DXP Enterprises, Inc.(b) | | | 222,691 | | | 10,858,413 |
WESCO International, Inc. | | | 341,700 | | | 52,194,675 |
| | | | | | | 108,766,464 |
Total Common Stocks & Other Equity Interests
(Cost $3,561,618,340) | | | 4,427,229,308 |
| |
Exchange-Traded Funds–1.66% | | | |
Global X Copper Miners ETF(c) | | | 1,056,200 | | | 48,342,274 |
Global X Uranium ETF(c) | | | 962,300 | | | 27,685,371 |
Total Exchange-Traded Funds
(Cost $59,083,298) | | | 76,027,645 |
| |
Money Market Funds–1.01% | | | |
Invesco Government & Agency Portfolio, Institutional Class, 5.23%(d)(e) | | | 16,221,338 | | | 16,221,338 |
Invesco Liquid Assets Portfolio, Institutional Class, 5.34%(d)(e) | | | 11,211,205 | | | 11,214,568 |
Invesco Treasury Portfolio, Institutional Class, 5.22%(d)(e) | | | 18,538,672 | | | 18,538,672 |
Total Money Market Funds
(Cost $45,972,394) | | | 45,974,578 |
TOTAL INVESTMENTS IN SECURITIES
(excluding investments purchased with cash collateral from securities on loan)-99.54%
(Cost $3,666,674,032) | | | | | | 4,549,231,531 |
See accompanying Notes to Financial Statements which are an integral part of the financial statements.
9 Invesco Small Cap Value Fund
| | | | | | | | |
| | | Shares | | | Value | |
| |
Investments Purchased with Cash Collateral from Securities on Loan | |
Money Market Funds–7.69% | | | | | | | | |
Invesco Private Government Fund,
5.29%(d)(e)(f) | | | 98,095,948 | | | $ | 98,095,948 | |
| |
Invesco Private Prime Fund,
5.46%(d)(e)(f) | | | 253,237,940 | | | | 253,313,911 | |
| |
Total Investments Purchased with Cash Collateral from Securities on Loan
(Cost $351,426,580) | | | | 351,409,859 | |
| |
TOTAL INVESTMENTS IN SECURITIES–107.23%
(Cost $4,018,100,612) | | | | 4,900,641,390 | |
| |
OTHER ASSETS LESS LIABILITIES–(7.23)% | | | | (330,619,949 | ) |
| |
NET ASSETS-100.00% | | | $ | 4,570,021,441 | |
| |
|
| Investment Abbreviations: |
|
| ADR – American Depositary Receipt |
| ETF – Exchange-Traded Fund |
Notes to Schedule of Investments:
| (a) | Industry and/or sector classifications used in this report are generally according to the Global Industry Classification Standard, which was developed by and is the exclusive property and a service mark of MSCI Inc. and Standard & Poor’s. |
| (b) | Non-income producing security. |
| (c) | All or a portion of this security was out on loan at April 30, 2024. |
| (d) | Affiliated holding. Affiliated holdings are investments in entities which are under common ownership or control of Invesco Ltd. or are investments in entities in which the Fund owns 5% or more of the outstanding voting securities. The table below shows the Fund’s transactions in, and earnings from, its investments in affiliates for the fiscal year ended April 30, 2024. |
| | | | | | | | | | | | | | | | | | | | | | | | | | | | | | | | |
| | | Value April 30, 2023 | | Purchases at Cost | | Proceeds from Sales | | Change in
Unrealized
Appreciation
(Depreciation) | | Realized
Gain
(Loss) | | Value April 30, 2024 | | Dividend Income |
| Investments in Affiliated Money Market Funds: | | | | | | | | | | | | | | | | | | | | | | | | | | | | | | | | |
Invesco Government & Agency Portfolio, Institutional Class | | | | $ 14,518,112 | | | | | $ 447,666,645 | | | | | $(445,963,419) | | | | | $ - | | | | | $ - | | | | | $ 16,221,338 | | | $ 1,405,990 |
Invesco Liquid Assets Portfolio, Institutional Class | | | | 9,998,880 | | | | | 319,761,889 | | | | | (318,545,300) | | | | | (538) | | | | | (363) | | | | | 11,214,568 | | | 1,009,067 |
Invesco Treasury Portfolio, Institutional Class | | | | 16,592,129 | | | | | 511,619,023 | | | | | (509,672,480) | | | | | - | | | | | - | | | | | 18,538,672 | | | 1,599,987 |
| Investments Purchased with Cash Collateral from Securities on Loan: | | | | | | | | | | | | | | | | | | | | | | | | | | | | | | | | |
Invesco Private Government Fund | | | | 61,733,491 | | | | | 741,513,162 | | | | | (705,150,705) | | | | | - | | | | | - | | | | | 98,095,948 | | | 3,176,683* |
Invesco Private Prime Fund | | | | 159,859,183 | | | | | 1,505,574,989 | | | | | (1,412,163,006) | | | | | (12,613) | | | | | 55,358 | | | | | 253,313,911 | | | 8,499,710* |
| Investments in Other Affiliates: | | | | | | | | | | | | | | | | | | | | | | | | | | | | | | | | |
Endava PLC, ADR** | | | | - | | | | | 74,435,920 | | | | | - | | | | | (11,198,520) | | | | | - | | | | | 63,237,400 | | | - |
MaxLinear, Inc.** | | | | - | | | | | 107,898,643 | | | | | (1,205,497) | | | | | (6,361,403) | | | | | (403,568) | | | | | 99,928,175 | | | - |
Total | | | | $262,701,795 | | | | | $3,708,470,271 | | | | | $(3,392,700,407) | | | | | $(17,573,074) | | | | | $(348,573) | | | | | $560,550,012 | | | $15,691,437 |
| * | Represents the income earned on the investment of cash collateral, which is included in securities lending income on the Statement of Operations. Does not include rebates and fees paid to lending agent or premiums received from borrowers, if any. |
| ** | As of April 30, 2023, this security was not considered as an affiliate of the Fund. |
| (e) | The rate shown is the 7-day SEC standardized yield as of April 30, 2024. |
| (f) | The security has been segregated to satisfy the commitment to return the cash collateral received in securities lending transactions upon the borrower’s return of the securities loaned. See Note 1I. |
| | | | | | | | | | | | | | | | | | | | | | | | | | | | |
| Open Forward Foreign Currency Contracts |
| Settlement | | | | Contract to | | | | | | Unrealized
Appreciation |
| Date | | Counterparty | | Deliver | | | Receive | | | | | | (Depreciation) |
Currency Risk | | | | | | | | | | | | | | | | | | | | | | | | | | | | |
05/20/2024 | | Merrill Lynch International | | | USD | | | | 348,179 | | | | | | | | GBP | | | | 279,672 | | | | | | | $ 1,316 |
| | | | | | | | |
Currency Risk | | | | | | | | | | | | | | | | | | | | | | | | | | | | |
05/20/2024 | | Merrill Lynch International | | | EUR | | | | 129,316,543 | | | | | | | | USD | | | | 137,632,592 | | | | | | | (466,977) |
See accompanying Notes to Financial Statements which are an integral part of the financial statements.
10 Invesco Small Cap Value Fund
| | | | | | | | | | | | | | | | | | | | | | | | | | | | |
| Open Forward Foreign Currency Contracts–(continued) |
| Settlement | | | | Contract to | | | | | | Unrealized
Appreciation |
| Date | | Counterparty | | Deliver | | | Receive | | | | | | (Depreciation) |
05/20/2024 | | Merrill Lynch International | | | GBP | | | | 4,284,365 | | | | | | | | USD | | | | 5,333,421 | | | | | | | $ (20,587) |
Subtotal–Depreciation | | | | | | | | | | | | | | | | | | | | | | | | | | (487,564) |
Total Forward Foreign Currency Contracts | | | | | | | | | | | | | | | | | | | | | | | | | | $(486,248) |
Abbreviations:
EUR – Euro
GBP – British Pound Sterling
USD – U.S. Dollar
See accompanying Notes to Financial Statements which are an integral part of the financial statements.
11 Invesco Small Cap Value Fund
Statement of Assets and Liabilities
April 30, 2024
| | | | |
Assets: | | | | |
Investments in unaffiliated securities, at value
(Cost $3,439,976,140)* | | $ | 4,340,091,378 | |
| |
Investments in affiliates, at value
(Cost $578,124,472) | | | 560,550,012 | |
| |
Other investments: | | | | |
Unrealized appreciation on forward foreign currency contracts outstanding | | | 1,316 | |
| |
Foreign currencies, at value (Cost $453,320) | | | 451,733 | |
| |
Receivable for: | | | | |
Investments sold | | | 11,754,951 | |
| |
Fund shares sold | | | 13,167,790 | |
| |
Dividends | | | 1,824,759 | |
| |
Investment for trustee deferred compensation and retirement plans | | | 194,447 | |
| |
Other assets | | | 123,763 | |
| |
Total assets | | | 4,928,160,149 | |
| |
| |
Liabilities: | | | | |
Other investments: | | | | |
Unrealized depreciation on forward foreign currency contracts outstanding | | | 487,564 | |
| |
Payable for: | | | | |
Fund shares reacquired | | | 4,443,427 | |
| |
Collateral upon return of securities loaned | | | 351,426,580 | |
| |
Accrued fees to affiliates | | | 1,510,136 | |
| |
Accrued other operating expenses | | | 63,198 | |
| |
Trustee deferred compensation and retirement plans | | | 207,803 | |
| |
Total liabilities | | | 358,138,708 | |
| |
Net assets applicable to shares outstanding | | $ | 4,570,021,441 | |
| |
| |
Net assets consist of: | | | | |
Shares of beneficial interest | | $ | 3,586,993,370 | |
| |
Distributable earnings | | | 983,028,071 | |
| |
| | $ | 4,570,021,441 | |
| |
| | | | |
Net Assets: | | | | |
Class A | | $ | 1,065,495,186 | |
| |
Class C | | $ | 45,501,657 | |
| |
Class R | | $ | 24,632,947 | |
| |
Class Y | | $ | 2,576,033,254 | |
| |
Class R6 | | $ | 858,358,397 | |
| |
|
Shares outstanding, no par value, with an unlimited number of shares authorized: | |
Class A | | | 48,301,930 | |
| |
Class C | | | 4,380,643 | |
| |
Class R | | | 1,125,627 | |
| |
Class Y | | | 106,807,154 | |
| |
Class R6 | | | 35,215,995 | |
| |
Class A: | | | | |
Net asset value per share | | $ | 22.06 | |
| |
Maximum offering price per share
(Net asset value of $22.06 ÷ 94.50%) | | $ | 23.34 | |
| |
Class C: | | | | |
Net asset value and offering price per share | | $ | 10.39 | |
| |
Class R: | | | | |
Net asset value and offering price per share | | $ | 21.88 | |
| |
Class Y: | | | | |
Net asset value and offering price per share | | $ | 24.12 | |
| |
Class R6: | | | | |
Net asset value and offering price per share | | $ | 24.37 | |
| |
| * | At April 30, 2024, securities with an aggregate value of $333,321,884 were on loan to brokers. |
See accompanying Notes to Financial Statements which are an integral part of the financial statements.
12 Invesco Small Cap Value Fund
Statement of Operations
For the year ended April 30, 2024
| | | | |
| |
Investment income: | | | | |
Dividends (net of foreign withholding taxes of $1,045,569) | | $ | 47,519,046 | |
| |
Dividends from affiliated money market funds (includes net securities lending income of $431,294) | | | 4,446,338 | |
| |
Total investment income | | | 51,965,384 | |
| |
| |
Expenses: | | | | |
Advisory fees | | | 21,141,033 | |
| |
Administrative services fees | | | 462,501 | |
| |
Custodian fees | | | 49,658 | |
| |
Distribution fees: | | | | |
| |
Class A | | | 2,263,588 | |
| |
Class C | | | 349,003 | |
| |
Class R | | | 97,355 | |
| |
Transfer agent fees – A, C, R and Y | | | 4,867,328 | |
| |
Transfer agent fees – R6 | | | 180,142 | |
| |
Trustees’ and officers’ fees and benefits | | | 50,133 | |
| |
Registration and filing fees | | | 242,549 | |
| |
Reports to shareholders | | | 660,748 | |
| |
Professional services fees | | | 77,880 | |
| |
Other | | | 40,180 | |
| |
Total expenses | | | 30,482,098 | |
| |
Less: Fees waived and/or expense offset arrangement(s) | | | (106,221 | ) |
| |
Net expenses | | | 30,375,877 | |
| |
Net investment income | | | 21,589,507 | |
| |
| |
Realized and unrealized gain (loss) from: | | | | |
Net realized gain (loss) from: | | | | |
Unaffiliated investment securities | | | 200,815,014 | |
| |
Affiliated investment securities | | | (348,573 | ) |
| |
Foreign currencies | | | 19,190 | |
| |
Forward foreign currency contracts | | | 6,217,228 | |
| |
| | | 206,702,859 | |
| |
Change in net unrealized appreciation (depreciation) of:
Unaffiliated investment securities | | | 785,195,209 | |
| |
Affiliated investment securities | | | (17,573,074 | ) |
| |
Foreign currencies | | | (13,208 | ) |
| |
Forward foreign currency contracts | | | 98,408 | |
| |
| | | 767,707,335 | |
| |
Net realized and unrealized gain | | | 974,410,194 | |
| |
Net increase in net assets resulting from operations | | $ | 995,999,701 | |
| |
See accompanying Notes to Financial Statements which are an integral part of the financial statements.
13 Invesco Small Cap Value Fund
Statement of Changes in Net Assets
For the years ended April 30, 2024 and 2023
| | | | | | | | |
| | | 2024 | | | 2023 | |
| |
Operations: | | | | | | | | |
Net investment income | | $ | 21,589,507 | | | $ | 18,287,865 | |
| |
Net realized gain | | | 206,702,859 | | | | 97,788,633 | |
| |
Change in net unrealized appreciation (depreciation) | | | 767,707,335 | | | | (23,733,520 | ) |
| |
Net increase in net assets resulting from operations | | | 995,999,701 | | | | 92,342,978 | |
| |
| | |
Distributions to shareholders from distributable earnings: | | | | | | | | |
Class A | | | (45,260,052 | ) | | | (71,798,839 | ) |
| |
Class C | | | (3,274,934 | ) | | | (4,955,135 | ) |
| |
Class R | | | (990,076 | ) | | | (1,274,881 | ) |
| |
Class Y | | | (84,433,654 | ) | | | (115,989,366 | ) |
| |
Class R6 | | | (29,735,481 | ) | | | (32,077,278 | ) |
| |
Total distributions from distributable earnings | | | (163,694,197 | ) | | | (226,095,499 | ) |
| |
| | |
Share transactions–net: | | | | | | | | |
Class A | | | 47,227,752 | | | | 120,945,262 | |
| |
Class C | | | 6,785,141 | | | | 13,206,738 | |
| |
Class R | | | 4,596,065 | | | | 4,726,898 | |
| |
Class Y | | | 705,640,377 | | | | 398,772,213 | |
| |
Class R6 | | | 284,280,773 | | | | 221,460,575 | |
| |
Net increase in net assets resulting from share transactions | | | 1,048,530,108 | | | | 759,111,686 | |
| |
Net increase in net assets | | | 1,880,835,612 | | | | 625,359,165 | |
| |
| | |
Net assets: | | | | | | | | |
Beginning of year | | | 2,689,185,829 | | | | 2,063,826,664 | |
| |
End of year | | $ | 4,570,021,441 | | | $ | 2,689,185,829 | |
| |
See accompanying Notes to Financial Statements which are an integral part of the financial statements.
14 Invesco Small Cap Value Fund
Financial Highlights
The following schedule presents financial highlights for a share of the Fund outstanding throughout the periods indicated.
| | | | | | | | | | | | | | | | | | | | | | | | | | | | | | | | | | | | | | | | | | | | | | | | | | | | | | | | |
| | | Net asset value, beginning of period | | Net investment income (loss)(a) | | Net gains (losses) on securities (both realized and unrealized) | | Total from investment operations | | Dividends from net investment income | | Distributions from net realized gains | | Total distributions | | Net asset value, end of period | | Total
return(b) | | Net assets,
end of period
(000’s omitted) | | Ratio of
expenses
to average
net assets
with fee waivers
and/or expenses absorbed | | Ratio of
expenses
to average net assets without
fee waivers
and/or
expenses
absorbed | | Ratio of net
investment
income
(loss) to average
net assets | | Portfolio
turnover (c) |
Class A | | | | | | | | | | | | | | | | | | | | | | | | | | | | | | | | | | | | | | | | | | | | | | | | | | | | | | | | |
Year ended 04/30/24 | | | $17.33 | | | | $ 0.09 | | | | $ 5.64 | | | | $ 5.73 | | | | $(0.11 | ) | | | $(0.89 | ) | | | $(1.00 | ) | | | $22.06 | | | | 33.73 | % | | | $1,065,495 | | | | 1.11 | % | | | 1.11 | % | | | 0.44 | % | | | 40 | % |
Year ended 04/30/23 | | | 18.37 | | | | 0.10 | | | | 0.62 | | | | 0.72 | | | | (0.06 | ) | | | (1.70 | ) | | | (1.76 | ) | | | 17.33 | | | | 4.09 | | | | 798,428 | | | | 1.09 | | | | 1.09 | | | | 0.58 | | | | 51 | |
Year ended 04/30/22 | | | 20.84 | | | | 0.01 | | | | 0.62 | | | | 0.63 | | | | (0.00 | ) | | | (3.10 | ) | | | (3.10 | ) | | | 18.37 | | | | 3.75 | | | | 721,429 | | | | 1.09 | | | | 1.09 | | | | 0.11 | | | | 79 | |
Year ended 04/30/21 | | | 9.62 | | | | 0.03 | | | | 11.24 | | | | 11.27 | | | | (0.05 | ) | | | – | | | | (0.05 | ) | | | 20.84 | | | | 117.30 | | | | 687,428 | | | | 1.12 | | | | 1.12 | | | | 0.24 | | | | 71 | |
Year ended 04/30/20 | | | 14.10 | | | | 0.02 | | | | (4.14 | ) | | | (4.12 | ) | | | – | | | | (0.36 | ) | | | (0.36 | ) | | | 9.62 | | | | (30.02 | ) | | | 372,448 | | | | 1.13 | | | | 1.13 | | | | 0.16 | | | | 47 | |
Class C | | | | | | | | | | | | | | | | | | | | | | | | | | | | | | | | | | | | | | | | | | | | | | | | | | | | | | | | |
Year ended 04/30/24 | | | 8.61 | | | | (0.03 | ) | | | 2.75 | | | | 2.72 | | | | (0.05 | ) | | | (0.89 | ) | | | (0.94 | ) | | | 10.39 | | | | 32.74 | | | | 45,502 | | | | 1.86 | | | | 1.86 | | | | (0.31 | ) | | | 40 | |
Year ended 04/30/23 | | | 10.00 | | | | (0.02 | ) | | | 0.33 | | | | 0.31 | | | | (0.00 | ) | | | (1.70 | ) | | | (1.70 | ) | | | 8.61 | | | | 3.36 | | | | 32,363 | | | | 1.84 | | | | 1.84 | | | | (0.17 | ) | | | 51 | |
Year ended 04/30/22 | | | 12.85 | | | | (0.07 | ) | | | 0.32 | | | | 0.25 | | | | (0.00 | ) | | | (3.10 | ) | | | (3.10 | ) | | | 10.00 | | | | 2.99 | | | | 23,397 | | | | 1.84 | | | | 1.84 | | | | (0.64 | ) | | | 79 | |
Year ended 04/30/21 | | | 5.96 | | | | (0.04 | ) | | | 6.94 | | | | 6.90 | | | | (0.01 | ) | | | – | | | | (0.01 | ) | | | 12.85 | | | | 115.93 | (d) | | | 17,598 | | | | 1.81 | (d) | | | 1.81 | (d) | | | (0.45 | )(d) | | | 71 | |
Year ended 04/30/20 | | | 8.93 | | | | (0.04 | ) | | | (2.57 | ) | | | (2.61 | ) | | | – | | | | (0.36 | ) | | | (0.36 | ) | | | 5.96 | | | | (30.50 | )(d) | | | 10,133 | | | | 1.84 | (d) | | | 1.84 | (d) | | | (0.55 | )(d) | | | 47 | |
Class R | | | | | | | | | | | | | | | | | | | | | | | | | | | | | | | | | | | | | | | | | | | | | | | | | | | | | | | | |
Year ended 04/30/24 | | | 17.22 | | | | 0.04 | | | | 5.60 | | | | 5.64 | | | | (0.09 | ) | | | (0.89 | ) | | | (0.98 | ) | | | 21.88 | | | | 33.37 | | | | 24,633 | | | | 1.36 | | | | 1.36 | | | | 0.19 | | | | 40 | |
Year ended 04/30/23 | | | 18.28 | | | | 0.06 | | | | 0.61 | | | | 0.67 | | | | (0.03 | ) | | | (1.70 | ) | | | (1.73 | ) | | | 17.22 | | | | 3.83 | | | | 15,241 | | | | 1.34 | | | | 1.34 | | | | 0.33 | | | | 51 | |
Year ended 04/30/22 | | | 20.79 | | | | (0.03 | ) | | | 0.62 | | | | 0.59 | | | | (0.00 | ) | | | (3.10 | ) | | | (3.10 | ) | | | 18.28 | | | | 3.52 | | | | 11,315 | | | | 1.34 | | | | 1.34 | | | | (0.14 | ) | | | 79 | |
Year ended 04/30/21 | | | 9.61 | | | | (0.00 | )(e) | | | 11.21 | | | | 11.21 | | | | (0.03 | ) | | | – | | | | (0.03 | ) | | | 20.79 | | | | 116.81 | | | | 9,140 | | | | 1.37 | | | | 1.37 | | | | (0.01 | ) | | | 71 | |
Period ended 04/30/20(f) | | | 8.49 | | | | (0.00 | )(e) | | | 1.12 | | | | 1.12 | | | | – | | | | – | | | | – | | | | 9.61 | | | | 13.19 | | | | 3,866 | | | | 1.37 | (g) | | | 1.37 | (g) | | | (0.08 | )(g) | | | 47 | |
Class Y | | | | | | | | | | | | | | | | | | | | | | | | | | | | | | | | | | | | | | | | | | | | | | | | | | | | | | | | |
Year ended 04/30/24 | | | 18.86 | | | | 0.15 | | | | 6.16 | | | | 6.31 | | | | (0.16 | ) | | | (0.89 | ) | | | (1.05 | ) | | | 24.12 | | | | 34.06 | | | | 2,576,033 | | | | 0.86 | | | | 0.86 | | | | 0.69 | | | | 40 | |
Year ended 04/30/23 | | | 19.84 | | | | 0.16 | | | | 0.66 | | | | 0.82 | | | | (0.10 | ) | | | (1.70 | ) | | | (1.80 | ) | | | 18.86 | | | | 4.31 | | | | 1,416,555 | | | | 0.84 | | | | 0.84 | | | | 0.83 | | | | 51 | |
Year ended 04/30/22 | | | 22.23 | | | | 0.08 | | | | 0.67 | | | | 0.75 | | | | (0.04 | ) | | | (3.10 | ) | | | (3.14 | ) | | | 19.84 | | | | 4.06 | | | | 1,085,935 | | | | 0.84 | | | | 0.84 | | | | 0.36 | | | | 79 | |
Year ended 04/30/21 | | | 10.25 | | | | 0.07 | | | | 11.98 | | | | 12.05 | | | | (0.07 | ) | | | – | | | | (0.07 | ) | | | 22.23 | | | | 117.78 | | | | 812,019 | | | | 0.87 | | | | 0.87 | | | | 0.49 | | | | 71 | |
Year ended 04/30/20 | | | 14.95 | | | | 0.06 | | | | (4.40 | ) | | | (4.34 | ) | | | – | | | | (0.36 | ) | | | (0.36 | ) | | | 10.25 | | | | (29.79 | ) | | | 457,857 | | | | 0.88 | | | | 0.88 | | | | 0.41 | | | | 47 | |
Class R6 | | | | | | | | | | | | | | | | | | | | | | | | | | | | | | | | | | | | | | | | | | | | | | | | | | | | | | | | |
Year ended 04/30/24 | | | 19.05 | | | | 0.18 | | | | 6.21 | | | | 6.39 | | | | (0.18 | ) | | | (0.89 | ) | | | (1.07 | ) | | | 24.37 | | | | 34.20 | | | | 858,358 | | | | 0.71 | | | | 0.71 | | | | 0.84 | | | | 40 | |
Year ended 04/30/23 | | | 20.01 | | | | 0.19 | | | | 0.68 | | | | 0.87 | | | | (0.13 | ) | | | (1.70 | ) | | | (1.83 | ) | | | 19.05 | | | | 4.50 | | | | 426,599 | | | | 0.70 | | | | 0.70 | | | | 0.97 | | | | 51 | |
Year ended 04/30/22 | | | 22.39 | | | | 0.11 | | | | 0.67 | | | | 0.78 | | | | (0.06 | ) | | | (3.10 | ) | | | (3.16 | ) | | | 20.01 | | | | 4.17 | | | | 221,751 | | | | 0.70 | | | | 0.70 | | | | 0.50 | | | | 79 | |
Year ended 04/30/21 | | | 10.31 | | | | 0.09 | | | | 12.07 | | | | 12.16 | | | | (0.08 | ) | | | – | | | | (0.08 | ) | | | 22.39 | | | | 118.25 | | | | 78,279 | | | | 0.73 | | | | 0.73 | | | | 0.63 | | | | 71 | |
Year ended 04/30/20 | | | 15.02 | | | | 0.08 | | | | (4.43 | ) | | | (4.35 | ) | | | – | | | | (0.36 | ) | | | (0.36 | ) | | | 10.31 | | | | (29.71 | ) | | | 60,628 | | | | 0.70 | | | | 0.70 | | | | 0.59 | | | | 47 | |
| (a) | Calculated using average shares outstanding. |
| (b) | Includes adjustments in accordance with accounting principles generally accepted in the United States of America and as such, the net asset value for financial reporting purposes and the returns based upon those net asset values may differ from the net asset value and returns for shareholder transactions. Does not include sales charges and is not annualized for periods less than one year, if applicable. |
| (c) | Portfolio turnover is calculated at the fund level and is not annualized for periods less than one year, if applicable. For the year ended April 30, 2020, the portfolio turnover calculation excludes the value of securities purchased of $23,823,797 in connection with the acquisition of Invesco Oppenheimer Small Cap Value Fund into the Fund. |
| (d) | The total return, ratio of expenses to average net assets and ratio of net investment income (loss) to average net assets reflect actual 12b-1 fees of 0.94% and 0.96% for the years ended April 30, 2021 and 2020, respectively. |
| (e) | Amount represents less than $(0.005). |
| (f) | Commencement date of April 17, 2020. |
See accompanying Notes to Financial Statements which are an integral part of the financial statements.
15 Invesco Small Cap Value Fund
Notes to Financial Statements
April 30, 2024
NOTE 1–Significant Accounting Policies
Invesco Small Cap Value Fund (the “Fund”) is a series portfolio of AIM Sector Funds (Invesco Sector Funds) (the “Trust”). The Trust is a Delaware statutory trust registered under the Investment Company Act of 1940, as amended (the “1940 Act”), as an open-end series management investment company authorized to issue an unlimited number of shares of beneficial interest. Information presented in these financial statements pertains only to the Fund. Matters affecting the Fund or each class will be voted on exclusively by the shareholders of the Fund or each class.
The Fund’s investment objective is long-term growth of capital.
The Fund currently consists of five different classes of shares: Class A, Class C, Class R, Class Y and Class R6. Class Y shares are available only to certain investors. Class A shares are sold with a front-end sales charge unless certain waiver criteria are met. Under certain circumstances, load waived shares may be subject to contingent deferred sales charges (“CDSC”). Class C shares are sold with a CDSC. Class R, Class Y and Class R6 shares are sold at net asset value. Class C shares held for eight years after purchase are eligible for automatic conversion into Class A shares of the same Fund (the “Conversion Feature”). The automatic conversion pursuant to the Conversion Feature will generally occur at the end of the month following the eighth anniversary after a purchase of Class C shares.
Effective as of the open of business on April 1, 2024, the Fund has limited public sales of its shares to certain investors.
The Fund is an investment company and accordingly follows the investment company accounting and reporting guidance in accordance with Financial Accounting Standards Board Accounting Standards Codification Topic 946, Financial Services – Investment Companies.
The following is a summary of the significant accounting policies followed by the Fund in the preparation of its financial statements.
| A. | Security Valuations – Securities, including restricted securities, are valued according to the following policy. |
A security listed or traded on an exchange is generally valued at its trade price or official closing price that day as of the close of the exchange where the security is principally traded, or lacking any trades or official closing price on a particular day, the security may be valued at the closing bid or ask price on that day. Securities traded in the over-the-counter market are valued based on prices furnished by independent pricing services or market makers. When such securities are valued using prices provided by an independent pricing service they may be considered fair valued. Futures contracts are valued at the daily settlement price set by an exchange on which they are principally traded. Where a final settlement price exists, exchange-traded options are valued at the final settlement price from the exchange where the option principally trades. Where a final settlement price does not exist, exchange-traded options are valued at the mean between the last bid and ask price generally from the exchange where the option principally trades.
Securities of investment companies that are not exchange-traded (e.g., open-end mutual funds) are valued using such company’s end-of-business-day net asset value per share.
Deposits, other obligations of U.S. and non-U.S. banks and financial institutions are valued at their daily account value.
Fixed income securities (including convertible debt securities) generally are valued on the basis of prices provided by independent pricing services. Prices provided by the pricing service may be determined without exclusive reliance on quoted prices, and may reflect appropriate factors such as institution-size trading in similar groups of securities, developments related to specific securities, dividend rate (for unlisted equities), yield (for debt obligations), quality, type of issue, coupon rate (for debt obligations), maturity (for debt obligations), individual trading characteristics and other market data. Pricing services generally value debt obligations assuming orderly transactions of institutional round lot size, but a fund may hold or transact in the same securities in smaller, odd lot sizes. Odd lots often trade at lower prices than institutional round lots, and their value may be adjusted accordingly. Debt obligations are subject to interest rate and credit risks. In addition, all debt obligations involve some risk of default with respect to interest and/or principal payments.
Foreign securities’ (including foreign exchange contracts) prices are converted into U.S. dollar amounts using the applicable exchange rates as of the close of the New York Stock Exchange (“NYSE”). If market quotations are available and reliable for foreign exchange-traded equity securities, the securities will be valued at the market quotations. Invesco Advisers, Inc. (the “Adviser” or “Invesco”) may use various pricing services to obtain market quotations as well as fair value prices. Because trading hours for certain foreign securities end before the close of the NYSE, closing market quotations may become not representative of market value in the Adviser’s judgment (“unreliable”). If, between the time trading ends on a particular security and the close of the customary trading session on the NYSE, a significant event occurs that makes the closing price of the security unreliable, the Adviser may fair value the security. If the event is likely to have affected the closing price of the security, the security will be valued at fair value in good faith in accordance with Board- approved policies and related Adviser procedures (“Valuation Procedures”). Adjustments to closing prices to reflect fair value may also be based on a screening process of an independent pricing service to indicate the degree of certainty, based on historical data, that the closing price in the principal market where a foreign security trades is not the current value as of the close of the NYSE. Foreign securities’ prices meeting the degree of certainty that the price is not reflective of current value will be priced at the indication of fair value from the independent pricing service. Multiple factors may be considered by the independent pricing service in determining adjustments to reflect fair value and may include information relating to sector indices, American Depositary Receipts and domestic and foreign index futures. Foreign securities may have additional risks including exchange rate changes, potential for sharply devalued currencies and high inflation, political and economic upheaval, the relative lack of issuer information, relatively low market liquidity and the potential lack of strict financial and accounting controls and standards.
Unlisted securities will be valued using prices provided by independent pricing services or by another method that the Adviser, in its judgment, believes better reflects the security’s fair value in accordance with the Valuation Procedures.
Non-traded rights and warrants shall be valued at intrinsic value if the terms of the rights and warrants are available, specifically the subscription or exercise price and the ratio. Intrinsic value is calculated as the daily market closing price of the security to be received less the subscription price, which is then adjusted by the exercise ratio. In the case of warrants, an option pricing model supplied by an independent pricing service may be used based on market data such as volatility, stock price and interest rate from the independent pricing service and strike price and exercise period from verified terms.
Securities for which market prices are not provided by any of the above methods may be valued based upon quotes furnished by independent sources. The mean between the last bid and ask prices may be used to value debt obligations, including corporate loans.
Securities for which market quotations are not readily available are fair valued by the Adviser in accordance with the Valuation Procedures. If a fair value price provided by a pricing service is unreliable, the Adviser will fair value the security using the Valuation Procedures. Issuer specific events, market trends, bid/ask quotes of brokers and information providers and other market data may be reviewed in the course of making a good faith determination of a security’s fair value.
The Fund may invest in securities that are subject to interest rate risk, meaning the risk that the prices will generally fall as interest rates rise and, conversely, the prices will generally rise as interest rates fall. Specific securities differ in their sensitivity to changes in interest rates depending on their individual characteristics. Changes in interest rates may result in increased market volatility, which may affect the value and/or liquidity of certain Fund investments.
Valuations change in response to many factors including the historical and prospective earnings of the issuer, the value of the issuer’s assets, general market conditions which are not specifically related to the particular issuer, such as real or perceived adverse economic conditions, changes in the general outlook for revenues or corporate earnings, changes in interest or currency rates, regional or global instability, natural or environmental disasters, widespread disease or other public health issues, war, acts of terrorism, significant governmental actions or adverse investor sentiment generally and market liquidity. Because of the inherent uncertainties of valuation, the values reflected in the financial statements may materially differ from the value received upon actual sale of those investments.
16 Invesco Small Cap Value Fund
The price the Fund could receive upon the sale of any investment may differ from the Adviser’s valuation of the investment, particularly for securities that are valued using a fair valuation technique. When fair valuation techniques are applied, the Adviser uses available information, including both observable and unobservable inputs and assumptions, to determine a methodology that will result in a valuation that the Adviser believes approximates market value. Fund securities that are fair valued may be subject to greater fluctuation in their value from one day to the next than would be the case if market quotations were used. Because of the inherent uncertainties of valuation, and the degree of subjectivity in such decisions, the Fund could realize a greater or lesser than expected gain or loss upon the sale of the investment.
| B. | Securities Transactions and Investment Income – Securities transactions are accounted for on a trade date basis. Realized gains or losses on sales are computed on the basis of specific identification of the securities sold. Interest income (net of withholding tax, if any) is recorded on an accrual basis from settlement date and includes coupon interest and amortization of premium and accretion of discount on debt securities as applicable. Pay-in-kind interest income and non-cash dividend income received in the form of securities in lieu of cash are recorded at the fair value of the securities received. Dividend income (net of withholding tax, if any) is recorded on the ex-dividend date. |
The Fund may periodically participate in litigation related to Fund investments. As such, the Fund may receive proceeds from litigation settlements. Any proceeds received are included in the Statement of Operations as realized gain (loss) for investments no longer held and as unrealized gain (loss) for investments still held.
Brokerage commissions and mark ups are considered transaction costs and are recorded as an increase to the cost basis of securities purchased and/or a reduction of proceeds on a sale of securities. Such transaction costs are included in the determination of net realized and unrealized gain (loss) from investment securities reported in the Statement of Operations and the Statement of Changes in Net Assets and the net realized and unrealized gains (losses) on securities per share in the Financial Highlights. Transaction costs are included in the calculation of the Fund’s net asset value and, accordingly, they reduce the Fund’s total returns. These transaction costs are not considered operating expenses and are not reflected in net investment income reported in the Statement of Operations and the Statement of Changes in Net Assets, or the net investment income per share and the ratios of expenses and net investment income reported in the Financial Highlights, nor are they limited by any expense limitation arrangements between the Fund and the investment adviser.
The Fund allocates income and realized and unrealized capital gains and losses to a class based on the relative net assets of each class.
| C. | Country Determination – For the purposes of making investment selection decisions and presentation in the Schedule of Investments, the investment adviser may determine the country in which an issuer is located and/or credit risk exposure based on various factors. These factors include the laws of the country under which the issuer is organized, where the issuer maintains a principal office, the country in which the issuer derives 50% or more of its total revenues, the country that has the primary market for the issuer’s securities and its “country of risk” as determined by a third party service provider, as well as other criteria. Among the other criteria that may be evaluated for making this determination are the country in which the issuer maintains 50% or more of its assets, the type of security, financial guarantees and enhancements, the nature of the collateral and the sponsor organization. Country of issuer and/or credit risk exposure has been determined to be the United States of America, unless otherwise noted. |
| D. | Distributions – Distributions from net investment income and net realized capital gain, if any, are generally declared and paid annually and recorded on the ex-dividend date. The Fund may elect to treat a portion of the proceeds from redemptions as distributions for federal income tax purposes. |
| E. | Federal Income Taxes – The Fund intends to comply with the requirements of Subchapter M of the Internal Revenue Code of 1986, as amended (the “Internal Revenue Code”), necessary to qualify as a regulated investment company and to distribute substantially all of the Fund’s taxable earnings to shareholders. As such, the Fund will not be subject to federal income taxes on otherwise taxable income (including net realized capital gain) that is distributed to shareholders. Therefore, no provision for federal income taxes is recorded in the financial statements. |
The Fund recognizes the tax benefits of uncertain tax positions only when the position is more likely than not to be sustained. Management has analyzed the Fund’s uncertain tax positions and concluded that no liability for unrecognized tax benefits should be recorded related to uncertain tax positions. Management is not aware of any tax positions for which it is reasonably possible that the total amounts of unrecognized tax benefits will change materially in the next 12 months.
The Fund files tax returns in the U.S. Federal jurisdiction and certain other jurisdictions. Generally, the Fund is subject to examinations by such taxing authorities for up to three years after the filing of the return for the tax period.
| F. | Expenses – Fees provided for under the Rule 12b-1 plan of a particular class of the Fund are charged to the operations of such class. Transfer agency fees and expenses and other shareholder recordkeeping fees and expenses attributable to Class R6 are charged to such class. Transfer agency fees and expenses and other shareholder recordkeeping fees and expenses relating to all other classes are allocated among those classes based on relative net assets. All other expenses are allocated among the classes based on relative net assets. |
| G. | Accounting Estimates – The preparation of financial statements in conformity with accounting principles generally accepted in the United States of America (“GAAP”) requires management to make estimates and assumptions that affect the reported amounts of assets and liabilities at the date of the financial statements and the reported amounts of revenues and expenses during the reporting period including estimates and assumptions related to taxation. Actual results could differ from those estimates by a significant amount. In addition, the Fund monitors for material events or transactions that may occur or become known after the period-end date and before the date the financial statements are released to print. |
| H. | Indemnifications – Under the Trust’s organizational documents, each Trustee, officer, employee or other agent of the Trust is indemnified against certain liabilities that may arise out of the performance of their duties to the Fund. Additionally, in the normal course of business, the Fund enters into contracts, including the Fund’s servicing agreements, that contain a variety of indemnification clauses. The Fund’s maximum exposure under these arrangements is unknown as this would involve future claims that may be made against the Fund that have not yet occurred. The risk of material loss as a result of such indemnification claims is considered remote. |
| I. | Securities Lending – The Fund may lend portfolio securities having a market value up to one-third of the Fund’s total assets. Such loans are secured by collateral equal to no less than the market value of the loaned securities determined daily by the securities lending provider. Such collateral will be cash or debt securities issued or guaranteed by the U.S. Government or any of its sponsored agencies. Cash collateral received in connection with these loans is invested in short-term money market instruments or affiliated, unregistered investment companies that comply with Rule 2a-7 under the 1940 Act and money market funds (collectively, “affiliated money market funds”) and is shown as such on the Schedule of Investments. The Fund bears the risk of loss with respect to the investment of collateral. It is the Fund’s policy to obtain additional collateral from or return excess collateral to the borrower by the end of the next business day, following the valuation date of the securities loaned. Therefore, the value of the collateral held may be temporarily less than the value of the securities on loan. When loaning securities, the Fund retains certain benefits of owning the securities, including the economic equivalent of dividends or interest generated by the security. Lending securities entails a risk of loss to the Fund if, and to the extent that, the market value of the securities loaned were to increase and the borrower did not increase the collateral accordingly, and the borrower failed to return the securities. The securities loaned are subject to termination at the option of the borrower or the Fund. Upon termination, the borrower will return to the Fund the securities loaned and the Fund will return the collateral. Upon the failure of the borrower to return the securities, collateral may be liquidated and the securities may be purchased on the open market to replace the loaned securities. The Fund could experience delays and costs in gaining access to the collateral and the securities may lose value during the delay which could result in potential losses to the Fund. Some of these losses may be indemnified by the lending agent. The Fund bears the risk of any deficiency in the amount of the collateral available for return to the borrower due to any loss on the collateral invested. Dividends received on cash collateral investments for securities lending transactions, which are net of |
17 Invesco Small Cap Value Fund
| | compensation to counterparties, are included in Dividends from affiliates on the Statement of Operations. The aggregate value of securities out on loan, if any, is shown as a footnote on the Statement of Assets and Liabilities. |
The Adviser serves as an affiliated securities lending agent for the Fund. The Bank of New York Mellon also serves as a securities lending agent. To the extent the Fund utilizes the Adviser as an affiliated securities lending agent, the Fund conducts its securities lending in accordance with, and in reliance upon, no-action letters issued by the SEC staff that provide guidance on how an affiliate may act as a direct agent lender and receive compensation for those services in a manner consistent with the federal securities laws. For the year ended April 30, 2024, the Fund paid the Adviser $23,763 in fees for securities lending agent services. Fees paid to the Adviser for securities lending agent services, if any, are included in Dividends from affiliates on the Statement of Operations.
| J. | Foreign Currency Translations – Foreign currency is valued at the close of the NYSE based on quotations posted by banks and major currency dealers. Portfolio securities and other assets and liabilities denominated in foreign currencies are translated into U.S. dollar amounts at the date of valuation. Purchases and sales of portfolio securities (net of foreign taxes withheld on disposition) and income items denominated in foreign currencies are translated into U.S. dollar amounts on the respective dates of such transactions. The Fund does not separately account for the portion of the results of operations resulting from changes in foreign exchange rates on investments and the fluctuations arising from changes in market prices of securities held. The combined results of changes in foreign exchange rates and the fluctuation of market prices on investments (net of estimated foreign tax withholding) are included with the net realized and unrealized gain or loss from investments in the Statement of Operations. Reported net realized foreign currency gains or losses arise from (1) sales of foreign currencies, (2) currency gains or losses realized between the trade and settlement dates on securities transactions, and (3) the difference between the amounts of dividends, interest, and foreign withholding taxes recorded on the Fund’s books and the U.S. dollar equivalent of the amounts actually received or paid. Net unrealized foreign currency gains and losses arise from changes in the fair values of assets and liabilities, other than investments in securities at fiscal period end, resulting from changes in exchange rates. |
The Fund may invest in foreign securities, which may be subject to foreign taxes on income, gains on investments or currency repatriation, a portion of which may be recoverable. Foreign taxes, if any, are recorded based on the tax regulations and rates that exist in the foreign markets in which the Fund invests and are shown in the Statement of Operations.
The performance of the Fund may be materially affected positively or negatively by foreign currency strength or weakness relative to the U.S. dollar. Currency rates in foreign countries may fluctuate for a number of reasons, including changes in interest rates, political, economic, or social instability and development, and imposition of currency controls. Currency controls in certain foreign jurisdictions may cause the Fund to experience significant delays in its ability to repatriate its assets in U.S. dollars at quoted spot rates, and it is possible that the Fund’s ability to convert certain foreign currencies into U.S. dollars may be limited and may occur at discounts to quoted rates. As a result, the value of the Fund’s assets and liabilities denominated in such currencies that would ultimately be realized could differ from those reported on the Statement of Assets and Liabilities. Certain foreign companies may be subject to sanctions, embargoes, or other governmental actions that may limit the ability to invest in, receive, hold, or sell the securities of such companies, all of which affect the market and/or credit risk of the investments. Because of the inherent uncertainties of valuation, the values reflected in the financial statements may materially differ from the value received upon actual sale of those investments.
| K. | Forward Foreign Currency Contracts – The Fund may engage in foreign currency transactions either on a spot (i.e. for prompt delivery and settlement) basis, or through forward foreign currency contracts, to manage or minimize currency or exchange rate risk. |
The Fund may also enter into forward foreign currency contracts for the purchase or sale of a security denominated in a foreign currency in order to “lock in” the U.S. dollar price of that security, or the Fund may also enter into forward foreign currency contracts that do not provide for physical exchange of the two currencies on the settlement date, but instead are settled by a single cash payment calculated as the difference between the agreed upon exchange rate and the spot rate at settlement based upon an agreed upon notional amount (non-deliverable forwards).
A forward foreign currency contract is an obligation between two parties (“Counterparties”) to purchase or sell a specific currency for an agreed-upon price at a future date. The use of forward foreign currency contracts for hedging does not eliminate fluctuations in the price of the underlying securities the Fund owns or intends to acquire but establishes a rate of exchange in advance. Fluctuations in the value of these contracts are measured by the difference in the contract date and reporting date exchange rates and are recorded as unrealized appreciation (depreciation) until the contracts are closed. When the contracts are closed, realized gains (losses) are recorded. Realized and unrealized gains (losses) on the contracts are included in the Statement of Operations. The primary risks associated with forward foreign currency contracts include failure of the Counterparty to meet the terms of the contract and the value of the foreign currency changing unfavorably. These risks may be in excess of the amounts reflected in the Statement of Assets and Liabilities.
NOTE 2–Advisory Fees and Other Fees Paid to Affiliates
The Trust has entered into a master investment advisory agreement with the Adviser. Under the terms of the investment advisory agreement, the Fund accrues daily and pays monthly an advisory fee to the Adviser based on the annual rate of the Fund’s average daily net assets as follows:
| | | | |
| Average Daily Net Assets | | Rate |
First $500 million | | 0.670% |
Next $500 million | | 0.645% |
Over $1 billion | | 0.620% |
For the year ended April 30, 2024, the effective advisory fee rate incurred by the Fund was 0.63%.
Under the terms of a master sub-advisory agreement between the Adviser and each of Invesco Asset Management Deutschland GmbH, Invesco Asset Management Limited, Invesco Asset Management (Japan) Limited, Invesco Hong Kong Limited, Invesco Senior Secured Management, Inc. and Invesco Canada Ltd. (collectively, the “Affiliated Sub-Advisers”) the Adviser, not the Fund, will pay 40% of the fees paid to the Adviser to any such Affiliated Sub-Adviser(s) that provide(s) discretionary investment management services to the Fund based on the percentage of assets allocated to such Affiliated Sub-Adviser(s).
Effective July 1, 2023, the Adviser has agreed, for an indefinite period, to waive advisory fees and/or reimburse expenses of all shares to the extent necessary to limit total annual fund operating expenses after fee waiver and/or expense reimbursement (excluding certain items discussed below) of Class A, Class C, Class R, Class Y and Class R6 shares to 2.00%, 2.75%, 2.25%, 1.75% and 1.75%, respectively, of the Fund’s average daily net assets (the “boundary limits”). Prior to July 1, 2023, the same boundary limits were in effect with an expiration date of June 30, 2023. In determining the Adviser’s obligation to waive advisory fees and/or reimburse expenses, the following expenses are not taken into account, and could cause the total annual fund operating expenses after fee waiver and/or expense reimbursement to exceed the numbers reflected above: (1) interest; (2) taxes; (3) dividend expense on short sales; (4) extraordinary or non-routine items, including litigation expenses; and (5) expenses that the Fund has incurred but did not actually pay because of an expense offset arrangement. Invesco may amend and/or terminate these boundary limits at any time in its sole discretion and will inform the Board of Trustees of any such changes. The Adviser did not waive fees and/or reimburse expenses during the period under these boundary limits.
Further, the Adviser has contractually agreed, through at least June 30, 2025, to waive the advisory fee payable by the Fund in an amount equal to 100% of the net advisory fees the Adviser receives from the affiliated money market funds on investments by the Fund of uninvested cash (excluding investments of cash collateral from securities lending) in such affiliated money market funds.
For the year ended April 30, 2024, the Adviser waived advisory fees of $82,636.
18 Invesco Small Cap Value Fund
The Trust has entered into a master administrative services agreement with Invesco pursuant to which the Fund has agreed to pay Invesco for certain administrative costs incurred in providing accounting services to the Fund. For the year ended April 30, 2024, expenses incurred under the agreement are shown in the Statement of Operations as Administrative services fees. Invesco has entered into a sub-administration agreement whereby State Street Bank and Trust Company (“SSB”) serves as fund accountant and provides certain administrative services to the Fund. Pursuant to a custody agreement with the Trust on behalf of the Fund, SSB also serves as the Fund’s custodian.
The Trust has entered into a transfer agency and service agreement with Invesco Investment Services, Inc. (“IIS”) pursuant to which the Fund has agreed to pay IIS a fee for providing transfer agency and shareholder services to the Fund and reimburse IIS for certain expenses incurred by IIS in the course of providing such services. IIS may make payments to intermediaries that provide omnibus account services, sub-accounting services and/or networking services. All fees payable by IIS to intermediaries that provide omnibus account services or sub-accounting services are charged back to the Fund, subject to certain limitations approved by the Trust’s Board of Trustees. For the year ended April 30, 2024, expenses incurred under the agreement are shown in the Statement of Operations as Transfer agent fees.
The Trust has entered into master distribution agreements with Invesco Distributors, Inc.(“IDI”) to serve as the distributor for the Class A, Class C, Class R, Class Y and Class R6 shares of the Fund. The Trust has adopted plans pursuant to Rule 12b-1 under the 1940 Act with respect to the Fund’s Class A, Class C and Class R shares (collectively the “Plans”). The Fund, pursuant to the Plans, reimburses IDI for its allocated share of expenses incurred for the period, up to a maximum annual rate of 0.25% of the average daily net assets of Class A shares and up to a maximum annual rate of 1.00% of the average daily net assets of Class C shares. The Fund pursuant to the Class R Plan, pays IDI compensation at the annual rate of 0.50% of the average daily net assets of Class R shares. The fees are accrued daily and paid monthly. Of the Plans payments, up to 0.25% of the average daily net assets of each class of shares may be paid to furnish continuing personal shareholder services to customers who purchase and own shares of such classes. Any amounts not paid as a service fee under the Plans would constitute an asset-based sales charge. Rules of the Financial Industry Regulatory Authority (“FINRA”) impose a cap on the total sales charges, including asset-based sales charges, that may be paid by any class of shares of the Fund. For the year ended April 30, 2024, expenses incurred under the Plans are shown in the Statement of Operations as Distribution fees.
Front-end sales commissions and CDSC (collectively, the “sales charges”) are not recorded as expenses of the Fund. Front-end sales commissions are deducted from proceeds from the sales of Fund shares prior to investment in Class A shares of the Fund. CDSC are deducted from redemption proceeds prior to remittance to the shareholder. During the year ended April 30, 2024, IDI advised the Fund that IDI retained $170,372 in front-end sales commissions from the sale of Class A shares and $2,847 and $23,613 from Class A and Class C shares, respectively, for CDSC imposed upon redemptions by shareholders.
For the year ended April 30, 2024, the Fund incurred $187,201 in brokerage commissions with Invesco Capital Markets, Inc., an affiliate of the Adviser and IDI, for portfolio transactions executed on behalf of the Fund.
Certain officers and trustees of the Trust are officers and directors of the Adviser, IIS and/or IDI.
NOTE 3–Additional Valuation Information
GAAP defines fair value as the price that would be received to sell an asset or paid to transfer a liability in an orderly transaction between market participants at the measurement date, under current market conditions. GAAP establishes a hierarchy that prioritizes the inputs to valuation methods, giving the highest priority to readily available unadjusted quoted prices in an active market for identical assets (Level 1) and the lowest priority to significant unobservable inputs (Level 3), generally when market prices are not readily available. Based on the valuation inputs, the securities or other investments are tiered into one of three levels. Changes in valuation methods may result in transfers in or out of an investment’s assigned level:
| | | | |
Level | | 1 - | | Prices are determined using quoted prices in an active market for identical assets. |
Level | | 2 - | | Prices are determined using other significant observable inputs. Observable inputs are inputs that other market participants may use in pricing a security. These may include quoted prices for similar securities, interest rates, prepayment speeds, credit risk, yield curves, loss severities, default rates, discount rates, volatilities and others. |
Level | | 3 - | | Prices are determined using significant unobservable inputs. In situations where quoted prices or observable inputs are unavailable (for example, when there is little or no market activity for an investment at the end of the period), unobservable inputs may be used. Unobservable inputs reflect the Adviser’s assumptions about the factors market participants would use in determining fair value of the securities or instruments and would be based on the best available information. |
The following is a summary of the tiered valuation input levels, as of April 30, 2024. The level assigned to the securities valuations may not be an indication of the risk or liquidity associated with investing in those securities. Because of the inherent uncertainties of valuation, the values reflected in the financial statements may materially differ from the value received upon actual sale of those investments.
| | | | | | | | | | | | | | | | | | | | | | | | | | | | |
| | | Level 1 | | | | | | Level 2 | | | | | | Level 3 | | | | | | Total | |
|
| |
Investments in Securities | | | | | | | | | | | | | | | | | | | | | | | | | | | | |
|
| |
Common Stocks & Other Equity Interests | | | $4,291,660,846 | | | | | | | | $135,568,462 | | | | | | | | $– | | | | | | | | $4,427,229,308 | |
|
| |
Exchange-Traded Funds | | | 76,027,645 | | | | | | | | – | | | | | | | | – | | | | | | | | 76,027,645 | |
|
| |
Money Market Funds | | | 45,974,578 | | | | | | | | 351,409,859 | | | | | | | | – | | | | | | | | 397,384,437 | |
|
| |
Total Investments in Securities | | | 4,413,663,069 | | | | | | | | 486,978,321 | | | | | | | | – | | | | | | | | 4,900,641,390 | |
|
| |
| | | | | | | |
Other Investments - Assets* | | | | | | | | | | | | | | | | | | | | | | | | | | | | |
|
| |
Forward Foreign Currency Contracts | | | – | | | | | | | | 1,316 | | | | | | | | – | | | | | | | | 1,316 | |
|
| |
Other Investments - Liabilities* | | | | | | | | | | | | | | | | | | | | | | | | | | | | |
|
| |
Forward Foreign Currency Contracts | | | – | | | | | | | | (487,564 | ) | | | | | | | – | | | | | | | | (487,564 | ) |
|
| |
Total Other Investments | | | – | | | | | | | | (486,248 | ) | | | | | | | – | | | | | | | | (486,248 | ) |
|
| |
Total Investments | | | $4,413,663,069 | | | | | | | | $486,492,073 | | | | | | | | $– | | | | | | | | $4,900,155,142 | |
|
| |
| * | Unrealized appreciation (depreciation). |
NOTE 4–Derivative Investments
The Fund may enter into an International Swaps and Derivatives Association Master Agreement (“ISDA Master Agreement”) under which a fund may trade OTC derivatives. An OTC transaction entered into under an ISDA Master Agreement typically involves a collateral posting arrangement, payment netting provisions and close-out netting provisions. These netting provisions allow for reduction of credit risk through netting of contractual obligations. The enforceability of the netting provisions of the ISDA Master Agreement depends on the governing law of the ISDA Master Agreement, among other factors.
For financial reporting purposes, the Fund does not offset OTC derivative assets or liabilities that are subject to ISDA Master Agreements in the Statement of Assets and Liabilities.
19 Invesco Small Cap Value Fund
Value of Derivative Investments at Period-End
The table below summarizes the value of the Fund’s derivative investments, detailed by primary risk exposure, held as of April 30, 2024:
| | | | |
| | | Value | |
| Derivative Assets | | Currency
Risk | |
|
| |
Unrealized appreciation on forward foreign currency contracts outstanding | | $ | 1,316 | |
|
| |
Derivatives not subject to master netting agreements | | | – | |
|
| |
Total Derivative Assets subject to master netting agreements | | $ | 1,316 | |
|
| |
| | | | |
| | | Value | |
| Derivative Liabilities | | Currency
Risk | |
|
| |
Unrealized depreciation on forward foreign currency contracts outstanding | | $ | (487,564 | ) |
|
| |
Derivatives not subject to master netting agreements | | | – | |
|
| |
Total Derivative Liabilities subject to master netting agreements | | $ | (487,564 | ) |
|
| |
Offsetting Assets and Liabilities
The table below reflects the Fund’s exposure to Counterparties subject to either an ISDA Master Agreement or other agreement for OTC derivative transactions as of April 30, 2024.
| | | | | | | | | | | | | | |
| | | Financial
Derivative Assets | | Financial
Derivative
Liabilities | | | | Collateral
(Received)/Pledged | | | |
| Counterparty | | Forward Foreign
Currency Contracts | | Forward Foreign
Currency Contracts | | Net Value of
Derivatives | | Non-Cash | | Cash | | Net
Amount | |
| |
Merrill Lynch International | | $1,316 | | $(487,564) | | $(486,248) | | $– | | $– | | $ | (486,248 | ) |
| |
Effect of Derivative Investments for the year ended April 30, 2024
The table below summarizes the gains (losses) on derivative investments, detailed by primary risk exposure, recognized in earnings during the period:
| | |
| | | Location of Gain on Statement of Operations |
| | | Currency Risk |
|
Realized Gain: | | |
Forward foreign currency contracts | | $6,217,228 |
|
|
Change in Net Unrealized Appreciation: | | |
Forward foreign currency contracts | | 98,408 |
|
|
Total | | $6,315,636 |
|
|
The table below summarizes the average notional value of derivatives held during the period.
| | | | |
| | | Forward
Foreign Currency
Contracts | |
|
| |
Average notional value | | | $142,566,209 | |
|
| |
NOTE 5–Expense Offset Arrangement(s)
The expense offset arrangement is comprised of transfer agency credits which result from balances in demand deposit accounts used by the transfer agent for clearing shareholder transactions. For the year ended April 30, 2024, the Fund received credits from this arrangement, which resulted in the reduction of the Fund’s total expenses of $23,585.
NOTE 6–Trustees’ and Officers’ Fees and Benefits
Trustees’ and Officers’ Fees and Benefits include amounts accrued by the Fund to pay remuneration to certain Trustees and Officers of the Fund. Trustees have the option to defer compensation payable by the Fund, and Trustees’ and Officers’ Fees and Benefits also include amounts accrued by the Fund to fund such deferred compensation amounts. Those Trustees who defer compensation have the option to select various Invesco Funds in which their deferral accounts shall be deemed to be invested. Finally, certain current Trustees were eligible to participate in a retirement plan that provided for benefits to be paid upon retirement to Trustees over a period of time based on the number of years of service. The Fund may have certain former Trustees who also participate in a retirement plan and receive benefits under such plan. Trustees’ and Officers’ Fees and Benefits include amounts accrued by the Fund to fund such retirement benefits. Obligations under the deferred compensation and retirement plans represent unsecured claims against the general assets of the Fund.
NOTE 7–Cash Balances
The Fund is permitted to temporarily carry a negative or overdrawn balance in its account with SSB, the custodian bank. Such balances, if any at period-end, are shown in the Statement of Assets and Liabilities under the payable caption Amount due custodian. To compensate the custodian bank for such overdrafts, the overdrawn Fund
20 Invesco Small Cap Value Fund
may either (1) leave funds as a compensating balance in the account so the custodian bank can be compensated by earning the additional interest; or (2) compensate by paying the custodian bank at a rate agreed upon by the custodian bank and Invesco, not to exceed the contractually agreed upon rate.
NOTE 8–Distributions to Shareholders and Tax Components of Net Assets
Tax Character of Distributions to Shareholders Paid During the Fiscal Years Ended April 30, 2024 and 2023:
| | | | | | | | | | | | |
| | | 2024 | | | | | | 2023 | |
| |
Ordinary income* | | $ | 23,029,237 | | | | | | | $ | 90,901,796 | |
| |
Long-term capital gain | | | 140,664,960 | | | | | | | | 135,193,703 | |
| |
Total distributions | | $ | 163,694,197 | | | | | | | $ | 226,095,499 | |
| |
| * | Includes short-term capital gain distributions, if any. |
Tax Components of Net Assets at Period-End:
| | | | |
| | | 2024 | |
| |
Undistributed ordinary income | | $ | 28,378,755 | |
| |
Undistributed long-term capital gain | | | 89,232,301 | |
| |
Net unrealized appreciation – investments | | | 871,994,367 | |
| |
Net unrealized appreciation – foreign currencies | | | 1,704 | |
| |
Temporary book/tax differences | | | (139,567 | ) |
| |
Capital loss carryforward | | | (6,439,489 | ) |
| |
Shares of beneficial interest | | | 3,586,993,370 | |
| |
Total net assets | | $ | 4,570,021,441 | |
| |
The difference between book-basis and tax-basis unrealized appreciation (depreciation) is due to differences in the timing of recognition of gains and losses on investments for tax and book purposes. The Fund’s net unrealized appreciation (depreciation) difference is attributable primarily to wash sales.
The temporary book/tax differences are a result of timing differences between book and tax recognition of income and/or expenses. The Fund’s temporary book/tax differences are the result of the trustee deferral of compensation and retirement plan benefits.
Capital loss carryforward is calculated and reported as of a specific date. Results of transactions and other activity after that date may affect the amount of capital loss carryforward actually available for the Fund to utilize. The ability to utilize capital loss carryforward in the future may be limited under the Internal Revenue Code and related regulations based on the results of future transactions.
The Fund has a capital loss carryforward as of April 30, 2024, as follows:
| | | | | | | | | | | | | | | | | | | | |
| Capital Loss Carryforward* | |
| |
| Expiration | | Short-Term | | | | | | Long-Term | | | | | | Total | |
| |
Not subject to expiration | | $ | 5,320,006 | | | | | | | $ | 1,119,483 | | | | | | | $ | 6,439,489 | |
| |
| * | Capital loss carryforward is reduced for limitations, if any, to the extent required by the Internal Revenue Code and may be further limited depending upon a variety of factors, including the realization of net unrealized gains or losses as of the date of any reorganization. |
NOTE 9–Investment Transactions
The aggregate amount of investment securities (other than short-term securities, U.S. Government obligations and money market funds, if any) purchased and sold by the Fund during the year ended April 30, 2024 was $2,232,741,673 and $1,315,282,136, respectively. Cost of investments, including any derivatives, on a tax basis includes the adjustments for financial reporting purposes as of the most recently completed federal income tax reporting period-end.
| | | | |
| Unrealized Appreciation (Depreciation) of Investments on a Tax Basis | |
| |
Aggregate unrealized appreciation of investments | | $ | 1,025,676,061 | |
| |
Aggregate unrealized (depreciation) of investments | | | (153,681,694 | ) |
| |
Net unrealized appreciation of investments | | $ | 871,994,367 | |
| |
Cost of investments for tax purposes is $4,028,160,775.
NOTE 10–Reclassification of Permanent Differences
Primarily as a result of differing book/tax treatment of equalization and passive foreign investment companies, on April 30, 2024, undistributed net investment income was increased by $10,944,643, undistributed net realized gain was decreased by $25,230,643 and shares of beneficial interest was increased by $14,286,000. This reclassification had no effect on the net assets of the Fund.
21 Invesco Small Cap Value Fund
NOTE 11–Share Information
| | | | | | | | | | | | | | | | | | | | | | | | | | | | |
| | | Summary of Share Activity | |
| |
| | | Year ended | | | Year ended | |
| | | April 30, 2024(a) | | | April 30, 2023 | |
| | | Shares | | | | | | Amount | | | | | | Shares | | | | | | Amount | |
| |
Sold: | | | | | | | | | | | | | | | | | | | | | | | | | | | | |
Class A | | | 9,760,696 | | | | | | | $ | 193,652,081 | | | | | | | | 11,231,349 | | | | | | | $ | 203,041,369 | |
| |
Class C | | | 1,941,123 | | | | | | | | 18,840,075 | | | | | | | | 1,909,727 | | | | | | | | 18,175,305 | |
| |
Class R | | | 456,690 | | | | | | | | 8,828,717 | | | | | | | | 309,010 | | | | | | | | 5,549,466 | |
| |
Class Y | | | 64,116,614 | | | | | | | | 1,393,315,035 | | | | | | | | 51,152,710 | | | | | | | | 996,010,001 | |
| |
Class R6 | | | 20,130,079 | | | | | | | | 439,470,909 | | | | | | | | 15,858,483 | | | | | | | | 310,382,838 | |
| |
| | | | | | | |
Issued as reinvestment of dividends: | | | | | | | | | | | | | | | | | | | | | | | | | | | | |
Class A | | | 2,156,145 | | | | | | | | 42,713,236 | | | | | | | | 3,995,064 | | | | | | | | 67,956,014 | |
| |
Class C | | | 327,224 | | | | | | | | 3,062,814 | | | | | | | | 559,784 | | | | | | | | 4,741,369 | |
| |
Class R | | | 49,492 | | | | | | | | 973,498 | | | | | | | | 75,348 | | | | | | | | 1,274,881 | |
| |
Class Y | | | 3,224,710 | | | | | | | | 69,782,715 | | | | | | | | 5,183,189 | | | | | | | | 95,889,004 | |
| |
Class R6 | | | 1,272,960 | | | | | | | | 27,826,915 | | | | | | | | 1,637,428 | | | | | | | | 30,570,788 | |
| |
| | | | | | | |
Automatic conversion of Class C shares to Class A shares: | | | | | | | | | | | | | | | | | | | | | | | | | | | | |
Class A | | | 120,309 | | | | | | | | 2,390,686 | | | | | | | | 85,885 | | | | | | | | 1,540,040 | |
| |
Class C | | | (249,374 | ) | | | | | | | (2,390,686 | ) | | | | | | | (166,840 | ) | | | | | | | (1,540,040 | ) |
| |
| | | | | | | |
Reacquired: | | | | | | | | | | | | | | | | | | | | | | | | | | | | |
Class A | | | (9,798,483 | ) | | | | | | | (191,528,251 | ) | | | | | | | (8,515,585 | ) | | | | | | | (151,592,161 | ) |
| |
Class C | | | (1,397,155 | ) | | | | | | | (12,727,062 | ) | | | | | | | (882,740 | ) | | | | | | | (8,169,896 | ) |
| |
Class R | | | (265,462 | ) | | | | | | | (5,206,150 | ) | | | | | | | (118,347 | ) | | | | | | | (2,097,449 | ) |
| |
Class Y | | | (35,630,783 | ) | | | | | | | (757,457,373 | ) | | | | | | | (35,985,175 | ) | | | | | | | (693,126,792 | ) |
| |
Class R6 | | | (8,582,174 | ) | | | | | | | (183,017,051 | ) | | | | | | | (6,183,012 | ) | | | | | | | (119,493,051 | ) |
| |
Net increase in share activity | | | 47,632,611 | | | | | | | $ | 1,048,530,108 | | | | | | | | 40,146,278 | | | | | | | $ | 759,111,686 | |
| |
| (a) | There are entities that are record owners of more than 5% of the outstanding shares of the Fund and in the aggregate own 58% of the outstanding shares of the Fund. IDI has an agreement with these entities to sell Fund shares. The Fund, Invesco and/or Invesco affiliates may make payments to these entities, which are considered to be related to the Fund, for providing services to the Fund, Invesco and/or Invesco affiliates including but not limited to services such as securities brokerage, distribution, third party record keeping and account servicing. The Fund has no knowledge as to whether all or any portion of the shares owned of record by these entities are also owned beneficially. |
22 Invesco Small Cap Value Fund
Report of Independent Registered Public Accounting Firm
To the Board of Trustees of AIM Sector Funds (Invesco Sector Funds) and Shareholders of Invesco Small Cap Value Fund
Opinion on the Financial Statements
We have audited the accompanying statement of assets and liabilities, including the schedule of investments, of Invesco Small Cap Value Fund (one of the funds constituting AIM Sector Funds (Invesco Sector Funds), referred to hereafter as the “Fund”) as of April 30, 2024, the related statement of operations for the year ended April 30, 2024, the statement of changes in net assets for each of the two years in the period ended April 30, 2024, including the related notes, and the financial highlights for each of the periods indicated therein (collectively referred to as the “financial statements”). In our opinion, the financial statements present fairly, in all material respects, the financial position of the Fund as of April 30, 2024, the results of its operations for the year then ended, the changes in its net assets for each of the two years in the period ended April 30, 2024 and the financial highlights for each of the periods indicated therein in conformity with accounting principles generally accepted in the United States of America.
Basis for Opinion
These financial statements are the responsibility of the Fund’s management. Our responsibility is to express an opinion on the Fund’s financial statements based on our audits. We are a public accounting firm registered with the Public Company Accounting Oversight Board (United States) (PCAOB) and are required to be independent with respect to the Fund in accordance with the U.S. federal securities laws and the applicable rules and regulations of the Securities and Exchange Commission and the PCAOB.
We conducted our audits of these financial statements in accordance with the standards of the PCAOB. Those standards require that we plan and perform the audit to obtain reasonable assurance about whether the financial statements are free of material misstatement, whether due to error or fraud.
Our audits included performing procedures to assess the risks of material misstatement of the financial statements, whether due to error or fraud, and performing procedures that respond to those risks. Such procedures included examining, on a test basis, evidence regarding the amounts and disclosures in the financial statements. Our audits also included evaluating the accounting principles used and significant estimates made by management, as well as evaluating the overall presentation of the financial statements. Our procedures included confirmation of securities owned as of April 30, 2024 by correspondence with the custodian, transfer agent and brokers. We believe that our audits provide a reasonable basis for our opinion.
/s/PricewaterhouseCoopers LLP
Houston, Texas
June 20, 2024
We have served as the auditor of one or more of the investment companies in the Invesco group of investment companies since at least 1995. We have not been able to determine the specific year we began serving as auditor.
23 Invesco Small Cap Value Fund
Calculating your ongoing Fund expenses
Example
As a shareholder of the Fund, you incur two types of costs: (1) transaction costs, which may include sales charges (loads) on purchase payments or contingent deferred sales charges on redemptions, if any; and (2) ongoing costs, including management fees, distribution and/or service (12b-1) fees, and other Fund expenses. This example is intended to help you understand your ongoing costs (in dollars) of investing in the Fund and to compare these costs with ongoing costs of investing in other mutual funds. The example is based on an investment of $1,000 invested at the beginning of the period and held for the entire period November 1, 2023 through April 30, 2024.
Actual expenses
The table below provides information about actual account values and actual expenses. You may use the information in this table, together with the amount you invested, to estimate the expenses that you paid over the period. Simply divide your account value by $1,000 (for example, an $8,600 account value divided by $1,000 = 8.6), then multiply the result by the number in the table under the heading entitled “Actual Expenses Paid During Period” to estimate the expenses you paid on your account during this period.
Hypothetical example for comparison purposes
The table below also provides information about hypothetical account values and hypothetical expenses based on the Fund’s actual expense ratio and an assumed rate of return of 5% per year before expenses, which is not the Fund’s actual return.
The hypothetical account values and expenses may not be used to estimate the actual ending account balance or expenses you paid for the period. You may use this information to compare the ongoing costs of investing in the Fund and other funds. To do so, compare this 5% hypothetical example with the 5% hypothetical examples that appear in the shareholder reports of the other funds.
Please note that the expenses shown in the table are meant to highlight your ongoing costs only and do not reflect any transaction costs, such as sales charges (loads) on purchase payments or contingent deferred sales charges on redemptions, if any. Therefore, the hypothetical information is useful in comparing ongoing costs only, and will not help you determine the relative total costs of owning different funds. In addition, if these transaction costs were included, your costs would have been higher.
| | | | | | | | | | | | | | | | | | | | | | | | |
| | | Beginning
Account Value (11/01/23) | | | ACTUAL | | | HYPOTHETICAL (5% annual return before expenses) | | | Annualized Expense Ratio | |
| | | Ending
Account Value (04/30/24)1 | | | Expenses Paid During Period2 | | | Ending
Account Value (04/30/24) | | | Expenses
Paid During Period2 | |
Class A | | | $1,000.00 | | | | $1,291.10 | | | | $6.21 | | | | $1,019.44 | | | | $5.47 | | | | 1.09% | |
Class C | | | 1,000.00 | | | | 1,285.60 | | | | 10.46 | | | | 1,015.71 | | | | 9.22 | | | | 1.84 | |
Class R | | | 1,000.00 | | | | 1,288.80 | | | | 7.63 | | | | 1,018.20 | | | | 6.72 | | | | 1.34 | |
Class Y | | | 1,000.00 | | | | 1,292.70 | | | | 4.79 | | | | 1,020.69 | | | | 4.22 | | | | 0.84 | |
Class R6 | | | 1,000.00 | | | | 1,293.10 | | | | 4.05 | | | | 1,021.33 | | | | 3.57 | | | | 0.71 | |
| 1 | The actual ending account value is based on the actual total return of the Fund for the period November 1, 2023 through April 30, 2024, after actual expenses and will differ from the hypothetical ending account value which is based on the Fund’s expense ratio and a hypothetical annual return of 5% before expenses. |
| 2 | Expenses are equal to the Fund’s annualized expense ratio as indicated above multiplied by the average account value over the period, multiplied by 182/366 to reflect the most recent fiscal half year. |
24 Invesco Small Cap Value Fund
Tax Information
Form 1099-DIV, Form 1042-S and other year–end tax information provide shareholders with actual calendar year amounts that should be included in their tax returns. Shareholders should consult their tax advisers.
The following distribution information is being provided as required by the Internal Revenue Code or to meet a specific state’s requirement.
The Fund designates the following amounts or, if subsequently determined to be different, the maximum amount allowable for its fiscal year ended April 30, 2024:
| | | | | | |
| | |
Federal and State Income Tax | | | | | | |
Long-Term Capital Gain Distributions | | $ | 154,950,960 | |
Qualified Dividend Income* | | | 99.99 | % |
Corporate Dividends Received Deduction* | | | 85.65 | % |
U.S. Treasury Obligations* | | | 0.00 | % |
Qualified Business Income* | | | 0.00 | % |
Business Interest Income* | | | 2.82 | % |
| | * | The above percentages are based on ordinary income dividends paid to shareholders during the Fund’s fiscal year. |
25 Invesco Small Cap Value Fund
Trustees and Officers
The address of each trustee and officer is AIM Sector Funds (Invesco Sector Funds) (the “Trust”), 11 Greenway Plaza, Houston, Texas 77046-1173. The trustees serve for the life of the Trust, subject to their earlier death, incapacitation, resignation, retirement or removal as more specifically provided in the Trust’s organizational documents. Each officer serves for a one year term or until their successors are elected and qualified. Column two below includes length of time served with predecessor entities, if any.
| | | | | | | | |
Name, Year of Birth and Position(s) Held with the Trust | | Trustee and/or Officer Since | | Principal Occupation(s) During Past 5 Years | | Number of Funds in Fund Complex
Overseen by
Trustee | | Other Directorship(s) Held by Trustee During At Least The Past 5 Years |
| Interested Trustees | | | | | | | | |
Jeffrey H. Kupor1 – 1968 Trustee | | 2024 | | Senior Managing Director and General Counsel, Invesco Ltd.; Trustee, Invesco Foundation, Inc.; Director, Invesco Advisers, Inc.; Executive Vice President, Invesco Asset Management (Bermuda), Ltd., Invesco Investments (Bermuda) Ltd.; and Vice President, Invesco Group Services, Inc. Formerly: Head of Legal of the Americas, Invesco Ltd.; Senior Vice President and Secretary, Invesco Advisers, Inc. (formerly known as Invesco Institutional (N.A.), Inc.) (registered investment adviser); Secretary, Invesco Distributors, Inc. (formerly known as Invesco AIM Distributors, Inc.); Vice President and Secretary, Invesco Investment Services, Inc. (formerly known as Invesco AIM Investment Services, Inc.); Senior Vice President, Chief Legal Officer and Secretary, The Invesco Funds; Secretary and General Counsel, Invesco Investment Advisers LLC (formerly known as Van Kampen Asset Management); Secretary and General Counsel, Invesco Capital Markets, Inc. (formerly known as Van Kampen Funds Inc.) and Chief Legal Officer, Invesco Exchange-Traded Fund Trust, Invesco Exchange-Traded Fund Trust II, Invesco India Exchange-Traded Fund Trust, Invesco Actively Managed Exchange-Traded Fund Trust, Invesco Actively Managed Exchange-Traded Commodity Fund Trust and Invesco Exchange-Traded Self-Indexed Fund Trust; Secretary and Vice President, Harbourview Asset Management Corporation; Secretary and Vice President, OppenheimerFunds, Inc. and Invesco Managed Accounts, LLC; Secretary and Senior Vice President, OFI Global Institutional, Inc.; Secretary and Vice President, OFI SteelPath, Inc.; Secretary and Vice President, Oppenheimer Acquisition Corp.; Secretary and Vice President, Shareholder Services, Inc.; Secretary and Vice President, Trinity Investment Management Corporation, Senior Vice President, Invesco Distributors, Inc.; Secretary and Vice President, Jemstep, Inc.; Head of Legal, Worldwide Institutional, Invesco Ltd.; Secretary and General Counsel, INVESCO Private Capital Investments, Inc.; Senior Vice President, Secretary and General Counsel, Invesco Management Group, Inc. (formerly known as Invesco AIM Management Group, Inc.); Assistant Secretary, INVESCO Asset Management (Bermuda) Ltd.; Secretary and General Counsel, Invesco Private Capital, Inc.; Assistant Secretary and General Counsel, INVESCO Realty, Inc.; Secretary and General Counsel, Invesco Senior Secured Management, Inc.; Secretary, Sovereign G./P. Holdings Inc.; Secretary, Invesco Indexing LLC; and Secretary, W.L. Ross & Co., LLC | | 164 | | None |
Douglas Sharp1 – 1974 Trustee | | 2024 | | Senior Managing Director and Head of Americas & EMEA, Invesco Ltd. Formerly: Director and Chairman Invesco UK Limited; Director, Chairman and Chief Executive, Invesco Fund Managers Limited | | 164 | | None |
| 1 | Mr. Kupor and Mr. Sharp are considered interested persons (within the meaning of Section 2(a)(19) of the 1940 Act) of the Trust because they are officers of the Adviser to the Trust, and officers of Invesco Ltd., ultimate parent of the Adviser. |
T-1 Invesco Small Cap Value Fund
Trustees and Officers–(continued)
| | | | | | | | |
Name, Year of Birth and Position(s) Held with the Trust | | Trustee and/or Officer Since | | Principal Occupation(s) During Past 5 Years | | Number of Funds in Fund Complex Overseen by
Trustee | | Other Directorship(s) Held by Trustee During At Least The Past 5 Years |
| Independent Trustees | | | | | | | | |
Beth Ann Brown – 1968 Trustee (2019) and Chair (2022) | | 2019 | | Independent Consultant Formerly: Head of Intermediary Distribution, Managing Director, Strategic Relations, Managing Director, Head of National Accounts, Senior Vice President, National Account Manager and Senior Vice President, Key Account Manager, Columbia Management Investment Advisers LLC; and Vice President, Key Account Manager, Liberty Funds Distributor, Inc. | | 164 | | Director, Board of Directors of Caron Engineering Inc.; Formerly: Advisor, Board of Advisors of Caron Engineering Inc.; President and Director, Acton Shapleigh Youth Conservation Corps (non-profit); President and Director Director of Grahamtastic Connection (non-profit); and Trustee of certain Oppenheimer Funds |
Carol Deckbar – 1962 Trustee | | 2024 | | Formerly: Executive Vice President and Chief Product Officer, TIAA Financial Services; Executive Vice President and Principal, College Retirement Equities Fund at TIAA; Executive Vice President and Head of Institutional Investments and Endowment Services, TIAA | | 164 | | Formerly: Board Member, TIAA Asset Management, Inc.; and Board Member, TH Real Estate Group Holdings Company |
Cynthia Hostetler – 1962 Trustee | | 2017 | | Non-Executive Director and Trustee of a number of public and private business corporations Formerly: Director, Aberdeen Investment Funds (4 portfolios); Director, Artio Global Investment LLC (mutual fund complex); Director, Edgen Group, Inc. (specialized energy and infrastructure products distributor); Director, Genesee & Wyoming, Inc. (railroads); Head of Investment Funds and Private Equity, Overseas Private Investment Corporation; President, First Manhattan Bancorporation, Inc.; and Attorney, Simpson Thacher & Bartlett LLP | | 164 | | Resideo Technologies, Inc. (smart home technology); Vulcan Materials Company (construction materials company); Trilinc Global Impact Fund; Investment Company Institute (professional organization); and Independent Directors Council (professional organization) |
Eli Jones – 1961 Trustee | | 2016 | | Professor and Dean Emeritus, Mays Business School - Texas A&M University Formerly: Dean of Mays Business School-Texas A&M University; Professor and Dean, Walton College of Business, University of Arkansas and E.J. Ourso College of Business, Louisiana State University; and Director, Arvest Bank | | 164 | | Insperity, Inc. (formerly known as Administaff) (human resources provider); Board Member of the regional board, First Financial Bank Texas; and Boad Member, First Financial Bankshares, Inc. Texas |
Elizabeth Krentzman – 1959 Trustee | | 2019 | | Formerly: Principal and Chief Regulatory Advisor for Asset Management Services and U.S. Mutual Fund Leader of Deloitte & Touche LLP; General Counsel of the Investment Company Institute (trade association); National Director of the Investment Management Regulatory Consulting Practice, Principal, Director and Senior Manager of Deloitte & Touche LLP; Assistant Director of the Division of Investment Management - Office of Disclosure and Investment Adviser Regulation of the U.S. Securities and Exchange Commission and various positions with the Division of Investment Management – Office of Regulatory Policy of the U.S. Securities and Exchange Commission; and Associate at Ropes & Gray LLP | | 164 | | Formerly: Member of the Cartica Funds Board of Directors (private investment fund); Trustee of the University of Florida National Board Foundation; Member of the University of Florida Law Center Association, Inc. Board of Trustees, Audit Committee and Membership Committee; and Trustee of certain Oppenheimer Funds |
Anthony J. LaCava, Jr. – 1956 Trustee | | 2019 | | Formerly: Director and Member of the Audit Committee, Blue Hills Bank (publicly traded financial institution) and Managing Partner, KPMG LLP | | 164 | | Member and Chairman, of the Bentley University, Business School Advisory Council; Formerly: Board Member and Chair of the Audit and Finance Committee and Nominating Committee, KPMG LLP |
James “Jim” Liddy – 1959 Trustee | | 2024 | | Formerly: Chairman, Global Financial Services, Americas and Retired Partner, KPMG LLP | | 164 | | Director and Treasurer, Gulfside Place Condominium Association, Inc. and Non-Executive Director, Kellenberg Memorial High School |
T-2 Invesco Small Cap Value Fund
Trustees and Officers–(continued)
| | | | | | | | |
Name, Year of Birth and Position(s) Held with the Trust | | Trustee and/or Officer Since | | Principal Occupation(s) During Past 5 Years | | Number of Funds in Fund Complex Overseen by
Trustee | | Other Directorship(s) Held by Trustee During At Least The Past 5 Years |
| Independent Trustees–(continued) |
Prema Mathai-Davis – 1950 Trustee | | 2003 | | Formerly: Co-Founder & Partner of Quantalytics Research, LLC, (a FinTech Investment Research Platform for the Self-Directed Investor); Trustee of YWCA Retirement Fund; CEO of YWCA of the USA; Board member of the NY Metropolitan Transportation Authority; Commissioner of the NYC Department of Aging; and Board member of Johns Hopkins Bioethics Institute | | 164 | | Member of Board of Positive Planet US (non-profit) and HealthCare Chaplaincy Network (non-profit) |
Joel W. Motley – 1952 Trustee | | 2019 | | Director of Office of Finance, Federal Home Loan Bank System; Managing Director of Carmona Motley Inc. (privately held financial advisor); Member of the Council on Foreign Relations and its Finance and Budget Committee; Chairman Emeritus of Board of Human Rights Watch and Member of its Investment Committee; and Member of Investment Committee Board of Historic Hudson Valley (non-profit cultural organization); and Member of the Vestry and the Investment Committee of Trinity Church Wall Street. Formerly: Managing Director of Public Capital Advisors, LLC (privately held financial advisor); Managing Director of Carmona Motley Hoffman, Inc. (privately held financial advisor); and Director of Columbia Equity Financial Corp. (privately held financial advisor) | | 164 | | Member of Board of Trust for Mutual Understanding (non-profit promoting the arts and environment); Member of Board of Greenwall Foundation (bioethics research foundation) and its Investment Committee; Member of Board of Friends of the LRC (non-profit legal advocacy); and Board Member and Investment Committee Member of Pulitzer Center for Crisis Reporting (non-profit journalism); and Trustee of certain Oppenheimer Funds; |
Teresa M. Ressel – 1962 Trustee | | 2017 | | Non-executive director and trustee of a number of public and private business corporations Formerly: Chief Executive Officer, UBS Securities LLC (investment banking); Group Chief Operating Officer, UBS AG Americas (investment banking); Sr. Management Team Olayan America, The Olayan Group (international investor/commercial/industrial); and Assistant Secretary for Management & Budget and Designated Chief Financial Officer, U.S. Department of Treasury | | 164 | | None |
Robert C. Troccoli – 1949 Trustee | | 2016 | | Formerly: Adjunct Professor, University of Denver – Daniels College of Business; and Managing Partner, KPMG LLP | | 164 | | None |
Daniel S. Vandivort – 1954 Trustee | | 2019 | | President, Flyway Advisory Services LLC (consulting and property management) and Member, Investment Committee of Historic Charleston Foundation Formerly: President and Chief Investment Officer, previously Head of Fixed Income, Weiss Peck and Greer/Robeco Investment Management; Trustee and Chair, Weiss Peck and Greer Funds Board; and various capacities at CS First Boston including Head of Fixed Income at First Boston Asset Management. | | 164 | | Formerly: Trustee and Governance Chair, Oppenheimer Funds; Treasurer, Chairman of the Audit and Finance Committee, Huntington Disease Foundation of America |
T-3 Invesco Small Cap Value Fund
Trustees and Officers–(continued)
| | | | | | | | |
Name, Year of Birth and Position(s) Held with the Trust | | Trustee and/or Officer Since | | Principal Occupation(s) During Past 5 Years | | Number of Funds in Fund Complex Overseen by
Trustee | | Other Directorship(s) Held by Trustee During At Least The Past 5 Years |
| Officers |
Glenn Brightman – 1972 President and Principal Executive Officer | | 2023 | | Chief Operating Officer, Americas, Invesco Ltd.; Senior Vice President, Invesco Advisers, Inc.; President and Principal Executive Officer, The Invesco Funds; Manager, Invesco Investment Advisers LLC. Formerly: Global Head of Finance, Invesco Ltd; Executive Vice President and Chief Financial Officer, Nuveen | | N/A | | N/A |
Melanie Ringold – 1975 Senior Vice President, Chief Legal Officer and Secretary | | 2023 | | Head of Legal of the Americas, Invesco Ltd.; Senior Vice President and Secretary, Invesco Advisers, Inc. (formerly known as Invesco Institutional (N.A.), Inc.) (registered investment adviser); Secretary, Invesco Distributors, Inc. (formerly known as Invesco AIM Distributors, Inc.); Secretary, Invesco Investment Services, Inc. (formerly known as Invesco AIM Investment Services, Inc.); Senior Vice President, Chief Legal Officer and Secretary, The Invesco Funds; Secretary, Invesco Investment Advisers LLC, Invesco Capital Markets, Inc.; Chief Legal Officer, Invesco Exchange-Traded Fund Trust, Invesco Exchange-Traded Fund Trust II, Invesco India Exchange-Traded Fund Trust, Invesco Actively Managed Exchange-Traded Fund Trust, Invesco Actively Secretary and Vice President, Harbourview Asset Management Corporation; Secretary and Senior Vice President, OppenheimerFunds, Inc. and Invesco Managed Accounts, LLC; Secretary and Senior Vice President, Oppenheimer Acquisition Corp.; Secretary, SteelPath Funds Remediation LLC; and Secretary and Senior Vice President, Trinity Investment Management Corporation Formerly: Secretary and Senior Vice President, OFI SteelPath, Inc., Assistant Secretary, Invesco Distributors, Inc., Invesco Advisers, Inc., Invesco Investment Services, Inc., Invesco Capital Markets, Inc., Invesco Capital Management LLC and Invesco Investment Advisers LLC; and Assistant Secretary and Assistant Vice President, Invesco Funds | | N/A | | N/A |
John M. Zerr – 1962 Senior Vice President | | 2006 | | Chief Operating Officer of the Americas; Senior Vice President, Invesco Advisers, Inc. (formerly known as Invesco Institutional (N.A.), Inc.) (registered investment adviser); Senior Vice President, Invesco Distributors, Inc. (formerly known as Invesco AIM Distributors, Inc.); Director and Vice President, Invesco Investment Services, Inc. (formerly known as Invesco AIM Investment Services, Inc.) Senior Vice President, The Invesco Funds; Managing Director, Invesco Capital Management LLC; Senior Vice President, Invesco Capital Markets, Inc. (formerly known as Van Kampen Funds Inc.); Manager, Invesco Specialized Products, LLC; Member, Invesco Canada Funds Advisory Board; Director, President and Chief Executive Officer, Invesco Corporate Class Inc. (corporate mutual fund company); Director, Chairman, President and Chief Executive Officer, Invesco Canada Ltd. (formerly known as Invesco Trimark Ltd./Invesco Trimark Ltèe) (registered investment adviser and registered transfer agent); President, Invesco, Inc.; President, Invesco Global Direct Real Estate Feeder GP Ltd.; President, Invesco IP Holdings (Canada) Ltd; President, Invesco Global Direct Real Estate GP Ltd.; and President Invesco Financial Services Ltd. / Services Financiers Invesco Ltée Formerly: Director and Chairman, Invesco Trust Company, Manager, Invesco Indexing LLC; Director, Invesco Investment Advisers LLC (formerly known as Van Kampen Asset Management); President, Trimark Investments Ltd/Services Financiers Invesco Ltee; Director and Senior Vice President, Invesco Insurance Agency, Inc.; Director and Senior Vice President, Invesco Management Group, Inc. (formerly known as Invesco AIM Management Group, Inc.); Secretary and General Counsel, Invesco Management Group, Inc. (formerly known as Invesco AIM Management Group, Inc.); Secretary, Invesco Investment Services, Inc. (formerly known as Invesco AIM Investment Services, Inc.); Chief Legal Officer and Secretary, The Invesco Funds; Secretary and General Counsel, Invesco Investment Advisers LLC (formerly known as Van Kampen Asset Management); Secretary and General Counsel, Invesco Capital Markets, Inc. (formerly known as Van Kampen Funds Inc.); Chief Legal Officer, Invesco Exchange-Traded Fund Trust, Invesco Exchange-Traded Fund Trust II, Invesco India Exchange-Traded Fund Trust, Invesco Actively Managed Exchange-Traded Fund Trust, Invesco Actively Managed Exchange-Traded Commodity Fund Trust and Invesco Exchange-Traded Self-Indexed Fund Trust; Secretary, Invesco Indexing LLC; Director, Secretary, General Counsel and Senior Vice President, Van Kampen Exchange Corp.; Director, Vice President and Secretary, IVZ Distributors, Inc. (formerly known as INVESCO Distributors, Inc.); Director and Vice President, INVESCO Funds Group, Inc.; Director and Vice President, Van Kampen Advisors Inc.; Director, Vice President, Secretary and General Counsel, Van Kampen Investor Services Inc.;Director and Secretary, Invesco Distributors, Inc. (formerly known as Invesco AIM Distributors, Inc.); Director, Senior Vice President, General Counsel and Secretary, Invesco AIM Advisers, Inc. and Van Kampen Investments Inc.; Director, Vice President and Secretary, Fund Management Company; Director, Senior Vice President, Secretary, General Counsel and Vice President, Invesco AIM Capital Management, Inc.; and Chief Operating Officer and General Counsel, Liberty Ridge Capital, Inc. (an investment adviser) | | N/A | | N/A |
T-4 Invesco Small Cap Value Fund
Trustees and Officers–(continued)
| | | | | | | | |
Name, Year of Birth and Position(s) Held with the Trust | | Trustee and/or Officer Since | | Principal Occupation(s) During Past 5 Years | | Number of Funds in Fund Complex Overseen by
Trustee | | Other Directorship(s) Held by Trustee During At Least The Past 5 Years |
| Officers–(continued) |
Tony Wong – 1973 Senior Vice President | | 2023 | | Senior Managing Director, Invesco Ltd.; Director, Chairman, Chief Executive Officer and President, Invesco Advisers, Inc.; Director and Chairman, Invesco Private Capital, Inc., INVESCO Private Capital Investments, Inc. and INVESCO Realty, Inc.; Director, Invesco Senior Secured Management, Inc.; President, Invesco Managed Accounts, LLC and SNW Asset Management Corporation; and Senior Vice President, The Invesco Funds Formerly: Assistant Vice President, The Invesco Funds; and Vice President, Invesco Advisers, Inc. | | N/A | | N/A |
Stephanie C. Butcher – 1971 Senior Vice President | | 2023 | | Senior Managing Director, Invesco Ltd.; Senior Vice President, The Invesco Funds; Director and Chief Executive Officer, Invesco Asset Management Limited | | N/A | | N/A |
Adrien Deberghes – 1967 Principal Financial Officer, Treasurer and Senior Vice President | | 2020 | | Head of the Fund Office of the CFO and Fund Administration; Vice President, Invesco Advisers, Inc.; Director, Invesco Trust Company; Principal Financial Officer, Treasurer and Senior Vice President, The Invesco Funds; Vice President, Invesco Exchange-Traded Fund Trust, Invesco Exchange-Traded Fund Trust II, Invesco India Exchange-Traded Fund Trust, Invesco Actively Managed Exchange-Traded Fund Trust, Invesco Actively Managed Exchange-Traded Commodity Fund Trust and Invesco Exchange-Traded Self-Indexed Fund Trust Formerly: Vice President, The Invesco Funds; Senior Vice President and Treasurer, Fidelity Investments | | N/A | | N/A |
Crissie M. Wisdom – 1969 Anti-Money Laundering Compliance Officer | | 2013 | | Anti-Money Laundering and OFAC Compliance Officer for Invesco U.S. entities including: Invesco Advisers, Inc. and its affiliates, Invesco Capital Markets, Inc., Invesco Distributors, Inc., Invesco Investment Services, Inc., The Invesco Funds, Invesco Capital Management, LLC, Invesco Trust Company; and Fraud Prevention Manager for Invesco Investment Services, Inc. | | N/A | | N/A |
Todd F. Kuehl – 1969 Chief Compliance Officer and Senior Vice President | | 2020 | | Chief Compliance Officer, Invesco Advisers, Inc. (registered investment adviser); and Chief Compliance Officer and Senior Vice President, The Invesco Funds Formerly: Managing Director and Chief Compliance Officer, Legg Mason (Mutual Funds); Chief Compliance Officer, Legg Mason Private Portfolio Group (registered investment adviser) | | N/A | | N/A |
James Bordewick, Jr. – 1959 Senior Vice President and Senior Officer | | 2022 | | Senior Vice President and Senior Officer, The Invesco Funds Formerly: Chief Legal Officer, KingsCrowd, Inc. (research and analytical platform for investment in private capital markets); Chief Operating Officer and Head of Legal and Regulatory, Netcapital (private capital investment platform); Managing Director, General Counsel of asset management and Chief Compliance Officer for asset management and private banking, Bank of America Corporation; Chief Legal Officer, Columbia Funds and BofA Funds; Senior Vice President and Associate General Counsel, MFS Investment Management; Chief Legal Officer, MFS Funds; Associate, Ropes & Gray; and Associate, Gaston Snow & Ely Bartlett | | N/A | | N/A |
The Statement of Additional Information of the Trust includes additional information about the Fund’s Trustees and is available upon request, without charge, by calling 1.800.959.4246. Please refer to the Fund’s Statement of Additional Information for information on the Fund’s sub-advisers.
| | | | | | |
| Office of the Fund | | Investment Adviser | | Distributor | | Auditors |
| 11 Greenway Plaza | | Invesco Advisers, Inc. | | Invesco Distributors, Inc. | | PricewaterhouseCoopers LLP |
| Houston, TX 77046-1173 | | 1331 Spring Street, NW, Suite 2500 | | 11 Greenway Plaza | | 1000 Louisiana Street, Suite 5800 |
| | Atlanta, GA 30309 | | Houston, TX 77046-1173 | | Houston, TX 77002-5021 |
| | | |
| Counsel to the Fund | | Counsel to the Independent Trustees | | Transfer Agent | | Custodian |
| Stradley Ronon Stevens & Young, LLP | | Sidley Austin LLP | | Invesco Investment Services, Inc. | | State Street Bank and Trust Company |
| 2005 Market Street, Suite 2600 | | 787 Seventh Avenue | | 11 Greenway Plaza | | 225 Franklin Street |
| Philadelphia, PA 19103-7018 | | New York, NY 10019 | | Houston, TX 77046-1173 | | Boston, MA 02110-2801 |
T-5 Invesco Small Cap Value Fund
Proxy Results
A Special Joint Meeting (“Meeting”) of Shareholders of AIM Sector Funds (Invesco Sector Funds), a Delaware statutory trust (“Trust”), was held on January 16, 2024.
The Meeting was held for the following purpose:
| (1) | Elect 14 trustees to the Board of Trustees of the Trust, each of whom will serve until his or her successor is duly elected and qualified. |
The results of the voting on the above matter were as follows:
| | | | | | | | | | |
| Matter | | Votes For | | | | | Votes Against/Withheld | |
(1)* Beth Ann Brown | | | 595,446,022.84 | | | | | | 16,915,661.31 | |
Carol Deckbar | | | 595,102,087.25 | | | | | | 17,259,596.89 | |
Cynthia Hostetler | | | 595,359,921.21 | | | | | | 17,001,762.94 | |
Dr. Eli Jones | | | 594,949,311.14 | | | | | | 17,412,373.00 | |
Elizabeth Krentzman | | | 595,453,833.65 | | | | | | 16,907,850.50 | |
Jeffrey H. Kupor | | | 595,342,690.51 | | | | | | 17,018,993.64 | |
Anthony J. LaCava, Jr. | | | 595,293,865.38 | | | | | | 17,067,818.77 | |
James Liddy | | | 594,980,026.97 | | | | | | 17,381,657.17 | |
Dr. Prema Mathai-Davis | | | 594,031,204.04 | | | | | | 18,330,480.11 | |
Joel W. Motley | | | 594,381,710.91 | | | | | | 17,979,973.23 | |
Teresa M. Ressel | | | 595,821,958.43 | | | | | | 16,539,725.72 | |
Douglas Sharp | | | 595,715,711.66 | | | | | | 16,645,972.48 | |
Robert C. Troccoli | | | 594,748,318.91 | | | | | | 17,613,365.24 | |
Daniel S. Vandivort | | | 595,002,691.19 | | | | | | 17,358,992.96 | |
* Proposal 1 required approval by a combined vote of all the portfolios of AIM Sector Funds (Invesco Sector Funds).
T-6 Invesco Small Cap Value Fund

Go paperless with eDelivery
Visit invesco.com/edelivery to enjoy the convenience and security of anytime electronic access to your investment documents.
With eDelivery, you can elect to have any or all of the following materials delivered straight to your inbox to download, save and print from your own computer:
| ∎ | | Fund reports and prospectuses |
Invesco mailing information
Send general correspondence to Invesco Investment Services, Inc., P.O. Box 219078, Kansas City, MO 64121-9078.
Important notice regarding delivery of security holder documents
To reduce Fund expenses, only one copy of most shareholder documents may be mailed to shareholders with multiple accounts at the same address (Householding). Mailing of your shareholder documents may be householded indefinitely unless you instruct us otherwise. If you do not want the mailing of these documents to be combined with those for other members of your household, please contact Invesco Investment Services, Inc. at 800 959 4246 or contact your financial institution. We will begin sending you individual copies for each account within 30 days after receiving your request.
Fund holdings and proxy voting information
The Fund provides a complete list of its portfolio holdings four times each year, at the end of each fiscal quarter. For the second and fourth quarters, the list appears, respectively, in the Fund’s semiannual and annual reports to shareholders. For the first and third quarters, the Fund files the list with the Securities and Exchange Commission (SEC) as an exhibit to its reports on Form N-PORT. The most recent list of portfolio holdings is available at invesco.com/completeqtrholdings. Shareholders can also look up the Fund’s Form N-PORT filings on the SEC website, sec.gov. The SEC file numbers for the Fund are shown below.
A description of the policies and procedures that the Fund uses to determine how to vote proxies relating to portfolio securities is available without charge, upon request, from our Client Services department at 800 959 4246, or at invesco.com/corporate/about-us/esg. The information is also available on the SEC website, sec.gov.
Information regarding how the Fund voted proxies related to its portfolio securities during the most recent 12-month period ended June 30 is available at invesco.com/proxysearch. This information is also available on the SEC website, sec.gov.
Invesco Advisers, Inc. is an investment adviser; it provides investment advisory services to individual and institutional clients and does not sell securities. Invesco Distributors, Inc. is the US distributor for Invesco Ltd.’s retail mutual funds, exchange-traded funds and institutional money market funds. Both are wholly owned, indirect subsidiaries of Invesco Ltd.
| | | | |
SEC file number(s): 811-03826 and 002-85905 | | Invesco Distributors, Inc. | | VK-SCV-AR-1 |

| | |
| Annual Report to Shareholders | | April 30, 2024 |
Invesco Technology Fund
Nasdaq:
A: ITYAX ∎ C: ITHCX ∎ Y: ITYYX ∎ Investor: FTCHX ∎ R5: FTPIX ∎ R6: FTPSX
Beginning in July 2024, amendments adopted by the Securities and Exchange Commission will substantially impact the design, content, and delivery of shareholder reports. These newly designed shareholder reports will highlight key fund information in a clear and concise format and must be mailed to each shareholder that has not elected to receive the reports electronically. Other information, including financial statements, will no longer be included in the shareholder report but will be available at invesco.com/reports, delivered upon request, and filed on a semi-annual basis on Form N-CSR.
If you would like to receive shareholder reports and other communications electronically instead of by mail, you may make that request by contacting your financial intermediary (such as a broker-dealer or bank) or, if you are a direct investor, by enrolling at invesco.com/edelivery. If you do not make this request or enroll in e-delivery, you will receive future shareholder reports and other communications by mail.
Management’s Discussion of Fund Performance
|
Performance summary |
For the fiscal year ended April 30, 2024, Class A shares of Invesco Technology Fund (the Fund), at net asset value (NAV), underperformed the S&P North American Technology Sector Index, the Fund’s style-specific benchmark. Your Fund’s long-term performance appears later in this report. |
Fund vs. Indexes |
Total returns, 4/30/23 to 4/30/24, at net asset value (NAV). Performance shown does not include applicable contingent deferred sales charges (CDSC) or front-end sales charges, which would have reduced performance. |
| | | | |
Class A Shares | | | 39.48 | % |
Class C Shares | | | 38.42 | |
Class Y Shares | | | 39.80 | |
Investor Class Shares | | | 39.64 | |
Class R5 Shares | | | 39.91 | |
Class R6 Shares | | | 40.00 | |
NASDAQ Composite Total Return Index▼ (Broad Market Index)* | | | 29.08 | |
S&P 500 Index∎ (Broad Market Index)* | | | 22.66 | |
S&P North American Technology Sector Index▼ (Style-Specific Index) | | | 45.66 | |
|
Source(s): ▼Bloomberg LP; ∎RIMES Technologies Corp. | |
|
*Effective August 28, 2023, the Fund changed its broad-based securities market benchmark from the NASDAQ Composite Total Return Index to the S&P 500 Index. The Fund believes the S&P 500 Index is an appropriate benchmark for evaluating the Fund’s performance against the overall applicable market. | |
Market conditions and your Fund
The US economy and equity markets remained resilient in the second quarter of 2023, as milder inflation data and better-than-expected corporate earnings supported equities, with most major indexes posting gains for the quarter and with some big tech names providing optimistic future guidance. Following the March 2023 banking crisis, markets stabilized in April, as corporate earnings season got underway with many companies exceeding earnings and revenue estimates. Facing persistently strong employment data, the US Federal Reserve (the Fed) raised the federal funds rate by 0.25% at its May 2023 meeting,1 but left rates unchanged at its June meeting, giving investors the long-awaited “pause” in rate hikes, which sent equities broadly higher.
Equity markets declined in the third quarter and into October 2023 as a resilient US economy complicated the Fed’s efforts to tame inflation. While inflation has slowed from its peak in 2022, in July 2023, the Consumer Price Index (CPI) rose by 0.2% and the 12-month headline inflation rate rose to 3.2% from 3% in June.2 Due to the persistence of inflation, the Fed raised the federal funds rate again in July by 0.25%.1 The CPI data released in September was higher-than-expected and the overall US labor market remained tight with unemployment near historic lows. At the same time the third quarter year-over-year Gross Domestic Product (GDP) estimate was 4.9%, far above expectations.2 Despite the higher-than-expected GDP for the third quarter of 2023, the Fed held interest rates steady at its September and October meetings, but left open the possibility of
another rate hike before the end of the calendar year.1
US equity markets posted strong gains in the fourth quarter of 2023 as investors anticipated the potential end of interest rate hikes by the Fed. Inflation slowed during the period as the CPI 12-month headline inflation rate fell to 3.1% in November from 3.7% in September, significantly below the 2022 peak of 9.1%.2 The Fed kept rates steady at its mid-December meeting and indicated that three rate cuts are expected in 2024. Fed chairman Powell noted that “the Fed’s policy rate is likely at or near its peak for this tightening cycle,“1 which prompted a strong equity rally into 2023 year-end and the yield on the 10-year US Treasury to fall from nearly 5% in October to below 4%.3
US equity markets rallied in the first quarter of 2024. In February, the S&P 500 Index closed above the 5,000 milestone for the first time.3 The US economy defied recession predictions, achieving a growth rate of 2.5% in 2023 and the labor market remained robust, with continued payroll gains and unemployment still historically low – below 4%.2 Inflation, however, remained persistent. January and February increases in the CPI were higher than expected, leading the Fed to defer its proposed interest rate cuts to the second half of 2024.1 Still, investors were mostly pleased by corporate earnings growth, except for three of the so-called “Magnificent Seven” stocks. Apple, Alphabet and Tesla’s stock prices suffered due to disappointing earnings, sales and revenue, or weak forward guidance. Although the stock market had a strong start in 2024, the stock market retreated in April. As consumer spending and a strong labor market were driving economic activity,
inflation and interest rate concerns persisted and investors feared another delay in expected rate cuts by the Fed, or worse, rate hikes.
Despite continued higher rates and increased market volatility, US stocks for the fiscal year had strong positive returns of 22.66%, as measured by the S&P 500 Index.4
During the fiscal year, the Fund underperformed the S&P North American Technology Sector Index. Underperformance was primarily attributed to weaker stock selection in the semiconductors and application software industries as well as our underweight exposure to interactive media & services and semiconductors. This was partially offset by stronger stock selection in the systems software industry and our underweight allocation to the technology hardware storage & peripherals industry.
The top individual contributors on an absolute basis during the fiscal year included
NVIDIA, Meta Platforms, and Microsoft. These top contributors are among the “Magnificent Seven” (Amazon.com, Alphabet, Apple, Meta Platforms, Microsoft, NVIDIA, and Tesla), the mega-cap technology-related stocks that dominated the market through most of 2023 and into 2024.
NVIDIA engages in the design and manufacture of computer graphics processors, chipsets and related multimedia software. The stock exhibited strong momentum due to excitement about generative artificial intelligence (AI) and upward revisions to estimates for production of silicon wafers used in semiconductors.
Meta Platforms engages in the development of social media applications. Continued cost control and strong earnings have also helped Meta Platforms post better-than-expected results.
Microsoft develops software, services, devices and solutions. The company also has exposure to AI, a key momentum driver amid the buzz about generative AI.
The top individual detractors on an absolute basis during the fiscal year included Confluent, Snowflake and ON Semiconductor.
Confluent provides a commercial platform for managing real-time data streams. The stock underperformed after management reported weak results and began a sales force transition. We exited our position during the fiscal year.
Snowflake provides cloud data warehousing software. Snowflake surprised investors with the announcement that CEO Frank Slootman retired at the end of February. The company also reduced revenue guidance for 2024.
ON Semiconductor sells semiconductors into the automotive, consumer and industrial industries. The aforementioned industries experienced an inventory correction resulting in reduced guidance for most companies including ON Semiconductor. We exited our position during the fiscal year.
2 Invesco Technology Fund
Technology-driven innovation has continued to create opportunities for wealth creation. Keeping this backdrop in mind, we remain focused on investing in shares of reasonably valued companies that we judge to have superior relative growth potential.
Thank you for your continued investment in the Invesco Technology Fund.
| 1 | Source: US Federal Reserve |
| 2 | Source: US Bureau of Labor Statistics |
| 4 | Source: Morningstar Direct |
Portfolio manager(s):
Ash Shah
The views and opinions expressed in management’s discussion of Fund performance are those of Invesco Advisers, Inc. and its affiliates. These views and opinions are subject to change at any time based on factors such as market and economic conditions. These views and opinions may not be relied upon as investment advice or recommendations, or as an offer for a particular security. The information is not a complete analysis of every aspect of any market, country, industry, security or the Fund. Statements of fact are from sources considered reliable, but Invesco Advisers, Inc. makes no representation or warranty as to their completeness or accuracy. Although historical performance is no guarantee of future results, these insights may help you understand our investment management philosophy.
See important Fund and, if applicable, index disclosures later in this report.
3 Invesco Technology Fund
Your Fund’s Long-Term Performance
Results of a $10,000 Investment – Oldest Share Class(es)
Fund and index data from 4/30/14
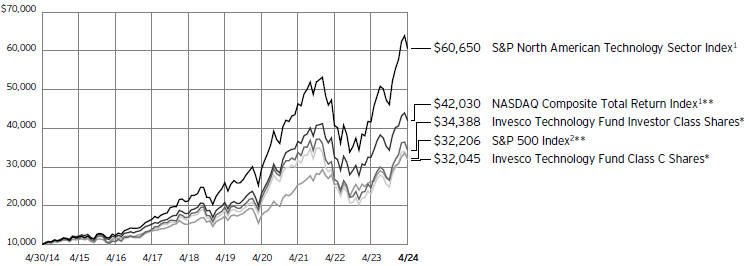
| 2 | Source: RIMES Technologies Corp. |
| * | It is Invesco’s policy to chart the Fund’s oldest share class(es). Because Investor Class shares do not have a sales charge, we also show the oldest share class with a sales charge, Class C shares. |
| ** | Effective August 28, 2023, the Fund changed its broad-based securities market benchmark from the NASDAQ Composite Total Return Index to the S&P 500 Index. The Fund believes the S&P 500 Index is an appropriate benchmark for evaluating the Fund’s performance against the overall applicable market. |
Past performance cannot guarantee future results.
The data shown in the chart include reinvested distributions, applicable sales charges and Fund expenses including management
fees. Index results include reinvested dividends, but they do not reflect sales charges. Performance of the peer group, if applicable, reflects fund expenses and management fees;
performance of a market index does not. Performance shown in the chart does not reflect deduction of taxes a shareholder would pay on Fund distributions or sale of Fund shares.
4 Invesco Technology Fund
| | | | |
| |
Average Annual Total Returns | |
As of 4/30/24, including maximum applicable sales charges | |
Class A Shares | | | | |
Inception (3/28/02) | | | 7.07 | % |
10 Years | | | 12.39 | |
5 Years | | | 10.50 | |
1 Year | | | 31.80 | |
| |
Class C Shares | | | | |
Inception (2/14/00) | | | 1.63 | % |
10 Years | | | 12.35 | |
5 Years | | | 10.91 | |
1 Year | | | 37.42 | |
| |
Class Y Shares | | | | |
Inception (10/3/08) | | | 13.48 | % |
10 Years | | | 13.31 | |
5 Years | | | 12.02 | |
1 Year | | | 39.80 | |
| |
Investor Class Shares | | | | |
Inception (1/19/84) | | | 10.56 | % |
10 Years | | | 13.15 | |
5 Years | | | 11.87 | |
1 Year | | | 39.64 | |
| |
Class R5 Shares | | | | |
Inception (12/21/98) | | | 6.92 | % |
10 Years | | | 13.49 | |
5 Years | | | 12.11 | |
1 Year | | | 39.91 | |
| |
Class R6 Shares | | | | |
10 Years | | | 13.35 | % |
5 Years | | | 12.18 | |
1 Year | | | 40.00 | |
Class R6 shares incepted on April 4, 2017. Performance shown prior to that date is that of Class A shares at net asset value and includes the 12b-1 fees applicable to Class A shares.
The performance data quoted represent past performance and cannot guarantee future results; current performance may be lower or higher. Please visit invesco.com/performance for the most recent month-end performance. Performance figures reflect reinvested distributions, changes in net asset value and the effect of the maximum sales charge unless otherwise stated. Performance figures do not reflect deduction of taxes a shareholder would pay on Fund distributions or sale of Fund shares. Investment return and principal value will fluctuate so that you may have a gain or loss when you sell shares.
Class A share performance reflects the maximum 5.50% sales charge, and Class C share performance reflects the applicable contingent deferred sales charge (CDSC) for the period involved. The CDSC on Class C shares is 1% for the first year after purchase. Class Y, Investor Class, Class R5 and Class R6 shares do not have a front-end sales charge or a CDSC; therefore, performance is at net asset value.
The performance of the Fund’s share classes will differ primarily due to different sales charge structures and class expenses.
Fund performance reflects any applicable fee waivers and/or expense reimbursements. Had the adviser not waived fees and/or reimbursed expenses currently or in the past, returns would have been lower. See current prospectus for more information.
5 Invesco Technology Fund
Supplemental Information
Invesco Technology Fund’s investment objective is long-term growth of capital.
| ∎ | Unless otherwise stated, information presented in this report is as of April 30, 2024, and is based on total net assets. |
| ∎ | Unless otherwise noted, all data is provided by Invesco. |
| ∎ | To access your Fund’s reports/prospectus, visit invesco.com/fundreports. |
About indexes used in this report
| ∎ | The NASDAQ Composite Total Return Index is a broad-based, market index of the common stocks and similar securities listed on the Nasdaq stock market. |
| ∎ | The S&P 500® Index is an unmanaged index considered representative of the US stock market. |
| ∎ | The S&P North American Technology Sector Index represents US securities classified under the GICS® information technology sector as well as the internet & direct marketing retail, interactive home entertainment, and interactive media and services sub-industries. |
| ∎ | The Fund is not managed to track the performance of any particular index, including the index(es) described here, and consequently, the performance of the Fund may deviate significantly from the performance of the index(es). |
| ∎ | A direct investment cannot be made in an index. Unless otherwise indicated, index results include reinvested dividends, and they do not reflect sales charges. Performance of the peer group, if applicable, reflects fund expenses; performance of a market index does not. |
Liquidity Risk Management Program
In compliance with Rule 22e-4 under the Investment Company Act of 1940, as amended (the “Liquidity Rule”), the Fund has adopted and implemented a liquidity risk management program in accordance with the Liquidity Rule (the “Program”). The Program is reasonably designed to assess and manage the Fund’s liquidity risk, which is the risk that the Fund could not meet redemption requests without significant dilution of remaining investors’ interests in the Fund. The Board of Trustees of the Fund (the “Board”) has appointed Invesco Advisers, Inc. (“Invesco”), the Fund’s investment adviser, as the Program’s administrator, and Invesco has delegated oversight of the Program to the Liquidity Risk Management Committee (the “Committee”), which is composed of senior representatives from relevant business groups at Invesco.
As required by the Liquidity Rule, the Program includes policies and procedures
providing for an assessment, no less frequently than annually, of the Fund’s liquidity risk that takes into account, as relevant to the Fund’s liquidity risk: (1) the Fund’s investment strategy and liquidity of portfolio investments during both normal and reasonably foreseeable stressed conditions; (2) short-term and long-term cash flow projections for the Fund during both normal and reasonably foreseeable stressed conditions; and (3) the Fund’s holdings of cash and cash equivalents and any borrowing arrangements. The Liquidity Rule also requires the classification of the Fund’s investments into categories that reflect the assessment of their relative liquidity under current market conditions. The Fund classifies its investments into one of four categories defined in the Liquidity Rule: “Highly Liquid,” “Moderately Liquid,” “Less Liquid,” and “Illiquid.” Funds that are not invested primarily in “Highly Liquid Investments” that are assets (cash or investments that are reasonably expected to be convertible into cash within three business days without significantly changing the market value of the investment) are required to establish a “Highly Liquid Investment Minimum” (“HLIM”), which is the minimum percentage of net assets that must be invested in Highly Liquid Investments. Funds with HLIMs have procedures for addressing HLIM shortfalls, including reporting to the Board and the SEC (on a non-public basis) as required by the Program and the Liquidity Rule. In addition, the Fund may not acquire an investment if, immediately after the acquisition, over 15% of the Fund’s net assets would consist of “Illiquid Investments” that are assets (an investment that cannot reasonably be expected to be sold or disposed of in current market conditions in seven calendar days or less without the sale or disposition significantly changing the market value of the investment). The Liquidity Rule and the Program also require reporting to the Board and the SEC (on a non-public basis) if a Fund’s holdings of Illiquid Investments exceed 15% of the Fund’s assets.
At a meeting held on March 25-27, 2024, the Committee presented a report to the Board that addressed the operation of the Program and assessed the Program’s
adequacy and effectiveness of implementation (the “Report”). The Report covered the period from January 1, 2023 through December 31, 2023 (the “Program Reporting Period”). The Report discussed notable events affecting liquidity over the Program Reporting Period, including the impact of the end of an aggressive rate hike cycle, signs that inflation was abating and market liquidity was reverting to normal, and the overall market. The Report noted that there were no material changes to the Program during the Program Reporting Period.
The Report stated, in relevant part, that during the Program Reporting Period:
| ∎ | The Program, as adopted and implemented, remained reasonably designed to assess and manage the Fund’s liquidity risk and was operated effectively to achieve that goal; |
| ∎ | The Fund’s investment strategy remained appropriate for an open-end fund; |
| ∎ | The Fund was able to meet requests for redemption without significant dilution of remaining investors’ interests in the Fund; |
| ∎ | The Fund did not breach the 15% limit on Illiquid Investments; and |
| ∎ | The Fund primarily held Highly Liquid Investments and therefore has not adopted an HLIM. |
|
|
This report must be accompanied or preceded by a currently effective Fund prospectus, which contains more complete information, including sales charges and expenses. Investors should read it carefully before investing. |
|
|
| NOT FDIC INSURED | MAY LOSE VALUE | NO BANK GUARANTEE |
6 Invesco Technology Fund
Fund Information
Portfolio Composition
| | |
| By sector | | % of total net assets |
| |
Information Technology | | 65.50% |
Communication Services | | 11.71 |
Consumer Discretionary | | 7.79 |
Industrials | | 7.55 |
Health Care | | 3.16 |
Financials | | 3.06 |
Money Market Funds Plus Other Assets Less Liabilities | | 1.23 |
Top 10 Equity Holdings*
| | | | | | |
| | | | | | % of total net assets |
| | |
| | 1. | | | NVIDIA Corp. | | 8.34% |
| | 2. | | | Microsoft Corp. | | 6.22 |
| | 3. | | | Amazon.com, Inc. | | 4.34 |
| | 4. | | | Broadcom, Inc. | | 4.10 |
| | 5. | | | Alphabet, Inc., Class A | | 3.56 |
| | 6. | | | Advanced Micro Devices, Inc. | | 2.85 |
| | 7. | | | Lam Research Corp. | | 2.71 |
| | 8. | | | HubSpot, Inc. | | 2.53 |
| | 9. | | | Meta Platforms, Inc., Class A | | 2.48 |
| | 10. | | | ServiceNow, Inc. | | 2.33 |
The Fund’s holdings are subject to change, and there is no assurance that the Fund will continue to hold any particular security.
* Excluding money market fund holdings, if any.
Data presented here are as of April 30, 2024.
7 Invesco Technology Fund
Schedule of Investments(a)
April 30, 2024
| | | | | | | | |
| | | Shares | | | Value | |
| |
Common Stocks & Other Equity Interests–98.77% | |
Advertising–1.26% | | | | | | | | |
Trade Desk, Inc. (The), Class A(b) | | | 233,392 | | | $ | 19,336,527 | |
| |
| | |
Aerospace & Defense–2.54% | | | | | | | | |
Axon Enterprise, Inc.(b) | | | 60,984 | | | | 19,128,242 | |
| |
TransDigm Group, Inc. | | | 15,942 | | | | 19,896,094 | |
| |
| | | | | | | 39,024,336 | |
| |
| | |
Application Software–12.90% | | | | | | | | |
Braze, Inc., Class A(b) | | | 153,162 | | | | 6,417,488 | |
| |
Cadence Design Systems, Inc.(b) | | | 106,732 | | | | 29,418,541 | |
| |
Datadog, Inc., Class A(b) | | | 183,736 | | | | 23,058,868 | |
| |
Guidewire Software, Inc.(b) | | | 70,174 | | | | 7,747,210 | |
| |
HubSpot, Inc.(b) | | | 64,084 | | | | 38,762,489 | |
| |
Informatica, Inc., Class A(b)(c) | | | 493,061 | | | | 15,270,099 | |
| |
Manhattan Associates, Inc.(b) | | | 62,064 | | | | 12,788,908 | |
| |
Nutanix, Inc., Class A(b) | | | 385,322 | | | | 23,389,044 | |
| |
PTC, Inc.(b) | | | 65,858 | | | | 11,685,844 | |
| |
Samsara, Inc., Class A(b) | | | 643,433 | | | | 22,475,115 | |
| |
Sprout Social, Inc., Class A(b)(c) | | | 140,961 | | | | 7,111,482 | |
| |
| | | | | | | 198,125,088 | |
| |
|
Asset Management & Custody Banks–0.99% | |
KKR & Co., Inc., Class A | | | 164,122 | | | | 15,274,835 | |
| |
| | |
Broadline Retail–5.18% | | | | | | | | |
Amazon.com, Inc.(b) | | | 380,770 | | | | 66,634,750 | |
| |
MercadoLibre, Inc. (Brazil)(b) | | | 8,828 | | | | 12,877,404 | |
| |
| | | | | | | 79,512,154 | |
| |
| | |
Casinos & Gaming–1.03% | | | | | | | | |
DraftKings, Inc., Class A(b) | | | 381,286 | | | | 15,846,246 | |
| |
| |
Communications Equipment–1.77% | | | | | |
Arista Networks, Inc.(b) | | | 105,738 | | | | 27,128,141 | |
| |
|
Construction & Engineering–0.82% | |
Comfort Systems USA, Inc. | | | 40,938 | | | | 12,666,627 | |
| |
| | |
Education Services–0.70% | | | | | | | | |
Duolingo, Inc.(b)(c) | | | 47,622 | | | | 10,750,666 | |
| |
|
Electrical Components & Equipment–2.02% | |
Eaton Corp. PLC | | | 57,398 | | | | 18,267,487 | |
| |
Vertiv Holdings Co., Class A | | | 136,712 | | | | 12,714,216 | |
| |
| | | | | | | 30,981,703 | |
| |
| | |
Electronic Components–0.75% | | | | | | | | |
Coherent Corp.(b) | | | 212,417 | | | | 11,604,341 | |
| |
| | |
Health Care Equipment–2.34% | | | | | | | | |
Boston Scientific Corp.(b) | | | 177,992 | | | | 12,792,285 | |
| |
DexCom, Inc.(b) | | | 124,392 | | | | 15,846,297 | |
| |
Intuitive Surgical, Inc.(b) | | | 19,507 | | | | 7,229,684 | |
| |
| | | | | | | 35,868,266 | |
| |
|
Industrial Machinery & Supplies & Components–1.07% | |
Parker-Hannifin Corp. | | | 30,258 | | | | 16,487,887 | |
| |
| | | | | | | | |
| | | Shares | | | Value | |
| |
Interactive Home Entertainment–1.27% | | | | | |
Take-Two Interactive Software, Inc.(b) | | | 136,672 | | | $ | 19,518,128 | |
| |
| |
Interactive Media & Services–6.04% | | | | | |
Alphabet, Inc., Class A(b) | | | 335,635 | | | | 54,634,665 | |
| |
Meta Platforms, Inc., Class A | | | 88,645 | | | | 38,132,420 | |
| |
| | | | | | | 92,767,085 | |
| |
| |
Internet Services & Infrastructure–5.33% | | | | | |
Cloudflare, Inc., Class A(b) | | | 255,333 | | | | 22,316,104 | |
| |
MongoDB, Inc.(b) | | | 75,487 | | | | 27,566,343 | |
| |
Shopify, Inc., Class A (Canada)(b) | | | 253,315 | | | | 17,782,713 | |
| |
Snowflake, Inc., Class A(b) | | | 91,452 | | | | 14,193,350 | |
| |
| | | | | | | 81,858,510 | |
| |
| | |
Movies & Entertainment–3.14% | | | | | | | | |
Netflix, Inc.(b) | | | 52,269 | | | | 28,781,402 | |
| |
Spotify Technology S.A. (Sweden)(b) | | | 69,089 | | | | 19,375,319 | |
| |
| | | | | | | 48,156,721 | |
| |
| |
Passenger Ground Transportation–1.10% | | | | | |
Uber Technologies, Inc.(b) | | | 254,378 | | | | 16,857,630 | |
| |
| | |
Pharmaceuticals–0.82% | | | | | | | | |
Eli Lilly and Co. | | | 16,196 | | | | 12,650,696 | |
| |
| | |
Restaurants–0.88% | | | | | | | | |
DoorDash, Inc., Class A(b) | | | 104,269 | | | | 13,477,811 | |
| |
|
Semiconductor Materials & Equipment–7.08% | |
Applied Materials, Inc. | | | 69,978 | | | | 13,901,130 | |
| |
ASML Holding N.V., New York Shares (Netherlands) | | | 39,220 | | | | 34,218,273 | |
| |
Entegris, Inc. | | | 143,830 | | | | 19,117,884 | |
| |
Lam Research Corp. | | | 46,444 | | | | 41,539,978 | |
| |
| | | | | | | 108,777,265 | |
| |
| | |
Semiconductors–22.44% | | | | | | | | |
Advanced Micro Devices, Inc.(b) | | | 276,386 | | | | 43,774,015 | |
| |
Allegro MicroSystems, Inc.
(Japan)(b)(c) | | | 308,591 | | | | 9,162,067 | |
| |
Astera Labs, Inc.(b)(c) | | | 68,406 | | | | 5,798,093 | |
| |
Broadcom, Inc. | | | 48,439 | | | | 62,983,778 | |
| |
Lattice Semiconductor Corp.(b) | | | 255,710 | | | | 17,541,706 | |
| |
Microchip Technology, Inc. | | | 126,375 | | | | 11,623,972 | |
| |
Monolithic Power Systems, Inc. | | | 42,932 | | | | 28,735,676 | |
| |
NVIDIA Corp. | | | 148,281 | | | | 128,117,750 | |
| |
NXP Semiconductors N.V. (China) | | | 101,828 | | | | 26,087,315 | |
| |
Silicon Laboratories, Inc.(b)(c) | | | 88,154 | | | | 10,709,829 | |
| |
| | | | | | | 344,534,201 | |
| |
| | |
Systems Software–13.11% | | | | | | | | |
CrowdStrike Holdings, Inc., Class A(b) | | | 88,463 | | | | 25,878,966 | |
| |
CyberArk Software Ltd.(b)(c) | | | 76,716 | | | | 18,354,303 | |
| |
GitLab, Inc., Class A(b) | | | 286,165 | | | | 15,015,078 | |
| |
JFrog Ltd. (Israel)(b) | | | 274,364 | | | | 10,941,636 | |
| |
Microsoft Corp. | | | 245,311 | | | | 95,506,932 | |
| |
ServiceNow, Inc.(b) | | | 51,467 | | | | 35,683,615 | |
| |
| | | | | | | 201,380,530 | |
| |
See accompanying Notes to Financial Statements which are an integral part of the financial statements.
8 Invesco Technology Fund
| | | | | | | | |
| | | Shares | | | Value | |
| |
Technology Hardware, Storage & Peripherals–2.12% | |
Apple, Inc. | | | 168,296 | | | $ | 28,665,858 | |
| |
Pure Storage, Inc., Class A(b) | | | 75,986 | | | | 3,829,694 | |
| |
| | | | | | | 32,495,552 | |
| |
|
Transaction & Payment Processing Services–2.07% | |
Mastercard, Inc., Class A | | | 37,164 | | | | 16,768,397 | |
| |
Visa, Inc., Class A | | | 55,804 | | | | 14,989,512 | |
| |
| | | | | | | 31,757,909 | |
| |
Total Common Stocks & Other Equity Interests
(Cost $978,550,539) | | | | 1,516,838,855 | |
| |
| |
Money Market Funds–1.46% | | | | | |
Invesco Government & Agency Portfolio, Institutional Class, 5.23%(d)(e) | | | 7,675,266 | | | | 7,675,266 | |
| |
Invesco Liquid Assets Portfolio, Institutional Class, 5.34%(d)(e) | | | 5,908,958 | | | | 5,910,731 | |
| |
Invesco Treasury Portfolio, Institutional Class, 5.22%(d)(e) | | | 8,771,733 | | | | 8,771,733 | |
| |
Total Money Market Funds
(Cost $22,357,302) | | | | 22,357,730 | |
| |
TOTAL INVESTMENTS IN SECURITIES
(excluding investments purchased with cash collateral from securities on loan)-100.23%
(Cost $1,000,907,841) | | | | | | | 1,539,196,585 | |
| |
| | | | | | | | |
| | | Shares | | | Value | |
| |
Investments Purchased with Cash Collateral from Securities on Loan | |
Money Market Funds–2.98% | | | | | | | | |
Invesco Private Government Fund, 5.29%(d)(e)(f) | | | 12,817,034 | | | $ | 12,817,034 | |
| |
Invesco Private Prime Fund, 5.46%(d)(e)(f) | | | 32,955,694 | | | | 32,965,581 | |
| |
Total Investments Purchased with Cash Collateral from Securities on Loan
(Cost $45,784,777) | | | | 45,782,615 | |
| |
TOTAL INVESTMENTS IN SECURITIES–103.21%
(Cost $1,046,692,618) | | | | 1,584,979,200 | |
| |
OTHER ASSETS LESS LIABILITIES–(3.21)% | | | | (49,334,524 | ) |
| |
NET ASSETS–100.00% | | | $ | 1,535,644,676 | |
| |
Notes to Schedule of Investments:
| (a) | Industry and/or sector classifications used in this report are generally according to the Global Industry Classification Standard, which was developed by and is the exclusive property and a service mark of MSCI Inc. and Standard & Poor’s. |
| (b) | Non-income producing security. |
| (c) | All or a portion of this security was out on loan at April 30, 2024. |
| (d) | Affiliated holding. Affiliated holdings are investments in entities which are under common ownership or control of Invesco Ltd. or are investments in entities in which the Fund owns 5% or more of the outstanding voting securities. The table below shows the Fund’s transactions in, and earnings from, its investments in affiliates for the fiscal year ended April 30, 2024. |
| | | | | | | | | | | | | | | | | | | | | | | | | | | | | | | | | | | |
| | | Value
April 30, 2023 | | Purchases at Cost | | Proceeds from Sales | | Change in
Unrealized
Appreciation
(Depreciation) | | Realized
Gain
(Loss) | | Value
April 30, 2024 | | Dividend Income |
| Investments in Affiliated Money Market Funds: | | | | | | | | | | | | | | | | | | | | | | | | | | | | | | | | | | | |
Invesco Government & Agency Portfolio, Institutional Class | | | $ | 5,835,409 | | | | $ | 138,566,656 | | | | $ | (136,726,799 | ) | | | | $ - | | | | | $ - | | | | | $ 7,675,266 | | | | | $ 411,378 | |
Invesco Liquid Assets Portfolio, Institutional Class | | | | 4,597,308 | | | | | 98,976,183 | | | | | (97,662,000 | ) | | | | (562) | | | | | (198 | ) | | | | 5,910,731 | | | | | 320,245 | |
Invesco Treasury Portfolio, Institutional Class | | | | 6,669,039 | | | | | 158,361,893 | | | | | (156,259,199 | ) | | | | - | | | | | - | | | | | 8,771,733 | | | | | 462,589 | |
| Investments Purchased with Cash Collateral from Securities on Loan: | | | | | | | | | | | | | | | | | | | | | | | | | | | | | | | | | | | |
Invesco Private Government Fund | | | | 15,785,224 | | | | | 249,539,546 | | | | | (252,507,736 | ) | | | | - | | | | | - | | | | | 12,817,034 | | | | | 925,937* | |
Invesco Private Prime Fund | | | | 40,590,577 | | | | | 607,629,047 | | | | | (615,260,350 | ) | | | | (1,749) | | | | | 8,056 | | | | | 32,965,581 | | | | | 2,468,248* | |
Total | | | $ | 73,477,557 | | | | $ | 1,253,073,325 | | | | $ | (1,258,416,084 | ) | | | | $(2,311) | | | | | $7,858 | | | | | $68,140,345 | | | | | $4,588,397 | |
| | * | Represents the income earned on the investment of cash collateral, which is included in securities lending income on the Statement of Operations. Does not include rebates and fees paid to lending agent or premiums received from borrowers, if any. |
| (e) | The rate shown is the 7-day SEC standardized yield as of April 30, 2024. |
| (f) | The security has been segregated to satisfy the commitment to return the cash collateral received in securities lending transactions upon the borrower’s return of the securities loaned. See Note 1I. |
See accompanying Notes to Financial Statements which are an integral part of the financial statements.
9 Invesco Technology Fund
Statement of Assets and Liabilities
April 30, 2024
| | | | |
Assets: | | | | |
Investments in unaffiliated securities, at value
(Cost $978,550,539)* | | $ | 1,516,838,855 | |
| |
Investments in affiliated money market funds, at value (Cost $68,142,079) | | | 68,140,345 | |
| |
Foreign currencies, at value (Cost $524) | | | 502 | |
| |
Receivable for: | | | | |
Investments sold | | | 4,267,305 | |
| |
Fund shares sold | | | 595,088 | |
| |
Dividends | | | 365,656 | |
| |
Investment for trustee deferred compensation and retirement plans | | | 145,132 | |
| |
Other assets | | | 61,239 | |
| |
Total assets | | | 1,590,414,122 | |
| |
| |
Liabilities: | | | | |
Payable for: | | | | |
Investments purchased | | | 7,259,016 | |
| |
Dividends | | | 135 | |
| |
Fund shares reacquired | | | 706,799 | |
| |
Collateral upon return of securities loaned | | | 45,784,777 | |
| |
Accrued fees to affiliates | | | 771,755 | |
| |
Accrued other operating expenses | | | 90,761 | |
| |
Trustee deferred compensation and retirement plans | | | 156,203 | |
| |
Total liabilities | | | 54,769,446 | |
| |
Net assets applicable to shares outstanding | | $ | 1,535,644,676 | |
| |
| |
Net assets consist of: | | | | |
Shares of beneficial interest | | $ | 873,065,389 | |
| |
Distributable earnings | | | 662,579,287 | |
| |
| | $ | 1,535,644,676 | |
| |
| | | | |
Net Assets: | | | | |
Class A | | $ | 851,380,444 | |
| |
Class C | | $ | 44,011,983 | |
| |
Class Y | | $ | 52,613,126 | |
| |
Investor Class | | $ | 582,882,497 | |
| |
Class R5 | | $ | 753,471 | |
| |
Class R6 | | $ | 4,003,155 | |
| |
|
Shares outstanding, no par value, with an unlimited number of shares authorized: | |
Class A | | | 15,241,613 | |
| |
Class C | | | 1,230,013 | |
| |
Class Y | | | 903,326 | |
| |
Investor Class | | | 10,446,740 | |
| |
Class R5 | | | 10,205 | |
| |
Class R6 | | | 54,034 | |
| |
Class A: | | | | |
Net asset value per share | | $ | 55.86 | |
| |
Maximum offering price per share
(Net asset value of $55.86 ÷ 94.50%) | | $ | 59.11 | |
| |
Class C: | | | | |
Net asset value and offering price per share | | $ | 35.78 | |
| |
Class Y: | | | | |
Net asset value and offering price per share | | $ | 58.24 | |
| |
Investor Class: | | | | |
Net asset value and offering price per share | | $ | 55.80 | |
| |
Class R5: | | | | |
Net asset value and offering price per share | | $ | 73.83 | |
| |
Class R6: | | | | |
Net asset value and offering price per share | | $ | 74.09 | |
| |
| * | At April 30, 2024, securities with an aggregate value of $44,016,614 were on loan to brokers. |
See accompanying Notes to Financial Statements which are an integral part of the financial statements.
10 Invesco Technology Fund
Statement of Operations
For the year ended April 30, 2024
| | | | |
| |
Investment income: | | | | |
Dividends (net of foreign withholding taxes of $103,610) | | $ | 5,277,904 | |
| |
Dividends from affiliated money market funds (includes net securities lending income of $221,206) | | | 1,415,418 | |
| |
Total investment income | | | 6,693,322 | |
| |
| |
Expenses: | | | | |
Advisory fees | | | 8,491,039 | |
| |
Administrative services fees | | | 191,989 | |
| |
Custodian fees | | | 13,088 | |
| |
Distribution fees: | | | | |
Class A | | | 1,879,609 | |
| |
Class C | | | 383,572 | |
| |
Investor Class | | | 765,603 | |
| |
Transfer agent fees – A, C, Y and Investor | | | 2,215,941 | |
| |
Transfer agent fees – R5 | | | 582 | |
| |
Transfer agent fees – R6 | | | 1,035 | |
| |
Trustees’ and officers’ fees and benefits | | | 32,257 | |
| |
Registration and filing fees | | | 96,937 | |
| |
Reports to shareholders | | | 297,634 | |
| |
Professional services fees | | | 69,728 | |
| |
Other | | | 22,069 | |
| |
Total expenses | | | 14,461,083 | |
| |
Less: Fees waived and/or expense offset arrangement(s) | | | (104,414 | ) |
| |
Net expenses | | | 14,356,669 | |
| |
Net investment income (loss) | | | (7,663,347 | ) |
| |
| |
Realized and unrealized gain (loss) from: | | | | |
Net realized gain from: | | | | |
Unaffiliated investment securities | | | 164,956,878 | |
| |
Affiliated investment securities | | | 7,858 | |
| |
Foreign currencies | | | 14,492 | |
| |
| | | 164,979,228 | |
| |
Change in net unrealized appreciation (depreciation) of: | | | | |
Unaffiliated investment securities | | | 279,309,632 | |
| |
Affiliated investment securities | | | (2,311 | ) |
| |
Foreign currencies | | | (2,754 | ) |
| |
| | | 279,304,567 | |
| |
Net realized and unrealized gain | | | 444,283,795 | |
| |
Net increase in net assets resulting from operations | | $ | 436,620,448 | |
| |
See accompanying Notes to Financial Statements which are an integral part of the financial statements.
11 Invesco Technology Fund
Statement of Changes in Net Assets
For the years ended April 30, 2024 and 2023
| | | | | | | | |
| | | 2024 | | | 2023 | |
| |
Operations: | | | | | | | | |
Net investment income (loss) | | | $ (7,663,347 | ) | | | $ (4,267,208 | ) |
| |
Net realized gain (loss) | | | 164,979,228 | | | | (10,688,020 | ) |
| |
Change in net unrealized appreciation (depreciation) | | | 279,304,567 | | | | (96,060,092 | ) |
| |
Net increase (decrease) in net assets resulting from operations | | | 436,620,448 | | | | (111,015,320 | ) |
| |
| | |
Distributions to shareholders from distributable earnings: | | | | | | | | |
Class A | | | (6,204,547 | ) | | | (8,480,586 | ) |
| |
Class C | | | (487,678 | ) | | | (629,186 | ) |
| |
Class Y | | | (341,371 | ) | | | (481,970 | ) |
| |
Investor Class | | | (4,379,528 | ) | | | (6,284,245 | ) |
| |
Class R5 | | | (3,465 | ) | | | (5,774 | ) |
| |
Class R6 | | | (23,855 | ) | | | (20,093 | ) |
| |
Total distributions from distributable earnings | | | (11,440,444 | ) | | | (15,901,854 | ) |
| |
| | |
Share transactions–net: | | | | | | | | |
Class A | | | 18,962,945 | | | | (26,687,914 | ) |
| |
Class C | | | 3,386,005 | | | | (3,474,883 | ) |
| |
Class Y | | | 5,529,664 | | | | (7,558,270 | ) |
| |
Investor Class | | | (28,250,983 | ) | | | (21,571,417 | ) |
| |
Class R5 | | | 129,580 | | | | (19,449 | ) |
| |
Class R6 | | | 581,752 | | | | 1,021,731 | |
| |
Net increase (decrease) in net assets resulting from share transactions | | | 338,963 | | | | (58,290,202 | ) |
| |
Net increase (decrease) in net assets | | | 425,518,967 | | | | (185,207,376 | ) |
| |
| | |
Net assets: | | | | | | | | |
Beginning of year | | | 1,110,125,709 | | | | 1,295,333,085 | |
| |
End of year | | | $1,535,644,676 | | | | $1,110,125,709 | |
| |
See accompanying Notes to Financial Statements which are an integral part of the financial statements.
12 Invesco Technology Fund
Financial Highlights
The following schedule presents financial highlights for a share of the Fund outstanding throughout the periods indicated.
| | | | | | | | | | | | | | | | | | | | | | | | | | | | | | | | | | | | | | | | | | | | | | | | |
| | | Net asset value, beginning of period | | Net investment income (loss)(a) | | Net gains (losses) on securities (both realized and unrealized) | | Total from investment operations | | Distributions from net realized gains | | Net assets value, end of period | | Total return(b) | | Net assets, end of period (000’s omitted) | | Ratio of expenses to average net assets with fee waivers and/or expenses absorbed | | Ratio of expenses to average net assets without fee waivers and/or expenses absorbed | | Ratio of net investment income (loss) to average net assets | | Portfolio turnover (c) |
Class A | | | | | | | | | | | | | | | | | | | | | | | | | | | | | | | | | | | | | | | | | | | | | | | | |
Year ended 04/30/24 | | | $40.36 | | | | $(0.29 | ) | | | $16.20 | | | | $15.91 | | | | $(0.41 | ) | | | $55.86 | | | | 39.51 | % | | | $851,380 | | | | 1.07 | % | | | 1.08 | % | | | (0.58 | )% | | | 95 | % |
Year ended 04/30/23 | | | 44.73 | | | | (0.17 | ) | | | (3.63 | ) | | | (3.80 | ) | | | (0.57 | ) | | | 40.36 | | | | (8.37 | ) | | | 600,500 | | | | 1.13 | | | | 1.13 | | | | (0.43 | ) | | | 142 | |
Year ended 04/30/22 | | | 72.50 | | | | (0.49 | ) | | | (10.69 | ) | | | (11.18 | ) | | | (16.59 | ) | | | 44.73 | | | | (20.67 | ) | | | 695,429 | | | | 1.02 | | | | 1.02 | | | | (0.75 | ) | | | 95 | |
Year ended 04/30/21 | | | 50.35 | | | | (0.46 | ) | | | 27.38 | | | | 26.92 | | | | (4.77 | ) | | | 72.50 | | | | 54.37 | | | | 927,620 | | | | 1.10 | | | | 1.10 | | | | (0.71 | ) | | | 59 | |
Year ended 04/30/20 | | | 49.68 | | | | (0.29 | ) | | | 5.71 | | | | 5.42 | | | | (4.75 | ) | | | 50.35 | | | | 11.31 | | | | 572,351 | | | | 1.19 | | | | 1.19 | | | | (0.58 | ) | | | 38 | |
Class C | | | | | | | | | | | | | | | | | | | | | | | | | | | | | | | | | | | | | | | | | | | | | | | | |
Year ended 04/30/24 | | | 26.16 | | | | (0.43 | ) | | | 10.46 | | | | 10.03 | | | | (0.41 | ) | | | 35.78 | | | | 38.47 | | | | 44,012 | | | | 1.82 | | | | 1.83 | | | | (1.33 | ) | | | 95 | |
Year ended 04/30/23 | | | 29.46 | | | | (0.31 | ) | | | (2.42 | ) | | | (2.73 | ) | | | (0.57 | ) | | | 26.16 | | | | (9.08 | ) | | | 29,413 | | | | 1.88 | | | | 1.88 | | | | (1.18 | ) | | | 142 | |
Year ended 04/30/22 | | | 53.59 | | | | (0.68 | ) | | | (6.86 | ) | | | (7.54 | ) | | | (16.59 | ) | | | 29.46 | | | | (21.24 | )(d) | | | 37,022 | | | | 1.74 | (d) | | | 1.74 | (d) | | | (1.47 | )(d) | | | 95 | |
Year ended 04/30/21 | | | 38.38 | | | | (0.72 | ) | | | 20.70 | | | | 19.98 | | | | (4.77 | ) | | | 53.59 | | | | 53.20 | (d) | | | 56,566 | | | | 1.84 | (d) | | | 1.84 | (d) | | | (1.45 | )(d) | | | 59 | |
Year ended 04/30/20 | | | 39.21 | | | | (0.51 | ) | | | 4.43 | | | | 3.92 | | | | (4.75 | ) | | | 38.38 | | | | 10.47 | | | | 32,723 | | | | 1.94 | | | | 1.94 | | | | (1.33 | ) | | | 38 | |
Class Y | | | | | | | | | | | | | | | | | | | | | | | | | | | | | | | | | | | | | | | | | | | | | | | | |
Year ended 04/30/24 | | | 41.97 | | | | (0.18 | ) | | | 16.86 | | | | 16.68 | | | | (0.41 | ) | | | 58.24 | | | | 39.83 | | | | 52,613 | | | | 0.82 | | | | 0.83 | | | | (0.33 | ) | | | 95 | |
Year ended 04/30/23 | | | 46.37 | | | | (0.07 | ) | | | (3.76 | ) | | | (3.83 | ) | | | (0.57 | ) | | | 41.97 | | | | (8.14 | ) | | | 33,882 | | | | 0.88 | | | | 0.88 | | | | (0.18 | ) | | | 142 | |
Year ended 04/30/22 | | | 74.39 | | | | (0.34 | ) | | | (11.09 | ) | | | (11.43 | ) | | | (16.59 | ) | | | 46.37 | | | | (20.46 | ) | | | 46,149 | | | | 0.77 | | | | 0.77 | | | | (0.50 | ) | | | 95 | |
Year ended 04/30/21 | | | 51.45 | | | | (0.31 | ) | | | 28.02 | | | | 27.71 | | | | (4.77 | ) | | | 74.39 | | | | 54.75 | | | | 62,294 | | | | 0.85 | | | | 0.85 | | | | (0.46 | ) | | | 59 | |
Year ended 04/30/20 | | | 50.55 | | | | (0.17 | ) | | | 5.82 | | | | 5.65 | | | | (4.75 | ) | | | 51.45 | | | | 11.57 | | | | 36,341 | | | | 0.94 | | | | 0.94 | | | | (0.33 | ) | | | 38 | |
Investor Class | | | | | | | | | | | | | | | | | | | | | | | | | | | | | | | | | | | | | | | | | | | | | | | | |
Year ended 04/30/24 | | | 40.27 | | | | (0.24 | ) | | | 16.18 | | | | 15.94 | | | | (0.41 | ) | | | 55.80 | | | | 39.67 | (e) | | | 582,882 | | | | 0.96 | (e) | | | 0.97 | (e) | | | (0.47 | )(e) | | | 95 | |
Year ended 04/30/23 | | | 44.58 | | | | (0.12 | ) | | | (3.62 | ) | | | (3.74 | ) | | | (0.57 | ) | | | 40.27 | | | | (8.26 | )(e) | | | 443,544 | | | | 1.00 | (e) | | | 1.00 | (e) | | | (0.30 | )(e) | | | 142 | |
Year ended 04/30/22 | | | 72.24 | | | | (0.42 | ) | | | (10.65 | ) | | | (11.07 | ) | | | (16.59 | ) | | | 44.58 | | | | (20.59 | )(e) | | | 514,752 | | | | 0.91 | (e) | | | 0.91 | (e) | | | (0.64 | )(e) | | | 95 | |
Year ended 04/30/21 | | | 50.13 | | | | (0.39 | ) | | | 27.27 | | | | 26.88 | | | | (4.77 | ) | | | 72.24 | | | | 54.53 | (e) | | | 698,143 | | | | 1.00 | (e) | | | 1.00 | (e) | | | (0.61 | )(e) | | | 59 | |
Year ended 04/30/20 | | | 49.44 | | | | (0.24 | ) | | | 5.68 | | | | 5.44 | | | | (4.75 | ) | | | 50.13 | | | | 11.41 | (e) | | | 483,563 | | | | 1.09 | (e) | | | 1.09 | (e) | | | (0.48 | )(e) | | | 38 | |
Class R5 | | | | | | | | | | | | | | | | | | | | | | | | | | | | | | | | | | | | | | | | | | | | | | | | |
Year ended 04/30/24 | | | 53.08 | | | | (0.19 | ) | | | 21.35 | | | | 21.16 | | | | (0.41 | ) | | | 73.83 | | | | 39.93 | | | | 753 | | | | 0.77 | | | | 0.77 | | | | (0.28 | ) | | | 95 | |
Year ended 04/30/23 | | | 58.42 | | | | (0.05 | ) | | | (4.72 | ) | | | (4.77 | ) | | | (0.57 | ) | | | 53.08 | | | | (8.07 | ) | | | 453 | | | | 0.79 | | | | 0.79 | | | | (0.09 | ) | | | 142 | |
Year ended 04/30/22 | | | 89.51 | | | | (0.38 | ) | | | (14.12 | ) | | | (14.50 | ) | | | (16.59 | ) | | | 58.42 | | | | (20.43 | ) | | | 520 | | | | 0.72 | | | | 0.72 | | | | (0.45 | ) | | | 95 | |
Year ended 04/30/21 | | | 61.17 | | | | (0.32 | ) | | | 33.43 | | | | 33.11 | | | | (4.77 | ) | | | 89.51 | | | | 54.88 | | | | 794 | | | | 0.77 | | | | 0.77 | | | | (0.38 | ) | | | 59 | |
Year ended 04/30/20 | | | 59.18 | | | | (0.12 | ) | | | 6.86 | | | | 6.74 | | | | (4.75 | ) | | | 61.17 | | | | 11.74 | | | | 267 | | | | 0.81 | | | | 0.81 | | | | (0.20 | ) | | | 38 | |
Class R6 | | | | | | | | | | | | | | | | | | | | | | | | | | | | | | | | | | | | | | | | | | | | | | | | |
Year ended 04/30/24 | | | 53.22 | | | | (0.14 | ) | | | 21.42 | | | | 21.28 | | | | (0.41 | ) | | | 74.09 | | | | 40.05 | | | | 4,003 | | | | 0.70 | | | | 0.70 | | | | (0.21 | ) | | | 95 | |
Year ended 04/30/23 | | | 58.54 | | | | (0.01 | ) | | | (4.74 | ) | | | (4.75 | ) | | | (0.57 | ) | | | 53.22 | | | | (8.02 | ) | | | 2,334 | | | | 0.72 | | | | 0.72 | | | | (0.02 | ) | | | 142 | |
Year ended 04/30/22 | | | 89.60 | | | | (0.32 | ) | | | (14.15 | ) | | | (14.47 | ) | | | (16.59 | ) | | | 58.54 | | | | (20.37 | ) | | | 1,460 | | | | 0.65 | | | | 0.65 | | | | (0.38 | ) | | | 95 | |
Year ended 04/30/21 | | | 61.21 | | | | (0.29 | ) | | | 33.45 | | | | 33.16 | | | | (4.77 | ) | | | 89.60 | | | | 54.93 | | | | 1,647 | | | | 0.74 | | | | 0.74 | | | | (0.35 | ) | | | 59 | |
Year ended 04/30/20 | | | 59.20 | | | | (0.10 | ) | | | 6.86 | | | | 6.76 | | | | (4.75 | ) | | | 61.21 | | | | 11.77 | | | | 545 | | | | 0.77 | | | | 0.77 | | | | (0.16 | ) | | | 38 | |
| (a) | Calculated using average shares outstanding. |
| (b) | Includes adjustments in accordance with accounting principles generally accepted in the United States of America and as such, the net asset value for financial reporting purposes and the returns based upon those net asset values may differ from the net asset value and returns for shareholder transactions. Does not include sales charges and is not annualized for periods less than one year, if applicable. |
| (c) | Portfolio turnover is calculated at the fund level and is not annualized for periods less than one year, if applicable. For the year ended April 30, 2020, the portfolio turnover calculation excludes the value of securities purchased of $50,768,823 in the effort to realign the Fund’s portfolio holdings after the reorganization of Invesco Technology Sector Fund into the Fund. |
| (d) | The total return, ratio of expenses to average net assets and ratio of net investment income (loss) to average net assets reflect actual 12b-1 fees of 0.97% and 0.99% for the year ended April 30, 2022 and 2021, respectively. |
| (e) | The total return, ratio of expenses to average net assets and ratio of net investment income (loss) to average net assets reflect actual 12b-1 fees of 0.14%, 0.12%, 0.14%, 0.15% and 0.15% for the years ended April 30, 2024, 2023, 2022, 2021 and 2020, respectively. |
See accompanying Notes to Financial Statements which are an integral part of the financial statements.
13 Invesco Technology Fund
Notes to Financial Statements
April 30, 2024
NOTE 1–Significant Accounting Policies
Invesco Technology Fund (the “Fund”) is a series portfolio of AIM Sector Funds (Invesco Sector Funds) (the “Trust”). The Trust is a Delaware statutory trust registered under the Investment Company Act of 1940, as amended (the “1940 Act”), as an open-end series management investment company authorized to issue an unlimited number of shares of beneficial interest. Information presented in these financial statements pertains only to the Fund. Matters affecting the Fund or each class will be voted on exclusively by the shareholders of the Fund or each class.
The Fund’s investment objective is long-term growth of capital.
The Fund currently consists of six different classes of shares: Class A, Class C, Class Y, Investor Class, Class R5 and Class R6. Class Y and Investor Class shares are available only to certain investors. Class A shares are sold with a front-end sales charge unless certain waiver criteria are met and under certain circumstances load waived shares may be subject to contingent deferred sales charges (“CDSC”). Class C shares are sold with a CDSC. Class Y, Investor Class, Class R5 and Class R6 shares are sold at net asset value. Class C shares held for eight years after purchase are eligible for automatic conversion into Class A shares of the same Fund (the “Conversion Feature”). The automatic conversion pursuant to the Conversion Feature will generally occur at the end of the month following the eighth anniversary after a purchase of Class C shares.
The Fund is an investment company and accordingly follows the investment company accounting and reporting guidance in accordance with Financial Accounting Standards Board Accounting Standards Codification Topic 946, Financial Services – Investment Companies.
The following is a summary of the significant accounting policies followed by the Fund in the preparation of its financial statements.
| A. | Security Valuations – Securities, including restricted securities, are valued according to the following policy. |
A security listed or traded on an exchange is generally valued at its trade price or official closing price that day as of the close of the exchange where the security is principally traded, or lacking any trades or official closing price on a particular day, the security may be valued at the closing bid or ask price on that day. Securities traded in the over-the-counter market are valued based on prices furnished by independent pricing services or market makers. When such securities are valued using prices provided by an independent pricing service they may be considered fair valued. Futures contracts are valued at the daily settlement price set by an exchange on which they are principally traded. Where a final settlement price exists, exchange-traded options are valued at the final settlement price from the exchange where the option principally trades. Where a final settlement price does not exist, exchange-traded options are valued at the mean between the last bid and ask price generally from the exchange where the option principally trades.
Securities of investment companies that are not exchange-traded (e.g., open-end mutual funds) are valued using such company’s end-of-business-day net asset value per share.
Deposits, other obligations of U.S. and non-U.S. banks and financial institutions are valued at their daily account value.
Fixed income securities (including convertible debt securities) generally are valued on the basis of prices provided by independent pricing services. Prices provided by the pricing service may be determined without exclusive reliance on quoted prices, and may reflect appropriate factors such as institution-size trading in similar groups of securities, developments related to specific securities, dividend rate (for unlisted equities), yield (for debt obligations), quality, type of issue, coupon rate (for debt obligations), maturity (for debt obligations), individual trading characteristics and other market data. Pricing services generally value debt obligations assuming orderly transactions of institutional round lot size, but a fund may hold or transact in the same securities in smaller, odd lot sizes. Odd lots often trade at lower prices than institutional round lots, and their value may be adjusted accordingly. Debt obligations are subject to interest rate and credit risks. In addition, all debt obligations involve some risk of default with respect to interest and/or principal payments.
Foreign securities’ (including foreign exchange contracts) prices are converted into U.S. dollar amounts using the applicable exchange rates as of the close of the New York Stock Exchange (“NYSE”). If market quotations are available and reliable for foreign exchange-traded equity securities, the securities will be valued at the market quotations. Invesco Advisers, Inc. (the “Adviser” or “Invesco”) may use various pricing services to obtain market quotations as well as fair value prices. Because trading hours for certain foreign securities end before the close of the NYSE, closing market quotations may become not representative of market value in the Adviser’s judgment (“unreliable”). If, between the time trading ends on a particular security and the close of the customary trading session on the NYSE, a significant event occurs that makes the closing price of the security unreliable, the Adviser may fair value the security. If the event is likely to have affected the closing price of the security, the security will be valued at fair value in good faith in accordance with Board- approved policies and related Adviser procedures (“Valuation Procedures”). Adjustments to closing prices to reflect fair value may also be based on a screening process of an independent pricing service to indicate the degree of certainty, based on historical data, that the closing price in the principal market where a foreign security trades is not the current value as of the close of the NYSE. Foreign securities’ prices meeting the degree of certainty that the price is not reflective of current value will be priced at the indication of fair value from the independent pricing service. Multiple factors may be considered by the independent pricing service in determining adjustments to reflect fair value and may include information relating to sector indices, American Depositary Receipts and domestic and foreign index futures. Foreign securities may have additional risks including exchange rate changes, potential for sharply devalued currencies and high inflation, political and economic upheaval, the relative lack of issuer information, relatively low market liquidity and the potential lack of strict financial and accounting controls and standards.
Unlisted securities will be valued using prices provided by independent pricing services or by another method that the Adviser, in its judgment, believes better reflects the security’s fair value in accordance with the Valuation Procedures.
Non-traded rights and warrants shall be valued at intrinsic value if the terms of the rights and warrants are available, specifically the subscription or exercise price and the ratio. Intrinsic value is calculated as the daily market closing price of the security to be received less the subscription price, which is then adjusted by the exercise ratio. In the case of warrants, an option pricing model supplied by an independent pricing service may be used based on market data such as volatility, stock price and interest rate from the independent pricing service and strike price and exercise period from verified terms.
Securities for which market prices are not provided by any of the above methods may be valued based upon quotes furnished by independent sources. The mean between the last bid and ask prices may be used to value debt obligations, including corporate loans.
Securities for which market quotations are not readily available are fair valued by the Adviser in accordance with the Valuation Procedures. If a fair value price provided by a pricing service is unreliable, the Adviser will fair value the security using the Valuation Procedures. Issuer specific events, market trends, bid/ask quotes of brokers and information providers and other market data may be reviewed in the course of making a good faith determination of a security’s fair value.
The Fund may invest in securities that are subject to interest rate risk, meaning the risk that the prices will generally fall as interest rates rise and, conversely, the prices will generally rise as interest rates fall. Specific securities differ in their sensitivity to changes in interest rates depending on their individual characteristics. Changes in interest rates may result in increased market volatility, which may affect the value and/or liquidity of certain Fund investments.
Valuations change in response to many factors including the historical and prospective earnings of the issuer, the value of the issuer’s assets, general market conditions which are not specifically related to the particular issuer, such as real or perceived adverse economic conditions, changes in the general outlook for revenues or corporate earnings, changes in interest or currency rates, regional or global instability, natural or environmental disasters, widespread disease or other public health issues, war, acts of terrorism, significant governmental actions or adverse investor sentiment generally and market liquidity. Because of the inherent uncertainties of valuation, the values reflected in the financial statements may materially differ from the value received upon actual sale of those investments.
14 Invesco Technology Fund
The price the Fund could receive upon the sale of any investment may differ from the Adviser’s valuation of the investment, particularly for securities that are valued using a fair valuation technique. When fair valuation techniques are applied, the Adviser uses available information, including both observable and unobservable inputs and assumptions, to determine a methodology that will result in a valuation that the Adviser believes approximates market value. Fund securities that are fair valued may be subject to greater fluctuation in their value from one day to the next than would be the case if market quotations were used. Because of the inherent uncertainties of valuation, and the degree of subjectivity in such decisions, the Fund could realize a greater or lesser than expected gain or loss upon the sale of the investment.
| B. | Securities Transactions and Investment Income – Securities transactions are accounted for on a trade date basis. Realized gains or losses on sales are computed on the basis of specific identification of the securities sold. Interest income (net of withholding tax, if any) is recorded on an accrual basis from settlement date and includes coupon interest and amortization of premium and accretion of discount on debt securities as applicable. Pay-in-kind interest income and non-cash dividend income received in the form of securities in lieu of cash are recorded at the fair value of the securities received. Dividend income (net of withholding tax, if any) is recorded on the ex-dividend date. |
The Fund may periodically participate in litigation related to Fund investments. As such, the Fund may receive proceeds from litigation settlements. Any proceeds received are included in the Statement of Operations as realized gain (loss) for investments no longer held and as unrealized gain (loss) for investments still held.
Brokerage commissions and mark ups are considered transaction costs and are recorded as an increase to the cost basis of securities purchased and/or a reduction of proceeds on a sale of securities. Such transaction costs are included in the determination of net realized and unrealized gain (loss) from investment securities reported in the Statement of Operations and the Statement of Changes in Net Assets and the net realized and unrealized gains (losses) on securities per share in the Financial Highlights. Transaction costs are included in the calculation of the Fund’s net asset value and, accordingly, they reduce the Fund’s total returns. These transaction costs are not considered operating expenses and are not reflected in net investment income reported in the Statement of Operations and the Statement of Changes in Net Assets, or the net investment income per share and the ratios of expenses and net investment income reported in the Financial Highlights, nor are they limited by any expense limitation arrangements between the Fund and the investment adviser.
The Fund allocates income and realized and unrealized capital gains and losses to a class based on the relative net assets of each class.
| C. | Country Determination – For the purposes of making investment selection decisions and presentation in the Schedule of Investments, the investment adviser may determine the country in which an issuer is located and/or credit risk exposure based on various factors. These factors include the laws of the country under which the issuer is organized, where the issuer maintains a principal office, the country in which the issuer derives 50% or more of its total revenues, the country that has the primary market for the issuer’s securities and its “country of risk” as determined by a third party service provider, as well as other criteria. Among the other criteria that may be evaluated for making this determination are the country in which the issuer maintains 50% or more of its assets, the type of security, financial guarantees and enhancements, the nature of the collateral and the sponsor organization. Country of issuer and/or credit risk exposure has been determined to be the United States of America, unless otherwise noted. |
| D. | Distributions – Distributions from net investment income and net realized capital gain, if any, are generally declared and paid annually and recorded on the ex-dividend date. The Fund may elect to treat a portion of the proceeds from redemptions as distributions for federal income tax purposes. |
| E. | Federal Income Taxes – The Fund intends to comply with the requirements of Subchapter M of the Internal Revenue Code of 1986, as amended (the “Internal Revenue Code”), necessary to qualify as a regulated investment company and to distribute substantially all of the Fund’s taxable earnings to shareholders. As such, the Fund will not be subject to federal income taxes on otherwise taxable income (including net realized capital gain) that is distributed to shareholders. Therefore, no provision for federal income taxes is recorded in the financial statements. |
The Fund recognizes the tax benefits of uncertain tax positions only when the position is more likely than not to be sustained. Management has analyzed the Fund’s uncertain tax positions and concluded that no liability for unrecognized tax benefits should be recorded related to uncertain tax positions. Management is not aware of any tax positions for which it is reasonably possible that the total amounts of unrecognized tax benefits will change materially in the next 12 months.
The Fund files tax returns in the U.S. Federal jurisdiction and certain other jurisdictions. Generally, the Fund is subject to examinations by such taxing authorities for up to three years after the filing of the return for the tax period.
| F. | Expenses – Fees provided for under the Rule 12b-1 plan of a particular class of the Fund are charged to the operations of such class. Transfer agency fees and expenses and other shareholder recordkeeping fees and expenses attributable to Class R5 and Class R6 are allocated based on relative net assets of Class R5 and Class R6. Sub-accounting fees attributable to Class R5 are charged to the operations of the class. Transfer agency fees and expenses and other shareholder recordkeeping fees and expenses relating to all other classes are allocated among those classes based on relative net assets. All other expenses are allocated among the classes based on relative net assets. |
| G. | Accounting Estimates – The preparation of financial statements in conformity with accounting principles generally accepted in the United States of America (“GAAP”) requires management to make estimates and assumptions that affect the reported amounts of assets and liabilities at the date of the financial statements and the reported amounts of revenues and expenses during the reporting period including estimates and assumptions related to taxation. Actual results could differ from those estimates by a significant amount. In addition, the Fund monitors for material events or transactions that may occur or become known after the period-end date and before the date the financial statements are released to print. |
| H. | Indemnifications – Under the Trust’s organizational documents, each Trustee, officer, employee or other agent of the Trust is indemnified against certain liabilities that may arise out of the performance of their duties to the Fund. Additionally, in the normal course of business, the Fund enters into contracts, including the Fund’s servicing agreements, that contain a variety of indemnification clauses. The Fund’s maximum exposure under these arrangements is unknown as this would involve future claims that may be made against the Fund that have not yet occurred. The risk of material loss as a result of such indemnification claims is considered remote. |
| I. | Securities Lending – The Fund may lend portfolio securities having a market value up to one-third of the Fund’s total assets. Such loans are secured by collateral equal to no less than the market value of the loaned securities determined daily by the securities lending provider. Such collateral will be cash or debt securities issued or guaranteed by the U.S. Government or any of its sponsored agencies. Cash collateral received in connection with these loans is invested in short-term money market instruments or affiliated, unregistered investment companies that comply with Rule 2a-7 under the 1940 Act and money market funds (collectively, “affiliated money market funds”) and is shown as such on the Schedule of Investments. The Fund bears the risk of loss with respect to the investment of collateral. It is the Fund’s policy to obtain additional collateral from or return excess collateral to the borrower by the end of the next business day, following the valuation date of the securities loaned. Therefore, the value of the collateral held may be temporarily less than the value of the securities on loan. When loaning securities, the Fund retains certain benefits of owning the securities, including the economic equivalent of dividends or interest generated by the security. Lending securities entails a risk of loss to the Fund if, and to the extent that, the market value of the securities loaned were to increase and the borrower did not increase the collateral accordingly, and the borrower failed to return the securities. The securities loaned are subject to termination at the option of the borrower or the Fund. Upon termination, the borrower will return to the Fund the securities loaned and the Fund will return the collateral. Upon the failure of the borrower to return the securities, collateral may be liquidated and the securities may be purchased on the open market to replace the loaned securities. The Fund could experience delays and costs in gaining access to the collateral and the securities may lose value during the delay which could result in potential losses to the Fund. Some of these losses may be indemnified by the lending agent. The Fund bears the risk of any deficiency in the amount of the collateral available for return to the borrower due to any loss on the collateral invested. Dividends received on cash collateral investments for securities lending transactions, which are net of |
15 Invesco Technology Fund
| | compensation to counterparties, are included in Dividends from affiliated money market funds on the Statement of Operations. The aggregate value of securities out on loan, if any, is shown as a footnote on the Statement of Assets and Liabilities. |
The Adviser serves as an affiliated securities lending agent for the Fund. The Bank of New York Mellon also serves as a securities lending agent. To the extent the Fund utilizes the Adviser as an affiliated securities lending agent, the Fund conducts its securities lending in accordance with, and in reliance upon, no-action letters issued by the SEC staff that provide guidance on how an affiliate may act as a direct agent lender and receive compensation for those services in a manner consistent with the federal securities laws. For the year ended April 30, 2024, the Fund paid the Adviser $15,750 in fees for securities lending agent services. Fees paid to the Adviser for securities lending agent services, if any, are included in Dividends from affiliated money market funds on the Statement of Operations.
| J. | Foreign Currency Translations – Foreign currency is valued at the close of the NYSE based on quotations posted by banks and major currency dealers. Portfolio securities and other assets and liabilities denominated in foreign currencies are translated into U.S. dollar amounts at the date of valuation. Purchases and sales of portfolio securities (net of foreign taxes withheld on disposition) and income items denominated in foreign currencies are translated into U.S. dollar amounts on the respective dates of such transactions. The Fund does not separately account for the portion of the results of operations resulting from changes in foreign exchange rates on investments and the fluctuations arising from changes in market prices of securities held. The combined results of changes in foreign exchange rates and the fluctuation of market prices on investments (net of estimated foreign tax withholding) are included with the net realized and unrealized gain or loss from investments in the Statement of Operations. Reported net realized foreign currency gains or losses arise from (1) sales of foreign currencies, (2) currency gains or losses realized between the trade and settlement dates on securities transactions, and (3) the difference between the amounts of dividends, interest, and foreign withholding taxes recorded on the Fund’s books and the U.S. dollar equivalent of the amounts actually received or paid. Net unrealized foreign currency gains and losses arise from changes in the fair values of assets and liabilities, other than investments in securities at fiscal period end, resulting from changes in exchange rates. |
The Fund may invest in foreign securities, which may be subject to foreign taxes on income, gains on investments or currency repatriation, a portion of which may be recoverable. Foreign taxes, if any, are recorded based on the tax regulations and rates that exist in the foreign markets in which the Fund invests and are shown in the Statement of Operations.
The performance of the Fund may be materially affected positively or negatively by foreign currency strength or weakness relative to the U.S. dollar. Currency rates in foreign countries may fluctuate for a number of reasons, including changes in interest rates, political, economic, or social instability and development, and imposition of currency controls. Currency controls in certain foreign jurisdictions may cause the Fund to experience significant delays in its ability to repatriate its assets in U.S. dollars at quoted spot rates, and it is possible that the Fund’s ability to convert certain foreign currencies into U.S. dollars may be limited and may occur at discounts to quoted rates. As a result, the value of the Fund’s assets and liabilities denominated in such currencies that would ultimately be realized could differ from those reported on the Statement of Assets and Liabilities. Certain foreign companies may be subject to sanctions, embargoes, or other governmental actions that may limit the ability to invest in, receive, hold, or sell the securities of such companies, all of which affect the market and/or credit risk of the investments. Because of the inherent uncertainties of valuation, the values reflected in the financial statements may materially differ from the value received upon actual sale of those investments.
| K. | Forward Foreign Currency Contracts – The Fund may engage in foreign currency transactions either on a spot (i.e. for prompt delivery and settlement) basis, or through forward foreign currency contracts, to manage or minimize currency or exchange rate risk. |
The Fund may also enter into forward foreign currency contracts for the purchase or sale of a security denominated in a foreign currency in order to “lock in” the U.S. dollar price of that security, or the Fund may also enter into forward foreign currency contracts that do not provide for physical exchange of the two currencies on the settlement date, but instead are settled by a single cash payment calculated as the difference between the agreed upon exchange rate and the spot rate at settlement based upon an agreed upon notional amount (non-deliverable forwards).
A forward foreign currency contract is an obligation between two parties (“Counterparties”) to purchase or sell a specific currency for an agreed-upon price at a future date. The use of forward foreign currency contracts for hedging does not eliminate fluctuations in the price of the underlying securities the Fund owns or intends to acquire but establishes a rate of exchange in advance. Fluctuations in the value of these contracts are measured by the difference in the contract date and reporting date exchange rates and are recorded as unrealized appreciation (depreciation) until the contracts are closed. When the contracts are closed, realized gains (losses) are recorded. Realized and unrealized gains (losses) on the contracts are included in the Statement of Operations. The primary risks associated with forward foreign currency contracts include failure of the Counterparty to meet the terms of the contract and the value of the foreign currency changing unfavorably. These risks may be in excess of the amounts reflected in the Statement of Assets and Liabilities.
| L. | Other Risks – The Fund’s investments are concentrated in a comparatively narrow segment of the economy, which may make the Fund more volatile. |
Many products and services offered in technology-related industries are subject to rapid obsolescence, which may lower the value of the issuers in this sector.
The Fund is non-diversified and may invest in securities of fewer issuers than if it were diversified. Thus, the value of the Fund’s shares may vary more widely and the Fund may be subject to greater market and credit risk than if the Fund invested more broadly.
Active trading of portfolio securities may result in added expenses, a lower return and increased tax liability.
NOTE 2–Advisory Fees and Other Fees Paid to Affiliates
The Trust has entered into a master investment advisory agreement with the Adviser. Under the terms of the investment advisory agreement, the Fund accrues daily and pays monthly an advisory fee to the Adviser based on the annual rate of the Fund’s average daily net assets as follows:
| | | | |
| Average Daily Net Assets | | Rate |
First $500 million | | 0.670% |
Next $500 million | | 0.640% |
Next $1 billion | | 0.520% |
Next $2 billion | | 0.450% |
Next $2 billion | | 0.400% |
Next $2 billion | | 0.375% |
Over $8 billion | | 0.350% |
For the year ended April 30, 2024, the effective advisory fee rate incurred by the Fund was 0.62%.
Under the terms of a master sub-advisory agreement between the Adviser and each of Invesco Asset Management Deutschland GmbH, Invesco Asset Management Limited, Invesco Asset Management (Japan) Limited, Invesco Hong Kong Limited, Invesco Senior Secured Management, Inc. and Invesco Canada Ltd. (collectively, the “Affiliated Sub-Advisers”) the Adviser, not the Fund, will pay 40% of the fees paid to the Adviser to any such Affiliated Sub-Adviser(s) that provide(s) discretionary investment management services to the Fund based on the percentage of assets allocated to such Affiliated Sub-Adviser(s).
Effective July 1, 2023, the Adviser has agreed, for an indefinite period, to waive advisory fees and/or reimburse expenses of all shares to the extent necessary to limit total annual fund operating expenses after fee waiver and/or expense reimbursement (excluding certain items discussed below) of Class A, Class C, Class Y, Investor Class, Class R5 and Class R6 shares to 2.00%, 2.75%, 1.75%, 2.00%, 1.75% and 1.75%, respectively, of the Fund’s average daily net assets (the “boundary limits”). Prior to July 1, 2023, the same boundary limits were in effect with an expiration date of June 30, 2023. In determining the Adviser’s obligation
16 Invesco Technology Fund
to waive advisory fees and/or reimburse expenses, the following expenses are not taken into account, and could cause the total annual fund operating expenses after fee waiver and/or expense reimbursement to exceed the numbers reflected above: (1) interest; (2) taxes; (3) dividend expense on short sales; (4) extraordinary or non-routine items, including litigation expenses; and (5) expenses that the Fund has incurred but did not actually pay because of an expense offset arrangement. Invesco may amend and/or terminate these boundary limits at any time in its sole discretion and will inform the Board of Trustees of any such changes. The Adviser did not waive fees and/or reimburse expenses during the period under these boundary limits.
Further, the Adviser has contractually agreed, through at least June 30, 2025, to waive the advisory fee payable by the Fund in an amount equal to 100% of the net advisory fees the Adviser receives from the affiliated money market funds on investments by the Fund of uninvested cash (excluding investments of cash collateral from securities lending) in such affiliated money market funds.
For the year ended April 30, 2024, the Adviser waived advisory fees of $23,079.
The Trust has entered into a master administrative services agreement with Invesco pursuant to which the Fund has agreed to pay Invesco for certain administrative costs incurred in providing accounting services to the Fund. For the year ended April 30, 2024, expenses incurred under the agreement are shown in the Statement of Operations as Administrative services fees. Invesco has entered into a sub-administration agreement whereby State Street Bank and Trust Company (“SSB”) serves as fund accountant and provides certain administrative services to the Fund. Pursuant to a custody agreement with the Trust on behalf of the Fund, SSB also serves as the Fund’s custodian.
The Trust has entered into a transfer agency and service agreement with Invesco Investment Services, Inc. (“IIS”) pursuant to which the Fund has agreed to pay IIS a fee for providing transfer agency and shareholder services to the Fund and reimburse IIS for certain expenses incurred by IIS in the course of providing such services. IIS may make payments to intermediaries that provide omnibus account services, sub-accounting services and/or networking services. All fees payable by IIS to intermediaries that provide omnibus account services or sub-accounting services are charged back to the Fund, subject to certain limitations approved by the Trust’s Board of Trustees. For the year ended April 30, 2024, expenses incurred under the agreement are shown in the Statement of Operations as Transfer agent fees.
The Trust has entered into master distribution agreements with Invesco Distributors, Inc. (“IDI”) to serve as the distributor for the Class A, Class C, Class Y, Investor Class, Class R5 and Class R6 shares of the Fund. The Trust has adopted plans pursuant to Rule 12b-1 under the 1940 Act with respect to the Fund’s Class A, Class C and Investor Class shares (collectively, the “Plans”). The Fund, pursuant to the Plans, reimburses IDI for its allocated share of expenses incurred for the period, up to a maximum annual rate of 0.25% of the average daily net assets of Class A shares, up to 1.00% of the average daily net assets of Class C shares, and up to 0.25% of the average daily net assets of Investor Class shares. The fees are accrued daily and paid monthly. Of the Plans payments, up to 0.25% of the average daily net assets of each class of shares may be paid to furnish continuing personal shareholder services to customers who purchase and own shares of such classes. Any amounts not paid as a service fee under the Plans would constitute an asset-based sales charge. Rules of the Financial Industry Regulatory Authority (“FINRA”) impose a cap on the total sales charges, including asset-based sales charges, that may be paid by any class of shares of the Fund. For the year ended April 30, 2024, expenses incurred under the Plans are shown in the Statement of Operations as Distribution fees.
Front-end sales commissions and CDSC (collectively, the “sales charges”) are not recorded as expenses of the Fund. Front-end sales commissions are deducted from proceeds from the sales of Fund shares prior to investment in Class A shares of the Fund. CDSC are deducted from redemption proceeds prior to remittance to the shareholder. During the year ended April 30, 2024, IDI advised the Fund that IDI retained $151,261 in front-end sales commissions from the sale of Class A shares and $4,195 and $3,678 from Class A and Class C shares, respectively, for CDSC imposed upon redemptions by shareholders.
For the year ended April 30, 2024, the Fund incurred $21,859 in brokerage commissions with Invesco Capital Markets, Inc., an affiliate of the Adviser and IDI, for portfolio transactions executed on behalf of the Fund.
Certain officers and trustees of the Trust are officers and directors of the Adviser, IIS and/or IDI.
NOTE 3–Additional Valuation Information
GAAP defines fair value as the price that would be received to sell an asset or paid to transfer a liability in an orderly transaction between market participants at the measurement date, under current market conditions. GAAP establishes a hierarchy that prioritizes the inputs to valuation methods, giving the highest priority to readily available unadjusted quoted prices in an active market for identical assets (Level 1) and the lowest priority to significant unobservable inputs (Level 3), generally when market prices are not readily available. Based on the valuation inputs, the securities or other investments are tiered into one of three levels. Changes in valuation methods may result in transfers in or out of an investment’s assigned level:
| | | | |
Level | | 1 - | | Prices are determined using quoted prices in an active market for identical assets. |
Level | | 2 - | | Prices are determined using other significant observable inputs. Observable inputs are inputs that other market participants may use in pricing a security. These may include quoted prices for similar securities, interest rates, prepayment speeds, credit risk, yield curves, loss severities, default rates, discount rates, volatilities and others. |
Level | | 3 - | | Prices are determined using significant unobservable inputs. In situations where quoted prices or observable inputs are unavailable (for example, when there is little or no market activity for an investment at the end of the period), unobservable inputs may be used. Unobservable inputs reflect the Adviser’s assumptions about the factors market participants would use in determining fair value of the securities or instruments and would be based on the best available information. |
The following is a summary of the tiered valuation input levels, as of April 30, 2024. The level assigned to the securities valuations may not be an indication of the risk or liquidity associated with investing in those securities. Because of the inherent uncertainties of valuation, the values reflected in the financial statements may materially differ from the value received upon actual sale of those investments.
| | | | | | | | | | | | | | | | |
| | | Level 1 | | | Level 2 | | | Level 3 | | | Total | |
|
| |
Investments in Securities | | | | | | | | | | | | | | | | |
|
| |
Common Stocks & Other Equity Interests | | $ | 1,516,838,855 | | | $ | – | | | $ | – | | | $ | 1,516,838,855 | |
|
| |
Money Market Funds | | | 22,357,730 | | | | 45,782,615 | | | | – | | | | 68,140,345 | |
|
| |
Total Investments | | $ | 1,539,196,585 | | | $ | 45,782,615 | | | $ | – | | | $ | 1,584,979,200 | |
|
| |
NOTE 4–Expense Offset Arrangement(s)
The expense offset arrangement is comprised of transfer agency credits which result from balances in demand deposit accounts used by the transfer agent for clearing shareholder transactions. For the year ended April 30, 2024, the Fund received credits from this arrangement, which resulted in the reduction of the Fund’s total expenses of $81,335.
NOTE 5–Trustees’ and Officers’ Fees and Benefits
Trustees’ and Officers’ Fees and Benefits include amounts accrued by the Fund to pay remuneration to certain Trustees and Officers of the Fund. Trustees have the option to defer compensation payable by the Fund, and Trustees’ and Officers’ Fees and Benefits also include amounts accrued by the Fund to fund such deferred compensation amounts. Those Trustees who defer compensation have the option to select various Invesco Funds in which their deferral accounts shall be deemed to be
17 Invesco Technology Fund
invested. Finally, certain current Trustees were eligible to participate in a retirement plan that provided for benefits to be paid upon retirement to Trustees over a period of time based on the number of years of service. The Fund may have certain former Trustees who also participate in a retirement plan and receive benefits under such plan. Trustees’ and Officers’ Fees and Benefits include amounts accrued by the Fund to fund such retirement benefits. Obligations under the deferred compensation and retirement plans represent unsecured claims against the general assets of the Fund.
NOTE 6–Cash Balances
The Fund is permitted to temporarily carry a negative or overdrawn balance in its account with SSB, the custodian bank. Such balances, if any at period-end, are shown in the Statement of Assets and Liabilities under the payable caption Amount due custodian. To compensate the custodian bank for such overdrafts, the overdrawn Fund may either (1) leave funds as a compensating balance in the account so the custodian bank can be compensated by earning the additional interest; or (2) compensate by paying the custodian bank at a rate agreed upon by the custodian bank and Invesco, not to exceed the contractually agreed upon rate.
NOTE 7–Distributions to Shareholders and Tax Components of Net Assets
Tax Character of Distributions to Shareholders Paid During the Fiscal Years Ended April 30, 2024 and 2023:
| | | | | | | | |
| | | 2024 | | | 2023 | |
|
| |
Ordinary income* | | $ | 11,409,921 | | | $ | – | |
|
| |
Long-term capital gain | | | 30,523 | | | | 15,901,854 | |
|
| |
Total distributions | | $ | 11,440,444 | | | $ | 15,901,854 | |
|
| |
| * | Includes short-term capital gain distributions, if any. |
Tax Components of Net Assets at Period-End:
| | | | |
| | | 2024 | |
| |
Undistributed ordinary income | | $ | 25,918,522 | |
| |
Undistributed long-term capital gain | | | 101,957,853 | |
| |
Net unrealized appreciation – investments | | | 534,806,666 | |
| |
Net unrealized appreciation – foreign currencies | | | 1,452 | |
| |
Temporary book/tax differences | | | (105,206 | ) |
| |
Shares of beneficial interest | | | 873,065,389 | |
| |
Total net assets | | $ | 1,535,644,676 | |
| |
The difference between book-basis and tax-basis unrealized appreciation (depreciation) is due to differences in the timing of recognition of gains and losses on investments for tax and book purposes. The Fund’s net unrealized appreciation (depreciation) difference is attributable primarily to wash sales.
The temporary book/tax differences are a result of timing differences between book and tax recognition of income and/or expenses. The Fund’s temporary book/tax differences are the result of the trustee deferral of compensation and retirement plan benefits.
Capital loss carryforward is calculated and reported as of a specific date. Results of transactions and other activity after that date may affect the amount of capital loss carryforward actually available for the Fund to utilize. The ability to utilize capital loss carryforward in the future may be limited under the Internal Revenue Code and related regulations based on the results of future transactions.
The Fund does not have a capital loss carryforward as of April 30, 2024.
NOTE 8–Investment Transactions
The aggregate amount of investment securities (other than short-term securities, U.S. Government obligations and money market funds, if any) purchased and sold by the Fund during the year ended April 30, 2024 was $1,283,454,692 and $1,292,618,738, respectively. Cost of investments, including any derivatives, on a tax basis includes the adjustments for financial reporting purposes as of the most recently completed federal income tax reporting period-end.
| | | | |
Unrealized Appreciation (Depreciation) of Investments on a Tax Basis | |
Aggregate unrealized appreciation of investments | | | $552,917,384 | |
|
| |
Aggregate unrealized (depreciation) of investments | | | (18,110,718 | ) |
|
| |
Net unrealized appreciation of investments | | | $534,806,666 | |
|
| |
Cost of investments for tax purposes is $1,050,172,534.
NOTE 9–Reclassification of Permanent Differences
Primarily as a result of differing book/tax treatment of net operating losses, on April 30, 2024, undistributed net investment income (loss) was increased by $9,451,794 and undistributed net realized gain was decreased by $9,451,794. This reclassification had no effect on the net assets or the distributable earnings of the Fund.
18 Invesco Technology Fund
NOTE 10–Share Information
| | | | | | | | | | | | | | | | |
| | | Summary of Share Activity | |
| |
| | | Year ended | | | Year ended | |
| | | April 30, 2024(a) | | | April 30, 2023 | |
| | | Shares | | | Amount | | | Shares | | | Amount | |
| |
Sold: | | | | | | | | | | | | | | | | |
Class A | | | 2,275,560 | | | $ | 114,680,147 | | | | 1,492,652 | | | $ | 59,794,545 | |
| |
Class C | | | 472,700 | | | | 15,378,591 | | | | 326,522 | | | | 8,541,652 | |
| |
Class Y | | | 372,908 | | | | 20,170,829 | | | | 205,849 | | | | 8,636,636 | |
| |
Investor Class | | | 351,058 | | | | 17,420,207 | | | | 263,201 | | | | 10,511,644 | |
| |
Class R5 | | | 2,621 | | | | 193,118 | | | | 1,580 | | | | 79,272 | |
| |
Class R6 | | | 34,945 | | | | 2,224,268 | | | | 31,780 | | | | 1,681,803 | |
| |
| | | | |
Issued as reinvestment of dividends: | | | | | | | | | | | | | | | | |
Class A | | | 113,581 | | | | 5,864,120 | | | | 220,620 | | | | 8,039,076 | |
| |
Class C | | | 14,337 | | | | 475,541 | | | | 25,783 | | | | 610,811 | |
| |
Class Y | | | 5,629 | | | | 302,794 | | | | 11,153 | | | | 422,234 | |
| |
Investor Class | | | 79,533 | | | | 4,099,933 | | | | 163,393 | | | | 5,939,318 | |
| |
Class R5 | | | 46 | | | | 3,103 | | | | 109 | | | | 5,194 | |
| |
Class R6 | | | 308 | | | | 21,047 | | | | 403 | | | | 19,321 | |
| |
| | | | |
Automatic conversion of Class C shares to Class A shares: | | | | | | | | | | | | | | | | |
Class A | | | 90,608 | | | | 4,639,814 | | | | 70,604 | | | | 2,774,024 | |
| |
Class C | | | (140,700 | ) | | | (4,639,814 | ) | | | (108,110 | ) | | | (2,774,024 | ) |
| |
| | | | |
Reacquired: | | | | | | | | | | | | | | | | |
Class A | | | (2,116,553 | ) | | | (106,221,136 | ) | | | (2,451,473 | ) | | | (97,295,559 | ) |
| |
Class C | | | (240,558 | ) | | | (7,828,313 | ) | | | (376,717 | ) | | | (9,853,322 | ) |
| |
Class Y | | | (282,598 | ) | | | (14,943,959 | ) | | | (404,891 | ) | | | (16,617,140 | ) |
| |
Investor Class | | | (997,477 | ) | | | (49,771,123 | ) | | | (960,051 | ) | | | (38,022,379 | ) |
| |
Class R5 | | | (994 | ) | | | (66,641 | ) | | | (2,057 | ) | | | (103,915 | ) |
| |
Class R6 | | | (25,066 | ) | | | (1,663,563 | ) | | | (13,276 | ) | | | (679,393 | ) |
| |
Net increase (decrease) in share activity | | | 9,888 | | | $ | 338,963 | | | | (1,502,926 | ) | | $ | (58,290,202 | ) |
| |
| (a) | There are entities that are record owners of more than 5% of the outstanding shares of the Fund and in the aggregate own 22% of the outstanding shares of the Fund. IDI has an agreement with these entities to sell Fund shares. The Fund, Invesco and/or Invesco affiliates may make payments to these entities, which are considered to be related to the Fund, for providing services to the Fund, Invesco and/or Invesco affiliates including but not limited to services such as securities brokerage, distribution, third party record keeping and account servicing. The Fund has no knowledge as to whether all or any portion of the shares owned of record by these entities are also owned beneficially. |
19 Invesco Technology Fund
Report of Independent Registered Public Accounting Firm
To the Board of Trustees of AIM Sector Funds (Invesco Sector Funds) and Shareholders of Invesco Technology Fund
Opinion on the Financial Statements
We have audited the accompanying statement of assets and liabilities, including the schedule of investments, of Invesco Technology Fund (one of the funds constituting AIM Sector Funds (Invesco Sector Funds), referred to hereafter as the “Fund”) as of April 30, 2024, the related statement of operations for the year ended April 30, 2024, the statement of changes in net assets for each of the two years in the period ended April 30, 2024, including the related notes, and the financial highlights for each of the five years in the period ended April 30, 2024 (collectively referred to as the “financial statements”). In our opinion, the financial statements present fairly, in all material respects, the financial position of the Fund as of April 30, 2024, the results of its operations for the year then ended, the changes in its net assets for each of the two years in the period ended April 30, 2024 and the financial highlights for each of the five years in the period ended April 30, 2024 in conformity with accounting principles generally accepted in the United States of America.
Basis for Opinion
These financial statements are the responsibility of the Fund’s management. Our responsibility is to express an opinion on the Fund’s financial statements based on our audits. We are a public accounting firm registered with the Public Company Accounting Oversight Board (United States) (PCAOB) and are required to be independent with respect to the Fund in accordance with the U.S. federal securities laws and the applicable rules and regulations of the Securities and Exchange Commission and the PCAOB.
We conducted our audits of these financial statements in accordance with the standards of the PCAOB. Those standards require that we plan and perform the audit to obtain reasonable assurance about whether the financial statements are free of material misstatement, whether due to error or fraud.
Our audits included performing procedures to assess the risks of material misstatement of the financial statements, whether due to error or fraud, and performing procedures that respond to those risks. Such procedures included examining, on a test basis, evidence regarding the amounts and disclosures in the financial statements. Our audits also included evaluating the accounting principles used and significant estimates made by management, as well as evaluating the overall presentation of the financial statements. Our procedures included confirmation of securities owned as of April 30, 2024 by correspondence with the custodian, transfer agent and brokers. We believe that our audits provide a reasonable basis for our opinion.
/s/PricewaterhouseCoopers LLP
Houston, Texas
June 20, 2024
We have served as the auditor of one or more of the investment companies in the Invesco group of investment companies since at least 1995. We have not been able to determine the specific year we began serving as auditor.
20 Invesco Technology Fund
Calculating your ongoing Fund expenses
Example
As a shareholder of the Fund, you incur two types of costs: (1) transaction costs, which may include sales charges (loads) on purchase payments or contingent deferred sales charges on redemptions, if any; and (2) ongoing costs, including management fees, distribution and/or service (12b-1) fees, and other Fund expenses. This example is intended to help you understand your ongoing costs (in dollars) of investing in the Fund and to compare these costs with ongoing costs of investing in other mutual funds. The example is based on an investment of $1,000 invested at the beginning of the period and held for the entire period November 1, 2023 through April 30, 2024.
Actual expenses
The table below provides information about actual account values and actual expenses. You may use the information in this table, together with the amount you invested, to estimate the expenses that you paid over the period. Simply divide your account value by $1,000 (for example, an $8,600 account value divided by $1,000 = 8.6), then multiply the result by the number in the table under the heading entitled “Actual Expenses Paid During Period” to estimate the expenses you paid on your account during this period.
Hypothetical example for comparison purposes
The table below also provides information about hypothetical account values and hypothetical expenses based on the Fund’s actual expense ratio and an assumed rate of return of 5% per year before expenses, which is not the Fund’s actual return.
The hypothetical account values and expenses may not be used to estimate the actual ending account balance or expenses you paid for the period. You may use this information to compare the ongoing costs of investing in the Fund and other funds. To do so, compare this 5% hypothetical example with the 5% hypothetical examples that appear in the shareholder reports of the other funds.
Please note that the expenses shown in the table are meant to highlight your ongoing costs only and do not reflect any transaction costs, such as sales charges (loads) on purchase payments or contingent deferred sales charges on redemptions, if any. Therefore, the hypothetical information is useful in comparing ongoing costs only, and will not help you determine the relative total costs of owning different funds. In addition, if these transaction costs were included, your costs would have been higher.
| | | | | | | | | | | | | | | | | | | | | | | | |
| | | Beginning
Account Value
(11/01/23) | | | ACTUAL | | | HYPOTHETICAL (5% annual return before expenses) | | | Annualized
Expense Ratio | |
| | Ending
Account Value
(04/30/24)1 | | | Expenses
Paid During
Period | | | Ending
Account Value
(04/30/24)1 | | | Expenses
Paid During
Period2 | |
Class A | | | $1,000.00 | | | | $1,289.60 | | | | $6.03 | | | | $1,019.59 | | | | $5.32 | | | | 1.06% | |
Class C | | | 1,000.00 | | | | 1,285.00 | | | | 10.28 | | | | 1,015.86 | | | | 9.07 | | | | 1.81 | |
Class Y | | | 1,000.00 | | | | 1,291.20 | | | | 4.61 | | | | 1,020.84 | | | | 4.07 | | | | 0.81 | |
Investor Class | | | 1,000.00 | | | | 1,290.70 | | | | 5.41 | | | | 1,020.14 | | | | 4.77 | | | | 0.95 | |
Class R5 | | | 1,000.00 | | | | 1,291.50 | | | | 4.33 | | | | 1,021.08 | | | | 3.82 | | | | 0.76 | |
Class R6 | | | 1,000.00 | | | | 1,292.10 | | | | 3.93 | | | | 1,021.43 | | | | 3.47 | | | | 0.69 | |
| 1 | The actual ending account value is based on the actual total return of the Fund for the period November 1, 2023 through April 30, 2024, after actual expenses and will differ from the hypothetical ending account value which is based on the Fund’s expense ratio and a hypothetical annual return of 5% before expenses. |
| 2 | Expenses are equal to the Fund’s annualized expense ratio as indicated above multiplied by the average account value over the period, multiplied by 182/366 to reflect the most recent fiscal half year. |
21 Invesco Technology Fund
Tax Information
Form 1099-DIV, Form 1042-S and other year–end tax information provide shareholders with actual calendar year amounts that should be included in their tax returns. Shareholders should consult their tax advisers.
The following distribution information is being provided as required by the Internal Revenue Code or to meet a specific state’s requirement.
The Fund designates the following amounts or, if subsequently determined to be different, the maximum amount allowable for its fiscal year ended April 30, 2024:
| | | | | | |
Federal and State Income Tax | | | | | | |
Long-Term Capital Gain Distributions | | $ | 30,523 | | | |
Qualified Dividend Income* | | | 13.08 | % | | |
Corporate Dividends Received Deduction* | | | 11.79 | % | | |
U.S. Treasury Obligations* | | | 0.00 | % | | |
Qualified Business Income* | | | 0.00 | % | | |
Business Interest Income* | | | 1.59 | % | | |
| | * | The above percentages are based on ordinary income dividends paid to shareholders during the Fund’s fiscal year. |
| | | | | | |
| | |
Non-Resident Alien Shareholders | | | | | | |
Short-Term Capital Gain Distributions | | $ | 11,409,921 | | | |
22 Invesco Technology Fund
Trustees and Officers
The address of each trustee and officer is AIM Sector Funds (Invesco Sector Funds) (the “Trust”), 11 Greenway Plaza, Houston, Texas 77046-1173. The trustees serve for the life of the Trust, subject to their earlier death, incapacitation, resignation, retirement or removal as more specifically provided in the Trust’s organizational documents. Each officer serves for a one year term or until their successors are elected and qualified. Column two below includes length of time served with predecessor entities, if any.
| | | | | | | | |
Name, Year of Birth and Position(s) Held with the Trust | | Trustee and/or Officer Since | | Principal Occupation(s) During Past 5 Years | | Number of
Funds in
Fund Complex
Overseen by
Trustee | | Other
Directorship(s) Held by Trustee
During At Least
The Past 5 Years |
| Interested Trustees | | | | | | | | |
Jeffrey H. Kupor1 – 1968 Trustee | | 2024 | | Senior Managing Director and General Counsel, Invesco Ltd.; Trustee, Invesco Foundation, Inc.; Director, Invesco Advisers, Inc.; Executive Vice President, Invesco Asset Management (Bermuda), Ltd., Invesco Investments (Bermuda) Ltd.; and Vice President, Invesco Group Services, Inc. Formerly: Head of Legal of the Americas, Invesco Ltd.; Senior Vice President and Secretary, Invesco Advisers, Inc. (formerly known as Invesco Institutional (N.A.), Inc.) (registered investment adviser); Secretary, Invesco Distributors, Inc. (formerly known as Invesco AIM Distributors, Inc.); Vice President and Secretary, Invesco Investment Services, Inc. (formerly known as Invesco AIM Investment Services, Inc.); Senior Vice President, Chief Legal Officer and Secretary, The Invesco Funds; Secretary and General Counsel, Invesco Investment Advisers LLC (formerly known as Van Kampen Asset Management); Secretary and General Counsel, Invesco Capital Markets, Inc. (formerly known as Van Kampen Funds Inc.) and Chief Legal Officer, Invesco Exchange-Traded Fund Trust, Invesco Exchange-Traded Fund Trust II, Invesco India Exchange-Traded Fund Trust, Invesco Actively Managed Exchange-Traded Fund Trust, Invesco Actively Managed Exchange-Traded Commodity Fund Trust and Invesco Exchange-Traded Self-Indexed Fund Trust; Secretary and Vice President, Harbourview Asset Management Corporation; Secretary and Vice President, OppenheimerFunds, Inc. and Invesco Managed Accounts, LLC; Secretary and Senior Vice President, OFI Global Institutional, Inc.; Secretary and Vice President, OFI SteelPath, Inc.; Secretary and Vice President, Oppenheimer Acquisition Corp.; Secretary and Vice President, Shareholder Services, Inc.; Secretary and Vice President, Trinity Investment Management Corporation, Senior Vice President, Invesco Distributors, Inc.; Secretary and Vice President, Jemstep, Inc.; Head of Legal, Worldwide Institutional, Invesco Ltd.; Secretary and General Counsel, INVESCO Private Capital Investments, Inc.; Senior Vice President, Secretary and General Counsel, Invesco Management Group, Inc. (formerly known as Invesco AIM Management Group, Inc.); Assistant Secretary, INVESCO Asset Management (Bermuda) Ltd.; Secretary and General Counsel, Invesco Private Capital, Inc.; Assistant Secretary and General Counsel, INVESCO Realty, Inc.; Secretary and General Counsel, Invesco Senior Secured Management, Inc.; Secretary, Sovereign G./P. Holdings Inc.; Secretary, Invesco Indexing LLC; and Secretary, W.L. Ross & Co., LLC | | 164 | | None |
Douglas Sharp1 – 1974 Trustee | | 2024 | | Senior Managing Director and Head of Americas & EMEA, Invesco Ltd. Formerly: Director and Chairman Invesco UK Limited; Director, Chairman and Chief Executive, Invesco Fund Managers Limited | | 164 | | None |
| 1 | Mr. Kupor and Mr. Sharp are considered interested persons (within the meaning of Section 2(a)(19) of the 1940 Act) of the Trust because they are officers of the Adviser to the Trust, and officers of Invesco Ltd., ultimate parent of the Adviser. |
T-1 Invesco Technology Fund
Trustees and Officers–(continued)
| | | | | | | | |
Name, Year of Birth and Position(s) Held with the Trust | | Trustee and/or Officer Since | | Principal Occupation(s) During Past 5 Years | | Number of Funds in Fund Complex
Overseen by
Trustee | | Other Directorship(s) Held by Trustee During At Least The Past 5 Years |
| Independent Trustees | | | | | | | | |
Beth Ann Brown – 1968 Trustee (2019) and Chair (2022) | | 2019 | | Independent Consultant Formerly: Head of Intermediary Distribution, Managing Director, Strategic Relations, Managing Director, Head of National Accounts, Senior Vice President, National Account Manager and Senior Vice President, Key Account Manager, Columbia Management Investment Advisers LLC; and Vice President, Key Account Manager, Liberty Funds Distributor, Inc. | | 164 | | Director, Board of Directors of Caron Engineering Inc.; Formerly: Advisor, Board of Advisors of Caron Engineering Inc.; President and Director, Acton Shapleigh Youth Conservation Corps (non-profit); President and Director Director of Grahamtastic Connection (non-profit); and Trustee of certain Oppenheimer Funds |
Carol Deckbar – 1962 Trustee | | 2024 | | Formerly: Executive Vice President and Chief Product Officer, TIAA Financial Services; Executive Vice President and Principal, College Retirement Equities Fund at TIAA; Executive Vice President and Head of Institutional Investments and Endowment Services, TIAA | | 164 | | Formerly: Board Member, TIAA Asset Management, Inc.; and Board Member, TH Real Estate Group Holdings Company |
Cynthia Hostetler –1962 Trustee | | 2017 | | Non-Executive Director and Trustee of a number of public and private business corporations Formerly: Director, Aberdeen Investment Funds (4 portfolios); Director, Artio Global Investment LLC (mutual fund complex); Director, Edgen Group, Inc. (specialized energy and infrastructure products distributor); Director, Genesee & Wyoming, Inc. (railroads); Head of Investment Funds and Private Equity, Overseas Private Investment Corporation; President, First Manhattan Bancorporation, Inc.; and Attorney, Simpson Thacher & Bartlett LLP | | 164 | | Resideo Technologies, Inc. (smart home technology); Vulcan Materials Company (construction materials company); Trilinc Global Impact Fund; Investment Company Institute (professional organization); and Independent Directors Council (professional organization) |
Eli Jones – 1961 Trustee | | 2016 | | Professor and Dean Emeritus, Mays Business School - Texas A&M University Formerly: Dean of Mays Business School-Texas A&M University; Professor and Dean, Walton College of Business, University of Arkansas and E.J. Ourso College of Business, Louisiana State University; and Director, Arvest Bank | | 164 | | Insperity, Inc. (formerly known as Administaff) (human resources provider); Board Member of the regional board, First Financial Bank Texas; and Boad Member, First Financial Bankshares, Inc. Texas |
Elizabeth Krentzman – 1959 Trustee | | 2019 | | Formerly: Principal and Chief Regulatory Advisor for Asset Management Services and U.S. Mutual Fund Leader of Deloitte & Touche LLP; General Counsel of the Investment Company Institute (trade association); National Director of the Investment Management Regulatory Consulting Practice, Principal, Director and Senior Manager of Deloitte & Touche LLP; Assistant Director of the Division of Investment Management - Office of Disclosure and Investment Adviser Regulation of the U.S. Securities and Exchange Commission and various positions with the Division of Investment Management – Office of Regulatory Policy of the U.S. Securities and Exchange Commission; and Associate at Ropes & Gray LLP | | 164 | | Formerly: Member of the Cartica Funds Board of Directors (private investment fund); Trustee of the University of Florida National Board Foundation; Member of the University of Florida Law Center Association, Inc. Board of Trustees, Audit Committee and Membership Committee; and Trustee of certain Oppenheimer Funds |
Anthony J. LaCava, Jr. – 1956 Trustee | | 2019 | | Formerly: Director and Member of the Audit Committee, Blue Hills Bank (publicly traded financial institution) and Managing Partner, KPMG LLP | | 164 | | Member and Chairman, of the Bentley University, Business School Advisory Council; Formerly: Board Member and Chair of the Audit and Finance Committee and Nominating Committee, KPMG LLP |
James “Jim” Liddy – 1959 Trustee | | 2024 | | Formerly: Chairman, Global Financial Services, Americas and Retired Partner, KPMG LLP | | 164 | | Director and Treasurer, Gulfside Place Condominium Association, Inc. and Non-Executive Director, Kellenberg Memorial High School |
T-2 Invesco Technology Fund
Trustees and Officers–(continued)
| | | | | | | | |
Name, Year of Birth and Position(s) Held with the Trust | | Trustee and/or Officer Since | | Principal Occupation(s) During Past 5 Years | | Number of
Funds in Fund Complex
Overseen by
Trustee | | Other Directorship(s)
Held by Trustee
During At Least
The Past 5 Years |
| Independent Trustees–(continued) |
Prema Mathai-Davis – 1950 Trustee | | 2003 | | Formerly: Co-Founder & Partner of Quantalytics Research, LLC, (a FinTech Investment Research Platform for the Self-Directed Investor); Trustee of YWCA Retirement Fund; CEO of YWCA of the USA; Board member of the NY Metropolitan Transportation Authority; Commissioner of the NYC Department of Aging; and Board member of Johns Hopkins Bioethics Institute | | 164 | | Member of Board of Positive Planet US (non-profit) and HealthCare Chaplaincy Network (non-profit) |
Joel W. Motley – 1952 Trustee | | 2019 | | Director of Office of Finance, Federal Home Loan Bank System; Managing Director of Carmona Motley Inc. (privately held financial advisor); Member of the Council on Foreign Relations and its Finance and Budget Committee; Chairman Emeritus of Board of Human Rights Watch and Member of its Investment Committee; and Member of Investment Committee Board of Historic Hudson Valley (non-profit cultural organization); and Member of the Vestry and the Investment Committee of Trinity Church Wall Street. Formerly: Managing Director of Public Capital Advisors, LLC (privately held financial advisor); Managing Director of Carmona Motley Hoffman, Inc. (privately held financial advisor); and Director of Columbia Equity Financial Corp. (privately held financial advisor) | | 164 | | Member of Board of Trust for Mutual Understanding (non-profit promoting the arts and environment); Member of Board of Greenwall Foundation (bioethics research foundation) and its Investment Committee; Member of Board of Friends of the LRC (non-profit legal advocacy); and Board Member and Investment Committee Member of Pulitzer Center for Crisis Reporting (non-profit journalism); and Trustee of certain Oppenheimer Funds; |
| | | | | | | | | |
Teresa M. Ressel – 1962 Trustee | | 2017 | | Non-executive director and trustee of a number of public and private business corporations Formerly: Chief Executive Officer, UBS Securities LLC (investment banking); Group Chief Operating Officer, UBS AG Americas (investment banking); Sr. Management Team Olayan America, The Olayan Group (international investor/commercial/industrial); and Assistant Secretary for Management & Budget and Designated Chief Financial Officer, U.S. Department of Treasury | | 164 | | None |
Robert C. Troccoli – 1949 Trustee | | 2016 | | Formerly: Adjunct Professor, University of Denver – Daniels College of Business; and Managing Partner, KPMG LLP | | 164 | | None |
Daniel S. Vandivort –1954 Trustee | | 2019 | | President, Flyway Advisory Services LLC (consulting and property management) and Member, Investment Committee of Historic Charleston Foundation Formerly: President and Chief Investment Officer, previously Head of Fixed Income, Weiss Peck and Greer/Robeco Investment Management; Trustee and Chair, Weiss Peck and Greer Funds Board; and various capacities at CS First Boston including Head of Fixed Income at First Boston Asset Management. | | 164 | | Formerly: Trustee and Governance Chair, Oppenheimer Funds; Treasurer, Chairman of the Audit and Finance Committee, Huntington Disease Foundation of America |
T-3 Invesco Technology Fund
Trustees and Officers–(continued)
| | | | | | | | |
Name, Year of Birth and Position(s) Held with the Trust | | Trustee and/or Officer Since | | Principal Occupation(s) During Past 5 Years | | Number of
Funds in
Fund Complex
Overseen by
Trustee | | Other Directorship(s)
Held by Trustee
During At Least
The Past 5 Years |
| Officers |
Glenn Brightman – 1972 President and Principal Executive Officer | | 2023 | | Chief Operating Officer, Americas, Invesco Ltd.; Senior Vice President, Invesco Advisers, Inc.; President and Principal Executive Officer, The Invesco Funds; Manager, Invesco Investment Advisers LLC. Formerly: Global Head of Finance, Invesco Ltd; Executive Vice President and Chief Financial Officer, Nuveen | | N/A | | N/A |
Melanie Ringold – 1975 Senior Vice President, Chief Legal Officer and Secretary | | 2023 | | Head of Legal of the Americas, Invesco Ltd.; Senior Vice President and Secretary, Invesco Advisers, Inc. (formerly known as Invesco Institutional (N.A.), Inc.) (registered investment adviser); Secretary, Invesco Distributors, Inc. (formerly known as Invesco AIM Distributors, Inc.); Secretary, Invesco Investment Services, Inc. (formerly known as Invesco AIM Investment Services, Inc.); Senior Vice President, Chief Legal Officer and Secretary, The Invesco Funds; Secretary, Invesco Investment Advisers LLC, Invesco Capital Markets, Inc.; Chief Legal Officer, Invesco Exchange-Traded Fund Trust, Invesco Exchange-Traded Fund Trust II, Invesco India Exchange-Traded Fund Trust, Invesco Actively Managed Exchange-Traded Fund Trust, Invesco Actively Secretary and Vice President, Harbourview Asset Management Corporation; Secretary and Senior Vice President, OppenheimerFunds, Inc. and Invesco Managed Accounts, LLC; Secretary and Senior Vice President, Oppenheimer Acquisition Corp.; Secretary, SteelPath Funds Remediation LLC; and Secretary and Senior Vice President, Trinity Investment Management Corporation Formerly: Secretary and Senior Vice President, OFI SteelPath, Inc., Assistant Secretary, Invesco Distributors, Inc., Invesco Advisers, Inc., Invesco Investment Services, Inc., Invesco Capital Markets, Inc., Invesco Capital Management LLC and Invesco Investment Advisers LLC; and Assistant Secretary and Assistant Vice President, Invesco Funds | | N/A | | N/A |
John M. Zerr – 1962 Senior Vice President | | 2006 | | Chief Operating Officer of the Americas; Senior Vice President, Invesco Advisers, Inc. (formerly known as Invesco Institutional (N.A.), Inc.) (registered investment adviser); Senior Vice President, Invesco Distributors, Inc. (formerly known as Invesco AIM Distributors, Inc.); Director and Vice President, Invesco Investment Services, Inc. (formerly known as Invesco AIM Investment Services, Inc.) Senior Vice President, The Invesco Funds; Managing Director, Invesco Capital Management LLC; Senior Vice President, Invesco Capital Markets, Inc. (formerly known as Van Kampen Funds Inc.); Manager, Invesco Specialized Products, LLC; Member, Invesco Canada Funds Advisory Board; Director, President and Chief Executive Officer, Invesco Corporate Class Inc. (corporate mutual fund company); Director, Chairman, President and Chief Executive Officer, Invesco Canada Ltd. (formerly known as Invesco Trimark Ltd./Invesco Trimark Ltèe) (registered investment adviser and registered transfer agent); President, Invesco, Inc.; President, Invesco Global Direct Real Estate Feeder GP Ltd.; President, Invesco IP Holdings (Canada) Ltd; President, Invesco Global Direct Real Estate GP Ltd.; and President Invesco Financial Services Ltd. / Services Financiers Invesco Ltée Formerly: Director and Chairman, Invesco Trust Company, Manager, Invesco Indexing LLC; Director, Invesco Investment Advisers LLC (formerly known as Van Kampen Asset Management); President, Trimark Investments Ltd/Services Financiers Invesco Ltee; Director and Senior Vice President, Invesco Insurance Agency, Inc.; Director and Senior Vice President, Invesco Management Group, Inc. (formerly known as Invesco AIM Management Group, Inc.); Secretary and General Counsel, Invesco Management Group, Inc. (formerly known as Invesco AIM Management Group, Inc.); Secretary, Invesco Investment Services, Inc. (formerly known as Invesco AIM Investment Services, Inc.); Chief Legal Officer and Secretary, The Invesco Funds; Secretary and General Counsel, Invesco Investment Advisers LLC (formerly known as Van Kampen Asset Management); Secretary and General Counsel, Invesco Capital Markets, Inc. (formerly known as Van Kampen Funds Inc.); Chief Legal Officer, Invesco Exchange-Traded Fund Trust, Invesco Exchange-Traded Fund Trust II, Invesco India Exchange-Traded Fund Trust, Invesco Actively Managed Exchange-Traded Fund Trust, Invesco Actively Managed Exchange-Traded Commodity Fund Trust and Invesco Exchange-Traded Self-Indexed Fund Trust; Secretary, Invesco Indexing LLC; Director, Secretary, General Counsel and Senior Vice President, Van Kampen Exchange Corp.; Director, Vice President and Secretary, IVZ Distributors, Inc. (formerly known as INVESCO Distributors, Inc.); Director and Vice President, INVESCO Funds Group, Inc.; Director and Vice President, Van Kampen Advisors Inc.; Director, Vice President, Secretary and General Counsel, Van Kampen Investor Services Inc.;Director and Secretary, Invesco Distributors, Inc. (formerly known as Invesco AIM Distributors, Inc.); Director, Senior Vice President, General Counsel and Secretary, Invesco AIM Advisers, Inc. and Van Kampen Investments Inc.; Director, Vice President and Secretary, Fund Management Company; Director, Senior Vice President, Secretary, General Counsel and Vice President, Invesco AIM Capital Management, Inc.; and Chief Operating Officer and General Counsel, Liberty Ridge Capital, Inc. (an investment adviser) | | N/A | | N/A |
T-4 Invesco Technology Fund
Trustees and Officers–(continued)
| | | | | | | | |
Name, Year of Birth and Position(s) Held with the Trust | | Trustee and/or Officer Since | | Principal Occupation(s) During Past 5 Years | | Number of
Funds in
Fund Complex
Overseen by
Trustee | | Other Directorship(s) Held by Trustee During At Least The Past 5 Years |
| Officers–(continued) |
Tony Wong – 1973 Senior Vice President | | 2023 | | Senior Managing Director, Invesco Ltd.; Director, Chairman, Chief Executive Officer and President, Invesco Advisers, Inc.; Director and Chairman, Invesco Private Capital, Inc., INVESCO Private Capital Investments, Inc. and INVESCO Realty, Inc.; Director, Invesco Senior Secured Management, Inc.; President, Invesco Managed Accounts, LLC and SNW Asset Management Corporation; and Senior Vice President, The Invesco Funds Formerly: Assistant Vice President, The Invesco Funds; and Vice President, Invesco Advisers, Inc. | | N/A | | N/A |
| Stephanie C. Butcher – 1971 Senior Vice President | | 2023 | | Senior Managing Director, Invesco Ltd.; Senior Vice President, The Invesco Funds; Director and Chief Executive Officer, Invesco Asset Management Limited | | N/A | | N/A |
Adrien Deberghes – 1967 Principal Financial Officer, Treasurer and Senior Vice President | | 2020 | | Head of the Fund Office of the CFO and Fund Administration; Vice President, Invesco Advisers, Inc.; Director, Invesco Trust Company; Principal Financial Officer, Treasurer and Senior Vice President, The Invesco Funds; Vice President, Invesco Exchange-Traded Fund Trust, Invesco Exchange-Traded Fund Trust II, Invesco India Exchange-Traded Fund Trust, Invesco Actively Managed Exchange-Traded Fund Trust, Invesco Actively Managed Exchange-Traded Commodity Fund Trust and Invesco Exchange-Traded Self-Indexed Fund Trust Formerly: Vice President, The Invesco Funds; Senior Vice President and Treasurer, Fidelity Investments | | N/A | | N/A |
Crissie M. Wisdom – 1969 Anti-Money Laundering Compliance Officer | | 2013 | | Anti-Money Laundering and OFAC Compliance Officer for Invesco U.S. entities including: Invesco Advisers, Inc. and its affiliates, Invesco Capital Markets, Inc., Invesco Distributors, Inc., Invesco Investment Services, Inc., The Invesco Funds, Invesco Capital Management, LLC, Invesco Trust Company; and Fraud Prevention Manager for Invesco Investment Services, Inc. | | N/A | | N/A |
Todd F. Kuehl – 1969 Chief Compliance Officer and Senior Vice President | | 2020 | | Chief Compliance Officer, Invesco Advisers, Inc. (registered investment adviser); and Chief Compliance Officer and Senior Vice President, The Invesco Funds Formerly: Managing Director and Chief Compliance Officer, Legg Mason (Mutual Funds); Chief Compliance Officer, Legg Mason Private Portfolio Group (registered investment adviser) | | N/A | | N/A |
| James Bordewick, Jr. – 1959 Senior Vice President and Senior Officer | | 2022 | | Senior Vice President and Senior Officer, The Invesco Funds Formerly: Chief Legal Officer, KingsCrowd, Inc. (research and analytical platform for investment in private capital markets); Chief Operating Officer and Head of Legal and Regulatory, Netcapital (private capital investment platform); Managing Director, General Counsel of asset management and Chief Compliance Officer for asset management and private banking, Bank of America Corporation; Chief Legal Officer, Columbia Funds and BofA Funds; Senior Vice President and Associate General Counsel, MFS Investment Management; Chief Legal Officer, MFS Funds; Associate, Ropes & Gray; and Associate, Gaston Snow & Ely Bartlett | | N/A | | N/A |
The Statement of Additional Information of the Trust includes additional information about the Fund’s Trustees and is available upon request, without charge, by calling 1.800.959.4246. Please refer to the Fund’s Statement of Additional Information for information on the Fund’s sub-advisers.
| | | | | | |
| Office of the Fund | | Investment Adviser | | Distributor | | Auditors |
| 11 Greenway Plaza | | Invesco Advisers, Inc. | | Invesco Distributors, Inc. | | PricewaterhouseCoopers LLP |
| Houston, TX 77046-1173 | | 1331 Spring Street, NW, Suite 2500 | | 11 Greenway Plaza | | 1000 Louisiana Street, Suite 5800 |
| | Atlanta, GA 30309 | | Houston, TX 77046-1173 | | Houston, TX 77002-5021 |
| | | |
| Counsel to the Fund | | Counsel to the Independent Trustees | | Transfer Agent | | Custodian |
| Stradley Ronon Stevens & Young, LLP | | Sidley Austin LLP | | Invesco Investment Services, Inc. | | State Street Bank and Trust Company |
| 2005 Market Street, Suite 2600 | | 787 Seventh Avenue | | 11 Greenway Plaza | | 225 Franklin Street |
| Philadelphia, PA 19103-7018 | | New York, NY 10019 | | Houston, TX 77046-1173 | | Boston, MA 02110-2801 |
T-5 Invesco Technology Fund
Proxy Results
A Special Joint Meeting (“Meeting”) of Shareholders of AIM Sector Funds (Invesco Sector Funds), a Delaware statutory trust (“Trust”), was held on January 16, 2024. The Meeting was held for the following purpose:
| (1) | Elect 14 trustees to the Board of Trustees of the Trust, each of whom will serve until his or her successor is duly elected and qualified. |
The results of the voting on the above matter were as follows:
| | | | | | | | |
| Matter | | Votes For | | | | | Votes Against/Withheld |
(1)* Beth Ann Brown | | | 595,446,022.84 | | | | | 16,915,661.31 |
Carol Deckbar | | | 595,102,087.25 | | | | | 17,259,596.89 |
Cynthia Hostetler | | | 595,359,921.21 | | | | | 17,001,762.94 |
Dr. Eli Jones | | | 594,949,311.14 | | | | | 17,412,373.00 |
Elizabeth Krentzman | | | 595,453,833.65 | | | | | 16,907,850.50 |
Jeffrey H. Kupor | | | 595,342,690.51 | | | | | 17,018,993.64 |
Anthony J. LaCava, Jr. | | | 595,293,865.38 | | | | | 17,067,818.77 |
James Liddy | | | 594,980,026.97 | | | | | 17,381,657.17 |
Dr. Prema Mathai-Davis | | | 594,031,204.04 | | | | | 18,330,480.11 |
Joel W. Motley | | | 594,381,710.91 | | | | | 17,979,973.23 |
Teresa M. Ressel | | | 595,821,958.43 | | | | | 16,539,725.72 |
Douglas Sharp | | | 595,715,711.66 | | | | | 16,645,972.48 |
Robert C. Troccoli | | | 594,748,318.91 | | | | | 17,613,365.24 |
Daniel S. Vandivort | | | 595,002,691.19 | | | | | 17,358,992.96 |
* Proposal 1 required approval by a combined vote of all the portfolios of AIM Sector Funds (Invesco Sector Funds).
T-6 Invesco Technology Fund

Go paperless with eDelivery
Visit invesco.com/edelivery to enjoy the convenience and security of anytime electronic access to your investment documents.
With eDelivery, you can elect to have any or all of the following materials delivered straight to your inbox to download, save and print from your own computer:
| ∎ | | Fund reports and prospectuses |
Invesco mailing information
Send general correspondence to Invesco Investment Services, Inc., P.O. Box 219078, Kansas City, MO 64121-9078.
Important notice regarding delivery of security holder documents
To reduce Fund expenses, only one copy of most shareholder documents may be mailed to shareholders with multiple accounts at the same address (Householding). Mailing of your shareholder documents may be householded indefinitely unless you instruct us otherwise. If you do not want the mailing of these documents to be combined with those for other members of your household, please contact Invesco Investment Services, Inc. at 800 959 4246 or contact your financial institution. We will begin sending you individual copies for each account within 30 days after receiving your request.
Fund holdings and proxy voting information
The Fund provides a complete list of its portfolio holdings four times each year, at the end of each fiscal quarter. For the second and fourth quarters, the list appears, respectively, in the Fund’s semiannual and annual reports to shareholders. For the first and third quarters, the Fund files the list with the Securities and Exchange Commission (SEC) as an exhibit to its reports on Form N-PORT. The most recent list of portfolio holdings is available at invesco.com/completeqtrholdings. Shareholders can also look up the Fund’s Form N-PORT filings on the SEC website, sec.gov. The SEC file numbers for the Fund are shown below.
A description of the policies and procedures that the Fund uses to determine how to vote proxies relating to portfolio securities is available without charge, upon request, from our Client Services department at 800 959 4246, or at invesco.com/corporate/about-us/esg. The information is also available on the SEC website, sec.gov.
Information regarding how the Fund voted proxies related to its portfolio securities during the most recent 12-month period ended June 30 is available at invesco.com/proxysearch. This information is also available on the SEC website, sec.gov.
Invesco Advisers, Inc. is an investment adviser; it provides investment advisory services to individual and institutional clients and does not sell securities. Invesco Distributors, Inc. is the US distributor for Invesco Ltd.’s retail mutual funds, exchange-traded funds and institutional money market funds. Both are wholly owned, indirect subsidiaries of Invesco Ltd.
| | | | |
SEC file number(s): 811-03826 and 002-85905 | | Invesco Distributors, Inc. | | I-TEC-AR-1 |

| | |
| Annual Report to Shareholders | | April 30, 2024 |
Invesco Value Opportunities Fund
Nasdaq:
A: VVOAX ∎ C: VVOCX ∎ R: VVORX ∎ Y: VVOIX ∎ R5: VVONX ∎ R6: VVOSX
|
Beginning in July 2024, amendments adopted by the Securities and Exchange Commission will substantially impact the design, content, and delivery of shareholder reports. These newly designed shareholder reports will highlight key fund information in a clear and concise format and must be mailed to each shareholder that has not elected to receive the reports electronically. Other information, including financial statements, will no longer be included in the shareholder report but will be available at invesco.com/reports, delivered upon request, and filed on a semi-annual basis on Form N-CSR. If you would like to receive shareholder reports and other communications electronically instead of by mail, you may make that request by contacting your financial intermediary (such as a broker-dealer or bank) or, if you are a direct investor, by enrolling at invesco.com/edelivery. If you do not make this request or enroll in e-delivery, you will receive future shareholder reports and other communications by mail. |
Management’s Discussion of Fund Performance
| | | | |
| |
Performance summary | |
For the fiscal year ended April 30, 2024, Class A shares of Invesco Value Opportunities Fund (the Fund), at net asset value (NAV), outperformed the Russell Midcap Value Index, the Fund’s style-specific benchmark. | |
Your Fund’s long-term performance appears later in this report. | |
| |
Fund vs. Indexes | |
Total returns, 4/30/23 to 4/30/24, at net asset value (NAV). Performance shown does not include applicable contingent deferred sales charges (CDSC) or front-end sales charges, which would have reduced performance. | |
Class A Shares | | | 30.70 | % |
Class C Shares | | | 29.77 | |
Class R Shares | | | 30.35 | |
Class Y Shares | | | 31.11 | |
Class R5 Shares | | | 31.11 | |
Class R6 Shares | | | 31.20 | |
S&P 500 Index▼ (Broad Market Index) | | | 22.66 | |
Russell Midcap Value Index▼ (Style-Specific Index) | | | 14.09 | |
Lipper Mid-Cap Value Funds Index∎ (Peer Group Index) | | | 14.10 | |
| |
Source(s): ▼RIMES Technologies Corp.; ∎Lipper Inc. | | | | |
Market conditions and your Fund
The US economy and equity markets remained resilient in the second quarter of 2023, as milder inflation data and better-than-expected corporate earnings supported equities, with most major indexes posting gains for the quarter and with some big tech names providing optimistic future guidance. Following the March 2023 banking crisis, markets stabilized in April, as corporate earnings season got underway with many companies exceeding earnings and revenue estimates. Facing persistently strong employment data, the US Federal Reserve (the Fed) raised the federal funds rate by 0.25% at its May 2023 meeting,1 but left rates unchanged at its June meeting, giving investors the long-awaited “pause” in rate hikes, which sent equities broadly higher.
Equity markets declined in the third quarter and into October 2023 as a resilient US economy complicated the Fed’s efforts to tame inflation. While inflation has slowed from its peak in 2022, in July 2023, the Consumer Price Index (CPI) rose by 0.2% and the 12-month headline inflation rate rose to 3.2% from 3% in June.2 Due to the persistence of inflation, the Fed raised the federal funds rate again in July by 0.25%.1 The CPI data released in September was higher-than-expected and the overall US labor market remained tight with unemployment near historic lows. At the same time the third quarter year-over-year Gross Domestic Product (GDP) estimate was 4.9%, far above expectations.2 Despite the higher-than-expected GDP for the third quarter of 2023, the Fed held interest rates steady at its September and October meetings, but left open the possibility of another rate hike before the end of the calendar year.1
US equity markets posted strong gains in the fourth quarter of 2023 as investors
anticipated the potential end of interest rate hikes by the Fed. Inflation slowed during the period as the CPI 12-month headline inflation rate fell to 3.1% in November from 3.7% in September, significantly below the 2022 peak of 9.1%.2 The Fed kept rates steady at its mid-December meeting and indicated that three rate cuts are expected in 2024. Fed chairman Powell noted that “the Fed’s policy rate is likely at or near its peak for this tightening cycle,“1 which prompted a strong equity rally into 2023 year-end and the yield on the 10-year US Treasury to fall from nearly 5% in October to below 4%.3
US equity markets rallied in the first quarter of 2024. In February, the S&P 500 Index closed above the 5,000 milestone for the first time.3 The US economy defied recession predictions, achieving a growth rate of 2.5% in 2023 and the labor market remained robust, with continued payroll gains and unemployment still historically low – below 4%.2 Inflation, however, remained persistent. January and February increases in the CPI were higher than expected, leading the Fed to defer its proposed interest rate cuts to the second half of 2024.1 Still, investors were mostly pleased by corporate earnings growth, except for three of the so-called “Magnificent Seven” stocks. Apple, Alphabet and Tesla’s stock prices suffered due to disappointing earnings, sales and revenue, or weak forward guidance. Although the stock market had a strong start in 2024, the stock market retreated in April. As consumer spending and a strong labor market were driving economic activity, inflation and interest rate concerns persisted and investors feared another delay in expected rate cuts by the Fed, or worse, rate hikes.
Despite continued higher rates and increased market volatility, US stocks for the fiscal year had strong positive returns of 22.66%, as measured by the S&P 500 Index.4
During the fiscal year we continued to use our intrinsic value strategy, seeking to create wealth by maintaining a long-term investment horizon and investing in companies selling at a significant discount to our estimate of their intrinsic value. We believe intrinsic value represents the fair economic worth of a business. Since our application of this strategy is highly disciplined and relatively unique, it is important to understand the benefits and limitations of our process. First, the investment strategy is intended to preserve your capital while growing it at above-market rates over the long-term. Second, our investments have little in common with popular stock market indexes and most of our peers. And third, the Fund’s short-term relative performance will naturally be different from stock market indexes and peers since we typically structure the portfolio significantly differently than these benchmarks.
The Fund outperformed the Russell Midcap Value Index during the fiscal year. Drivers of Fund performance were mainly stock-specific. However, the Fund’s overweight in industrials and energy helped relative performance versus the Russell Midcap Value Index, as these were the best performing sectors within the index for the fiscal year. The Fund’s avoidance of real estate and communication services also aided relative performance versus the style-specific benchmark, as these sectors lagged. Select holdings in industrials and utilities were among the largest contributors on an absolute basis, while select holdings in financials and information technology (IT) were among the largest detractors.
Vertiv Holdings in industrials and Vistra Corporation in utilities were the largest contributors to overall Fund performance during the fiscal year. Vertiv is a manufacturer of electrical power, thermal management and other equipment for data centers. Shares were up after the company reported strong performance for 2023, driven by increased spending in data centers as a result of artificial intelligence (AI) investments. Vistra is one of the largest power producers and retail energy providers in the US. Shares of the company rose during the fiscal year due to an enhanced long-term demand growth outlook driven by the build out of energy-intensive AI data centers as well as strong financial results for 2023.
Western Alliance Bancorporation was the largest detractor from overall Fund performance for the fiscal year. The company is one of the largest regional banks in the US, primarily servicing the western and midwestern states, and it was a new purchase during the fiscal year. Shares pulled back at the beginning of 2024 following a weaker than expected earnings report, which gave us the opportunity to invest at an attractive discount to our estimate of intrinsic value. Specifically, the bank traded at a historically low price to tangible book value despite an attractive return on equity and a solid capital position. IT
| | |
| 2 | | Invesco Value Opportunities Fund |
company Lumentum Holdings was also a large detractor from absolute Fund performance during the fiscal year. The company is a market-leading designer and manufacturer of innovative optical and photonic products for the communications and electronics end-markets. Shares fell during the fiscal year as the company continues to deal with below end-market demand due to the customer inventory correction in the telecommunications market.
We believe the single most important indicator of how the Fund is positioned for potential future success is not our recent investment results or popular statistical measures, but rather the difference between current market prices and the Fund’s estimated intrinsic value – the aggregate business value of the portfolio based on our estimate of intrinsic value for each individual holding.
At the end of the fiscal year, the difference between the market price and the estimated intrinsic value of the Fund was attractive, according to our estimation. While there is no assurance that market value will ever reflect our estimate of the Fund’s intrinsic value, we believe the gap between price and estimated intrinsic value may provide above-average capital appreciation.
We will continue to work hard to protect and grow the Fund’s estimated intrinsic value. We thank you for your investment in Invesco Value Opportunities Fund and for sharing our long-term investment perspective.
| 1 | Source: US Federal Reserve |
| 2 | Source: US Bureau of Labor Statistics |
| 4 | Source: Morningstar Direct |
Portfolio manager(s):
Jonathan Edwards - Lead
Jonathan Mueller
The views and opinions expressed in management’s discussion of Fund performance are those of Invesco Advisers, Inc. and its affiliates. These views and opinions are subject to change at any time based on factors such as market and economic conditions. These views and opinions may not be relied upon as investment advice or recommendations, or as an offer for a particular security. The information is not a complete analysis of every aspect of any market, country, industry, security or the Fund. Statements of fact are from sources considered reliable, but Invesco Advisers, Inc. makes no representation or warranty as to their completeness or accuracy. Although historical performance is no guarantee of future results, these insights may help you understand our investment management philosophy.
See important Fund and, if applicable, index disclosures later in this report.
| | |
| 3 | | Invesco Value Opportunities Fund |
Your Fund’s Long-Term Performance
Results of a $10,000 Investment – Oldest Share Class(es)
Fund and index data from 4/30/14
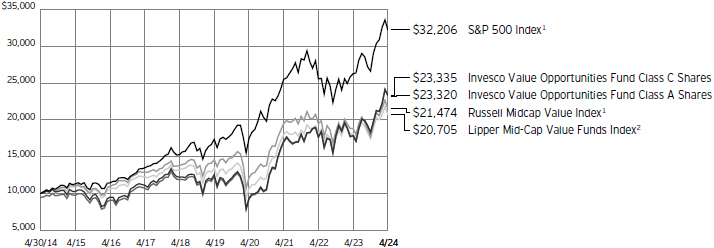
1 Source: RIMES Technologies Corp.
2 Source: Lipper Inc.
Past performance cannot guarantee future results.
The data shown in the chart include reinvested distributions, applicable sales charges and Fund expenses including management
fees. Index results include reinvested dividends, but they do not reflect sales charges. Performance of the peer group, if applicable, reflects fund expenses and management fees;
performance of a market index does not. Performance shown in the chart does not reflect deduction of taxes a shareholder would pay on Fund distributions or sale of Fund shares.
| | |
| 4 | | Invesco Value Opportunities Fund |
| | | | |
| |
| Average Annual Total Returns | |
| As of 4/30/24, including maximum applicable sales charges | |
| |
Class A Shares | | | | |
Inception (6/25/01) | | | 6.99 | % |
10 Years | | | 8.84 | |
5 Years | | | 12.39 | |
1 Year | | | 23.49 | |
| |
Class C Shares | | | | |
Inception (6/25/01) | | | 6.98 | % |
10 Years | | | 8.84 | |
5 Years | | | 12.86 | |
1 Year | | | 28.77 | |
| |
Class R Shares | | | | |
Inception (5/23/11) | | | 10.20 | % |
10 Years | | | 9.18 | |
5 Years | | | 13.39 | |
1 Year | | | 30.35 | |
| |
Class Y Shares | | | | |
Inception (3/23/05) | | | 7.73 | % |
10 Years | | | 9.73 | |
5 Years | | | 13.97 | |
1 Year | | | 31.11 | |
| |
Class R5 Shares | | | | |
Inception (5/23/11) | | | 10.93 | % |
10 Years | | | 9.87 | |
5 Years | | | 14.08 | |
1 Year | | | 31.11 | |
| |
Class R6 Shares | | | | |
10 Years | | | 9.78 | % |
5 Years | | | 14.13 | |
1 Year | | | 31.20 | |
Performance includes litigation proceeds. Had these proceeds not been received, total returns would have been lower.
Effective June 1, 2010, Class A, Class C and Class I shares of the predecessor fund, Van Kampen Value Opportunities Fund, advised by Van Kampen Asset Management were reorganized into Class A, Class C and Class Y shares, respectively, of Invesco Van Kampen Value Opportunities Fund (renamed Invesco Value Opportunities Fund). Returns shown above, prior to June 1, 2010, for Class A, Class C and Class Y shares are those for Class A, Class C and Class I shares of the predecessor fund. Share class returns will differ from the predecessor fund because of different expenses.
Class R6 shares incepted on April 4, 2017. Performance shown prior to that date is that of the Fund’s Class A shares at net asset value and includes the 12b-1 fees applicable to Class A shares.
The performance data quoted represent past performance and cannot guarantee future results; current performance may be lower or higher. Please visit invesco.com/performance for the most recent month-end performance. Performance figures reflect reinvested distributions, changes in net asset value and the effect of the maximum sales charge unless otherwise stated.
Performance figures do not reflect deduction of taxes a shareholder would pay on Fund distributions or sale of Fund shares. Investment return and principal value will fluctuate so that you may have a gain or loss when you sell shares.
Class A share performance reflects the maximum 5.50% sales charge, and Class C share performance reflects the applicable contingent deferred sales charge (CDSC) for the period involved. The CDSC on Class C shares is 1% for the first year after purchase. Class R, Class Y, Class R5 and Class R6 shares do not have a front-end sales charge or a CDSC; therefore, performance is at net asset value.
The performance of the Fund’s share classes will differ primarily due to different sales charge structures and class expenses.
Fund performance reflects any applicable fee waivers and/or expense reimbursements. Had the adviser not waived fees and/or reimbursed expenses currently or in the past, returns would have been lower. See current prospectus for more information.
| | |
| 5 | | Invesco Value Opportunities Fund |
Supplemental Information
Invesco Value Opportunities Fund’s investment objective is total return through growth of capital and current income.
| ∎ | Unless otherwise stated, information presented in this report is as of April 30, 2024, and is based on total net assets. |
| ∎ | Unless otherwise noted, all data is provided by Invesco. |
| ∎ | To access your Fund’s reports/prospectus, visit invesco.com/fundreports. |
About indexes used in this report
| ∎ | The S&P 500® Index is an unmanaged index considered representative of the US stock market. |
| ∎ | The Russell Midcap® Value Index is an unmanaged index considered representative of mid-cap value stocks. The Russell Midcap Value Index is a trademark/service mark of the Frank Russell Co. Russell® is a trademark of the Frank Russell Co. |
| ∎ | The Lipper Mid-Cap Value Funds Index is an unmanaged index considered representative of mid-cap value funds tracked by Lipper. |
| ∎ | The Fund is not managed to track the performance of any particular index, including the index(es) described here, and consequently, the performance of the Fund may deviate significantly from the performance of the index(es). |
| ∎ | A direct investment cannot be made in an index. Unless otherwise indicated, index results include reinvested dividends, and they do not reflect sales charges. Performance of the peer group, if applicable, reflects fund expenses; performance of a market index does not. |
Liquidity Risk Management Program
In compliance with Rule 22e-4 under the Investment Company Act of 1940, as amended (the “Liquidity Rule”), the Fund has adopted and implemented a liquidity risk management program in accordance with the Liquidity Rule (the “Program”). The Program is reasonably designed to assess and manage the Fund’s liquidity risk, which is the risk that the Fund could not meet redemption requests without significant dilution of remaining investors’ interests in the Fund. The Board of Trustees of the Fund (the “Board”) has appointed Invesco Advisers, Inc. (“Invesco”), the Fund’s investment adviser, as the Program’s administrator, and Invesco has delegated oversight of the Program to the Liquidity Risk Management Committee (the “Committee”), which is composed of senior representatives from relevant business groups at Invesco.
As required by the Liquidity Rule, the Program includes policies and procedures
providing for an assessment, no less frequently than annually, of the Fund’s liquidity risk that takes into account, as relevant to the Fund’s liquidity risk: (1) the Fund’s investment strategy and liquidity of portfolio investments during both normal and reasonably foreseeable stressed conditions; (2) short-term and long-term cash flow projections for the Fund during both normal and reasonably foreseeable stressed conditions; and (3) the Fund’s holdings of cash and cash equivalents and any borrowing arrangements. The Liquidity Rule also requires the classification of the Fund’s investments into categories that reflect the assessment of their relative liquidity under current market conditions. The Fund classifies its investments into one of four categories defined in the Liquidity Rule: “Highly Liquid,” “Moderately Liquid,” “Less Liquid,” and “Illiquid.” Funds that are not invested primarily in “Highly Liquid Investments” that are assets (cash or investments that are reasonably expected to be convertible into cash within three business days without significantly changing the market value of the investment) are required to establish a “Highly Liquid Investment Minimum” (“HLIM”), which is the minimum percentage of net assets that must be invested in Highly Liquid Investments. Funds with HLIMs have procedures for addressing HLIM shortfalls, including reporting to the Board and the SEC (on a non-public basis) as required by the Program and the Liquidity Rule. In addition, the Fund may not acquire an investment if, immediately after the acquisition, over 15% of the Fund’s net assets would consist of “Illiquid Investments” that are assets (an investment that cannot reasonably be expected to be sold or disposed of in current market conditions in seven calendar days or less without the sale or disposition significantly changing the market value of the investment). The Liquidity Rule and the Program also require reporting to the Board and the SEC (on a non-public basis) if a Fund’s holdings of Illiquid Investments exceed 15% of the Fund’s assets.
At a meeting held on March 25-27, 2024, the Committee presented a report to the Board that addressed the operation of the
Program and assessed the Program’s adequacy and effectiveness of implementation (the “Report”). The Report covered the period from January 1, 2023 through December 31, 2023 (the “Program Reporting Period”). The Report discussed notable events affecting liquidity over the Program Reporting Period, including the impact of the end of an aggressive rate hike cycle, signs that inflation was abating and market liquidity was reverting to normal, and the overall market. The Report noted that there were no material changes to the Program during the Program Reporting Period.
The Report stated, in relevant part, that during the Program Reporting Period:
| ∎ | The Program, as adopted and implemented, remained reasonably designed to assess and manage the Fund’s liquidity risk and was operated effectively to achieve that goal; |
| ∎ | The Fund’s investment strategy remained appropriate for an open-end fund; |
| ∎ | The Fund was able to meet requests for redemption without significant dilution of remaining investors’ interests in the Fund; |
| ∎ | The Fund did not breach the 15% limit on Illiquid Investments; and |
| ∎ | The Fund primarily held Highly Liquid Investments and therefore has not adopted an HLIM. |
|
|
This report must be accompanied or preceded by a currently effective Fund prospectus, which contains more complete information, including sales charges and expenses. Investors should read it carefully before investing. |
|
| |
| NOT FDIC INSURED | MAY LOSE VALUE | NO BANK GUARANTEE |
| | |
| 6 | | Invesco Value Opportunities Fund |
Fund Information
Portfolio Composition
| | |
| By sector | | % of total net assets |
| |
Industrials | | 20.79% |
| |
Financials | | 17.54 |
| |
Health Care | | 12.68 |
| |
Energy | | 10.97 |
| |
Materials | | 10.83 |
| |
Information Technology | | 9.85 |
| |
Utilities | | 6.47 |
| |
Consumer Staples | | 4.77 |
| |
Consumer Discretionary | | 4.48 |
| |
Money Market Funds Plus Other Assets Less Liabilities | | 1.62 |
Top 10 Equity Holdings*
| | | | |
| | | | | % of total net assets |
| | |
| 1. | | Vertiv Holdings Co., Class A | | 3.86% |
| | |
| 2. | | Vistra Corp. | | 3.39 |
| | |
| 3. | | Coherent Corp. | | 3.14 |
| | |
| 4. | | Expedia Group, Inc. | | 3.11 |
| | |
| 5. | | NRG Energy, Inc. | | 3.08 |
| | |
| 6. | | Lumentum Holdings, Inc. | | 2.98 |
| | |
| 7. | | Fidelity National Information Services, Inc. | | 2.88 |
| | |
| 8. | | Centene Corp. | | 2.87 |
| | |
| 9. | | Avantor, Inc. | | 2.57 |
| | |
| 10. | | Freeport-McMoRan, Inc. | | 2.55 |
The Fund’s holdings are subject to change, and there is no assurance that the Fund will continue to hold any particular security.
| * | Excluding money market fund holdings, if any. |
Data presented here are as of April 30, 2024.
| | |
| 7 | | Invesco Value Opportunities Fund |
Schedule of Investments(a)
April 30, 2024
| | | | | | |
| | | Shares | | | Value |
|
|
Common Stocks & Other Equity Interests–98.38% |
Aerospace & Defense–2.12% |
| | |
Leonardo S.p.A. (Italy) | | | 3,287,100 | | | $ 75,544,292 |
|
|
| |
Automotive Parts & Equipment–0.87% | | | |
| | |
Dana, Inc. | | | 2,503,668 | | | 31,120,593 |
|
|
| | |
Biotechnology–1.94% | | | | | | |
| | |
Amicus Therapeutics, Inc.(b) | | | 1,098,600 | | | 10,975,014 |
|
|
| | |
Apellis Pharmaceuticals, Inc.(b) | | | 236,800 | | | 10,464,192 |
|
|
| | |
Ascendis Pharma A/S, ADR (Denmark)(b) | | | 85,600 | | | 11,850,464 |
|
|
| | |
Ionis Pharmaceuticals, Inc.(b) | | | 301,700 | | | 12,448,142 |
|
|
| | |
Neurocrine Biosciences, Inc.(b) | | | 91,400 | | | 12,571,156 |
|
|
| | |
Ultragenyx Pharmaceutical, Inc.(b) | | | 253,700 | | | 10,792,398 |
|
|
| | |
| | | | | | 69,101,366 |
|
|
|
Coal & Consumable Fuels–0.76% |
| | |
Cameco Corp. (Canada)(c) | | | 595,644 | | | 27,179,236 |
|
|
|
Communications Equipment–2.98% |
| | |
Lumentum Holdings, Inc.(b)(c) | | | 2,426,437 | | | 106,180,883 |
|
|
|
Construction & Engineering–3.86% |
| | |
AECOM | | | 661,226 | | | 61,070,833 |
|
|
| | |
MasTec, Inc.(b) | | | 859,900 | | | 76,264,531 |
|
|
| | |
| | | | | | 137,335,364 |
|
|
|
Construction Machinery & Heavy Transportation Equipment– 1.27% |
| | |
Oshkosh Corp. | | | 403,146 | | | 45,261,201 |
|
|
| | |
Copper–2.55% | | | | | | |
| | |
Freeport-McMoRan, Inc. | | | 1,820,200 | | | 90,900,788 |
|
|
| | |
Diversified Banks–1.83% | | | | | | |
| | |
U.S. Bancorp | | | 1,607,600 | | | 65,316,788 |
|
|
| |
Diversified Chemicals–1.18% | | | |
| | |
Huntsman Corp. | | | 1,764,400 | | | 42,098,584 |
|
|
| |
Diversified Metals & Mining–3.11% | | | |
| | |
Anglo American PLC (South Africa) | | | 1,131,100 | | | 36,961,475 |
|
|
| | |
Teck Resources Ltd., Class B (Canada) | | | 1,503,400 | | | 73,952,246 |
|
|
| | |
| | | | | | 110,913,721 |
|
|
|
Electric Utilities–3.08% |
| | |
NRG Energy, Inc. | | | 1,509,800 | | | 109,717,166 |
|
|
|
Electrical Components & Equipment–3.86% |
| | |
Vertiv Holdings Co., Class A | | | 1,479,906 | | | 137,631,257 |
|
|
|
Electronic Components–3.14% |
| | |
Coherent Corp.(b) | | | 2,045,344 | | | 111,737,143 |
|
|
|
Electronic Manufacturing Services–1.70% |
| | |
Flex Ltd.(b) | | | 2,113,523 | | | 60,552,434 |
|
|
| | |
Food Distributors–3.10% | | | | | | |
| | |
Performance Food Group Co.(b) | | | 782,654 | | | 53,126,554 |
|
|
| | |
US Foods Holding Corp.(b) | | | 1,142,216 | | | 57,396,354 |
|
|
| | |
| | | | | | 110,522,908 |
|
|
| | | | | | |
| | | Shares | | | Value |
|
|
Gold–1.96% | | | | | | |
| | |
Agnico Eagle Mines Ltd. (Canada) | | | 1,100,170 | | | $ 69,695,769 |
|
|
|
Health Care Distributors–1.54% |
Henry Schein, Inc.(b)(c) | | | 793,400 | | | 54,966,752 |
|
|
|
Health Care Facilities–1.03% |
Universal Health Services, Inc., Class B | | | 215,310 | | | 36,695,283 |
|
|
|
Health Care Services–0.47% |
Fresenius Medical Care AG (Germany) | | | 393,000 | | | 16,546,363 |
|
|
|
Hotels, Resorts & Cruise Lines–3.61% |
Expedia Group, Inc.(b) | | | 821,500 | | | 110,598,545 |
|
|
Travel + Leisure Co. | | | 409,632 | | | 17,835,377 |
|
|
| | | | | | 128,433,922 |
|
|
| | |
Household Products–1.67% | | | | | | |
Spectrum Brands Holdings, Inc.(c) | | | 725,171 | | | 59,369,750 |
|
|
|
Human Resource & Employment Services–0.77% |
ManpowerGroup, Inc. | | | 364,904 | | | 27,532,007 |
|
|
|
Independent Power Producers & Energy Traders–3.39% |
Vistra Corp. | | | 1,591,700 | | | 120,714,528 |
|
|
|
Industrial Machinery & Supplies & Components–1.44% |
Chart Industries, Inc.(b)(c) | | | 357,000 | | | 51,429,420 |
|
|
| | |
Insurance Brokers–1.95% | | | | | | |
Willis Towers Watson PLC | | | 276,600 | | | 69,465,324 |
|
|
| | |
Integrated Oil & Gas–1.63% | | | | | | |
Cenovus Energy, Inc. (Canada) | | | 2,821,100 | | | 58,001,816 |
|
|
|
Investment Banking & Brokerage–1.60% |
Goldman Sachs Group, Inc. (The) | | | 133,500 | | | 56,965,785 |
|
|
| | |
Life & Health Insurance–1.41% | | | | | | |
Globe Life, Inc.(c) | | | 660,500 | | | 50,310,285 |
|
|
|
Life Sciences Tools & Services–2.57% |
Avantor, Inc.(b) | | | 3,771,200 | | | 91,376,176 |
|
|
| | |
Managed Health Care–4.38% | | | | | | |
Centene Corp.(b) | | | 1,396,721 | | | 102,044,436 |
|
|
Molina Healthcare, Inc.(b) | | | 157,400 | | | 53,846,540 |
|
|
| | | | | | 155,890,976 |
|
|
|
Oil & Gas Exploration & Production–6.51% |
APA Corp. | | | 1,520,700 | | | 47,810,808 |
|
|
ARC Resources Ltd. (Canada) | | | 3,359,300 | | | 60,834,162 |
|
|
EQT Corp. | | | 1,031,500 | | | 41,352,835 |
|
|
Murphy Oil Corp.(c) | | | 634,300 | | | 28,315,152 |
|
|
Southwestern Energy Co.(b) | | | 7,124,900 | | | 53,365,501 |
|
|
| | | | | | 231,678,458 |
|
|
|
Oil & Gas Refining & Marketing–0.87% |
Phillips 66 | | | 217,200 | | | 31,105,212 |
|
|
|
Oil & Gas Storage & Transportation–1.20% |
New Fortress Energy, Inc.(c) | | | 1,629,350 | | | 42,688,970 |
|
|
See accompanying Notes to Financial Statements which are an integral part of the financial statements.
| | |
| 8 | | Invesco Value Opportunities Fund |
| | | | | | |
| | | Shares | | | Value |
|
|
Paper & Plastic Packaging Products & Materials–0.70% |
Sealed Air Corp. | | | 794,700 | | | $ 25,017,156 |
|
|
|
Pharmaceuticals–0.75% |
Axsome Therapeutics, Inc.(b)(c) | | | 176,700 | | | 13,033,392 |
|
|
Intra-Cellular Therapies, Inc.(b) | | | 188,200 | | | 13,514,642 |
|
|
| | | | | | 26,548,034 |
|
|
|
Regional Banks–7.87% |
Huntington Bancshares, Inc. | | | 6,557,099 | | | 88,324,123 |
|
|
Pinnacle Financial Partners, Inc. | | | 836,000 | | | 64,121,200 |
|
|
Webster Financial Corp. | | | 1,226,832 | | | 53,772,047 |
|
|
Western Alliance Bancorporation | | | 1,305,900 | | | 74,214,297 |
|
|
| | | | | | 280,431,667 |
|
|
|
Research & Consulting Services–4.25% |
Jacobs Solutions, Inc. | | | 463,000 | | | 66,454,390 |
|
|
KBR, Inc. | | | 1,306,100 | | | 84,818,134 |
|
|
| | | | | | 151,272,524 |
|
|
|
Semiconductor Materials & Equipment–2.03% |
MKS Instruments, Inc.(c) | | | 607,723 | | | 72,306,883 |
|
|
|
Silver–1.33% |
Pan American Silver Corp. (Canada) | | | 2,568,072 | | | 47,355,248 |
|
|
|
Trading Companies & Distributors–3.22% |
Air Lease Corp., Class A(c) | | | 1,352,400 | | | 67,944,576 |
|
|
WESCO International, Inc. | | | 306,900 | | | 46,878,975 |
|
|
| | | | | | 114,823,551 |
|
|
|
Transaction & Payment Processing Services–2.88% |
Fidelity National Information Services, Inc. | | | 1,510,700 | | | 102,606,744 |
|
|
Total Common Stocks & Other Equity Interests
(Cost $2,788,837,091) | | | 3,504,342,327 |
|
|
| | | | | | |
| | | Shares | | | Value |
|
|
Money Market Funds–1.46% |
Invesco Government & Agency Portfolio, Institutional Class, 5.23%(d)(e) | | | 18,271,732 | | | $ 18,271,732 |
|
|
Invesco Liquid Assets Portfolio, Institutional Class, 5.34%(d)(e) | | | 12,910,245 | | | 12,914,118 |
|
|
Invesco Treasury Portfolio, Institutional Class, 5.22%(d)(e) | | | 20,881,981 | | | 20,881,981 |
|
|
Total Money Market Funds
(Cost $52,067,979) | | | 52,067,831 |
|
|
TOTAL INVESTMENTS IN SECURITIES
(excluding investments purchased with cash collateral from securities on loan)-99.84%
(Cost $2,840,905,070) | | | 3,556,410,158 |
|
|
|
Investments Purchased with Cash Collateral from Securities on Loan |
Money Market Funds–5.99% | | | | | | |
Invesco Private Government Fund, 5.29%(d)(e)(f) | | | 59,695,901 | | | 59,695,901 |
|
|
Invesco Private Prime Fund,
5.46%(d)(e)(f) | | | 153,484,971 | | | 153,531,017 |
|
|
Total Investments Purchased with Cash Collateral from Securities on Loan
(Cost $213,236,268) | | | 213,226,918 |
|
|
TOTAL INVESTMENTS IN SECURITIES–105.83%
(Cost $3,054,141,338) | | | 3,769,637,076 |
|
|
OTHER ASSETS LESS LIABILITIES–(5.83)% | | | (207,586,890) |
|
|
NET ASSETS–100.00% | | | $3,562,050,186 |
|
|
Investment Abbreviations:
ADR – American Depositary Receipt
Notes to Schedule of Investments:
| (a) | Industry and/or sector classifications used in this report are generally according to the Global Industry Classification Standard, which was developed by and is the exclusive property and a service mark of MSCI Inc. and Standard & Poor’s. |
| (b) | Non-income producing security. |
| (c) | All or a portion of this security was out on loan at April 30, 2024. |
| (d) | Affiliated holding. Affiliated holdings are investments in entities which are under common ownership or control of Invesco Ltd. or are investments in entities in which the Fund owns 5% or more of the outstanding voting securities. The table below shows the Fund’s transactions in, and earnings from, its investments in affiliates for the fiscal year ended April 30, 2024. |
| | | | | | | | | | | | | | | | | | | | | | | | | | | | |
| | | Value April 30, 2023 | | | Purchases at Cost | | | Proceeds from Sales | | | Change in Unrealized Appreciation (Depreciation) | | | Realized Gain | | | Value April 30, 2024 | | | Dividend Income | |
| Investments in Affiliated Money Market Funds: | | | | | | | | | | | | | | | | | | | | | | | | | | | | |
Invesco Government & Agency Portfolio, Institutional Class | | | $ 33,035,494 | | | | $ 326,241,568 | | | | $ (341,005,330) | | | | $ - | | | | $ - | | | | $ 18,271,732 | | | | $ 1,114,289 | |
Invesco Liquid Assets Portfolio, Institutional Class | | | 23,460,147 | | | | 233,029,691 | | | | (243,575,236) | | | | (4,309) | | | | 3,825 | | | | 12,914,118 | | | | 805,858 | |
Invesco Treasury Portfolio, Institutional Class | | | 37,754,851 | | | | 372,847,505 | | | | (389,720,375) | | | | - | | | | - | | | | 20,881,981 | | | | 1,266,293 | |
| Investments Purchased with Cash Collateral from Securities on Loan: | | | | | | | | | | | | | | | | | | | | | | | | | | | | |
Invesco Private Government Fund | | | 28,820,789 | | | | 661,322,542 | | | | (630,447,430) | | | | - | | | | - | | | | 59,695,901 | | | | 1,934,883* | |
Invesco Private Prime Fund | | | 69,737,895 | | | | 1,390,722,430 | | | | (1,306,949,769) | | | | (7,828) | | | | 28,289 | | | | 153,531,017 | | | | 5,161,637* | |
Total | | | $192,809,176 | | | | $2,984,163,736 | | | | $(2,911,698,140) | | | | $(12,137) | | | | $32,114 | | | | $265,294,749 | | | | $10,282,960 | |
| | * | Represents the income earned on the investment of cash collateral, which is included in securities lending income on the Statement of Operations. Does not include rebates and fees paid to lending agent or premiums received from borrowers, if any. |
See accompanying Notes to Financial Statements which are an integral part of the financial statements.
| | |
| 9 | | Invesco Value Opportunities Fund |
| (e) | The rate shown is the 7-day SEC standardized yield as of April 30, 2024. |
| (f) | The security has been segregated to satisfy the commitment to return the cash collateral received in securities lending transactions upon the borrower’s return of the securities loaned. See Note 1I. |
| | | | | | | | | | | | | | |
| Open Forward Foreign Currency Contracts | |
| | | | | | | | Unrealized | |
| Settlement | | | | Contract to | | | Appreciation | |
| | | | | | | | | | |
| Date | | Counterparty | | Deliver | | | Receive | | | (Depreciation) | |
| Currency Risk | | | | | | | | | | | | | | |
| 05/20/2024 | | UBS AG | | GBP | 2,149,090 | | | USD | 2,685,995 | | | | $ 359 | |
| | | | |
| Currency Risk | | | | | | | | | | | | | | |
| 05/20/2024 | | Goldman Sachs International | | GBP | 4,580,955 | | | USD | 5,723,903 | | | | (742 | ) |
| 05/20/2024 | | Merrill Lynch International | | EUR | 87,828,455 | | | USD | 93,476,501 | | | | (317,158 | ) |
| 05/20/2024 | | Merrill Lynch International | | GBP | 24,375,325 | | | USD | 30,343,787 | | | | (117,128 | ) |
Subtotal–Depreciation | | | | | | | | | | | (435,028 | ) |
Total Forward Foreign Currency Contracts | | | | | | | | | | | $(434,669 | ) |
Abbreviations:
EUR – Euro
GBP – British Pound Sterling
USD – U.S. Dollar
See accompanying Notes to Financial Statements which are an integral part of the financial statements.
| | |
| 10 | | Invesco Value Opportunities Fund |
Statement of Assets and Liabilities
April 30, 2024
| | | | |
Assets: | | | | |
| |
Investments in unaffiliated securities, at value
(Cost $2,788,837,091)* | | $ | 3,504,342,327 | |
|
| |
| |
Investments in affiliated money market funds, at value (Cost $265,304,247) | | | 265,294,749 | |
|
| |
| |
Other investments: | | | | |
Unrealized appreciation on forward foreign currency contracts outstanding | | | 359 | |
|
| |
| |
Foreign currencies, at value (Cost $440,783) | | | 439,127 | |
|
| |
| |
Receivable for: | | | | |
Fund shares sold | | | 7,542,993 | |
|
| |
| |
Dividends | | | 2,209,012 | |
|
| |
| |
Investment for trustee deferred compensation and retirement plans | | | 614,068 | |
|
| |
| |
Other assets | | | 73,153 | |
|
| |
| |
Total assets | | | 3,780,515,788 | |
|
| |
| |
Liabilities: | | | | |
Other investments: | | | | |
Unrealized depreciation on forward foreign currency contracts outstanding | | | 435,028 | |
|
| |
Payable for: | | | | |
| |
Fund shares reacquired | | | 2,553,130 | |
|
| |
| |
Collateral upon return of securities loaned | | | 213,236,268 | |
|
| |
| |
Accrued fees to affiliates | | | 1,509,666 | |
|
| |
| |
Accrued other operating expenses | | | 4,579 | |
|
| |
| |
Trustee deferred compensation and retirement plans | | | 726,931 | |
|
| |
| |
Total liabilities | | | 218,465,602 | |
|
| |
| |
Net assets applicable to shares outstanding | | $ | 3,562,050,186 | |
|
| |
| |
Net assets consist of: | | | | |
Shares of beneficial interest | | $ | 2,820,711,249 | |
|
| |
Distributable earnings | | | 741,338,937 | |
|
| |
| |
| | $ | 3,562,050,186 | |
|
| |
| | | | |
Net Assets: | | | | |
| |
Class A | | $ | 2,462,836,814 | |
|
| |
| |
Class C | | $ | 59,749,984 | |
|
| |
| |
Class R | | $ | 80,905,345 | |
|
| |
| |
Class Y | | $ | 418,661,931 | |
|
| |
| |
Class R5 | | $ | 16,560,204 | |
|
| |
| |
Class R6 | | $ | 523,335,908 | |
|
| |
|
Shares outstanding, no par value, with an unlimited number of shares authorized: | |
| |
Class A | | | 126,607,333 | |
|
| |
| |
Class C | | | 3,417,620 | |
|
| |
| |
Class R | | | 4,242,274 | |
|
| |
| |
Class Y | | | 21,376,337 | |
|
| |
| |
Class R5 | | | 836,417 | |
|
| |
| |
Class R6 | | | 26,375,226 | |
|
| |
Class A: | | | | |
| |
Net asset value per share | | $ | 19.45 | |
|
| |
| |
Maximum offering price per share
(Net asset value of $19.45 ÷ 94.50%) | | $ | 20.58 | |
|
| |
Class C: | | | | |
| |
Net asset value and offering price per share | | $ | 17.48 | |
|
| |
Class R: | | | | |
| |
Net asset value and offering price per share | | $ | 19.07 | |
|
| |
Class Y: | | | | |
| |
Net asset value and offering price per share | | $ | 19.59 | |
|
| |
Class R5: | | | | |
| |
Net asset value and offering price per share | | $ | 19.80 | |
|
| |
Class R6: | | | | |
| |
Net asset value and offering price per share | | $ | 19.84 | |
|
| |
| * | At April 30, 2024, securities with an aggregate value of $203,439,938 were on loan to brokers. |
See accompanying Notes to Financial Statements which are an integral part of the financial statements.
| | |
| 11 | | Invesco Value Opportunities Fund |
Statement of Operations
For the year ended April 30, 2024
| | | | |
Investment income: | | | | |
| |
Dividends (net of foreign withholding taxes of $1,153,060) | | $ | 46,299,137 | |
|
| |
| |
Dividends from affiliated money market funds (includes net securities lending income of $222,489) | | | 3,408,929 | |
|
| |
Total investment income | | | 49,708,066 | |
|
| |
| |
Expenses: | | | | |
| |
Advisory fees | | | 18,772,426 | |
|
| |
| |
Administrative services fees | | | 471,280 | |
|
| |
| |
Custodian fees | | | 36,824 | |
|
| |
| |
Distribution fees: | | | | |
Class A | | | 5,536,693 | |
|
| |
Class C | | | 568,157 | |
|
| |
Class R | | | 369,353 | |
|
| |
| |
Transfer agent fees – A, C, R and Y | | | 4,370,359 | |
|
| |
| |
Transfer agent fees – R5 | | | 11,574 | |
|
| |
| |
Transfer agent fees – R6 | | | 107,399 | |
|
| |
| |
Trustees’ and officers’ fees and benefits | | | 59,827 | |
|
| |
| |
Registration and filing fees | | | 149,624 | |
|
| |
| |
Reports to shareholders | | | 534,704 | |
|
| |
| |
Professional services fees | | | 83,599 | |
|
| |
| |
Other | | | 42,431 | |
|
| |
Total expenses | | | 31,114,250 | |
|
| |
Less: Fees waived and/or expense offset arrangement(s) | | | (178,185 | ) |
|
| |
Net expenses | | | 30,936,065 | |
|
| |
Net investment income | | | 18,772,001 | |
|
| |
| |
Realized and unrealized gain (loss) from: | | | | |
| |
Net realized gain (loss) from: | | | | |
Unaffiliated investment securities | | | 174,891,992 | |
|
| |
Affiliated investment securities | | | 32,114 | |
|
| |
Foreign currencies | | | (6,023 | ) |
|
| |
Forward foreign currency contracts | | | 6,633,403 | |
|
| |
| | | 181,551,486 | |
|
| |
| |
Change in net unrealized appreciation (depreciation) of: | | | | |
Unaffiliated investment securities | | | 621,471,569 | |
|
| |
Affiliated investment securities | | | (12,137 | ) |
|
| |
Foreign currencies | | | (10,447 | ) |
|
| |
Forward foreign currency contracts | | | (239,793 | ) |
|
| |
| | | 621,209,192 | |
|
| |
| |
Net realized and unrealized gain | | | 802,760,678 | |
|
| |
| |
Net increase in net assets resulting from operations | | $ | 821,532,679 | |
|
| |
See accompanying Notes to Financial Statements which are an integral part of the financial statements.
| | |
| 12 | | Invesco Value Opportunities Fund |
Statement of Changes in Net Assets
For the years ended April 30, 2024 and 2023
| | | | | | | | |
| | | 2024 | | | 2023 | |
|
| |
Operations: | | | | | | | | |
Net investment income | | $ | 18,772,001 | | | $ | 18,249,429 | |
|
| |
Net realized gain | | | 181,551,486 | | | | 22,265,718 | |
|
| |
Change in net unrealized appreciation (depreciation) | | | 621,209,192 | | | | (177,868,717 | ) |
|
| |
Net increase (decrease) in net assets resulting from operations | | | 821,532,679 | | | | (137,353,570 | ) |
|
| |
| | |
Distributions to shareholders from distributable earnings: | | | | | | | | |
Class A | | | (51,372,437 | ) | | | (68,612,556 | ) |
|
| |
Class C | | | (1,462,833 | ) | | | (1,654,187 | ) |
|
| |
Class R | | | (1,736,109 | ) | | | (1,280,060 | ) |
|
| |
Class Y | | | (7,341,891 | ) | | | (11,608,802 | ) |
|
| |
Class R5 | | | (220,685 | ) | | | (28,476 | ) |
|
| |
Class R6 | | | (7,718,078 | ) | | | (24,873,218 | ) |
|
| |
Total distributions from distributable earnings | | | (69,852,033 | ) | | | (108,057,299 | ) |
|
| |
| | |
Share transactions–net: | | | | | | | | |
Class A | | | (159,564,572 | ) | | | 1,517,501,777 | |
|
| |
Class C | | | (14,054,637 | ) | | | 49,167,618 | |
|
| |
Class R | | | (7,729,602 | ) | | | 65,002,994 | |
|
| |
Class Y | | | 61,836,823 | | | | 179,925,533 | |
|
| |
Class R5 | | | 4,261,287 | | | | 9,856,926 | |
|
| |
Class R6 | | | 110,226,064 | | | | 108,688,495 | |
|
| |
Net increase (decrease) in net assets resulting from share transactions | | | (5,024,637 | ) | | | 1,930,143,343 | |
|
| |
Net increase in net assets | | | 746,656,009 | | | | 1,684,732,474 | |
|
| |
| | |
Net assets: | | | | | | | | |
Beginning of year | | | 2,815,394,177 | | | | 1,130,661,703 | |
|
| |
End of year | | $ | 3,562,050,186 | | | $ | 2,815,394,177 | |
|
| |
See accompanying Notes to Financial Statements which are an integral part of the financial statements.
| | |
| 13 | | Invesco Value Opportunities Fund |
Financial Highlights
The following schedule presents financial highlights for a share of the Fund outstanding throughout the periods indicated.
| | | | | | | | | | | | | | | | | | | | | | | | | | | | | | | | | | | | | | | | | | | | | | | | | | | | | | | | |
| | | Net asset value, beginning of period | | Net investment income (loss)(a) | | Net gains (losses) on securities (both realized and unrealized) | | Total from investment operations | | Dividends from net investment income | | Distributions from net realized gains | | Total distributions | | Net asset value, end of period | | Total return(b) | | Net assets, end of period (000’s omitted) | | Ratio of expenses to average net assets with fee waivers and/or expenses absorbed | | Ratio of expenses to average net assets without fee waivers and/or expenses absorbed | | Ratio of net investment income (loss) to average net assets | | Portfolio turnover (c) |
Class A | | | | | | | | | | | | | | | | | | | | | | | | | | | | | | | | | | | | | | | | | | | | | | | | | | | | | | | | |
Year ended 04/30/24 | | | $15.23 | | | | $ 0.10 | | | | $ 4.53 | | | | $ 4.63 | | | | $(0.04 | ) | | | $(0.37 | ) | | | $(0.41 | ) | | | $19.45 | | | | 30.70 | % | | | $2,462,837 | | | | 1.07 | % | | | 1.07 | % | | | 0.57 | % | | | 47 | % |
Year ended 04/30/23 | | | 16.52 | | | | 0.18 | | | | 0.07 | | | | 0.25 | | | | (0.12 | ) | | | (1.42 | ) | | | (1.54 | ) | | | 15.23 | | | | 1.09 | | | | 2,074,880 | | | | 1.08 | | | | 1.08 | | | | 1.12 | | | | 70 | |
Year ended 04/30/22 | | | 17.34 | | | | 0.08 | | | | 0.60 | | | | 0.68 | | | | (0.10 | ) | | | (1.40 | ) | | | (1.50 | ) | | | 16.52 | | | | 4.01 | | | | 739,860 | | | | 1.11 | | | | 1.11 | | | | 0.44 | | | | 65 | |
Year ended 04/30/21 | | | 9.44 | | | | 0.06 | | | | 7.87 | | | | 7.93 | | | | (0.03 | ) | | | – | | | | (0.03 | ) | | | 17.34 | | | | 84.15 | | | | 726,801 | | | | 1.22 | | | | 1.22 | | | | 0.45 | | | | 62 | |
Year ended 04/30/20 | | | 12.84 | | | | 0.03 | | | | (3.18 | )(d) | | | (3.15 | ) | | | – | | | | (0.25 | ) | | | (0.25 | ) | | | 9.44 | | | | (25.02 | )(d) | | | 440,826 | | | | 1.21 | | | | 1.21 | | | | 0.27 | | | | 41 | |
Class C | | | | | | | | | | | | | | | | | | | | | | | | | | | | | | | | | | | | | | | | | | | | | | | | | | | | | | | | |
Year ended 04/30/24 | | | 13.82 | | | | (0.02 | ) | | | 4.09 | | | | 4.07 | | | | (0.04 | ) | | | (0.37 | ) | | | (0.41 | ) | | | 17.48 | | | | 29.77 | (e) | | | 59,750 | | | | 1.79 | (e) | | | 1.79 | (e) | | | (0.15 | )(e) | | | 47 | |
Year ended 04/30/23 | | | 15.14 | | | | 0.06 | | | | 0.06 | | | | 0.12 | | | | (0.02 | ) | | | (1.42 | ) | | | (1.44 | ) | | | 13.82 | | |
| 0.37
| (e)
| | | 60,082 | | | | 1.80 | (e) | | | 1.80 | (e) | | | 0.40 | (e) | | | 70 | |
Year ended 04/30/22 | | | 16.04 | | | | (0.05 | ) | | | 0.55 | | | | 0.50 | | | | – | | | | (1.40 | ) | | | (1.40 | ) | | | 15.14 | | | | 3.16 | | | | 16,682 | | | | 1.86 | | | | 1.86 | | | | (0.31 | ) | | | 65 | |
Year ended 04/30/21 | | | 8.77 | | | | (0.02 | ) | | | 7.29 | | | | 7.27 | | | | – | | | | – | | | | – | | | | 16.04 | | | | 82.90 | (e) | | | 12,906 | | | | 1.89 | (e) | | | 1.89 | (e) | | | (0.22 | )(e) | | | 62 | |
Year ended 04/30/20 | | | 12.02 | | | | (0.04 | ) | | | (2.96 | )(d) | | | (3.00 | ) | | | – | | | | (0.25 | ) | | | (0.25 | ) | | | 8.77 | | | | (25.48 | )(d)(e) | | | 10,107 | | | | 1.85 | (e) | | | 1.85 | (e) | | | (0.37 | )(e) | | | 41 | |
Class R | | | | | | | | | | | | | | | | | | | | | | | | | | | | | | | | | | | | | | | | | | | | | | | | | | | | | | | | |
Year ended 04/30/24 | | | 14.97 | | | | 0.05 | | | | 4.46 | | | | 4.51 | | | | (0.04 | ) | | | (0.37 | ) | | | (0.41 | ) | | | 19.07 | | | | 30.43 | | | | 80,905 | | | | 1.32 | | | | 1.32 | | | | 0.32 | | | | 47 | |
Year ended 04/30/23 | | | 16.27 | | | | 0.14 | | | | 0.06 | | | | 0.20 | | | | (0.08 | ) | | | (1.42 | ) | | | (1.50 | ) | | | 14.97 | | | | 0.82 | | | | 70,744 | | | | 1.33 | | | | 1.33 | | | | 0.87 | | | | 70 | |
Year ended 04/30/22 | | | 17.09 | | | | 0.03 | | | | 0.60 | | | | 0.63 | | | | (0.05 | ) | | | (1.40 | ) | | | (1.45 | ) | | | 16.27 | | | | 3.73 | | | | 12,018 | | | | 1.36 | | | | 1.36 | | | | 0.19 | | | | 65 | |
Year ended 04/30/21 | | | 9.31 | | | | 0.03 | | | | 7.75 | | | | 7.78 | | | | – | | | | – | | | | – | | | | 17.09 | | | | 83.57 | | | | 10,385 | | | | 1.47 | | | | 1.47 | | | | 0.20 | | | | 62 | |
Year ended 04/30/20 | | | 12.69 | | | | 0.00 | | | | (3.13 | )(d) | | | (3.13 | ) | | | – | | | | (0.25 | ) | | | (0.25 | ) | | | 9.31 | | | | (25.16 | )(d) | | | 6,362 | | | | 1.46 | | | | 1.46 | | | | 0.02 | | | | 41 | |
Class Y | | | | | | | | | | | | | | | | | | | | | | | | | | | | | | | | | | | | | | | | | | | | | | | | | | | | | | | | |
Year ended 04/30/24 | | | 15.29 | | | | 0.14 | | | | 4.57 | | | | 4.71 | | | | (0.04 | ) | | | (0.37 | ) | | | (0.41 | ) | | | 19.59 | | | | 31.11 | | | | 418,662 | | | | 0.82 | | | | 0.82 | | | | 0.82 | | | | 47 | |
Year ended 04/30/23 | | | 16.58 | | | | 0.22 | | | | 0.07 | | | | 0.29 | | | | (0.16 | ) | | | (1.42 | ) | | | (1.58 | ) | | | 15.29 | | | | 1.33 | | | | 276,929 | | | | 0.83 | | | | 0.83 | | | | 1.37 | | | | 70 | |
Year ended 04/30/22 | | | 17.42 | | | | 0.12 | | | | 0.61 | | | | 0.73 | | | | (0.17 | ) | | | (1.40 | ) | | | (1.57 | ) | | | 16.58 | | | | 4.25 | | | | 123,154 | | | | 0.86 | | | | 0.86 | | | | 0.69 | | | | 65 | |
Year ended 04/30/21 | | | 9.49 | | | | 0.09 | | | | 7.91 | | | | 8.00 | | | | (0.07 | ) | | | – | | | | (0.07 | ) | | | 17.42 | | | | 84.48 | | | | 81,115 | | | | 0.97 | | | | 0.97 | | | | 0.70 | | | | 62 | |
Year ended 04/30/20 | | | 12.86 | | | | 0.06 | | | | (3.18 | )(d) | | | (3.12 | ) | | | – | | | | (0.25 | ) | | | (0.25 | ) | | | 9.49 | | | | (24.74 | )(d) | | | 23,760 | | | | 0.96 | | | | 0.96 | | | | 0.52 | | | | 41 | |
Class R5 | | | | | | | | | | | | | | | | | | | | | | | | | | | | | | | | | | | | | | | | | | | | | | | | | | | | | | | | |
Year ended 04/30/24 | | | 15.45 | | | | 0.15 | | | | 4.61 | | | | 4.76 | | | | (0.04 | ) | | | (0.37 | ) | | | (0.41 | ) | | | 19.80 | | | | 31.11 | | | | 16,560 | | | | 0.76 | | | | 0.76 | | | | 0.88 | | | | 47 | |
Year ended 04/30/23 | | | 16.74 | | | | 0.22 | | | | 0.08 | | | | 0.30 | | | | (0.17 | ) | | | (1.42 | ) | | | (1.59 | ) | | | 15.45 | | | | 1.37 | | | | 9,322 | | | | 0.78 | | | | 0.78 | | | | 1.42 | | | | 70 | |
Year ended 04/30/22 | | | 17.58 | | | | 0.13 | | | | 0.62 | | | | 0.75 | | | | (0.19 | ) | | | (1.40 | ) | | | (1.59 | ) | | | 16.74 | | | | 4.35 | | | | 311 | | | | 0.81 | | | | 0.81 | | | | 0.74 | | | | 65 | |
Year ended 04/30/21 | | | 9.58 | | | | 0.11 | | | | 7.98 | | | | 8.09 | | | | (0.09 | ) | | | – | | | | (0.09 | ) | | | 17.58 | | | | 84.70 | | | | 714 | | | | 0.84 | | | | 0.84 | | | | 0.83 | | | | 62 | |
Year ended 04/30/20 | | | 12.95 | | | | 0.08 | | | | (3.20 | )(d) | | | (3.12 | ) | | | – | | | | (0.25 | ) | | | (0.25 | ) | | | 9.58 | | | | (24.57 | )(d) | | | 406 | | | | 0.80 | | | | 0.80 | | | | 0.68 | | | | 41 | |
Class R6 | | | | | | | | | | | | | | | | | | | | | | | | | | | | | | | | | | | | | | | | | | | | | | | | | | | | | | | | |
Year ended 04/30/24 | | | 15.47 | | | | 0.16 | | | | 4.62 | | | | 4.78 | | | | (0.04 | ) | | | (0.37 | ) | | | (0.41 | ) | | | 19.84 | | | | 31.20 | | | | 523,336 | | | | 0.69 | | | | 0.69 | | | | 0.95 | | | | 47 | |
Year ended 04/30/23 | | | 16.75 | | | | 0.24 | | | | 0.08 | | | | 0.32 | | | | (0.18 | ) | | | (1.42 | ) | | | (1.60 | ) | | | 15.47 | | | | 1.50 | | | | 323,438 | | | | 0.71 | | | | 0.71 | | | | 1.49 | | | | 70 | |
Year ended 04/30/22 | | | 17.60 | | | | 0.14 | | | | 0.62 | | | | 0.76 | | | | (0.21 | ) | | | (1.40 | ) | | | (1.61 | ) | | | 16.75 | | | | 4.38 | | | | 238,636 | | | | 0.74 | | | | 0.74 | | | | 0.81 | | | | 65 | |
Year ended 04/30/21 | | | 9.59 | | | | 0.11 | | | | 8.00 | | | | 8.11 | | | | (0.10 | ) | | | – | | | | (0.10 | ) | | | 17.60 | | | | 84.81 | | | | 47,501 | | | | 0.78 | | | | 0.78 | | | | 0.89 | | | | 62 | |
Year ended 04/30/20 | | | 12.97 | | | | 0.09 | | | | (3.22 | )(d) | | | (3.13 | ) | | | – | | | | (0.25 | ) | | | (0.25 | ) | | | 9.59 | | | | (24.61 | )(d) | | | 25,226 | | | | 0.75 | | | | 0.75 | | | | 0.73 | | | | 41 | |
| (a) | Calculated using average shares outstanding. |
| (b) | Includes adjustments in accordance with accounting principles generally accepted in the United States of America and as such, the net asset value for financial reporting purposes and the returns based upon those net asset values may differ from the net asset value and returns for shareholder transactions. Does not include sales charges and is not annualized for periods less than one year, if applicable. |
| (c) | Portfolio turnover is calculated at the fund level and is not annualized for periods less than one year, if applicable. For the year ended April 30, 2023, the portfolio turnover calculation excludes the value of securities purchased of $1,658,856,812 in connection with the acquisition of Invesco American Value Fund into the Fund. |
| (d) | Includes litigation proceeds received during the period. Had these litigation proceeds not been received, Net gains (losses) on securities (both realized and unrealized) per share would have been $(3.28), $(3.06), $(3.23), $(3.28), $(3.30) and $(3.32) for Class A, Class C, Class R, Class Y, Class R5 and Class R6 shares, respectively. Total returns would have been lower. |
| (e) | The total return, ratio of expenses to average net assets and ratio of net investment income (loss) to average net assets reflect actual 12b-1 fees of 0.97%, 0.97%, 0.92% and 0.89% for the years ended April 30, 2024, 2023, 2021 and 2020, respectively. |
See accompanying Notes to Financial Statements which are an integral part of the financial statements.
| | |
| 14 | | Invesco Value Opportunities Fund |
Notes to Financial Statements
April 30, 2024
NOTE 1–Significant Accounting Policies
Invesco Value Opportunities Fund (the “Fund”) is a series portfolio of AIM Sector Funds (Invesco Sector Funds) (the “Trust”). The Trust is a Delaware statutory trust registered under the Investment Company Act of 1940, as amended (the “1940 Act”), as an open-end series management investment company authorized to issue an unlimited number of shares of beneficial interest. Information presented in these financial statements pertains only to the Fund. Matters affecting the Fund or each class will be voted on exclusively by the shareholders of the Fund or each class.
The Fund’s investment objective is total return through growth of capital and current income.
The Fund currently consists of six different classes of shares: Class A, Class C, Class R, Class Y, Class R5 and Class R6. Class Y shares are available only to certain investors. Class A shares are sold with a front-end sales charge unless certain waiver criteria are met. Under certain circumstances, load waived shares may be subject to contingent deferred sales charges (“CDSC”). Class C shares are sold with a CDSC. Class R, Class Y, Class R5 and Class R6 shares are sold at net asset value. Class C shares held for eight years after purchase are eligible for automatic conversion into Class A shares of the same Fund (the “Conversion Feature”). The automatic conversion pursuant to the Conversion Feature will generally occur at the end of the month following the eighth anniversary after a purchase of Class C shares.
The Fund is an investment company and accordingly follows the investment company accounting and reporting guidance in accordance with Financial Accounting Standards Board Accounting Standards Codification Topic 946, Financial Services – Investment Companies.
The following is a summary of the significant accounting policies followed by the Fund in the preparation of its financial statements.
| A. | Security Valuations – Securities, including restricted securities, are valued according to the following policy. |
A security listed or traded on an exchange is generally valued at its trade price or official closing price that day as of the close of the exchange where the security is principally traded, or lacking any trades or official closing price on a particular day, the security may be valued at the closing bid or ask price on that day. Securities traded in the over-the-counter market are valued based on prices furnished by independent pricing services or market makers. When such securities are valued using prices provided by an independent pricing service they may be considered fair valued. Futures contracts are valued at the daily settlement price set by an exchange on which they are principally traded. Where a final settlement price exists, exchange-traded options are valued at the final settlement price from the exchange where the option principally trades. Where a final settlement price does not exist, exchange-traded options are valued at the mean between the last bid and ask price generally from the exchange where the option principally trades.
Securities of investment companies that are not exchange-traded (e.g., open-end mutual funds) are valued using such company’s end-of-business-day net asset value per share.
Deposits, other obligations of U.S. and non-U.S. banks and financial institutions are valued at their daily account value.
Fixed income securities (including convertible debt securities) generally are valued on the basis of prices provided by independent pricing services. Prices provided by the pricing service may be determined without exclusive reliance on quoted prices, and may reflect appropriate factors such as institution-size trading in similar groups of securities, developments related to specific securities, dividend rate (for unlisted equities), yield (for debt obligations), quality, type of issue, coupon rate (for debt obligations), maturity (for debt obligations), individual trading characteristics and other market data. Pricing services generally value debt obligations assuming orderly transactions of institutional round lot size, but a fund may hold or transact in the same securities in smaller, odd lot sizes. Odd lots often trade at lower prices than institutional round lots, and their value may be adjusted accordingly. Debt obligations are subject to interest rate and credit risks. In addition, all debt obligations involve some risk of default with respect to interest and/or principal payments.
Foreign securities’ (including foreign exchange contracts) prices are converted into U.S. dollar amounts using the applicable exchange rates as of the close of the New York Stock Exchange (“NYSE”). If market quotations are available and reliable for foreign exchange-traded equity securities, the securities will be valued at the market quotations. Invesco Advisers, Inc. (the “Adviser” or “Invesco”) may use various pricing services to obtain market quotations as well as fair value prices. Because trading hours for certain foreign securities end before the close of the NYSE, closing market quotations may become not representative of market value in the Adviser’s judgment (“unreliable”). If, between the time trading ends on a particular security and the close of the customary trading session on the NYSE, a significant event occurs that makes the closing price of the security unreliable, the Adviser may fair value the security. If the event is likely to have affected the closing price of the security, the security will be valued at fair value in good faith in accordance with Board- approved policies and related Adviser procedures (“Valuation Procedures”). Adjustments to closing prices to reflect fair value may also be based on a screening process of an independent pricing service to indicate the degree of certainty, based on historical data, that the closing price in the principal market where a foreign security trades is not the current value as of the close of the NYSE. Foreign securities’ prices meeting the degree of certainty that the price is not reflective of current value will be priced at the indication of fair value from the independent pricing service. Multiple factors may be considered by the independent pricing service in determining adjustments to reflect fair value and may include information relating to sector indices, American Depositary Receipts and domestic and foreign index futures. Foreign securities may have additional risks including exchange rate changes, potential for sharply devalued currencies and high inflation, political and economic upheaval, the relative lack of issuer information, relatively low market liquidity and the potential lack of strict financial and accounting controls and standards.
Unlisted securities will be valued using prices provided by independent pricing services or by another method that the Adviser, in its judgment, believes better reflects the security’s fair value in accordance with the Valuation Procedures.
Non-traded rights and warrants shall be valued at intrinsic value if the terms of the rights and warrants are available, specifically the subscription or exercise price and the ratio. Intrinsic value is calculated as the daily market closing price of the security to be received less the subscription price, which is then adjusted by the exercise ratio. In the case of warrants, an option pricing model supplied by an independent pricing service may be used based on market data such as volatility, stock price and interest rate from the independent pricing service and strike price and exercise period from verified terms.
Securities for which market prices are not provided by any of the above methods may be valued based upon quotes furnished by independent sources. The mean between the last bid and ask prices may be used to value debt obligations, including corporate loans.
Securities for which market quotations are not readily available are fair valued by the Adviser in accordance with the Valuation Procedures. If a fair value price provided by a pricing service is unreliable, the Adviser will fair value the security using the Valuation Procedures. Issuer specific events, market trends, bid/ask quotes of brokers and information providers and other market data may be reviewed in the course of making a good faith determination of a security’s fair value.
The Fund may invest in securities that are subject to interest rate risk, meaning the risk that the prices will generally fall as interest rates rise and, conversely, the prices will generally rise as interest rates fall. Specific securities differ in their sensitivity to changes in interest rates depending on their individual characteristics. Changes in interest rates may result in increased market volatility, which may affect the value and/or liquidity of certain Fund investments.
Valuations change in response to many factors including the historical and prospective earnings of the issuer, the value of the issuer’s assets, general market conditions which are not specifically related to the particular issuer, such as real or perceived adverse economic conditions, changes in the general outlook for revenues or corporate earnings, changes in interest or currency rates, regional or global instability, natural or environmental disasters, widespread disease or other public health issues, war, acts of terrorism, significant governmental actions or adverse investor sentiment generally and market liquidity. Because of the inherent uncertainties of valuation, the values reflected in the financial statements may materially differ from the value received upon actual sale of those investments.
The price the Fund could receive upon the sale of any investment may differ from the Adviser’s valuation of the investment, particularly for securities that are valued using a fair valuation technique. When fair valuation techniques are applied, the Adviser uses available information, including both observable and
| | |
| 15 | | Invesco Value Opportunities Fund |
unobservable inputs and assumptions, to determine a methodology that will result in a valuation that the Adviser believes approximates market value. Fund securities that are fair valued may be subject to greater fluctuation in their value from one day to the next than would be the case if market quotations were used. Because of the inherent uncertainties of valuation, and the degree of subjectivity in such decisions, the Fund could realize a greater or lesser than expected gain or loss upon the sale of the investment.
| B. | Securities Transactions and Investment Income – Securities transactions are accounted for on a trade date basis. Realized gains or losses on sales are computed on the basis of specific identification of the securities sold. Interest income (net of withholding tax, if any) is recorded on an accrual basis from settlement date and includes coupon interest and amortization of premium and accretion of discount on debt securities as applicable. Pay-in-kind interest income and non-cash dividend income received in the form of securities in lieu of cash are recorded at the fair value of the securities received. Dividend income (net of withholding tax, if any) is recorded on the ex-dividend date. |
The Fund may periodically participate in litigation related to Fund investments. As such, the Fund may receive proceeds from litigation settlements. Any proceeds received are included in the Statement of Operations as realized gain (loss) for investments no longer held and as unrealized gain (loss) for investments still held.
Brokerage commissions and mark ups are considered transaction costs and are recorded as an increase to the cost basis of securities purchased and/or a reduction of proceeds on a sale of securities. Such transaction costs are included in the determination of net realized and unrealized gain (loss) from investment securities reported in the Statement of Operations and the Statement of Changes in Net Assets and the net realized and unrealized gains (losses) on securities per share in the Financial Highlights. Transaction costs are included in the calculation of the Fund’s net asset value and, accordingly, they reduce the Fund’s total returns. These transaction costs are not considered operating expenses and are not reflected in net investment income reported in the Statement of Operations and the Statement of Changes in Net Assets, or the net investment income per share and the ratios of expenses and net investment income reported in the Financial Highlights, nor are they limited by any expense limitation arrangements between the Fund and the investment adviser.
The Fund allocates income and realized and unrealized capital gains and losses to a class based on the relative net assets of each class.
| C. | Country Determination – For the purposes of making investment selection decisions and presentation in the Schedule of Investments, the investment adviser may determine the country in which an issuer is located and/or credit risk exposure based on various factors. These factors include the laws of the country under which the issuer is organized, where the issuer maintains a principal office, the country in which the issuer derives 50% or more of its total revenues, the country that has the primary market for the issuer’s securities and its “country of risk” as determined by a third party service provider, as well as other criteria. Among the other criteria that may be evaluated for making this determination are the country in which the issuer maintains 50% or more of its assets, the type of security, financial guarantees and enhancements, the nature of the collateral and the sponsor organization. Country of issuer and/or credit risk exposure has been determined to be the United States of America, unless otherwise noted. |
| D. | Distributions – Distributions from net investment income and net realized capital gain, if any, are generally declared and paid annually and recorded on the ex-dividend date. The Fund may elect to treat a portion of the proceeds from redemptions as distributions for federal income tax purposes. |
| E. | Federal Income Taxes – The Fund intends to comply with the requirements of Subchapter M of the Internal Revenue Code of 1986, as amended (the “Internal Revenue Code”), necessary to qualify as a regulated investment company and to distribute substantially all of the Fund’s taxable earnings to shareholders. As such, the Fund will not be subject to federal income taxes on otherwise taxable income (including net realized capital gain) that is distributed to shareholders. Therefore, no provision for federal income taxes is recorded in the financial statements. |
The Fund recognizes the tax benefits of uncertain tax positions only when the position is more likely than not to be sustained. Management has analyzed the Fund’s uncertain tax positions and concluded that no liability for unrecognized tax benefits should be recorded related to uncertain tax positions. Management is not aware of any tax positions for which it is reasonably possible that the total amounts of unrecognized tax benefits will change materially in the next 12 months.
The Fund files tax returns in the U.S. Federal jurisdiction and certain other jurisdictions. Generally, the Fund is subject to examinations by such taxing authorities for up to three years after the filing of the return for the tax period.
| F. | Expenses – Fees provided for under the Rule 12b-1 plan of a particular class of the Fund are charged to the operations of such class. Transfer agency fees and expenses and other shareholder recordkeeping fees and expenses attributable to Class R5 and Class R6 are allocated based on relative net assets of Class R5 and Class R6. Sub-accounting fees attributable to Class R5 are charged to the operations of the class. Transfer agency fees and expenses and other shareholder recordkeeping fees and expenses relating to all other classes are allocated among those classes based on relative net assets. All other expenses are allocated among the classes based on relative net assets. |
| G. | Accounting Estimates – The preparation of financial statements in conformity with accounting principles generally accepted in the United States of America (“GAAP”) requires management to make estimates and assumptions that affect the reported amounts of assets and liabilities at the date of the financial statements and the reported amounts of revenues and expenses during the reporting period including estimates and assumptions related to taxation. Actual results could differ from those estimates by a significant amount. In addition, the Fund monitors for material events or transactions that may occur or become known after the period-end date and before the date the financial statements are released to print. |
| H. | Indemnifications – Under the Trust’s organizational documents, each Trustee, officer, employee or other agent of the Trust is indemnified against certain liabilities that may arise out of the performance of their duties to the Fund. Additionally, in the normal course of business, the Fund enters into contracts, including the Fund’s servicing agreements, that contain a variety of indemnification clauses. The Fund’s maximum exposure under these arrangements is unknown as this would involve future claims that may be made against the Fund that have not yet occurred. The risk of material loss as a result of such indemnification claims is considered remote. |
| I. | Securities Lending – The Fund may lend portfolio securities having a market value up to one-third of the Fund’s total assets. Such loans are secured by collateral equal to no less than the market value of the loaned securities determined daily by the securities lending provider. Such collateral will be cash or debt securities issued or guaranteed by the U.S. Government or any of its sponsored agencies. Cash collateral received in connection with these loans is invested in short-term money market instruments or affiliated, unregistered investment companies that comply with Rule 2a-7 under the 1940 Act and money market funds (collectively, “affiliated money market funds”) and is shown as such on the Schedule of Investments. The Fund bears the risk of loss with respect to the investment of collateral. It is the Fund’s policy to obtain additional collateral from or return excess collateral to the borrower by the end of the next business day, following the valuation date of the securities loaned. Therefore, the value of the collateral held may be temporarily less than the value of the securities on loan. When loaning securities, the Fund retains certain benefits of owning the securities, including the economic equivalent of dividends or interest generated by the security. Lending securities entails a risk of loss to the Fund if, and to the extent that, the market value of the securities loaned were to increase and the borrower did not increase the collateral accordingly, and the borrower failed to return the securities. The securities loaned are subject to termination at the option of the borrower or the Fund. Upon termination, the borrower will return to the Fund the securities loaned and the Fund will return the collateral. Upon the failure of the borrower to return the securities, collateral may be liquidated and the securities may be purchased on the open market to replace the loaned securities. The Fund could experience delays and costs in gaining access to the collateral and the securities may lose value during the delay which could result in potential losses to the Fund. Some of these losses may be indemnified by the lending agent. The Fund bears the risk of any deficiency in the amount of the collateral available for return to the borrower due to any loss on the collateral invested. Dividends received on cash collateral investments for securities lending transactions, which are net of compensation to counterparties, are included in Dividends from affiliated money market funds on the Statement of Operations. The aggregate value of securities out on loan, if any, is shown as a footnote on the Statement of Assets and Liabilities. |
The Adviser serves as an affiliated securities lending agent for the Fund. The Bank of New York Mellon also serves as a securities lending agent. To the extent the Fund utilizes the Adviser as an affiliated securities lending agent, the Fund conducts its securities lending in accordance with, and in reliance upon, no-action
| | |
| 16 | | Invesco Value Opportunities Fund |
letters issued by the SEC staff that provide guidance on how an affiliate may act as a direct agent lender and receive compensation for those services in a manner consistent with the federal securities laws. For the year ended April 30, 2024, the Fund paid the Adviser $14,510 in fees for securities lending agent services. Fees paid to the Adviser for securities lending agent services, if any, are included in Dividends from affiliated money market funds on the Statement of Operations.
| J. | Foreign Currency Translations – Foreign currency is valued at the close of the NYSE based on quotations posted by banks and major currency dealers. Portfolio securities and other assets and liabilities denominated in foreign currencies are translated into U.S. dollar amounts at the date of valuation. Purchases and sales of portfolio securities (net of foreign taxes withheld on disposition) and income items denominated in foreign currencies are translated into U.S. dollar amounts on the respective dates of such transactions. The Fund does not separately account for the portion of the results of operations resulting from changes in foreign exchange rates on investments and the fluctuations arising from changes in market prices of securities held. The combined results of changes in foreign exchange rates and the fluctuation of market prices on investments (net of estimated foreign tax withholding) are included with the net realized and unrealized gain or loss from investments in the Statement of Operations. Reported net realized foreign currency gains or losses arise from (1) sales of foreign currencies, (2) currency gains or losses realized between the trade and settlement dates on securities transactions, and (3) the difference between the amounts of dividends, interest, and foreign withholding taxes recorded on the Fund’s books and the U.S. dollar equivalent of the amounts actually received or paid. Net unrealized foreign currency gains and losses arise from changes in the fair values of assets and liabilities, other than investments in securities at fiscal period end, resulting from changes in exchange rates. |
The Fund may invest in foreign securities, which may be subject to foreign taxes on income, gains on investments or currency repatriation, a portion of which may be recoverable. Foreign taxes, if any, are recorded based on the tax regulations and rates that exist in the foreign markets in which the Fund invests and are shown in the Statement of Operations.
The performance of the Fund may be materially affected positively or negatively by foreign currency strength or weakness relative to the U.S. dollar. Currency rates in foreign countries may fluctuate for a number of reasons, including changes in interest rates, political, economic, or social instability and development, and imposition of currency controls. Currency controls in certain foreign jurisdictions may cause the Fund to experience significant delays in its ability to repatriate its assets in U.S. dollars at quoted spot rates, and it is possible that the Fund’s ability to convert certain foreign currencies into U.S. dollars may be limited and may occur at discounts to quoted rates. As a result, the value of the Fund’s assets and liabilities denominated in such currencies that would ultimately be realized could differ from those reported on the Statement of Assets and Liabilities. Certain foreign companies may be subject to sanctions, embargoes, or other governmental actions that may limit the ability to invest in, receive, hold, or sell the securities of such companies, all of which affect the market and/or credit risk of the investments. Because of the inherent uncertainties of valuation, the values reflected in the financial statements may materially differ from the value received upon actual sale of those investments.
| K. | Forward Foreign Currency Contracts – The Fund may engage in foreign currency transactions either on a spot (i.e. for prompt delivery and settlement) basis, or through forward foreign currency contracts, to manage or minimize currency or exchange rate risk. |
The Fund may also enter into forward foreign currency contracts for the purchase or sale of a security denominated in a foreign currency in order to “lock in” the U.S. dollar price of that security, or the Fund may also enter into forward foreign currency contracts that do not provide for physical exchange of the two currencies on the settlement date, but instead are settled by a single cash payment calculated as the difference between the agreed upon exchange rate and the spot rate at settlement based upon an agreed upon notional amount (non-deliverable forwards).
A forward foreign currency contract is an obligation between two parties (“Counterparties”) to purchase or sell a specific currency for an agreed-upon price at a future date. The use of forward foreign currency contracts for hedging does not eliminate fluctuations in the price of the underlying securities the Fund owns or intends to acquire but establishes a rate of exchange in advance. Fluctuations in the value of these contracts are measured by the difference in the contract date and reporting date exchange rates and are recorded as unrealized appreciation (depreciation) until the contracts are closed. When the contracts are closed, realized gains (losses) are recorded. Realized and unrealized gains (losses) on the contracts are included in the Statement of Operations. The primary risks associated with forward foreign currency contracts include failure of the Counterparty to meet the terms of the contract and the value of the foreign currency changing unfavorably. These risks may be in excess of the amounts reflected in the Statement of Assets and Liabilities.
NOTE 2–Advisory Fees and Other Fees Paid to Affiliates
The Trust has entered into a master investment advisory agreement with the Adviser. Under the terms of the investment advisory agreement, the Fund accrues daily and pays monthly an advisory fee to the Adviser based on the annual rate of the Fund’s average daily net assets as follows:
| | |
| Average Daily Net Assets | | Rate |
| |
First $250 million | | 0.695% |
| |
Next $250 million | | 0.670% |
| |
Next $500 million | | 0.645% |
| |
Next $1.5 billion | | 0.610% |
| |
Next $3.5 billion | | 0.560% |
| |
Next $4 billion | | 0.545% |
| |
Over $10 billion | | 0.520% |
For the year ended April 30, 2024, the effective advisory fee rate incurred by the Fund was 0.62%.
Under the terms of a master sub-advisory agreement between the Adviser and each of Invesco Asset Management Deutschland GmbH, Invesco Asset Management Limited, Invesco Asset Management (Japan) Limited, Invesco Hong Kong Limited, Invesco Senior Secured Management, Inc. and Invesco Canada Ltd. (collectively, the “Affiliated Sub-Advisers”) the Adviser, not the Fund, will pay 40% of the fees paid to the Adviser to any such Affiliated Sub-Adviser(s) that provide(s) discretionary investment management services to the Fund based on the percentage of assets allocated to such Affiliated Sub-Adviser(s).
Effective July 1, 2023, the Adviser has agreed, for an indefinite period, to waive advisory fees and/or reimburse expenses of all shares to the extent necessary to limit total annual fund operating expenses after fee waiver and/or expense reimbursement (excluding certain items discussed below) of Class A, Class C, Class R, Class Y, Class R5 and Class R6 shares to 2.00%, 2.75%, 2.25%, 1.75%, 1.75% and 1.75%, respectively, of the Fund’s average daily net assets (the “boundary limits”). Prior to July 1, 2023, the same boundary limits were in effect with an expiration date of June 30, 2023. In determining the Adviser’s obligation to waive advisory fees and/or reimburse expenses, the following expenses are not taken into account, and could cause the total annual fund operating expenses after fee waiver and/or expense reimbursement to exceed the numbers reflected above: (1) interest; (2) taxes; (3) dividend expense on short sales; (4) extraordinary or non-routine items, including litigation expenses; and (5) expenses that the Fund has incurred but did not actually pay because of an expense offset arrangement. Invesco may amend and/or terminate these boundary limits at any time in its sole discretion and will inform the Board of Trustees of any such changes. The Adviser did not waive fees and/or reimburse expenses during the period under these boundary limits.
Further, the Adviser has contractually agreed, through at least June 30, 2025, to waive the advisory fee payable by the Fund in an amount equal to 100% of the net advisory fees the Adviser receives from the affiliated money market funds on investments by the Fund of uninvested cash (excluding investments of cash collateral from securities lending) in such affiliated money market funds.
For the year ended April 30, 2024, the Adviser waived advisory fees of $66,939.
| | |
| 17 | | Invesco Value Opportunities Fund |
The Trust has entered into a master administrative services agreement with Invesco pursuant to which the Fund has agreed to pay Invesco for certain administrative costs incurred in providing accounting services to the Fund. For the year ended April 30, 2024, expenses incurred under the agreement are shown in the Statement of Operations as Administrative services fees. Invesco has entered into a sub-administration agreement whereby State Street Bank and Trust Company (“SSB”) serves as fund accountant and provides certain administrative services to the Fund. Pursuant to a custody agreement with the Trust on behalf of the Fund, SSB also serves as the Fund’s custodian.
The Trust has entered into a transfer agency and service agreement with Invesco Investment Services, Inc. (“IIS”) pursuant to which the Fund has agreed to pay IIS a fee for providing transfer agency and shareholder services to the Fund and reimburse IIS for certain expenses incurred by IIS in the course of providing such services. IIS may make payments to intermediaries that provide omnibus account services, sub-accounting services and/or networking services. All fees payable by IIS to intermediaries that provide omnibus account services or sub-accounting services are charged back to the Fund, subject to certain limitations approved by the Trust’s Board of Trustees. For the year ended April 30, 2024, expenses incurred under the agreement are shown in the Statement of Operations as Transfer agent fees.
The Trust has entered into master distribution agreements with Invesco Distributors, Inc.(“IDI”) to serve as the distributor for the Class A, Class C, Class R, Class Y, Class R5 and Class R6 shares of the Fund. The Trust has adopted plans pursuant to Rule 12b-1 under the 1940 Act with respect to the Fund’s Class A, Class C and Class R shares (collectively the “Plans”). The Fund, pursuant to the Plans, reimburses IDI for its allocated share of expenses incurred for the period, up to a maximum annual rate of 0.25% of the average daily net assets of Class A shares and up to a maximum annual rate of 1.00% of the average daily net assets of Class C shares. The Fund pursuant to the Class R Plan, pays IDI compensation at the annual rate of 0.50% of the average daily net assets of Class R shares. The fees are accrued daily and paid monthly. Of the Plans payments, up to 0.25% of the average daily net assets of each class of shares may be paid to furnish continuing personal shareholder services to customers who purchase and own shares of such classes. Any amounts not paid as a service fee under the Plans would constitute an asset-based sales charge. Rules of the Financial Industry Regulatory Authority (“FINRA”) impose a cap on the total sales charges, including asset-based sales charges, that may be paid by any class of shares of the Fund. For the year ended April 30, 2024, expenses incurred under the Plans are shown in the Statement of Operations as Distribution fees.
Front-end sales commissions and CDSC (collectively, the “sales charges”) are not recorded as expenses of the Fund. Front-end sales commissions are deducted from proceeds from the sales of Fund shares prior to investment in Class A shares of the Fund. CDSC are deducted from redemption proceeds prior to remittance to the shareholder. During the year ended April 30, 2024, IDI advised the Fund that IDI retained $167,092 in front-end sales commissions from the sale of Class A shares and $7,320 and $3,691 from Class A and Class C shares, respectively, for CDSC imposed upon redemptions by shareholders.
For the year ended April 30, 2024, the Fund incurred $167,547 in brokerage commissions with Invesco Capital Markets, Inc., an affiliate of the Adviser and IDI, for portfolio transactions executed on behalf of the Fund.
Certain officers and trustees of the Trust are officers and directors of the Adviser, IIS and/or IDI.
NOTE 3–Additional Valuation Information
GAAP defines fair value as the price that would be received to sell an asset or paid to transfer a liability in an orderly transaction between market participants at the measurement date, under current market conditions. GAAP establishes a hierarchy that prioritizes the inputs to valuation methods, giving the highest priority to readily available unadjusted quoted prices in an active market for identical assets (Level 1) and the lowest priority to significant unobservable inputs (Level 3), generally when market prices are not readily available. Based on the valuation inputs, the securities or other investments are tiered into one of three levels. Changes in valuation methods may result in transfers in or out of an investment’s assigned level:
| | |
| Level 1 - | | Prices are determined using quoted prices in an active market for identical assets. |
| Level 2 - | | Prices are determined using other significant observable inputs. Observable inputs are inputs that other market participants may use in pricing a security. These may include quoted prices for similar securities, interest rates, prepayment speeds, credit risk, yield curves, loss severities, default rates, discount rates, volatilities and others. |
| Level 3 - | | Prices are determined using significant unobservable inputs. In situations where quoted prices or observable inputs are unavailable (for example, when there is little or no market activity for an investment at the end of the period), unobservable inputs may be used. Unobservable inputs reflect the Adviser’s assumptions about the factors market participants would use in determining fair value of the securities or instruments and would be based on the best available information. |
The following is a summary of the tiered valuation input levels, as of April 30, 2024. The level assigned to the securities valuations may not be an indication of the risk or liquidity associated with investing in those securities. Because of the inherent uncertainties of valuation, the values reflected in the financial statements may materially differ from the value received upon actual sale of those investments.
| | | | | | | | | | | | | | | | | | | | | | | | | | | | |
| | | Level 1 | | | | | | Level 2 | | | | | | Level 3 | | | | | | Total | |
|
| |
Investments in Securities | | | | | | | | | | | | | | | | | | | | | | | | | | | | |
|
| |
Common Stocks & Other Equity Interests | | $ | 3,375,290,197 | | | | | | | $ | 129,052,130 | | | | | | | | $– | | | | | | | $ | 3,504,342,327 | |
|
| |
Money Market Funds | | | 52,067,831 | | | | | | | | 213,226,918 | | | | | | | | – | | | | | | | | 265,294,749 | |
|
| |
Total Investments in Securities | | | 3,427,358,028 | | | | | | | | 342,279,048 | | | | | | | | – | | | | | | | | 3,769,637,076 | |
|
| |
Other Investments - Assets* | | | | | | | | | | | | | | | | | | | | | | | | | | | | |
|
| |
Forward Foreign Currency Contracts | | | – | | | | | | | | 359 | | | | | | | | – | | | | | | | | 359 | |
|
| |
| | | | | | | |
Other Investments - Liabilities* | | | | | | | | | | | | | | | | | | | | | | | | | | | | |
|
| |
Forward Foreign Currency Contracts | | | – | | | | | | | | (435,028 | ) | | | | | | | – | | | | | | | | (435,028 | ) |
|
| |
Total Other Investments | | | – | | | | | | | | (434,669 | ) | | | | | | | – | | | | | | | | (434,669 | ) |
|
| |
Total Investments | | $ | 3,427,358,028 | | | | | | | $ | 341,844,379 | | | | | | | | $– | | | | | | | $ | 3,769,202,407 | |
|
| |
| * | Unrealized appreciation (depreciation). |
NOTE 4–Derivative Investments
The Fund may enter into an International Swaps and Derivatives Association Master Agreement (“ISDA Master Agreement”) under which a fund may trade OTC derivatives. An OTC transaction entered into under an ISDA Master Agreement typically involves a collateral posting arrangement, payment netting provisions and close-out netting provisions. These netting provisions allow for reduction of credit risk through netting of contractual obligations. The enforceability of the netting provisions of the ISDA Master Agreement depends on the governing law of the ISDA Master Agreement, among other factors.
| | |
| 18 | | Invesco Value Opportunities Fund |
For financial reporting purposes, the Fund does not offset OTC derivative assets or liabilities that are subject to ISDA Master Agreements in the Statement of Assets and Liabilities.
| | | | |
| | | Value | |
| Derivative Assets | | Currency
Risk | |
|
| |
Unrealized appreciation on forward foreign currency contracts outstanding | | $ | 359 | |
|
| |
Derivatives not subject to master netting agreements | | | – | |
|
| |
Total Derivative Assets subject to master netting agreements | | $ | 359 | |
|
| |
| | | | |
| | | Value | |
| Derivative Liabilities | | Currency
Risk | |
|
| |
Unrealized depreciation on forward foreign currency contracts outstanding | | $ | (435,028 | ) |
|
| |
Derivatives not subject to master netting agreements | | | – | |
|
| |
Total Derivative Liabilities subject to master netting agreements | | $ | (435,028 | ) |
|
| |
The table below reflects the Fund’s exposure to Counterparties subject to either an ISDA Master Agreement or other agreement for OTC derivative transactions as of April 30, 2024.
| | | | | | | | | | | | | | | | | | | | | | | | |
| | | Financial
Derivative
Assets | | | Financial
Derivative
Liabilities | | | | | | Collateral
(Received)/Pledged | | | | |
| Counterparty | | Forward Foreign
Currency Contracts | | | Forward Foreign
Currency Contracts | | | Net Value of
Derivatives | | | Non-Cash | | | Cash | | | Net
Amount | |
|
| |
Goldman Sachs International | | | $ – | | | | $ (742) | | | | $ (742) | | | | $– | | | | $– | | | | $ (742 | ) |
|
| |
Merrill Lynch International | | | – | | | | (434,286) | | | | (434,286) | | | | – | | | | – | | | | (434,286 | ) |
|
| |
UBS AG | | | 359 | | | | – | | | | 359 | | | | – | | | | – | | | | 359 | |
|
| |
Total | | | $359 | | | | $(435,028) | | | | $(434,669) | | | | $– | | | | $– | | | | $(434,669 | ) |
|
| |
Effect of Derivative Investments for the year ended April 30, 2024
The table below summarizes the gains (losses) on derivative investments, detailed by primary risk exposure, recognized in earnings during the period:
| | | | |
| | | Location of Gain (Loss) on
Statement of Operations | |
| | | Currency Risk | |
|
| |
Realized Gain: | | | | |
Forward foreign currency contracts | | | $6,633,403 | |
|
| |
Change in Net Unrealized Appreciation (Depreciation): | | | | |
Forward foreign currency contracts | | | (239,793) | |
|
| |
Total | | | $6,393,610 | |
|
| |
The table below summarizes the average notional value of derivatives held during the period.
| | |
| | | Forward
Foreign Currency
Contracts |
|
|
Average notional value | | $127,268,157 |
|
|
NOTE 5–Expense Offset Arrangement(s)
The expense offset arrangement is comprised of transfer agency credits which result from balances in demand deposit accounts used by the transfer agent for clearing shareholder transactions. For the year ended April 30, 2024, the Fund received credits from this arrangement, which resulted in the reduction of the Fund’s total expenses of $111,246.
NOTE 6–Trustees’ and Officers’ Fees and Benefits
Trustees’ and Officers’ Fees and Benefits include amounts accrued by the Fund to pay remuneration to certain Trustees and Officers of the Fund. Trustees have the option to defer compensation payable by the Fund, and Trustees’ and Officers’ Fees and Benefits also include amounts accrued by the Fund to fund such deferred compensation amounts. Those Trustees who defer compensation have the option to select various Invesco Funds in which their deferral accounts shall be deemed to be invested. Finally, certain current Trustees were eligible to participate in a retirement plan that provided for benefits to be paid upon retirement to Trustees over a period of time based on the number of years of service. The Fund may have certain former Trustees who also participate in a retirement plan and receive benefits under such plan. Trustees’ and Officers’ Fees and Benefits include amounts accrued by the Fund to fund such retirement benefits. Obligations under the deferred compensation and retirement plans represent unsecured claims against the general assets of the Fund.
| | |
| 19 | | Invesco Value Opportunities Fund |
NOTE 7–Cash Balances
The Fund is permitted to temporarily carry a negative or overdrawn balance in its account with SSB, the custodian bank. Such balances, if any at period-end, are shown in the Statement of Assets and Liabilities under the payable caption Amount due custodian. To compensate the custodian bank for such overdrafts, the overdrawn Fund may either (1) leave funds as a compensating balance in the account so the custodian bank can be compensated by earning the additional interest; or (2) compensate by paying the custodian bank at a rate agreed upon by the custodian bank and Invesco, not to exceed the contractually agreed upon rate.
NOTE 8–Distributions to Shareholders and Tax Components of Net Assets
Tax Character of Distributions to Shareholders Paid During the Fiscal Years Ended April 30, 2024 and 2023:
| | | | | | | | |
| | | 2024 | | | 2023 | |
|
| |
Ordinary income* | | | $ 6,394,390 | | | | $ 29,542,910 | |
|
| |
Long-term capital gain | | | 63,457,643 | | | | 78,514,389 | |
|
| |
Total distributions | | | $69,852,033 | | | | $108,057,299 | |
|
| |
| * | Includes short-term capital gain distributions, if any. |
Tax Components of Net Assets at Period-End:
| | | | |
| | | 2024 | |
|
| |
Undistributed ordinary income | | | $ 20,408,106 | |
|
| |
Undistributed long-term capital gain | | | 96,307,733 | |
|
| |
Net unrealized appreciation – investments | | | 702,629,042 | |
|
| |
Net unrealized appreciation – foreign currencies | | | 5,563 | |
|
| |
Temporary book/tax differences | | | (555,974 | ) |
|
| |
Capital loss carryforward | | | (77,455,533 | ) |
|
| |
Shares of beneficial interest | | | 2,820,711,249 | |
|
| |
Total net assets | | | $3,562,050,186 | |
|
| |
The difference between book-basis and tax-basis unrealized appreciation (depreciation) is due to differences in the timing of recognition of gains and losses on investments for tax and book purposes. The Fund’s net unrealized appreciation (depreciation) difference is attributable primarily to wash sales.
The temporary book/tax differences are a result of timing differences between book and tax recognition of income and/or expenses. The Fund’s temporary book/tax differences are the result of the trustee deferral of compensation and retirement plan benefits.
Capital loss carryforward is calculated and reported as of a specific date. Results of transactions and other activity after that date may affect the amount of capital loss carryforward actually available for the Fund to utilize. The ability to utilize capital loss carryforward in the future may be limited under the Internal Revenue Code and related regulations based on the results of future transactions.
The Fund has a capital loss carryforward as of April 30, 2024, as follows:
| | | | | | | | |
| Capital Loss Carryforward* |
|
|
Expiration | | | | Short-Term | | Long-Term | | Total |
|
|
Not subject to expiration | | | | $77,455,533 | | $– | | $77,455,533 |
|
|
| * | Capital loss carryforward is reduced for limitations, if any, to the extent required by the Internal Revenue Code and may be further limited depending upon a variety of factors, including the realization of net unrealized gains or losses as of the date of any reorganization. |
NOTE 9–Investment Transactions
The aggregate amount of investment securities (other than short-term securities, U.S. Government obligations and money market funds, if any) purchased and sold by the Fund during the year ended April 30, 2024 was $1,352,753,530 and $1,383,428,430, respectively. Cost of investments, including any derivatives, on a tax basis includes the adjustments for financial reporting purposes as of the most recently completed federal income tax reporting period-end.
| | | | |
Unrealized Appreciation (Depreciation) of Investments on a Tax Basis | |
Aggregate unrealized appreciation of investments | | | $813,681,111 | |
|
| |
Aggregate unrealized (depreciation) of investments | | | (111,052,069 | ) |
|
| |
Net unrealized appreciation of investments | | | $702,629,042 | |
|
| |
Cost of investments for tax purposes is $3,066,573,365.
NOTE 10–Reclassification of Permanent Differences
Primarily as a result of differing book/tax treatment of distributions, foreign currency transactions and equalization, on April 30, 2024, undistributed net investment income was increased by $7,991,739, undistributed net realized gain was decreased by $15,264,147 and shares of beneficial interest was increased by $7,272,408. This reclassification had no effect on the net assets of the Fund.
| | |
| 20 | | Invesco Value Opportunities Fund |
NOTE 11–Share Information
| | | | | | | | | | | | | | | | |
| | | Summary of Share Activity | |
|
| |
| | | Year ended
April 30, 2024(a) | | | Year ended
April 30, 2023 | |
| | | Shares | | | Amount | | | Shares | | | Amount | |
|
| |
Sold: | | | | | | | | | | | | | | | | |
Class A | | | 6,858,809 | | | $ | 117,865,341 | | | | 5,708,709 | | | $ | 91,615,505 | |
|
| |
Class C | | | 465,320 | | | | 7,232,957 | | | | 409,186 | | | | 6,012,929 | |
|
| |
Class R | | | 699,064 | | | | 11,798,297 | | | | 513,995 | | | | 8,036,177 | |
|
| |
Class Y | | | 10,247,832 | | | | 182,551,876 | | | | 8,514,047 | | | | 138,761,080 | |
|
| |
Class R5 | | | 537,593 | | | | 9,432,554 | | | | 40,918 | | | | 648,953 | |
|
| |
Class R6 | | | 11,148,631 | | | | 208,838,095 | | | | 5,722,008 | | | | 91,725,786 | |
|
| |
| | | | |
Issued as reinvestment of dividends: | | | | | | | | | | | | | | | | |
Class A | | | 2,919,638 | | | | 50,071,797 | | | | 4,027,358 | | | | 64,357,184 | |
|
| |
Class C | | | 93,320 | | | | 1,441,793 | | | | 107,987 | | | | 1,570,130 | |
|
| |
Class R | | | 103,034 | | | | 1,734,067 | | | | 81,301 | | | | 1,278,864 | |
|
| |
Class Y | | | 382,537 | | | | 6,598,765 | | | | 632,536 | | | | 10,139,560 | |
|
| |
Class R5 | | | 12,490 | | | | 217,702 | | | | 1,164 | | | | 18,852 | |
|
| |
Class R6 | | | 440,916 | | | | 7,702,809 | | | | 1,511,522 | | | | 24,501,770 | |
|
| |
| | | | |
Automatic conversion of Class C shares to Class A shares: | | | | | | | | | | | | | | | | |
Class A | | | 462,032 | | | | 7,972,289 | | | | 220,950 | | | | 3,420,139 | |
|
| |
Class C | | | (511,768 | ) | | | (7,972,289 | ) | | | (243,066 | ) | | | (3,420,139 | ) |
|
| |
| | | | |
Issued in connection with acquisitions:(b) | | | | | | | | | | | | | | | | |
Class A | | | - | | | | - | | | | 90,760,772 | | | | 1,504,034,870 | |
|
| |
Class C | | | - | | | | - | | | | 3,342,631 | | | | 50,339,180 | |
|
| |
Class R | | | - | | | | - | | | | 3,881,097 | | | | 63,270,433 | |
|
| |
Class Y | | | - | | | | - | | | | 8,110,851 | | | | 134,901,684 | |
|
| |
Class R5 | | | - | | | | - | | | | 611,702 | | | | 10,275,987 | |
|
| |
Class R6 | | | - | | | | - | | | | 3,529,313 | | | | 59,357,533 | |
|
| |
| | | | |
Reacquired: | | | | | | | | | | | | | | | | |
Class A | | | (19,857,286 | ) | | | (335,473,999 | ) | | | (9,278,577 | ) | | | (145,925,921 | ) |
|
| |
Class C | | | (975,969 | ) | | | (14,757,098 | ) | | | (371,583 | ) | | | (5,334,482 | ) |
|
| |
Class R | | | (1,284,000 | ) | | | (21,261,966 | ) | | | (490,787 | ) | | | (7,582,480 | ) |
|
| |
Class Y | | | (7,360,175 | ) | | | (127,313,818 | ) | | | (6,578,317 | ) | | | (103,876,791 | ) |
|
| |
Class R5 | | | (317,128 | ) | | | (5,388,969 | ) | | | (68,928 | ) | | | (1,086,866 | ) |
|
| |
Class R6 | | | (6,120,835 | ) | | | (106,314,840 | ) | | | (4,100,984 | ) | | | (66,896,594 | ) |
|
| |
Net increase (decrease) in share activity | | | (2,055,945 | ) | | $ | (5,024,637 | ) | | | 116,595,805 | | | $ | 1,930,143,343 | |
|
| |
| (a) | There are entities that are record owners of more than 5% of the outstanding shares of the Fund and in the aggregate own 19% of the outstanding shares of the Fund. IDI has an agreement with these entities to sell Fund shares. The Fund, Invesco and/or Invesco affiliates may make payments to these entities, which are considered to be related to the Fund, for providing services to the Fund, Invesco and/or Invesco affiliates including but not limited to services such as securities brokerage, distribution, third party record keeping and account servicing. The Fund has no knowledge as to whether all or any portion of the shares owned of record by these entities are also owned beneficially. |
| (b) | After the close of business on February 10, 2023, the Fund acquired all the net assets of Invesco American Value Fund (the “Target Fund”) pursuant to a plan of reorganization approved by the Board of Trustees of the Fund on September 20, 2022. The reorganization was executed in order to reduce overlap and increase efficiencies in the Adviser’s product line. The acquisition was accomplished by a tax-free exchange of 110,236,366 shares of the Fund for 62,423,301 shares outstanding of the Target Fund as of the close of business on February 10, 2023. Shares of the Target Fund were exchanged for the like class of shares of the Fund, based on the relative net asset value of the Target Fund to the net asset value of the Fund on the close of business, February 10, 2023. The Target Fund’s net assets as of the close of business on February 10, 2023 of $1,822,179,687, including $133,143,707 of unrealized appreciation (depreciation), were combined with those of the Fund. The net assets of the Fund immediately before the acquisition were $1,284,207,818 and $3,106,387,505 immediately after the acquisition. |
The pro forma results of operations for the year ended April 30, 2023 assuming the reorganization had been completed on May 1, 2022, the beginning of the annual reporting period are as follows:
| | | | |
Net investment income | | $ | 32,887,684 | |
|
| |
Net realized/unrealized gains | | | 3,468,110 | |
|
| |
Change in net assets resulting from operations | | $ | 36,355,794 | |
|
| |
As the combined investment portfolios have been managed as a single integrated portfolio since the acquisition was completed, it is not practicable to separate the amounts of revenue and earnings of the Target Fund that have been included in the Fund’s Statement of Operations since February 11, 2023.
| | |
| 21 | | Invesco Value Opportunities Fund |
Report of Independent Registered Public Accounting Firm
To the Board of Trustees of AIM Sector Funds (Invesco Sector Funds) and Shareholders of Invesco Value Opportunities Fund
Opinion on the Financial Statements
We have audited the accompanying statement of assets and liabilities, including the schedule of investments, of Invesco Value Opportunities Fund (one of the funds constituting AIM Sector Funds (Invesco Sector Funds), referred to hereafter as the “Fund”) as of April 30, 2024, the related statement of operations for the year ended April 30, 2024, the statement of changes in net assets for each of the two years in the period ended April 30, 2024, including the related notes, and the financial highlights for each of the five years in the period ended April 30, 2024 (collectively referred to as the “financial statements”). In our opinion, the financial statements present fairly, in all material respects, the financial position of the Fund as of April 30, 2024, the results of its operations for the year then ended, the changes in its net assets for each of the two years in the period ended April 30, 2024 and the financial highlights for each of the five years in the period ended April 30, 2024 in conformity with accounting principles generally accepted in the United States of America.
Basis for Opinion
These financial statements are the responsibility of the Fund’s management. Our responsibility is to express an opinion on the Fund’s financial statements based on our audits. We are a public accounting firm registered with the Public Company Accounting Oversight Board (United States) (PCAOB) and are required to be independent with respect to the Fund in accordance with the U.S. federal securities laws and the applicable rules and regulations of the Securities and Exchange Commission and the PCAOB.
We conducted our audits of these financial statements in accordance with the standards of the PCAOB. Those standards require that we plan and perform the audit to obtain reasonable assurance about whether the financial statements are free of material misstatement, whether due to error or fraud.
Our audits included performing procedures to assess the risks of material misstatement of the financial statements, whether due to error or fraud, and performing procedures that respond to those risks. Such procedures included examining, on a test basis, evidence regarding the amounts and disclosures in the financial statements. Our audits also included evaluating the accounting principles used and significant estimates made by management, as well as evaluating the overall presentation of the financial statements. Our procedures included confirmation of securities owned as of April 30, 2024 by correspondence with the custodian, transfer agent and brokers. We believe that our audits provide a reasonable basis for our opinion.
/s/PricewaterhouseCoopers LLP
Houston, Texas
June 20, 2024
We have served as the auditor of one or more of the investment companies in the Invesco group of investment companies since at least 1995. We have not been able to determine the specific year we began serving as auditor.
| | |
| 22 | | Invesco Value Opportunities Fund |
Calculating your ongoing Fund expenses
Example
As a shareholder of the Fund, you incur two types of costs: (1) transaction costs, which may include sales charges (loads) on purchase payments or contingent deferred sales charges on redemptions, if any; and (2) ongoing costs, including management fees, distribution and/or service (12b-1) fees, and other Fund expenses. This example is intended to help you understand your ongoing costs (in dollars) of investing in the Fund and to compare these costs with ongoing costs of investing in other mutual funds. The example is based on an investment of $1,000 invested at the beginning of the period and held for the entire period November 1, 2023 through April 30, 2024.
Actual expenses
The table below provides information about actual account values and actual expenses. You may use the information in this table, together with the amount you invested, to estimate the expenses that you paid over the period. Simply divide your account value by $1,000 (for example, an $8,600 account value divided by $1,000 = 8.6), then multiply the result by the number in the table under the heading entitled “Actual Expenses Paid During Period” to estimate the expenses you paid on your account during this period.
Hypothetical example for comparison purposes
The table below also provides information about hypothetical account values and hypothetical expenses based on the Fund’s actual expense ratio and an assumed rate of return of 5% per year before expenses, which is not the Fund’s actual return.
The hypothetical account values and expenses may not be used to estimate the actual ending account balance or expenses you paid for the period. You may use this information to compare the ongoing costs of investing in the Fund and other funds. To do so, compare this 5% hypothetical example with the 5% hypothetical examples that appear in the shareholder reports of the other funds.
Please note that the expenses shown in the table are meant to highlight your ongoing costs only and do not reflect any transaction costs, such as sales charges (loads) on purchase payments or contingent deferred sales charges on redemptions, if any. Therefore, the hypothetical information is useful in comparing ongoing costs only, and will not help you determine the relative total costs of owning different funds. In addition, if these transaction costs were included, your costs would have been higher.
| | | | | | | | | | | | |
| | | | | ACTUAL | | HYPOTHETICAL (5% annual return before expenses) | | |
| | | Beginning
Account Value
(11/01/23) | | Ending
Account Value
(04/30/24)1 | | Expenses
Paid During
Period2 | | Ending
Account Value
(04/30/24) | | Expenses
Paid During
Period2 | | Annualized
Expense Ratio |
Class A | | $1,000.00 | | $1,275.20 | | $6.05 | | $1,019.54 | | $5.37 | | 1.07% |
Class C | | 1,000.00 | | 1,270.20 | | 10.10 | | 1,015.96 | | 8.97 | | 1.79 |
Class R | | 1,000.00 | | 1,273.70 | | 7.46 | | 1,018.30 | | 6.62 | | 1.32 |
Class Y | | 1,000.00 | | 1,276.80 | | 4.64 | | 1,020.79 | | 4.12 | | 0.82 |
Class R5 | | 1,000.00 | | 1,277.20 | | 4.30 | | 1,021.08 | | 3.82 | | 0.76 |
Class R6 | | 1,000.00 | | 1,277.30 | | 3.91 | | 1,021.43 | | 3.47 | | 0.69 |
| 1 | The actual ending account value is based on the actual total return of the Fund for the period November 1, 2023 through April 30, 2024, after actual expenses and will differ from the hypothetical ending account value which is based on the Fund’s expense ratio and a hypothetical annual return of 5% before expenses. |
| 2 | Expenses are equal to the Fund’s annualized expense ratio as indicated above multiplied by the average account value over the period, multiplied by 182/366 to reflect the most recent fiscal half year. |
| | |
| 23 | | Invesco Value Opportunities Fund |
Tax Information
Form 1099-DIV, Form 1042-S and other year–end tax information provide shareholders with actual calendar year amounts that should be included in their tax returns. Shareholders should consult their tax advisers.
The following distribution information is being provided as required by the Internal Revenue Code or to meet a specific state’s requirement.
The Fund designates the following amounts or, if subsequently determined to be different, the maximum amount allowable for its fiscal year ended April 30, 2024:
| | | | | | | | |
Federal and State Income Tax | | | | | | |
Long-Term Capital Gain Distributions | | | $70,698,643 | | | | | |
Qualified Dividend Income* | | | 100.00% | | | | | |
Corporate Dividends Received Deduction* | | | 100.00% | | | | | |
U.S. Treasury Obligations* | | | 0.00% | | | | | |
Qualified Business Income* | | | 0.00% | | | | | |
Business Interest Income* | | | 0.00% | | | | | |
|
| * The above percentages are based on ordinary income dividends paid to shareholders during the Fund’s fiscal year. | |
| | |
| 24 | | Invesco Value Opportunities Fund |
Trustees and Officers
The address of each trustee and officer is AIM Sector Funds (Invesco Sector Funds) (the “Trust”), 11 Greenway Plaza, Houston, Texas 77046-1173. The trustees serve for the life of the Trust, subject to their earlier death, incapacitation, resignation, retirement or removal as more specifically provided in the Trust’s organizational documents. Each officer serves for a one year term or until their successors are elected and qualified. Column two below includes length of time served with predecessor entities, if any.
| | | | | | | | |
Name, Year of Birth and Position(s) Held with the Trust | | Trustee and/or Officer Since | | Principal Occupation(s) During Past 5 Years | | Number of Funds in Fund Complex
Overseen by
Trustee | | Other Directorship(s) Held by Trustee During At Least The Past 5 Years |
| Interested Trustees | | | | | | | | |
Jeffrey H. Kupor1 – 1968 Trustee | | 2024 | | Senior Managing Director and General Counsel, Invesco Ltd.; Trustee, Invesco Foundation, Inc.; Director, Invesco Advisers, Inc.; Executive Vice President, Invesco Asset Management (Bermuda), Ltd., Invesco Investments (Bermuda) Ltd.; and Vice President, Invesco Group Services, Inc. Formerly: Head of Legal of the Americas, Invesco Ltd.; Senior Vice President and Secretary, Invesco Advisers, Inc. (formerly known as Invesco Institutional (N.A.), Inc.) (registered investment adviser); Secretary, Invesco Distributors, Inc. (formerly known as Invesco AIM Distributors, Inc.); Vice President and Secretary, Invesco Investment Services, Inc. (formerly known as Invesco AIM Investment Services, Inc.); Senior Vice President, Chief Legal Officer and Secretary, The Invesco Funds; Secretary and General Counsel, Invesco Investment Advisers LLC (formerly known as Van Kampen Asset Management); Secretary and General Counsel, Invesco Capital Markets, Inc. (formerly known as Van Kampen Funds Inc.) and Chief Legal Officer, Invesco Exchange-Traded Fund Trust, Invesco Exchange-Traded Fund Trust II, Invesco India Exchange-Traded Fund Trust, Invesco Actively Managed Exchange-Traded Fund Trust, Invesco Actively Managed Exchange-Traded Commodity Fund Trust and Invesco Exchange-Traded Self-Indexed Fund Trust; Secretary and Vice President, Harbourview Asset Management Corporation; Secretary and Vice President, OppenheimerFunds, Inc. and Invesco Managed Accounts, LLC; Secretary and Senior Vice President, OFI Global Institutional, Inc.; Secretary and Vice President, OFI SteelPath, Inc.; Secretary and Vice President, Oppenheimer Acquisition Corp.; Secretary and Vice President, Shareholder Services, Inc.; Secretary and Vice President, Trinity Investment Management Corporation, Senior Vice President, Invesco Distributors, Inc.; Secretary and Vice President, Jemstep, Inc.; Head of Legal, Worldwide Institutional, Invesco Ltd.; Secretary and General Counsel, INVESCO Private Capital Investments, Inc.; Senior Vice President, Secretary and General Counsel, Invesco Management Group, Inc. (formerly known as Invesco AIM Management Group, Inc.); Assistant Secretary, INVESCO Asset Management (Bermuda) Ltd.; Secretary and General Counsel, Invesco Private Capital, Inc.; Assistant Secretary and General Counsel, INVESCO Realty, Inc.; Secretary and General Counsel, Invesco Senior Secured Management, Inc.; Secretary, Sovereign G./P. Holdings Inc.; Secretary, Invesco Indexing LLC; and Secretary, W.L. Ross & Co., LLC | | 164 | | None |
Douglas Sharp1 – 1974 Trustee | | 2024 | | Senior Managing Director and Head of Americas & EMEA, Invesco Ltd. Formerly: Director and Chairman Invesco UK Limited; Director, Chairman and Chief Executive, Invesco Fund Managers Limited | | 164 | | None |
| 1 | Mr. Kupor and Mr. Sharp are considered interested persons (within the meaning of Section 2(a)(19) of the 1940 Act) of the Trust because they are officers of the Adviser to the Trust, and officers of Invesco Ltd., ultimate parent of the Adviser. |
| | |
| T-1 | | Invesco Value Opportunities Fund |
Trustees and Officers–(continued)
| | | | | | | | |
Name, Year of Birth and Position(s) Held with the Trust | | Trustee and/or Officer Since | | Principal Occupation(s) During Past 5 Years | | Number of Funds in Fund Complex
Overseen by
Trustee | | Other Directorship(s) Held by Trustee During At Least The Past 5 Years |
| Independent Trustees | | | | | | | | |
Beth Ann Brown – 1968 Trustee (2019) and Chair (2022) | | 2019 | | Independent Consultant Formerly: Head of Intermediary Distribution, Managing Director, Strategic Relations, Managing Director, Head of National Accounts, Senior Vice President, National Account Manager and Senior Vice President, Key Account Manager, Columbia Management Investment Advisers LLC; and Vice President, Key Account Manager, Liberty Funds Distributor, Inc. | | 164 | | Director, Board of Directors of Caron Engineering Inc.; Formerly: Advisor, Board of Advisors of Caron Engineering Inc.; President and Director, Acton Shapleigh Youth Conservation Corps (non-profit); President and Director Director of Grahamtastic Connection (non-profit); and Trustee of certain Oppenheimer Funds |
Carol Deckbar – 1962 Trustee | | 2024 | | Formerly: Executive Vice President and Chief Product Officer, TIAA Financial Services; Executive Vice President and Principal, College Retirement Equities Fund at TIAA; Executive Vice President and Head of Institutional Investments and Endowment Services, TIAA | | 164 | | Formerly: Board Member, TIAA Asset Management, Inc.; and Board Member, TH Real Estate Group Holdings Company |
Cynthia Hostetler –1962 Trustee | | 2017 | | Non-Executive Director and Trustee of a number of public and private business corporations Formerly: Director, Aberdeen Investment Funds (4 portfolios); Director, Artio Global Investment LLC (mutual fund complex); Director, Edgen Group, Inc. (specialized energy and infrastructure products distributor); Director, Genesee & Wyoming, Inc. (railroads); Head of Investment Funds and Private Equity, Overseas Private Investment Corporation; President, First Manhattan Bancorporation, Inc.; and Attorney, Simpson Thacher & Bartlett LLP | | 164 | | Resideo Technologies, Inc. (smart home technology); Vulcan Materials Company (construction materials company); Trilinc Global Impact Fund; Investment Company Institute (professional organization); and Independent Directors Council (professional organization) |
Eli Jones – 1961 Trustee | | 2016 | | Professor and Dean Emeritus, Mays Business School - Texas A&M University Formerly: Dean of Mays Business School-Texas A&M University; Professor and Dean, Walton College of Business, University of Arkansas and E.J. Ourso College of Business, Louisiana State University; and Director, Arvest Bank | | 164 | | Insperity, Inc. (formerly known as Administaff) (human resources provider); Board Member of the regional board, First Financial Bank Texas; and Boad Member, First Financial Bankshares, Inc. Texas |
Elizabeth Krentzman – 1959 Trustee | | 2019 | | Formerly: Principal and Chief Regulatory Advisor for Asset Management Services and U.S. Mutual Fund Leader of Deloitte & Touche LLP; General Counsel of the Investment Company Institute (trade association); National Director of the Investment Management Regulatory Consulting Practice, Principal, Director and Senior Manager of Deloitte & Touche LLP; Assistant Director of the Division of Investment Management - Office of Disclosure and Investment Adviser Regulation of the U.S. Securities and Exchange Commission and various positions with the Division of Investment Management – Office of Regulatory Policy of the U.S. Securities and Exchange Commission; and Associate at Ropes & Gray LLP | | 164 | | Formerly: Member of the Cartica Funds Board of Directors (private investment fund); Trustee of the University of Florida National Board Foundation; Member of the University of Florida Law Center Association, Inc. Board of Trustees, Audit Committee and Membership Committee; and Trustee of certain Oppenheimer Funds |
Anthony J. LaCava, Jr. – 1956 Trustee | | 2019 | | Formerly: Director and Member of the Audit Committee, Blue Hills Bank (publicly traded financial institution) and Managing Partner, KPMG LLP | | 164 | | Member and Chairman, of the Bentley University, Business School Advisory Council; Formerly: Board Member and Chair of the Audit and Finance Committee and Nominating Committee, KPMG LLP |
James “Jim” Liddy – 1959 Trustee | | 2024 | | Formerly: Chairman, Global Financial Services, Americas and Retired Partner, KPMG LLP | | 164 | | Director and Treasurer, Gulfside Place Condominium Association, Inc. and Non-Executive Director, Kellenberg Memorial High School |
| | |
| T-2 | | Invesco Value Opportunities Fund |
Trustees and Officers–(continued)
| | | | | | | | |
Name, Year of Birth and Position(s) Held with the Trust | | Trustee and/or Officer Since | | Principal Occupation(s) During Past 5 Years | | Number of Funds in Fund Complex
Overseen by
Trustee | | Other Directorship(s) Held by Trustee During At Least The Past 5 Years |
| Independent Trustees–(continued) |
Prema Mathai-Davis – 1950 Trustee | | 2003 | | Formerly: Co-Founder & Partner of Quantalytics Research, LLC, (a FinTech Investment Research Platform for the Self-Directed Investor); Trustee of YWCA Retirement Fund; CEO of YWCA of the USA; Board member of the NY Metropolitan Transportation Authority; Commissioner of the NYC Department of Aging; and Board member of Johns Hopkins Bioethics Institute | | 164 | | Member of Board of Positive Planet US (non-profit) and HealthCare Chaplaincy Network (non-profit) |
Joel W. Motley – 1952 Trustee | | 2019 | | Director of Office of Finance, Federal Home Loan Bank System; Managing Director of Carmona Motley Inc. (privately held financial advisor); Member of the Council on Foreign Relations and its Finance and Budget Committee; Chairman Emeritus of Board of Human Rights Watch and Member of its Investment Committee; and Member of Investment Committee Board of Historic Hudson Valley (non-profit cultural organization); and Member of the Vestry and the Investment Committee of Trinity Church Wall Street. Formerly: Managing Director of Public Capital Advisors, LLC (privately held financial advisor); Managing Director of Carmona Motley Hoffman, Inc. (privately held financial advisor); and Director of Columbia Equity Financial Corp. (privately held financial advisor) | | 164 | | Member of Board of Trust for Mutual Understanding (non-profit promoting the arts and environment); Member of Board of Greenwall Foundation (bioethics research foundation) and its Investment Committee; Member of Board of Friends of the LRC (non-profit legal advocacy); and Board Member and Investment Committee Member of Pulitzer Center for Crisis Reporting (non-profit journalism); and Trustee of certain Oppenheimer Funds; |
Teresa M. Ressel – 1962 Trustee | | 2017 | | Non-executive director and trustee of a number of public and private business corporations Formerly: Chief Executive Officer, UBS Securities LLC (investment banking); Group Chief Operating Officer, UBS AG Americas (investment banking); Sr. Management Team Olayan America, The Olayan Group (international investor/commercial/industrial); and Assistant Secretary for Management & Budget and Designated Chief Financial Officer, U.S. Department of Treasury | | 164 | | None |
Robert C. Troccoli – 1949 Trustee | | 2016 | | Formerly: Adjunct Professor, University of Denver – Daniels College of Business; and Managing Partner, KPMG LLP | | 164 | | None |
Daniel S. Vandivort –1954 Trustee | | 2019 | | President, Flyway Advisory Services LLC (consulting and property management) and Member, Investment Committee of Historic Charleston Foundation Formerly: President and Chief Investment Officer, previously Head of Fixed Income, Weiss Peck and Greer/Robeco Investment Management; Trustee and Chair, Weiss Peck and Greer Funds Board; and various capacities at CS First Boston including Head of Fixed Income at First Boston Asset Management. | | 164 | | Formerly: Trustee and Governance Chair, Oppenheimer Funds; Treasurer, Chairman of the Audit and Finance Committee, Huntington Disease Foundation of America |
| | |
| T-3 | | Invesco Value Opportunities Fund |
Trustees and Officers–(continued)
| | | | | | | | |
Name, Year of Birth and Position(s) Held with the Trust | | Trustee and/or Officer Since | | Principal Occupation(s) During Past 5 Years | | Number of Funds in Fund Complex
Overseen by
Trustee | | Other Directorship(s) Held by Trustee During At Least The Past 5 Years |
| Officers |
Glenn Brightman – 1972 President and Principal Executive Officer | | 2023 | | Chief Operating Officer, Americas, Invesco Ltd.; Senior Vice President, Invesco Advisers, Inc.; President and Principal Executive Officer, The Invesco Funds; Manager, Invesco Investment Advisers LLC. Formerly: Global Head of Finance, Invesco Ltd; Executive Vice President and Chief Financial Officer, Nuveen | | N/A | | N/A |
Melanie Ringold – 1975 Senior Vice President, Chief Legal Officer and Secretary | | 2023 | | Head of Legal of the Americas, Invesco Ltd.; Senior Vice President and Secretary, Invesco Advisers, Inc. (formerly known as Invesco Institutional (N.A.), Inc.) (registered investment adviser); Secretary, Invesco Distributors, Inc. (formerly known as Invesco AIM Distributors, Inc.); Secretary, Invesco Investment Services, Inc. (formerly known as Invesco AIM Investment Services, Inc.); Senior Vice President, Chief Legal Officer and Secretary, The Invesco Funds; Secretary, Invesco Investment Advisers LLC, Invesco Capital Markets, Inc.; Chief Legal Officer, Invesco Exchange-Traded Fund Trust, Invesco Exchange-Traded Fund Trust II, Invesco India Exchange-Traded Fund Trust, Invesco Actively Managed Exchange-Traded Fund Trust, Invesco Actively Secretary and Vice President, Harbourview Asset Management Corporation; Secretary and Senior Vice President, OppenheimerFunds, Inc. and Invesco Managed Accounts, LLC; Secretary and Senior Vice President, Oppenheimer Acquisition Corp.; Secretary, SteelPath Funds Remediation LLC; and Secretary and Senior Vice President, Trinity Investment Management Corporation Formerly: Secretary and Senior Vice President, OFI SteelPath, Inc., Assistant Secretary, Invesco Distributors, Inc., Invesco Advisers, Inc., Invesco Investment Services, Inc., Invesco Capital Markets, Inc., Invesco Capital Management LLC and Invesco Investment Advisers LLC; and Assistant Secretary and Assistant Vice President, Invesco Funds | | N/A | | N/A |
John M. Zerr – 1962 Senior Vice President | | 2006 | | Chief Operating Officer of the Americas; Senior Vice President, Invesco Advisers, Inc. (formerly known as Invesco Institutional (N.A.), Inc.) (registered investment adviser); Senior Vice President, Invesco Distributors, Inc. (formerly known as Invesco AIM Distributors, Inc.); Director and Vice President, Invesco Investment Services, Inc. (formerly known as Invesco AIM Investment Services, Inc.) Senior Vice President, The Invesco Funds; Managing Director, Invesco Capital Management LLC; Senior Vice President, Invesco Capital Markets, Inc. (formerly known as Van Kampen Funds Inc.); Manager, Invesco Specialized Products, LLC; Member, Invesco Canada Funds Advisory Board; Director, President and Chief Executive Officer, Invesco Corporate Class Inc. (corporate mutual fund company); Director, Chairman, President and Chief Executive Officer, Invesco Canada Ltd. (formerly known as Invesco Trimark Ltd./Invesco Trimark Ltèe) (registered investment adviser and registered transfer agent); President, Invesco, Inc.; President, Invesco Global Direct Real Estate Feeder GP Ltd.; President, Invesco IP Holdings (Canada) Ltd; President, Invesco Global Direct Real Estate GP Ltd.; and President Invesco Financial Services Ltd. / Services Financiers Invesco Ltée Formerly: Director and Chairman, Invesco Trust Company, Manager, Invesco Indexing LLC; Director, Invesco Investment Advisers LLC (formerly known as Van Kampen Asset Management); President, Trimark Investments Ltd/Services Financiers Invesco Ltee; Director and Senior Vice President, Invesco Insurance Agency, Inc.; Director and Senior Vice President, Invesco Management Group, Inc. (formerly known as Invesco AIM Management Group, Inc.); Secretary and General Counsel, Invesco Management Group, Inc. (formerly known as Invesco AIM Management Group, Inc.); Secretary, Invesco Investment Services, Inc. (formerly known as Invesco AIM Investment Services, Inc.); Chief Legal Officer and Secretary, The Invesco Funds; Secretary and General Counsel, Invesco Investment Advisers LLC (formerly known as Van Kampen Asset Management); Secretary and General Counsel, Invesco Capital Markets, Inc. (formerly known as Van Kampen Funds Inc.); Chief Legal Officer, Invesco Exchange-Traded Fund Trust, Invesco Exchange-Traded Fund Trust II, Invesco India Exchange-Traded Fund Trust, Invesco Actively Managed Exchange-Traded Fund Trust, Invesco Actively Managed Exchange-Traded Commodity Fund Trust and Invesco Exchange-Traded Self-Indexed Fund Trust; Secretary, Invesco Indexing LLC; Director, Secretary, General Counsel and Senior Vice President, Van Kampen Exchange Corp.; Director, Vice President and Secretary, IVZ Distributors, Inc. (formerly known as INVESCO Distributors, Inc.); Director and Vice President, INVESCO Funds Group, Inc.; Director and Vice President, Van Kampen Advisors Inc.; Director, Vice President, Secretary and General Counsel, Van Kampen Investor Services Inc.; Director and Secretary, Invesco Distributors, Inc. (formerly known as Invesco AIM Distributors, Inc.); Director, Senior Vice President, General Counsel and Secretary, Invesco AIM Advisers, Inc. and Van Kampen Investments Inc.; Director, Vice President and Secretary, Fund Management Company; Director, Senior Vice President, Secretary, General Counsel and Vice President, Invesco AIM Capital Management, Inc.; and Chief Operating Officer and General Counsel, Liberty Ridge Capital, Inc. (an investment adviser) | | N/A | | N/A |
| | |
| T-4 | | Invesco Value Opportunities Fund |
Trustees and Officers–(continued)
| | | | | | | | |
Name, Year of Birth and Position(s) Held with the Trust | | Trustee and/or Officer Since | | Principal Occupation(s) During Past 5 Years | | Number of Funds in Fund Complex Overseen by Trustee | | Other Directorship(s) Held by Trustee During At Least The Past 5 Years |
| Officers–(continued) |
Tony Wong – 1973 Senior Vice President | | 2023 | | Senior Managing Director, Invesco Ltd.; Director, Chairman, Chief Executive Officer and President, Invesco Advisers, Inc.; Director and Chairman, Invesco Private Capital, Inc., INVESCO Private Capital Investments, Inc. and INVESCO Realty, Inc.; Director, Invesco Senior Secured Management, Inc.; President, Invesco Managed Accounts, LLC and SNW Asset Management Corporation; and Senior Vice President, The Invesco Funds Formerly: Assistant Vice President, The Invesco Funds; and Vice President, Invesco Advisers, Inc. | | N/A | | N/A |
Stephanie C. Butcher – 1971 Senior Vice President | | 2023 | | Senior Managing Director, Invesco Ltd.; Senior Vice President, The Invesco Funds; Director and Chief Executive Officer, Invesco Asset Management Limited | | N/A | | N/A |
Adrien Deberghes – 1967 Principal Financial Officer, Treasurer and Senior Vice President | | 2020 | | Head of the Fund Office of the CFO and Fund Administration; Vice President, Invesco Advisers, Inc.; Director, Invesco Trust Company; Principal Financial Officer, Treasurer and Senior Vice President, The Invesco Funds; Vice President, Invesco Exchange-Traded Fund Trust, Invesco Exchange-Traded Fund Trust II, Invesco India Exchange-Traded Fund Trust, Invesco Actively Managed Exchange-Traded Fund Trust, Invesco Actively Managed Exchange-Traded Commodity Fund Trust and Invesco Exchange-Traded Self-Indexed Fund Trust Formerly: Vice President, The Invesco Funds; Senior Vice President and Treasurer, Fidelity Investments | | N/A | | N/A |
Crissie M. Wisdom – 1969 Anti-Money Laundering Compliance Officer | | 2013 | | Anti-Money Laundering and OFAC Compliance Officer for Invesco U.S. entities including: Invesco Advisers, Inc. and its affiliates, Invesco Capital Markets, Inc., Invesco Distributors, Inc., Invesco Investment Services, Inc., The Invesco Funds, Invesco Capital Management, LLC, Invesco Trust Company; and Fraud Prevention Manager for Invesco Investment Services, Inc. | | N/A | | N/A |
Todd F. Kuehl – 1969 Chief Compliance Officer and Senior Vice President | | 2020 | | Chief Compliance Officer, Invesco Advisers, Inc. (registered investment adviser); and Chief Compliance Officer and Senior Vice President, The Invesco Funds Formerly: Managing Director and Chief Compliance Officer, Legg Mason (Mutual Funds); Chief Compliance Officer, Legg Mason Private Portfolio Group (registered investment adviser) | | N/A | | N/A |
James Bordewick, Jr. – 1959 Senior Vice President and Senior Officer | | 2022 | | Senior Vice President and Senior Officer, The Invesco Funds Formerly: Chief Legal Officer, KingsCrowd, Inc. (research and analytical platform for investment in private capital markets); Chief Operating Officer and Head of Legal and Regulatory, Netcapital (private capital investment platform); Managing Director, General Counsel of asset management and Chief Compliance Officer for asset management and private banking, Bank of America Corporation; Chief Legal Officer, Columbia Funds and BofA Funds; Senior Vice President and Associate General Counsel, MFS Investment Management; Chief Legal Officer, MFS Funds; Associate, Ropes & Gray; and Associate, Gaston Snow & Ely Bartlett | | N/A | | N/A |
The Statement of Additional Information of the Trust includes additional information about the Fund’s Trustees and is available upon request, without charge, by calling 1.800.959.4246. Please refer to the Fund’s Statement of Additional Information for information on the Fund’s sub-advisers.
| | | | | | |
| Office of the Fund | | Investment Adviser | | Distributor | | Auditors |
| 11 Greenway Plaza | | Invesco Advisers, Inc. | | Invesco Distributors, Inc. | | PricewaterhouseCoopers LLP |
| Houston, TX 77046-1173 | | 1331 Spring Street, NW, Suite 2500 | | 11 Greenway Plaza | | 1000 Louisiana Street, Suite 5800 |
| | Atlanta, GA 30309 | | Houston, TX 77046-1173 | | Houston, TX 77002-5021 |
| | | |
| Counsel to the Fund | | Counsel to the Independent Trustees | | Transfer Agent | | Custodian |
| Stradley Ronon Stevens & Young, LLP | | Sidley Austin LLP | | Invesco Investment Services, Inc. | | State Street Bank and Trust Company |
| 2005 Market Street, Suite 2600 | | 787 Seventh Avenue | | 11 Greenway Plaza | | 225 Franklin Street |
| Philadelphia, PA 19103-7018 | | New York, NY 10019 | | Houston, TX 77046-1173 | | Boston, MA 02110-2801 |
| | |
| T-5 | | Invesco Value Opportunities Fund |
Proxy Results
A Special Joint Meeting (“Meeting”) of Shareholders of AIM Sector Funds (Invesco Sector Funds), a Delaware statutory trust (“Trust”), was held on January 16, 2024. The Meeting was held for the following purpose:
| (1) | Elect 14 trustees to the Board of Trustees of the Trust, each of whom will serve until his or her successor is duly elected and qualified. |
The results of the voting on the above matter were as follows:
| | | | | | | | | | |
| | | Matter | | Votes For | | | Votes Against/Withheld | |
|
| |
| (1)* | | Beth Ann Brown | | | 595,446,022.84 | | | | 16,915,661.31 | |
| | Carol Deckbar | | | 595,102,087.25 | | | | 17,259,596.89 | |
| | Cynthia Hostetler | | | 595,359,921.21 | | | | 17,001,762.94 | |
| | Dr. Eli Jones | | | 594,949,311.14 | | | | 17,412,373.00 | |
| | Elizabeth Krentzman | | | 595,453,833.65 | | | | 16,907,850.50 | |
| | Jeffrey H. Kupor | | | 595,342,690.51 | | | | 17,018,993.64 | |
| | Anthony J. LaCava, Jr. | | | 595,293,865.38 | | | | 17,067,818.77 | |
| | James Liddy | | | 594,980,026.97 | | | | 17,381,657.17 | |
| | Dr. Prema Mathai-Davis | | | 594,031,204.04 | | | | 18,330,480.11 | |
| | Joel W. Motley | | | 594,381,710.91 | | | | 17,979,973.23 | |
| | Teresa M. Ressel | | | 595,821,958.43 | | | | 16,539,725.72 | |
| | Douglas Sharp | | | 595,715,711.66 | | | | 16,645,972.48 | |
| | Robert C. Troccoli | | | 594,748,318.91 | | | | 17,613,365.24 | |
| | Daniel S. Vandivort | | | 595,002,691.19 | | | | 17,358,992.96 | |
* Proposal 1 required approval by a combined vote of all the portfolios of AIM Sector Funds (Invesco Sector Funds).
| | |
| T-6 | | Invesco Value Opportunities Fund |

Go paperless with eDelivery
Visit invesco.com/edelivery to enjoy the convenience and security of anytime electronic access to your investment documents.
With eDelivery, you can elect to have any or all of the following materials delivered straight to your inbox to download, save and print from your own computer:
∎ Fund reports and prospectuses
∎ Quarterly statements
∎ Daily confirmations
∎ Tax forms
Invesco mailing information
Send general correspondence to Invesco Investment Services, Inc., P.O. Box 219078, Kansas City, MO 64121-9078.
Important notice regarding delivery of security holder documents
To reduce Fund expenses, only one copy of most shareholder documents may be mailed to shareholders with multiple accounts at the same address (Householding). Mailing of your shareholder documents may be householded indefinitely unless you instruct us otherwise. If you do not want the mailing of these documents to be combined with those for other members of your household, please contact Invesco Investment Services, Inc. at 800 959 4246 or contact your financial institution. We will begin sending you individual copies for each account within 30 days after receiving your request.
Fund holdings and proxy voting information
The Fund provides a complete list of its portfolio holdings four times each year, at the end of each fiscal quarter. For the second and fourth quarters, the list appears, respectively, in the Fund’s semiannual and annual reports to shareholders. For the first and third quarters, the Fund files the list with the Securities and Exchange Commission (SEC) as an exhibit to its reports on Form N-PORT. The most recent list of portfolio holdings is available at invesco.com/completeqtrholdings. Shareholders can also look up the Fund’s Form N-PORT filings on the SEC website, sec.gov. The SEC file numbers for the Fund are shown below.
A description of the policies and procedures that the Fund uses to determine how to vote proxies relating to portfolio securities is available without charge, upon request, from our Client Services department at 800 959 4246, or at invesco.com/corporate/about-us/esg. The information is also available on the SEC website, sec.gov.
Information regarding how the Fund voted proxies related to its portfolio securities during the most recent 12-month period ended June 30 is available at invesco.com/proxysearch. This information is also available on the SEC website, sec.gov.
Invesco Advisers, Inc. is an investment adviser; it provides investment advisory services to individual and institutional clients and does not sell securities. Invesco Distributors, Inc. is the US distributor for Invesco Ltd.’s retail mutual funds, exchange-traded funds and institutional money market funds. Both are wholly owned, indirect subsidiaries of Invesco Ltd.
| | | | |
| SEC file number(s): 811-03826 and 002-85905 | | Invesco Distributors, Inc. | | VK-VOPP-AR-1 |
(b) Not applicable.
There were no material amendments to the Code of Ethics (the “Code”) that applies to the Registrant’s Principal Executive Officer (“PEO”) and Principal Financial Officer (“PFO”) during the period covered by the report. The Code was revised to include the PEOs and PFOs of certain Invesco exchange traded funds, previously covered by a separate code of ethics. The Registrant did not grant any waivers, including implicit waivers, from any provisions of the Code to the PEO or PFO during the period covered by this report.
| ITEM 3. | AUDIT COMMITTEE FINANCIAL EXPERT. |
The Board of Trustees has determined that the Registrant has at least one audit committee financial expert serving on its Audit Committee. The Audit Committee financial expert is Anthony J. LaCava, Jr. Anthony J. LaCava, Jr. is “independent” within the meaning of that term as used in Form N-CSR.
| ITEM 4. | PRINCIPAL ACCOUNTANT FEES AND SERVICES. |
(a) to (d)
Fees Billed by PwC Related to the Registrant
PricewaterhouseCoopers LLP (“PwC”), the Registrant’s independent registered public accounting firm, billed the Registrant aggregate fees for services rendered to the Registrant for the last two fiscal years as shown in the following table. The Audit Committee pre-approved all audit and non-audit services provided to the Registrant.
| | | | | | | | |
| | | Fees Billed for
Services Rendered
to the Registrant for
fiscal year end 2024 | | | Fees Billed for
Services Rendered
to the Registrant for
fiscal year end 2023 | |
Audit Fees | | $ | 282,237 | | | $ | 274,431 | |
Audit-Related Fees(1) | | $ | 0 | | | $ | 11,000 | |
Tax Fees(2) | | $ | 207,885 | | | $ | 170,873 | |
All Other Fees | | $ | 0 | | | $ | 0 | |
| | | | | | | | |
Total Fees | | $ | 490,122 | | | $ | 456,304 | |
| | | | | | | | |
| (1) | Audit-Related Fees for the fiscal year ended 2023 includes fees billed for reviewing regulatory filings. |
| (2) | Tax Fees for the fiscal years ended 2024 and 2023 includes fees billed for preparation of U.S. Tax Returns and Taxable Income calculations, including excise tax and year-to-date estimates for various book-to-tax differences. |
Fees Billed by PwC Related to Invesco and Affiliates
PwC billed Invesco Advisers, Inc. (“Invesco”), the Registrant’s investment adviser, and any entity controlling, controlled by or under common control with Invesco that provides ongoing services to the Registrant (“Affiliates”) aggregate fees for pre-approved non-audit services rendered to Invesco and Affiliates for the last two fiscal years as shown in the following table. The Audit Committee pre-approved all non-audit services provided to Invesco and Affiliates that were required to be pre-approved.
| | | | | | | | |
| | | Fees Billed for Non-
Audit Services
Rendered to Invesco and
Invesco Affiliates for
fiscal year end 2024
That Were Required
to be Pre-Approved
by the Registrant’s
Audit Committee | | | Fees Billed for Non-Audit
Services Rendered to
Invesco and Invesco
Affiliates for fiscal year end
2023 That Were Required
to be Pre-Approved
by the Registrant’s
Audit Committee | |
Audit-Related Fees(1) | | $ | 1,121,000 | | | $ | 1,074,000 | |
Tax Fees | | $ | 0 | | | $ | 0 | |
All Other Fees | | $ | 0 | | | $ | 0 | |
| | | | | | | | |
Total Fees | | $ | 1,121,000 | | | $ | 1,074,000 | |
| | | | | | | | |
| (1) | Audit-Related Fees for the fiscal years ended 2024 and 2023 include fees billed related to reviewing controls at a service organization. |
(e)(1)
PRE-APPROVAL OF AUDIT AND NON-AUDIT SERVICES
POLICIES AND PROCEDURES
As adopted by the Audit Committees
of the Invesco Funds (the “Funds”)
Last Amended March 29, 2017
| | I. | Statement of Principles |
The Audit Committees (the “Audit Committee”) of the Boards of Trustees of the Funds (the “Board”) have adopted these policies and procedures (the “Procedures”) with respect to the pre-approval of audit and non-audit services to be provided by the Funds’ independent auditor (the “Auditor”) to the Funds, and to the Funds’ investment adviser(s) and any entity controlling, controlled by, or under common control with the investment adviser(s) that provides ongoing services to the Funds (collectively, “Service Affiliates”).
Under Section 202 of the Sarbanes-Oxley Act of 2002, all audit and non-audit services provided to the Funds by the Auditor must be preapproved by the Audit Committee. Rule 2-01 of Regulation S-X requires that the Audit Committee also pre-approve a Service Affiliate’s engagement of the Auditor for non-audit services if the engagement relates directly to the operations and financial reporting of the Funds (a “Service Affiliate’s Covered Engagement”).
These Procedures set forth the procedures and the conditions pursuant to which the Audit Committee may pre-approve audit and non-audit services for the Funds and a Service Affiliate’s Covered Engagement pursuant to rules and regulations of the Securities and Exchange Commission (“SEC”) and other
organizations and regulatory bodies applicable to the Funds (“Applicable Rules”).1 They address both general pre-approvals without consideration of specific case-by-case services (“general pre-approvals”) and pre-approvals on a case-by-case basis (“specific pre-approvals”). Any services requiring pre-approval that are not within the scope of general pre-approvals hereunder are subject to specific pre-approval. These Procedures also address the delegation by the Audit Committee of pre-approval authority to the Audit Committee Chair or Vice Chair.
| | II. | Pre-Approval of Fund Audit Services |
The annual Fund audit services engagement, including terms and fees, is subject to specific pre-approval by the Audit Committee. Audit services include the annual financial statement audit and other procedures required to be performed by an independent auditor to be able to form an opinion on the Funds’ financial statements. The Audit Committee will receive, review and consider sufficient information concerning a proposed Fund audit engagement to make a reasonable evaluation of the Auditor’s qualifications and independence. The Audit Committee will oversee the Fund audit services engagement as necessary, including approving any changes in terms, audit scope, conditions and fees.
In addition to approving the Fund audit services engagement at least annually and specifically approving any changes, the Audit Committee may generally or specifically pre-approve engagements for other audit services, which are those services that only an independent auditor reasonably can provide. Other audit services may include services associated with SEC registration statements, periodic reports and other documents filed with the SEC.
| | III. | General and Specific Pre-Approval of Non-Audit Fund Services |
The Audit Committee will consider, at least annually, the list of General Pre-Approved Non-Audit Services which list may be terminated or modified at any time by the Audit Committee. To inform the Audit Committee’s review and approval of General Pre-Approved Non-Audit Services, the Funds’ Treasurer (or his or her designee) and Auditor shall provide such information regarding independence or other matters as the Audit Committee may request.
Any services or fee ranges that are not within the scope of General Pre-Approved Non-Audit Services have not received general pre-approval and require specific pre-approval. Each request for specific pre-approval by the Audit Committee for services to be provided by the Auditor to the Funds must be submitted to the Audit Committee by the Funds’ Treasurer (or his or her designee) and must include detailed information about the services to be provided, the fees or fee ranges to be charged, and other relevant information sufficient to allow the Audit Committee to consider whether to pre-approve such engagement, including evaluating whether the provision of such services will impair the independence of the Auditor and is otherwise consistent with Applicable Rules.
| | IV. | Non-Audit Service Types |
The Audit Committee may provide either general or specific pre-approval of audit-related, tax or other services, each as described in more detail below.
| 1 | Applicable Rules include, for example, New York Stock Exchange (“NYSE”) rules applicable to closed-end funds managed by Invesco and listed on NYSE. |
“Audit-related services” are assurance and related services that are reasonably related to the performance of the audit or review of the Fund’s financial statements or that are traditionally performed by an independent auditor. Audit-related services include, among others, accounting consultations related to accounting, financial reporting or disclosure matters not classified as “Audit services”; assistance with understanding and implementing new accounting and financial reporting guidance from rulemaking authorities; services related to mergers, acquisitions or dispositions; compliance with ratings agency requirements and interfund lending activities; and assistance with internal control reporting requirements.
“Tax services” include, but are not limited to, the review and signing of the Funds’ federal tax returns, the review of required distributions by the Funds and consultations regarding tax matters such as the tax treatment of new investments or the impact of new regulations. The Audit Committee will not approve proposed services of the Auditor which the Audit Committee believes are to be provided in connection with a service or transaction initially recommended by the Auditor, the sole business purpose of which may be tax avoidance and the tax treatment of which may not be supported in the Internal Revenue Code and related regulations. The Audit Committee will consult with the Funds’ Treasurer (or his or her designee) and may consult with outside counsel or advisers as necessary to ensure the consistency of tax services rendered by the Auditor with the foregoing policy. The Auditor shall not represent any Fund or any Service Affiliate before a tax court, district court or federal court of claims.
Each request to provide tax services under either the general or specific pre-approval of the Audit Committee will include a description from the Auditor in writing of (i) the scope of the service, the fee structure for the engagement, and any side letter or other amendment to the engagement letter, or any other agreement (whether oral, written, or otherwise) between the Auditor and the Funds, relating to the service; and (ii) any compensation arrangement or other agreement, such as a referral agreement, a referral fee or fee-sharing arrangement, between the Auditor (or an affiliate of the Auditor) and any person (other than the Funds or Service Affiliates receiving the services) with respect to the promoting, marketing, or recommending of a transaction covered by the service. The Auditor will also discuss with the Audit Committee the potential effects of the services on the independence of the Auditor, and document the substance of its discussion with the Audit Committee.
The Audit Committee may pre-approve other non-audit services so long as the Audit Committee believes that the service will not impair the independence of the Auditor. Appendix I includes a list of services that the Auditor is prohibited from performing by the SEC rules. Appendix I also includes a list of services that would impair the Auditor’s independence unless the Audit Committee reasonably concludes that the results of the services will not be subject to audit procedures during an audit of the Funds’ financial statements.
| | V. | Pre-Approval of Service Affiliate’s Covered Engagements |
Rule 2-01 of Regulation S-X requires that the Audit Committee pre-approve a Service Affiliate’s engagement of the Auditor for non-audit services if the engagement relates directly to the operations and financial reporting of the Funds, defined above as a “Service Affiliate’s Covered Engagement”.
The Audit Committee may provide either general or specific pre-approval of any Service Affiliate’s Covered Engagement, including for audit-related, tax or other services, as described above, if the Audit Committee believes that the provision of the services to a Service Affiliate will not impair the independence of the Auditor with respect to the Funds. Any Service Affiliate’s Covered Engagements that are not within the scope of General Pre-Approved Non-Audit Services have not received general pre-approval and require specific pre-approval.
Each request for specific pre-approval by the Audit Committee of a Service Affiliate’s Covered Engagement must be submitted to the Audit Committee by the Funds’ Treasurer (or his or her designee) and must include detailed information about the services to be provided, the fees or fee ranges to be charged, a description of the current status of the pre-approval process involving other audit committees in the Invesco investment company complex (as defined in Rule 2-201 of Regulation S-X) with respect to the proposed engagement, and other relevant information sufficient to allow the Audit Committee to consider whether the provision of such services will impair the independence of the Auditor from the Funds. Additionally, the Funds’ Treasurer (or his or her designee) and the Auditor will provide the Audit Committee with a statement that the proposed engagement requires pre-approval by the Audit Committee, the proposed engagement, in their view, will not impair the independence of the Auditor and is consistent with Applicable Rules, and the description of the proposed engagement provided to the Audit Committee is consistent with that presented to or approved by the Invesco audit committee.
Information about all Service Affiliate engagements of the Auditor for non-audit services, whether or not subject to pre-approval by the Audit Committee, shall be provided to the Audit Committee at least quarterly, to allow the Audit Committee to consider whether the provision of such services is compatible with maintaining the Auditor’s independence from the Funds. The Funds’ Treasurer and Auditor shall provide the Audit Committee with sufficiently detailed information about the scope of services provided and the fees for such services, to ensure that the Audit Committee can adequately consider whether the provision of such services is compatible with maintaining the Auditor’s independence from the Fund.
| | VI. | Pre-Approved Fee Levels or Established Amounts |
Pre-approved fee levels or ranges for audit and non-audit services to be provided by the Auditor to the Funds, and for a Service Affiliate’s Covered Engagement, under general pre-approval or specific pre-approval will be set periodically by the Audit Committee. Any proposed fees exceeding 110% of the maximum pre-approved fee levels or ranges for such services or engagements will be promptly presented to the Audit Committee and will require specific pre-approval by the Audit Committee before payment of any additional fees is made.
The Audit Committee hereby delegates, subject to the dollar limitations set forth below, specific authority to its Chair, or in his or her absence, Vice Chair, to pre-approve audit and non-audit services proposed to be provided by the Auditor to the Funds and/or a Service Affiliate’s Covered Engagement, between Audit Committee meetings. Such delegation does not preclude the Chair or Vice Chair from declining, on a case-by-case basis, to exercise his or her delegated authority and instead convening the Audit Committee to consider and pre-approve any proposed services or engagements.
Notwithstanding the foregoing, the Audit Committee must pre-approve: (a) any non-audit services to be provided to the Funds for which the fees are estimated to exceed $500,000; (b) any Service Affiliate’s Covered Engagement for which the fees are estimated to exceed $500,000; or (c) any cost increase to any previously approved service or engagement that exceeds the greater of $250,000 or 50% of the previously approved fees up to a maximum increase of $500,000.
| | VIII. | Compliance with Procedures |
Notwithstanding anything herein to the contrary, failure to pre-approve any services or engagements that are not required to be pre-approved pursuant to the de minimis exception provided for in Rule 2-01(c)(7)(i)(C) of Regulation S-X shall not constitute a violation of these Procedures. The Audit Committee has designated the Funds’ Treasurer to ensure services and engagements are pre-approved in compliance with these Procedures. The Funds’ Treasurer will immediately report to the Chair of the Audit Committee, or the Vice Chair in his or her absence, any breach of these Procedures that comes to the attention of the Funds’ Treasurer or any services or engagements that are not required to be pre-approved pursuant to the de minimis exception provided for in Rule 2-01(c)(7)(i)(C) of Regulation S-X.
On at least an annual basis, the Auditor will provide the Audit Committee with a summary of all non-audit services provided to any entity in the investment company complex (as defined in section 2-01(f)(14) of Regulation S-X, including the Funds and Service Affiliates) that were not pre-approved, including the nature of services provided and the associated fees.
| | IX. | Amendments to Procedures |
All material amendments to these Procedures must be approved in advance by the Audit Committee. Non-material amendments to these Procedures may be made by the Legal and Compliance Departments and will be reported to the Audit Committee at the next regularly scheduled meeting of the Audit Committee.
Appendix I
Non-Audit Services That May Impair the Auditor’s Independence
The Auditor is not independent if, at any point during the audit and professional engagement, the Auditor provides the following non-audit services:
| | • | | Broker-dealer, investment adviser, or investment banking services ; |
| | • | | Expert services unrelated to the audit; |
| | • | | Any service or product provided for a contingent fee or a commission; |
| | • | | Services related to marketing, planning, or opining in favor of the tax treatment of confidential transactions or aggressive tax position transactions, a significant purpose of which is tax avoidance; |
| | • | | Tax services for persons in financial reporting oversight roles at the Fund; and |
| | • | | Any other service that the Public Company Oversight Board determines by regulation is impermissible. |
An Auditor is not independent if, at any point during the audit and professional engagement, the Auditor provides the following non-audit services unless it is reasonable to conclude that the results of the services will not be subject to audit procedures during an audit of the Funds’ financial statements:
| | • | | Bookkeeping or other services related to the accounting records or financial statements of the audit client; |
| | • | | Financial information systems design and implementation; |
| | • | | Appraisal or valuation services, fairness opinions, or contribution-in-kind reports; |
| | • | | Actuarial services; and |
| | • | | Internal audit outsourcing services. |
(e)(2) There were no amounts that were pre-approved by the Audit Committee pursuant to the de minimis exception under Rule 2-01 of Regulation S-X.
(f) Not applicable.
(g) In addition to the amounts shown in the tables above, PwC billed Invesco and Invesco Affiliates aggregate fees of $6,572,000 for the fiscal year ended April 30, 2024 and $6,738,000 for the fiscal year ended April 30, 2023. In total, PwC billed the Registrant, Invesco and Invesco Affiliates aggregate non-audit fees of $7,900,885 for the fiscal year ended April 30, 2024 and $7,982,873 for the fiscal year ended April 30, 2023.
PwC provided audit services to the Investment Company complex of approximately $34 million.
(h) The Audit Committee also has considered whether the provision of non-audit services that were rendered to Invesco and Invesco Affiliates that were not required to be pre-approved pursuant to SEC regulations, if any, is compatible with maintaining PwC’s independence.
(i) Not applicable.
(j) Not applicable.
| ITEM 5. | AUDIT COMMITTEE OF LISTED REGISTRANTS. |
Not applicable.
| ITEM 6. | SCHEDULE OF INVESTMENTS. |
Investments in securities of unaffiliated issuers is included as part of the reports to stockholders filed under Item 1 of this Form.
| ITEM 7. | DISCLOSURE OF PROXY VOTING POLICIES AND PROCEDURES FOR CLOSED-END MANAGEMENT INVESTMENT COMPANIES. |
Not applicable.
| ITEM 8. | PORTFOLIO MANAGERS OF CLOSED-END MANAGEMENT INVESTMENT COMPANIES. |
Not applicable.
| ITEM 9. | PURCHASES OF EQUITY SECURITIES BY CLOSED-END MANAGEMENT INVESTMENT COMPANY AND AFFILIATED PURCHASERS. |
Not applicable.
| ITEM 10. | SUBMISSION OF MATTERS TO A VOTE OF SECURITY HOLDERS. |
None.
| ITEM 11. | CONTROLS AND PROCEDURES. |
| | (a) | As of June 14, 2024, an evaluation was performed under the supervision and with the participation of the officers of the Registrant, including the PEO and PFO, to assess the effectiveness of the Registrant’s disclosure controls and procedures, as that term is defined in Rule 30a-3(c) under the Investment Company Act of 1940 (the “Act”), as amended. Based on that evaluation, the Registrant’s officers, including the PEO and PFO, concluded that, as of |
| | June 14, 2024, the Registrant’s disclosure controls and procedures were reasonably designed to ensure: (1) that information required to be disclosed by the Registrant on Form N-CSR is recorded, processed, summarized and reported within the time periods specified by the rules and forms of the Securities and Exchange Commission; and (2) that material information relating to the Registrant is made known to the PEO and PFO as appropriate to allow timely decisions regarding required disclosure. |
| | (b) | There have been no changes in the Registrant’s internal control over financial reporting (as defined in Rule 30a-3(d) under the Act) that occurred during the period covered by this report that have materially affected, or are reasonably likely to materially affect, the Registrant’s internal control over financial reporting. |
| ITEM 12. | DISCLOSURE OF SECURITIES LENDING ACTIVITIES FOR CLOSED-END MANAGEMENT INVESTMENT COMPANIES. |
Not applicable.
| ITEM 13. | RECOVERY OF ERRONEOUSLY AWARDED COMPENSATION. |
Not applicable.
SIGNATURES
Pursuant to the requirements of the Securities Exchange Act of 1934 and the Investment Company Act of 1940, the Registrant has duly caused this report to be signed on its behalf by the undersigned, thereunto duly authorized.
Registrant: AIM Sector Funds (Invesco Sector Funds)
| | |
| By: | | /s/ Glenn Brightman |
| | Glenn Brightman |
| | Principal Executive Officer |
| |
| Date: | | June 28, 2024 |
Pursuant to the requirements of the Securities and Exchange Act of 1934 and the Investment Company Act of 1940, this report has been signed below by the following persons on behalf of the Registrant and in the capacities and on the dates indicated.
| | |
| By: | | /s/ Glenn Brightman |
| | Glenn Brightman |
| | Principal Executive Officer |
| |
| Date: | | June 28, 2024 |
| | |
| By: | | /s/ Adrien Deberghes |
| | Adrien Deberghes |
| | Principal Financial Officer |
| |
| Date: | | June 28, 2024 |