|
Exhibit 99.1 
|
Tribune Media Investor Day PRESENTATION December 11, 2014I nvestor Day PRESENTATION
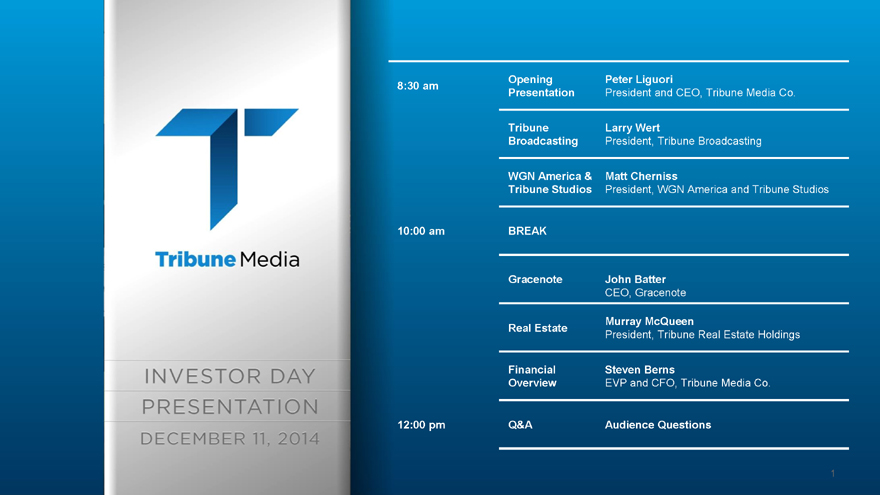
MediaInvestor DayPRESENTATIONDecember 11, 2014Opening Peter Liguori 8:30 amPresentation President and CEO, Tribune Media Co.Tribune Larry WertBroadcasting President, Tribune BroadcastingWGN America & Matt ChernissTribune Studios President, WGN America and Tribune Studios10:00 am BREAKGracenote John BatterCEO, GracenoteMurray McQueen Real EstatePresident, Tribune Real Estate HoldingsFinancial Steven BernsOverview EVP and CFO, Tribune Media Co.12:00 pm Q&A Audience Questions1
MediaInvestor DayPRESENTATIONDecember 11, 2014Investor DayPRESENTATION
|
|
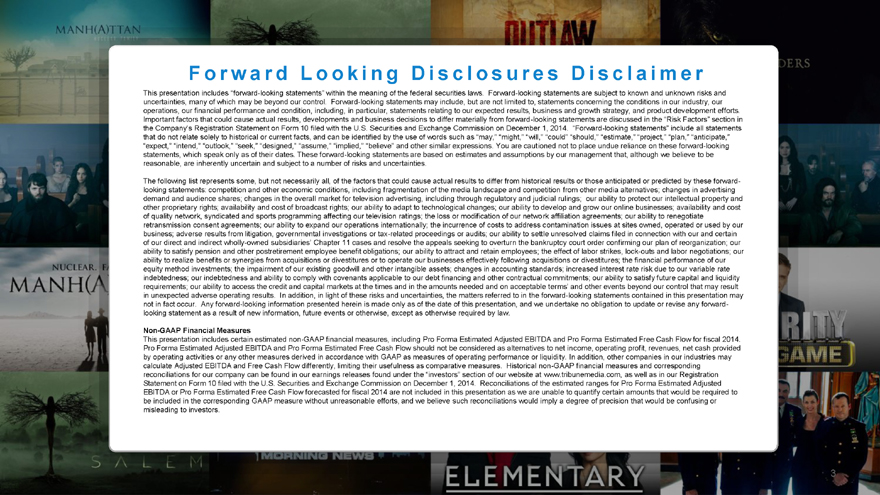
o r w a r d L o o k i n g D i s c l o s u r e s D i s c l a i m e rThis presentation includes forward-looking statements within the meaning of the federal securities laws. Forward-looking statements are subject to known and unknown risks and uncertainties, many of which may be beyond our control. Forward-looking statements may include, but are not limited to, statements concerning the conditions in our industry, our operations, our financial performance and condition, including, in particular, statements relating to our expected results, business and growth strategy, and product development efforts. Important factors that could cause actual results, developments and business decisions to differ materially from forward-looking statements are discussed in the Risk Factors section in the Company s Registration Statement on Form 10 filed with the U.S. Securities and Exchange Commission on December 1, 2014. Forward-looking statements include all statements that do not relate solely to historical or current facts, and can be identified by the use of words such as may, might, will, could should, estimate, project, plan, anticipate, expect, intend, outlook, seek, designed, assume, implied, believe and other similar expressions. You are cautioned not to place undue reliance on these forward-looking statements, which speak only as of their dates. These forward-looking statements are based on estimates and assumptions by our management that, although we believe to be reasonable, are inherently uncertain and subject to a number of risks and uncertainties. The following list represents some, but not necessarily all, of the factors that could cause actual results to differ from historical results or those anticipated or predicted by these forward-looking statements: competition and other economic conditions, including fragmentation of the media landscape and competition from other media alternatives; changes in advertising demand and audience shares; changes in the overall market for television advertising, including through regulatory and judicial rulings; our ability to protect our intellectual property and other proprietary rights; availability and cost of broadcast rights; our ability to adapt to technological changes; our ability to develop and grow our online businesses; availability and cost of quality network, syndicated and sports programming affecting our television ratings; the loss or modification of our network affiliation agreements; our ability to renegotiate retransmission consent agreements; our ability to expand our operations internationally; the incurrence of costs to address contamination issues at sites owned, operated or used by our business; adverse results from litigation, governmental investigations or tax-related proceedings or audits; our ability to settle unresolved claims filed in connection with our and certain of our direct and indirect wholly-owned subsidiaries Chapter 11 cases and resolve the appeals seeking to overturn the bankruptcy court order confirming our plan of reorganization; our ability to satisfy pension and other postretirement employee benefit obligations; our ability to attract and retain employees; the effect of labor strikes, lock-outs and labor negotiations; our ability to realize benefits or synergies from acquisitions or divestitures or to operate our businesses effectively following acquisitions or divestitures; the financial performance of our equity method investments; the impairment of our existing goodwill and other intangible assets; changes in accounting standards; increased interest rate risk due to our variable rate indebtedness; our indebtedness and ability to comply with covenants applicable to our debt financing and other contractual commitments; our ability to satisfy future capital and liquidity requirements; our ability to access the credit and capital markets at the times and in the amounts needed and on acceptable terms and other events beyond our control that may result in unexpected adverse operating results. In addition, in light of these risks and uncertainties, the matters referred to in the forward-looking statements contained in this presentation may not in fact occur. Any forward-looking information presented herein is made only as of the date of this presentation, and we undertake no obligation to update or revise any forward-looking statement as a result of new information, future events or otherwise, except as otherwise required by law.Non-GAAP Financial MeasuresThis presentation includes certain estimated non-GAAP financial measures, including Pro Forma Estimated Adjusted EBITDA and Pro Forma Estimated Free Cash Flow for fiscal 2014. Pro Forma Estimated Adjusted EBITDA and Pro Forma Estimated Free Cash Flow should not be considered as alternatives to net income, operating profit, revenues, net cash provided by operating activities or any other measures derived in accordance with GAAP as measures of operating performance or liquidity. In addition, other companies in our industries may calculate Adjusted EBITDA and Free Cash Flow differently, limiting their usefulness as comparative measures. Historical non-GAAP financial measures and corresponding reconciliations for our company can be found in our earnings releases found under the investors section of our website at www.tribunemedia.com, as well as in our Registration Statement on Form 10 filed with the U.S. Securities and Exchange Commission on December 1, 2014. Reconciliations of the estimated ranges for Pro Forma Estimated Adjusted EBITDA or Pro Forma Estimated Free Cash Flow forecasted for fiscal 2014 are not included in this presentation as we are unable to quantify certain amounts that would be required to be included in the corresponding GAAP measure without unreasonable efforts, and we believe such reconciliations would imply a degree of precision that would be confusing or misleading to investors.
|
|
MediaInvestor DayPRESENTATIONDecember 11, 2014Opening Peter Liguori 8:30 amPresentation President and CEO, Tribune Media Co.Tribune Larry WertBroadcasting President, Tribune BroadcastingWGN America & Matt ChernissTribune Studios President, WGN America and Tribune Studios10:00 am BREAKGracenote John BatterCEO, GracenoteMurray McQueen Real EstatePresident, Tribune Real Estate HoldingsFinancial Steven BernsOverview EVP and CFO, Tribune Media Co.12:00 pm Q&A Audience Questions1
MediaInvestor DayPRESENTATIONDecember 11, 2014Investor DayPRESENTATION
MediaInvestor DayPRESENTATIONDecember 11, 2014Peter LiguoriPresident and CEO, Tribune Media Co.
MediaInvestor DayPRESENTATIONDecember 11, 2014
|

|
Best—in—Class L e a d e r s h i p T e a mPeter Liguori Steven Berns Edward Lazarus Larry Wert John BatterPresident & CEO EVP & CFO EVP & General Counsel President, Broadcast Media EVP & CEO, GracenoteCOO of Discovery CFO of Revlon, Inc Chief of Staff to Chairman of the President/General Manager of CEO of M-GO, a popular digital TV and Communications CFO of Tradeweb FCC WMAQ-TV, the NBC owned station movie streaming service Experience in Chicago Chairman of Entertainment for President & CFO of MDC Partners Practiced law at Akin, Gump President of Production at Dreamworks Prior Fox Broadcasting Strauss, Haur & Feld 30+ years in broadcasting AnimationExperience President & CEO of News Corp s FX NetworksMatt Cherniss Dana Zimmer Murray McQueen Chandler BigelowPresident & General Manager, President, Distribution President, Real Estate EVP & Chief Business WGN America & Tribune Studios Strategies and Operations OfficerSenior VP/Production for Warner EVP of TV Network Distribution for Co-Founder & Managing Partner of CFO of Tribune Bros. NBC Universal Channel West Group Treasurer of Tribune Prior EVP/Programming for Fox EVP of Affiliate Sales and Marketing Managing Director at Cerberus Broadcasting Company for Comcast Networks CapitalExperience 6
|
|
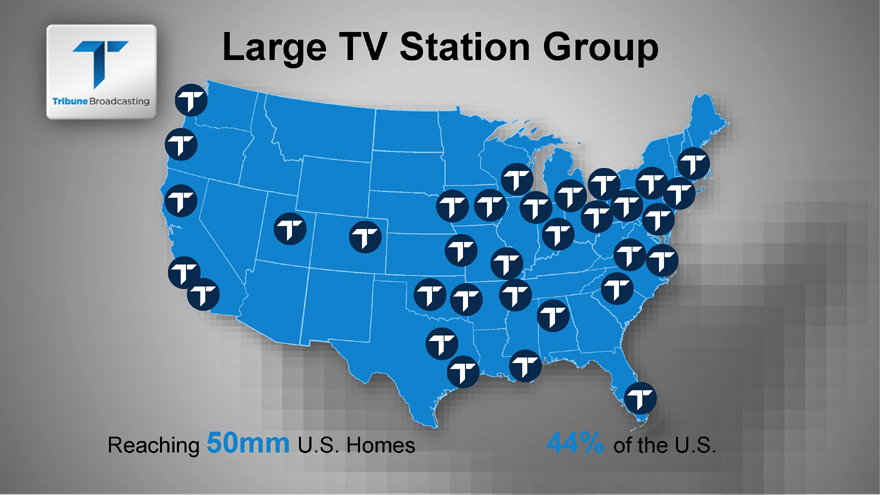
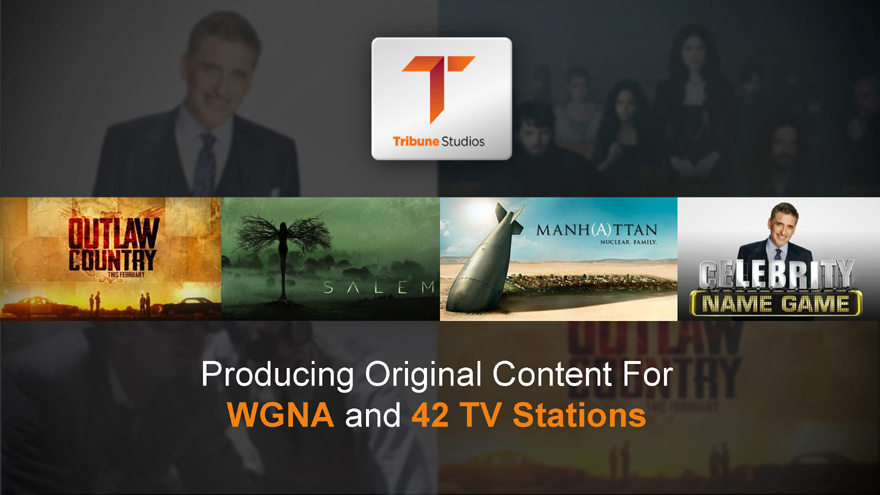
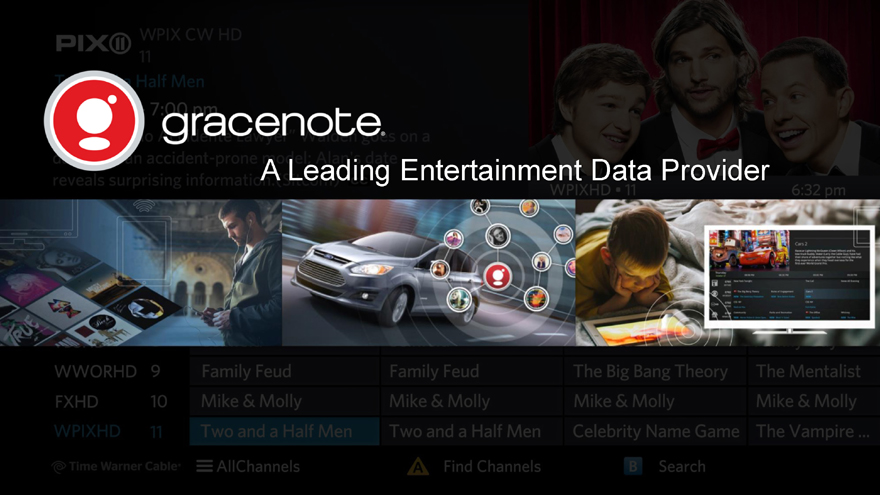
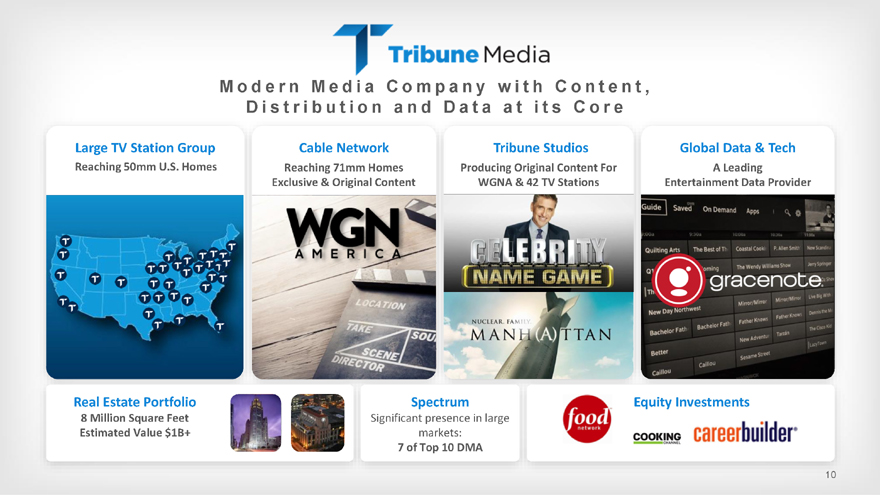
o d e r n M e d i a C o m p a n y w i t h C o n t e n t , D i s t r i b u t i o n a n d D a t a a t i t s C o r eLarge TV Station GroupReaching 50mm U.S. Homes Cable NetworkReaching 71mm Homes Exclusive & Original ContentTribune StudiosProducing Original Content For WGNA & 42 TV StationsGlobal Data & TechA LeadingEntertainment Data ProviderReal Estate Portfolio8 Million Square Feet Estimated Value $1B+SpectrumSignificant presence in large markets: 7 of Top 10 DMAEquity Investments
TV Station GroupReaching 50mm U.S. Homes 44% of the U.S.
AMERICACable NetworkReaching 71mm HomesExclusive & OriginalContent
Original Content For WGNA and 42 TV Stations
A Leading Entertainment Date Provider
n M e d i a C o m p a n y w i t h C o n t e n t , D i s t r i b u t i o n a n d D a t a a t i t s C o r eLarge TV Station GroupReaching 50mm U.S. HomesCable NetworkReaching 71mm Homes Exclusive & Original ContentTribune StudiosProducing Original Content For WGNA & 42 TV StationsGlobal Data & TechA LeadingEntertainment Data ProviderReal Estate Portfolio8 Million Square Feet Estimated Value $1B+SpectrumSignificant presence in large markets: 7 of Top 10 DMAEquity Investments
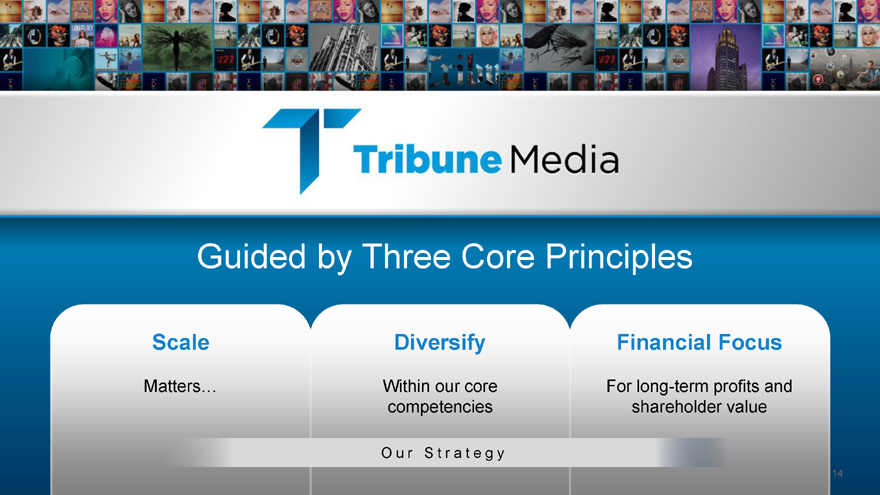
by Three Core PrinciplesScaleMattersDiversifyWithin our core competenciesFinancial FocusFor long-term profits and shareholder valueO u r S t r a t e g y
Believe in Broadcasting
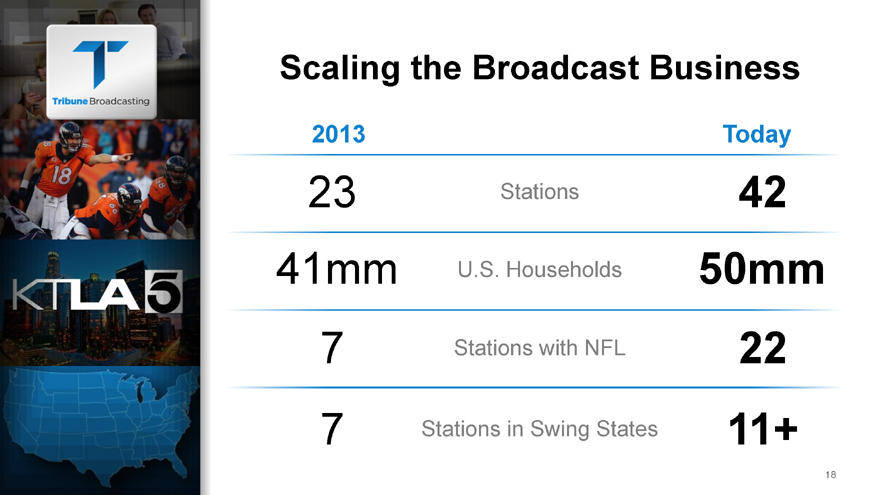
the Broadcast Business2013 Today23 Stations 4241mm U.S. Households 50mm7 Stations with NFL 227 Stations in Swing States 11+18
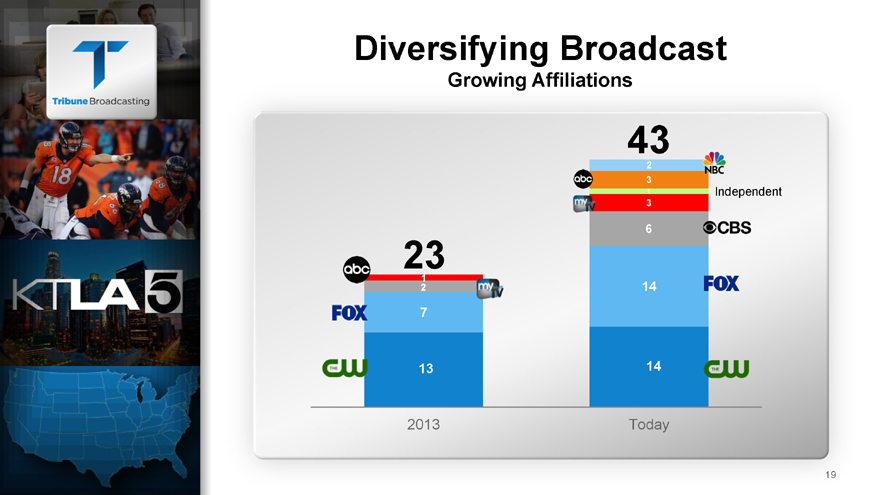
Broadcast 432 31 Independent362312 14 713 14 2013 Today
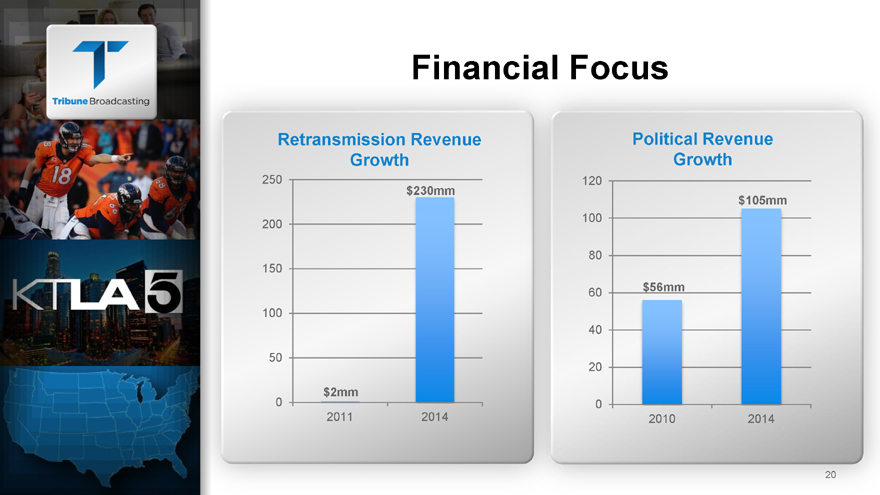
Revenue Growth250 $230mm200 150 100 50$2mm02011 2014Political Revenue Growth120 $105mm1008060 $56mm402002010 2014
AMERICA
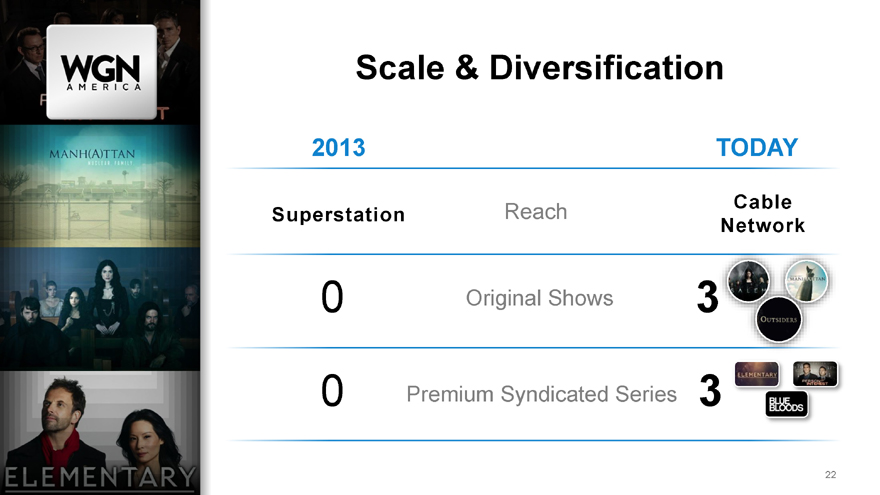
& Diversification2013 TODAYReach Cable SuperstationNetwork0 Original Shows 30 Premium Syndicated Series 322
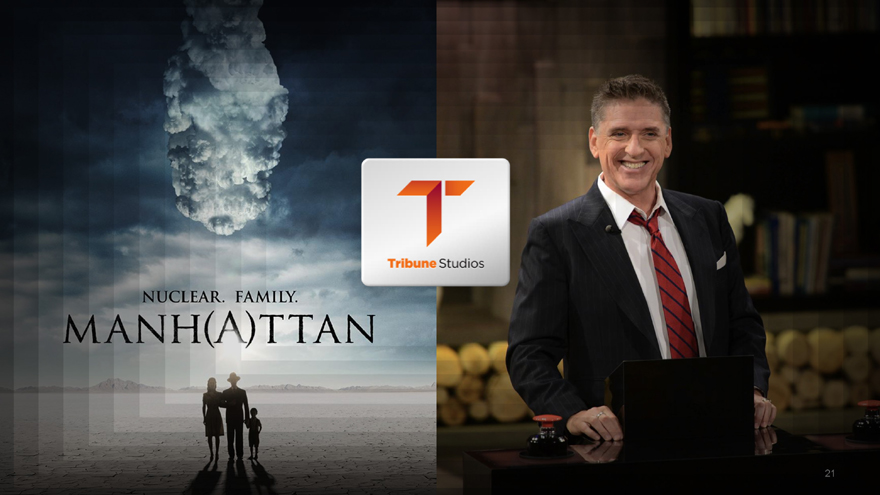
FAMILY MANH(A)TTAN 21
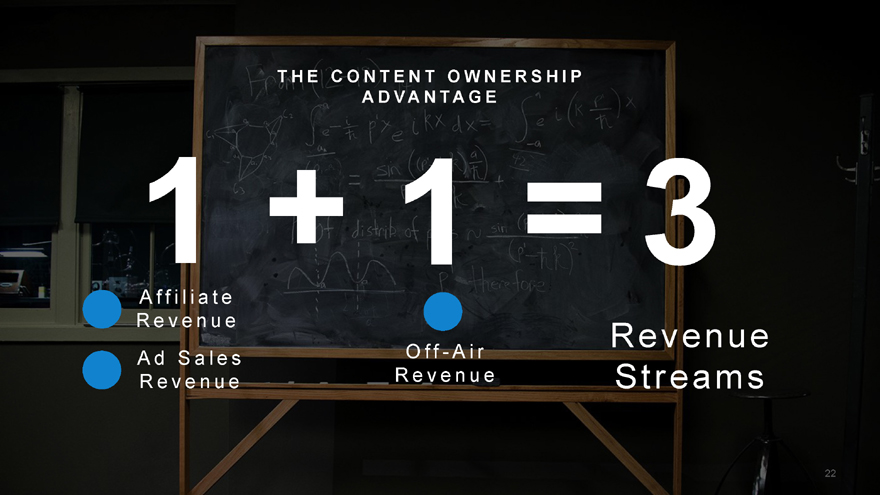
H E C O N T E N T O W N E R S H I P A D V A N T A G E1 + 1 = 3A f f i l i a t e R e v e n u e Revenue A d S a l e s O f f—A i r R e v e n u e R e v e n u e Streams22
Broadcasting Spectrum
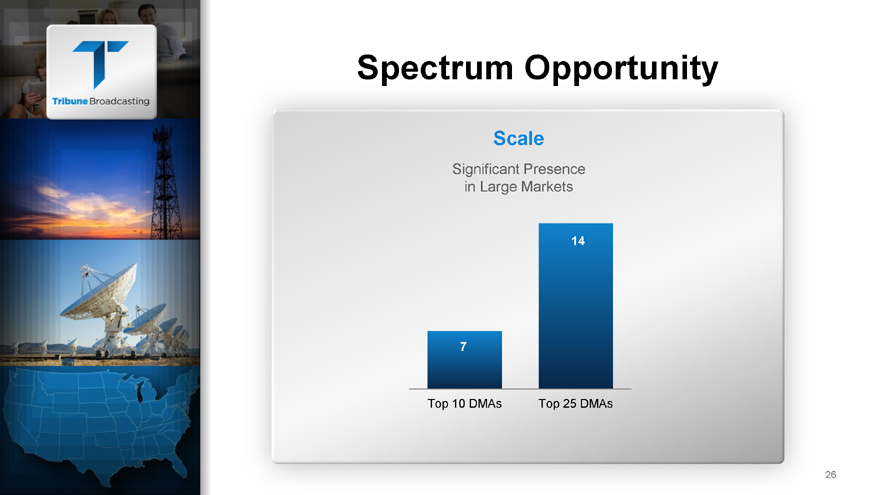
OpportunityScaleSignificant Presence in Large Markets147Top 10 DMAs Top 25 DMAs26
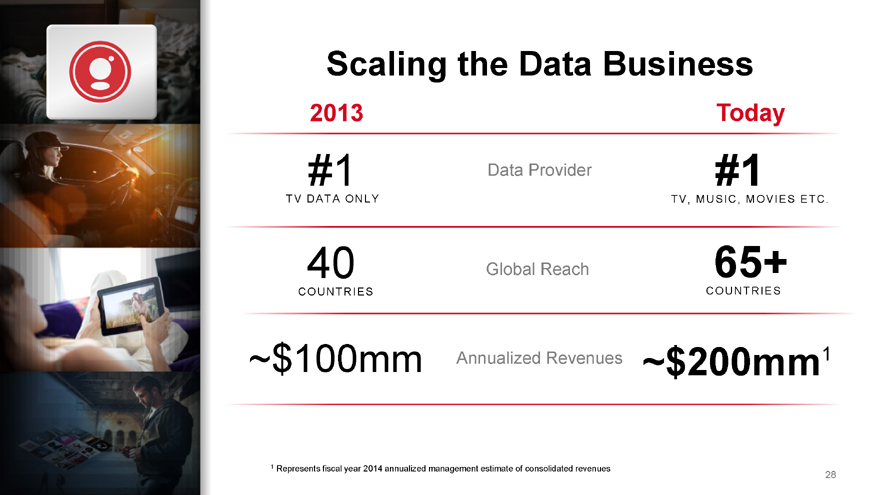
the Data Business2013 Today#1 Data Provider #1T V DA T A O NLY T V , M US I C, M O V I E S E T C.40 Global Reach 65+CO UNT RI E S CO UNT RI E S~$100mm Annualized Revenues ~$200mm11 Represents fiscal year 2014 annualized management estimate of consolidated revenues28
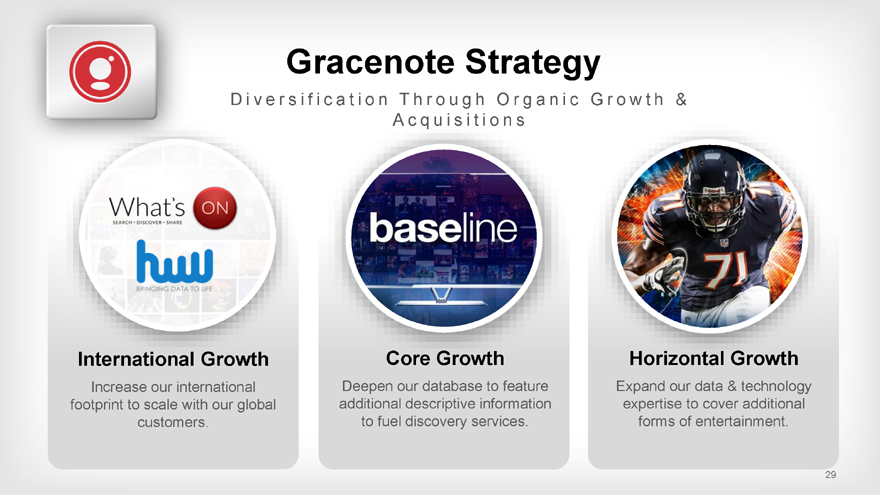
StrategyD i v e r s i f i c a t i o n T h r o u g h O r g a n i c G r o w t h & A c q u i s i t i o n sInternational Growth Increase our international footprint to scale with our global customers.Core Growth Deepen our database to feature additional descriptive information to fuel discovery services. Horizontal Growth Expand our data & technology expertise to cover additional forms of entertainment. 29
Real Eastate
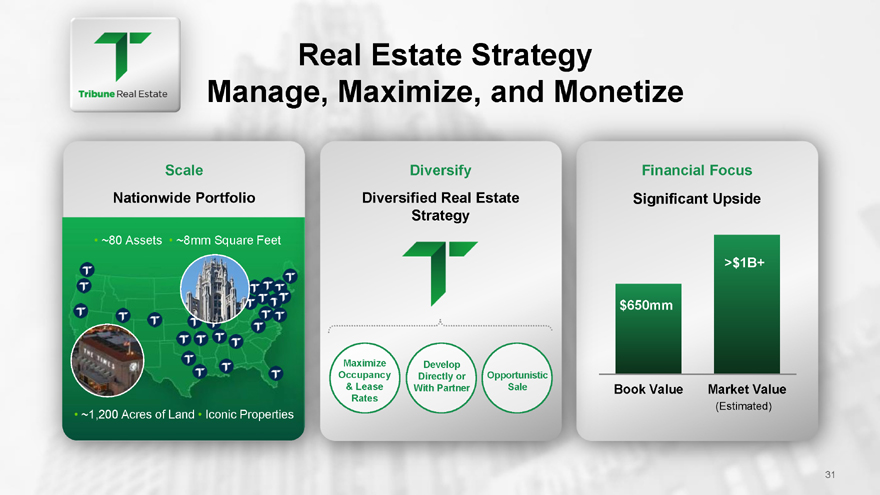
Estate Strategy Manage, Maximize, and MonetizeScaleNationwide Portfolio ~80 Assets ~8mm Square Feet ~1,200 Acres of Land Iconic PropertiDiversifyDiversified Real Estate Strategy Maximize Develop Occupancy Directly or Opportunistic & Lease With Partner Sale RatesFinancial Focus Significant Upside>$1B+ $650mmBook Value Market Value(Estimated)
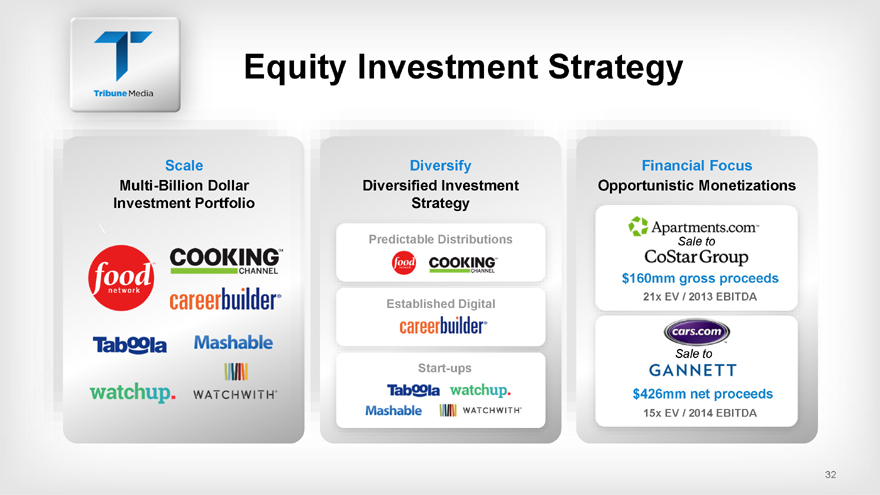
Investment StrategyScaleMulti-Billion Dollar Investment PortfolioDiversifyDiversified Investment StrategyFinancial Focus Opportunistic MonetizationsSale to$160mm gross proceeds21x EV / 2013 EBITDASale to$426mm net proceeds15x EV / 2014 EBITDA32
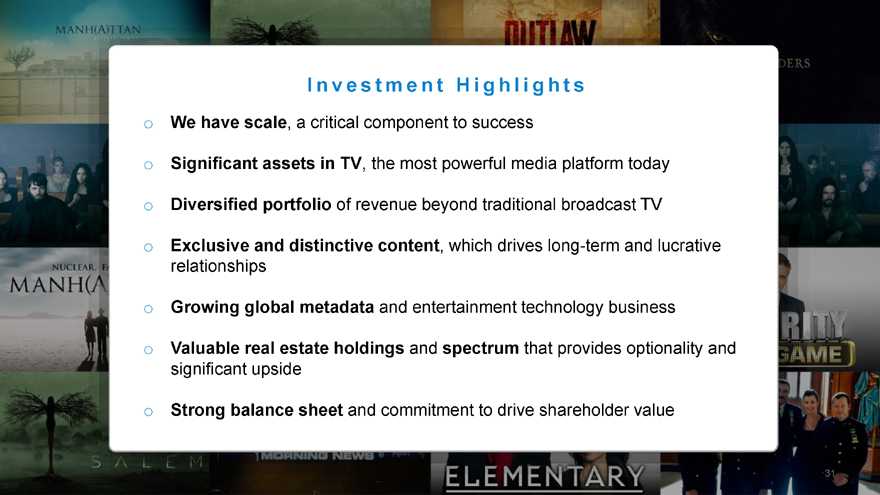
n v e s t m e n t H i g h l i g h t so We have scale, a critical component to success o Significant assets in TV, the most powerful media platform today o Diversified portfolio of revenue beyond traditional broadcast TVo Exclusive and distinctive content, which drives long-term and lucrative relationships o Growing global metadata and entertainment technology businesso Valuable real estate holdings and spectrum that provides optionality and significant upsideo Strong balance sheet and commitment to drive shareholder value
MediaInvestor DayPRESENTATIONDecember 11, 2014WGN America
Media Investor Day PRESENTATION December 11, 2014 WGN AMERICA
Broadcasting Investor Day PRESENTATION December 11, 2014Larry WertPresident, Broadcast MediaTribune Broadcasting2
|
|
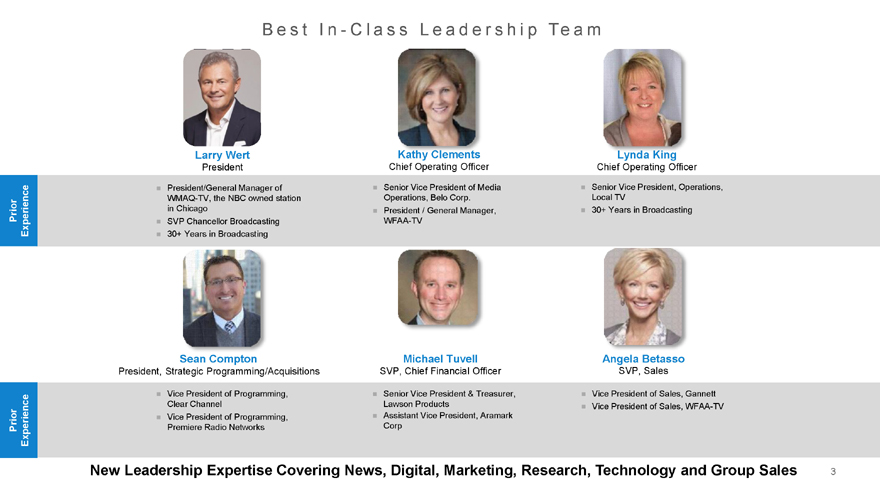
e s t I n—C l a s s L e a d e r s h i p Te a mLarry WertPresidentPresident/General Manager of WMAQ-TV, the NBC owned station in Chicago SVP Chancellor Broadcasting 30+ Years in BroadcastingChief Operating OfficerSenior Vice President of Media Operations, Belo Corp.President / General Manager, WFAA-TVLynda KingChief Operating OfficerSenior Vice President, Operations, Local TV30+ Years in BroadcastingSean ComptonPresident, Strategic Programming/AcquisitionsVice President of Programming, Clear Channel Vice President of Programming, Premiere Radio NetworksMichael TuvellSVP, Chief Financial OfficerSenior Vice President & Treasurer, Lawson Products Assistant Vice President, Aramark CorpAngela BetassoSVP, SalesVice President of Sales, Gannett Vice President of Sales, WFAA-TVNew Leadership Expertise Covering News, Digital, Marketing, Research, Technology and Group Sales 3Prior Prior Experience Experience
|
|
Media Our Core BeliefsWe Believe in We Control Our We Believe in Local Broadcasting Destiny4
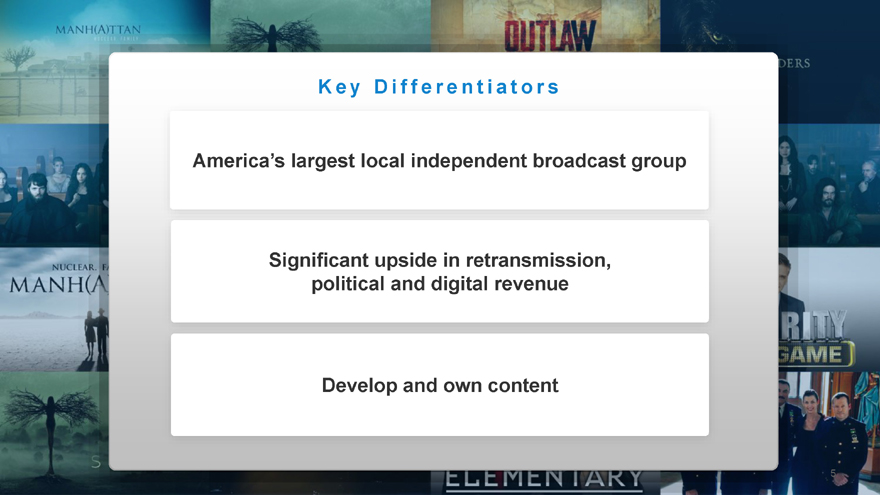
e y D i f f e r e n t i a t o r sAmerica s largest local independent broadcast groupSignificant upside in retransmission, political and digital revenue Develop and own content
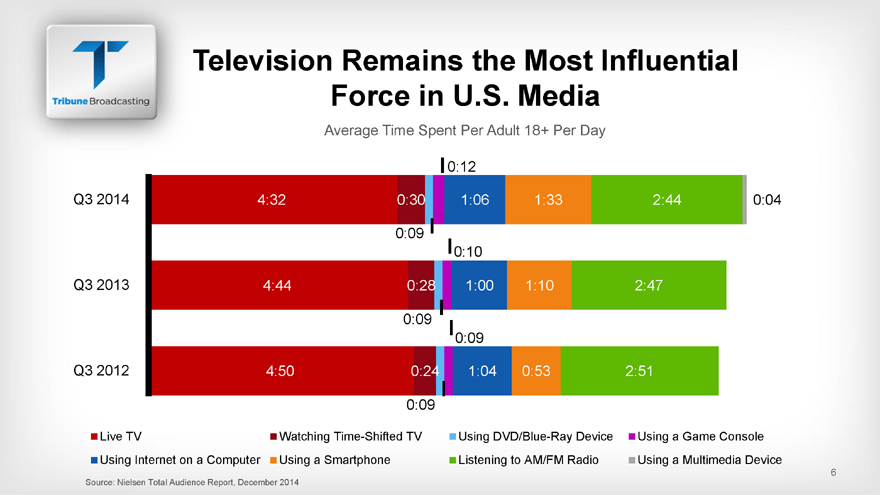
Remains the Most Influential Force in U.S. MediaAverage Time Spent Per Adult 18+ Per Day0:12Q3 2014 4:32 0:30 1:06 1:33 2:44 0:040:090:10Q3 2013 4:44 0:28 1:00 1:10 2:470:090:09Q3 2012 4:50 0:24 1:04 0:53 2:510:09Live TV Watching Time-Shifted TV Using DVD/Blue-Ray Device Using a Game Console Using Internet on a Computer Using a Smartphone Listening to AM/FM Radio Using a Multimedia Device6Source: Nielsen Total Audience Report, December 2014
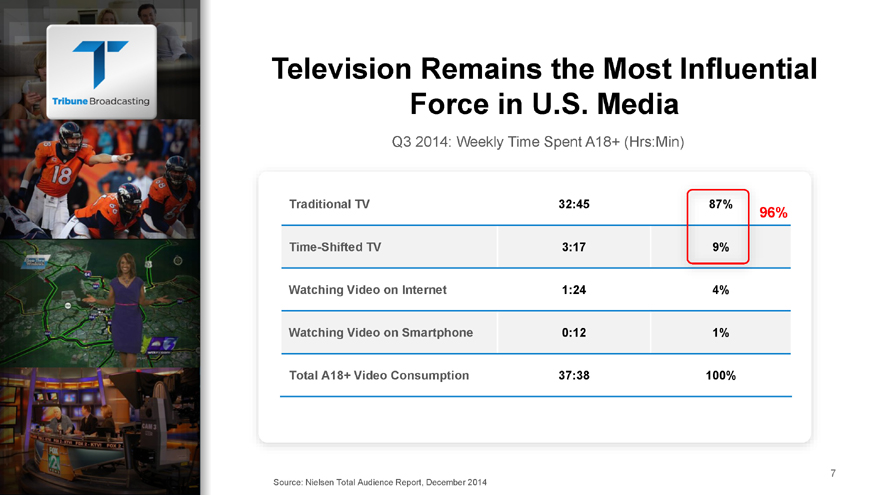
Remains the Most Influential Force in U.S. MediaQ3 2014: Weekly Time Spent A18+ (Hrs:Min) 87% 9%Traditional TV 32:4596%Time-Shifted TV 3:17Watching Video on Internet 1:24 4% Watching Video on Smartphone 0:12 1% Total A18+ Video Consumption 37:38 100%7Source: Nielsen Total Audience Report, December 2014
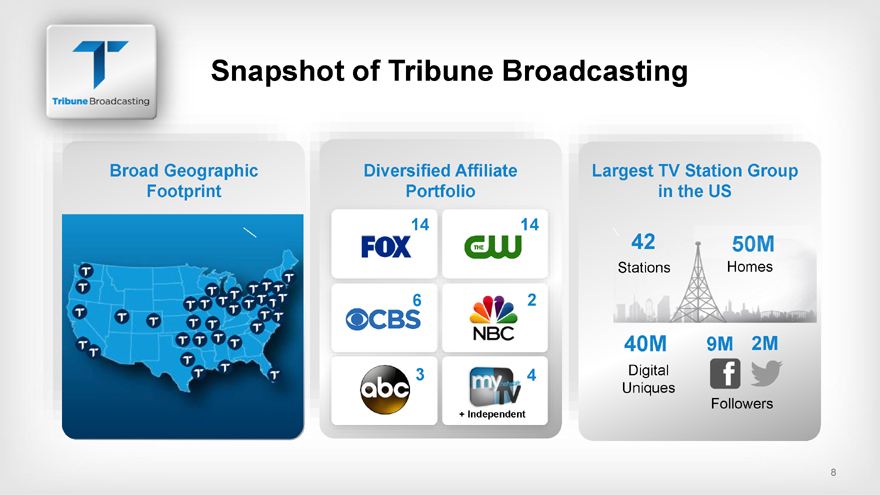
of Tribune BroadcastingBroad Geographic FootprintDiversified Affiliate Portfolio14 146 23 4+ IndependentLargest TV Station Group in the USStations40M 9M 2MDigital UniquesFollowers8
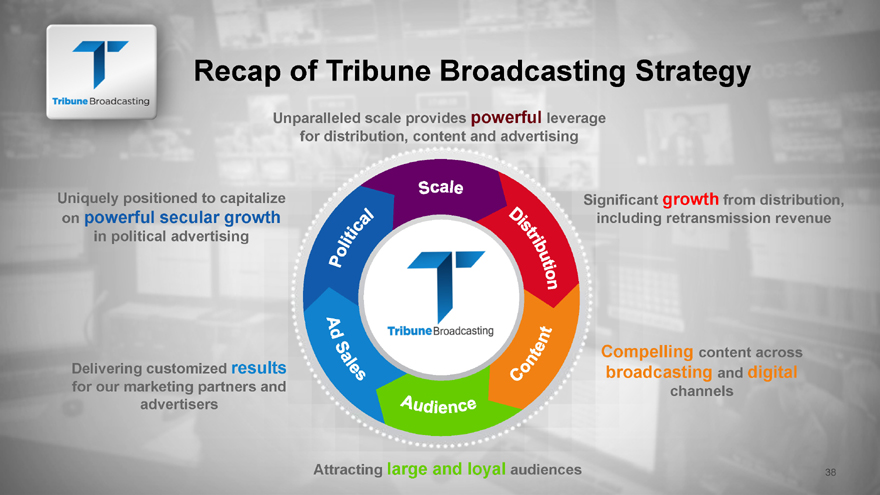
of Tribune Broadcasting StrategyUnparalleled scale provides powerful leverage for distribution, content and advertisingUniquely positioned to capitalize Significant growth from distribution, on powerful secular growth including retransmission revenue in political advertisingCompelling content across Delivering customized results broadcasting and digital for our marketing partners and channels advertisersAttracting large and loyal audiences
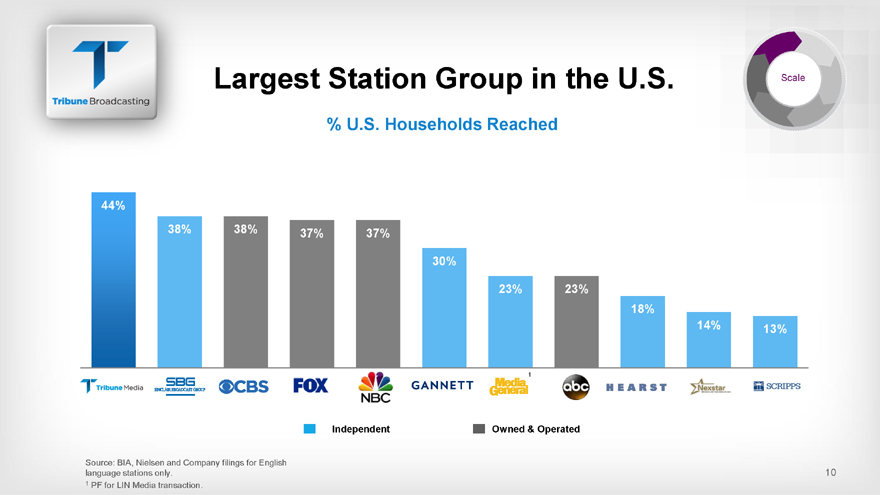
Station Group in the U.S.% U.S. Households Reached44%38% 38% 37% 37%30%23% 23%18%14% 13%1Independent Owned & OperatedSource: BIA, Nielsen and Company filings for English language stations only. 101 PF for LIN Media transaction.
|
|
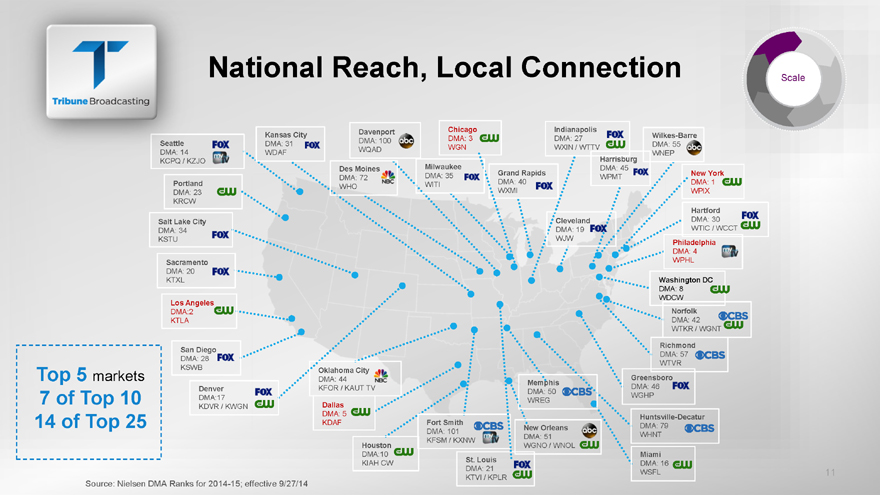
Reach, Local Connection ScaleDavenport Chicago Indianapolis Kansas CityDMA: 100 DMA: 3 DMA: 27 DMA: 31 WQAD WGN WXIN / WTTVWDAF Harrisburg ZJO Milwaukee Des Moines DMA: 45 DMA: 35 Grand RapidsDMA: 72 WPMT Portland WITI DMA: 40 WHODMA: 23 WXMI KRCWSalt Lake City ClevelandDMA: 34 DMA: 19 WTIC / WCCT KSTU WJWPhiladelphiaDMA: 4Sacramento WPHL DMA: 20 KTXL Washington DCDMA: 8 WDCWLos AngelesDMA:2 NorfolkKTLA DMA: 42 WTKR / WGNTRichmond San DiegoDMA: 57 DMA: 28 WTVR KSWB Oklahoma City Top 5 markets DMA: 44 Greensboro Memphis Denver KFOR / KAUT TV DMA: 46 DMA: 50 DMA:17 WGHP7 of Top 10 WREGKDVR / KWGN Dallas DMA: 5Huntsville-Decatur14 of Top 25 KDAF Fort SmithNew Orleans DMA: 79 DMA: 101 DMA: 51 WHNT KFSM / KXNWHouston WGNO / WNOLDMA:10 Miami St. LouisKIAH CW DMA: 16 DMA: 21WSFL 11 KTVI / KPLRSource: Nielsen DMA Ranks for 2014-15; effective 9/27/14
is#1 or #2In 22 Markets12
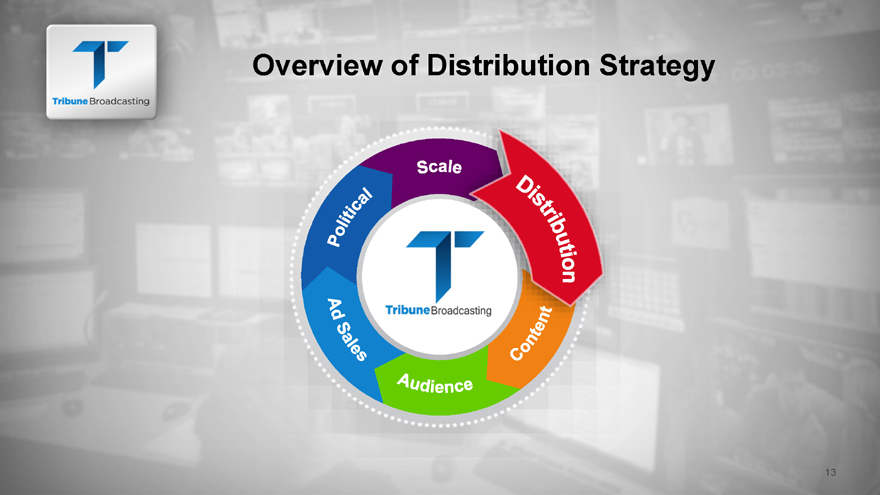
of Distribution Strategy 13
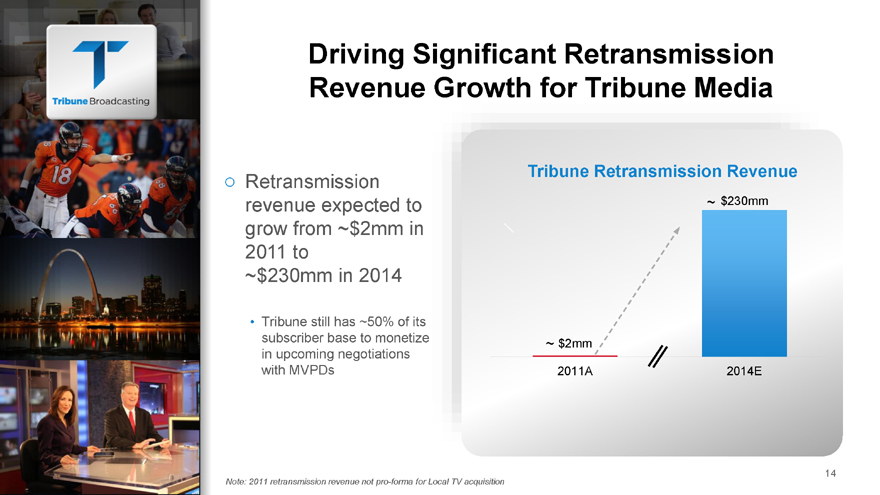
Significant Retransmission Revenue Growth for Tribune MediaTribune Retransmission Revenue Retransmission revenue expected to ~ $230mm grow from ~$2mm in 2011 to ~$230mm in 2014 Tribune still has ~50% of its subscriber base to monetize ~ $2mm in upcoming negotiations with MVPDs 2011A 2014ENote: 2011 retransmission revenue not pro-forma for Local TV acquisition 14
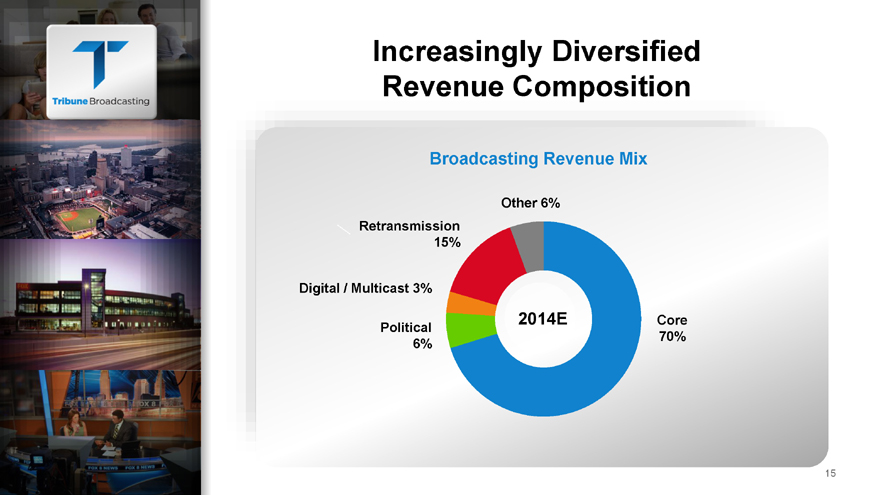
Diversified Revenue CompositionBroadcasting Revenue MixOther 6% Retransmission 15%Digital / Multicast 3%2014E Core Political 70% 6%15
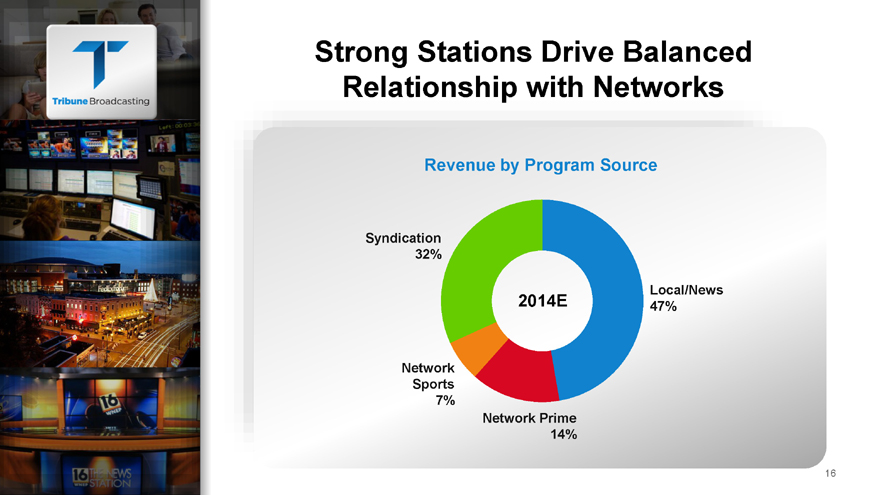
Stations Drive Balanced Relationship with NetworksRevenue by Program SourceSyndication 32%Local/News2014E 47%Network Sports 7%Network Prime 14%16
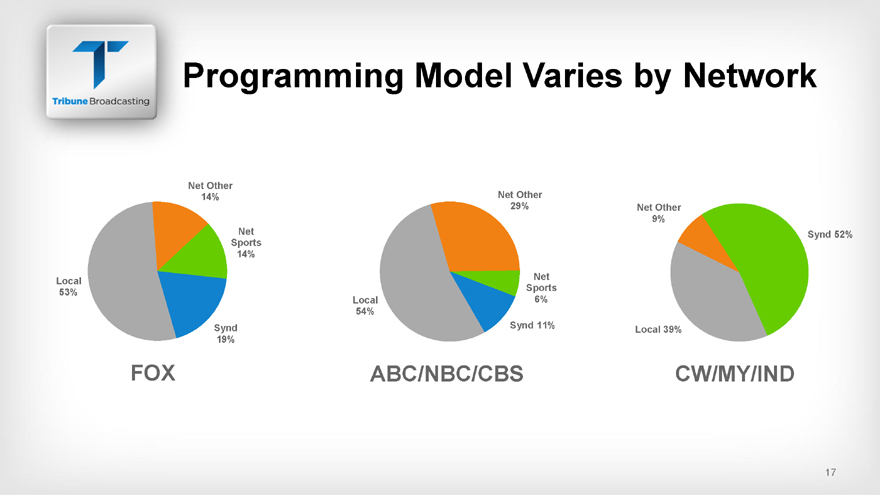
Model Varies by NetworkNet Other14% Net Other29% Net Other 9%Net Synd 52% Sports 14%Net Local Sports 53% Local 6% 54%Synd Synd 11% Local 39% 19%FOX ABC/NBC/CBS CW/MY/IND17
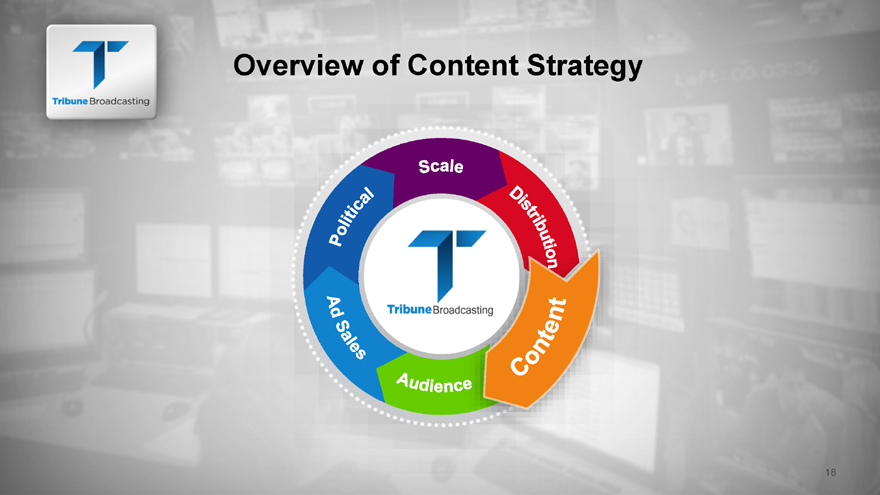
of Content Strategy 18
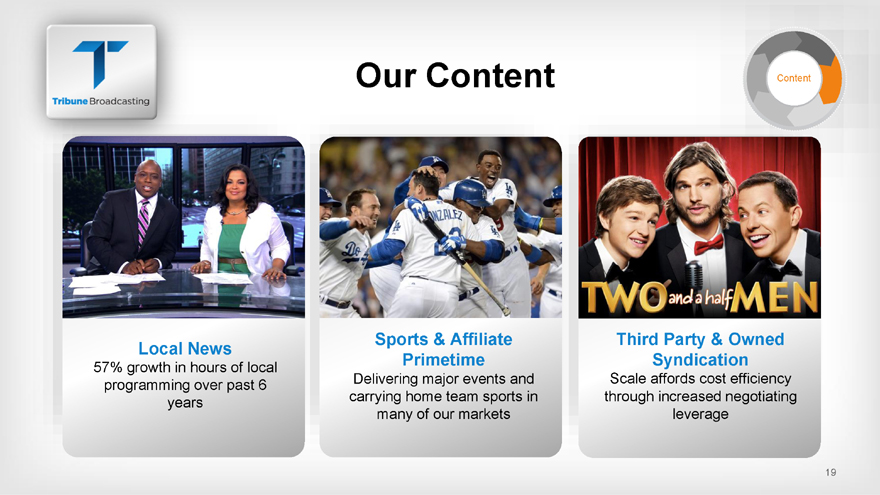
ContentLocal News57% growth in hours of local programming over past 6 yearsSports & Affiliate Primetime Delivering major events and carrying home team sports in many of our marketsThird Party & Owned Syndication Scale affords cost efficiency through increased negotiating leverage19
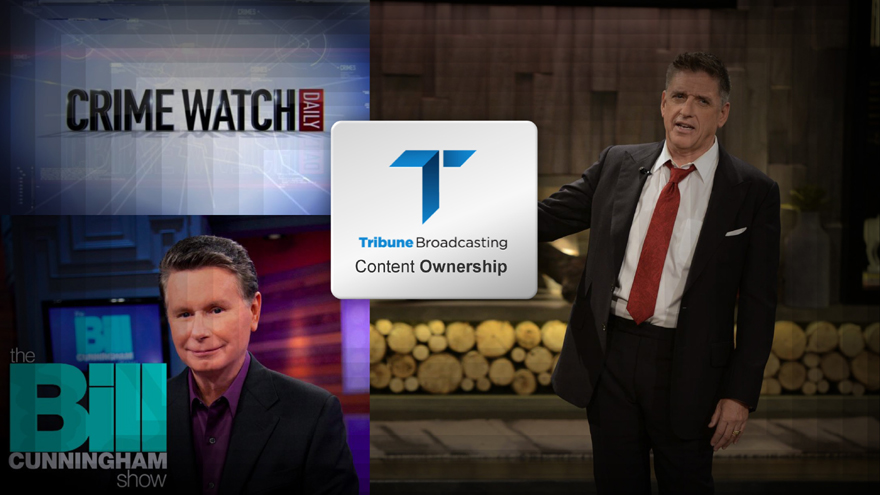
Broadcasting Content Ownership
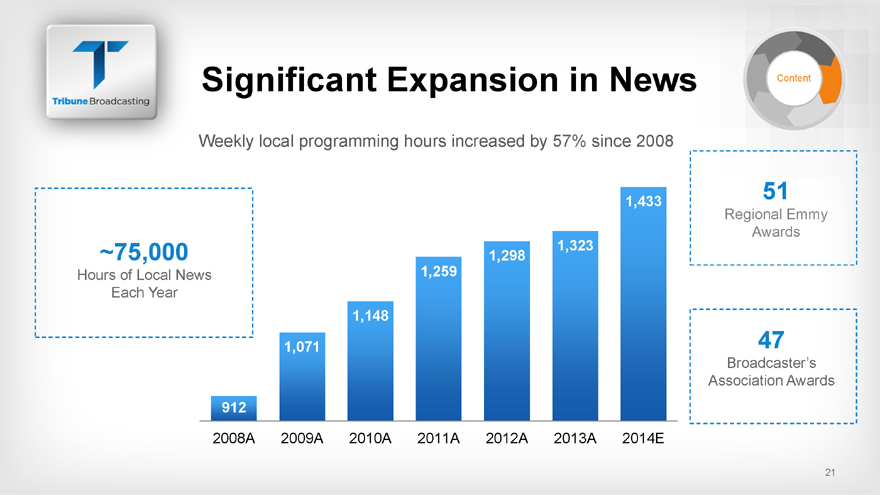
Expansion in NewsWeekly local programming hours increased by 57% since 20 ~75,000Hours of Local News Each Year51 Regional Emmy Awards 47Broadcaster sAssociation Awards1,4331,323 1,298 1,259 1,148 1,071 912 2008A 2009A 2010A 2011A 2012A 2013A 2014E 21
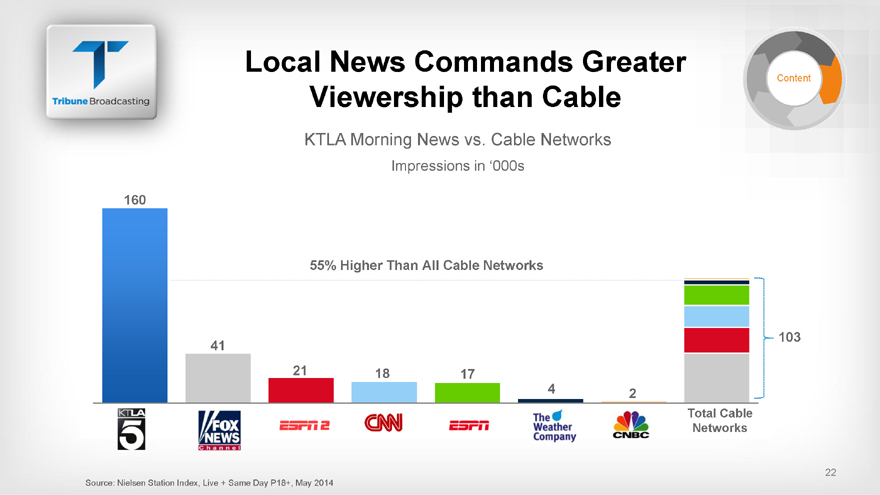
News Commands Greater Viewership than CableKTLA Morning News vs. Cable NetworksImpressions in 000s16055% Higher Than All Cable Networks 103 41 21 18 17 4 2 Total Cable Networks22Source: Nielsen Station Index, Live + Same Day P18+, May 2014
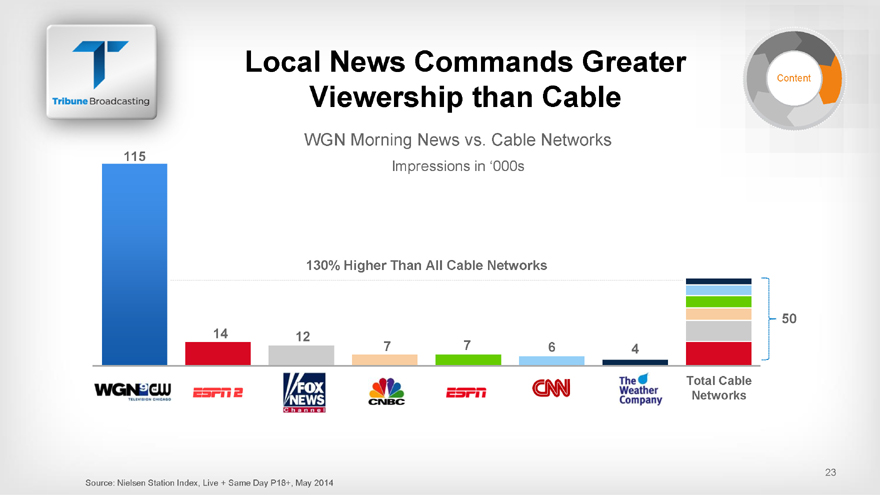
News Commands Greater Viewership than CableWGN Morning News vs. Cable NetworksImpressions in 000s130% Higher Than All Cable Networks 5014 12 7 7 6 4 Total Cable Networks23Source: Nielsen Station Index, Live + Same Day P18+, May 2014
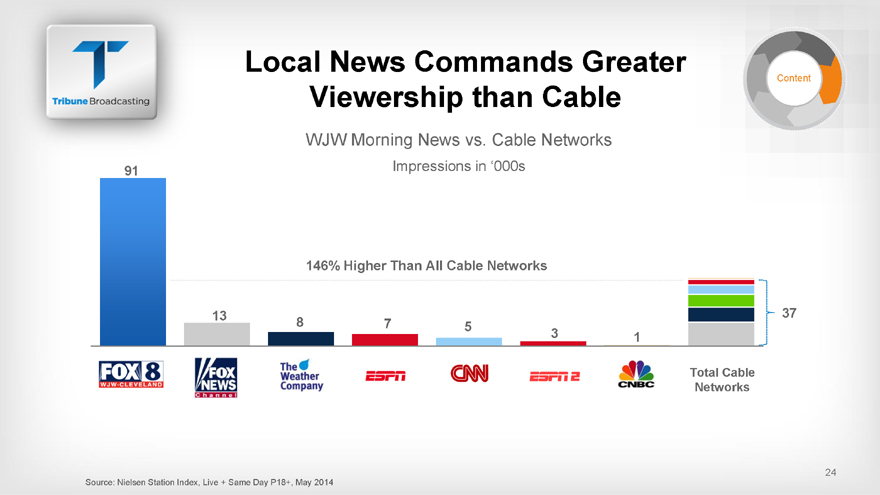
News Commands Greater Viewership than CableWJW Morning News vs. Cable NetworksImpressions in 000s91 146% Higher Than All Cable Networks 13 378 7 5 3 1 Total Cable Networks
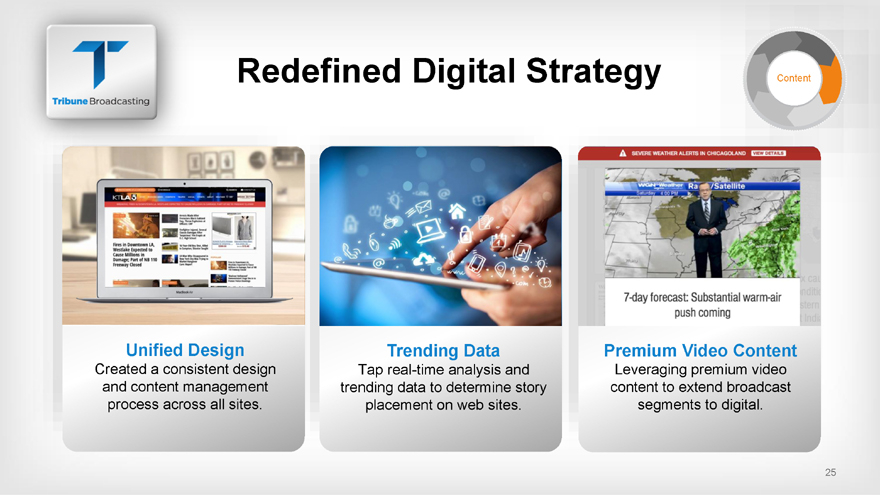
Digital StrategyUnified DesignCreated a consistent design and content management process across all sites.Trending DataTap real-time analysis and trending data to determine story placement on web sites.Premium Video Content Leveraging premium video content to extend broadcast segments to digital.25
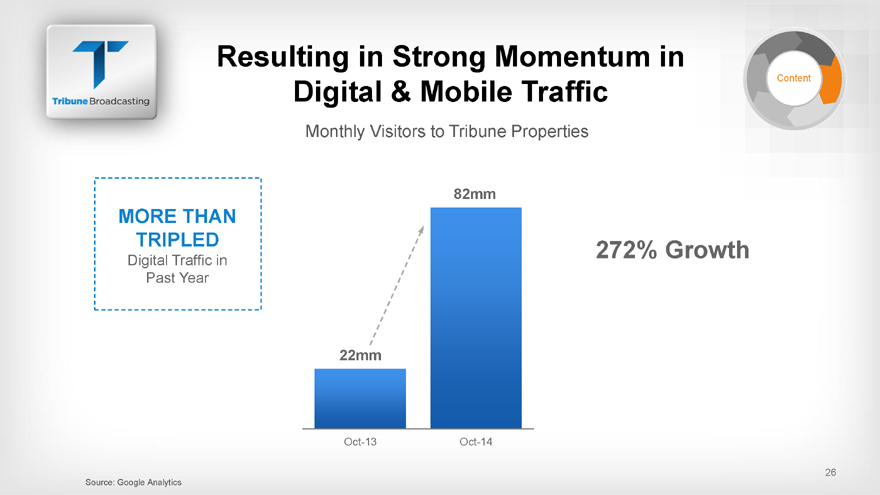
in Strong Momentum Digital & Mobile TrafficMonthly Visitors to Tribune Properties 82mmMORE THAN TRIPLED 272% GrowthDigital Traffic in Past Year22mmOct-13 Oct-1426Source: Google Analytics
Audience
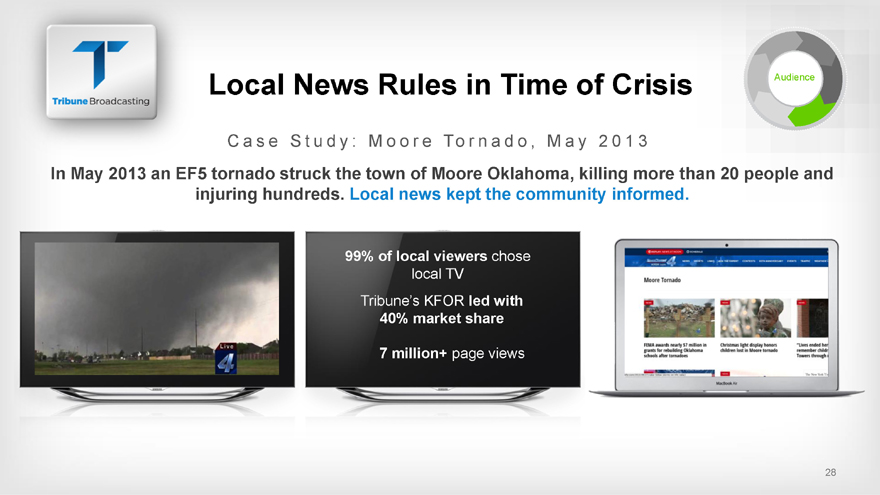
News Rules in Time of AudienceC a s e S t u d y : M o o r e To r n a d o , M a y 2 0 1 3In May 2013 an EF5 tornado struck the town of Moore Oklahoma, killing injuring hundreds. Local news kept the community 99% of local viewers chose local TVTribune s KFOR led with 40% market share7 million+ page views28
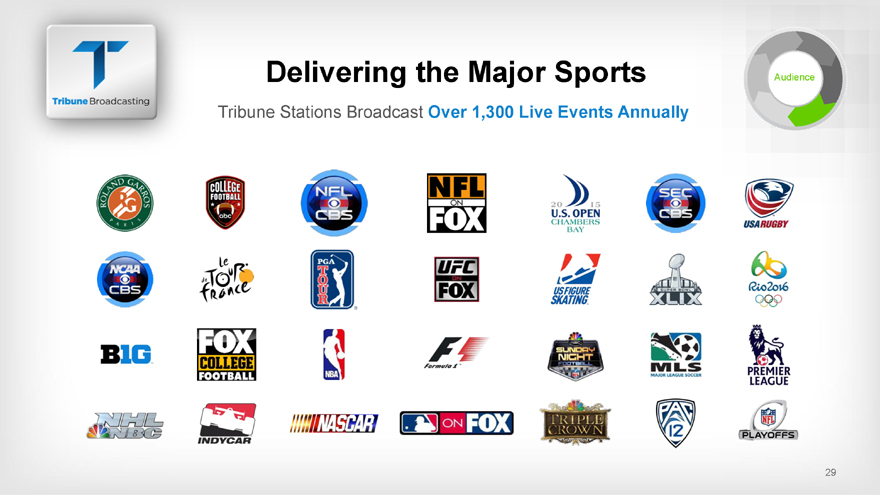
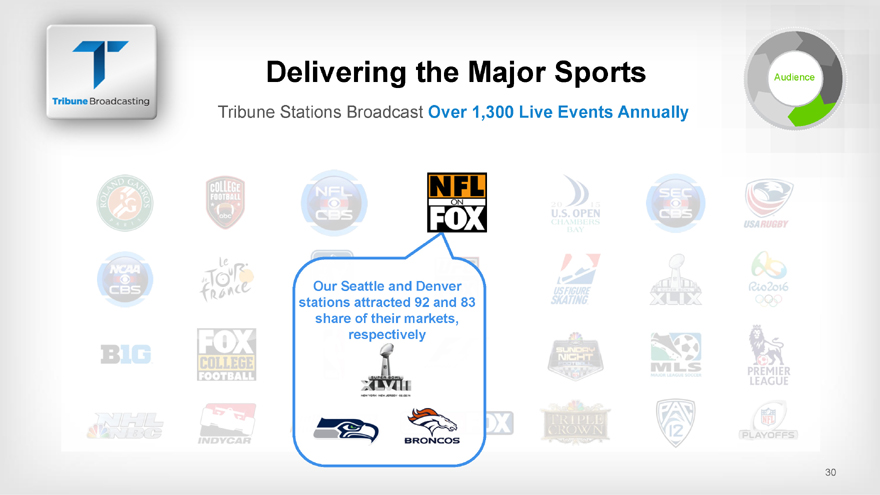
the Major Sports AudienceTribune Stations Broadcast Over 1,300 Live Events Ann29
the Major Sports AudienceTribune Stations Broadcast Over 1,300 Live Events AnnOur Seattle and Denver stations attracted 92 and 83 share of their markets, respectively30
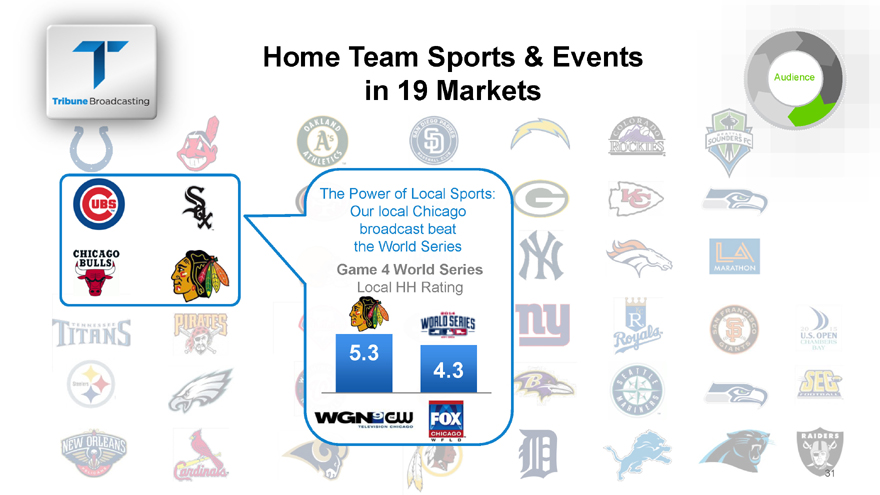
Team Sports & Events in 19 Markets AudienceThe Power of Local Sports: Our local Chicago broadcast beat the World SeriesGame 4 World SeriesLocal HH Rating5.34.331
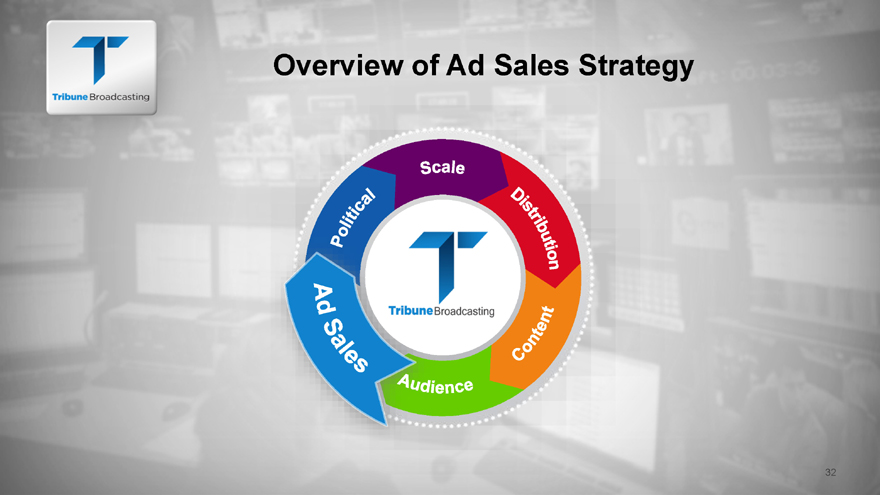
of Ad Sales Strategy
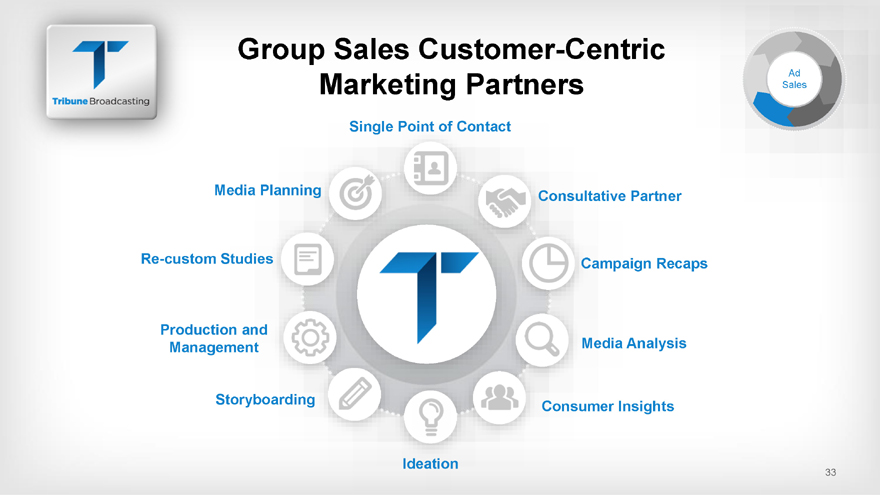
Sales Customer-CentricAdMarketing Partners SalesSingle Point of ContactMedia Planning Consultative Re-custom Studies Campaign RecapsProduction and Management Media AnalysisStoryboardingConsumer InsightsIdeation33
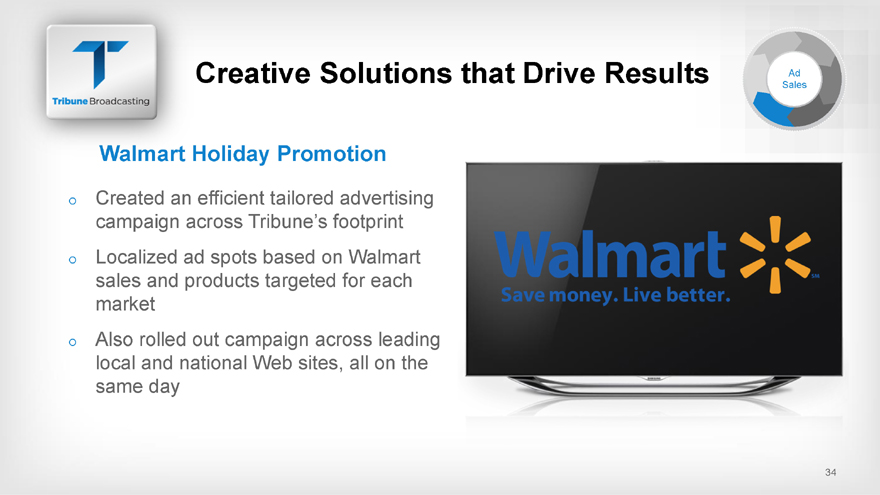
Solutions that Drive AdSalesWalmart Holiday Promotion Created an efficient tailored advertising campaign across Tribune s footprintLocalized ad spots based on Walmart sales and products targeted for each market Also rolled out campaign across leading local and national Web sites, all on the same day 34
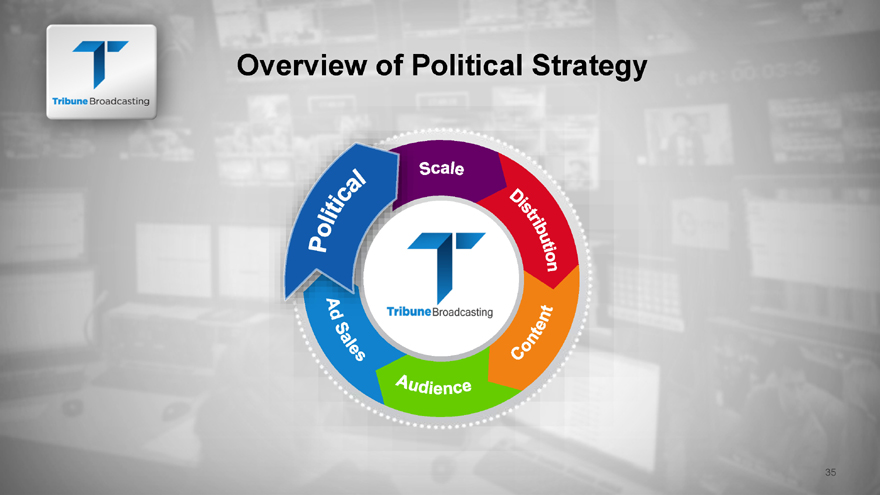
of Political Strategy 35
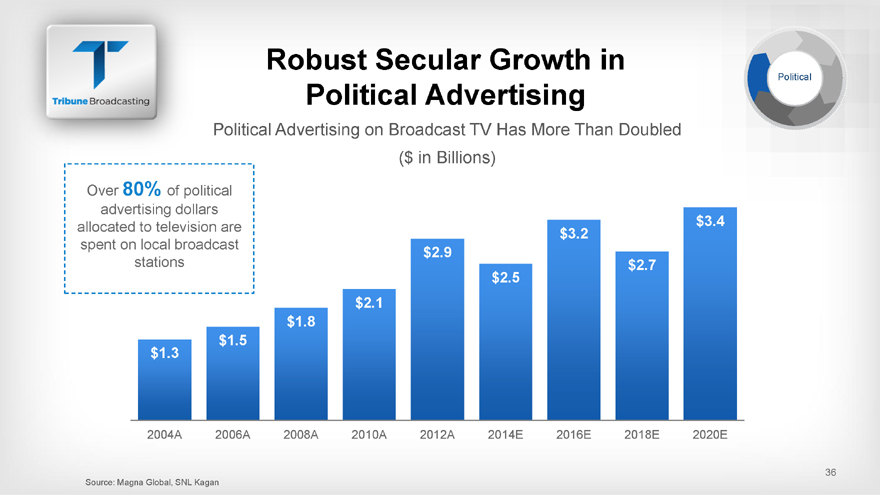
Secular Growth in PoliticalPolitical AdvertisingPolitical Advertising on Broadcast TV Has More Than Double($ in Billions)Over 80% of political advertising dollars allocated to television are $3.2 spent on local broadcast $2.9 stations $2.7 $2.5 $2.1 $1.8 $1.3 $1.5 2004A 2006A 2008A 2010A 2012A 2014E 2016E 2018E 2020E36Source: Magna Global, SNL Kagan
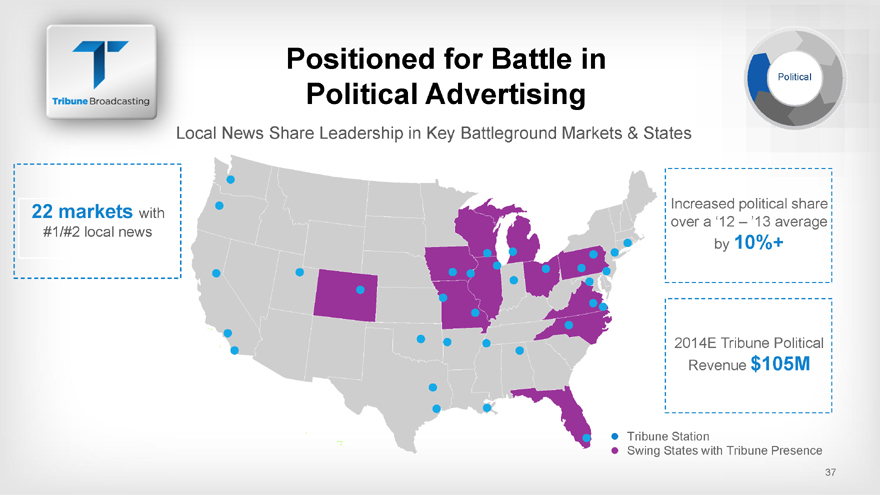
for Battle in PoliticalPolitical Advertisingcal News Share Leadership in Key Battleground Markets & 22 markets with #1/#2 local newsby 10% 10%+2014E Tribune Political Revenue $105MTribune StationSwing States with Tribune Presence37
of Tribune Broadcasting StrategyUnparalleled scale provides powerful leverage for distribution, content and advertisingUniquely positioned to capitalize Significant growth from distribution, on powerful secular growth including retransmission revenue in political advertisingCompelling content across Delivering customized results broadcasting and digital for our marketing partners and channels advertisersAttracting large and loyal audiences
Media Investor Day PRESENTATION December 11, 2014 WGN AMERICA
Media Investor Day PRESENTATION December 11, 2014 WGN AMERICA
Studios Investor Day PRESENTATION December 11, 2014 WGN AMERICA Matt Cherniss President WGN America and T ribune Studios WGN America and Tribune Studios2
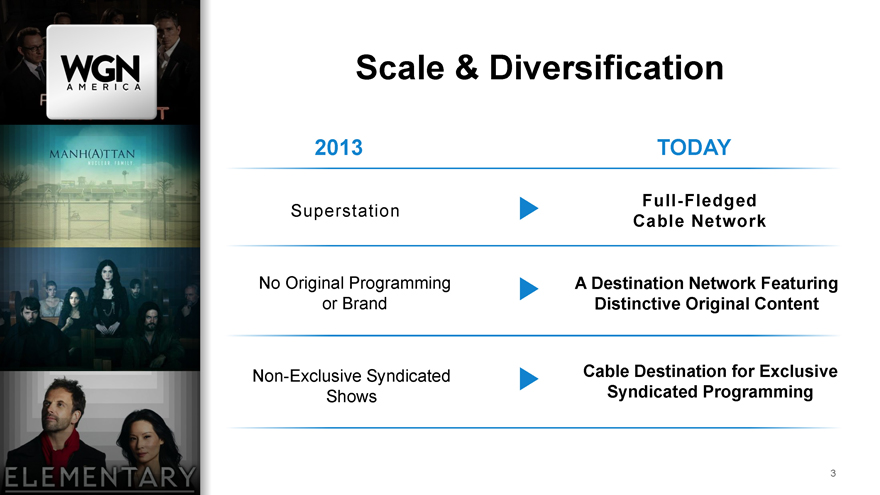
Scale & Diversification2013 TODAY ull-Fledged Superstation Cable Net work No Original Programming A Destination Network Featuring or Brand Distinctive Original Content Non-Exclusive Syndicated Cable Destination for Exclusive Shows Syndicated Programming3
|
|
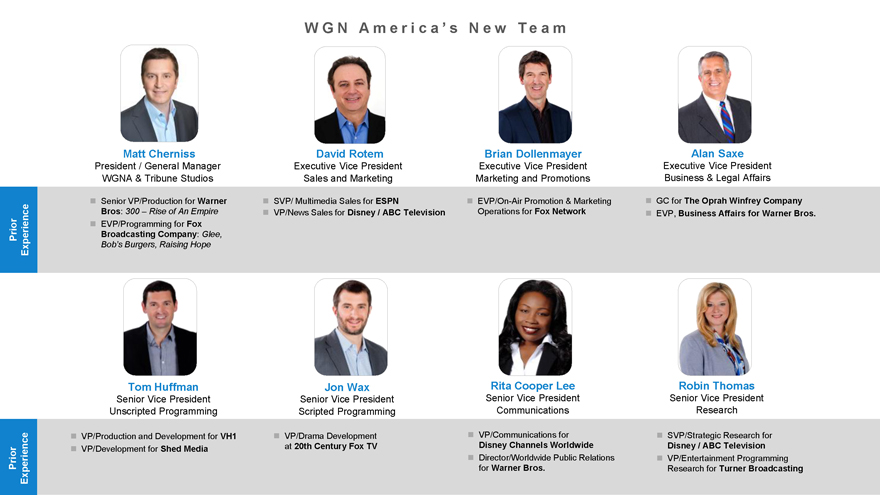
G N A m e r i c a s N e w T e a m Matt Cherniss President / General Manager WGNA & Tribune Studios Senior VP/Production for Warner Bros: 300 Rise of An Empire EVP/Programming for Fox Broadcasting Company: Glee, Bob s Burgers, Raising Hope David Rotem Brian Dollen mayer Alan Saxe Executive Vice President Executive Vice President Executive Vice President Sales and Marketing Marketing and Promotions Business & Legal Affairs SVP/ Multimedia Sales for ESPN EVP/On-Air Promotion & Marketing GC for The Oprah Winfrey Company VP/News Sales for Disney / ABC Television Operations for Fox Network EVP, Business Affairs for Warner Bros. Tom Huffman Jon Wax Rita Cooper Lee Robin Thomas Senior Vice President Senior Vice President Senior Vice President Senior Vice President Unscripted Programming Scripted Programming Communications Research VP/Production and Development for VH1 VP/Drama Development VP/Communications for SVP/Strategic Research for at 20th Century Fox TV Disney Channels Worldwide Disney / ABC Television VP/Development for Shed Media Director/Worldwide Public Relations VP/Entertainment Programming for Warner Bros. Research for Turner Broadcasting Prior Prior Experience Experience
|
|
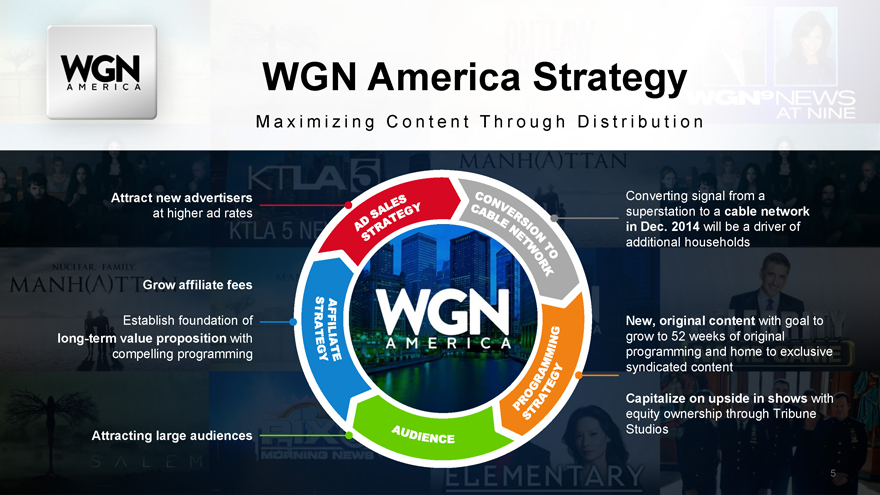
America Strategy M a x i m i z i n g C o n t e n t T h r o u g h D i s t r i b u t i o n Attract new advertisers Converting signal from a at higher ad rates superstation to a cable network in Dec. 2014 will be a driver of additional house holds Grow affiliate fees Establish foundation of New, original content with goal to long-term value proposition with grow to 52 weeks of original compelling programming programming and home to exclusive syndicated content Capitalize on upside in shows with equity ownership through Tribune StudiosAttracting large audiences5
|
|
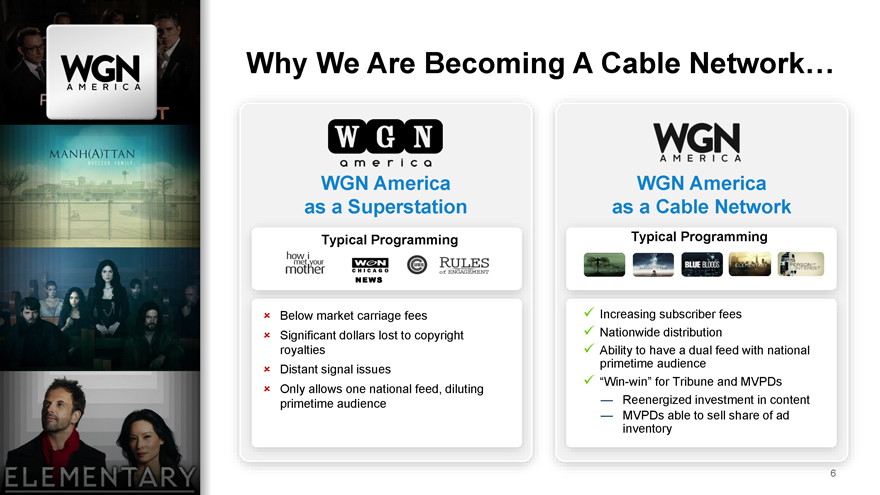
Why We Are Becoming A Cable Network WGN America WGN America as a Superstation as a Cable Network Typical Programming Typical Programming NEWS Below market carriage fees Increasing subscriber fees Significant dollars lost to copyright Nationwide distribution royalties Ability to have a dual feed with national primetime audience Distant signal issues Win-win for Tribune and MVPDs Only allows one national feed, diluting Reenergized investment in content primetime audience MVPDs able to sell share of ad inventory6
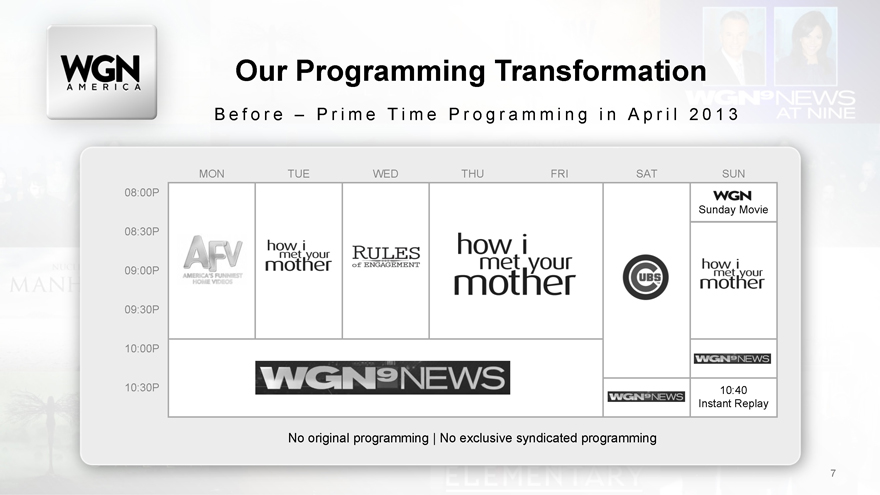
Programming Trans formationB e f o r e P r i m e T i m e P r o g r a m m i n g i n A p r i l 2 0 1 3MON TUE WED THU FRI SAT SUN 08:00PSunday Movie08:30P09:00P 09:30P 10:00P10:30P 10:40 Instant ReplayNo original programming | No exclusive syndicated programming7
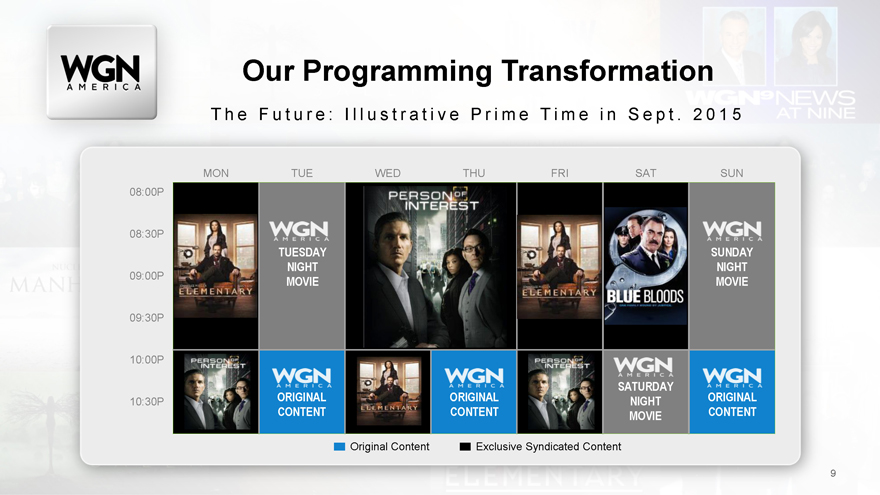
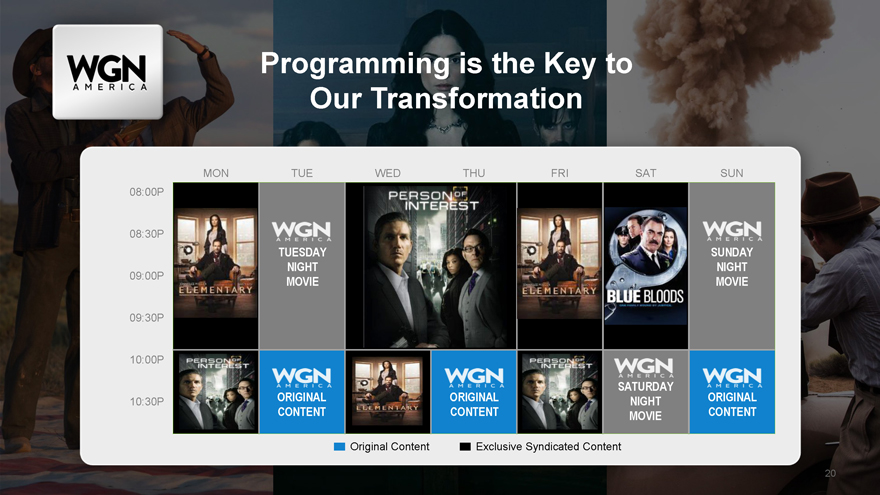
Programming TransformationT h e F u t u r e : I l l u s t r a t i v e P r i m e T i m e i n S e p t . 2 0 1 5MON TUE WED THU FRI SAT SUN 08:00P08:30PTUESDAY SUNDAY NIGHT NIGHT 09:00P MOVIE MOVIE09:30P10:00PSATURDAY10:30P ORIGINAL ORIGINAL NIGHT ORIGINAL CONTENT CONTENT MOVIE CONTENTOriginal Content Exclusive Syndicated Content9
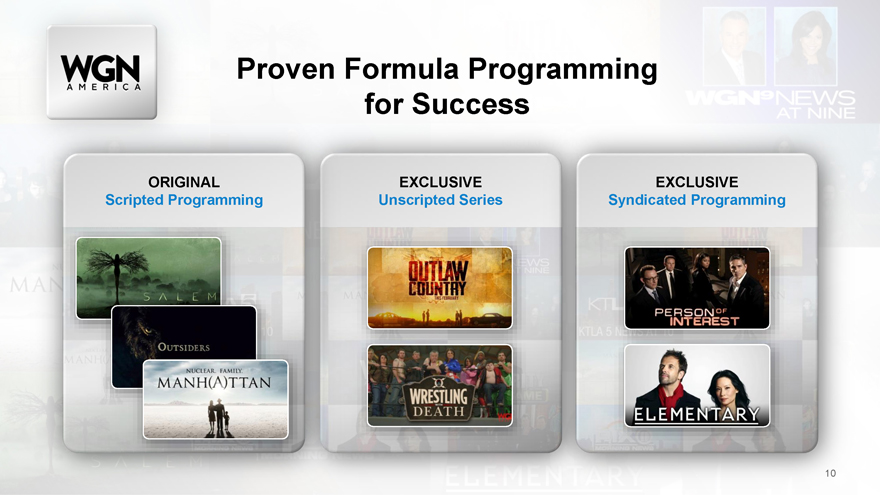
Formula Programming for SuccessORIGINAL EXCLUSIVE EXCLUSIVE Scripted Programming Unscripted Series Syndicated Programming10
We Measure Success11
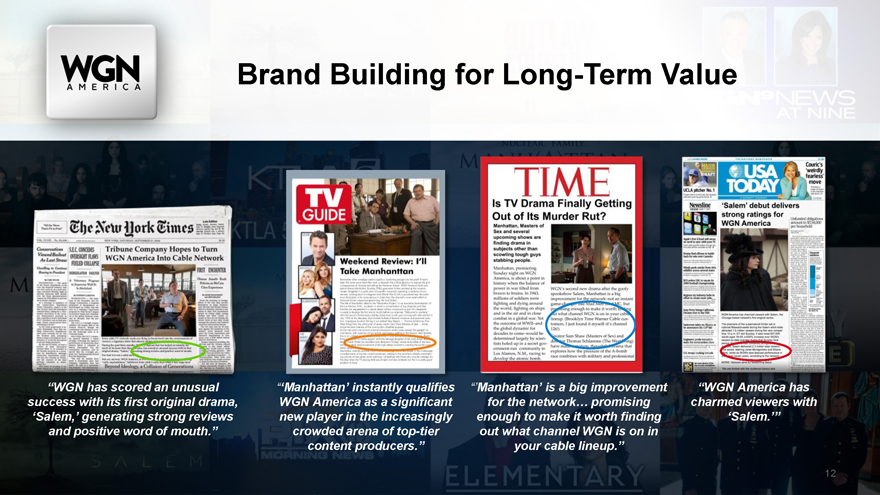
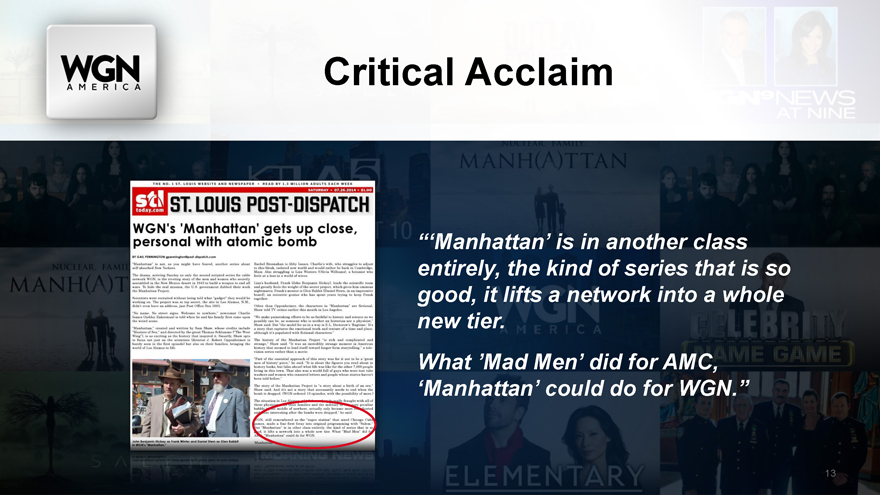
Building for Long-Term Value WGN has scored an unusual Manhattan instantly qualifies Manhattan is a big improvement WGN America has success with its first original drama, WGN America as a significant for the network promising charmed viewers with Salem, generating strong reviews new player in the increasingly enough to make it worth finding Salem. and positive word of mouth. crowded arena of top-tier out what channel WGN is on in content producers. your cable lineup. 12
Acclaim Manhattan is in another class entirely, the kind of series that is so good, it lifts a network into a whole new tier. What Mad Men did for AMC, Manhattan could do for WGN. 13
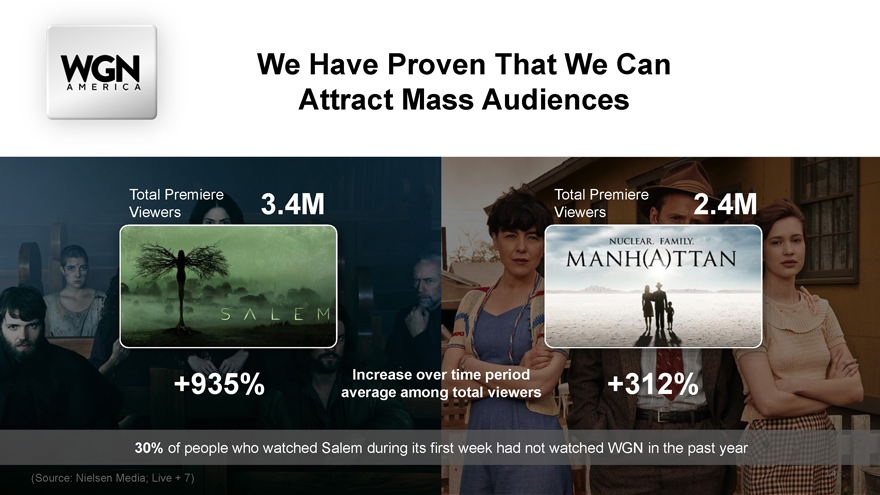
Have Proven That We Can Attract Mass AudiencesTotal Premiere 3.4M Total Premiere 2.4M Viewers Viewers+935% Increase over time period +312% average among total viewers 30% of people who watched Salem during its first week had not watched WGN in the past year(Source: Nielsen Media; Live + 7) 14
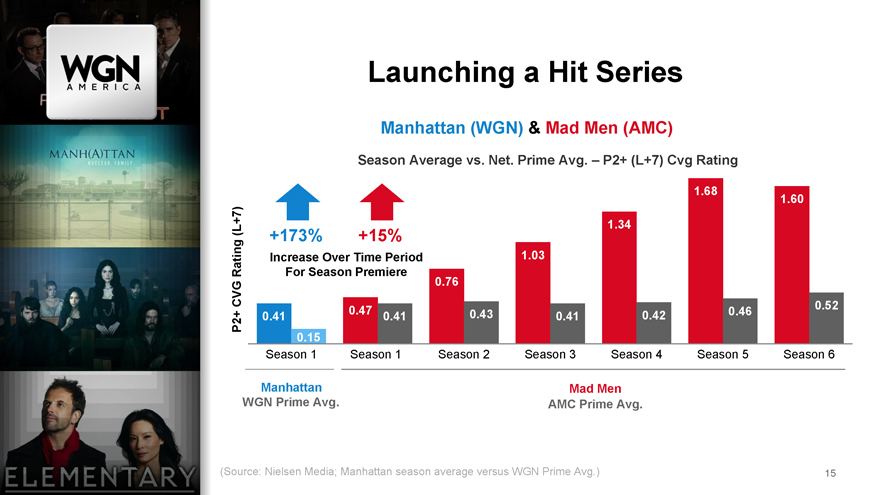
a Hit SeriesManhattan (WGN) & Mad Men (AMC)Season Average vs. Net. Prime Avg. P2+ (L+7) Cvg Rating1.68 1.60 (L+7) 1.34 +173% +15%Increase Over Time Period 1.03 Rating For Season Premiere CVG 0.76 0.47 0.52 0.41 0.41 0.43 0.41 0.42 0.46 P2+0.15 Season 1 Season 1 Season 2 Season 3 Season 4 Season 5 Season 6Manhattan Mad Men WGN Prime Avg. AMC Prime Avg.(Source: Nielsen Media; Manhattan season average versus WGN Prime Avg.) 15
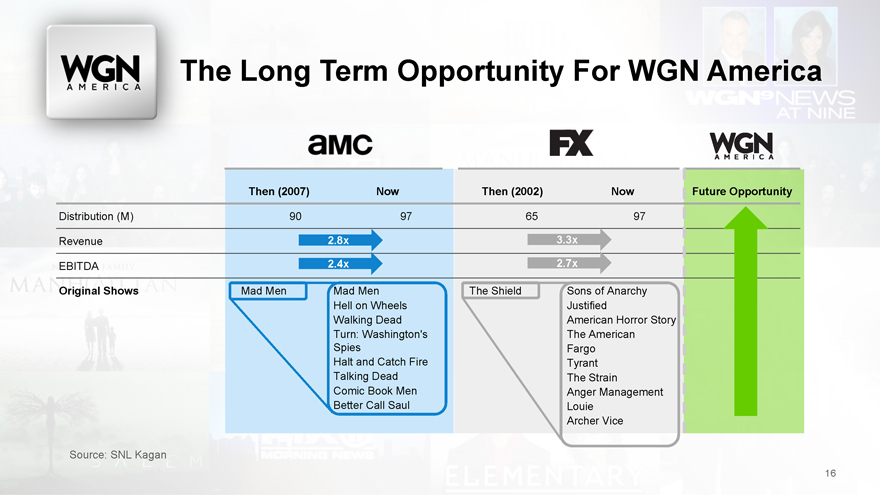
Long Term Opportunity For WGN AmericaThen (2007) Now Then (2002) Now Future OpportunityDistribution (M) 90 97 65 97Revenue 2.8x 3.3x EBITDA 2.4x 2.7xOriginal Shows Mad Men Mad Men The Shield Sons of Anarchy Hell on Wheels Justified Walking Dead American Horror Story Turn: Washington’s The American Spies Fargo Halt and Catch Fire Tyrant Talking Dead The Strain Comic Book Men Anger Management Better Call Saul Louie Archer ViceSource: SNL Kagan16
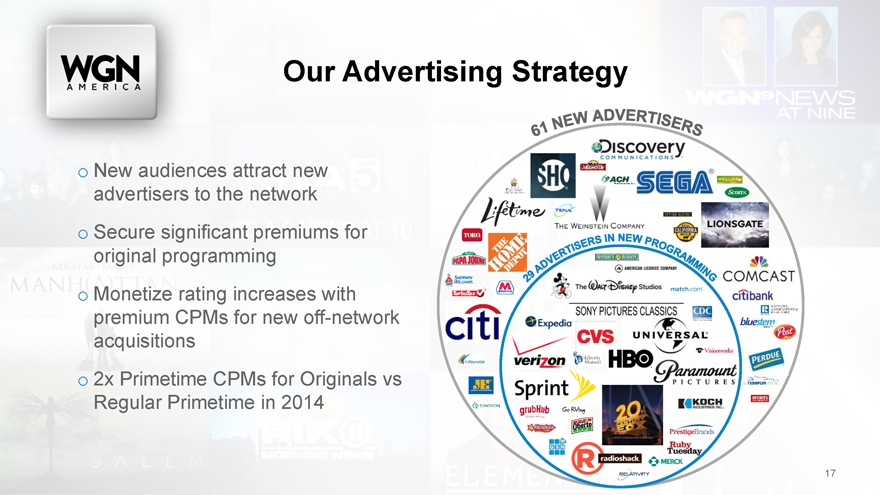
Advertising Strategyo New audiences attract new advertisers to the network o Secure significant premiums for original programming o Monetize rating increases with premium CPMs for new off-network acquisitions o 2x Primetime CPMs for Originals vs Regular Primetime in 201417
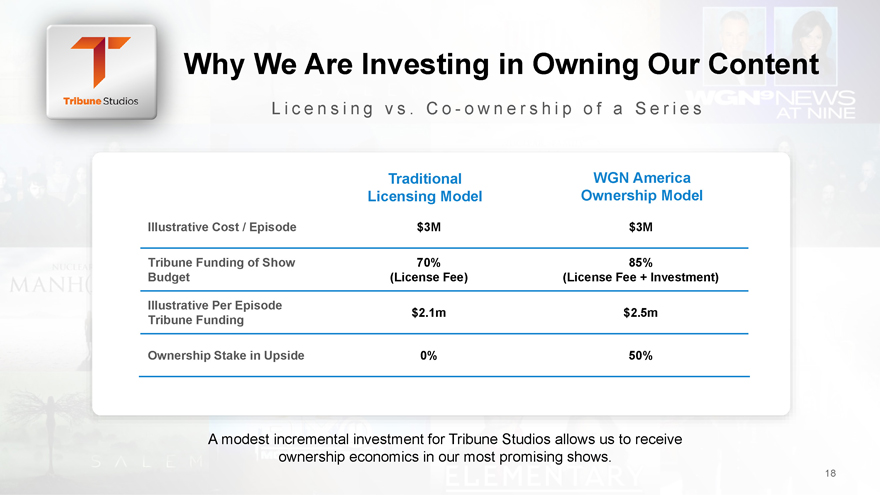
We Are Investing in Owning Our ContentLicensin g v s . C o—o w n e r s h i p o f a S e r i e sTraditional WGN America Licensing Model Ownership ModelIllustrative Cost / Episode $3M $3MTribune Funding of Show 70% 85%Budget (License Fee) (License Fee + Investment)Illustrative Per Episode $2.1m $2.5m Tribune FundingOwnership Stake in Upside 0% 50%A modest incremental investment for Tribune Studios allows us to receive ownership economics in our most promising shows.18
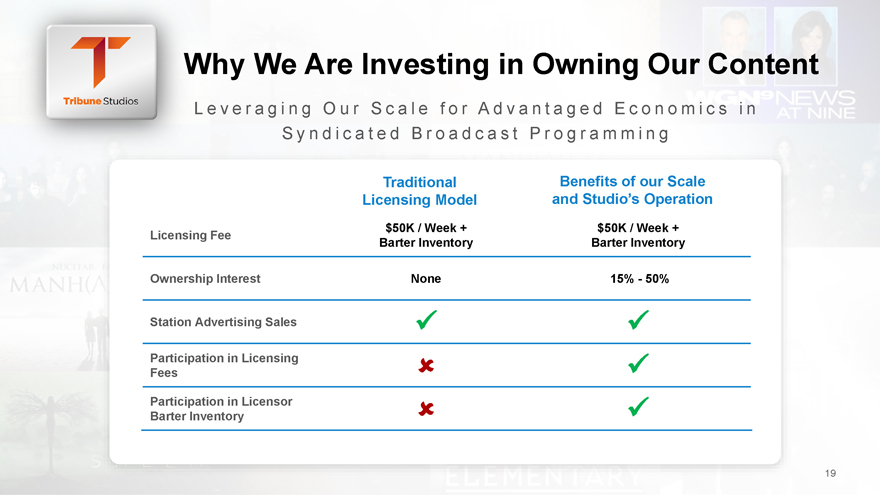
We Are Investing in Owning Our ContentL e v e r a g i n g O u r S c a l e f o r A d v a n t a g e d E c o n o m i c s i n S y n d i c a t e d B r o a d c a s t P r o g r a m m i n gTraditional Benefits of our Scale Licensing Model and Studio s Operation $50K / Week + $50K / Week + Licensing Fee Barter Inventory Barter InventoryOwnership Interest None 15%—50%Station Advertising Sales Participation in Licensing Fees Participation in Licensor Barter Inventory19
is the Key to Our TransformationMON TUE WED THU FRI SAT SUN 08:00P08:30PTUESDAY SUNDAY NIGHT NIGHT 09:00P MOVIE MOVIE09:30P10:00PSATURDAY10:30P ORIGINAL ORIGINAL NIGHT ORIGINAL CONTENT CONTENT MOVIE CONTENTOriginal Content Exclusive Syndicated Content20
Media Investor Day PRESENTATION December 11, 2014 WGN AMERICA
Media grace note Investor Day PRESENTATION December 11, 2014 WGN AMERICA
note Investor Day PRESENTATION December 11, 2014 John BatterEVP, Tribune Media Co. and CEO, GracenoteGracenote
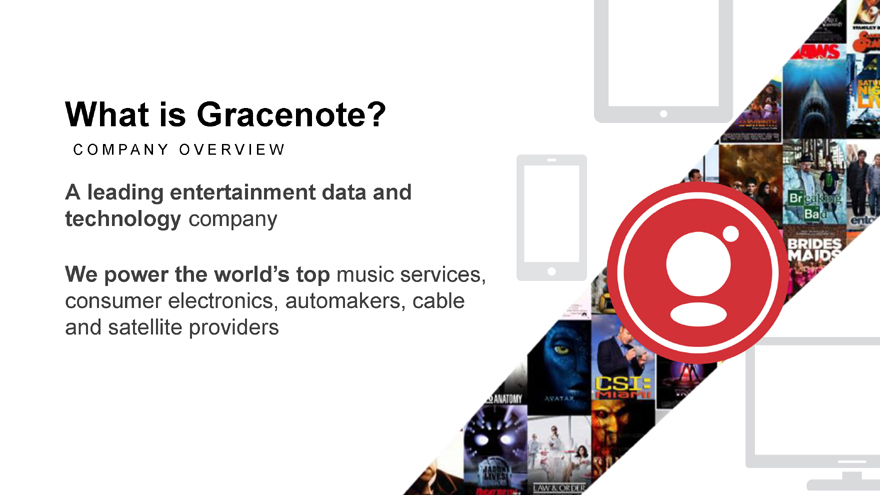
is Gracenote C O M P A N Y O V E R V I E WA leading entertainment data and technology companyWe power the world s top music services, consumer electronics, automakers, cable and satellite providers
is Metadata And why should you care 12
R A C E N O T E C O R E B U S I N E S S V E R T I C A L Svideo music automotiveHelping our customers reimagine the way people identify, discover and connect with the music, TV shows and movies they love.
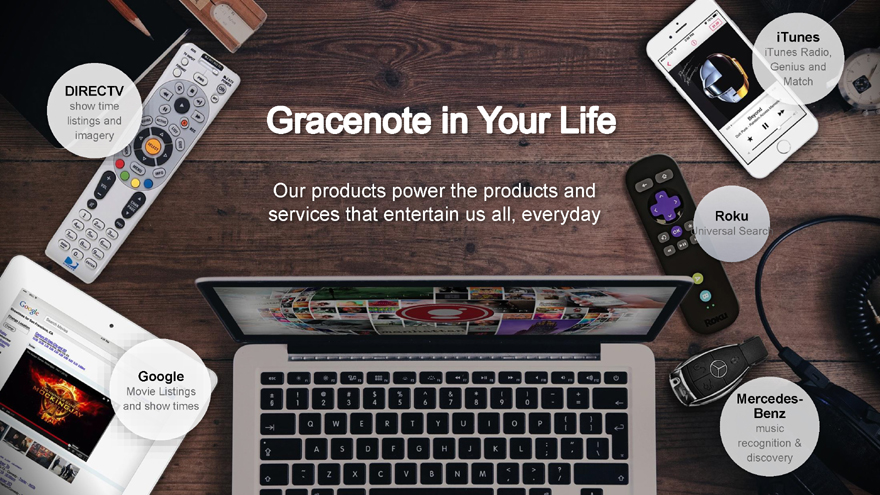
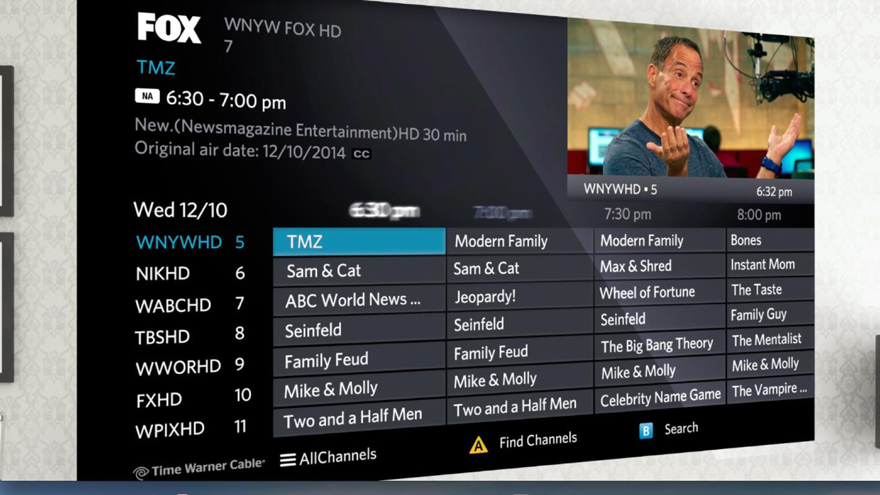
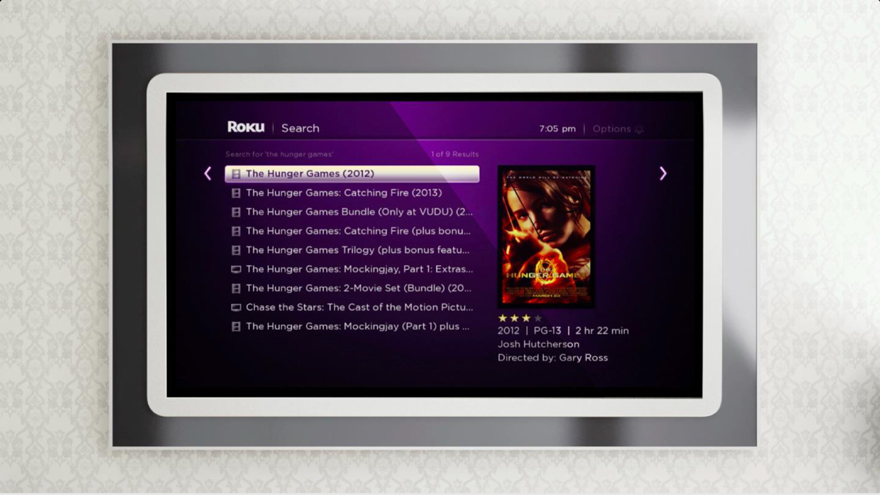
iTunes Radio, Genius and MatchDIRECTV show time listings and imageryOur products power the products and services that entertain us all, everyday RokuUniversal SearchGoogleMovie Listings Mercedes-and show timesBenz music recognition & discovery
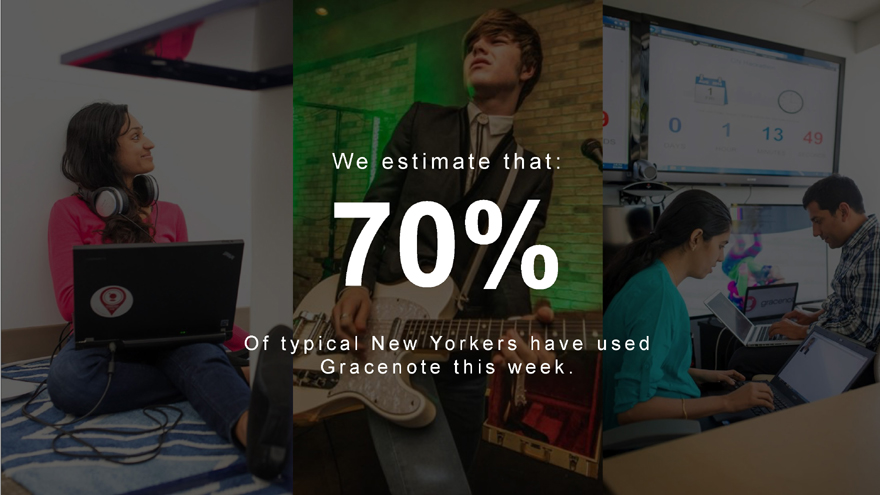
e e s t i m a t e t h a t :70%O f t y p i c a l N e w Yo r k e r s h a v e u s e d G r a c e n o t e t h i s w e e k .
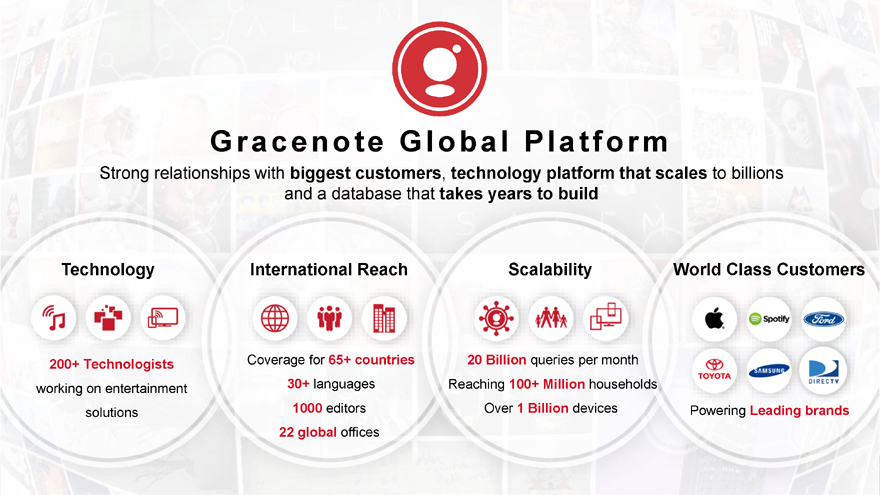
r a c e n o t e G l o b a l P l a t f o r mStrong relationships with biggest customers, technology platform that scales to billions and a database that takes years to buildTechnology International Reach Scalability World Class Customers200+ Technologists Coverage for 65+ countries 20 Billion queries per month working on entertainment 30+ languages Reaching 100+ Million households solutions 1000 editors Over 1 Billion devices22 global offices
Video CustomersOur Video Customers Represent top cable and satellite providers, Internet companies and OTT platforms worldwide
wnyw fox hd
search The Hunger Games (2012)
Music CustomersOur Music Customers Represent the biggest names in streaming,
Sleep Till Brooklyn Beastle Boys Licensed to III No Sleep Till
Auto CustomersGracenote works with every major automotive manufacturer
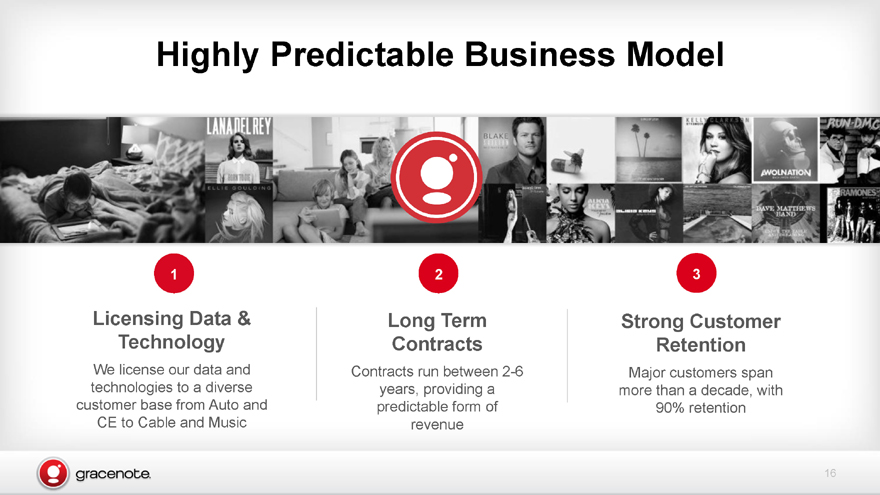
Predictable Business Model1 2 3Licensing Data & Long Term Strong Customer Technology Contracts RetentionWe license our data and Contracts run between 2-6 Major customers span technologies to a diverse years, providing a more than a decade, with customer base from Auto and predictable form of 90% retention CE to Cable and Music revenue16
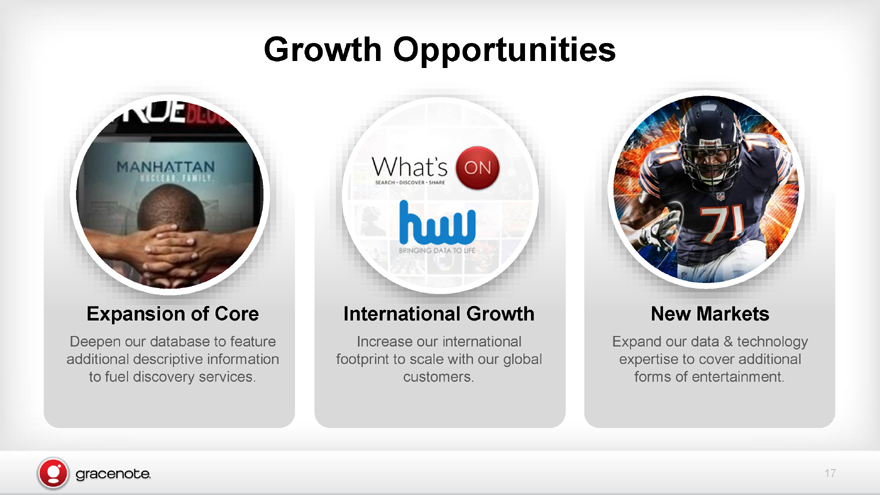
OpportunitiesDeepen our database to feature Increase our international Expand our data & technology additional descriptive information footprint to scale with our global expertise to cover additional to fuel discovery services. customers. forms of entertainment.17
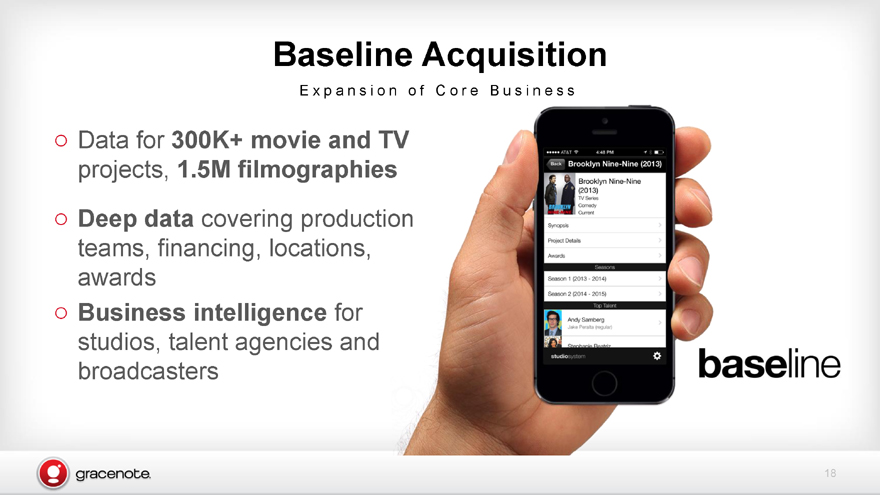
AcquisitionE x p a n s i o n o f C o r e B u s i n e s s Data for 300K+ movie and projects, 1.5M filmographie Deep data covering production teams, financing, locations, awards Business intelligence for studios, talent agencies and broadcasters Base line18
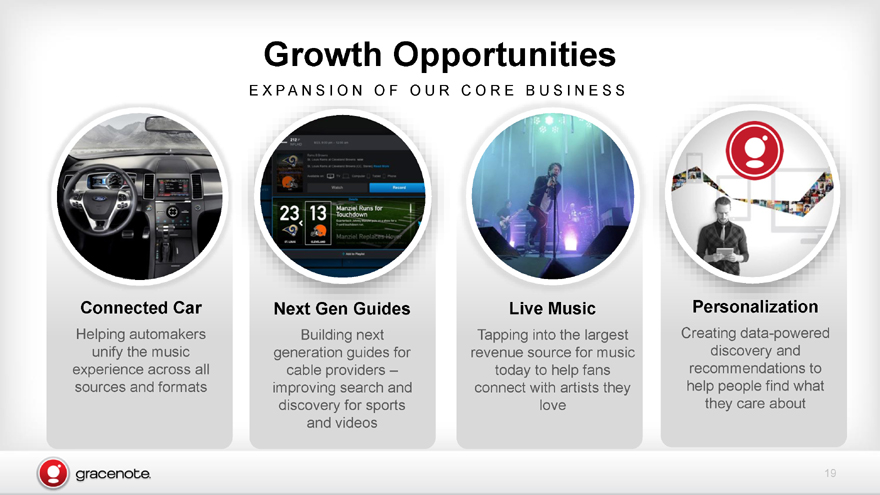
OpportunitiesE X P A N S I O N O F O U R C O R E B U S I N E S SConnected Car Next Gen Guides Live Music PersonalizationHelping automakers Building next Tapping into the largest Creating data-powered unify the music generation guides for revenue source for music discovery and experience across all cable providers today to help fans recommendations to sources and formats improving search and connect with artists they help people find what discovery for sports love they care about and videos19
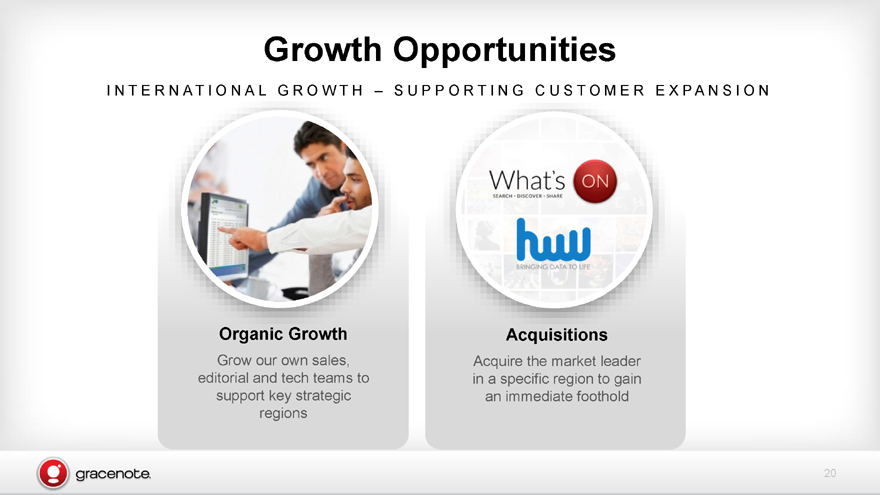
OpportunitiesI N T E R N A T I O N A L G R O W T H S U P P O R T I N G C U S T O M E R E X P A N S I O NGrow our own sales, Acquire the market leader editorial and tech teams to in a specific region to gain support key strategic an immediate foothold regions 20
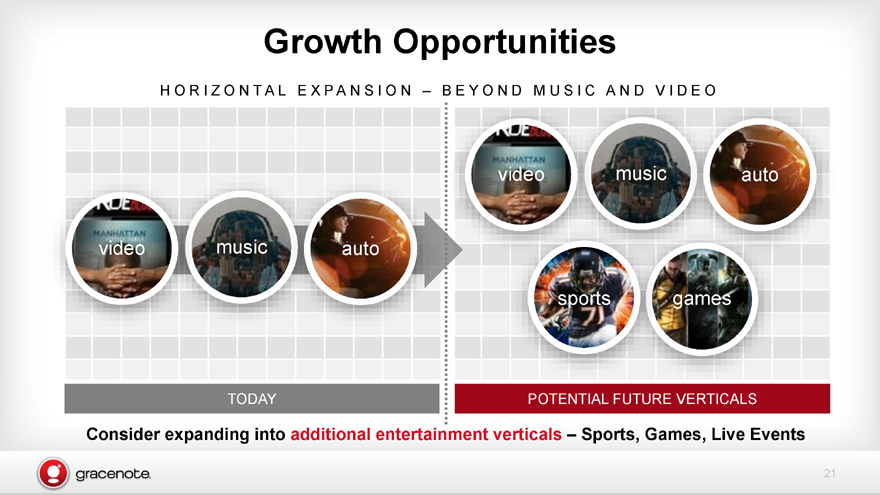
OpportunitiesH O R I Z O N T A L E X P A N S I O N B E Y O N D M U S I C A N D V I D E Ovideo music autovideo music autosports gamesTODAY POTENTIAL FUTURE VERTICALSConsider expanding into additional entertainment verticals Sports, Games, Live Events21
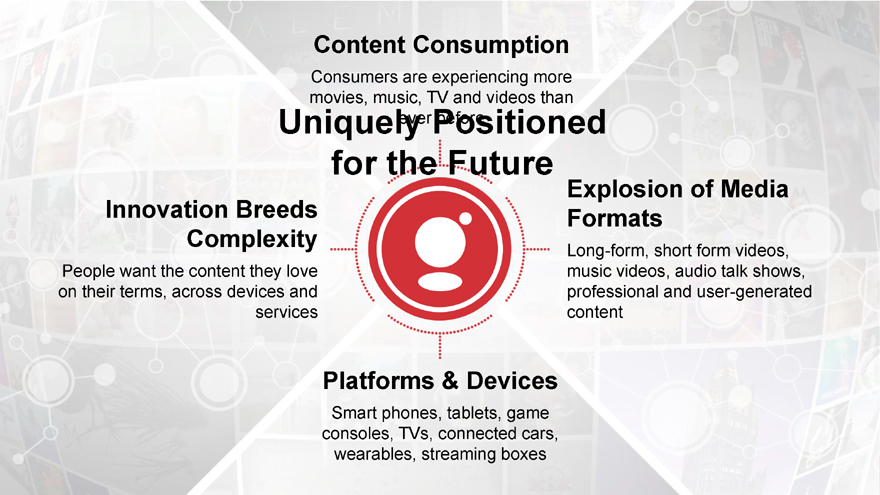
ConsumptionConsumers are experiencing more movies, music, TV and videos than Uniquely ever Positioned before for the FutureExplosion of Media Innovation Breeds Formats ComplexityLong-form, short form videos, People want the content they love music videos, audio talk shows, on their terms, across devices and professional and user-generated services contentPlatforms & DevicesSmart phones, tablets, game consoles, TVs, connected cars, wearables, streaming boxes
Media grace note Investor Day PRESENTATION December 11, 2014 WGN AMERICA
Tribune Real Estate Investor Day PRESENTATION December 11, 2014 Murray McQueen
President, Tribune Real Estate Holdings
Real Estate
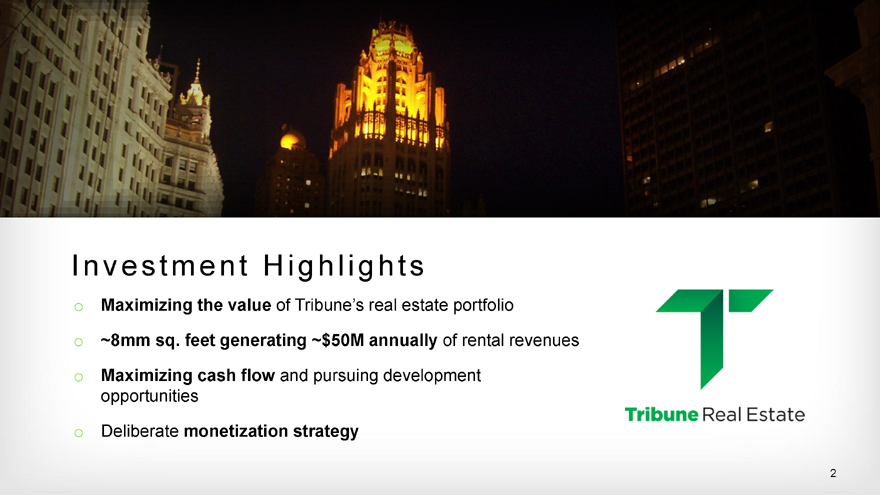
I n v e s t m e n t H i g h l i g h t s
o Maximizing the value of Tribune’s real estate portfolio
o ~8mm sq. feet generating ~$50M annually of rental revenues
o Maximizing cash flow and pursuing development opportunities
o Deliberate monetization strategy
2
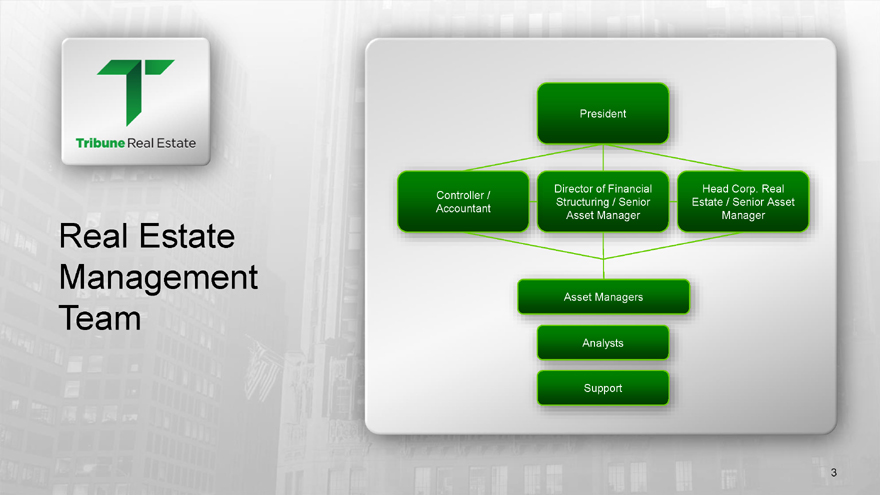
President
Director of Financial Head Corp. Real Controller / Structuring / Senior Estate / Senior Asset Accountant Asset Manager Manager
Real Estate Management
Asset Managers
Team
Analysts
Support
3
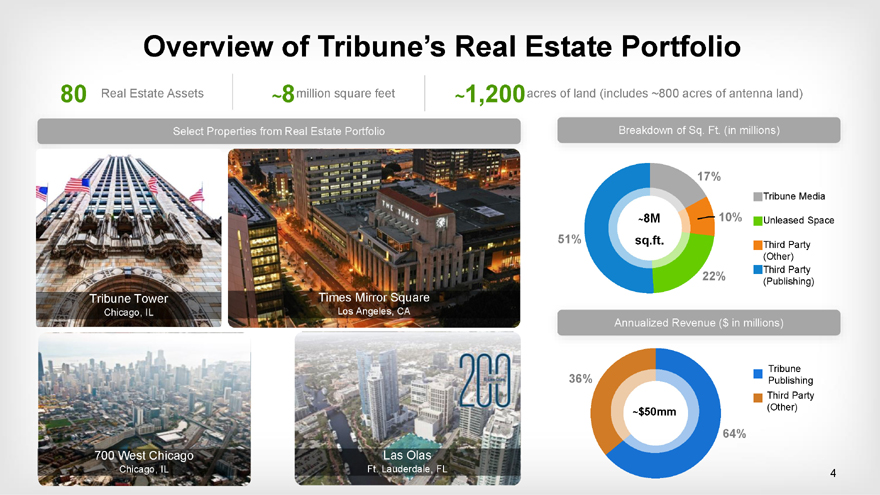
Overview of Tribune’s Real Estate Portfolio
80 Real Estate Assets ~8million square feet ~1,200acres of land (includes ~800 acres of antenna land)
Select Properties from Real Estate Portfolio Breakdown of Sq. Ft. (in millions)
17%
Tribune Media
~8M 10% Unleased Space
51% sq.ft.
Third Party (Other) Third Party
22%
(Publishing)
Tribune Tower Times Mirror Square
Chicago, IL Los Angeles, CA
Annualized Revenue ($ in millions)
36% Tribune Publishing Third Party $ (Other)
~ 50mm
64%
700 West Chicago Las Olas
Chicago, IL Ft. Lauderdale, FL 4
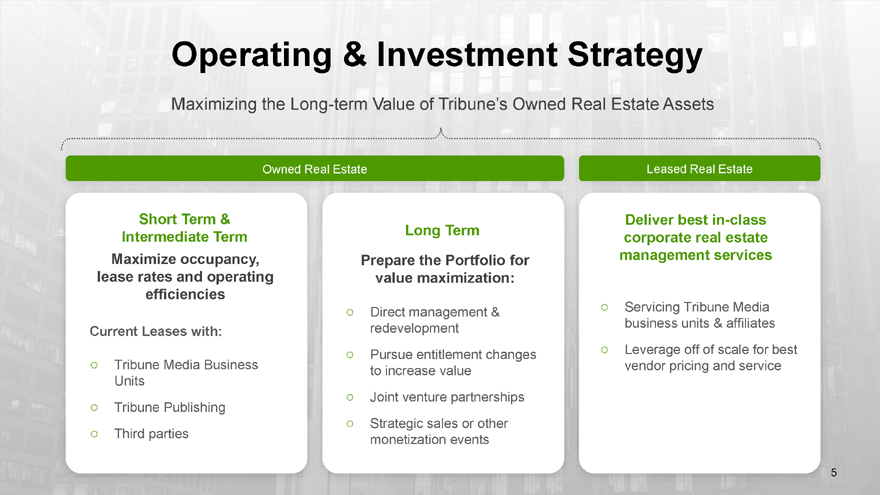
Operating & Investment Strategy
Maximizing the Long-term Value of Tribune’s Owned Real Estate Assets
Owned Real Estate Leased Real Estate
Short Term & Deliver best in-class Long Term Intermediate Term corporate real estate Maximize occupancy, Prepare the Portfolio for management services lease rates and operating value maximization: efficiencies
Direct management & Servicing Tribune Media redevelopment business units & affiliates
Current Leases with:
Pursue entitlement changes Leverage off of scale for best
Tribune Media Business vendor pricing and service to increase value Units
Joint venture partnerships
Tribune Publishing
Strategic sales or other
Third parties monetization events
T r i b u n e R e a l E s t a t e H o l d i n g s : G e o g r a p h i c a l l y D i v e r s e
7 | | 0 0 W e s t T r i b u n e C h i c a g o T o w e r |
l a n d o
T i m e s
F o r t M i r r o r L a u d e r d a l e S q u a r e
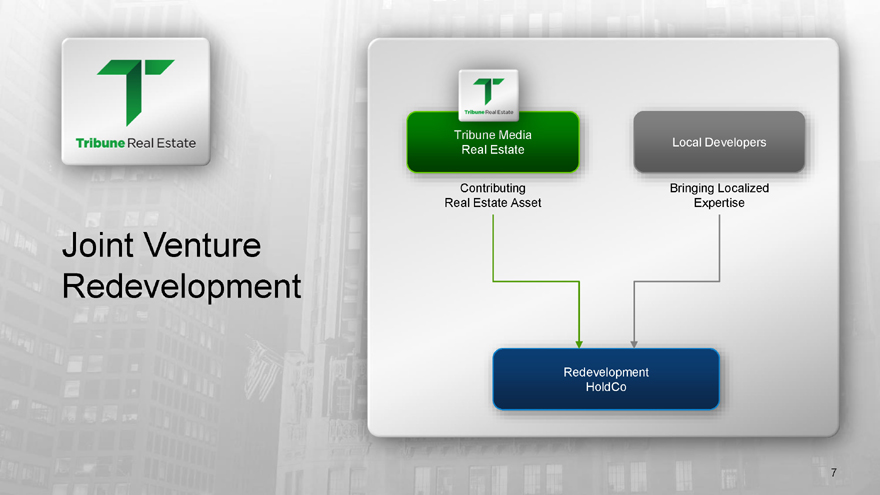
Local Developers
Contributing Bringing Localized Real Estate Asset Expertise
Joint Venture Redevelopment
Redevelopment HoldCo
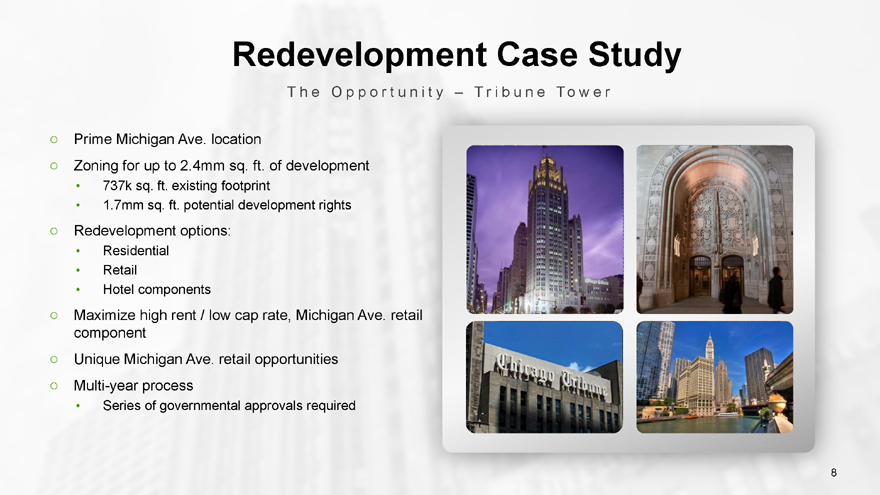
Redevelopment Case Study
T h e O p p o r t u
Prime Michigan Ave. location
Zoning for up to 2.4mm sq. ft. of development
737k sq. ft. existing footprint
1.7mm sq. ft. potential development rights
Redevelopment options:
Residential
Retail
Hotel components
Maximize high rent / low cap rate, Michigan Ave. component
Unique Michigan Ave. retail opportunities
Multi-year process
Series of governmental approvals required
8
Redevelopment Case Study: Tribune Tower
Tr i b u n e To w e r S i t e h a s t h e 2 nd H i g h e s t V i s i t o r
C o u n t i n C h i c a g o
ribune Tower
Tr i b u n e To w e r
10
Dylan’s Candy Bar Tribune Tower Retail
Potential Redevelopment on Tribune Tower Site
Conceptual Massing Study
11
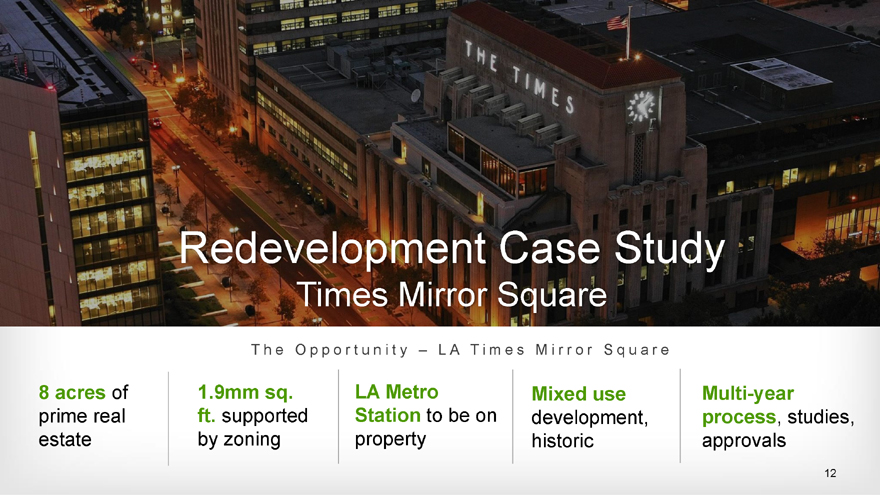
Redevelopment Case Study
Times Mirror Square
T h e O p p o r t u n i t y – L A T i m e s M i r r o r S q u a r e
8 acres of 1.9mm sq. LA Metro Mixed use Multi-year prime real ft. supported Station to be on development, process, studies, estate by zoning property historic approvals
12
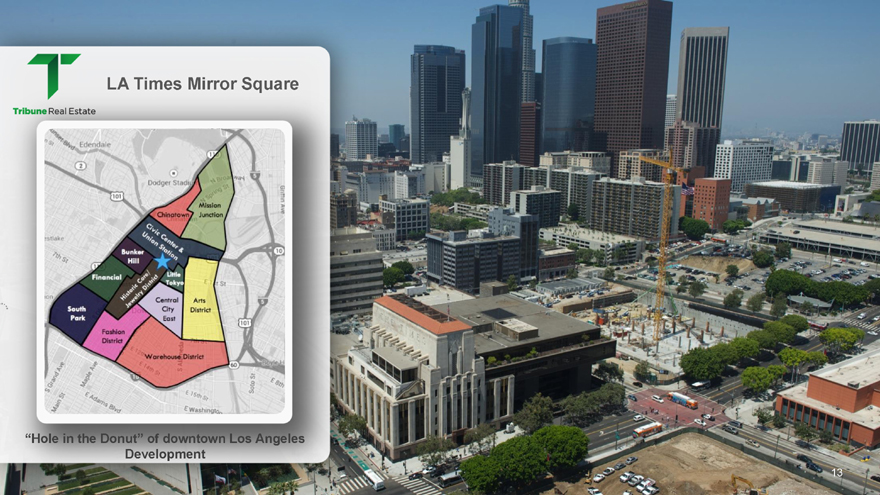
LA Times Mirror Square
“Hole in the Donut” of downtown Los Angeles
Development
13
R e a l E s t a t e S u m m a r y
Portfolio of mission critical, single purpose facilities
Attractive locations that capitalize on the renaissance of urban centers
Capitalize on previously undermanaged real estate holdings and underutilized locations
Strategy to maximize value creation by forming strategic partnership with local developers, entitle and redevelop opportunistically, and create monetizable cash flows
Enhance the operating efficiencies through best practices in operations, leasing and expense management
14
Media Investor Day presentation December 11, 2014 Steven BernsO, ribune Media Tribune Media
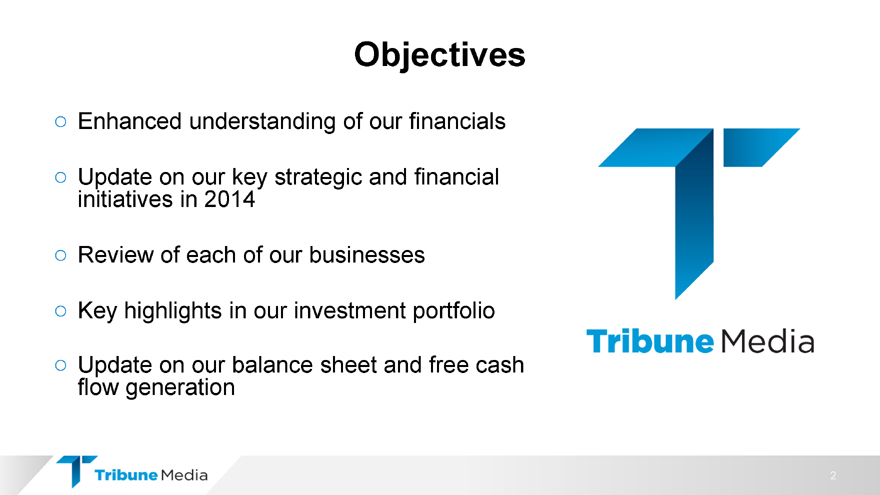
Enhanced understanding of our financials Update on our key strategic and financial initiatives in 2014 Review of each of our businesses Key highlights in our investment portfolio Update on our balance sheet and free cash flow generation2
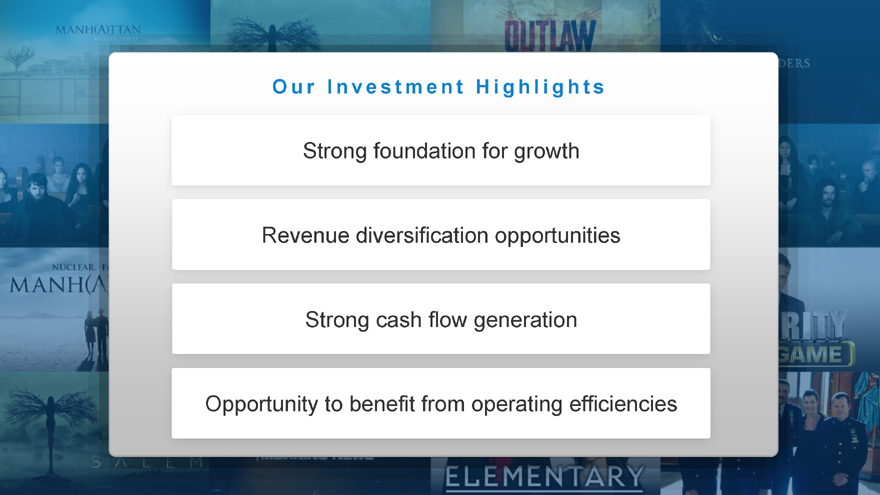
u r I n v e s t m e n t H i g h l i g h t sStrong foundation for growth Revenue diversification opportunities Strong cash flow generationOpportunity to benefit from operating efficiencies
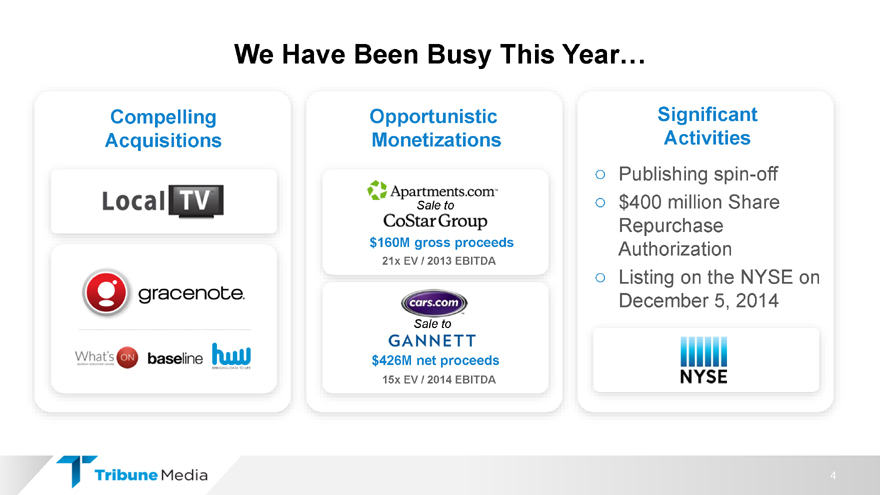
Have Been Busy This YearCompelling Opportunistic Significant Acquisitions Monetizations Activities Publishing spin-off Sale to $400 million Share Repurchase $160M gross proceeds Authorization21x EV / 2013 EBITDA Listing on the NYSE on December 5, 2014Sale to$426M net proceeds15x EV / 2014 EBITDA4
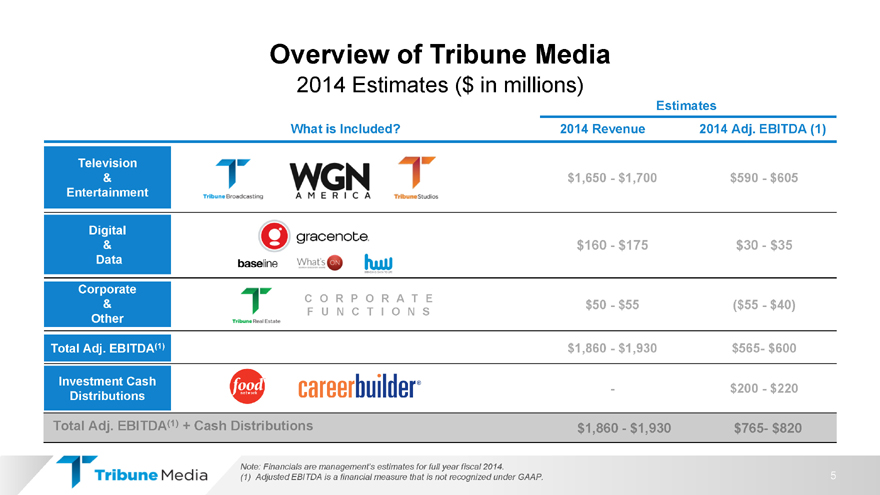
of Tribune Media2014 Estimates ($ in millions)Estimates What is Included 2014 Revenue 2014 Adj. EBITDA (1)Television& $1,650—$1,700 $590—$605EntertainmentDigital& $160—$175 $30—$35DataCorporateC O R P O R A T E & $50—$55 ($55—$40)F U N C T I O N SOtherTotal Adj. EBITDA(1) $1,860—$1,930 $565- $600Investment Cash—$200—$220DistributionsTotal Adj. EBITDA(1) + Cash Distributions $1,860—$1,930 $765- $820Note: Financials are management s estimates for full year fiscal 2014. 5(1) Adjusted EBITDA is a financial measure that is not recognized under GAAP.
|
|
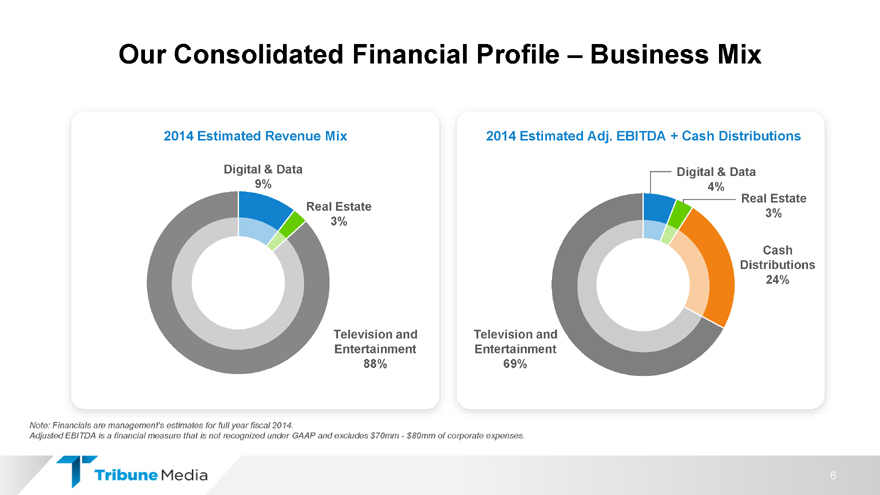
Consolidated Financial Profile Business Mix2014 Estimated Revenue Mix 2014 Estimated Adj. EBITDA + Cash DistributionsDigital & Data Digital & Data 9% 4% Real EstateReal Estate3% 3%Cash Distributions 24%Television and Television and Entertainment Entertainment 88% 69%Note: Financials are management s estimates for full year fiscal 2014.Adjusted EBITDA is a financial measure that is not recognized under GAAP and excludes $70mm—$80mm of corporate expenses.6
|
|
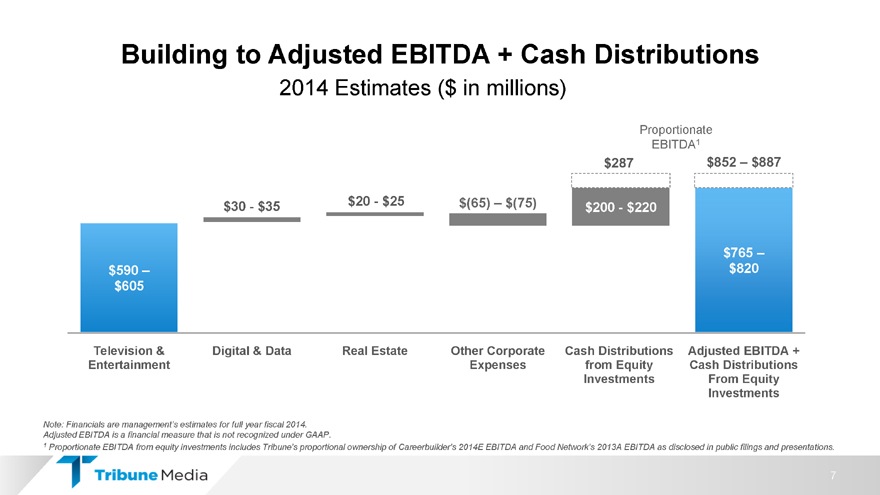
to Adjusted EBITDA + Cash Distributions2014 Estimates ($ in millions)Proportionate EBITDA1 $287 $852 $887$30—$35 $20—$25 $(65) $(75) $200—$220$765 $590 $820 598 630 578 578 $605Television & Digital & Data Real Estate Other Corporate Cash Distributions Adjusted EBITDA + Entertainment Expenses from Equity Cash Distributions Investments From Equity InvestmentsNote: Financials are management s estimates for full year fiscal 2014.Adjusted EBITDA is a financial measure that is not recognized under GAAP. 1 Proportionate EBITDA from equity investments includes Tribune s proportional ownership of Careerbuilder s 2014E EBITDA and Food Network s 2013A EBITDA as disclosed in public filings and presentations.7
|
|
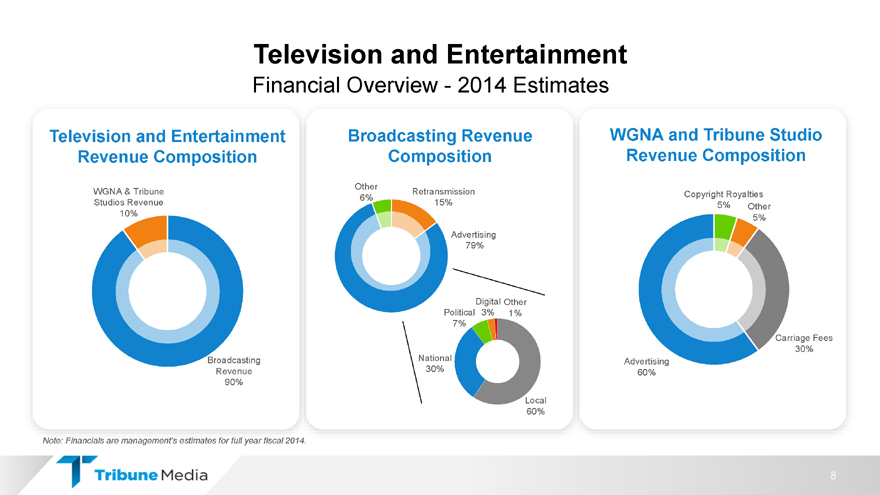
and EntertainmentFinancial Overview—2014 EstimatesTelevision and Entertainment Broadcasting Revenue WGNA and Tribune Studio Revenue Composition Composition Revenue CompositionOtherWGNA & Tribune Retransmission Copyright Royalties 6% Studios Revenue 15% 5% Other 10% 5% Advertising 79%Digital Other Political 3% 1% 7%Carriage Fees 30% Broadcasting National Advertising Revenue 30% 60% 90%Local 60%Note: Financials are management s estimates for full year fiscal 2014.8
|
|
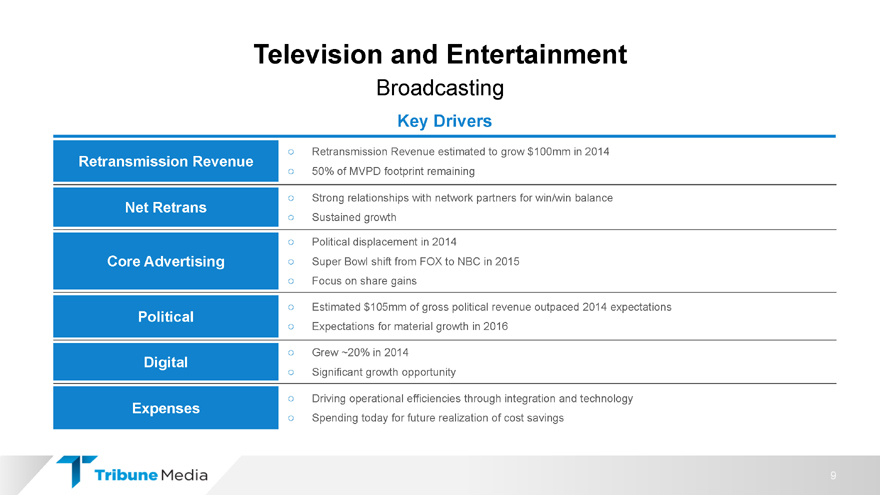
and EntertainmentBroadcastingKey Drivers Retransmission Revenue estimated to grow $100mm in 2014 Retransmission Revenue 50% of MVPD footprint remaining Strong relationships with network partners for win/win balanceNet Retrans Sustained growth Political displacement in 2014Core Advertising Super Bowl shift from FOX to NBC in 2015 Focus on share gains Estimated $105mm of gross political revenue outpaced 2014 expectationsPolitical Expectations for material growth in 2016 Grew ~20% in 2014Digital Significant growth opportunity Driving operational efficiencies through integration and technologyExpenses Spending today for future realization of cost savings9
|
|
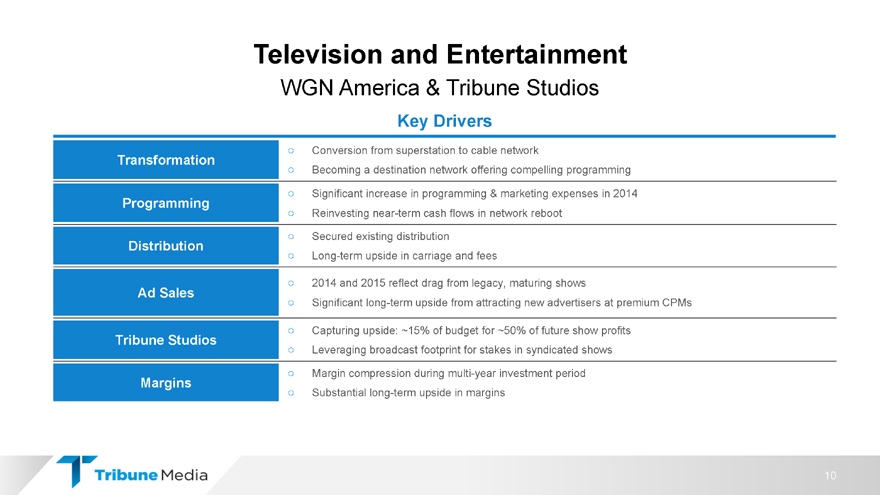
and EntertainmentWGN America & Tribune StudiosKey Drivers Conversion from superstation to cable networkTransformation Becoming a destination network offering compelling programming Significant increase in programming & marketing expenses in 2014 Programming Reinvesting near-term cash flows in network reboot Secured existing distributionDistribution Long-term upside in carriage and fees 2014 and 2015 reflect drag from legacy, maturing showsAd Sales Significant long-term upside from attracting new advertisers at premium CPMs Capturing upside: ~15% of budget for ~50% of future show profitsTribune Studios Leveraging broadcast footprint for stakes in syndicated shows Margin compression during multi-year investment periodMargins Substantial long-term upside in margins10
|
|
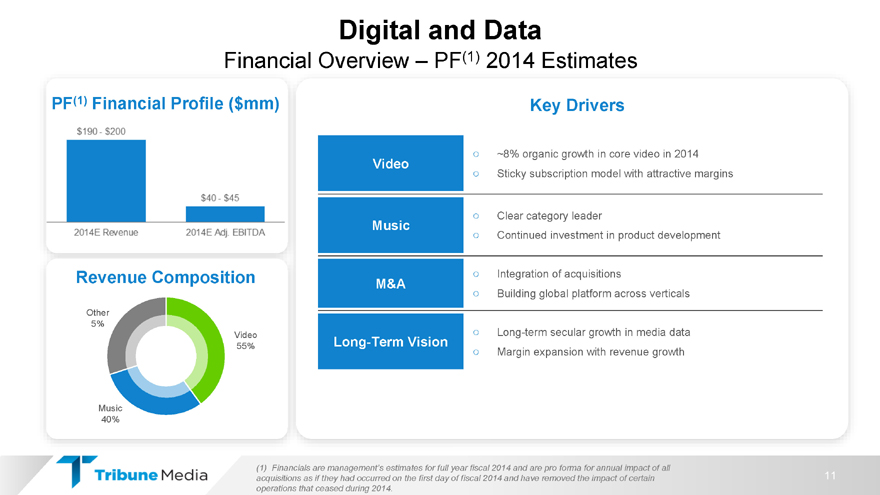
and DataFinancial Overview PF(1) 2014 EstimatesPF(1) Financial Profile ($mm) Key Drivers ~8% organic growth in core video in 2014Video Sticky subscription model with attractive margins Clear category leaderMusic Continued investment in product developmentRevenue Composition Integration of acquisitionsM&A Building global platform across verticals Other5% Video Long-term secular growth in media data55% Long-Term Vision Margin expansion with revenue growth Music40%(1) Financials are management s estimates for full year fiscal 2014 and are pro forma for annual impact of all acquisitions as if they had occurred on the first day of fiscal 2014 and have removed the impact of certain 11 operations that ceased during 2014.
|
|
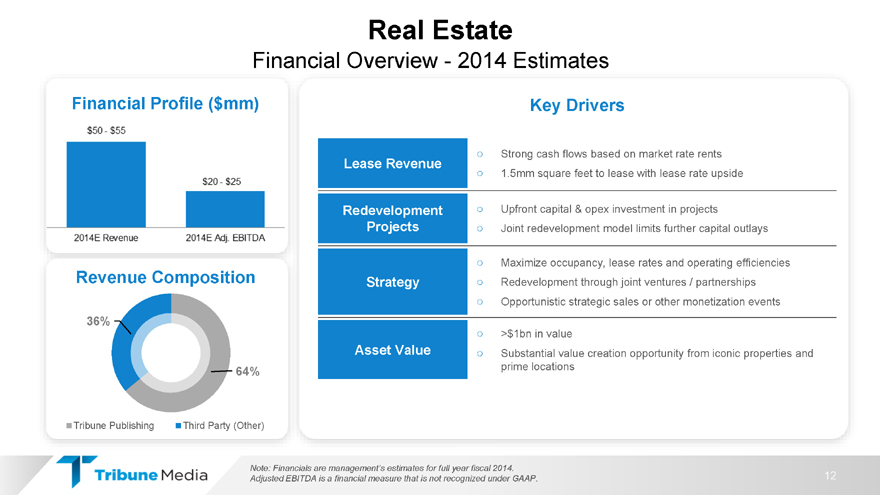
EstateFinancial Overview—2014 EstimatesFinancial Profile ($mm) Key Drivers Strong cash flows based on market rate rentsLease Revenue 1.5mm square feet to lease with lease rate upsideRedevelopment Upfront capital & opex investment in projectsProjects Joint redevelopment model limits further capital outlays Maximize occupancy, lease rates and operating efficiencies Revenue Composition Strategy Redevelopment through joint ventures / partnerships Opportunistic strategic sales or other monetization events36% >$1bn in valueAsset Value Substantial value creation opportunity from iconic properties and 64% prime locationsTribune Publishing Third Party (Other)Note: Financials are management s estimates for full year fiscal 2014.Adjusted EBITDA is a financial measure that is not recognized under GAAP. 12
|
|
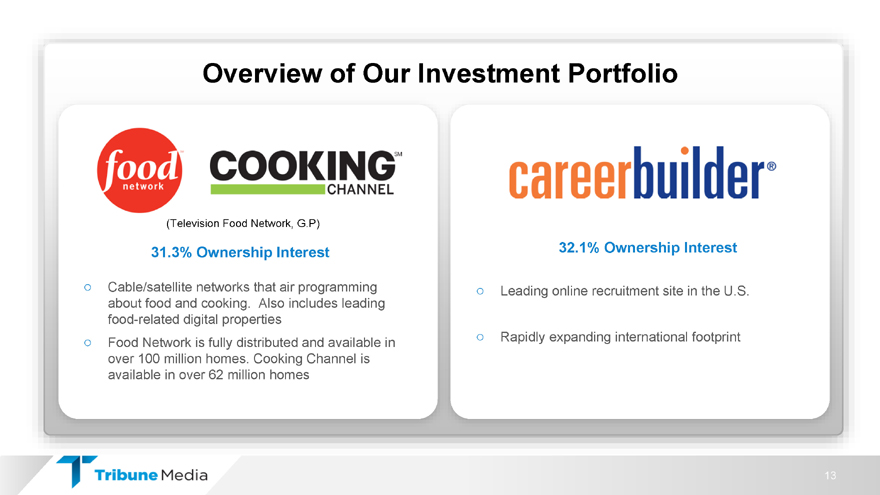
of Our Investment Portfolio(Television Food Network, G.P)31.3% Ownership Interest 32.1% Ownership Interest Cable/satellite networks that air programming Leading online recruitment site in the U.S. about food and cooking. Also includes leading food-related digital properties Food Network is fully distributed and available in Rapidly expanding international footprint over 100 million homes. Cooking Channel is available in over 62 million homes13
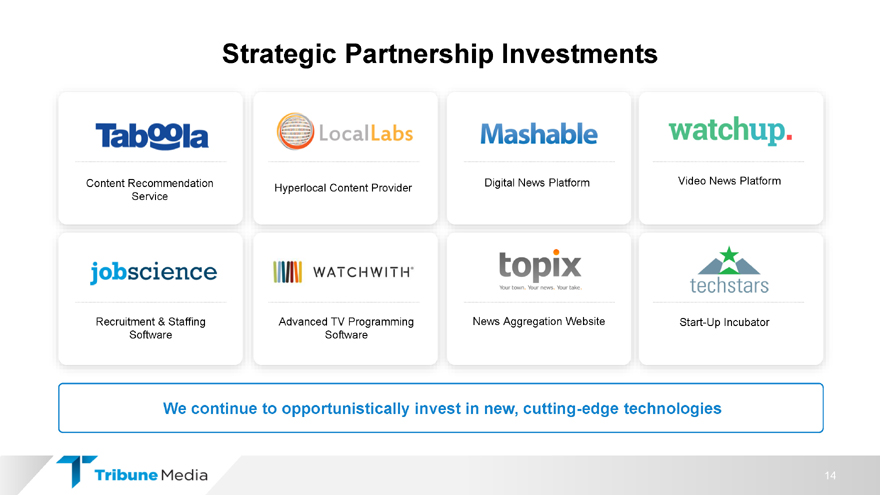
Partnership InvestmentsContent Recommendation Digital News Platform Video News Platform Hyperlocal Content Provider ServiceRecruitment & Staffing Advanced TV Programming News Aggregation Website Start-Up Incubator Software SoftwareWe continue to opportunistically invest in new, cutting-edge technologies14
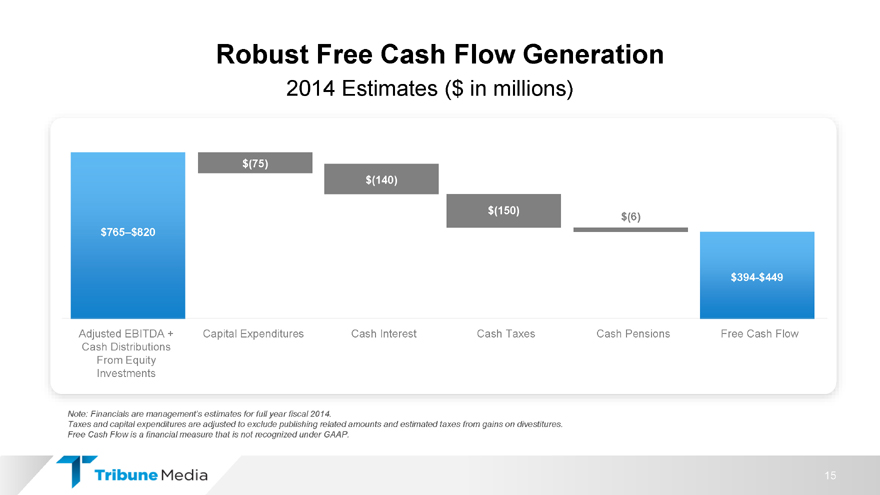
Free Cash Flow Generation2014 Estimates ($ in millions)$(75) $(140)$(150) $(6) $765 $820$394-$449Adjusted EBITDA + Capital Expenditures Cash Interest Cash Taxes Cash Pensions Free Cash Flow Cash Distributions From Equity InvestmentsNote: Financials are management s estimates for full year fiscal 2014.Taxes and capital expenditures are adjusted to exclude publishing related amounts and estimated taxes from gains on divestitures. Free Cash Flow is a financial measure that is not recognized under GAAP. 15
|
|
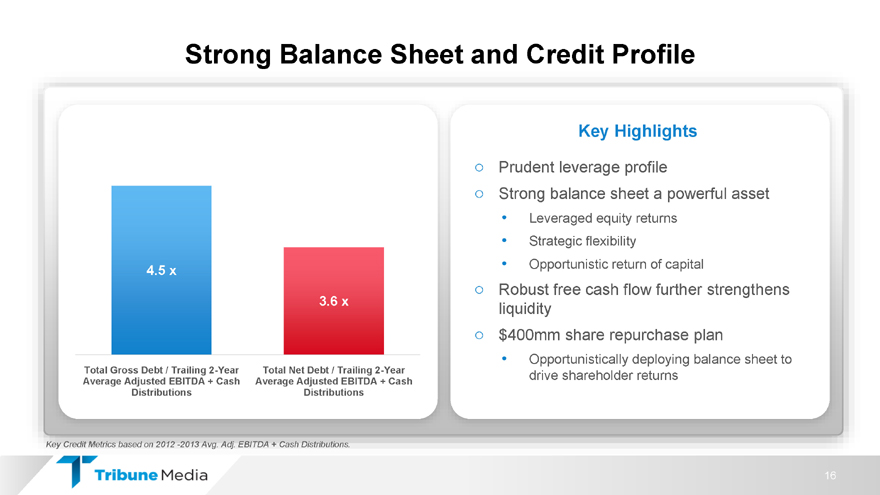
Balance Sheet and Credit Profile Key Highlights Prudent leverage profile Strong balance sheet a powerful asset Leveraged equity returns Strategic flexibility Opportunistic return of capital4.5 x Robust free cash flow further strengthens 3.6 xliquidity $400mm share repurchase plan Opportunistically deploying balance sheet to Total Gross Debt / Trailing 2-Year Total Net Debt / Trailing 2-Year drive shareholder returns Average Adjusted EBITDA + Cash Average Adjusted EBITDA + Cash Distributions DistributionsKey Credit Metrics based on 2012 -2013 Avg. Adj. EBITDA + Cash Distributions.16
u r I n v e s t m e n t H i g h l i g h t sStrong foundation for growth Revenue diversification opportunities Strong cash flow generationOpportunity to benefit from operating efficiencies
Media Investor Day presentation December 11, 2014 Appendix
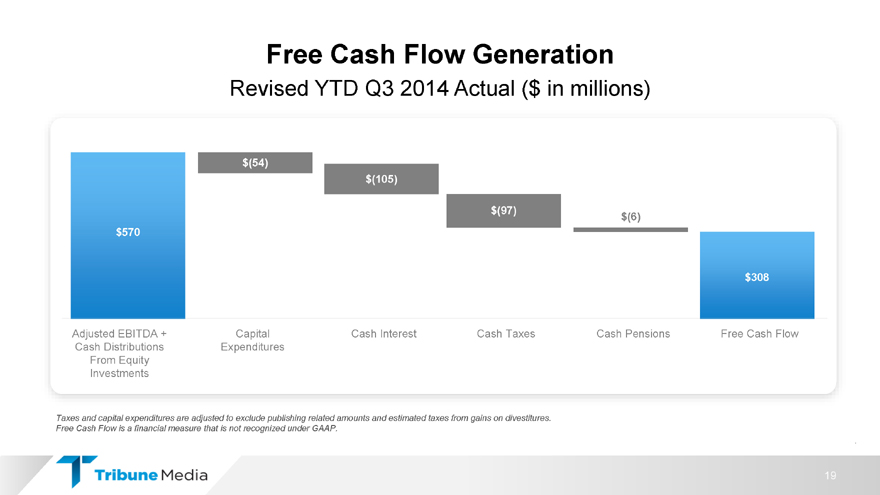
Cash Flow GenerationRevised YTD Q3 2014 Actual ($ in millions)$(54) $(105)$(97) $(6) $570$308Adjusted EBITDA + Capital Cash Interest Cash Taxes Cash Pensions Free Cash Flow Cash Distributions Expenditures From Equity InvestmentsTaxes and capital expenditures are adjusted to exclude publishing related amounts and estimated taxes from gains on divestitures. Free Cash Flow is a financial measure that is not recognized under GAAP. .19