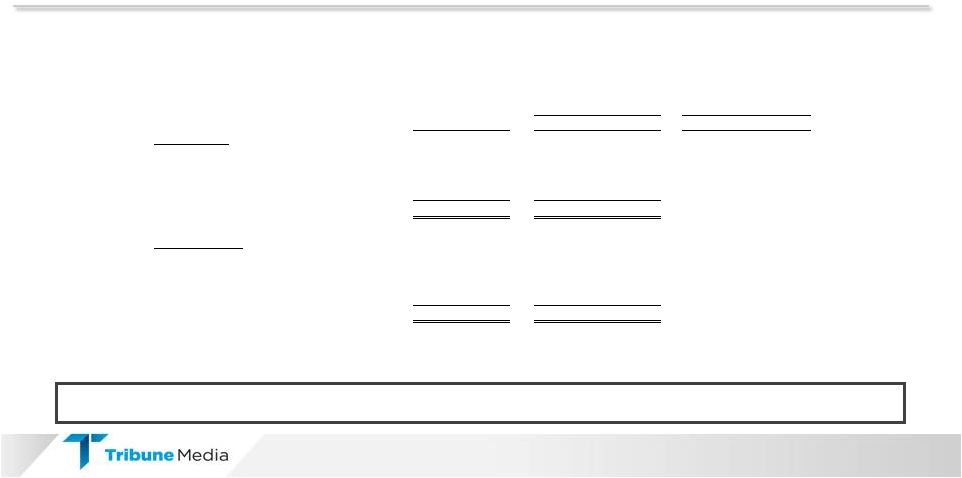
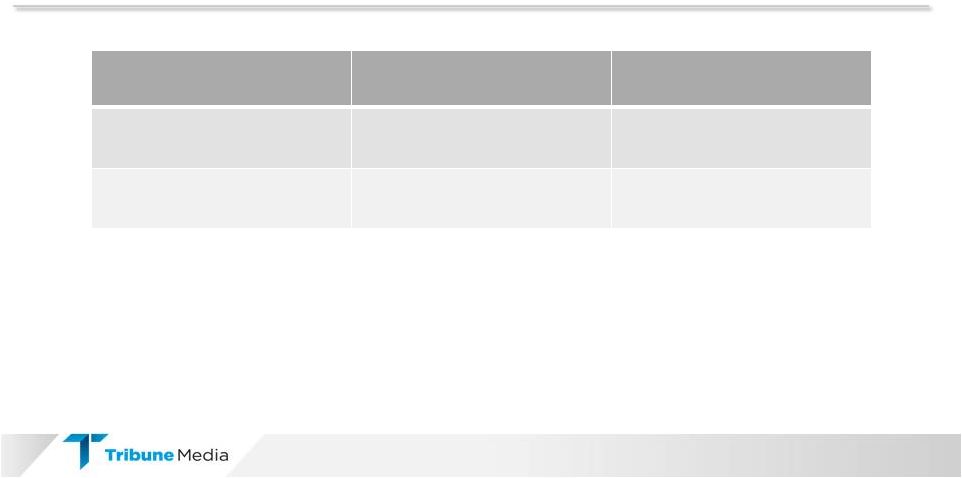
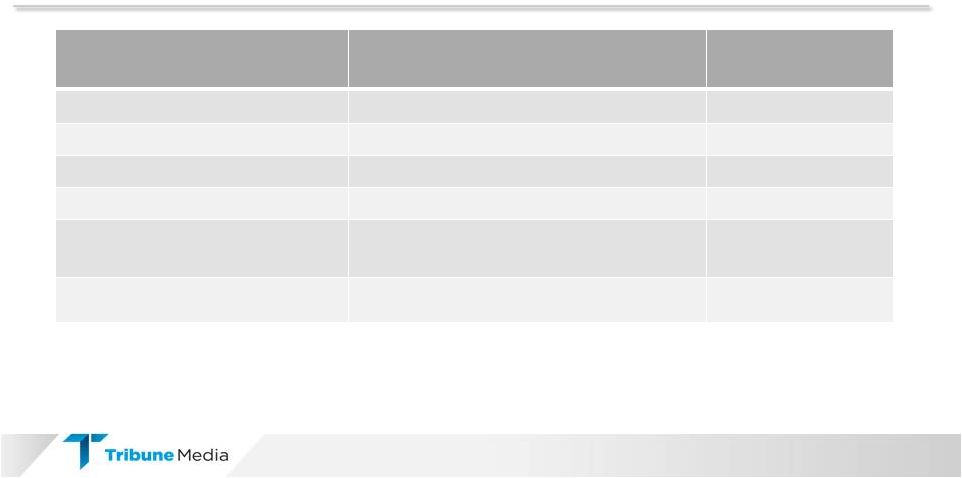
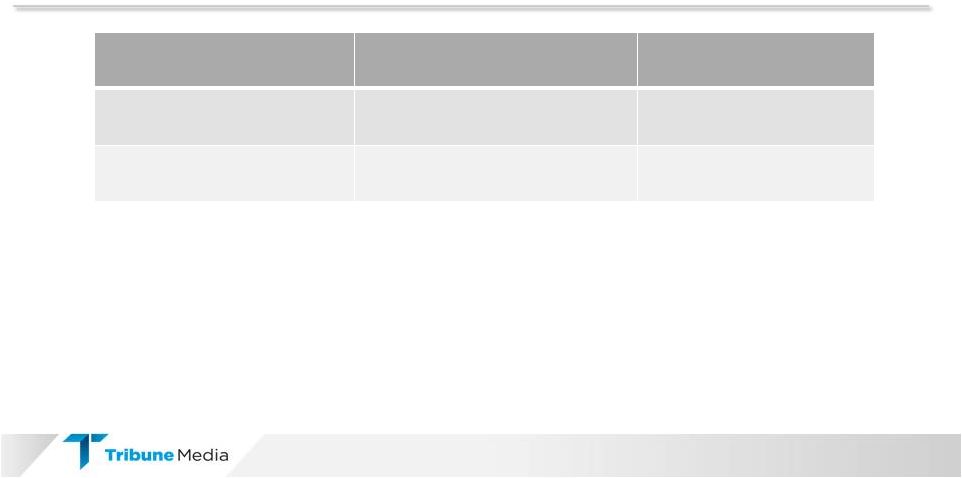
28 Consolidated (USD thousands) 2014 2013 2014 2013 2014 2013 2014 2013 2014 2013 Revenue 446,102 $ 274,156 $ 474,979 $ 292,915 $ 474,858 $ 280,608 $ 553,420 $ 299,561 $ 1,949,359 $ 1,147,240 $ Net Income 41,067 $ 58,359 $ 82,923 $ 66,311 $ 37,997 $ 49,771 $ 314,676 $ 67,114 $ 476,663 $ 241,555 $ Income (loss) from discontinued operations, net of taxes 12,600 15,309 15,841 18,923 (14,889) 10,527 — 33,854 13,552 78,613 Income from Continuing Operations 28,467 43,050 67,082 47,388 52,886 39,244 314,676 33,260 463,111 162,942 Income tax expense 17,649 11,682 42,305 31,509 2,647 27,325 216,098 25,449 278,699 95,965 Reorganization items, net 2,216 7,331 2,165 4,502 1,594 1,708 1,293 3,390 7,268 16,931 Other non-operating (gain) loss, net (157) 140 1,295 (386) (68) 67 3,640 1,671 4,710 1,492 Write-down of investment — — — — — — 94 — 94 — Gain on investment transactions, net — (29) (700) (17) (2) (104) (371,783) — (372,485) (150) Loss on extinguishment of debt — — — — — — — 28,380 — 28,380 Interest expense 40,519 9,396 39,146 9,575 39,150 9,558 39,051 10,605 157,866 39,134 Interest income (171) (93) (147) (102) (363) (100) (687) (118) (1,368) (413) Income on equity investments, net (38,263) (16,441) (118,953) (37,695) (40,559) (31,899) (38,938) (59,206) (236,713) (145,241) Operating Profit 50,260 55,036 32,193 54,774 55,285 45,799 163,444 43,431 301,182 199,040 Depreciation 16,711 9,018 17,540 10,131 17,991 10,558 17,945 11,480 70,187 41,187 Amortization 60,674 28,300 61,018 28,301 47,953 28,395 48,642 29,721 218,287 114,717 Stock-based compensation 8,449 — 6,121 1,366 5,833 1,870 5,788 2,181 26,191 5,417 Severance and related charges 2,439 134 712 541 1,974 727 1,484 1,154 6,609 2,556 Transaction-related costs 5,699 500 2,234 3,273 5,181 1,504 2,570 14,497 15,684 19,774 Gain on sales of real estate — (135) — — (303) — (21,388) — (21,691) (135) Contract termination cost — — 15,646 — — — (646) — 15,000 — Other 1,558 155 2,398 (606) 2,194 77 827 1,517 6,977 1,143 Pension (credit) expense (7,804) (8,266) (7,518) (9,125) (7,660) (8,694) (7,661) (8,695) (30,643) (34,780) Adjusted EBITDA 137,986 $ 84,742 $ 130,344 $ 88,655 $ 128,448 $ 80,236 $ 211,005 $ 95,286 $ 607,783 $ 348,919 $ First Quarter Second Quarter Third Quarter Fourth Quarter Full Year |