UNITED STATES
SECURITIES AND EXCHANGE COMMISSION
WASHINGTON, D. C. 20549
FORM 10-K
| x | ANNUAL REPORT PURSUANT TO SECTION 13 OR 15(d) OF THE SECURITIES EXCHANGE ACT OF 1934 |
For the fiscal year ended April 3, 2010
OR
| ¨ | TRANSITION REPORT PURSUANT TO SECTION 13 OR 15(d) OF THE SECURITIES EXCHANGE ACT OF 1934 |
Commission File Number: 0-12853
ELECTRO SCIENTIFIC INDUSTRIES, INC.
(Exact name of registrant as specified in its charter)
| | |
| Oregon | | 93-0370304 |
(State or other jurisdiction of incorporation or organization) | | (I.R.S. Employer Identification No.) |
| |
| 13900 N.W. Science Park Drive, Portland, Oregon | | 97229 |
| (Address of principal executive offices) | | (Zip Code) |
Registrant’s telephone number, including area code: 503-641-4141
Securities registered pursuant to Section 12(b) of the Act:
None
Securities registered pursuant to Section 12(g) of the Act:
Common Stock, without par value
Series A No Par Preferred Stock Purchase Rights
Indicate by check mark if the Registrant is a well-known seasoned issuer, as defined in Rule 405 of the Securities Act. Yes ¨ No x
Indicate by check mark if the Registrant is not required to file reports pursuant Section 13 or Section 15(d) of the Act. Yes ¨ No x
Indicate by check mark whether the Registrant (1) has filed all reports required to be filed by Section 13 or 15(d) of the Securities Exchange Act of 1934 during the preceding 12 months (or for such shorter period that the Registrant was required to file such reports), and (2) has been subject to such filing requirements for the past 90 days. Yes x No ¨
Indicate by check mark whether the registrant has submitted electronically and posted on its corporate Web site, if any, every Interactive Data File required to be submitted and posted pursuant to Rule 405 of Regulation S-T (§232.405 of this chapter) during the preceding 12 months (or for such shorter period that the registrant was required to submit and post such files). Yes ¨ No ¨
Indicate by check mark if disclosure of delinquent filers pursuant to Item 405 of Regulation S-K (§229.405 of this chapter) is not contained herein, and will not be contained, to the best of Registrant’s knowledge, in definitive proxy or information statements incorporated by reference in Part III of this Form 10-K, or any amendment to this Form 10-K. ¨
Indicate by check mark whether the Registrant is a large accelerated filer, an accelerated filer, a non-accelerated filer or a smaller reporting company. See the definitions of “large accelerated filer”, “accelerated filer” and “smaller reporting company” in Rule 12b-2 of the Exchange Act.
Large accelerated filer ¨ Accelerated filer x Non-accelerated filer ¨ Smaller reporting company ¨
Indicate by check mark whether the Registrant is a shell company (as defined in Rule 12b-2 of the Act). Yes ¨ No x
The aggregate market value of the voting and non-voting common equity held by non-affiliates, computed by reference to the last sales price ($13.07) as reported by the NASDAQ Global Select Market, as of the last business day of the Registrant’s most recently completed second fiscal quarter (September 25, 2009) was $306,124,952.
The number of shares outstanding of the Registrant’s Common Stock as of June 7, 2010 was 27,832,779 shares.
Documents Incorporated by Reference
The Registrant has incorporated into Part III of this Form 10-K, by reference, portions of its Proxy Statement for its 2010 Annual Meeting of Shareholders.
ELECTRO SCIENTIFIC INDUSTRIES, INC.
2010 FORM 10-K ANNUAL REPORT
TABLE OF CONTENTS
PART I
This annual report on Form 10-K contains forward-looking statements that are subject to risks and uncertainties. Actual results may differ materially from the forward-looking statements. Factors that could cause or contribute to such differences include, but are not limited to, those set forth under the caption “Factors That May Affect Future Results” included within Item 1A. Risk Factors.
Where You Can Find More Information
We file annual, quarterly and current reports, proxy statements and other information with the Securities and Exchange Commission (SEC) under the Securities Exchange Act of 1934 as amended (Exchange Act). You can inspect and copy our reports, proxy statements, and other information filed with the SEC at the SEC’s Public Reference Room at 450 Fifth Street, NW, Washington, D.C 20549. Please call the SEC at 1-800-SEC-0330 for further information on the Public Reference Room. The SEC maintains an Internet site atwww.sec.gov where you can obtain most of our SEC filings. We also make available, free of charge on our website atwww.esi.com, our annual report on Form 10-K, quarterly reports on Form 10-Q, current reports on Form 8-K, and amendments to those reports filed or furnished pursuant to Section 13(a) or 15(d) of the Exchange Act as soon as reasonably practicable after they are filed electronically with the SEC. The information found on our website is not part of this Form 10-K. You can also obtain copies of these reports by contacting Investor Relations at (503) 641-4141.
Fiscal Year
On July 3, 2007, our Board of Directors approved a change in the Company’s reporting period that results in a fiscal year consisting of 52 or 53 weeks ending on the Saturday nearest March 31. Accordingly, our fiscal 2010 reporting period consisted of a 53-week period ending on April 3, 2010, our fiscal 2009 reporting period consisted of a 52-week period ending on March 28, 2009 and our fiscal 2008 reporting period consisted of a 43-week period (approximately ten months) beginning June 3, 2007 and ending March 29, 2008. As discussed in Note 4 “Comparative Consolidated Statements of Operations (Unaudited)” to the Consolidated Financial Statements in Item 8 Financial Statements and Supplementary Data, for comparative purposes, we provided pro forma results for the twelve months ended March 29, 2008.
All references to years or quarters relate to fiscal years or fiscal quarters unless otherwise noted.
Business Overview
Electro Scientific Industries, Inc. and its subsidiaries (ESI) provide high-technology manufacturing equipment to the global semiconductor and micro-electronics markets, including advanced laser systems that are used to micro-engineer electronic device features in high-volume production environments. Our customers are primarily manufacturers of semiconductors, electronic interconnect devices, passive components, light-emitting diodes (LEDs), or other components used in a wide variety of end products in the computer, consumer electronics, communications and other industries. Our equipment enables these manufacturers to implement device features or achieve yield and productivity gains in their manufacturing processes that can be critical to their profitability. ESI was founded in 1944 and is headquartered in Portland, Oregon, with subsidiaries in the United States, Europe and Asia.
Our advanced laser micro-engineering systems allow semiconductor and micro-electronics manufacturers to physically alter select device features during high-volume production in order to heighten performance and boost production yields. Laser micro-engineering comprises a set of precise micron-level processes, including advanced micro-machining, wafer scribing and dicing, semiconductor memory-link cutting, semiconductor device trimming, material ablation and via drilling as well as nano-level structuring to alter material characteristics. These processes require application-specific laser systems able to meet our customers’ exacting
1
performance and productivity requirements. Our laser-based systems improve production yields or enable improved performance for semiconductor devices, high-density interconnect (HDI) circuits, flexible interconnect material, advanced semiconductor packaging, LEDs, flat panel liquid crystal displays (LCDs) and other components.
Additionally, we produce high-capacity test and optical inspection equipment that is critical to the quality control process during the production of multi-layer ceramic capacitors (MLCCs). Our equipment ensures that each MLCC meets both the electrical and physical tolerances required to perform properly.
Semiconductor and Micro-electronics Industry Overview
The semiconductor and micro-electronics markets continue to be driven by demand for advanced features and improved functionality for consumer items. The technologies for consumer-oriented electronics such as smart phones, computers, mobile computing devices, video games and high-definition televisions have developed rapidly as increasingly affordable products have been introduced that offer more functionality in smaller form. In addition, semiconductor technologies are being used in a broadening number of markets and applications, including automotive, energy, medical and security.
These dynamics in turn are driving the need for faster, smaller, more complex, less expensive and higher-quality electronic devices and circuits. To achieve these performance, size and cost improvements, semiconductor and other device manufacturers are increasing the circuit densities in these devices. Manufacturers of cellular telephones, for example, must miniaturize the circuits to accommodate added functionalities within the size limitations of their finished products. In addition, analog-to-digital and hybrid circuits must be tuned to operate within precise specifications, enabling greater performance and functionality.
Smaller and lighter semiconductor devices also drive the need to shrink the physical dimensions of the semiconductor packaging and the HDI circuit board on which it is mounted. Higher operating speeds of computers and communications products require more input and output channels within these packages and between the packages and the HDI circuit board. These trends require more accurate and smaller vias to create connections between layers and interconnecting devices.
In addition, the highly competitive consumer markets for electronic products drive demand for lower-cost semiconductor devices and components. Semiconductor devices are produced in large unit volumes and their production and testing is highly automated. Manufacturers continually seek to reduce costs by improving throughput, yield and quality. These manufacturers are also utilizing new materials to improve performance and reduce power consumption. Semiconductor equipment suppliers are challenged to continually innovate manufacturing process solutions and equipment.
For example, dynamic random access memory (DRAM) producers are continuing to shrink the size of individual memory devices on a wafer in order to improve profitability. As the industry moves from the 50 nanometer technology node down to 40 nanometers and below, the number of memory devices per 300mm wafer can increase as much as 50 percent. To improve production yield, device manufacturers utilize advanced systems such as our new dual-beam Tailored Pulse laser memory repair products.
As semiconductor manufacturers move toward higher densities and more complex architectures, machine vision has emerged as a critical technology. Machine vision allows manufacturers to achieve increased equipment speed with fewer errors. This technology is integral to many applications and is utilized extensively for alignment and inspection within our systems.
As consumer devices become smaller and more complex, more capacitance is required to be designed into the circuit. This has resulted in a significant increase in the use of smaller, higher-capacitance passive
2
components such as MLCCs. In 2009, estimated production of MLCCs was nearly 2 trillion units. These MLCCs must be tested electrically and optically to characterize performance and ensure reliability. Automated equipment to test these MLCCs in the manufacturing environment, like our high capacitance tester, can test and sort up to 750,000 parts per hour.
Variations of these advanced semiconductor technologies and manufacturing processes are increasingly being employed in the production of other types of devices and components, including LEDs. For example, automated, laser-based systems, like our Accuscribe 2100 series, are used to scribe the sapphire wafer to separate individual devices in the production of LEDs. LEDs are increasingly utilized in electronics, display, automotive, and general lighting applications.
A growing portion of our business is derived from specialized micro-engineering applications. Any material that can be cut, drilled, etched, or otherwise surface treated using a mechanical process can be micro-machined with greater precision and accuracy using a laser-based solution. As the form factors of consumer electronics and other products or devices become more compact, mechanical processes will not be able to meet the stringent specifications demanded by producers. We believe the capabilities of laser-based solutions for micro-engineering will enable our customers to move beyond the limitations of mechanical processes and generate significant growth for us in the future.
Our Solutions
We believe our products address the needs of semiconductor and micro-electronics manufacturers by providing them with a high return on their investment due to measurable production benefits such as improved yield, increased throughput, higher performance, continued miniaturization and greater reliability. We typically design our production systems to be upgraded, enabling them to accommodate the next generation of technology and giving customers the flexibility to add capacity or improve product performance at a reasonable incremental cost.
Our core competencies enable us to design, manufacture, and market a variety of laser-based, integrated solutions for micro-engineering applications in high-volume manufacturing environments. These core competencies include a deep understanding of laser/material interaction, laser beam positioning, optics and illumination including image processing and optical character recognition, high-speed motion control, small parts handling, and systems engineering. We combine this technology expertise with a thorough understanding of our customers’ processes and objectives to develop integrated solutions and products addressing multiple markets and applications.
Our customers manufacture semiconductors, passive components, interconnect/packaging devices, components or other parts, which, in turn, serve a wide range of electronic applications. Our systems contribute in the manufacturing of these components and devices. The largest end-market applications for our customers are consumer electronics, computers and mobile devices.
Our Strategy
Our strategy is to leverage our core competencies to be a market leader across multiple new and existing markets and applications. These core competencies, combined with an understanding of our customers’ processes and the use of common platforms, enable us to address a broad range of micro-engineering applications and end markets. We intend to focus our efforts on businesses and applications where our differentiated capability enables us to be a market leader. The elements of our strategy are to gain share in our established markets and expand our addressable markets by entering adjacent applications within existing markets or extending existing applications or technologies into adjacent markets. We will continue to invest in research and development to maintain our market leadership and increase the value of our products to global customers.
3
Gain share in existing markets
We intend to leverage our core competencies and existing technologies to grow our overall market position serving manufacturers in semiconductor, advanced semiconductor packaging, flexible circuits, LED, LCD panel and passive components industries—all markets in which we currently maintain a leadership position. We intend to maintain and grow our leadership position by developing new products that have higher performance, throughput and reliability, thereby lowering the effective cost of ownership to our customers.
Expand our addressable markets
We plan to leverage our core competencies, customer collaboration, solutions expertise and common platforms to expand our addressable markets by entering into adjacent applications such as scribing, dicing, advanced micro-machining and optical inspection of different types of materials and devices within our existing markets. In addition, we believe there are opportunities to extend these same types of applications to enable better performance or yield improvement of devices or components used in adjacent end markets such as energy, medical, industrial and security. We intend to expand our addressable markets through both internal and external business development.
Invest in research and development to maintain our technological leadership
We intend to further develop our technological leadership by maintaining a significant level of investment in research and development. Our key technological capabilities include laser/material interaction, laser beam positioning, optics and illumination including image processing and optical character recognition, high-speed motion control systems, small parts handling systems, and systems integration. We consider our continuing ability to develop intellectual property to be an important component of our future success.
Increase the value of our products to global customers
We are focused on improving our customers’ yield, throughput and productivity by utilizing our technology, global infrastructure, customer service and ability to integrate multiple technologies. We work with our market-leading customers through high-level, multi-disciplinary management and employee teams to define and produce the next generation of manufacturing systems. This requires confidential interaction between the customer and ESI, sharing technology and product roadmaps often looking out over a three- to five-year period. Embracing the industry trend toward globalization has enabled us to elevate our presence in key world markets, particularly in the Asia-Pacific market.
Our Products
We operate within one segment, high-technology manufacturing equipment, which is comprised of products grouped according to our three key target markets: semiconductors, passive components and interconnect/micro-machining.
Semiconductor Group (SG)
Semiconductor Memory Yield Improvement Systems
Our semiconductor memory yield improvement product line is designed to cost-effectively meet the production challenges faced by semiconductor manufacturers, including shrinking circuit sizes, material changes and increasing numbers of memory devices per wafer. As circuit densities in semiconductor memory devices such as DRAM have increased, manufacturers have built redundant cells into their memory designs and connected them with small electrical links on the device surface. During the manufacturing process, wafers with millions of individual memory cells are tested to identify defective cells. Our laser systems are then used to cut links that reprogram the device by disconnecting the paths to defective portions of the memory device and replacing them with functional redundant cells. This process enables significant post-repair yield improvements that are essential to our customers’ profitability.
4
Our semiconductor memory yield equipment is primarily used in the manufacture of DRAM memory devices.
Our 98XX series systems are designed specifically for the 300mm wafer processing market, but can also handle 200mm wafers. Our systems can be configured for multiple wavelengths including ultraviolet (UV), green and infrared. With the introduction of our 9850 Tailored Pulse system, we offer unmatched flexibility in processing complex, next generation fuse designs and materials. In addition, our dual beam architecture provides significant throughput advantages compared to a single beam repair tool. These high-performance systems deliver increased manufacturing productivity, while minimizing capital requirements.
Thin Film Trimming
Our Model 2100 thin-film-on-silicon trimming system enables manufacturers to improve the precision of the components they produce by trimming performance parameters to specific values for precision analog devices. It employs a unique prober-independent architecture and patented 1.3-micron wavelength process to deliver superior throughput and yield.
LED Wafer Scribing
Our Accuscribe line of sapphire wafer scribing tools is a key component in the manufacture of high-brightness blue LEDs. During production, these LEDs are created on a thin wafer of synthetic sapphire crystal that must be broken into individual units at the end of the process. The brittle nature of the sapphire wafer requires that it be carefully cut in order to prevent unwanted fractures and yield losses when the wafer is broken apart into discrete LEDs. The Accuscribe system uses a laser to scribe the wafer with a precise groove between individual LEDs. When mechanical force is applied to the wafer, it fractures along these grooves and allows the wafer to be split apart into discrete LEDs which results in higher production yields.
LCD Repair
Our laser LCD repair systems are critical to improving yields in the manufacture of flat panel displays. For example, during production, individual pixels of a display may develop electrical defects that result in no light emission or the emission of only a steady white light. To correct these defects, flat panel display producers employ a laser repair process to isolate the electrical defects during production by cutting the inputs to the pixel. Our laser systems are primarily sold to the manufacturers of LCD repair tools as a key component of their products.
Interconnect/Micro-machining Group (IMG)
Interconnect Via Drilling
For electrical interconnect applications, our laser microvia engineering systems are targeted at applications that require the highest accuracy and smallest via (hole) dimensions to create electrical connections between layers in high-density circuit boards, flexible circuits and IC packages. Our microvia drilling technology addresses the rapidly changing applications in IC packages, multichip modules and HDI circuit boards. Our UV laser processing systems employ state-of-the-art technology in lasers, optics and motion control. Our products include single-beam and multi-beam systems that produce very high-quality vias with the best-in-class placement accuracy for improved yield of packages and substrates.
Advanced Micro-Machining
In addition, our tools can be configured with a variety of lasers and material handling devices that make them ideal for other advanced laser-based micro-machining applications. As technologies enable shrinking sizes and the form factors of consumer electronics and other devices become more compact, mechanical processes are
5
not able to meet the stringent specifications demanded by producers. We offer several platforms that enable customers to perform precision drilling, scribing, etching, routing or nano-structuring in many different types of materials and devices including glass, metal, plastic, paint and ceramics. The processed material or device is used in many different end markets including microelectronics, computer, medical, energy, and display markets. Our recently introduced ML5900 is a particularly versatile platform optimized for industrial production and includes integrated inspection and a rotary stage for parallel processing of devices. In addition, during fiscal 2010 we acquired the intellectual property of Applied Photonics, Inc., adding additional capability for high-speed, single-pass, non-contact, non-debris glass cutting for LCD and hand-held applications. We also offer laser tools which ablate material for identification and analysis applications including forensics, mineral analysis and research. We believe the capabilities of laser-based solutions for micro-machining will enable our customers to move beyond the limitations of mechanical processes and generate significant growth for us in the future.
Passive Components Group (PCG)
We design and manufacture products that combine high-speed small parts handling technology with real-time control systems to provide highly automated, cost-effective solutions for manufacturers of MLCCs and other passive components such as capacitor arrays, inductors, resistors, varistors and hybrid circuits. These components, produced in quantities of trillions of units per year, process analog, digital and high-frequency signals in nearly all electronic products.
We provide several types of products and solutions in this market. Our MLCC test systems employ high-speed handling and positioning techniques to precisely load, test and sort MLCCs based on their electrical energy storage capacity, or capacitance, and their electrical energy leakage, or dissipation factor. Our 35XX series is the most productive tester in the market today and continues to gain acceptance with major MLCC manufacturers which have traditionally developed and used their own in-house systems. We also offer termination systems which apply a conductive material to the ends of ceramic capacitors permitting connection of the device in a circuit on a high-density printed wiring board. Our optical inspection systems perform six-sided automated inspection of MLCCs and arrays for dimensional criteria and defects. Circuit fine-tuning systems are application-specific laser systems that adjust the electrical performance of a hybrid circuit, or that adjust an electronic assembly containing many circuits, by removing a precise amount of material from one or more circuit components. Finally, we produce consumable products such as carrier plates and termination belts, both of which are used to hold MLCCs during the manufacturing process.
Customers
Our top ten customers for fiscal 2010, 2009 and 2008 accounted for approximately 56%, 50% and 59% of total net sales, respectively. One customer, Apple, Inc. and its affiliates, accounted for approximately 30% and 21% of total net sales in fiscal 2010 and 2009, respectively. Two customers, Samsung and Hynix, together accounted for approximately 23% of net sales in fiscal 2008. No other customer individually accounted for more than 10% of total net sales in fiscal 2010, 2009 or 2008.
See Note 23 “Product and Geographical Information” to the Consolidated Financial Statements in Item 8 Financial Statements and Supplementary Data for our net sales by geographic area.
Sales, Marketing and Service
We sell our products worldwide through direct sales and service offices, value-added resellers and independent representatives located around the world. ESI has direct sales and service personnel in Oregon, California, and several other states; Japan, Korea, Taiwan, Singapore and China in Asia; and the United Kingdom, Germany and France in Europe. We serve selected customers in the United States, South America, Europe, Israel and additional countries through manufacturers’ representatives.
6
We have a substantial base of installed products in use by leading worldwide semiconductor and micro-electronics manufacturers. We emphasize strong working relationships with these customers to meet their needs for additional systems and to facilitate the successful development and sale of new products to these customers.
We generally employ service personnel wherever we have a significant installed base. We offer a variety of warranty, maintenance and parts replacement programs to service the requirements of a high-volume manufacturing environment.
Backlog
Backlog consists of purchase orders for products and spare parts that we expect to ship within 12 months and service contracts for performance generally within 24 months. Backlog does not include deferred revenue. Backlog was $40.6 million at April 3, 2010 compared to $16.8 million at March 28, 2009, representing an increase of 142% driven by higher demand. The stated backlog is not necessarily indicative of sales for any future period, whether as a result of order cancellations or deferrals, shipping or acceptance delays, or otherwise, nor does backlog represent any assurance that we will realize a profit from filling the orders.
Research, Development and Technology
We believe that our ability to compete effectively depends, in part, on our ability to maintain and expand our expertise in core technologies and product applications. The primary emphasis of our research and development is to advance our capabilities in:
| | • | | lasers and laser/material interaction; |
| | • | | high-speed, micron-level motion control systems; |
| | • | | image processing and optical character recognition; |
| | • | | high-speed, small parts handling; |
| | • | | real-time production-line electronic measurement; |
| | • | | real-time operating systems; and |
Our research and development expenditures for fiscal 2010, 2009, and 2008 (ten months) were $33.6 million (22.6% of net sales), $38.2 million (24.3% of net sales) and $36.1 million (14.6% of net sales), respectively.
Competition
Our markets are dynamic, cyclical and highly competitive. The principal competitive factors in our markets are product performance, ease of use, cost of ownership, reliability, service, technical support, a product improvement path, price, established relationships with customers, product familiarity and proprietary technology. We believe that our products compete favorably with respect to these factors. Some of our competitors have greater financial, engineering and manufacturing resources and larger distribution networks than we do. Some of our customers develop, or have the ability to develop, manufacturing equipment similar to our products. Competition in our markets may intensify and our technological advantages may be reduced or lost as a result of technological advances by competitors or customers or changes in electronic device processing technology.
7
The principal competitor for our semiconductor group is GSI Group Inc. Competitors for LED scribing include Disco Corporation, JP Sercel Associates, Inc. and Laser Solutions, Inc. LCD repair competitors include Big Sky Laser Technologies, Inc. and Hoya Corporation. For the passive components group, our competitors include Daiichi Jitsugyo Viswill Co., Ltd., GSI Group, Inc., Humo Laboratory, Ltd. and Tokyo Weld Co., Ltd. as well as component manufacturers that develop systems for internal use. Our interconnect/micro-machining group competes with laser systems provided by Hitachi Via Mechanics Ltd., LPKF Laser & Electronics AG, Mitsubishi Electric Corporation and several local Chinese and Korean competitors.
Manufacturing and Supply
Our production facilities are located in Portland, Oregon; Klamath Falls, Oregon; Fremont, California and Singapore. The Fremont facility manufactures products for our New Wave Research (NWR) division and the Klamath Falls facility manufactures PCG consumable products. The Singapore facility performs assembly of our IMG and PCG systems. Manufacturing operations located in Portland consist of electronic subassembly and final system assembly for all of our other products. As we move forward with efforts to streamline the organization and improve efficiencies, we expect a growing percentage of final systems will be shipped from Singapore.
We use qualified manufacturers to supply many components and sub-system modules for our products. Our systems use high-performance computers, peripherals, lasers and other components from various suppliers. Some of the components we use are obtained from a single source or a limited group of suppliers. An interruption in the supply of a particular component would have a temporary adverse impact on us. We believe our relationships with our suppliers are good.
Patents and Other Intellectual Property
We have a policy of seeking patents, when appropriate, on inventions relating to new products and improvements that are discovered or developed as part of our ongoing research, development and manufacturing activities. We own 148 United States patents and 347 patents issued outside of the United States as of April 3, 2010. Additionally, as of April 3, 2010, we had 158 patent applications pending in the United States and 477 patent applications pending outside of the United States. Although our patents are important, we believe that the success of our business also depends on the technical competence and innovation of our employees.
We rely on copyright protection for our proprietary software. We also rely upon trade secret protection for our confidential and proprietary information. Others may independently develop substantially equivalent proprietary information and techniques, and we may be unable to meaningfully protect our trade secrets.
Employees
As of April 3, 2010, we employed 581 people. Many of our employees are highly skilled, and our success will depend in part upon our ability to attract and retain such employees, who are in great demand. We have never had a work stoppage or strike, and no employees are represented by a labor union or covered by a collective bargaining agreement. We consider our employee relations to be good.
Environmental Compliance
During calendar 2010, we achieved ISO 14001 certification for our environmental management system for our Portland, Oregon and Fremont, California operations. We do not expect compliance with international, federal, state and local provisions which have been enacted or adopted related to the discharge of materials into the environment, or otherwise relating to protection of the environment, to have a material effect on our capital expenditures, earnings or competitive position.
8
The statements contained in this report that are not statements of historical fact, including without limitation statements containing the words “believes,” “expects” and similar words, constitute forward-looking statements that are subject to a number of risks and uncertainties. From time to time, we may make other forward-looking statements. Investors are cautioned that such forward-looking statements are subject to an inherent risk that actual results may differ materially. The following information highlights some of the factors that could cause actual results to differ materially from the results expressed or implied by our forward-looking statements. Forward-looking statements should be considered in light of these factors. Factors that may result in such variances include, but are not limited to, the following:
The industries we serve are volatile and unpredictable.
Our business is dependent upon the capital expenditures of manufacturers of semiconductors and micro-electronics used in wireless communications, computers and other electronic products. The capital equipment market for semiconductor and micro-electronics manufacturers has historically been characterized by sudden and severe cyclical variations in product supply and demand due to a number of factors including capacity utilization, demand for customers’ products, inventory levels relative to demand, and access to affordable capital. The timing, severity and duration of these market cycles are difficult or impossible to predict. Significant downturns in the market for semiconductor and micro-electronics used in electronic devices reduce demand for our products and may materially and adversely affect our business, financial condition and operating results.
For example, the recent economic slowdown resulted in a decrease in orders for all of our product groups for each quarter throughout 2009, with virtually no orders for our memory repair systems throughout 2010. Additionally, some of our customers’ ability to access credit was adversely affected, limiting their ability to purchase our products. The degree of the impact on our business of the current economic environment will continue to depend on a number of factors, including the strength and continuity of the recovery in the US economy, the global economy in general, access to capital and stability of the financial system, and overall health of the semiconductor and micro-electronics industries. This impact may cause potential material adverse changes to our financial and operational results.
To meet rapidly changing demand in the industries we serve, we must effectively manage our resources and production capacity. During periods of decreasing demand for our products, we must be able to appropriately align our cost structure with prevailing market conditions and effectively manage our supply chain. Our ability to rapidly and effectively reduce our cost structure in response to such downturns is limited by the fixed nature of many of our expenses in the near term and by our need to continue our investment in next-generation product technology and to support and service our products. Conversely, when upturns in this market occur, we may have difficulty rapidly and effectively increasing our manufacturing capacity or procuring sufficient materials to meet sudden increases in customer demand, which could result in the loss of business to our competitors and harm to our relationships with our customers. If we are not able to timely and appropriately adapt to changes in our business environment, our business, financial condition or results of operations may be materially and adversely affected.
The markets in which we operate are highly competitive.
We face substantial competition from established competitors throughout the world, some of which have greater financial, engineering, manufacturing and marketing resources than we do. Those competitors with greater resources may, in addition to other things, be able to better withstand periodic downturns, compete more effectively on the basis of price and technology, or more quickly develop enhancements to, and new generations of, products that compete with the products we manufacture and market. New companies may enter the markets in which we compete, or industry consolidation may occur, further increasing competition in those markets. Furthermore, our technological advantages may be reduced or lost as a result of technological advances by our competitors.
9
Moreover, our business, financial condition or results of operations may be materially and adversely affected by competitive pressure and intense price-based competition. We have experienced and continue to experience significant price competition in the sale of our products. In addition, pricing pressures typically have become more intense during cyclical downturns when competitors seek to maintain or increase market share, reduce inventory or introduce more technologically advanced products. We believe that to be competitive we must continue to expend significant financial resources in order to, among other things, invest in new product development and enhancements. We may not be able to compete successfully in the future and increased competition may result in price reductions, reduced profit margins and loss of market share.
Our operating results may fluctuate significantly from period to period, which could negatively impact our business.
Our revenues, operating margins and other operating results could fluctuate significantly from quarter to quarter depending upon a variety of factors, including:
| | • | | demand for our products as a result of the cyclical nature of the semiconductor and micro-electronics manufacturing industries and the markets upon which they depend or otherwise; |
| | • | | changes in the timing and terms of product orders by our customers as a result of our customer concentration or otherwise; |
| | • | | changes in the mix of products and services that we offer; |
| | • | | timing and market acceptance of our new product introductions; |
| | • | | delays or problems in the planned introduction of new products, or in the performance of any such products following delivery to customers; |
| | • | | our competitors’ announcements of new products, services or technological innovations, which can, among other things, render our products less competitive due to the rapid technological change in our industry; |
| | • | | the timing and related costs of any acquisitions, divestitures or other strategic transactions; |
| | • | | our ability to reduce our costs in response to decreased demand for our products and services; |
| | • | | disruptions in our manufacturing process or in the supply of components to us; |
| | • | | write-offs for excess or obsolete inventory; and |
| | • | | competitive pricing pressures. |
These risks may be exacerbated by the fact that we derive a substantial portion of our revenue from the sale of a relatively small numbers of products. As a result of these risks, we believe that quarter to quarter comparisons of our revenue and operating results may not be meaningful, and that these comparisons may not be an accurate indicator of our future performance.
Our markets are subject to rapid technological change, and to compete effectively, we must continually introduce new products that achieve market acceptance.
The markets for our products are characterized by rapid technological change and innovation, frequent new product introductions, changes in customer requirements and evolving industry standards. Our future performance will depend on the successful development, introduction and market acceptance of new and enhanced products that address technological changes and the requirements of current and potential customers. The development of new, technologically advanced products is a complex and uncertain process, requiring high levels of innovation and highly skilled engineering and development personnel, as well as the accurate anticipation of technological and market trends. We cannot assure you that we will be able to identify, develop, manufacture, market or support new or enhanced products successfully, if at all, or on a timely basis. The introduction by us or by our competitors of
10
new or enhanced products, or alternative technologies, may cause our customers to defer, change or cancel orders for our existing products or cease purchasing our products altogether. For example, for many years the semi-conductor memory industry has employed alternative redundancy technologies. The adoption by our customers of electrical redundancy technology could have a material adverse effect on demand for our SG products. Further, we cannot assure that our new products will gain market acceptance or that we will be able to respond effectively to product announcements by competitors, technology changes or emerging industry standards. If we are unable to develop new or enhanced products to address product or technology changes or new industry standards on a timely basis or at all, or if our new or enhanced products are not accepted by the market, our business, results of operations and financial condition may be adversely affected.
We depend on a few significant customers, none of which are bound by long-term contracts, for a large portion of our revenues.
We depend on a few significant customers for a large portion of our revenues. In fiscal 2010, our top ten customers accounted for approximately 56% of total net sales, with one customer accounting for approximately 30% of total net sales. We anticipate that sales of our products to a relatively small number of customers will continue to account for a significant portion of our revenues. Consolidation between customers, changes in various partnership and technology arrangements between customers, customer bankruptcies or customer departures from their respective industries all may result in even fewer customers accounting for a high percentage of our revenue. For example, in early calendar 2009 Qimonda AG, historically one of our top European customers, went bankrupt.
None of our customers have any long-term obligation to continue to buy our products or services. As a result, our customers may delay, reduce or cease ordering our products or services at any time. Cancellations, reductions or deferrals could result from a number of factors, including a prolonged or additional downturn in the semiconductor or micro-electronics industries, manufacturing delays, completion of new product manufacturing ramp-up by customers, quality or reliability issues with our products, the development and introduction of new products and technologies by our competitors, or interruptions to our customers’ operations due to fire, natural disasters or other events. In particular, the markets we serve are subject to significant and unpredictable volatility, and downturns in those markets reduce demand for our products. In the future, the cancellation, reduction or deferral of purchases of our products by even a single customer could significantly reduce our revenues in any particular quarter. If we were to lose any of our significant customers or suffer a material reduction in their purchase orders, revenue could decline and our business, financial condition and results of operations could be materially and adversely affected.
The failure of critical suppliers to deliver sufficient product quantities in a timely and cost-effective manner could negatively affect our business.
We use a wide range of materials from numerous suppliers in the manufacture of our products, including custom electronic, laser and mechanical components. We generally do not have guaranteed supply arrangements with our suppliers. We seek to reduce the risk of production and service interruptions and shortages of key parts by selecting and qualifying alternative suppliers for key parts, monitoring the financial stability of key suppliers and maintaining appropriate inventories of key parts. Although we make reasonable efforts to ensure that parts are available from multiple suppliers, some key parts are available only from a single supplier or a limited group of suppliers in the short term. In addition, some of the lasers we use in our products are difficult to manufacture, and as a result we may not receive an adequate supply of lasers in a timely fashion to fill orders. Operations at our suppliers’ facilities are subject to disruption or discontinuation for a variety of reasons, including changes in business relationships, competitive factors, financial difficulties, work stoppages, fire, natural disasters or other causes. Any such disruption or discontinuation to our suppliers’ operations could interrupt or reduce our manufacturing activities and delay delivery of our products, any or all of which could materially and adversely affect our results of operations. In addition, as markets recover, there is a heightened risk that one or more of our suppliers may not be able to meet increased demand requirements, adversely impacting our ability to fulfill orders and win business with our customers.
11
The failure of our contract manufacturers to timely perform could negatively affect our business.
We have arrangements with contract manufacturers to complete the manufacture of certain of our products or product subcomponents. Any significant interruption in our contract manufacturers’ ability to provide manufacturing services to us as a result of contractual disputes with us or another party, labor disruptions, financial difficulties, natural disasters, delay or interruption in the receipt of inventory or other causes could result in reduced manufacturing capabilities or delayed deliveries for certain of our products, any or all of which could materially and adversely affect our results of operations.
We may recognize charges for excess or obsolete inventory if our demand projections are incorrect or our technology strategy changes.
Our business is highly competitive and one factor on which we compete is the ability to ship products on schedules required by customers. In order to facilitate timely shipping, management forecasts demand, both in type and amount of products, and these forecasts are used to determine inventory to be purchased. We also order materials based on our technology roadmap, which represents management’s assessment of technology that will be utilized in new products that we develop. Certain types of inventory, including lasers and optical equipment, are particularly expensive and may only be used in the production of a single type of product. If actual demand is lower than forecast with respect to the type or amount of products actually ordered, or both, our inventory levels may increase. For example, at April 3, 2010, we had $72.1 million of inventory reflected on our Consolidated Balance Sheet, much of which we purchased or committed to purchase prior to the time the severity of the recent economic downturn became apparent. As a result, there is a risk that we may have to incur material accounting charges for excess and obsolete inventory if inventory cannot be used, which would negatively affect our financial results. Also, if we alter our technology or product development strategy, we may have inventory which may not be usable under the new strategy, which may also result in material accounting charges. For example, during fiscal 2009, we wrote-off $4.1 million of material from a research, development and engineering program due to a change in our product development strategy.
We may not be able to protect the proprietary rights upon which our business depends.
Our success depends significantly upon the protection of our proprietary rights. We attempt to protect our proprietary rights through patents, copyrights, trademarks, maintenance of trade secrets and other measures, including entering into confidentiality agreements. We incur substantial costs to obtain and maintain patents and to defend our intellectual property rights. For example, we initiated litigation against All Ring Tech Co., Ltd. in Taiwan in August 2005 alleging that certain of our patent rights had been violated. We rely upon the laws of the United States and foreign countries where we develop, manufacture or sell our products to protect our proprietary rights. We may not be successful in protecting these proprietary rights, these rights may not provide the competitive advantages that we expect, or other parties may challenge, invalidate or circumvent these rights.
Further, our efforts to protect our intellectual property may be less effective in some foreign countries where intellectual property rights are not as well protected as in the United States. Many United States companies have encountered substantial problems in protecting their proprietary rights against infringement in foreign countries. If we fail to adequately protect our intellectual property in these countries, it could be easier for our competitors to sell competing products in foreign countries, which could result in reduced sales and gross margins.
We may be subject to claims of intellectual property infringement.
Several of our competitors hold patents covering a variety of technologies, applications and methods of use similar to some of those used in our products. While we attempt in our designs to avoid patent infringement, from time to time we and our customers have received correspondence from our competitors claiming that some of our products, as used by our customers, may be infringing one or more of these patents. Competitors or others have in the past and may in the future assert infringement claims against our customers or us with respect to current or future products or uses, and these assertions may result in costly litigation or require us to obtain a
12
license to use intellectual property rights of others. If claims of infringement are asserted against our customers, those customers may seek indemnification from us for damages or expenses they incur.
If we become subject to infringement claims, we will evaluate our position and consider the available alternatives, which may include seeking licenses to use the technology in question or defending our position. These licenses, however, may not be available on satisfactory terms or at all. If we are not able to negotiate the necessary licenses on commercially reasonable terms or successfully defend our position, our financial condition and results of operations could be materially and adversely affected.
Our ability to reduce costs is limited by our need to invest in research and development.
Our industry is characterized by the need for continued investment in research and development. Because of intense competition in the industries in which we compete, if we were to fail to invest sufficiently in research and development, our products could become less attractive to our current and potential customers or obsolete, and our business and financial condition could be materially and adversely affected. As a result of our need to maintain our spending levels in this area, our operating results could be materially harmed if our net sales decline. In addition, as a result of our emphasis on research and development and technological innovation, our operating costs may increase in the future, and research and development expenses may increase as a percentage of total operating expenses and as a percentage of net sales.
We may make acquisitions in the future, which may be difficult to integrate, disrupt our business, dilute shareholder value or divert management attention.
We may make acquisitions of, or significant investments in, other businesses with complementary products, services or technologies. Acquisitions involve numerous risks, many of which are unpredictable and beyond our control, including:
| | • | | difficulties and increased costs in connection with integration of the personnel, operations, technologies and products of the merged businesses; |
| | • | | implementation of our enterprise resource planning (ERP) system into the acquired company’s operations; |
| | • | | diversion of management’s attention from other operational matters; |
| | • | | the potential loss of key employees of the acquired company; |
| | • | | lack of synergy or inability to realize expected synergies resulting from the acquisition; |
| | • | | acquired assets becoming impaired as a result of technological advancements or worse-than-expected performance by the acquired company; |
| | • | | difficulties establishing satisfactory internal controls at the acquired company; |
| | • | | risks and uncertainties relating to the performance of the combined company following the transaction; and |
| | • | | incurring unanticipated liabilities for which we will not be indemnified. |
Furthermore, the accounting for an acquisition could result in significant charges resulting from amortization of intangible assets we acquire. Our inability to effectively manage these risks could result in our inability to realize the anticipated benefits of an acquisition on a timely basis, or at all, and materially and adversely affect our business, financial condition and results of operations. In addition, all future acquisition transaction costs must be expensed as incurred rather than capitalized, which may have a material adverse effect on our results of operations.
13
The means by which we finance an acquisition may also significantly affect our business or the value of the shares of our common stock. If we issue common stock to pay for an acquisition, the ownership percentage of our existing shareholders will be reduced and the value of the shares held by our existing shareholders could be diluted. If we use cash on hand to pay for an acquisition, the payment could significantly reduce the cash that would be available to fund our operations or to use for other purposes. If we borrow funds in connection with an acquisition, we would be required to use cash to service the debt and to comply with financial and other covenants.
We may from time to time also make strategic investments in development stage companies. Investments in development stage companies are subject to a high degree of risk. We cannot assure you that we will not lose all or a portion of our investment in any such company.
We are implementing our globalization strategy, and if we do not effectively devise and implement an effective globalization plan or if we decide to change our strategy, our operating results could be negatively impacted.
We are implementing our globalization strategy in which we are moving certain operational resources and capabilities to different countries in Asia to reduce costs and to be closer to our customers. We believe this implementation will reduce our manufacturing costs for certain products, enhance customer relationships and improve our responsiveness. We are currently implementing the first major phase of this strategy, having opened a larger manufacturing facility in Singapore in the fourth quarter of fiscal 2010 for certain IMG and PCG products.
Our globalization strategy is subject to a variety of complexities and risks, many of which we have little experience managing, and which may divert a substantial amount of management’s time. These risks include:
| | • | | challenges in designing new facilities that can be scaled for future expansion, replicating current processes and bringing new facilities up to full operation; |
| | • | | unpredictable costs, redundancy costs and cost overruns for developing new facilities and acquiring equipment; |
| | • | | building local management teams, technical personnel and other staff for functions that we have not previously conducted outside of the United States; |
| | • | | technical obstacles such as poor production or process yield and loss of quality control during the ramp of a new facility; |
| | • | | requalifications and other procedures that may be required by our customers; |
| | • | | our ability to bring up local suppliers to meet our quality and cycle-time needs; |
| | • | | rapidly changing business conditions that may require plans to be changed or abandoned before they are fully implemented; and |
| | • | | challenges posed by distance and by differences in language and culture. |
These and other factors could delay the development and implementation of our strategy, as well as impair our gross margins, delay shipments and deliveries, cause us to lose sales, require us to write off investments already made, damage our reputation and harm our business, financial condition and operating results. If we decide to change our current global regionalization strategy, we may incur charges for certain costs incurred.
We are exposed to the risks of operating a global business, including risks associated with exchange rate fluctuations, legal and regulatory changes and the impact of regional and global economic disruptions.
International shipments accounted for 90% of net sales in 2010, with 83% of our net sales to customers in Asia. We expect that international shipments will continue to represent a significant percentage of net sales in the future. We also have significant foreign operations, including a Singapore manufacturing facility, research and
14
development facilities in Taiwan and China, and sales and service offices in various countries. Under our globalization strategy, we intend to increase our foreign operations in the future. Our non-U.S. sales, purchases and operations are subject to risks inherent in conducting business abroad, many of which are outside our control, including the following:
| | • | | periodic local or geographic economic downturns and unstable political conditions; |
| | • | | price and currency exchange controls; |
| | • | | fluctuation in the relative values of currencies; |
| | • | | difficulties protecting intellectual property; |
| | • | | compliance with labor laws and other laws governing employees; |
| | • | | shipping delays and disruptions; |
| | • | | increases in shipping costs, caused by increased fuel costs or otherwise, which we may not be able to pass on to our customers; |
| | • | | unexpected changes in trading policies, regulatory requirements, tariffs and other barriers; and |
| | • | | difficulties in managing a global enterprise, including staffing, collecting accounts receivable, managing suppliers, distributors and representatives, and repatriating earnings. |
Our business and operating results could also be impacted, directly or indirectly, by natural disasters, outbreaks of infectious disease, military action, international conflicts, terrorist activities, civil unrest and associated political instability. Any such events or circumstances may result in heightened security concerns with respect to domestic and international travel and commerce, which may further affect our business and operating results. In particular, due to these uncertainties, we are subject to the following additional risks:
| | • | | future tightening of immigration controls may adversely affect the residence status of non-U.S. engineers and other key technical employees in our U.S. facilities or our ability to hire new non-U.S. employees in such facilities; |
| | • | | more frequent instances of shipping delays; |
| | • | | demand for our products may not increase or may decrease; and |
| | • | | our customers or suppliers may experience financial difficulties or cease operations. |
Unfavorable currency exchange rate fluctuations may lead to lower operating margins or may cause us to raise prices.
Currency exchange rate fluctuations could have an adverse effect on our sales and results of operations and we could experience losses with respect to forward exchange contracts into which we may enter. Unfavorable currency fluctuations could require us to increase prices to foreign customers, which could result in lower net sales by us to such customers. Alternatively, if we do not adjust the prices for our products in response to unfavorable currency fluctuations, our results of operations could be materially and adversely affected. In addition, many of our foreign sales are denominated in the currency of the country in which these products are sold and the currency we receive in payment for such sales could be less valuable at the time of receipt as a result of exchange rate fluctuations. From time to time, we enter into forward exchange contracts to hedge the value of accounts receivable primarily denominated in Japanese yen and other currencies. However, we cannot be certain that our efforts will be adequate to protect us against significant currency fluctuations or that such efforts will not expose us to additional exchange rate risks, which could adversely affect our results of operations.
15
Our effective tax rate is subject to fluctuation and we may have exposure to additional tax liabilities.
As a global company, we are subject to taxation in the United States and numerous foreign jurisdictions. Our effective tax rate is subject to fluctuation from one period to the next because the income tax rates for each year are a function of many factors, including: (a) taxable income levels and the effects of a mix of profits (losses) earned by ESI and our subsidiaries in numerous tax jurisdictions with a broad range of income tax rates, (b) our ability to utilize deferred tax assets, (c) taxes, refunds, interest or penalties resulting from tax audits, (d) the magnitude of various credits and deductions as a percentage of total taxable income and (e) changes in tax laws or the interpretation of such tax laws. Changes in the mix of these items may cause our effective tax rate to fluctuate between periods, which could have a material adverse effect on our financial position and results of operations.
Furthermore, we are frequently under audits by United States and foreign tax authorities. We may have exposure to additional tax liabilities as a result of these audits. Significant judgment is required in determining our provision for income and other tax liabilities. Although we believe our tax estimates are reasonable, the final outcome of tax audits and the impact of changes in tax laws or the interpretation of tax laws could result in material differences from what is reflected in historical income tax accruals. If additional taxes are assessed as a result of an examination, a material effect on our financial results, tax positions or cash flows could occur in the period or periods in which the determination is made.
No significant market currently exists for the auction rate securities we hold and we may not be able to liquidate them at the current valuation, if at all, and we may recognize impairment charges if their estimated fair values decline.
As of April 3, 2010, we held a total of $13.7 million invested in auction rate securities (ARS) at par value. Additionally, we held $4.0 million of par value ARS which were converted by the bond issuer to its preferred stock during the third quarter of 2009. These securities were recorded at an estimated fair value of $5.0 million as of April 3, 2010. The contractual maturities of these securities range up to calendar year 2050, and several securities and the preferred stock do not have stated maturities. As a result of disruptions experienced in the global credit and capital markets, the auctions that previously provided liquidity for the ARS began to fail during the second fiscal quarter of 2008.
Since that time, none of these securities have traded through the auction process and few market transactions for these securities have been observed. Additionally, the bond insurers that guarantee the ARS experienced credit rating downgrades and the issuer of the preferred stock suspended dividend payments. Consequently, we recognized significant write downs of the ARS as a result of the declines in fair value and the ARS are categorized as non-current assets.
We cannot reasonably predict if or when our remaining ARS will become liquid, and it is not possible to ascertain when or whether market conditions will change resulting in the recovery of fair value on these auction rate securities. It is possible that a secondary market for the underlying securities will develop in which trading prices fall below our currently recorded fair values. Under such a scenario, or if other events arise that impact the fair value of the securities, we may have to recognize further losses, which would adversely impact our financial position and results of operations.
It is possible that continued uncertainty in the credit markets could also impact the liquidity of our other investments and cash equivalents, which could impair our liquidity or require us to recognize impairment charges on the value of those investments, which would negatively impact our financial position and results of operations.
Our intangible assets may become impaired.
We held $8.4 million in definite-lived acquired intangible assets at April 3, 2010. We review these intangible assets for impairment when events or changes in circumstances indicate the carrying value may not be recoverable. If such an adverse event occurred and had the effect of changing one of the critical assumptions or
16
estimates related to the fair value of our intangible assets, an impairment charge could result. For example, during fiscal 2009, as a result of a decrease in our market capitalization, we recorded a goodwill impairment charge of $17.4 million to write off all existing goodwill. Any such impairment charges may have a material negative impact on our financial condition and operating results.
We may be unable to retain, attract and assimilate key managerial, financial, engineering and other technical personnel.
Our continued success depends in part upon the services of our key managerial, financial and technical personnel. The loss of key personnel, or our inability to attract, assimilate and retain qualified personnel, could result in the loss of customers, inhibit our ability to operate and grow our business, and otherwise have a material adverse effect on our business and results of operations. We have previously had to, and may in the future have to, impose salary reductions on senior employees during economic downturns in an effort to maintain our financial position. These actions may have an adverse effect on employee loyalty and may make it more difficult for us to attract and retain key personnel. Competition for qualified personnel in the industries in which we compete is intense, and we may not be successful in attracting and retaining qualified personnel. We may incur significant costs in our efforts to recruit and retain key personnel, which could affect our financial position and results of operations.
We are exposed to lawsuits in the normal course of business.
We have been and may in the future be subject to various legal proceedings, including claims that involve possible infringement of patent or other intellectual property rights of third parties. It is inherently difficult to assess the outcome of litigation matters, and there can be no assurance that we will prevail in any litigation. Any such litigation could result in substantial cost and diversion of management’s attention, which by itself could have a material adverse effect on our financial condition and operating results. Further, adverse determinations in such litigation could result in loss of our property rights, subject us to significant liabilities to third parties, require us to seek licenses from third parties or prevent us from manufacturing or selling our products, any of which could materially adversely affect our business, financial condition or results of operations.
Many of our products are highly complex and may contain defects or errors.
Our products are highly complex, and our extensive product development, manufacturing and testing processes may not be adequate to detect all defects, errors, failures and quality issues that could impact customer satisfaction or result in claims against us. As a result, we may have to replace certain components or provide remediation in response to the discovery of defects in products after they are shipped. The occurrence of any defects, errors, failures or quality issues could result in cancellation of orders, product returns, diversion of our resources, legal actions by our customers and other losses to us or to our customers. These occurrences could also result in the loss of, or delay in, market acceptance of our products and loss of sales, which would harm our business and adversely affect our revenues and profitability.
We are subject to numerous governmental regulations.
We are subject to federal, state, local and foreign regulations, including environmental regulations and regulations relating to the design and operation of our products. We may incur significant costs as we seek to ensure that our products meet safety standards, many of which vary across the states and countries in which our products are used. Compliance with future regulations, directives and standards could require us to modify or redesign some products, make capital expenditures or incur substantial costs. If we do not comply with current or future regulations, directives and standards, we could be subject to fines, our production or shipments could be suspended, and we could be prohibited from offering particular products in specified markets. If we are unable to comply with current or future regulations, directives and standards, our financial condition and results of operations could be materially and adversely affected.
17
Compliance with changing regulations and standards for accounting, corporate governance and public disclosure may result in additional expenses.
Changing laws, regulations and standards relating to corporate governance and public disclosure, including new Securities and Exchange Commission (SEC) regulations, new NASDAQ Global Select Market rules and new accounting requirements have the potential to create uncertainty and result in additional governance and disclosure complexities for companies such as ours. To maintain high standards of corporate governance and public disclosure, we intend to invest all reasonably necessary resources to comply with all other current and future standards. These investments may result in increased general and administrative expenses and a diversion of management time and attention from strategic revenue generating and cost management activities.
We may be unable to maintain effective internal controls over financial reporting.
The SEC, as directed by Section 404 of the Sarbanes-Oxley Act of 2002, adopted rules that require us to include in our annual reports on Form 10-K a report by management assessing the effectiveness of our internal control over financial reporting. In addition, our independent registered public accounting firm must attest to, and report on the effectiveness of, our internal control over financial reporting. Although we regularly review our internal control over financial reporting in order to ensure compliance with the Section 404 requirements, there is no guarantee that we will be successful in complying with the requirements of Section 404. Our failure to maintain adequate internal controls over financial reporting could cause (a) investors to lose confidence in the reliability of our financial statements or (b) a delay in our ability to timely file our periodic reports with the SEC, each of which could, in addition to a number of other adverse consequences, negatively impact our stock price.
Our stock price is volatile.
The market price of our common stock has fluctuated widely. During fiscal 2010, our stock price fluctuated between a high of $14.36 per share and a low of $5.92 per share. Consequently, the current market price of our common stock may not be indicative of future market prices, and we may be unable to sustain or increase the value of an investment in our common stock. Factors affecting our stock price, many of which our outside of our control, may include:
| | • | | variations in operating results from quarter to quarter; |
| | • | | changes in earnings estimates by analysts or our failure to meet analysts’ expectations; |
| | • | | changes in the market price per share of our public company customers; |
| | • | | market conditions in the semiconductor and other industries into which we sell products; |
| | • | | general economic conditions; |
| | • | | political changes, hostilities or natural disasters; |
| | • | | low trading volume of our common stock; and |
| | • | | the number of firms making a market in our common stock. |
In addition, the stock market has recently experienced significant price and volume fluctuations. These fluctuations have particularly affected the market prices of the securities of high-technology companies like ours. These market fluctuations could adversely affect the market price of our common stock.
Provisions of our charter documents, our shareholder rights plan and Oregon law could make it more difficult for a third party to acquire us.
Our articles of incorporation and bylaws contain provisions that could make it harder for a third party to acquire us without the consent of our Board of Directors. Our Board of Directors has also adopted a shareholder rights plan, or “poison pill,” which would significantly dilute the ownership of a hostile acquirer. In addition, the
18
Oregon Control Share Act and the Oregon Business Combination Act limit the ability of parties who acquire a significant amount of voting stock to exercise control over us. These provisions may have the effect of lengthening the time required for a person to acquire control of us through a proxy contest or the election of a majority of our Board of Directors, may deter efforts to obtain control of us and may make it more difficult for a third party to acquire us without negotiation. These provisions may apply even if the offer may be considered beneficial by our shareholders.
| Item 1B. | Unresolved Staff Comments |
None.
Our executive and administrative offices, as well as some of our manufacturing facilities, are located in Portland and Klamath Falls, Oregon. Our primary system manufacturing facilities are located in a four-building complex with 250,800 square feet of space on 15 acres in Portland, Oregon. Our passive component consumable products are manufactured at a 53,000 square foot plant on 31 acres in Klamath Falls, Oregon. We own all of these buildings. We believe the productive capacity of these facilities to be adequate and suitable for the requirements of our business for the foreseeable future.
We lease approximately 65,000 square feet of facilities in Fremont, California that are used for NWR and SG operations and manufacturing and approximately 26,000 square feet of facilities in Singapore where we manufacture certain IMG and PCG products. We also lease other office and facility space in various locations throughout the United States and various foreign countries.
In August 2005, we commenced a proceeding in the Kaohsiung District Court of Taiwan (the Court) directed against All Ring Tech Co., Ltd. (All Ring) of Taiwan. We alleged that All Ring’s Capacitor Tester Model RK-T6600 (the Capacitor Tester) infringes ESI’s Taiwan Patent No. 207469, entitled “Circuit Component Handler” (the 207469 patent). As part of this proceeding, the Court issued a Provisional Attachment Order (PAO) in August 2005, restricting the use of some of All Ring’s assets. All Ring then filed a bond with the Court to obtain relief from the attachment of its assets. In July 2007, the Court issued a second PAO and approximately $6.0 million was restricted in All Ring’s accounts. The second PAO remains in effect and cannot be revoked.
In October 2005, we filed a formal patent infringement action against All Ring in the Court. The Court-appointed expert initially concluded that the Capacitor Tester and All Ring’s RK-T2000 both infringe every claim of the 207469 patent and that All Ring’s RK-L50 infringes a number of the claims as well. Because we had amended our claims in the cancellation action as described below, the Court asked the Court-appointed expert to respond to questions regarding the expert’s initial opinion. The Court-appointed expert conducted an additional inspection of each of these systems on September 21, 2009, and will re-evaluate whether the systems infringe after reviewing the briefs that the Company and All Ring have submitted. At the request of the Court, an audit of All Ring was conducted by an independent accounting firm in November and December of 2009 to assist the Court in making any damages determinations. The firm has not yet issued its audit report.
Also in October 2005, the Court executed a Preliminary Injunction Order (PIO) that prohibits All Ring from manufacturing, selling, offering for sale or using the Capacitor Tester until final judgment is entered in the formal patent infringement action. The Court dismissed All Ring’s application to revoke the PIO on January 18, 2008, and the PIO remains in place.
In November 2005, All Ring filed a cancellation action against ESI’s 207469 patent in the Taiwan Intellectual Property Office (the IPO). On July 5, 2007, the IPO issued a notice requiring us to cancel two of the
19
claims in the 207469 patent. We filed a response canceling the two claims and amending the remaining claims accordingly in August 2007. On August 12, 2008, the IPO decided the action in our favor and dismissed the cancellation action. All Ring appealed the IPO’s cancellation decision to the Board of Appeal of the Ministry of Economic Affairs (MOEA) on September 12, 2008. On March 23, 2009, the MOEA dismissed the IPO’s cancellation decision solely on procedural grounds. The MOEA remanded the case to the IPO with a request that the IPO issue another decision within six months that rectifies the procedural defects of the IPO’s earlier decision. On July 22, 2009, the IPO issued a decision dismissing All Ring’s cancellation action. All Ring appealed the IPO’s decision to the MOEA in August 2009. The MOEA dismissed All Ring’s appeal in February 2010.
Pursuant to the Court’s PAO and PIO, we were required to post Taiwan dollar security bonds with the Court. In July 2009, we substituted a letter of credit as a partial substitution and received back $2.0 million of the security bonds from the Court. The letter of credit is collateralized by $2.4 million of restricted cash. In September 2009, we established an additional letter of credit and received back the remaining $7.1 million of the security bonds. This second letter of credit is collateralized by $8.4 million of restricted cash. The total restricted cash balance of $10.8 million is included in the Consolidated Balance Sheet at April 3, 2010 as a current asset.
In the ordinary course of business, we are involved in various other legal matters, either asserted or unasserted, and investigations. In our opinion, ultimate resolution of these matters will not have a material effect on our consolidated financial position, results of operations or cash flows.
20
PART II
| Item 5. | Market for Registrant’s Common Equity, Related Shareholder Matters and Issuer Purchases of Equity Securities |
Common Stock Prices and Dividends
Our common stock trades on the NASDAQ Global Select Market under the symbol ESIO. There were 616 shareholders of record as of June 7, 2010, and on that date there were 27,832,779 common shares outstanding. The closing price on June 7, 2010 was $11.96.
The following table shows the high and low closing prices for our common stock as reported on the NASDAQ Global Select Market for the fiscal quarters indicated:
| | | | | | |
Fiscal 2010 | | High | | Low |
Quarter 1 | | $ | 12.08 | | $ | 5.92 |
Quarter 2 | | | 13.19 | | | 10.55 |
Quarter 3 | | | 14.36 | | | 9.73 |
Quarter 4 | | | 13.90 | | | 10.19 |
| | | | | | |
Fiscal 2009 | | High | | Low |
Quarter 1 | | $ | 17.57 | | $ | 14.36 |
Quarter 2 | | | 16.14 | | | 13.88 |
Quarter 3 | | | 14.22 | | | 5.56 |
Quarter 4 | | | 7.75 | | | 4.89 |
Consistent with historical practices, we have not paid any cash dividends on our common stock during the last two fiscal years. We intend to retain any earnings for our business and do not anticipate paying any cash dividends in the foreseeable future.
Share Repurchase Transactions
On May 15, 2008, the Board of Directors authorized a share repurchase program for $20.0 million in shares of the Company’s outstanding common stock primarily to offset dilution from equity compensation programs. The repurchases are to be made at management’s discretion in the open market or in privately negotiated transactions in compliance with applicable securities laws and other legal requirements and are subject to market conditions, share price and other factors. During fiscal 2010, the Company repurchased a total of 64,960 shares for $0.6 million under the share repurchase program at an average price per share of $8.55, calculated inclusive of commissions and fees. No repurchases were made during the fourth quarter of 2010. There is no fixed completion date for the repurchase program.
Disclosures related to securities authorized for issuance under our Equity Compensation Plans are incorporated by reference into Item 12 of this annual report on Form 10-K, Security Ownership of Certain Beneficial Owners and Management and Related Shareholder Matters, from our Proxy Statement for our fiscal 2010 annual meeting.
21
Stock Performance Graph
The graph below compares the cumulative 58-month total return to holders of Electro Scientific Industries, Inc. common stock with the cumulative total returns of the S&P 500 Index and the S&P Information Technology Index for the same period. The graph assumes that the value of the investment in Electro Scientific Industries, Inc. common stock and in each of the indices (including reinvestment of dividends) was $100 on May 28, 2005 and tracks it through April 3, 2010.
Historical stock price performance should not be relied upon as indicative of future stock price performance.
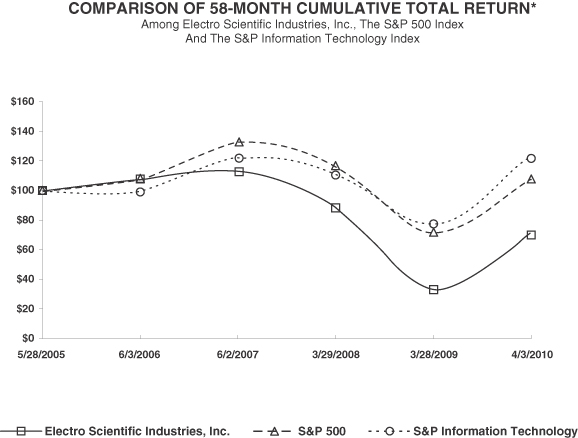
| | | | | | | | | | | | |
| | | Cumulative Total Return |
| | | May 28,
2005 | | June 3,
2006 | | June 2,
2007 | | March 29,
2008 | | March 28,
2009 | | April 3,
2010 |
Electro Scientific Industries, Inc. | | 100.00 | | 109.00 | | 114.35 | | 89.29 | | 34.66 | | 72.19 |
S&P 500 | | 100.00 | | 108.64 | | 133.40 | | 117.17 | | 72.54 | | 108.64 |
S&P Information Technology | | 100.00 | | 100.73 | | 123.93 | | 112.54 | | 78.70 | | 124.36 |
Copyright© 2010 Standard & Poor’s, a division of The McGraw-Hill Companies Inc. All rights reserved. (www.researchdatagroup.com/S&P.htm)
22
| Item 6. | Selected Financial Data |
| | | | | | | | | | | | | | | | | | |
(In thousands, except per share data) | | 2010 | | | 2009 | | | 2008 | | 2007 | | 2006 | |
Statement of Operations Data | | | | | | | | | | | | | | | | | | |
Net Sales | | $ | 148,893 | | | $ | 157,313 | | | $ | 247,155 | | $ | 250,824 | | $ | 207,006 | |
(Benefit from) provision for income taxes2 | | | (9,778 | ) | | | (13,627 | ) | | | 9,923 | | | 11,103 | | | (1,536 | ) |
Net (loss) income1,2,3,4,5 | | | (11,984 | ) | | | (51,050 | ) | | | 16,589 | | | 23,524 | | | 20,823 | |
Net (loss) income per share—basic1,2,3,4,5 | | | (0.44 | ) | | | (1.89 | ) | | | 0.59 | | | 0.81 | | | 0.72 | |
Net (loss) income per share—diluted1,2,3,4,5 | | | (0.44 | ) | | | (1.89 | ) | | | 0.59 | | | 0.80 | | | 0.72 | |
| | | | | |
Balance Sheet Data | | | | | | | | | | | | | | | | | | |
Cash and cash equivalents, restricted cash, short-term investments and auction rate securities6,7,8 | | $ | 171,320 | | | $ | 161,925 | | | $ | 160,905 | | $ | 228,691 | | $ | 229,332 | |
Working capital | | | 253,728 | | | | 246,910 | | | | 274,667 | | | 327,288 | | | 302,184 | |
Net property, plant and equipment | | | 40,590 | | | | 43,005 | | | | 47,962 | | | 43,859 | | | 43,338 | |
Total assets | | | 394,418 | | | | 384,247 | | | | 455,612 | | | 465,668 | | | 437,465 | |
Long-term debt | | | — | | | | — | | | | — | | | — | | | — | |
Shareholders’ equity | | | 342,662 | | | | 343,523 | | | | 392,240 | | | 408,330 | | | 388,167 | |
| 1. | Fiscal 2010 included a pretax benefit of $4.5 million for net merger termination proceeds, a charge of $1.3 million for other-than-temporary impairment of auction rate securities and pretax expense of $2.1 million for amortization of acquired intangible assets. Fiscal 2010 also included pretax expense of $7.7 million of share-based compensation expense. |
| 2. | Fiscal 2009 included expenses of $17.4 million for a goodwill impairment charge, $13.6 million for other-than-temporary impairment of auction rate securities and $6.0 million for increases to the valuation allowance on deferred tax assets. Fiscal 2009 also included pretax expenses of $2.3 million for amortization of acquired intangible assets, $4.0 million for restructuring, $4.1 million for the write-off of materials from an RD&E program due to a change in product development strategy and $4.4 million in share-based compensation expense. |
| 3. | Fiscal 2008 included a pretax charge of $3.3 million to record the fair value adjustments primarily related to acquired inventory and amortization of acquired intangibles, a charge of $2.8 million to record the write-off of acquired in-process research & development related to the acquisition of New Wave Research, Inc., and pretax expenses of $2.1 million for amortization of acquired intangible assets, $1.0 million of restructuring costs and $3.7 million in share-based compensation expense. |
| 4. | Fiscal 2007 included pretax gains of $1.3 million for an insurance recovery on fire-damaged demonstration systems and $1.0 million for an insurance settlement related to shareholder and derivative lawsuits. Fiscal 2007 also included pretax expense of $2.9 million in share-based compensation expense. |
| 5. | Fiscal 2006 included a $5.9 million reduction in accrued income taxes due to the statutory closure of various tax years. Fiscal 2006 also included pretax expense of $1.4 million in share-based compensation expense. |
| 6. | Fiscal 2010 included illiquid auction rate securities at a fair value of $5.0 million. |
| 7. | Fiscal 2009 included illiquid auction rate securities at a fair value of $6.0 million. |
| 8. | Fiscal 2008 included illiquid auction rate securities at a fair value of $15.7 million. |
23
| Item 7. | Management’s Discussion and Analysis of Financial Condition and Results of Operations |
Overview of Business
Electro Scientific Industries, Inc. and its subsidiaries (ESI) provide high-technology manufacturing equipment to the global semiconductor and micro-electronics markets, including advanced laser systems that are used to micro-engineer electronic device features in high-volume production environments. Our customers are primarily manufacturers of semiconductors, electronic interconnect devices, passive components, light-emitting diodes (LEDs), or other components used in a wide variety of end products in the computer, consumer electronics, communications and other industries. Our equipment enables these manufacturers to implement device features or achieve yield and productivity gains in their manufacturing processes that can be critical to their profitability. ESI was founded in 1944 and is headquartered in Portland, Oregon, with subsidiaries in the United States, Europe and Asia.
Our advanced laser micro-engineering systems allow semiconductor and micro-electronics manufacturers to physically alter select device features during high-volume production in order to heighten performance and boost production yields. Laser micro-engineering comprises a set of precise micron-level processes, including advanced micro-machining, wafer scribing and dicing, semiconductor memory-link cutting, semiconductor device trimming, material ablation and via drilling as well as nano-level structuring to alter material characteristics. These processes require application-specific laser systems able to meet our customers’ exacting performance and productivity requirements. Our laser-based systems improve production yields or enable improved performance for semiconductor devices, high-density interconnect (HDI) circuits, flexible interconnect material, advanced semiconductor packaging, LEDs, flat panel liquid crystal displays (LCDs) and other components.
Additionally, we produce high-capacity test and optical inspection equipment that is critical to the quality control process during the production of multi-layer ceramic capacitors (MLCCs). Our equipment ensures that each MLCC meets both the electrical and physical tolerances required to perform properly.
Change in Fiscal Reporting Periods
On July 3, 2007, our Board of Directors approved a change in the Company’s reporting period that results in a fiscal year consisting of 52 or 53 weeks ending on the Saturday nearest March 31. Accordingly, our fiscal 2010 reporting period consisted of a 53-week period ending on April 3, 2010, our fiscal 2009 reporting period consisted of a 52-week period ending on March 28, 2009 and our fiscal 2008 reporting period consisted of a 43-week period (approximately ten months) beginning June 3, 2007 and ending March 29, 2008.
In addition, as discussed in Note 4 “Comparative Consolidated Statements of Operations (Unaudited)” to the Consolidated Financial Statements in Item 8 Financial Statements and Supplementary Data, we provided pro forma results for the twelve months ended March 29, 2008 for comparative purposes. All references to years or quarters relate to fiscal years or fiscal quarters unless otherwise noted.
Overview of Financial Results
The financial results of fiscal 2010 reflected a gradual recovery in most of our markets following the global downturn that severely impacted our order activity throughout fiscal 2009. Consumer and business spending on electronic equipment increased throughout fiscal 2010, driving capacity expansion and capital spending by our customers. As a result, our total order volume of $173.4 million in fiscal 2010 increased approximately 34% compared to orders of $129.2 million in fiscal 2009.
Orders for our Semiconductor Group (SG) products decreased approximately 5% during fiscal 2010 compared to fiscal 2009. The decrease was primarily due to continued weak demand from our memory customers. In fiscal 2009, memory markets experienced a downturn that continued to impact order levels
24
throughout 2010 as our customers slowly absorbed existing capacity from fiscal 2008 and early fiscal 2009 purchases. Partially offsetting this weak demand in memory markets was increased demand for our LED wafer scribing products as consumer demand for LED-backlit displays and televisions drove improved markets for these products.
Orders for our Passive Components Group (PCG) products increased approximately 160% during fiscal 2010 compared to fiscal 2009. This increase reflected recovery in demand for consumer electronics and the trend for higher-capacitance MLCCs in new electronic devices, which in turn drove increased capacity requirements from our customers.
Orders for our Interconnect/Micro-machining Group (IMG) products increased by approximately 20% during fiscal 2010 compared to fiscal 2009, including a large order for our new model ML5900 received in the third quarter of fiscal 2010. The growth in orders was due to penetration into new applications by our advanced micro-machining products and solid demand for our via drilling and laser ablation products.
Fiscal 2010 total shipments were $151.2 million compared to $156.0 million for fiscal 2009. In each sequential quarter of 2010, total shipments increased, while in contrast, total shipments decreased in each sequential quarter of fiscal 2009, a reflection of the global economic downturn that began during fiscal 2009. By product group, PCG shipments increased by approximately 17% in fiscal 2010, IMG shipments increased by approximately 8% and SG shipments decreased by approximately 37%. Backlog was $40.6 million as of April 3, 2010 compared to $16.8 million as of March 28, 2009.
Gross margins were 37.5% on net sales of $148.9 million in fiscal 2010 compared to 37.1% on net sales of $157.3 million in fiscal 2009. The slight increase in gross margin percentage was due to a favorable shift in product mix in 2010, which offset overall lower sales volume.
Net operating expenses of $77.6 million in 2010 decreased $35.1 million from $112.7 million in 2009. This decrease was primarily due to a goodwill impairment charge recorded during 2009 of $17.4 million, restructuring costs of $4.0 million in 2009 and a $6.4 million decrease resulting from $4.5 million of net merger termination proceeds received in 2010 following $1.9 million of merger transaction costs incurred in 2009. Excluding these items, operating expenses decreased $7.3 million from the prior year, reflecting a lower cost structure and implementation of temporary cost reduction measures, including salary reductions, following the restructuring efforts initiated during 2009.
Operating loss was $21.8 million in fiscal 2010 compared to $54.3 million in fiscal 2009, a reduction in operating loss of $32.5 million. This decrease was primarily due to the reduction in net operating expenses described above, partially offset by slightly lower gross profit. Non-operating income for 2010 was slightly positive, as $1.3 million of other-than-temporary impairment charges mostly offset $1.4 million of net interest and other income. Comparatively, fiscal 2009 had non-operating expense of $10.4 million, as other-than-temporary impairment charges of $13.6 million exceeded net interest and other income of $3.2 million. Net loss was $12.0 million in 2010 compared to $51.0 million in 2009 due to the impact of the items discussed above.
25
Results of Operations
The following table presents results of operations data as a percentage of net sales for the year ended April 3, 2010, the year ended March 28, 2009 and the ten-month year ended March 29, 2008:
| | | | | | | | | |
| | | 2010 | | | 2009 | | | 2008 | |
Net sales | | 100.0 | % | | 100.0 | % | | 100.0 | % |
Cost of sales | | 62.5 | | | 62.9 | | | 54.6 | |
| | | | | | | | | |
Gross margin | | 37.5 | | | 37.1 | | | 45.4 | |
Selling, service and administration | | 32.5 | | | 32.6 | | | 21.2 | |
Research, development and engineering | | 22.6 | | | 24.3 | | | 14.6 | |
Goodwill impairment charge | | — | | | 11.1 | | | — | |
Restructuring costs | | — | | | 2.5 | | | 0.4 | |
Merger (termination proceeds) transaction costs, net | | (3.0 | ) | | 1.2 | | | — | |
Write-off of acquired in-process research & development | | — | | | — | | | 1.1 | |
| | | | | | | | | |
Operating (loss) income | | (14.6 | ) | | (34.6 | ) | | 8.1 | |
Other-than-temporary impairment of auction rate securities | | (0.9 | ) | | (8.6 | ) | | — | |
Interest and other income, net | | 0.9 | | | 2.0 | | | 2.6 | |
| | | | | | | | | |
(Loss) income before income taxes | | (14.6 | ) | | (41.2 | ) | | 10.7 | |
(Benefit from) provision for income taxes | | (6.6 | ) | | (8.7 | ) | | 4.0 | |
| | | | | | | | | |
Net (loss) income | | (8.0 | )% | | (32.5 | )% | | 6.7 | % |
| | | | | | | | | |
Fiscal Year Ended April 3, 2010 Compared to Fiscal Year Ended March 28, 2009
Net Sales
The following table presents net sales information by product group:
| | | | | | | | | | | | |
| | | 2010 | | | 2009 | |
(In thousands, except percentages) | | Net Sales | | % of Net Sales | | | Net Sales | | % of Net Sales | |
Semiconductor Group (SG) | | $ | 28,525 | | 19.2 | % | | $ | 44,855 | | 28.5 | % |
Passive Components Group (PCG) | | | 31,697 | | 21.3 | | | | 29,243 | | 18.6 | |
Interconnect/Micro-machining Group (IMG) | | | 88,671 | | 59.5 | | | | 83,215 | | 52.9 | |
| | | | | | | | | | | | |
| | $ | 148,893 | | 100.0 | % | | $ | 157,313 | | 100.0 | % |
| | | | | | | | | | | | |
Net sales for fiscal 2010 decreased $8.4 million or 5.4% over net sales for the year ended March 28, 2009. A significant decrease in SG net sales was partially offset by increases in IMG and PCG.
SG sales for the year ended April 3, 2010 decreased $16.3 million or 36.4% compared to the year ended March 28, 2009. The reduction in SG revenues was primarily attributable to the weakness in memory markets that began in early fiscal 2009 and continued to impact sales through fiscal 2010 as our customers absorbed existing production capacity. The slow recovery of the memory markets was partially offset by increased sales of our LED wafer scribing and LCD repair products during 2010 as consumer demand for LED-backlit displays and televisions in turn drove improved markets for these products.
PCG sales for the year ended April 3, 2010 were up $2.5 million or 8.4% compared to the year ended March 28, 2009. This increase was primarily due to increased capacity utilization by our MLCC manufacturing customers. In fiscal 2009, the global economic slowdown led to excess production capacity; however, in fiscal 2010, increasing demand for consumer electronics drove stronger capacity utilization and additional capital investment by our customers.
26
IMG sales for the year ended April 3, 2010 increased $5.5 million or 6.6% over IMG sales for the year ended March 28, 2009. The increase in IMG sales was primarily driven by demand for our advanced micro-machining products from new applications, including a large order for our new model ML5900 which led revenue in the fourth quarter of fiscal 2010. Additionally, demand in the flex-circuit and integrated circuit packaging segments of the market remained strong as a result of consumer demand for smart phones and other hand-held devices.
The following table presents net sales information by geographic region:
| | | | | | | | | | | | |
| | | 2010 | | | 2009 | |
(In thousands, except percentages) | | Net Sales | | % of Net Sales | | | Net Sales | | % of Net Sales | |
Asia | | $ | 124,078 | | 83.4 | % | | $ | 110,114 | | 70.0 | % |
Americas | | | 14,189 | | 9.5 | | | | 30,637 | | 19.5 | |
Europe | | | 10,626 | | 7.1 | | | | 16,562 | | 10.5 | |
| | | | | | | | | | | | |
| | $ | 148,893 | | 100.0 | % | | $ | 157,313 | | 100.0 | % |
| | | | | | | | | | | | |
Net sales to Asia for the year ended April 3, 2010 increased $14.0 million or 12.7% compared to the year ended March 28, 2009. The increase in net sales reflects improvement in customer spending on electronic equipment combined with a continued trend by our customers to source their high-volume manufacturing in Asia.
Net sales to the Americas for the year ended April 3, 2010 declined $16.4 million or 53.7% compared to the year ended March 28, 2009. This decrease was due to reduced capital investment primarily by our semiconductor customers as they utilize existing capacity from purchases in prior years.
Net sales to Europe for the year ended April 3, 2010 declined $5.9 million or 35.8% compared to the year ended March 28, 2009. This decrease was primarily due to a reduction in SG sales in the region, reflecting the impact of the global economic downturn on key customers in that region, including the bankruptcy of Qimonda AG.
Gross Profit
The following table presents gross profit information:
| | | | | | | | | | | | |
| | | 2010 | | | 2009 | |
(In thousands, except percentages) | | Gross Profit | | % of Net Sales | | | Gross Profit | | % of Net Sales | |
Gross Profit | | $ | 55,865 | | 37.5 | % | | $ | 58,418 | | 37.1 | % |
| | | | | | | | | | | | |
Gross profit was $55.9 million for the year ended April 3, 2010, a decrease of $2.6 million or 4.4% compared to the year ended March 28, 2009. The net dollar decrease was primarily caused by decreased revenue levels, partially offset by a favorable shift in product mix.
Gross profit as a percentage of net sales was 37.5% for the year ended April 3, 2010 compared to 37.1% for the year ended March 28, 2009. This improvement reflects a favorable product mix in 2010 compared to 2009.
27
Operating Expenses
The following table presents operating expense information:
| | | | | | | | | | | | | |
| | | 2010 | | | 2009 | |
(In thousands, except percentages) | | Expense | | | % of Net Sales | | | Expense | | % of Net Sales | |
Selling, service and administration | | $ | 48,536 | | | 32.5 | % | | $ | 51,260 | | 32.6 | % |
Research, development and engineering | | | 33,618 | | | 22.6 | | | | 38,179 | | 24.3 | |
Goodwill impairment charge | | | — | | | — | | | | 17,396 | | 11.1 | |
Restructuring costs | | | — | | | — | | | | 4,011 | | 2.5 | |
Merger (termination proceeds) transaction costs, net | | | (4,516 | ) | | (3.0 | ) | | | 1,850 | | 1.2 | |
| | | | | | | | | | | | | |
| | $ | 77,638 | | | 52.1 | % | | $ | 112,696 | | 71.7 | % |
| | | | | | | | | | | | | |
Selling, Service and Administration
Selling, service and administration (SS&A) expenses primarily consist of labor and other employee-related expenses including share-based compensation expense, travel expenses, professional fees, sales commissions and facilities costs. SS&A expenses for the year ended April 3, 2010 were $2.7 million lower than for the year ended March 28, 2009. Excluding the impact of a $2.6 million increase in share-based compensation expense, primarily driven by incremental charges for our annual stock grant, the decrease was $5.3 million. This decrease was the result of cost savings realized through restructuring actions initiated during fiscal 2009 and temporary cost reduction measures, including salary reductions, during the first three quarters of 2010.
Research, Development and Engineering
Research, development and engineering (RD&E) expenses are primarily comprised of labor and other employee-related expenses, professional fees, project materials, equipment costs and facilities costs. RD&E expenses for the year ended April 3, 2010 were $4.6 million lower than for the year ended March 28, 2009. This decrease was primarily due to a $4.1 million charge taken in fiscal 2009 to write off material from an RD&E program due to a change in our product development strategy. Excluding the impact of this charge, RD&E expenses declined $0.5 million. This decrease was due to our lower cost structure following the restructuring actions initiated in fiscal 2009 and the temporary cost reduction measures that were in effect during most of fiscal 2010, partially offset by an increase in share-based compensation expense and higher project spending related to new-product investment.
Share-Based Compensation
Included in the preceding table of operating expense information were $6.7 million and $3.7 million of share-based compensation expense for the years ended April 3, 2010 and March 28, 2009, respectively. Share-based compensation expense increased in fiscal 2010 compared to fiscal 2009 primarily due to a higher number of grants awarded in 2010 to counteract the effect of the economic downturn on employee retention, and to a lesser extent, the impact of termination-related forfeitures during 2009.
Goodwill Impairment Charge
No goodwill impairment charges were incurred during the year ended April 3, 2010. During the year ended March 28, 2009, a $17.4 million charge was incurred due to declines in our stock price and market capitalization.
Restructuring Costs
No restructuring costs were incurred during the year ended April 3, 2010 compared to $4.0 million incurred during the year ended March 28, 2009. The fiscal 2009 costs were incurred as the result of actions taken in
28
response to weakness in memory markets and reductions in capital spending driven by the global economic recession. See Note 24 “Restructuring and Cost Management Plans” to the Consolidated Financial Statements in Item 8 Financial Statements and Supplementary Data for additional information.
Merger (Termination Proceeds) Transaction Costs, net
Net merger termination proceeds for the year ended April 3, 2010 were $4.5 million, which represented the receipt of a $5.4 million merger termination fee offset by $0.9 million of merger transaction costs. Merger transaction costs were $1.9 million for the year ended March 28, 2009, which represented expenses incurred in connection with the terminated merger.
Non-operating Income and Expense
Other-than-temporary Impairment of Auction Rate Securities
| | | | | | | | | | | | | | |
| | | 2010 | | | 2009 | |
(In thousands, except percentages) | | Other-than-
temporary
Impairment | | | % of Net Sales | | | Other-than-
temporary
Impairment | | | % of Net Sales | |
Other-than-temporary impairment of auction rate securities | | $ | (1,347 | ) | | (0.9 | )% | | $ | (13,593 | ) | | (8.6 | )% |
| | | | | | | | | | | | | | |
Other-than-temporary impairment charges related to our auction rate securities (ARS) were $1.3 million for the year ended April 3, 2010 and $13.6 million for the year ended March 28, 2009, a decrease of $12.2 million. The $1.3 million charge for the year ended April 3, 2010 was recorded during the fourth quarter due to the suspension of interest payments by the issuer of certain of our ARS and decreases in the credit quality of bond insurers of certain of our other ARS. The $13.6 million of charges for the year ended March 28, 2009 were incurred due to the impact of instability in the global financial markets on the estimated fair values of our ARS. See Note 6 “Fair Value Measurements” to the Consolidated Financial Statements in Item 8 Financial Statements and Supplementary Data for further discussion.
Interest and Other Income, net
Interest and other income, net, consists of interest income and expense, market gains and losses on assets held in employees��� deferred compensation accounts, realized and unrealized foreign exchange gains and losses, bank charges, investment management fees, ARS valuation fees and other miscellaneous non-operating items. Net interest and other income was as follows:
| | | | | | | | | | | | |
| | | 2010 | | | 2009 | |
(In thousands, except percentages) | | Interest and
Other Income,
net | | % of Net Sales | | | Interest and
Other Income,
net | | % of Net Sales | |
Interest and other income, net | | $ | 1,358 | | 0.9 | % | | $ | 3,194 | | 2.0 | % |
| | | | | | | | | | | | |
For the year ended April 3, 2010, interest and other income, net, was $1.4 million, compared to $3.2 million for the year ended March 28, 2009. This $1.8 million decrease was primarily due to a decline in interest income that was largely due to market-driven decreases in yields.
29
Income Taxes
The following table presents income tax information:
| | | | | | | | | | | | | | |
| | | 2010 | | | 2009 | |
(In thousands, except percentages) | | Income
Tax Benefit | | | Effective
Tax Rate | | | Income
Tax Benefit | | | Effective
Tax Rate | |
Benefit from income taxes | | $ | (9,778 | ) | | 44.9 | % | | $ | (13,627 | ) | | 21.1 | % |
| | | | | | | | | | | | | | |
The income tax benefit recorded for the year ended April 3, 2010 was $9.8 million on pretax loss of $21.8 million, an effective rate of 44.9%. For the year ended March 28, 2009, the income tax benefit was $13.6 million on pretax loss of $64.7 million, an effective tax rate of 21.1%. The lower effective tax rate for fiscal 2009 was primarily related to the $17.4 million goodwill impairment charge recorded during fiscal 2009, which was not deductible for US tax purposes, and an increase in the valuation allowance on deferred tax assets related to our auction rate securities during fiscal 2009. In fiscal 2010, our rate was favorably impacted by a reduction in reserves associated with uncertain tax positions, certain permanent differences and other discrete adjustments.
Our effective tax rate is subject to fluctuation based upon the occurrence and timing of numerous discrete events such as changes in tax laws or their interpretations, extensions or expirations of research and experimentation credits, closure of tax years subject to examination, finalization of income tax returns, the relationship of fixed deductions to overall changes in estimated and actual pretax income or loss and the tax jurisdictions where income or loss is generated. Based on currently available information, we are not aware of any further discrete events which are likely to occur that would have a material effect on our financial position, expected cash flows or results of operations. We anticipate no significant changes in unrecognized tax benefits in the next twelve months as the result of examinations or lapsed statutes of limitation.
Net Loss
The following table presents net loss information:
| | | | | | | | | | | | | | |
| | | 2010 | | | 2009 | |
(In thousands, except percentages) | | Net Loss | | | % of Net Sales | | | Net Loss | | | % of Net Sales | |
Net loss | | $ | (11,984 | ) | | (8.0 | )% | | $ | (51,050 | ) | | (32.5 | )% |
| | | | | | | | | | | | | | |
As a result of the factors discussed above, net loss for the year ended April 3, 2010 was $12.0 million, or $0.44 per basic and diluted share, compared to net loss of $51.0 million, or $1.89 per basic and diluted share for the year ended March 28, 2009.
Twelve Months Ended March 28, 2009 Compared to Ten Months and Pro Forma Twelve Months Ended March 29, 2008
Due to the change in our fiscal reporting periods discussed above, in the following analyses, we have presented supplemental comparisons of the twelve months ended March 28, 2009 to a pro forma twelve-month period ended March 29, 2008. Necessary estimates were made for certain items in order to create the pro forma twelve-month statement of operations for 2008. See Note 4 “Comparative Consolidated Statements of Operations (Unaudited)” to the Consolidated Financial Statements in Item 8 Financial Statements and Supplementary Data for further discussion.
30
Acquisition of New Wave Research, Incorporated
On July 20, 2007, we acquired New Wave Research, Incorporated (NWR), a privately-held company headquartered in Fremont, California. We acquired 100% of NWR’s outstanding common stock for approximately $36.2 million, comprised of $34.9 million in cash and $1.3 million of merger-related transaction costs. The results for fiscal 2008 include the results of our NWR division from the date of acquisition forward.
Net Sales
The following table presents net sales information by product group:
| | | | | | | | | | | | | | | | | | |
| | | Fiscal 2009 | | | Ten Months Ended
March 29, 2008 | | | Pro Forma Twelve Months Ended
March 29, 2008 (Unaudited) | |
(In thousands, except percentages) | | Net Sales | | % of Net Sales | | | Net Sales | | % of Net Sales | | | Net Sales | | % of Net Sales | |
Semiconductor Group (SG) | | $ | 44,855 | | 28.5 | % | | $ | 109,156 | | 44.2 | % | | $ | 156,831 | | 50.0 | % |
Passive Components Group (PCG) | | | 29,243 | | 18.6 | | | | 75,112 | | 30.4 | | | | 85,840 | | 27.4 | |
Interconnect/Micro-machining Group (IMG) | | | 83,215 | | 52.9 | | | | 62,887 | | 25.4 | | | | 70,875 | | 22.6 | |
| | | | | | | | | | | | | | | | | | |
| | $ | 157,313 | | 100.0 | % | | $ | 247,155 | | 100.0 | % | | $ | 313,546 | | 100.0 | % |
| | | | | | | | | | | | | | | | | | |
Net sales for the twelve months ended March 28, 2009 decreased $89.8 million or 36.4% over net sales for the ten months ended March 29, 2008. A significant decrease in SG and PCG net sales was partially offset by a significant increase in IMG net sales, including the impact of a full year of NWR sales.
Net sales for the twelve months ended March 28, 2009 decreased $156.2 million or 49.8% compared to net sales of $313.5 million for the pro forma twelve months ended March 29, 2008. The downward trend was driven by sharp decreases in SG and PCG net sales, partially offset by an increase in IMG net sales, including an $8.0 million increase in NWR’s IMG sales.
SG sales for the twelve months ended March 28, 2009 decreased $64.3 million or 58.9% compared to the ten months ended March 29, 2008. SG sales for the twelve months ended March 28, 2009 decreased $112.0 million or 71.4% compared to the pro forma twelve months ended March 29, 2008. The reductions in SG revenues were attributable to weakened memory markets. For each comparison, there was a partial increase in sales resulting from the acquisition of NWR.
PCG sales for the twelve months ended March 28, 2009 were down $45.9 million or 61.1% compared to the ten months ended March 29, 2008 and down $56.6 million or 65.9% compared to the pro forma twelve months ended March 29, 2008. These decreases in revenues were due to the impact of the slowing global economy on consumption of consumer electronics, which led to excess capacity for our customers in this market.
IMG sales for the twelve months ended March 28, 2009 increased $20.3 million or 32.3% over IMG sales for the ten months ended March 29, 2008 and increased $12.3 million or 17.4% compared to the pro forma twelve months ended March 29, 2008. The increase was driven primarily by demand for our micro-machining products, partially offset by softening demand in the flex-circuit and integrated circuit packaging segments of the market. The increase in fiscal 2009 reflected $8.0 million in additional sales for Laser Ablation tools and Laser Components as a result of the acquisition of NWR.
31
Gross Profit
The following table presents gross profit information:
| | | | | | | | | | | | | | | | | | |
| | | Fiscal 2009 | | | Ten Months Ended
March 29, 2008 | | | Pro Forma Twelve Months Ended
March 29, 2008 (Unaudited) | |
(In thousands, except percentages) | | Gross Profit | | % of Net Sales | | | Gross Profit | | % of Net Sales | | | Gross Profit | | % of Net Sales | |
Gross Profit | | $ | 58,418 | | 37.1 | % | | $ | 112,141 | | 45.4 | % | | $ | 141,301 | | 45.1 | % |
| | | | | | | | | | | | | | | | | | |
Gross profit was $58.4 million for the twelve months ended March 28, 2009 compared to $112.1 million and $141.3 million for the ten months ended March 29, 2008 and pro forma twelve months ended March 29, 2008, respectively. The net dollar decreases were primarily caused by decreased revenue levels along with an associated reduction in capacity utilization, and to a lesser extent, higher excess and obsolete charges. As a response to the decline in business, management implemented cost reduction efforts throughout fiscal 2009, including reductions in manufacturing labor and overhead, which partially mitigated the impact of lower production volumes.
Gross profit as a percentage of net sales was 37.1% for the fiscal year ended March 28, 2009 compared to 45.4% and 45.1% for the ten months ended March 29, 2008 and the pro forma twelve months ended March 29, 2008, respectively. The same factors discussed above caused the decrease in margin rate over these periods.
Operating Expenses
Operating expenses for the fiscal year ended March 28, 2009, the ten-month fiscal year ended March 29, 2008, and the pro forma twelve months ended March 29, 2008 were as follows:
| | | | | | | | | | | | | | | | | | |
| | | Fiscal 2009 | | | Ten Months Ended
March 29, 2008 | | | Pro Forma Twelve Months Ended
March 29, 2008 (Unaudited) | |
(In thousands, except percentages) | | Expense | | % of Net Sales | | | Expense | | % of Net Sales | | | Expense | | % of Net Sales | |
Selling, service and administration | | $ | 51,260 | | 32.6 | % | | $ | 52,262 | | 21.2 | % | | $ | 61,495 | | 19.6 | % |
Research, development and engineering | | | 38,179 | | 24.3 | | | | 36,104 | | 14.6 | | | | 42,479 | | 13.6 | |
Goodwill impairment charge | | | 17,396 | | 11.1 | | | | — | | — | | | | — | | — | |
Restructuring costs | | | 4,011 | | 2.5 | | | | 972 | | 0.4 | | | | 972 | | 0.3 | |
Merger transaction costs | | | 1,850 | | 1.2 | | | | — | | — | | | | — | | — | |
Write-off of acquired in-process R&D | | | — | | — | | | | 2,800 | | 1.1 | | | | 2,800 | | 0.9 | |
| | | | | | | | | | | | | | | | | | |
| | $ | 112,696 | | 71.7 | % | | $ | 92,138 | | 37.3 | % | | $ | 107,746 | | 34.4 | % |
| | | | | | | | | | | | | | | | | | |
Selling, Service and Administration
Selling, service and administration (SS&A) expenses for the twelve months ended March 28, 2009 were $51.3 million compared to $52.3 million for the ten months ended March 29, 2008. This $1.0 million decrease reflects cost savings realized from restructuring actions and cost management activities partially offset by the two-month differential in reporting periods, and increases of $0.4 million due to equity compensation and $0.3 million attributable to assuming NWR operations. In addition, purchase accounting expenses relating to the NWR acquisition decreased $0.3 million.
SS&A expenses for the twelve months ended March 28, 2009 decreased $10.2 million compared to $61.5 million for the pro forma twelve months ended March 29, 2008. This decrease reflects cost savings realized from restructuring actions and cost management activities.
32
Research, Development and Engineering
Research, development and engineering (RD&E) expenses for the twelve months ended March 28, 2009 were $38.2 million compared to $36.1 million for the ten months ended March 29, 2008. This increase is primarily due to the two month differential in reporting periods, increases in equity compensation, and the addition of NWR for a full year. Additionally, fiscal 2009 included a $4.1 million charge incurred during the fourth quarter to write-off material from an RD&E program due to a change in our product development strategy. Excluding these impacts, RD&E expense was lower in fiscal 2009 than fiscal 2008, which was the result of cost savings realized from restructuring and cost management efforts.
RD&E expenses for the twelve months ended March 28, 2009 decreased $4.3 million compared to $42.5 million for the pro forma twelve months ended March 29, 2008. Apart from the $4.1 million charge to write-off materials, expenses decreased $8.4 million, primarily due to cost management and restructuring actions.
Goodwill Impairment Charge
Our stock price and market capitalization declined substantially during the third quarter of 2009. As a result, we reviewed the recoverability of goodwill as of December 27, 2008 and recognized an impairment charge of $17.4 million. This charge was reflected as “Goodwill impairment charge” in the accompanying Consolidated Statement of Operations for the year ended March 28, 2009. This charge was not deductible for income tax purposes and had no effect on our cash flows or liquidity.
Restructuring Costs
Restructuring costs incurred during the twelve months ended March 28, 2009 totaled $4.0 million, compared to $1.0 million during the ten months ended March 29, 2008 and pro forma twelve months ended March 29, 2008. The fiscal 2008 costs were incurred in the fourth quarter as the result of actions taken in response to weakness in memory markets and reductions in capital spending. These trends worsened during fiscal 2009 amid the global economic recession, and as a result, we took additional actions, resulting in $4.0 million of restructuring costs for the twelve months ended March 28, 2009. See Note 24 “Restructuring and Cost Management Plans” to the Consolidated Financial Statements in Item 8 Financial Statements and Supplementary Data for additional information.
Merger Transaction Costs
Merger transaction costs of $1.9 million included in operating expenses for the twelve months ended March 28, 2009 represent expenses incurred in connection with a terminated merger. The merger was originally announced on October 16, 2008. On January 20, 2009, the company we were to acquire announced that its Board of Directors had withdrawn its recommendation in favor of the merger agreement, and during the fourth quarter of 2009, we elected to pursue termination of the agreement. As a result, we recognized $1.9 million of merger-related expenses as operating expenses during the fourth quarter of 2009. No such charges occurred during the ten months ended March 29, 2008 or pro forma twelve months ended March 29, 2008.
Write-off of Acquired In-process Research & Development
In fiscal 2008, $2.8 million allocated to NWR’s in-process research and development was written off at the date of the acquisition. The acquired in-process research and development related to three programs: development of a diode-pumped solid-state LED wafer-scribing system, a next-generation Advanced Beam Delivery System and a next-generation laser product. The value of the in-process research and development was based on the excess earnings method of the income approach, which measures the value of an asset by calculating the present value of related future economic benefits, such as cash earnings. In determining the value of in-process research and development, the assumed commercialization date for these products was April 2008.
33
Commercialization of the diode-pumped solid-state LED wafer-scribing system and the next-generation laser product began in the first half of fiscal 2009 and development of the Advanced Beam Delivery System was ceased during the second quarter of 2009. The modeled cash flow was discounted back to the net present value and was based on estimates of revenues and operating profits related to the project. Significant assumptions and estimates used in the valuation of in-process research and development included stage of project development, future revenues, life of the product’s underlying technology, future operating expenses, and a discount rate of 18%.
Non-operating Income and Expense
Other-than-temporary Impairment of Auction Rate Investments
For the twelve months ended March 28, 2009, we recorded other-than-temporary impairment charges of $13.6 million in the results of operations related to our ARS. These charges were recorded throughout fiscal 2009 as the instability of the global financial markets during the year created a prolonged period of decline in the values of ARS. See Note 6 “Fair Value Measurements” to the Consolidated Financial Statements in Item 8 Financial Statements and Supplementary Data for further discussion.
Interest and Other Income, net
For the twelve months ended March 28, 2009, net interest and other income was $3.2 million, compared to $6.5 million and $8.3 million for the ten months ended March 29, 2008 and pro forma twelve months ended March 29, 2008, respectively. The decreases were primarily the result of decreases in interest income, largely due to market-driven decreases in yields.
Income Taxes
The income tax benefit recorded for the twelve months ended March 28, 2009 was $13.6 million on pretax loss of $64.7 million, an effective rate of 21.1%. In the ten-month fiscal year ended March 29, 2008, the income tax provision recorded was $9.9 million on pretax income of $26.5 million, which represented an effective tax rate of 37.4%. The change in the effective tax rate is primarily related to the 2009 goodwill impairment charge of $17.4 million which was not deductible for US tax purposes as well as an increase in the valuation allowance on certain deferred tax assets. The increase to the valuation allowance was required as the unrealized capital losses arising from the $13.6 million write-down of our auction rate securities will only be deductible when realized to the extent of future capital gain income.
Net (Loss) Income
As a result of the factors discussed above, net loss in fiscal 2009 was $51.0 million, or $1.89 per basic and diluted share, compared to net income of $16.6 million, or $0.59 per basic and diluted share in the ten-month fiscal year ended March 29, 2008 and compared to net income of $25.9 million, or $0.92 per basic share and $0.91 per diluted share on a pro forma basis for the twelve months ended March 29, 2008.
Financial Condition and Liquidity
At April 3, 2010, our principal sources of liquidity were cash and cash equivalents of $39.3 million, short-term investments of $116.1 million and accounts receivable of $38.1 million. We also held $10.8 million in restricted cash which represented collateral for commercial letters of credit. At April 3, 2010, we had a current ratio of 6.9 and held no long-term debt. Working capital of $253.7 million was up slightly compared to the March 28, 2009 balance of $246.9 million.
On May 15, 2008, the Board of Directors authorized a share repurchase program totaling $20.0 million to acquire shares of the Company’s outstanding common stock primarily to offset dilution from equity
34
compensation programs. Repurchases under the program are to be made at management’s discretion in the open market or in privately negotiated transactions in compliance with applicable securities laws and other legal requirements and are subject to market conditions, share price and other factors. During the year ended April 3, 2010, we repurchased 64,960 shares for $0.6 million under this program at an average price per share of $8.55, calculated inclusive of commissions and fees. As of April 3, 2010, a total of 372,825 shares have been repurchased for $5.3 million under this authorization at an average price of $14.16 per share, calculated inclusive of commissions and fees. Cash used to settle repurchase transactions is reflected as a component of cash used in financing activities in the Consolidated Statements of Cash Flows. There is no fixed completion date for the repurchase program.
As of April 3, 2010, we held a total of $13.7 million invested in auction rate securities (ARS) at par value. Additionally, we held $4.0 million of par value ARS which were converted by the bond issuer to its preferred stock during the third quarter of 2009. The ARS are comprised predominately of securities issued by insurance companies to raise funds to meet regulatory capital reserve requirements and the ARS assume the credit ratings of the bond insurers who guarantee the timely payment of principal and interest on these insured securities. At the time of purchase in fiscal 2007, these ARS were rated AAA and AA. The contractual maturities of these securities range up to calendar year 2050, and several securities and the preferred stock do not have stated maturities. These securities previously provided short-term liquidity through a Dutch auction process that reset the applicable interest rate at pre-determined calendar intervals, generally every 28 to 35 days. This mechanism previously allowed existing investors to either retain or liquidate their holdings by selling such securities at par. During the second quarter of fiscal 2008, as a result of the liquidity issues experienced in the global credit and capital markets, our ARS began to experience failed auctions.
Since that time, none of our ARS have traded through the auction process and few market transactions for these securities have been observed. Additionally, the bond insurers of the ARS and preferred stock experienced credit rating downgrades throughout fiscal 2009. Consequently, it was determined that the declines in fair value of these securities during fiscal 2009 represented other-than-temporary impairments in accordance with U.S. generally accepted accounting principles. Accordingly, the cost bases of these securities were written down to their estimated fair values with an other-than-temporary impairment charge of $13.6 million for the year ended March 28, 2009.
During the third quarter of 2010, we sold certain ARS for approximately $1.4 million pursuant to a tender agreement with the parent company of the securities’ original issuer. The ARS had an original par value of $1.9 million and had been written down to an estimated fair value of $1.6 million as of the beginning of the third quarter of 2010. As a result of the sale, we reclassified $0.3 million of previously recorded unrealized net gains out of accumulated other comprehensive income.
During the fourth quarter of 2010, the issuer of the preferred stock discontinued dividend payments and the credit quality of certain bond insurers of the ARS declined. Due to these developments, we recognized an other-than-temporary impairment charge of $1.3 million during the year ended April 3, 2010. The $5.0 million estimated fair value of our remaining ARS is classified as a non-current asset on the Consolidated Balance Sheet at April 3, 2010, consistent with the classification at March 28, 2009.
We currently continue to receive all interest payments on our ARS when due, but cannot predict if or when dividend payments on our preferred stock will resume. Additionally, we cannot predict if or when our remaining ARS will become liquid.
Sources and Uses of Cash
Net cash flows provided by operating activities totaled $2.9 million for the year ended April 3, 2010. Significant impacts to cash flows for the year were the net loss of $12.0 million, adjusted for non-cash items
35
totaling $11.2 million, offset by $3.6 million in net improvements within working capital. Net decreases in inventories provided operating cash of $11.9 million and net increases in accounts payable and accrued liabilities provided $9.0 million, while net increases in trade receivables consumed $19.1 million.
For the year ended April 3, 2010, net cash used in investing activities of $119.0 million was primarily due to the purchase of securities of $282.1 million and increases in restricted cash of $10.8 million, offset by $169.6 million in proceeds from sales and maturities of securities and $7.7 million provided by decreases in other assets, which primarily reflected the substitution of letters of credit for the cash bond previously held by the Kaohsiung District Court of Taiwan. Purchases of property, plant and equipment totaled $3.2 million. Net cash provided by financing activities of $0.8 million was attributable to $1.4 million of proceeds from stock plans less $0.6 million used for share repurchases.
We believe that our existing cash, cash equivalents and short-term investments are adequate to fund our operations, share repurchase program and contractual obligations for at least the next twelve months.
Contractual Obligations
The contractual commitments and obligations below represent our estimates of future payments under fixed contractual obligations and commitments. The actual payments may differ from these estimates due to changes in our business needs, cancellation provisions, and other factors. We cannot provide certainty regarding the timing of the payment schedule and the amounts of payments.
The following table summarizes our contractual commitments and obligations as of April 3, 2010, by the fiscal year in which they are due:
| | | | | | | | | | | | | | | | | | | | | |
(In thousands) | | Total | | 2011 | | 2012 | | 2013 | | 2014 | | 2015 | | Thereafter |
Purchase commitments | | $ | 25,580 | | $ | 24,282 | | $ | 1,298 | | $ | — | | $ | — | | $ | — | | $ | — |
Derivative financial instruments, net | | | 2,797 | | | 2,797 | | | — | | | — | | | — | | | — | | | — |
Operating leases | | | 4,426 | | | 2,267 | | | 1,215 | | | 614 | | | 252 | | | 72 | | | 6 |
| | | | | | | | | | | | | | | | | | | | | |
| | $ | 32,803 | | $ | 29,346 | | $ | 2,513 | | $ | 614 | | $ | 252 | | $ | 72 | | $ | 6 |
| | | | | | | | | | | | | | | | | | | | | |
This table does not include $7.5 million of unrecognized tax benefits due to the uncertainty with respect to the timing of future cash flows as of April 3, 2010. We are unable to make reasonably reliable estimates of the period of cash settlement with the respective taxing authorities and the total amounts of income tax payable and the timing of such tax payments may depend on the resolution of current and future tax examinations which cannot be estimated.
Derivative financial instruments represent various forward exchange contracts to hedge foreign currency transactions. Amounts are presented above in U.S. dollars, translated at exchange rates on April 3, 2010 and are a net presentation of amounts expected to be received and paid upon settlement of these contracts. Purchase commitments represent obligations under open purchase orders, primarily for inventory, issued in the normal course of business.
Critical Accounting Policies and Estimates
The preparation of our financial statements requires us to make estimates and judgments that affect the reported amounts of assets, liabilities, revenues and expenses. Our estimates are based on historical experience and on various assumptions that we believe to be reasonable under the circumstances. These estimates form the basis for judgments about the carrying values of assets and liabilities that are not readily apparent from other sources. See Note 2 “Summary of Significant Accounting Policies” to the Consolidated Financial Statements in Item 8 Financial Statements and Supplementary Data for additional information.
36
Our critical accounting policies and estimates include the following:
| | • | | product warranty reserves; |
| | • | | allowance for doubtful accounts; |
| | • | | share-based compensation; |
| | • | | income taxes including the valuation of deferred tax assets; |
| | • | | fair value measurements; |
| | • | | valuation of cost method equity investments; |
| | • | | valuation of long-lived assets; and |
Revenue Recognition
We recognize revenue when persuasive evidence of an arrangement exists, delivery has occurred or the services have been rendered, the sales price is fixed or determinable and collection of the related receivable is reasonably assured. Title and risk of loss generally pass to the customer at the time of delivery of the product to a common carrier. Revenue is recognized upon such delivery, provided that fulfillment of acceptance criteria can be demonstrated prior to shipment. Where the acceptance criteria cannot be demonstrated prior to shipment, or in the case of substantially new products, revenue is deferred until acceptance has been received. For multiple element arrangements, the fair values of any undelivered elements are deferred until the elements are delivered and acceptance criteria are met. Revenues are recorded net of taxes collected which are required to be submitted to government authorities. Installation services are not essential to the functionality of the delivered equipment and installation revenue is deferred until installation is complete. Historically, neither the costs of installation accrued nor the fair value of installation service revenue deferred has been material.
Revenues associated with sales to customers under local contracts in Japan are recognized upon title transfer, which generally occurs upon customer acceptance. Prior to the second quarter of 2009, the Company additionally sold product directly to its distributor in Japan and title generally transferred upon shipment, subject to the Company’s standard revenue recognition policy. In fiscal 2009, the Company discontinued this sales model and had no such sales directly to distributors subsequent to the first quarter of 2009.
Revenues related to spare parts and consumable sales are generally recognized upon shipment. Revenues related to maintenance and service contracts are recognized ratably over the duration of the contracts.
Inventory Valuation
We regularly evaluate the value of our inventory based on a combination of factors including, but not limited to, the following: forecasted sales or usage, historical usage rates, estimated service period, product end-of-life dates, estimated current and future market values, service inventory requirements and new product introductions. Purchasing requirements and alternative uses for the inventory are explored within these processes to mitigate inventory exposure. Raw materials with quantities in excess of forecasted usage are reviewed quarterly for obsolescence by our engineering and operating personnel. Raw material obsolescence write-downs are typically caused by engineering change orders or product end-of-life adjustments in the market.
37
Research and development product costs are generally expensed as incurred. Engineering materials that are expected to provide future value are generally classified as raw materials inventory. During the fourth quarter of 2009, we recorded a $4.1 million charge to write off material from an RD&E program due to a change in our product development strategy. This charge was recorded as engineering project expense.
Finished goods are reviewed quarterly by product marketing and operating personnel to determine if inventory carrying costs exceed market selling prices. When necessary, we record inventory write-downs as an increase to cost of sales based on the above factors and take into account worldwide quantities and forecasted demand into our analysis. If circumstances related to our inventories change, our estimates of the value of inventory could materially change.
Product Warranty Reserves
We evaluate obligations related to product warranties quarterly. A standard one-year warranty is provided on most products. Warranty charges are comprised of costs to service the warranty, including labor to repair the system and replacement parts for defective items, as well as other costs incidental to the repairs. Warranty charges are recorded net of any cost recoveries resulting from either successful repair of damaged parts or from warranties offered by our suppliers for defective components. Using historical data, we estimate average warranty cost per system or part type and record the provision for such charges as an element of cost of goods sold upon recognition of the related revenue. Additionally, the overall warranty accrual balance is separately analyzed using the remaining warranty periods outstanding on systems and items under warranty, and any resulting changes in estimates are recorded as an adjustment to cost of sales. If circumstances change, or if a significant change in warranty-related incidents occurs, the impact of the change in the warranty accrual could be material. Accrued product warranty is included on the Consolidated Balance Sheets as a component of accrued liabilities.
Allowance for Doubtful Accounts
Credit limits are established by reviewing the financial history and stability of each customer. Where appropriate, we obtain credit rating reports and financial statements of the customer to establish and modify their credit limits. On certain foreign sales, we require letters of credit. We regularly evaluate the collectability of our trade receivable balances based on a combination of factors. When a customer’s account becomes past due, we talk with the customer to determine the cause. If we determine that a customer will be unable to fully meet its financial obligation to us, such as in the case of a bankruptcy filing or other material events impacting its business, we record a specific reserve for bad debt to reduce the related receivable to the amount we expect to recover given all information then available. If circumstances related to specific customers change, our estimates of the recoverability of receivables could materially change. We record estimated bad debt expense as an increase to selling, service and administration expenses. As of April 3, 2010, our allowance for doubtful accounts totaled $0.7 million and we did not incur bad-debt expense during fiscal 2010.
Share-Based Compensation
We measure and recognize compensation expense for all share-based payment awards granted to our employees and directors, including employee stock options, stock-settled stock appreciation rights (SARs), non-vested restricted stock units and purchases under the employee stock purchase plan, based on the estimated fair value of the award on the grant date. We use the Black-Scholes valuation model as our method of valuation for stock option and SAR awards.
The use of the Black-Scholes valuation model to estimate the fair value of stock option and SAR awards requires us to make assumptions regarding the risk-free interest rate, expected dividend yield, expected term and expected volatility over the expected term of the award. The assumptions used in calculating the fair value of share-based payment awards represent management’s best estimates based on our historical data, but these estimates involve inherent uncertainties and the recognition of expense could be materially different in the future.
38
Compensation expense is only recognized on awards that are estimated to ultimately vest. Therefore, based on historical forfeiture rates and patterns, the estimated future forfeitures are factored into the compensation expense to be recognized over the vesting period. We update our forfeiture estimates at least annually and recognize any changes to accumulated compensation expense in the period of change. If actual forfeitures differ significantly from our estimates, our results of operations could be materially impacted.
Income Taxes
We are subject to income taxes in the United States and in numerous foreign jurisdictions and in the ordinary course of business, there are transactions and calculations where the ultimate tax determination is uncertain. The Company reports a liability for unrecognized tax benefits resulting from uncertain tax positions taken or expected to be taken in a tax return. The Company recognizes interest and penalties, if any, related to the unrecognized tax benefits in income tax expense.
Deferred tax assets and liabilities are measured using enacted tax rates expected to apply to taxable income in the years in which those assets and liabilities are expected to be recovered or settled. The effect on deferred taxes of a change in tax rates is recognized in income in the period that includes the enactment date. When management determines that it is more likely than not that a deferred tax asset will not be fully realized, a valuation allowance is established to reduce deferred tax assets to the amount expected to be realized. Should management’s assumptions and expectations be inaccurate, our results of operations and financial condition could be adversely affected in future periods. At April 3, 2010, our net deferred tax assets totaled $38.3 million, which was net of a valuation allowance of $9.5 million.
Fair Value Measurements
Effective March 29, 2009, we adopted the provisions of Statement of Financial Accounting Standards (SFAS) No. 157 pertaining to nonfinancial assets and liabilities. We had adopted the provisions of SFAS No. 157 pertaining to financial assets and liabilities as of March 30, 2008. The adoption of SFAS No. 157 did not have a material impact on the Company’s financial statements. SFAS No. 157 was incorporated into Financial Accounting Standards Board (FASB) Accounting Standards Codification (ASC) Topic 820 “Fair Value Measurements and Disclosures” (ASC Topic 820).
In April 2009, the FASB issued FASB Staff Position (FSP) FAS No. 157-4; FSP FAS No. 115-2 and FAS No. 124-2; and FSP No. 107 and APB No. 28-1. FSP FAS No. 157-4 provides guidance on how to determine the fair value of assets and liabilities under SFAS No. 157 when there is no active market, and reaffirms the SFAS No. 157 objective to reflect an asset’s sale price in an orderly transaction at the date of the financial statements. FSP FAS No. 157-4 was incorporated into the ASC within ASC Topic 820. FSP FAS No. 115-2 and FAS No. 124-2 modifies the requirements for recognizing other-than-temporarily impaired debt securities and revises the existing impairment model for such securities, by distinguishing between credit and non-credit components of impaired debt securities that are not expected to be sold. FSP FAS No. 115-2 and FAS No. 124-2 was incorporated into the ASC within ASC Topic 320. FSP FAS No. 107-1 and APB No. 28-1 enhances disclosures about fair value for instruments under the scope of SFAS No. 157 for both interim and annual periods. FSP FAS No. 107-1 and APB No. 28-1 was incorporated into the ASC within ASC Topic 825 “Financial Instruments”. We adopted these Staff Positions as of the first quarter of 2010.
In January 2010, the FASB issued ASC Accounting Standards Update (ASU) 2010-06 “Improving Disclosures about Fair Value Measurements” (ASC ASU 2010-06). ASC ASU 2010-06 requires various additional disclosures regarding fair value measurements, including the amounts of significant transfers between Level 1 and Level 2 of the fair value hierarchy, the reasons for any transfers in or out of Level 3, and a gross basis of presentation for purchases, sales, issuances and settlements within the Level 3 activity rollforward. The ASC became effective for the fourth quarter of 2010, except for the disclosures about purchases, sales, issuances
39
and settlements within the Level 3 activity rollforward, which will be effective for the first quarter of 2012. Our adoption of the ASC did not have a material impact on our financial statements, nor will the adoption of the remaining provisions of the ASC.
Because none of our auction rate securities have traded through the auction process and few market transactions have been observed for these securities, estimated fair values were based primarily upon the income approach using a discounted cash flow model which took into account the following: (i) the underlying structure of each security; (ii) the present value of future principal and interest payments discounted at rates that reflect current market conditions; (iii) consideration of the probabilities of default, restructuring or redemption by the issuer (trigger events); (iv) estimates of the recovery rates in the event of default for each security; (v) the financial condition, results, ratings of and financial claims on the bond insurers and issuers; and (vi) the underlying trust assets of the securities.
Valuation of Cost Method Equity Investments
Minority equity investments include $6.0 million invested in Series D Preferred Stock and $2.2 million invested in Series E Preferred Stock of OmniGuide, Inc., representing an 11% interest. At each reporting period, we determine whether events or circumstances have occurred that are likely to have a significant adverse effect on the fair value of these investments. If there are no events or circumstances identified that would adversely affect the fair value of the investments, the fair values of the investments are not calculated as it is not practicable to do so. As of April 3, 2010, we had not identified any events or circumstances that indicated the investments were impaired; therefore, the full carrying value of $8.2 million was included in Other assets on the Consolidated Balance Sheet.
Valuation of Long-Lived Assets
Long-lived assets, principally property and equipment and identifiable intangibles held and used by us, are reviewed for impairment whenever events or circumstances indicate that the carrying amount of assets may not be recoverable. We evaluate recoverability of assets to be held and used by comparing the carrying amount of an asset to estimated future net undiscounted cash flows to be generated by the asset. If such assets are considered to be impaired, the impairment recognized is measured as the amount by which the carrying amount of the assets exceeds the fair value of the assets.
Valuation of Goodwill
Goodwill is tested for impairment at least annually. Fair value is determined based on a method that compares our market capitalization against the net book value of our assets. Based on the results of the fiscal 2009 impairment test, we recognized an impairment charge of $17.4 million to write-off all existing goodwill in fiscal 2009.
| Item 7A. | Quantitative and Qualitative Disclosures about Market Risk |
Interest Rate Risk
We maintain a short-term and long-term investment portfolio consisting of commercial paper, U.S. government agency notes, corporate bonds and auction rate securities. These securities are subject to interest rate risk and will decline in value if interest rates increase. The majority of these securities are classified as available for sale securities; therefore, the impact on fair value of interest rate changes is reflected as a separate component of shareholders’ equity. Due to the short duration of our investment portfolio, an immediate 10% change in interest rates would not have a material effect on the fair value of our invested assets; however, interest income on invested assets over a twelve-month period would change by approximately $0.1 million.
40
Investment Risk
As of April 3, 2010, we held a total of $13.7 million invested in auction rate securities (ARS) at par value. Additionally, we held $4.0 million of par value ARS which were converted by the bond issuer to its preferred stock during the third quarter of 2009. The ARS are comprised predominately of securities issued by insurance companies to raise funds to meet regulatory capital reserve requirements and the ARS assume the credit ratings of the bond insurers who guarantee the timely payment of principal and interest on these insured securities. At the time of purchase in fiscal 2007, these ARS were rated AAA and AA. The contractual maturities of these securities range up to calendar year 2050, and several securities and the preferred stock do not have stated maturities. These securities previously provided short-term liquidity through a Dutch auction process that reset the applicable interest rate at pre-determined calendar intervals, generally every 28 to 35 days. This mechanism previously allowed existing investors to either retain or liquidate their holdings by selling such securities at par. During the second quarter of 2008, as a result of the liquidity issues experienced in the global credit and capital markets, our ARS began to experience failed auctions.
Since that time, none of our ARS have traded through the auction process and few market transactions for these securities have been observed. Additionally, the bond insurers of the ARS and preferred stock experienced credit rating downgrades throughout fiscal 2009. Consequently, it was determined that the declines in fair value of these securities during fiscal 2009 represented other-than-temporary impairments in accordance with U.S. generally accepted accounting principles. Accordingly, the cost bases of these securities were written down to their estimated fair values with an other-than-temporary impairment charge of $13.6 million for the year ended March 28, 2009.
During the third quarter of 2010, we sold certain ARS for approximately $1.4 million pursuant to a tender agreement with the parent company of the securities’ original issuer. The ARS had an original par value of $1.9 million and had been written down to an estimated fair value of $1.6 million as of the beginning of the third quarter of 2010. As a result of the sale, we reclassified $0.3 million of previously recorded unrealized net gains out of accumulated other comprehensive income.
During the fourth quarter of 2010, the issuer of the preferred stock discontinued dividend payments and the credit quality of certain bond insurers of the ARS declined further. Due to these developments, we recognized an other-than-temporary impairment charge of $1.3 million during the year ended April 3, 2010. The $5.0 million estimated fair value of our remaining ARS is classified as a non-current asset on the Consolidated Balance Sheet at April 3, 2010, consistent with the classification at March 28, 2009.
We currently continue to receive all interest payments on our ARS when due, but cannot predict if or when dividend payments on our preferred stock will resume. Additionally, we cannot predict if or when our remaining ARS will become liquid.
Foreign Currency Exchange Rate Risk
We purchase derivative financial instruments on a limited basis and do not use them for trading purposes. We do, however, use derivatives to manage well-defined foreign currency risks. We enter into forward exchange contracts to hedge the value of material non-functional currency monetary asset and liability balances. The net effect of an immediate 10% change in exchange rates on the forward exchange contracts and the underlying hedged positions would not be material to our financial position or the results of our operations.
41
The table below summarizes, by currency, the notional amounts of our forward exchange contracts in U.S. dollars as of April 3, 2010 and March 28, 2009. The “bought” amounts represent the net U.S. dollar equivalents of commitments to purchase foreign currencies, and the “sold” amounts represent the net U.S. dollar equivalent of commitments to sell foreign currencies. The foreign currency amounts have been translated into a U.S. dollar equivalent value using the exchange rate at the reporting date.
| | | | | | | | |
| | | Bought (Sold) | |
(In thousands) | | 2010 | | | 2009 | |
Japanese yen | | $ | 4,719 | | | $ | 5,573 | |
Taiwan Dollar | | | 1,985 | | | | 4,432 | |
Korean Won | | | (2,324 | ) | | | (1,422 | ) |
British Pound | | | (2,087 | ) | | | (4,068 | ) |
Euro | | | 504 | | | | (249 | ) |
| | | | | | | | |
| | $ | 2,797 | | | $ | 4,266 | |
| | | | | | | | |
42
| Item 8. | Financial Statements and Supplementary Data |
REPORT OF INDEPENDENT REGISTERED PUBLIC ACCOUNTING FIRM
The Board of Directors and Shareholders of
Electro Scientific Industries, Inc.:
We have audited the accompanying consolidated balance sheets of Electro Scientific Industries, Inc. and subsidiaries as of April 3, 2010 and March 28, 2009, and the related consolidated statements of operations, shareholders’ equity and comprehensive income (loss), and cash flows for the years ended April 3, 2010 and March 28, 2009, and the ten-month period ended March 29, 2008. These consolidated financial statements are the responsibility of the Company’s management. Our responsibility is to express an opinion on these consolidated financial statements based on our audits.
We conducted our audits in accordance with the standards of the Public Company Accounting Oversight Board (United States). Those standards require that we plan and perform the audit to obtain reasonable assurance about whether the financial statements are free of material misstatement. An audit includes examining, on a test basis, evidence supporting the amounts and disclosures in the financial statements. An audit also includes assessing the accounting principles used and significant estimates made by management, as well as evaluating the overall financial statement presentation. We believe that our audits provide a reasonable basis for our opinion.
In our opinion, the consolidated financial statements referred to above present fairly, in all material respects, the financial position of Electro Scientific Industries, Inc. and subsidiaries as of April 3, 2010 and March 28, 2009, and the results of their operations and their cash flows for the years ended April 3, 2010 and March 28, 2009, and the ten-month period ended March 29, 2008, in conformity with U.S. generally accepted accounting principles.
We also have audited, in accordance with the standards of the Public Company Accounting Oversight Board (United States), Electro Scientific Industries, Inc’s internal control over financial reporting as of April 3, 2010, based on criteria established inInternal Control—Integrated Framework issued by the Committee of Sponsoring Organizations of the Treadway Commission (COSO), and our report dated June 15, 2010 expressed an unqualified opinion on the effectiveness of the Company’s internal control over financial reporting.
|
| /s/ KPMG LLP |
|
| Portland, Oregon |
| June 15, 2010 |
43
ELECTRO SCIENTIFIC INDUSTRIES, INC. AND SUBSIDIARIES
CONSOLIDATED BALANCE SHEETS
As of April 3, 2010 and March 28, 2009
| | | | | | | | |
(In thousands) | | 2010 | | | 2009 | |
ASSETS | | | | | | | | |
Current assets: | | | | | | | | |
Cash and cash equivalents | | $ | 39,335 | | | $ | 153,538 | |
Restricted cash | | | 10,824 | | | | — | |
Short-term investments | | | 116,140 | | | | 2,380 | |
| | | | | | | | |
Total cash, restricted cash and investments | | | 166,299 | | | | 155,918 | |
| | |
Trade receivables, net of allowances of $697 and $969 | | | 38,061 | | | | 18,847 | |
Inventories | | | 72,090 | | | | 84,882 | |
Shipped systems pending acceptance | | | 4,106 | | | | 2,072 | |
Deferred income taxes, net | | | 7,232 | | | | 6,298 | |
Other current assets | | | 8,677 | | | | 10,594 | |
| | | | | | | | |
Total current assets | | | 296,465 | | | | 278,611 | |
Non-current assets: | | | | | | | | |
Auction rate securities | | | 5,021 | | | | 6,007 | |
Property, plant and equipment, net | | | 40,590 | | | | 43,005 | |
Non-current deferred income taxes, net | | | 31,079 | | | | 22,620 | |
Acquired intangible assets, net | | | 8,255 | | | | 9,972 | |
Other assets | | | 13,008 | | | | 24,032 | |
| | | | | | | | |
Total assets | | $ | 394,418 | | | $ | 384,247 | |
| | | | | | | | |
LIABILITIES AND SHAREHOLDERS’ EQUITY | | | | | | | | |
Current liabilities: | | | | | | | | |
Accounts payable | | $ | 14,607 | | | $ | 7,492 | |
Accrued liabilities | | | 14,937 | | | | 12,958 | |
Deferred revenue | | | 13,193 | | | | 11,251 | |
| | | | | | | | |
Total current liabilities | | | 42,737 | | | | 31,701 | |
Non-current liabilities: | | | | | | | | |
Income taxes payable | | | 9,019 | | | | 9,023 | |
Commitments and contingencies (Notes 18 and 21) | | | | | | | | |
Shareholders’ equity: | | | | | | | | |
Preferred stock, without par value; 1,000 shares authorized; no shares issued | | | — | | | | — | |
Common stock, without par value; 100,000 shares authorized;
27,665 and 27,184 issued and outstanding | | | 142,369 | | | | 133,808 | |
Retained earnings | | | 199,486 | | | | 211,085 | |
Accumulated other comprehensive income related to auction rate securities | | | 1,301 | | | | — | |
Accumulated other comprehensive loss, other | | | (494 | ) | | | (1,370 | ) |
| | | | | | | | |
Total shareholders’ equity | | | 342,662 | | | | 343,523 | |
| | | | | | | | |
Total liabilities and shareholders’ equity | | $ | 394,418 | | | $ | 384,247 | |
| | | | | | | | |
See Accompanying Notes to Consolidated Financial Statements
44
ELECTRO SCIENTIFIC INDUSTRIES, INC. AND SUBSIDIARIES
CONSOLIDATED STATEMENTS OF OPERATIONS
For the year ended April 3, 2010, year ended March 28, 2009 and ten months ended March 29, 2008
| | | | | | | | | | | |
(In thousands, except per share amounts) | | 2010 | | | 2009 | | | 2008 |
Net sales | | $ | 148,893 | | | $ | 157,313 | | | $ | 247,155 |
Cost of sales | | | 93,028 | | | | 98,895 | | | | 135,014 |
| | | | | | | | | | | |
Gross profit | | | 55,865 | | | | 58,418 | | | | 112,141 |
Operating expenses: | | | | | | | | | | | |
Selling, service and administration | | | 48,536 | | | | 51,260 | | | | 52,262 |
Research, development and engineering | | | 33,618 | | | | 38,179 | | | | 36,104 |
Goodwill impairment charge | | | — | | | | 17,396 | | | | — |
Restructuring costs | | | — | | | | 4,011 | | | | 972 |
Merger (termination proceeds) transaction costs, net | | | (4,516 | ) | | | 1,850 | | | | — |
Write-off of acquired in-process research and development | | | — | | | | — | | | | 2,800 |
| | | | | | | | | | | |
Net operating expenses | | | 77,638 | | | | 112,696 | | | | 92,138 |
| | | | | | | | | | | |
Operating (loss) income | | | (21,773 | ) | | | (54,278 | ) | | | 20,003 |
Non-operating income (expense): | | | | | | | | | | | |
Other-than-temporary impairment of auction rate securities | | | (1,347 | ) | | | (13,593 | ) | | | — |
Interest and other income, net | | | 1,358 | | | | 3,194 | | | | 6,509 |
| | | | | | | | | | | |
Total non-operating income (expense) | | | 11 | | | | (10,399 | ) | | | 6,509 |
| | | | | | | | | | | |
(Loss) income before income taxes | | | (21,762 | ) | | | (64,677 | ) | | | 26,512 |
(Benefit from) provision for income taxes | | | (9,778 | ) | | | (13,627 | ) | | | 9,923 |
| | | | | | | | | | | |
Net (loss) income | | $ | (11,984 | ) | | $ | (51,050 | ) | | $ | 16,589 |
| | | | | | | | | | | |
Net (loss) income per share—basic | | $ | (0.44 | ) | | $ | (1.89 | ) | | $ | 0.59 |
| | | | | | | | | | | |
Net (loss) income per share—diluted | | $ | (0.44 | ) | | $ | (1.89 | ) | | $ | 0.59 |
| | | | | | | | | | | |
Weighted average number of shares—basic | | | 27,449 | | | | 27,079 | | | | 27,929 |
| | | | | | | | | | | |
Weighted average number of shares—diluted | | | 27,449 | | | | 27,079 | | | | 28,323 |
| | | | | | | | | | | |
See Accompanying Notes to Consolidated Financial Statements
45
ELECTRO SCIENTIFIC INDUSTRIES, INC. AND SUBSIDIARIES
CONSOLIDATED STATEMENTS OF SHAREHOLDERS’ EQUITY
AND COMPREHENSIVE INCOME (LOSS)
For the year ended April 3, 2010, year ended March 28, 2009 and ten months ended March 29, 2008
| | | | | | | | | | | | | | | | | | | |
| | | Common Stock | | | Retained
Earnings | | | Accumulated
Comprehensive
Income (Loss) | | | Total
Shareholders’
Equity | |
(In thousands) | | Shares | | | Amount | | | | |
Balance at June 2, 2007 | | 28,766 | | | $ | 162,719 | | | $ | 245,546 | | | $ | 65 | | | $ | 408,330 | |
Share repurchases | | (1,975 | ) | | | (39,644 | ) | | | — | | | | — | | | | (39,644 | ) |
Stock plans: | | | | | | | | | | | | | | | | | | | |
Employee stock plans | | 321 | | | | 8,257 | | | | — | | | | — | | | | 8,257 | |
Tax benefit of stock options exercised | | — | | | | 85 | | | | — | | | | — | | | | 85 | |
Comprehensive income (loss): | | | | | | | | | | | | | | | | | | | |
Net income | | — | | | | — | | | | 16,589 | | | | — | | | | 16,589 | |
Net unrealized loss on securities (net of tax of $1,395) | | — | | | | — | | | | — | | | | (2,568 | ) | | | (2,568 | ) |
Cumulative translation adjustment (net of tax of ($601)) | | — | | | | — | | | | — | | | | 1,068 | | | | 1,068 | |
Accumulated other comprehensive income related to benefit plan obligations (net of tax of ($61)) | | — | | | | — | | | | — | | | | 123 | | | | 123 | |
| | | | | | | | | | | | | | | | | | | |
Comprehensive income | | | | | | | | | | | | | | | | | | 15,212 | |
| | | | | | | | | | | | | | | | | | | |
Balance at March 29, 2008 | | 27,112 | | | | 131,417 | | | | 262,135 | | | | (1,312 | ) | | | 392,240 | |
Share repurchases | | (308 | ) | | | (4,724 | ) | | | — | | | | — | | | | (4,724 | ) |
Stock plans: | | | | | | | | | | | | | | | | | | | |
Employee stock plans | | 380 | | | | 7,178 | | | | — | | | | — | | | | 7,178 | |
Tax impact of stock options exercised | | — | | | | (63 | ) | | | — | | | | — | | | | (63 | ) |
Comprehensive income (loss): | | | | | | | | | | | | | | | | | | | |
Net loss | | — | | | | — | | | | (51,050 | ) | | | — | | | | (51,050 | ) |
Net unrealized loss on securities (net of tax of $22) | | — | | | | — | | | | — | | | | (39 | ) | | | (39 | ) |
Reclassification of unrealized loss on auction rate securities (net of tax of ($1,407)) | | — | | | | — | | | | — | | | | 2,496 | | | | 2,496 | |
Cumulative translation adjustment (net of tax of $1,455) | | — | | | | — | | | | — | | | | (2,587 | ) | | | (2,587 | ) |
Accumulated other comprehensive income related to benefit plan obligations (net of tax of ($41)) | | — | | | | — | | | | — | | | | 72 | | | | 72 | |
| | | | | | | | | | | | | | | | | | | |
Comprehensive loss | | | | | | | | | | | | | | | | | | (51,108 | ) |
| | | | | | | | | | | | | | | | | | | |
Balance at March 28, 2009 as previously reported | | 27,184 | | | | 133,808 | | | | 211,085 | | | | (1,370 | ) | | | 343,523 | |
Cumulative-effect adjustment related to auction rate securities | | — | | | | — | | | | 385 | | | | (385 | ) | | | — | |
| | | | | | | | | | | | | | | | | | | |
Balance at March 29, 2009 as adjusted | | 27,184 | | | | 133,808 | | | | 211,470 | | | | (1,755 | ) | | | 343,523 | |
Share repurchases | | (65 | ) | | | (555 | ) | | | — | | | | — | | | | (555 | ) |
Stock plans: | | | | | | | | | | | | | | | | | | | |
Employee stock plans | | 546 | | | | 9,116 | | | | — | | | | — | | | | 9,116 | |
Comprehensive income (loss): | | | | | | | | | | | | | | | | | | | |
Net loss | | — | | | | — | | | | (11,984 | ) | | | — | | | | (11,984 | ) |
Net unrealized loss on securities (net of tax of $7) | | — | | | | — | | | | — | | | | (13 | ) | | | (13 | ) |
Net unrealized gain on auction rate securities | | — | | | | — | | | | — | | | | 2,004 | | | | 2,004 | |
Reclassification of unrealized gain on auction rate securities to earnings (net of tax of $178) | | — | | | | — | | | | — | | | | (317 | ) | | | (317 | ) |
Cumulative translation adjustment (net of tax of ($541)) | | — | | | | — | | | | — | | | | 962 | | | | 962 | |
Accumulated other comprehensive loss related to benefit plan obligations (net of tax of $42) | | — | | | | — | | | | — | | | | (74 | ) | | | (74 | ) |
| | | | | | | | | | | | | | | | | | | |
Comprehensive loss | | | | | | | | | | | | | | | | | | (9,422 | ) |
| | | | | | | | | | | | | | | | | | | |
Balance at April 3, 2010 | | 27,665 | | | $ | 142,369 | | | $ | 199,486 | | | $ | 807 | | | $ | 342,662 | |
| | | | | | | | | | | | | | | | | | | |
See Accompanying Notes to Consolidated Financial Statements
46
ELECTRO SCIENTIFIC INDUSTRIES, INC. AND SUBSIDIARIES
CONSOLIDATED STATEMENTS OF CASH FLOWS
For the year ended April 3, 2010, year ended March 28, 2009 and ten months ended March 29, 2008
| | | | | | | | | | | | |
(In thousands) | | 2010 | | | 2009 | | | 2008 | |
CASH FLOWS FROM OPERATING ACTIVITIES | | | | | | | | | | | | |
Net (loss) income | | $ | (11,984 | ) | | $ | (51,050 | ) | | $ | 16,589 | |
Adjustments to reconcile net (loss) income to cash provided by operating activities: | | | | | | | | | | | | |
Depreciation and amortization | | | 10,002 | | | | 10,343 | | | | 8,157 | |
Amortization of acquired intangible assets | | | 2,149 | | | | 2,393 | | | | 2,101 | |
Share-based compensation expense | | | 7,696 | | | | 4,378 | | | | 3,721 | |
Write-off of acquired in-process research and development | | | — | | | | — | | | | 2,800 | |
(Recovery of) provision for doubtful accounts | | | (31 | ) | | | 491 | | | | — | |
Loss on disposal of property and equipment | | | 15 | | | | 96 | | | | 115 | |
Other-than-temporary impairment of auction rate securities | | | 1,347 | | | | 13,593 | | | | — | |
Goodwill impairment charge | | | — | | | | 17,396 | | | | — | |
Deferred income taxes | | | (9,937 | ) | | | (11,167 | ) | | | 2,931 | |
Changes in operating accounts, net of acquisition: | | | | | | | | | | | | |
(Increase) decrease in trade receivables, net | | | (19,110 | ) | | | 38,935 | | | | 696 | |
Decrease (increase) in inventories | | | 11,918 | | | | 16,567 | | | | (18,218 | ) |
(Increase) decrease in shipped systems pending acceptance | | | (2,034 | ) | | | 511 | | | | (766 | ) |
Decrease (increase) in other current assets | | | 1,802 | | | | (3,462 | ) | | | 1,411 | |
Increase (decrease) in accounts payable and accrued liabilities | | | 8,999 | | | | (19,930 | ) | | | (2,986 | ) |
Increase (decrease) in deferred revenue | | | 2,023 | | | | (1,332 | ) | | | (1,310 | ) |
| | | | | | | | | | | | |
Net cash provided by operating activities | | | 2,855 | | | | 17,762 | | | | 15,241 | |
| | | |
CASH FLOWS FROM INVESTING ACTIVITIES | | | | | | | | | | | | |
Purchases of investments | | | (282,058 | ) | | | (870,612 | ) | | | (464,065 | ) |
Proceeds from sales and maturities of investments | | | 169,613 | | | | 870,935 | | | | 569,880 | |
Purchase of property, plant and equipment | | | (3,195 | ) | | | (3,094 | ) | | | (6,014 | ) |
Purchase of equipment and intellectual property | | | — | | | | (2,250 | ) | | | — | |
Increase in restricted cash | | | (10,824 | ) | | | — | | | | — | |
Cash paid for NWR, net of cash acquired | | | — | | | | — | | | | (36,159 | ) |
Minority equity investment | | | (193 | ) | | | (876 | ) | | | (1,115 | ) |
Proceeds from sale of minority equity investment | | | — | | | | 4,884 | | | | — | |
Decrease (increase) in other assets | | | 7,702 | | | | 1,445 | | | | (2,589 | ) |
| | | | | | | | | | | | |
Net cash (used in) provided by investing activities | | | (118,955 | ) | | | 432 | | | | 59,938 | |
| | | |
CASH FLOWS FROM FINANCING ACTIVITIES | | | | | | | | | | | | |
Proceeds from exercise of stock options and stock plans | | | 1,377 | | | | 2,800 | | | | 4,535 | |
Share repurchases | | | (555 | ) | | | (4,724 | ) | | | (40,270 | ) |
Excess tax benefit of share-based compensation | | | — | | | | — | | | | 85 | |
| | | | | | | | | | | | |
Net cash provided by (used in) financing activities | | | 822 | | | | (1,924 | ) | | | (35,650 | ) |
Effect of exchange rate changes on cash | | | 1,075 | | | | (3,791 | ) | | | 1,068 | |
| | | | | | | | | | | | |
NET CHANGE IN CASH AND CASH EQUIVALENTS | | | (114,203 | ) | | | 12,479 | | | | 40,597 | |
CASH AND CASH EQUIVALENTS AT BEGINNING OF PERIOD | | | 153,538 | | | | 141,059 | | | | 100,462 | |
| | | | | | | | | | | | |
CASH AND CASH EQUIVALENTS AT END OF PERIOD | | $ | 39,335 | | | $ | 153,538 | | | $ | 141,059 | |
| | | | | | | | | | | | |
SUPPLEMENTAL CASH FLOW INFORMATION | | | | | | | | | | | | |
Cash paid for interest | | $ | (24 | ) | | $ | — | | | $ | (87 | ) |
Cash paid for income taxes | | | (2,167 | ) | | | (3,259 | ) | | | (8,698 | ) |
Income tax refunds received | | | 4,239 | | | | 2,893 | | | | 164 | |
See Accompanying Notes to Consolidated Financial Statements
47
ELECTRO SCIENTIFIC INDUSTRIES, INC.
NOTES TO CONSOLIDATED FINANCIAL STATEMENTS
1. The Company
Electro Scientific Industries, Inc. and its subsidiaries, all of which are wholly owned (collectively, the Company), provide high-technology manufacturing equipment to the global semiconductor and micro-electronics markets, including advanced laser systems that are used to micro-engineer electronic device features in high-volume production environments. The Company’s customers are primarily manufacturers of semiconductors, electronic interconnect devices, passive components, light-emitting diodes (LEDs), or other components used in a wide variety of end products in the computer, consumer electronics, communications and other industries. The Company’s equipment enables these manufacturers to implement device features or achieve yield and productivity gains in their manufacturing processes that can be critical to their profitability. The Company was founded in 1944 and is headquartered in Portland, Oregon, with subsidiaries in the United States, Europe and Asia.
2. Summary of Significant Accounting Policies
Basis of Presentation
The accompanying consolidated financial statements include the accounts of Electro Scientific Industries, Inc. and its subsidiaries. Certain prior period amounts have been reclassified to conform to the current period’s presentation, with no effect on previously reported earnings or cash flows. All intercompany accounts and transactions have been eliminated.
On July 3, 2007, our Board of Directors approved a change in the Company’s reporting period that results in a fiscal year consisting of 52 or 53 weeks ending on the Saturday nearest March 31. Accordingly, our fiscal 2010 reporting period consisted of a 53-week period ending on April 3, 2010, our fiscal 2009 reporting period consisted of a 52-week period ending on March 28, 2009 and our fiscal 2008 reporting period consisted of a 43-week period (approximately ten months) beginning June 3, 2007 and ending March 29, 2008. For comparative purposes, a pro forma consolidated statement of operations for the twelve months ended March 29, 2008 is presented in Note 4 “Comparative Consolidated Statements of Operations (Unaudited)”. All references to years relate to fiscal years unless otherwise noted. All references to fiscal 2008 relate to the ten-month period ended March 29, 2008.
Estimates
The preparation of financial statements in conformity with accounting principles generally accepted in the United States requires management to make estimates and assumptions that affect the reported amounts of assets and liabilities and disclosure of commitments and contingencies at the date of the financial statements and the reported amounts of revenues and expenses during the reporting periods. Actual results may differ from those estimates. Management believes that the estimates used are reasonable. Significant estimates made by management include: revenue recognition; inventory valuation; product warranty reserves; allowance for doubtful accounts; share-based compensation; income taxes including the valuation of deferred tax assets; fair value measurements; valuation of cost method equity investments; valuation of long-lived assets; and valuation of goodwill. The current economic environment has increased the degree of uncertainty inherent in these estimates and assumptions.
Risks and Uncertainties
The Company uses financial instruments that potentially subject it to concentrations of credit risk. Such instruments include cash equivalents, available-for-sale marketable securities, trade receivables and financial instruments used in hedging activities. The Company invests cash in cash deposits, money market funds,
48
commercial paper, certificates of deposit and readily marketable debt securities. Investments are placed with high credit quality financial institutions and the credit exposure from any one institution or instrument is minimized. Additionally, the Company holds investments in auction rate securities (ARS). See Note 6 “Fair Value Measurements” for further discussion on these investments.
The Company sells a significant portion of its products to a small number of large semiconductor and micro-electronics manufacturers. The top ten customers accounted for approximately 56%, 50% and 59% of total net sales in fiscal 2010, 2009 and 2008, respectively. One consumer electronics manufacturer accounted for approximately 30% and 21% of total net sales in fiscal 2010 and 2009, respectively. Two customers together accounted for approximately 23% of total net sales in fiscal 2008. No other customer individually accounted for more than 10% of total net sales in fiscal 2010, 2009 or 2008. The Company’s operating results may be adversely affected if the financial condition and operations of these key customers decline.
The Company uses qualified manufacturers to supply many components and sub-system modules of its products. The systems that the Company manufactures use high-performance computers, peripherals, lasers and other components from various suppliers. The Company obtains some of the components from a single source or a limited group of suppliers. An interruption in the supply of a particular component would have a temporary adverse impact on the Company’s operating results.
The Company’s net investment exposure in foreign subsidiaries translated into U.S. dollars using the period-end exchange rates at April 3, 2010 and March 28, 2009 was approximately $27.1 million and $37.3 million, respectively. The potential loss in fair value resulting from a hypothetical 10% adverse change in foreign exchange rates would be approximately $2.7 million and $3.7 million at April 3, 2010 and March 28, 2009, respectively. The Company currently has no plans to dispose of any of its foreign subsidiaries, and therefore, foreign exchange rate gains or losses on foreign investments are reflected as a cumulative translation adjustment, net of tax, and do not affect the Company’s results of operations.
The Company’s operations involve a number of other risks and uncertainties including but not limited to those relating to the cyclicality of the semiconductor and micro-electronics markets, the availability of materials provided by suppliers, the effect of general economic conditions, rapid changes in technology and international operations.
Cash Equivalents and Investments
All highly liquid investments with a maturity of 90 days or less at the date of purchase are considered to be cash equivalents. Short-term investments reflect marketable securities that have maturities of less than one year or are subject to immediate pre-payment or call provisions. These securities consist primarily of marketable debt securities and are classified as “available for sale” and recorded at fair market value. Unrealized gains and losses on short-term investments are recorded as a component of accumulated other comprehensive income (loss) within shareholders’ equity. To determine whether any existing impairment is considered other-than-temporary and requires recognition of an impairment loss in the results of operations, the Company evaluates its marketable securities based on the nature of the investments and the Company’s intent and ability to hold the securities until the securities are no longer in an unrealized loss position.
Restricted Cash
Restricted cash represents cash which collateralizes commercial letters of credit substituted for a cash bond previously held by the Kaohsiung District Court of Taiwan. See Note 21 “Legal Proceedings” below for further discussion.
49
Accounts Receivable and Allowance for Doubtful Accounts
Trade accounts receivable are stated at the amount the Company expects to collect and do not bear interest. Credit limits are established by reviewing the financial history and stability of each customer. Where appropriate, the Company obtains credit rating reports and financial statements of the customer to establish or modify credit limits. On certain foreign sales, letters of credit are required. The collectability of trade receivable balances is regularly evaluated based on a combination of factors such as customer credit-worthiness, past transaction history with the customer, current economic industry trends, and changes in customer payment terms. If it is determined that a customer will be unable to fully meet its financial obligation, such as in the case of a bankruptcy filing or other material events impacting its business, a specific reserve for bad debt is recorded to reduce the related receivable to the amount expected to be recovered.
Inventories
Inventories are principally valued at standard costs, which approximate the lower of cost (first-in, first-out) or market. Costs utilized for inventory valuation purposes include material, labor and manufacturing overhead.
Shipped Systems Pending Acceptance
Shipped systems pending acceptance relate to systems that have been ordered and shipped to the customer, but have been deferred in accordance with the Company’s revenue recognition policy. Shipped systems pending acceptance are recognized as cost of sales once all criteria for revenue recognition have been met and revenue is recorded. Shipped systems pending acceptance are valued at standard costs, which approximate the lower of cost (first-in, first-out) or market. Costs utilized in the valuation of shipped systems pending acceptance include material, labor and manufacturing overhead and exclude costs of installation.
Property, Plant and Equipment
Property, plant and equipment are stated at cost less accumulated depreciation and amortization. Depreciation and amortization are provided using the straight-line method over the estimated useful lives of the assets. Expenditures for maintenance, repairs and minor improvements are expensed as incurred. Major improvements and additions are capitalized. When assets are sold or retired, the cost and related accumulated depreciation and amortization are removed from the accounts and the resulting gain or loss is included as a component of operating expenses.
Costs of Computer Software for Internal Use
Computer software costs are capitalized according to the criteria specified by Financial Accounting Standards Board (FASB) Accounting Standards Codification (ASC) Topic 350 “Intangibles—Goodwill and Other” (ASC Topic 350), including external direct costs of materials and services consumed in obtaining and developing internal-use computer software and payroll and related costs for employees who are directly associated with the implementation project to the extent of the time spent directly on the project.
Long-Lived Asset Impairment
Long-lived assets, principally property, equipment and identifiable definite-lived intangibles, are reviewed for impairment whenever events or circumstances indicate that the carrying amount of the assets may not be recoverable. The Company evaluates recoverability of assets to be held and used by comparing the carrying amount of an asset to estimated future net undiscounted cash flows generated by the asset. If such assets are considered to be impaired, the impairment recognized is measured as the amount by which the carrying amount of the assets exceeds the fair value of the assets.
The Company’s purchased patents are amortized over their estimated useful lives, generally ten to seventeen years.
50
Other purchased intangible assets with definite useful lives are carried at cost less accumulated amortization. Amortization expense is recognized on either a straight-line or sum-of-the-years digits method over the estimated useful lives of the intangible assets, which range from one to seven years.
Goodwill Impairment
The Company accounts for goodwill pursuant to ASC Topic 350. ASC Topic 350 requires that goodwill be tested for impairment at least annually. Due to decreases in the Company’s market capitalization, the Company reviewed the recoverability of goodwill as of the end of the third quarter of 2009 and concluded that an impairment had taken place. Consistent with historical practices, the estimation of fair value was determined based on a method that compares the Company’s market capitalization against the net book value of the Company’s assets.
Other Assets
Other assets include consignment, demonstration (demo) and training equipment, minority equity investments and long-term deposits.
Consigned, demo and training equipment are recorded at the lower of standard costs or estimated market values, until the assets are sold.
As of April 3, 2010 and March 28, 2009, the Company had an $8.2 million minority equity investment in preferred stock of OmniGuide, Inc. (OmniGuide) that included $6.0 million of Series D Preferred Stock and $2.2 million of Series E Preferred Stock. These investments are accounted for as cost method investments. At each reporting period end, the Company determines whether events or circumstances have occurred that are likely to have a significant adverse effect on the fair value of the investments. If there are no identified events or circumstances that may have a significant adverse effect on the fair value of the investments, the fair value of the investments are not calculated as it is not practicable to do so. As of April 3, 2010, management had not identified any events or circumstances that indicated the investments were impaired, therefore the full carrying value of $8.2 million was included in other assets on the Consolidated Balance Sheet.
Fair Value of Financial Instruments
The carrying amounts of financial instruments, including cash and cash equivalents, accounts receivable, accounts payable and accrued liabilities approximate fair value due to the short maturities of these financial instruments. Current and non-current marketable securities are recorded at fair market value. See Note 6 “Fair Value Measurements” for additional information.
Derivative Financial Instruments
The Company’s primary objective for holding derivative financial instruments is to manage currency risk. The Company’s accounting policies for these instruments are based on whether they meet the Company’s criteria for designation as hedging transactions, either as cash flow or fair value hedges. A hedge of the exposure to variability in the cash flows of an asset or a liability, or of a forecasted transaction, is referred to as a cash flow hedge. A hedge of the exposure to changes in fair value of an asset or a liability, or of an unrecognized firm commitment, is referred to as a fair value hedge. The criteria for designating a derivative as a hedge include the instrument’s effectiveness in risk reduction and, in most cases, a one-to-one matching of the derivative instrument to its underlying transaction.
51
Revenue Recognition
The Company recognizes revenue when persuasive evidence of an arrangement exists, delivery has occurred or the services have been rendered, the sales price is fixed or determinable and collection of the related receivable is reasonably assured. Title and risk of loss generally pass to the customer at the time of delivery of the product to a common carrier. Revenue is recognized upon such delivery, provided that fulfillment of acceptance criteria can be demonstrated prior to shipment. Where the acceptance criteria cannot be demonstrated prior to shipment, or in the case of substantially new products, revenue is deferred until acceptance has been received. For multiple element arrangements, the fair value of any undelivered elements is deferred until the elements are delivered and acceptance criteria are met. Revenues are recorded net of taxes collected which are required to be submitted to government authorities. Installation services are not essential to the functionality of the delivered equipment and installation revenue is deferred until installation is complete. Neither the costs of installation accrued nor the fair value of installation service revenue deferred has been material.
Revenues associated with sales to customers under local contracts in Japan are recognized upon title transfer, which generally occurs upon customer acceptance. Additionally, prior to the second quarter of 2009, the Company sold products directly to its distributor in Japan. For these sales, title generally transferred upon shipment, subject to the Company’s standard revenue recognition policy. In fiscal 2009, the Company discontinued this sales model and had no such sales directly to distributors subsequent to the first quarter of 2009.
Revenues related to spare parts and consumable sales are generally recognized upon shipment. Revenues related to maintenance and service contracts are recognized ratably over the duration of the contracts.
Product Warranty
The Company evaluates obligations related to product warranties quarterly. A standard one-year warranty from the date of acceptance is provided on most products. Warranty charges are comprised of costs to service the warranty, including labor to repair the system and replacement parts for defective items, as well as other costs incidental to the repairs. Warranty charges are recorded net of any cost recoveries resulting from either successful repair of damaged parts or from warranties offered by the Company’s suppliers for defective components. Using historical data, the Company estimates average warranty cost per system or part type and records the provision for such charges as an element of cost of goods sold upon recognition of the related revenue. Additionally, the overall warranty accrual balance is separately analyzed using the remaining warranty periods outstanding on systems and items under warranty, and any resulting changes in estimates are recorded as an adjustment to cost of sales. If circumstances change, or if a significant change in warranty-related incidents occurs, the impact of the change in the warranty accrual could be material. Accrued product warranty is included on the Consolidated Balance Sheets as a component of accrued liabilities.
Research and Development
Research and development costs, which include labor and related employee expenses, patent maintenance fees, project materials, project subcontractors, depreciation of engineering equipment, building costs and other administration expenses, are generally expensed as incurred. Engineering materials that are expected to provide future value are included in inventory.
Taxes on Unremitted Foreign Income
Under ASC Topic 740 “Income Taxes”, the Company is required to provide for deferred taxes on the undistributed earnings of a subsidiary which is included in consolidated income of the parent, except to the extent that the income is intended to be indefinitely reinvested or remitted in a tax-free liquidation.
52
The Company provides for income taxes on its foreign subsidiaries’ taxable income based on the effective income tax rate in each respective jurisdiction. U.S. income tax expense is recorded on the unremitted foreign earnings that we do not intend to indefinitely reinvest abroad, including any estimated withholding taxes, as if those earnings were repatriated to the U.S. parent company.
Comprehensive Income (Loss)
Comprehensive income (loss) includes net income (loss) and “other comprehensive income,” which includes charges or credits to equity that are not the result of transactions with shareholders. Comprehensive income (loss) within these consolidated financial statements includes cumulative foreign currency translation adjustments, unrealized gains and losses on securities available for sale and certain gains or losses on foreign currency forward contracts. The cumulative translation adjustment included in accumulated other comprehensive income (loss) at April 3, 2010 and March 28, 2009 was $(0.4) million and $(1.4) million, respectively.
Earnings per Share
Basic earnings per share (EPS) is computed utilizing the weighted average number of shares outstanding during the period. Diluted EPS also considers common stock equivalents, such as stock options, stock-settled stock appreciation rights (SARs) and restricted stock units, to the extent that they are not antidilutive.
Share-Based Compensation
The Company follows the provisions of ASC Topic 718 “Compensation—Stock Compensation” (ASC Topic 718). ASC Topic 718 requires the Company to recognize expense related to the fair value of its share-based compensation awards. The Company uses the Black-Scholes model to estimate the fair value of all share-based compensation awards on the date of grant, except for unvested restricted stock units, which are valued at the fair market value of the Company’s stock on the date of award. The Company recognizes the compensation expense for options, SARs and unvested restricted stock units on a straight-line basis over the requisite service period of the award.
Segment Reporting
The Company complies with ASC Topic 280 “Segment Reporting” (ASC Topic 280). ASC Topic 280, which is based on a management approach to segment reporting, establishes requirements to report selected segment information quarterly and to report annually entity-wide disclosures about products, major customers and the geographies in which the entity holds material assets and reports revenue. An operating segment is defined as a component that engages in business activities whose operating results are reviewed by the chief operating decision maker and for which discrete financial information is available. Based on the provisions of ASC Topic 280, the Company has determined that it operates in one segment. The Company manages its resources and assesses its performance on an enterprise-wide basis. The Company’s product groups qualify for aggregation under ASC Topic 280 due to their similarities in customer base, economic characteristics, nature of products and services, and procurement, manufacturing and distribution processes.
Employee Benefit Plans
The Company has an employee savings plan under the provisions of Section 401(k) of the Internal Revenue Code. The Company did not make contributions to the plan during fiscal 2010. During fiscal 2009 and 2008, contributions to the plan by the Company were $0.9 million and $1.0 million, respectively.
The Company has defined benefit retirement plans at certain of its foreign subsidiaries. The Company accounts for these plans based on the provisions of ASC Topic 715 “Compensation-Retirement Benefits”, which it adopted during fiscal 2007.
53
3. Recent Accounting Pronouncements
In June 2009, the FASB issued Statement of Financial Accounting Standards (SFAS) No. 168 “The FASB Accounting Standards Codification and the Hierarchy of Generally Accepted Accounting Principles” (SFAS No. 168). SFAS No. 168 replaces SFAS No. 162 “The Hierarchy of Generally Accepted Accounting Principles” and establishes the ASC as the source of authoritative accounting principles. SFAS No. 168 was incorporated into the ASC within ASC Topic 105 “Generally Accepted Accounting Principles” with the issuance of ASC Accounting Standards Update (ASU) 2009-1. The ASC combines all existing authoritative standards into a comprehensive, topically organized online database to simplify user access to all authoritative GAAP. The ASC became effective for the Company’s second quarter of 2010 and the adoption of the ASC did not have a material impact on the Company’s financial position, results of operations or cash flows.
In April 2009, the FASB issued FSP FAS No. 157-4; FSP FAS No. 115-2 and FAS No. 124-2; and FSP No. 107 and APB No. 28-1. FSP FAS No. 157-4 provides guidance on how to determine the fair value of assets and liabilities under SFAS No. 157 when there is no active market, and reaffirms the SFAS No. 157 objective to reflect an asset’s sale price in an orderly transaction at the date of the financial statements. FSP FAS No. 157-4 was incorporated into the ASC within ASC Topic 820 “Fair Value Measurements and Disclosures”. FSP FAS No. 115-2 and FAS No. 124-2 modifies the requirements for recognizing other-than-temporarily impaired debt securities and revises the existing impairment model for such securities, by distinguishing between credit and non-credit components of impaired debt securities that are not expected to be sold. FSP FAS No. 115-2 and FAS No. 124-2 was incorporated into the ASC within ASC Topic 320 “Investments—Debt and Equity Securities”. FSP FAS No. 107-1 and APB No. 28-1 enhances disclosures about fair value for instruments under the scope of SFAS No. 157 for both interim and annual periods. FAS No. 107-1 and APB No. 28-1 was incorporated into the ASC within ASC Topic 825 “Financial Instruments”. The Company adopted these Staff Positions as of the first quarter of 2010 and they have not had a material impact on the Company’s financial position, results of operations or cash flows. See Note 6 “Fair Value Measurements” for disclosures applicable to these Staff Positions.
In October 2009, the FASB issued ASC Accounting Standards Update (ASU) 2009-13 “Certain Revenue Arrangements That Include Software Elements” (ASC ASU 2009-13). ASC ASU 2009-13 addresses how arrangement consideration should be allocated to deliverables in a multiple-deliverable revenue arrangement. ASC ASU 2009-13 will become effective for the Company’s first quarter of fiscal 2012. The Company is currently evaluating the impact, if any, that the adoption of ASC ASU 2009-13 will have on its financial position, results of operations and cash flows.
In October 2009, the FASB issued ASC ASU 2009-14 “Certain Revenue Arrangements That Include Software Elements” (ASC ASU 2009-14). ASC ASU 2009-14 modifies the scope of Software Revenue Recognition to exclude non-software components of tangible products and software components of tangible products that are sold, licensed, or leased with tangible products when the software components and non-software components of the tangible product function together to deliver the tangible product’s essential functionality. ASC ASU 2009-14 will become effective for the Company’s first quarter of fiscal 2012. The Company is currently evaluating the impact, if any, that the adoption of ASC ASU 2009-14 will have on its financial position, results of operations and cash flows.
In January 2010, the FASB issued ASC ASU 2010-06 “Improving Disclosures about Fair Value Measurements” (ASC ASU 2010-06). ASC ASU 2010-06 requires various additional disclosures regarding fair value measurements, including the amounts of significant transfers between Level 1 and Level 2 of the fair value hierarchy, the reasons for any transfers in or out of Level 3, and a gross basis of presentation for purchases, sales, issuances and settlements within the Level 3 activity rollforward. The ASC became effective for the Company’s fourth quarter of fiscal 2010, except for the disclosures about purchases, sales, issuances and settlements within the Level 3 activity rollforward, which will be effective for the Company’s first quarter of fiscal 2012. The Company’s adoption of the ASC did not have a material impact on its financial position, results of operations or cash flows, nor will the adoption of the remaining provisions of the ASC.
54
In February 2010, the FASB issued ASC ASU 2010-09 “Amendments to Certain Recognition and Disclosure Requirements” (ASC ASU 2010-09). ASC ASU 2010-09 eliminates the requirement for entities that file or furnish financial statements with the Securities and Exchange Commission (SEC) to disclose the date through which subsequent events have been evaluated in originally issued and reissued financial statements. The Company adopted ASC ASU 2010-09 in the fourth quarter of fiscal 2010.
4. Comparative Consolidated Statements of Operations (Unaudited)
On July 3, 2007, our Board of Directors approved a change in the Company’s reporting period that results in a fiscal year consisting of 52 or 53 weeks ending on the Saturday nearest March 31. Accordingly, our fiscal 2010 reporting period consisted of a 53-week period ending on April 3, 2010, our fiscal 2009 reporting period consisted of a 52-week period ending on March 28, 2009 and our fiscal 2008 reporting period consisted of a 43-week period (approximately ten months) beginning June 3, 2007 and ending March 29, 2008.
To create a pro forma twelve-month statement of operations for fiscal 2008 for comparative purposes, the Company used year to date results as reported in the Form 10-K for the ten months ended March 29, 2008, and then calculated the estimated unaudited results for the two months ended June 2, 2007. To calculate the estimated April and May 2007 results, management estimated certain items that were normally recorded on a quarterly basis, including standard cost variances, overhead allocations, certain operating expenses and the income tax provision. Certain standard cost variances and overhead allocations were estimated on a pro rata revenue basis for the quarter. Certain operating expenses were estimated on a pro rata or normalized basis, as appropriate. For comparative purposes, a Consolidated Statement of Operations for the twelve months ended March 29, 2008 was as follows:
| | | |
(In thousands, except per share data) | | Pro Forma
Twelve Months Ended
Mar 29, 2008
(Unaudited) |
Net sales | | $ | 313,546 |
Cost of sales | | | 172,245 |
Gross profit | | | 141,301 |
Operating expenses: | | | |
Selling, service and administration | | | 61,495 |
Research, development and engineering | | | 42,479 |
Write-off of acquired in-process research and development | | | 2,800 |
Restructuring costs | | | 972 |
| | | |
Operating income | | | 33,555 |
Interest and other income, net | | | 8,332 |
| | | |
Income before income taxes | | | 41,887 |
Provision for income taxes | | | 15,999 |
| | | |
Net income | | $ | 25,888 |
| | | |
Net income per share—basic | | $ | 0.92 |
| | | |
Net income per share—diluted | | $ | 0.91 |
| | | |
Weighted average number of shares—basic | | | 28,138 |
| | | |
Weighted average number of shares—diluted | | | 28,533 |
| | | |
5. Share-Based Compensation
The Company recognizes expense related to the fair value of its share-based compensation awards using the Black-Scholes model to estimate the fair value of awards on the date of grant, except for unvested restricted stock unit awards which are valued at the fair market value of the Company’s stock on the date of award. The Company recognizes compensation expense for all share-based compensation awards on a straight-line basis over the requisite service period of the award.
55
Stock Plans
In October 2004, the shareholders approved the adoption of the 2004 Stock Incentive Plan (the 2004 Plan) that replaced various stock compensation plans that were previously approved by the shareholders or the Board of Directors (the Replaced Plans), except with respect to options and other awards previously outstanding. Outstanding options and awards remained subject to the terms of the Replaced Plans under which they were originally granted. At that time, the shareholders also approved the reservation of 3,000,000 shares of common stock for issuance under the 2004 Plan. These shares are in addition to any shares of common stock that, at the time the 2004 Plan was approved by shareholders, were available for grant under the Replaced Plans or that may subsequently become available for grant under any of the Replaced Plans through the expiration, termination, forfeiture or cancellation of grants. In January 2005, the Board of Directors approved certain amendments to the 2004 Plan. These amendments prohibit grants of stock options or stock-settled stock appreciation rights (SARs) with an exercise price less than fair market value, require that time-based restricted stock awards have a minimum vesting period of at least three years, with the subject shares vesting no more quickly than one-third annually over the three-year period, and expressly prohibit the reservation of additional shares under the 2004 Plan without shareholder approval. In April 2005, the Board of Directors approved another amendment to the 2004 Plan extending the period during which an option may be exercised following termination of employment or service if an optionee dies within the 90-day exercise period following termination. In October 2007, the shareholders approved an additional amendment to the 2004 Plan to permit awards to non-employee service providers and implement certain claw-back provisions.
The 2004 Plan allows for grants of stock options, stock appreciation rights, stock bonuses (including restricted stock units), restricted stock and performance-based awards. Stock options and SARs outstanding under the 2004 Plan and the Replaced Plans vest over variable periods determined at the grant date, generally with terms of immediate vesting or up to four years, and expire ten years from the date of grant. Options and SARs issued under the 2004 Plan and the Replaced Plans are exercisable at prices not less than fair market value on the date of the grant. The 2004 Plan prohibits repricing of options and SARs granted without prior shareholder approval. Certain restricted stock units awarded under the 2004 Plan vest based on performance criteria that are tied to the Company’s results of operations, personal performance criteria, and, in certain cases, length of service.
During fiscal 2008, the Company granted an option to purchase 80,000 shares to a key executive. The Board of Directors authorized these grants as inducements for joining the Company and the grants were not made under a shareholder approved plan. The exercise price for each option grant is the fair market value of the Company’s stock on the date of the grant. Options granted to the key executive become exercisable with respect to 25 percent of the underlying shares each year over four years.
In September 1990, the shareholders approved the adoption of the 1990 Employee Stock Purchase Plan, as amended in September 1998, October 2003, October 2004, January 2008 and August 2009 (the ESPP), pursuant to which 3,400,000 shares of common stock have been reserved for issuance to participating employees. Eligible employees may elect to contribute up to 15 percent of their base wage and commissions during each pay period. The ESPP provides for separate overlapping twenty-four month offerings starting every three months. Each offering has eight purchase dates occurring every three months on designated dates. The offerings under the ESPP commence on February 15, May 15, August 15 and November 15 of each calendar year. Any eligible employee may participate in only one offering at a time and may purchase shares only through payroll deductions permitted under the ESPP. At the end of each three-month purchase period, the purchase price is determined and the accumulated funds are used to automatically purchase shares of common stock. The purchase price per share is equal to 85 percent of the lower of the fair market value of the common stock on (a) the first day of the offering period or (b) the date of purchase. The ESPP also provides that if the fair market value of the common stock on the first day of the new offering period is less than or equal to the fair market value of the common stock on the first date of any ongoing offering, employees participating in any such ongoing offering will be automatically withdrawn from it and enrolled in the new offering.
56
The Company granted SARs starting in the first quarter of 2010. SARs grant the right to receive shares of the Company’s stock equivalent to the increase in stock value of a specified number of shares over a specified period of time, divided by the stock price at the time of exercise. The Company uses the Black-Scholes model to estimate the fair value of SARs. Similar to options, SARs are recorded at the fair value of the award at grant date and the expense is recognized on a straight-line basis over the requisite service period of the award. The Company did not grant any stock options during fiscal 2010 and did not grant any SARs prior to the first quarter of 2010.
Share-based compensation expense was included in the Company’s Consolidated Statements of Operations as follows:
| | | | | | | | | |
(In thousands) | | 2010 | | 2009 | | 2008 |
Cost of sales | | $ | 1,059 | | $ | 712 | | $ | 538 |
Selling, service and administration | | | 5,306 | | | 2,749 | | | 2,306 |
Research, development and engineering | | | 1,355 | | | 917 | | | 877 |
| | | | | | | | | |
Total share-based compensation expense | | $ | 7,720 | | $ | 4,378 | | $ | 3,721 |
| | | | | | | | | |
The total amount of cash received from Employee Stock Purchase Plan (ESPP) purchases for 2010 was $1.4 million and there were no stock options or SARs exercised during 2010. The total amount of cash received from the exercise of stock options and ESPP purchases was $2.8 million and $4.5 million for 2009 and 2008, respectively. All stock plan awards are settled with newly issued shares.
No share-based compensation costs were capitalized during fiscal 2010. As of April 3, 2010, the Company had $10.1 million of total unrecognized share-based compensation costs, net of estimated forfeitures, which are expected to be recognized over a weighted average period of 2.3 years.
Valuation Assumptions
The Black-Scholes option pricing model is utilized to determine the fair value of options and SARs granted. The following weighted average assumptions were used in calculating the fair value during the periods presented:
| | | | | | | | | |
| | | 2010 | | | 2009 | | | 2008 | |
Risk-free interest rate | | 2.63 | % | | 3.50 | % | | 4.27 | % |
Expected dividend yield | | 0 | % | | 0 | % | | 0 | % |
Expected lives | | 5.6 years | | | 4.6 years | | | 4.3 years | |
Expected volatility | | 48 | % | | 41 | % | | 42 | % |
The following weighted average assumptions were used to estimate the fair value of ESPP during the periods presented:
| | | | | | | | | |
| | | 2010 | | | 2009 | | | 2008 | |
Risk-free interest rate | | 0.43 | % | | 1.27 | % | | 3.25 | % |
Expected dividend yield | | 0 | % | | 0 | % | | 0 | % |
Expected lives | | 1.1 years | | | 1.1 years | | | 1.2 years | |
Expected volatility | | 60 | % | | 50 | % | | 35 | % |
The risk-free rates used are based on the U.S. Treasury yields over the expected terms. The expected term and forfeiture estimates for stock options and SARs are based on an analysis of actual exercise behavior. The expected term for the ESPP is the weighted average length of the purchase periods. The Company uses its historical volatility over the estimated expected term as the expected volatility.
57
At April 3, 2010, the Company had 10,089,089 shares of its common stock reserved for issuance under all of the above plans combined. Of those shares, 4,676,177 are subject to issuance under currently outstanding stock options and stock awards and 5,412,912 shares, including 1,463,301 shares available for issuance under the 1990 Employee Stock Purchase plan, are available for future grants. The weighted-average fair-value of share-based compensation awards, including stock option and SAR awards granted and vested during the period, unvested restricted stock unit awards granted during the period and the intrinsic value of stock options and SARs exercised during the period were:
| | | | | | | | | |
(In thousands, except per share data) | | 2010 | | 2009 | | 2008 |
Stock-Option and SAR Awards: | | | | | | | | | |
Grant date fair value per share | | $ | 3.88 | | $ | 6.86 | | $ | 9.75 |
Total fair value of options and SARs granted | | $ | 3,412 | | $ | 968 | | $ | 2,384 |
Total fair value of options and SARs vested | | $ | 526 | | $ | 1,285 | | $ | 1,035 |
Total intrinsic value of options and SARs exercised | | $ | — | | $ | 105 | | $ | 590 |
Unvested Restricted Stock Unit Awards: | | | | | | | | | |
Grant date fair value per share | | $ | 8.46 | | $ | 16.19 | | $ | 22.50 |
Total fair value of awards granted | | $ | 4,187 | | $ | 5,614 | | $ | 9,832 |
Employee Stock Purchase Plan: | | | | | | | | | |
Grant date fair value per share | | $ | 2.17 | | $ | 3.21 | | $ | 5.30 |
Total grant date fair value | | $ | 773 | | $ | 979 | | $ | 673 |
Share-Based Payment Award Activity
Information with respect to stock option and SAR activity was as follows:
| | | | | | | | | | | |
| | | Shares | | | Weighted
Average
Exercise
Price | | Weighted
Average
Remaining
Contractual
Term | | Aggregate
Intrinsic
Value
(In thousands) |
Outstanding at March 28, 2009 | | 3,430,847 | | | $ | 24.74 | | | | | |
Granted | | 879,900 | | | | 8.26 | | | | | |
Exercised | | — | | | | — | | | | | |
Expired or forfeited | | (563,007 | ) | | | 24.83 | | | | | |
| | | | | | | | | | | |
Outstanding at April 3, 2010 | | 3,747,740 | | | $ | 20.86 | | 5.24 | | $ | 4,182 |
| | | | | | | | | | | |
Vested and expected to vest at April 3, 2010 | | 3,548,809 | | | $ | 21.50 | | 5.03 | | $ | 3,329 |
| | | | | | | | | | | |
Exercisable at April 3, 2010 | | 2,732,019 | | | $ | 24.98 | | 3.87 | | $ | 7 |
| | | | | | | | | | | |
Information with respect to unvested restricted stock unit awards activity was as follows:
| | | | | | | | | | | |
| | | Shares | | | Weighted
Average
Grant Date
Fair Value | | Weighted
Average
Remaining
Contractual
Term | | Aggregate
Intrinsic
Value
(In thousands) |
Outstanding at March 28, 2009 | | 716,840 | | | $ | 19.32 | | | | | |
Awarded | | 495,100 | | | | 8.46 | | | | | |
Vested | | (230,594 | ) | | | 14.63 | | | | | |
Forfeited | | (52,909 | ) | | | 19.13 | | | | | |
| | | | | | | | | | | |
Outstanding at April 3, 2010 | | 928,437 | | | $ | 14.70 | | 1.64 | | $ | 12,144 |
| | | | | | | | | | | |
58
6. Fair Value Measurements
Financial Assets Measured at Fair Value
Fair value is defined under ASC Topic 820 “Fair Value Measurements and Disclosures” (ASC Topic 820) as the exchange price that would be received for an asset or paid to transfer a liability (an exit price) in the principal or most advantageous market for the asset or liability in an orderly transaction between market participants on the measurement date. Valuation techniques used to measure fair value must maximize the use of observable inputs and minimize the use of unobservable inputs. ASC Topic 820 establishes a three-tier fair value hierarchy, which prioritizes the inputs used in measuring fair value. These tiers include the following:
| | • | | Level 1, defined as observable inputs such as quoted prices in active markets for identical assets or liabilities; |
| | • | | Level 2, defined as inputs other than quoted prices in active markets for similar assets or liabilities that are either directly or indirectly observable; and |
| | • | | Level 3, defined as unobservable inputs in which little or no market data exists, therefore requiring an entity to develop its own assumptions. |
The Company’s fair value hierarchy for its financial assets measured at fair value on a recurring basis as of April 3, 2010 and March 28, 2009 was as follows (in thousands):
| | | | | | | | | | | | | | |
April 3, 2010 | | Level 1 | | Level 2 | | | Level 3 | | Total | |
Money market securities | | $ | 4,244 | | $ | — | | | $ | — | | $ | 4,244 | |
Government agencies | | | — | | | 73,130 | | | | — | | | 73,130 | |
Commercial paper | | | — | | | 41,992 | | | | — | | | 41,992 | |
U.S. treasuries | | | — | | | 17,089 | | | | — | | | 17,089 | |
Forward purchase or (sale) contracts: | | | | | | | | | | | | | | |
Japanese Yen | | | — | | | 165 | | | | — | | | 165 | |
Taiwan Dollar | | | — | | | (10 | ) | | | — | | | (10 | ) |
Korean Won | | | — | | | 15 | | | | — | | | 15 | |
Euro | | | — | | | 6 | | | | — | | | 6 | |
British Pound | | | — | | | 5 | | | | — | | | 5 | |
Auction rate securities | | | — | | | — | | | | 5,021 | | | 5,021 | |
Preferred stock | | | — | | | — | | | | — | | | — | |
| | | | |
March 28, 2009 | | Level 1 | | Level 2 | | | Level 3 | | Total | |
Money market securities | | $ | 139,650 | | $ | — | | | $ | — | | $ | 139,650 | |
Corporate notes and bonds | | | — | | | 2,084 | | | | — | | | 2,084 | |
Forward purchase or (sale) contracts: | | | | | | | | | | | | | | |
Japanese Yen | | | — | | | 116 | | | | — | | | 116 | |
Taiwan Dollar | | | — | | | (202 | ) | | | — | | | (202 | ) |
Korean Won | | | — | | | 214 | | | | — | | | 214 | |
Euro | | | — | | | 19 | | | | — | | | 19 | |
British Pound | | | — | | | 7 | | | | — | | | 7 | |
Auction rate securities | | | — | | | — | | | | 5,627 | | | 5,627 | |
Preferred stock | | | — | | | — | | | | 380 | | | 380 | |
For Level 1 assets, the Company utilized quoted prices in active markets for identical assets.
For Level 2 assets, exclusive of forward contracts, the Company utilized quoted prices in active markets for similar assets. For the forward contracts, spot prices at April 2, 2010 were utilized to calculate the unrealized gain/loss on open forward contracts.
59
The Level 3 assets consisted of ARS and preferred stock acquired through the conversion of certain ARS during the third quarter of 2009. As none of the Company’s securities have traded through the auction process and few market transactions have been observed for these securities, estimated fair values were based primarily upon the income approach using a discounted cash flow model which took into account the following: (i) the underlying structure of each security; (ii) the present value of future principal and interest payments discounted at rates that reflect current market conditions; (iii) consideration of the probabilities of default, restructuring or redemption by the issuer (trigger events); (iv) estimates of the recovery rates in the event of default for each security; (v) the financial condition, results, ratings of and financial claims on the bond insurers and issuers; and (vi) the underlying trust assets of the securities.
As of April 3, 2010, the Company held a total of $13.7 million invested in auction rate securities (ARS) at par value. Additionally, the Company held $4.0 million of par value ARS which were converted by the bond issuer to its preferred stock during the third quarter of 2009. The ARS are comprised predominately of securities issued by insurance companies to raise funds to meet regulatory capital reserve requirements and the ARS assume the credit ratings of the bond insurers who guarantee the timely payment of principal and interest on these insured securities. At the time of purchase in fiscal 2007, these ARS were rated AAA and AA. The contractual maturities of these securities range up to calendar year 2050, and several securities and the preferred stock do not have stated maturities. These securities previously provided short-term liquidity through a Dutch auction process that reset the applicable interest rate at pre-determined calendar intervals, generally every 28 to 35 days. This mechanism previously allowed existing investors to either retain or liquidate their holdings by selling such securities at par. During the second quarter of 2008, as a result of the liquidity issues experienced in the global credit and capital markets, our ARS began to experience failed auctions.
Since that time, none of the Company’s ARS have traded through the auction process and few market transactions for these securities have been observed. Additionally, the bond insurers of the ARS and preferred stock experienced credit rating downgrades throughout fiscal 2009. Consequently, it was determined that the declines in fair value of these securities during fiscal 2009 represented other-than-temporary impairments in accordance with U.S. generally accepted accounting principles. Accordingly, the cost bases of these securities were written down to their estimated fair values with an other-than-temporary impairment charge of $13.6 million for the year ended March 28, 2009.
As of the beginning of fiscal 2010, in accordance with the adoption of ASC Topic 320 “Investments—Debt and Equity Securities” (ASC Topic 320), the Company recorded a cumulative-effect adjustment to increase the opening balance of retained earnings by $0.4 million, which represented the non-credit portion of the ARS loss previously recorded as an other-than-temporary impairment in the statement of operations. The credit portion of the ARS loss was determined by direct estimation of the change in fair value attributable to market movements. The Company utilized market indices representing investments of constant credit quality over time and measured the index yield, which is considered attributable to non-credit related factors, at the beginning and end of the period. The effect of this change in yield on the value of the security was measured and subtracted from the total change in fair value to arrive at the estimated change in value attributable to changes in credit quality.
During the third quarter of 2010, the Company sold certain ARS for approximately $1.4 million pursuant to a tender agreement with the parent company of the securities’ original issuer. The ARS had an original par value of $1.9 million and had been written down to an estimated fair value of $1.6 million as of the beginning of the third quarter of 2010. As a result of the sale, the Company reclassified $0.3 million of previously recorded unrealized net gains out of accumulated other comprehensive income.
During the fourth quarter of 2010, the issuer of the preferred stock discontinued dividend payments and the credit quality of certain bond insurers of the ARS declined further. Due to these developments, the Company recognized an other-than-temporary impairment charge of $1.3 million during the year ended April 3, 2010.
60
As of April 3, 2010, total net unrealized gains on the Company’s remaining ARS were $1.3 million, which represented the fiscal 2010 fair value adjustment of $2.6 million for unrealized gains, reduced by the cumulative- effect adjustment of $0.4 million, $0.3 million related to sale of certain ARS in the third quarter of 2010 and a $0.6 million unrealized loss adjustment in the fourth quarter of 2010. The $5.0 million estimated fair value of the Company’s remaining ARS is classified as a non-current asset on the Consolidated Balance Sheet at April 3, 2010, consistent with the classification at March 28, 2009.
The Company currently continues to receive all interest payments on its ARS when due, but cannot predict if or when dividend payments on its preferred stock will resume. Additionally, the Company cannot predict if or when its remaining ARS will become liquid.
The following table illustrates Level 3 activity from March 29, 2008 to April 3, 2010 (in thousands):
| | | | | | | | | | | | |
| | | Auction Rate
Securities | | | Preferred
Stock | | | Total | |
Fair Value, March 29, 2008 | | $ | 15,697 | | | $ | — | | | $ | 15,697 | |
Adjustment to Accumulated other comprehensive income (loss): | | | | | | | | | | | | |
Unrealized losses | | | 3,903 | | | | — | | | | 3,903 | |
Conversion of auction rate securities into preferred stock | | | (4,000 | ) | | | 4,000 | | | | — | |
Other-than-temporary impairment | | | (9,973 | ) | | | (3,620 | ) | | | (13,593 | ) |
Purchases, issuances and settlements | | | — | | | | — | | | | — | |
Net transfers into (out of) Level 3 | | | — | | | | — | | | | — | |
| | | | | | | | | | | | |
Fair Value, March 28, 2009 | | | 5,627 | | | | 380 | | | | 6,007 | |
Adjustment to Accumulated other comprehensive income (loss): | | | | | | | | | | | | |
Unrealized gains | | | 2,643 | | | | — | | | | 2,643 | |
Unrealized losses | | | (639 | ) | | | — | | | | (639 | ) |
Other-than-temporary impairment | | | (967 | ) | | | (380 | ) | | | (1,347 | ) |
Sales | | | (1,643 | ) | | | — | | | | (1,643 | ) |
Purchases, issuances and settlements | | | — | | | | — | | | | — | |
Net transfers into (out of) Level 3 | | | — | | | | — | | | | — | |
| | | | | | | | | | | | |
Fair Value, April 3, 2010 | | $ | 5,021 | | | $ | — | | | $ | 5,021 | |
| | | | | | | | | | | | |
As of April 3, 2010, the Company had $6.0 million invested in Series D Preferred Stock and $2.2 million invested in Series E Preferred Stock of OmniGuide, Inc., representing an 11% interest. At each reporting period end, the Company determines whether events or circumstances have occurred that are likely to have a significant adverse effect on the fair value of these investments. If there are no events or circumstances identified that would adversely affect the fair value of the investments, the fair values of the investments are not calculated as it is not practicable to do so. As of April 3, 2010 and March 28, 2009, management had not identified any events or circumstances that indicated the investments were impaired; therefore, as presented in Note 12 “Other Assets”, the full carrying values of $8.2 million and $8.0 million were included in Other assets on the Consolidated Balance Sheets at April 3, 2010 and March 28, 2009, respectively.
61
Investments
Certain information regarding the Company’s investments at April 3, 2010 and March 28, 2009 was as follows (in thousands):
| | | | | | | | | | | | | |
| | | | | Unrealized | | | |
April 3, 2010 | | Cost | | Gain | | Loss | | | Fair Value |
Available-for-sale securities (current): | | | | | | | | | | | | | |
Government agencies | | $ | 73,141 | | $ | — | | $ | (11 | ) | | $ | 73,130 |
Commercial paper | | | 41,992 | | | — | | | — | | | | 41,992 |
U.S. treasuries | | | 17,088 | | | 1 | | | — | | | | 17,089 |
| | | | | | | | | | | | | |
| | $ | 132,221 | | $ | 1 | | $ | (11 | ) | | $ | 132,211 |
| | | | | | | | | | | | | |
Available-for-sale securities (non-current): | | | | | | | | | | | | | |
Auction rate securities | | $ | 13,700 | | $ | 1,301 | | $ | (9,980 | ) | | $ | 5,021 |
Preferred stock | | | 4,000 | | | — | | | (4,000 | ) | | | — |
| | | | | | | | | | | | | |
| | $ | 17,700 | | $ | 1,301 | | $ | (13,980 | ) | | $ | 5,021 |
| | | | | | | | | | | | | |
| | | |
| | | | | Unrealized | | | |
March 28, 2009 | | Cost | | Gain | | Loss | | | Fair Value |
Available-for-sale securities (current): | | | | | | | | | | | | | |
Corporate notes and bonds | | $ | 2,072 | | $ | 12 | | $ | — | | | $ | 2,084 |
| | | | | | | | | | | | | |
Available-for-sale securities (non-current): | | | | | | | | | | | | | |
Auction rate securities | | $ | 15,600 | | $ | — | | $ | (9,973 | ) | | $ | 5,627 |
Preferred stock | | | 4,000 | | | — | | | (3,620 | ) | | | 380 |
| | | | | | | | | | | | | |
| | $ | 19,600 | | $ | — | | $ | (13,593 | ) | | $ | 6,007 |
| | | | | | | | | | | | | |
Other than the sale of ARS discussed above, the Company sold $2.0 million of current available-for-sale securities during the year ended April 3, 2010, which resulted in an insignificant net gain. There were no sales of available-for-sale securities during the year ended March 28, 2009. For purposes of determining gross realized gains and losses and reclassification out of accumulated other comprehensive income, the cost of securities sold is based on specific identification. Net unrealized holding gains and losses on current available-for-sale securities included in accumulated other comprehensive income were insignificant as of April 3, 2010 and March 28, 2009. Gains reclassified out of accumulated other comprehensive income into earnings during the year ended April 3, 2010 were $0.3 million.
Underlying maturities of investments at April 3, 2010 were $132.2 million within one year and $5.0 million beyond 10 years.
7. Inventories
The components of inventories at April 3, 2010 and March 28, 2009 were as follows:
| | | | | | |
(In thousands) | | 2010 | | 2009 |
Raw materials and purchased parts | | $ | 47,636 | | $ | 56,701 |
Work-in-process | | | 10,731 | | | 7,741 |
Finished goods | | | 13,723 | | | 20,440 |
| | | | | | |
| | $ | 72,090 | | $ | 84,882 |
| | | | | | |
62
8. Other Current Assets
Other current assets at April 3, 2010 and March 28, 2009 consisted of the following:
| | | | | | |
(In thousands) | | 2010 | | 2009 |
Prepaid expenses | | $ | 4,286 | | $ | 2,055 |
Income tax refund receivable | | | 3,017 | | | 4,828 |
Value added tax receivable | | | 1,179 | | | 3,426 |
Other | | | 195 | | | 285 |
| | | | | | |
| | $ | 8,677 | | $ | 10,594 |
| | | | | | |
9. Goodwill
The Company had no goodwill balance as of April 3, 2010. Due to decreases in the Company’s market capitalization during fiscal 2009, the Company reviewed the recoverability of goodwill as of the end of the third quarter of 2009. Consistent with historical practices, the estimation of the fair value was determined based on a method that compares the Company’s market capitalization against the net book value of the Company’s assets. Based on the results of the review, it was determined that the fair value of the Company’s goodwill was less than the carrying value. Accordingly, as of the end of the third quarter of 2009, the Company recognized an impairment charge of $17.4 million, of which $16.0 million related to the NWR acquisition. The impairment charge is reflected in “Goodwill impairment charge” in the accompanying Consolidated Statement of Operations for the year ended March 28, 2009. This charge had no effect on the Company’s cash flows or liquidity and was not deductible for income tax purposes.
10. Property, Plant and Equipment
Property, plant and equipment as of April 3, 2010 and March 28, 2009 consisted of the following:
| | | | | | | | | | |
(In thousands) | | Estimated
Useful Lives | | 2010 | | | 2009 | |
Land | | n/a | | $ | 3,086 | | | $ | 3,056 | |
Buildings and improvements | | 3 to 40 years | | | 40,225 | | | | 39,443 | |
Machinery and equipment | | 3 to 10 years | | | 52,328 | | | | 46,094 | |
Computer equipment and software | | 1 to 7 years | | | 29,373 | | | | 29,289 | |
| | | | | | | | | | |
| | | | | 125,012 | | | | 117,882 | |
Less accumulated depreciation | | | | | (84,422 | ) | | | (74,877 | ) |
| | | | | | | | | | |
| | | | $ | 40,590 | | | $ | 43,005 | |
| | | | | | | | | | |
Depreciation expense totaled $10.0 million, $10.3 million and $7.8 million in 2010, 2009 and 2008, respectively.
Costs related to the implementation of an ERP system that met the criteria for capitalization under ASC Topic 350 “Intangibles—Goodwill and Other” were insignificant in 2010 and were $0.9 million and $1.2 million in 2009 and 2008, respectively.
63
11. Acquired Intangible Assets
Acquired intangible assets as of April 3, 2010 and March 28, 2009 consisted of the following:
| | | | | | | | | | |
(In thousands, except years) | | Weighted
Average
Useful Life
(In years) | | 2010 | | | 2009 | |
Developed technology | | 7 | | $ | 8,100 | | | $ | 8,100 | |
Customer relationships | | 6 | | | 2,700 | | | | 2,700 | |
Customer backlog | | 1 | | | 700 | | | | 700 | |
Trade name and trademarks | | 3 | | | 400 | | | | 400 | |
Change of control agreements | | 1 | | | 100 | | | | 100 | |
Fair value of below-market lease (non-current portion) | | 3.8 | | | 311 | | | | 311 | |
Patents | | 13.2 | | | 2,978 | | | | 2,546 | |
| | | | | | | | | | |
| | | | | 15,289 | | | | 14,857 | |
Less accumulated amortization | | | | | (7,034 | ) | | | (4,885 | ) |
| | | | | | | | | | |
Total non-current acquired intangible assets | | | | | 8,255 | | | | 9,972 | |
| | | | | | | | | | |
Fair value of below-market lease (current portion) | | | | | 110 | | | | 110 | |
| | | | | | | | | | |
Total acquired intangible assets | | | | $ | 8,365 | | | $ | 10,082 | |
| | | | | | | | | | |
Amortization expense for acquired intangible assets has been recorded in the Consolidated Statements of Operations as follows:
| | | | | | | | | |
(In thousands) | | 2010 | | 2009 | | 2008 |
Cost of sales | | $ | 1,155 | | $ | 1,157 | | $ | 800 |
Selling, service and administration | | | 798 | | | 1,175 | | | 1,250 |
Research, development and engineering | | | 196 | | | 61 | | | 51 |
| | | | | | | | | |
| | $ | 2,149 | | $ | 2,393 | | $ | 2,101 |
| | | | | | | | | |
The estimated amortization expense for acquired intangible assets in future years is as follows (in thousands):
| | | |
Year | | Amortization |
2011 | | $ | 1,939 |
2012 | | | 1,671 |
2013 | | | 1,512 |
2014 | | | 1,383 |
2015 | | | 543 |
Future years | | | 1,317 |
| | | |
| | $ | 8,365 |
| | | |
12. Other Assets
Other assets consisted of the following as of April 3, 2010 and March 28, 2009:
| | | | | | |
(In thousands) | | 2010 | | 2009 |
Minority equity investment | | $ | 8,184 | | $ | 7,991 |
Consignment and demo equipment, net | | | 3,957 | | | 6,447 |
All-Ring patent suit court bond | | | — | | | 8,738 |
Other | | | 867 | | | 856 |
| | | | | | |
| | $ | 13,008 | | $ | 24,032 |
| | | | | | |
64
During fiscal 2010, the Company established letters of credit as substitution for the All-Ring patent suit court bond and received back $9.1 million in total proceeds from the court. The All-Ring patent suit court bond balance declined by $8.7 million due to the receipt of the $9.1 million proceeds, inclusive of a $0.4 million favorable impact from foreign currency rate fluctuation.
13. Income Taxes
The Company accounts for income taxes under the asset and liability method. Under this method, deferred income taxes are recognized for the future tax consequences attributable to temporary differences between the financial statement and tax balances of existing assets and liabilities. Deferred tax assets and liabilities are measured using enacted tax rates expected to apply to taxable income in the years in which those assets and liabilities are expected to be recovered or settled. The effect on deferred taxes of a change in tax rates is recognized in income in the period that includes the enactment date. When management determines that it is not more likely than not that a deferred tax asset will be fully realized, a valuation allowance is established to reduce deferred tax assets to the amount expected to be realized.
Net deferred tax assets at April 3, 2010 and March 28, 2009 consisted of the following:
| | | | | | | | |
(In thousands) | | 2010 | | | 2009 | |
Deferred tax assets and liabilities: | | | | | | | | |
Current | | | | | | | | |
Inventory valuation and warranty costs | | $ | 5,612 | | | $ | 4,821 | |
Receivables and other current assets | | | (268 | ) | | | (141 | ) |
Payroll-related accruals | | | 654 | | | | 583 | |
Accrued liabilities | | | 390 | | | | 636 | |
Deferred revenue | | | 2,625 | | | | 3,002 | |
Tax loss and credit carryforwards | | | — | | | | 47 | |
Other | | | 13 | | | | (212 | ) |
| | | | | | | | |
Total current deferred tax assets | | | 9,026 | | | | 8,736 | |
Valuation allowance, current | | | (1,794 | ) | | | (2,438 | ) |
| | | | | | | | |
Net current deferred tax assets | | $ | 7,232 | | | $ | 6,298 | |
| | | | | | | | |
Non-current | | | | | | | | |
Deferred compensation | | | 3,538 | | | | 2,430 | |
Intangible assets and investments | | | 4,031 | | | | 3,039 | |
Accrued liabilities | | | 475 | | | | 559 | |
Property, plant and equipment | | | 1,027 | | | | 415 | |
Other comprehensive loss | | | 137 | | | | 698 | |
Tax loss and credit carryforwards | | | 28,234 | | | | 23,056 | |
Other | | | 1,347 | | | | 1,177 | |
| | | | | | | | |
Total non-current deferred tax asset | | | 38,789 | | | | 31,374 | |
Valuation allowance, non-current | | | (7,710 | ) | | | (8,754 | ) |
| | | | | | | | |
Net non-current deferred tax assets | | $ | 31,079 | | | $ | 22,620 | |
| | | | | | | | |
Total deferred tax assets | | | 47,815 | | | | 40,110 | |
Total valuation allowance | | | (9,504 | ) | | | (11,192 | ) |
| | | | | | | | |
Net deferred tax assets | | $ | 38,311 | | | $ | 28,918 | |
| | | | | | | | |
65
As of April 3, 2010 the Company had approximately $28.2 million in tax assets resulting from federal, state and foreign net operating losses and tax credits. A detailed breakdown of the net operating loss carryforwards (tax-effected) and tax credits at April 3, 2010 and March 28, 2009 was as follows:
| | | | | | |
(In thousands) | | 2010 | | 2009 |
Federal net operating losses | | $ | 2,021 | | $ | 2,021 |
State net operating losses | | | 3,364 | | | 2,539 |
Foreign operating losses and tax credits | | | 8,157 | | | 6,834 |
Federal research credits | | | 10,294 | | | 5,897 |
State research credits | | | 2,759 | | | 4,391 |
Federal minimum tax credit | | | 1,246 | | | 1,246 |
Federal capital losses | | | 393 | | | 175 |
| | | | | | |
| | $ | 28,234 | | $ | 23,103 |
| | | | | | |
The federal net operating losses expire in fiscal 2012. The state net operating losses expire on various dates through fiscal 2030. The majority of the foreign tax credits expire on various dates through fiscal 2020. The federal and most of the state research credits expire on various dates through fiscal 2030. Certain state research credits and the federal minimum tax credits are available indefinitely.
A valuation allowance of $9.5 million and $11.2 million was recorded as of April 3, 2010 and March 28, 2009, respectively. The valuation allowance decreased by $1.7 million in fiscal 2010 and increased by $6.0 million and $0.7 million in fiscal 2009 and fiscal 2008, respectively. The decrease in the valuation allowance in fiscal 2010 was primarily caused by the expiration of state research credits previously subject to a valuation and a reduction in the valuation against state net operating losses. These reductions were partially offset by increased valuation allowances on capital losses and other-than-temporary impairment charges on ARS. Future adjustments to the valuation allowance against the deferred tax assets may be recorded with changes in future forecasts of taxable income. Based upon historical and future expectations of taxable income, the Company believes that its valuation allowance on deferred tax assets is adequate and that it is more-likely-than-not that the net deferred tax assets of $38.3 million at April 3, 2010 will be realized within the applicable carryforward periods.
The components of income before income taxes and the provision for (benefit from) income taxes, all from continuing operations, were as follows:
| | | | | | | | | | | | |
(In thousands) | | 2010 | | | 2009 | | | 2008 | |
(Loss) income before income taxes: | | | | | | | | | | | | |
Domestic | | $ | (20,139 | ) | | $ | (62,614 | ) | | $ | 21,678 | |
Foreign | | | (1,623 | ) | | | (2,063 | ) | | | 4,834 | |
| | | | | | | | | | | | |
Total (loss) income before income taxes | | $ | (21,762 | ) | | $ | (64,677 | ) | | $ | 26,512 | |
| | | | | | | | | | | | |
(Benefit from) provision for income taxes: | | | | | | | | | | | | |
Current: | | | | | | | | | | | | |
U.S. federal and state | | | (1,169 | ) | | | (4,297 | ) | | | 5,091 | |
Foreign | | | 784 | | | | 3,671 | | | | 2,116 | |
| | | | | | | | | | | | |
| | | (385 | ) | | | (626 | ) | | | 7,207 | |
Deferred: | | | | | | | | | | | | |
U.S. federal and state | | | (9,045 | ) | | | (13,283 | ) | | | 2,992 | |
Foreign | | | (348 | ) | | | 282 | | | | (276 | ) |
| | | | | | | | | | | | |
| | | (9,393 | ) | | | (13,001 | ) | | | 2,716 | |
| | | | | | | | | | | | |
Total (benefit from) provision for income taxes | | $ | (9,778 | ) | | $ | (13,627 | ) | | $ | 9,923 | |
| | | | | | | | | | | | |
66
No tax benefits associated with share-based compensation were allocated to common stock during fiscal 2010. During fiscal 2009 and 2008, $0.1 million of tax benefits associated with share-based compensation were allocated to common stock.
A reconciliation of the Company’s effective tax rate to the United States federal statutory income tax rate was as follows:
| | | | | | | | | |
(In thousands) | | 2010 | | | 2009 | | | 2008 | |
U.S. federal statutory income tax rate | | 35.0 | % | | 35.0 | % | | 35.0 | % |
State income taxes, net of federal benefit | | 1.0 | | | 1.0 | | | 0.8 | |
Tax credits | | 4.4 | | | 2.7 | | | (4.8 | ) |
Domestic production and export tax incentives | | — | | | — | | | (1.2 | ) |
Non-U.S. income taxed at different rates | | 5.9 | | | 3.7 | | | 1.5 | |
Changes in unrecognized tax benefits | | 0.2 | | | (1.9 | ) | | 0.2 | |
Goodwill impairment | | — | | | (12.5 | ) | | — | |
Change in valuation allowance | | — | | | (6.5 | ) | | 0.9 | |
Stock compensation | | (2.6 | ) | | (1.1 | ) | | 0.9 | |
In-process research and development write-off | | — | | | — | | | 3.8 | |
Other, net | | 1.0 | | | 0.7 | | | 0.3 | |
| | | | | | | | | |
| | 44.9 | % | | 21.1 | % | | 37.4 | % |
| | | | | | | | | |
During the year ended April 3, 2010, the Internal Revenue Service completed its audit of fiscal 2008. This resulted in an incremental tax liability of $0.3 million. The Company also performed a carryback of fiscal 2009 net operating losses to its fiscal 2008 and fiscal 2007 income tax returns, resulting in a tax refund of $3.2 million and the recovery of research and development and foreign tax credits previously claimed.
During the year ended March 28, 2009, the Company recorded a goodwill impairment charge of $17.4 million. During the ten months ended March 29, 2008, the Company recorded an in-process research and development write-off of $2.8 million. Each of these items was non-deductible for tax purposes.
The Company operates globally but considers its significant tax jurisdictions to include the United States, Taiwan, China, Korea, Japan, Singapore and the United Kingdom. As of April 3, 2010, the following tax years remained subject to examination by the major tax jurisdictions indicated:
| | |
Major Jurisdictions | | Open Tax Years |
China | | 2003 and forward |
Japan | | 2003 and forward |
Korea | | 2005 and forward |
Singapore | | 2004 and forward |
Taiwan | | 2005 and forward |
United Kingdom | | 2004 and forward |
United States | | 2004 and forward |
The Company adopted FASB Interpretation No. 48 “Accounting for Uncertainty in Income Taxes—an interpretation of FASB Statement No. 109” (FIN 48), incorporated into the ASC within ASC Topic 740 “Income Taxes” (ASC Topic 740) as of the beginning of fiscal 2008. This interpretation clarifies the criteria for recognizing income tax benefits under SFAS No. 109, also incorporated into ASC Topic 740, and requires additional disclosures for uncertain tax positions. Under ASC Topic 740, financial statement recognition of the benefit for tax positions is dependent upon the benefit being more likely than not to be sustainable upon examination. If this threshold is met, the tax benefit is then measured and recognized at the largest amount that is more-likely-than-not to be realized upon ultimate settlement. The adoption of FIN 48 did not have a material impact on the Company’s financial position.
67
A reconciliation of the beginning and ending amount of the consolidated liability for unrecognized income tax benefits for the years ended April 3, 2010 and March 28, 2009 was as follows:
| | | | | | | | |
(In thousands) | | 2010 | | | 2009 | |
Beginning unrecognized tax benefits balance | | $ | 7,645 | | | $ | 6,871 | |
Gross increases for tax positions of prior years | | | — | | | | 296 | |
Gross decreases for tax positions of prior years | | | (375 | ) | | | (12 | ) |
Gross increases for tax positions for current year | | | 270 | | | | 490 | |
| | | | | | | | |
Ending unrecognized tax benefits balance | | $ | 7,540 | | | $ | 7,645 | |
| | | | | | | | |
The total amount of net unrecognized tax benefits that, if recognized, would affect the effective tax rate was $7.5 million at April 3, 2010 and $7.6 million at March 28, 2009. The Company recognizes accrued interest and penalties on unrecognized tax positions in the provision for income taxes. Gross accrued interest and penalties were $1.9 million and $1.8 million as of April 3, 2010 and March 28, 2009, respectively. The gross amount of interest and penalties incurred during fiscal 2010, 2009 and 2008 was $0.1 million, $0.6 million and $0.2 million, respectively. Other than for increases and decreases consistent with prior years, the Company does not anticipate any significant changes in unrecognized tax benefits in the next twelve months as the result of examinations or lapse of statutes of limitation. The unrecognized tax benefits, along with the related accrued interest and penalties, were presented as long-term income taxes payable on the Consolidated Balance Sheets as of April 3, 2010 and March 28, 2009.
14. Accrued Liabilities
Accrued liabilities consisted of the following at April 3, 2010 and March 28, 2009:
| | | | | | |
(In thousands) | | 2010 | | 2009 |
Payroll-related liabilities | | $ | 5,727 | | $ | 3,971 |
Product warranty accrual | | | 2,576 | | | 2,057 |
Pension benefit liabilities | | | 1,415 | | | 1,230 |
Purchase order commitments and receipts | | | 1,352 | | | 673 |
Professional fees payable | | | 1,327 | | | 1,143 |
Customer deposits | | | 1,020 | | | 624 |
Value added taxes payable | | | 16 | | | 2,095 |
Other | | | 1,504 | | | 1,165 |
| | | | | | |
| | $ | 14,937 | | $ | 12,958 |
| | | | | | |
15. Product Warranty
The following is a reconciliation of the changes in the aggregate product warranty accrual for fiscal 2010, 2009 and 2008:
| | | | | | | | | | | | |
(In thousands) | | 2010 | | | 2009 | | | 2008 | |
Product warranty accrual, beginning | | $ | 2,057 | | | $ | 3,740 | | | $ | 3,893 | |
NWR warranty reserve acquired | | | — | | | | — | | | | 774 | |
Warranty charges incurred, net | | | (4,040 | ) | | | (6,546 | ) | | | (6,127 | ) |
Provision for warranty charges | | | 4,559 | | | | 4,863 | | | | 5,200 | |
| | | | | | | | | | | | |
Product warranty accrual, ending | | $ | 2,576 | | | $ | 2,057 | | | $ | 3,740 | |
| | | | | | | | | | | | |
68
Net warranty charges incurred include labor charges and costs of replacement parts for system repairs under warranty. These costs are recorded net of any estimated cost recoveries resulting from either successful repair of damaged parts or from warranties offered by the Company’s suppliers for defective components. The provision for warranty charges reflects the estimate of future anticipated net warranty costs to be incurred for all products under warranty at fiscal year end and is recorded to cost of sales.
16. Deferred Revenue
The following is a reconciliation of the changes in deferred revenue for fiscal 2010, 2009 and 2008:
| | | | | | | | | | | | |
(In thousands) | | 2010 | | | 2009 | | | 2008 | |
Deferred revenue, beginning | | $ | 11,251 | | | $ | 12,583 | | | $ | 12,290 | |
NWR deferred revenue acquired | | | — | | | | — | | | | 1,603 | |
Revenue deferred | | | 27,774 | | | | 23,763 | | | | 38,176 | |
Revenue recognized | | | (25,832 | ) | | | (25,095 | ) | | | (39,486 | ) |
| | | | | | | | | | | | |
Deferred revenue, ending | | $ | 13,193 | | | $ | 11,251 | | | $ | 12,583 | |
| | | | | | | | | | | | |
17. Derivative Financial Instruments
The Company purchases derivative financial instruments on a limited basis and does not use them for trading purposes. It does, however, use derivatives to manage well-defined foreign currency risks. The Company hedges material non-functional currency monetary asset and liability balances. Foreign exchange contracts having gains and losses are recognized at the end of each fiscal period in the Company’s results of operations. Such gains and losses are typically offset by the corresponding changes to the related underlying hedged item. Cash flows from derivative financial instruments are classified in the same category as the cash flows from the items being hedged.
At April 3, 2010 and March 28, 2009, the Company had net forward exchange contracts to purchase foreign currencies totaling $2.8 million and $4.3 million, respectively. In general, these contracts mature in less than one year and the counterparties are large, highly rated banks; therefore, the Company believes that the risk of loss as a result of nonperformance by the banks is minimal.
The table below summarizes, by currency, the notional amounts of forward exchange contracts in U.S. dollars as of April 3, 2010 and March 28, 2009. The “bought” amounts represent the net U.S. dollar equivalents of commitments to purchase foreign currencies, and the “sold” amounts represent the net U.S. dollar equivalent of commitments to sell foreign currencies. The foreign currency amounts have been translated into a U.S. dollar equivalent value using the exchange rate as of April 3, 2010 and March 28, 2009.
| | | | | | | | |
| | | Bought (Sold) | |
(In thousands) | | 2010 | | | 2009 | |
Japanese yen | | $ | 4,719 | | | $ | 5,573 | |
Taiwan Dollar | | | 1,985 | | | | 4,432 | |
Korean Won | | | (2,324 | ) | | | (1,422 | ) |
British Pound | | | (2,087 | ) | | | (4,068 | ) |
Euro | | | 504 | | | | (249 | ) |
| | | | | | | | |
| | $ | 2,797 | | | $ | 4,266 | |
| | | | | | | | |
69
18. Commitments and Contingencies
The aggregate minimum commitment obligation under operating leases and purchase commitments beyond April 3, 2010 was as follows (in thousands):
| | | | | | |
Year | | Operating
Leases | | Purchase
Commitments |
2011 | | $ | 2,267 | | $ | 24,282 |
2012 | | | 1,215 | | | 1,298 |
2013 | | | 614 | | | — |
2014 | | | 252 | | | — |
2015 | | | 72 | | | — |
Thereafter | | | 6 | | | — |
| | | | | | |
| | $ | 4,426 | | $ | 25,580 |
| | | | | | |
The Company leases certain equipment, automobiles, manufacturing and office space under operating leases, which are non-cancelable and expire on various dates through fiscal 2016. Rental expense for all operating leases was $1.9 million, $2.1 million and $1.8 million in fiscal 2010, 2009 and 2008, respectively. Purchase commitments represent obligations under open purchase orders, primarily for inventory, issued in the normal course of business.
In the normal course of business, the Company indemnifies customers with respect to certain matters. The Company has agreed, under certain conditions, to hold these third parties harmless against specified losses, such as those arising from other third party claims that the Company’s products, when used for their intended purposes, infringe the intellectual property rights of such other third parties. To date, the Company has not recorded any material charges related to these types of indemnifications.
19. Earnings (Loss) Per Share
Following is a reconciliation of weighted average shares outstanding used in the calculation of basic and diluted earnings per share for fiscal 2010, 2009 and 2008:
| | | | | | | | | | | |
(In thousands, except per share data) | | 2010 | | | 2009 | | | 2008 |
Net (loss) income | | $ | (11,984 | ) | | $ | (51,050 | ) | | $ | 16,589 |
| | | | | | | | | | | |
Weighted average shares used for basic earnings per share | | | 27,449 | | | | 27,079 | | | | 27,929 |
Incremental diluted shares | | | — | | | | — | | | | 394 |
| | | | | | | | | | | |
Weighted average shares used for diluted earnings per share | | | 27,449 | | | | 27,079 | | | | 28,323 |
| | | | | | | | | | | |
Net (loss) income per share: | | | | | | | | | | | |
Net (loss) income—basic | | $ | (0.44 | ) | | $ | (1.89 | ) | | $ | 0.59 |
| | | | | | | | | | | |
Net (loss) income—diluted | | $ | (0.44 | ) | | $ | (1.89 | ) | | $ | 0.59 |
| | | | | | | | | | | |
Awards of options, stock-settled stock appreciation rights (SOSARs) and unvested restricted stock units (RSUs) representing an additional 4.5 million, 4.3 million and 2.7 million shares of stock for fiscal 2010, 2009 and 2008, respectively, were not included in the calculation of diluted net earnings per share because their effect would have been antidilutive.
20. Share Repurchase Program
On May 15, 2008, the Board of Directors authorized a share repurchase program totaling $20.0 million to acquire shares of the Company’s outstanding common stock primarily to offset dilution from equity compensation programs. The repurchases are to be made at management’s discretion in the open market or in
70
privately negotiated transactions in compliance with applicable securities laws and other legal requirements and are subject to market conditions, share price and other factors. There is no fixed completion date for the repurchase program.
During the year ended April 3, 2010, the Company repurchased 64,960 shares for $0.6 million under this program at an average price per share of $8.55, calculated inclusive of commissions and fees. As of April 3, 2010, a total of 372,825 shares have been repurchased for $5.3 million under this authorization at an average price of $14.16 per share, calculated inclusive of commissions and fees. Cash used to settle repurchase transactions is reflected as a component of cash used in financing activities in the Consolidated Statements of Cash Flows.
21. Legal Proceedings
All Ring Patent Infringement Prosecution
In August 2005, the Company commenced a proceeding in the Kaohsiung District Court of Taiwan (the Court) directed against All Ring Tech Co., Ltd. (All Ring) of Taiwan. The Company alleged that All Ring’s Capacitor Tester Model RK-T6600 (the Capacitor Tester) infringes ESI’s Taiwan Patent No. 207469, entitled “Circuit Component Handler” (the 207469 patent). As part of this proceeding, the Court issued a Provisional Attachment Order (PAO) in August 2005, restricting the use of some of All Ring’s assets. All Ring then filed a bond with the Court to obtain relief from the attachment of its assets. In July 2007, the Court issued a second PAO and approximately $6.0 million was restricted in All Ring’s accounts. The second PAO remains in effect and cannot be revoked.
In October 2005, the Company filed a formal patent infringement action against All Ring in the Court. The Court-appointed expert initially concluded that the Capacitor Tester and All Ring’s RK-T2000 both infringe every claim of the 207469 patent and that All Ring’s RK-L50 infringes a number of the claims as well. Because the Company had amended its claims in the cancellation action as described below, the Court asked the Court-appointed expert to respond to questions regarding the expert’s initial opinion. The Court-appointed expert conducted an additional inspection of each of these systems on September 21, 2009, and will re-evaluate whether the systems infringe after reviewing the briefs that the Company and All Ring have submitted. At the request of the Court, an audit of All Ring was conducted by an independent accounting firm in November and December of calendar 2009 to assist the Court in making any damages determinations. The firm has not yet issued its audit report.
Also in October 2005, the Court executed a Preliminary Injunction Order (PIO) that prohibits All Ring from manufacturing, selling, offering for sale or using the Capacitor Tester until final judgment is entered in the formal patent infringement action. The Court dismissed All Ring’s application to revoke the PIO on January 18, 2008, and the PIO remains in place.
In November 2005, All Ring filed a cancellation action against ESI’s 207469 patent in the Taiwan Intellectual Property Office (the IPO). On July 5, 2007, the IPO issued a notice requiring the Company to cancel two of the claims in the 207469 patent. The Company filed a response canceling the two claims and amending the remaining claims accordingly in August 2007. On August 12, 2008, the IPO decided the action in the Company’s favor and dismissed the cancellation action. All Ring appealed the IPO’s cancellation decision to the Board of Appeal of the Ministry of Economic Affairs (MOEA) on September 12, 2008. On March 23, 2009, the MOEA dismissed the IPO’s cancellation decision solely on procedural grounds. The MOEA remanded the case to the IPO with a request that the IPO issue another decision within six months that rectifies the procedural defects of the IPO’s earlier decision. On July 22, 2009, the IPO issued a decision dismissing All Ring’s cancellation action. All Ring appealed the IPO’s decision to the MOEA in August 2009. The MOEA dismissed All Ring’s appeal in February 2010.
71
Pursuant to the Court’s PAO and PIO, the Company was required to post Taiwan dollar security bonds with the Court. In July 2009, the Company established a letter of credit as a partial substitution for the security bonds and received back $2.0 million from the Court. The letter of credit is collateralized by $2.4 million of restricted cash. In September 2009, the Company established an additional letter of credit and received back the remaining $7.1 million of the security bonds. This second letter of credit is collateralized by $8.4 million of restricted cash. The total restricted cash balance of $10.8 million is included in the Consolidated Balance Sheet at April 3, 2010 as a current asset.
In the ordinary course of business, the Company is involved in various other legal matters, either asserted or unasserted, and investigations. In the opinion of management, ultimate resolution of these matters will not have a material effect on the Company’s consolidated financial position, results of operations or cash flows.
22. Shareholder Rights Plan
The Company’s current shareholder rights plan was entered into on May 18, 2009. Under the terms of the plan, each share of common stock carries with it a right (right), and under certain conditions, each right may be exercised to purchase 1/100 of a share of Series A No Par Preferred Stock at a purchase price of $60, subject to adjustment. The Rights are not presently exercisable and will only become exercisable following the occurrence of certain specified events. Generally, the Rights become exercisable after a person or group acquires or commences a tender offer that would result in beneficial ownership of 15 percent or more of outstanding common stock. In addition, the Rights become exercisable if any party becomes a beneficial owner of 10 percent or more of outstanding common stock and is determined by the Board of Directors to be an adverse party. If a person or group acquires 15 percent of outstanding common stock or the Board of Directors declares a person to be an Adverse Person, each Right will be adjusted to entitle its holder to receive, upon exercise, common stock, or, in certain circumstances, other assets of the Company having a value equal to twice the exercise price of the Right.
If, after the Rights become exercisable, the Company is acquired in a merger or other business combination, each Right will be adjusted to entitle its holder to receive, upon exercise, common stock of the acquiring company having a value equal to twice the exercise price of the Right, depending on the circumstances. The Rights expire on May 18, 2019 and may be redeemed by the Company for $0.001 per Right. The Rights do not have voting or dividend rights and, until they become exercisable, have no dilutive effect on the Company’s earnings.
23. Product and Geographic Information
Net sales by product type were as follows:
| | | | | | | | | |
(In thousands) | | 2010 | | 2009 | | 2008 |
Semiconductor Group (SG) | | $ | 28,525 | | $ | 44,855 | | $ | 109,156 |
Passive Components Group (PCG) | | | 31,697 | | | 29,243 | | | 75,112 |
Interconnect/Micro-machining Group (IMG) | | | 88,671 | | | 83,215 | | | 62,887 |
| | | | | | | | | |
| | $ | 148,893 | | $ | 157,313 | | $ | 247,155 |
| | | | | | | | | |
Net sales by geographic area, based on the location of the end user, were as follows:
| | | | | | | | | |
(In thousands) | | 2010 | | 2009 | | 2008 |
Asia | | $ | 124,078 | | $ | 110,114 | | $ | 183,783 |
Americas | | | 14,189 | | | 30,637 | | | 43,870 |
Europe | | | 10,626 | | | 16,562 | | | 19,502 |
| | | | | | | | | |
| | $ | 148,893 | | $ | 157,313 | | $ | 247,155 |
| | | | | | | | | |
72
Long-lived assets, exclusive of auction rate securities and deferred tax assets, by geographic area were as follows:
| | | | | | |
(In thousands) | | 2010 | | 2009 |
United States | | $ | 56,914 | | $ | 62,177 |
Asia | | | 4,851 | | | 14,737 |
Europe | | | 88 | | | 95 |
| | | | | | |
| | $ | 61,853 | | $ | 77,009 |
| | | | | | |
24. Restructuring and Cost Management Plans
In the fourth quarter of 2008, the Company observed weakness in memory markets and related reductions in customers’ capital spending and as a result, began to take cost-reduction actions in response to the change in market conditions. These adverse trends in memory markets and capital spending continued throughout fiscal 2009 and were further compounded by significant volatility in global financial markets and economic slowing. As a result, the Company took additional actions during fiscal 2009 in response to the market conditions in order to mitigate the impact of lower business levels to its results from operations. These actions included reductions in workforce, office consolidations in foreign subsidiary locations, the closure of a small research and development facility, suspension of the Company’s 401(k) match, temporary pay reductions, company-wide furloughs and plant shutdowns. The temporary salary reduction program was discontinued in the latter part of fiscal 2010.
No additional restructuring costs were incurred during fiscal 2010. During fiscal 2009, these actions resulted in $4.0 million of total restructuring costs, substantially all of which related to employee severance and related benefits. In conjunction with these actions, 158 positions were eliminated in the Company’s U.S. and overseas offices during fiscal 2009, impacting all functional groups. At April 3, 2010 and March 28, 2009, the amount included in accrued liabilities was $0.1 million and $0.4 million, respectively.
25. Quarterly Financial Information (Unaudited)
| | | | | | | | | | | | | | | | |
(In thousands, except per share data) | | 1st Quarter | | | 2nd Quarter | | | 3rd Quarter | | | 4th Quarter | |
Year ended April 3, 2010 | | | | | | | | | | | | | | | | |
Net sales | | $ | 22,603 | | | $ | 27,638 | | | $ | 39,048 | | | $ | 59,604 | |
Gross profit | | | 5,961 | | | | 9,426 | | | | 14,817 | | | | 25,661 | |
Net operating expenses1 | | | 14,910 | | | | 18,796 | | | | 20,703 | | | | 23,229 | |
Benefit from income taxes | | | (3,077 | ) | | | (2,893 | ) | | | (3,104 | ) | | | (704 | ) |
Net (loss) income2 | | | (5,530 | ) | | | (6,120 | ) | | | (2,413 | ) | | | 2,078 | |
Basic net (loss) income per share | | | (0.20 | ) | | | (0.22 | ) | | | (0.09 | ) | | | 0.08 | |
Diluted net (loss) income per share | | | (0.20 | ) | | | (0.22 | ) | | | (0.09 | ) | | | 0.07 | |
| | | | |
Year ended March 28, 2009 | | | | | | | | | | | | | | | | |
Net sales | | $ | 64,024 | | | $ | 49,610 | | | $ | 25,618 | | | $ | 18,061 | |
Gross profit | | | 25,291 | | | | 21,072 | | | | 7,418 | | | | 4,637 | |
Net operating expenses3 | | | 25,507 | | | | 23,366 | | | | 37,509 | | | | 26,314 | |
Benefit from income taxes | | | (1,692 | ) | | | (2,449 | ) | | | (1,834 | ) | | | (7,652 | ) |
Net loss4 | | | (2,758 | ) | | | (4,109 | ) | | | (29,258 | ) | | | (14,925 | ) |
Basic net loss per share | | | (0.10 | ) | | | (0.15 | ) | | | (1.08 | ) | | | (0.55 | ) |
Diluted net loss per share | | | (0.10 | ) | | | (0.15 | ) | | | (1.08 | ) | | | (0.55 | ) |
73
The sum of the quarterly data presented in the table above for fiscal 2010 and 2009 does not equal annual results due to rounding.
| 1. | In the first quarter of 2010, net operating expenses included a pretax benefit of $4.5 million for net merger termination proceeds. |
| 2. | In the fourth quarter of 2010, net income included a charge of $1.3 million for other-than-temporary impairment of auction rate securities. |
| 3. | In the fourth quarter of 2009, net operating expenses included pretax expenses of $4.1 million to write-off material from an RD&E program due to a change in product development strategy, $1.9 million of merger transaction costs associated with a terminated merger and $2.0 million of restructuring costs. In the third quarter of 2009, operating expenses included a $17.4 million goodwill impairment charge and pretax expense of $0.1 million in restructuring charges. In the second quarter of 2009, operating expenses included pretax expense of $1.2 million in restructuring costs. In the first quarter of 2009, operating expenses included pretax expense of $0.7 million in restructuring costs. |
| 4. | In the fourth quarter of 2009, net loss included charges of $1.1 million for other-than-temporary impairment of auction rate securities and $1.1 million for increases to the valuation allowance on deferred tax assets. In the third quarter of 2009, net loss included charges of $2.0 million for other-than-temporary impairment of auction rate securities and $4.9 million for increases to the valuation allowance on deferred tax assets. In the second quarter of 2009, net loss included a charge of $5.4 million for other-than-temporary impairment of auction rate securities. In the first quarter of 2009, net loss included a charge of $5.1 million for other-than-temporary impairment of auction rate securities. |
| Item 9. | Changes in and Disagreements with Accountants on Accounting and Financial Disclosure |
None.
| Item 9A. | Controls and Procedures |
Attached to this annual report as exhibits 31.1 and 31.2 are the certifications of our President and Chief Executive Officer (CEO) and our Chief Financial Officer (CFO) required by Section 302 of the Sarbanes-Oxley Act of 2002 (the Section 302 Certifications). This “Controls and Procedures” section of our annual report on Form 10-K is our disclosure of the conclusions of our management, including our CEO and our CFO, regarding the effectiveness of our disclosure controls and procedures as of the end of the period covered by this report based on management’s evaluation of those disclosure controls and procedures. This section of the Annual Report on Form 10-K should be read in conjunction with the Section 302 Certifications for a more complete understanding of the topics presented.
(a) Evaluation of Disclosure Controls and Procedures
We evaluated the effectiveness of the design and operation of our disclosure controls and procedures as of the end of the period covered by this Annual Report on Form 10-K. This controls evaluation was performed under the supervision and with the participation of management, including our CEO and CFO. Disclosure controls are procedures that are designed to ensure that information required to be disclosed in our reports filed under the Securities Exchange Act of 1934 (the Exchange Act), such as this Annual Report on Form 10-K, is recorded, processed, summarized and reported within the time periods specified by the Securities and Exchange Commission (the SEC). Disclosure controls are also designed to ensure that such information is accumulated and communicated to our management, including the CEO and CFO, as appropriate to allow timely decisions regarding required disclosure. Our quarterly evaluation of disclosure controls includes an evaluation of some components of our internal control over financial reporting. We also perform a separate annual evaluation of internal control over financial reporting for the purpose of providing the management report below.
74
The evaluation of our disclosure controls included a review of their objectives and design as well as their effect on the information generated for use in this Annual Report on Form 10-K. This type of evaluation is performed on a quarterly basis so that the conclusions of management, including the CEO and CFO, concerning the effectiveness of the disclosure controls can be reported in our periodic reports on Form 10-Q and Form 10-K. Many of the components of our disclosure controls are also evaluated on an ongoing basis by our finance organization. The overall goals of these various evaluation activities are to monitor our disclosure controls and to modify them as necessary. We intend to maintain the disclosure controls as dynamic systems that we adjust as circumstances merit.
Based on the controls evaluation, our CEO and CFO have concluded that, subject to the limitations noted in (c) below, as of the end of the period covered by this Form 10-K, our disclosure controls and procedures were effective to provide reasonable assurance that information required to be disclosed in our Exchange Act reports is recorded, processed, summarized and reported within the time periods specified by the SEC, and that material information relating to the Company is made known to management, including the CEO and the CFO, particularly during the time when our periodic reports are being prepared.
(b) Management’s Report on Internal Control Over Financial Reporting
Our management is responsible for establishing and maintaining adequate internal control over financial reporting, as such term is defined in Exchange Act Rules 13a-15(f) and 15d-15(f). Under the supervision and with the participation of our management, including our CEO and CFO, we conducted an evaluation of the effectiveness of our internal control over financial reporting as of April 3, 2010 based on the guidelines established inInternal Control—Integrated Framework issued by the Committee of Sponsoring Organizations of the Treadway Commission (COSO). Based on this evaluation, our management has concluded that our internal control over financial reporting was effective as of April 3, 2010.
KPMG LLP, an independent registered public accounting firm, has performed an independent assessment on the effectiveness of our internal control over financial reporting as referenced in their report included in (e) below.
(c) Limitations on Effectiveness of Controls
Our management, including our CEO and CFO, do not expect that our disclosure controls or our internal control over financial reporting will prevent all error and all fraud. A control system, no matter how well-conceived and operated, can provide only reasonable, not absolute, assurance that the objectives of the control system are met. Further, the design of a control system must reflect the fact that there are resource constraints, and the benefits of controls must be considered relative to their costs. Because of the inherent limitations in all control systems, no evaluation of controls can provide absolute assurance that all control issues and instances of fraud, if any, within the company have been detected. These inherent limitations include the realities that judgments in decision-making can be faulty, and that breakdowns can occur because of a simple error or mistake. Additionally, controls can be circumvented by the individual acts of some persons, by collusion of two or more people, or by management override of the controls. The design of any system of controls also is based in part upon certain assumptions about the likelihood of future events, and there can be no assurance that any design will succeed in achieving its stated goals under all potential future conditions. Because of the inherent limitations in a cost-effective control system, misstatements due to error or fraud may occur and not be detected.
(d) Changes in Internal Control
There has been no change in our internal control over financial reporting that occurred during our last fiscal quarter that has materially affected or is reasonably likely to materially affect our internal control over financial reporting.
75
(e) Report of Independent Registered Public Accounting Firm
The Board of Directors and Shareholders of
Electro Scientific Industries, Inc.:
We have audited Electro Scientific Industries, Inc.’s internal control over financial reporting as of April 3, 2010, based on criteria established in Internal Control—Integrated Framework issued by the Committee of Sponsoring Organizations of the Treadway Commission (COSO). Electro Scientific Industries, Inc.’s management is responsible for maintaining effective internal control over financial reporting and for its assessment of the effectiveness of internal control over financial reporting, included in the accompanying Management’s Report on Internal Control Over Financial Reporting included in Item 9A(b). Our responsibility is to express an opinion on the Company’s internal control over financial reporting based on our audit.
We conducted our audit in accordance with the standards of the Public Company Accounting Oversight Board (United States). Those standards require that we plan and perform the audit to obtain reasonable assurance about whether effective internal control over financial reporting was maintained in all material respects. Our audit included obtaining an understanding of internal control over financial reporting, assessing the risk that a material weakness exists, and testing and evaluating the design and operating effectiveness of internal control based on the assessed risk. Our audit also included performing such other procedures as we considered necessary in the circumstances. We believe that our audit provides a reasonable basis for our opinion.
A company’s internal control over financial reporting is a process designed to provide reasonable assurance regarding the reliability of financial reporting and the preparation of financial statements for external purposes in accordance with generally accepted accounting principles. A company’s internal control over financial reporting includes those policies and procedures that (1) pertain to the maintenance of records that, in reasonable detail, accurately and fairly reflect the transactions and dispositions of the assets of the company; (2) provide reasonable assurance that transactions are recorded as necessary to permit preparation of financial statements in accordance with generally accepted accounting principles, and that receipts and expenditures of the company are being made only in accordance with authorizations of management and directors of the company; and (3) provide reasonable assurance regarding prevention or timely detection of unauthorized acquisition, use, or disposition of the company’s assets that could have a material effect on the financial statements.
Because of its inherent limitations, internal control over financial reporting may not prevent or detect misstatements. Also, projections of any evaluation of effectiveness to future periods are subject to the risk that controls may become inadequate because of changes in conditions, or that the degree of compliance with the policies or procedures may deteriorate.
In our opinion, Electro Scientific Industries, Inc. maintained, in all material respects, effective internal control over financial reporting as of April 3, 2010, based on criteria established in Internal Control—Integrated Framework issued by the Committee of Sponsoring Organizations of the Treadway Commission (COSO).
We also have audited, in accordance with the standards of the Public Company Accounting Oversight Board (United States), the consolidated balance sheets of Electro Scientific Industries, Inc. and subsidiaries as of April 3, 2010 and March 28, 2009, and the related consolidated statements of operations, shareholders’ equity and comprehensive income (loss), and cash flows for the years ended April 3, 2010 and March 28, 2009 and the ten-month period ended March 29, 2008, and our report dated June 15, 2010 expressed an unqualified opinion on those consolidated financial statements.
/s/ KPMG LLP
Portland, Oregon
June 15, 2010
76
| Item 9B. | Other Information |
None.
PART III
| Item 10. | Directors, Executive Officers and Corporate Governance |
The information required by this item, including information about the Company’s audit committee, is included under the headings “Proposal 1: Election of Directors,” “Board Committees,” “Executive Officers” and “Section 16(a) Beneficial Ownership Reporting Compliance” in our Proxy Statement for our 2010 Annual Meeting of Shareholders and is incorporated herein by reference.
The Company has adopted the ESI Code of Conduct, a code of ethics and business practices with which every person who works for the Company is expected to comply. In addition, the Company has adopted a Code of Ethics for Financial Managers applicable to the chief executive officer, principal financial officer, principal accounting officer or controller and any other person performing similar functions on behalf of the Company. The ESI Code of Conduct and Code of Ethics for Financial Managers are publicly available on the Company’s website under “Governance” in the Investors Section (athttp://www.esi.com/esi/investors). This website address is intended to be an inactive, textual reference only; none of the material on this website is part of this report. If any waiver is granted, including any implicit waiver, from a provision of the Code of Ethics for Financial Managers, the Company will disclose the nature of such waiver on that website or in a report on Form 8-K.
| Item 11. | Executive Compensation |
The information required by this item is included under the headings “Board Compensation,” “Executive Compensation,” “Potential Payments Upon Termination or Change in Control,” “Compensation Discussion and Analysis,” “Compensation Committee Report” and “Compensation Committee Interlocks and Insider Participation” in our Proxy Statement for our 2010 Annual Meeting of Shareholders and is incorporated herein by reference.
| Item 12. | Security Ownership of Certain Beneficial Owners and Management and Related Shareholder Matters |
Certain information required by this item is included under the headings “Security Ownership of Certain Beneficial Owners and Management” and “Equity Compensation Plan Information” in our Proxy Statement for our 2010 Annual Meeting of Shareholders and is incorporated herein by reference.
| Item 13. | Certain Relationships and Related Transactions, and Director Independence |
The information required by this item is included under “Certain Relationships and Related Transactions” and “Corporate Governance Guidelines and Independence” in our Proxy Statement for our 2010 Annual Meeting of Shareholders and is incorporated herein by reference.
| Item 14. | Principal Accounting Fees and Services |
The information required by this item is included under “Principal Accounting Fees and Services” in our Proxy Statement for our 2010 Annual Meeting of Shareholders and is incorporated herein by reference.
77
PART IV
| Item 15. | Exhibits and Financial Statement Schedules |
(a)(1) and (a)(2) Financial Statements and Schedules
The Consolidated Financial Statements, together with the reports thereon of our independent registered public accounting firm, are included on the pages indicated below:
| | |
| | | Page |
Report of Independent Registered Public Accounting Firm | | 43 |
| |
Consolidated Balance Sheets as of April 3, 2010 and March 28, 2009 | | 44 |
| |
Consolidated Statements of Operations for the year ended April 3, 2010, year ended March 28, 2009 and ten months ended March 29, 2008 | | 45 |
| |
Consolidated Statements of Shareholders’ Equity and Comprehensive Income (Loss) for the year ended April 3, 2010, year ended March 28, 2009 and ten months ended March 29, 2008 | | 46 |
| |
Consolidated Statements of Cash Flows for the year ended April 3, 2010, year ended March 28, 2009 and ten months ended March 29, 2008 | | 47 |
| |
Notes to the Consolidated Financial Statements | | 48 |
There are no schedules required to be filed herewith.
(a)(3) Exhibits
The following exhibits are filed herewith and this list is intended to constitute the exhibit index. An asterisk (*) beside the exhibit number indicates the exhibits containing a management contract, compensatory plan or arrangement, which are required to be identified in this report.
| | |
| 2.1 | | Agreement and Plan of Merger and Reorganization by and among Electro Scientific Industries, Inc., Zirkon Merger Sub, LLC and Zygo Corporation dated as of October 15, 2008. Incorporated by reference to Exhibit 2.1 of the Company’s Current Report on form 8-K filed October 16, 2008. |
| |
| 2.2 | | Amendment No. 1 to Agreement and Plan of Reorganization by and among Electro Scientific Industries, Inc., Zirkon Merger Sub LLC and Zygo Corporation, dated as of December 2, 2008. Incorporated by reference to Annex A of the Company’s Registration Statement on Form S-4 filed on December 8, 2008. |
| |
| 3.1 | | Third Restated Articles of Incorporation, as amended. |
| |
| 3.2 | | 2009 Amended and Restated Bylaws. Incorporated by reference to Exhibit 3.2 of the Company’s Current Report on form 8-K filed on May 19, 2009 (the “May 19 8-K”). |
| |
| 4.1 | | Rights Agreement, dated as of May 18, 2009, between Electro Scientific Industries, Inc. and Mellon Investor Services. Incorporated by reference to Exhibit 4.1 of the May 19 8-K. |
| |
| 10.1* | | ESI 1983 Stock Option Plan, as amended. Incorporated by reference to Exhibit 10-E of the Company’s Annual Report on Form 10-K for the fiscal year ended May 31, 1986. |
| |
| 10.2* | | ESI 1989 Stock Option Plan, as amended. Incorporated by reference to Exhibit 10-B of the Company’s Annual Report on Form 10-K for the fiscal year ended May 31, 1997 (the “1997 10-K”). |
| |
| 10.3* | | 1996 Stock Incentive Plan. Incorporated by reference to Exhibit 10-E of the 1997 10-K. |
| |
| 10.4* | | 2000 Stock Option Plan. Incorporated by reference to Exhibit 10-F of the Company’s Annual Report on Form 10-K for the fiscal year ended June 3, 2000. |
| |
| 10.5* | | 2000 Stock Option Incentive Plan. Incorporated by reference to Appendix A of the Company’s definitive Proxy Statement for its 2000 Annual Meeting of Shareholders. |
78
| | |
| 10.6* | | Employment Agreement between the Company and Nicholas C. Konidaris, dated January 7, 2004. Incorporated by reference to Exhibit 10.1 of the Company’s previously filed Quarterly Report on Form 10-Q for the quarter ended February 28, 2004. |
| |
| 10.7* | | Amendment No. 1 to Employment Agreement between the Company and Nicholas Konidaris, dated as of January 25, 2005. Incorporated by reference to Exhibit 10.1 of the Company’s Current Report on Form 8-K filed on January 31, 2005 (the “January 31 8-K”). |
| |
| 10.8* | | Amendment to Employment Agreement, dated November 12, 2008, between the Company and Nicholas Konidaris. Incorporated by reference to Exhibit 10.2 of the Company’s Quarterly Report on Form 10-Q for the fiscal quarter ended December 27, 2008. |
| |
| 10.9* | | Amendment No. 3 to Employment Agreement, dated September 30, 2009, between Electro Scientific Industries, Inc. and Nicholas Konidaris. Incorporated by reference to Exhibit 10 of the Company’s Current Report on Form 8-K filed on October 2, 2009. |
| |
| 10.10* | | Amendment No. 1 to Stock Option Agreement between the Company and Nicholas Konidaris, dated as of January 25, 2005. Incorporated by reference to Exhibit 10.2 of the January 31 8-K. |
| |
| 10.11* | | Form of Amendment No. 1 to Stock Option Agreement between the Company and Nicholas Konidaris, dated as of January 25, 2005. Incorporated by reference to Exhibit 10.3 of the January 31 8-K. |
| |
| 10.12* | | Form of Amendment No. 1 to Stock Option Agreement between the Company and Nicholas Konidaris, dated as of January 25, 2005. Incorporated by reference to Exhibit 10.4 of the January 31 8-K. |
| |
| 10.13* | | Form of Restricted Stock Units Award Agreement between the Company and Nicholas Konidaris, dated as of January 25, 2005. Incorporated by reference to Exhibit 10.6 of the January 31 8-K. |
| |
| 10.14* | | 2004 Stock Incentive Plan, as amended. Incorporated by reference to Exhibit 10.2 of the Company’s Quarterly Report on Form 10-Q for the fiscal quarter ended September 29, 2007. |
| |
| 10.15* | | Deferred Compensation Plan 2008 Restatement. Incorporated by reference to Exhibit 10.14 of the Company’s Annual Report on Form 10-K for the fiscal year ended March 29, 2008 (the “2008 10-K”). |
| |
| 10.16* | | Amendment No. 1 to Deferred Compensation Plan 2008 Restatement. Incorporated by reference to Exhibit 10.31 of the 2008 10-K. |
| |
| 10.17* | | Form of Notice of Grant of Stock Options and Option Agreement and related Option Terms and Conditions (Incentive Stock Options) (for awards made prior to July 20, 2005). Incorporated by reference to Exhibit 10.3 of the Company’s Current Report on form 8-K filed on October 21, 2004 (the “October 21 8-K”). |
| |
| 10.18* | | Form of Notice of Grant of Stock Options and Option Agreement and related Option Terms and Conditions (Non-Qualified Stock Options) (for awards made prior to July 20, 2005). Incorporated by reference to Exhibit 10.4 of the October 21 8-K. |
| |
| 10.19* | | Form of Notice of Grant of Stock Options and Option Agreement and related Terms and Conditions (non-directors) (for awards made on July 20, 2005). Incorporated by reference to Exhibit 10.2 of the Company’s Current Report on Form 8-K filed July 26, 2005 (the “July 26 8-K”). |
| |
| 10.20* | | Form of Notice of Grant of Stock Options and Option Agreement and related Terms and Conditions (directors) (for awards made on July 20, 2005). Incorporated by reference to Exhibit 10.3 of the July 26 8-K. |
| |
| 10.21* | | Form of Performance Based Restricted Stock Units Award Agreement (for awards made prior to July 19, 2006). Incorporated by reference to Exhibit 10.5 of the January 31 8-K. |
| |
| 10.22* | | Form of Restricted Stock Units Award Agreement (for awards made prior to July 19, 2006). Incorporated by reference to Exhibit 10.7 of the January 31 8-K. |
79
| | | |
| 10.23 | * | | Form of Notice of Grant of Stock Options and Option Agreement and related Option Terms and Conditions (Non-Qualified Stock Options granted to Non-Directors) (for awards made on May 24, 2006). Incorporated by reference to Exhibit 10.1 of the Company’s Current Report on Form 8-K filed on May 30, 2006 (the “May 30 8-K”). |
| |
| 10.24 | * | | Form of Notice of Grant of Stock Options and Option Agreement and related Option Terms and Conditions (Non-Qualified Stock Options granted to Directors) (for awards made in May 2006). Incorporated by reference to Exhibit 10.2 of the May 30 8-K. |
| |
| 10.25 | * | | Form of Restricted Stock Unit Agreement between the Company and Nicholas Konidaris, dated as of October 4, 2006. Incorporated by reference to Exhibit 10.1 of the Company’s Current Report on Form 8-K filed October 11, 2006. |
| |
| 10.26 | * | | Form of Change in Control Agreement between the Company and each of Robert DeBakker and Paul Oldham. Incorporated by reference to Exhibit 10.1 of the Company’s Current Report on Form 8-K filed September 26, 2006. |
| |
| 10.27 | * | | Form of Restricted Stock Unit Agreement (for awards made on or after July 19, 2006 and prior to February 2008). Incorporated by reference to Exhibit 10.2 of the Company’s Current Report on Form 8-K filed July 25, 2006 (the “July 25 8-K”). |
| |
| 10.28 | * | | Form of Restricted Stock Unit Agreement for directors. Incorporated by reference to Exhibit 10.4 of the July 25 8-K. |
| |
| 10.29 | * | | Form of Notice of Grant of Stock Options and Option Agreement and related Terms and Conditions (for awards made after February 2008). Incorporated by reference to Exhibit 10.27 of the 2008 10-K. |
| |
| 10.30 | * | | Form of Amended and Restated Performance-Based Restricted Stock Unit Agreement (for July 2006 awards). Incorporated by reference to Exhibit 10.28 of the 2008 10-K. |
| |
| 10.31 | * | | Form of Restricted Stock Unit Agreement (for awards made after February 2008). Incorporated by reference to Exhibit 10.29 of the 2008 10-K. |
| |
| 10.32 | * | | Form of Performance-Based Restricted Stock Unit Agreement (for awards made on or after July 2007). Incorporated by reference to Exhibit 10.30 of the 2008 10-K. |
| |
| 10.33 | * | | Form of Stock Appreciation Rights Agreement. Incorporated by reference to Exhibit 10.1 of the Company’s Quarterly Report on Form 10-Q for the fiscal quarter ended September 26, 2009. |
| |
| 10.34 | * | | Form of Indemnification Agreement for directors and certain officers. Incorporated by reference to Exhibit 10 of the Company’s Current Report on Form 8-K filed on February 17, 2010. |
| |
| 10.35 | | | Voting Agreement, dated as of December 8, 2008, among Electro Scientific Industries, Inc. and The D3 Family Fund, L.P., The D3 Family Bulldog Fund, L.P., The D3 Family Canadian Fund, L.P., The DIII Offshore Fund, L.P., Nierenberg Investment Management Company, Inc., Nierenberg Investment Management Offshore, Inc. and David Nierenberg. Incorporated by reference to Exhibit 10 of the Company’s Current Report on form 8-K filed December 9, 2008. |
| |
| 10.36 | | | Settlement Agreement and Mutual Release, dated April 2, 2009, among Electro Scientific Industries, Inc., Zirkon Merger Sub, LLC, and Zygo Corporation. Incorporated by reference to Exhibit 10 of the Company’s Current Report on form 8-K filed April 3, 2009. |
| |
| 21 | | | Subsidiaries of the Company |
| |
| 23 | | | Consent of Independent Registered Public Accounting Firm |
| |
| 24.1 | | | Power of Attorney for Frederick Ball |
| |
| 24.2 | | | Power of Attorney for Richard J. Faubert |
| |
| 24.3 | | | Power of Attorney for Edward C. Grady |
80
| | |
| 24.4 | | Power of Attorney for Barry L. Harmon |
| |
| 24.5 | | Power of Attorney for W. Arthur Porter |
| |
| 24.6 | | Power of Attorney for Gerald F. Taylor |
| |
| 24.7 | | Power of Attorney for David Nierenberg |
| |
| 24.8 | | Power of Attorney for Jon D. Tompkins |
| |
| 24.9 | | Power of Attorney for Robert R. Walker |
| |
| 31.1 | | Certification of the Chief Executive Officer pursuant to Section 302 of the Sarbanes-Oxley Act of 2002. |
| |
| 31.2 | | Certification of the Chief Financial Officer pursuant to Section 302 of the Sarbanes-Oxley Act of 2002. |
| |
| 32.1 | | Certification of Chief Executive Officer pursuant to 18 U.S.C. Section 1350, as adopted pursuant to Section 906 of the Sarbanes-Oxley Act of 2002. |
| |
| 32.2 | | Certification of Chief Financial Officer pursuant to 18 U.S.C. Section 1350, as adopted pursuant to Section 906 of the Sarbanes-Oxley Act of 2002. |
81
SIGNATURES
Pursuant to the requirements of Section 13 or 15(d) of the Securities Exchange Act of 1934, the Registrant has duly caused this report to be signed on its behalf by the undersigned, thereunto duly authorized.
| | | | | | |
| Date: June 15, 2010 | | | | ELECTRO SCIENTIFIC INDUSTRIES, INC. |
| | | |
| | | | By: | | /s/ NICHOLAS KONIDARIS |
| | | | | | Nicholas Konidaris |
| | | | | | President and Chief Executive Officer |
Pursuant to the requirements of the Securities Exchange Act of 1934, this report has been signed below by the following persons on behalf of the Registrant and in the capacities indicated on June 15, 2010.
| | | | |
Signature | | Title |
| |
/s/ NICHOLAS KONIDARIS Nicholas Konidaris | | President, Chief Executive Officer and Director
(Principal Executive Officer) |
| |
/s/ PAUL OLDHAM Paul Oldham | | Vice President of Administration, Chief Financial Officer and Corporate Secretary
(Principal Financial Officer) |
| |
/s/ KERRY MUSTOE Kerry Mustoe | | Vice President, Corporate Controller, and Chief Accounting Officer
(Principal Accounting Officer) |
| |
*FREDERICK A. BALL Frederick Ball | | Director |
| |
*RICHARD J. FAUBERT Richard J. Faubert | | Director |
| |
*EDWARD C. GRADY Edward C. Grady | | Director |
| |
*BARRY L. HARMON Barry L. Harmon | | Director |
| |
*W. ARTHUR PORTER W. Arthur Porter | | Director |
| |
*GERALD F. TAYLOR Gerald F. Taylor | | Director |
| |
*DAVID NIERENBERG David Nierenberg | | Director |
| |
*JON D. TOMPKINS Jon D. Tompkins | | Chairman of the Board |
| |
*ROBERT R. WALKER Robert R. Walker | | Director |
| | |
*By: | | /s/ PAUL OLDHAM Paul Oldham,Attorney-in-fact | | |
82