MERCHANTS BANCSHARES, INC. AND SUBSIDIARIES
ANNUAL REPORT ON FORM 10-K FOR THE YEAR ENDED DECEMBER 31, 2012
TABLE OF CONTENTS
FORWARD-LOOKING STATEMENTS
Certain statements contained in this Annual Report on Form 10-K that are not historical facts may constitute forward-looking statements within the meaning of Section 27A of the Securities Act of 1933, as amended, and Section 21E of the Securities Exchange Act of 1934, as amended, and are intended to be covered by the safe harbor provisions of the Private Securities Litigation Reform Act of 1995. Forward-looking statements involve risks and uncertainties. These statements, which are based on certain assumptions and describe our future plans, strategies and expectations, can generally be identified by the use of the words “may,” “will,” “should,” “could,” “would,” “plan,” “potential,” “estimate,” “project,” “believe,” “intend,” “anticipate,” “expect,” “target” and similar expressions. These statements include, among others, statements regarding our intent, belief or expectations with respect to economic conditions, trends affecting our financial condition or results of operations, and our exposure to market, interest rate and credit risk.
Forward-looking statements are based on the current assumptions and beliefs of Management and are only expectations of future results. Our actual results could differ materially from those projected in the forward-looking statements as a result of, among other factors, adverse conditions in the capital and debt markets; changes in interest rates; competitive pressures from other financial institutions; the effects of continuing deterioration in general economic conditions on a national basis or in the local markets in which we operate, including changes which adversely affect borrowers’ ability to service and repay our loans; changes in the value of securities and other assets; changes in loan default and charge-off rates; the adequacy of loan loss reserves; reductions in deposit levels necessitating increased borrowing to fund loans and investments; changes in government regulation; and changes in assumptions used in making such forward-looking statements, as well as the other risks and uncertainties detailed in Item 1A. “Risk Factors,” beginning on page 12 of this Annual Report on Form 10-K. Forward-looking statements speak only as of the date on which they are made. We do not undertake any obligation to update any forward-looking statement to reflect circumstances or events that occur after the date the forward-looking statements are made.
USE OF NON-GAAP FINANCIAL MEASURES
Certain information in Item 7, “Management’s Discussion and Analysis of Financial Condition and Results of Operations” contains financial information determined by methods other than in accordance with accounting principles generally accepted in the United States of America (“GAAP”). We use these “non-GAAP” measures in our analysis of our performance and believe that these non-GAAP financial measures provide a greater understanding of ongoing operations and enhance comparability of results with prior periods as well as demonstrating the effects of significant gains and charges in the current period. We believe that a meaningful analysis of our financial performance requires an understanding of the factors underlying that performance. We believe that investors may use these non-GAAP financial measures to analyze financial performance without the impact of unusual items that may obscure trends in our underlying performance. These disclosures should not be viewed as a substitute for operating results determined in accordance with GAAP, nor are they necessarily comparable to non-GAAP performance measures that may be presented by other companies.
In several places net interest income is presented on a fully taxable equivalent basis. Specifically included in interest income is tax-exempt interest income from certain tax-exempt loans. An amount equal to the tax benefit derived from this tax exempt income is added back to the interest income total, to produce net interest income on a fully taxable equivalent basis. We believe the disclosure of taxable equivalent net interest income information improves the clarity of financial analysis, and is particularly useful to investors in understanding and evaluating the changes and trends in our results of operations. Other financial institutions commonly present net interest income on a taxable equivalent basis. This adjustment is considered helpful in the comparison of one financial institution’s net interest income to that of another, as each will have a different proportion of taxable exempt interest from its earning assets. Moreover, net interest income is a component of a second financial measure commonly used by financial institutions, net interest margin, which is the ratio of net interest income to average earning assets. For purposes of this measure as well, other financial institutions generally use taxable equivalent net interest income to provide a better basis of comparison from institution to institution. We follow these practices. A reconciliation of taxable equivalent financial information to our consolidated financial statements prepared in accordance with GAAP appears at the bottom of the table entitled “Distribution of Assets, Liabilities and Shareholders Equity; Interest Rates and Net Interest Margin.” A 35.0% tax rate was used in both 2012 and 2011.
PART I
ITEM 1 - BUSINESS
OVERVIEW
Merchants Bancshares, Inc. (“Merchants”) is a bank holding company originally organized under Vermont law in 1983 (and subsequently reincorporated in Delaware in 1987) for the purposes of owning all of the outstanding capital stock of Merchants Bank. Merchants Bank, which is Merchants’ primary subsidiary, is a Vermont commercial bank with 33 full-service banking offices located throughout the state of Vermont.
Merchants Bank was organized in 1849 and as of December 31, 2012, is the sole remaining statewide commercial banking operation in Vermont, with deposits totaling $1.27 billion, gross loans of $1.08 billion, and total assets of $1.71 billion. As used herein, “Merchants,” “we,” “us,” “our” shall mean Merchants Bancshares, Inc. and our subsidiaries unless otherwise noted or the context otherwise requires.
Our Trust division offers investment management, financial planning and trustee services. As of December 31, 2012, this division had fiduciary responsibility for assets having a market value in excess of $555 million, of which more than $500 million constituted managed assets.
MBVT Statutory Trust I was formed on December 15, 2004 as part of our private placement of an aggregate of $20 million of trust preferred securities through a pooled trust preferred program. The Trust was formed for the sole purpose of issuing non-voting capital securities. The proceeds from the sale of the capital securities were loaned to us under junior subordinated debentures issued to the Trust. The debentures are the only asset of the Trust and payments under the debentures are the sole revenue of the Trust.
EMPLOYEES
As of December 31, 2012, we employed 288 full-time and 34 part-time employees, representing a combined full-time equivalent complement of 306 employees.
We maintain comprehensive employee benefits programs for employees, which provide major medical insurance, hospitalization, dental insurance, long-term and short-term disability insurance, life insurance and a 401(k) Plan. We believe that relations with our employees are good.
COMPETITION
Presently, there are 14 independent banks and two independent trust companies headquartered in the State of Vermont. In addition, there are nine regional or national banks that have operations in Vermont. Merchants Bank remains the only independent statewide bank headquartered in the State of Vermont. Of the companies headquartered outside Vermont, seven are located in either Connecticut, Massachusetts, New Hampshire, New York or Ohio. Two other banking companies are owned by a parent headquartered outside of the United States (one in Canada and one in the United Kingdom). Based upon the FDIC deposit market share data report for June 30, 2012, Merchants has 10.67% of the Vermont bank deposit market.
We compete in Vermont for deposit and loan business not only with other commercial and savings banks, and savings and loan associations, but also with credit unions, and other non-bank financial providers. As of December 31, 2012, the most recently available information, there were more than 26 state- or federally-chartered credit unions operating in Vermont. As a bank holding company and state-chartered commercial bank, we are subject to extensive regulation and supervision, including, in many cases, regulation that limits the type and scope of our activities. The non-bank financial service providers that compete with us may be subject to less restrictive regulation and supervision. Competition from nationally-chartered banks, local institutions, and credit unions continues to be active.
Prior to 2010, there were a number of new banking offices opened in Vermont by existing banks or new market entrants. There was one new full service banking office opened in Vermont during 2011 and none opened during 2012. This makes it imperative to have competitive products and exceptional service levels in order to compete effectively. The Vermont marketplace is relatively saturated as there are 20% fewer households and businesses per branch versus the U.S. average.
Prior to 2006, there was a significant increase in new lenders licensed to do business in Vermont. These companies offered business, home mortgage and consumer finance loans. From December 31, 2006 to December 31, 2011, the number of licensed lenders declined from 626 to 410. The decline in licensed lenders benefitted us positively in the commercial loan and home mortgage business.
The fact that we are a locally-managed, independent bank has, we believe, contributed significantly to the growth in average loans and deposits between 2006 and 2012. Customers have cited the local management and decision-making as important considerations when choosing a bank, and the sale of several independent Vermont-based financial institutions since 2007 has narrowed the base of independent Vermont-based financial institutions that such customers may favor.
From a retail product standpoint, we have seen a significant change in the competitive landscape in the past few years. Federal legislation enacted during 2010, coupled with the extended period of low absolute interest rates, has prompted many banks to evaluate their transaction account structures and make changes to their product offerings. We reviewed and changed our business product line-up and fee structure in 2012 and will review alternative retail account structures during 2013. Any changes will take into account competitive products available in the market.
No material part of our business is dependent upon one, or a few, customers, or upon a particular industry segment, the loss of which would have a material adverse impact on our operations.
REGULATION AND SUPERVISION
General
As a bank holding company registered under the Bank Holding Company Act of 1956, as amended (the “BHCA”), we are subject to regulation and supervision by the Board of Governors of the Federal Reserve System (the “FRB”). As a state-chartered commercial bank, Merchants Bank is subject to regulation and supervision by the Federal Deposit Insurance Corporation (the “FDIC”) and by the Commissioner of the Department of Financial Regulation of the State of Vermont (the “Commissioner”). To the extent that the following information describes statutory or regulatory provisions, it is qualified in its entirety by reference to those particular statutory provisions. Any change in applicable law or regulation may have a material effect on our business and prospects. The following discussion of certain of the material elements of the regulatory framework applicable to banks and bank holding companies is not intended to be complete.
Financial Regulatory Reform Legislation
The Dodd-Frank Wall Street Reform and Consumer Protection Act (the “Dodd-Frank Act”) comprehensively reformed the regulation of financial institutions, products and services. Among other things, the Dodd-Frank Act:
· | granted the FRB increased supervisory authority and codified the source of strength doctrine, as discussed in more detail in “—Source of Strength” below; |
· | provided for new capital standards applicable to us, as discussed in more detail in “—Capital Adequacy and Safety and Soundness—Regulatory Capital Requirements” below; |
· | modified deposit insurance coverage, as discussed in “—Capital Adequacy and Safety and Soundness—Deposit Insurance” below; |
· | barred banking organizations, such as ourselves, from engaging in proprietary trading and from sponsoring and investing in hedge funds and private equity funds, except as permitted under certain limited circumstances, as discussed in “—Bank Holding Company Regulation” below; |
· | established new corporate governance and proxy disclosure requirements, as discussed in “—Corporate Governance and Executive Compensation” below; |
· | established the Bureau of Consumer Financial Protection (the “CFPB”), as discussed in “—Consumer Protection Regulation” below; |
· | established new minimum mortgage underwriting standards for residential mortgages, as discussed in “—Mortgage Reform” below; |
· | permited the payment of interest on business demand deposit accounts; |
· | established and empowered the Financial Stability Oversight Council to designate certain activities as posing a risk to the U.S. financial system and recommend new or heightened standards and safeguards for financial institutions engaging in such activities; and |
· | established the Office of Financial Research, which has the power to require reports from financial services companies such as ourselves. |
Bank Holding Company Regulation
Unless a bank holding company becomes a financial holding company under the Gramm-Leach-Bliley Act (the “GLBA”) as discussed below, the BHCA prohibits (with the exceptions noted below in this paragraph) a bank holding company from acquiring a direct or indirect interest in or control of more than 5% of the voting shares of any company that is not a bank or a bank holding company. In addition, the BHCA prohibits engaging directly or indirectly in activities other than those of banking, managing or controlling banks or furnishing services to its subsidiary banks. However, a bank holding company may engage in and may own shares of companies engaged in certain activities that the FRB determines to be so closely related to banking or managing and controlling banks as to be a proper incident thereto. In making such determinations, the FRB is required to weigh the expected benefit to the public, including such factors as greater convenience, increased competition or gains in efficiency, against the possible adverse effects, such as undue concentration of resources, decreased or unfair competition, conflicts of interests or unsafe or unsound banking practices.
Under the GLBA, financial holding companies are permitted to offer their customers virtually any type of service that is financial in nature or incidental thereto, including banking, securities underwriting, insurance (both underwriting and agency), and merchant banking. Under the Dodd-Frank Act, however, a bank holding company and its affiliates are prohibited from engaging in proprietary trading and from sponsoring and investing in hedge funds and private equity funds, except as permitted under certain limited circumstances. In order to engage in financial activities under the GLBA, a bank holding company must qualify and register with the FRB as a “financial holding company” by demonstrating that each of its bank subsidiaries is “well capitalized”, “well managed,” and has at least a “satisfactory” rating under the Community Reinvestment Act of 1977 (“CRA”). Although we believe that we meet the qualifications to become a financial holding company under the GLBA, we have not elected “financial holding company” status, but rather to retain our pre-GLBA bank holding company regulatory status for the present time. This means that we can engage in those activities which are closely related to banking. We are required by the BHCA to file an annual report and additional reports required with the FRB. The FRB also inspects us periodically.
The BHCA requires every bank holding company to obtain the prior approval of the FRB before acquiring substantially all of the assets of any bank, or ownership or control of any voting shares of a bank, if, after such acquisition, the bank holding company would own or control, directly or indirectly, more than five percent of the voting shares of such bank. Additionally, as a bank holding company, we are prohibited from acquiring ownership or control of five percent or more of any class of voting securities of any company that is not a bank, or from engaging in activities other than banking or controlling banks except where the FRB has determined that such activities are so closely related to banking as to be a “proper incident thereto.”
Source of Strength
Under the Dodd-Frank Act, we are required to serve as a source of financial strength for Merchants Bank in the event of the financial distress of Merchants Bank. This provision codifies the longstanding policy of the FRB. In addition, any capital loans by a bank holding company to any of its bank subsidiaries are subordinate to the payment of deposits and to certain other indebtedness. In the event of a bank holding company’s bankruptcy, any commitment by the bank holding company to a federal bank regulatory agency to maintain the capital of a bank subsidiary will be assumed by the bankruptcy trustee and entitled to a priority of payment.
Certain Transactions by Bank Holding Companies with their Affiliates
There are various statutory restrictions on the extent to which bank holding companies and their non-bank subsidiaries may borrow, obtain credit from or otherwise engage in “covered transactions” with their insured depository institution subsidiaries. The Dodd-Frank Act amended the definition of affiliate to include an investment fund for which the depository institution or one of its affiliates is an investment adviser. An insured depository institution (and its subsidiaries) may not lend money to, or engage in covered transactions with, its non-depository institution affiliates if the aggregate amount of covered transactions outstanding involving the bank, plus the proposed transaction exceeds the following limits: (i) in the case of any one such affiliate, the aggregate amount of covered transactions of the insured depository institution and its subsidiaries cannot exceed 10% of the capital stock and surplus of the insured depository institution; and (ii) in the case of all affiliates, the aggregate amount of covered transactions of the insured depository institution and its subsidiaries cannot exceed 20% of the capital stock and surplus of the insured depository institution. For this purpose, “covered transactions” are defined by statute to include a loan or extension of credit to an affiliate, a purchase of or investment in securities issued by an affiliate, a purchase of assets from an affiliate unless exempted by the FRB, the acceptance of securities issued by an affiliate as collateral for a loan or extension of credit to any person or company, the issuance of a guarantee, acceptance or letter of credit on behalf of an affiliate, securities borrowing or lending transactions with an affiliate that creates a credit exposure to such affiliate, or a derivatives transaction with an affiliate that creates a credit exposure to such affiliate. Covered transactions are also subject to certain collateral security requirements. Covered transactions as well as other types of transactions between a bank and a bank holding company must be on market terms and not otherwise unduly favorable to the holding company or an affiliate of the holding company. Moreover, Section 106 of the BHCA provides that, to further competition, a bank holding company and its subsidiaries are prohibited from engaging in certain tying arrangements in connection with any extension of credit, lease or sale of property of any kind, or furnishing of any service.
Regulation of Merchants Bank
As an FDIC-insured state-chartered bank, Merchants Bank is subject to the supervision of and regulation by the Commissioner and the FDIC. This supervision and regulation is for the protection of depositors, the Deposit Insurance Fund (“DIF”) of the FDIC, and consumers, and is not for the protection of Merchants’ shareholders. The prior approval of the FDIC and the Commissioner is required, among other things, for Merchants Bank to establish or relocate an additional branch office, assume deposits, or engage in any merger, consolidation, purchase or sale of all or substantially all of the assets of any bank. Under the Dodd-Frank Act, the FRB may directly examine the subsidiaries of Merchants, including Merchants Bank.
Capital Adequacy and Safety and Soundness
Regulatory Capital Requirements. The FRB and the FDIC have issued substantially similar risk-based and leverage capital guidelines applicable to United States banking organizations. In addition, these regulatory agencies may from time to time require that a banking organization maintain capital above the minimum levels, whether because of its financial condition or actual or anticipated growth.
The FRB risk-based guidelines define a three-tier capital framework. Tier 1 capital for bank holding companies generally consists of
the sum of common stockholders’ equity, perpetual preferred stock and trust preferred securities (both subject to certain limitations and, in the case of the latter, to specific limitations on the kind and amount of such securities which may be included as Tier 1 capital and certain additional restrictions described below), and minority interests in the equity accounts of consolidated subsidiaries, less goodwill and other non-qualifying intangible assets. Pursuant to the Dodd-Frank Act, trust preferred securities issued after May 19, 2010, will not count as Tier 1 capital; however, our trust preferred securities have been grandfathered for Tier 1 eligibility. Under the proposed Basel III capital rules discussed below, Merchants’ currently outstanding trust preferred securities would be phased out from the calculation of Tier 1 capital over a ten-year period. Tier 2 capital generally consists of hybrid capital instruments, perpetual debt and mandatory convertible debt securities; perpetual preferred stock and trust preferred securities, to the extent it is not eligible to be included as Tier 1 capital; term subordinated debt and intermediate-term preferred stock; and, subject to limitations, general allowances for loan losses. The sum of Tier 1 and Tier 2 capital less certain required deductions, such as investments in unconsolidated banking or finance subsidiaries, represents qualifying total capital. Risk-based capital ratios are calculated by dividing Tier 1 and total capital, respectively, by risk-weighted assets. Assets and off-balance sheet credit equivalents are assigned to one of four categories of risk-weights, based primarily on relative credit risk. The minimum Tier 1 risk-based capital ratio is 4% and the minimum total risk-based capital ratio is 8%. The Dodd-Frank Act requires the FRB to establish minimum risk-based capital requirements that may not be lower than those in effect on July 21, 2010. As of December 31, 2012, our Tier 1 risk-based capital ratio was 14.75% and our total risk-based capital ratio was 16.00%. We are currently considered “well capitalized” under all regulatory definitions.
In addition to the risk-based capital requirements, the FRB requires top-rated bank holding companies to maintain a minimum leverage capital ratio of Tier 1 capital (defined by reference to the risk-based capital guidelines) to its average total consolidated assets of at least 3.0%. For most other bank holding companies (including us), the minimum leverage capital ratio is 4.0%. Bank holding companies with supervisory, financial, operational or managerial weaknesses, as well as bank holding companies that are anticipating or experiencing significant growth, are expected to maintain capital ratios well above the minimum levels. Our leverage capital ratio at December 31, 2012 was 8.08%.
Pursuant to the Dodd-Frank Act, as with the risk-based capital requirements discussed above, the leverage capital requirements generally applicable to insured depository institutions will serve as a floor for any leverage capital requirements the FRB may establish for bank holding companies, such as ourselves. The Dodd-Frank Act requires the FRB to establish leverage capital requirements for bank holding companies that may not be lower than those in effect in effect for insured depository institutions as of July 21, 2010.
The FDIC has promulgated regulations and adopted a statement of policy regarding the capital adequacy of state-chartered banks, which, like Merchants Bank, are not members of the Federal Reserve System. These requirements are substantially similar to those adopted by the FRB regarding bank holding companies, as described above. Moreover, the FDIC has promulgated corresponding regulations to implement the system of prompt corrective action established by Section 38 of the Federal Deposit Insurance Act (“FDIA”). Under the regulations, a bank is “well capitalized” if it has: (i) a total risk-based capital ratio of 10.0% or greater; (ii) a Tier 1 risk-based capital ratio of 6.0% or greater; (iii) a leverage capital ratio of 5.0% or greater; and (iv) is not subject to any written agreement, order, capital directive or prompt corrective action directive to meet and maintain a specific capital level for any capital measure. A bank is “adequately capitalized” if it has: (1) a total risk-based capital ratio of 8.0% or greater; (2) a Tier 1 risk-based capital ratio of 4.0% or greater; and (3) a leverage capital ratio of 4.0% or greater (3.0% under certain circumstances) and does not meet the definition of a “well capitalized bank.”
The FDIC also must take into consideration: (i) concentrations of credit risk; (ii) interest rate risk; and (iii) risks from non-traditional activities, as well as an institution’s ability to manage those risks, when determining the adequacy of an institution’s capital. This evaluation will be made as a part of the institution’s regular safety and soundness examination. We are currently considered well-capitalized under all regulatory definitions.
Generally, a bank, upon receiving notice that it is not adequately capitalized (i.e., that it is “undercapitalized”), becomes subject to the prompt corrective action provisions of Section 38 of FDIA that, for example, (i) restrict payment of capital distributions and management fees, (ii) require that the FDIC monitor the condition of the institution and its efforts to restore its capital, (iii) require submission of a capital restoration plan, (iv) restrict the growth of the institution’s assets and (v) require prior regulatory approval of certain expansion proposals. A bank that is required to submit a capital restoration plan must concurrently submit a performance guarantee by each company that controls the bank. A bank that is “critically undercapitalized” (i.e., has a ratio of tangible equity to total assets that is equal to or less than 2.0%) will be subject to further restrictions, and generally will be placed in conservatorship or receivership within 90 days.
We have not elected, and do not expect to elect, to calculate our risk-based capital requirements under either the “advanced” or “standard” approach of the Basel II capital accords. In 2010 and 2011, members of the Basel Committee on Banking Supervision agreed to new global capital adequacy standards, known as Basel III. These standards provide for setting forth higher capital requirements, enhanced risk coverage, a global leverage ratio, liquidity standards, and a provision for counter-cyclical capital. The federal banking agencies issued three joint proposed rules (the “Proposed Capital Rules”) that implement the Basel III capital standards and establish the minimum capital levels for banks and bank holding companies required under the Dodd-Frank Act. The Proposed Capital Rules would establish a minimum common equity Tier 1 capital ratio of 6.5% of risk-weighted assets for a “well
capitalized” institution and would increase the minimum total Tier 1 capital ratio for a “well capitalized” institution from 6 % to 8%. Additionally, the Proposed Capital Rules would require an institution to establish a capital conservation buffer of common equity Tier 1 capital in an amount equal to 2.5% of total risk weight assets above the 6.5% minimum risk-based capital requirement. The Proposed Capital Rules would revise certain other capital definitions and, generally, impose more stringent capital requirements. Further, the Proposed Capital Rules would increase the required capital for certain categories of assets, including higher-risk residential mortgages, higher-risk construction real estate loans and certain exposures related to securitizations. Under the Proposed Capital Rules, the amount of capital held against residential mortgages would be based upon the loan-to-value (“LTV”) ratio of the mortgage. Additionally, the Proposed Capital Rules would remove the filter for accumulated other comprehensive income in the current capital rules which currently prevents unrealized gains and losses from being included in the calculation of the institution’s capital. This change would result in the need for additional capital to be held against unrealized gains and losses on “available for sale” securities, hedges and any adjustments to the funded status of defined benefit plans, which could result in increased volatility in the amount of required capital. As noted above, the Proposed Capital Rules also eliminate the treatment of trust preferred securities as Tier 1 capital over a ten-year period.
The financial services industry, members of Congress and state regulatory agencies provided extensive comments on the Proposed Capital Rules to the federal banking agencies. In response to such commentary, the federal banking agencies extended the deadline for the Proposed Capital Rules to go into effect and indicated that a final rule would be issued in 2013. The final capital rule may differ significantly in substance or in scope from the Proposed Capital Rules. Accordingly, Merchants is not yet in a position to determine the effect of Basel III and the Proposed Capital Rules on its capital requirements.
Deposit Insurance. Substantially all of Merchants Bank’s deposits are insured up to applicable limits by the DIF and are subject to deposit insurance assessments to maintain the DIF. The FDIA, as amended by the Federal Deposit Insurance Reform Act and the Dodd-Frank Act, requires the FDIC to set a ratio of deposit insurance reserves to estimated insured deposits—the designated reserve ratio—of at least 1.35%. The FDIC utilizes a risk-based assessment system that imposes insurance premiums based upon a risk matrix that takes into account a bank’s capital level and supervisory rating (“CAMELS rating”). CAMELS ratings reflect the applicable bank regulatory agency’s evaluation of the financial institution’s capital, asset quality, management, earnings, liquidity and sensitivity to risk. Assessment rates may also vary for certain institutions based on long‑term debt issuer ratings, secured or brokered deposits. Pursuant to the Dodd-Frank Act, deposit premiums are based on assets rather than insurable deposits. To determine Merchants Bank’s actual deposit insurance premiums, we compute the base amount on Merchants Bank’s average consolidated assets less Merchants Bank’s average tangible equity (defined as the amount of Tier 1 capital) and Merchants Bank’s applicable assessment rate. Assessment rates range from 2.5 to 9 basis points on the broader assessment base for banks in the lowest risk category up to 30 to 45 basis points for banks in the highest risk category.
Pursuant to an FDIC rule issued in November 2009, we prepaid our quarterly risk-based assessments to the FDIC for the fourth quarter of 2009 and for all of 2010, 2011 and 2012 on December 31, 2009. We recorded the entire amount of our prepayment as a prepaid asset that bears a zero percent risk weight for risk-based capital purposes. Each quarter, we record an expense for our regular quarterly assessment for the quarter and a corresponding credit to the prepaid assessment until the asset is exhausted. The FDIC will not refund or collect additional prepaid assessments because of a decrease or growth in deposits over the next three years. However, should the prepaid assessment not be exhausted after collection of the amount due on June 30, 2013, the remaining amount of the prepayment will be returned to us. The timing of any refund of the prepaid assessment will not be affected by the change in the deposit insurance assessment calculation discussed above.
Pursuant to the Dodd-Frank Act, FDIC deposit insurance has been permanently increased from $100,000 to $250,000 per depositor. Additionally, the Dodd-Frank Act provided temporary unlimited deposit insurance coverage for noninterest-bearing transactions accounts beginning December 31, 2010, and ending December 31, 2012.
Our FDIC insurance expense totaled $866 thousand in 2012.
Under the FDIA, the FDIC may terminate deposit insurance upon a finding that the institution has engaged in unsafe and unsound practices, is in an unsafe or unsound condition to continue operations, or has violated any applicable law, regulation, rule, order or condition imposed by the FDIC.
Safety and Soundness Standards. The FDIA requires the federal bank regulatory agencies to prescribe standards, by regulations or guidelines, relating to internal controls, information systems and internal audit systems, loan documentation, credit underwriting, interest rate risk exposure, asset growth, asset quality, earnings, stock valuation and compensation, fees and benefits, and such other operational and managerial standards as the agencies deem appropriate. Guidelines adopted by the federal bank regulatory agencies establish general standards relating to internal controls and information systems, internal audit systems, loan documentation, credit underwriting, interest rate exposure, asset growth and compensation, fees and benefits. In general, the guidelines require, among other things, appropriate systems and practices to identify and manage the risk and exposures specified in the guidelines. The guidelines prohibit excessive compensation as an unsafe and unsound practice and describe compensation as excessive when the amounts paid are unreasonable or disproportionate to the services performed by an executive officer, employee, director or principal stockholder. In addition, the agencies adopted regulations that authorize, but do not require, an agency to order an institution that has been given notice by an agency that it is not satisfying any of such safety and soundness standards to submit a compliance plan. If, after being so
notified, an institution fails to submit an acceptable compliance plan or fails in any material respect to implement an acceptable compliance plan, the agency must issue an order directing action to correct the deficiency and may issue an order directing other actions of the types to which an undercapitalized institution is subject under the “prompt corrective action” provisions of FDIA. See “—Regulatory Capital Requirements” above. If an institution fails to comply with such an order, the agency may seek to enforce such order in judicial proceedings and to impose civil money penalties.
Depositor Preference. The FDIA provides that, in the event of the “liquidation or other resolution” of an insured depository institution, the claims of depositors of the institution, including the claims of the FDIC as subrogee of insured depositors, and certain claims for administrative expenses of the FDIC as a receiver, will have priority over other general unsecured claims against the institution. If an insured depository institution fails, insured and uninsured depositors, along with the FDIC, will have priority in payment ahead of unsecured, non-deposit creditors, including depositors whose deposits are payable only outside of the United States and the parent bank holding company, with respect to any extensions of credit they have made to such insured depository institution.
Real Estate Lending Standards
The Federal Deposit Insurance Corporation Improvement Act (the “FDICIA”) requires the federal bank regulatory agencies to adopt uniform real estate lending standards. The FDIC has adopted regulations, which establish supervisory limitations on LTV ratios in real estate loans by FDIC-insured banks. The regulations require banks to establish LTV ratio limitations within or below the prescribed uniform range of supervisory limits.
Activities and Investments of Insured State Banks
The FDICIA provides that FDIC-insured state banks, such as Merchants Bank, may not engage as a principal, directly or through a subsidiary, in any activity that is not permissible for a national bank, unless the FDIC determines that the activity does not pose a significant risk to the insurance fund, and the bank is in compliance with its applicable capital standards. In addition, an insured state bank may not acquire or retain, directly or through a subsidiary, any equity investment of a type, or in an amount, that is not permissible for a national bank, unless such investments meet certain grandfather requirements.
The GLBA includes a section of the FDIA governing subsidiaries of state banks that engage in “activities as principal that would only be permissible” for a national bank to conduct in a financial subsidiary. This provision permits state banks, to the extent permitted under state law, to engage in certain new activities, which are permissible for subsidiaries of a financial holding company. Further, it expressly preserves the ability of a state bank to retain all existing subsidiaries. Because the applicable Vermont statute explicitly permits banks chartered by the state to engage in all activities permissible for national banks, we are permitted to form subsidiaries to engage in the activities authorized by the GLBA. In order to form a financial subsidiary, a state bank must be well-capitalized, and the state bank would be subject to certain capital deduction, risk management and affiliate transaction rules, which are applicable to national banks.
Consumer Protection Regulation
We are subject to a number of federal and state laws designed to protect consumers and prohibit unfair or deceptive business practices. These laws include the Equal Credit Opportunity Act, the Fair Housing Act, Home Ownership Protection Act, the Fair Credit Reporting Act, as amended by the Fair and Accurate Credit Transactions Act of 2003 (the “FACT Act”), the GLBA, the Truth in Lending Act, CRA, the Home Mortgage Disclosure Act, the Real Estate Settlement Procedures Act, the National Flood Insurance Act and various state law counterparts. These laws and regulations mandate certain disclosure requirements and regulate the manner in which financial institutions must interact with customers when taking deposits, making loans, collecting loans and providing other services. Further, the Dodd-Frank Act established the CFPB, which has the responsibility for making rules and regulations under the federal consumer protection laws relating to financial products and services. The CFPB also has a broad mandate to prohibit unfair or deceptive acts and practices and is specifically empowered to require certain disclosures to consumers and draft model disclosure forms. Failure to comply with consumer protection laws and regulations can subject financial institutions to enforcement actions, fines and other penalties. The FDIC examines Merchants Bank for compliance with CFPB rules and enforces CFPB rules with respect to Merchants Bank.
Mortgage Reform
The Dodd-Frank Act prescribes certain standards that mortgage lenders must consider before making a residential mortgage loan, including verifying a borrower’s ability to repay such mortgage loan. The CFPB issued a final rule that requires creditors, such as Merchants Bank, to make a reasonable good faith determination of a consumer’s ability to repay any consumer credit transaction secured by a dwelling. The rule provides creditors with minimum requirements for making such ability-to-repay determinations. Creditors are required to consider the following eight underwriting factors: (1) current or reasonably expected income or assets; (2) current employment status; (3) the monthly payment on the covered transaction; (4) the monthly payment on any simultaneous loan; (4) the monthly payment for mortgage-related obligations; (6) current debt obligations, alimony and child support; (7) the monthly debt-to-income ratio or residual income; and (8) credit history. While the Dodd-Frank Act provides that qualified mortgages are entitled to a presumption that the creditor satisfied the ability-to-repay requirements, the final rule provides a safe harbor for loans that satisfy the definition of a qualified mortgage and are not “higher priced.” Higher-priced loans are subject to a rebuttable presumption. A “qualified mortgage” is a loan that does not contain certain risky features, such as negative amortization, interest-only payments,
balloon payments, a term exceeding 30 years, has a debt-to-income ratio of not more than 43%, and for which the creditor considers and verifies the consumer’s current debt obligations, alimony, and child support. The rule becomes effective on January 10, 2014.
The Dodd-Frank Act also allows borrowers to assert violations of certain provisions of the Truth-in-Lending Act as a defense to foreclosure proceedings. Under the Dodd-Frank Act, prepayment penalties are prohibited for certain mortgage transactions and creditors are prohibited from financing insurance policies in connection with a residential mortgage loan or home equity line of credit. The Dodd-Frank Act requires mortgage lenders to make additional disclosures prior to the extension of credit, in each billing statement and for negative amortization loans and hybrid adjustable rate mortgages. Additionally, the CFPB has issued rules governing mortgage servicing, appraisals, escrow requirements for higher-priced mortgages and loan originator qualification and compensation.
Privacy and Customer Information Security
The GLBA requires financial institutions to implement policies and procedures regarding the disclosure of nonpublic personal information about consumers to nonaffiliated third parties. In general, we must provide our customers with an annual disclosure that explains our policies and procedures regarding the disclosure of such nonpublic personal information, and, except as otherwise required or permitted by law, we are prohibited from disclosing such information except as provided in such policies and procedures. The GLBA also requires that we develop, implement and maintain a comprehensive written information security program designed to ensure the security and confidentiality of customer information (as defined under the GLBA), to protect against anticipated threats or hazards to the security or integrity of such information; and to protect against unauthorized access to or use of such information that could result in substantial harm or inconvenience to any customer. We are also required to send a notice to customers whose “sensitive information” has been compromised if unauthorized use of this information is “reasonably possible.” Most of the states, including the states where we operate, have enacted legislation concerning breaches of data security and our duties in response to a data breach. Congress continues to consider federal legislation that would require consumer notice of data security breaches. Pursuant to the FACT Act, we must also develop and implement a written identity theft prevention program to detect, prevent, and mitigate identity theft in connection with the opening of certain accounts or certain existing accounts. Additionally, the FACT Act amends the Fair Credit Reporting Act to generally prohibit a person from using information received from an affiliate to make a solicitation for marketing purposes to a consumer, unless the consumer is given notice and a reasonable opportunity and a reasonable and simple method to opt out of the making of such solicitations.
Regulatory Enforcement Authority
The enforcement powers available to the federal banking agencies include, among other things, the ability to assess civil money penalties, to issue cease and desist or removal orders and to initiate injunctive actions against banking organizations and institution-affiliated parties, as defined. In general, these enforcement actions may be initiated for violations of law and regulations and unsafe or unsound practices. Other actions or inactions may provide the basis for enforcement action, including misleading or untimely reports filed with regulatory authorities. Under certain circumstances, federal and state law requires public disclosure and reports of certain criminal offenses and also final enforcement actions by the federal banking agencies.
Community Reinvestment Act
Pursuant to the CRA and similar provisions of Vermont law, regulatory authorities review our performance in meeting the credit needs of the communities we serve. The applicable regulatory authorities consider compliance with this law in connection with the applications for, among other things, approval for de novo branches, branch relocations and acquisitions of banks and bank holding companies. We received a “satisfactory” rating at our CRA examination dated November 14, 2011.
Failure of an institution to receive at least a “satisfactory” rating could inhibit such institution or its holding company from undertaking certain activities, including engaging in activities newly permitted as a financial holding company under GLBA, and acquisitions of other financial institutions. The FRB must take into account the record of performance of banks in meeting the credit needs of the entire community served, including low- and moderate-income neighborhoods. Current CRA regulations for large banks primarily rely on objective criteria of the performance of institutions under three key assessment tests: a lending test, a service test and an investment test. For smaller banks, current CRA regulations primarily evaluate the performance of institutions under two key assessment tests: a lending test and a community development test. We are committed to meeting the existing or anticipated credit needs of our entire community, including low- and moderate-income neighborhoods, consistent with safe and sound banking operations.
Branching and Acquisitions
The Riegle‑Neal Interstate Banking and Branching Efficiency Act of 1994, as amended (“Riegle‑Neal”) and the Dodd-Frank Act permit well capitalized and well managed bank holding companies, as determined by the FRB, to acquire banks in any state subject to certain concentration limits and other conditions. Riegle‑Neal also generally authorizes the interstate merger of banks. In addition, among other things, Riegle‑Neal and the Dodd-Frank Act permit banks to establish new branches on an interstate basis to the same extent a bank chartered by the host state may establish branches. Bank holding companies and banks are required to obtain prior FRB approval to acquire more than 5% of a class of voting securities, or substantially all of the assets, of a bank holding company, bank or savings association.
Anti-Money Laundering and the Bank Secrecy Act
Under the Bank Secrecy Act (“BSA”), a financial institution, is required to have systems in place to detect certain transactions, based on the size and nature of the transaction. Financial institutions are generally required to report to the United States Treasury any cash transactions involving more than $10,000. In addition, financial institutions are required to file suspicious activity reports for transactions that involve more than $5,000 and which the financial institution knows, suspects or has reason to suspect involves illegal funds, is designed to evade the requirements of the BSA or has no lawful purpose. The Uniting and Strengthening America by Providing Appropriate Tools Required to Intercept and Obstruct Terrorism Act of 2001 (the “USA PATRIOT Act”), which amended the BSA, is designed to deny terrorists and others the ability to obtain anonymous access to the U.S. financial system. The USA PATRIOT Act has significant implications for financial institutions and businesses of other types involved in the transfer of money. The USA PATRIOT Act, together with the implementing regulations of various federal regulatory agencies, has caused financial institutions, such as Merchants Bank, to adopt and implement additional policies or amend existing policies and procedures with respect to, among other things, anti-money laundering compliance, suspicious activity, currency transaction reporting, customer identity verification and customer risk analysis. In evaluating an application under Section 3 of the BHCA to acquire a bank or an application under the Bank Merger Act to merge banks or affect a purchase of assets and assumption of deposits and other liabilities, the applicable federal banking regulator must consider the anti-money laundering compliance record of both the applicant and the target.
The United States has imposed economic sanctions that affect transactions with designated foreign countries, nationals and others. These sanctions, which are administered by the Treasury Office of Foreign Assets Control (“OFAC”), take many different forms. Generally, however, they contain one or more of the following elements: (i) restrictions on trade with or investment in a sanctioned country, including prohibitions against direct or indirect imports from and exports to a sanctioned country and prohibitions on “U.S. persons” engaging in financial transactions relating to making investments in, or providing investment-related advice or assistance to, a sanctioned country; and (ii) a blocking of assets in which the government or specially designated nationals of the sanctioned country have an interest, by prohibiting transfers of property subject to U.S. jurisdiction (including property in the possession or control of U.S. persons). Blocked assets (for example, property and bank deposits) cannot be paid out, withdrawn, set off or transferred in any manner without a license from OFAC.
Sarbanes-Oxley Act of 2002 (“Sarbanes‑Oxley”)
Sarbanes-Oxley implemented a broad range of corporate governance and accounting measures for public companies (including publicly-held bank holding companies such as ourselves) designed to promote honesty and transparency in corporate America. Sarbanes-Oxley’s principal provisions, many of which have been interpreted through regulations released in 2003, provide for and include, among other things, (i) requirements for audit committees, including independence and financial expertise; (ii) certification of financial statements by the principal executive officer and principal financial officer of the reporting company; (iii) standards for auditors and regulation of audits; (iv) disclosure and reporting requirements for the reporting company and directors and executive officers; and (v) a range of civil and criminal penalties for fraud and other violations of securities laws.
Corporate Governance and Executive Compensation
Under the Dodd-Frank Act, the Securities and Exchange Commission (the “SEC”) has adopted rules granting shareholders a non-binding vote on executive compensation and “golden parachute” payments. Pursuant to modifications of the proxy rules under the Dodd-Frank Act, we will be required to disclose the relationship between executive pay and financial performance, the ratio of the median pay of all employees to the pay of the chief executive officer, and employee and director hedging activities. As required by the Dodd-Frank Act, the stock exchanges have amended their listing rules to require that each member of a listed company’s compensation committee be independent and be granted the authority and funding to retain independent advisors and to prohibit the listing of any security of an issuer that does not adopt policies governing the claw back of excess executive compensation based on inaccurate financial statements. The federal regulatory agencies have proposed new regulations prohibiting incentive-based compensation arrangements that encourage executives and certain other employees to take inappropriate risks.
Federal Home Loan Bank System
Merchants Bank is a member of the Federal Home Loan Bank of Boston (the “FHLBB”), which is one of the regional Federal Home Loan Banks comprising the Federal Home Loan Bank System. Each Federal Home Loan Bank provides a central credit facility primarily for member institutions. Member institutions are required to acquire and hold shares of capital stock in the FHLBB in an amount at least equal to the sum of 0.35% of the aggregate principal amount of its unpaid residential mortgage loans and similar obligations at the beginning of each year. We were in compliance with this requirement at December 31, 2012. We receive dividends on our FHLBB stock. The FHLBB has recently declared dividends equal to an annual yield of approximately the daily average three-month LIBOR yield for the quarter for which the dividend has been declared. Dividend income on FHLBB stock of $45 thousand was recorded during 2012.
Any advances from the FHLBB must be secured by specified types of collateral, and long-term advances may be used for the purpose of providing funds for residential housing finance, commercial lending and to purchase investments. Long term advances may also be used to help alleviate interest rate risk for asset and liability management purposes. As of December 31, 2012, we had no FHLBB advances.
AVAILABLE INFORMATION
We file annual, quarterly, and current reports, proxy statements, and other documents with the SEC. The public may read and copy any materials that we have filed with the SEC at the SEC's Public Reference Room at 100 F Street, NE, Washington, DC 20549. The public may obtain information on the operation of the Public Reference Room by calling the SEC at 1-800-SEC-0330. Also, the SEC maintains an Internet website that contains reports, proxy and information statements, and other information regarding issuers, including us, that file electronically with the SEC. The public can obtain any documents that we have filed with the SEC at the SEC website at www.sec.gov.
We also make available free of charge on or through our Internet website at www.mbvt.com our Annual Report on Form 10-K, Quarterly Reports on Form 10-Q, Current Reports on Form 8-K, and, if applicable, amendments to those reports filed or furnished pursuant to Section 13(a) or 15(d) of the Exchange Act, as soon as reasonably practicable after Merchants electronically files such materials with or furnishes them to the SEC. We also make all filed insider transactions available through our website free of charge. In addition, our Audit Committee, Compensation Committee, and Nominating and Governance Committee Charters as well as our Code of Ethics Policy for Senior Financial Officers, are available free of charge on our website.
ITEM 1A – RISK FACTORS
Sustained low interest rates and interest rate volatility may reduce our profitability.
Our consolidated earnings and financial condition are primarily dependent upon net interest income, which is the difference between interest earned from loans and investments and interest paid on deposits and borrowings. The narrowing of that difference could adversely affect our earnings and financial condition. We cannot predict with certainty or control changes in interest rates. Regional and local economic conditions and the policies of regulatory authorities, including monetary policies of the FRB, affect interest income and interest expense. While we have ongoing policies and procedures designed to manage the risks associated with changes in market interest rates, changes in interest rates may have an adverse effect on our profitability. Increases in interest rates could affect the amount of loans that we originate, because higher rates could cause customers to apply for fewer loans. Higher interest rates could also cause depositors to shift funds from accounts that have a comparatively lower cost, to accounts with a higher cost. If the cost of interest-bearing deposits increases at a rate greater than the yields on interest-earning assets, net interest income will be negatively affected. Changes in the asset and liability mix may also affect net interest income. Similarly, lower interest rates cause higher yielding assets to prepay and floating or adjustable rate assets to reset to lower rates, and at the same time reduce the profitability of our free or very low cost deposit accounts. If we are not able to reduce our funding costs sufficiently, due to either competitive factors or the maturity schedule of existing liabilities, then our net interest margin will decline.
Our loan portfolio is concentrated in Vermont and we may be adversely affected by regional economic conditions and real estate values.
Because our loan portfolio is in Vermont, we may be adversely affected by regional economic conditions. Further, because a substantial portion of our loan portfolio is secured by real estate in Vermont, the value of the associated collateral is also subject to regional real estate market conditions. If these areas experience adverse economic, political or business conditions, we would likely experience higher rates of loss and delinquency on these loans than if the loans were more geographically diverse.
Our financial condition and results of operations have been adversely affected, and may continue to be adversely affected, by the U.S. and international financial market and economic conditions.
We have been, and continue to be, impacted by general business and economic conditions in the United States and, to a lesser extent, abroad. These conditions include short-term and long-term interest rates, inflation, money supply, political issues, legislative and regulatory changes, fluctuations in both debt and equity capital markets, broad trends in industry and finance, unemployment and the strength of the U.S. economy and the local economies in which we operate, all of which are beyond our control. Deterioration in any of these conditions could result in increases in loan delinquencies, and non-performing assets, decreases in loan collateral values, decreases in the value of our investment portfolio and a decrease in demand for our products and services. While there are early indications that the U.S. economy is improving, there remains significant uncertainty regarding the sustainability of the economic recovery.
If our allowance for loan losses is not sufficient to cover actual loan losses, our earnings could decrease.
Our loan customers may not repay their loans according to the terms of the loans, and the collateral securing the payment of these loans may be insufficient to pay any remaining loan balance. We therefore may experience significant loan losses, which could have a material adverse effect on our operating results.
Material additions to our allowance for loan losses also would materially decrease our net income, and the charge-off of loans may cause us to increase the allowance. We make various assumptions and judgments about the collectability of our loan portfolio, including the creditworthiness of our borrowers and the value of the real estate and other assets serving as collateral for the repayment of many of our loans. We rely on our loan quality reviews, our experience and our evaluation of economic conditions, among other factors, in determining the amount of the allowance for loan losses. If our assumptions prove to be incorrect, our allowance for loan losses may not be sufficient to cover losses inherent in our loan portfolio, resulting in additions to our allowance.
In addition, bank regulators periodically review our allowance for loan losses and may require us to increase our provision for loan losses or recognize further loan charge-offs, which may have a material adverse effect on our financial condition and results of operations. We believe that the current amount of allowance for loan losses is sufficient to absorb inherent losses in our loan portfolio.
Our commercial, commercial real estate and construction loan portfolio may expose us to increased credit risks.
At December 31, 2012, approximately 46% of our loan portfolio was comprised of commercial, commercial real estate, and construction loans with two relationships exceeding $16 million, exposing us to the risks inherent in financings based upon analyses of credit risk, the value of underlying collateral, including real estate, and other more intangible factors, which are considered in making commercial loans. In general, commercial and commercial real estate loans historically pose greater credit risks, than owner occupied residential mortgage loans. The repayment of commercial real estate loans depends on the business and financial condition of borrowers, and a number of our borrowers have more than one commercial real estate loan outstanding with us. Economic events and changes in government regulations, which we and our borrowers cannot control or reliably predict, could have an adverse impact on the cash flows generated by properties securing our commercial real estate loans and on the values of the properties securing those loans. Repayment of commercial loans depend substantially on the borrowers’ underlying business, financial condition and cash flows. Commercial loans are generally collateralized by equipment, inventory, accounts receivable and other fixed assets. Compared to real estate, that type of collateral is more difficult to monitor, its value is harder to ascertain, it may depreciate more rapidly and it may not be as readily saleable if repossessed.
We operate in a highly regulated environment and may be adversely affected by changes in laws and regulations.
We are subject to regulation and supervision by the FRB, and Merchants Bank is subject to regulation and supervision by the FDIC and the Commissioner. Federal and state laws and regulations govern numerous matters, including changes in the ownership or control of banks and bank holding companies, maintenance of adequate capital and the financial condition of a financial institution, permissible types, amounts and terms of extensions of credit and investments, permissible nonbanking activities, the level of reserves against deposits and restrictions on dividend payments. The FDIC and the Commissioner possess the power to issue cease and desist orders to prevent or remedy unsafe or unsound practices or violations of law by banks subject to their regulation, and the FRB possesses similar powers with respect to bank holding companies. These and other restrictions limit the manner in which we may conduct business and obtain financing.
We are also affected by the monetary policies of the FRB. Changes in monetary or legislative policies may affect the interest rates we must offer to attract deposits and the interest rates we must charge on our loans, as well as the manner in which we offer deposits and make loans. These monetary policies have had, and are expected to continue to have, significant effects on the operating results of depository institutions generally, including Merchants Bank.
The laws, rules, regulations, and supervisory guidance and policies applicable to us are subject to regular modification and change. It is impossible to predict the competitive impact that any such changes would have on the banking and financial services industry in general or on our business in particular. Such changes may, among other things, increase the cost of doing business, limit permissible activities, or affect the competitive balance between banks and other financial institutions. The Dodd-Frank Act instituted major changes to the banking and financial institutions regulatory regimes in light of the recent performance of and government intervention in the financial services sector. Other changes to statutes, regulations, or regulatory policies, including changes in interpretation or implementation of statutes, regulations, or policies, could affect us in substantial and unpredictable ways. Such changes could subject us to additional costs, limit the types of financial services and products we may offer, and/or increase the ability of non-banks to offer competing financial services and products, among other things. Failure to comply with laws, regulations, or policies could result in sanctions by regulatory agencies, civil money penalties, and/or reputation damage, which could have a material adverse effect on our business, financial condition, and results of operations. See Item 1, “Business—Regulation and Supervision.”
Additional requirements imposed by the Dodd-Frank Act could adversely affect us.
The Dodd-Frank Act comprehensively reformed the regulation of financial institutions, products and services. Because many aspects of the Dodd-Frank Act are subject to rulemaking and will take effect over several years, it is difficult to forecast the impact that such rulemaking will have on us, our customers or the financial industry. Certain provisions of the Dodd-Frank Act that affect deposit insurance assessments, the payment of interest on demand deposits and interchange fees could increase the costs associated with Merchants Bank’s deposit-generating activities, as well as place limitations on the revenues that those deposits may generate. In addition, the Dodd-Frank Act established the CFPB as an independent bureau of the FRB. The CFPB has the authority to prescribe rules for all depository institutions governing the provision of consumer financial products and services, which may result in rules and regulations that reduce the profitability of such products and services or impose greater costs on us and our subsidiaries. The Dodd-Frank Act also established new minimum mortgage underwriting standards for residential mortgages and the regulatory agencies have focused on the examination and supervision of mortgage lending and servicing activities.
Current and future legal and regulatory requirements, restrictions, and regulations, including those imposed under the Dodd-Frank Act, may adversely impact our profitability and may have a material and adverse effect on our business, financial condition, and results of operations, may require us to invest significant management attention and resources to evaluate and make any changes required by the legislation and related regulations and may make it more difficult for us to attract and retain qualified executive officers and employees.
We may become subject to more stringent capital requirements.
The Dodd-Frank Act requires the federal banking agencies to establish minimum leverage and risk-based capital requirements that will apply to both insured banks and their holding companies. In addition, the federal banking agencies issued three joint proposed rules, or the “proposed capital rules,” that would implement the Basel III capital standards and would establish the minimum capital levels required under the Dodd-Frank Act. The proposed capital rules would establish a minimum common equity Tier 1 capital ratio of 6.5% of risk-weighted assets for a “well capitalized” institution, and increase the minimum total Tier 1 capital ratio for a well capitalized institution from 6 % to 8%. Additionally, the proposed capital rules would require an institution to establish a capital conservation buffer of common equity Tier 1 capital in an amount equal to 2.5% of total risk weight assets above the 6.5% minimum risk-based capital requirement. The proposed capital rules would also phase out trust preferred securities from Tier 1 capital and increase the required capital for certain categories of assets, including higher-risk residential mortgages, higher-risk construction real estate loans and certain exposures related to securitizations, and would remove the filter for accumulated other comprehensive income in the current capital rules which currently prevents unrealized gains and losses from being included in the calculation of the institution’s capital.
The federal banking agencies extended the deadline for the proposed capital rules to go into effect and indicated that final rules would be issued in 2013. The final capital rules may differ significantly in substance or in scope from the proposed capital rules. However, the final capital rules are expected to increase our capital requirements and related compliance costs. Implementation of these standards, or any other new regulations, may adversely affect our ability to pay dividends, or require us to reduce business levels or raise capital, including in ways that may adversely affect our results of operations or financial condition.
Competition in the local banking industry may impair our ability to attract and retain customers at current levels.
Competition in the markets in which we operate may limit our ability to attract and retain customers. In particular, our competitors include major financial companies whose greater resources may afford them a marketplace advantage by enabling them to maintain numerous banking locations and mount extensive promotional and advertising campaigns. Additionally, banks and other financial institutions with larger capitalization, as well as financial intermediaries not subject to bank regulatory restrictions, have larger lending limits and are able to serve the credit and investment needs of larger customers. If we are unable to attract and retain customers, we may be unable to continue our loan growth and our results of operations and financial condition may otherwise be negatively impacted.
Prepayments of loans may negatively impact our business.
Generally, our customers may prepay the principal amount of their outstanding loans at any time. The speed at which such prepayments occur, as well as the size of such prepayments, are within our customers’ discretion. If customers prepay the principal amount of their loans, and we are unable to lend those funds to other borrowers or invest the funds at the same or higher interest rates, our interest income will be reduced. A significant reduction in interest income could have a negative impact on our results of operations and financial condition.
We may incur significant losses as a result of ineffective risk management processes and strategies.
We seek to monitor and control our risk exposure through a risk and control framework encompassing a variety of separate but complementary financial, credit, operational, compliance and legal reporting systems, internal controls, management review processes and other mechanisms. While we employ a broad and diversified set of risk monitoring and risk mitigation techniques, those techniques and the judgments that accompany their application may not be effective and may not anticipate every economic and financial outcome in all market environments or the specifics and timing of such outcomes. Market conditions over the last several years have involved unprecedented dislocations and highlight the limitations inherent in using historical data to manage risk.
We may be unable to attract and retain key personnel.
Our success depends, in large part, on our ability to attract and retain key personnel. Competition for qualified personnel in the financial services industry and in the Vermont marketplace can be intense and we may not be able to hire or retain the key personnel that we depend upon for success. The unexpected loss of services of one or more of our key personnel could have a material adverse impact on our business because of their skills, knowledge of the markets in which we operate, years of industry experience and the difficulty of promptly finding qualified replacement personnel.
Our ability to attract and retain customers and employees could be adversely affected to the extent our reputation is harmed.
Our ability to attract and retain customers and employees could be adversely affected to the extent our reputation is damaged. Our actual or perceived failure to address various issues could give rise to reputational risk that could cause harm to us and our business prospects, including failure to properly address operational risks. These issues also include, but are not limited to, legal and regulatory requirements; privacy; properly maintaining customer and associate personal information; record keeping; money-laundering; sales and trading practices; ethical issues; appropriately addressing potential conflicts of interest; and the proper identification of the legal, reputational, credit, liquidity and market risks inherent in our products. Failure to appropriately address any of these issues could also give rise to additional regulatory restrictions, reputational harm and legal risks, which could among other consequences increase the size and number of litigation claims and damages asserted or subject us to enforcement actions, fines and penalties and cause us to incur related costs and expenses.
We may suffer losses as a result of operational risk or technical system failures.
The potential for operational risk exposure exists throughout our organization. Integral to our performance is the continued efficacy of our internal processes, systems, relationships with third parties and the associates and executives in our day-to-day and ongoing operations. Operational risk also encompasses the failure to implement strategic objectives in a successful, timely and cost-effective manner. Failure to properly manage operational risk subjects us to risks of loss that may vary in size, scale and scope, including loss of customers, operational or technical failures, unlawful tampering with our technical systems, ineffectiveness or exposure due to interruption in third party support, as well as the loss of key individuals or failure on the part of key individuals to perform properly. Although we seek to mitigate operational risk through a system of internal controls, losses from operational risk could take the form of explicit charges, increased operational costs, harm to our reputation or foregone opportunities.
We must adapt to information technology changes in the financial services industry, which could present operational issues, require significant capital spending, or impact our reputation.
The financial services industry is constantly undergoing technological changes, with frequent introductions of new technology-driven products and services. The effective use of technology increases efficiency and enables financial institutions to better serve customers and may reduce costs. Our future success will depend, in part, upon our ability to address the needs of our customers by using technology to provide products and services that will satisfy customer demands for convenience, as well as to create additional efficiencies in our operations. We may not be able to effectively implement new technology-driven products and services or be successful in marketing these products and services to our customers.
The market price and trading volume of our common stock may be volatile.
The market price of our common stock may be volatile. In addition, the trading volume in our common stock may fluctuate and cause significant price variations to occur. We cannot assure you that the market price of our common stock will not fluctuate or decline significantly in the future. Some of the factors that could negatively affect our share price or result in fluctuations in the price or trading volume of our common stock include:
· | quarterly variations in our operating results or the quality of our assets; |
· | operating results that vary from the expectations of Management, securities analysts and investors; |
· | changes in expectations as to our future financial performance; |
· | announcements of innovations, new products, strategic developments, significant contracts, acquisitions and other material events by us or our competitors; |
· | the operating and securities price performance of other companies that investors believe are comparable to us; |
· | our past and future dividend practices; |
· | future sales of our equity or equity-related securities; and |
· | changes in global financial markets and global economies and general market conditions, such as interest or foreign exchange rates, stock, commodity or real estate valuations or volatility. |
We are a holding company and depend on Merchants Bank for dividends, distributions and other payments.
We are a separate and distinct legal entity from our banking subsidiary and depend on dividends, distributions and other payments from Merchants Bank to fund dividend payments to our shareholders and to fund all payments on our other obligations. Merchants Bank is subject to laws that authorize regulatory bodies to block or reduce the payment of cash dividends or other distributions to us. Regulatory action of that kind could impede access to funds we need to make payments on our obligations or dividend payments. Additionally, if Merchants Bank’s earnings are not sufficient to make dividend payments to us while maintaining adequate capital levels, we may not be able to make dividend payments to our shareholders.
Our shareholders may not receive dividends on our common stock.
Holders of our common stock are entitled to receive dividends only when, as and if declared by our board of directors. Although we have historically declared cash dividends on our common stock, we are not required to do so and our board of directors may reduce or eliminate our common stock dividend in the future. Further, the FRB has issued guidelines for evaluating proposals by large bank holding companies to increase dividends or repurchase or redeem shares, which includes a requirement for such firms to develop a capital distribution plan. In the future, the FRB may expand these requirements to cover all bank holding companies, which could restrict our ability to pay dividends. A reduction or elimination of dividends could adversely affect the market price of our common stock.
Changes in accounting standards can be difficult to predict and can materially impact how we record and report our financial condition and results of operations.
Our accounting policies and methods are fundamental to how we record and report our financial condition and results of operations. From time to time, the Financial Accounting Standards Board (“FASB”) changes the financial accounting and reporting standards that
govern the preparation of our financial statements. These changes can be hard to anticipate and implement and can materially impact how we record and report our financial condition and results of operations.
Our financial statements are based in part on assumptions and estimates, which, if wrong, could cause unexpected losses in the future.
Pursuant to GAAP, we are required to use certain assumptions and estimates in preparing our financial statements, including in determining credit loss reserves, reserves related to litigation and the fair value of certain assets and liabilities, among other items. If assumptions or estimates underlying our financial statements are incorrect, we may experience material losses. For additional information, see Item 7, “Management’s Discussion and Analysis of Financial Condition and Results of Operations – Critical Accounting Policies.”
There are potential risks associated with future acquisitions and expansions.
We evaluate acquisition and other expansion opportunities and strategies. To the extent we acquire other companies in the future, our business may be negatively impacted by certain risks inherent with such acquisitions. These risks include the following:
· | the risk that the acquired business will not perform in accordance with Management’s expectations; |
· | the risk that difficulties will arise in connection with the integration of the operations of the acquired business with the operations of our business; |
· | the risk that Management will divert its attention from other aspects of our business; |
· | the risk that we may lose key employees of the combined business; and |
· | the risks associated with entering into geographic and product markets in which we have limited or no direct prior experience. |
ITEM 1B – UNRESOLVED STAFF COMMENTS
None
ITEM 2 – PROPERTIES
As of December 31, 2012, we operated 33 full-service banking offices and 41 ATMs throughout the state of Vermont. We closed our branch location in Bellows Falls, Vermont, in 2012. Our headquarters are located at 275 Kennedy Drive, South Burlington, Vermont, which also houses our operations and administrative offices and our Trust division.
We lease certain premises from third parties, including our headquarters, under current market terms and conditions. All offices are in good physical condition with modern equipment and facilities considered adequate to meet the banking needs of customers in the communities served. Additional information relating to our properties is set forth in Note 5 to the consolidated financial statements included in Item 8 of this Annual Report on Form 10-K.
ITEM 3 – LEGAL PROCEEDINGS
We are involved in various legal proceedings arising from our normal business activities. In the opinion of Management, based upon input from counsel on the outcome of such proceedings, final disposition of these proceedings will not have a material adverse effect on our consolidated financial position.
ITEM 4 – MINE SAFETY DISCLOSURES
Not applicable.
PART II
ITEM 5 - MARKET FOR REGISTRANT'S COMMON EQUITY, RELATED STOCKHOLDER MATTERS AND ISSUER PURCHASES OF EQUITY SECURITIES
Common Stock and Dividends
The common stock of Merchants is traded on the NASDAQ Global Select Market under the trading symbol “MBVT”. Merchants currently pays dividends on a quarterly basis. Quarterly stock prices and dividends per share paid for each quarterly period during the last two years were as follows:
| | | |
| | | |
| | | Dividends |
Quarter Ended | High | Low | Paid |
December 31, 2012 | $ 30.02 | $ 25.80 | $ 0.28 |
September 30, 2012 | 30.48 | 25.94 | 0.28 |
June 30, 2012 | 28.68 | 25.07 | 0.28 |
March 31, 2012 | 29.89 | 25.89 | 0.28 |
December 31, 2011 | 30.13 | 25.27 | 0.28 |
September 30, 2011 | 27.78 | 23.79 | 0.28 |
June 30, 2011 | 27.79 | 23.53 | 0.28 |
March 31, 2011 | 28.87 | 23.77 | 0.28 |
High and low stock prices are based upon quotations as reported by the NASDAQ Global Select Market. Prices of transactions between private parties may vary from the ranges quoted above.
As of February 27, 2013, Merchants had 787 shareholders of record. Merchants declared and distributed dividends totaling $1.12 per share during 2012. In January 2013, Merchants declared a dividend of $0.28 per share, which was paid on February 14, 2013, to shareholders of record as of January 31, 2013. Future dividends will depend upon the financial condition and earnings of Merchants and its subsidiaries, its need for funds and other factors, including applicable government regulations.
Merchants Bancshares, Inc. is a legal entity separate and distinct from Merchants Bank. The revenue of Merchants (on a parent company-only basis) is derived primarily from interest and dividends paid to it by Merchants Bank. The right of Merchants, and consequently the right of shareholders of Merchants, to participate in any distribution of the assets or earnings of any subsidiary through the payment of such dividends or otherwise is necessarily subject to the prior claims of creditors of the subsidiary (including depositors, in the case of its banking subsidiary), except to the extent that certain claims of Merchants in a creditor capacity may be recognized.
It is the policy of the FRB that bank holding companies should pay dividends only out of current earnings and only if, after paying such dividends, the bank holding company would remain adequately capitalized. The FRB has the authority to prohibit a bank holding company, such as Merchants, from paying dividends if it deems such payment to be an unsafe or unsound practice.
The FDIC has the authority to use its enforcement powers to prohibit a bank from paying dividends if, in its opinion, the payment of dividends would constitute an unsafe or unsound practice. Federal law also prohibits the payment of dividends by a bank that will result in the bank failing to meet its applicable capital requirements on a pro forma basis.
Vermont law requires the approval of state bank regulatory authorities if the dividends declared by state banks exceed prescribed limits. The payment of any dividends by Merchants Bank will be determined based on a number of factors, including recent earnings history, the Bank’s liquidity, asset quality profile and capital adequacy.
Performance Graph
The line-graph presentation below compares cumulative five-year shareholder returns with the NASDAQ Bank Index and the Russell 2000 Index. The comparison assumes the investment, on December 31, 2007, of $100 in Merchants’ common stock and each of the foregoing indices and reinvestment of all dividends.
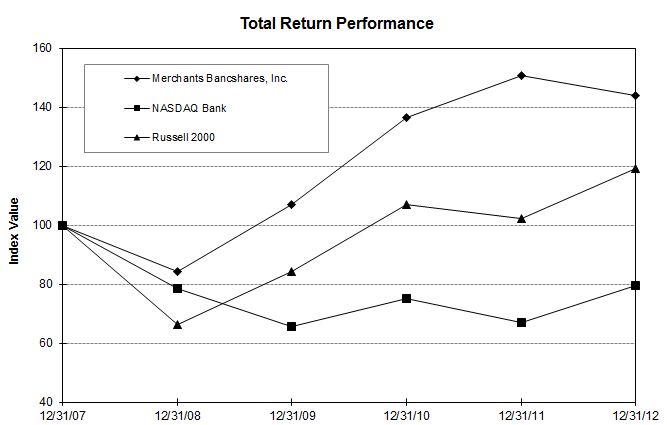
| | | | | | |
| Period Ending |
Index | 12/31/07 | 12/31/08 | 12/31/09 | 12/31/10 | 12/31/11 | 12/31/12 |
Merchants Bancshares, Inc. | 100.00 | 84.12 | 106.87 | 136.44 | 150.68 | 143.83 |
NASDAQ Bank | 100.00 | 78.46 | 65.67 | 74.97 | 67.10 | 79.64 |
Russell 2000 | 100.00 | 66.21 | 84.20 | 106.82 | 102.36 | 119.09 |
The performance graph and related information furnished under Item 5 of this Annual Report on Form 10-K shall not be deemed to be “soliciting material” or to be “filed” with the SEC, or subject to Regulation 14A or 14C, other than as provided in Item 201 of Regulation S-K, or to the liabilities of Section 18 of the Exchange Act. Such information shall not be incorporated by reference into any future filing under the Securities Act or Exchange Act except to the extent that Merchants specifically incorporates it by reference into such filing.
Securities Authorized for Issuance under Equity Compensation Plans
We maintain two equity compensation plans: the 2008 Deferred Compensation Plan for Non-Employee Directors and Trustees and the Amended and Restated Merchants Bancshares, Inc. 2008 Stock Incentive Plan. Each of these plans has been approved by our shareholders. The following table includes information as of December 31, 2012 about these plans. See Note 12 to the consolidated financial statements included in Item 8 for a description of these plans.
| | | | | |
Plan Category | Number of Securities to be Issued Upon Exercise of Outstanding Options, Warrants and Rights | | Weighted-Average Price of Outstanding Options, Warrants and Rights | | Number of Securities Remaining Available for Future Issuance Under Equity Compensation Plans (Excluding Securities Reflected in First Column) |
Equity Compensation Plans Approved by Security Holders | 95,385 | (a) | $ 22.87 | (b) | 575,188 |
Equity Compensation Plans Not Approved by Security Holders | 0 | | 0 | | 0 |
Total | 95,385 | | $ 22.87 | | 575,188 |
(a) This number relates to the Amended and Restated Merchants Bancshares, Inc. 2008 Stock Incentive Plan.
(b) This price reflects the weighted-average exercise price of outstanding stock options under the Amended and Restated Merchants Bancshares, Inc. 2008 Stock Incentive Plan.
Issuer Repurchase of Equity Securities
We extended, through January 2014, our stock buyback program, originally adopted in January 2007. Under the program we may repurchase 200,000 shares of our common stock on the open market from time to time, and have purchased 143,475 shares at an average price per share of $22.94 since the program's adoption in 2007. We did not repurchase any of our shares during 2012, 2011 or 2010 and do not expect to repurchase shares in the near future.
ITEM 6 - SELECTED FINANCIAL DATA
The supplementary financial data presented in the following tables contain information highlighting certain significant trends in our financial condition and results of operations over an extended period of time.
The following information should be analyzed in conjunction with Item 7, “Management’s Discussion and Analysis of Financial Condition and Results of Operations” and with the audited consolidated financial statements and related notes included in Item 8 of this Annual Report on Form 10-K.
| | | | | |
| | | | | |
| | | | | |
|
Merchants Bancshares, Inc. |
Five Year Summary of Financial Data |
|
| At or For the Year Ended December 31, |
(In thousands except share and per share data) | 2012 | 2011 | 2010 | 2009 | 2008 |
Results For The Year | | | | | |
Interest and dividend income | $ 56,857 | $ 58,018 | $ 60,262 | $ 66,340 | $ 68,582 |
Interest expense | 6,883 | 8,644 | 11,107 | 16,224 | 24,929 |
Net interest income | 49,974 | 49,374 | 49,155 | 50,116 | 43,653 |
Provision (credit) for loan losses | 950 | 750 | (1,750) | 4,100 | 1,525 |
Net interest income after provision (credit) for loan losses | 49,024 | 48,624 | 50,905 | 46,016 | 42,128 |
Noninterest income | 11,481 | 10,380 | 11,631 | 10,315 | 8,658 |
Noninterest expense | 41,334 | 41,260 | 42,427 | 40,098 | 35,101 |
Income before income taxes | 19,171 | 17,744 | 20,109 | 16,233 | 15,685 |
Provision for income taxes | 3,977 | 3,124 | 4,648 | 3,754 | 3,768 |
Net income | $ 15,194 | $ 14,620 | $ 15,461 | $ 12,479 | $ 11,917 |
| | | | | |
Share Data | | | | | |
Basic earnings per common share | $ 2.43 | $ 2.35 | $ 2.51 | $ 2.04 | $ 1.96 |
Diluted earnings per common share | $ 2.42 | $ 2.35 | $ 2.51 | $ 2.04 | $ 1.96 |
Cash dividends declared per common share | $ 1.12 | $ 1.12 | $ 1.12 | $ 1.12 | $ 1.12 |
Weighted average common shares outstanding (1) | 6,258,832 | 6,212,187 | 6,167,446 | 6,105,909 | 6,069,653 |
Period end common shares outstanding (2) | 6,271,102 | 6,232,783 | 6,186,363 | 6,141,823 | 6,061,182 |
Year-end book value per share | $ 19.84 | $ 18.54 | $ 16.95 | $ 15.65 | $ 13.89 |
Year-end book value per share (2) | $ 18.82 | $ 17.57 | $ 16.06 | $ 14.82 | $ 13.15 |
| | | | | |
Key Performance Ratios | | | | | |
Return on average shareholders' equity | 13.37% | 14.11% | 16.18% | 14.73% | 15.91% |
Return on average assets | 0.92% | 0.97% | 1.07% | 0.91% | 0.93% |
Average equity to average assets | 6.89% | 6.87% | 6.64% | 6.16% | 5.87% |
Tier 1 leverage ratio | 8.08% | 8.08% | 7.90% | 7.67% | 7.42% |
Tangible equity ratio | 6.92% | 6.80% | 6.68% | 6.34% | 5.94% |
Dividend payout ratio | 46.28% | 47.66% | 44.62% | 54.90% | 57.14% |
Allowance for loan losses to total loans at year-end | 1.07% | 1.03% | 1.11% | 1.19% | 1.05% |
Nonperforming loans as a percentage of total loans | 0.27% | 0.24% | 0.45% | 1.58% | 1.37% |
Net interest margin | 3.28% | 3.51% | 3.65% | 3.80% | 3.58% |
| | | | | |
Average Balances | | | | | |
Total assets | $ 1,648,393 | $ 1,507,656 | $ 1,438,730 | $ 1,376,054 | $ 1,276,855 |
Earning assets | 1,587,190 | 1,461,359 | 1,379,475 | 1,326,326 | 1,220,393 |
Gross loans | 1,057,446 | 971,003 | 912,363 | 901,582 | 781,645 |
Investments (3) | 509,384 | 436,170 | 437,058 | 388,215 | 428,198 |
Total deposits | 1,222,423 | 1,120,234 | 1,053,503 | 1,003,778 | 923,863 |
Shareholders' equity | 113,621 | 103,639 | 95,580 | 84,706 | 74,916 |
| | | | | |
At Year-End | | | | | |
Total assets | $ 1,708,550 | $ 1,611,869 | $ 1,487,644 | $ 1,434,861 | $ 1,340,823 |
Gross loans | 1,082,923 | 1,027,626 | 910,794 | 918,538 | 847,127 |
Allowance for loan losses | 11,562 | 10,619 | 10,135 | 10,976 | 8,894 |
Investments (3) | 517,233 | 520,939 | 475,386 | 417,441 | 440,132 |
Total deposits | 1,271,080 | 1,177,880 | 1,092,196 | 1,043,319 | 930,797 |
Shareholders' equity | 118,221 | 109,537 | 99,331 | 90,625 | 79,310 |
| | | | | |
(1) Weighted average common shares outstanding includes an average of 316,920; 318,110; 318,549; 317,288; and 315,130 shares held in Rabbi Trusts for deferred compensation plans for directors for 2012, 2011, 2010, 2009 and 2008, respectively. |
|
(2) Period end common shares outstanding and year-end book value include 324,515; 325,703; 327,100; 326,453; and 323,754 shares held in Rabbi Trusts for deferred compensation plans for directors for 2012, 2011, 2010, 2009 and 2008, respectively. |
|
(3) Includes Federal Home Loan Bank stock of $8.15 million for 2012 and $8.63 million for 2011, 2010, 2009 and 2008. |
Merchants Bancshares, Inc.
Summary of Quarterly Financial Information
(Unaudited)
| | | | | | | | | | | | |
(In thousands except per share data) | | 2012 | | 2011 |
| | Q4 | Q3 | Q2 | Q1 | Year | | Q4 | Q3 | Q2 | Q1 | Year |
Interest and dividend income | | $ 13,963 | $ 14,229 | $ 14,246 | $ 14,419 | $ 56,857 | | $ 14,390 | $ 14,865 | $ 14,712 | $ 14,051 | $ 58,018 |
Interest expense | | 1,428 | 1,565 | 1,907 | 1,983 | 6,883 | | 2,005 | 2,121 | 2,219 | 2,299 | 8,644 |
Net interest income | | 12,535 | 12,664 | 12,339 | 12,436 | 49,974 | | 12,385 | 12,744 | 12,493 | 11,752 | 49,374 |
Provision (credit) for loan losses | | 250 | 250 | 200 | 250 | 950 | | 250 | 250 | 250 | 0 | 750 |
Noninterest income | | 2,758 | 3,199 | 3,163 | 2,361 | 11,481 | | 2,315 | 3,412 | 2,560 | 2,093 | 10,380 |
Noninterest expense | | 10,137 | 10,449 | 10,645 | 10,103 | 41,334 | | 9,898 | 11,045 | 10,206 | 10,111 | 41,260 |
Income before income taxes | | 4,906 | 5,164 | 4,657 | 4,444 | 19,171 | | 4,552 | 4,861 | 4,597 | 3,734 | 17,744 |
Provision for income taxes | | 1,066 | 1,159 | 921 | 831 | 3,977 | | 843 | 680 | 968 | 633 | 3,124 |
Net income | | $ 3,840 | $ 4,005 | $ 3,736 | $ 3,613 | $ 15,194 | | $ 3,709 | $ 4,181 | $ 3,629 | $ 3,101 | $ 14,620 |
Basic earnings per share | | $ 0.61 | $ 0.64 | $ 0.60 | $ 0.58 | $ 2.43 | | $ 0.60 | $ 0.67 | $ 0.58 | $ 0.50 | $ 2.35 |
Diluted earnings per share | | 0.61 | 0.64 | 0.60 | 0.58 | 2.42 | | 0.59 | 0.67 | 0.58 | 0.50 | 2.34 |
Cash dividends declared and paid per share | | $ 0.28 | $ 0.28 | $ 0.28 | $ 0.28 | $ 1.12 | | $ 0.28 | $ 0.28 | $ 0.28 | $ 0.28 | $ 1.12 |
ITEM 7 - MANAGEMENT'S DISCUSSION AND ANALYSIS OF FINANCIAL CONDITION AND RESULTS OF OPERATIONS
CRITICAL ACCOUNTING POLICIES
Management’s discussion and analysis of our financial condition and results of operations is based on the consolidated financial statements, which are prepared in accordance with accounting principles generally accepted in the United States. The preparation of such consolidated financial statements requires Management to make estimates and assumptions that affect the reported amounts of assets, liabilities, revenues and expenses, and related disclosure of contingent assets and liabilities. Management evaluates its estimates on an ongoing basis. Management bases its estimates on historical experience and various other assumptions that are believed to be reasonable under the circumstances, the results of which form the basis in making judgments about financial statement amounts. Actual results could differ from the amount derived from Management’s estimates and assumptions under different conditions.
Our significant accounting policies are described in more detail in Note 1 to the consolidated financial statements included in Item 8 of this Annual Report on Form 10-K. Management believes the following accounting policies are the most critical to the preparation of the consolidated financial statements.
Allowance for Credit Losses: The allowance for credit losses (“Allowance”) includes the allowance for loan losses and the reserve for undisbursed lines of credit. The Allowance, which is established through the provision for credit losses, is based on Management’s evaluation of the level of allowance required in relation to the estimated losses in the loan portfolio and undisbursed lines of credit. Management believes the Allowance is a significant estimate and therefore evaluates its adequacy each quarter. When determining the appropriate amount of the Allowance, Management considers factors such as previous loss experience, the size and composition of the loan portfolio, current economic and real estate market conditions, the performance of individual loans in relation to contract terms, and the estimated fair value of collateral that secures the loans. The use of different estimates or assumptions could produce a different Allowance.
Income Taxes: We estimate our income taxes for each period for which a statement of income is presented. This involves estimating our actual current tax exposure, as well as assessing temporary differences resulting from differing timing of recognition of expenses, income and tax credits, for tax and accounting purposes. These differences result in deferred tax assets and liabilities, which are included in our consolidated balance sheets. We must also assess the likelihood that any deferred tax assets will be recovered from future taxable income and, to the extent that recovery is not likely, a valuation allowance must be established. Significant management judgment is required in determining income tax expense, and deferred tax assets and liabilities. As of December 31, 2012, we
determined that no valuation allowance for deferred tax assets was necessary.
Valuation of Investment Securities: Management evaluates securities for other-than-temporary impairment on at least a quarterly basis, and more frequently when economic or market concerns warrant such evaluation. When an other-than-temporary impairment has occurred, the amount of the other-than-temporary impairment recognized in earnings depends on whether we intend to sell the security or more likely than not will be required to sell the security before recovery of its amortized cost basis less any current-period credit loss. To determine whether an impairment is other‑than‑temporary, we consider all available information relevant to the collectability of the security, including past events, current conditions, and reasonable and supportable forecasts when developing estimates of cash flows expected to be collected. Evidence considered in this assessment includes the reasons for the impairment, the severity and duration of the impairment, changes in value subsequent to year‑end, forecasted performance of the investee, and the general market conditions in the geographic area or industry the investee operates in.
If we intend to sell the security or it is more likely than not that we will be required to sell the security before recovery of its amortized cost basis less any current-period credit loss, the impairment is recognized in earnings equal to the entire difference between the investment’s amortized cost basis and its fair value at the balance sheet date. If we do not intend to sell the security and it is not more likely than not that we will be required to sell the security before recovery of its amortized cost basis less any current-period credit loss, the other-than-temporary impairment is separated into the amount representing the credit loss and the amount related to all other factors. The amount of the total other-than-temporary impairment related to the credit loss is recognized in earnings. The amount of the total impairment related to other factors is recognized in other comprehensive income, net of applicable income taxes.
GENERAL
The following discussion and analysis of financial condition and results of operations of Merchants and its subsidiaries for the three years ended December 31, 2012 should be read in conjunction with the consolidated financial statements and Notes thereto and selected statistical information appearing elsewhere in this Annual Report on Form 10-K. The financial condition and results of operations of Merchants essentially reflect the operations of its principal subsidiary, Merchants Bank. Certain statements contained in this section are forward-looking statements subject to certain risks and uncertainties described in this Annual Report on Form 10-K under the headings “Forward-Looking Statements” and “Risk Factors.”
Non-GAAP Financial Measures
Certain measurements contained in this section which are presented on a fully taxable equivalent basis constitute non-GAAP financial measures as described in this Annual Report on Form 10-K under the heading “Use of Non-GAAP Financial Measures.”
RESULTS OF OPERATIONS
Overview
We realized net income of $15.19 million, $14.62 million and $15.46 million for the years ended December 31, 2012, 2011 and 2010, respectively. Basic earnings per share were $2.43, $2.35 and $2.51 and diluted earnings per share were $2.42, $2.35 and $2.51 for the years ended December 31, 2012, 2011 and 2010, respectively. We declared and distributed total dividends of $1.12 per share each year during 2012, 2011 and 2010. On January 17, 2013, we declared a dividend of $0.28 per share, which was paid on February 14, 2013, to shareholders of record as of January 31, 2013. Total assets reached a new record high of $1.71 billion at December 31, 2012, an increase of $96.68 million, or 6.0% over year end 2011. Total shareholders’ equity was $118.22 million at December 31, 2012, an increase of 7.9% over the balance at December 31, 2011.
Our return on average equity was 13.37%, 14.11% and 16.18% for 2012, 2011 and 2010, respectively, and our return on average assets was 0.92%, 0.97% and 1.07% for 2012, 2011 and 2010, respectively. Book value per share increased to $19.84 during 2012. Our capital ratios remain strong, with a Tier 1 leverage ratio of 8.08%, a total risk-based capital ratio of 16.00% and a tangible capital ratio of 6.92%.
Ø | Net interest income - Our taxable equivalent net interest income was $51.99 million for 2012 compared to $51.30 million for 2011. Our taxable equivalent net interest margin decreased by 23 basis points for 2012 to 3.28% from 3.51% for 2011. |
Ø | Provision for Credit Losses - The 2012 provision for credit losses was $950 thousand, compared to $750 thousand for 2011. Asset quality remained strong throughout 2012, and we had a small net recovery for the year. |
Ø | Loans - We also achieved a new record high in our loan portfolio for the second year in a row. Ending loan balances at December 31, 2012 were $1.08 billion, an increase of $55.30 million, or 5.4%, from ending loan balances at December 31, 2011. |
Ø | Investments - Our investment portfolio totaled $509.09 million at December 31, 2012, a decrease of $3.22 million from the December 31, 2011 ending balance of $512.31 million. |
Ø | Deposits - Total deposits also reached a record high during 2012 and ended the year at $1.27 billion, an increase of $93.20 million, or 7.9%, from balances of $1.18 billion at December 31, 2011. |
Ø | Long-term debt prepayment - We prepaid a total of $20.00 million in long-term debt at a rate of 2.75% during 2012, and paid a prepayment penalty of $1.36 million in conjunction with the transaction. |
Net Interest Income
2012 compared with 2011
As shown on the accompanying schedule on page 24, our taxable equivalent net interest income was $51.99 million for the year ended December 31, 2012, compared to $51.30 million for same period in 2011. Our taxable equivalent net interest margin decreased 23 basis points to 3.28% during 2012. Our continued growth in earning assets has helped to offset margin compression and allowed us to increase net interest income during 2012. Average earning assets for 2012 were $1.59 billion, an increase of $125.83 million over 2011.
The extended low-interest rate environment continues to present a challenge as our assets reprice down at a steady rate and new assets come on at lower rates. Overall asset yields were 3.71% for 2012, compared to 4.10% for 2011. The average rate on our loan portfolio was 4.44% for 2012, a 42 basis point decrease from 2011. The average rate on our investment portfolio for 2012 was 2.32%, a 58 basis point decrease from 2011.
Decreased loan yields resulted from the combined effect of the extended low interest rate environment and competitive pressure for strong credits. Decreased yields in our investment portfolio are a result of the extended low interest rate environment and tight spreads for agency issued or guaranteed investments.
We continued our efforts to offset decreased yields on our assets by increasing balances in our inexpensive checking and money market account balances and reducing our overall funding costs. Of the $102.19 million in total growth in average deposits during 2012, $51.02 million was in our demand deposit accounts and $66.10 million was in savings, interest bearing checking and money market accounts. These increases were offset by a $14.94 million decrease in time deposits. Average time deposits as a percentage of total average deposits declined to 28.1% for 2012 compared to 31.9% for 2011. The average cost of interest bearing liabilities for 2012 was 52 basis points, an 18 basis point decrease from 2011. We prepaid a total of $20 million in long-term FHLBB advances at a rate of 2.75% during 2012, incurring total prepayment penalties of $1.36 million. These prepayments will reduce our overall cost of funds going forward.
2011 compared with 2010
Our taxable equivalent net interest income increased $956 thousand to $51.30 million for the year ended December 31, 2011, compared to $50.35 million for the year ended December 31, 2010. Our taxable equivalent net interest margin decreased by 14 basis points for 2011 to 3.51% from 3.65% for 2010. Our growth in net interest income in spite of margin compression was a result of a larger earning asset base. Our average earning assets increased $81.88 million, or 5.9%, during 2011; $58.64 million of that growth was in our loan portfolio, our highest yielding asset class. In spite of our success in growing the loan portfolio, the average rate on our earning assets decreased by 35 basis points to 4.10% during the year, while the average cost of our interest bearing liabilities decreased 23 basis points to 0.70% for 2011 compared to 0.93% for 2010. We experienced reduced yields on both our loan and investment portfolios. The average rate earned on loans decreased 32 basis points during 2011 to 4.86%, while the average rate earned on our investment portfolio decreased 34 basis points to 2.90% during the same period.
During 2011, we continued our efforts to offset decreased yields on the asset side by increasing balances in our relatively inexpensive checking and money market account balances and reducing our liability costs. Of the $66.73 million in total growth in average deposits during 2011, $33.14 million was in our demand deposit accounts and $50.51 million was in savings, interest bearing checking and money market accounts. These increases were offset by a $16.92 million decrease in time deposits. Average time deposits as a percentage of total average deposits declined to 31.9% for 2011 compared to 35.6% for 2010. The average cost of interest bearing liabilities decreased 23 basis points during 2011 to 0.70%. The cost of interest bearing deposits decreased 14 basis points to 0.47% during 2011 and the cost of total borrowed funds decreased 46 basis points to 1.52% during the same time period.
We reduced our dependence on wholesale funding during 2011 and prepaid a total of $16.00 million in long-term debt with maturities in 2013 and 2015 at an average rate of 2.92%, and we paid a prepayment penalty of $861 thousand in conjunction with the transaction.
The following table presents an analysis of net interest income and illustrates interest income earned and interest expense charged for each major component of interest earning assets and interest bearing liabilities. Yields/rates are computed on a fully taxable-equivalent (“FTE”) basis, using a 35% rate. Nonaccrual loans are included in the average loan balance outstanding.
| | | | | | | | | | | | | | | |
| | | | | | | | | | | | | | | |
Distribution of Assets, Liabilities and Shareholders' Equity; Interest Rates and Net Interest Margin |
| | | | | | | | | | | | | | | |
| 2012 | 2011 | 2010 |
| | | Interest | Average | | | Interest | Average | | | Interest | Average |
Taxable equivalent | Average | Income/ | Yield/ | Average | Income/ | Yield/ | Average | Income/ | Yield/ |
(In thousands) | Balance | Expense | Rate | Balance | Expense | Rate | Balance | Expense | Rate |
ASSETS: | | | | | | | | | | | | | | | |
Loans, including fees on loans | $ | 1,057,446 | $ | 46,992 | 4.44% | $ | 971,003 | $ | 47,201 | 4.86% | $ | 912,363 | $ | 47,234 | 5.18% |
Investments | | 509,384 | | 11,834 | 2.32% | | 436,170 | | 12,644 | 2.90% | | 437,058 | | 14,140 | 3.24% |
Federal funds sold, securities sold under agreements to repurchase and interest bearing deposits with banks | | 20,360 | | 46 | 0.23% | | 54,186 | | 103 | 0.19% | | 30,054 | | 81 | 0.27% |
Total earning assets | | 1,587,190 | $ | 58,872 | 3.71% | | 1,461,359 | $ | 59,948 | 4.10% | | 1,379,475 | $ | 61,455 | 4.45% |
Allowance for loan losses | | (11,182) | | | | | (10,432) | | | | | (10,609) | | | |
Cash and cash equivalents | | 25,217 | | | | | 10,686 | | | | | 24,460 | | | |
Premises and equipment | | 14,874 | | | | | 14,263 | | | | | 13,583 | | | |
Other assets | | 32,294 | | | | | 31,780 | | | | | 31,821 | | | |
Total assets | $ | 1,648,393 | | | | $ | 1,507,656 | | | | $ | 1,438,730 | | | |
| | | | | | | | | | | | | | | |
LIABILITIES AND SHAREHOLDERS' EQUITY: | | | | | | | | | | | | | | | |
Interest bearing deposits: | | | | | | | | | | | | | | | |
Savings, interest bearing checking and money market accounts | $ | 665,399 | $ | 776 | 0.12% | $ | 599,296 | $ | 1,167 | 0.19% | $ | 548,788 | $ | 1,461 | 0.27% |
Time deposits | | 342,911 | | 2,775 | 0.81% | | 357,848 | | 3,307 | 0.92% | | 374,768 | | 4,153 | 1.11% |
Total interest bearing deposits | | 1,008,310 | | 3,551 | 0.35% | | 957,144 | | 4,474 | 0.47% | | 923,556 | | 5,614 | 0.61% |
Federal funds purchased and Federal Home Loan Bank short-term borrowings | | 38,290 | | 108 | 0.28% | | 2,153 | | 1 | 0.05% | | 2,730 | | 4 | 0.15% |
Securities sold under agreements to repurchase, short-term | | 230,281 | | 1,682 | 0.73% | | 217,823 | | 2,064 | 0.95% | | 172,165 | | 1,619 | 0.94% |
Securities sold under agreements to repurchase, long-term | | 0 | | 0 | 0.00% | | 4,726 | | 141 | 2.98% | | 50,056 | | 1,818 | 3.63% |
Other long-term debt | | 13,667 | | 363 | 2.66% | | 28,117 | | 773 | 2.75% | | 31,179 | | 863 | 2.77% |
Junior subordinated debentures issued to unconsolidated subsidiary trust | | 20,619 | | 1,179 | 5.80% | | 20,619 | | 1,191 | 5.87% | | 20,619 | | 1,189 | 5.86% |
Total borrowed funds | | 302,857 | | 3,332 | 1.10% | | 273,438 | | 4,170 | 1.52% | | 276,749 | | 5,493 | 1.98% |
Total interest bearing liabilities | | 1,311,167 | $ | 6,883 | 0.52% | | 1,230,582 | $ | 8,644 | 0.70% | | 1,200,305 | $ | 11,107 | 0.93% |
Demand deposits | | 214,113 | | | | | 163,090 | | | | | 129,947 | | | |
Other liabilities | | 9,492 | | | | | 10,345 | | | | | 12,898 | | | |
Shareholders' equity | | 113,621 | | | | | 103,639 | | | | | 95,580 | | | |
Total liabilities & shareholders' equity | $ | 1,648,393 | | | | $ | 1,507,656 | | | | $ | 1,438,730 | | | |
| | | | | | | | | | | | | | | |
Net interest income, FTE | | | $ | 51,989 | | | | $ | 51,304 | | | | $ | 50,348 | |
Tax equivalent adjustment | | | | (2,015) | | | | | (1,930) | | | | | (1,193) | |
Net interest income, GAAP | | | $ | 49,974 | | | | $ | 49,374 | | | | $ | 49,155 | |
| | | | | | | | | | | | | | | |
Yield spread | | | | | 3.19% | | | | | 3.40% | | | | | 3.53% |
| | | | | | | | | | | | | | | |
Net interest margin | | | | | 3.28% | | | | | 3.51% | | | | | 3.65% |
The following table presents the extent to which changes in interest rates and changes in the volume of earning assets and interest bearing liabilities have affected interest income and interest expense during the periods indicated. Information is presented in each category with respect to: (i) changes attributable to changes in volume (changes in volume multiplied by prior rate), (ii) changes attributable to changes in rate (changes in rate multiplied by prior volume) and (iii) changes in volume/rate (change in volume multiplied by change in rate).
| | | | | | |
| | | | | | |
Analysis of Changes in Fully Taxable Equivalent Net Interest Income |
| | | | | | |
2012 vs 2011 |
| | | | Due to |
| | | Increase | | | Volume/ |
(In thousands) | 2012 | 2011 | (Decrease) | Volume | Rate | Rate |
Fully taxable equivalent interest income: | | | | | | |
Loans, including fees on loans | $ 46,992 | $ 47,201 | $ (209) | $ 4,202 | $ (4,051) | $ (360) |
Investments | 11,834 | 12,644 | (810) | 2,122 | (2,511) | (421) |
Federal funds sold, securities sold under agreements to repurchase and interest bearing deposits with banks | 46 | 103 | (57) | (64) | 20 | (13) |
Total interest income | 58,872 | 59,948 | (1,076) | 6,260 | (6,542) | (794) |
Less interest expense: | | | | | | |
Savings, interest bearing checking and money market accounts | 776 | 1,167 | (391) | 129 | (468) | (52) |
Time deposits | 2,775 | 3,307 | (532) | (138) | (411) | 17 |
Federal funds purchased and Federal home Loan Bank short-term borrowings | 108 | 1 | 107 | 17 | 5 | 85 |
Securities sold under agreements to repurchase, short-term | 1,682 | 2,064 | (382) | 118 | (472) | (28) |
Securities sold under agreements to repurchase, long-term | 0 | 141 | (141) | (141) | (141) | 141 |
Other long-term debt | 363 | 773 | (410) | (397) | (27) | 14 |
Junior subordinated debentures issued to unconsolidated subsidiary trust | 1,179 | 1,191 | (12) | 0 | (12) | 0 |
Total interest expense | 6,883 | 8,644 | (1,761) | (412) | (1,526) | 177 |
Net interest income | $ 51,989 | $ 51,304 | $ 685 | $ 6,672 | $ (5,016) | $ (971) |
| | | | | | |
2011 vs 2010 |
| | | | Due to |
| | | Increase | | | Volume/ |
(In thousands) | 2011 | 2010 | (Decrease) | Volume | Rate | Rate |
Fully taxable equivalent interest income: | | | | | | |
Loans, including fees on loans | $ 47,201 | $ 47,234 | $ (33) | $ 3,036 | $ (2,884) | $ (185) |
Investments | 12,644 | 14,140 | (1,496) | (29) | (1,470) | 3 |
Federal funds sold, securities sold under agreements to repurchase and interest bearing deposits with banks | 103 | 81 | 22 | 65 | (24) | (19) |
Total interest income | 59,948 | 61,455 | (1,507) | 3,072 | (4,378) | (201) |
Less interest expense: | | | | | | |
Savings, interest bearing checking and money market accounts | 1,167 | 1,461 | (294) | 134 | (393) | (35) |
Time deposits | 3,307 | 4,153 | (846) | (188) | (690) | 32 |
Federal funds purchased and Federal home Loan Bank short-term borrowings | 1 | 4 | (3) | (1) | (3) | 1 |
Securities sold under agreements to repurchase, short-term | 2,064 | 1,619 | 445 | 429 | 12 | 4 |
Securities sold under agreements to repurchase, long-term | 141 | 1,818 | (1,677) | (1,646) | (328) | 297 |
Other long-term debt | 773 | 863 | (90) | (85) | (5) | 0 |
Junior subordinated debentures issued to unconsolidated subsidiary trust | 1,191 | 1,189 | 2 | 0 | 2 | 0 |
Total interest expense | 8,644 | 11,107 | (2,463) | (1,357) | (1,405) | 299 |
Net interest income | $ 51,304 | $ 50,348 | $ 956 | $ 4,429 | $ (2,973) | $ (500) |
Provision for Credit Losses
The allowance for loan losses at December 31, 2012 was $11.56 million, or 1.07% of total loans and 397% of non-performing loans compared to the December 31, 2011 balance of $10.62 million, or 1.03% of total loans and 423% of non-performing loans. We recorded a provision of $950 thousand during 2012 compared to $750 thousand during 2011. Our asset quality remained strong during 2012; our continued strong loan growth during the year was the primary reason for the increase in the provision during 2012. Nonperforming loans totaled $2.91 million, or 0.27% of total loans, at December 31, 2012 compared to $2.51 million, or 0.24% of total loans, at the December 31, 2011. Net recoveries of previously charged-off loans for 2012 were $9 thousand, compared to net charge-offs of $151 thousand during 2011. Performing loans past due 30-89 days were zero at December 31, 2012, compared to $213 thousand at December 31, 2011. Additionally, accruing substandard loans increased to $17.36 million at December 31, 2012, compared to $12.41 million at December 31, 2011. Our other real estate owned (“OREO”) balance was zero at December 31, 2012 and was $358 thousand at December 31, 2011. All of these factors are taken into consideration during Management’s quarterly review of the Allowance. For a more detailed discussion of our Allowance and nonperforming assets, see “Credit Quality and Allowance for Credit Losses.”
NONINTEREST INCOME AND EXPENSES
Noninterest income
2012 compared to 2011
Total non-interest income increased to $11.48 million for 2012 from $10.38 million for 2011. During 2012, we made the decision to relocate one of our branches to a more visible location and recognized a net gain on the sale of our current branch location of $749 thousand. Additionally, during 2012, we recognized a gain of $334 thousand on the sale of mineral rights we owned on properties in Oklahoma which we acquired in a bank acquisition in 1971. We also recognized net gains on investment securities of $507 thousand for the year ended December 31, 2012 compared to $994 thousand for 2011. Excluding net gains on investment securities and the gains on the sale of the branch location and mineral rights, non-interest income increased to $9.89 million for 2012 compared to $9.39 million of 2011. This increase is primarily a result of increases in net debit card income and Trust division income, offset in part by decreased overdraft fee revenue. Additionally, the timing of investments in low income housing partnerships and their associated tax credits led to a reduction in equity in losses of real estate limited partnerships to $(1.52) million for 2012, compared to $(1.77) million for 2011. We account for our investment in these partnerships using the equity method. Losses generated by the partnerships are recorded as a reduction in our investments in the consolidated balance sheets and as a reduction of noninterest income in the consolidated statements of income. Tax credits generated by the partnerships are recorded as a reduction in the income tax provision. We find these investments attractive because they provide a high targeted internal rate of return, and provide an opportunity to invest in affordable housing in the communities in which we do business.
2011 compared to 2010
Total noninterest income decreased to $10.38 million for 2011 from $11.63 million for 2010. Excluding net gains (losses) on security sales and other than temporary impairment losses, noninterest income decreased to $9.39 million for 2011 from $9.72 million for 2010. Income from the Trust division increased to $2.52 million for the year ended December 31, 2011, compared to $2.16 million for 2010, a result of a combination of increased sales and improved market performance. Revenue related to service charges on deposits decreased to $4.30 million for 2011, compared to $4.93 million for 2010. The decrease is a result of legislative changes restricting overdrafts that went into effect on August 15, 2010. Net overdraft fee revenue decreased to $3.43 million for 2011, compared to $4.05 million for 2010. Other noninterest income increased slightly to $4.34 million from $4.30 million, a result of increased net debit card income of $75 thousand offset by other smaller decreases.
Noninterest expense
2012 compared to 2011
Total non-interest expense increased to $41.33 million for 2012 compared to $41.26 million of 2011. We prepaid $20 million in long-term debt and incurred prepayment penalties totaling $1.36 million during 2012. We also prepaid $16 million in long-term debt during 2011 and incurred a prepayment penalty of $861 thousand. Excluding the prepayment penalties, non-interest expense decreased $428 thousand for 2012 compared to 2011. There were a number of increases and decreases that contributed to this overall increase:
Ø | Compensation and benefits were $935 thousand lower for 2012 compared to 2011. Salary increases were offset by higher than normal vacant positions during 2012, a lower incentive accrual, and credits related to loan origination fees. |
Ø | A change in our health insurance plan for 2012 resulted in a $274 thousand reduction in health and group insurance expense for 2012 compared to 2011. |
Ø | Occupancy and equipment expenses for 2012 increased $262 thousand to $7.45 million from $7.19 million for 2011, a result of ongoing capital investments related to maintenance, increased compliance requirements and enhancement and expansion of customer service delivery channels. |
Ø | Legal and professional fees decreased to $2.54 million for 2012 compared to $2.81 million for 2011 as a result of decreased use of consultants during 2012. |
Ø | FDIC insurance expense was $866 thousand for 2012 compared to $936 thousand for 2011; during 2012 we benefited from a full year of the new FDIC insurance assessment rules that went into effect on April 1, 2011. |
2011 compared to 2010
Total noninterest expense decreased to $41.26 million from $42.43 million for 2011 compared to 2010. There were a number of increases and decreases that contributed to this overall decrease.
Ø | The largest change for 2011 compared to 2010 was decreased prepayment penalties in 2011 compared to 2010. We prepaid a total of $16.00 million in long-term debt during 2011 and incurred prepayment penalties of $861 thousand as a result. We prepaid a total of $46.50 million in long-term debt during 2010 and incurred prepayment penalties of $3.07 million. |
Ø | Occupancy and equipment expenses increased to $7.19 million for 2011 compared to $6.64 million for 2010 as a result of capital investments. |
Ø | Legal and professional fees increased to $2.81 million for 2011 compared to $2.44 million for 2010 as consultants were retained to help us explore opportunities for expense reductions and improved operating efficiencies. |
Ø | FDIC insurance expense for 2011 decreased to $936 thousand from $1.42 million for 2010 as a result of new deposit insurance assessment rules that went into effect on April 1, 2011. |
Ø | OREO expense for 2011 was $193 thousand, compared to expense recoveries and gains during 2010 related to sales of OREO properties leading to a negative expense of $298 thousand. |
Ø | Other noninterest expenses were $5.75 million for 2011 compared to $6.01 million for 2010. The primary reason for the decrease was the final disposition of our flood damaged branch in Wilmington, Vermont. We sold the branch for $90 thousand during 2011 and received insurance proceeds of $298 thousand. In total, we booked a gain of approximately $152 thousand related to this branch. |
Income Taxes
We recognized $2.12 million, $2.60 million and $2.03 million, respectively, during 2012, 2011, and 2010, in low-income housing, historic rehabilitation and qualified school construction bond tax credits as a reduction in the provision for income taxes. These credits, combined with tax exempt income earned on our municipal loan portfolio, resulted in an effective tax rate of 20.7%, 17.6% and 23.1%, for 2012, 2011, and 2010, respectively. Absent the large historic rehabilitation credits that were available in 2011, our effective tax rate for 2011 would have been approximately 20%. As of December 31, 2012, we had a net deferred tax asset of $3.73 million arising from temporary differences between our book and tax reporting. This net deferred tax asset is included in other assets in the consolidated balance sheets.
BALANCE SHEET ANALYSIS
Our total assets increased $96.68 million, or 6.0%, to a record high of $1.71 billion at December 31, 2012 from $1.61 billion at December 31, 2011, while our average earning assets increased by $125.83 million, or 8.6%, to $1.59 billion at December 31, 2012 from $1.46 billion at December 31, 2011.
Loans
Average loans for 2012 were $1.06 billion, an $86.44 million increase over average loans for 2011 of $971.00 million. Loans at December 31, 2012 reached a new record high of $1.08 billion, a $55.30 million increase over 2011 ending balances of $1.03 billion. Year-to-date growth in our commercial loan portfolio has been driven by new customer acquisitions and expansion of existing relationships.
The composition of our loan portfolio is shown in the following table:
| | | | | |
| As of December 31, |
(In thousands) | 2012 | 2011 | 2010 | 2009 | 2008 |
Commercial, financial & agricultural | $ 165,023 | $ 146,990 | $ 112,514 | $ 113,980 | $ 126,266 |
Municipal | 84,689 | 101,705 | 67,861 | 44,753 | 2,766 |
Real estate – residential | 489,951 | 439,818 | 422,981 | 435,273 | 395,834 |
Real estate – commercial | 327,622 | 313,915 | 284,296 | 290,737 | 273,526 |
Real estate – construction | 10,561 | 18,993 | 16,420 | 25,146 | 40,357 |
Installment | 4,701 | 5,806 | 6,284 | 7,711 | 7,670 |
All other loans | 376 | 399 | 438 | 938 | 708 |
| $ 1,082,923 | $ 1,027,626 | $ 910,794 | $ 918,538 | $ 847,127 |
Totals above are shown net of deferred loans fees of $250 thousand, $11 thousand, $(80) thousand, $(140) thousand and $(74) thousand for 2012, 2011, 2010, 2009 and 2008, respectively.
Reduced loan demand by our municipal customers led to a reduction in municipal balances during 2012. Growth in our residential real estate portfolio continues to be driven by increased mortgage refinance volume due to the low interest rate environment.
At December 31, 2012, we serviced $2.97 million in residential mortgage loans for investors such as the Federal National Mortgage Association (“FNMA”) and the Federal Home Loan Mortgage Corporation (“FHLMC”), and other financial investors and government agencies. This servicing portfolio continued to decrease during 2012. We have not sold a residential mortgage on the secondary market in over ten years. We do not expected servicing revenue to be a significant revenue source in the future.
The following table presents the contractual maturities of our loan portfolio at December 31, 2012:
| | | | |
| | Over One | | |
| One Year | Through | Over Five | |
(In thousands) | Or Less | 5 Years | Years | Total |
Commercial, financial & agricultural | $ 55,710 | $ 51,184 | $ 58,129 | $ 165,023 |
Municipal | 50,735 | 10,007 | 23,947 | 84,689 |
Real estate – residential | 11,011 | 55,198 | 423,742 | 489,951 |
Real estate – commercial | 31,095 | 191,088 | 105,439 | 327,622 |
Real estate – construction | 5,697 | 4,227 | 637 | 10,561 |
Installment | 2,445 | 2,175 | 81 | 4,701 |
All other loans | 376 | 0 | 0 | 376 |
| $ 157,069 | $ 313,879 | $ 611,975 | $ 1,082,923 |
The following table presents loans maturing after one year that have predetermined interest rates and floating or adjustable interest rates as of December 31, 2012:
| | |
| | |
(In thousands) | Fixed | Adjustable |
Commercial, financial & agricultural | $ 59,240 | $ 50,073 |
Municipal | 33,954 | 0 |
Real estate – residential | 440,160 | 38,780 |
Real estate – commercial | 181,625 | 114,902 |
Real estate – construction | 743 | 4,121 |
Installment | 2,252 | 4 |
| $ 717,974 | $ 207,880 |
Investments
The investment portfolio is used to generate interest income, manage liquidity and mitigate interest rate sensitivity. Our investment portfolio totaled $509.09 million at December 31, 2012, a decrease of $3.22 million from the December 31, 2011 ending balance of $512.31 million.
We purchased bonds with a total book value of $325.71 million during 2012. We sold bonds with a book value of $129.43 million during 2012 for a net pre-tax gain of $507 thousand. These trades allowed us to lock in gains on faster paying mortgage-backed securities and helped us to reduce our exposure to accelerated premium amortization in the portfolio.
The composition of our investment portfolio at carrying amounts is shown in the following table:
| | | |
| As of December 31, |
(In thousands) | 2012 | 2011 | 2010 |
Available for Sale: | |
U.S. Treasury Obligations | $ 100 | $ 250 | $ 250 |
U.S. Agency Obligations | 10,897 | 0 | 0 |
U.S. Government Sponsored Enterprises (“U.S. GSEs”) | 59,366 | 90,419 | 47,788 |
FHLB Obligations | 24,585 | 16,676 | 11,457 |
Residential Real Estate Mortgage-backed Securities (“Agency MBSs”) | 148,767 | 183,838 | 174,907 |
Agency Commercial Mortgage Backed Securities ("Agency CMBSs") | 5,029 | 0 | 0 |
Agency Collateralized Mortgage Obligations (“Agency CMOs”) | 230,399 | 214,480 | 224,268 |
Collateralized Loan Obligations ("CLOs") | 24,527 | 0 | 0 |
Non-agency Collateralized Mortgage Obligations (“Non-Agency CMOs”) | 4,593 | 4,855 | 5,852 |
Asset Backed Securities (“ABSs”) | 418 | 1,233 | 1,440 |
Total available for sale | 508,681 | 511,751 | 465,962 |
Held to maturity: | | | |
Agency MBSs | 407 | 558 | 794 |
Total held to maturity | 407 | 558 | 794 |
Total Securities | $ 509,088 | $ 512,309 | $ 466,756 |
Agency MBSs and Agency CMOs consist of pools of residential mortgages which are guaranteed by the FNMA, FHLMC, or Government National Mortgage Association (“GNMA”) with various origination dates and maturities. Agency CMBS consists of bonds backed by commercial real estate which are guaranteed by FNMA. CLOs are floating rate securities that consist of pools of commercial loans structured to provide very strong over collateralization and subordination. All of our CLOs are the senior AAA tranche and are the first bond to get paid down. Non-Agency CMOs are tracked individually with updates on the performance of the underlying collateral and stress testing performed and reviewed monthly. Additionally, we monitor individual bonds that experience greater levels prepayment or market volatility.
We use an external pricing service to obtain fair market values for our investment portfolio. We have obtained and reviewed the service provider’s pricing and reference data document. Evaluations are based on market data and vary by asset class and incorporate available trade, bid and other market information. Because many fixed income securities do not trade on a daily basis, the service provider’s evaluated pricing applications apply available information as applicable through processes such as benchmark curves, benchmarking of like securities, sector groupings, and matrix pricing, to prepare evaluations. In addition, model processes, such as the Option Adjusted Spread model are used to assess interest rate impact and develop prepayment scenarios. We periodically test the values provided to us by the pricing service through a combination of back testing on actual sales of securities and by obtaining prices on all bonds from an alternative pricing source.
We have two non-Agency CMOs with a current book value of $4.59 million. Management, with the help of outside experts, has performed impairment analyses on these bonds. One of the non-Agency CMOs, with a cost basis of $3.04 million and a fair value of $3.04 million at December 31, 2012, is rated BB by Fitch and Ba2 by Moody’s. Delinquencies have been fairly low and prepayments on the bond during 2012 have led to increased credit support. We own a senior tranche in this bond. Although losses are expected in the bond overall, our position in the structure of the bond is expected to protect us from realizing losses. The second bond has a cost basis of $1.55 million and a fair value of $1.55 million. This bond is rated CC by Fitch and CCC by S&P. We own a super senior tranche in this bond. Although losses are expected in the bond overall, our super senior position in the structure is expected to protect us from realizing losses.
We do not intend to sell the investment securities that are in an unrealized loss position, and it is unlikely that we will be required to sell the investment securities before recovery of their amortized cost bases, which may be maturity.
The contractual final maturity distribution of the debt securities classified as available for sale and held to maturity as of December 31, 2012, are as follows:
SECURITIES AVAILABLE FOR SALE (at fair value):
| | | | | |
| | | | | |
(In thousands) | Within One Year | After One But Within Five Years | After Five But Within Ten Years | After Ten Years | Total |
U.S. Treasury Obligations | $ 0 | $ 100 | $ 0 | $ 0 | $ 100 |
U.S. Agency Obligations | 0 | 0 | 0 | 10,897 | 10,897 |
U.S. GSEs | 0 | 10,025 | 49,341 | 0 | 59,366 |
FHLB Obligations | 0 | 0 | 24,585 | 0 | 24,585 |
Agency MBSs | 316 | 3,387 | 22,854 | 122,210 | 148,767 |
Agency CMBSs | 0 | 0 | 5,029 | 0 | 5,029 |
Agency CMOs | 0 | 0 | 4,139 | 226,260 | 230,399 |
CLOs | 0 | 0 | 24,527 | 0 | 24,527 |
Non-Agency CMOs | 0 | 0 | 0 | 4,593 | 4,593 |
ABSs | 0 | 0 | 0 | 418 | 418 |
| $ 316 | $ 13,512 | $ 130,475 | $ 364,378 | $ 508,681 |
Weighted average investment yield | 3.94% | 2.14% | 2.16% | 2.36% | |
SECURITIES HELD TO MATURITY (at amortized cost):
| | | | | |
| | | | | |
(In thousands) | Within One Year | After One But Within Five Years | After Five But Within Ten Years | After Ten Years | Total |
Agency MBSs | $ 11 | $ 73 | $ 0 | $ 323 | $ 407 |
Weighted average investment yield | 7.02% | 6.94% | 0 | 6.52% | |
Actual maturities will differ from contractual maturities because borrowers may have rights to call or prepay obligations. Maturities of mortgage-backed securities and collateralized mortgage obligations are based on final contractual maturities.
As a member of the Federal Home Loan Bank system, we are required to invest in stock of the FHLBB in an amount determined based on our borrowings from the FHLBB. At December 31, 2012, our investment in FHLBB stock totaled $8.15 million. Dividend income on FHLBB stock of $45 thousand and $32 thousand was recorded during 2012 and 2011, respectively. The FHLBB continues to be classified as “adequately capitalized” by its primary regulator. Based on current available information, we have concluded that our investment in FHLBB stock is not impaired. We will continue to monitor our investment in FHLBB stock.
Other Assets
Bank Premises and Equipment increased to $16.08 million at December 31, 2012 from $14.23 million at year-end 2011. During 2012, we relocated our branch in Barre, Vermont, to a newly constructed facility in a more favorable location.
Investments in Real Estate Limited Partnerships increased $234 thousand due to additional investments made. These partnerships provide affordable housing in the communities in which we do business, and provide us with a high targeted rate of return on our investment.
We entered into a sale leaseback arrangement for our principal office in South Burlington, Vermont, in June 2008. Deferred gains on the sale leaseback transaction resulted in a $423 thousand offset to rent expense per year through 2016 and $635 thousand thereafter.
Deposits
Our deposit balances at December 31, 2012 increased $93.20 million, or 7.91%, to a record high of $1.27 billion from $1.18 billion at December 31, 2011. The composition of our deposit balances is shown in the following table:
| | | |
| As of December 31, |
(In thousands) | 2012 | 2011 | 2010 |
Demand | $ 240,491 | $ 197,522 | $ 141,412 |
Savings and interest bearing checking | 363,902 | 326,226 | 294,963 |
Money market accounts | 336,289 | 305,884 | 289,618 |
Time deposits | 330,398 | 348,248 | 366,203 |
| $ 1,271,080 | $ 1,177,880 | $ 1,092,196 |
Growth during 2012 has been concentrated in our transaction account categories. Demand deposits have shown solid growth during 2012 increasing by $42.97 million, or 21.75%, to $240.49 million at December 31, 2012 from $197.52 million at December 31, 2011, due in part to the continued migration away from time deposit categories during 2012. Total time deposits decreased during 2012 by $17.85 million to $330.40 million compared to 2011. Time deposits decreased to 26.0% of total deposits at December 31, 2012 from 29.6% of total deposits at December 31, 2011. Other transaction account categories have increased $68.08 million during 2012 compared to 2011.
The Transaction Account Guarantee (“TAG”) program, which provided unlimited coverage of noninterest-bearing transaction deposit accounts expired on January 1, 2013. We have offered customers affected by the expiration of the TAG program an alternative account that will provide them the same benefit. To date, we have not seen any material deposit outflows related to the expiration of TAG.
Time deposits of $100 thousand and greater at December 31, 2012 and 2011 had the following schedule of maturities:
| | |
| As of December 31, |
(In thousands) | 2012 | 2011 |
Three months or less | $ 24,738 | $ 32,836 |
Three to six months | 31,762 | 26,169 |
Six to twelve months | 39,939 | 39,103 |
One to five years | 26,932 | 29,195 |
| $ 123,371 | $ 127,303 |
Other Liabilities
Balances in our cash management sweep product increased 9.5% to $287.52 million at December 31, 2012 compared to $262.53 million at December 31, 2011. The balances are included with “Securities sold under agreements to repurchase” on the accompanying consolidated balance sheet. The increase is attributable to new and expanded municipal banking relationships. As mentioned previously, we prepaid $20 million in long-term debt during 2012.
On December 15, 2004, we closed our private placement of an aggregate of $20 million of trust preferred securities. The placement occurred through a newly-formed Delaware statutory trust affiliate, MBVT Statutory Trust I (the “Trust”) as part of a pooled trust preferred program. The Trust was formed for the sole purpose of issuing capital securities; these securities are non-voting. We own all of the common securities of the Trust. The proceeds from the sale of the capital securities were loaned to us under subordinated debentures issued to the Trust. The debentures are the only asset of the Trust and payments under the debentures are the sole revenue of the Trust. Our primary source of funds to pay interest on the debentures held by the Trust is current dividends from our principal subsidiary, Merchants Bank. Accordingly, our ability to service the debentures is dependent upon the continued ability of Merchants Bank to pay dividends to us.
These hybrid securities qualify as regulatory capital, up to certain regulatory limits. At the same time, they are considered debt for tax purposes, and as such, interest payments are fully deductible. The trust preferred securities total $20.62 million, and carried a fixed rate of interest through December 2009, at which time the rate became variable and adjusts quarterly at three-month LIBOR plus 1.95%. We entered into two interest rate swap arrangements for our trust preferred issuance which were effective beginning on December 15, 2009. One swap fixed the interest rate on $10 million at 6.50% for three years; this swap expired on December 15, 2012 and has not been extended or renewed. The second swap fixed the rate on $10 million at 5.23% and expires on December 15, 2016. The impact on net interest income for 2012, 2011 and 2010 from the interest expense on the trust preferred securities was $1.18
million, $1.19 million and $1.19 million per year, respectively. The trust preferred securities mature on December 31, 2034, and are redeemable without penalty at our option, subject to prior approval by the FRB.
CREDIT QUALITY AND ALLOWANCE FOR CREDIT LOSSES
The United States economy showed slight improvement during 2012, although high unemployment and foreclosure rates continued in certain parts of the country. Although Vermont, our primary market, has not been immune to this economic turmoil, the state has one of the lowest foreclosure rates in the country, home price depreciation has been muted, and the unemployment rate is lower than the national average.
Credit quality
Credit quality is a major strategic focus and strength of our company. Although we actively manage current nonperforming and classified loans, there is no assurance that we will not have increased levels of problem assets in the future. The make up of the nonperforming pool is dynamic with accounts moving in and out of this category over time. The following table summarizes our nonperforming loans (“NPL”) and nonperforming assets (“NPA”) as of December 31, 2008, through December 31, 2012:
| | | | | |
(In thousands) | 2012 | 2011 | 2010 | 2009 | 2008 |
Nonaccrual loans | $ 2,355 | $ 1,953 | $ 3,171 | $ 13,412 | $ 9,361 |
Loans past due greater than 90 days and accruing | 0 | 0 | 384 | 88 | 57 |
Troubled debt restructurings (“TDR”) | 557 | 558 | 549 | 981 | 2,225 |
Total nonperforming loans | 2,912 | 2,511 | 4,104 | 14,481 | 11,643 |
OREO | 0 | 358 | 191 | 655 | 802 |
Total nonperforming assets | $ 2,912 | $ 2,869 | $ 4,295 | $ 15,136 | $ 12,445 |
Non-performing loans at December 31, 2012 were $2.91 million. The increase compared to December 31, 2011 was primarily due to the downgrade of one jumbo residential mortgage customer. Of the $2.91 million in nonperforming loans in the table above, $705 thousand are commercial loans and $2.21 million are residential mortgages and home equity loans.
We originate traditional mortgage and home equity products which are fully documented and underwritten. We take a proactive risk management approach by conducting periodic stress-testing of the existing residential loan portfolio and adjusting underwriting requirements, if necessary, based upon the results of the analysis. The assumptions used in the stress testing include: credit score migration; calculation of possible losses using conservative assumptions of market decline; review of life-of-loan delinquency levels relative to loan size and credit score; analysis of the portfolio by loan size, and distribution within the portfolio by loan-to-value ratios. Based upon the results of assessments of the residential loan portfolio conducted in 2012 and 2011, Management concluded that current reserve levels were adequate.
Our analysis indicates that, through a combination of estimated collateral value and, where needed, an appropriately allocated reserve, any additional loss exposure on current non-accruing loans is minimal.
TDRs represent balances where the existing loan was modified involving a concession in rate, term or payment amount due to the distressed financial condition of the borrower. There were eight restructured residential mortgages at December 31, 2012 with balances totaling $372 thousand. There were two restructured commercial loans at December 31, 2012 with balances totaling $185 thousand. Eight of the ten TDRs at December 31, 2012 continue to pay as agreed according to the modified terms and all but one of these loans are considered well-secured; two of the TDRs are in foreclosure.
Excluded from the nonperforming balances discussed above are our loans that are 30 to 89 days past due, which are not necessarily considered classified or impaired. Loans 30 to 89 days past due as a percentage of total loans as of the periods indicated are presented in the following table:
| |
Year Ended | 30-89 Days |
December 31, 2012 | 0.00% |
December 31, 2011 | 0.02% |
December 31, 2010 | 0.14% |
December 31, 2009 | 0.09% |
December 31, 2008 | 0.16% |
Loans, including impaired loans, are generally classified as nonaccrual if they are past due as to maturity or payment of principal or interest for a period of more than 90 days. If a loan or a portion of a loan is internally classified as impaired or is partially charged-off, the loan is generally classified as nonaccrual. Loans that are on a current payment status or past due less than 90 days may also be classified as nonaccrual if repayment in full of principal and/or interest is in doubt. Income accruals are suspended on all nonaccruing loans, and all previously accrued and uncollected interest is charged against current income.
Loans may be returned to accrual status when there is a sustained period of repayment performance (generally a minimum of six
months) by the borrower, in accordance with the contractual terms of the loans and all principal and interest amounts contractually due, including arrearages, are reasonably assured of repayment within an acceptable period of time.
While a loan is classified as nonaccrual and the future collectability of the recorded loan balance is uncertain, any payments received are generally applied to reduce the principal balance. When the future collectability of the recorded loan balance is expected, interest income may be recognized on a cash basis. In the case where a nonaccrual loan has been partially charged-off, recognition of interest on a cash basis is limited to that which would have been recognized on the recorded loan balance at the contractual interest rate. Interest collections in excess of that amount are recorded as a reduction of principal.
A loan remains in nonaccruing status until the factors which suggest doubtful collectability no longer exist, the loan is liquidated, or when the loan is determined to be uncollectible, and is charged off against the allowance for loan losses. In those cases where a nonaccruing loan is secured by real estate, we can, and may, initiate foreclosure proceedings. The result of such action will either be to cause repayment of the loan with the proceeds of a foreclosure sale or to give us possession of the collateral in order to manage a future resale of the real estate. Foreclosed property is recorded at the lower of its cost or estimated fair value, less any estimated costs to sell and is actively marketed. Any cost in excess of the estimated fair value on the transfer date is charged to the allowance for loan losses, while further declines in market values are recorded as OREO expense in the consolidated statement of income. Impaired loans, which primarily consist of non-accruing residential mortgage and commercial real estate loans and TDRs, totaled $3.02 million and $2.51 million at December 31, 2012 and 2011, respectively. At December 31, 2012, $1.85 million of impaired loans had specific reserve allocations totaling $569 thousand.
Substandard loans at December 31, 2012 totaled $19.51 million, of which $17.36 million in loans continue to accrue interest. Loans identified as substandard have well-defined weaknesses that, if not addressed, could result in a loss. These accruing substandard loans have generally continued to pay promptly and Management conducts regularly scheduled comprehensive reviews of the borrowers’ financial condition, payment performance, accrual status and collateral. These reviews also ensure that these troubled accounts are properly administered with a focus on loss mitigation and that any potential loss exposures are appropriately quantified, and reserved for. The findings of this review process are a key component in assessing the adequacy of our loan loss reserve.
Accruing substandard loans at December 31, 2012 reflect a $4.95 million increase in balances since December 31, 2011. At December 31, 2012, accruing substandard loans related to owner-occupied commercial real estate totaled $11.80 million, investor commercial real estate loans totaled $1.45 million, residential mortgage loans totaled $797 thousand, multifamily real estate loans totaled $1.35 million, and $1.96 million in substandard loans are outstanding to corporate borrowers in a variety of different industries. Eight borrowers in a variety of industries account for 70% of the total accruing substandard loans, and approximately $2.17 million of the total accruing substandard loans carry some form of government guarantee.
To date, with very few exceptions, all payments due from accruing substandard borrowers have been made as agreed and Management’s ongoing evaluation of these borrowers’ financial condition and collateral indicates a reasonable certainty that these exposures are adequately secured.
Management monitors asset quality closely and continuously performs detailed and extensive reviews on larger credits and problematic credits identified on the watched asset list, nonperforming asset listings and internal credit rating reports. In addition to frequent financial analysis and review of well-rated and adversely graded loans, Management incorporates active monitoring of key credit and non-credit risks for each customer, assessing risk through the daily reviews of overdrafts, delinquencies and usage of electronic banking products and tracking for timely receipt of all required financial statements.
Allowance for Credit Losses
The allowance for credit losses is made up of two components: the allowance for loan losses (“ALL”) and the reserve for undisbursed lines. The ALL is based on Management's estimate of the amount required to reflect the known and inherent risks in the loan portfolio, based on circumstances and conditions known at each reporting date. We review the adequacy of the ALL quarterly. Factors considered in evaluating the adequacy of the ALL include previous loss experience, the size and composition of the portfolio, risk rating composition, current economic and real estate market conditions and their effect on the borrowers, the performance of individual loans in relation to contractual terms and estimated fair values of properties that secure impaired loans.
The adequacy of the ALL is determined using a consistent, systematic methodology, consisting of a review of both specific reserves for loans identified as impaired and general reserves for the various loan portfolio classifications. When a loan is impaired, we determine its impairment loss by comparing the excess, if any, of the loan’s carrying amount over (1) the present value of expected future cash flows discounted at the loan’s original effective interest rate, (2) the observable market price of the impaired loan, or (3) the fair value of the collateral securing a collateral-dependent loan. When a loan is deemed to have an impairment loss, the loan is either charged down to its estimated net realizable value, or a specific reserve is established as part of the overall allowance for loan losses if Management needs more time to evaluate all of the facts and circumstances relevant to that particular loan.
The general allowance for loan losses is a percentage-based reflection of historical loss experience and assigns a required allocation by loan classification based on a fixed percentage of all outstanding loan balances. The general allowance for loan losses employs a risk-rating model that grades loans based on their general characteristics of credit quality and relative risk. Appropriate reserve levels are estimated based on Management’s judgments regarding the historical loss experience, current economic trends, trends in the portfolio
mix, volume and trends in delinquencies and non-accrual loans.
The following table summarizes the allowance for loan losses allocated by loan type:
| | | | | |
(In thousands) | 2012 | 2011 | 2010 | 2009 | 2008 |
Commercial, financial & agricultural | $ 2,915 | $ 2,412 | $ 2,112 | $ 3,106 | $ 2,840 |
Municipal | 494 | 307 | 236 | 134 | 0 |
Real estate – residential | 3,494 | 3,025 | 2,367 | 2,222 | 1,033 |
Real estate – commercial | 4,444 | 4,442 | 5,098 | 4,943 | 4,254 |
Real estate – construction | 187 | 393 | 277 | 349 | 542 |
Installment | 17 | 23 | 24 | 39 | 4 |
All other loans | 11 | 17 | 21 | 183 | 221 |
Allowance for loan losses | $ 11,562 | $ 10,619 | $ 10,135 | $ 10,976 | $ 8,894 |
Losses are charged against the ALL when Management believes that the collectability of principal is doubtful. To the extent Management determines the level of anticipated losses in the portfolio increased or diminished, the ALL is adjusted through current earnings. Overall, Management believes that the ALL is maintained at an adequate level, in light of historical and current factors, to reflect the level of credit risk in the loan portfolio. Loan loss experience and nonperforming asset data are presented and discussed in relation to their impact on the adequacy of the ALL.
The following table reflects our loan loss experience and activity in the Allowance for Credit Losses for the past five years:
| | | | | |
(In thousands) | 2012 | 2011 | 2010 | 2009 | 2008 |
Average loans outstanding | $ 1,057,446 | $ 971,003 | $ 912,363 | $ 901,582 | $ 781,645 |
Allowance beginning of year | 11,353 | 10,754 | 11,702 | 9,311 | 8,350 |
Charge-offs: | | | | | |
Commercial, financial & agricultural and all other loans | (9) | (80) | (1,691) | (1,355) | (16) |
Real estate – residential | (20) | (83) | (25) | (255) | (28) |
Real estate – commercial | (32) | (60) | (259) | (258) | 0 |
Real estate – construction | 0 | (96) | 0 | 0 | (637) |
Installment | 0 | (10) | (2) | (8) | 0 |
Total charge-offs | (61) | (329) | (1,977) | (1,876) | (681) |
Recoveries: | | | | | |
Commercial, financial & agricultural and all other loans | 30 | 101 | 2,128 | 110 | 60 |
Real estate – residential | 14 | 4 | 20 | 2 | 1 |
Real estate – commercial | 1 | 44 | 31 | 51 | 56 |
Real estate – construction | 25 | 25 | 593 | 3 | 0 |
Installment | 0 | 4 | 7 | 1 | 0 |
Total recoveries | 70 | 178 | 2,779 | 167 | 117 |
Net recoveries (charge-offs) | 9 | (151) | 802 | (1,709) | (564) |
Provision (credit) for credit losses | 950 | 750 | (1,750) | 4,100 | 1,525 |
Allowance end of year | $ 12,312 | $ 11,353 | $ 10,754 | $ 11,702 | $ 9,311 |
Ratio of net charge-offs to average loans outstanding | 0.00% | (0.02)% | 0.09% | (0.19)% | (0.07)% |
Components: | | | | | |
Allowance for loan losses | $ 11,562 | $ 10,619 | $ 10,135 | $ 10,976 | $ 8,894 |
Reserve for undisbursed lines of credit | 750 | 734 | 619 | 726 | 417 |
Allowance for credit losses | $ 12,312 | $ 11,353 | $ 10,754 | $ 11,702 | $ 9,311 |
The increase in the provision from 2011 to 2012 was primarily a result of our loan growth during 2012.
The following table reflects our nonperforming asset and coverage ratios as of the dates indicated:
| | | | | |
| 2012 | 2011 | 2010 | 2009 | 2008 |
NPL to total loans | 0.27% | 0.24% | 0.45% | 1.58% | 1.37% |
NPA to total assets | 0.17% | 0.18% | 0.29% | 1.05% | 0.93% |
Allowance for loan losses to total loans | 1.07% | 1.03% | 1.11% | 1.19% | 1.05% |
Allowance for loan losses to NPL | 397% | 423% | 247% | 76% | 76% |
We will continue to take all appropriate measures to restore nonperforming assets to performing status or otherwise liquidate these assets in an orderly fashion so as to maximize their value. There can be no assurances that we will be able to complete the disposition of nonperforming assets without incurring further losses.
Loan Portfolio Monitoring
Our Board of Directors grants each loan officer the authority to originate loans on our behalf, subject to certain limitations. The Board of Directors also establishes restrictions regarding the types of loans that may be granted and the distribution of loan types within our portfolio, and sets loan authority limits for each lender. These authorized lending limits are reviewed at least annually and are based upon the lender's knowledge and experience. Loan requests that exceed a lender's authority require the signature of our credit division manager, senior loan officer, and/or our President. All extensions of credit of $4.0 million or greater to any one borrower, or related party interest, are reviewed and approved by the Loan Committee of Merchants Bank’s Board of Directors.
The Loan Committee and the credit department regularly monitor our loan portfolio. The entire loan portfolio, as well as individual loans, is reviewed for loan performance, compliance with internal policy requirements and banking regulations, creditworthiness, and strength of documentation. We monitor loan concentrations by individual borrowers, industries and loan types. As part of the annual credit policy review process, targets are set by loan type for the total portfolio. Credit risk ratings assessing inherent risk in individual loans are assigned to commercial loans at origination and are routinely reviewed by lenders and Management on a periodic basis according to total exposure and risk rating. These internal reviews assess the adequacy of all aspects of credit administration, additionally, we maintain an on-going active monitoring process of loan performance during the year. We have also hired external loan review firms to assist in monitoring both the commercial and residential loan portfolios. The commercial loan review firm reviews at a minimum 60% in dollar volume of our commercial loan portfolio each year. These comprehensive reviews assessed the accuracy of our risk rating system as well as the effectiveness of credit administration in managing overall credit risks.
All loan officers are required to service their loan portfolios and account relationships. Loan officers, a commercial workout officer, or collection personnel take remedial actions to assure full and timely payment of loan balances as necessary, with the supervision of the Senior Lender and the Senior Credit Officer.
EFFECTS OF INFLATION
The financial nature of our consolidated balance sheet and statement of income is more clearly affected by changes in interest rates than by inflation, but inflation does affect us because as prices increase the money supply tends to increase, the size of loans requested tends to increase, total company assets increase, and interest rates are affected by inflationary expectations. In addition, operating expenses tend to increase without a corresponding increase in productivity. There is no precise method, however, to measure the effects of inflation on our financial statements. Accordingly, any examination or analysis of the financial statements should take into consideration the possible effects of inflation.
Liquidity and Capital Resource Management
General
Liquid assets are maintained at levels considered adequate to meet our liquidity needs. Liquidity is adjusted as appropriate to meet asset and liability management objectives. Liquidity is monitored by the Asset and Liability Committee (“ALCO”) of Merchants Bank’s Board of Directors, based upon Merchants Bank’s policies. Our primary sources of liquidity are deposits, amortization and prepayment of loans, maturities of investment securities and other short-term investments, periodic principal repayments on mortgage-backed and other amortizing securities, advances from the FHLBB, and earnings and funds provided from operations. While scheduled principal repayments on loans are a relatively predictable source of funds, deposit flows and loan prepayments are greatly influenced by market interest rates, economic conditions, and rates offered by our competition. Interest rates on deposits are priced to maintain a desired level of total deposits.
As of December 31, 2012, we could borrow up to $45 million in overnight funds through unsecured borrowing lines established with correspondent banks. We have established both overnight and longer term lines of credit with FHLBB. FHLBB borrowings are secured by residential mortgage loans. The total amount of loans pledged to the FHLBB for both short and long-term borrowing arrangements totaled $342.56 million at December 31, 2012. We have additional borrowing capacity with the FHLBB of $232.34
million as of December 31, 2012. We have also established a borrowing facility with the FRB which will enable us to borrow at the discount window. Additionally, we have the ability to borrow through the use of repurchase agreements, collateralized by Agency MBS and Agency CMO, with certain approved counterparties. Our investment portfolio, which is managed by the ALCO, has a book value of $499.78 million at December 31, 2012, of which $349.45 million was pledged. The portfolio is a reliable source of cash flow for us. We closely monitor our short term cash position. Any excess funds are either left on deposit at the FRB, or are in a fully insured account with one of our correspondent banks.
FHLBB short-term borrowings mature daily and there was no outstanding balance at December 31, 2012. The demand note due to the U.S. Treasury matures daily and bears interest at the federal funds rate less 0.25%. The rate on this borrowing at December 31, 2012 was zero.
| | |
| Year Ended December 31, 2012 | Year Ended December 31, 2011 |
FHLBB and other short-term borrowings | | |
Amount outstanding at end of period | $ 0 | $ 0 |
Maximum month-end amount outstanding | 97,000 | 0 |
Average amount outstanding | 38,290 | 359 |
Weighted average-rate during the period | 0.28% | 0.28% |
Weighted average rate at period end | 0% | 0% |
Demand note due U.S. Treasury | | |
Amount outstanding at end of period | $ 0 | $ 0 |
Maximum month-end amount outstanding | 0 | 3,013 |
Average amount outstanding | 0 | 1,794 |
Weighted average-rate during the period | 0% | 0% |
Weighted average rate at period-end | 0% | 0% |
Securities sold under agreement to repurchase, short-term | | |
Amount outstanding at end of period | $ 287,520 | $ 262,527 |
Maximum month-end amount outstanding | 303,420 | 266,897 |
Average amount outstanding | 230,281 | 217,823 |
Weighted average-rate during the period | 0.73% | 0.95% |
Weighted average rate at period end | 0.47% | 0.91% |
Contractual Obligations
We have certain long-term contractual obligations, including long-term debt agreements, operating leases for branch operations, and time deposits. The maturity schedules for these obligations are as follows:
| | | | | |
(In thousands) | Less than One year | One Year To Three Years | Three Years To Five Years | Over Five Years | Total |
Debt maturities | $ 81 | $ 166 | $ 172 | $ 2,064 | $ 2,483 |
Junior subordinated debentures | 0 | 0 | 0 | 20,619 | 20,619 |
Operating lease payments | 1,134 | 1,838 | 1,583 | 4,857 | 9,412 |
Time deposits | 262,857 | 49,333 | 18,208 | 0 | 330,398 |
| $ 264,072 | $ 51,337 | $ 19,963 | $ 27,540 | $ 362,912 |
Commitments and Off-Balance Sheet Risk
We are a party to financial instruments with off‑balance sheet risk in the normal course of business to meet the financing needs of our customers. These financial instruments primarily include commitments to extend credit and financial guarantees. Such instruments involve, to varying degrees, elements of credit and interest rate risk that are not recognized in the accompanying consolidated balance sheets.
Exposure to credit loss in the event of nonperformance by the other party to the financial instruments for commitments to extend credit and financial guarantees written is represented by the contractual amount of those instruments. We use the same credit policies in making commitments as we do for on‑balance sheet instruments. The contractual amounts of these financial instruments at December 31, 2012 are as follows:
| |
(In thousands) | Contractual Amount |
Financial instruments whose contract amounts represent credit risk: | |
Commitments to originate loans | $ 13,624 |
Unused lines of credit | 180,812 |
Standby letters of credit | 4,481 |
Loans sold with recourse | 8 |
Equity commitments to affordable housing limited partnerships | 869 |
Commitments to originate loans are agreements to lend to a customer as long as there is no violation of any condition established in the contract. Commitments to originate loans generally have expiration dates within 60 days of the commitment. Unused lines of credit have expiration dates ranging from one to two years from the date of the commitment. Because a portion of the commitments are expected to expire without being drawn upon, the total commitment amount does not necessarily represent a future cash requirement. We evaluate each customer's creditworthiness on a case‑by‑case basis. Upon extension of credit, we obtain an appropriate amount of real and/or personal property as collateral based on our credit evaluation of the counterparty.
We do not issue any guarantees that would require liability-recognition or disclosure, other than standby letters of credit. We have issued conditional commitments in the form of standby letters of credit to guarantee payment on behalf of a customer and guarantee the performance of a customer to a third party. Standby letters of credit generally arise in connection with lending relationships. The credit risk involved in issuing these instruments is essentially the same as that involved in extending loans to customers. Contingent obligations under standby letters of credit totaled approximately $4.48 million and $4.26 million at December 31, 2012 and 2011, respectively, and represent the maximum potential future payments we could be required to make. Typically, these instruments have terms of 12 months or less and expire unused; therefore, the total amounts do not necessarily represent future cash requirements. Each customer is evaluated individually for creditworthiness under the same underwriting standards used for commitments to extend credit and on-balance sheet instruments. Our policies governing loan collateral apply to standby letters of credit at the time of credit extension. LTV ratios are generally consistent with LTV requirements for other commercial loans secured by similar types of collateral. The fair value of our standby letters of credit at December 31, 2012 and 2011 was insignificant.
Equity commitments to affordable housing partnerships represent funding commitments for certain limited partnerships. These partnerships were created for the purpose of acquiring, constructing and/or redeveloping affordable housing projects. The funding of these commitments is generally contingent upon substantial completion of the project and none extend beyond the fifth anniversary of substantial completion.
Capital Resources
In general, capital growth is essential to support deposit and asset growth and to ensure our strength and safety. Net income increased our capital by $15.19 million in 2012, $14.62 million in 2011 and $15.46 million in 2010. Payment of dividends decreased our capital by $7.01 million, $6.95 million and $6.90 million while the use of treasury stock to fund our dividend reinvestment plan increased our capital by $683 thousand, $719 thousand and $762 thousand during 2012, 2011 and 2010, respectively. In December 2004, we privately placed $20 million in capital securities as part of pooled trust preferred program. These capital securities have certain features that make them an attractive funding vehicle. The securities qualify as regulatory capital under regulatory adequacy guidelines, and are included in capital in the table below.
Changes in the market value of our available for sale investment portfolio, net of tax, decreased capital by $665 thousand in 2012 and increased capital by $1.94 million in 2011. Our pre-tax unrecognized net actuarial loss in our pension plan was $4.82 million at December 31, 2012 which resulted in a cumulative after-tax charge to equity of $3.13 million. Our unrealized loss on our interest rate swaps, net of taxes, at December 31, 2012, reduced capital by a cumulative $688 thousand.
We extended, through January 2014, our stock buyback program, originally adopted in January 2007. Under the program, we may repurchase up to 200,000 shares of our common stock on the open market from time to time, and have purchased 143,475 shares at an average price per share of $22.94 since the program's adoption in 2007. We did not repurchase any of our shares during 2012, and do not expect to repurchase shares in the near future.
ITEM 7A – QUANTITATIVE AND QUALITATIVE DISCLOSURES ABOUT MARKET RISK
RISK MANAGEMENT
General
Our Management and Board of Directors are committed to sound risk management practices throughout the organization. We have developed and implemented a centralized risk management monitoring program. Risks associated with our business activities and products are identified and measured as to probability of occurrence and impact on us (low, moderate, or high), and the control or other activities in place to manage those risks are identified and assessed. Periodically, department-level and senior managers re-
evaluate and report on the risk management processes for which they are responsible. This documented program provides us with a comprehensive framework for monitoring our risk profile from a macro perspective. It also serves as a tool for assessing internal controls over financial reporting as required under the FDICIA and the Sarbanes-Oxley Act of 2002.
Market Risk
Market risk is the risk of loss in a financial instrument arising from adverse changes in market rates or prices such as interest rates, foreign currency exchange rates, commodity prices, and equity prices. Our primary market risk exposure is interest rate risk. An important component of our asset and liability management process is the ongoing monitoring and management of this risk, which is governed by established policies that are reviewed and approved annually by our Board of Directors. Our Investment Policy details the types of securities that may be purchased, and establishes portfolio limits and maturity limits for the various sectors. The Investment Policy also establishes specific investment quality limits. Our Board of Directors has established a Board-level Asset/Liability Committee, which delegates responsibility for carrying out the asset/liability management policies to the Management-level Asset/Liability Committee (the “ALCO”). The ALCO, chaired by the Chief Financial Officer and composed of members of senior management, develops guidelines and strategies impacting our asset and liability management related activities based upon estimated market risk sensitivity, policy limits and overall market interest rate levels and trends. The ALCO manages the investment portfolio. As the portfolio has grown, the ALCO has used portfolio diversification as a way to mitigate the risk of being too heavily invested in any single asset class. We continued to work to maximize net interest income while mitigating risk during the year through further repositioning of the investment portfolio, selective sales of specific securities, as well as carefully monitoring the overall duration and average life of the portfolio, and monitoring individual securities, among other strategies.
Liquidity Risk
Our liquidity is measured by our ability to raise cash when needed at a reasonable cost. We must be capable of meeting expected and unexpected obligations to customers at any time. Given the uncertain nature of customer demands as well as the need to maximize earnings, we must have available reasonably priced sources of funds, on- and off-balance sheet, which can be accessed quickly in time of need. As discussed above under Item 7, “Management’s Discussion and Analysis of Financial Condition and Results of Operations - Liquidity and Capital Resource Management,” we have several sources of readily available funds, including the ability to borrow using our investment portfolio as collateral. We also monitor our liquidity on a quarterly basis in compliance with our Liquidity Contingency Plan. Our liquidity monitoring process identifies early liquidity stress triggers, and also allows us to model worst case liquidity scenarios, and various responses to those scenarios.
Financial markets have been volatile and challenging for many financial institutions. Because of our favorable credit quality and strong balance sheet, we have not experienced any liquidity constraints through the end of 2012. During the past several quarters, our liquidity position has been strong, as depositors and investors in the wholesale funding markets seek strong financial institutions.
Interest Rate Risk
Interest rate risk is the exposure to a movement in interest rates, which, as described above, affects our net interest income. Asset and liability management is governed by policies reviewed and approved annually by Merchants Bank’s Board of Directors. The ALCO meets frequently to review and develop asset/liability management strategies and tactics.
The ALCO is responsible for evaluating and managing the interest rate risk which arises naturally from imbalances in repricing, maturity and cash flow characteristics of our assets and liabilities. Techniques used by the ALCO take into consideration the cash flow and repricing attributes of balance sheet and off-balance sheet items and their relation to possible changes in interest rates. The ALCO manages interest rate exposure primarily by using on-balance sheet strategies, generally accomplished through the management of the duration, rate sensitivity and average lives of our various investments, and by extending or shortening maturities of borrowed funds, as well as carefully managing and monitoring the pricing of loans and deposits. The ALCO also considers the use of off-balance sheet strategies, such as interest rate caps and floors and interest rate swaps, to help minimize the Company’s exposure to changes in interest rates. By using derivative financial instruments to hedge exposures to changes in interest rates we are exposed to credit risk and market risk. Credit risk is the failure of the counterparty to perform under the terms of the derivative contract. When the fair value of a derivative contract is positive, the counterparty owes us, creating credit risk. We minimize credit risk in derivative instruments by entering into transactions only with high-quality counterparties. The market risk associated with interest-rate contracts is managed by establishing and monitoring parameters that limit the types and degree of market risk that may be undertaken.
The ALCO is responsible for ensuring that our Board of Directors receives accurate information regarding our interest rate risk position at least quarterly. The investment advisory firm and ALCO consultant meet collectively with the board and Management-level ALCOs on a quarterly basis. During these meetings the ALCO consultant reviews our current position and discusses future strategies, as well as reviewing the result of rate shocks of its balance sheet and a variety of other analyses. The investment advisor reports on the overall performance of the portfolio and performs modeling of the cash flow, effective duration, and yield characteristics of the portfolio under various interest rate scenarios; and also reviews and provides detail on individual holdings in the portfolio.
The ALCO consultant’s most recent review was as of December 31, 2012. The consultant ran a base simulation assuming no changes in rates as well as a 200 basis point rising and, because rates continue to be very low, a 100 basis point falling interest rate scenario that assumes a parallel and pro rata shift of the yield curve over a one-year period, and no growth assumptions. Additionally, the consultant ran a 400 basis point rising simulation that assumed a parallel shift of the curve over 24 months, a 500 basis point rising
simulation which assumed the curve flattened over a 24 month time frame, and a 500 basis point rising simulation which assumed the increase in rates was delayed by two years. A summary of the results is as follows:
Current/Flat Rates: Net interest income levels are projected to trend downward throughout the simulation as the sustained low rate environment causes continued margin pressures as assets continue to reprice and are replaced at lower rates than the existing portfolio, while funding costs are at or near their floors.
Falling Rates: If rates fall 100 basis points our net interest income is projected to trend downward and below that of the current rate scenario as another round of falling rates would drive asset yields even lower while funding costs would drop to near zero.
Rising Rates: Higher rates are better for us under all scenarios as our low cost deposits are worth more to us when they can be invested at higher rates. In the up 200 basis points scenario, net interest income is projected to move up quickly as asset yields reprice up more quickly than funding costs and asset cash flows are reinvested at higher rates. If rates remain at current low levels for another two years, the benefit of rising rates is muted because the starting point for asset yields will be much lower.
We have established a target range for the change in net interest income in year one of zero to 7.5%. The net interest income simulation as of December 31, 2012 showed that the change in net interest income for the next 12 months from our expected or “most likely” forecast was as follows:
| |
Rate Change | Percent Change in Net Interest Income |
Up 200 basis points | 3.47 | % |
Down 100 basis points | (1.04) | % |
The change in net interest income in the second year of the simulation shows a much more pronounced downward trend in the flat and down 100 basis points scenarios, the projected change is (6.94)% and (13.13)%, respectively, while the up 200 basis points simulation produces an increase of 4.16%. The degree to which this exposure materializes will depend, in part, on our ability to manage our balance sheet as interest rates rise or fall.
Actual results may differ materially from those projected. The analysis assumes a static balance sheet. All rate changes are ramped over a 12 month time horizon based upon a parallel yield curve shift. In the down 100 basis points scenario, Federal funds and Treasury yields are floored at 0.01% while Prime is floored at 3.00%. All other market rates (e.g. LIBOR, FHLB) are floored at 0.25% to reflect credit spreads. The model used to perform the balance sheet simulation assumes a parallel shift of the yield curve over 12 months and reprices every interest-bearing asset and liability on our balance sheet. The model uses contractual repricing dates for variable products, contractual maturities for fixed rate products, and product-specific assumptions for deposits which are subject to repricing based on current market conditions. Investment securities with call provisions are examined on an individual basis in each rate environment to estimate the likelihood of a call. The model also assumes that the rate at which certain mortgage related assets prepay will vary as rates rise and fall, based on prepayment estimates derived from the Loan Processing System Applied Analytics model.
The preceding sensitivity analysis does not represent our forecast and should not be relied upon as being indicative of expected operating results. These estimates are based upon numerous assumptions including without limitation: the nature and timing of interest rate levels including yield curve shape, prepayments on loans and securities, deposit run-off rates, pricing decisions on loans and deposits and reinvestment/replacement of asset and liability cash flows, among others. While assumptions are developed based upon current economic and local market conditions, we cannot make any assurances as to the predictive nature of these assumptions including how customer preferences or competitor influences might change. As market conditions vary from those assumed in the sensitivity analysis, actual results will likely differ due to: the varying impact of changes in the balances and mix of loans and deposits differing from those assumed, the impact of possible off balance sheet hedging strategies, and other internal/external variables. Furthermore, the sensitivity analysis does not reflect all actions that the ALCO might take in responding to or anticipating changes in interest rates.
The most significant ongoing factor affecting market risk exposure of net interest income during the year ended December 31, 2012 was the sustained low interest rate environment. Net interest income exposure is also significantly affected by the shape and level of the U.S. Government securities and interest rate swap yield curves, and changes in the size and composition of the loan, investment and deposit portfolios. During 2012, the two year Treasury note remained flat at 25 basis points and the ten year Treasury note decreased by 11 basis points to 178 basis points. The spread between the two year and the ten year Treasury notes at December 31, 2012 was 153 basis points, compared to 164 basis points at December 31, 2011.
Credit Risk
The Board of Directors reviews and approves our loan policy on an annual basis. Among other things, the loan policy establishes restrictions regarding the types of loans that may be granted, and the distribution of loan types within our portfolio. Our Board of Directors grants each loan officer the authority to originate loans on our behalf, subject to certain limitations. These authorized lending limits are reviewed at least annually and are based upon the lender’s knowledge and experience. Loan requests that exceed a lender’s authority require the signature of our Credit Division Manager, Senior Loan Officer, and/or President. All extensions of credit of $4.0
million or greater to any one borrower or related party interest are reviewed and approved by the Loan Committee of our Board of Directors. Our loan portfolio is continuously monitored for performance, creditworthiness and strength of documentation through the use of a variety of management reports and the assistance of an external loan review firm. Credit ratings are assigned to commercial loans and are routinely reviewed. Loan officers, under the supervision of the Senior Lender and Senior Credit Officer, take remedial actions to assure full and timely payment of loan balances when necessary. Our policy is to discontinue the accrual of interest on loans when scheduled payments become contractually past due 90 or more days and the ultimate collectability of principal or interest become doubtful. In certain instances the accrual of interest is discontinued prior to 90 days past due if Management determines that the borrower will not be able to continue making timely payments.
ITEM 8 – FINANCIAL STATEMENTS AND SUPPLEMENTARY DATA
Merchants Bancshares, Inc.
Consolidated Balance Sheets
| | | | |
| | | | |
| December 31, | December 31, |
(In thousands except share and per share data) | 2012 | 2011 |
ASSETS | | | | |
Cash and due from banks | $ | 34,547 | $ | 10,392 |
Interest earning deposits with banks and other short-term investments | | 42,681 | | 27,420 |
Total cash and cash equivalents | | 77,228 | | 37,812 |
Investments: | | | | |
Securities available for sale, at fair value | | 508,681 | | 511,751 |
Securities held to maturity (fair value of $454 and $624) | | 407 | | 558 |
Total investments | | 509,088 | | 512,309 |
Loans | | 1,082,923 | | 1,027,626 |
Less: Allowance for loan losses | | 11,562 | | 10,619 |
Net loans | | 1,071,361 | | 1,017,007 |
Federal Home Loan Bank stock | | 8,145 | | 8,630 |
Bank premises and equipment, net | | 16,077 | | 14,232 |
Investment in real estate limited partnerships | | 5,423 | | 5,189 |
Other assets | | 21,228 | | 16,690 |
Total assets | $ | 1,708,550 | $ | 1,611,869 |
LIABILITIES | | | | |
Deposits: | | | | |
Demand (noninterest bearing) | $ | 240,491 | $ | 197,522 |
Savings, interest bearing checking and money market accounts | | 700,191 | | 632,110 |
Time deposits $100 thousand and greater | | 123,371 | | 127,303 |
Other time deposits | | 207,027 | | 220,945 |
Total deposits | | 1,271,080 | | 1,177,880 |
Securities sold under agreements to repurchase | | 287,520 | | 262,527 |
Other long-term debt | | 2,483 | | 22,562 |
Junior subordinated debentures issued to unconsolidated subsidiary trust | | 20,619 | | 20,619 |
Other liabilities | | 8,627 | | 18,744 |
Total liabilities | | 1,590,329 | | 1,502,332 |
Commitments and contingencies (Note 15) | | | | |
SHAREHOLDERS' EQUITY | | | | |
Preferred stock | | | | |
Class A non-voting shares authorized - 200,000, none outstanding | | 0 | | 0 |
Class B voting shares authorized - 1,500,000, none outstanding | | 0 | | 0 |
Common stock, $.01 par value | | 67 | | 67 |
Authorized 10,000,000 shares; issued 6,651,760 at December 31, 2012 and December 31, 2011 | | | | |
Outstanding: 5,957,870 at December 31, 2012 and 5,907,080 at December 31, 2011 | | | | |
Capital in excess of par value | | 36,742 | | 36,544 |
Retained earnings | | 87,580 | | 79,393 |
Treasury stock, at cost: 693,890 shares at December 31, 2012 and 744,680 shares
at December 31, 2011 | | (14,786) | | (15,817) |
Deferred compensation arrangements | | 6,403 | | 6,248 |
Accumulated other comprehensive income | | 2,215 | | 3,102 |
Total shareholders' equity | | 118,221 | | 109,537 |
Total liabilities and shareholders' equity | $ | 1,708,550 | $ | 1,611,869 |
| | | | |
See accompanying notes to consolidated financial statements |
Merchants Bancshares, Inc.
Consolidated Statements of Income
| | | | | | |
| | | | | | |
| Years Ended December 31, |
(In thousands except per share data) | 2012 | 2011 | 2010 |
INTEREST AND DIVIDEND INCOME | | | | | | |
Interest and fees on loans | $ | 44,977 | $ | 45,271 | $ | 46,041 |
Investment income: | | | | | | |
Interest and dividends on investment securities | | 11,834 | | 12,644 | | 14,140 |
Interest on interest earning deposits with banks and other short-term investments | | 46 | | 103 | | 81 |
Total interest and dividend income | | 56,857 | | 58,018 | | 60,262 |
INTEREST EXPENSE | | | | | | |
Savings, interest bearing checking and money market accounts | | 776 | | 1,167 | | 1,461 |
Time deposits $100 thousand and greater | | 1,025 | | 1,135 | | 1,292 |
Other time deposits | | 1,750 | | 2,172 | | 2,861 |
Securities sold under agreement to repurchase and other short-term debt | | 1,790 | | 2,065 | | 1,623 |
Long-term debt | | 1,542 | | 2,105 | | 3,870 |
Total interest expense | | 6,883 | | 8,644 | | 11,107 |
Net interest income | | 49,974 | | 49,374 | | 49,155 |
Provision (credit) for credit losses | | 950 | | 750 | | (1,750) |
Net interest income after provision for credit losses | | 49,024 | | 48,624 | | 50,905 |
NONINTEREST INCOME | | | | | | |
Changes in fair value on impaired securities | | 0 | | (65) | | 329 |
Non-credit related (gain) losses on securities not expected to be sold (recognized in other comprehensive income) | | 0 | | 10 | | (498) |
Net impairment losses | | 0 | | (55) | | (169) |
Net gains on investment securities | | 507 | | 1,049 | | 2,082 |
Trust division income | | 2,685 | | 2,516 | | 2,163 |
Service charges on deposits | | 4,078 | | 4,298 | | 4,929 |
Equity in losses of real estate limited partnerships | | (1,516) | | (1,766) | | (1,672) |
Gain on sale of other assets | | 1,083 | | 0 | | 0 |
Other | | 4,644 | | 4,338 | | 4,298 |
Total noninterest income | | 11,481 | | 10,380 | | 11,631 |
NONINTEREST EXPENSE | | | | | | |
Compensation and benefits | | 19,582 | | 20,517 | | 20,499 |
Occupancy expense | | 3,826 | | 3,824 | | 3,703 |
Equipment expense | | 3,626 | | 3,366 | | 2,932 |
Legal and professional fees | | 2,545 | | 2,811 | | 2,443 |
Marketing | | 1,841 | | 1,733 | | 1,505 |
State franchise taxes | | 1,295 | | 1,265 | | 1,151 |
FDIC insurance | | 866 | | 936 | | 1,415 |
Prepayment penalty on long-term debt | | 1,363 | | 861 | | 3,071 |
Other Real Estate Owned ("OREO") expenses | | 197 | | 193 | | (298) |
Other | | 6,193 | | 5,754 | | 6,006 |
Total noninterest expense | | 41,334 | | 41,260 | | 42,427 |
Income before provision for income taxes | | 19,171 | | 17,744 | | 20,109 |
Provision for income taxes | | 3,977 | | 3,124 | | 4,648 |
NET INCOME | $ | 15,194 | $ | 14,620 | $ | 15,461 |
| | | | | | |
Basic earnings per common share | $ | 2.43 | $ | 2.35 | $ | 2.51 |
Diluted earnings per common share | $ | 2.42 | $ | 2.35 | $ | 2.51 |
| | | | | | |
See accompanying notes to consolidated financial statements | | |
Merchants Bancshares, Inc.
Consolidated Statements of Comprehensive Income
| | | | | | |
| | | | | | |
| |
| Year Ended December 31, |
(In thousands) | 2012 | 2011 | 2010 |
Net income | $ | 15,194 | $ | 14,620 | $ | 15,461 |
Other comprehensive (loss) income, net of tax: | | | | | | |
Change in net unrealized (loss) gain on securities available for sale, net of taxes of $(181), $1,394 and $300 | | (336) | | 2,590 | | 558 |
Reclassification adjustments for net securities gain included in net income, net of taxes of $(178), $(348) and $(729) | | (329) | | (646) | | (1,354) |
Change in net unrealized loss on interest rate swaps, net of taxes of $122, $(66) and $(197) | | 226 | | (123) | | (366) |
Pension liability adjustment, net of taxes of $(241), $(213) and $93 | | (448) | | (396) | | 172 |
Other comprehensive (loss) income | | (887) | | 1,425 | | (990) |
Comprehensive income | $ | 14,307 | $ | 16,045 | $ | 14,471 |
| | | | | | |
See accompanying notes to consolidated financial statements |
Merchants Bancshares, Inc.
Consolidated Statements of Changes in Shareholders' Equity
For the Years Ended December 31, 2012, 2011, and 2010
| | | | | | | | | | | | | | |
| | | | | | | | | | | | | | |
| | | | | | | | | | | Accumulated | | |
| | | Capital in | | | | | Deferred | Other | | |
| Common | Excess of | Retained | Treasury | Compensation | Comprehensive | | |
(In thousands except per share data) | Stock | Par Value | Earnings | Stock | Arrangements | Income (loss) | Total |
Balance at December 31, 2009 | $ | 67 | $ | 36,278 | $ | 63,165 | $ | (17,798) | $ | 6,246 | $ | 2,667 | $ | 90,625 |
Net income | | 0 | | 0 | | 15,461 | | 0 | | 0 | | 0 | | 15,461 |
Dividends paid ($1.12 per share) | | 0 | | 0 | | (6,901) | | 0 | | 0 | | 0 | | (6,901) |
Sale of treasury stock | | 0 | | 0 | | 0 | | 10 | | 0 | | 0 | | 10 |
Distribution of stock under deferred compensation arrangements | | 0 | | 0 | | 0 | | 455 | | (455) | | 0 | | 0 |
Shares issued under stock plans, net of excess tax benefit | | 0 | | (7) | | 0 | | 63 | | 207 | | 0 | | 263 |
Share based compensation expense | | 0 | | 101 | | 0 | | 0 | | 0 | | 0 | | 101 |
Dividend reinvestment plan | | 0 | | (24) | | 0 | | 434 | | 352 | | 0 | | 762 |
Other comprehensive income | | 0 | | 0 | | 0 | | 0 | | 0 | | (990) | | (990) |
Balance at December 31, 2010 | $ | 67 | $ | 36,348 | $ | 71,725 | $ | (16,836) | $ | 6,350 | $ | 1,677 | $ | 99,331 |
Net income | | 0 | | 0 | | 14,620 | | 0 | | 0 | | 0 | | 14,620 |
Dividends paid ($1.12 per share) | | 0 | | 0 | | (6,952) | | 0 | | 0 | | 0 | | (6,952) |
Sale of treasury stock | | 0 | | 1 | | 0 | | 13 | | 0 | | 0 | | 14 |
Distribution of stock under deferred compensation arrangements | | 0 | | 0 | | 0 | | 432 | | (432) | | 0 | | 0 |
Shares issued under stock plans, net of excess tax benefit | | 0 | | 19 | | 0 | | 273 | | (76) | | 0 | | 216 |
Share based compensation expense | | 0 | | 110 | | 0 | | 0 | | 54 | | 0 | | 164 |
Dividend reinvestment plan | | 0 | | 66 | | 0 | | 301 | | 352 | | 0 | | 719 |
Other comprehensive loss | | 0 | | 0 | | 0 | | 0 | | 0 | | 1,425 | | 1,425 |
Balance at December 31, 2011 | $ | 67 | $ | 36,544 | $ | 79,393 | $ | (15,817) | $ | 6,248 | $ | 3,102 | $ | 109,537 |
Net income | | 0 | | 0 | | 15,194 | | 0 | | 0 | | 0 | | 15,194 |
Dividends paid ($1.12 per share) | | 0 | | 0 | | (7,007) | | 0 | | 0 | | 0 | | (7,007) |
Sale of treasury stock | | 0 | | 2 | | 0 | | 16 | | 0 | | 0 | | 18 |
Distribution of stock under deferred compensation arrangements | | 0 | | 0 | | 0 | | 386 | | (386) | | 0 | | 0 |
Shares issued under stock plans, net of excess tax benefit | | 0 | | 41 | | 0 | | 380 | | 90 | | 0 | | 511 |
Share based compensation expense | | 0 | | 72 | | 0 | | 0 | | 100 | | 0 | | 172 |
Dividend reinvestment plan | | 0 | | 83 | | 0 | | 249 | | 351 | | 0 | | 683 |
Other comprehensive income | | 0 | | 0 | | 0 | | 0 | | 0 | | (887) | | (887) |
Balance at December 31, 2012 | $ | 67 | $ | 36,742 | $ | 87,580 | $ | (14,786) | $ | 6,403 | $ | 2,215 | $ | 118,221 |
| | | | | | | | | | | | | | |
| | | | | | | | | | | | | | |
See accompanying notes to consolidated financial statements |
Merchants Bancshares, Inc.
Consolidated Statements of Cash Flows
| | | | | | |
| | | | | | |
| Year Ended December 31, |
(In thousands) | 2012 | 2011 | 2010 |
CASH FLOWS FROM OPERATING ACTIVITIES: | | | | | | |
Net income | $ | 15,194 | $ | 14,620 | $ | 15,461 |
Adjustments to reconcile net income to net cash provided by operating activities: | | | | | | |
Provision (credit) for loan losses | | 950 | | 750 | | (1,750) |
Deferred tax expense (benefit) | | 772 | | (1,337) | | 205 |
Depreciation and amortization | | 1,948 | | 1,891 | | 1,700 |
Amortization of investment security premiums and accretion of discounts, net | | 2,330 | | 3,858 | | 4,827 |
Stock option expense | | 172 | | 164 | | 101 |
Contribution to pension plan | | (5,000) | | 0 | | 0 |
Net gains on sales of investment securities | | (507) | | (1,049) | | (2,082) |
Other-than-temporary impairment losses on investment securities | | 0 | | 55 | | 169 |
Net gains on sale of loans | | 0 | | (25) | | (12) |
Net (gains) losses on sale of premises, equipment and other assets | | (1,040) | | 119 | | 23 |
Gains on sale of other real estate owned | | (7) | | (50) | | (537) |
Equity in losses of real estate limited partnerships, net | | 1,516 | | 1,766 | | 1,672 |
Changes in assets and liabilities: | | | | | | |
Net change in interest receivable | | 753 | | (129) | | (211) |
Net change in other assets | | (2,333) | | 2,130 | | (877) |
Net change in interest payable | | 2,196 | | (96) | | (467) |
Net change in other liabilities | | (11,282) | | 8,726 | | (5,888) |
Net cash provided by operating activities | | 5,662 | | 31,393 | | 12,334 |
CASH FLOWS FROM INVESTING ACTIVITIES: | | | | | | |
Proceeds from sales of investment securities available for sale | | 129,936 | | 131,858 | | 58,477 |
Proceeds from maturities of investment securities available for sale | | 186,540 | | 181,385 | | 245,890 |
Proceeds from maturities of investment securities held to maturity | | 151 | | 236 | | 365 |
Proceeds from redemption of Federal Home Loan Bank stock | | 485 | | 0 | | 0 |
Purchases of investment securities available for sale | | (316,251) | | (358,906) | | (366,816) |
Loan originations (in excess of) less than principal payments | | (55,428) | | (117,536) | | 7,467 |
Proceeds from sales of loans, net | | 0 | | 80 | | 290 |
Proceeds from sale of other assets | | 334 | | 0 | | 0 |
Proceeds from sale of premises and equipment | | 788 | | 52 | | 4 |
Proceeds from sales of other real estate owned | | 505 | | 380 | | 1,801 |
Real estate limited partnership investments | | (1,750) | | (1,702) | | (1,705) |
Purchases of bank premises and equipment | | (3,877) | | (1,929) | | (3,001) |
Net cash used in investing activities | | (58,567) | | (166,082) | | (57,228) |
CASH FLOWS FROM FINANCING ACTIVITIES: | | | | | | |
Net increase in deposits | | 93,200 | | 85,684 | | 48,877 |
Net (decrease) increase in short-term borrowings | | 0 | | (2,964) | | 1,561 |
Net increase in securities sold under agreement to repurchase, short-term | | 24,993 | | 37,834 | | 46,378 |
Net decrease in securities sold under agreement to repurchase, long-term | | 0 | | (7,500) | | (46,500) |
Principal payments on long-term debt | | (20,079) | | (8,577) | | (76) |
Cash dividends paid | | (6,324) | | (6,233) | | (6,139) |
Sale of treasury stock | | 18 | | 14 | | 10 |
Increase in deferred compensation arrangements | | 213 | | 216 | | 202 |
Proceeds from exercise of stock options, net of withholding taxes | | 280 | | 0 | | 59 |
Tax benefit from exercise of stock options | | 20 | | 1 | | 2 |
Net cash provided by financing activities | | 92,321 | | 98,475 | | 44,374 |
Increase (decrease) in cash and cash equivalents | | 39,416 | | (36,214) | | (520) |
Cash and cash equivalents beginning of period | | 37,812 | | 74,026 | | 74,546 |
Cash and cash equivalents end of period | $ | 77,228 | $ | 37,812 | $ | 74,026 |
| | | | | | |
SUPPLEMENTAL DISCLOSURE OF CASH FLOW INFORMATION: | | | | | | |
Total interest payments | $ | 4,687 | $ | 8,739 | $ | 11,575 |
Total income tax payments | | 5,950 | | 1,950 | | 8,400 |
SUPPLEMENTAL DISCLOSURE OF NON-CASH INVESTING AND FINANCING ACTIVITIES | | | | | | |
Distribution of stock under deferred compensation arrangements | $ | 391 | $ | 432 | $ | 455 |
Distribution of treasury stock in lieu of cash dividend | | 683 | | 719 | | 762 |
Non-cash exercise of stock options | | 130 | | 124 | | 0 |
Transfer of loans to other real estate owned | | 140 | | 497 | | 800 |
(Decrease) increase in payable for investments purchased | | (9,461) | | 9,461 | | (3,000) |
| | | | | | |
See accompanying notes to consolidated financial statements |
Merchants Bancshares, Inc.
Notes to Consolidated Financial Statements
December 31, 2012, 2011 and 2010
NOTE 1: SUMMARY OF SIGNIFICANT ACCOUNTING POLICIES
Principles of Consolidation
The accompanying consolidated financial statements include the accounts of Merchants Bancshares, Inc., and its wholly-owned subsidiary Merchants Bank (collectively “Merchants”, “we,” “us, “our”). All material intercompany accounts and transactions are eliminated in consolidation. We offer a full range of deposit, loan, cash management, and trust services to meet the financial needs of individual consumers, businesses and municipalities at 33 full-service banking offices throughout the state of Vermont as of December 31, 2012.
Management’s Use of Estimates in Preparation of Financial Statements
The preparation of financial statements in conformity with accounting principles generally accepted in the United States of America requires Management to make estimates and assumptions that affect the reported amounts of assets and liabilities and disclosure of contingent assets and liabilities at the date of the financial statements, and the reported amounts of income and expenses during the reporting periods. The most significant estimates include those used in determining the allowance for loan losses, income taxes, interest income recognition on loans and investments and analysis of other-than-temporary impairment of our investment securities portfolio. Operating results in the future may vary from the amounts derived from Management's estimates and assumptions.
Cash and Cash Equivalents
Cash and cash equivalents consist of cash on hand, amounts due from banks, Federal Funds sold and other short-term investments, with maturities at time of purchase of less than 90 days, in the accompanying consolidated statements of cash flows.
Investment Securities
We classify certain of our investments in debt securities as held to maturity, which are carried at amortized cost, if we have the positive intent and ability to hold such securities to maturity. Investments in debt securities that are not classified as held to maturity and equity securities that have readily determinable fair values are classified as available for sale securities or trading securities. Available for sale securities are investments not classified as trading or held to maturity. Available for sale securities are carried at fair value which is measured at each reporting date. The resulting unrealized gain or loss is reflected in accumulated other comprehensive income (loss) net of the associated tax effects. Gains and losses on sales of investment securities are recognized through the statement of income using the specific identification method.
Transfers from securities available for sale to securities held to maturity are recorded at the securities’ fair values on the date of the transfer. Any net unrealized gains or losses continue to be included as a separate component of accumulated other comprehensive income (loss), on a net of tax basis. As long as the securities are carried in the held to maturity portfolio, such amounts are amortized (accreted) over the estimated remaining life of the transferred securities as an adjustment to yield in a manner consistent with the amortization of premiums and discounts.
Interest and dividend income, including amortization of premiums and discounts, are recorded in earnings for all categories of investment securities. Discounts and premiums related to debt securities are amortized using the level-yield method.
Management reviews reductions in fair value below book value of investment securities to determine whether the impairment is other than temporary. When an other-than-temporary impairment (“OTTI”) has occurred, the amount of OTTI recognized in earnings depends on whether we intend to sell the security or more likely than not will be required to sell the security before recovery of its amortized cost basis less any current period credit loss. To determine whether an impairment is other-than-temporary, we consider all available information relevant to the collectability of the security, including past events, current conditions, and reasonable and supportable forecasts when developing estimates of cash flows expected to be collected. Evidence considered in this assessment includes the reasons for the impairment, the severity and duration of the impairment, changes in value subsequent to year-end, forecasted performance of the investee, and the general market condition in the geographic area or industry the investee operates in.
If we intend to sell the security, or more likely than not will be required to sell the security, before recovery of its amortized cost basis less any current period credit loss, the OTTI is recognized in earnings equal to the entire difference between the investment’s amortized cost basis and its fair value at the balance sheet date. If we do not intend to sell the security and it is not more likely than not that we will be required to sell the security before recovery of its amortized cost basis less any current period credit loss, the OTTI is separated into the amount representing the credit loss and the amount related to all other factors. The amount of the total OTTI related to the credit loss is recognized in earnings. The amount of the total OTTI related to other factors is recognized in other comprehensive income, net of applicable income taxes.
Federal Home Loan Bank System
We are a member of the Federal Home Loan Bank System, which consists of 12 regional Federal Home Loan Banks. The Federal Home Loan Bank of Boston (“FHLBB”) provides a central credit facility primarily for member institutions. Member institutions are
required to acquire and hold shares of capital stock in the FHLBB in an amount at least equal to the sum of 0.35% of the aggregate principal amount of its unpaid residential mortgage loans and similar obligations at the beginning of each year. We were in compliance with this requirement at December 31, 2012.
Loans
Loans are carried at the principal amounts outstanding net of the allowance for loan losses, and net of deferred loan costs and fees. Deferred loan costs and fees are amortized over the estimated lives of the loans using the interest method.
Allowance for Credit Losses
The Allowance for Credit Losses (“Allowance”) is comprised of the Allowance for Loan Losses and the Reserve for Undisbursed Lines of Credit, and is based on Management’s estimate of the amount required to reflect the known and inherent losses in the loan portfolio. Factors considered in evaluating the adequacy of the Allowance include previous loss experience, the size and composition of the portfolio, risk rating composition, current economic and real estate market conditions and their effect on the borrowers, the performance of individual loans in relation to contractual terms and estimated fair values of properties that secure impaired loans.
The adequacy of the Allowance is determined using a consistent, systematic methodology, consisting of a review of both specific reserves for loans identified as impaired and general reserves for the various loan portfolio classifications. When a loan is impaired, we determine its impairment loss by comparing the excess, if any, of the loan’s carrying amount over (1) the present value of expected future cash flows discounted at the loan’s original effective interest rate, (2) the observable market price of the impaired loan, or (3) the fair value of the collateral securing a collateral-dependent loan. When a loan is deemed to have an impairment loss, the loan is either charged down to its estimated net realizable value, or a specific reserve is established as part of the overall allowance for loan losses if Management needs more time to evaluate all of the facts and circumstances relevant to that particular loan.
Income Recognition on Impaired and Nonaccrual Loans
Loans, including impaired loans, are generally classified as nonaccrual if they are past due as to maturity or payment of principal or interest for a period of more than 90 days. If a loan or a portion of a loan is internally classified as impaired or is partially charged-off, the loan is classified as nonaccrual. Loans that are on a current payment status or past due less than 90 days may also be classified as nonaccrual if repayment in full of principal and/or interest is in doubt. Income accruals are suspended on all nonaccruing loans, and all previously accrued and uncollected interest is charged against current income.
Loans may be returned to accrual status when there is a sustained period of repayment performance (generally a minimum of six months) by the borrower, in accordance with the contractual terms of the loans and all principal and interest amounts contractually due, including arrearages, are reasonably assured of repayment within an acceptable period of time.
While a loan is classified as nonaccrual and the future collectability of the recorded loan balance is uncertain, any payments received are generally applied to reduce the principal balance. When the future collectability of the recorded loan balance is expected, interest income may be recognized on a cash basis. In the case where a nonaccrual loan had been partially charged-off, recognition of interest on a cash basis is limited to that which would have been recognized on the recorded loan balance at the contractual interest rate. Interest collections in excess of that amount are recorded as a reduction of principal.
Troubled Debt Restructuring (“TDR”)
Loans are designated as a TDR when a concession is made on a credit as a result of financial difficulties of the borrower. Typically, such concessions consist of a reduction in interest rate to a below market rate, taking into account the credit quality of the note, or a deferment or reduction of payments, principal or interest, which alters the Bank’s position or significantly extends the note’s maturity date, such that the present value of cash flows to be received is less than those contractually established at the loan’s origination.
Premises and Equipment
Premises and equipment are stated at cost, less accumulated depreciation and amortization. Depreciation and amortization are provided using straight-line and accelerated methods at rates that depreciate the original cost of the premises and equipment over their estimated useful lives or the expected lease term in the case of leasehold improvements. Expenditures for maintenance, repairs and renewals of minor items are generally charged to expense as incurred. When premises and equipment are replaced, retired, or deemed no longer useful they are written down to estimated selling price less costs to sell by a charge to current earnings.
Income Taxes
Deferred tax assets and liabilities are reflected at currently enacted income tax rates applicable to the period in which the deferred tax assets or liabilities are expected to be realized or settled. As changes in tax laws or rates are enacted, deferred tax assets and liabilities are adjusted through the provision for income taxes. Low-income housing tax credits and historic rehabilitation credits are recognized as a reduction of income tax expense in the year in which they are earned. Penalties and/or interest were zero or immaterial for 2012, 2011 and 2010 and were classified as other noninterest expense in our consolidated statements of income. Our policy is to reduce deferred tax assets by a valuation allowance if, based on the weight of available evidence, it is more likely than not that some or all of the deferred tax assets will not be realized.
Investments in Real Estate Limited Partnerships
We have investments in various real estate limited partnerships that acquire, develop, own and operate low and moderate-income housing. Our ownership interest in these limited partnerships ranges from 3.3% to 99.9% as of December 31, 2012. We account for our investments in these limited partnerships, where we neither actively participate nor have a controlling interest, under the equity method of accounting.
Management periodically reviews the results of operations of the various real estate limited partnerships to determine if the partnerships generate sufficient operating cash flow to fund their current obligations. In addition, we review the current value of the underlying property compared to the outstanding debt obligations. If it is determined that the investment suffers from a permanent impairment, the carrying value is written down to the estimated realizable value. The maximum exposure on these investments is the current carrying amount plus amounts obligated to be funded in the future.
Other Real Estate Owned
Collateral acquired through foreclosure is recorded at the lower of cost or fair value, less estimated costs to sell, at the time of acquisition. Any cost in excess of the estimated fair value on the transfer date is charged to the allowance for loan losses. Subsequent decreases in the fair value of other real estate owned (“OREO”) are reflected as a write-down and charged to expense. Net operating income or expense related to foreclosed property is included in noninterest expense in the accompanying consolidated statements of income.
Repurchase Agreements
Repurchase agreements are accounted for as secured financing transactions since we maintain effective control over the transferred securities and the transfer meets the other criteria for such accounting. Obligations to repurchase securities sold are reflected as a liability in the consolidated balance sheets. The securities underlying the agreements are delivered to a custodial account for the benefit of the repurchase agreement holders. The repurchase agreement holders, who may sell, loan or otherwise dispose of such securities to other parties in the normal course of their operations, agree to resell to us the same securities at the maturities of the agreements.
Deferred Compensation Plans
The Merchants Bancshares, Inc. and Subsidiaries 2008 Compensation Plan for Non-Employee Directors and Trustees provides a compensation plan for our non-employee directors and our subsidiaries’ non-employee directors and trustees. Under the plan the total number of shares of common stock that may be subject to the granting of awards will equal 150,000 shares. Under the terms of these plans participating directors can elect to have all, or a specified percentage, of their director’s fees for a given year paid in the form of cash or deferred in the form of restricted shares of Merchants’ common stock. These shares are held in a rabbi trust and are considered outstanding for purposes of computing earnings per share. Directors who elect to have their compensation deferred are credited with a number of shares of Merchants’ common stock equal in value to the amount of fees.
Stock-Based Compensation
The Amended and Restated Merchants Bancshares, Inc. 2008 Stock Incentive Plan provides grants of up to 600,000 stock options or restricted stock awards to certain key employees. We recognize compensation expense for services received in a share-based payment transaction over the required service period, generally defined as the vesting period. The compensation cost is based on the grant-date fair value of the award (as determined by quoted market prices). Stock awards are granted at fair market value on the date of the grant and vest based on a three year service period.
The fair value of an option grant is estimated on the grant date using the Black-Scholes option-pricing model that requires us to develop estimates for assumptions used in the model. The Black-Scholes valuation model uses the following assumptions: expected volatility, expected term of option, risk-free interest rate and dividend yield. Expected volatility estimates are developed by us based on historical volatility of our stock. We use historical data to estimate the expected term of the options. The risk-free interest rate for periods within the expected life of the option is based on the U.S. Treasury yield in effect at the grant date.
Restricted stock provides grantees with rights to shares of common stock upon completion of the service period. During the service period, all shares are considered outstanding and dividends are paid on the restricted stock.
Employee Benefit Costs
Prior to 1995, we maintained a non-contributory pension plan covering substantially all employees that met eligibility requirements. The plan was curtailed in 1995. The cost of this plan, based on actuarial computations of current and future benefits, is charged to current operating expenses. We recognize the overfunded or underfunded status of a single employer defined benefit post retirement plan as an asset or liability on the consolidated balance sheets and recognize changes in the funded status in comprehensive income in the year in which the change occurred.
Earnings Per Share
Basic earnings per share are calculated by dividing net income available to common shareholders by the weighted average number of common shares outstanding. Diluted earnings per share are computed in a manner similar to that of basic earnings per share except that the weighted average number of common shares outstanding is increased to include the number of additional common shares that
would have been outstanding if all potentially dilutive common shares (such as stock options and unvested restricted stock awards) were issued during the period, computed using the treasury stock method. Shares held in rabbi trusts related to deferred compensation plans are considered outstanding for purposes of computing earnings per share.
Derivative Financial Instruments and Hedging Activities
Derivative instruments utilized by us include interest rate floor, cap and swap agreements. We are an end-user of derivative instruments and do not conduct trading activities for derivatives. We recognize our derivatives as either assets or liabilities in the balance sheet and measure those instruments at fair value. Changes in the fair value of the derivative financial instruments are reported as a component of other comprehensive income because they qualify for hedge accounting.
We formally document our hedging relationships and our risk-management objective and strategy for undertaking the hedge, the hedging instrument, the hedged item, the nature of the risk being hedged, how the hedging instrument’s effectiveness in offsetting the hedged risk will be assessed prospectively and retrospectively, and a description of the method of measuring ineffectiveness. We also formally assess, both at the hedge’s inception and on an ongoing basis, whether the derivatives that are used in hedging transactions are highly effective in offsetting cash flows of hedged items. Changes in the fair value of a derivative that is highly effective and that is designated and qualifies as a cash-flow hedge are recorded in accumulated other comprehensive income to the extent that the derivative is effective as a hedge, until earnings are affected by the variability in cash flows of the designated hedged item. The ineffective portion, if any, of the change in fair value of a derivative instrument that qualifies as a cash-flow hedge is reported in earnings.
Segment Reporting
Our operations are solely in the financial services industry and include providing to our customers traditional banking and other financial services. We operate primarily in the state of Vermont. Management makes operating decisions and assesses performance based on an ongoing review of our consolidated financial results. Therefore, we have a single operating segment for financial reporting purposes.
Fair Value Measurements
Fair value is an exit price, representing the amount that would be received to sell an asset or paid to transfer a liability in an orderly transaction between market participants and such fair value measurements are not adjusted for transaction costs. The fair value hierarchy prioritizes the inputs to valuation techniques used to measure fair value. The hierarchy gives the highest priority to unadjusted quoted prices in active markets for identical assets or liabilities (Level 1 measurement) and the lowest priority to unobservable inputs (Level 3 measurements). A financial instrument’s level within the fair value hierarchy is based on the lowest level of input that is significant to the fair value measurement.
The types of instruments valued based on quoted market prices in active markets include most U.S. government and Agency securities, liquid mortgage products, active listed equities and most money market securities. Such instruments are generally classified within Level 1 or Level 2 of the fair value hierarchy. We do not adjust the quoted price for such instruments.
The types of instruments valued based on quoted prices in markets that are not active, broker or dealer quotations, or alternative pricing sources with reasonable levels of price transparency include most investment-grade and high-yield corporate bonds, less liquid mortgage products, less liquid Agency securities, less liquid listed equities, state, municipal and provincial obligations, and certain physical commodities. Such instruments are generally classified within Level 2 of the fair value hierarchy.
Level 3 is for positions that are not traded in active markets or are subject to transfer restrictions; valuations are adjusted to reflect illiquidity and/or non-transferability, and such adjustments are generally based on available market evidence. In the absence of such evidence, Management’s best estimate will be used. Management’s best estimate consists of both internal and external support on certain Level 3 investments. Subsequent to inception, Management only changes Level 3 inputs and assumptions when corroborated by evidence such as transactions in similar instruments, completed or pending third-party transactions in the underlying investment or comparable entities, subsequent rounds of financing, recapitalizations and other transactions across the capital structure, offerings in the equity or debt markets, and changes in financial ratios or cash flows.
Reclassifications
Reclassifications are made to prior years’ consolidated financial statements whenever necessary to conform to the current year’s presentation.
NOTE 2: RECENT ACCOUNTING PRONOUNCEMENTS
In December 2011, the Financial Accounting Standards Board (“FASB”) issued Accounting Standards Update (“ASU”) 2011-11, “Balance Sheet (Topic 210) – Disclosures about Offsetting Assets and Liabilities.” The amendments in this ASU require an entity to disclose information about offsetting and related arrangements to enable users of its financial statements to understand the effect of those arrangements on its financial position. The amendments in this ASU affect all entities that have financial instruments and derivative instruments that are either (1) offset in accordance with either Section 210-20-45 or Section 815-10-45 or (2) subject to an
enforceable master netting arrangement or similar agreement. The requirements amend the disclosure requirements on offsetting in Section 210-20-50. An entity is required to apply the amendments for annual reporting periods beginning on or after January 1, 2013, and interim periods within those annual periods. An entity should provide the disclosures required by those amendments retrospectively for all comparative periods presented. We do not expect that this update will have a material impact on our financial condition or results of operations.
In June 2011, the FASB issued ASU 2011-05, “Comprehensive Income (Topic 220) - Presentation of Comprehensive Income.” ASU 2011-05 requires that all non-owner changes in stockholders’ equity be presented either in a single continuous statement of comprehensive income or in two separate but consecutive statements. In both choices, an entity is required to present each component of net income along with total net income, each component of other comprehensive income along with a total for other comprehensive income, and a total amount for comprehensive income. In December 2011, FASB issued ASU 2011-12, which deferred the effective date of the requirement in ASU 2011-05 to present items that are reclassified from accumulated other comprehensive income to net income alongside their respective components of net income and other comprehensive income. ASU 2011-05 was effective for us beginning January 1, 2012. Adoption of these updates did not have a material impact on our financial condition or results of operations.
In May 2011, the FASB issued ASU 2011-04, “Fair Value Measurement (Topic 820) - Amendments to Achieve Common Fair Value Measurement and Disclosure Requirements in U.S. GAAP and IFRSs.” The amendments in this ASU changed the wording used to describe the requirements in U.S. GAAP for measuring fair value and for disclosing information about fair value measurements. The amendments clarified the Board’s intent about the application of existing fair value measurement and disclosure requirements. The amendments in this ASU were to be applied prospectively. For public entities, the amendments were effective during interim and annual periods beginning after December 15, 2011. Adoption of this update did not have a material impact on our financial condition or results of operations.
NOTE 3: INVESTMENT SECURITIES
Investments in securities are classified as available for sale or held to maturity as of December 31, 2012 and 2011. The amortized cost and fair values of the securities classified as available for sale and held to maturity as of December 31, 2012 are as follows:
| | | | | | | | |
| | | | | | | | |
| | | Gross | Gross | | |
| Amortized | Unrealized | Unrealized | Fair |
(In thousands) | Cost | Gains | Losses | Value |
Available for Sale: | | | | | | | | |
U.S. Treasury Obligations | $ | 100 | $ | 0 | $ | 0 | $ | 100 |
U.S. Agency Obligations | | 10,956 | | 0 | | 59 | | 10,897 |
U.S. Government Sponsored Enterprises (“U.S. GSEs”) | | 58,731 | | 723 | | 88 | | 59,366 |
Federal Home Loan Bank ("FHLB") Obligations | | 24,546 | | 39 | | 0 | | 24,585 |
Residential Real Estate Mortgage-backed Securities ("Agency MBSs") | | 142,441 | | 6,326 | | 0 | | 148,767 |
Agency Commercial Mortgage Backed Securities ("Agency CMBSs") | | 5,087 | | 0 | | 58 | | 5,029 |
Agency Collateralized Mortgage Obligations ("Agency CMOs") | | 227,815 | | 2,922 | | 338 | | 230,399 |
Collateralized Loan Obligations ("CLOs") | | 24,748 | | 0 | | 221 | | 24,527 |
Non-agency Collateralized Mortgage Obligations ("Non-Agency CMOs”) Agency CMOs") | | 4,589 | | 6 | | 2 | | 4,593 |
Asset Backed Securities ("ABSs") | | 357 | | 61 | | 0 | | 418 |
Total Available for Sale | $ | 499,370 | $ | 10,077 | $ | 766 | $ | 508,681 |
Held to Maturity: | | | | | | | | |
Agency MBSs | $ | 407 | $ | 47 | $ | 0 | $ | 454 |
Total Held to Maturity | $ | 407 | $ | 47 | $ | 0 | $ | 454 |
The amortized cost and fair values of the securities classified as available for sale and held to maturity as of December 31, 2011 are as follows:
| | | | | | | | |
| | | | | | | | |
| | | Gross | Gross | | |
| Amortized | Unrealized | Unrealized | Fair |
(In thousands) | Cost | Gains | Losses | Value |
Available for Sale: | | | | | | | | |
U.S. Treasury Obligations | $ | 250 | $ | 0 | $ | 0 | $ | 250 |
U.S. GSEs | | 89,597 | | 828 | | 6 | | 90,419 |
FHLB Obligations | | 16,545 | | 134 | | 3 | | 16,676 |
Agency MBSs | | 176,756 | | 7,100 | | 18 | | 183,838 |
Agency CMOs | | 211,749 | | 2,976 | | 245 | | 214,480 |
Non-Agency CMOs | | 5,346 | | 2 | | 493 | | 4,855 |
ABSs | | 1,172 | | 61 | | 0 | | 1,233 |
Total Available for Sale | $ | 501,415 | $ | 11,101 | $ | 765 | $ | 511,751 |
Held to Maturity: | | | | | | | | |
Agency MBSs | $ | 558 | $ | 66 | $ | 0 | $ | 624 |
Total Held to Maturity | $ | 558 | $ | 66 | $ | 0 | $ | 624 |
The contractual final maturity distribution of the debt securities classified as available for sale and held to maturity as of December 31, 2012, are as follows:
| | | | | | | | | | |
| | | | | | | | | | |
| | | After One | After Five | | | | |
| Within | But Within | But Within | After Ten | | |
(In thousands) | One Year | Five Years | Ten Years | Years | Total |
Available for Sale (at fair value): | | | | | | | | | | |
U.S. Treasury Obligations | $ | 0 | $ | 100 | $ | 0 | $ | 0 | $ | 100 |
U.S. Agency Obligations | | 0 | | 0 | | 0 | | 10,897 | | 10,897 |
U.S. GSEs | | 0 | | 10,025 | | 49,341 | | 0 | | 59,366 |
FHLB Obligations | | 0 | | 0 | | 24,585 | | 0 | | 24,585 |
Agency MBSs | | 316 | | 3,387 | | 22,854 | | 122,210 | | 148,767 |
Agency CMBSs | | 0 | | 0 | | 5,029 | | 0 | | 5,029 |
Agency CMOs | | 0 | | 0 | | 4,139 | | 226,260 | | 230,399 |
CLOs | | 0 | | 0 | | 24,527 | | 0 | | 24,527 |
Non-Agency CMOs | | 0 | | 0 | | 0 | | 4,593 | | 4,593 |
ABSs | | 0 | | 0 | | 0 | | 418 | | 418 |
Total Available for Sale | $ | 316 | $ | 13,512 | $ | 130,475 | $ | 364,378 | $ | 508,681 |
Held to Maturity (at amortized cost): | | | | | | | | | | |
Agency MBSs | $ | 11 | $ | 73 | $ | 0 | $ | 323 | $ | 407 |
Total Held to Maturity | $ | 11 | $ | 73 | $ | 0 | $ | 323 | $ | 407 |
The contractual final maturity distribution of the debt securities classified as available for sale and held to maturity as of December 31, 2011, are as follows:
| | | | | | | | | | |
| | | | | | | | | | |
| | | After One | After Five | | | | |
| Within | But Within | But Within | After Ten | | |
(In thousands) | One Year | Five Years | Ten Years | Years | Total |
Available for Sale (at fair value): | | | | | | | | | | |
U.S. Treasury Obligations | $ | 250 | $ | 0 | $ | 0 | $ | 0 | $ | 250 |
U.S. GSEs | | 3,023 | | 12,567 | | 69,823 | | 5,006 | | 90,419 |
FHLB Obligations | | 3,389 | | 0 | | 13,287 | | 0 | | 16,676 |
Agency MBSs | | 20 | | 6,118 | | 32,897 | | 144,803 | | 183,838 |
Agency CMOs | | 0 | | 0 | | 3,056 | | 211,424 | | 214,480 |
Non-Agency CMOs | | 0 | | 0 | | 50 | | 4,805 | | 4,855 |
ABSs | | 0 | | 0 | | 0 | | 1,233 | | 1,233 |
Total Available for Sale | $ | 6,682 | $ | 18,685 | $ | 119,113 | $ | 367,271 | $ | 511,751 |
Held to Maturity (at amortized cost): | | | | | | | | | | |
Agency MBSs | $ | 0 | $ | 158 | $ | 0 | $ | 400 | $ | 558 |
Total Held to Maturity | $ | 0 | $ | 158 | $ | 0 | $ | 400 | $ | 558 |
Actual maturities will differ from contractual maturities because borrowers may have rights to call or prepay obligations. Maturities of Agency MBSs and Agency CMOs in the table above are based on final contractual maturities.
The following table presents the proceeds, gross gains and gross losses on available for sale securities.
| | | | | | |
| | | | | | |
(In thousands) | 2012 | 2011 | 2010 |
Proceeds | $ | 129,936 | $ | 131,858 | $ | 58,477 |
Gross gains | | 811 | | 1,188 | | 2,122 |
Gross losses | | (304) | | (139) | | (40) |
Net gains | $ | 507 | $ | 1,049 | $ | 2,082 |
Securities with a book value of $349.52 million and $299.36 million at December 31, 2012 and 2011, respectively, were pledged to secure U.S. Treasury borrowings, public deposits, securities sold under agreements to repurchase, and for other purposes required by law.
Gross unrealized losses on investment securities available for sale and the fair value of the related securities, aggregated by investment category and length of time that individual securities have been in continuous unrealized loss position, at December 31, 2012, were as follows:
| | | | | | | | | | | | |
| | | | | | | | | | | | |
| Less Than 12 Months | 12 Months or More | Total |
(In thousands) | Fair Value | Loss | Fair Value | Loss | | Fair Value | Loss |
As of December 31, 2012 | | | | | | | | | | | | |
U.S. Agency Obligations | $ | 10,897 | $ | 59 | $ | 0 | $ | 0 | $ | 10,897 | $ | 59 |
U.S. GSEs | | 9,882 | | 88 | | 0 | | 0 | | 9,882 | | 88 |
Agency CMBSs | | 5,029 | | 58 | | 0 | | 0 | | 5,029 | | 58 |
Agency CMOs | | 39,047 | | 338 | | 0 | | 0 | | 39,047 | | 338 |
CLOs | | 24,527 | | 221 | | 0 | | 0 | | 24,527 | | 221 |
Non-Agency CMOs | | 0 | | 0 | | 3,041 | | 2 | | 3,041 | | 2 |
| $ | 89,382 | $ | 764 | $ | 3,041 | $ | 2 | $ | 92,423 | $ | 766 |
Gross unrealized losses on investment securities available for sale and the fair value of the related securities, aggregated by investment category and length of time that individual securities have been in continuous unrealized loss position, at December 31, 2011, were as follows:
| | | | | | | | | | | | |
| | | | | | | | | | | | |
| Less Than 12 Months | 12 Months or More | Total |
(In thousands) | Fair Value | Loss | Fair Value | Loss | Fair Value | Loss |
As of December 31, 2011 | | | | | | | | | | | | |
U.S. GSEs | $ | 2,536 | $ | 6 | $ | 0 | $ | 0 | $ | 2,536 | $ | 6 |
FHLB Obligations | | 5,047 | | 3 | | 0 | | 0 | | 5,047 | | 3 |
Agency MBSs | | 10,452 | | 18 | | 0 | | 0 | | 10,452 | | 18 |
Agency CMOs | | 43,708 | | 205 | | 2,861 | | 40 | | 46,569 | | 245 |
Non-Agency CMOs | | 0 | | 0 | | 4,805 | | 493 | | 4,805 | | 493 |
| $ | 61,743 | $ | 232 | $ | 7,666 | $ | 533 | $ | 69,409 | $ | 765 |
There were no securities held to maturity with unrealized losses as of December 31, 2012 or 2011.
There were no securities classified as trading at December 31, 2012 and 2011.
Unrealized losses on investment securities result from the cost basis of the security being higher than its current fair value. These discrepancies generally occur because of changes in interest rates since the time of purchase, or because the credit quality of the issuer has deteriorated. We perform a quarterly analysis of each security in our portfolio to determine if impairment exists, and if it does, whether that impairment is other-than-temporary.
Agency MBSs and Agency CMOs consist of pools of residential mortgages which are guaranteed by the FNMA, FHLMC, or Government National Mortgage Association (“GNMA”) with various origination dates and maturities. Agency CMBS consists of bonds backed by commercial real estate which are guaranteed by FNMA. CLOs are floating rate securities that consist of pools of commercial loans structured to provide very strong over collateralization and subordination. All of our CLOs are the senior AAA tranche and are the first bond to get paid down. Non-Agency CMOs are tracked individually with updates on the performance of the underlying collateral and stress testing performed and reviewed monthly. Additionally, we monitor individual bonds that experience greater levels prepayment or market volatility.
We use an external pricing service to obtain fair market values for our investment portfolio. We have obtained and reviewed the service provider’s pricing and reference data document. Evaluations are based on market data and vary by asset class and incorporate available trade, bid and other market information. Because many fixed income securities do not trade on a daily basis, the service provider’s evaluated pricing applications apply available information as applicable through processes such as benchmark curves, benchmarking of like securities, sector groupings, and matrix pricing, to prepare evaluations. In addition, model processes, such as the Option Adjusted Spread model are used to assess interest rate impact and develop prepayment scenarios. We periodically test the values provided to us by the pricing service through a combination of back testing on actual sales of securities and by obtaining prices on all bonds from an alternative pricing source.
We have two non-Agency CMOs with a current book value of $4.59 million. Management, with the help of outside experts, has performed impairment analyses on these bonds. One of the non-Agency CMOs, with a cost basis of $3.04 million and a fair value of $3.04 million at December 31, 2012, is rated BB by Fitch and Ba2 by Moody’s. Delinquencies have been fairly low and prepayment speeds for the bond during 2012 have been rapid leading to increased credit support. We own a senior tranche in this bond. Although losses are expected in the bond overall, our position in the structure of the bond is expected to protect us from realizing losses. The second bond has a cost basis of $1.55 million and a fair value of $1.55 million. This bond is rated CC by Fitch and CCC by S&P. We own a super senior tranche in this bond. Although losses are expected in the bond overall, our super senior position in the structure is expected to protect us from realizing losses.
We do not intend to sell the investment securities that are in an unrealized loss position, and it is unlikely that we will be required to sell the investment securities before recovery of their amortized cost bases, which may be maturity.
As a member of the FHLB system, we are required to invest in stock of the FHLBB in an amount determined based on our borrowings from the FHLBB. At December 31, 2012, our investment in FHLBB stock totaled $8.15 million. We received and recorded dividend income totaling $45 thousand and $32 thousand during the 2012 and 2011, respectively. We received no dividend income on FHLBB stock during 2010.
NOTE 4: LOANS AND THE ALLOWANCE FOR CREDIT LOSSES
Loans
The composition of our loan portfolio at December 31, 2012 and 2011 was as follows:
| | | | |
| | | | |
(In thousands) | December 31, 2012 | December 31, 2011 |
Commercial, financial and agricultural | $ | 165,023 | $ | 146,990 |
Municipal loans | | 84,689 | | 101,705 |
Real estate loans – residential | | 489,951 | | 439,818 |
Real estate loans – commercial | | 327,622 | | 313,915 |
Real estate loans – construction | | 10,561 | | 18,993 |
Installment loans | | 4,701 | | 5,806 |
All other loans | | 376 | | 399 |
Total loans | $ | 1,082,923 | $ | 1,027,626 |
We primarily originate residential real estate, commercial, commercial real estate, municipal obligations and installment loans to customers throughout the state of Vermont. There are no significant industry concentrations in the loan portfolio. Loans totaled $1.08 billion and $1.03 billion at December 31, 2012 and 2011, respectively. Total loans included $(250) thousand and $11 thousand of net deferred loan origination fees at December 31, 2012 and December 31, 2011, respectively. The aggregate amount of overdrawn deposit balances classified as loan balances was $376 thousand and $399 thousand at December 31, 2012 and 2011, respectively.
Allowance for Credit Losses
We have divided the loan portfolio into portfolio segments, each with different risk characteristics and methodologies for assessing risk. Each portfolio segment is broken down into class segments where appropriate. Class segments contain unique measurement attributes, risk characteristics and methods for monitoring and assessing risk that are necessary to develop the allowance for loan and lease losses. Unique characteristics such as borrower type, loan type, collateral type, and risk characteristics define each class segment. A description of the segments follows:
Commercial, financial and agricultural: We offer a variety of loan options to meet the specific needs of commercial customers including term loans and lines of credit. Such loans are made available to businesses for working capital such as inventory and receivables, business expansion and equipment purchases. Generally, a collateral lien is placed on equipment, receivables, inventory or other assets owned by the borrower. These loans carry a higher risk than commercial real estate loans by the nature of the underlying collateral, and the collateral value may change daily. To reduce the risk, management generally employs enhanced monitoring requirements, obtains personal guarantees and, where appropriate, may also attempt to secure real estate as collateral.
Municipal: Municipal loans primarily consist of shorter term loans issued on a tax-exempt basis which are considered general obligations of the municipality. These loans are generally viewed as lower risk and self-liquidating as Vermont statutes mandate that a municipality utilize its taxing power to meet its financial obligations. To a lesser extent, we also made longer term loans under the federal Qualified School Construction Bond program. Proceeds were used for the construction, rehabilitation or repair of public school properties and we receive a federal tax credit in lieu of interest income on these loans.
Real Estate – Residential: Residential real estate loans consist primarily of loans secured by first or second mortgages on primary residences. We originate adjustable-rate and fixed-rate, one-to-four family residential real estate loans for the construction, purchase or refinancing of a mortgage. These loans are collateralized by owner-occupied properties located in our market area. Loans on one-to-four family residential real estate are generally originated in amounts of no more than 80% of the purchase price or appraised value (whichever is lower). Mortgage title insurance and hazard insurance are required.
Real Estate – Commercial: We offer commercial real estate loans to finance real estate purchases and refinancing of existing commercial properties. These commercial real estate loans are secured by first liens on the real estate, which may include both owner occupied and non owner occupied facilities. The types of facilities financed include apartments, hotels, warehouses, retail facilities, manufacturing facilities and office buildings. Our underwriting analysis includes credit verification, independent appraisals, a review of the borrower's financial condition, and a detailed analysis of the borrower’s underlying cash flows.
Real Estate – Construction: We offer construction loans for the construction, expansion and improvement of residential and commercial properties which are secured by the real estate being developed. A review of all plans and budgets is performed prior to approval, third party progress documents are required during construction, and an independent approval process for all draw and release requests is maintained to ensure that funding is prudently administered and that funds are sufficient to complete the project.
Installment: We offer traditional direct consumer installment loans for various personal needs, including vehicle and boat financing. The vast majority of these loans are secured by a lien on the purchased vehicle and are underwritten using credit scores and income verification. We do not provide any indirect consumer lending activities.
For purposes of evaluating the adequacy of the allowance for credit losses, we consider a number of significant factors that affect the collectability of the portfolio. For individually evaluated loans, these include estimates of loss exposure, which reflect the facts and circumstances that affect the likelihood of repayment of such loans as of the evaluation date. For homogeneous pools of loans, estimates of our exposure to credit loss reflect a current assessment of a number of factors, which could affect collectability. These factors include: past loss experience; size, trend, composition, and nature of loans; changes in lending policies and procedures, including underwriting standards and collection, charge-offs and recoveries; trends experienced in nonperforming and delinquent loans; current economic conditions in our market; the effect of external factors such as competition, legal and regulatory requirements; and the experience, ability, and depth of lending management and staff. Past loss experience is based on net loan losses as a percentage of portfolio balances, using a five year weighted average. An external loan review firm and various regulatory agencies periodically review our allowance for credit losses.
After a thorough consideration of the factors discussed above, any required additions to the allowance for credit losses are made periodically by charges to the provision for credit losses. These charges are necessary to maintain the allowance for credit losses at a level which Management believes is reasonably reflective of overall inherent risk of probable loss in the portfolio. While Management uses available information to recognize losses on loans, additions may fluctuate from one reporting period to another. These fluctuations are reflective of changes in risk associated with portfolio content and/or changes in management’s assessment of any or all of the determining factors discussed above.
The following table reflects our loan loss experience and activity in the allowance for credit losses for the twelve months ended December 31, 2012:
| | | | | | | | | | | | | | | | |
| | | | | | | | | | | | | | | | |
(In thousands) | Commercial, financial and agricultural | Municipal | Real estate- residential | Real estate- commercial | Real estate-construction | Installment | All other | Totals |
Allowance for credit losses: | | | | | | | | | | | | | | | | |
Beginning balance | $ | 2,905 | $ | 309 | $ | 3,138 | $ | 4,484 | $ | 477 | $ | 23 | $ | 17 | $ | 11,353 |
Charge-offs | | (9) | | 0 | | (20) | | (32) | | 0 | | 0 | | 0 | | (61) |
Recoveries | | 30 | | 0 | | 14 | | 1 | | 25 | | 0 | | 0 | | 70 |
Provision (credit) | | 521 | | 213 | | 450 | | 46 | | (268) | | (6) | | (6) | | 950 |
Ending balance | $ | 3,447 | $ | 522 | $ | 3,582 | $ | 4,499 | $ | 234 | $ | 17 | $ | 11 | $ | 12,312 |
Ending balance individually | | | | | | | | | | | | | | | | |
evaluated for impairment | $ | 149 | $ | 0 | $ | 361 | $ | 59 | $ | 0 | $ | 0 | $ | 0 | $ | 569 |
Ending balance collectively | | | | | | | | | | | | | | | | |
evaluated for impairment | | 3,298 | | 522 | | 3,221 | | 4,440 | | 234 | | 17 | | 11 | | 11,743 |
Totals | $ | 3,447 | $ | 522 | $ | 3,582 | $ | 4,499 | $ | 234 | $ | 17 | $ | 11 | $ | 12,312 |
Financing receivables: | | | | | | | | | | | | | | | | |
Ending balance individually | | | | | | | | | | | | | | | | |
evaluated for impairment | $ | 233 | $ | 0 | $ | 2,317 | $ | 472 | $ | 0 | $ | 0 | $ | 0 | $ | 3,022 |
Ending balance collectively | | | | | | | | | | | | | | | | |
evaluated for impairment | | 164,790 | | 84,689 | | 487,634 | | 327,150 | | 10,561 | | 4,701 | | 376 | | 1,079,901 |
Totals | $ | 165,023 | $ | 84,689 | $ | 489,951 | $ | 327,622 | $ | 10,561 | $ | 4,701 | $ | 376 | $ | 1,082,923 |
Components: | | | | | | | | | | | | | | | | |
Allowance for loan losses | $ | 2,915 | $ | 494 | $ | 3,494 | $ | 4,444 | $ | 187 | $ | 17 | $ | 11 | $ | 11,562 |
Reserve for undisbursed | | | | | | | | | | | | | | | | |
lines of credit | | 532 | | 28 | | 88 | | 55 | | 47 | | 0 | | 0 | | 750 |
Total allowance for credit | | | | | | | | | | | | | | | | |
losses | $ | 3,447 | $ | 522 | $ | 3,582 | $ | 4,499 | $ | 234 | $ | 17 | $ | 11 | $ | 12,312 |
The following table reflects our loan loss experience and activity in the allowance for credit losses for the twelve months ended December 31, 2011:
| | | | | | | | | | | | | | | | |
| | | | | | | | | | | | | | | | |
(In thousands) | Commercial, financial and agricultural | Municipal | Real estate- residential | Real estate- commercial | Real estate-construction | Installment | All other | Totals |
Allowance for credit losses: | | | | | | | | | | | | | | | | |
Beginning balance | $ | 2,617 | $ | 236 | $ | 2,428 | $ | 5,143 | $ | 283 | $ | 24 | $ | 23 | $ | 10,754 |
Charge-offs | | (80) | | 0 | | (83) | | (60) | | (96) | | (10) | | 0 | | (329) |
Recoveries | | 101 | | 0 | | 4 | | 44 | | 25 | | 4 | | 0 | | 178 |
Provision (credit) | | 267 | | 73 | | 789 | | (643) | | 265 | | 5 | | (6) | | 750 |
Ending balance | $ | 2,905 | $ | 309 | $ | 3,138 | $ | 4,484 | $ | 477 | $ | 23 | $ | 17 | $ | 11,353 |
Ending balance individually | | | | | | | | | | | | | | | | |
evaluated for impairment | $ | 17 | $ | 0 | $ | 210 | $ | 0 | $ | 0 | $ | 0 | $ | 0 | $ | 227 |
Ending balance collectively | | | | | | | | | | | | | | | | |
evaluated for impairment | | 2,888 | | 309 | | 2,928 | | 4,484 | | 477 | | 23 | | 17 | | 11,126 |
Totals | $ | 2,905 | $ | 309 | $ | 3,138 | $ | 4,484 | $ | 477 | $ | 23 | $ | 17 | $ | 11,353 |
Financing receivables: | | | | | | | | | | | | | | | | |
Ending balance individually | | | | | | | | | | | | | | | | |
evaluated for impairment | $ | 114 | $ | 0 | $ | 1,985 | $ | 412 | $ | 0 | $ | 0 | $ | 0 | $ | 2,511 |
Ending balance collectively | | | | | | | | | | | | | | | | |
evaluated for impairment | | 146,876 | | 101,705 | | 437,833 | | 313,503 | | 18,993 | | 5,806 | | 399 | | 1,025,115 |
Totals | $ | 146,990 | $ | 101,705 | $ | 439,818 | $ | 313,915 | $ | 18,993 | $ | 5,806 | $ | 399 | $ | 1,027,626 |
Components: | | | | | | | | | | | | | | | | |
Allowance for loan losses | $ | 2,412 | $ | 307 | $ | 3,025 | $ | 4,442 | $ | 393 | $ | 23 | $ | 17 | $ | 10,619 |
Reserve for undisbursed | | | | | | | | | | | | | | | | |
lines of credit | | 493 | | 2 | | 113 | | 42 | | 84 | | 0 | | 0 | | 734 |
Total allowance for credit | | | | | | | | | | | | | | | | |
losses | $ | 2,905 | $ | 309 | $ | 3,138 | $ | 4,484 | $ | 477 | $ | 23 | $ | 17 | $ | 11,353 |
The table below presents the recorded investment of loans, including nonaccrual and restructured loans, segregated by class, with delinquency aging as of December 31, 2012:
| | | | | | | | | | | | | | |
| | | | | | | | | | | | | | |
| 30-59 Days | 60-89 Days | 90 Days or More | Total Past | | | Greater Than 90 Days and |
(In thousands) | Past Due | Past Due | Past Due | Due | Current | Total | Accruing |
Commercial, financial and agricultural | $ | 0 | $ | 0 | $ | 0 | $ | 0 | $ | 165,023 | $ | 165,023 | $ | 0 |
Municipal | | 0 | | 0 | | 0 | | 0 | | 84,689 | | 84,689 | | 0 |
Real estate-residential: | | | | | | | | | | | | | | |
First mortgage | | 92 | | 43 | | 950 | | 1,085 | | 449,956 | | 451,041 | | 0 |
Second mortgage | | 0 | | 0 | | 716 | | 716 | | 38,194 | | 38,910 | | 0 |
Real estate-commercial: | | | | | | | | | | | | | | |
Owner occupied | | 0 | | 0 | | 295 | | 295 | | 222,013 | | 222,308 | | 0 |
Non-owner occupied | | 0 | | 0 | | 0 | | 0 | | 105,314 | | 105,314 | | 0 |
Real estate-construction: | | | | | | | | | | | | | | |
Residential | | 0 | | 0 | | 0 | | 0 | | 1,559 | | 1,559 | | 0 |
Commercial | | 0 | | 0 | | 0 | | 0 | | 9,002 | | 9,002 | | 0 |
Installment | | 0 | | 0 | | 0 | | 0 | | 4,701 | | 4,701 | | 0 |
Other | | 0 | | 0 | | 0 | | 0 | | 376 | | 376 | | 0 |
Total | $ | 92 | $ | 43 | $ | 1,961 | $ | 2,096 | $ | 1,080,827 | $ | 1,082,923 | $ | 0 |
All of the total past due loans in the aging table above consist of non-accruing and restructured loans. There were no past due performing loans at December 31, 2012.
The table below presents the recorded investment of loans, including nonaccrual and restructured loans, segregated by class, with delinquency aging as of December 31, 2011:
| | | | | | | | | | | | | | |
| | | | | | | | | | | | | | |
| 30-59 Days | 60-89 Days | 90 Days or More | Total Past | | | Greater Than 90 Days and |
(In thousands) | Past Due | Past Due | Past Due | Due | Current | Total | Accruing |
Commercial, financial and agricultural | $ | 0 | $ | 40 | $ | 8 | $ | 48 | $ | 146,942 | $ | 146,990 | $ | 0 |
Municipal | | 0 | | 0 | | 0 | | 0 | | 101,705 | | 101,705 | | 0 |
Real estate-residential: | | | | | | | | | | | | | | |
First mortgage | | 39 | | 305 | | 731 | | 1,075 | | 400,256 | | 401,331 | | 0 |
Second mortgage | | 0 | | 0 | | 281 | | 281 | | 38,206 | | 38,487 | | 0 |
Real estate-commercial: | | | | | | | | | | | | | | |
Owner occupied | | 0 | | 325 | | 87 | | 412 | | 205,844 | | 206,256 | | 0 |
Non-owner occupied | | 0 | | 0 | | 0 | | 0 | | 107,659 | | 107,659 | | 0 |
Real estate-construction: | | | | | | | | | | | | | | |
Residential | | 0 | | 0 | | 0 | | 0 | | 1,798 | | 1,798 | | 0 |
Commercial | | 0 | | 0 | | 0 | | 0 | | 17,195 | | 17,195 | | 0 |
Installment | | 0 | | 0 | | 0 | | 0 | | 5,806 | | 5,806 | | 0 |
Other | | 0 | | 0 | | 0 | | 0 | | 399 | | 399 | | 0 |
Total | $ | 39 | $ | 670 | $ | 1,107 | $ | 1,816 | $ | 1,025,810 | $ | 1,027,626 | $ | 0 |
Non-accruing and restructured loans make up $1.60 million of the total past due loans in the aging table above.
Impaired loans by class at December 31, 2012 are as follows:
| | | | | | | | | | |
| | | | | | | | | | |
(In thousands) | Recorded Investment | Unpaid Principal Balance | Related Allowance | Average Recorded Investment | Interest Income Recognized |
With no related allowance recorded | | | | | | | | | | |
Commercial, financial and agricultural | $ | 7 | $ | 970 | $ | 0 | $ | 39 | $ | 1 |
Real estate – residential: | | | | | | | | | | |
First mortgage | | 853 | | 1,174 | | 0 | | 807 | | 51 |
Second mortgage | | 16 | | 52 | | 0 | | 247 | | 34 |
Real estate – commercial: | | | | | | | | | | |
Owner occupied | | 295 | | 487 | | 0 | | 380 | | 3 |
Non-owner occupied | | 0 | | 70 | | 0 | | 0 | | 0 |
Installment | | 0 | | 45 | | 0 | | 1 | | 0 |
With related allowance recorded | | | | | | | | | | |
Commercial, financial and agricultural | | 226 | | 228 | | 149 | | 37 | | 2 |
Real estate – residential: | | | | | | | | | | |
First mortgage | | 748 | | 766 | | 173 | | 662 | | 1 |
Second mortgage | | 700 | | 700 | | 188 | | 320 | | 0 |
Real estate – commercial: | | | | | | | | | | |
Owner occupied | | 177 | | 179 | | 59 | | 136 | | 2 |
Total | | | | | | | | | | |
Commercial, financial and agricultural | | 233 | | 1,198 | | 149 | | 76 | | 3 |
Real estate – residential | | 2,317 | | 2,692 | | 361 | | 2,036 | | 86 |
Real estate – commercial | | 472 | | 736 | | 59 | | 516 | | 5 |
Installment and other | | 0 | | 45 | | 0 | | 1 | | 0 |
Total | $ | 3,022 | $ | 4,671 | $ | 569 | $ | 2,629 | $ | 94 |
Impaired loans by class at December 31, 2011 are as follows:
| | | | | | | | | | |
| | | | | | | | | | |
(In thousands) | Recorded Investment | Unpaid Principal Balance | Related Allowance | Average Recorded Investment | Interest Income Recognized |
With no related allowance recorded | | | | | | | | | | |
Commercial, financial and agricultural | $ | 77 | $ | 1,099 | $ | 0 | $ | 154 | $ | 0 |
Real estate – residential: | | | | | | | | | | |
First mortgage | | 914 | | 1,162 | | 0 | | 1,201 | | 44 |
Second mortgage | | 222 | | 224 | | 0 | | 325 | | 43 |
Real estate – commercial: | | | | | | | | | | |
Owner occupied | | 412 | | 548 | | 0 | | 495 | | 11 |
Non-owner occupied | | 0 | | 70 | | 0 | | 64 | | 4 |
Real estate – construction: | | | | | | | | | | |
Commercial | | 0 | | 94 | | 0 | | 107 | | 0 |
Installment | | 0 | | 43 | | 0 | | 3 | | 1 |
With related allowance recorded | | | | | | | | | | |
Commercial, financial and agricultural | | 37 | | 43 | | 17 | | 240 | | 18 |
Real estate – residential: | | | | | | | | | | |
First mortgage | | 790 | | 830 | | 207 | | 761 | | 0 |
Second mortgage | | 59 | | 60 | | 3 | | 34 | | 0 |
Real estate – commercial: | | | | | | | | | | |
Non-owner occupied | | 0 | | 0 | | 0 | | 46 | | 9 |
Total | | | | | | | | | | |
Commercial, financial and agricultural | | 114 | | 1,142 | | 17 | | 394 | | 18 |
Real estate – residential | | 1,985 | | 2,276 | | 210 | | 2,321 | | 87 |
Real estate – commercial | | 412 | | 618 | | 0 | | 605 | | 24 |
Real estate – construction | | 0 | | 94 | | 0 | | 107 | | 0 |
Installment and other | | 0 | | 43 | | 0 | | 3 | | 1 |
Total | $ | 2,511 | $ | 4,173 | $ | 227 | $ | 3,430 | $ | 130 |
Impaired loans by class at December 31, 2010 are as follows:
| | | | | | | | | | |
| | | | | | | | | | |
(In thousands) | Recorded Investment | Unpaid Principal Balance | Related Allowance | Average Recorded Investment | Interest Income Recognized |
With no related allowance recorded | | | | | | | | | | |
Commercial, financial and agricultural | $ | 112 | $ | 1,077 | $ | 0 | $ | 2,536 | $ | 248 |
Real estate – residential: | | | | | | | | | | |
First mortgage | | 1,318 | | 1,636 | | 0 | | 269 | | 83 |
Second mortgage | | 644 | | 644 | | 0 | | 407 | | 17 |
Real estate – commercial: | | | | | | | | | | |
Owner occupied | | 483 | | 490 | | 0 | | 601 | | 49 |
Non-owner occupied | | 400 | | 640 | | 0 | | 402 | | 22 |
Real estate – construction: | | | | | | | | | | |
Residential | | 0 | | 0 | | 0 | | 195 | | 41 |
Commercial | | 0 | | 0 | | 0 | | 130 | | 0 |
Installment | | 0 | | 17 | | 0 | | 0 | | 0 |
With related allowance recorded | | | | | | | | | | |
Commercial, financial and agricultural | | 483 | | 483 | | 275 | | 1,898 | | 100 |
Real estate – residential: | | | | | | | | | | |
First mortgage | | 664 | | 664 | | 58 | | 1,059 | | 14 |
Total | | | | | | | | | | |
Commercial, financial and agricultural | | 595 | | 1,560 | | 275 | | 4,434 | | 348 |
Real estate – residential | | 2,626 | | 2,944 | | 58 | | 1,735 | | 114 |
Real estate – commercial | | 883 | | 1,130 | | 0 | | 1,003 | | 71 |
Real estate – construction | | 0 | | 0 | | 0 | | 325 | | 41 |
Installment and other | | 0 | | 17 | | 0 | | 0 | | 0 |
Total | $ | 4,104 | $ | 5,651 | $ | 333 | $ | 7,497 | $ | 574 |
Interest income recorded on impaired loans is reflected below:
| | | | | | |
| | | | | | |
(In thousands) | 2012 | 2011 | 2010 |
Interest income - accrual basis | $ | 94 | $ | 130 | $ | 286 |
Interest income - cash basis | | 0 | | 0 | | 288 |
Residential and commercial loans serviced for others at December 31, 2012 and 2011 amounted to approximately $22.30 million and $18.02 million, respectively.
Nonperforming loans at December 31, 2012 and 2011 are as follows:
| | | | |
| | | | |
(In thousands) | December 31, 2012 | December 31, 2011 |
Nonaccrual loans | $ | 2,355 | $ | 1,953 |
Loans past due greater than 90 days and accruing | | 0 | | 0 |
TDRs | | 557 | | 558 |
Total nonperforming loans | $ | 2,912 | $ | 2,511 |
Of the total TDRs in the table above, $374 thousand at December 31, 2012 and $224 thousand at December 31, 2011, are nonaccruing.
We have reviewed all restructurings that occurred on or after January 1, 2012 for identification as troubled debt restructurings. We did not identify as TDR any loans for which the allowance for credit losses had been measured under a general allowance for credit losses methodology. The loans in the table below are considered impaired under the guidance in Section 310-10-35. Included in the total TDRs of $557 thousand at December 31, 2012 are $336 thousand which were restructured prior to January 1, 2012.
Presented below is a summary of our restructurings during the year ended December 31, 2012 and December 31, 2011:
| | | | | | | | | | | |
| | | | | | | | | | | |
| 2012 | | 2011 |
| Number | Pre-Modification Recorded | Post-Modification Recorded | | Number | Pre-Modification Recorded | Post-modification Recorded |
(Dollars in thousands) | of Loans | Investment | Investment | | of Loans | Investment | Investment |
Commercial, financial and agricultural | 1 | $ | 9 | $ | 8 | | 0 | $ | 0 | $ | 0 |
Real estate – residential: | | | | | | | | | | | |
First mortgage | 1 | | 18 | | 14 | | 3 | | 262 | | 211 |
Second mortgage | 1 | | 25 | | 22 | | 0 | | 0 | | 0 |
Real estate - commercial: | | | | | | | | | | | |
Owner occupied | 1 | | 182 | | 177 | | 0 | | 0 | | 0 |
The loans in the table above were classified as TDRs because the borrowers demonstrated cash flow insufficient to service their debt, as well as an inability to obtain funds at market rates from other sources. Three of the loans that were restructured during 2012 were in non-accruing status at the time of the modification. The loan in accruing status at the end of the year demonstrated a sustained period of repayment performance, in accordance with the modified terms of the loan, the loan is considered adequately secured and all principal and interest amounts contractually due are reasonably assured of repayment within an acceptable period of time.
Modifications were granted which consisted of lower interest rates and more favorable payment terms to the borrower. There were no TDRs restructured within the past twelve months that have defaulted.
There were ten TDRs at at December 31, 2012, all of which demonstrated cash flow insufficient to service their debt, as well as an inability to obtain funds at market rates from other sources. At December 31, 2012, two restructured loans totaling $69 thousand that were restructured in a prior year, were in default with foreclosure proceedings in process. The other loans were performing in accordance with their modified agreements. At December 31, 2012, four of the loans totaling $183 thousand were accruing and six of the loans totaling $374 thousand were in nonaccrual. At December 31, 2012, there were no commitments to lend additional funds to borrower whose loans have been modified in a troubled debt restructuring. We had $332 thousand in commitments to lend additional funds to borrowers whose loans were in nonaccrual status or to borrowers whose loans were 90 days past due and still accruing. Merchants recorded interest income on restructured loans of approximately $28 thousand for 2012.
We had no OREO at December 31, 2012, compared with $358 thousand at December 31, 2011.
Nonaccrual loans by class as of December 31, 2012 and 2011 are as follows:
| | | | |
| | | | |
(In thousands) | December 31, 2012 | December 31, 2011 |
Commercial, financial and agricultural | $ | 225 | $ | 114 |
Real estate - residential: | | | | |
First mortgage | | 1,119 | | 1,146 |
Second mortgage | | 716 | | 281 |
Real estate - commercial: | | | | |
Owner occupied | | 295 | | 412 |
Total nonaccruing non-TDR loans | $ | 2,355 | $ | 1,953 |
Nonaccruing TDR’s | | | | |
Commercial, financial and agricultural | | 8 | | 0 |
Real estate – residential: | | | | |
First mortgage | | 189 | | 224 |
Real estate - commercial: | | | | |
Owner occupied | | 177 | | 0 |
Total nonaccrual loans including TDRs | $ | 2,729 | $ | 2,177 |
Commercial Grading System
We use risk rating definitions for our commercial loan portfolios and certain residential loans which are generally consistent with regulatory and banking industry norms. Loans are assigned a credit quality grade which is based upon management’s on-going assessment of risk based upon an evaluation of the quantitative and qualitative aspects of each credit. This assessment is a dynamic process and risk ratings are adjusted as each borrower’s financial situation changes. This process is designed to provide timely recognition of a borrower’s financial condition and appropriately focus management resources.
Pass rated loans exhibit acceptable risk to the bank in terms of financial capacity to repay their loans as well as possessing acceptable fallback repayment sources, typically collateral and personal guarantees. These loans are subject to a formal annual review process; additionally, management reviews the risk rating at the time of any late payments, overdrafts or other sign of deterioration in the interim.
Loans rated Pass-Watch require more than usual attention and monitoring by the account officer, though not to the extent that a formal remediation plan is warranted. Borrowers can be rated Pass-Watch based upon a weakened capital structure, marginally adequate cash flow and/or collateral coverage or early-stage declining trends in operations or financial condition.
Loans rated Special Mention possess potential weakness that may expose the bank to some risk of loss in the future. These loans require more frequent monitoring and formal reporting to Management.
Substandard loans reflect well-defined weaknesses in the current repayment capacity, collateral or net worth of the borrower with the possibility of some loss to the bank if these weaknesses are not corrected. Action plans are required for these loans to address the inherent weakness in the credit and are formally reviewed.
Below is a summary of loans by credit quality indicator as of December 31, 2012:
| | | | | | | | | | | | |
| | | | | | | | | | | | |
| | | | | | | | | | | |
| Unrated Residential and | | | Pass- | Special | Sub- | | |
(In thousands) | Consumer | Pass | Watch | Mention | Standard | Total |
Commercial, financial and agricultural | $ | 85 | $ | 138,307 | $ | 18,738 | $ | 5,704 | $ | 2,189 | $ | 165,023 |
Municipal | | 5 | | 77,242 | | 7,442 | | 0 | | 0 | | 84,689 |
Real estate – residential: | | | | | | | | | | | | |
First mortgage | | 418,802 | | 29,237 | | 1,275 | | 194 | | 1,533 | | 451,041 |
Second mortgage | | 37,200 | | 1,000 | | 0 | | 0 | | 710 | | 38,910 |
Real estate – commercial: | | | | | | | | | | | | |
Owner occupied | | 86 | | 188,330 | | 16,718 | | 3,546 | | 13,628 | | 222,308 |
Non-owner occupied | | 40 | | 93,002 | | 10,211 | | 613 | | 1,448 | | 105,314 |
Real estate – construction: | | | | | | | | | | | | |
Residential | | 41 | | 0 | | 1,518 | | 0 | | 0 | | 1,559 |
Commercial | | 598 | | 7,882 | | 522 | | 0 | | 0 | | 9,002 |
Installment | | 4,701 | | 0 | | 0 | | 0 | | 0 | | 4,701 |
All other loans | | 376 | | 0 | | 0 | | 0 | | 0 | | 376 |
Total | $ | 461,934 | $ | 535,000 | $ | 56,424 | $ | 10,057 | $ | 19,508 | $ | 1,082,923 |
Below is a summary of loans by credit quality indicator as of December 31, 2011:
| | | | | | | | | | | | |
| | | | | | | | | | | | |
| | | | | | | | | | | |
| Unrated Residential and | | | Pass- | Special | Sub- | | |
(In thousands) | Consumer | Pass | Watch | Mention | Standard | Total |
Commercial, financial and agricultural | $ | 2 | $ | 117,772 | $ | 28,326 | $ | 170 | $ | 720 | $ | 146,990 |
Municipal | | 0 | | 101,705 | | 0 | | 0 | | 0 | | 101,705 |
Real estate – residential: | | | | | | | | | | | | |
First mortgage | | 379,512 | | 18,647 | | 1,569 | | 641 | | 962 | | 401,331 |
Second mortgage | | 38,020 | | 146 | | 0 | | 0 | | 321 | | 38,487 |
Real estate – commercial: | | | | | | | | | | | | |
Owner occupied | | 0 | | 175,878 | | 14,001 | | 7,355 | | 9,022 | | 206,256 |
Non-owner occupied | | 0 | | 95,239 | | 8,891 | | 1,195 | | 2,334 | | 107,659 |
Real estate – construction: | | | | | | | | | | | | |
Residential | | 99 | | 0 | | 1,699 | | 0 | | 0 | | 1,798 |
Commercial | | 81 | | 15,925 | | 573 | | 0 | | 616 | | 17,195 |
Installment | | 5,806 | | 0 | | 0 | | 0 | | 0 | | 5,806 |
All other loans | | 399 | | 0 | | 0 | | 0 | | 0 | | 399 |
Total | $ | 423,919 | $ | 525,312 | $ | 55,059 | $ | 9,361 | $ | 13,975 | $ | 1,027,626 |
The amount of interest which was not earned, but which would have been earned had our nonaccrual and restructured loans performed in accordance with their original terms and conditions, was approximately $142 thousand, $193 thousand and $425 thousand in 2012, 2011 and 2010, respectively.
It is our policy to make loans to directors, executive officers, and associates of such persons on substantially the same terms, including interest rates and collateral, as those prevailing for comparable lending transactions with other persons.
NOTE 5: PREMISES AND EQUIPMENT
The components of premises and equipment included in the accompanying consolidated balance sheets are as follows:
| | | | | |
| | | | | |
(In thousands) | 2012 | 2011 | Estimated Useful Lives (In years) |
Land | $ | 525 | $ | 544 | N/A |
Bank premises | | 10,476 | | 10,712 | 39 |
Leasehold improvements | | 8,499 | | 6,627 | 5 – 20 |
Furniture, equipment, and software | | 18,124 | | 16,376 | 3 – 7 |
Total gross fixed sssets | | 37,624 | | 34,259 | |
Less: accumulated depreciation and amortization | | 21,547 | | 20,027 | |
Total net fixed assets | $ | 16,077 | $ | 14,232 | |
Depreciation and amortization expense related to premises and equipment amounted to $1.95 million, $1.89 million and $1.70 million in 2012, 2011 and 2010, respectively.
We occupy certain banking offices under non-cancellable operating lease agreements expiring at various dates over the next 20 years. The majority of leases have multiple options with escalation clauses for increases associated with the cost of living or other variable expenses over time. Rent expense on these properties totaled $1.08 million, $1.02 million and $1.02 million for the years ended December 31, 2012, 2011 and 2010, respectively.
Minimum lease payments on these properties subsequent to December 31, 2012 are as follows:
| | |
| | |
(In thousands) | Amount |
2013 | $ | 1,134 |
2014 | | 929 |
2015 | | 909 |
2016 | | 809 |
2017 | | 774 |
After 2017 | | 4,857 |
Total | $ | 9,412 |
We entered into a sale leaseback arrangement for our principal office in South Burlington, Vermont, in June 2008. Deferred gains on the sale leaseback transaction resulted in a $423 thousand offset to rent expense per year through 2016 and $635 thousand thereafter.
We had no intangibles on our balance sheet at any point during 2012 or 2011, therefore no amortization was recorded during 2012 or 2011. Amortization for intangibles is expected to be zero for 2013.
NOTE 6: TIME DEPOSITS
Scheduled maturities of time deposits at December 31, 2012 were as follows:
| | |
| | |
(In thousands) | | |
Mature in year ending December 31, | | |
2013 | $ | 262,857 |
2014 | | 36,629 |
2015 | | 12,705 |
2016 | | 10,986 |
2017 | | 7,221 |
Thereafter | | 0 |
Total time deposits | $ | 330,398 |
Time deposits greater than $100 thousand totaled $123.37 million and $127.30 million as of December 31, 2012 and 2011, respectively. Interest expense on time deposits greater than $100 thousand amounted to $1.02 million, $1.14 million and $1.29 million for the years ended December 31, 2012, 2011 and 2010, respectively.
NOTE 7: SECURITIES SOLD UNDER AGREEMENTS TO REPURCHASE AND OTHER SHORT-TERM DEBT
FHLBB short term borrowings and Securities sold under agreements to repurchase mature daily. Securities sold under agreements to repurchase are collateralized by mortgage backed securities and collateralized mortgage backed obligations. We maintain effective control over the securities underlying the agreements.
As of December 31, 2012, we could borrow up to $45.00 million in overnight funds through unsecured borrowing lines established with correspondent banks. We have established both overnight and longer term lines of credit with the FHLBB. The borrowings are secured by residential mortgage loans. The total amount of loans pledged to the FHLBB for both short and long-term borrowing arrangements totaled $342.56 million and $225.86 million at December 31, 2012 and 2011, respectively. We have $232.34 million in additional short or long-term borrowing capacity with FHLBB. We also have the ability to borrow short-term or long-term through the use of repurchase agreements, collateralized by our investments, with certain approved counterparties.
The following table provides certain information regarding other borrowed funds for the three years ended December 31, 2012, 2011 and 2010:
| | | | | | | | | | | |
| | | | | | | | | | | |
(In thousands) | 2012 | | 2011 | | 2010 |
FHLBB short-term borrowings | | | | | | | | | | | |
Amount outstanding at year end | $ | 0 | | | $ | 0 | | | $ | 0 | |
Maximum amount outstanding during the year | | 97,000 | | | | 0 | | | | 13,000 | |
Average amount outstanding during the year | | 38,290 | | | | 359 | | | | 1,316 | |
Weighted average-rate during the year | | 0.28 | % | | | 0.28 | % | | | 0.31 | % |
Weighted average rate at year-end | | 0 | % | | | 0 | % | | | 0 | % |
Demand note due U.S. Treasury | | | | | | | | | | | |
Amount outstanding at year end | $ | 0 | | | $ | 0 | | | $ | 2,964 | |
Maximum amount outstanding during the year | | 0 | | | | 3,013 | | | | 3,330 | |
Average amount outstanding during the year | | 0 | | | | 1,794 | | | | 1,414 | |
Weighted average-rate during the year | | 0 | % | | | 0 | % | | | 0 | % |
Weighted average rate at year-end | | 0 | % | | | 0 | % | | | 0 | % |
Securities sold under agreement to repurchase | | | | | | | | | | | |
Amount outstanding at year end | $ | 287,520 | | | $ | 262,527 | | | $ | 224,693 | |
Maximum amount outstanding during the year | | 303,420 | | | | 266,897 | | | | 224,693 | |
Average amount outstanding during the year | | 230,281 | | | | 217,823 | | | | 172,165 | |
Weighted average-rate during the year | | 0.73 | % | | | 0.95 | % | | | 0.94 | % |
Weighted average rate at year-end | | 0.47 | % | | | 0.91 | % | | | 1.01 | % |
NOTE 8: LONG-TERM DEBT
Long-term debt consisted of the following at December 31, 2012 and 2011:
| | | | |
| | | | |
(In thousands) | 2012 | 2011 |
FHLBB Note, 2.75%, final maturity April 2015 | $ | 0 | $ | 20,000 |
FHLBB Notes, payable through March 2029, Rates ranging from 1.50% to 2.50% | | 2,483 | | 2,562 |
| $ | 2,483 | $ | 22,562 |
Interest expense on FHLB debt totaled $363 thousand and $774 thousand for 2012 and 2011 respectively. Interest on Securities Sold Under Agreements to Repurchase totaled $0 and $141 thousand for 2012 and 2011, respectively.
During 2012, we prepaid $20.00 million in long-term debt and incurred prepayment penalties totaling $1.36 million. During 2011, we prepaid $16.00 million in long-term debt and incurred prepayment penalties of $861 thousand.
Contractual maturities and amortization of long-term debt subsequent to December 31, 2012, are as follows:
| | |
| | |
(In thousands) | | Amount |
2013 | $ | 81 |
2014 | | 82 |
2015 | | 84 |
2016 | | 85 |
2017 | | 87 |
After 2017 | | 2,064 |
Total due | $ | 2,483 |
NOTE 9: TRUST PREFERRED SECURITIES
On December 15, 2004, we closed our private placement of an aggregate of $20 million of trust preferred securities. The placement occurred through a newly formed Delaware statutory trust affiliate, MBVT Statutory Trust I (the “Trust”), as part of a pooled trust preferred program. The Trust was formed for the sole purpose of issuing capital securities which are non-voting. We own all of the common securities of the Trust. The proceeds from the sale of the capital securities were loaned to us under deeply subordinated debentures issued to the Trust. The debentures are the only asset of the Trust and payments under the debentures are the sole revenue of the Trust. Our primary source of funds to pay interest on the debentures held by the Trust is current dividends from our principal subsidiary, Merchants Bank. Accordingly, our ability to service the debentures is dependent upon the continued ability of Merchants Bank to pay dividends to us.
These hybrid securities currently qualify as regulatory capital, up to certain regulatory limits. At the same time they are considered debt for tax purposes, and as such, interest payments are fully deductible. The trust preferred securities total $20.62 million, and carried a fixed rate of interest through December 2009 at which time the rate became variable and adjusts quarterly at three month LIBOR plus 1.95%. We entered into two interest rate swap arrangements for our trust preferred issuance which were effective beginning on December 15, 2009. One swap fixed the interest rate on $10 million at 6.5% for three years; this swap expired on December 15, 2012 and has not been extended or renewed. The second swap fixed the rate on $10 million at 5.23% and expires on December 15, 2016. The impact on net interest income for 2012, 2011 and 2010 from the interest expense on the trust preferred securities was $1.18 million, $1.19 million and $1.19 million per year, respectively. The trust preferred securities mature on December 31, 2034, and are redeemable without penalty at our option, subject to prior approval by the FRB.
NOTE 10: INCOME TAXES
The components of the provision for income taxes were as follows for the years ended December 31, 2012, 2011 and 2010:
| | | | | | |
| | | | | | |
(In thousands) | 2012 | 2011 | 2010 |
Current | $ | 3,205 | $ | 4,461 | $ | 4,443 |
Deferred | | 772 | | (1,337) | | 205 |
Provision for income taxes | $ | 3,977 | $ | 3,124 | $ | 4,648 |
Not included in the above table is the income tax impact associated with the unrealized gain or loss on securities available for sale and the income tax impact associated with the funded status of the pension plan, which are recorded directly in shareholders’ equity as a component of accumulated other comprehensive loss.
The tax effects of temporary differences and tax credits that give rise to deferred tax assets and liabilities at December 31, 2012 and 2011 are presented below:
| | | | |
| | | | |
(In thousands) | 2012 | 2011 |
Deferred tax assets: | | | | |
Allowance for loan losses | $ | 4,309 | $ | 3,974 |
Post retirement benefit obligation | | 1,685 | | 1,444 |
Loan mark-to-market adjustment | | 2,778 | | 2,627 |
Deferred compensation | | 1,293 | | 1,217 |
Installment sales | | 180 | | 293 |
Core deposit intangible | | 70 | | 108 |
Interest rate swap | | 370 | | 492 |
Other | | 647 | | 335 |
Investment in real estate limited partnerships, net | | 246 | | 86 |
Total deferred tax assets | $ | 11,578 | $ | 10,576 |
Deferred tax liabilities: | | | | |
Unrealized gain on securities available for sale | $ | (3,259) | $ | (3,598) |
Depreciation | | (1,638) | | (1,746) |
Accrued pension cost | | (2,949) | | (1,288) |
Total deferred tax liabilities | $ | (7,846) | $ | (6,632) |
Net deferred tax asset | $ | 3,732 | $ | 3,944 |
In assessing the realizability of our total deferred tax assets, Management considers whether it is more likely than not that some portion or all of those assets will not be realized. Based upon Management’s consideration of historical and anticipated future pre-tax income, as well as the reversal period for the items giving rise to the deferred tax assets and liabilities, a valuation allowance for deferred tax assets was not considered necessary at December 31, 2012 and 2011. However, factors beyond management’s controls, such as the general state of the economy can affect future levels of taxable income and there can be no assurances that sufficient taxable income will be generated to fully realize the deferred tax assets in the future.
The following is a reconciliation of the federal income tax provision, calculated at the statutory rate of 35%, to the recorded provision for income taxes:
| | | | | | |
| | | | | | |
(In thousands) | 2012 | 2011 | 2010 |
Applicable statutory Federal income tax | $ | 6,710 | $ | 6,210 | $ | 7,038 |
(Reduction) increase in taxes resulting from: | | | | | | |
Tax-exempt income | | (719) | | (716) | | (402) |
Tax credits | | (2,164) | | (2,592) | | (2,027) |
Other, net | | 150 | | 222 | | 39 |
Provision for income taxes | $ | 3,977 | $ | 3,124 | $ | 4,648 |
We have not identified any of our tax positions that contain significant uncertainties. Housing tax credits are recognized using the flow through method. We are subject to federal and state income tax examinations for years after December 31, 2009.
The State of Vermont assesses a franchise tax for banks in lieu of income tax. The franchise tax is assessed based on deposits. Vermont franchise taxes, net of state credits amounted to approximately $1.20 million, $1.18 million and $1.07 million in 2012, 2011 and 2010, respectively, which is included as non-interest expense in the accompanying consolidated statement of income.
NOTE 11: EMPLOYEE BENEFIT PLANS
Pension Plan
Prior to January 1995, we maintained a noncontributory defined benefit plan covering all eligible employees. Our pension plan (the “Pension Plan”) was a final average pay plan with benefits based on the average salary rates over the five consecutive plan years out of the last ten consecutive plan years that produce the highest average. It was our policy to fund the cost of benefits expected to accrue during the year plus amortization of any unfunded accrued liability that had accumulated prior to the valuation date based on IRS regulations for funding. During 1995, the Pension Plan was curtailed. Accordingly, all accrued benefits were fully vested and no additional years of service or age will be accrued.
We recognize the overfunded or underfunded status of a single employer defined benefit post retirement plan as an asset or liability on the consolidated balance sheets and recognize changes in the funded status in comprehensive income in the year in which the change occurred.
The following tables provide a reconciliation of the changes in the Pension Plan’s benefit obligations and fair value of assets over the two year period ending December 31, 2012, and a statement of the funded status as of December 31 of both years:
| | | | |
| | | | |
(In thousands) | 2012 | 2011 |
Reconciliation of benefit obligation | | | | |
Benefit obligation at beginning of year | $ | 9,240 | $ | 9,109 |
Service cost including expenses | | 48 | | 50 |
Interest cost | | 478 | | 473 |
Actuarial loss | | 1,559 | | 138 |
Benefits paid | | (524) | | (530) |
Benefit obligation at year-end | $ | 10,801 | $ | 9,240 |
Reconciliation of fair value of plan assets | | | | |
Fair value of plan assets at beginning of year | $ | 8,806 | $ | 9,404 |
Actual return on plan assets | | 1,132 | | (70) |
Employer contributions | | 5,000 | | 0 |
Benefits paid | | (526) | | (528) |
Fair value of plan assets at year-end | $ | 14,412 | $ | 8,806 |
Funded status at year end | $ | 3,611 | $ | (434) |
We have no minimum required contribution for 2013.
The accumulated benefit obligation is equal to the projected benefit obligation and was $10.80 million and $9.24 million at December 31, 2012 and 2011, respectively.
The following tables summarize the components of net periodic benefit cost and other changes in Pension Plan assets and benefit obligations recognized in other comprehensive income for the years ended December 31, 2012, 2011 and 2010, respectively:
| | | | | | |
| | | | | | |
(In thousands) | 2012 | 2011 | 2010 |
Interest cost | $ | 478 | $ | 473 | $ | 482 |
Expected return on plan assets | | (600) | | (642) | | (600) |
Service costs | | 48 | | 50 | | 54 |
Net loss amortization | | 326 | | 252 | | 242 |
Net periodic pension cost | $ | 252 | $ | 133 | $ | 178 |
| | | | | | |
| | | | | | |
(In thousands) | | 2012 | | 2011 | | 2010 |
Net loss (gain) | $ | 1,016 | $ | 861 | $ | (23) |
Net loss amortization | | (326) | | (252) | | (242) |
Total recognized in other comprehensive income | $ | 690 | $ | 609 | $ | (265) |
Total recognized in net periodic pension cost and other comprehensive income | $ | 942 | $ | 742 | $ | (87) |
The estimated net actuarial loss for the Pension Plan that will be amortized from accumulated other comprehensive income into net periodic pension cost for 2013 is $335 thousand.
The following table summarizes the assumptions used to determine the benefit obligations and net periodic benefit costs for the years ended December 31, 2012, 2011 and 2010:
| | | | | | | |
| | | | | | | |
| | 2012 | 2011 | 2010 |
Benefit obligations | | | | | | | |
Discount rate | | 3.98 | % | 5.24 | % | 5.26 | % |
Net periodic benefit cost | | | | | | | |
Discount rate | | 5.24 | % | 5.26 | % | 5.80 | % |
Expected long-term return on plan assets | | 7.00 | % | 7.00 | % | 7.00 | % |
The discount rate reflects the rates at which pension benefits could be effectively settled. We look to rates of return on high-quality fixed income investments currently available and expected to be available during the period of maturity of the pension benefits. Consideration was given to the rates that would be used to settle plan obligations as of December 31, 2012 and to the rates of other indices at year-end. Our actuary constructed a hypothetical high quality bond portfolio with cash flows that match the expected monthly benefit payments under the pension plan and calculated a discount rate based upon that portfolio. The expected long-term rate of return on plan assets reflects long-term earnings expectations on existing plan assets and those contributions expected to be received during the current plan year. In estimating that rate, appropriate consideration was given to historical returns earned by plan assets in the fund and the rates of return expected to be available for reinvestment. Rates of return were adjusted to reflect current capital market assumptions and changes in investment allocations, if any.
The Board of Directors has chosen our Trust division as the investment manager for the Pension Plan. The investment objectives of the Pension Plan are to provide both income and capital appreciation and to assist with current and future spending needs of the Pension Plan while at the same time minimizing the risks of investing. The investment target of the Pension Plan is to achieve a total annual rate of return in excess of the change in the Consumer Price Index for the aggregate investments of the Pension Plan evaluated over a period of five years. A certain amount of risk must be assumed to achieve the Pension Plan's investment target rate of return. The Pension Plan uses a balanced portfolio which has a 5-15 year time horizon and is considered moderate risk. The portfolio strategy followed by the Pension Plan has a baseline allocation of 60% stock and 40% fixed income securities, but the investment manager may allocate funds within certain specified ranges. The range for equities is 35% to 75% and for fixed income securities the range is 25% to 60%. The allocation among categories will vary from the baseline allocation when opportunities are identified to improve returns and/or reduce risk.
The fair value of Pension Plan assets at December 31, 2012 by asset category are as follows:
| | | | | | | | |
| | | | | | | | |
| | | Fair Value Measurements at Reporting Date Using: |
| | | Quoted Prices in Active Markets for Identical Assets | Significant Other Observable Inputs | Significant Unobservable Inputs |
(In thousands) | Total | | (Level 1) | | (Level 2) | | (Level 3) |
Cash | $ | 0 | $ | 0 | $ | 0 | $ | 0 |
Money Market Funds | | 5,301 | | 5,301 | | 0 | | 0 |
Equity Securities: | | | | | | | | |
Large Cap Equity Mutual Funds | | 2,104 | | 2,104 | | 0 | | 0 |
Small Cap Equity Mutual Funds | | 75 | | 75 | | 0 | | 0 |
Domestic Equities | | 205 | | 205 | | 0 | | 0 |
Global Equity Mutual Funds | | 577 | | 577 | | 0 | | 0 |
International Equity Mutual Funds | | 1,651�� | | 1,651 | | 0 | | 0 |
Absolute Return Funds | | 446 | | 446 | | 0 | | 0 |
Fixed Income: | | | | | | | | |
International Bond Mutual Funds | | 364 | | 364 | | 0 | | 0 |
Taxable Bond Mutual Funds | | 3,689 | | 3,689 | | 0 | | 0 |
Total | $ | 14,412 | $ | 14,412 | $ | 0 | $ | 0 |
The fair value of Pension Plan assets at December 31, 2011 by asset category are as follows:
| | | | | | | | |
| | | | | | | | |
| | | Fair Value Measurements at Reporting Date Using: |
| | | Quoted Prices in Active Markets for Identical Assets | Significant Other Observable Inputs | Significant Unobservable Inputs |
(In thousands) | Total | | (Level 1) | | (Level 2) | | (Level 3) |
Cash | $ | 13 | $ | 13 | $ | 0 | $ | 0 |
Money Market Funds | | 258 | | 258 | | 0 | | 0 |
Equity Securities: | | | | | | | | |
Large Cap Equity Mutual Funds | | 2,425 | | 2,425 | | 0 | | 0 |
Small Cap Equity Mutual Funds | | 80 | | 80 | | 0 | | 0 |
Domestic Equities | | 223 | | 223 | | 0 | | 0 |
Global Equity Mutual Funds | | 506 | | 506 | | 0 | | 0 |
International Equity Mutual Funds | | 822 | | 822 | | 0 | | 0 |
Absolute Return Funds | | 419 | | 419 | | 0 | | 0 |
Fixed Income: | | | | | | | | |
International Bond Mutual Funds | | 419 | | 419 | | 0 | | 0 |
Taxable Bond Mutual Funds | | 3,641 | | 3,641 | | 0 | | 0 |
Total | $ | 8,806 | $ | 8,806 | $ | 0 | $ | 0 |
Large Cap Equity Mutual Funds: Funds in this category have a diversified, index and actively managed multi-manager approach to investing in domestic stocks. There are multiple fund managers that are included in the portfolio with multiple categories of industries being invested in by the managers in mid-size, to large-size publicly traded firms with a majority of funds invested in large companies.
Small Cap Equity Mutual Funds: Funds in this category have a diversified, active fund manager approach to investing in small company domestic stocks.
Domestic equities: The Pension Plan holds 7,650 shares of Merchants Bancshares, Inc. stock with a cost basis of $64 thousand and a market value at December 31, 2012 of $205 thousand.
Global Equity Mutual Funds: Funds in this category are diversified, active global equity funds that have exposure to both large company domestic stocks as well as large company developed country international stocks.
International Equity Mutual Funds: Funds in this category have a diversified, index and actively managed multi-manager approach to investing in international developed country stocks and emerging market stocks.
Absolute Return Funds: Funds in this category are invested in a diversified portfolio of stocks, preferred stocks, convertible bonds, and bonds. The portfolio manager’s objective is to take advantage of inefficiencies in the stock and bond markets to capture a return on investment by using specialized trading strategies. The goal of these trading strategies is to provide investors with consistent, positive returns that are not necessarily correlated to the general equity markets.
International Bond Mutual Funds: Funds in this category have a diversified, actively managed multi-manager approach to investing in international bonds, with an average credit rating for the majority of the portfolio being investment grade.
Taxable Bond Mutual Funds: Funds in this category have a diversified, actively managed multi-manager approach to investing in domestic and international bonds. A majority of funds are invested in domestic bonds with an average credit rating for the majority of the portfolio being investment grade.
The following table summarizes the estimated future benefit payments expected to be paid under the Pension Plan:
| | |
| | |
| | Pension |
(In thousands) | | Benefits |
2013 | $ | 508 |
2014 | | 541 |
2015 | | 556 |
2016 | | 578 |
2017 | | 619 |
Years 2018 to 2022 | $ | 3,385 |
The estimated future benefit payments expected to be paid under the Pension Plan are based on the same assumptions used to measure our benefit obligation at December 31, 2012. No future service estimates were included due to the frozen status of the Pension Plan.
401(k) Employee Stock Ownership Plan
Under the terms of our 401(k) Employee Stock Ownership Plan (“401(k)”) eligible employees are entitled to contribute up to 75% of their compensation, subject to IRS limitations, to the 401(k), and we contribute a percentage of the amounts contributed by the employees as authorized by Merchants’ Bank’s Board of Directors. In 2011 we introduced a Roth plan available to all employees as part of the 401K plan. We contributed approximately 47%, 49% and 49% of the amounts contributed by the employees in 2012, 2011 and 2010, respectively.
Summary of Expense
A summary of expense relating to our various employee benefit plans for each of the years in the three year period ended December 31, 2012 is as follows:
| | | | | | |
| | | | | | |
(In thousands) | 2012 | 2011 | 2010 |
Pension plan | $ | 252 | $ | 133 | $ | 178 |
401(k) | | 590 | | 622 | | 554 |
Total | $ | 842 | $ | 755 | $ | 732 |
NOTE 12: STOCK-BASED COMPENSATION PLANS
Merchants has established stock based compensation plans for directors and for certain employees. The Amended and Restated Merchants Bancshares, Inc. 2008 Stock Incentive Plan (the “Plan”) allows us to grant stock options and restricted stock grants to certain employees. The Plan allows for the issuance of up to 600,000 shares of stock. As of December 31, 2012, there were 461,310 shares that remain available for future grants under the Plan. The Merchants Bancshares, Inc. and Subsidiaries Amended and Restated 2008 Compensation Plan for Non-Employee Directors and Trustees allows us to issue up to 150,000 shares of stock. As of December 31, 2012 there were 113,878 shares that remain available for future issuance under the Plan.
The fair value of stock option and restricted stock awards, measured at the grant date are amortized to compensation expense on a straight-line basis over the vesting period. The total compensation cost related to stock option awards and restricted stock awards was $172 thousand, $164 thousand and $101 thousand for 2012, 2011 and 2010, respectively. There were no restricted stock awards prior
to 2011. Compensation cost related to stock option and restricted stock awards is included in salary expense in the accompanying consolidated statements of income. Remaining compensation expense relating to current outstanding stock option grants is $27 thousand. Remaining compensation expense related to current outstanding restricted stock awards is $228 thousand.
Deferred Compensation Plans for Non-Employee Directors
Merchants has established deferred compensation plans for non-employee directors. Under the terms of these plans participating directors can elect to have all, or a specified percentage, of their director’s fees for a given year paid in the form of cash or deferred in the form of restricted shares of Merchants’ common stock. These shares are held in a rabbi trust and are considered outstanding for purposes of computing earnings per share. Directors who elect to have their compensation deferred are credited with a number of shares of Merchants’ common stock equal in value to the amount of fees deferred. The participating director may not sell, transfer or otherwise dispose of these shares prior to distribution. With respect to shares of common stock issued or otherwise transferred to a participating director, the participating director will have the right to receive dividends or other distributions thereon. Deferred director’s fees are recognized as an expense in the year incurred.
Restricted Stock
Restricted stock provides grantees with rights to shares of common stock upon completion of a service period. During the service period, all shares are considered outstanding and dividends are paid on the restricted stock. We made a grant of 6,680 and 11,054 restricted shares in 2012 and 2011, respectively. The shares vest three years after the grant date. The grant date fair value of restricted stock granted during 2012 and 2011 was $26.33 per share and $25.00 per share, respectively.
Stock Options
Stock options are granted at 100% of fair market value and vest over three years. No stock options were granted during 2012 or 2011. We granted 52,475 options during May 2010. The fair value of the options granted during 2010 was $3.06 per option. The fair value of each option grant is estimated on the grant date using the Black-Scholes option-pricing model that requires Merchants to develop estimates for assumptions used in the model. The Black-Scholes valuation model uses the following assumptions: expected volatility, expected term of option, risk-free interest rate and dividend yield. Expected volatility estimates are developed based on historical volatility of our stock. We use historical data to estimate the expected term of the options. The risk-free interest rate for periods within the expected life of the option is based on the U.S. Treasury yield in effect at the grant date. The dividend yield represents the expected dividends on our stock.
A summary of Merchants’ stock option plan as of December 31, 2012, 2011 and 2010 and changes during the years then ended are as follows, with numbers of shares in thousands:
| | | | | | | | | |
| | | | | | | | | |
| 2012 | 2011 | 2010 |
| | Weighted | | Weighted | | Weighted |
| | Average | | Average | | Average |
| Number | Exercise | Number | Exercise | Number | Exercise |
| Of | Price | Of | Price | Of | Price |
| Shares | Per Share | Shares | Per Share | Shares | Per Share |
Options outstanding, beginning of year | 121 | $ | 22.81 | 127 | $ | 22.82 | 81 | $ | 23.30 |
Granted | 0 | | 0 | 0 | | 0 | 52 | | 22.07 |
Exercised | 18 | | 22.81 | 6 | | 22.93 | 2 | | 23.00 |
Forfeited | 8 | | 22.07 | 0 | | 0 | 4 | | 22.75 |
Expired | 0 | | 0 | 0 | | 0 | 0 | | 0 |
Options outstanding, end of year | 95 | $ | 22.87 | 121 | $ | 22.81 | 127 | $ | 22.82 |
Options exercisable | 51 | $ | 23.57 | 34 | $ | 24.01 | 10 | $ | 26.63 |
As of December 31, 2012, there were options outstanding within the following ranges: 85 thousand at an exercise price within the range of $22.07 to $22.93, and 10 thousand at $26.63.
Options outstanding at December 31, 2012 had an intrinsic value of $372 thousand and a weighted average remaining term of 6.39 years. The total intrinsic value of options exercised was $73 thousand, $8 thousand and $6 thousand for the three years ended December 31, 2012, 2011 and 2010, respectively. We generally use shares held in treasury for option exercises. Options exercisable at December 31, 2012 had an intrinsic value of $163 thousand and a weighted average remaining term of 5.52 years. The total cash received from employees, net of withholding taxes, as a result of employee stock option exercises was $280 thousand, $0 and $59 thousand for the years ended December 31, 2012, 2011 and 2010, respectively. The tax benefit realized as a result of the stock option exercises was approximately $20 thousand, $1 thousand and $2 thousand for the years ended December 31, 2012, 2011 and 2010, respectively.
NOTE 13: EARNINGS PER SHARE
The following table presents reconciliations of the calculations of basic and diluted earnings per share for the years ended December 31, 2012, 2011 and 2010:
| | | | | | |
| | | | | | |
(In thousands except per share data) | 2012 | 2011 | 2010 |
Net income | $ | 15,194 | $ | 14,620 | $ | 15,461 |
Weighted average common shares outstanding | | 6,259 | | 6,212 | | 6,167 |
Dilutive effect of common stock equivalents | | 12 | | 12 | | 4 |
Weighted average common and common equivalent | | | | | | |
shares outstanding | | 6,271 | | 6,224 | | 6,171 |
Basic earnings per common share | $ | 2.43 | $ | 2.35 | $ | 2.51 |
Diluted earnings per common share | $ | 2.42 | $ | 2.35 | $ | 2.51 |
Basic earnings per common share were computed by dividing net income by the weighted average number of shares of common stock outstanding during the year. The computation of diluted earnings per share excludes the effect of assuming the exercise of certain outstanding stock options because the effect would be anti-dilutive. There were no anti-dilutive options outstanding for 2012. The average anti-dilutive options outstanding for 2011 and 2010 were 7,500 and 44,478, respectively.
NOTE 14: PARENT COMPANY
The Parent Company's investments in its subsidiaries are recorded using the equity method of accounting. Summarized financial information relative to the Parent Company only balance sheets at December 31, 2012 and 2011, and statements of income and cash flows for each of the years in the three year period ended December 31, 2012, are shown in the following table. The statement of changes in stockholders' equity for the Parent Company are not reported because they are identical to the consolidated financial statements.
| | | | |
| | | | |
Balance Sheets as of December 31, | | | | |
(In thousands) | 2012 | 2011 |
Assets: | | | | |
Investment in subsidiaries* | $ | 135,373 | $ | 127,581 |
Cash* | | 4,116 | | 3,395 |
Other assets | | 526 | | 696 |
Total assets | $ | 140,015 | $ | 131,672 |
Liabilities and shareholders’ equity: | | | | |
Other liabilities | $ | 1,175 | $ | 1,516 |
Long term debt | | 20,619 | | 20,619 |
Shareholders’ equity | | 118,221 | | 109,537 |
Total liabilities and shareholders’ equity | $ | 140,015 | $ | 131,672 |
| | | | | | |
| | | | | | |
Statements of Income for the Years Ended December 31, | | | | | | |
(In thousands) | 2012 | 2011 | 2010 |
Dividends from Merchants Bank* | $ | 7,607 | $ | 7,953 | $ | 6,901 |
Equity in undistributed earnings of subsidiaries* | | 8,721 | | 7,832 | | 9,705 |
Other expense, net | | (1,743) | | (1,788) | | (1,760) |
Benefit from income taxes | | 609 | | 623 | | 615 |
Net income | $ | 15,194 | $ | 14,620 | $ | 15,461 |
| | | | | | |
| | | | | | |
Statement of Cash Flows for the Years Ended December 31, | | | | | | |
(In thousands) | 2012 | 2011 | 2010 |
Cash flow from operating activities: | | | | | | |
Net income | $ | 15,194 | $ | 14,620 | $ | 15,461 |
Adjustments to reconcile net income to net cash provided by operating activities: | | | | | | |
Net change in other assets | | 170 | | (84) | | (187) |
Net change in other liabilities | | (116) | | 66 | | 201 |
Equity in undistributed earnings of subsidiaries* | | (8,721) | | (7,832) | | (9,705) |
Net cash provided by operating activities | | 6,527 | | 6,770 | | 5,770 |
Cash flows from financing activities: | | | | | | |
Sale of treasury stock | | 18 | | 14 | | 10 |
Proceeds from exercise of stock options | | 280 | | (1) | | 59 |
Tax benefit from exercises of stock options | | 20 | | 1 | | 2 |
Cash dividends paid | | (6,324) | | (6,233) | | (6,139) |
Other, net | | 200 | | 206 | | 208 |
Net cash used in financing activities | | (5,806) | | (6,013) | | (5,860) |
Increase (decrease) in cash and cash equivalents | | 721 | | 757 | | (90) |
Cash and cash equivalents at beginning of year | | 3,395 | | 2,638 | | 2,728 |
Cash and cash equivalents at end of year | $ | 4,116 | $ | 3,395 | $ | 2,638 |
| | | | | | |
* Account balances are partially or fully eliminated in consolidation | | | | | | |
NOTE 15: COMMITMENTS AND CONTINGENCIES
Financial Instruments with Off-Balance Sheet Risk
Merchants is a party to financial instruments with off-balance sheet risk in the normal course of business to meet the financing needs of its customers. These financial instruments primarily include commitments to extend credit and financial guarantees. Such instruments involve, to varying degrees, elements of credit and interest rate risk that are not recognized in the accompanying consolidated balance sheets.
Exposure to credit loss in the event of nonperformance by the other party to the financial instruments for commitments to extend credit and financial guarantees written is represented by the contractual amount of those instruments. We use the same credit policies in making commitments as we do for on-balance sheet instruments.
The contractual amounts of these financial instruments at December 31, 2012 and 2011 are as follows:
| | | | |
| | | | |
(In thousands) | 2012 | 2011 |
Financial instruments whose contract amounts represent credit risk: | | | | |
Commitments to originate loans | $ | 13,624 | $ | 17,569 |
Unused lines of credit | | 180,812 | | 186,196 |
Standby letters of credit | | 4,481 | | 4,262 |
Loans sold with recourse | | 8 | | 22 |
Equity commitments to affordable housing limited partnerships | | 869 | | 2,619 |
Commitments to extend credit are agreements to lend to a customer as long as there is no violation of any condition established in the contract. Commitments generally have fixed expiration dates or other termination clauses and may require payment of a fee. Since a portion of the commitment is expected to expire without being drawn upon, the total commitment amount does not necessarily represent a future cash requirement. We evaluate each customer's creditworthiness on a case-by-case basis. The amount of collateral obtained by us upon extension of credit is based on Management's credit evaluation of the counterparty, and an appropriate amount of real and/or personal property is typically obtained as collateral.
Disclosures are required regarding liability-recognition for the fair value at issuance of certain guarantees. We do not issue any guarantees that would require liability-recognition or disclosure, other than our standby letters of credit. We have issued conditional commitments in the form of standby letters of credit to guarantee payment on behalf of a customer and guarantee the performance of a customer to a third party. Standby letters of credit generally arise in connection with lending relationships. The credit risk involved in issuing these instruments is essentially the same as that involved in extending loans to customers. Contingent obligations under standby letters of credit totaled approximately $4.48 million and $4.26 million at December 31, 2012 and 2011, respectively, and represent the maximum potential future payments we could be required to make. Typically, these instruments have terms of 12 months or less and expire unused; therefore, the total amounts do not necessarily represent future cash requirements. Each customer is evaluated individually for creditworthiness under the same underwriting standards used for commitments to extend credit and on-balance sheet instruments. Our policies governing loan collateral apply to standby letters of credit at the time of credit extension. Loan-to-value ratios are generally consistent with loan-to-value requirements for other commercial loans secured by similar types of collateral.
We may enter into commitments to sell loans, which involve market and interest rate risk. There were no such commitments at December 31, 2012 or 2011.
Balances at the Federal Reserve Bank
At December 31, 2012 and 2011, amounts at the Federal Reserve Bank included $9.17 million and $12.22 million, respectively, held to satisfy certain reserve requirements of the Federal Reserve Bank.
Legal Proceedings
We have been named as defendants in various legal proceedings arising from our normal business activities. Although the amount of any ultimate liability with respect to such proceedings cannot be determined, in the opinion of Management, based upon input from counsel on the outcome of such proceedings, any such liability will not have a material effect on our consolidated financial position.
NOTE 16: FAIR VALUE OF FINANCIAL INSTRUMENTS
We record certain assets and liabilities at fair value. Fair value is defined as the price that would be received to sell an asset or paid to transfer a liability in an orderly transaction between market participants at the measurement date. Fair value measurements are also utilized to determine the initial value of certain assets and liabilities, to perform impairment assessments, and for disclosure purposes. We use quoted market prices and observable inputs to the maximum extent possible when measuring fair value. In the absence of quoted market prices, various valuation techniques are utilized to measure fair value. When possible, observable market data for identical or similar financial instruments are used in the valuation. When market data is not available, fair value is determined using valuation models that incorporate Management’s estimates of the assumptions a market participant would use in pricing the asset or liability.
Our valuation methodologies may produce a fair value calculation that may not be indicative of net realizable value or reflective of future fair values. While Management believes our valuation methodologies are appropriate and consistent with other market participants, the use of different methodologies or assumptions to determine the fair value of certain financial instruments could result in a different estimate of fair value at the reporting date. Furthermore, the reported fair value amounts have not been comprehensively revalued since the presentation dates, and therefore, estimates of fair value after the balance sheet date may differ significantly from the amounts presented herein. A more detailed description of the valuation methodologies used for assets and liabilities measured at fair value, as well as the general classification of such instruments pursuant to the valuation hierarchy, is set forth below.
The fair value hierarchy prioritizes the inputs to valuation techniques used to measure fair value. The hierarchy gives the highest priority to unadjusted quoted prices in active markets for identical assets or liabilities (Level 1 measurement) and the lowest priority to unobservable inputs (Level 3 measurements). The three levels of the fair value hierarchy are described below:
Ø | Level 1 - Unadjusted quoted prices in active markets that are accessible at the measurement date for identical, unrestricted assets or liabilities. |
Ø | Level 2 - Quoted prices for similar assets or liabilities in active markets, quoted prices in markets that are not active, or inputs that are observable, either directly or indirectly, for substantially the full term of the asset or liability. |
Ø | Level 3 - Prices or valuation techniques that require inputs that are both significant to the fair value measurement and unobservable (i.e., supported by little or no market activity). |
A financial instrument’s level within the fair value hierarchy is based on the lowest level of input that is significant to the fair value measurement.
Financial instruments on a recurring basis
The table below presents the balance of financial assets and liabilities at December 31, 2012 measured at fair value on a recurring basis:
| | | | | | | | |
| | | | | | | | |
| | | Fair Value Measurements at Reporting Date Using |
| | | Quoted Prices in Active Markets for Identical Assets | Significant Other Observable Inputs | Significant Unobservable Inputs |
(In thousands) | Total | (Level 1) | (Level 2) | (Level 3) |
Assets | | | | | | | | |
U.S. Treasury Obligations | $ | 100 | $ | 0 | $ | 100 | $ | 0 |
U.S. Agency Obligations | | 10,897 | | 0 | | 10,897 | | 0 |
U.S. GSEs | | 59,366 | | 0 | | 59,366 | | 0 |
FHLB Obligations | | 24,585 | | 0 | | 24,585 | | 0 |
Agency MBSs | | 148,767 | | 0 | | 148,767 | | 0 |
Agency CMBSs | | 5,029 | | 0 | | 5,029 | | 0 |
Agency CMOs | | 230,399 | | 0 | | 230,399 | | 0 |
CLOs | | 24,527 | | 0 | | 24,527 | | 0 |
Non-Agency CMOs | | 4,593 | | 0 | | 4,593 | | 0 |
ABSs | | 418 | | 0 | | 418 | | 0 |
Interest rate swap agreements | | 552 | | 0 | | 552 | | 0 |
Total assets | $ | 509,233 | $ | 0 | $ | 509,233 | $ | 0 |
Liabilities | | | | | | | | |
Interest rate swap agreements | | 1,610 | | 0 | | 1,610 | | 0 |
Total liabilities | $ | 1,610 | $ | 0 | $ | 1,610 | $ | 0 |
The table below presents the balance of financial assets and liabilities at December 31, 2011 measured at fair value on a recurring basis:
| | | | | | | | |
| | | | | | | | |
| | | Fair Value Measurements at Reporting Date Using |
| | | Quoted Prices in Active Markets for Identical Assets | Significant Other Observable Inputs | Significant Unobservable Inputs |
(In thousands) | Total | (Level 1) | (Level 2) | (Level 3) |
Assets | | | | | | | | |
U.S. Treasury Obligations | $ | 250 | $ | 0 | $ | 250 | $ | 0 |
U.S. GSEs | | 90,419 | | 0 | | 90,419 | | 0 |
FHLB Obligations | | 16,676 | | 0 | | 16,676 | | 0 |
Agency MBSs | | 183,838 | | 0 | | 183,838 | | 0 |
Agency CMOs | | 214,480 | | 0 | | 214,480 | | 0 |
Non-Agency CMOs | | 4,855 | | 0 | | 4,855 | | 0 |
ABSs | | 1,233 | | 0 | | 1,233 | | 0 |
Interest rate swap agreements | | 207 | | 0 | | 207 | | 0 |
Total assets | $ | 511,958 | $ | 0 | $ | 511,958 | $ | 0 |
Liabilities | | | | | | | | |
Interest rate swap agreements | | 1,613 | | 0 | | 1,613 | | 0 |
Total liabilities | $ | 1,613 | $ | 0 | $ | 1,613 | $ | 0 |
Investment securities are reported at fair value utilizing Level 2 inputs. The prices for these instruments are obtained through an independent pricing service or dealer market participant with whom we have historically transacted both purchases and sales of investment securities. Prices obtained from these sources include market quotations and matrix pricing. The fair value measurements consider observable data that may include dealer quotes, market spreads, cash flows, the U.S. Treasury yield curve, live trading levels, trade execution data, market consensus prepayment speeds, credit information and the bond’s terms and conditions, among other things. More information regarding our investment securities can be found in Footnote 3 to these consolidated financial statements.
The interest rate swaps are reported at their fair value utilizing Level 2 inputs from third parties. The fair value of our interest rate swaps are determined using prices obtained from a third party advisor. The fair value measurement of the interest rate swap is determined by netting the discounted future fixed cash payments and the discounted expected variable cash receipts. The variable cash receipts are based on the expectation of future interest rates derived from observed market interest rate curves.
There were no transfers between Level 1 and Level 2 for the year ended December 31, 2012 or December 31, 2011. There were no Level 3 assets measured at fair value on a recurring basis during the year ended December 31, 2012.
Financial instruments on a non-recurring basis
Certain assets are also measured at fair value on a non-recurring basis. These other financial assets include impaired loans and OREO.
The table below presents the balance of financial assets at December 31, 2012 measured at fair value on a nonrecurring basis:
| | | | | | | | |
| | | | | | | | |
| | | Fair Value Measurements at Reporting Date Using |
| | | Quoted Prices in Active Markets for Identical Assets | Significant Other Observable Inputs | Significant Unobservable Inputs |
(In thousands) | Total | (Level 1) | (Level 2) | (Level 3) |
OREO | $ | 0 | $ | 0 | $ | 0 | $ | 0 |
Impaired loans | | 2,912 | | 0 | | 0 | | 2,912 |
Total | $ | 2,912 | $ | 0 | $ | 0 | $ | 2,912 |
The table below presents the balance of financial assets at December 31, 2011 measured at fair value on a nonrecurring basis:
| | | | | | | | |
| | | | | | | | |
| | | Fair Value Measurements at Reporting Date Using |
| | | Quoted Prices in Active Markets for Identical Assets | Significant Other Observable Inputs | Significant Unobservable Inputs |
(In thousands) | Total | (Level 1) | (Level 2) | (Level 3) |
OREO | $ | 358 | $ | 0 | $ | 0 | $ | 358 |
Impaired loans | | 2,511 | | 0 | | 0 | | 2,511 |
Total | $ | 2,869 | $ | 0 | $ | 0 | $ | 2,869 |
In accordance with the provisions of FASB ASC Subtopic 310-10-35, “Accounting by Creditors for Impairment of a Loan – an Amendment of FASB Statements No. 5 and 15,” we had collateral dependent impaired loans with a carrying value of approximately $3.02 million, which had specific reserves included in the allowance for loan losses of $569 thousand at December 31, 2012.
We use the fair value of underlying collateral to estimate the specific reserves for collateral dependent impaired loans. Collateral may be real estate and/or business assets including equipment, inventory and accounts receivable. Real estate values are determined based on appraisals by qualified licensed appraisers we have hired. These appraisals may utilize a single valuation approach or a combination of approaches including comparable sales and the income approach. Management’s ongoing review of appraisal information may result in additional discounts or adjustments to valuation based upon more recent market sales activity or more current appraisal information derived from properties of similar type and/or locale. Other business assets are valued using a variety of approaches including appraisals, depreciated book value, purchase price and independent confirmation of accounts receivable. OREO in the table above consists of property acquired through foreclosures and settlements of loans. Property acquired is carried at the lower of cost or the estimated fair value of the property, determined by an independent appraisal, and is adjusted for estimated disposal costs. Certain inputs used in appraisals, and possible subsequent adjustments, are not always observable, and therefore, collateral dependent impaired loans and OREO are categorized as Level 3 within the fair value hierarchy.
The table below presents the valuation methodology and unobservable inputs for Level 3 assets measured at fair value on a non-recurring basis at December 31, 2012:
| | | | | |
| | | | | |
| | | | | Range of |
(Dollars in thousands) | Fair value | Valuation Methodology | Unobservable Inputs | Inputs |
OREO | $ | 0 | Appraisal of collateral | Appraisal adjustments | 0%-40% |
Impaired loans | | 2,912 | Appraisal of collateral | Appraisal adjustments | 0%-40% |
The methodology and unobservable inputs at December 31, 2012 are consistent with those at December 31, 2011.
Changes to our assumptions about unobservable inputs will impact our estimate of fair value. Discounts to appraised values reflect the age of the appraisal and estimated costs of disposition.
GAAP requires disclosure of the fair value of financial assets and financial liabilities, including those financial assets and financial liabilities that are not measured and reported at fair value on a recurring or non-recurring basis.
The fair value of Merchants’ financial instruments as of December 31, 2012 are summarized in the table below:
| | | | | | | | | | |
| | | | | | | | | | |
| Carrying | | | | | | | |
(In thousands) | Amount | Fair Value | | Level 1 | | Level 2 | | Level 3 |
Cash and cash equivalents | $ | 77,228 | $ | 77,228 | $ | 77,228 | $ | 0 | $ | 0 |
Securities available for sale | | 508,681 | | 508,681 | | 0 | | 508,681 | | 0 |
Securities held to maturity | | 407 | | 454 | | 0 | | 454 | | 0 |
FHLB stock | | 8,145 | | 8,145 | | 0 | | 8,145 | | 0 |
Loans, net of allowance for loan losses | | 1,071,361 | | 1,096,188 | | 0 | | 0 | | 1,096,188 |
Interest rate contract-cash flow hedge | | 552 | | 552 | | 0 | | 552 | | 0 |
Accrued interest receivable | | 4,368 | | 4,368 | | 0 | | 4,368 | | 0 |
Total assets | $ | 1,670,742 | $ | 1,695,616 | $ | 77,228 | $ | 522,200 | $ | 1,096,188 |
Deposits | $ | 1,271,080 | $ | 1,273,573 | $ | 940,682 | $ | 332,891 | $ | 0 |
Short-term borrowings | | 0 | | 0 | | 0 | | 0 | | 0 |
Securities sold under agreement to repurchase | | 287,520 | | 287,837 | | 0 | | 287,837 | | 0 |
Other long-term debt | | 2,483 | | 2,502 | | 0 | | 2,502 | | 0 |
Junior subordinated debentures issued to unconsolidated subsidiary trust | | 20,619 | | 15,177 | | 0 | | 15,177 | | 0 |
Interest rate contract-cash flow hedge | | 1,610 | | 1,610 | | 0 | | 1,610 | | 0 |
Accrued interest payable | | 195 | | 195 | | 0 | | 195 | | 0 |
Total liabilities | $ | 1,583,507 | $ | 1,580,894 | $ | 940,682 | $ | 640,212 | $ | 0 |
The fair value of Merchants’ financial instruments as of December 31, 2011 are summarized in the table below:
| | | | | | | | | | |
| | | | | | | | | | |
| Carrying | | | | | | | |
(In thousands) | Amount | Fair Value | | Level 1 | | Level 2 | | Level 3 |
Cash and cash equivalents | $ | 37,812 | $ | 37,812 | $ | 37,812 | $ | 0 | $ | 0 |
Securities available for sale | | 511,751 | | 511,751 | | 0 | | 511,751 | | 0 |
Securities held to maturity | | 558 | | 624 | | 0 | | 624 | | 0 |
FHLB stock | | 8,630 | | 8,630 | | 0 | | 8,630 | | 0 |
Loans, net of allowance for loan losses | | 1,017,007 | | 1,035,131 | | 0 | | 0 | | 1,035,131 |
Interest rate contract-cash flow hedge | | 207 | | 207 | | 0 | | 207 | | 0 |
Accrued interest receivable | | 5,121 | | 5,121 | | 0 | | 5,121 | | 0 |
Total assets | $ | 1,581,086 | $ | 1,599,276 | $ | 37,812 | $ | 526,333 | $ | 1,035,131 |
Deposits | $ | 1,177,880 | $ | 1,181,066 | $ | 829,632 | $ | 351,434 | $ | 0 |
Short-term borrowings | | 0 | | 0 | | 0 | | 0 | | 0 |
Securities sold under agreement to repurchase | | 262,527 | | 263,062 | | 0 | | 263,062 | | 0 |
Other long-term debt | | 22,562 | | 23,594 | | 0 | | 23,594 | | 0 |
Junior subordinated debentures issued to unconsolidated subsidiary trust | | 20,619 | | 15,268 | | 0 | | 15,268 | | 0 |
Interest rate contract-cash flow hedge | | 1,613 | | 1,613 | | 0 | | 1,613 | | 0 |
Accrued interest payable | | 282 | | 282 | | 0 | | 282 | | 0 |
Total liabilities | $ | 1,485,483 | $ | 1,484,885 | $ | 829,632 | $ | 655,253 | $ | 0 |
The carrying amounts reported in the consolidated balance sheets for cash and cash equivalents, FHLBB stock, accrued interest receivable and accrued interest payable approximate fair value.
The methodologies for other financial assets and financial liabilities are discussed below.
Loans - The fair value for loans is estimated using discounted cash flow analyses, using interest rates and spreads currently being offered for loans with similar terms to borrowers of similar credit quality. The fair value estimates, methods and assumptions set forth below for our financial instruments, including those financial instruments carried at cost, are made solely to comply with disclosures required by generally accepted accounting principles in the United States and do not always incorporate the exit-price concept of fair value proscribed by ASC 820-10 and should be read in conjunction with the financial statements and associated footnotes.
Deposits - The fair value of demand deposits approximates the amount reported in the consolidated balance sheets. The fair value of variable rate, fixed term certificates of deposit also approximates the carrying amount reported in the consolidated balance sheets. The fair value of fixed rate and fixed term certificates of deposit is estimated using a discounted cash flow method which applies interest rates currently being offered for deposits of similar remaining maturities.
Debt - The fair value of debt is estimated using current market rates for borrowings of similar remaining maturity.
Commitments to Extend Credit and Standby Letters of Credit - The fair value of commitments to extend credit is estimated using the fees currently charged to enter into similar agreements, taking into account the remaining terms of the agreements and the present creditworthiness of the counterparties. For fixed rate loan commitments, fair value also considers the difference between current levels of interest rates and the committed rates. The fair value of financial standby letters of credit is based on fees currently charged for similar agreements or on the estimated cost to terminate them or otherwise settle the obligations with the counterparties. The fair value of commitments to extend credit and standby letters of credit is approximately $45 thousand at December 31, 2012 and $42 thousand as of December 31, 2011, respectively.
Limitations ‑ Fair value estimates are made at a specific point in time based on relevant market information and information about the financial instruments. Because no market exists for a significant portion of the financial instruments, fair value estimates are based on judgments regarding future expected loss experience, current economic conditions, risk characteristics of various financial instruments, and other such factors.
These estimates do not reflect any premium or discount that could result from offering for sale at one time our entire holdings of a particular financial instrument. These estimates are subjective in nature and require considerable judgment to interpret market data. Accordingly, the estimates presented herein are not necessarily indicative of the amounts we could realize in a current market exchange, nor are they intended to represent the fair value of us as a whole. The use of different market assumptions and/or estimation methodologies may have a material effect on the estimated fair value amounts. The fair value estimates presented herein are based on pertinent information available to Management as of the respective balance sheet date. Although we are not aware of any factors that would significantly affect the estimated fair value amounts, such amounts have not been comprehensively revalued since the presentation dates, and therefore, estimates of fair value after the balance sheet date may differ significantly from the amounts presented herein.
Other significant assets, such as premises and equipment, other assets, and liabilities not defined as financial instruments, are not included in the above disclosures. Also, the fair value estimates for deposits do not include the benefit that results from the low-cost funding provided by the deposit liabilities compared to the cost of borrowing funds in the market.
NOTE 17: COMPREHENSIVE INCOME
The accumulated balances for each classification of other comprehensive income are as follows:
| | | | | | | | | | |
| | | | | | | | | |
(In thousands) | Unrealized (gains) losses on securities | Pension and postretirement benefit plans | Interest rate swaps | Unrealized gains (losses) on securities deemed other than temporarily impaired | Accumulated other comprehensive income (loss) |
Balance January 1, 2010 | $ | 5,763 | $ | (2,458) | $ | (425) | $ | (213) | $ | 2,667 |
Net current period change | | 266 | | 172 | | (366) | | 292 | | 364 |
Reclassification adjustments for (gains) losses reclassified into income | | (1,354) | | 0 | | 0 | | 0 | | (1,354) |
Balance December 31, 2010 | $ | 4,675 | $ | (2,286) | $ | (791) | $ | 79 | $ | 1,677 |
Net current period change | | 2,583 | | (396) | | (123) | | 7 | | 2,071 |
Reclassification adjustments for (gains) losses reclassified into income | | (646) | | 0 | | 0 | | 0 | | (646) |
Balance December 31, 2011 | $ | 6,612 | $ | (2,682) | $ | (914) | $ | 86 | $ | 3,102 |
Net current period change | | (250) | | (448) | | 226 | | (86) | | (558) |
Reclassification adjustments for (gains) losses reclassified into income | | (329) | | 0 | | 0 | | 0 | | (329) |
Balance December 31, 2012 | $ | 6,033 | $ | (3,130) | $ | (688) | $ | 0 | $ | 2,215 |
NOTE 18: REGULATORY CAPITAL REQUIREMENTS
We are subject to various regulatory capital requirements administered by federal banking agencies. Failure to meet minimum capital requirements can initiate certain mandatory, and possibly additional discretionary, actions by regulators that, if undertaken, could have a direct material effect on our financial statements. Under capital adequacy guidelines, we must meet specific capital guidelines that involve quantitative measures of our assets, liabilities, and certain off-balance sheet items as calculated under regulatory accounting practices. It is the policy of the FRB that banks and bank holding companies, respectively, should pay dividends only out of current earnings and only if, after paying such dividends, the bank or bank holding company would remain adequately capitalized. We are also subject to the regulatory framework for prompt corrective action that requires it to meet specific capital guidelines to be considered well capitalized. Our capital amounts and classification are also subject to qualitative judgments by the regulators about components, risk weightings and other factors.
Quantitative measures established by regulation to ensure capital adequacy require us to maintain minimum ratios (set forth in the table below) of total and Tier 1 capital (as defined in the regulations) to risk-weighted assets (as defined) and of Tier 1 capital (as defined) to average assets (as defined). Management believes, as of December 31, 2012, that Merchants met all capital adequacy requirements to which it is subject.
As of December 31, 2012, the most recent notification from the FDIC categorized Merchants Bank as well capitalized under the regulatory framework for prompt corrective action. There are no conditions or events since that notification that Management believes have changed Merchants Bank’s category. To be considered well capitalized under the regulatory framework for prompt corrective action, Merchants Bank must maintain minimum Tier 1 Leverage, Tier 1 Risk-Based, and Total Risk-Based Capital ratios. Set forth in the table below are those ratios as well as those for Merchants Bancshares, Inc.
| | | | | | | | | | | | | | |
| | | | | | | | | | | | | | |
| | | | | | | | | | | To Be Well- |
| | | | | | | | | | | Capitalized Under |
| | | | | | For Capital | | Prompt Corrective |
| Actual | | Adequacy Purposes | | Action Provisions |
(In thousands) | Amount | Percent | | Amount | Percent | | Amount | Percent |
As of December 31, 2012 | | | | | | | | | | | | | | |
Merchants Bancshares, Inc.: | | | | | | | | | | | | | | |
Tier 1 Leverage Capital | $ | 136,004 | 8.08 | % | | $ | 67,307 | 4.00 | % | | | N/A | N/A | |
Tier 1 Risk-Based Capital | | 136,004 | 14.75 | % | | | 36,887 | 4.00 | % | | | N/A | N/A | |
Total Risk-Based Capital | | 147,505 | 16.00 | % | | | 73,753 | 8.00 | % | | | N/A | N/A | |
Merchants Bank: | | | | | | | | | | | | | | |
Tier 1 Leverage Capital | $ | 131,850 | 7.81 | % | | $ | 67,494 | 4.00 | % | | $ | 84,367 | 5.00 | % |
Tier 1 Risk-Based Capital | | 131,850 | 14.21 | % | | | 37,123 | 4.00 | % | | | 55,684 | 6.00 | % |
Total Risk-Based Capital | | 143,422 | 15.45 | % | | | 74,245 | 8.00 | % | | | 92,806 | 10.00 | % |
As of December 31, 2011 | | | | | | | | | | | | | | |
Merchants Bancshares, Inc.: | | | | | | | | | | | | | | |
Tier 1 Leverage Capital | $ | 126,435 | 8.08 | % | | $ | 62,573 | 4.00 | % | | | N/A | N/A | |
Tier 1 Risk-Based Capital | | 126,435 | 14.66 | % | | | 34,490 | 4.00 | % | | | N/A | N/A | |
Total Risk-Based Capital | | 137,255 | 15.92 | % | | | 68,981 | 8.00 | % | | | N/A | N/A | |
Merchants Bank: | | | | | | | | | | | | | | |
Tier 1 Leverage Capital | $ | 122,946 | 7.84 | % | | $ | 62,740 | 4.00 | % | | $ | 78,425 | 5.00 | % |
Tier 1 Risk-Based Capital | | 122,946 | 14.16 | % | | | 34,723 | 4.00 | % | | | 52,084 | 6.00 | % |
Total Risk-Based Capital | | 133,837 | 15.42 | % | | | 69,446 | 8.00 | % | | | 86,807 | 10.00 | % |
Capital amounts for Merchants Bancshares, Inc. include $20 million in trust preferred securities issued in December 2004. These hybrid securities qualify as regulatory capital up to certain regulatory limits.
NOTE 19: DERIVATIVE FINANCIAL INSTRUMENTS
At December 31, 2012 and 2011, we held interest rate swaps with a combined notional amount of $10 million and $20 million, respectively, that were designated as cash flow hedges. The swaps were used to convert all or a portion of the floating rate interest on our trust preferred issuance to a fixed rate of interest. The purpose of the hedge was to protect us from the risk of variability arising from the floating rate interest on the debentures. The effective portion of unrealized changes in the fair value of derivatives accounted for as cash flow hedges are reported in other comprehensive income and reclassified to earnings if gains or losses are realized. Each quarter we assess the effectiveness of the hedging relationships by comparing the changes in cash flows of the derivative hedging instruments with the changes in cash flows of the designated hedged item. The ineffective portion of changes in the fair value of the derivatives is recognized directly in earnings. There was no ineffective portion recognized in earnings during 2012, 2011 or 2010. The fair value of $(1.06) million and $(1.41) million was reflected in other comprehensive income in the accompanying consolidated balance sheets at December 31, 2012 and December 31, 2011, respectively.
At December 31, 2012 and 2011, we had two interest rate derivative positions, with a combined notional amount of $28.63 million and $29.60 million, respectively, that were not designated as hedging instruments. These derivative positions related to a transaction in which we entered into an interest rate swap with a customer while at the same time entering into an offsetting rate swap with another financial institution. In connection with the transaction, we agreed to pay interest to the customer on a notional amount at a variable interest rate and receive interest from the customer on the same notional amount at a fixed interest rate. At the same time, we agreed to pay another financial institution the same fixed interest rate on the same notional amount and receive the same variable interest rate on the same notional amount. The transaction allows our customer to effectively convert a variable rate loan to a fixed rate loan. Because the terms of the swaps with our customer and the other financial institution offset each other, with the only difference being counterparty credit risk, changes in the fair value of the underlying derivative contracts are not materially different and do not significantly impact our results of operations. The fair value was reflected in other assets and other liabilities in the accompanying consolidated balance sheets at December 31, 2012. We assessed our counterparty risk at December 31, 2012 and determined any credit risk inherent in our derivative contracts was insignificant. Information about the fair value of derivative financial instruments can be found in Footnote 16 to these consolidated financial statements.
REPORT OF INDEPENDENT REGISTERED PUBLIC ACCOUNTING FIRM
The Board of Directors and Shareholders
Merchants Bancshares, Inc.:
We have audited the accompanying consolidated balance sheets of Merchants Bancshares, Inc. and subsidiaries (the Company) as of December 31, 2012 and 2011 and the related consolidated statements of income, comprehensive income, changes in shareholders’ equity, and cash flows for each of the years in the three-year period ended December 31, 2012. These consolidated financial statements are the responsibility of the Company’s management. Our responsibility is to express an opinion on these consolidated financial statements based on our audits.
We conducted our audits in accordance with the standards of the Public Company Accounting Oversight Board (United States). Those standards require that we plan and perform the audit to obtain reasonable assurance about whether the financial statements are free of material misstatement. An audit includes examining, on a test basis, evidence supporting the amounts and disclosures in the financial statements. An audit also includes assessing the accounting principles used and significant estimates made by management, as well as evaluating the overall financial statement presentation. We believe that our audits provide a reasonable basis for our opinion.
In our opinion, the consolidated financial statements referred to above present fairly, in all material respects, the financial position of Merchants Bancshares, Inc. and subsidiaries as of December 31, 2012 and 2011 and the results of their operations and their cash flows for each of the years in the three-year period ended December 31, 2012, in conformity with U.S. generally accepted accounting principles.
We also have audited, in accordance with the standards of the Public Company Accounting Oversight Board (United States), Merchants Bancshares, Inc.’s internal control over financial reporting as of December 31, 2012, based on criteria established in Internal Control – Integrated Framework issued by the Committee of Sponsoring Organizations of the Treadway Commission (COSO) and our report dated March 5, 2013, expressed an unqualified opinion on the effectiveness of Merchants Bancshares, Inc.’s internal control over financial reporting.
/s/ KPMG LLP
Albany, New York
March 5, 2013
REPORT OF INDEPENDENT REGISTERED PUBLIC ACCOUNTING FIRM
The Board of Directors and Shareholders
Merchants Bancshares, Inc.:
We have audited Merchants Bancshares, Inc.’s internal control over financial reporting as of December 31, 2012, based on criteria established in Internal Control – Integrated Framework issued by the Committee of Sponsoring Organizations of the Treadway Commission (COSO). Merchants Bancshares, Inc.’s management is responsible for maintaining effective internal control over financial reporting and for its assessment of the effectiveness of internal control over financial reporting, included in the accompanying “Managements Report on Internal Control Over Financial Reporting.” Our responsibility is to express an opinion on the Company’s internal control over financial reporting based on our audit.
We conducted our audit in accordance with the standards of the Public Company Accounting Oversight Board (United States). Those standards require that we plan and perform the audit to obtain reasonable assurance about whether effective internal control over financial reporting was maintained in all material respects. Our audit included obtaining an understanding of internal control over financial reporting, assessing the risk that a material weakness exists, and testing and evaluating the design and operating effectiveness of internal control based on the assessed risk. Our audit also included performing such other procedures as we considered necessary in the circumstances. We believe that our audit provides a reasonable basis for our opinion.
A company’s internal control over financial reporting is a process designed to provide reasonable assurance regarding the reliability of financial reporting and the preparation of financial statements for external purposes in accordance with generally accepted accounting principles. A company’s internal control over financial reporting includes those policies and procedures that (1) pertain to the maintenance of records that, in reasonable detail, accurately and fairly reflect the transactions and dispositions of the assets of the company; (2) provide reasonable assurance that transactions are recorded as necessary to permit preparation of financial statements in accordance with generally accepted accounting principles, and that receipts and expenditures of the company are being made only in accordance with authorizations of management and directors of the company; and (3) provide reasonable assurance regarding prevention or timely detection of unauthorized acquisition, use, or disposition of the company’s assets that could have a material effect on the financial statements.
Because of its inherent limitations, internal control over financial reporting may not prevent or detect misstatements. Also, projections of any evaluation of effectiveness to future periods are subject to the risk that controls may become inadequate because of changes in conditions or that the degree of compliance with the policies or procedures may deteriorate.
In our opinion, Merchants Bancshares, Inc. maintained, in all material respects, effective internal control over financial reporting as of December 31, 2012, based on criteria established in Internal Control – Integrated Framework issued by the Committee of Sponsoring Organizations of the Treadway Commission.
We also have audited, in accordance with the standards of the Public Company Accounting Oversight Board (United States), the consolidated balance sheets of Merchants Bancshares, Inc. and subsidiaries as of December 31, 2012 and 2011 and the related consolidated statements of income, comprehensive income, changes in shareholders’ equity and cash flows for each of the years in the three-year period ended December 31, 2012, and our report dated March 5, 2013, expressed an unqualified opinion on those consolidated financial statements.
/s/ KPMG LLP
Albany, New York
March 5, 2013
ITEM 9 - CHANGES IN AND DISAGREEMENTS WITH ACCOUNTANTS ON ACCOUNTING AND FINANCIAL DISCLOSURE
None.
ITEM 9A - CONTROLS AND PROCEDURES
Evaluation of Disclosure Controls and Procedures – Our principal executive officer and principal financial officer have evaluated our disclosure controls and procedures (as defined in Rules 13a-15(e) or 15d-15(e) under the Exchange Act) as of December 31, 2012. Based on this evaluation, the principal executive officer and principal financial officer have concluded that our disclosure controls and procedures effectively ensure that information required to be disclosed in our filings and submissions with the Securities and Exchange Commission under the Exchange Act is recorded, processed, summarized and reported within the time periods specified by the Securities and Exchange Commission.
Management’s Report on Internal Control Over Financial Reporting – Management is responsible for establishing and maintaining adequate internal control over financial reporting, as such term is defined in Exchange Act Rule 13a-15(f) or 15d-15(f). Our internal control system was designed to provide reasonable assurances to our Management and board of directors regarding the preparation and fair presentation of published financial statements. Under the supervision and with the participation of our Management, including our principal executive officer and principal financial officer, an evaluation of the effectiveness of our internal control over financial reporting was conducted, based on the framework in Internal Control – Integrated Framework issued by the Committee of Sponsoring Organizations of the Treadway Commission. Based on the evaluation under the framework in Internal Control – Integrated Framework, Management concluded that our internal control over financial reporting was effective as of December 31, 2012.
KPMG LLP, the independent registered public accounting firm that audited our consolidated financial statements, has issued an attestation report on our internal control over financial reporting as of December 31, 2012. This report can be found on page 82.
Changes in Internal Controls over Financial Reporting – No changes in our internal controls over financial reporting that have materially affected, or are reasonably likely to materially affect, our internal controls over financial reporting occurred during the fourth quarter of 2012.
ITEM 9B – OTHER INFORMATION
None.
PART III
ITEM 10 – DIRECTORS, EXECUTIVE OFFICERS AND CORPORATE GOVERNANCE
ITEM 11 - EXECUTIVE COMPENSATION
ITEM 12 - SECURITY OWNERSHIP OF CERTAIN BENEFICIAL OWNERS AND MANAGEMENT AND RELATED STOCKHOLDER MATTERS
ITEM 13 - CERTAIN RELATIONSHIPS AND RELATED TRANSACTIONS, AND DIRECTOR INDEPENDENCE
ITEM 14 - PRINCIPAL ACCOUNTING FEES AND SERVICES
Information required by Items 10 through 14 will be included in our Proxy Statement to be filed relating to our 2013 Annual Meeting of Shareholders and is incorporated herein by reference.
Pursuant to Rule 12b-23 and Instruction G to Form 10-K, our Proxy Statement will be filed within 120 days subsequent to the end of our fiscal year ended December 31, 2012.
PART IV
ITEM 15 – EXHIBITS, FINANCIAL STATEMENT SCHEDULES
(1) The following consolidated financial statements are included:
Consolidated Balance Sheets, December 31, 2012, and December 31, 2011
Consolidated Statements of Income for the years ended December 31, 2012, 2011 and 2010
Consolidated Statements of Comprehensive Income for the years ended December 31, 2012, 2011 and 2010
Consolidated Statements of Changes in Shareholders’ Equity for the years ended December 31, 2012, 2011 and 2010
Consolidated Statements of Cash Flows for the years ended December 31, 2012, 2011 and 2010
Notes to Consolidated Financial Statements
(2) The following exhibits are either filed or attached as part of this report, or are incorporated herein by reference:
Exhibit Description
| |
| |
3.1.1 | Certificate of Incorporation, filed on April 20, 1987 (Incorporated by reference to Exhibit 3.1.1 to Merchants’ Annual Report on Form 10-K for the Year Ended December 31, 2011) |
3.1.2 | Certificate of Merger, filed on June 5, 1987 (Incorporated by reference to Exhibit 3.1.2 to Merchants’ Annual Report on Form 10-K for the Year Ended December 31, 2006) |
3.1.3 | Certificate of Amendment, filed on May 11, 1988 (Incorporated by reference to Exhibit 3.1.3 to Merchants’ Annual Report on Form 10-K filed on March 16, 2007) |
3.1.4 | Certificate of Amendment, filed on April 29, 1991 (Incorporated by reference to Exhibit 3.1.4 to Merchants’ Annual Report on Form 10-K filed on March 16, 2007) |
3.1.5 | Certificate of Amendment, filed on August 29, 2006 (Incorporated by reference to Exhibit 3.1.5 to Merchants’ Annual Report on Form 10-K filed on March 16, 2007) |
3.1.6 | Certificate of Amendment, filed August 29, 2006 (Incorporated by reference to Exhibit 3.1.6 to Merchants’ Annual Report on Form 10-K filed on March 16, 2007) |
3.2 | Amended and Restated Bylaws of Merchants (Incorporated by reference to Exhibit 3.2 to Merchants’ Report on Form 8-K filed on April 16, 2009) |
4 | Specimen of Merchants’ Common Stock Certificate (Incorporated by reference to Exhibit 4.1 to Merchants’ Annual Report on Form 10-K filed on March 13, 2008) |
10.1 | Merchants Bancshares, Inc. Dividend Reinvestment and Stock Purchase Plan (Incorporated by reference to Exhibit 4.1 to Merchants’ Registration Statement on Form S-3 (Registration No. 333-151572) filed on June 11, 2008) |
10.2 | Amended and Restated Merchants Bancshares, Inc. 2008 Stock Incentive Plan (Incorporated by reference to Exhibit 10.1 to Merchants’ Current Report on Form 8-K filed on May 6, 2011) + |
10.3 | First Amendment to Amended and Restated Merchants Bancshares, Inc. 2008 Stock Incentive Plan (Incorporated by reference to Exhibit 10.3 to Merchants’ Annual Report on Form 10-K for the Year Ended December 31, 2011) + |
10.4 | Form of Restricted Stock Agreement (Incorporated by reference to Exhibit 10.4 to Merchants’ Annual Report on Form 10-K for the Year Ended December 31, 2011) + |
10.5 | The Merchants Bancshares, Inc. and Subsidiaries Amended and Restated 1996 Compensation Plan for Non-Employee Directors (Incorporated by reference to Exhibit 10.3 to Merchants’ Annual Report on Form 10-K filed on March 15, 2011) + |
10.6 | The Merchants Bancshares, Inc. and Subsidiaries Amended and Restated 2008 Compensation Plan for Non-Employee Directors and Trustees (Incorporated by reference to Exhibit 10.3 to Merchants’ Annual Report on Form 10-K filed on March 15, 2011) + |
10.7 | Merchants Bancshares, Inc. Executive Annual Incentive Plan (Incorporated by reference to Exhibit 10.1 to Merchants’ Report on Form 8-K filed on March 2, 2011) + |
10.8 | Employment Agreement by and among Merchants, Merchants Bank and Michael R. Tuttle, dated March 17, 2011 (Incorporated by reference to Exhibit 10.1 to Merchants’ Current Report on Form 8-K filed on March 23, 2011) + |
10.9 | Employment Agreement by and among Merchants, Merchants Bank and Janet P. Spitler, dated March 17, 2011 (Incorporated by reference to Exhibit 10.2 to Merchants’ Current Report on Form 8-K filed on March 23, 2011) + |
10.10 | The Merchants Bank Amended and Restated Deferred Compensation Plan for Directors (Incorporated by reference to Exhibit 10.7 to Merchants’ Annual Report on Form 10-K filed on March 15, 2011) + |
10.11 | Trust under the Merchants Bank Amended and Restated Deferred Compensation Plan for Directors (Incorporated by reference to Exhibit 10.8 to Merchants’ Annual Report on Form 10-K filed on March 15, 2011) + |
10.12 | Agreement among the Merchants Bank and Kathryn T. Boardman, Thomas R. Havers and Susan D. Struble dated as of December 20, 1995 (Incorporated by reference to Exhibit 10.9 to Merchants’ Annual Report on Form 10-K filed on March 15, 2011) + |
10.13 | Trust under the Agreement among the Merchants Bank and Kathryn T. Boardman, Thomas R. Havers and Susan D. Struble dated as of December 20, 1995 (Incorporated by reference to Exhibit 10.10 to Merchants’ Annual Report on Form 10-K filed on March 15, 2011) + |
10.14 | Employment Agreement by and between Merchants Bank and Thomas R. Havers, dated March 17, 2011 (Incorporated by reference to Exhibit 10.4 to Merchants’ Current Report on Form 8-K filed on March 23, 2011) + |
10.15 | Employment Agreement by and between Merchants Bank and Geoffrey R. Hesslink, dated March 17, 2011 (Incorporated by reference to Exhibit 10.5 to Merchants’ Current Report on Form 8-K filed on March 23, 2011) + |
10.16 | Indenture, dated December 15, 2004, by and between Merchants Bancshares, Inc. and Wilmington Trust Company, as trustee (Incorporated by reference to Exhibit 10.5 to Merchants’ Annual Report on Form 10-K filed on March 9, 2005) |
10.17 | Guarantee Agreement, dated December 15, 2004, by and between Merchants Bancshares, Inc. and Wilmington Trust Company dated December 15, 2004 for the benefit of the holders from time to time of the Capital Securities of MBVT Statutory Trust I (Incorporated by reference to Exhibit 10.5.3 to Merchants’ Annual Report on Form 10-K filed on March 9, 2005) |
10.18 | Declaration of Trust of MBVT Statutory Trust I, dated December 2, 2004 (Incorporated by reference to Exhibit 10.5.2 to Merchants’ Annual Report on Form 10-K filed on March 9, 2005) |
10.19 | Subscription Agreement, dated December 15, 2004, by and among MBVT Statutory Trust I, Merchants and Preferred Term Securities XVI, Ltd. (Incorporated by reference to Exhibit 10.5.1 to Merchants’ Annual Report on Form 10-K filed on March 9, 2005) |
10.20 | Placement Agreement, dated December 7, 2004, by and among Merchants Bancshares, Inc., FTN Financial Capital Markets and Keefe, Bruyette & Woods, Inc. (Incorporated by reference to Exhibit 10.5.4 to Merchants’ Annual Report on Form 10-K filed on March 9, 2005) |
10.21 | Purchase and Sale Agreement between Merchants Bank and Eastern Avenue Properties, L.L.C., dated as of June 27, 2008 (Incorporated by reference to Exhibit 10.18.1 to Merchants’ Quarterly Report on Form 10-Q for the Quarter Ended June 30, 2008) |
10.22 | Leaseback Agreement between Merchants Bank and Farrell Exchange, L.L.C., dated as of June 27, 2008 (Incorporated by reference to Exhibit 10.18.2 to Merchants’ Quarterly Report on Form 10-Q for the Quarter Ended June 30, 2008) |
21 | Subsidiaries of Merchants (Incorporated by reference to Exhibit 21 to Merchants’ Annual Report on Form 10-K for the Year Ended December 31, 2011) |
23 | Consent of KPMG LLP* |
31.1 | Certification of Chief Executive Officer Pursuant to Rules 13a-14 and 15d-14 under the Securities Exchange Act of 1934, as amended* |
31.2 | Certification of Chief Financial Officer Pursuant to Rules 13a-14 and 15d-14 under the Securities Exchange Act of 1934, as amended* |
32.1 | Certification of Chief Executive Officer Pursuant to 18 U.S.C. Section 1350, as adopted pursuant to Section 906 of the Sarbanes-Oxley Act of 2002** |
32.2 | Certification of Chief Financial Officer Pursuant to 18 U.S.C. Section 1350, as adopted pursuant to Section 906 of the Sarbanes-Oxley Act of 2002** |
101 | The following materials from Merchants Bancshares, Inc.’s Annual Report on Form 10-K for the year ended December 31, 2012 formatted in XBRL: (i) Consolidated Balance Sheets at December 31, 2012 and December 31, 2011; (ii) Consolidated Statements of Income for the years ended December 31, 2012, 2011 and 2010; (iii) Consolidated Statements of Comprehensive Income for the years ended December 31, 2012, 2011 and 2010; (iv) Consolidated Statements of Changes in Shareholders’ Equity for the years ended December 31, 2012, 2011 and 2010; (v) Consolidated Statements of Cash Flows for the years ended December 31, 2012, 2011 and 2010; and (vi) Notes to Consolidated Financial Statements** |
+ Management contract or compensatory plan or agreement * Filed herewith ** Furnished herewith |
SIGNATURES
Pursuant to the requirement of Section 13 or 15 (d) of the Securities Exchange Act of 1934 the registrant has duly caused this report to be signed on its behalf by the undersigned, thereunto duly authorized.
Merchants Bancshares, Inc.
Date | March 5, 2013 | By | /s/ Michael R. Tuttle |
| | | Michael R. Tuttle, President & CEO |
Pursuant to the requirement of the Securities Exchange Act of 1934, this report has been signed below by the following persons on behalf of MERCHANTS BANCSHARES, INC., and in the capacities and on the date as indicated.
5 | | |
/s/ Michael R. Tuttle | | March 5, 2013 |
Michael R. Tuttle, Director, | | Date |
President & CEO of Merchants | | |
| | |
/s/ Scott F. Boardman | | March 5, 2013 |
Scott F. Boardman, Director | | Date |
| | |
/s/ Peter A. Bouyea | | March 5, 2013 |
Peter A. Bouyea, Director | | Date |
| | |
/s/ Karen J. Danaher | | March 5, 2013 |
Karen J. Danaher, Director | | Date |
| | |
/s/ Jeffrey L. Davis | | March 5, 2013 |
Jeffrey L. Davis, Director | | Date |
| | |
/s/ Michael G. Furlong | | March 5, 2013 |
Michael G. Furlong, Director | | Date |
| | |
/s/ John A. Kane | | March 5, 2013 |
John A. Kane, Director | | Date |
| | |
/s/ Lorilee A. Lawton | | March 5, 2013 |
Lorilee A. Lawton, Director | | Date |
| | |
/s/ Bruce M. Lisman | | March 5, 2013 |
Bruce M. Lisman, Director | | Date |
| | |
/s/ Raymond C. Pecor, Jr. | | March 5, 2013 |
Raymond C. Pecor, Jr. Director | | Date |
Chairman of the Board of Directors | | |
| | |
/s/ Raymond C. Pecor III | | March 5, 2013 |
Raymond C. Pecor III, Director | | Date |
| | |
/s/ Patrick S. Robins | | March 5, 2013 |
Patrick S. Robins, Director | | Date |
| | |
/s/ Robert A. Skiff | | March 5, 2013 |
Robert A. Skiff, Director | | Date |
| | |
/s/ Janet P. Spitler | | March 5, 2013 |
Janet P. Spitler, Treasurer, CFO and Principal Accounting Officer of Merchants | | Date |