Exhibit 99.1
FIG Partners Bank CEO Forum September 28 - 29, 2015 NASDAQ: MBVT February 2016 Fig Partners Investor Roadshow
2 FIG Partners Bank CEO Forum September 28 - 29, 2015 2 Special Note This presentation contains some statements that may constitute forward - looking statements . Forward - looking statements relate to expectations, beliefs, projections, future plans and strategies, anticipated events or trends and similar expressions concerning matters that are not historical facts . The forward - looking statements reflect Merchants’ current views about future events and are subject to risks, uncertainties, assumptions and changes in circumstances that may cause Merchants’ actual results to differ significantly from those expressed in any forward - looking statement . Forward - looking statements should not be relied on since they involve known and unknown risks, uncertainties and other factors that are, in some cases, beyond Merchants’ control and which could materially affect actual results . The factors that could cause actual results to differ materially from current expectations include changes in general economic conditions, changes in interest rates, changes in competitive product and pricing pressures among financial institutions within Merchants’ markets, and changes in the financial condition of Merchants’ borrowers . The forward - looking statements contained herein represent Merchants’ judgment as of the date of this release, and Merchants cautions readers not to place undue reliance on such statements . For further information, please refer to Merchants’ reports filed with the Securities and Exchange Commission .
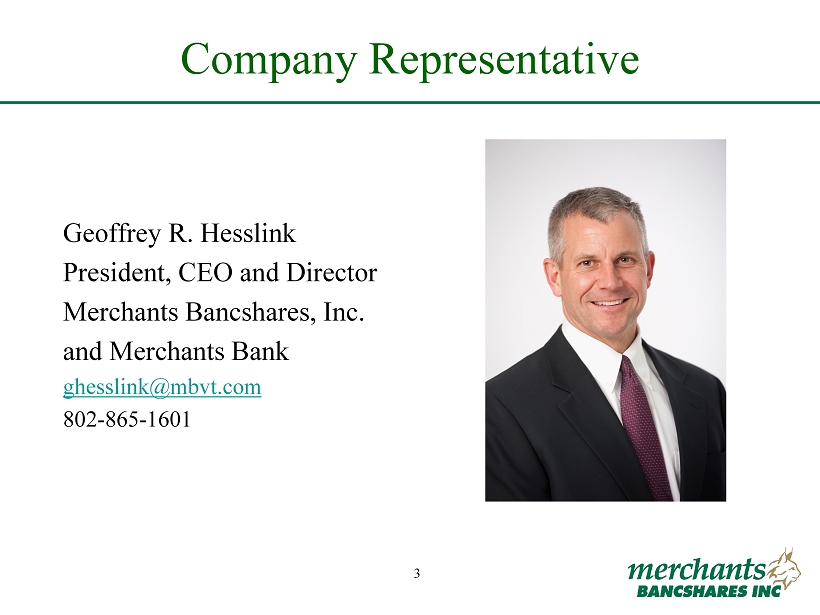
3 FIG Partners Bank CEO Forum September 28 - 29, 2015 3 Company Representative Geoffrey R. Hesslink President, CEO and Director Merchants Bancshares, Inc. and Merchants Bank ghesslink@mbvt.com 802 - 865 - 1601
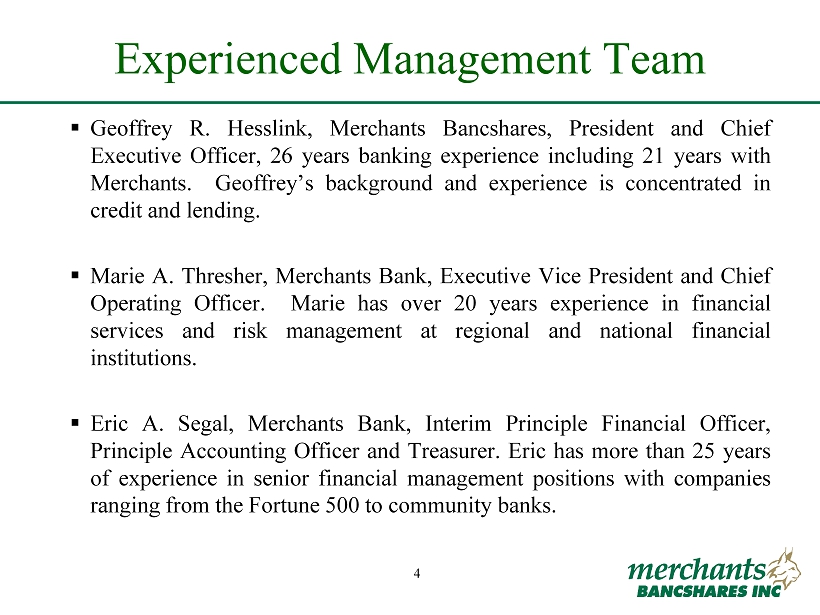
4 FIG Partners Bank CEO Forum September 28 - 29, 2015 4 Experienced Management Team ▪ Geoffrey R . Hesslink , Merchants Bancshares, President and Chief Executive Officer, 26 years banking experience including 21 years with Merchants . Geoffrey’s background and experience is concentrated in credit and lending . ▪ Marie A . Thresher, Merchants Bank, Executive Vice President and Chief Operating Officer . Marie has over 20 years experience in financial services and risk management at regional and national financial institutions . ▪ Eric A . Segal, Merchants Bank, Interim Principle Financial Officer, Principle Accounting Officer and Treasurer . Eric has more than 25 years of experience in senior financial management positions with companies ranging from the Fortune 500 to community banks .

5 FIG Partners Bank CEO Forum September 28 - 29, 2015 5 Corporate Profile ▪ Largest statewide independent bank in Vermont ▪ Strong management team ▪ Solid track record – strong earnings, core funding and pristine asset quality ▪ 7.4% Tangible Book Value (TBV) Compound Annual Growth Rate (CAGR) since 2005
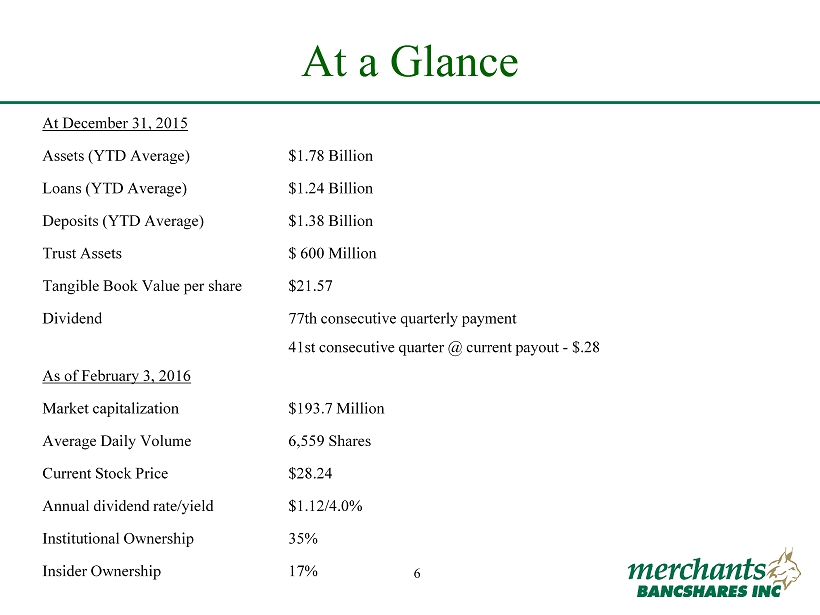
6 FIG Partners Bank CEO Forum September 28 - 29, 2015 6 At a Glance At December 31, 2015 Assets (YTD Average) $1.78 Billion Loans (YTD Average) $1.24 Billion Deposits (YTD Average) $1.38 Billion Trust Assets $ 600 Million Tangible Book Value per share $21.57 Dividend 77th consecutive quarterly payment 41st consecutive quarter @ current payout - $.28 As of February 3, 2016 Market capitalization $193.7 Million Average Daily Volume 6,559 Shares Current Stock Price $28.24 Annual dividend rate/yield $1.12/4.0% Institutional Ownership 35% Insider Ownership 17%
7 FIG Partners Bank CEO Forum September 28 - 29, 2015 7 Investment Highlights ▪ Experienced and capable senior management team ▪ Low risk balance sheet ▪ Superior loan c redit q uality ▪ Current NPAs to Assets 21 bps – peaked at 105 bps in 2009 ▪ Net Charge - offs never rose above 19 bps over past six years ▪ Investments 100% AAA rated ▪ Strong liquidity ▪ Core funded ▪ Strong c apital r atios – Total Risk Based Capital 15.9% ▪ Sustained strong earnings ▪ 8 year stock total return over 100% ▪ Favorable market position – largest statewide independent bank capable of competing with regional and national banks ▪ Expansion into Western Massachusetts with recent acquisition of NUVO
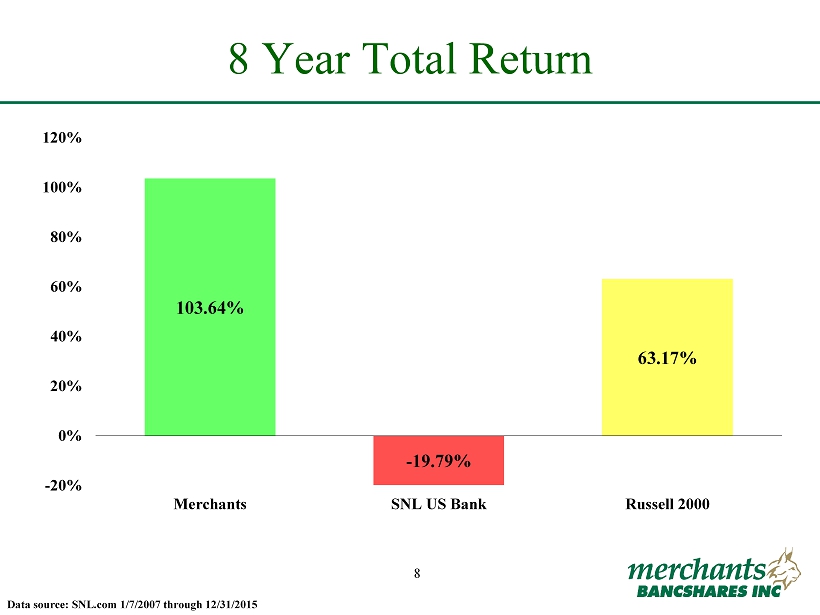
8 FIG Partners Bank CEO Forum September 28 - 29, 2015 8 8 Year Total Return Data source: SNL.com 1/7/2007 through 12/31/2015 103.64% - 19.79% 63.17% -20% 0% 20% 40% 60% 80% 100% 120% Merchants SNL US Bank Russell 2000
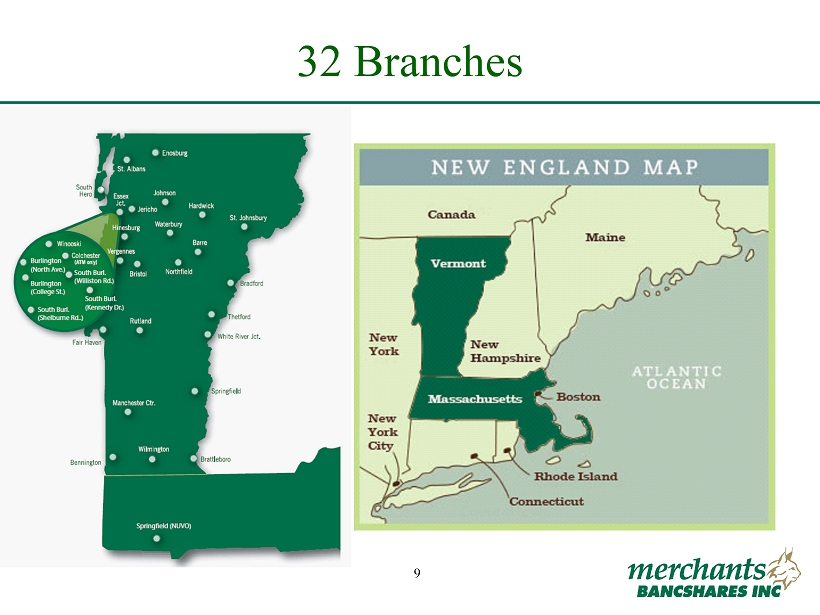
9 FIG Partners Bank CEO Forum September 28 - 29, 2015 9 32 Branches
10 FIG Partners Bank CEO Forum September 28 - 29, 2015 10 Vermont and Massachusetts Marketplace
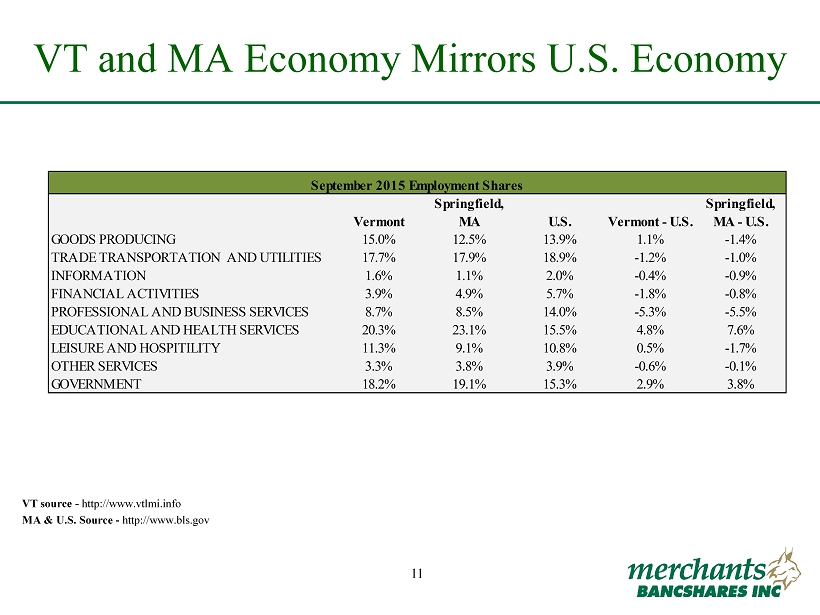
11 FIG Partners Bank CEO Forum September 28 - 29, 2015 11 VT and MA Economy Mirrors U.S. Economy VT source - http://www.vtlmi.info MA & U.S. Source - http://www.bls.gov Vermont Springfield, MA U.S. Vermont - U.S. Springfield, MA - U.S. GOODS PRODUCING 15.0% 12.5% 13.9% 1.1% -1.4% TRADE TRANSPORTATION AND UTILITIES 17.7% 17.9% 18.9% -1.2% -1.0% INFORMATION 1.6% 1.1% 2.0% -0.4% -0.9% FINANCIAL ACTIVITIES 3.9% 4.9% 5.7% -1.8% -0.8% PROFESSIONAL AND BUSINESS SERVICES 8.7% 8.5% 14.0% -5.3% -5.5% EDUCATIONAL AND HEALTH SERVICES 20.3% 23.1% 15.5% 4.8% 7.6% LEISURE AND HOSPITILITY 11.3% 9.1% 10.8% 0.5% -1.7% OTHER SERVICES 3.3% 3.8% 3.9% -0.6% -0.1% GOVERNMENT 18.2% 19.1% 15.3% 2.9% 3.8% September 2015 Employment Shares
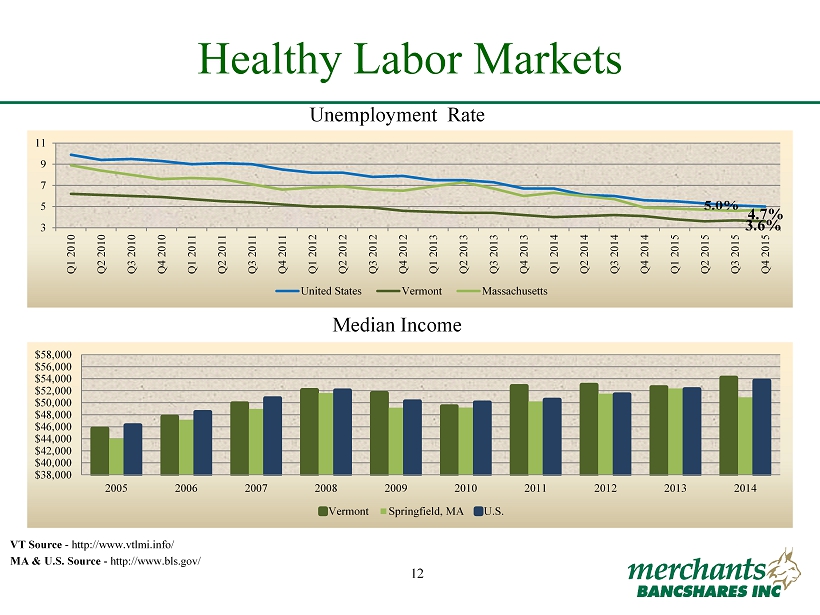
12 FIG Partners Bank CEO Forum September 28 - 29, 2015 12 Healthy Labor Markets VT Source - http://www.vtlmi.info / MA & U.S . Source - http://www.bls.gov/ Unemployment Rate Median Income 4.7% 3.6% 3 5 7 9 11 Q1 2010 Q2 2010 Q3 2010 Q4 2010 Q1 2011 Q2 2011 Q3 2011 Q4 2011 Q1 2012 Q2 2012 Q3 2012 Q4 2012 Q1 2013 Q2 2013 Q3 2013 Q4 2013 Q1 2014 Q2 2014 Q3 2014 Q4 2014 Q1 2015 Q2 2015 Q3 2015 Q4 2015 United States Vermont Massachusetts $38,000 $40,000 $42,000 $44,000 $46,000 $48,000 $50,000 $52,000 $54,000 $56,000 $58,000 2005 2006 2007 2008 2009 2010 2011 2012 2013 2014 Vermont Springfield, MA U.S.
13 FIG Partners Bank CEO Forum September 28 - 29, 2015 13 Financial Metrics
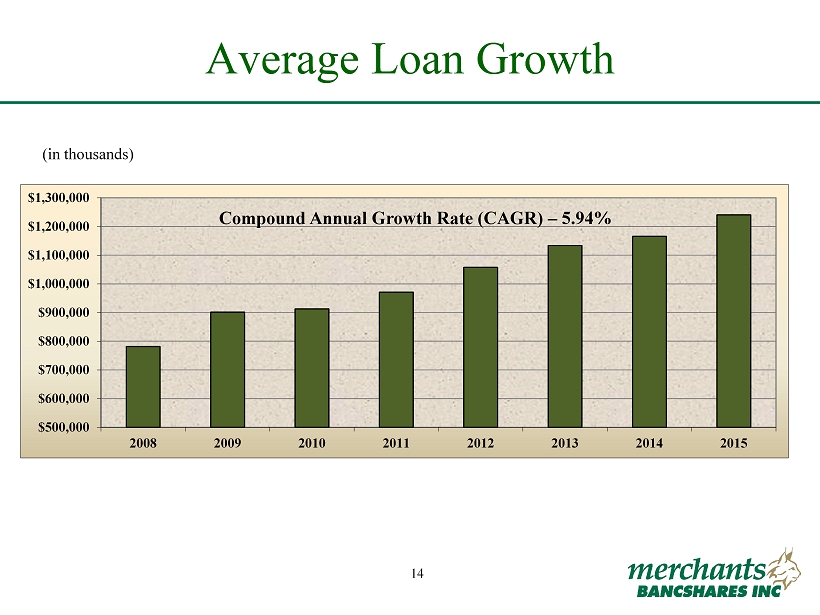
14 FIG Partners Bank CEO Forum September 28 - 29, 2015 14 Average Loan Growth (in thousands) $500,000 $600,000 $700,000 $800,000 $900,000 $1,000,000 $1,100,000 $1,200,000 $1,300,000 2008 2009 2010 2011 2012 2013 2014 2015 Compound Annual Growth Rate (CAGR) – 5.94%
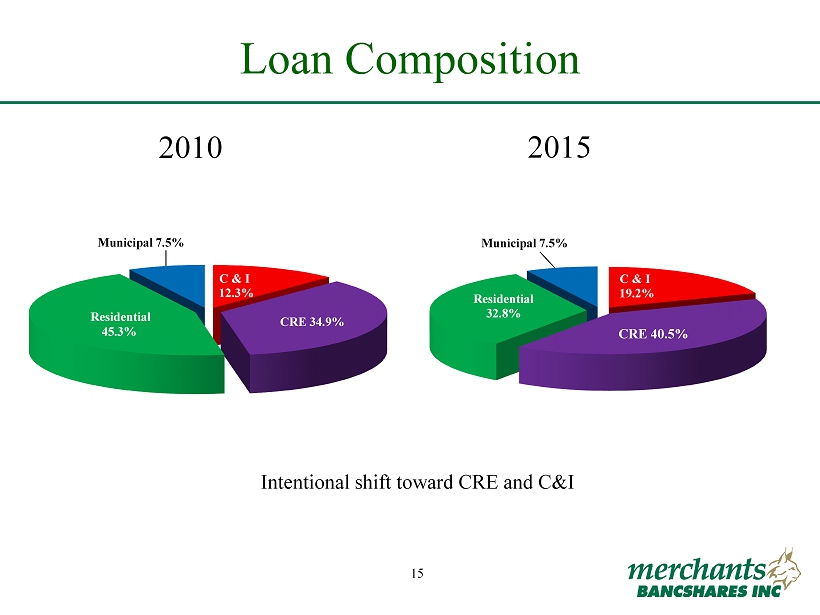
15 FIG Partners Bank CEO Forum September 28 - 29, 2015 15 Loan Composition 2015 2010 C & I 12.3% CRE 34.9% Residential 45.3% Municipal 7.5% Intentional shift toward CRE and C&I C & I 19.2% CRE 40.5% Residential 32.8% Municipal 7.5%
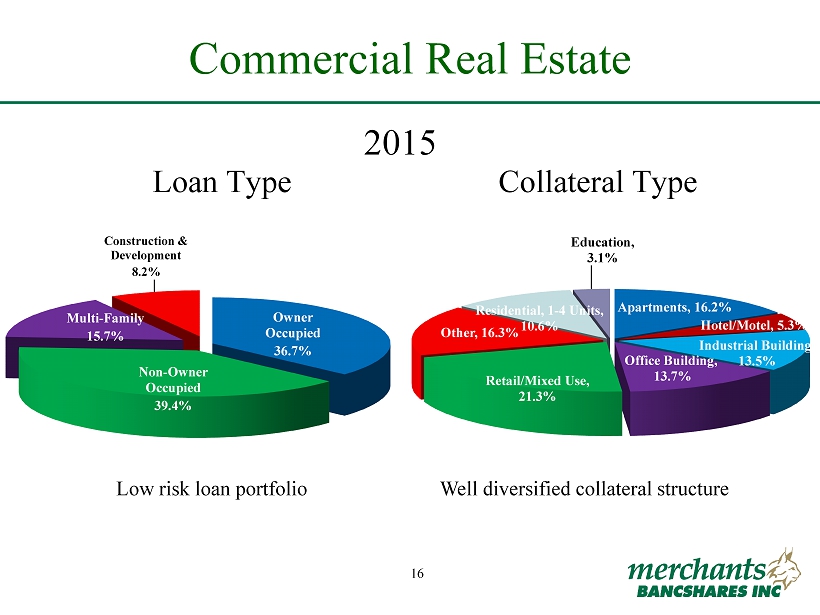
16 FIG Partners Bank CEO Forum September 28 - 29, 2015 16 Commercial Real Estate Loan Type Collateral Type 2015 Low risk loan portfolio Well diversified collateral structure Owner Occupied 36.7% Non - Owner Occupied 39.4% Multi - Family 15.7% Construction & Development 8.2% Apartments, 16.2% Hotel/Motel, 5.3% Industrial Building, 13.5% Office Building, 13.7% Retail/Mixed Use, 21.3% Other, 16.3% Residential, 1 - 4 Units, 10.6% Education, 3.1%

17 FIG Partners Bank CEO Forum September 28 - 29, 2015 17 Superior Asset Quality Peer Group consists of banks in New England and New York – see Appendix (NPAs as a % of Total Assets) 0.92% 1.05% 0.29% 0.18% 0.17% 0.06% 0.05% 0.21% 0.67% 1.37% 1.38% 1.47% 1.29% 1.22% 0.88% 0.77% 0.00% 0.20% 0.40% 0.60% 0.80% 1.00% 1.20% 1.40% 1.60% 2008 2009 2010 2011 2012 2013 2014 2015 Merchants Peer Group
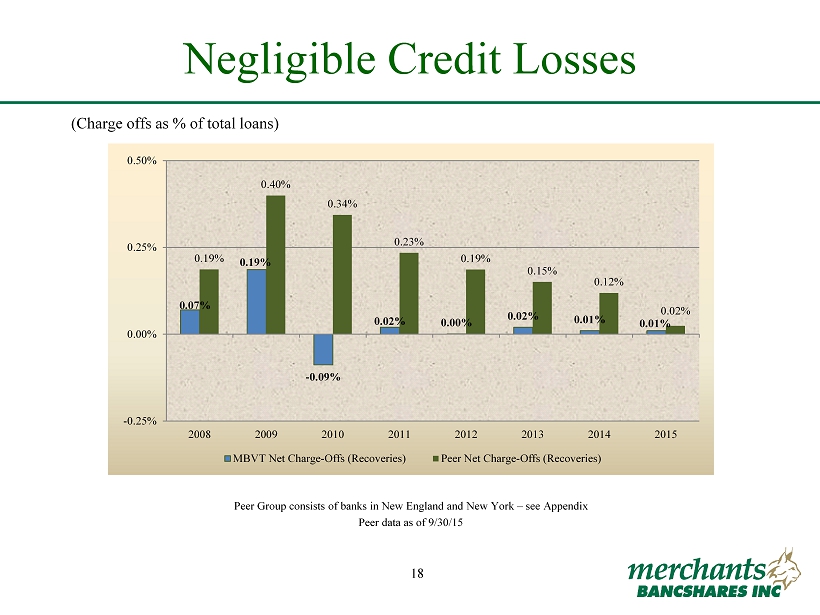
18 FIG Partners Bank CEO Forum September 28 - 29, 2015 18 Negligible Credit Losses (Charge offs as % of total loans) Peer Group consists of banks in New England and New York – see Appendix Peer data as of 9/30/15 0.07% 0.19% - 0.09% 0.02% 0.00% 0.02% 0.01% 0.01% 0.19% 0.40% 0.34% 0.23% 0.19% 0.15% 0.12% 0.02% -0.25% 0.00% 0.25% 0.50% 2008 2009 2010 2011 2012 2013 2014 2015 MBVT Net Charge-Offs (Recoveries) Peer Net Charge-Offs (Recoveries)
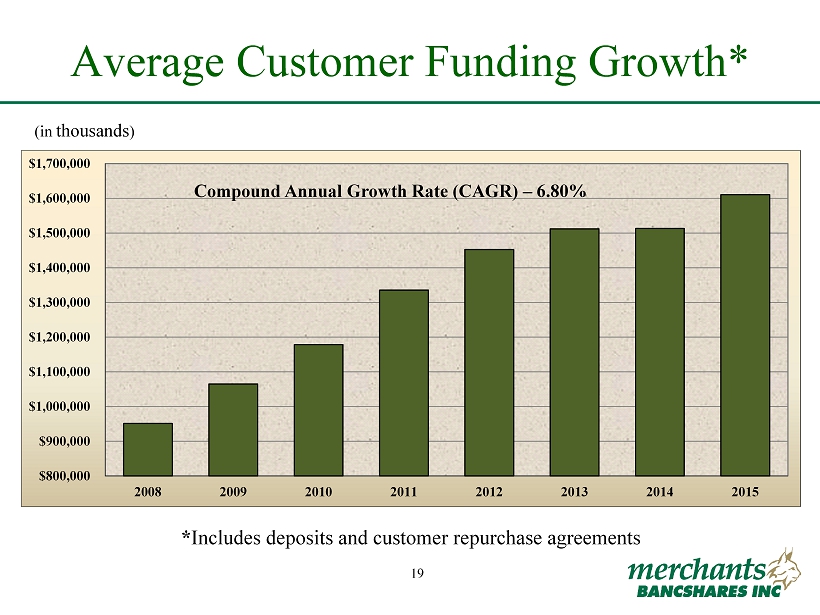
19 FIG Partners Bank CEO Forum September 28 - 29, 2015 19 Average Customer Funding Growth* (in thousands ) * Includes deposits and customer repurchase agreements $800,000 $900,000 $1,000,000 $1,100,000 $1,200,000 $1,300,000 $1,400,000 $1,500,000 $1,600,000 $1,700,000 2008 2009 2010 2011 2012 2013 2014 2015 Compound Annual Growth Rate (CAGR) – 6.80%
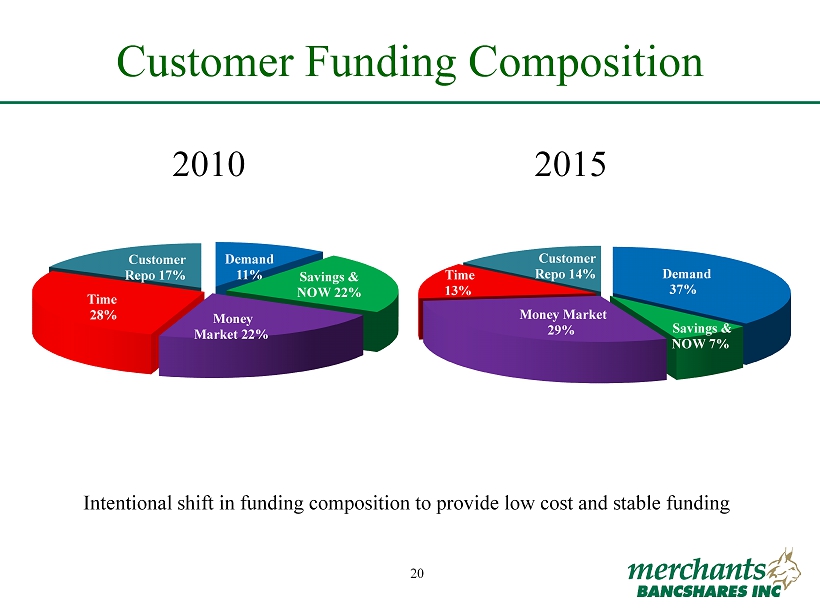
20 FIG Partners Bank CEO Forum September 28 - 29, 2015 20 Customer Funding Composition Intentional shift in funding composition to provide low cost and stable funding Demand 11% Money Market 22% Savings & NOW 22% Time 28% Customer Repo 17% 2010 2015 Demand 37% Savings & NOW 7% Money Market 29% Time 13% Customer Repo 14%
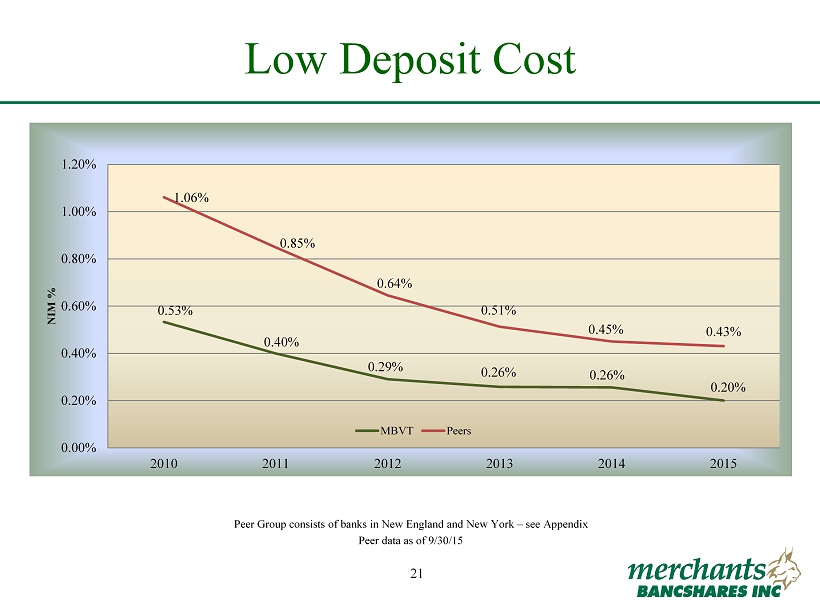
21 FIG Partners Bank CEO Forum September 28 - 29, 2015 21 Low Deposit Cost $322,772 38.36% $385,121 41.38% $206,728 22.23% $217,978 25.13% $221,004 23.74% $281,865 27.02% Peer Group consists of banks in New England and New York – see Appendix Peer data as of 9/30/15 0.53% 0.40% 0.29% 0.26% 0.26% 0.20% 1.06% 0.85% 0.64% 0.51% 0.45% 0.43% 0.00% 0.20% 0.40% 0.60% 0.80% 1.00% 1.20% 2010 2011 2012 2013 2014 2015 NIM % MBVT Peers
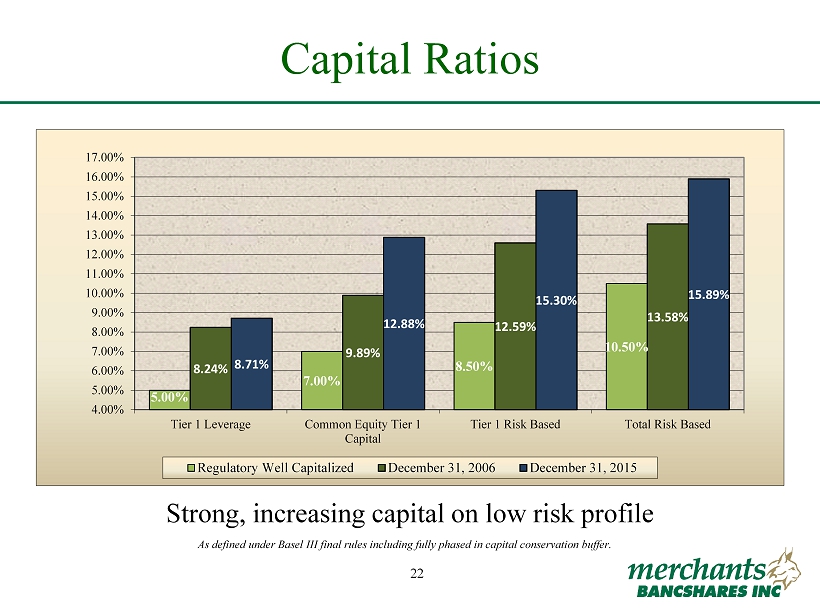
22 FIG Partners Bank CEO Forum September 28 - 29, 2015 22 Capital Ratios As defined under Basel III final rules including fully phased in capital conservation buffer. Strong, increasing capital on low risk profile 5.00% 7.00% 8.50% 10.50% 8.24% 9.89% 12.59% 13.58% 8.71% 12.88% 15.30% 15.89% 4.00% 5.00% 6.00% 7.00% 8.00% 9.00% 10.00% 11.00% 12.00% 13.00% 14.00% 15.00% 16.00% 17.00% Tier 1 Leverage Common Equity Tier 1 Capital Tier 1 Risk Based Total Risk Based Regulatory Well Capitalized December 31, 2006 December 31, 2015
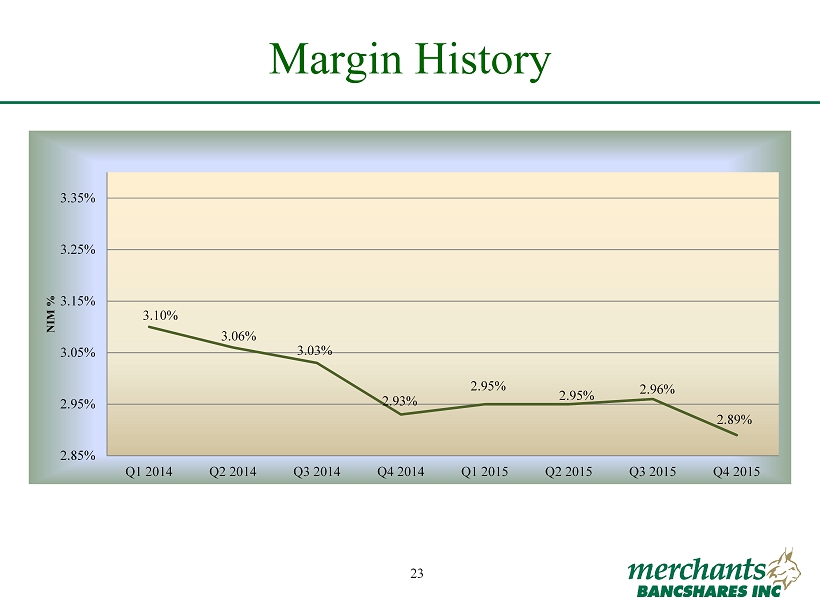
23 FIG Partners Bank CEO Forum September 28 - 29, 2015 23 Margin History 3.10% 3.06% 3.03% 2.93% 2.95% 2.95% 2.96% 2.89% 2.85% 2.95% 3.05% 3.15% 3.25% 3.35% Q1 2014 Q2 2014 Q3 2014 Q4 2014 Q1 2015 Q2 2015 Q3 2015 Q4 2015 NIM %
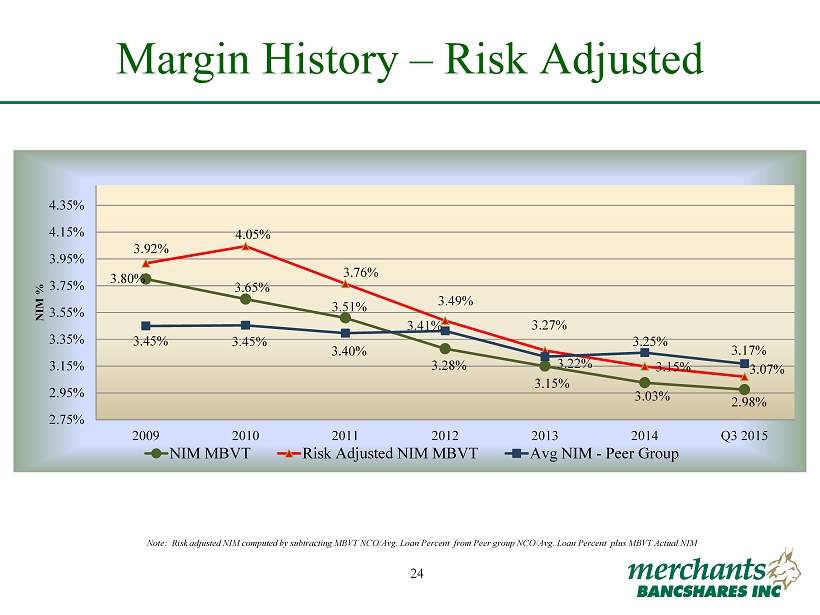
24 FIG Partners Bank CEO Forum September 28 - 29, 2015 24 Margin History – Risk Adjusted Note: Risk adjusted NIM computed by subtracting MBVT NCO/Avg. Loan Percent from Peer group NCO/Avg. Loan Percent plus MBVT Ac tual NIM 3.80% 3.65% 3.51% 3.28% 3.15% 3.03% 2.98% 3.92% 4.05% 3.76% 3.49% 3.27% 3.15% 3.07% 3.45% 3.45% 3.40% 3.41% 3.22% 3.25% 3.17% 2.75% 2.95% 3.15% 3.35% 3.55% 3.75% 3.95% 4.15% 4.35% 2009 2010 2011 2012 2013 2014 Q3 2015 NIM % NIM MBVT Risk Adjusted NIM MBVT Avg NIM - Peer Group
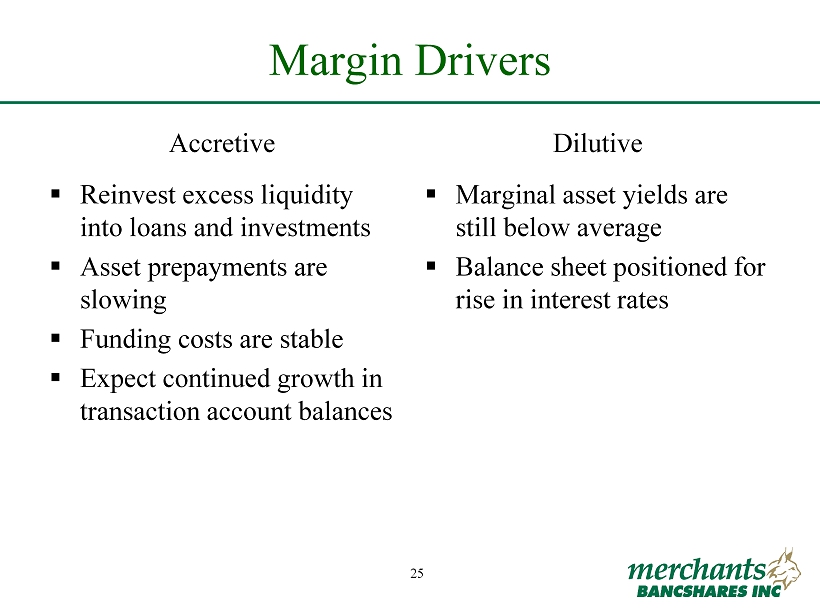
25 FIG Partners Bank CEO Forum September 28 - 29, 2015 25 Margin Drivers Accretive ▪ Reinvest excess liquidity into loans and investments ▪ Asset prepayments are slowing ▪ Funding costs are stable ▪ Expect continued growth in transaction account balances Dilutive ▪ Marginal asset yields are still below average ▪ Balance sheet positioned for rise in interest rates
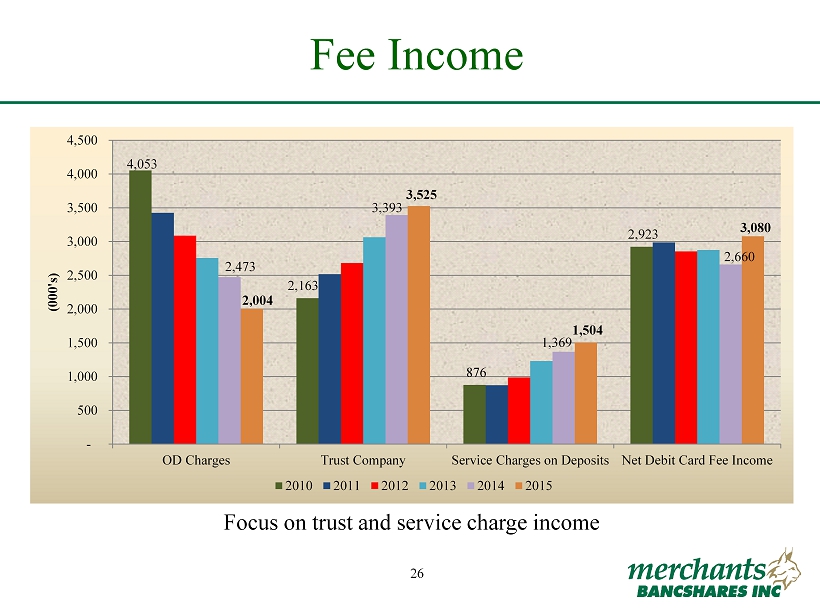
26 FIG Partners Bank CEO Forum September 28 - 29, 2015 26 Fee Income Focus on trust and service charge income 4,053 2,163 876 2,923 2,473 3,393 1,369 2,660 2,004 3,525 1,504 3,080 - 500 1,000 1,500 2,000 2,500 3,000 3,500 4,000 4,500 OD Charges Trust Company Service Charges on Deposits Net Debit Card Fee Income (000's) 2010 2011 2012 2013 2014 2015
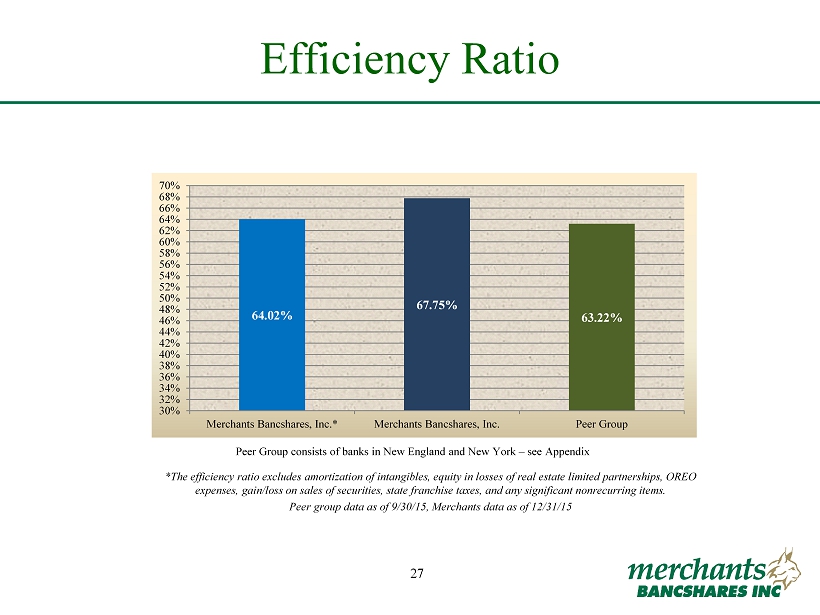
27 FIG Partners Bank CEO Forum September 28 - 29, 2015 27 Efficiency Ratio *The efficiency ratio excludes amortization of intangibles, equity in losses of real estate limited partnerships, OREO expenses, gain/loss on sales of securities, state franchise taxes, and any significant nonrecurring items . Peer group data as of 9/30/15, Merchants data as of 12/31/15 Peer Group consists of banks in New England and New York – see Appendix 64.02% 67.75% 63.22% 30% 32% 34% 36% 38% 40% 42% 44% 46% 48% 50% 52% 54% 56% 58% 60% 62% 64% 66% 68% 70% Merchants Bancshares, Inc.* Merchants Bancshares, Inc. Peer Group
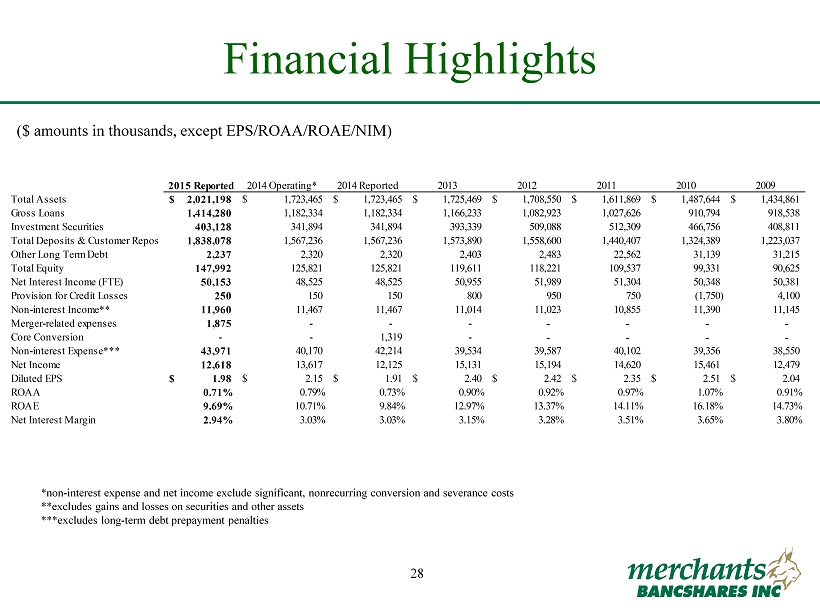
28 FIG Partners Bank CEO Forum September 28 - 29, 2015 28 Financial Highlights ($ amounts in thousands, except EPS/ROAA/ROAE/NIM) *non - interest expense and net income exclude significant, nonrecurring conversion and severance costs **excludes gains and losses on securities and other assets ***excludes long - term debt prepayment penalties 2015 Reported 2014 Operating* 2014 Reported 2013 2012 2011 2010 2009 Total Assets 2,021,198$ 1,723,465$ 1,723,465$ 1,725,469$ 1,708,550$ 1,611,869$ 1,487,644$ 1,434,861$ Gross Loans 1,414,280 1,182,334 1,182,334 1,166,233 1,082,923 1,027,626 910,794 918,538 Investment Securities 403,128 341,894 341,894 393,339 509,088 512,309 466,756 408,811 Total Deposits & Customer Repos 1,838,078 1,567,236 1,567,236 1,573,890 1,558,600 1,440,407 1,324,389 1,223,037 Other Long Term Debt 2,237 2,320 2,320 2,403 2,483 22,562 31,139 31,215 Total Equity 147,992 125,821 125,821 119,611 118,221 109,537 99,331 90,625 Net Interest Income (FTE) 50,153 48,525 48,525 50,955 51,989 51,304 50,348 50,381 Provision for Credit Losses 250 150 150 800 950 750 (1,750) 4,100 Non-interest Income** 11,960 11,467 11,467 11,014 11,023 10,855 11,390 11,145 Merger-related expenses 1,875 - - - - - - - Core Conversion - - 1,319 - - - - - Non-interest Expense*** 43,971 40,170 42,214 39,534 39,587 40,102 39,356 38,550 Net Income 12,618 13,617 12,125 15,131 15,194 14,620 15,461 12,479 Diluted EPS 1.98$ 2.15$ 1.91$ 2.40$ 2.42$ 2.35$ 2.51$ 2.04$ ROAA 0.71% 0.79% 0.73% 0.90% 0.92% 0.97% 1.07% 0.91% ROAE 9.69% 10.71% 9.84% 12.97% 13.37% 14.11% 16.18% 14.73% Net Interest Margin 2.94% 3.03% 3.03% 3.15% 3.28% 3.51% 3.65% 3.80%
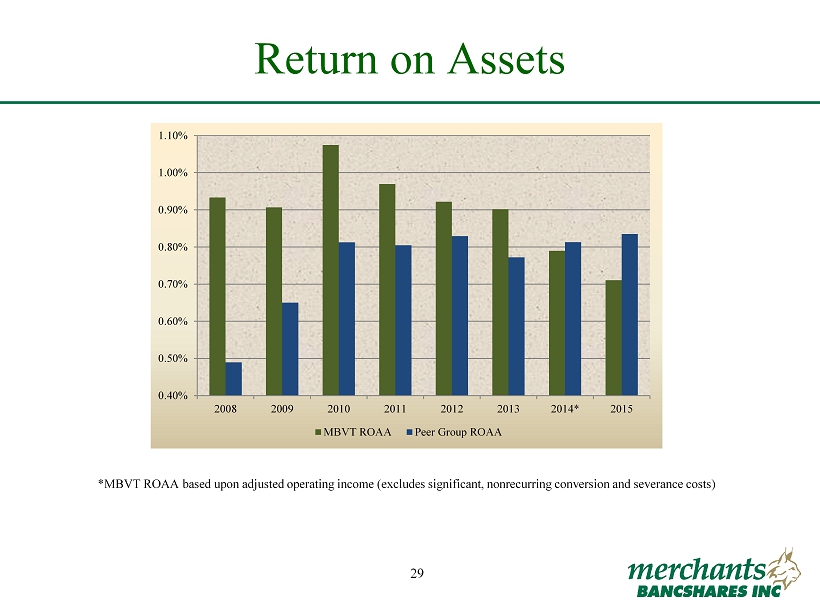
29 FIG Partners Bank CEO Forum September 28 - 29, 2015 29 Return on Assets *MBVT ROAA based upon adjusted operating income (excludes significant, nonrecurring conversion and severance costs) 0.40% 0.50% 0.60% 0.70% 0.80% 0.90% 1.00% 1.10% 2008 2009 2010 2011 2012 2013 2014* 2015 MBVT ROAA Peer Group ROAA
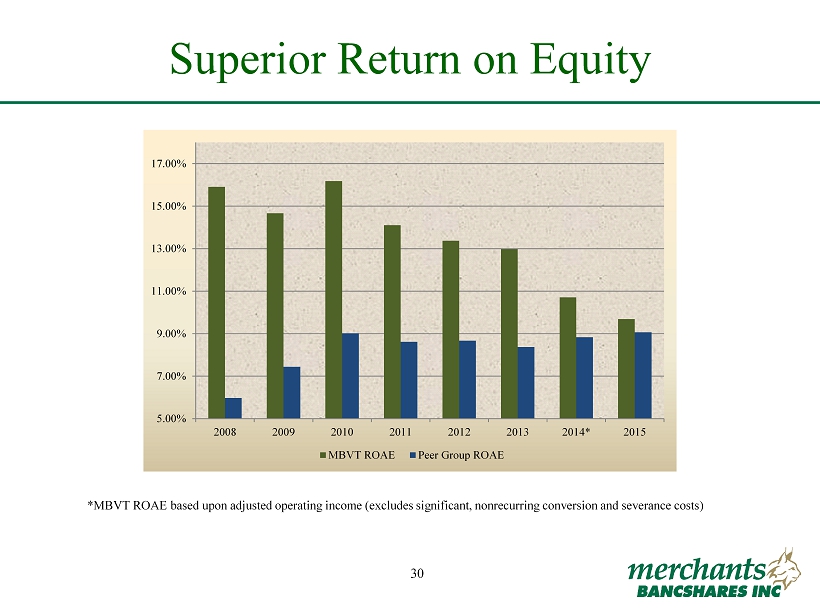
30 FIG Partners Bank CEO Forum September 28 - 29, 2015 30 Superior Return on Equity *MBVT ROAE based upon adjusted operating income (excludes significant, nonrecurring conversion and severance costs) 5.00% 7.00% 9.00% 11.00% 13.00% 15.00% 17.00% 2008 2009 2010 2011 2012 2013 2014* 2015 MBVT ROAE Peer Group ROAE
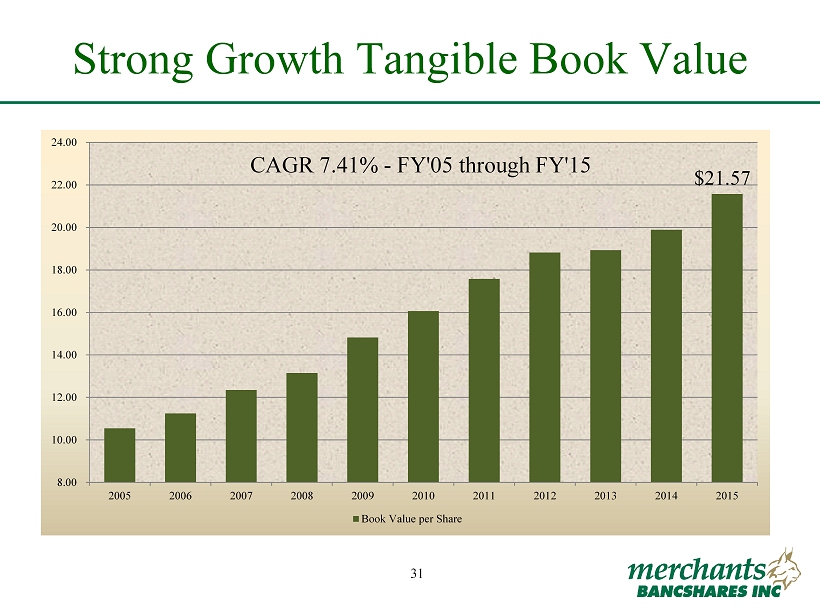
31 FIG Partners Bank CEO Forum September 28 - 29, 2015 31 Strong Growth Tangible Book Value $21.57 8.00 10.00 12.00 14.00 16.00 18.00 20.00 22.00 24.00 2005 2006 2007 2008 2009 2010 2011 2012 2013 2014 2015 CAGR 7.41% - FY'05 through FY'15 Book Value per Share
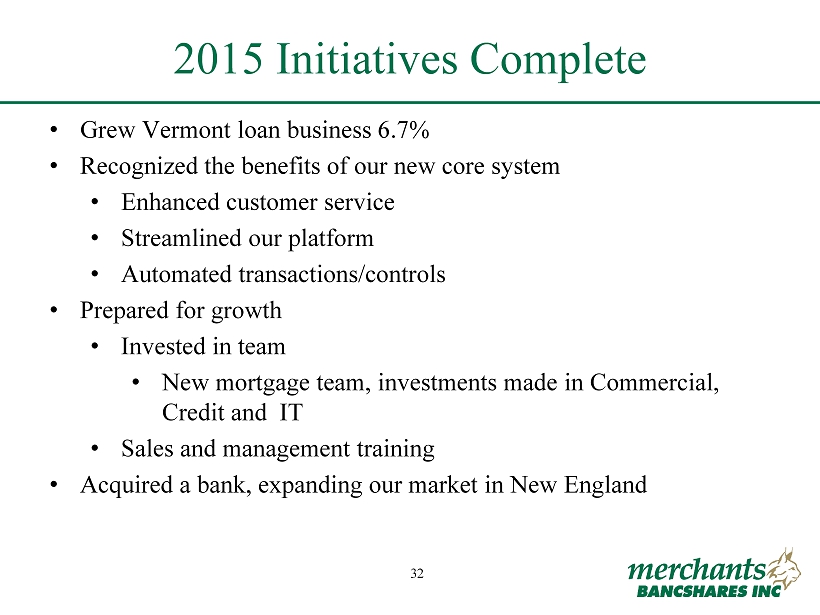
32 FIG Partners Bank CEO Forum September 28 - 29, 2015 32 • Grew Vermont loan business 6.7% • Recognized the benefits of our new core system • Enhanced customer service • Streamlined our platform • Automated transactions/controls • Prepared for growth • Invested in team • New mortgage team, investments made in Commercial, Credit and IT • Sales and management training • Acquired a bank, expanding our market in New England 2015 Initiatives Complete

33 FIG Partners Bank CEO Forum September 28 - 29, 2015 33 Opportunities
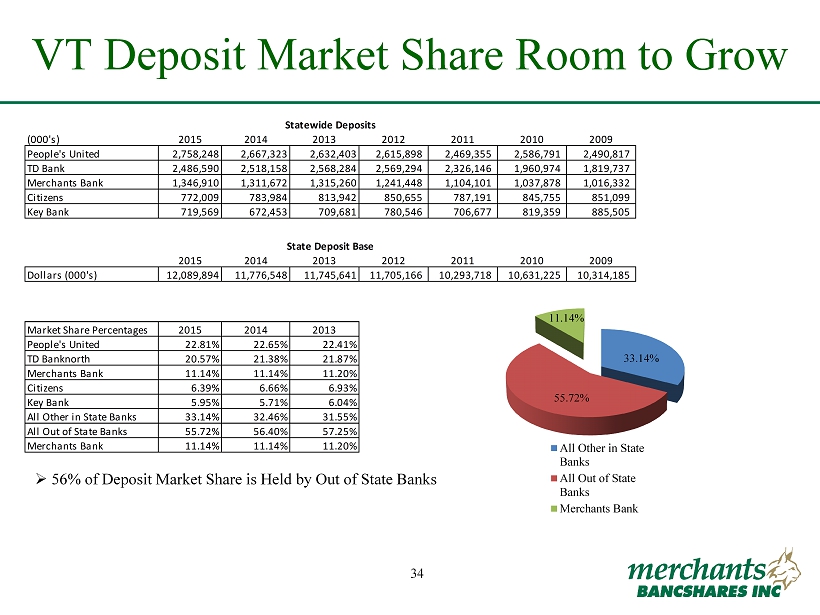
34 FIG Partners Bank CEO Forum September 28 - 29, 2015 34 VT Deposit Market Share Room to Grow » 56% of Deposit Market Share is Held by Out of State Banks 33.14% 55.72% 11.14% All Other in State Banks All Out of State Banks Merchants Bank (000's) 2015 2014 2013 2012 2011 2010 2009 People's United 2,758,248 2,667,323 2,632,403 2,615,898 2,469,355 2,586,791 2,490,817 TD Bank 2,486,590 2,518,158 2,568,284 2,569,294 2,326,146 1,960,974 1,819,737 Merchants Bank 1,346,910 1,311,672 1,315,260 1,241,448 1,104,101 1,037,878 1,016,332 Citizens 772,009 783,984 813,942 850,655 787,191 845,755 851,099 Key Bank 719,569 672,453 709,681 780,546 706,677 819,359 885,505 Statewide Deposits 2015 2014 2013 2012 2011 2010 2009 Dollars (000's) 12,089,894 11,776,548 11,745,641 11,705,166 10,293,718 10,631,225 10,314,185 State Deposit Base Market Share Percentages 2015 2014 2013 People's United 22.81% 22.65% 22.41% TD Banknorth 20.57% 21.38% 21.87% Merchants Bank 11.14% 11.14% 11.20% Citizens 6.39% 6.66% 6.93% Key Bank 5.95% 5.71% 6.04% All Other in State Banks 33.14% 32.46% 31.55% All Out of State Banks 55.72% 56.40% 57.25% Merchants Bank 11.14% 11.14% 11.20%
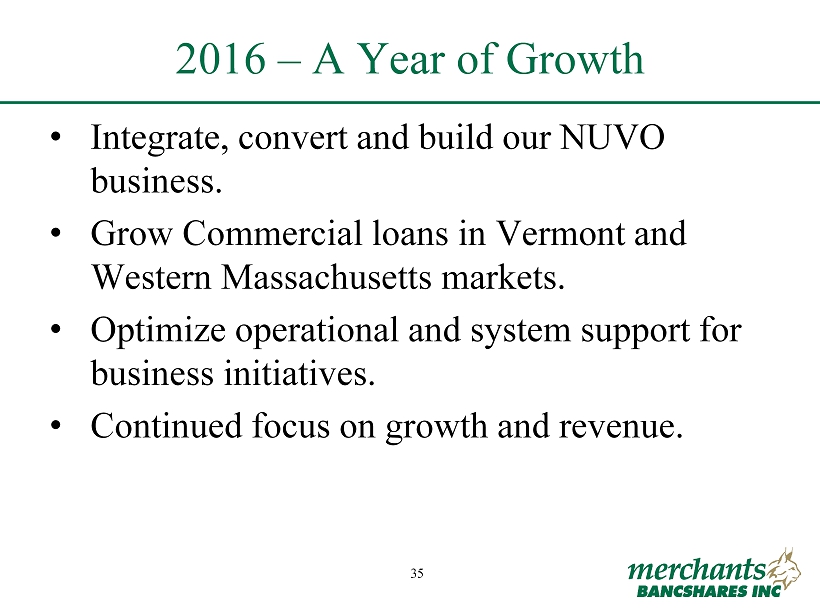
35 FIG Partners Bank CEO Forum September 28 - 29, 2015 35 • Integrate, convert and build our NUVO business. • Grow Commercial loans in Vermont and Western Massachusetts markets. • Optimize operational and system support for business initiatives. • Continued focus on growth and revenue. 2016 – A Year of Growth
36 FIG Partners Bank CEO Forum September 28 - 29, 2015 36 Appendix
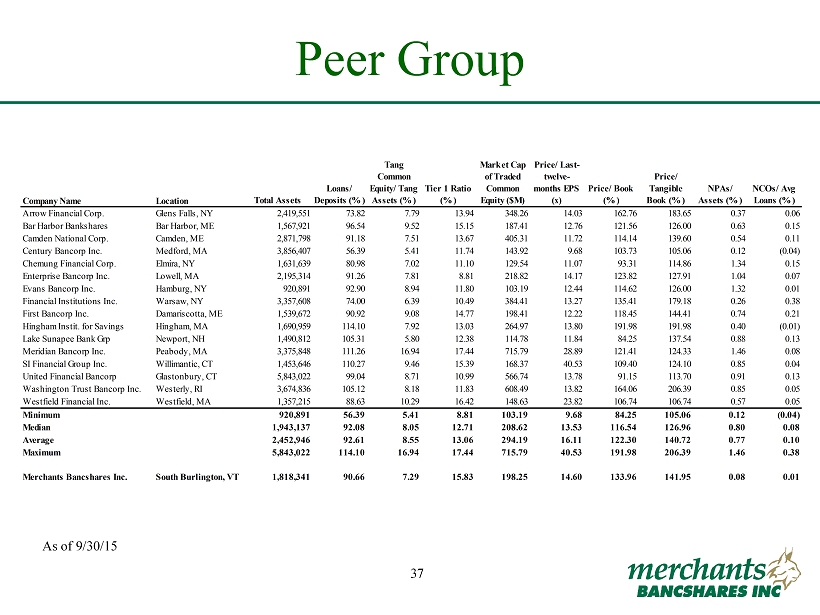
37 FIG Partners Bank CEO Forum September 28 - 29, 2015 37 Peer Group Company Name Location Total Assets Loans/ Deposits (%) Tang Common Equity/ Tang Assets (%) Tier 1 Ratio (%) Market Cap of Traded Common Equity ($M) Price/ Last- twelve- months EPS (x) Price/ Book (%) Price/ Tangible Book (%) NPAs/ Assets (%) NCOs/ Avg Loans (%) Arrow Financial Corp. Glens Falls, NY 2,419,551 73.82 7.79 13.94 348.26 14.03 162.76 183.65 0.37 0.06 Bar Harbor Bankshares Bar Harbor, ME 1,567,921 96.54 9.52 15.15 187.41 12.76 121.56 126.00 0.63 0.15 Camden National Corp. Camden, ME 2,871,798 91.18 7.51 13.67 405.31 11.72 114.14 139.60 0.54 0.11 Century Bancorp Inc. Medford, MA 3,856,407 56.39 5.41 11.74 143.92 9.68 103.73 105.06 0.12 (0.04) Chemung Financial Corp. Elmira, NY 1,631,639 80.98 7.02 11.10 129.54 11.07 93.31 114.86 1.34 0.15 Enterprise Bancorp Inc. Lowell, MA 2,195,314 91.26 7.81 8.81 218.82 14.17 123.82 127.91 1.04 0.07 Evans Bancorp Inc. Hamburg, NY 920,891 92.90 8.94 11.80 103.19 12.44 114.62 126.00 1.32 0.01 Financial Institutions Inc. Warsaw, NY 3,357,608 74.00 6.39 10.49 384.41 13.27 135.41 179.18 0.26 0.38 First Bancorp Inc. Damariscotta, ME 1,539,672 90.92 9.08 14.77 198.41 12.22 118.45 144.41 0.74 0.21 Hingham Instit. for Savings Hingham, MA 1,690,959 114.10 7.92 13.03 264.97 13.80 191.98 191.98 0.40 (0.01) Lake Sunapee Bank Grp Newport, NH 1,490,812 105.31 5.80 12.38 114.78 11.84 84.25 137.54 0.88 0.13 Meridian Bancorp Inc. Peabody, MA 3,375,848 111.26 16.94 17.44 715.79 28.89 121.41 124.33 1.46 0.08 SI Financial Group Inc. Willimantic, CT 1,453,646 110.27 9.46 15.39 168.37 40.53 109.40 124.10 0.85 0.04 United Financial Bancorp Glastonbury, CT 5,843,022 99.04 8.71 10.99 566.74 13.78 91.15 113.70 0.91 0.13 Washington Trust Bancorp Inc. Westerly, RI 3,674,836 105.12 8.18 11.83 608.49 13.82 164.06 206.39 0.85 0.05 Westfield Financial Inc. Westfield, MA 1,357,215 88.63 10.29 16.42 148.63 23.82 106.74 106.74 0.57 0.05 Minimum 920,891 56.39 5.41 8.81 103.19 9.68 84.25 105.06 0.12 (0.04) Median 1,943,137 92.08 8.05 12.71 208.62 13.53 116.54 126.96 0.80 0.08 Average 2,452,946 92.61 8.55 13.06 294.19 16.11 122.30 140.72 0.77 0.10 Maximum 5,843,022 114.10 16.94 17.44 715.79 40.53 191.98 206.39 1.46 0.38 Merchants Bancshares Inc. South Burlington, VT 1,818,341 90.66 7.29 15.83 198.25 14.60 133.96 141.95 0.08 0.01 As of 9/30/15
38 FIG Partners Bank CEO Forum September 28 - 29, 2015 38 Acquisition of NUVO Bank & Trust Company December 4, 2015
39 FIG Partners Bank CEO Forum September 28 - 29, 2015 39 The Merger of Merchants Bank and NUVO Bank & Trust Company On December 4 , 2015 , Merchants completed the acquisition of NUVO Bank & Trust Company (“NUVO”), which was structured as a merger of NUVO with and into Merchants’ wholly - owned subsidiary, Merchants Bank . NUVO’s banking business is operating as a division of Merchants Bank . Total compensation paid by Merchants for NUVO's outstanding stock was comprised of approximately 517 , 109 shares of common stock and $ 5 . 106 million in cash . Merchants also paid an aggregate of approximately $ 878 , 000 to cash out NUVO stock options and a portion of its common stock warrants and issued replacement warrants to purchase Merchants common stock on adjusted terms . With completion of the merger, Merchants Bancshares now has consolidated assets of approximately $ 2 . 0 billion and 32 banking locations, including the new office in Springfield, Massachusetts . These balances are unaudited and do not include any adjustments for purchase accounting . Upon completion of the merger on December 4 , 2015 , Merchants had 6 , 859 , 933 shares of common stock outstanding, including the 517 , 109 shares of common stock issued as consideration for the merger .
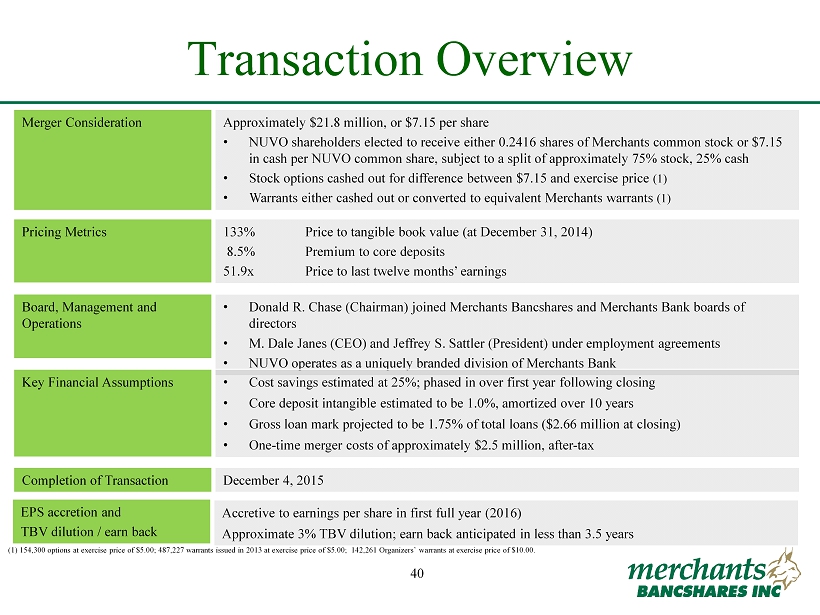
40 FIG Partners Bank CEO Forum September 28 - 29, 2015 40 Transaction Overview Merger Consideration Approximately $21.8 million, or $7.15 per share • NUVO shareholders elected to receive either 0.2416 shares of Merchants common stock or $7.15 in cash per NUVO common share, subject to a split of approximately 75% stock, 25% cash • Stock options cashed out for difference between $7.15 and exercise price (1) • Warrants either cashed out or converted to equivalent Merchants warrants (1) Pricing Metrics 133% Price to tangible book value (at December 31, 2014) 8.5% Premium to core deposits 51.9x Price to last twelve months’ earnings Board, Management and Operations • Donald R. Chase (Chairman) joined Merchants Bancshares and Merchants Bank boards of directors • M. Dale Janes (CEO) and Jeffrey S. Sattler (President) under employment agreements • NUVO operates as a uniquely branded division of Merchants Bank Key Financial Assumptions • Cost savings estimated at 25%; phased in over first year following closing • Core deposit intangible estimated to be 1.0%, amortized over 10 years • Gross loan mark projected to be 1.75% of total loans ($2.66 million at closing) • One - time merger costs of approximately $2.5 million, after - tax Completion of Transaction December 4, 2015 EPS accretion and TBV dilution / earn back Accretive to earnings per share in first full year (2016) Approximate 3% TBV dilution; earn back anticipated in less than 3.5 years (1) 154,300 options at exercise price of $5.00; 487,227 warrants issued in 2013 at exercise price of $5.00; 142,261 Organize rs’ warrants at exercise price of $10.00.
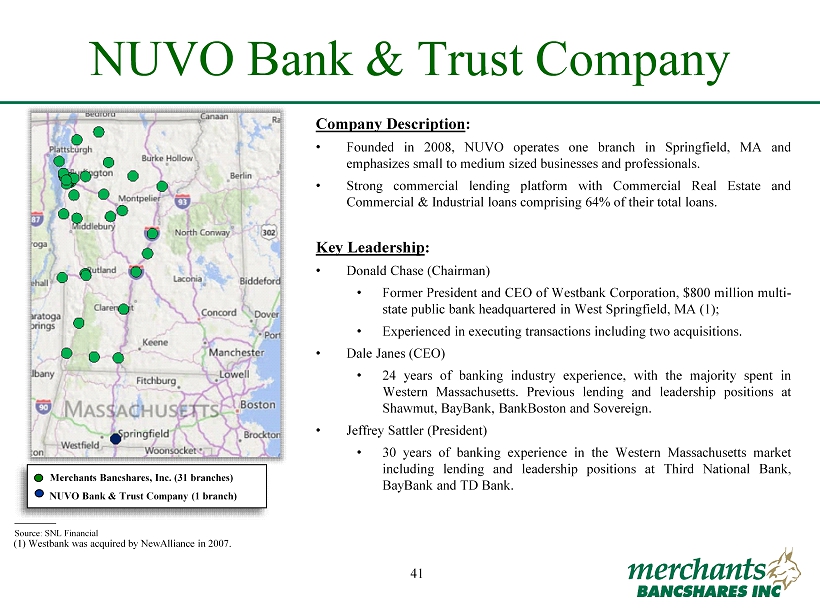
41 FIG Partners Bank CEO Forum September 28 - 29, 2015 41 NUVO Bank & Trust Company Company Description : • Founded in 2008 , NUVO operates one branch in Springfield, MA and emphasizes small to medium sized businesses and professionals . • Strong commercial lending platform with Commercial Real Estate and Commercial & Industrial loans comprising 64 % of their total loans . Key Leadership : • Donald Chase (Chairman) • Former President and CEO of Westbank Corporation, $ 800 million multi - state public bank headquartered in West Springfield, MA ( 1 ) ; • Experienced in executing transactions including two acquisitions . • Dale Janes (CEO) • 24 years of banking industry experience, with the majority spent in Western Massachusetts . Previous lending and leadership positions at Shawmut, BayBank, BankBoston and Sovereign . • Jeffrey Sattler (President) • 30 years of banking experience in the Western Massachusetts market including lending and leadership positions at Third National Bank, BayBank and TD Bank . Merchants Bancshares, Inc. (31 branches) NUVO Bank & Trust Company (1 branch) ________ Source: SNL Financial (1) Westbank was acquired by NewAlliance in 2007.
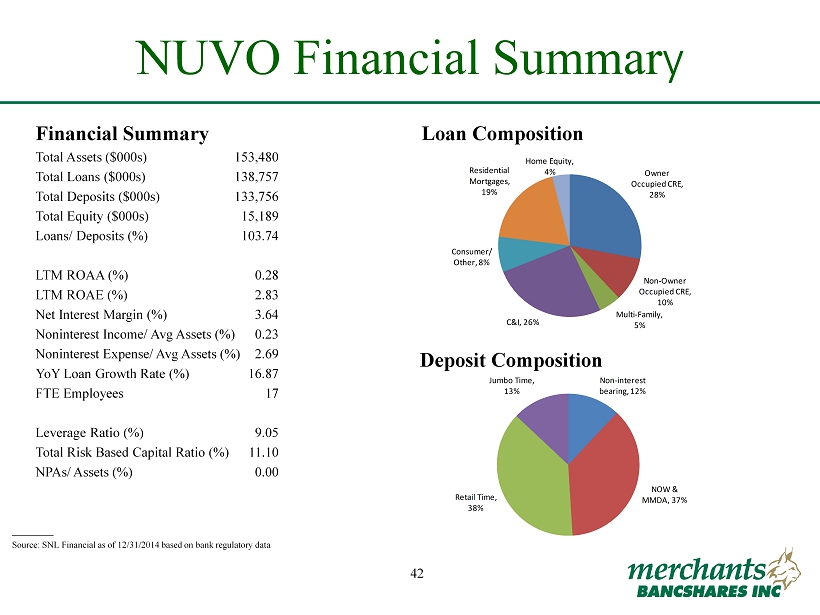
42 FIG Partners Bank CEO Forum September 28 - 29, 2015 42 NUVO Financial Summar y ________ Source: SNL Financial as of 12/31/2014 based on bank regulatory data Financial Summary Total Assets ($000s) Total Loans ($000s) Total Deposits ($000s) Total Equity ($000s) Loans/ Deposits (%) LTM ROAA (%) LTM ROAE (%) Net Interest Margin (%) Noninterest Income/ Avg Assets (%) Noninterest Expense/ Avg Assets (%) YoY Loan Growth Rate (%) FTE Employees Leverage Ratio (%) Total Risk Based Capital Ratio (%) NPAs/ Assets (%) 153,480 138,757 133,756 15,189 103.74 0.28 2.83 3.64 0.23 2.69 16.87 17 9.05 11.10 0.00 Loan Composition Deposit Composition Owner Occupied CRE, 28% Non - Owner Occupied CRE, 10% Multi - Family, 5% C&I, 26% Consumer/ Other, 8% Residential Mortgages, 19% Home Equity, 4% Non - interest bearing, 12% NOW & MMDA, 37% Retail Time, 38% Jumbo Time, 13%
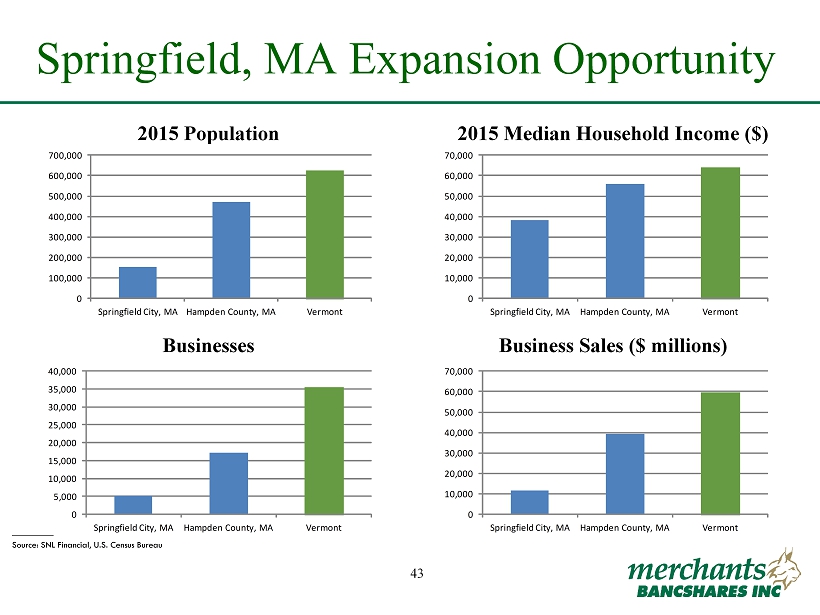
43 FIG Partners Bank CEO Forum September 28 - 29, 2015 43 0 5,000 10,000 15,000 20,000 25,000 30,000 35,000 40,000 Springfield City, MA Hampden County, MA Vermont 0 10,000 20,000 30,000 40,000 50,000 60,000 70,000 Springfield City, MA Hampden County, MA Vermont Springfield, MA Expansion Opportunity ________ Source: SNL Financial, U.S. Census Bureau 2015 Population 2015 Median Household Income ($) 0 100,000 200,000 300,000 400,000 500,000 600,000 700,000 Springfield City, MA Hampden County, MA Vermont 0 10,000 20,000 30,000 40,000 50,000 60,000 70,000 Springfield City, MA Hampden County, MA Vermont Businesses Business Sales ($ millions)
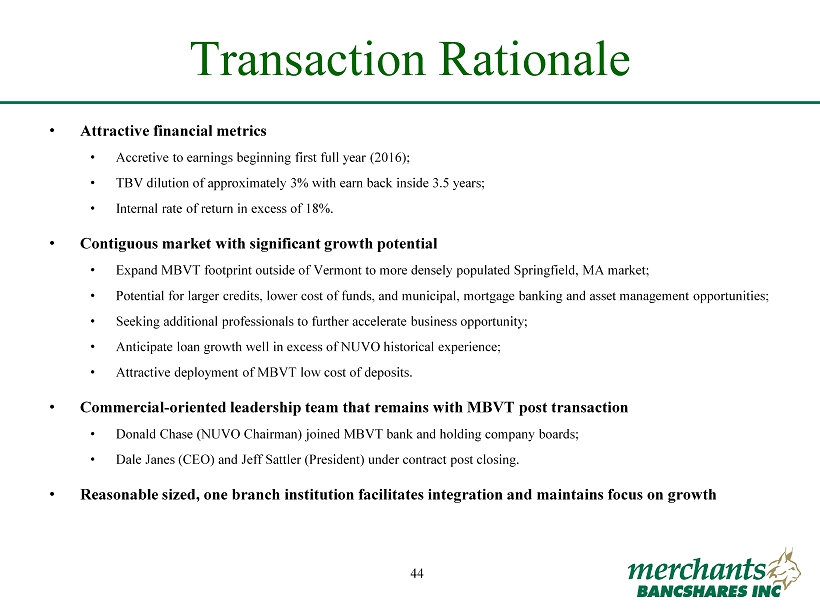
44 FIG Partners Bank CEO Forum September 28 - 29, 2015 44 Transaction Rationale • Attractive financial metrics • Accretive to earnings beginning first full year (2016); • TBV dilution of approximately 3% with earn back inside 3.5 years; • Internal rate of return in excess of 18%. • Contiguous market with significant growth potential • Expand MBVT footprint outside of Vermont to more densely populated Springfield, MA market; • Potential for larger credits, lower cost of funds, and municipal, mortgage banking and asset management opportunities; • Seeking additional professionals to further accelerate business opportunity; • Anticipate loan growth well in excess of NUVO historical experience; • Attractive deployment of MBVT low cost of deposits. • Commercial - oriented leadership team that remains with MBVT post transaction • Donald Chase (NUVO Chairman) joined MBVT bank and holding company boards; • Dale Janes (CEO) and Jeff Sattler (President) under contract post closing. • Reasonable sized, one branch institution facilitates integration and maintains focus on growth
45 FIG Partners Bank CEO Forum September 28 - 29, 2015 45 Questions?