| Q3 2014 SUPPLEMENTAL OPERATING & FINANCIAL DATA NYSE: O Exhibit 99.1 |
| TABLE OF CONTENTS Q3 2014 Supplemental Operating & Financial Data 2 Corporate Overview 3 Financial Summary Consolidated Statements of Income 4 Funds from Operations (FFO) 5 Adjusted Funds from Operations (AFFO) 6 Consolidated Balance Sheets 7 Debt Summary 8 Debt Maturities 9 Capitalization & Financial Ratios 10 EBITDA & Coverage Ratios 11 Debt Covenants 12 Transaction Summary Investment Summary 13 Disposition Summary 14 Development Pipeline 15 Real Estate Portfolio Summary Tenant Diversification 16 Industry Diversification 17 Geographic Diversification 19 Property Type Diversification 20 Same Store Rental Revenue 21 Leasing Data Occupancy 23 Leasing Activity 24 Expirations 25 This Supplemental Operating & Financial Data should be read in connection with the Company's third quarter 2014 earnings press release (included as Exhibit 99.1 of the Company's Current Report on 8-K, filed on October 29, 2014) as certain disclosures, definitions and reconciliations in such announcement have not been included in this Supplemental Operating & Financial Data. |
| CORPORATE OVERVIEW 3 Q3 2014 Supplemental Operating & Financial Data Senior Management John P. Case, President, Chief Executive Officer and Director Richard G. Collins, Executive VP, Portfolio Management Paul M. Meurer, Executive VP, Chief Financial Officer and Treasurer Michael R. Pfeiffer, Executive VP, General Counsel and Secretary Sumit Roy, Executive VP, Chief Operating Officer and Chief Investment Officer Credit Ratings Standard & Poor’s BBB+ Stable Outlook Moody's Baa1 Stable Outlook Fitch BBB+ Stable Outlook Dividend Information as of September 2014 Current annualized dividend is $2.20 per share Compounded average annual dividend growth rate of approximately 4.6% 530 consecutive monthly dividends paid 68 consecutive quarterly dividend increases Corporate Headquarters New Corporate Headquarters 600 La Terraza Blvd. Change effective January 1, 2015 Escondido, California 92025 11995 El Camino Real Phone: (760) 741-2111 San Diego, California 92130 Website: www.realtyincome.com Phone: (858) 284-5000 Transfer Agent Wells Fargo Shareowner Services Phone: (877) 218-2434 Email: stocktransfer@wellsfargo.com Website: www.shareowneronline.com Corporate Profile Realty Income, The Monthly Dividend Company®, is a publicly traded real estate company with the primary business objective of generating dependable monthly cash dividends from a consistent and predictable level of cash flow from operations. Our monthly dividends are supported by the cash flow from our portfolio of properties leased to commercial tenants. We have in-house acquisition, portfolio management, asset management, credit research, real estate research, legal, finance and accounting, and capital markets expertise. Over the past 45 years, Realty Income has been acquiring and managing freestanding commercial properties that generate rental revenue under long-term, net lease agreements. Portfolio Overview At September 30, 2014, we owned a diversified portfolio of 4,284 properties located in 49 states and Puerto Rico, with over 69.8 million square feet of leasable space. Our properties are leased to 231 different commercial tenants doing business in 47 separate industries. Approximately 78% of our quarterly rental revenues were generated from retail properties, 10% from industrial and distribution properties, and the remaining 12% were from other property types. Our occupancy rate as of September 30, 2014 was 98.3%, with a weighted average remaining lease term of approximately 10.4 years. Common Stock Our Common Stock is traded on the New York Stock Exchange under the symbol "O" September 30, 2014 Closing price $ 40.79 Shares and units outstanding 223,512,414 Market value of common equity $ 9,117,071,000 Total market capitalization $ 14,504,421,000 |
| CONSOLIDATED STATEMENTS OF INCOME (dollars in thousands, except per share data - unaudited) 4 Q3 2014 Supplemental Operating & Financial Data Three months ended September 30, Nine months ended September 30, 2014 2013 2014 2013 REVENUE Rental $ 226,832 $ 195,332 $ 662,822 $ 543,219 Tenant reimbursements 8,275 5,107 20,872 15,619 Other 606 1,642 2,238 5,207 Total revenue 235,713 202,081 685,932 564,045 EXPENSES Depreciation and amortization 95,260 80,822 278,124 221,476 Interest 52,814 49,836 157,246 130,667 General and administrative 11,025 16,640 35,499 40,356 Property (including reimbursable) 12,770 8,466 33,474 25,792 Income taxes 697 569 2,358 1,770 Provisions for impairment 495 - 2,676 290 Merger-related costs - 240 - 12,875 Total expenses 173,061 156,573 509,377 433,226 Gain on sales of real estate 10,975 - 14,211 - Income from continuing operations 73,627 45,508 190,766 130,819 Income from discontinued operations - 6,399 3,097 50,831 Net income 73,627 51,907 193,863 181,650 Net income attributable to noncontrolling interests (344 ) (336 ) (1,016 ) (422 ) Net income attributable to the Company 73,283 51,571 192,847 181,228 Preferred stock dividends (9,327 ) (10,482 ) (30,292 ) (31,447 ) Excess of redemption value over carrying value of preferred shares subject to redemption (6,015 ) - (6,015 ) - Net income available to common stockholders $ 57,941 $ 41,089 $ 156,540 $ 149,781 Amounts available to common stockholders per common share: Income from continuing operations, basic and diluted $ 0.26 $ 0.18 $ 0.71 $ 0.53 Net income, basic and diluted $ 0.26 $ 0.21 $ 0.72 $ 0.80 |
| FUNDS FROM OPERATIONS (FFO) (dollars in thousands, except per share data) 5 Q3 2014 Supplemental Operating & Financial Data (1) FFO for the three and nine months ended September 30, 2013 has been normalized to exclude merger-related costs related to our acquisition of American Realty Capital Trust, Inc., or ARCT. (2) FFO per share for the three and nine months ended September 30, 2014 was impacted by a $6.0 million non-cash redemption charge on the Class E preferred shares that were redeemed in October 2014, which represents $0.03 FFO per share. Three months ended September 30, Nine months ended September 30, 2014 2013 2014 2013 Net income available to common stockholders $ 57,941 $ 41,089 $ 156,540 $ 149,781 Depreciation and amortization: Continuing operations 95,260 80,822 278,124 221,476 Discontinued operations - 443 - 1,590 Depreciation of furniture, fixtures and equipment (125 ) (76 ) (320 ) (203 ) Provisions for impairment on investment properties: Continuing operations 495 - 2,676 290 Discontinued operations - 76 - 2,738 Gain on sale of investment properties: Continuing operations (10,975 ) - (14,211 ) - Discontinued operations - (6,163 ) (2,607 ) (50,467 ) Merger-related costs (1) - 240 - 12,875 FFO adjustments allocable to noncontrolling interests (337 ) (285 ) (1,032 ) (680 ) FFO available to common stockholders $ 142,259 $ 116,146 $ 419,170 $ 337,400 FFO per common share(2): Basic $ 0.64 $ 0.59 $ 1.93 $ 1.80 Diluted $ 0.64 $ 0.59 $ 1.93 $ 1.79 Distributions paid to common stockholders $ 122,092 $ 106,875 $ 356,735 $ 298,544 FFO in excess of distributions paid to common stockholders $ 20,167 $ 9,271 $ 62,435 $ 38,856 Weighted average number of common shares used for computation per share: Basic 222,061,661 195,768,298 216,804,815 187,805,222 Diluted 222,236,071 196,619,866 216,830,013 188,399,848 |
| ADJUSTED FUNDS FROM OPERATIONS (AFFO) (dollars in thousands, except per share data) 6 Q3 2014 Supplemental Operating & Financial Data (1) See reconciling items for FFO presented under "Funds from Operations (FFO)." Three months ended September 30, Nine months ended September 30, 2014 2013 2014 2013 Net income available to common stockholders $ 57,941 $ 41,089 $ 156,540 $ 149,781 Cumulative adjustments to calculate FFO(1) 84,318 75,057 262,630 187,619 FFO available to common stockholders 142,259 116,146 419,170 337,400 Excess of redemption value over carrying value of Class E preferred share redemption 6,015 - 6,015 - Amortization of share-based compensation 2,204 6,737 7,653 14,235 Amortization of deferred financing costs 1,235 1,196 3,476 3,217 Amortization of net mortgage premiums (2,285 ) (2,518 ) (7,060 ) (6,959 ) (Gain) loss on early extinguishment of mortgage debt (2,909 ) - (3,528 ) - (Gain) loss on interest rate swaps (633 ) 596 409 (690 ) Capitalized leasing costs and commissions (188 ) (369 ) (655 ) (1,143 ) Capitalized building improvements (1,616 ) (2,239 ) (3,883 ) (4,759 ) Straight-line rent (3,851 ) (3,656 ) (11,764 ) (10,111 ) Amortization of above and below-market leases 2,166 2,026 6,374 6,249 AFFO adjustments allocable to noncontrolling interests 32 - 48 - Total AFFO available to common stockholders $ 142,429 $ 117,919 $ 416,255 $ 337,439 AFFO per common share: Basic $ 0.64 $ 0.60 $ 1.92 $ 1.80 Diluted $ 0.64 $ 0.60 $ 1.92 $ 1.79 Distributions paid to common stockholders $ 122,092 $ 106,875 $ 356,735 $ 298,544 AFFO in excess of distributions paid to common stockholders $ 20,337 $ 11,044 $ 59,520 $ 38,895 Weighted average number of common shares used for computation per share: Basic 222,061,661 195,768,298 216,804,815 187,805,222 Diluted 222,236,071 196,619,866 216,830,013 188,399,848 |
| CONSOLIDATED BALANCE SHEETS (dollars in thousands, except per share amounts) 7 Q3 2014 Supplemental Operating & Financial Data September 30, 2014 December 31, 2013 ASSETS (unaudited) Real estate, at cost: Land $ 3,008,036 $ 2,791,147 Buildings and improvements 7,995,808 7,108,328 Total real estate, at cost 11,003,844 9,899,475 Less accumulated depreciation and amortization (1,317,760 ) (1,114,888 ) Net real estate held for investment 9,686,084 8,784,587 Real estate held for sale, net 15,757 12,022 Net real estate 9,701,841 8,796,609 Cash and cash equivalents 16,936 10,257 Accounts receivable, net 47,852 39,323 Acquired lease intangible assets, net 1,059,879 935,459 Goodwill 15,535 15,660 Other assets, net 97,797 127,133 Total assets $ 10,939,840 $ 9,924,441 LIABILITIES AND EQUITY Distributions payable $ 43,289 $ 41,452 Accounts payable and accrued expenses 78,271 102,511 Acquired lease intangible liabilities, net 201,245 148,250 Other liabilities 44,410 44,030 Preferred shares subject to mandatory redemption 220,000 - Line of credit payable 45,000 128,000 Term loan 70,000 70,000 Mortgages payable, net 862,212 783,360 Notes payable, net 3,785,027 3,185,480 Total liabilities 5,349,454 4,503,083 Stockholders' equity: Preferred stock and paid in capital, par value $0.01 per share, 69,900,000 shares authorized and 16,350,000 shares issued and outstanding as of September 30, 2014 and 25,150,000 shares issued and outstanding as of December 31, 2013 395,377 609,363 Common stock and paid in capital, par value $0.01 per share, 370,100,000 shares authorized, 222,670,846 shares issued and outstanding as of September 30, 2014 and 207,485,073 shares issued and outstanding at December 31, 2013 6,361,400 5,767,878 Distributions in excess of net income (1,194,987 ) (991,794 ) Total stockholders' equity 5,561,790 5,385,447 Noncontrolling interests 28,596 35,911 Total equity 5,590,386 5,421,358 Total liabilities and equity $ 10,939,840 $ 9,924,441 |
| DEBT SUMMARY (dollars in thousands) 8 Q3 2014 Supplemental Operating & Financial Data Principal Interest Weighted Balance as of Rate as of Average Years Maturity Date September 30, 2014 % of Debt September 30, 2014 until Maturity Credit Facility Credit Facility (1) May 9, 2017 $ 45,000 0.9% 1.23% 2.6 years Unsecured Term Loan Term Loan (2) January 21, 2018 70,000 1.5% 1.36% 3.3 years Senior Unsecured Notes and Bonds 5.50% Notes due 2015 November 15, 2015 150,000 3.2% 5.50% 5.95% Notes due 2016 September 15, 2016 275,000 5.8% 5.95% 5.375% Notes due 2017 September 15, 2017 175,000 3.7% 5.38% 2.00% Notes due 2018 January 31, 2018 350,000 7.4% 2.00% 6.75% Notes due 2019 August 15, 2019 550,000 11.6% 6.75% 5.75% Notes due 2021 January 15, 2021 250,000 5.3% 5.75% 3.25% Notes due 2022 October 15, 2022 450,000 9.5% 3.25% 4.65% Notes due 2023 August 1, 2023 750,000 15.8% 4.65% 3.875% Notes due 2024 July 15, 2024 350,000 7.4% 3.88% 4.125% Notes due 2026 October 15, 2026 250,000 5.3% 4.13% 5.875% Bonds due 2035 March 15, 2035 250,000 5.3% 5.88% Principal amount 3,800,000 Unamortized discounts (14,973) Carrying value 3,785,027 79.5% 4.75% 7.5 years Mortgages Payable 58 mortgages on 243 properties October 2014 - June 2032 843,600 (3) 17.7% 4.97% 4.0 years Unamortized premiums 18,612 Carrying value 862,212 18.1% TOTAL DEBT $ 4,758,600 (4) 4.71% Fixed Rate $ 4,674,491 98% Variable Rate $ 84,109 2% (1) We have a $1.5 billion unsecured acquisition credit facility with an initial term that expires in May 2016. It includes, at our election, a one-year extension option at a cost of 0.2% of the facility commitment, or $3 million. As of September 30, 2014, approximately $1.46 billion was available on the credit facility. (2) Borrowing under the term loan bears interest at the current one month LIBOR, plus 1.2%. We have an interest rate swap which essentially fixes our per annum interest rate on the term loan at 2.15%. (3) The mortgages payable are at fixed interest rates, except for mortgages totaling $39.1 million at September 30, 2014. (4) Excludes non-cash unamortized original issuance discounts recorded on the senior unsecured notes and bonds, as well as non-cash unamortized premiums recorded on the mortgages payable. |
| DEBT MATURITIES (dollars in millions) 9 Q3 2014 Supplemental Operating & Financial Data Consolidated Debt Maturities Year of Credit Term Senior Unsecured Mortgages Average Maturity Facility Loan Notes and Bonds Payable Total Interest Rate (1) 2014 $ - $ - $ - $ 7.6 $ 7.6 6.39% 2015 - - 150.0 119.7 269.7 5.32% 2016 - - 275.0 248.4 523.4 5.39% 2017 45.0 - 175.0 142.5 362.5 5.53% 2018 - 70.0 350.0 15.1 435.1 2.02% Thereafter - - 2,850.0 310.3 3,160.3 4.88% Totals $ 45.0 $ 70.0 $ 3,800.0 $ 843.6 $ 4,758.6 (1) Average interest rate for 2017 excludes the credit facility. Mortgages Payable Maturities by Quarter Year of First Second Third Fourth Average Maturity Quarter Quarter Quarter Quarter Total Interest Rate 2014 $ - $ - $ - $ 7.6 $ 7.6 6.39% 2015 1.9 40.5 38.8 38.5 119.7 5.10% 2016 101.1 128.3 16.8 2.2 248.4 4.76% 2017 42.2 36.5 39.3 24.5 142.5 5.72% 2018 1.1 11.9 1.0 1.1 15.1 5.47% Thereafter 310.3 4.69% Totals $ 146.3 $ 217.2 $ 95.9 $ 73.9 $ 843.6 |
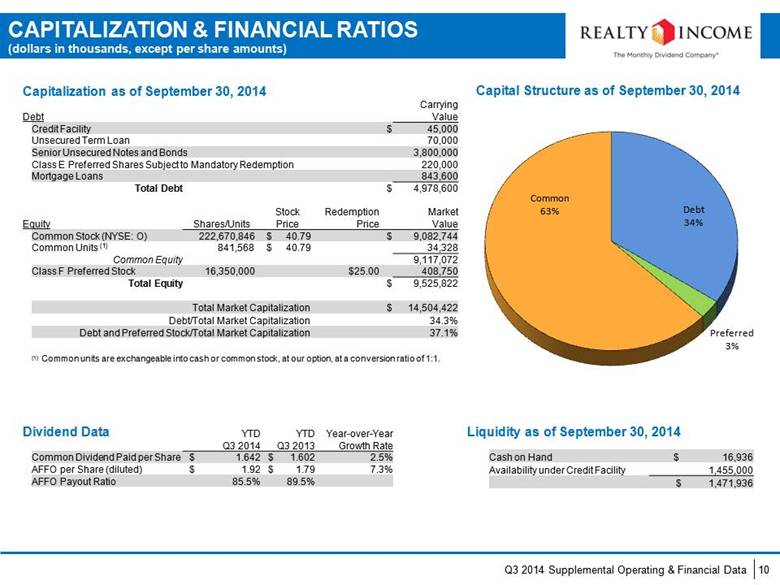
| CAPITALIZATION & FINANCIAL RATIOS (dollars in thousands, except per share amounts) 10 3.9 Capital Structure as of September 30, 2014 Q3 2014 Supplemental Operating & Financial Data Capitalization as of September 30, 2014 Carrying Debt Value Credit Facility $ 45,000 Unsecured Term Loan 70,000 Senior Unsecured Notes and Bonds 3,800,000 Class E Preferred Shares Subject to Mandatory Redemption 220,000 Mortgage Loans 843,600 Total Debt $ 4,978,600 Stock Redemption Market Equity Shares/Units Price Price Value Common Stock (NYSE: O) 222,670,846 $ 40.79 $ 9,082,744 Common Units (1) 841,568 $ 40.79 34,328 Common Equity 9,117,072 Class F Preferred Stock 16,350,000 $25.00 408,750 Total Equity $ 9,525,822 Total Market Capitalization $ 14,504,422 Debt/Total Market Capitalization 34.3% Debt and Preferred Stock/Total Market Capitalization 37.1% (1) Common units are exchangeable into cash or common stock, at our option, at a conversion ratio of 1:1. Dividend Data YTD YTD Year-over-Year Q3 2014 Q3 2013 Growth Rate Common Dividend Paid per Share $ 1.642 $ 1.602 2.5% AFFO per Share (diluted) $ 1.92 $ 1.79 7.3% AFFO Payout Ratio 85.5% 89.5% Liquidity as of September 30, 2014 Cash on Hand $ 16,936 Availability under Credit Facility 1,455,000 $ 1,471,936 |
| EBITDA & COVERAGE RATIOS (dollars in thousands) 11 Debt Service Coverage (2) Fixed Charge Coverage (3) 3.9 Q3 2014 Supplemental Operating & Financial Data Reconciliation of Net Income to EBITDA(1) Three months ended September 30, 2014 Net income $ 73,627 Interest 52,814 Taxes 697 Depreciation 95,260 Impairment loss 495 Gain on interest rate swaps (633) Gain on sales (10,975) Discontinued operations (EBITDA components) - Quarterly EBITDA $ 211,285 Annualized EBITDA $ 845,140 Debt/EBITDA 5.9 (1) EBITDA means, for the most recent quarter, annualized earnings (net income) before (i) interest expense, (ii) income and franchise taxes, (iii) real estate depreciation and amortization, (iv) impairment losses, (v) non-cash loss (gain) on swaps, and (vi) gain on sales (Realty Income properties). (2) Refer to footnote 1 on page 12 for a detailed description of the calculation of debt service coverage. (3) Fixed charge coverage is calculated in exactly the same manner as the debt service coverage (defined on page 12), except that preferred stock dividends are also added to the denominator. |
| DEBT COVENANTS 12 Q3 2014 Supplemental Operating & Financial Data As of September 30, 2014 The following is a summary of the key financial covenants for our senior unsecured notes and bonds, as defined and calculated per their terms. These calculations, which are not based on U.S. GAAP measurements, are presented to investors to show our ability to incur additional debt under the terms of our notes only and are not measures of our liquidity or performance. Required Actuals Limitation on incurrence of total debt < 60% of adjusted undepreciated assets 44.8% Limitation on incurrence of secured debt < 40% of adjusted undepreciated assets 7.7% Debt service coverage (trailing 12 months) (1) > 1.5 x 3.7x Maintenance of total unencumbered assets > 150% of unsecured debt 230.1% (1) This covenant is calculated on a pro forma basis for the preceding four-quarter period on the assumption that: (i) the incurrence of any Debt (as defined in the covenants) incurred by us since the first day of such four-quarter period and the application of the proceeds therefrom (including to refinance other Debt since the first day of such four-quarter period), (ii) the repayment or retirement of any of our Debt since the first day of such four-quarter period, and (iii) any acquisition or disposition by us of any asset or group since the first day of such four-quarters had in each case occurred on October 1, 2013, and subject to certain additional adjustments. Such pro forma ratio has been prepared on the basis required by that debt service covenant, reflects various estimates and assumptions and is subject to other uncertainties, and therefore does not purport to reflect what our actual debt service coverage ratio would have been had transactions referred to in clauses (i), (ii) and (iii) of the preceding sentence occurred as of October 1, 2013, nor does it purport to reflect our debt service coverage ratio for any future period. |
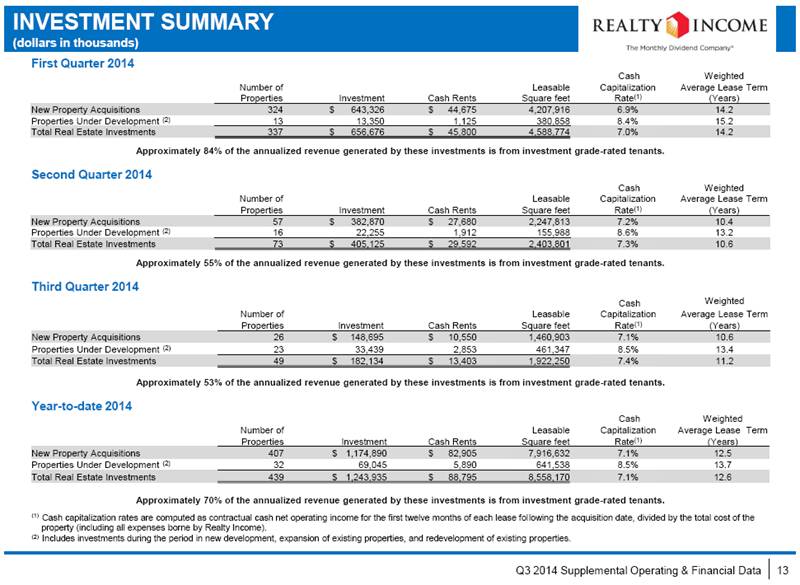
| INVESTMENT SUMMARY (dollars in thousands) 13 Q3 2014 Supplemental Operating & Financial Data First Quarter 2014 Number of Properties Investment Cash Rents Leasable Square feet Cash Capitalization Rate(1) Weighted Average Lease Term (Years) New Property Acquisitions 324 $ 643,326 $ 44,675 4,207,916 6.9% 14.2 Properties Under Development (2) 13 13,350 1,125 380,858 8.4% 15.2 Total Real Estate Investments 337 $ 656,676 $ 45,800 4,588,774 7.0% 14.2 Approximately 84% of the annualized revenue generated by these investments is from investment grade-rated tenants. Second Quarter 2014 Number of Properties Investment Cash Rents Leasable Square feet Cash Capitalization Rate(1) Weighted Average Lease Term (Years) New Property Acquisitions 57 $ 382,870 $ 27,680 2,247,813 7.2% 10.4 Properties Under Development (2) 16 22,255 1,912 155,988 8.6% 13.2 Total Real Estate Investments 73 $ 405,125 $ 29,592 2,403,801 7.3% 10.6 Approximately 55% of the annualized revenue generated by these investments is from investment grade-rated tenants. Third Quarter 2014 Number of Properties Investment Cash Rents Leasable Square feet Cash Capitalization Rate(1) Weighted Average Lease Term (Years) New Property Acquisitions 26 $ 148,695 $ 10,550 1,460,903 7.1% 10.6 Properties Under Development (2) 23 33,439 2,853 461,347 8.5% 13.4 Total Real Estate Investments 49 $ 182,134 $ 13,403 1,922,250 7.4% 11.2 Approximately 53% of the annualized revenue generated by these investments is from investment grade-rated tenants. Year-to-date 2014 Number of Properties Investment Cash Rents Leasable Square feet Cash Capitalization Rate(1) Weighted Average Lease Term (Years) New Property Acquisitions 407 $ 1,174,890 $ 82,905 7,916,632 7.1% 12.5 Properties Under Development (2) 32 69,045 5,890 641,538 8.5% 13.7 Total Real Estate Investments 439 $ 1,243,935 $ 88,795 8,558,170 7.1% 12.6 Approximately 70% of the annualized revenue generated by these investments is from investment grade-rated tenants. (1) Cash capitalization rates are computed as contractual cash net operating income for the first twelve months of each lease following the acquisition date, divided by the total cost of the property (including all expenses borne by Realty Income). (2) Includes investments during the period in new development, expansion of existing properties, and redevelopment of existing properties. |
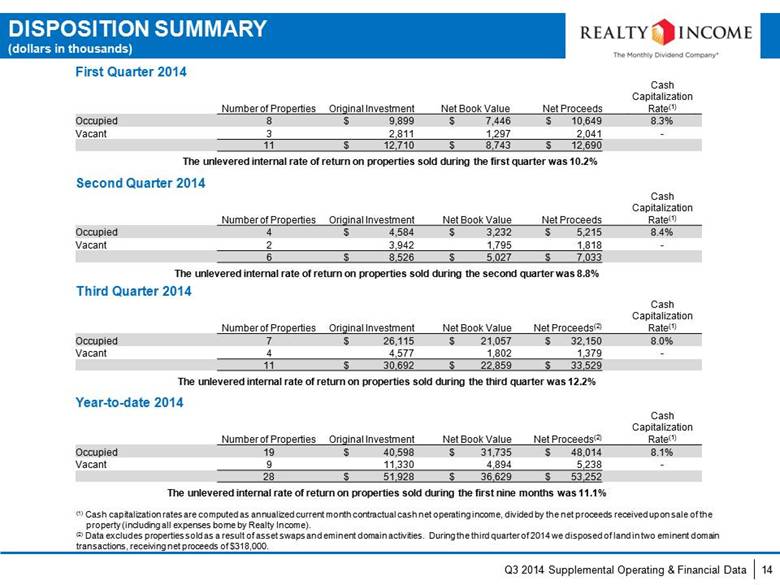
| DISPOSITION SUMMARY (dollars in thousands) 14 Q3 2014 Supplemental Operating & Financial Data First Quarter 2014 Number of Properties Original Investment Net Book Value Net Proceeds Cash Capitalization Rate(1) Occupied 8 $ 9,899 $ 7,446 $ 10,649 8.3% Vacant 3 2,811 1,297 2,041 - 11 $ 12,710 $ 8,743 $ 12,690 Second Quarter 2014 Number of Properties Original Investment Net Book Value Net Proceeds Cash Capitalization Rate(1) Occupied 4 $ 4,584 $ 3,232 $ 5,215 8.4% Vacant 2 3,942 1,795 1,818 - 6 $ 8,526 $ 5,027 $ 7,033 Year-to-date 2014 Number of Properties Original Investment Net Book Value Net Proceeds(2) Cash Capitalization Rate(1) Occupied 19 $ 40,598 $ 31,735 $ 48,014 8.1% Vacant 9 11,330 4,894 5,238 - 28 $ 51,928 $ 36,629 $ 53,252 The unlevered internal rate of return on properties sold during the first quarter was 10.2% The unlevered internal rate of return on properties sold during the second quarter was 8.8% The unlevered internal rate of return on properties sold during the first nine months was 11.1% Third Quarter 2014 Number of Properties Original Investment Net Book Value Net Proceeds(2) Cash Capitalization Rate(1) Occupied 7 $ 26,115 $ 21,057 $ 32,150 8.0% Vacant 4 4,577 1,802 1,379 - 11 $ 30,692 $ 22,859 $ 33,529 The unlevered internal rate of return on properties sold during the third quarter was 12.2% (1) Cash capitalization rates are computed as annualized current month contractual cash net operating income, divided by the net proceeds received upon sale of the property (including all expenses borne by Realty Income). (2) Data excludes properties sold as a result of asset swaps and eminent domain activities. During the third quarter of 2014 we disposed of land in two eminent domain transactions, receiving net proceeds of $318,000. |
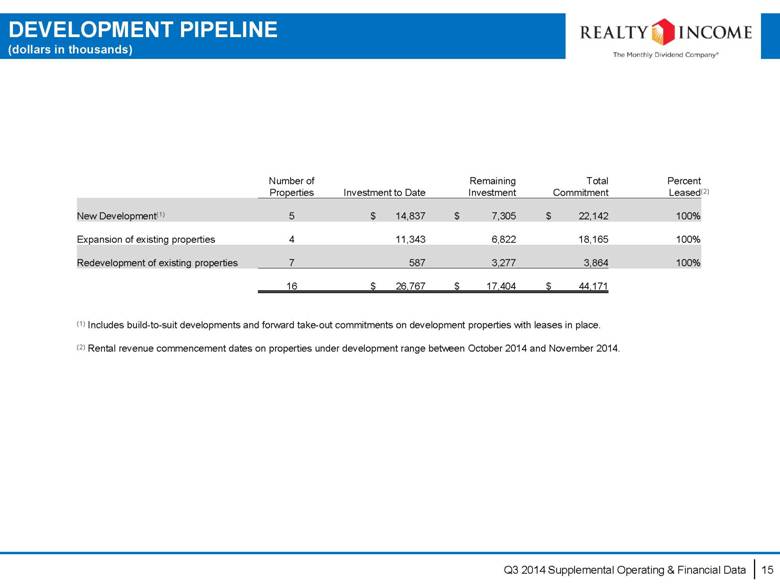
| DEVELOPMENT PIPELINE(dollars in thousands)Number of Remaining Total PercentProperties Investment to Date Investment Commitment Leased(2)New Development(1) 5 $14,837 $7,305 $22,142 100%Expansion of existing properties 4 11,343 6,822 18,165 100%Redevelopment of existing properties 7 587 3,277 3,864 100%16 $26,767 $17,404 $44,171(1)Includes build-to-suit developments and forward take-out commitments on development properties with leases in place.(2)Rental revenue commencement dates on properties under development range between October 2014 and November 2014. |
| TENANT DIVERSIFICATION 16 Top 20 Tenants Our 20 largest tenants based on percentage of total portfolio annualized rental revenue at September 30, 2014 include the following: Investment Grade Tenants(1): Number of Properties 1,929 Percentage of Annualized Rents 46.4% Q3 2014 Supplemental Operating & Financial Data Tenant Number of Properties % of Revenue Investment Grade Ratings (Moody’s/S&P/Fitch) Walgreens 116 5.4 % Baa1/ BBB/ A- FedEx 38 5.1 % Baa1/ BBB/ BBB Dollar General 502 4.9 % Baa3/ BBB-/ - LA Fitness 46 4.7 % - Family Dollar 453 4.5 % Baa3/ BBB-/ - BJ's Wholesale Clubs 15 2.9 % - AMC Theatres 20 2.8 % - Diageo 17 2.7 % A3/ A-/ A- Regal Cinemas 23 2.3 % - Northern Tier Energy/Super America 134 2.2 % - CVS Pharmacy 56 2.1 % Baa1/ BBB+/ BBB+ Rite Aid 58 1.9 % - TBC Corporation 149 1.9 % A2/ A/ - Circle K 168 1.8 % Baa2/ BBB/ - The Pantry 145 1.7 % - Walmart/Sam's Club 19 1.4 % Aa2/ AA/ AA GPM Investments/Fas Mart 140 1.4 % - NPC International 202 1.4 % - Smart & Final 36 1.2 % - FreedomRoads/Camping World 18 1.2 % - EBITDAR/Rent Ratio on Retail Properties 2.6x (1) (1) Based on most recently analyzed information from retail tenants providing this information. The information that we receive from our retail tenants is not independently verified by us. (1) Investment grade tenants are defined as tenants with a credit rating of Baa3/BBB- or higher from one of the three major rating agencies (Moody’s/S&P/Fitch). 46.4% of our annualized rental revenue is generated from properties leased to investment grade tenants, including 7% from properties leased to subsidiaries of investment grade companies. |
| Percentage of Rental Revenue (1) For the Quarter Ended For the Years Ended September 30, Dec 31, Dec 31, Dec 31, Dec 31, Dec 31, Dec 31, 2014 2013 2012 2011 2010 2009 2008 Retail industries Apparel stores 2.2 % 1.9 % 1.7 % 1.4 % 1.2 % 1.1 % 1.1 % Automotive collision services 0.8 0.8 1.1 0.9 1.0 1.1 1.0 Automotive parts 1.3 1.2 1.0 1.2 1.4 1.5 1.6 Automotive service 1.8 2.1 3.1 3.7 4.7 4.8 4.8 Automotive tire services 3.1 3.6 4.7 5.6 6.4 6.9 6.7 Book stores * * 0.1 0.1 0.1 0.2 0.2 Child care 2.2 2.8 4.5 5.2 6.5 7.3 7.6 Consumer electronics 0.3 0.3 0.5 0.5 0.6 0.7 0.8 Convenience stores 10.0 11.2 16.3 18.5 17.1 16.9 15.8 Crafts and novelties 0.5 0.5 0.3 0.2 0.3 0.3 0.3 Dollar stores 9.6 6.2 2.2 - - - - Drug stores 9.4 8.1 3.5 3.8 4.1 4.3 4.1 Education 0.4 0.4 0.7 0.7 0.8 0.9 0.8 Entertainment 0.6 0.6 0.9 1.0 1.2 1.3 1.2 Equipment services 0.1 0.1 0.1 0.2 0.2 0.2 0.2 Financial services 1.4 1.5 0.2 0.2 0.2 0.2 0.2 General merchandise 1.2 1.1 0.6 0.6 0.8 0.8 0.8 Grocery stores 3.2 2.9 3.7 1.6 0.9 0.7 0.7 Health and fitness 7.0 6.3 6.8 6.4 6.9 5.9 5.6 Health care 1.1 1.1 - - - - - Home furnishings 0.7 0.9 1.0 1.1 1.3 1.3 2.4 Home improvement 2.0 1.6 1.5 1.7 2.0 2.2 2.1 Jewelry 0.1 0.1 - - - - - Motor vehicle dealerships 1.5 1.6 2.1 2.2 2.6 2.7 3.2 Office supplies 0.4 0.5 0.8 0.9 0.9 1.0 1.0 Pet supplies and services 0.7 0.8 0.6 0.7 0.9 0.9 0.8 Restaurants - casual dining 4.2 5.1 7.3 10.9 13.4 13.7 14.3 Restaurants - quick service 3.5 4.4 5.9 6.6 7.7 8.3 8.2 Shoe stores 0.1 0.1 0.1 0.2 0.1 - - Sporting goods 1.7 1.7 2.5 2.7 2.7 2.6 2.3 Theaters 5.2 6.2 9.4 8.8 8.9 9.2 9.0 Transportation services 0.1 0.1 0.2 0.2 0.2 0.2 0.2 Wholesale clubs 4.1 3.9 3.2 0.7 - - - Other * 0.1 0.1 0.1 0.3 1.1 1.2 Retail industries 80.5 % 79.8 % 86.7 % 88.6 % 95.4 % 98.3 % 98.2 % INDUSTRY DIVERSIFICATION 17 Q3 2014 Supplemental Operating & Financial Data * Less than 0.1% (1) Includes rental revenue for all properties owned by Realty Income at the end of each period presented, including revenue from properties reclassified as discontinued operations. Excludes revenue from properties owned by Crest Net Lease, Inc., or Crest. |
| INDUSTRY DIVERSIFICATION (CONT’D) 18 Q3 2014 Supplemental Operating & Financial Data * Less than 0.1% Percentage of Rental Revenue(1) For the Quarter Ended For the Years Ended September 30, Dec 31, Dec 31, Dec 31, Dec 31, Dec 31, Dec 31, 2014 2013 2012 2011 2010 2009 2008 Non-retail industries Aerospace 1.2 1.2 0.9 0.5 - - - Beverages 2.8 3.3 5.1 5.6 3.0 - - Consumer appliances 0.5 0.6 0.1 - - - - Consumer goods 0.9 1.0 0.1 - - - - Crafts and novelties 0.1 0.1 - - - - - Diversified industrial 0.6 0.2 0.1 - - - - Electric utilities 0.1 * - - - - - Equipment services 0.5 0.4 0.3 0.2 - - - Financial services 0.4 0.5 0.4 0.3 - - - Food processing 1.3 1.5 1.3 0.7 - - - General merchandise 0.3 - - - - - - Government services 1.2 1.4 0.1 0.1 0.1 0.1 - Health care 0.7 0.8 * * - - - Home furnishings 0.2 0.2 - - - - - Home improvement * - - - - - - Insurance 0.1 0.1 * - - - - Machinery 0.2 0.2 0.1 - - - - Other manufacturing 0.7 0.6 - - - - - Packaging 0.8 0.9 0.7 0.4 - - - Paper 0.2 0.2 0.1 0.1 - - - Shoe stores 0.8 0.9 - - - - - Telecommunications 0.7 0.7 0.8 0.7 - - - Transportation services 5.0 5.3 2.2 1.6 - - - Other 0.2 0.1 1.0 1.2 1.5 1.6 1.8 Non-retail industries 19.5 % 20.2 % 13.3 % 11.4 % 4.6 % 1.7 % 1.8 % Totals 100.0 % 100.0 % 100.0 % 100.0 % 100.0 % 100.0 % 100.0 % (1) Includes rental revenue for all properties owned by Realty Income at the end of each period presented, including revenue from properties reclassified as discontinued operations. Excludes revenue from properties owned by Crest Net Lease, Inc., or Crest. |
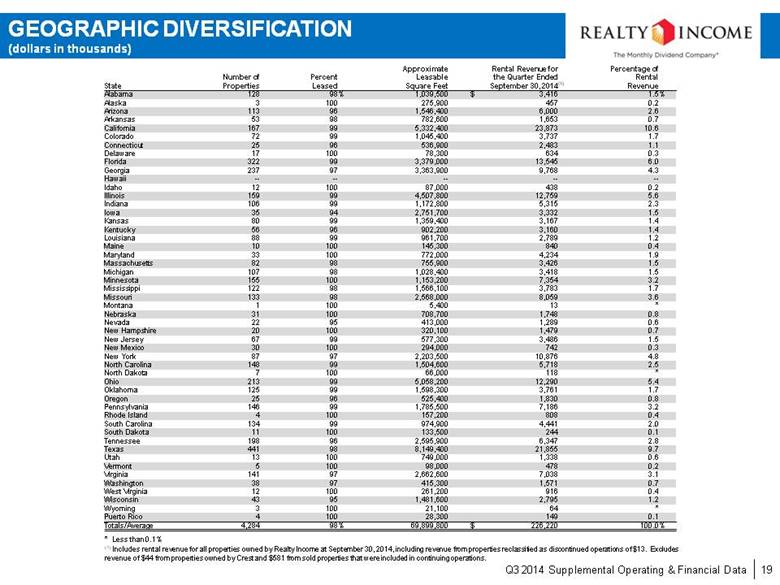
| GEOGRAPHIC DIVERSIFICATION (dollars in thousands) 19 (1) Includes rental revenue for all properties owned by Realty Income at September 30, 2014, including revenue from properties reclassified as discontinued operations of $13. Excludes revenue of $44 from properties owned by Crest and $581 from sold properties that were included in continuing operations. Q3 2014 Supplemental Operating & Financial Data * Less than 0.1% Approximate Rental Revenue for Percentage of Number of Percent Leasable the Quarter Ended Rental State Properties Leased Square Feet September 30, 2014 (1) Revenue Alabama 128 98 % 1,039,500 $ 3,416 1.5 % Alaska 3 100 275,900 457 0.2 Arizona 113 96 1,546,400 6,000 2.6 Arkansas 53 98 782,600 1,653 0.7 California 167 99 5,332,400 23,873 10.6 Colorado 72 99 1,045,400 3,737 1.7 Connecticut 25 96 536,900 2,483 1.1 Delaware 17 100 78,300 634 0.3 Florida 322 99 3,379,000 13,545 6.0 Georgia 237 97 3,363,900 9,768 4.3 Hawaii -- -- -- -- -- Idaho 12 100 87,000 438 0.2 Illinois 159 99 4,507,800 12,759 5.6 Indiana 106 99 1,172,800 5,315 2.3 Iowa 35 94 2,751,700 3,332 1.5 Kansas 80 99 1,359,400 3,167 1.4 Kentucky 56 96 902,200 3,160 1.4 Louisiana 88 99 961,700 2,789 1.2 Maine 10 100 145,300 840 0.4 Maryland 33 100 772,000 4,234 1.9 Massachusetts 82 98 755,900 3,426 1.5 Michigan 107 98 1,028,400 3,418 1.5 Minnesota 155 100 1,153,200 7,354 3.2 Mississippi 122 98 1,566,100 3,783 1.7 Missouri 133 98 2,568,000 8,059 3.6 Montana 1 100 5,400 13 * Nebraska 31 100 708,700 1,748 0.8 Nevada 22 95 413,000 1,289 0.6 New Hampshire 20 100 320,100 1,479 0.7 New Jersey 67 99 577,300 3,486 1.5 New Mexico 30 100 294,000 742 0.3 New York 87 97 2,203,500 10,876 4.8 North Carolina 148 99 1,504,600 5,718 2.5 North Dakota 7 100 66,000 118 * Ohio 213 99 5,058,200 12,290 5.4 Oklahoma 125 99 1,598,300 3,761 1.7 Oregon 25 96 525,400 1,830 0.8 Pennsylvania 146 99 1,785,500 7,186 3.2 Rhode Island 4 100 157,200 808 0.4 South Carolina 134 99 974,900 4,441 2.0 South Dakota 11 100 133,500 244 0.1 Tennessee 198 96 2,595,900 6,347 2.8 Texas 441 98 8,149,400 21,855 9.7 Utah 13 100 749,000 1,338 0.6 Vermont 5 100 98,000 478 0.2 Virginia 141 97 2,662,600 7,038 3.1 Washington 38 97 415,300 1,571 0.7 West Virginia 12 100 261,200 916 0.4 Wisconsin 43 95 1,481,600 2,795 1.2 Wyoming 3 100 21,100 64 * Puerto Rico 4 100 28,300 149 0.1 Totals/Average 4,284 98 % 69,899,800 $ 226,220 100.0 % |
| PROPERTY TYPE DIVERSIFICATION (dollars in thousands) 20 Approximate Rental Revenue for the Percentage of Number of Leasable Quarter Ended Rental Property Type Properties Square Feet September 30, 2014 (1) Revenue Retail 4,128 46,451,000 $ 176,992 78.2 % Industrial and distribution 81 15,869,200 23,248 10.3 Office 46 3,519,900 15,097 6.7 Manufacturing 14 3,875,200 5,616 2.5 Agriculture 15 184,500 5,267 2.3 Totals 4,284 69,899,800 $ 226,220 100.0 % (1) Includes rental revenue for all properties owned by Realty Income at September 30, 2014, including revenue from properties reclassified as discontinued operations of $13. Excludes revenue of $44 from properties owned by Crest and $581 from sold properties that were included in continuing operations. Q3 2014 Supplemental Operating & Financial Data |
| SAME STORE RENTAL REVENUE (dollars in thousands) 21 Same Store Rental Revenue Number of Properties 2,756 Square Footage 34,297,045 Q3 2014 $ 129,349 Q3 2013 $ 127,625 Increase (in dollars) $ 1,724 Increase (percent) 1.4% Q3 2014 Supplemental Operating & Financial Data Top 3 Industries Contributing to the Change Quarter ended Quarter ended Net % Change Industry September 30, 2014 September 30, 2013 Change by Industry Convenience Stores $ 19,825 $ 19,319 $ 506 2.6% Health and Fitness 9,564 9,285 279 3.0% Restaurants - Quick Service 6,493 6,353 140 2.2% Same Store Rental Revenue Number of Properties 2,756 Square Footage 34,297,045 YTD Q3 2014 $ 388,020 YTD Q3 2013 $ 382,318 Increase (in dollars) $ 5,702 Increase (percent) 1.5% Top 3 Industries Contributing to the Change Nine months ended Nine months ended Net % Change Industry September 30, 2014 September 30, 2013 Change by Industry Convenience Stores $ 59,081 $ 57,671 $ 1,410 2.4% Automotive Tire Services 17,902 17,055 847 5.0% Health and Fitness 28,398 27,739 659 2.4% Third Quarter 2014 Year-to-date 2014 |
| SAME STORE RENTAL REVENUE (CONT’D) (dollars in thousands) 22 Q3 2014 Supplemental Operating & Financial Data Same Store Pool Defined For purposes of determining the same store rent property pool, we include all properties that were owned for the entire year-to-date period, for both the current and prior year except for properties during the current or prior year that were: (i) vacant at any time, (ii) under development or redevelopment, or (iii) involved in eminent domain and rent was reduced. Third Quarter 2014 Quarter ended Quarter ended Net % Change by Contribution by Property Type September 30, 2014 September 30, 2013 Change Property Type Property Type Retail $ 111,277 109,764 1,513 1.4% 87.8% Agriculture 5,267 5,202 65 1.2% 3.8% Office 3,021 2,968 53 1.8% 3.1% Manufacturing 3,456 3,408 48 1.4% 2.7% Industrial and distribution 6,328 6,283 45 0.7% 2.6% Total $ 129,349 127,625 1,724 1.4% 100.0% Year-to-date 2014 Nine months ended Nine months ended Net % Change by Contribution by Property Type September 30, 2014 September 30, 2013 Change Property Type Property Type Retail $ 334,051 328,987 5,064 1.5% 88.7% Agriculture 15,685 15,491 194 1.3% 3.4% Office 9,056 8,876 180 2.0% 3.3% Manufacturing 10,321 10,180 141 1.4% 2.5% Industrial and distribution 18,907 18,784 123 0.7% 2.1% Total $ 388,020 382,318 5,702 1.5% 100% Same Store Rental Revenue by Property Type |
| OCCUPANCY 23 96.6% 97.0% 97.2% 97.7% 98.2% 98.1% 98.2% 98.3% Q3 2014 Supplemental Operating & Financial Data By Property Occupied Properties 4,210 Total Properties 4,284 Occupancy 98.3% By Square Footage Occupied Square Footage 69,243,600 Total Square Footage 69,899,800 Occupancy 99.1% By Rental Revenue Quarterly Rental Revenue $ 224,759,100 Quarterly Vacant Rental Revenue $ 1,952,800 (1) Occupancy 99.1% (1) Based on contractual monthly rents received immediately preceding the date of vacancy. Change in Occupancy Vacant Properties at 6/30/2014 74 Expiration Activity (1) + 81 Leasing Activity (2) - 77 Vacant Property Sales Activity - 4 Vacant Properties at 9/30/2014 74 (1) Includes scheduled and unscheduled expirations as well as future expirations resolved in the current quarter. (2) Includes 71 expirations that were re-leased to the same or new tenants without vacancy, and six that was re-leased after a period of vacancy. See page 24 for additional detail on re-leasing activity. |
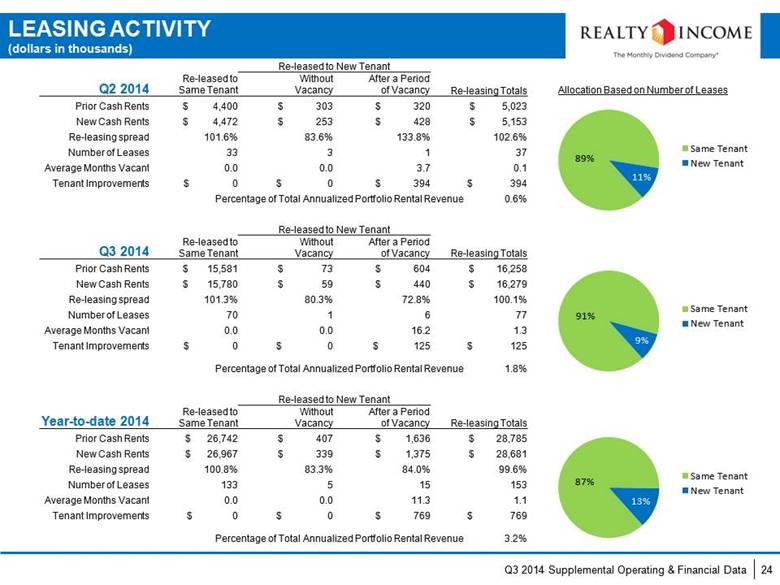
| LEASING ACTIVITY (dollars in thousands) 24 Q3 2014 Supplemental Operating & Financial Data Re-leased to New Tenant Q2 2014 Re-leased to Same Tenant Without Vacancy After a Period of Vacancy Re-leasing Totals Prior Cash Rents $ 4,400 $ 303 $ 320 $ 5,023 New Cash Rents $ 4,472 $ 253 $ 428 $ 5,153 Re-leasing spread 101.6% 83.6% 133.8% 102.6% Number of Leases 33 3 1 37 Average Months Vacant 0.0 0.0 3.7 0.1 Tenant Improvements $ 0 $ 0 $ 394 $ 394 Percentage of Total Annualized Portfolio Rental Revenue 0.6% Re-leased to New Tenant Q3 2014 Re-leased to Same Tenant Without Vacancy After a Period of Vacancy Re-leasing Totals Prior Cash Rents $ 15,581 $ 73 $ 604 $ 16,258 New Cash Rents $ 15,780 $ 59 $ 440 $ 16,279 Re-leasing spread 101.3% 80.3% 72.8% 100.1% Number of Leases 70 1 6 77 Average Months Vacant 0.0 0.0 16.2 1.3 Tenant Improvements $ 0 $ 0 $ 125 $ 125 Percentage of Total Annualized Portfolio Rental Revenue 1.8% Re-leased to New Tenant Year-to-date 2014 Re-leased to Same Tenant Without Vacancy After a Period of Vacancy Re-leasing Totals Prior Cash Rents $ 26,742 $ 407 $ 1,636 $ 28,785 New Cash Rents $ 26,967 $ 339 $ 1,375 $ 28,681 Re-leasing spread 100.8% 83.3% 84.0% 99.6% Number of Leases 133 5 15 153 Average Months Vacant 0.0 0.0 11.3 1.1 Tenant Improvements $ 0 $ 0 $ 769 $ 769 Percentage of Total Annualized Portfolio Rental Revenue 3.2% Allocation Based on Number of Leases |
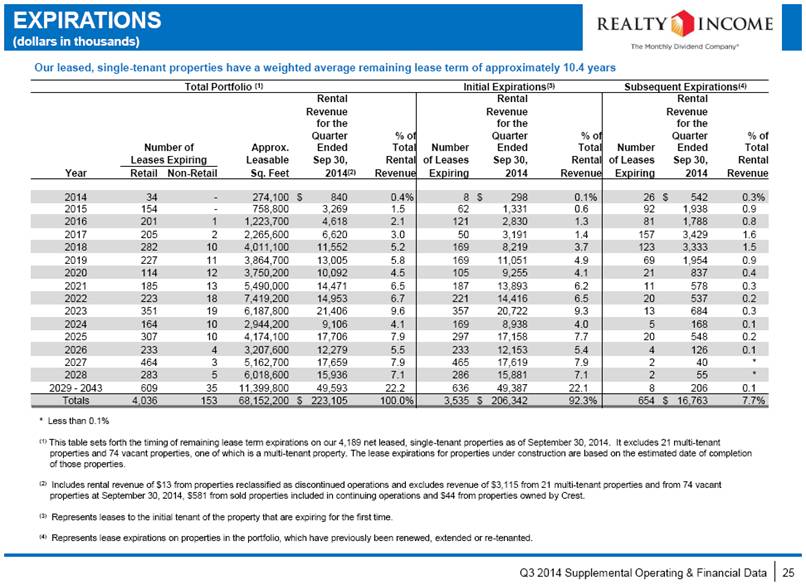
| EXPIRATIONS (dollars in thousands) 25 Q3 2014 Supplemental Operating & Financial Data * Less than 0.1% (1) This table sets forth the timing of remaining lease term expirations on our 4,189 net leased, single-tenant properties as of September 30, 2014. It excludes 21 multi-tenant properties and 74 vacant properties, one of which is a multi-tenant property. The lease expirations for properties under construction are based on the estimated date of completion of those properties. (2) Includes rental revenue of $13 from properties reclassified as discontinued operations and excludes revenue of $3,115 from 21 multi-tenant properties and from 74 vacant properties at September 30, 2014, $581 from sold properties included in continuing operations and $44 from properties owned by Crest. (3) Represents leases to the initial tenant of the property that are expiring for the first time. (4) Represents lease expirations on properties in the portfolio, which have previously been renewed, extended or re-tenanted. Our leased, single-tenant properties have a weighted average remaining lease term of approximately 10.4 years Total Portfolio (1) Initial Expirations(3) Subsequent Expirations(4) Rental Rental Rental Revenue Revenue Revenue for the for the for the Quarter % of Quarter % of Quarter % of Number of Approx. Ended Total Number Ended Total Number Ended Total Leases Expiring Leasable Sep 30, Rental of Leases Sep 30, Rental of Leases Sep 30, Rental Year Retail Non-Retail Sq. Feet 2014 (2) Revenue Expiring 2014 Revenue Expiring 2014 Revenue 2014 34 - 274,100 $ 840 0.4 % 8 $ 298 0.1 % 26 $ 542 0.3 % 2015 154 - 758,800 3,269 1.5 62 1,331 0.6 92 1,938 0.9 2016 201 1 1,223,700 4,618 2.1 121 2,830 1.3 81 1,788 0.8 2017 205 2 2,265,600 6,620 3.0 50 3,191 1.4 157 3,429 1.6 2018 282 10 4,011,100 11,552 5.2 169 8,219 3.7 123 3,333 1.5 2019 227 11 3,864,700 13,005 5.8 169 11,051 4.9 69 1,954 0.9 2020 114 12 3,750,200 10,092 4.5 105 9,255 4.1 21 837 0.4 2021 185 13 5,490,000 14,471 6.5 187 13,893 6.2 11 578 0.3 2022 223 18 7,419,200 14,953 6.7 221 14,416 6.5 20 537 0.2 2023 351 19 6,187,800 21,406 9.6 357 20,722 9.3 13 684 0.3 2024 164 10 2,944,200 9,106 4.1 169 8,938 4.0 5 168 0.1 2025 307 10 4,174,100 17,706 7.9 297 17,158 7.7 20 548 0.2 2026 233 4 3,207,600 12,279 5.5 233 12,153 5.4 4 126 0.1 2027 464 3 5,162,700 17,659 7.9 465 17,619 7.9 2 40 * 2028 283 5 6,018,600 15,936 7.1 286 15,881 7.1 2 55 * 2029 - 2043 609 35 11,399,800 49,593 22.2 636 49,387 22.1 8 206 0.1 Totals 4,036 153 68,152,200 $ 223,105 100.0 % 3,535 $ 206,342 92.3 % 654 $ 16,763 7.7 % |