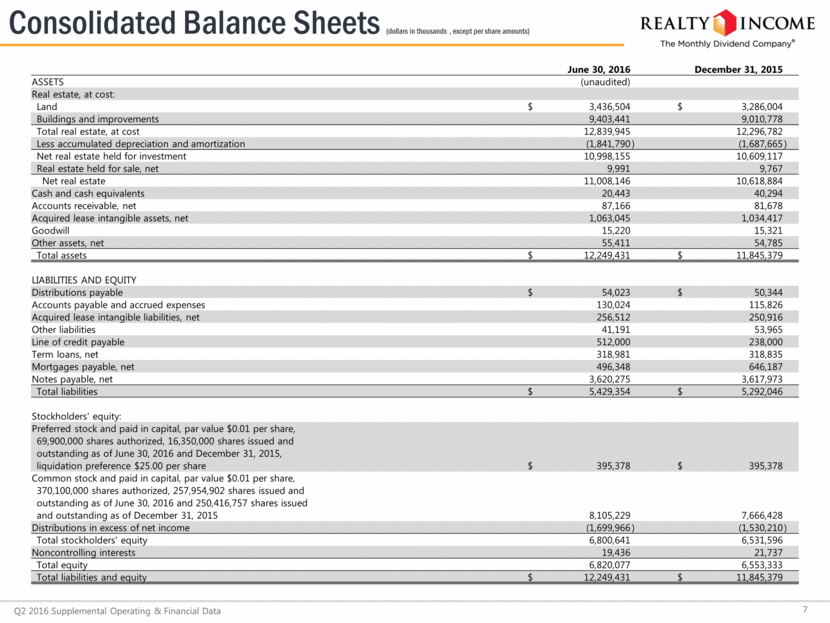
Consolidated Balance Sheets (dollars in thousands , except per share amounts) 7 Q2 2016 Supplemental Operating & Financial Data June 30, 2016 December 31, 2015 ASSETS (unaudited) Real estate, at cost: Land $ 3,436,504 $ 3,286,004 Buildings and improvements 9,403,441 9,010,778 Total real estate, at cost 12,839,945 12,296,782 Less accumulated depreciation and amortization (1,841,790 ) (1,687,665 ) Net real estate held for investment 10,998,155 10,609,117 Real estate held for sale, net 9,991 9,767 Net real estate 11,008,146 10,618,884 Cash and cash equivalents 20,443 40,294 Accounts receivable, net 87,166 81,678 Acquired lease intangible assets, net 1,063,045 1,034,417 Goodwill 15,220 15,321 Other assets, net 55,411 54,785 Total assets $ 12,249,431 $ 11,845,379 LIABILITIES AND EQUITY Distributions payable $ 54,023 $ 50,344 Accounts payable and accrued expenses 130,024 115,826 Acquired lease intangible liabilities, net 256,512 250,916 Other liabilities 41,191 53,965 Line of credit payable 512,000 238,000 Term loans, net 318,981 318,835 Mortgages payable, net 496,348 646,187 Notes payable, net 3,620,275 3,617,973 Total liabilities $ 5,429,354 $ 5,292,046 Stockholders' equity: Preferred stock and paid in capital, par value $0.01 per share, 69,900,000 shares authorized, 16,350,000 shares issued and $ 395,378 $ 395,378 outstanding as of June 30, 2016 and December 31, 2015, liquidation preference $25.00 per share Common stock and paid in capital, par value $0.01 per share, 370,100,000 shares authorized, 257,954,902 shares issued and outstanding as of June 30, 2016 and 250,416,757 shares issued and outstanding as of December 31, 2015 8,105,229 7,666,428 Distributions in excess of net income (1,699,966 ) (1,530,210 ) Total stockholders' equity 6,800,641 6,531,596 Noncontrolling interests 19,436 21,737 Total equity 6,820,077 6,553,333 Total liabilities and equity $ 12,249,431 $ 11,845,379
