Exhibit 99.1
 |  |
CONTACT:
Tere H. Miller
Vice President,
Corporate Communications
(760) 741-2111, ext. 1177
SHAREHOLDERS APPROVE REALTY INCOME’S ACQUISITION OF AMERICAN REALTY CAPITAL TRUST
FOR IMMEDIATE RELEASE | Realty Income to Increase Common Stock Dividend, Provides Updated Earnings Estimates, and Provides Post Acquisition Company Information |
ESCONDIDO, CALIFORNIA, January 16, 2013….Realty Income Corporation (Realty Income), The Monthly Dividend Company®, (NYSE: O), announced today that Realty Income and American Realty Capital Trust (ARCT) shareholders have approved the acquisition of ARCT by Realty Income. The transaction is expected to close later in January.
When the transaction closes, Realty Income will issue 45.6 million shares of common stock to ARCT shareholders, based on a fixed exchange ratio of 0.2874 shares of Realty Income stock for each share of ARCT common stock owned, and ARCT shareholders will receive a one-time cash payment of $0.35 per share. The transaction will be essentially balance sheet neutral.
Commenting on the approved acquisition, Chief Executive Officer Tom A. Lewis said, “We are very gratified to have received approval from both Realty Income and ARCT shareholders to complete the acquisition of ARCT. As a result of this transaction, we will significantly advance our strategic objective to increase the overall credit quality of the revenue generated by our tenants. We are also pleased that, due to the significant revenue and earnings growth as a result of this acquisition, we are able to substantially increase our dividend.”
Common Stock Dividend Increase
Realty Income further announced that it anticipates its Board of Directors will declare an increase in the company’s common stock monthly cash dividend to $0.1809167 per share from $0.15175 per share after the transaction closes. When the dividend is increased, it will be the 70th dividend increase since Realty Income was listed on the New York Stock Exchange in 1994. The new monthly dividend amount will represent an annualized dividend of $2.171 per share, as compared to the previous annualized dividend of $1.821 per share, or an increase of 19.2%.
Updated 2013 Earnings Estimates
The ARCT acquisition is anticipated to be immediately accretive to Realty Income’s Normalized Funds from Operations (FFO) and Adjusted Funds from Operations (AFFO). Normalized FFO is based on FFO adjusted to add back merger-related costs. Based on the approved ARCT acquisition, combined with the record $1.16 billion in new property acquisitions for 2012, the company is increasing 2013 earnings estimates. The updated 2013 Normalized FFO and AFFO estimates are as follows (excluding the one-time costs associated with the ARCT transaction):
Normalized FFO per share for 2013 should range from $2.32 to $2.38 per share, an increase of 13.7% to 19.0% over the Normalized 2012 FFO per share estimate of $2.00 to $2.04. Normalized FFO per share for 2013 is based on an estimated net income per share range of $1.04 to $1.10, plus estimated real estate depreciation of $1.51 and reduced by potential estimated gains on sales of investment properties of $0.23 per share (in accordance with NAREIT’s definition of FFO).
AFFO per share for 2013 should range from $2.33 to $2.39 per share, an increase of 10.4% to 16.0% over the 2012 estimated AFFO per share of $2.06 to $2.11. The AFFO per share estimate for 2013 is based on adding back items to FFO, that reduce net income, totaling approximately $0.10, and deducting capitalized expenditures and straight-line rent revenue items totaling approximately $0.08, for a net increase of $0.01 to $0.02 over Normalized FFO.
Realty Income considers FFO and AFFO to be appropriate supplemental measures of a real estate investment trust’s (REIT’s) operating performance. Realty Income defines FFO consistent with the National Association of Real Estate Investment Trust’s (NAREIT’s) definition as net income available to common stockholders plus depreciation and
Realty Income Corporation, 600 La Terraza Blvd., Escondido, CA 92025 (760) 741- 2111 Fax (760) 741-8617
amortization of real estate assets, reduced by gains on sales of investment properties and extraordinary items. AFFO further adjusts FFO for unique revenue and expense items which are not pertinent to the measurement of Realty Income’s ongoing operating performance.
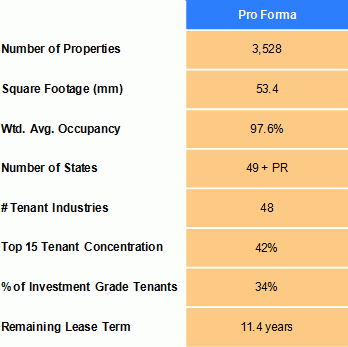
Post Acquisition Company Summary Information
Upon closing, Realty Income will add 515 freestanding commercial properties that are owned by ARCT to the company’s real estate portfolio. These properties are freestanding locations, which are net-leased to primarily investment grade rated tenants doing business in 27 industries. After adding these properties, Realty Income will own a total of 3,528 properties leased to 202 tenants doing business in 48 industries. Approximately 34% of the anticipated lease revenue will be generated by investment grade rated tenants, as compared to 19% prior to the ARCT acquisition. In addition, Realty Income will achieve increased diversification by industry, tenant and property type, increasing the number of industries to 48 from 44, the number of tenants to 202 from 150, and diversifying the property types to 77% retail, 11% distribution facility, 6% office, 3% agriculture, 2% manufacturing, and 1% industrial. With the acquisition of ARCT, the company will realize an increase in its portfolio occupancy to 97.6% from 97.2%.
Upon the closing of the ARCT acquisition, Realty Income is expected to have a total enterprise value of approximately $12.4 billion, and an equity market capitalization of $8.4 billion, making the company the largest publicly traded net-lease REIT by a factor of two times. Please see the charts and tables below for more information.
About Realty Income
Realty Income, The Monthly Dividend Company®, is a New York Stock Exchange real estate company dedicated to providing shareholders with dependable monthly income. To date the company has declared 510 consecutive common stock monthly dividends throughout its 44-year operating history and increased the dividend 69 times since Realty Income’s listing on the New York Stock Exchange in 1994. The monthly income is supported by the cash flow from over 3,500 properties owned under long-term lease agreements with regional and national retail chains and other commercial enterprises. The company is an active buyer of net-leased properties nationwide. Additional information about the company can be obtained from the corporate website at
www.realtyincome.com.
Note to Editors: Realty Income press releases are available on the company’s corporate website at:
http://www.realtyincome.com/invest/newsroom-library/press-releases.shtml.
2
Key Metrics After ARCT Acquisition
Property Type Diversification
The following table sets forth certain property type information regarding Realty Income’s property portfolio after the acquisition of American Realty Capital Trust (dollars in thousands):
Property Type | Number of Properties | Approximate Leasable Square Feet | Annualized Rental Revenue at 12/31/12 | Percentage of Annualized Rental Revenue | ||||||||||||
Retail | 3,387 | 32,853,300 | $ | 549,943 | 77.2 | % | ||||||||||
Distribution | 61 | 14,189,100 | 79,258 | 11.1 | ||||||||||||
Office | 40 | 2,221,700 | 39,752 | 5.6 | ||||||||||||
Agriculture | 15 | 184,500 | 20,551 | 2.9 | ||||||||||||
Manufacturing | 10 | 3,117,100 | 16,588 | 2.3 | ||||||||||||
Industrial | 15 | 850,500 | 6,320 | 0.9 | ||||||||||||
|
|
|
|
|
|
|
| |||||||||
Totals | 3,528 | 53,416,200 | $ | 712,412 | 100.0 | % | ||||||||||
|
|
|
|
|
|
|
| |||||||||
Tenant Diversification
Largest Tenants based on Percentage of Total Portfolio Rental Revenue at December 31, 2012 | ||||||||||
| FedEx | 5.5 | % | Regal Cinemas | 2.4 | % | |||||
| L.A. Fitness | 3.9 | % | Dollar General | 2.0 | % | |||||
| Family Dollar | 3.5 | % | The Pantry | 2.0 | % | |||||
| AMC Theatres | 3.5 | % | Rite Aid | 1.9 | % | |||||
| Diageo | 3.3 | % | NPC International/Pizza Hut | 1.8 | % | |||||
| BJ’s Wholesale Club | 3.3 | % | Friendly’s Ice Cream | 1.6 | % | |||||
| Walgreens | 2.9 | % | CVS | 1.6 | % | |||||
| Northern Tier Energy/Super America | 2.9 | % | ||||||||
3
Industry Diversification
The following table sets forth certain information regarding Realty Income’s property portfolio after the acquisition of American Realty Capital Trust classified according to the business of the respective tenants, expressed as a percentage of our total rental revenue:
| Percentage of Rental Revenue(1) For the Years Ended | ||||||||||||||||||||||||||||
| Percentage of Annualized Rental Revenue at 12/31/2012 | Dec 31, 2011 | Dec 31, 2010 | Dec 31, 2009 | Dec 31, 2008 | Dec 31, 2007 | Dec 31, 2006 | ||||||||||||||||||||||
| Retail Industries | ||||||||||||||||||||||||||||
Apparel stores | 1.6 | % | 1.4 | % | 1.2 | % | 1.1 | % | 1.1 | % | 1.2 | % | 1.7 | % | ||||||||||||||
Automotive collision services | 0.8 | 0.9 | 1.0 | 1.1 | 1.0 | 1.1 | 1.3 | |||||||||||||||||||||
Automotive parts | 1.1 | 1.2 | 1.4 | 1.5 | 1.6 | 2.1 | 2.8 | |||||||||||||||||||||
Automotive service | 3.0 | 3.7 | 4.7 | 4.8 | 4.8 | 5.2 | 6.9 | |||||||||||||||||||||
Automotive tire services | 3.2 | 5.6 | 6.4 | 6.9 | 6.7 | 7.3 | 6.1 | |||||||||||||||||||||
Book stores | * | 0.1 | 0.1 | 0.2 | 0.2 | 0.2 | 0.2 | |||||||||||||||||||||
Business services | * | * | * | * | * | 0.1 | 0.1 | |||||||||||||||||||||
Child care | 3.0 | 5.2 | 6.5 | 7.3 | 7.6 | 8.4 | 10.3 | |||||||||||||||||||||
Consumer electronics | 0.3 | 0.5 | 0.6 | 0.7 | 0.8 | 0.9 | 1.1 | |||||||||||||||||||||
Convenience stores | 11.6 | 18.5 | 17.1 | 16.9 | 15.8 | 14.0 | 16.1 | |||||||||||||||||||||
Crafts and novelties | 0.6 | 0.2 | 0.3 | 0.3 | 0.3 | 0.3 | 0.4 | |||||||||||||||||||||
Dollar stores | 5.6 | — | — | — | — | — | — | |||||||||||||||||||||
Drug stores | 6.6 | 3.8 | 4.1 | 4.3 | 4.1 | 2.7 | 2.9 | |||||||||||||||||||||
Education | 0.5 | 0.7 | 0.8 | 0.9 | 0.8 | 0.8 | 0.8 | |||||||||||||||||||||
Entertainment | 0.6 | 1.0 | 1.2 | 1.3 | 1.2 | 1.4 | 1.6 | |||||||||||||||||||||
Equipment services | 0.1 | 0.2 | 0.2 | 0.2 | 0.2 | 0.2 | 0.2 | |||||||||||||||||||||
Financial services | 1.9 | 0.2 | 0.2 | 0.2 | 0.2 | 0.2 | 0.1 | |||||||||||||||||||||
General merchandise | 1.2 | 0.6 | 0.8 | 0.8 | 0.8 | 0.7 | 0.6 | |||||||||||||||||||||
Grocery stores | 3.2 | 1.6 | 0.9 | 0.7 | 0.7 | 0.7 | 0.7 | |||||||||||||||||||||
Health and fitness | 5.2 | 6.4 | 6.9 | 5.9 | 5.6 | 5.1 | 4.3 | |||||||||||||||||||||
Home furnishings | 1.0 | 1.1 | 1.3 | 1.3 | 2.4 | 2.6 | 3.1 | |||||||||||||||||||||
Home improvement | 1.6 | 1.7 | 2.0 | 2.2 | 2.1 | 2.4 | 3.4 | |||||||||||||||||||||
Jewelry | 0.1 | — | — | — | — | — | — | |||||||||||||||||||||
Motor vehicle dealerships | 1.7 | 2.2 | 2.6 | 2.7 | 3.2 | 3.1 | 3.4 | |||||||||||||||||||||
Office supplies | 0.5 | 0.9 | 0.9 | 1.0 | 1.0 | 1.1 | 1.3 | |||||||||||||||||||||
Pet supplies and services | 0.9 | 0.7 | 0.9 | 0.9 | 0.8 | 0.9 | 1.1 | |||||||||||||||||||||
Restaurants - casual dining | 5.6 | 10.9 | 13.4 | 13.7 | 14.3 | 14.9 | 7.0 | |||||||||||||||||||||
Restaurants - quick service | 4.6 | 6.6 | 7.7 | 8.3 | 8.2 | 6.6 | 4.9 | |||||||||||||||||||||
Shoe stores | 0.9 | 0.2 | 0.1 | — | — | — | — | |||||||||||||||||||||
Sporting goods | 1.7 | 2.7 | 2.7 | 2.6 | 2.3 | 2.6 | 2.9 | |||||||||||||||||||||
Theaters | 6.4 | 8.8 | 8.9 | 9.2 | 9.0 | 9.0 | 9.6 | |||||||||||||||||||||
Transportation services | 0.1 | 0.2 | 0.2 | 0.2 | 0.2 | 0.2 | 0.3 | |||||||||||||||||||||
Video rental | 0.0 | 0.0 | 0.2 | 1.0 | 1.1 | 1.7 | 2.1 | |||||||||||||||||||||
Wholesale clubs | 3.4 | 0.7 | — | — | — | — | — | |||||||||||||||||||||
Other | 0.1 | 0.1 | 0.1 | 0.1 | 0.1 | 0.1 | 0.2 | |||||||||||||||||||||
|
|
|
|
|
|
|
|
|
|
|
|
|
| |||||||||||||||
Retail Industries | 78.7 | % | 88.6 | % | 95.4 | % | 98.3 | % | 98.2 | % | 97.8 | % | 97.5 | % | ||||||||||||||
|
|
|
|
|
|
|
|
|
|
|
|
|
| |||||||||||||||
4
Industry Diversification (continued)
| Percentage of Annualized Rental Revenue at 12/31/2012 | Percentage of Rental Revenue(1) For the Years Ended | |||||||||||||||||||||||||||
| Dec 31, | Dec 31, | Dec 31, | Dec 31, | Dec 31, | Dec 31, | |||||||||||||||||||||||
| 2011 | 2010 | 2009 | 2008 | 2007 | 2006 | |||||||||||||||||||||||
Other Industries | ||||||||||||||||||||||||||||
Aerospace | 0.9 | 0.5 | — | — | — | — | — | |||||||||||||||||||||
Beverages | 3.5 | 5.6 | 3.0 | — | — | — | — | |||||||||||||||||||||
Consumer appliances | 0.7 | — | — | — | — | — | — | |||||||||||||||||||||
Consumer goods | 1.1 | — | — | — | — | — | — | |||||||||||||||||||||
Diversified industrial | 0.1 | — | — | — | — | — | — | |||||||||||||||||||||
Equipment services | 0.3 | 0.2 | — | — | — | — | — | |||||||||||||||||||||
Financial services | 0.3 | 0.3 | — | — | — | — | — | |||||||||||||||||||||
Food processing | 1.5 | 0.7 | — | — | — | — | — | |||||||||||||||||||||
Government services | 1.5 | — | — | — | — | — | — | |||||||||||||||||||||
Health care | 2.0 | — | — | — | — | — | — | |||||||||||||||||||||
Home furnishings | 0.2 | — | — | — | — | — | — | |||||||||||||||||||||
Insurance | 0.1 | — | — | — | — | — | — | |||||||||||||||||||||
Machinery | 0.2 | — | — | — | — | — | — | |||||||||||||||||||||
Other manufacturing | 0.5 | — | — | — | — | — | — | |||||||||||||||||||||
Packaging | 1.0 | 0.4 | — | — | — | — | — | |||||||||||||||||||||
Paper | 0.2 | 0.1 | — | — | — | — | — | |||||||||||||||||||||
Telecommunications | 0.7 | 0.7 | — | — | — | — | — | |||||||||||||||||||||
Transportation services | 5.7 | 1.6 | — | — | — | — | — | |||||||||||||||||||||
Other | 0.8 | 1.3 | 1.6 | 1.7 | 1.8 | 2.2 | 2.5 | |||||||||||||||||||||
|
|
|
|
|
|
|
|
|
|
|
|
|
| |||||||||||||||
Other Industries | 21.3 | % | 11.4 | % | 4.6 | % | 1.7 | % | 1.8 | % | 2.2 | % | 2.5 | % | ||||||||||||||
|
|
|
|
|
|
|
|
|
|
|
|
|
| |||||||||||||||
Totals | 100.0 | % | 100.0 | % | 100.0 | % | 100.0 | % | 100.0 | % | 100.0 | % | 100.0 | % | ||||||||||||||
|
|
|
|
|
|
|
|
|
|
|
|
|
| |||||||||||||||
| * | Less than 0.1% |
| (1) | Includes rental revenue for all properties owned by Realty Income at the end of each period presented, including revenue from properties reclassified as discontinued operations. Excludes revenue from properties owned by Crest. |
5
Geographic Diversification
The following table sets forth certain state-by-state information regarding Realty Income’s property portfolio after the acquisition of American Realty Capital Trust (dollars in thousands):
State | Number of Properties | Percent Leased | Approximate Leasable Square Feet | Annualized Rental Revenue at 12/31/2012 | Percentage of Annualized Rental Revenue | |||||||||||||||
Alabama | 87 | 97 | % | 658,800 | $ | 10,097 | 1.4 | % | ||||||||||||
Alaska | 2 | 100 | 128,500 | 1,226 | 0.2 | |||||||||||||||
Arizona | 101 | 98 | 1,079,000 | 19,713 | 2.8 | |||||||||||||||
Arkansas | 27 | 96 | 532,500 | 4,160 | 0.6 | |||||||||||||||
California | 152 | 100 | 4,497,800 | 80,373 | 11.3 | |||||||||||||||
Colorado | 65 | 97 | 618,700 | 9,584 | 1.3 | |||||||||||||||
Connecticut | 26 | 92 | 475,600 | 8,349 | 1.2 | |||||||||||||||
Delaware | 16 | 100 | 29,500 | 1,562 | 0.2 | |||||||||||||||
Florida | 234 | 98 | 2,443,700 | 41,373 | 5.8 | |||||||||||||||
Georgia | 176 | 95 | 2,326,800 | 28,532 | 4.0 | |||||||||||||||
Hawaii | — | — | — | — | — | |||||||||||||||
Idaho | 14 | 93 | 97,500 | 1,812 | 0.3 | |||||||||||||||
Illinois | 132 | 99 | 3,386,400 | 36,395 | 5.1 | |||||||||||||||
Indiana | 91 | 98 | 909,300 | 16,820 | 2.4 | |||||||||||||||
Iowa | 35 | 91 | 2,679,900 | 11,879 | 1.7 | |||||||||||||||
Kansas | 76 | 96 | 1,557,300 | 11,940 | 1.7 | |||||||||||||||
Kentucky | 36 | 97 | 514,000 | 8,857 | 1.2 | |||||||||||||||
Louisiana | 65 | 100 | 619,800 | 9,171 | 1.3 | |||||||||||||||
Maine | 5 | 100 | 67,700 | 1,550 | 0.2 | |||||||||||||||
Maryland | 32 | 100 | 658,000 | 14,460 | 2.0 | |||||||||||||||
Massachusetts | 82 | 94 | 699,900 | 11,768 | 1.7 | |||||||||||||||
Michigan | 96 | 100 | 871,900 | 11,308 | 1.6 | |||||||||||||||
Minnesota | 156 | 100 | 1,141,900 | 28,940 | 4.1 | |||||||||||||||
Mississippi | 83 | 95 | 834,900 | 9,255 | 1.3 | |||||||||||||||
Missouri | 108 | 99 | 1,744,300 | 24,573 | 3.4 | |||||||||||||||
Montana | 2 | 100 | 30,000 | 282 | * | |||||||||||||||
Nebraska | 26 | 100 | 377,700 | 4,772 | 0.7 | |||||||||||||||
Nevada | 18 | 100 | 366,000 | 4,804 | 0.7 | |||||||||||||||
New Hampshire | 18 | 94 | 280,000 | 4,588 | 0.6 | |||||||||||||||
New Jersey | 66 | 97 | 449,000 | 10,374 | 1.5 | |||||||||||||||
New Mexico | 21 | 100 | 166,800 | 2,048 | 0.3 | |||||||||||||||
New York | 80 | 99 | 1,967,000 | 39,214 | 5.5 | |||||||||||||||
North Carolina | 113 | 96 | 1,014,600 | 16,055 | 2.3 | |||||||||||||||
North Dakota | 7 | 100 | 66,000 | 480 | 0.1 | |||||||||||||||
Ohio | 177 | 97 | 4,163,000 | 34,867 | 4.9 | |||||||||||||||
Oklahoma | 64 | 98 | 1,031,500 | 8,780 | 1.2 | |||||||||||||||
Oregon | 23 | 100 | 394,900 | 5,344 | 0.8 | |||||||||||||||
Pennsylvania | 147 | 99 | 1,702,700 | 27,326 | 3.8 | |||||||||||||||
Rhode Island | 3 | 100 | 11,000 | 147 | * | |||||||||||||||
South Carolina | 118 | 97 | 735,800 | 15,219 | 2.1 | |||||||||||||||
South Dakota | 11 | 100 | 133,500 | 1,032 | 0.1 | |||||||||||||||
Tennessee | 144 | 97 | 1,564,700 | 16,386 | 2.3 | |||||||||||||||
Texas | 368 | 98 | 5,281,300 | 68,678 | 9.6 | |||||||||||||||
Utah | 11 | 100 | 737,600 | 4,618 | 0.7 | |||||||||||||||
Vermont | 5 | 100 | 78,000 | 1,675 | 0.2 | |||||||||||||||
Virginia | 121 | 97 | 2,480,900 | 25,303 | 3.6 | |||||||||||||||
Washington | 36 | 97 | 372,000 | 5,040 | 0.7 | |||||||||||||||
West Virginia | 10 | 100 | 242,900 | 3,363 | 0.5 | |||||||||||||||
Wisconsin | 35 | 94 | 1,145,600 | 7,204 | 1.0 | |||||||||||||||
Wyoming | 3 | 100 | 21,100 | 257 | * | |||||||||||||||
Puerto Rico | 4 | 100 | 28,900 | 859 | 0.1 | |||||||||||||||
|
|
|
|
|
|
|
|
|
| |||||||||||
Totals/Average | 3,528 | 98 | % | 53,416,200 | $ | 712,412 | 100.0 | % | ||||||||||||
|
|
|
|
|
|
|
|
|
| |||||||||||
| * | Less than 0.1% |
6
Improved Lease Maturity Schedule
Realty Income reduces its near term lease rollover
while extending its weighted average lease term
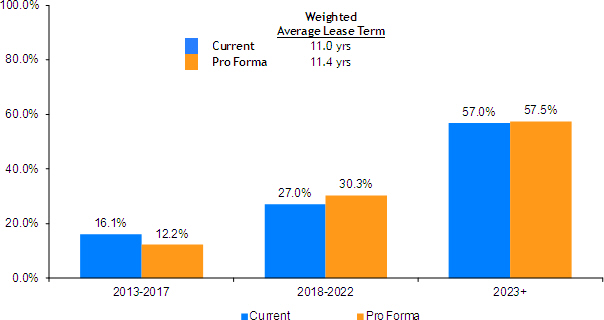
Note: Data based on annualized December 31, 2012 rental revenue.
Dividend Increase Chart
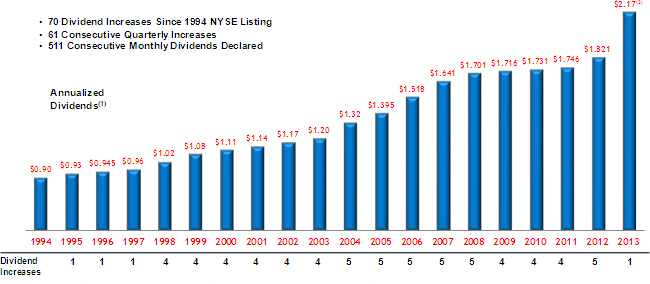
| (1) | Annualized dividend amount reflects the December declared dividend rate per share multiplied by twelve. |
| (2) | Annualized 2013 proforma dividend rate based on special January increase. |
7
Realty Income Performance vs. Major Stock Indices
| Realty Income | Equity REIT Index(1) | Dow Jones Industrial Average | S&P 500 | NASDAQ Composite | ||||||||||||||||||||||||||||||||||||
| Dividend Yield | Total Return(2) | Dividend Yield | Total Return(3) | Dividend Yield | Total Return(3) | Dividend Yield | Total Return(3) | Dividend Yield | Total Return(4) | |||||||||||||||||||||||||||||||
1995 | 8.3 | % | 42.0 | % | 7.4 | % | 15.3 | % | 2.4 | % | 36.9 | % | 2.3 | % | 37.6 | % | 0.6 | % | 39.9 | % | ||||||||||||||||||||
1996 | 7.9 | % | 15.4 | % | 6.1 | % | 35.3 | % | 2.2 | % | 28.9 | % | 2.0 | % | 23.0 | % | 0.2 | % | 22.7 | % | ||||||||||||||||||||
1997 | 7.5 | % | 14.5 | % | 5.5 | % | 20.3 | % | 1.8 | % | 24.9 | % | 1.6 | % | 33.4 | % | 0.5 | % | 21.6 | % | ||||||||||||||||||||
1998 | 8.2 | % | 5.5 | % | 7.5 | % | (17.5 | %) | 1.7 | % | 18.1 | % | 1.3 | % | 28.6 | % | 0.3 | % | 39.6 | % | ||||||||||||||||||||
1999 | 10.5 | % | (8.7 | %) | 8.7 | % | (4.6 | %) | 1.3 | % | 27.2 | % | 1.1 | % | 21.0 | % | 0.2 | % | 85.6 | % | ||||||||||||||||||||
2000 | 8.9 | % | 31.2 | % | 7.5 | % | 26.4 | % | 1.5 | % | (4.7 | %) | 1.2 | % | (9.1 | %) | 0.3 | % | (39.3 | %) | ||||||||||||||||||||
2001 | 7.8 | % | 27.2 | % | 7.1 | % | 13.9 | % | 1.9 | % | (5.5 | %) | 1.4 | % | (11.9 | %) | 0.3 | % | (21.1 | %) | ||||||||||||||||||||
2002 | 6.7 | % | 26.9 | % | 7.1 | % | 3.8 | % | 2.6 | % | (15.0 | %) | 1.9 | % | (22.1 | %) | 0.5 | % | (31.5 | %) | ||||||||||||||||||||
2003 | 6.0 | % | 21.0 | % | 5.5 | % | 37.1 | % | 2.3 | % | 28.3 | % | 1.8 | % | 28.7 | % | 0.6 | % | 50.0 | % | ||||||||||||||||||||
2004 | 5.2 | % | 32.7 | % | 4.7 | % | 31.6 | % | 2.2 | % | 5.6 | % | 1.8 | % | 10.9 | % | 0.6 | % | 8.6 | % | ||||||||||||||||||||
2005 | 6.5 | % | (9.2 | %) | 4.6 | % | 12.2 | % | 2.6 | % | 1.7 | % | 1.9 | % | 4.9 | % | 0.9 | % | 1.4 | % | ||||||||||||||||||||
2006 | 5.5 | % | 34.8 | % | 3.7 | % | 35.1 | % | 2.5 | % | 19.0 | % | 1.9 | % | 15.8 | % | 0.8 | % | 9.5 | % | ||||||||||||||||||||
2007 | 6.1 | % | 3.2 | % | 4.9 | % | (15.7 | %) | 2.7 | % | 8.8 | % | 2.1 | % | 5.5 | % | 0.8 | % | 9.8 | % | ||||||||||||||||||||
2008 | 7.3 | % | (8.2 | %) | 7.6 | % | (37.7 | %) | 3.6 | % | (31.8 | %) | 3.2 | % | (37.0 | %) | 1.3 | % | (40.5 | %) | ||||||||||||||||||||
2009 | 6.6 | % | 19.3 | % | 3.7 | % | 28.0 | % | 2.6 | % | 22.6 | % | 2.0 | % | 26.5 | % | 1.0 | % | 43.9 | % | ||||||||||||||||||||
2010 | 5.1 | % | 38.6 | % | 3.5 | % | 27.9 | % | 2.6 | % | 14.0 | % | 1.9 | % | 15.1 | % | 1.2 | % | 16.9 | % | ||||||||||||||||||||
2011 | 5.0 | % | 7.3 | % | 3.8 | % | 8.3 | % | 2.8 | % | 8.3 | % | 2.3 | % | 2.1 | % | 1.3 | % | (1.8 | %) | ||||||||||||||||||||
2012 | 4.5 | % | 20.1 | % | 3.5 | % | 19.7 | % | 3.0 | % | 10.2 | % | 2.5 | % | 16.0 | % | 2.6 | % | 15.9 | % | ||||||||||||||||||||
Compounded Average Annual Total Return(5) | 17.4 | % | 11.0 | % | 9.3 | % | 8.3 | % | 7.8 | % | ||||||||||||||||||||||||||||||
Note: All of these Dividend Yields are calculated as annualized dividend based on last dividend paid in applicable time period divided by closing price as of period end. Dividend Yield sources: NAREIT website and Bloomberg.
| (1) | FTSE NAREIT US Equity REIT Index, as per NAREIT website. |
| (2) | Calculated as the difference between the closing stock price as of period end less the closing stock price as of previous period, plus dividends paid in period, divided by closing stock price as of end of previous period. Does not include reinvestment of dividends. |
| (3) | Includes reinvestment of dividends. Sources: NAREIT website and Factset. |
| (4) | Price only index, does not include dividends. Source: Factset. |
| (5) | All of these Compounded Average Annual Total Return rates are calculated in the same manner: from Realty Income’s NYSE listing on October 18, 1994 through December 31, 2012, and assuming reinvestment of dividends, except for NASDAQ. Past performance does not guarantee future performance. Realty Income presents this data for informational purposes only and makes no representation about its future performance or how it will compare in performance to other indices in the future. |
8