Table of Contents
UNITED STATES
SECURITIES AND EXCHANGE COMMISSION
Washington, D.C. 20549
FORM N-CSR
CERTIFIED SHAREHOLDER REPORT OF REGISTERED
MANAGEMENT INVESTMENT COMPANIES
Investment Company Act file number 811-03836
Anchor Series Trust
(Exact name of registrant as specified in charter)
Harborside 5, 185 Hudson Street, Suite 3300, Jersey City, NJ 07311
(Address of principal executive offices) (Zip code)
John T. Genoy
President
SunAmerica Asset Management, LLC
Harborside 5
185 Hudson Street, Suite 3300,
Jersey City, NJ 07311
(Name and address of agent for service)
Registrant’s telephone number, including area code: (201) 324-6414
Date of fiscal year end: December 31
Date of reporting period: December 31, 2017
Table of Contents
| Item 1. | Reports to Stockholders |
Table of Contents
ANCHOR SERIES TRUST
ANNUAL REPORT
DECEMBER 31, 2017
Table of Contents
| 1 | ||||
| 3 | ||||
| 5 | ||||
| 18 | ||||
| 34 | ||||
| 38 | ||||
| 43 | ||||
| 49 | ||||
| 52 | ||||
| 55 | ||||
| 65 | ||||
| 67 | ||||
| 69 | ||||
| 73 | ||||
| 90 | ||||
| 95 | ||||
| 96 | ||||
| 98 | ||||
| 99 |
Table of Contents
Dear Anchor Series Trust Investor:
We are pleased to present our annual report for the Anchor Series Trust, the underlying investment portfolios for the series of variable products issued by our Life Companies.
The following report contains the investment portfolio information and the financial statements of the Anchor Series Trust portfolios for the reporting period ended December 31, 2017. The report may also contain information on portfolios not currently available in your variable contract.
We believe this information will give you some insight into the performance of your underlying investments. If you have any questions, please contact your investment representative, or you may contact us directly at 1-800-445-7862.
Thank you for the confidence you place in us with your financial future, and we look forward to reporting to you once again in six months.
Sincerely,

John T. Genoy
President
Anchor Series Trust
Note: All performance figures quoted are for the Anchor Series Trust. They do not reflect fees and charges associated with the variable annuity. Past performance is no guarantee of future results. Annuities are long-term investment vehicles designed for retirement purposes. Early withdrawal may be subject to withdrawal charges and if taken prior to age 59 1/2, a 10% federal tax penalty may apply. An investment in a variable annuity involves investment risk, including possible loss of principal. The contract, when redeemed, may be worth more or less than the total amount invested.
Investments in stocks and bonds are subject to risks, including stock market and interest rate fluctuations. Investments in growth stocks as well as small and mid-cap company stocks may be subject to volatile price swings and therefore present a greater potential for loss than other investments. Investments in non-U.S. stocks and bonds are subject to additional risks such as fluctuations in foreign currencies, political and economic instability, differences in securities regulation and accounting standards, foreign tax laws, and limited availability of public information. Income seeking investment strategies may not be realized due to changes in dividend policies or the availability of capital resources.
Investments that concentrate on one economic sector or geographic region are generally subject to greater volatility than more diverse investments. Investments in real estate investment trusts (REITs) involve risks such as refinancing, economic conditions in the real estate industry, changes in property values, dependency on real estate management, and other risks associated with a concentration in one sector or geographic region. Investments in securities related to gold and other precious metals and minerals are speculative and impacted by a host of worldwide economic, financial and political factors.
Investments in debt securities are subject to credit risk (i.e., the risk that an issuer might not pay interest when due or repay principal at maturity of the obligation). Investments in lower-rated bonds and “junk bonds” are considered speculative due to the heightened risk of default and are subject to unpredictable losses as a result of changes in the issuer’s creditworthiness.
See reverse side for additional information.
Investments in derivatives are subject to heightened risk; gains or losses from non-hedging positions may be substantially greater than the cost of the position. Active trading may result in high portfolio turnover and correspondingly greater transaction costs for the portfolio and underlying portfolios.
| ||
| 1 |
Table of Contents
There can be no assurance that the Portfolios will meet their investment objectives. A full description of the investment goals, principal strategies, and risks for each Portfolio are provided in the prospectus.
Investments are not guaranteed or endorsed by any bank, is not a deposit or obligation of any bank, and is not federally insured by Federal Deposit Corporation (FDIC), the Federal Reserve Board or any other federal government agency.
* Not FDIC or NCUA/NCUSIF Insured
* May Lose Value * No Bank or Credit Union Guarantee
* Not a Deposit * Not insured by any Federal Government Agency
| ||
| 2 |
Table of Contents
ANCHOR SERIES TRUST
December 31, 2017 |
(unaudited)
Disclosure of Portfolio Expenses in Shareholder Reports
As a shareholder of a separate series (a “Portfolio”) in the Anchor Series Trust (the “Trust”), you incur ongoing costs, including management fees and/or service (12b-1) fees and other Portfolio expenses. This example is intended to help you understand your ongoing costs (in dollars) of investing in the Portfolios and to compare these costs with the ongoing costs of investing in other mutual funds. The example is based on an investment of $1,000 invested at July 1, 2017 and held until December 31, 2017. Shares of the Trust are not offered directly to the public. Instead, shares are currently issued and redeemed only in connection with investments in and payments under variable annuity contracts and variable life insurance policies (“Variable Contracts”) offered by life insurance companies affiliated with SunAmerica Asset Management, LLC, the Trust’s investment adviser and manager, as well as non-affiliated life insurance companies. The fees and expenses associated with the Variable Contracts are not included in these examples, and had such fees and expenses been included, your costs would have been higher. Please see your variable contract prospectus for more details on the fees associated with the Variable Contract.
Actual Expenses
The “Actual” section of the table provides information about your actual account values and actual expenses. You may use the information in these columns, together with the amount you invested, to estimate the expenses that you paid over the period. Simply divide your account value by $1,000 (for example, an $8,600 account value divided by $1,000 = 8.6), then multiply the result by the number in the column under the heading entitled “Expenses Paid During the Six Months Ended December 31, 2017” to estimate the expenses you paid on your account during this period. The “Expenses Paid During the Six Months Ended December 31, 2017” column and the “Annualized Expense Ratio” column do not include fees and expenses that may be charged by the Variable Contracts in which the Portfolios are offered. Had these fees and expenses been included, the “Expenses Paid During the Six Months Ended December 31, 2017” column would have been higher and the “Ending Account Value” column would have been lower.
Hypothetical Example for Comparison Purposes
The “Hypothetical” section of the table provides information about hypothetical account values and hypothetical expenses based on each Portfolio’s actual expense ratio and an annual rate of return of 5% before expenses, which is not the Portfolio’s actual return. The hypothetical account values and expenses may not be used to estimate the actual ending account balance or expenses you paid for the period. You may use this information to compare the ongoing costs of investing in these Portfolios and other funds. To do so, compare this 5% hypothetical example with the 5% hypothetical examples that appear in the shareholder reports of other funds. The “Expenses Paid During the Six Months Ended December 31, 2017” column and the “Annualized Expense Ratio” column do not include fees and expenses that may be charged by the Variable Contracts in which the Portfolios are offered. Had these fees and expenses been included, the “Expenses Paid During the Six Months Ended December 31, 2017” column would have been higher and the “Ending Account Value” column would have been lower.
Please note that the expenses shown in the table are meant to highlight your ongoing costs only and do not reflect any fees and expenses that may be charged by the Variable Contracts. Please refer to your variable contract prospectus for more information. Therefore, the “Hypothetical” example is useful in comparing ongoing costs only and will not help you determine the relative total costs of owning different funds. In addition, if these fees and expenses were included, your costs would have been higher.
| ||
| 3 |
Table of Contents
ANCHOR SERIES TRUST
EXPENSE EXAMPLE (continued) December 31, 2017 |
(unaudited)
| Actual | Hypothetical | |||||||||||||||||||||||||||
| Portfolio | Beginning Account Value at July 1, 2017 | Ending December 31, | Expenses Paid December 31, | Beginning Account Value at July 1, 2017 | Ending December 31, | Expenses Paid December 31, | Annualized Expense Ratio* | |||||||||||||||||||||
SA Wellington Government and Quality Bond† | ||||||||||||||||||||||||||||
Class 1 | $ | 1,000.00 | $ | 1,010.73 | $ | 2.94 | $ | 1,000.00 | $ | 1,022.28 | $ | 2.96 | 0.58 | % | ||||||||||||||
Class 2 | $ | 1,000.00 | $ | 1,010.17 | $ | 3.70 | $ | 1,000.00 | $ | 1,021.53 | $ | 3.72 | 0.73 | % | ||||||||||||||
Class 3 | $ | 1,000.00 | $ | 1,010.13 | $ | 4.21 | $ | 1,000.00 | $ | 1,021.02 | $ | 4.23 | 0.83 | % | ||||||||||||||
SA Edge Asset Allocation† | ||||||||||||||||||||||||||||
Class 1 | $ | 1,000.00 | $ | 1,068.09 | $ | 4.01 | $ | 1,000.00 | $ | 1,021.32 | $ | 3.92 | 0.77 | % | ||||||||||||||
Class 2 | $ | 1,000.00 | $ | 1,066.63 | $ | 4.79 | $ | 1,000.00 | $ | 1,020.57 | $ | 4.69 | 0.92 | % | ||||||||||||||
Class 3 | $ | 1,000.00 | $ | 1,066.24 | $ | 5.31 | $ | 1,000.00 | $ | 1,020.06 | $ | 5.19 | 1.02 | % | ||||||||||||||
SA Wellington Growth and Income† | ||||||||||||||||||||||||||||
Class 1 | $ | 1,000.00 | $ | 1,125.24 | $ | 4.02 | $ | 1,000.00 | $ | 1,021.42 | $ | 3.82 | 0.75 | % | ||||||||||||||
SA Wellington Growth† | ||||||||||||||||||||||||||||
Class 1 | $ | 1,000.00 | $ | 1,083.36 | $ | 4.04 | $ | 1,000.00 | $ | 1,021.32 | $ | 3.92 | 0.77 | % | ||||||||||||||
Class 2 | $ | 1,000.00 | $ | 1,082.33 | $ | 4.83 | $ | 1,000.00 | $ | 1,020.57 | $ | 4.69 | 0.92 | % | ||||||||||||||
Class 3 | $ | 1,000.00 | $ | 1,081.97 | $ | 5.35 | $ | 1,000.00 | $ | 1,020.06 | $ | 5.19 | 1.02 | % | ||||||||||||||
SA Wellington Capital Appreciation† | ||||||||||||||||||||||||||||
Class 1 | $ | 1,000.00 | $ | 1,126.19 | $ | 4.02 | $ | 1,000.00 | $ | 1,021.42 | $ | 3.82 | 0.75 | % | ||||||||||||||
Class 2 | $ | 1,000.00 | $ | 1,125.22 | $ | 4.82 | $ | 1,000.00 | $ | 1,020.67 | $ | 4.58 | 0.90 | % | ||||||||||||||
Class 3 | $ | 1,000.00 | $ | 1,124.84 | $ | 5.36 | $ | 1,000.00 | $ | 1,020.16 | $ | 5.09 | 1.00 | % | ||||||||||||||
SA Wellington Natural Resources† | ||||||||||||||||||||||||||||
Class 1 | $ | 1,000.00 | $ | 1,220.25 | $ | 4.92 | $ | 1,000.00 | $ | 1,020.77 | $ | 4.48 | 0.88 | % | ||||||||||||||
Class 2 | $ | 1,000.00 | $ | 1,219.42 | $ | 5.76 | $ | 1,000.00 | $ | 1,020.01 | $ | 5.24 | 1.03 | % | ||||||||||||||
Class 3 | $ | 1,000.00 | $ | 1,218.92 | $ | 6.32 | $ | 1,000.00 | $ | 1,019.51 | $ | 5.75 | 1.13 | % | ||||||||||||||
SA BlackRock Multi-Asset Income# | ||||||||||||||||||||||||||||
Class 1 | $ | 1,000.00 | $ | 1,017.84 | $ | 2.95 | $ | 1,000.00 | $ | 1,022.28 | $ | 2.96 | 0.58 | % | ||||||||||||||
Class 3 | $ | 1,000.00 | $ | 1,017.69 | $ | 4.22 | $ | 1,000.00 | $ | 1,021.02 | $ | 4.23 | 0.83 | % | ||||||||||||||
SA Wellington Multi-Asset Income#† | ||||||||||||||||||||||||||||
Class 1 | $ | 1,000.00 | $ | 1,058.57 | $ | 4.46 | $ | 1,000.00 | $ | 1,020.87 | $ | 4.38 | 0.86 | % | ||||||||||||||
Class 3 | $ | 1,000.00 | $ | 1,058.18 | $ | 5.76 | $ | 1,000.00 | $ | 1,019.61 | $ | 5.65 | 1.11 | % | ||||||||||||||
| * | Expenses are equal to each Portfolio’s annualized expense ratio multiplied by the average account value over the period, multiplied by 184 days in the period then divided by 365 days (to reflect the one-half year period). These ratios do not reflect fees and expenses associated with the Variable Contracts. If such fees and expenses had been included, the expenses would have been higher. Please refer to your Variable Contract prospectus for details on the expenses that apply to the Variable Contracts of the insurance companies. |
| # | During the stated period, the investment adviser either waived a portion of or all fees and assumed a portion of or all expenses for the Portfolios or through recoupment provisions, recovered a portion of or all fees and expenses waived or reimbursed in the previous two fiscal years. As a result, if these fees and expenses had not been waived or assumed, the “Actual/Hypothetical Ending Account Value” would have been lower and the “Actual/Hypothetical Expenses Paid During the Six Months Ended December 31, 2017” and “Annualized Expense Ratio” would have been higher. If these fees and expenses had not been recouped, the “Actual/Hypothetical Ending Account Value” would have been higher and the “Actual/Hypothetical Expenses Paid During the Six Months Ended December 31, 2017” and the “Annualized Expense Ratio” would have been lower. |
| † | See Note 1 |
| ||
| 4 |
Table of Contents
Anchor Series Trust SA Wellington Government and Quality Bond Portfolio++
PORTFOLIO PROFILE — December 31, 2017 — (unaudited)
Industry Allocation*
United States Treasury Notes | 20.1 | % | ||
Federal Home Loan Mtg. Corp. | 16.9 | |||
Federal National Mtg. Assoc. | 14.6 | |||
Repurchase Agreements | 11.4 | |||
Diversified Financial Services | 6.9 | |||
United States Treasury Bonds | 6.1 | |||
Banks-Commercial | 5.4 | |||
Diversified Banking Institutions | 3.4 | |||
Municipal Bonds & Notes | 2.8 | |||
Electric-Integrated | 1.5 | |||
Government National Mtg. Assoc. | 1.5 | |||
Oil Companies-Integrated | 1.4 | |||
Sovereign | 1.3 | |||
Banks-Super Regional | 1.0 | |||
Electric-Distribution | 1.0 | |||
Auto-Cars/Light Trucks | 0.8 | |||
E-Commerce/Products | 0.8 | |||
Medical-Drugs | 0.8 | |||
Brewery | 0.6 | |||
Oil Companies-Exploration & Production | 0.6 | |||
Medical-Hospitals | 0.6 | |||
Sovereign Agency | 0.6 | |||
Insurance-Multi-line | 0.6 | |||
Banks-Fiduciary | 0.5 | |||
Transport-Services | 0.5 | |||
Insurance-Life/Health | 0.5 | |||
Medical Labs & Testing Services | 0.5 | |||
Gas-Distribution | 0.5 | |||
Finance-Commercial | 0.5 | |||
Diversified Manufacturing Operations | 0.5 | |||
Schools | 0.4 | |||
Insurance-Mutual | 0.4 | |||
Applications Software | 0.3 | |||
Computers | 0.3 | |||
Enterprise Software/Service | 0.3 | |||
Cellular Telecom | 0.3 | |||
Insurance-Reinsurance | 0.3 | |||
Finance-Credit Card | 0.3 | |||
Medical-HMO | 0.3 | |||
Building-Heavy Construction | 0.2 | |||
Building Societies | 0.2 | |||
Medical Instruments | 0.2 | |||
Semiconductor Components-Integrated Circuits | 0.2 | |||
Investment Management/Advisor Services | 0.2 | |||
Cable/Satellite TV | 0.2 | |||
Banks-Export/Import | 0.2 | |||
Real Estate Investment Trusts | 0.2 | |||
Resolution Funding Corp | 0.2 | |||
Oil-Field Services | 0.1 | |||
Special Purpose Entities | 0.1 | |||
Airlines | 0.1 | |||
Water | 0.1 | |||
Machinery-Construction & Mining | 0.1 | |||
Insurance-Property/Casualty | 0.1 | |||
Retail-Building Products | 0.1 | |||
|
| |||
| 109.6 | % | |||
|
|
Credit Quality†#
Aaa | 68.3 | % | ||
Aa | 9.8 | % | ||
A | 17.0 | % | ||
Baa | 1.9 | % | ||
Not Rated@ | 3.0 | % | ||
|
| |||
| 100.0 | % | |||
|
|
| ++ | See Note 1 |
| † | Source: Moody’s |
| # | Calculated as a percentage of total debt issues |
| @ | Represents debt issues that either have no rating, or the rating is unavailable from the data source. |
| * | Calculated as a percentage of net assets |
| ||
| 5 |
Table of Contents
Anchor Series Trust SA Wellington Government and Quality Bond Portfolio++
PORTFOLIO OF INVESTMENTS — December 31, 2017
| Security Description | Principal Amount | Value (Note 2) | ||||||
ASSET BACKED SECURITIES — 6.4% |
| |||||||
Diversified Financial Services — 6.4% |
| |||||||
Ajax Mtg. Loan Trust VRS | $ | 5,510,000 | $ | 5,509,984 | ||||
Angel Oak Mtg. Trust LLC VRS | 1,276,341 | 1,267,645 | ||||||
Apidos CLO XVI FRS | 7,200,000 | 7,226,942 | ||||||
Apidos CLO XXI FRS | 3,380,000 | 3,394,713 | ||||||
Apidos CLO XXII FRS | 3,000,000 | 3,010,470 | ||||||
Bayview Opportunity Master Fund Trust VRS | 2,979,278 | 3,037,243 | ||||||
Benefit Street Partners CLO, Ltd. FRS | 830,000 | 831,655 | ||||||
Canadian Pacer Auto Receivables Trust | 1,335,000 | 1,328,560 | ||||||
Cent CLO, Ltd. FRS | 4,285,000 | 4,300,962 | ||||||
Chesapeake Funding II LLC | 5,315,000 | 5,300,384 | ||||||
COMM Mtg. Trust | 1,020,000 | 1,035,522 | ||||||
Deephaven Residential Mtg. Trust VRS | 1,489,921 | 1,489,828 | ||||||
Enterprise Fleet Financing LLC | 2,210,000 | 2,206,079 | ||||||
Finance of America Structured Securities Trust VRS | 1,363,574 | 1,363,118 | ||||||
First Investors Auto Owner Trust | 353,769 | 353,614 | ||||||
First Investors Auto Owner Trust | 1,074,449 | 1,073,051 | ||||||
First Investors Auto Owner Trust | 1,265,000 | 1,259,978 | ||||||
Ford Credit Floorplan Master Owner Trust | 590,000 | 587,850 | ||||||
| Security Description | Principal Amount | Value (Note 2) | ||||||
Diversified Financial Services (continued) |
| |||||||
KKR CLO 15, Ltd. FRS | $ | 2,855,000 | $ | 2,898,824 | ||||
LB-UBS Commercial Mtg. Trust VRS | 636,831 | 637,914 | ||||||
Madison Park Funding, Ltd. FRS | 4,300,000 | 4,304,949 | ||||||
MetLife Securitization Trust VRS | 1,797,714 | 1,815,714 | ||||||
Mill City Mtg. Loan Trust VRS | 830,490 | 825,393 | ||||||
Mill City Mtg. Loan Trust VRS | 2,194,275 | 2,191,552 | ||||||
MMAF Equipment Finance LLC | 1,835,000 | 1,826,910 | ||||||
Nationstar HECM Loan Trust VRS | 911,053 | 911,053 | ||||||
Octagon Investment Partners XVI, Ltd. FRS | 1,221,265 | 1,224,243 | ||||||
OneMain Direct Auto Receivables Trust | 1,960,000 | 1,958,522 | ||||||
Prestige Auto Receivables Trust | 264,280 | 264,290 | ||||||
Race Point X CLO, Ltd. FRS | 5,000,000 | 5,018,395 | ||||||
Santander Drive Auto Receivables Trust | 357,644 | 357,772 | ||||||
Securitized Term Auto Receivables Trust | 3,410,000 | 3,396,375 | ||||||
Securitized Term Auto Receivables Trust | 1,130,000 | 1,123,667 | ||||||
SFAVE Commercial Mtg. Securities Trust VRS | 2,340,000 | 2,394,388 | ||||||
Sound Point CLO XII, Ltd. FRS | 2,865,000 | 2,875,217 | ||||||
| ||
| 6 |
Table of Contents
Anchor Series Trust SA Wellington Government and Quality Bond Portfolio++
PORTFOLIO OF INVESTMENTS — December 31, 2017 — (continued)
| Security Description | Principal Amount | Value (Note 2) | ||||||
ASSET BACKED SECURITIES (continued) |
| |||||||
Diversified Financial Services (continued) |
| |||||||
Springleaf Funding Trust | $ | 2,435,000 | $ | 2,444,669 | ||||
Springleaf Funding Trust | 1,070,000 | 1,081,521 | ||||||
Thacher Park CLO, Ltd. FRS | 5,100,000 | 5,102,540 | ||||||
Towd Point Mtg. Trust VRS | 1,911,872 | 1,893,593 | ||||||
Towd Point Mtg. Trust VRS | 3,177,598 | 3,164,394 | ||||||
Utility Debt Securitization Authority | 1,695,000 | 1,743,867 | ||||||
Voya CLO, Ltd. FRS | 7,240,000 | 7,241,716 | ||||||
|
| |||||||
Total Asset Backed Securities | 101,275,076 | |||||||
|
| |||||||
U.S. CORPORATE BONDS & NOTES — 16.5% |
| |||||||
Airlines — 0.1% |
| |||||||
Southwest Airlines Co. Pass Through Trust | 1,684,296 | 1,832,009 | ||||||
|
| |||||||
Applications Software — 0.3% |
| |||||||
Microsoft Corp. | 4,015,000 | 3,871,927 | ||||||
Microsoft Corp. | 1,500,000 | 1,563,767 | ||||||
|
| |||||||
| 5,435,694 | ||||||||
|
| |||||||
Auto-Cars/Light Trucks — 0.8% |
| |||||||
Daimler Finance North America LLC | 190,000 | 190,348 | ||||||
Daimler Finance North America LLC | 2,910,000 | 2,885,322 | ||||||
Daimler Finance North America LLC | 210,000 | 218,560 | ||||||
Toyota Motor Credit Corp. | 3,680,000 | 3,627,001 | ||||||
Toyota Motor Credit Corp. | 4,950,000 | 4,934,374 | ||||||
Volkswagen Group of America Finance LLC | 795,000 | 794,518 | ||||||
|
| |||||||
| 12,650,123 | ||||||||
|
| |||||||
| Security Description | Principal Amount | Value (Note 2) | ||||||
Banks-Commercial — 0.3% |
| |||||||
Fifth Third Bank | $ | 450,000 | $ | 454,416 | ||||
PNC Bank NA | 2,150,000 | 2,163,684 | ||||||
PNC Bank NA | 865,000 | 883,838 | ||||||
US Bank NA | 2,000,000 | 1,986,511 | ||||||
|
| |||||||
| 5,488,449 | ||||||||
|
| |||||||
Banks-Fiduciary — 0.5% |
| |||||||
Bank of New York Mellon Corp. | 2,790,000 | 2,786,013 | ||||||
Bank of New York Mellon Corp. | 4,250,000 | 4,119,139 | ||||||
State Street Corp. | 1,495,000 | 1,495,432 | ||||||
|
| |||||||
| 8,400,584 | ||||||||
|
| |||||||
Banks-Super Regional — 1.0% |
| |||||||
Huntington National Bank | 1,050,000 | 1,049,824 | ||||||
US Bancorp | 1,065,000 | 1,118,504 | ||||||
US Bancorp | 400,000 | 514,704 | ||||||
Wells Fargo & Co. | 3,000,000 | 2,998,628 | ||||||
Wells Fargo & Co. | 1,780,000 | 1,744,679 | ||||||
Wells Fargo & Co. | 735,000 | 740,516 | ||||||
Wells Fargo & Co. | 2,770,000 | 2,822,758 | ||||||
Wells Fargo & Co. | 585,000 | 637,939 | ||||||
Wells Fargo Bank NA | 5,000,000 | 4,992,288 | ||||||
|
| |||||||
| 16,619,840 | ||||||||
|
| |||||||
Brewery — 0.6% |
| |||||||
Anheuser-Busch InBev Finance, Inc. | 5,100,000 | 5,218,796 | ||||||
Anheuser-Busch InBev Finance, Inc. | 3,275,000 | 3,379,726 | ||||||
| ||
| 7 |
Table of Contents
Anchor Series Trust SA Wellington Government and Quality Bond Portfolio++
PORTFOLIO OF INVESTMENTS — December 31, 2017 — (continued)
| Security Description | Principal Amount | Value (Note 2) | ||||||
U.S. CORPORATE BONDS & NOTES (continued) |
| |||||||
Brewery (continued) |
| |||||||
Anheuser-Busch InBev Worldwide, Inc. Company Guar. Notes | $ | 1,640,000 | $ | 1,627,563 | ||||
|
| |||||||
| 10,226,085 | ||||||||
|
| |||||||
Building-Heavy Construction — 0.2% |
| |||||||
SBA Tower Trust | 3,665,000 | 3,692,488 | ||||||
|
| |||||||
Cable/Satellite TV — 0.2% |
| |||||||
Comcast Corp. | 2,695,000 | 2,712,839 | ||||||
Comcast Corp. | 200,000 | 217,993 | ||||||
|
| |||||||
| 2,930,832 | ||||||||
|
| |||||||
Cellular Telecom — 0.2% |
| |||||||
Crown Castle Towers LLC | 3,550,000 | 3,585,607 | ||||||
|
| |||||||
Computers — 0.3% |
| |||||||
Apple, Inc. | 147,000 | 140,892 | ||||||
Apple, Inc. | 2,000,000 | 2,032,086 | ||||||
Apple, Inc. | 1,050,000 | 1,071,592 | ||||||
Apple, Inc. | 1,815,000 | 1,882,194 | ||||||
|
| |||||||
| 5,126,764 | ||||||||
|
| |||||||
Diversified Banking Institutions — 2.0% |
| |||||||
Bank of America Corp. | 1,547,000 | 1,550,972 | ||||||
Bank of America Corp. | 2,245,000 | 2,281,938 | ||||||
Bank of America Corp. | 2,200,000 | 2,339,822 | ||||||
Citigroup, Inc. | 3,000,000 | 3,027,972 | ||||||
Citigroup, Inc. | 1,035,000 | 1,039,883 | ||||||
Goldman Sachs Group, Inc. | 2,075,000 | 2,066,639 | ||||||
Goldman Sachs Group, Inc. | 1,155,000 | 1,317,340 | ||||||
Goldman Sachs Group, Inc. | 4,000,000 | 4,042,098 | ||||||
| Security Description | Principal Amount | Value (Note 2) | ||||||
Diversified Banking Institutions (continued) |
| |||||||
JPMorgan Chase & Co. | $ | 2,000,000 | $ | 2,113,120 | ||||
JPMorgan Chase & Co. | 1,080,000 | 1,356,229 | ||||||
Morgan Stanley | 4,200,000 | 4,298,509 | ||||||
Morgan Stanley | 6,125,000 | 6,394,964 | ||||||
|
| |||||||
| 31,829,486 | ||||||||
|
| |||||||
Diversified Manufacturing Operations — 0.2% |
| |||||||
General Electric Capital Corp. | 1,718,000 | 1,822,538 | ||||||
Parker-Hannifin Corp. | 630,000 | 703,427 | ||||||
|
| |||||||
| 2,525,965 | ||||||||
|
| |||||||
E-Commerce/Products — 0.4% |
| |||||||
Amazon.com, Inc. | 1,250,000 | 1,246,200 | ||||||
Amazon.com, Inc. | 1,000,000 | 1,090,894 | ||||||
Amazon.com, Inc. | 3,525,000 | 4,137,398 | ||||||
|
| |||||||
| 6,474,492 | ||||||||
|
| |||||||
Electric-Distribution — 0.3% |
| |||||||
Entergy Louisiana LLC | 1,675,000 | 1,670,725 | ||||||
Oglethorpe Power Corp. | 2,200,000 | 2,529,137 | ||||||
|
| |||||||
| 4,199,862 | ||||||||
|
| |||||||
Electric-Integrated — 1.5% |
| |||||||
Consolidated Edison Co. of New York, Inc. | 565,000 | 646,751 | ||||||
Duke Energy Carolinas LLC | 2,000,000 | 2,710,388 | ||||||
Duke Energy Carolinas LLC | 1,825,000 | 2,414,994 | ||||||
Florida Power & Light Co. | 2,000,000 | 2,186,848 | ||||||
MidAmerican Energy Co. | 375,000 | 420,988 | ||||||
Pacific Gas & Electric Co. | 100,000 | 99,389 | ||||||
| ||
| 8 |
Table of Contents
Anchor Series Trust SA Wellington Government and Quality Bond Portfolio++
PORTFOLIO OF INVESTMENTS — December 31, 2017 — (continued)
| Security Description | Principal Amount | Value (Note 2) | ||||||
U.S. CORPORATE BONDS & NOTES (continued) |
| |||||||
Electric-Integrated (continued) |
| |||||||
Pacific Gas & Electric Co. | $ | 106,000 | $ | 110,760 | ||||
Pacific Gas & Electric Co. | 105,000 | 116,401 | ||||||
Pacific Gas & Electric Co. | 230,000 | 268,495 | ||||||
Pacific Gas & Electric Co. | 2,750,000 | 3,316,903 | ||||||
Pacific Gas & Electric Co. | 2,267,000 | 2,829,021 | ||||||
Pacific Gas & Electric Co. | 605,000 | 762,567 | ||||||
Pacific Gas & Electric Co. | 110,000 | 142,984 | ||||||
Pacific Gas & Electric Co. | 125,000 | 165,271 | ||||||
South Carolina Electric & Gas Co. | 750,000 | 783,514 | ||||||
South Carolina Electric & Gas Co. | 265,000 | 286,278 | ||||||
South Carolina Electric & Gas Co. | 176,000 | 201,379 | ||||||
South Carolina Electric & Gas Co. | 220,000 | 260,076 | ||||||
South Carolina Electric & Gas Co. | 2,400,000 | 2,999,721 | ||||||
Southern California Edison Co. | 885,000 | 878,643 | ||||||
Virginia Electric & Power Co. | 2,735,000 | 2,827,702 | ||||||
|
| |||||||
| 24,429,073 | ||||||||
|
| |||||||
Enterprise Software/Service — 0.3% |
| |||||||
Oracle Corp. | 5,040,000 | 4,976,970 | ||||||
|
| |||||||
Finance-Commercial — 0.5% |
| |||||||
Private Export Funding Corp. | 7,050,000 | 7,402,260 | ||||||
|
| |||||||
Finance-Credit Card — 0.3% |
| |||||||
American Express Credit Corp. | 4,695,000 | 4,710,231 | ||||||
|
| |||||||
| Security Description | Principal Amount | Value (Note 2) | ||||||
Gas-Distribution — 0.5% |
| |||||||
Boston Gas Co. | $ | 655,000 | $ | 652,893 | ||||
KeySpan Gas East Corp. | 3,525,000 | 3,426,673 | ||||||
Southern California Gas Co. | 3,610,000 | 3,496,984 | ||||||
|
| |||||||
| 7,576,550 | ||||||||
|
| |||||||
Insurance-Life/Health — 0.5% |
| |||||||
John Hancock Life Insurance Co. | 5,000,000 | 6,071,168 | ||||||
Teachers Insurance & Annuity Assoc. of America | 1,430,000 | 1,635,742 | ||||||
|
| |||||||
| 7,706,910 | ||||||||
|
| |||||||
Insurance-Multi-line — 0.6% |
| |||||||
Guardian Life Global Funding | 1,140,000 | 1,116,727 | ||||||
Metropolitan Life Global Funding I | 6,000,000 | 5,877,185 | ||||||
Metropolitan Life Global Funding I | 965,000 | 964,832 | ||||||
Metropolitan Life Global Funding I | 1,330,000 | 1,366,725 | ||||||
|
| |||||||
| 9,325,469 | ||||||||
|
| |||||||
Insurance-Mutual — 0.4% |
| |||||||
New York Life Global Funding | 4,655,000 | 4,675,512 | ||||||
Northwestern Mutual Life Insurance Co. | 1,192,000 | 1,208,397 | ||||||
|
| |||||||
| 5,883,909 | ||||||||
|
| |||||||
Insurance-Property/Casualty — 0.1% |
| |||||||
ACE INA Holdings, Inc. | 1,015,000 | 1,045,453 | ||||||
|
| |||||||
Insurance-Reinsurance — 0.3% |
| |||||||
Berkshire Hathaway, Inc. | 4,685,000 | 4,715,615 | ||||||
|
| |||||||
Machinery-Construction & Mining — 0.1% |
| |||||||
Caterpillar Financial Services Corp. | 1,140,000 | 1,136,702 | ||||||
|
| |||||||
Medical Instruments — 0.2% |
| |||||||
Medtronic, Inc. | 1,065,000 | 1,090,821 | ||||||
| ||
| 9 |
Table of Contents
Anchor Series Trust SA Wellington Government and Quality Bond Portfolio++
PORTFOLIO OF INVESTMENTS — December 31, 2017 — (continued)
| Security Description | Principal Amount | Value (Note 2) | ||||||
U.S. CORPORATE BONDS & NOTES (continued) |
| |||||||
Medical Instruments (continued) |
| |||||||
Medtronic, Inc. | $ | 1,700,000 | $ | 1,763,490 | ||||
Medtronic, Inc. | 425,000 | 445,087 | ||||||
|
| |||||||
| 3,299,398 | ||||||||
|
| |||||||
Medical Labs & Testing Services — 0.5% |
| |||||||
Roche Holdings, Inc. | 5,080,000 | 4,833,431 | ||||||
Roche Holdings, Inc. | 2,775,000 | 2,815,848 | ||||||
|
| |||||||
| 7,649,279 | ||||||||
|
| |||||||
Medical-Drugs — 0.8% |
| |||||||
Bayer US Finance LLC | 355,000 | 355,197 | ||||||
Bayer US Finance LLC | 1,700,000 | 1,717,451 | ||||||
Eli Lilly & Co. | 620,000 | 621,721 | ||||||
Merck & Co., Inc. | 2,680,000 | 2,669,151 | ||||||
Merck & Co., Inc. | 1,880,000 | 1,895,650 | ||||||
Merck & Co., Inc. | 760,000 | 849,808 | ||||||
Novartis Capital Corp. | 3,700,000 | 3,847,872 | ||||||
|
| |||||||
| 11,956,850 | ||||||||
|
| |||||||
Medical-HMO — 0.3% |
| |||||||
Kaiser Foundation Hospitals | 461,000 | 474,577 | ||||||
UnitedHealth Group, Inc. | 1,360,000 | 1,404,378 | ||||||
UnitedHealth Group, Inc. | 2,165,000 | 2,281,964 | ||||||
|
| |||||||
| 4,160,919 | ||||||||
|
| |||||||
Medical-Hospitals — 0.6% |
| |||||||
Ascension Health | 125,000 | 145,799 | ||||||
Dignity Health | 260,000 | 259,687 | ||||||
Dignity Health | 540,000 | 557,532 | ||||||
| Security Description | Principal Amount | Value (Note 2) | ||||||
Medical-Hospitals (continued) |
| |||||||
Memorial Sloan-Kettering Cancer Center | $ | 740,000 | $ | 800,068 | ||||
Mercy Health | 4,000,000 | 4,016,630 | ||||||
SSM Health Care Corp. | 3,785,000 | 3,925,109 | ||||||
|
| |||||||
| 9,704,825 | ||||||||
|
| |||||||
Networking Products — 0.0% |
| |||||||
Cisco Systems, Inc. | 250,000 | 254,556 | ||||||
|
| |||||||
Oil Companies-Exploration & Production — 0.1% |
| |||||||
ConocoPhillips Co. | 280,000 | 283,255 | ||||||
ConocoPhillips Co. | 370,000 | 381,087 | ||||||
ConocoPhillips Co. | 436,000 | 458,483 | ||||||
ConocoPhillips Co. | 245,000 | 278,094 | ||||||
|
| |||||||
| 1,400,919 | ||||||||
|
| |||||||
Oil Companies-Integrated — 0.1% |
| |||||||
Exxon Mobil Corp. | 700,000 | 698,434 | ||||||
Exxon Mobil Corp. | 590,000 | 594,177 | ||||||
|
| |||||||
| 1,292,611 | ||||||||
|
| |||||||
Retail-Building Products — 0.1% |
| |||||||
Home Depot, Inc. | 740,000 | 838,023 | ||||||
|
| |||||||
Schools — 0.4% |
| |||||||
Stanford University | 5,000,000 | 6,170,035 | ||||||
|
| |||||||
Semiconductor Components-Integrated Circuits — 0.2% |
| |||||||
QUALCOMM, Inc. | 3,215,000 | 3,201,478 | ||||||
|
| |||||||
Special Purpose Entity — 0.1% |
| |||||||
Postal Square LP | 1,755,150 | 2,039,447 | ||||||
|
| |||||||
Transport-Services — 0.5% |
| |||||||
Federal Express Corp. | 1,985,975 | 2,144,853 | ||||||
| ||
| 10 |
Table of Contents
Anchor Series Trust SA Wellington Government and Quality Bond Portfolio++
PORTFOLIO OF INVESTMENTS — December 31, 2017 — (continued)
| Security Description | Principal Amount | Value (Note 2) | ||||||
U.S. CORPORATE BONDS & NOTES (continued) |
| |||||||
Transport-Services (continued) |
| |||||||
United Parcel Service of America, Inc. | $ | 5,000,000 | $ | 5,661,995 | ||||
|
| |||||||
| 7,806,848 | ||||||||
|
| |||||||
Water — 0.1% |
| |||||||
American Water Capital Corp. | 1,250,000 | 1,237,076 | ||||||
|
| |||||||
Total U.S. Corporate Bonds & Notes | 260,939,686 | |||||||
|
| |||||||
FOREIGN CORPORATE BONDS & NOTES — 10.8% |
| |||||||
Banks-Commercial — 5.1% |
| |||||||
Bank of Montreal | 3,500,000 | 3,510,364 | ||||||
Bank of Montreal | 4,000,000 | 3,994,451 | ||||||
Bank of Nova Scotia | 3,000,000 | 3,002,989 | ||||||
Bank of Nova Scotia | 2,145,000 | 2,146,389 | ||||||
Banque Federative du Credit Mutuel SA | 4,300,000 | 4,328,479 | ||||||
Canadian Imperial Bank of Commerce FRS | 2,845,000 | 2,854,664 | ||||||
Credit Suisse AG | 860,000 | 868,824 | ||||||
Credit Suisse AG | 2,200,000 | 2,276,431 | ||||||
DNB Bank ASA | 5,800,000 | 5,763,323 | ||||||
DNB Boligkreditt AS | 1,780,000 | 1,774,599 | ||||||
ING Groep NV | 635,000 | 642,594 | ||||||
ING Groep NV | 2,045,000 | 2,131,964 | ||||||
Macquarie Bank, Ltd. | 635,000 | 633,444 | ||||||
National Australia Bank, Ltd. | 8,200,000 | 8,167,487 | ||||||
NBK SPC, Ltd. | 9,345,000 | 9,186,135 | ||||||
| Security Description | Principal Amount | Value (Note 2) | ||||||
Banks-Commercial (continued) |
| |||||||
Nordea Bank AB FRS | $ | 8,000,000 | $ | 8,056,940 | ||||
Royal Bank of Canada | 5,100,000 | 5,115,106 | ||||||
Santander UK PLC | 3,600,000 | 3,611,064 | ||||||
Svenska Handelsbanken AB | 3,000,000 | 3,182,254 | ||||||
Swedbank AB | 5,000,000 | 5,015,585 | ||||||
Toronto-Dominion Bank | 4,000,000 | 3,989,999 | ||||||
|
| |||||||
| 80,253,085 | ||||||||
|
| |||||||
Building Societies — 0.2% |
| |||||||
Nationwide Building Society | 3,650,000 | 3,647,704 | ||||||
|
| |||||||
Cellular Telecom — 0.1% |
| |||||||
America Movil SAB de CV | 635,000 | 642,564 | ||||||
America Movil SAB de CV | 530,000 | 673,477 | ||||||
|
| |||||||
| 1,316,041 | ||||||||
|
| |||||||
Diversified Banking Institutions — 1.4% |
| |||||||
BNP Paribas SA | 2,200,000 | 2,204,786 | ||||||
BNP Paribas SA | 4,700,000 | 4,678,180 | ||||||
Credit Agricole SA | 2,940,000 | 2,920,220 | ||||||
HSBC Holdings PLC | 1,650,000 | 1,686,460 | ||||||
HSBC Holdings PLC | 7,310,000 | 7,520,951 | ||||||
HSBC Holdings PLC | 1,160,000 | 1,211,698 | ||||||
HSBC Holdings PLC | 370,000 | 385,592 | ||||||
Societe Generale SA | 1,955,000 | 1,972,908 | ||||||
|
| |||||||
| 22,580,795 | ||||||||
|
| |||||||
| ||
| 11 |
Table of Contents
Anchor Series Trust SA Wellington Government and Quality Bond Portfolio++
PORTFOLIO OF INVESTMENTS — December 31, 2017 — (continued)
| Security Description | Principal Amount | Value (Note 2) | ||||||
FOREIGN CORPORATE BONDS & NOTES (continued) |
| |||||||
Diversified Financial Services — 0.5% |
| |||||||
GE Capital International Funding Co. ULC | $ | 4,869,000 | $ | 4,846,551 | ||||
GE Capital International Funding Co. ULC | 2,479,000 | 2,682,914 | ||||||
|
| |||||||
| 7,529,465 | ||||||||
|
| |||||||
Diversified Manufacturing Operations — 0.3% |
| |||||||
Siemens Financieringsmaatschappij NV | 4,485,000 | 4,551,158 | ||||||
|
| |||||||
E-Commerce/Products — 0.4% |
| |||||||
Alibaba Group Holding, Ltd. | 490,000 | 491,428 | ||||||
Alibaba Group Holding, Ltd. | 3,400,000 | 3,399,142 | ||||||
Alibaba Group Holding, Ltd. | 2,110,000 | 2,188,835 | ||||||
|
| |||||||
| 6,079,405 | ||||||||
|
| |||||||
Electric-Distribution — 0.5% |
| |||||||
State Grid Overseas Investment, Ltd. | 2,000,000 | 2,007,387 | ||||||
State Grid Overseas Investment, Ltd. | 3,015,000 | 2,988,481 | ||||||
State Grid Overseas Investment, Ltd. | 2,760,000 | 2,773,342 | ||||||
|
| |||||||
| 7,769,210 | ||||||||
|
| |||||||
Investment Management/Advisor Services — 0.2% |
| |||||||
CDP Financial, Inc. | 2,900,000 | 3,013,884 | ||||||
|
| |||||||
Oil Companies-Exploration & Production — 0.5% |
| |||||||
Sinopec Group Overseas Development, Ltd. | 5,660,000 | 5,630,152 | ||||||
Sinopec Group Overseas Development, Ltd. | 3,020,000 | 3,015,440 | ||||||
|
| |||||||
| 8,645,592 | ||||||||
|
| |||||||
Oil Companies-Integrated — 1.3% |
| |||||||
BG Energy Capital PLC | 670,000 | 702,513 | ||||||
BP Capital Markets PLC | 925,000 | 948,106 | ||||||
| Security Description | Principal Amount | Value (Note 2) | ||||||
Oil Companies-Integrated (continued) |
| |||||||
BP Capital Markets PLC | $ | 2,270,000 | $ | 2,348,141 | ||||
BP Capital Markets PLC | 405,000 | 430,725 | ||||||
BP Capital Markets PLC | 1,100,000 | 1,177,925 | ||||||
Shell International Finance BV | 2,265,000 | 2,327,712 | ||||||
Shell International Finance BV | 2,625,000 | 2,744,908 | ||||||
Statoil ASA | 325,000 | 324,975 | ||||||
Statoil ASA | 211,000 | 209,746 | ||||||
Statoil ASA | 185,000 | 184,201 | ||||||
Statoil ASA | 475,000 | 481,402 | ||||||
Statoil ASA | 2,250,000 | 2,287,101 | ||||||
Statoil ASA | 2,395,000 | 2,462,194 | ||||||
Statoil ASA | 815,000 | 856,241 | ||||||
Total Capital SA | 3,000,000 | 3,007,499 | ||||||
|
| |||||||
| 20,493,389 | ||||||||
|
| |||||||
Oil-Field Services — 0.1% |
| |||||||
Schlumberger Investment SA | 2,100,000 | 2,210,801 | ||||||
|
| |||||||
Real Estate Investment Trusts — 0.2% |
| |||||||
Scentre Group Trust 1/Scentre Group Trust 2 | 2,390,000 | 2,384,880 | ||||||
|
| |||||||
Total Foreign Corporate Bonds & Notes | 170,475,409 | |||||||
|
| |||||||
FOREIGN GOVERNMENT OBLIGATIONS — 1.7% |
| |||||||
Banks-Export/Import — 0.2% |
| |||||||
Japan Bank for International Cooperation | 2,776,000 | 2,763,953 | ||||||
|
| |||||||
Electric-Distribution — 0.2% |
| |||||||
Hydro-Quebec | 3,000,000 | 3,590,547 | ||||||
|
| |||||||
| ||
| 12 |
Table of Contents
Anchor Series Trust SA Wellington Government and Quality Bond Portfolio++
PORTFOLIO OF INVESTMENTS — December 31, 2017 — (continued)
| Security Description | Principal Amount | Value (Note 2) | ||||||
FOREIGN GOVERNMENT OBLIGATIONS (continued) |
| |||||||
Sovereign — 1.3% |
| |||||||
Kingdom of Saudi Arabia | $ | 1,775,000 | $ | 1,731,441 | ||||
Kingdom of Saudi Arabia | 3,440,000 | 3,381,596 | ||||||
State of Qatar | 11,060,000 | 10,855,390 | ||||||
State of Qatar | 4,540,000 | 4,766,946 | ||||||
|
| |||||||
| 20,735,373 | ||||||||
|
| |||||||
Total Foreign Government Obligations | 27,089,873 | |||||||
|
| |||||||
MUNICIPAL BONDS & NOTES — 2.8% |
| |||||||
Atlanta Downtown Development Authority | 2,560,000 | 2,746,650 | ||||||
Bay Area Toll Authority | 1,475,000 | 2,330,234 | ||||||
Chicago Transit Authority | 220,000 | 236,317 | ||||||
Chicago Transit Authority | 3,585,000 | 4,860,866 | ||||||
Chicago Transit Authority | 145,000 | 196,604 | ||||||
Kansas Development Finance Authority | 2,350,000 | 2,678,107 | ||||||
Kansas Development Finance Authority | 1,020,000 | 1,117,951 | ||||||
Maryland State Transportation Authority | 1,245,000 | 1,660,818 | ||||||
Municipal Electric Authority of Georgia | 1,635,000 | 2,095,808 | ||||||
North Texas Tollway Authority | 2,150,000 | 3,270,773 | ||||||
Oregon School Boards Association | 2,800,000 | 3,083,304 | ||||||
| Security Description | Principal Amount | Value (Note 2) | ||||||
MUNICIPAL BONDS & NOTES (continued) |
| |||||||
Port Authority of New York & New Jersey | $ | 1,870,000 | $ | 2,277,978 | ||||
San Antonio, Texas Electric & Gas | 885,000 | 1,191,723 | ||||||
San Jose Redevelopment Agency Successor Agency | 1,215,000 | 1,197,018 | ||||||
State of California | 3,200,000 | 4,802,304 | ||||||
State of California | 915,000 | 1,439,853 | ||||||
State of Wisconsin | 2,500,000 | 2,867,175 | ||||||
University of California | 2,955,000 | 3,865,022 | ||||||
University of California | 1,405,000 | 1,976,456 | ||||||
|
| |||||||
Total Municipal Bonds & Notes | 43,894,961 | |||||||
|
| |||||||
U.S. GOVERNMENT AGENCIES — 33.8% |
| |||||||
Federal Home Loan Mtg. Corp. — 16.9% |
| |||||||
2.50% due 10/01/2031 | 7,450,838 | 7,442,002 | ||||||
3.00% due 06/01/2046 | 10,637,750 | 10,652,474 | ||||||
3.00% due 09/01/2046 | 33,749,902 | 33,796,617 | ||||||
3.00% due 10/01/2046 | 2,465,736 | 2,468,767 | ||||||
3.00% due 11/01/2046 | 36,383,209 | 36,454,699 | ||||||
3.00% due 12/01/2046 | 58,098,917 | 58,178,129 | ||||||
3.00% due 01/01/2047 | 472,252 | 472,833 | ||||||
3.00% due 02/01/2047 | 2,636,863 | 2,640,107 | ||||||
3.00% due January 15 TBA | 17,300,000 | 17,614,881 | ||||||
3.50% due 08/01/2047 | 30,888,092 | 31,768,084 | ||||||
3.50% due January 15 TBA | 3,000,000 | 3,099,317 | ||||||
3.50% due January 30 TBA | 43,000,000 | 44,157,878 | ||||||
4.00% due 09/01/2026 | 756,363 | 784,256 | ||||||
4.00% due 12/01/2040 | 5,522,028 | 5,797,657 | ||||||
5.50% due January 30 TBA | 2,000,000 | 2,186,698 | ||||||
6.00% due 12/01/2039 | 263,067 | 294,560 | ||||||
7.50% due 05/01/2027 | 1,035 | 1,168 | ||||||
Federal Home Loan Mtg. Corp. Multifamily Mtg. Trust VRS | 780,000 | 786,939 | ||||||
Federal Home Loan Mtg. Corp. | 8,788,219 | 8,889,541 | ||||||
|
| |||||||
| 267,486,607 | ||||||||
|
| |||||||
| ||
| 13 |
Table of Contents
Anchor Series Trust SA Wellington Government and Quality Bond Portfolio++
PORTFOLIO OF INVESTMENTS — December 31, 2017 — (continued)
| Security Description | Principal Amount | Value (Note 2) | ||||||
U.S. GOVERNMENT AGENCIES (continued) |
| |||||||
Federal National Mtg. Assoc. — 14.6% |
| |||||||
Federal National Mtg. Assoc. | ||||||||
2.00% due 09/01/2031 | $ | 467,943 | $ | 455,926 | ||||
2.00% due 11/01/2031 | 538,712 | 524,875 | ||||||
2.00% due 12/01/2031 | 1,670,962 | 1,628,039 | ||||||
2.47% due 05/01/2025 | 3,416,138 | 3,391,095 | ||||||
2.50% due 03/01/2030 | 7,558,253 | 7,572,819 | ||||||
2.50% due January 30 TBA | 1,800,000 | 1,737,075 | ||||||
2.68% due 05/01/2025 | 6,000,000 | 6,015,974 | ||||||
2.81% due 07/01/2025 | 6,000,000 | 6,046,632 | ||||||
2.98% due 07/01/2022 | 6,950,136 | 7,099,442 | ||||||
2.99% due 10/01/2025 | 2,139,907 | 2,180,745 | ||||||
3.00% due 05/01/2027 | 711,187 | 726,375 | ||||||
3.00% due 06/01/2027 | 392,519 | 400,916 | ||||||
3.00% due 08/01/2027 | 226,922 | 231,660 | ||||||
3.00% due 10/01/2046 | 24,979,296 | 25,037,825 | ||||||
3.00% due January 15 TBA | 2,000,000 | 2,037,109 | ||||||
3.01% due 12/01/2024 | 3,796,275 | 3,879,443 | ||||||
3.09% due 10/01/2025 | 1,033,809 | 1,060,243 | ||||||
3.12% due 05/01/2033 | 2,779,707 | 2,664,828 | ||||||
3.33% due 07/01/2022 | 5,294,000 | 5,496,259 | ||||||
3.50% due January 15 TBA | 7,350,000 | 7,586,427 | ||||||
3.50% due January 30 TBA | 25,600,000 | 26,284,001 | ||||||
4.00% due 09/01/2026 | 6,268,015 | 6,546,224 | ||||||
4.00% due 01/01/2046 | 9,353,603 | 9,785,098 | ||||||
4.00% due 02/01/2046 | 10,322,507 | 10,798,049 | ||||||
4.00% due January 30 TBA | 32,100,000 | 33,568,219 | ||||||
4.50% due 11/01/2026 | 907,583 | 958,080 | ||||||
4.50% due 01/01/2027 | 906,102 | 955,995 | ||||||
4.50% due 05/01/2039 | 42,546 | 45,412 | ||||||
4.50% due 06/01/2039 | 70,064 | 74,602 | ||||||
4.50% due 08/01/2039 | 10,699 | 11,417 | ||||||
4.50% due 11/01/2040 | 757,956 | 809,054 | ||||||
4.50% due 12/01/2040 | 309,277 | 331,582 | ||||||
4.50% due 07/01/2041 | 422,772 | 451,346 | ||||||
4.50% due 06/01/2043 | 224,583 | 239,741 | ||||||
4.50% due 10/01/2043 | 217,650 | 231,746 | ||||||
4.50% due 11/01/2043 | 74,812 | 79,847 | ||||||
5.00% due January 30 TBA | 24,000,000 | 25,794,845 | ||||||
5.50% due 03/01/2038 | 750,001 | 826,006 | ||||||
5.50% due 06/01/2038 | 38,724 | 42,649 | ||||||
5.50% due 08/01/2038 | 46,572 | 51,307 | ||||||
5.50% due 09/01/2039 | 24,406 | 26,856 | ||||||
5.50% due 05/01/2040 | 1,946 | 2,132 | ||||||
5.50% due 06/01/2040 | 11,579 | 12,829 | ||||||
5.50% due January 30 TBA | 11,700,000 | 12,820,121 | ||||||
6.50% due 02/01/2038 | 71,684 | 81,460 | ||||||
6.50% due 10/01/2039 | 81,965 | 92,415 | ||||||
Federal National Mtg. Assoc. REMIC FRS | ||||||||
Series 2017-M13, Class FA | ||||||||
1.64% (1 ML+0.40%) due 10/25/2024(5) | 2,208,972 | 2,207,697 | ||||||
Series 2017-M5, Class FA | ||||||||
1.73% (1 ML+0.49%) due 04/25/2024(5) | 1,069,594 | 1,070,662 | ||||||
Federal National Mtg. Assoc. REMIC VRS | 10,285,000 | 10,298,520 | ||||||
|
| |||||||
| 230,271,619 | ||||||||
|
| |||||||
| Security Description | Principal Amount | Value (Note 2) | ||||||
Government National Mtg. Assoc. — 1.5% |
| |||||||
4.00% due 02/15/2041 | $ | 1,050,238 | $ | 1,100,599 | ||||
4.00% due 09/15/2041 | 849,262 | 891,328 | ||||||
4.00% due 02/15/2042 | 13,987 | 14,605 | ||||||
4.00% due 08/15/2042 | 146,247 | 155,094 | ||||||
4.50% due 05/15/2040 | 631,632 | 668,929 | ||||||
4.50% due 06/15/2040 | 830,196 | 878,661 | ||||||
4.50% due 07/15/2040 | 1,388,687 | 1,467,537 | ||||||
4.50% due 05/15/2042 | 166,186 | 175,810 | ||||||
4.50% due January 30 TBA | 3,025,000 | 3,172,941 | ||||||
5.00% due 07/15/2033 | 1,220,034 | 1,323,561 | ||||||
5.00% due 10/15/2033 | 70,405 | 76,736 | ||||||
5.00% due 11/15/2033 | 10,670 | 11,558 | ||||||
5.00% due 12/15/2033 | 28,563 | 30,839 | ||||||
5.00% due 01/15/2034 | 125,273 | 135,951 | ||||||
5.00% due 02/15/2034 | 63,123 | 67,900 | ||||||
5.00% due 03/15/2034 | 5,008 | 5,387 | ||||||
5.00% due 05/15/2034 | 9,611 | 10,567 | ||||||
5.00% due 06/15/2035 | 7,199 | 7,811 | ||||||
5.00% due 09/15/2035 | 92,001 | 101,273 | ||||||
5.00% due 11/15/2035 | 23,975 | 25,824 | ||||||
5.00% due 12/15/2035 | 19,832 | 21,458 | ||||||
5.00% due 02/15/2036 | 10,920 | 11,771 | ||||||
5.00% due 03/15/2036 | 9,938 | 10,692 | ||||||
5.00% due 09/15/2036 | 4,408 | 4,761 | ||||||
5.00% due 05/15/2038 | 9,179 | 9,880 | ||||||
5.00% due 07/15/2038 | 129,944 | 140,898 | ||||||
5.00% due 08/15/2038 | 32,011 | 34,719 | ||||||
5.00% due 11/15/2038 | 83,043 | 89,836 | ||||||
5.00% due 12/15/2038 | 322,695 | 350,053 | ||||||
5.00% due 06/15/2039 | 416,746 | 451,974 | ||||||
5.00% due 08/15/2039 | 107,223 | 116,509 | ||||||
5.00% due 07/15/2040 | 44,301 | 47,652 | ||||||
5.00% due 04/15/2041 | 262,426 | 284,578 | ||||||
5.50% due 10/15/2032 | 1,498 | 1,645 | ||||||
5.50% due 02/15/2033 | 70,397 | 77,210 | ||||||
5.50% due 05/15/2033 | 54,510 | 60,431 | ||||||
5.50% due 06/15/2033 | 66,249 | 73,360 | ||||||
5.50% due 07/15/2033 | 12,066 | 13,335 | ||||||
5.50% due 08/15/2033 | 7,511 | 8,237 | ||||||
5.50% due 09/15/2033 | 4,358 | 4,841 | ||||||
5.50% due 11/15/2033 | 128,303 | 140,877 | ||||||
5.50% due 01/15/2034 | 16,497 | 18,304 | ||||||
5.50% due 02/15/2034 | 53,840 | 59,399 | ||||||
5.50% due 03/15/2034 | 565,862 | 621,430 | ||||||
5.50% due 04/15/2034 | 23,125 | 25,740 | ||||||
5.50% due 05/15/2034 | 43,676 | 48,563 | ||||||
5.50% due 06/15/2034 | 11,429 | 12,603 | ||||||
5.50% due 07/15/2034 | 22,051 | 24,357 | ||||||
5.50% due 08/15/2034 | 15,615 | 17,176 | ||||||
5.50% due 09/15/2034 | 153,409 | 168,256 | ||||||
5.50% due 10/15/2034 | 202,573 | 224,197 | ||||||
5.50% due 04/15/2036 | 46,523 | 51,218 | ||||||
6.00% due 03/15/2028 | 7,316 | 8,179 | ||||||
6.00% due 06/15/2028 | 12,815 | 14,327 | ||||||
6.00% due 08/15/2028 | 25,892 | 28,948 | ||||||
6.00% due 09/15/2028 | 32,168 | 35,965 | ||||||
6.00% due 10/15/2028 | 10,694 | 11,956 | ||||||
6.00% due 12/15/2028 | 44,205 | 49,496 | ||||||
6.00% due 04/15/2029 | 2,164 | 2,419 | ||||||
6.00% due 01/15/2032 | 7,983 | 9,004 | ||||||
6.00% due 02/15/2032 | 245 | 274 | ||||||
6.00% due 07/15/2032 | 8,159 | 9,121 | ||||||
6.00% due 09/15/2032 | 11,896 | 13,301 | ||||||
| ||
| 14 |
Table of Contents
Anchor Series Trust SA Wellington Government and Quality Bond Portfolio++
PORTFOLIO OF INVESTMENTS — December 31, 2017 — (continued)
| Security Description | Principal Amount | Value (Note 2) | ||||||
U.S. GOVERNMENT AGENCIES (continued) |
| |||||||
Government National Mtg. Assoc. (continued) |
| |||||||
6.00% due 10/15/2032 | $ | 187,979 | $ | 214,534 | ||||
6.00% due 11/15/2032 | 8,536 | 9,544 | ||||||
6.00% due 01/15/2033 | 2,897 | 3,239 | ||||||
6.00% due 02/15/2033 | 9,685 | 11,027 | ||||||
6.00% due 03/15/2033 | 27,095 | 30,356 | ||||||
6.00% due 04/15/2033 | 46,185 | 51,635 | ||||||
6.00% due 05/15/2033 | 79,822 | 89,242 | ||||||
6.00% due 12/15/2033 | 22,750 | 25,703 | ||||||
6.00% due 08/15/2034 | 4,160 | 4,696 | ||||||
6.00% due 09/15/2034 | 76,434 | 85,455 | ||||||
6.00% due 10/15/2034 | 46,687 | 52,593 | ||||||
6.00% due 05/15/2036 | 21,507 | 24,239 | ||||||
6.00% due 06/15/2036 | 237,453 | 271,436 | ||||||
6.00% due 07/15/2036 | 2,945,572 | 3,322,033 | ||||||
6.00% due 08/15/2036 | 82,315 | 92,818 | ||||||
6.00% due 12/15/2036 | 168,251 | 189,215 | ||||||
6.00% due 02/15/2037 | 60,179 | 67,893 | ||||||
6.00% due 08/15/2037 | 48,383 | 54,094 | ||||||
6.00% due 01/15/2038 | 241,016 | 272,306 | ||||||
6.00% due 03/15/2038 | 141,416 | 158,131 | ||||||
6.00% due 07/15/2038 | 96,720 | 108,135 | ||||||
6.00% due 08/15/2038 | 245,942 | 275,231 | ||||||
6.00% due 09/15/2038 | 453,760 | 509,339 | ||||||
6.00% due 10/15/2038 | 560,454 | 631,493 | ||||||
6.00% due 11/15/2038 | 199,395 | 222,937 | ||||||
6.00% due 12/15/2038 | 194,727 | 217,828 | ||||||
6.00% due 01/15/2039 | 153,091 | 172,831 | ||||||
6.00% due 02/15/2039 | 119,899 | 134,148 | ||||||
6.00% due 04/15/2039 | 115,291 | 128,921 | ||||||
6.00% due 12/15/2039 | 128,501 | 143,667 | ||||||
6.00% due 03/15/2040 | 216,980 | 242,593 | ||||||
6.00% due 04/15/2040 | 52,631 | 58,843 | ||||||
6.00% due 06/15/2041 | 180,653 | 201,973 | ||||||
6.50% due 06/15/2023 | 2,647 | 2,936 | ||||||
6.50% due 07/15/2023 | 13,924 | 15,447 | ||||||
6.50% due 08/15/2023 | 1,602 | 1,777 | ||||||
6.50% due 10/15/2023 | 10,073 | 11,174 | ||||||
6.50% due 11/15/2023 | 12,932 | 14,347 | ||||||
6.50% due 12/15/2023 | 38,980 | 43,246 | ||||||
6.50% due 02/15/2027 | 1,343 | 1,497 | ||||||
6.50% due 12/15/2027 | 1,642 | 1,821 | ||||||
6.50% due 01/15/2028 | 17,009 | 18,869 | ||||||
6.50% due 02/15/2028 | 7,383 | 8,191 | ||||||
6.50% due 03/15/2028 | 23,589 | 26,312 | ||||||
6.50% due 04/15/2028 | 12,026 | 13,342 | ||||||
6.50% due 05/15/2028 | 40,281 | 44,685 | ||||||
6.50% due 06/15/2028 | 73,976 | 82,218 | ||||||
6.50% due 07/15/2028 | 57,374 | 63,648 | ||||||
6.50% due 08/15/2028 | 36,205 | 40,323 | ||||||
6.50% due 09/15/2028 | 51,182 | 56,791 | ||||||
6.50% due 10/15/2028 | 45,207 | 50,270 | ||||||
6.50% due 11/15/2028 | 47,763 | 53,214 | ||||||
6.50% due 12/15/2028 | 41,732 | 46,438 | ||||||
6.50% due 01/15/2029 | 882 | 979 | ||||||
6.50% due 02/15/2029 | 9,698 | 10,759 | ||||||
6.50% due 03/15/2029 | 16,705 | 18,533 | ||||||
6.50% due 04/15/2029 | 7,169 | 7,954 | ||||||
6.50% due 05/15/2029 | 56,704 | 62,908 | ||||||
6.50% due 06/15/2029 | 6,574 | 7,293 | ||||||
6.50% due 03/15/2031 | 3,108 | 3,448 | ||||||
6.50% due 04/15/2031 | 714 | 823 | ||||||
6.50% due 05/15/2031 | 67,771 | 75,304 | ||||||
| Security Description | Principal Amount | Value (Note 2) | ||||||
Government National Mtg. Assoc. (continued) |
| |||||||
6.50% due 06/15/2031 | $ | 41,528 | $ | 46,072 | ||||
6.50% due 07/15/2031 | 140,639 | 156,028 | ||||||
6.50% due 08/15/2031 | 26,662 | 29,580 | ||||||
6.50% due 09/15/2031 | 78,901 | 87,534 | ||||||
6.50% due 10/15/2031 | 33,880 | 38,029 | ||||||
6.50% due 11/15/2031 | 37,695 | 41,820 | ||||||
6.50% due 01/15/2032 | 115,677 | 128,332 | ||||||
6.50% due 02/15/2032 | 45,982 | 51,013 | ||||||
6.50% due 04/15/2032 | 12,598 | 13,976 | ||||||
6.50% due 05/15/2032 | 23,199 | 25,737 | ||||||
7.00% due 11/15/2031 | 25,014 | 28,111 | ||||||
7.00% due 03/15/2032 | 17,680 | 20,357 | ||||||
7.00% due 01/15/2033 | 24,060 | 27,981 | ||||||
7.00% due 05/15/2033 | 64,445 | 74,723 | ||||||
7.00% due 07/15/2033 | 46,818 | 53,674 | ||||||
7.00% due 11/15/2033 | 63,983 | 74,254 | ||||||
8.00% due 10/15/2029 | 386 | 387 | ||||||
8.00% due 12/15/2029 | 3,019 | 3,030 | ||||||
8.00% due 01/15/2030 | 15,744 | 16,356 | ||||||
8.00% due 03/15/2030 | 120 | 120 | ||||||
8.00% due 04/15/2030 | 16,898 | 17,112 | ||||||
8.00% due 08/15/2030 | 1,615 | 1,620 | ||||||
8.00% due 09/15/2030 | 20,270 | 20,794 | ||||||
8.00% due 11/15/2030 | 1,690 | 1,780 | ||||||
8.00% due 12/15/2030 | 678 | 683 | ||||||
8.00% due 02/15/2031 | 36,299 | 38,867 | ||||||
8.00% due 03/15/2031 | 10,446 | 10,550 | ||||||
Government National Mtg. Assoc., REMIC | ||||||||
Series 2005-74, Class HA | ||||||||
7.50% due 09/16/2035(3) | 50,334 | 55,154 | ||||||
Series 2005-74, Class HB | ||||||||
7.50% due 09/16/2035(3) | 288,051 | 327,950 | ||||||
Series 2005-74, Class HC | ||||||||
7.50% due 09/16/2035(3) | 119,343 | 139,203 | ||||||
|
| |||||||
| 24,125,363 | ||||||||
|
| |||||||
Sovereign Agency — 0.8% |
| |||||||
Resolution Funding Corp. STRIPS | 2,500,000 | 2,371,818 | ||||||
Tennessee Valley Authority | 7,400,000 | 9,328,388 | ||||||
|
| |||||||
| 11,700,206 | ||||||||
|
| |||||||
Total U.S. Government Agencies | 533,583,795 | |||||||
|
| |||||||
U.S. GOVERNMENT TREASURIES — 26.2% |
| |||||||
United States Treasury Bonds — 6.1% |
| |||||||
2.50% due 02/15/2045 | 10,270,000 | 9,790,600 | ||||||
2.50% due 05/15/2046(6) | 5,065,000 | 4,818,081 | ||||||
2.75% due 08/15/2047 | 5,415,000 | 5,421,769 | ||||||
2.75% due 11/15/2047 | 3,820,000 | 3,826,267 | ||||||
2.88% due 05/15/2043 | 31,130,000 | 32,009,179 | ||||||
2.88% due 08/15/2045 | 6,205,000 | 6,363,518 | ||||||
3.00% due 11/15/2044 | 1,790,000 | 1,880,129 | ||||||
3.00% due 02/15/2047 | 10,685,000 | 11,237,198 | ||||||
3.00% due 05/15/2047 | 2,795,000 | 2,938,571 | ||||||
3.38% due 05/15/2044 | 2,895,000 | 3,248,620 | ||||||
3.63% due 02/15/2044 | 13,550,000 | 15,838,151 | ||||||
|
| |||||||
| 97,372,083 | ||||||||
|
| |||||||
| ||
| 15 |
Table of Contents
Anchor Series Trust SA Wellington Government and Quality Bond Portfolio++
PORTFOLIO OF INVESTMENTS — December 31, 2017 — (continued)
| Security Description | Principal Amount | Value (Note 2) | ||||||
U.S. GOVERNMENT TREASURIES (continued) |
| |||||||
United States Treasury Notes — 20.1% |
| |||||||
0.38% due 01/15/2027 TIPS(7) | $ | 46,390,845 | $ | 46,056,568 | ||||
1.25% due 11/30/2018 | 6,800,000 | 6,766,797 | ||||||
1.25% due 04/30/2019 | 21,790,000 | 21,617,212 | ||||||
1.25% due 03/31/2021 | 11,200,000 | 10,923,500 | ||||||
1.38% due 07/31/2018 | 6,305,000 | 6,296,626 | ||||||
1.38% due 09/30/2018 | 23,200,000 | 23,138,375 | ||||||
1.38% due 02/29/2020 | 5,500,000 | 5,437,910 | ||||||
1.38% due 03/31/2020 | 28,050,000 | 27,721,289 | ||||||
1.38% due 09/30/2020 | 5,000,000 | 4,923,828 | ||||||
1.50% due 03/31/2023 | 25,900,000 | 24,969,219 | ||||||
1.63% due 06/30/2020 | 41,800,000 | 41,491,399 | ||||||
1.75% due 06/30/2022 | 18,000,000 | 17,674,453 | ||||||
1.88% due 06/30/2020 | 32,000,000 | 31,958,750 | ||||||
1.88% due 03/31/2022 | 4,550,000 | 4,498,635 | ||||||
1.88% due 04/30/2022 | 24,875,000 | 24,577,666 | ||||||
1.88% due 07/31/2022 | 4,000,000 | 3,945,781 | ||||||
2.00% due 11/30/2020 | 10,400,000 | 10,409,750 | ||||||
2.25% due 08/15/2027 | 5,045,000 | 4,974,055 | ||||||
|
| |||||||
| 317,381,813 | ||||||||
|
| |||||||
Total U.S. Government Treasuries | 414,753,896 | |||||||
|
| |||||||
Total Long-Term Investment Securities | 1,552,012,696 | |||||||
|
| |||||||
REPURCHASE AGREEMENTS — 11.4% |
| |||||||
Bank of America Securities LLC Joint Repurchase Agreement(8) | 27,745,000 | 27,745,000 | ||||||
Barclays Capital, Inc. Joint Repurchase Agreement(8) | 30,830,000 | 30,830,000 | ||||||
BNP Paribas SA Joint Repurchase Agreement(8) | 52,430,000 | 52,430,000 | ||||||
Deutsche Bank AG Joint Repurchase Agreement(8) | 20,460,000 | 20,460,000 | ||||||
RBS Securities, Inc. Joint Repurchase Agreement(8) | 49,330,000 | 49,330,000 | ||||||
|
| |||||||
Total Repurchase Agreements | 180,795,000 | |||||||
|
| |||||||
TOTAL INVESTMENTS | 109.6 | % | 1,732,807,696 | |||||
Liabilities in excess of other assets | (9.6 | ) | (151,960,947 | ) | ||||
|
|
|
| |||||
NET ASSETS | 100.0 | % | $ | 1,580,846,749 | ||||
|
|
|
| |||||
FORWARD SALES CONTRACTS — (0.57)% |
| |||||||
U.S. Government Agencies — (0.57)% |
| |||||||
Federal National Mtg. Assoc. — (0.47)% |
| |||||||
4.00% due January 15 TBA | (5,700,000 | ) | $ | (5,861,977 | ) | |||
4.50% due January 30 TBA | (1,520,000 | ) | (1,617,137 | ) | ||||
|
| |||||||
| (7,479,114 | ) | |||||||
|
| |||||||
| Security Description | Principal Amount | Value (Note 2) | ||||||
Government National Mtg. Assoc. — (0.10)% |
| |||||||
4.00% due January 30 TBA | $ | (1,500,000 | ) | $ | (1,565,616 | ) | ||
|
| |||||||
Total Forward Sales Contracts | $ | (9,044,730 | ) | |||||
|
| |||||||
| ++ | See Note 1 |
| * | Securities exempt from registration under Rule 144A of the Securities Act of 1933. These securities may be sold in transactions exempt from registration, normally to qualified institutional buyers. The Portfolio has no right to demand registration of these securities. At December 31, 2017, the aggregate value of these securities was $267,678,123 representing 16.9% of net assets. Unless otherwise indicated, these securities are not considered to be illiquid. |
| (1) | Securities classified as Level 3 (see Note 2). |
| (2) | Certain variable rate securities are not based on a published reference rate and spread but are determined by the issuer or agent and are based on current market conditions. These securities do not indicate a reference rate and spread in their description above. |
| (3) | Collateralized Mortgage Obligation |
| (4) | Collateralized Loan Obligation |
| (5) | Commercial Mortgage Backed Security |
| (6) | The security or a portion thereof was pledged as collateral to cover margin requirements for open futures contracts. |
| (7) | Principal amount of security is adjusted for inflation. |
| (8) | See Note 2 for details of Joint Repurchase Agreements. |
| (9) | See Note 6 for cost of investments on a tax basis. |
CLO — Collateralized Loan Obligation
REMIC — Real Estate Mortgage Investment Conduit
STRIPS — Separate trading of registered interest and principal of securities
TBA — Securities purchased on a forward commitment basis with an approximate principal amount and no definite maturity date. The actual principal amount and maturity date will be determined upon settlement date.
TIPS — Treasury Inflation Protected Securities
ULC — Unlimited Liability Corp.
FRS — Floating Rate Security
VRS — Variable Rate Security
The rates on FRS and VRS are the current interest rates at December 31, 2017 and unless noted otherwise, the dates shown are the original maturity dates.
Index Legend
1 ML — 1 Month USD LIBOR
3 ML — 3 Month USD LIBOR
| Futures Contracts | ||||||||||||||||||||
| Number of Contracts | Type | Description | Expiration Month | Notational Basis* | Notational Value* | Unrealized Appreciation (Depreciation) | ||||||||||||||
| 389 | Short | U.S. Treasury 10 Year Notes | March 2018 | $ | 48,590,949 | $ | 48,254,234 | $ | 336,715 | |||||||||||
|
| |||||||||||||||||||
| * | Notational basis refers to the contractual amount agreed upon at inception of the open contract; notational value represents the current value of the open contract. |
| ||
| 16 |
Table of Contents
Anchor Series Trust SA Wellington Government and Quality Bond Portfolio++
PORTFOLIO OF INVESTMENTS — December 31, 2017 — (continued)
The following is a summary of the inputs used to value the Portfolio’s net assets as of December 31, 2017 (see Note 2):
| Level 1 - Unadjusted Quoted Prices | Level 2 - Other Observable Inputs | Level 3 - Significant Unobservable Inputs | Total | |||||||||||||
ASSETS: | ||||||||||||||||
Investments at Value:* | ||||||||||||||||
Asset Backed Securities: | ||||||||||||||||
Diversified Financial Services | $ | — | $ | 95,765,092 | $ | 5,509,984 | $ | 101,275,076 | ||||||||
U.S. Corporate Bonds & Notes | — | 260,939,686 | — | 260,939,686 | ||||||||||||
Foreign Corporate Bonds & Notes | — | 170,475,409 | — | 170,475,409 | ||||||||||||
Foreign Government Obligations | — | 27,089,873 | — | 27,089,873 | ||||||||||||
Municipal Bond & Notes | — | 43,894,961 | — | 43,894,961 | ||||||||||||
U.S. Government Agencies | — | 533,583,795 | — | 533,583,795 | ||||||||||||
U.S. Government Treasuries | — | 414,753,896 | — | 414,753,896 | ||||||||||||
Repurchase Agreements | — | 180,795,000 | — | 180,795,000 | ||||||||||||
|
|
|
|
|
|
|
| |||||||||
Total Investments at Value | $ | — | $ | 1,727,297,712 | $ | 5,509,984 | $ | 1,732,807,696 | ||||||||
|
|
|
|
|
|
|
| |||||||||
Other Financial Instruments:+ | ||||||||||||||||
Futures Contracts | $ | 336,715 | $ | — | $ | — | $ | 336,715 | ||||||||
|
|
|
|
|
|
|
| |||||||||
LIABILITIES: | ||||||||||||||||
Forward Sales Contracts: | ||||||||||||||||
U.S. Government Agencies | $ | — | $ | 9,044,730 | $ | — | $ | 9,044,730 | ||||||||
|
|
|
|
|
|
|
| |||||||||
| * | For a detailed presentation of investments, please refer to the Portfolio of Investments. |
| + | Other Financial Instruments are derivative Instruments, not reflected in the Portfolio of Investments, such as futures, forward, swap and written option contracts, which are valued at the unrealized appreciation (depreciation) on the instrument. |
The Portfolio’s policy is to recognize transfers between Levels as of the end of the reporting period. There were no transfers between levels during the reporting period.
At the beginning and end of the reporting period, Level 3 investments were not considered a material portion of the Portfolio.
See Notes to Financial Statements
| ||
| 17 |
Table of Contents
Anchor Series Trust SA Edge Asset Allocation Portfolio#
PORTFOLIO PROFILE — December 31, 2017 — (unaudited)
Industry Allocation*
Federal National Mtg. Assoc. | 5.7 | % | ||
Diversified Financial Services | 4.5 | |||
Exchange-Traded Funds | 4.5 | |||
Diversified Banking Institutions | 3.9 | |||
Electric-Integrated | 3.8 | |||
Real Estate Investment Trusts | 3.8 | |||
Medical-Drugs | 3.2 | |||
Banks-Commercial | 2.5 | |||
Banks-Super Regional | 2.5 | |||
Federal Home Loan Mtg. Corp. | 2.4 | |||
Oil Companies-Exploration & Production | 2.3 | |||
Pipelines | 2.0 | |||
Oil Companies-Integrated | 1.7 | |||
Medical Instruments | 1.6 | |||
Airlines | 1.5 | |||
Applications Software | 1.5 | |||
Computers | 1.4 | |||
Government National Mtg. Assoc. | 1.3 | |||
Enterprise Software/Service | 1.3 | |||
Beverages-Non-alcoholic | 1.2 | |||
Oil Refining & Marketing | 1.2 | |||
Toys | 1.1 | |||
Chemicals-Diversified | 1.1 | |||
Auto/Truck Parts & Equipment-Original | 1.1 | |||
Repurchase Agreements | 1.1 | |||
Electronic Components-Semiconductors | 1.1 | |||
Food-Misc./Diversified | 1.0 | |||
Medical Products | 1.0 | |||
Finance-Credit Card | 1.0 | |||
Insurance-Multi-line | 1.0 | |||
Cellular Telecom | 0.9 | |||
Chemicals-Specialty | 0.9 | |||
Medical-Biomedical/Gene | 0.9 | |||
Diversified Manufacturing Operations | 0.9 | |||
Cable/Satellite TV | 0.9 | |||
Finance-Other Services | 0.9 | |||
Auction Houses/Art Dealers | 0.8 | |||
Auto-Cars/Light Trucks | 0.8 | |||
Insurance-Reinsurance | 0.8 | |||
Telecom Services | 0.8 | |||
Finance-Mortgage Loan/Banker | 0.8 | |||
Medical-Hospitals | 0.7 | |||
E-Commerce/Products | 0.7 | |||
Non-Hazardous Waste Disposal | 0.7 | |||
Gas-Distribution | 0.7 | |||
Aerospace/Defense | 0.6 | |||
Brewery | 0.6 | |||
Food-Meat Products | 0.6 | |||
Semiconductor Components-Integrated Circuits | 0.6 | |||
Insurance-Property/Casualty | 0.5 | |||
United States Treasury Bonds | 0.5 | |||
Cosmetics & Toiletries | 0.5 | |||
Diagnostic Equipment | 0.5 | |||
Tools-Hand Held | 0.5 | |||
Radio | 0.5 | |||
Oil & Gas Drilling | 0.5 | |||
Telephone-Integrated | 0.4 | |||
Containers-Paper/Plastic | 0.4 | |||
Web Portals/ISP | 0.4 | |||
Rubber-Tires | 0.4 | |||
Steel-Specialty | 0.4 |
Data Processing/Management | 0.4 | % | ||
Networking Products | 0.4 | |||
Real Estate Management/Services | 0.4 | |||
Physical Therapy/Rehabilitation Centers | 0.4 | |||
Human Resources | 0.4 | |||
Banks-Fiduciary | 0.4 | |||
Oil-Field Services | 0.4 | |||
Security Services | 0.4 | |||
Apparel Manufacturers | 0.3 | |||
Investment Management/Advisor Services | 0.3 | |||
Medical-HMO | 0.3 | |||
Building & Construction Products-Misc. | 0.3 | |||
Commercial Services-Finance | 0.3 | |||
Transport-Services | 0.3 | |||
Electric-Transmission | 0.3 | |||
Television | 0.3 | |||
Auto-Heavy Duty Trucks | 0.3 | |||
E-Commerce/Services | 0.3 | |||
Private Equity | 0.3 | |||
Food-Retail | 0.3 | |||
Hotels/Motels | 0.3 | |||
Internet Content-Entertainment | 0.3 | |||
Office Automation & Equipment | 0.3 | |||
Electronic Forms | 0.3 | |||
Storage/Warehousing | 0.3 | |||
SupraNational Banks | 0.3 | |||
Finance-Investment Banker/Broker | 0.3 | |||
Insurance-Mutual | 0.3 | |||
Retail-Apparel/Shoe | 0.3 | |||
Soap & Cleaning Preparation | 0.3 | |||
Rental Auto/Equipment | 0.2 | |||
Computer Services | 0.2 | |||
Electronic Connectors | 0.2 | |||
Beverages-Wine/Spirits | 0.2 | |||
Retail-Restaurants | 0.2 | |||
Machine Tools & Related Products | 0.2 | |||
Savings & Loans/Thrifts | 0.2 | |||
Electronic Parts Distribution | 0.2 | |||
United States Treasury Notes | 0.2 | |||
Independent Power Producers | 0.2 | |||
Retail-Discount | 0.2 | |||
Satellite Telecom | 0.2 | |||
Office Supplies & Forms | 0.2 | |||
Machinery-Farming | 0.2 | |||
Batteries/Battery Systems | 0.2 | |||
Transport-Rail | 0.2 | |||
Investment Companies | 0.2 | |||
Transport-Marine | 0.2 | |||
Instruments-Controls | 0.2 | |||
X-Ray Equipment | 0.2 | |||
Electric Products-Misc. | 0.2 | |||
Medical-Generic Drugs | 0.2 | |||
Electronic Components-Misc. | 0.1 | |||
Commercial Services | 0.1 | |||
Web Hosting/Design | 0.1 | |||
Casino Hotels | 0.1 | |||
Agricultural Chemicals | 0.1 | |||
Home Decoration Products | 0.1 | |||
Finance-Commercial | 0.1 | |||
Insurance-Life/Health | 0.1 | |||
Tobacco | 0.1 | |||
Medical Labs & Testing Services | 0.1 | |||
| ||
| 18 |
Table of Contents
Anchor Series Trust SA Edge Asset Allocation Portfolio#
PORTFOLIO PROFILE — December 31, 2017 — (unaudited) — (continued)
Industry Allocation* (continued)
Housewares | 0.1 | % | ||
Aerospace/Defense-Equipment | 0.1 | |||
Industrial Gases | 0.1 | |||
Office Furnishings-Original | 0.1 | |||
Semiconductor Equipment | 0.1 | |||
Computer Software | 0.1 | |||
Disposable Medical Products | 0.1 | |||
Electric-Generation | 0.1 | |||
Multimedia | 0.1 | |||
|
| |||
| 99.5 | % | |||
|
|
| # | See Note 1 |
| * | Calculated as a percentage of net assets |
| ||
| 19 |
Table of Contents
Anchor Series Trust SA Edge Asset Allocation Portfolio#
PORTFOLIO OF INVESTMENTS — December 31, 2017
| Security Description | Shares | Value (Note 2) | ||||||
COMMON STOCKS — 56.7% |
| |||||||
Aerospace/Defense — 0.5% |
| |||||||
Boeing Co. | 3,593 | $ | 1,059,612 | |||||
|
| |||||||
Agricultural Chemicals — 0.1% |
| |||||||
Incitec Pivot, Ltd. ADR | 86,846 | 264,012 | ||||||
|
| |||||||
Airlines — 1.1% |
| |||||||
Alaska Air Group, Inc. | 19,800 | 1,455,498 | ||||||
Copa Holdings SA, Class A | 2,000 | 268,120 | ||||||
Delta Air Lines, Inc. | 6,279 | 351,624 | ||||||
Hawaiian Holdings, Inc. | 861 | 34,311 | ||||||
|
| |||||||
| 2,109,553 | ||||||||
|
| |||||||
Apparel Manufacturers — 0.2% |
| |||||||
VF Corp. | 5,899 | 436,526 | ||||||
|
| |||||||
Applications Software — 1.2% |
| |||||||
Microsoft Corp. | 20,407 | 1,745,615 | ||||||
Red Hat, Inc.† | 4,488 | 539,009 | ||||||
|
| |||||||
| 2,284,624 | ||||||||
|
| |||||||
Auction Houses/Art Dealers — 0.8% | ||||||||
KAR Auction Services, Inc. | 19,451 | 982,470 | ||||||
Ritchie Bros. Auctioneers, Inc. | 20,758 | 621,287 | ||||||
|
| |||||||
| 1,603,757 | ||||||||
|
| |||||||
Auto-Cars/Light Trucks — 0.4% |
| |||||||
Nissan Motor Co., Ltd. ADR | 40,000 | 796,000 | ||||||
|
| |||||||
Auto-Heavy Duty Trucks — 0.3% |
| |||||||
New Flyer Industries, Inc. | 2,895 | 124,368 | ||||||
PACCAR, Inc. | 6,378 | 453,348 | ||||||
|
| |||||||
| 577,716 | ||||||||
|
| |||||||
Auto/Truck Parts & Equipment-Original — 1.1% |
| |||||||
Adient PLC | 1,283 | 100,972 | ||||||
Autoliv, Inc. | 9,293 | 1,180,954 | ||||||
Linamar Corp. | 101 | 5,882 | ||||||
Magna International, Inc. | 14,650 | 830,216 | ||||||
|
| |||||||
| 2,118,024 | ||||||||
|
| |||||||
Banks-Commercial — 2.0% |
| |||||||
Banco Bilbao Vizcaya Argentaria SA ADR | 88,863 | 755,336 | ||||||
Bank of Nova Scotia | 8,642 | 557,668 | ||||||
Bank of the Ozarks | 2,623 | 127,084 | ||||||
BOK Financial Corp. | 518 | 47,822 | ||||||
Cullen/Frost Bankers, Inc. | 6,491 | 614,373 | ||||||
East West Bancorp, Inc. | 13,663 | 831,120 | ||||||
Grupo Financiero Santander Mexico SAB de CV ADR, Class B | 17,203 | 125,754 | ||||||
Hope Bancorp, Inc. | 2,707 | 49,403 | ||||||
ING Groep NV ADR | 40,000 | 738,400 | ||||||
PacWest Bancorp | 2,083 | 104,983 | ||||||
Washington Trust Bancorp, Inc. | 798 | 42,494 | ||||||
|
| |||||||
| 3,994,437 | ||||||||
|
| |||||||
Banks-Super Regional — 1.3% |
| |||||||
PNC Financial Services Group, Inc. | 14,035 | 2,025,110 | ||||||
US Bancorp | 11,237 | 602,079 | ||||||
|
| |||||||
| 2,627,189 | ||||||||
|
| |||||||
Batteries/Battery Systems — 0.2% |
| |||||||
Energizer Holdings, Inc. | 7,005 | 336,100 | ||||||
|
| |||||||
| Security Description | Shares | Value (Note 2) | ||||||
Beverages-Non-alcoholic — 1.1% |
| |||||||
Coca-Cola Co. | 5,182 | $ | 237,750 | |||||
Dr Pepper Snapple Group, Inc. | 12,112 | 1,175,591 | ||||||
PepsiCo, Inc. | 6,903 | 827,808 | ||||||
|
| |||||||
| 2,241,149 | ||||||||
|
| |||||||
Beverages-Wine/Spirits — 0.2% |
| |||||||
Diageo PLC ADR | 3,250 | 474,597 | ||||||
|
| |||||||
Brewery — 0.3% |
| |||||||
Ambev SA ADR | 100,000 | 646,000 | ||||||
|
| |||||||
Building & Construction Products-Misc. — 0.3% |
| |||||||
James Hardie Industries PLC ADR | 36,434 | 641,603 | ||||||
|
| |||||||
Cable/Satellite TV — 0.6% |
| |||||||
Comcast Corp., Class A | 30,769 | 1,232,298 | ||||||
|
| |||||||
Cellular Telecom — 0.5% |
| |||||||
MTN Group, Ltd. ADR | 10,000 | 108,700 | ||||||
T-Mobile US, Inc.† | 11,394 | 723,633 | ||||||
Telstra Corp., Ltd. ADR | 15,000 | 212,250 | ||||||
|
| |||||||
| 1,044,583 | ||||||||
|
| |||||||
Chemicals-Diversified — 0.9% |
| |||||||
Akzo Nobel NV ADR | 4,000 | 116,560 | ||||||
Croda International PLC ADR | 18,027 | 529,453 | ||||||
DowDuPont, Inc. | 2,639 | 187,950 | ||||||
FMC Corp. | 1,331 | 125,992 | ||||||
Huntsman Corp. | 1,856 | 61,786 | ||||||
Innospec, Inc. | 6,578 | 464,407 | ||||||
PPG Industries, Inc. | 1,744 | 203,734 | ||||||
|
| |||||||
| 1,689,882 | ||||||||
|
| |||||||
Chemicals-Specialty — 0.9% |
| |||||||
Givaudan SA ADR | 10,000 | 462,100 | ||||||
H.B. Fuller Co. | 25,529 | 1,375,247 | ||||||
|
| |||||||
| 1,837,347 | ||||||||
|
| |||||||
Coal — 0.0% |
| |||||||
Alliance Resource Partners LP | 2,219 | 43,714 | ||||||
|
| |||||||
Coatings/Paint — 0.0% |
| |||||||
RPM International, Inc. | 867 | 45,448 | ||||||
|
| |||||||
Commercial Services — 0.1% |
| |||||||
RELX PLC ADR | 12,000 | 284,400 | ||||||
|
| |||||||
Commercial Services-Finance — 0.3% |
| |||||||
Experian PLC ADR | 24,000 | 526,080 | ||||||
Travelport Worldwide, Ltd. | 6,821 | 89,150 | ||||||
|
| |||||||
| 615,230 | ||||||||
|
| |||||||
Computer Services — 0.1% |
| |||||||
Accenture PLC, Class A | 834 | 127,677 | ||||||
International Business Machines Corp. | 344 | 52,776 | ||||||
Leidos Holdings, Inc. | 1,242 | 80,196 | ||||||
|
| |||||||
| 260,649 | ||||||||
|
| |||||||
Computer Software — 0.1% |
| |||||||
j2 Global, Inc. | 1,607 | 120,573 | ||||||
|
| |||||||
Computers — 1.1% |
| |||||||
Apple, Inc. | 13,298 | 2,250,421 | ||||||
|
| |||||||
Containers-Paper/Plastic — 0.0% |
| |||||||
Packaging Corp. of America | 395 | 47,617 | ||||||
|
| |||||||
Cosmetics & Toiletries — 0.5% |
| |||||||
Procter & Gamble Co. | 6,210 | 570,575 | ||||||
| ||
| 20 |
Table of Contents
Anchor Series Trust SA Edge Asset Allocation Portfolio#
PORTFOLIO OF INVESTMENTS — December 31, 2017 — (continued)
| Security Description | Shares | Value (Note 2) | ||||||
COMMON STOCKS (continued) |
| |||||||
Cosmetics & Toiletries (continued) |
| |||||||
Unilever NV | 8,000 | $ | 450,560 | |||||
|
| |||||||
| 1,021,135 | ||||||||
|
| |||||||
Data Processing/Management — 0.4% |
| |||||||
Broadridge Financial Solutions, Inc. | 550 | 49,819 | ||||||
Fair Isaac Corp. | 3,427 | 525,016 | ||||||
Fidelity National Information Services, Inc. | 2,317 | 218,007 | ||||||
|
| |||||||
| 792,842 | ||||||||
|
| |||||||
Diagnostic Equipment — 0.5% |
| |||||||
Abbott Laboratories | 7,034 | 401,430 | ||||||
Thermo Fisher Scientific, Inc. | 3,049 | 578,944 | ||||||
|
| |||||||
| 980,374 | ||||||||
|
| |||||||
Disposable Medical Products — 0.1% |
| |||||||
STERIS PLC | 1,128 | 98,666 | ||||||
|
| |||||||
Diversified Banking Institutions — 1.5% |
| |||||||
BNP Paribas SA ADR | 20,000 | 747,000 | ||||||
JPMorgan Chase & Co. | 20,789 | 2,223,176 | ||||||
|
| |||||||
| 2,970,176 | ||||||||
|
| |||||||
Diversified Manufacturing Operations — 0.7% |
| |||||||
3M Co. | 784 | 184,530 | ||||||
Crane Co. | 688 | 61,383 | ||||||
Parker-Hannifin Corp. | 1,961 | 391,377 | ||||||
Siemens AG ADR | 11,000 | 761,970 | ||||||
|
| |||||||
| 1,399,260 | ||||||||
|
| |||||||
E-Commerce/Products — 0.3% |
| |||||||
Amazon.com, Inc.† | 581 | 679,462 | ||||||
|
| |||||||
E-Commerce/Services — 0.3% |
| |||||||
Priceline Group, Inc.† | 331 | 575,192 | ||||||
|
| |||||||
Electric Products-Misc. — 0.2% |
| |||||||
Littelfuse, Inc. | 1,464 | 289,608 | ||||||
|
| |||||||
Electric-Integrated — 2.1% |
| |||||||
ALLETE, Inc. | 698 | 51,903 | ||||||
Alliant Energy Corp. | 1,417 | 60,378 | ||||||
CLP Holdings, Ltd. ADR | 35,000 | 360,850 | ||||||
Eversource Energy | 13,522 | 854,320 | ||||||
Fortis, Inc. | 661 | 24,239 | ||||||
Great Plains Energy, Inc. | 2,123 | 68,445 | ||||||
NextEra Energy, Inc. | 9,150 | 1,429,138 | ||||||
PNM Resources, Inc. | 819 | 33,129 | ||||||
WEC Energy Group, Inc. | 12,760 | 847,647 | ||||||
Xcel Energy, Inc. | 8,205 | 394,743 | ||||||
|
| |||||||
| 4,124,792 | ||||||||
|
| |||||||
Electronic Components-Misc. — 0.0% |
| |||||||
Garmin, Ltd. | 619 | 36,874 | ||||||
|
| |||||||
Electronic Components-Semiconductors — 1.1% |
| |||||||
Broadcom, Ltd. | 1,385 | 355,806 | ||||||
Microchip Technology, Inc. | 19,728 | 1,733,697 | ||||||
|
| |||||||
| 2,089,503 | ||||||||
|
| |||||||
Electronic Connectors — 0.2% |
| |||||||
TE Connectivity, Ltd. | 5,000 | 475,200 | ||||||
|
| |||||||
Electronic Forms — 0.3% |
| |||||||
Adobe Systems, Inc.† | 3,078 | 539,389 | ||||||
|
| |||||||
Electronic Parts Distribution — 0.2% |
| |||||||
Arrow Electronics, Inc.† | 5,210 | 418,936 | ||||||
|
| |||||||
| Security Description | Shares | Value (Note 2) | ||||||
Enterprise Software/Service — 0.9% |
| |||||||
Black Knight, Inc.† | 26,782 | $ | 1,182,425 | |||||
SAP SE ADR | 4,500 | 505,620 | ||||||
|
| |||||||
| 1,688,045 | ||||||||
|
| |||||||
Environmental Monitoring & Detection — 0.0% |
| |||||||
MSA Safety, Inc. | 562 | 43,566 | ||||||
|
| |||||||
Filtration/Separation Products — 0.0% |
| |||||||
Donaldson Co., Inc. | 315 | 15,419 | ||||||
|
| |||||||
Finance-Credit Card — 1.0% |
| |||||||
Discover Financial Services | 26,348 | 2,026,688 | ||||||
|
| |||||||
Finance-Mortgage Loan/Banker — 0.8% |
| |||||||
FNF Group | 37,557 | 1,473,737 | ||||||
�� |
| |||||||
Finance-Other Services — 0.8% |
| |||||||
BGC Partners, Inc., Class A | 4,660 | 70,413 | ||||||
Deutsche Boerse AG ADR | 60,000 | 692,100 | ||||||
Hong Kong Exchanges & Clearing, Ltd. ADR | 24,000 | 737,520 | ||||||
|
| |||||||
| 1,500,033 | ||||||||
|
| |||||||
Food-Meat Products — 0.6% |
| |||||||
Hormel Foods Corp. | 5,094 | 185,371 | ||||||
Tyson Foods, Inc., Class A | 11,533 | 934,980 | ||||||
|
| |||||||
| 1,120,351 | ||||||||
|
| |||||||
Food-Misc./Diversified — 0.9% |
| |||||||
B&G Foods, Inc. | 10,486 | 368,583 | ||||||
Danone SA ADR | 40,000 | 670,800 | ||||||
Ingredion, Inc. | 392 | 54,802 | ||||||
Kraft Heinz Co. | 4,193 | 326,048 | ||||||
Orkla ASA ADR | 35,000 | 369,337 | ||||||
|
| |||||||
| 1,789,570 | ||||||||
|
| |||||||
Food-Retail — 0.3% |
| |||||||
Kroger Co. | 20,270 | 556,411 | ||||||
|
| |||||||
Gas-Distribution — 0.5% |
| |||||||
Rubis SCA ADR | 40,000 | 528,800 | ||||||
Sempra Energy | 2,987 | 319,370 | ||||||
Vectren Corp. | 621 | 40,377 | ||||||
|
| |||||||
| 888,547 | ||||||||
|
| |||||||
Golf — 0.0% |
| |||||||
Acushnet Holdings Corp. | 2,814 | 59,319 | ||||||
|
| |||||||
Housewares — 0.1% |
| |||||||
Tupperware Brands Corp. | 3,978 | 249,421 | ||||||
|
| |||||||
Human Resources — 0.4% |
| |||||||
Adecco Group AG ADR | 19,640 | 752,801 | ||||||
|
| |||||||
Industrial Automated/Robotic — 0.0% |
| |||||||
Nordson Corp. | 405 | 59,292 | ||||||
|
| |||||||
Industrial Gases — 0.1% |
| |||||||
Air Products & Chemicals, Inc. | 1,492 | 244,807 | ||||||
|
| |||||||
Instruments-Controls — 0.2% |
| |||||||
Honeywell International, Inc. | 1,982 | 303,960 | ||||||
|
| |||||||
Insurance Brokers — 0.0% |
| |||||||
Arthur J. Gallagher & Co. | 702 | 44,423 | ||||||
|
| |||||||
Insurance-Multi-line — 0.9% |
| |||||||
Allstate Corp. | 4,540 | 475,383 | ||||||
Chubb, Ltd. | 8,393 | 1,226,469 | ||||||
|
| |||||||
| 1,701,852 | ||||||||
|
| |||||||
| ||
| 21 |
Table of Contents
Anchor Series Trust SA Edge Asset Allocation Portfolio#
PORTFOLIO OF INVESTMENTS — December 31, 2017 — (continued)
| Security Description | Shares | Value (Note 2) | ||||||
COMMON STOCKS (continued) |
| |||||||
Insurance-Property/Casualty — 0.5% |
| |||||||
Beazley PLC | 3,601 | $ | 25,818 | |||||
Fairfax Financial Holdings, Ltd. | 499 | 264,640 | ||||||
James River Group Holdings, Ltd. | 1,077 | 43,091 | ||||||
Markel Corp.† | 396 | 451,095 | ||||||
XL Group, Ltd. | 7,500 | 263,700 | ||||||
|
| |||||||
| 1,048,344 | ||||||||
|
| |||||||
Insurance-Reinsurance — 0.5% |
| |||||||
Swiss Re AG ADR | 39,962 | 934,312 | ||||||
Validus Holdings, Ltd. | 1,737 | 81,500 | ||||||
|
| |||||||
| 1,015,812 | ||||||||
|
| |||||||
Internet Content-Entertainment — 0.3% |
| |||||||
Facebook, Inc., Class A† | 3,092 | 545,614 | ||||||
|
| |||||||
Investment Companies — 0.2% |
| |||||||
Ares Capital Corp. | 3,976 | 62,503 | ||||||
Oaktree Capital Group LLC | 6,148 | 258,831 | ||||||
|
| |||||||
| 321,334 | ||||||||
|
| |||||||
Investment Management/Advisor Services — 0.3% |
| |||||||
BlackRock, Inc. | 1,262 | 648,302 | ||||||
|
| |||||||
Machine Tools & Related Products — 0.2% |
| |||||||
Lincoln Electric Holdings, Inc. | 4,929 | 451,398 | ||||||
|
| |||||||
Machinery-Farming — 0.2% |
| |||||||
Deere & Co. | 2,240 | 350,582 | ||||||
|
| |||||||
Machinery-General Industrial — 0.0% |
| |||||||
Albany International Corp., Class A | 298 | 18,312 | ||||||
Applied Industrial Technologies, Inc. | 273 | 18,591 | ||||||
IDEX Corp. | 179 | 23,623 | ||||||
|
| |||||||
| 60,526 | ||||||||
|
| |||||||
Medical Instruments — 1.2% |
| |||||||
Edwards Lifesciences Corp.† | 3,719 | 419,169 | ||||||
Medtronic PLC | 17,360 | 1,401,820 | ||||||
Teleflex, Inc. | 2,422 | 602,642 | ||||||
|
| |||||||
| 2,423,631 | ||||||||
|
| |||||||
Medical Products — 1.0% |
| |||||||
Becton Dickinson and Co. | 1,719 | 367,969 | ||||||
Sonova Holding AG ADR | 20,500 | 640,625 | ||||||
Varian Medical Systems, Inc.† | 9,272 | 1,030,583 | ||||||
|
| |||||||
| 2,039,177 | ||||||||
|
| |||||||
Medical-Biomedical/Gene — 0.1% |
| |||||||
CSL, Ltd. ADR | 5,000 | 275,850 | ||||||
|
| |||||||
Medical-Drugs — 3.1% |
| |||||||
GlaxoSmithKline PLC ADR | 13,958 | 495,090 | ||||||
Johnson & Johnson | 2,960 | 413,571 | ||||||
Merck & Co., Inc. | 22,855 | 1,286,051 | ||||||
Novartis AG ADR | 7,804 | 655,224 | ||||||
Novo Nordisk A/S ADR | 14,000 | 751,380 | ||||||
Pfizer, Inc. | 36,230 | 1,312,251 | ||||||
Roche Holding AG ADR | 35,969 | 1,135,901 | ||||||
|
| |||||||
| 6,049,468 | ||||||||
|
| |||||||
Medical-HMO — 0.3% |
| |||||||
UnitedHealth Group, Inc. | 2,937 | 647,491 | ||||||
|
| |||||||
Medical-Hospitals — 0.2% |
| |||||||
Universal Health Services, Inc., Class B | 4,026 | 456,347 | ||||||
|
| |||||||
| Security Description | Shares | Value (Note 2) | ||||||
Multimedia — 0.1% |
| |||||||
Walt Disney Co. | 887 | $ | 95,361 | |||||
|
| |||||||
Networking Products — 0.4% |
| |||||||
Cisco Systems, Inc. | 20,091 | 769,485 | ||||||
|
| |||||||
Non-Hazardous Waste Disposal — 0.6% |
| |||||||
Waste Connections, Inc. | 16,299 | 1,156,251 | ||||||
|
| |||||||
Office Furnishings-Original — 0.1% |
| |||||||
HNI Corp. | 6,029 | 232,539 | ||||||
|
| |||||||
Office Supplies & Forms — 0.2% |
| |||||||
Avery Dennison Corp. | 3,110 | 357,215 | ||||||
|
| |||||||
Oil & Gas Drilling — 0.1% |
| |||||||
Helmerich & Payne, Inc. | 1,429 | 92,371 | ||||||
|
| |||||||
Oil Companies-Exploration & Production — 2.0% |
| |||||||
Cimarex Energy Co. | 18,811 | 2,295,130 | ||||||
Linn Energy, Inc.† | 8,843 | 355,931 | ||||||
Occidental Petroleum Corp. | 4,374 | 322,189 | ||||||
Vermilion Energy, Inc.(NYSE) | 2,313 | 84,055 | ||||||
Vermilion Energy, Inc.(TSX) | 19,000 | 690,080 | ||||||
W&T Offshore, Inc.† | 63,825 | 211,261 | ||||||
|
| |||||||
| 3,958,646 | ||||||||
|
| |||||||
Oil Companies-Integrated — 1.0% |
| |||||||
Chevron Corp. | 2,727 | 341,393 | ||||||
Exxon Mobil Corp. | 3,961 | 331,298 | ||||||
Royal Dutch Shell PLC, Class B ADR | 19,824 | 1,353,781 | ||||||
|
| |||||||
| 2,026,472 | ||||||||
|
| |||||||
Oil Refining & Marketing — 1.1% |
| |||||||
HollyFrontier Corp. | 9,678 | 495,707 | ||||||
Marathon Petroleum Corp. | 9,688 | 639,214 | ||||||
Valero Energy Corp. | 10,417 | 957,427 | ||||||
|
| |||||||
| 2,092,348 | ||||||||
|
| |||||||
Pipelines — 0.4% |
| |||||||
EnLink Midstream Partners LP | 5,338 | 82,045 | ||||||
Enterprise Products Partners LP | 20,469 | 542,633 | ||||||
Phillips 66 Partners LP | 260 | 13,611 | ||||||
Targa Resources Corp. | 1,538 | 74,470 | ||||||
|
| |||||||
| 712,759 | ||||||||
|
| |||||||
Power Converter/Supply Equipment — 0.0% |
| |||||||
Hubbell, Inc. | 267 | 36,136 | ||||||
|
| |||||||
Private Equity — 0.3% |
| |||||||
KKR & Co. LP | 26,514 | 558,385 | ||||||
|
| |||||||
Radio — 0.5% |
| |||||||
Entercom Communications Corp., Class A | 4,440 | 47,952 | ||||||
Sirius XM Holdings, Inc. | 163,552 | 876,639 | ||||||
|
| |||||||
| 924,591 | ||||||||
|
| |||||||
Real Estate Investment Trusts — 2.5% |
| |||||||
Agree Realty Corp. | 407 | 20,936 | ||||||
Alexandria Real Estate Equities, Inc. | 9,277 | 1,211,483 | ||||||
Annaly Capital Management, Inc. | 27,702 | 329,377 | ||||||
Colony NorthStar, Inc., Class A | 6,763 | 77,166 | ||||||
Digital Realty Trust, Inc. | 7,573 | 862,565 | ||||||
EastGroup Properties, Inc. | 240 | 21,211 | ||||||
EPR Properties | 1,085 | 71,024 | ||||||
Gramercy Property Trust | 2,873 | 76,594 | ||||||
Host Hotels & Resorts, Inc. | 14,479 | 287,408 | ||||||
LaSalle Hotel Properties | 1,579 | 44,323 | ||||||
| ||
| 22 |
Table of Contents
Anchor Series Trust SA Edge Asset Allocation Portfolio#
PORTFOLIO OF INVESTMENTS — December 31, 2017 — (continued)
| Security Description | Shares | Value (Note 2) | ||||||
COMMON STOCKS (continued) |
| |||||||
Real Estate Investment Trusts (continued) |
| |||||||
Medical Properties Trust, Inc. | 7,576 | $ | 104,397 | |||||
Omega Healthcare Investors, Inc. | 16,544 | 455,622 | ||||||
Pebblebrook Hotel Trust | 1,248 | 46,388 | ||||||
Ramco-Gershenson Properties Trust | 2,399 | 35,337 | ||||||
Realty Income Corp. | 8,937 | 509,588 | ||||||
Simon Property Group, Inc. | 2,200 | 377,828 | ||||||
Tanger Factory Outlet Centers, Inc. | 16,033 | 425,035 | ||||||
|
| |||||||
| 4,956,282 | ||||||||
|
| |||||||
Real Estate Management/Services — 0.4% |
| |||||||
Daito Trust Construction Co., Ltd. ADR | 15,000 | 769,350 | ||||||
|
| |||||||
Rental Auto/Equipment — 0.1% |
| |||||||
Aaron’s, Inc. | 7,096 | 282,776 | ||||||
|
| |||||||
Retail-Apparel/Shoe — 0.3% |
| |||||||
lululemon athletica, Inc.† | 6,356 | 499,518 | ||||||
|
| |||||||
Retail-Catalog Shopping — 0.0% |
| |||||||
MSC Industrial Direct Co., Inc., Class A | 185 | 17,882 | ||||||
|
| |||||||
Retail-Discount — 0.2% |
| |||||||
Costco Wholesale Corp. | 2,087 | 388,432 | ||||||
|
| |||||||
Retail-Major Department Stores — 0.0% |
| |||||||
Nordstrom, Inc. | 1,064 | 50,412 | ||||||
|
| |||||||
Retail-Restaurants — 0.2% |
| |||||||
Chipotle Mexican Grill, Inc.† | 653 | 188,737 | ||||||
Starbucks Corp. | 4,849 | 278,478 | ||||||
|
| |||||||
| 467,215 | ||||||||
|
| |||||||
Rubber-Tires — 0.4% |
| |||||||
Bridgestone Corp. ADR | 35,000 | 813,400 | ||||||
|
| |||||||
Satellite Telecom — 0.2% |
| |||||||
Inmarsat PLC ADR | 54,900 | 361,242 | ||||||
|
| |||||||
Savings & Loans/Thrifts — 0.2% |
| |||||||
Washington Federal, Inc. | 12,998 | 445,181 | ||||||
|
| |||||||
Security Services — 0.4% |
| |||||||
Secom Co., Ltd. ADR | 38,000 | 716,300 | ||||||
|
| |||||||
Semiconductor Components-Integrated Circuits — 0.6% |
| |||||||
Maxim Integrated Products, Inc. | 4,231 | 221,197 | ||||||
Taiwan Semiconductor Manufacturing Co., Ltd. ADR | 22,510 | 892,521 | ||||||
|
| |||||||
| 1,113,718 | ||||||||
|
| |||||||
Semiconductor Equipment — 0.1% |
| |||||||
Applied Materials, Inc. | 3,629 | 185,514 | ||||||
MKS Instruments, Inc. | 350 | 33,075 | ||||||
|
| |||||||
| 218,589 | ||||||||
|
| |||||||
Soap & Cleaning Preparation — 0.3% |
| |||||||
Reckitt Benckiser Group PLC ADR | 26,000 | 494,260 | ||||||
|
| |||||||
SupraNational Banks — 0.3% |
| |||||||
Banco Latinoamericano de Comercio Exterior SA, Class E | 19,371 | 521,080 | ||||||
|
| |||||||
Telecom Services — 0.5% |
| |||||||
BCE, Inc. | 19,303 | 926,737 | ||||||
Consolidated Communications Holdings, Inc. | 1,472 | 17,944 | ||||||
|
| |||||||
| 944,681 | ||||||||
|
| |||||||
Telephone-Integrated — 0.2% |
| |||||||
Verizon Communications, Inc. | 7,917 | 419,047 | ||||||
|
| |||||||
| Security Description | Shares/ Principal Amount | Value (Note 2) | ||||||
Television — 0.3% |
| |||||||
Nexstar Media Group, Inc., Class A | 6,133 | $ | 479,600 | |||||
Sinclair Broadcast Group, Inc., Class A | 2,749 | 104,050 | ||||||
|
| |||||||
| 583,650 | ||||||||
|
| |||||||
Tobacco — 0.1% |
| |||||||
Imperial Brands PLC ADR | 6,000 | 256,020 | ||||||
|
| |||||||
Tools-Hand Held — 0.5% |
| |||||||
Snap-on, Inc. | 5,479 | 954,990 | ||||||
|
| |||||||
Toys — 1.1% |
| |||||||
Hasbro, Inc. | 24,157 | 2,195,630 | ||||||
|
| |||||||
Transport-Marine — 0.2% |
| |||||||
Kirby Corp.† | 4,653 | 310,820 | ||||||
|
| |||||||
Transport-Rail — 0.2% |
| |||||||
Union Pacific Corp. | 2,422 | 324,790 | ||||||
|
| |||||||
Transport-Services — 0.3% |
| |||||||
Expeditors International of Washington, Inc. | 6,984 | 451,795 | ||||||
United Parcel Service, Inc., Class B | 1,239 | 147,627 | ||||||
|
| |||||||
| 599,422 | ||||||||
|
| |||||||
Venture Capital — 0.0% |
| |||||||
Hercules Capital, Inc. | 1,509 | 19,798 | ||||||
|
| |||||||
Web Portals/ISP — 0.4% |
| |||||||
Alphabet, Inc., Class A† | 814 | 857,468 | ||||||
|
| |||||||
X-Ray Equipment — 0.2% |
| |||||||
Varex Imaging Corp.† | 7,432 | 298,543 | ||||||
|
| |||||||
Total Common Stocks | 111,919,643 | |||||||
|
| |||||||
EXCHANGE-TRADED FUNDS — 4.5% |
| |||||||
iShares MSCI Emerging Markets ETF | 103,652 | 4,884,082 | ||||||
Vanguard Global ex-U.S. Real Estate ETF | 65,500 | 3,962,750 | ||||||
|
| |||||||
Total Exchange-Traded Funds | 8,846,832 | |||||||
|
| |||||||
PREFERRED SECURITIES/CAPITAL SECURITIES — 0.8% |
| |||||||
Banks-Super Regional — 0.3% |
| |||||||
PNC Financial Services Group, Inc. | $ | 250,000 | 277,512 | |||||
Wells Fargo & Co. | 250,000 | 254,050 | ||||||
|
| |||||||
| 531,562 | ||||||||
|
| |||||||
Diversified Banking Institutions — 0.3% |
| |||||||
Bank of America Corp. | 500,000 | 510,000 | ||||||
|
| |||||||
Insurance-Life/Health — 0.1% |
| |||||||
Prudential Financial, Inc. | 250,000 | 256,813 | ||||||
|
| |||||||
Insurance-Multi-line — 0.1% |
| |||||||
Hartford Financial Services Group, Inc. | 250,000 | 256,250 | ||||||
|
| |||||||
Total Preferred Securities/Capital Securities | 1,554,625 | |||||||
|
| |||||||
| ||
| 23 |
Table of Contents
Anchor Series Trust SA Edge Asset Allocation Portfolio#
PORTFOLIO OF INVESTMENTS — December 31, 2017 — (continued)
| Security Description | Principal Amount | Value (Note 2) | ||||||
ASSET BACKED SECURITIES — 4.3% |
| |||||||
Diversified Financial Services — 4.3% |
| |||||||
ACE Securities Corp. Mtg. Loan Trust | $ | 99,686 | $ | 96,613 | ||||
AmeriCredit Automobile Receivables Trust | 250,000 | 250,147 | ||||||
AmeriCredit Automobile Receivables Trust | 140,000 | 139,156 | ||||||
Capital Auto Receivables Asset Trust | 1,521 | 1,521 | ||||||
CFCRE Commercial Mtg. Trust | 200,000 | 208,804 | ||||||
Citigroup Mtg. Loan Trust VRS | 274,912 | 292,240 | ||||||
COMM Mtg. Trust VRS | 250,000 | 243,665 | ||||||
Countrywide Home Loan Mtg. Pass Through Trust | 97 | 97 | ||||||
CPS Auto Receivables Trust | 23,401 | 23,376 | ||||||
CPS Auto Receivables Trust | 240,000 | 240,854 | ||||||
Credit Suisse First Boston Mtg. Securities Corp. FRS | 7,231 | 7,192 | ||||||
CSMC Trust VRS | 93,958 | 94,829 | ||||||
Ford Credit Auto Owner Trust | 250,000 | 246,389 | ||||||
GS Mtg. Securities Trust | 310,327 | 306,719 | ||||||
GS Mtg. Securities Trust VRS | 200,000 | 197,687 | ||||||
GS Mtg. Securities Trust | 230,000 | 245,448 | ||||||
GS Mtg. Securities Trust VRS | 100,000 | 101,982 | ||||||
GS Mtg. Securities Trust VRS | 200,000 | 187,793 | ||||||
| Security Description | Principal Amount | Value (Note 2) | ||||||
Diversified Financial Services (continued) |
| |||||||
GS Mtg. Securities Trust VRS | $ | 300,000 | $ | 293,786 | ||||
GSMSC Pass-Through Trust FRS | 5,447 | 5,441 | ||||||
JPMorgan Mtg. Trust VRS | 203,343 | 204,413 | ||||||
JPMorgan Mtg.Trust VRS | 79,635 | 80,702 | ||||||
JPMorgan Mtg. Trust VRS | 240,931 | 244,008 | ||||||
JPMorgan Mtg. Trust VRS | 192,518 | 191,610 | ||||||
KeyCorp. Student Loan Trust FRS | 148,160 | 147,979 | ||||||
KeyCorp. Student Loan Trust FRS | 126,280 | 126,293 | ||||||
MVW Owner Trust | 128,640 | 128,004 | ||||||
New Residential Mtg. Loan Trust VRS | 95,912 | 101,680 | ||||||
New Residential Mtg. Loan Trust VRS | 87,158 | 92,137 | ||||||
PFS Financing Corp. FRS | 250,000 | 250,258 | ||||||
Residential Accredit Loans, Inc. | 7,134 | 7,136 | ||||||
Santander Drive Auto Receivables Trust | 209,652 | 210,175 | ||||||
Sequoia Mtg. Trust VRS | 117,314 | 114,024 | ||||||
Sequoia Mtg. Trust VRS | 93,644 | 94,156 | ||||||
Sequoia Mtg. Trust VRS | 90,583 | 91,524 | ||||||
SLM Private Credit Student Loan Trust FRS | 152,960 | 149,917 | ||||||
| ||
| 24 |
Table of Contents
Anchor Series Trust SA Edge Asset Allocation Portfolio#
PORTFOLIO OF INVESTMENTS — December 31, 2017 — (continued)
| Security Description | Principal Amount | Value (Note 2) | ||||||
ASSET BACKED SECURITIES (continued) |
| |||||||
Diversified Financial Services (continued) |
| |||||||
SLM Private Credit Student Loan Trust FRS | $ | 164,614 | $ | 164,144 | ||||
Towd Point Mtg. Trust VRS | 250,000 | 263,566 | ||||||
UBS-Barclays Commercial Mtg. Trust | 200,000 | 200,933 | ||||||
Verizon Owner Trust | 250,000 | 249,373 | ||||||
Wells Fargo Commercial Mtg. Trust VRS Series 2016-LC25, Class B | 300,000 | 311,872 | ||||||
Wells Fargo Commercial Mtg. Trust VRS | 300,000 | 304,604 | ||||||
Wells Fargo Home Equity Trust FRS | 4,007 | 4,010 | ||||||
Westlake Automobile Receivables Trust | 250,000 | 249,601 | ||||||
WFRBS Commercial Mtg. Trust VRS | 160,000 | 127,651 | ||||||
WFRBS Commercial Mtg. Trust VRS | 300,000 | 274,322 | ||||||
WFRBS Commercial Mtg. Trust VRS | 300,000 | 299,160 | ||||||
WFRBS Commercial Mtg. Trust VRS | 300,000 | 312,569 | ||||||
WFRBS Commercial Mtg. Trust VRS | 300,000 | 297,268 | ||||||
|
| |||||||
Total Asset Backed Securities | 8,476,828 | |||||||
|
| |||||||
U.S. CORPORATE BONDS & NOTES — 20.0% |
| |||||||
Aerospace/Defense — 0.1% |
| |||||||
Lockheed Martin Corp. | 250,000 | 263,185 | ||||||
|
| |||||||
Aerospace/Defense-Equipment — 0.1% |
| |||||||
United Technologies Corp. | 250,000 | 247,537 | ||||||
|
| |||||||
Airlines — 0.4% |
| |||||||
American Airlines Pass-Through Trust | 273,555 | 291,124 | ||||||
| Security Description | Principal Amount | Value (Note 2) | ||||||
Airlines (continued) |
| |||||||
Delta Air Lines Pass Through Trust | $ | 121,082 | $ | 130,914 | ||||
US Airways Pass Through Trust | 386,281 | 419,540 | ||||||
|
| |||||||
| 841,578 | ||||||||
|
| |||||||
Apparel Manufacturers — 0.1% |
| |||||||
Under Armour, Inc. | 250,000 | 218,885 | ||||||
|
| |||||||
Auto-Cars/Light Trucks — 0.4% |
| |||||||
American Honda Finance Corp. | 250,000 | 236,631 | ||||||
American Honda Finance Corp. | 250,000 | 259,460 | ||||||
Toyota Motor Credit Corp. | 250,000 | 250,573 | ||||||
|
| |||||||
| 746,664 | ||||||||
|
| |||||||
Banks-Commercial — 0.4% |
| |||||||
KeyBank NA | 250,000 | 249,811 | ||||||
PNC Bank NA | 250,000 | 247,964 | ||||||
PNC Bank NA | 250,000 | 249,628 | ||||||
|
| |||||||
| 747,403 | ||||||||
|
| |||||||
Banks-Fiduciary — 0.4% |
| |||||||
Bank of New York Mellon Corp. | 500,000 | 484,605 | ||||||
State Street Corp. | 250,000 | 252,170 | ||||||
|
| |||||||
| 736,775 | ||||||||
|
| |||||||
Banks-Super Regional — 0.9% |
| |||||||
SunTrust Banks, Inc. | 500,000 | 499,983 | ||||||
SunTrust Banks, Inc. | 250,000 | 252,799 | ||||||
US Bancorp | 250,000 | 254,984 | ||||||
US Bancorp | 250,000 | 258,980 | ||||||
Wells Fargo & Co. | 250,000 | 251,539 | ||||||
| ||
| 25 |
Table of Contents
Anchor Series Trust SA Edge Asset Allocation Portfolio#
PORTFOLIO OF INVESTMENTS — December 31, 2017 — (continued)
| Security Description | Principal Amount | Value (Note 2) | ||||||
U.S. CORPORATE BONDS & NOTES (continued) |
| |||||||
Banks-Super Regional (continued) |
| |||||||
Wells Fargo & Co. | $ | 250,000 | $ | 254,864 | ||||
|
| |||||||
| 1,773,149 | ||||||||
|
| |||||||
Beverages-Non-alcoholic — 0.1% |
| |||||||
PepsiCo, Inc. | 250,000 | 247,026 | ||||||
|
| |||||||
Brewery — 0.3% |
| |||||||
Anheuser-Busch InBev Finance, Inc. | 500,000 | 559,075 | ||||||
|
| |||||||
Cable/Satellite TV — 0.3% |
| |||||||
Comcast Corp. | 250,000 | 255,051 | ||||||
Time Warner Cable LLC | 250,000 | 294,018 | ||||||
|
| |||||||
| 549,069 | ||||||||
|
| |||||||
Casino Hotels — 0.1% |
| |||||||
Boyd Gaming Corp. | 250,000 | 265,000 | ||||||
|
| |||||||
Cellular Telecom — 0.4% |
| |||||||
Sprint Corp. | 250,000 | 266,250 | ||||||
T-Mobile USA, Inc. | 500,000 | 535,000 | ||||||
|
| |||||||
| 801,250 | ||||||||
|
| |||||||
Chemicals-Diversified — 0.2% |
| |||||||
Westlake Chemical Corp. | 218,000 | 222,009 | ||||||
Westlake Chemical Corp. | 250,000 | 251,444 | ||||||
|
| |||||||
| 473,453 | ||||||||
|
| |||||||
Computer Services — 0.1% |
| |||||||
International Business Machines Corp. | 250,000 | 250,306 | ||||||
|
| |||||||
Computers — 0.3% |
| |||||||
Apple, Inc. | 250,000 | 247,427 | ||||||
Apple, Inc. | 250,000 | 253,175 | ||||||
|
| |||||||
| 500,602 | ||||||||
|
| |||||||
Containers-Paper/Plastic — 0.4% |
| |||||||
Graphic Packaging International, Inc. | 500,000 | 531,250 | ||||||
| Security Description | Principal Amount | Value (Note 2) | ||||||
Containers-Paper/Plastic (continued) |
| |||||||
Sealed Air Corp. | $ | 250,000 | $ | 290,625 | ||||
|
| |||||||
| 821,875 | ||||||||
|
| |||||||
Diversified Banking Institutions — 2.0% |
| |||||||
Bank of America Corp. FRS | 250,000 | 255,196 | ||||||
Bank of America Corp. | 250,000 | 250,368 | ||||||
Bank of America Corp. | 250,000 | 255,601 | ||||||
Citigroup, Inc. FRS | 200,000 | 205,864 | ||||||
Citigroup, Inc. | 500,000 | 529,351 | ||||||
Goldman Sachs Group, Inc. FRS | 250,000 | 252,908 | ||||||
Goldman Sachs Group, Inc. | 500,000 | 541,895 | ||||||
JPMorgan Chase & Co. FRS | 250,000 | 254,337 | ||||||
JPMorgan Chase & Co. | 250,000 | 259,952 | ||||||
JPMorgan Chase & Co. | 250,000 | 262,130 | ||||||
Morgan Stanley FRS | 250,000 | 256,802 | ||||||
Morgan Stanley | 250,000 | 261,763 | ||||||
Morgan Stanley | 250,000 | 298,385 | ||||||
|
| |||||||
| 3,884,552 | ||||||||
|
| |||||||
Diversified Manufacturing Operations — 0.2% |
| |||||||
General Electric Capital Corp. | 144,000 | 155,490 | ||||||
Ingersoll-Rand Global Holding Co., Ltd. | 250,000 | 257,241 | ||||||
|
| |||||||
| 412,731 | ||||||||
|
| |||||||
| ||
| 26 |
Table of Contents
Anchor Series Trust SA Edge Asset Allocation Portfolio#
PORTFOLIO OF INVESTMENTS — December 31, 2017 — (continued)
| Security Description | Principal Amount | Value (Note 2) | ||||||
U.S. CORPORATE BONDS & NOTES (continued) |
| |||||||
E-Commerce/Products — 0.4% |
| |||||||
Amazon.com, Inc. | $ | 250,000 | $ | 247,404 | ||||
Amazon.com, Inc. | 500,000 | 538,859 | ||||||
|
| |||||||
| 786,263 | ||||||||
|
| |||||||
Electric-Generation — 0.1% |
| |||||||
Indiantown Cogeneration LP | 90,227 | 96,213 | ||||||
|
| |||||||
Electric-Integrated — 1.5% |
| |||||||
Black Hills Corp. | 250,000 | 250,681 | ||||||
Black Hills Corp. | 500,000 | 510,375 | ||||||
Dominion Resources, Inc. | 200,000 | 201,548 | ||||||
PacifiCorp | 500,000 | 611,031 | ||||||
PPL Electric Utilities Corp. | 250,000 | 270,215 | ||||||
PPL Energy Supply LLC | 1,000,000 | 915,000 | ||||||
Public Service Co. of New Mexico | 250,000 | 255,206 | ||||||
|
| |||||||
| 3,014,056 | ||||||||
|
| |||||||
Electric-Transmission — 0.3% |
| |||||||
Oncor Electric Delivery Co. LLC | 500,000 | 590,811 | ||||||
|
| |||||||
Electronic Components-Misc. — 0.1% |
| |||||||
Corning, Inc. | 250,000 | 279,251 | ||||||
|
| |||||||
Enterprise Software/Service — 0.4% |
| |||||||
Oracle Corp. | 250,000 | 246,055 | ||||||
Oracle Corp. | 250,000 | 254,241 | ||||||
Oracle Corp. | 250,000 | 259,231 | ||||||
|
| |||||||
| 759,527 | ||||||||
|
| |||||||
Finance-Commercial — 0.1% |
| |||||||
Jefferies Finance LLC/JFIN Co-Issuer Corp. | 250,000 | 257,187 | ||||||
|
| |||||||
| Security Description | Principal Amount | Value (Note 2) | ||||||
Finance-Investment Banker/Broker — 0.3% |
| |||||||
Jefferies Group LLC | $ | 250,000 | $ | 265,784 | ||||
Jefferies Group LLC | 250,000 | 252,050 | ||||||
|
| |||||||
| 517,834 | ||||||||
|
| |||||||
Finance-Other Services — 0.1% |
| |||||||
GTP Acquisition Partners I LLC | 250,000 | 247,901 | ||||||
|
| |||||||
Food-Misc./Diversified — 0.1% |
| |||||||
Kraft Heinz Foods Co. | 250,000 | 258,218 | ||||||
|
| |||||||
Gas-Distribution — 0.2% |
| |||||||
NiSource Finance Corp. | 250,000 | 323,534 | ||||||
|
| |||||||
Home Decoration Products — 0.1% |
| |||||||
Newell Rubbermaid, Inc. | 250,000 | 261,102 | ||||||
|
| |||||||
Hotels/Motels — 0.3% |
| |||||||
Choice Hotels International, Inc. | 500,000 | 547,500 | ||||||
|
| |||||||
Independent Power Producers — 0.2% |
| |||||||
GenOn Energy, Inc. | 500,000 | 395,000 | ||||||
|
| |||||||
Insurance-Mutual — 0.3% |
| |||||||
MassMutual Global Funding II | 250,000 | 250,506 | ||||||
New York Life Global Funding | 250,000 | 250,274 | ||||||
|
| |||||||
| 500,780 | ||||||||
|
| |||||||
Insurance-Reinsurance — 0.3% |
| |||||||
Berkshire Hathaway Finance Corp. FRS | 500,000 | 500,015 | ||||||
|
| |||||||
Medical Instruments — 0.4% |
| |||||||
Medtronic, Inc. | 250,000 | 251,480 | ||||||
Medtronic, Inc. | 500,000 | 563,657 | ||||||
|
| |||||||
| 815,137 | ||||||||
|
| |||||||
Medical Labs & Testing Services — 0.1% |
| |||||||
Roche Holdings, Inc. FRS | 250,000 | 250,859 | ||||||
|
| |||||||
| ||
| 27 |
Table of Contents
Anchor Series Trust SA Edge Asset Allocation Portfolio#
PORTFOLIO OF INVESTMENTS — December 31, 2017 — (continued)
| Security Description | Principal Amount | Value (Note 2) | ||||||
U.S. CORPORATE BONDS & NOTES (continued) |
| |||||||
Medical-Biomedical/Gene — 0.8% |
| |||||||
Amgen, Inc. | $ | 250,000 | $ | 250,051 | ||||
Amgen, Inc. | 250,000 | 261,297 | ||||||
Celgene Corp. | 500,000 | 499,627 | ||||||
Gilead Sciences, Inc. | 250,000 | 258,553 | ||||||
Gilead Sciences, Inc. | 250,000 | 266,636 | ||||||
|
| |||||||
| 1,536,164 | ||||||||
|
| |||||||
Medical-Drugs — 0.1% |
| |||||||
AbbVie, Inc. | 250,000 | 250,727 | ||||||
|
| |||||||
Medical-Hospitals — 0.5% |
| |||||||
HCA, Inc. | 500,000 | 533,750 | ||||||
Surgery Center Holdings, Inc. | 500,000 | 517,500 | ||||||
|
| |||||||
| 1,051,250 | ||||||||
|
| |||||||
Non-Hazardous Waste Disposal — 0.1% |
| |||||||
Republic Services, Inc. | 250,000 | 272,934 | ||||||
|
| |||||||
Office Automation & Equipment — 0.3% |
| |||||||
CDW LLC/CDW Finance Corp. | 500,000 | 543,750 | ||||||
|
| |||||||
Oil & Gas Drilling — 0.4% |
| |||||||
Nabors Industries, Inc. | 500,000 | 467,500 | ||||||
Rowan Cos., Inc. | 250,000 | 220,000 | ||||||
|
| |||||||
| 687,500 | ||||||||
|
| |||||||
Oil Companies-Exploration & Production — 0.3% |
| |||||||
W&T Offshore, Inc. | 161,787 | 124,576 | ||||||
W&T Offshore, Inc. | 180,624 | 171,141 | ||||||
Whiting Petroleum Corp. | 250,000 | 256,563 | ||||||
|
| |||||||
| 552,280 | ||||||||
|
| |||||||
| Security Description | Principal Amount | Value (Note 2) | ||||||
Oil Refining & Marketing — 0.1% |
| |||||||
Phillips 66 | $ | 250,000 | $ | 265,709 | ||||
|
| |||||||
Oil-Field Services — 0.3% |
| |||||||
Exterran Partners LP/EXLP Finance Corp. | 500,000 | 500,000 | ||||||
|
| |||||||
Physical Therapy/Rehabilitation Centers — 0.4% |
| |||||||
HealthSouth Corp. | 750,000 | 767,812 | ||||||
|
| |||||||
Pipelines — 1.5% |
| |||||||
Buckeye Partners LP | 250,000 | 247,209 | ||||||
Columbia Pipeline Group, Inc. | 250,000 | 253,571 | ||||||
Columbia Pipeline Group, Inc. | 250,000 | 312,046 | ||||||
El Paso Natural Gas Co. LLC | 500,000 | 619,335 | ||||||
NGPL PipeCo LLC | 500,000 | 508,437 | ||||||
Plains All American Pipeline LP/PAA Finance Corp. | 500,000 | 506,850 | ||||||
Southeast Supply Header LLC | 250,000 | 258,524 | ||||||
Williams Partners LP/ACMP Finance Corp | 250,000 | 261,250 | ||||||
|
| |||||||
| 2,967,222 | ||||||||
|
| |||||||
Real Estate Investment Trusts — 1.3% |
| |||||||
Alexandria Real Estate Equities, Inc. | 200,000 | 200,842 | ||||||
Alexandria Real Estate Equities, Inc. | 250,000 | 265,470 | ||||||
CubeSmart LP | 250,000 | 267,695 | ||||||
Hospitality Properties Trust | 250,000 | 262,731 | ||||||
Hospitality Properties Trust | 250,000 | 266,780 | ||||||
Omega Healthcare Investors, Inc. | 250,000 | 259,067 | ||||||
| ||
| 28 |
Table of Contents
Anchor Series Trust SA Edge Asset Allocation Portfolio#
PORTFOLIO OF INVESTMENTS — December 31, 2017 — (continued)
| Security Description | Principal Amount | Value (Note 2) | ||||||
U.S. CORPORATE BONDS & NOTES (continued) |
| |||||||
Real Estate Investment Trusts (continued) |
| |||||||
Physicians Realty LP | $ | 500,000 | $ | 508,735 | ||||
Simon Property Group LP | 250,000 | 263,606 | ||||||
Ventas Realty LP/Ventas Capital Corp. | 250,000 | 252,978 | ||||||
|
| |||||||
| 2,547,904 | ||||||||
|
| |||||||
Rental Auto/Equipment — 0.1% |
| |||||||
ERAC USA Finance LLC | 250,000 | 263,674 | ||||||
|
| |||||||
Savings & Loans/Thrifts — 0.0% |
| |||||||
Washington Mutual Bank | 125,000 | 0 | ||||||
|
| |||||||
Steel-Specialty — 0.4% |
| |||||||
Allegheny Technologies, Inc. | 750,000 | 810,465 | ||||||
|
| |||||||
Storage/Warehousing — 0.3% |
| |||||||
Mobile Mini, Inc. | 500,000 | 525,000 | ||||||
|
| |||||||
Telecom Services — 0.3% |
| |||||||
Qwest Corp. | 500,000 | 538,440 | ||||||
|
| |||||||
Telephone-Integrated — 0.2% |
| |||||||
Sprint Capital Corp. | 250,000 | 261,563 | ||||||
Verizon Communications, Inc. | 200,000 | 201,218 | ||||||
|
| |||||||
| 462,781 | ||||||||
|
| |||||||
Web Hosting/Design — 0.1% |
| |||||||
VeriSign, Inc. | 250,000 | 272,187 | ||||||
|
| |||||||
Total U.S. Corporate Bonds & Notes | 39,557,102 | |||||||
|
| |||||||
FOREIGN CORPORATE BONDS & NOTES — 1.6% |
| |||||||
Banks-Commercial — 0.1% |
| |||||||
ING Groep NV | 250,000 | 252,990 | ||||||
|
| |||||||
Diversified Banking Institutions — 0.1% |
| |||||||
UBS Group Funding Switzerland AG | 250,000 | 253,978 | ||||||
|
| |||||||
| Security Description | Principal Amount | Value (Note 2) | ||||||
Diversified Financial Services — 0.2% |
| |||||||
GE Capital International Funding Co. ULC | $ | 413,000 | $ | 411,096 | ||||
|
| |||||||
Electric-Integrated — 0.2% |
| |||||||
TransAlta Corp. | 250,000 | 252,657 | ||||||
TransAlta Corp. | 200,000 | 203,101 | ||||||
|
| |||||||
| 455,758 | ||||||||
|
| |||||||
Medical-Generic Drugs — 0.2% |
| |||||||
Allergan Funding SCS | 250,000 | 264,541 | ||||||
|
| |||||||
Oil Companies-Integrated — 0.7% |
| |||||||
BP Capital Markets PLC | 750,000 | 773,280 | ||||||
Suncor Energy, Inc. | 500,000 | 511,719 | ||||||
|
| |||||||
| 1,284,999 | ||||||||
|
| |||||||
Oil-Field Services — 0.1% |
| |||||||
Weatherford International, Ltd. | 250,000 | 226,250 | ||||||
|
| |||||||
Total Foreign Corporate Bonds & Notes | 3,149,612 | |||||||
|
| |||||||
U.S. GOVERNMENT AGENCIES — 9.4% |
| |||||||
Federal Home Loan Mtg. Corp. — 2.4% |
| |||||||
2.00% due 02/01/2028 | 158,777 | 155,447 | ||||||
3.00% due 04/01/2035 | 58,535 | 59,566 | ||||||
3.00% due 09/01/2035 | 75,206 | 76,529 | ||||||
3.00% due 10/01/2042 | 314,975 | 316,688 | ||||||
3.00% due 05/01/2043 | 130,770 | 131,538 | ||||||
3.00% due 07/01/2045 | 165,149 | 165,697 | ||||||
3.00% due 01/01/2047 | 112,706 | 113,342 | ||||||
3.50% due 07/01/2042 | 116,630 | 120,360 | ||||||
3.50% due 10/01/2042 | 118,280 | 122,226 | ||||||
3.50% due 08/01/2043 | 191,125 | 197,756 | ||||||
3.50% due 02/01/2044 | 181,977 | 187,486 | ||||||
3.50% due 08/01/2045 | 231,196 | 239,469 | ||||||
3.50% due 07/01/2046 | 86,597 | 89,696 | ||||||
3.50% due 01/01/2047 | 236,733 | 244,748 | ||||||
4.00% due 10/01/2045 | 210,860 | 223,642 | ||||||
4.00% due 08/01/2047 | 219,845 | 233,166 | ||||||
4.50% due 11/01/2043 | 119,109 | 129,339 | ||||||
5.00% due 01/01/2034 | 56,859 | 61,694 | ||||||
5.00% due 04/01/2035 | 50,629 | 54,936 | ||||||
5.50% due 01/01/2018 | 526 | 526 | ||||||
6.00% due 05/01/2031 | 11,957 | 13,551 | ||||||
6.00% due 09/01/2032 | 6,089 | 6,801 | ||||||
7.50% due 12/01/2030 | 13,373 | 13,870 | ||||||
7.50% due 01/01/2031 | 18,972 | 20,428 | ||||||
7.50% due 02/01/2031 | 1,954 | 2,163 | ||||||
| ||
| 29 |
Table of Contents
Anchor Series Trust SA Edge Asset Allocation Portfolio#
PORTFOLIO OF INVESTMENTS — December 31, 2017 — (continued)
| Security Description | Principal Amount | Value (Note 2) | ||||||
U.S. GOVERNMENT AGENCIES (continued) |
| |||||||
Federal Home Loan Mtg. Corp. (continued) |
| |||||||
Federal Home Loan Mtg. Corp. REMIC VRS | $ | 530,473 | $ | 28,903 | ||||
Federal Home Loan Mtg. Corp. REMIC | ||||||||
Series 4127, Class EJ | 116,319 | 114,085 | ||||||
Series 4033, Class ED | 163,300 | 163,100 | ||||||
Series 4097, Class HI | 777,528 | 74,932 | ||||||
Series 4579, Class BA | 124,159 | 124,950 | ||||||
Series 4121, Class HI | 613,845 | 63,558 | ||||||
Series 4343, Class DI | 339,678 | 38,817 | ||||||
Series 4121, Class UI | 442,943 | 88,306 | ||||||
Series 4650, Class CA | 49,432 | 50,877 | ||||||
Series 4648, Class E | 85,146 | 86,944 | ||||||
Series 4673, Class NT | 120,000 | 121,749 | ||||||
Series 3924, Class LB | 200,000 | 208,062 | ||||||
Series 4135, Class DI | 278,657 | 43,734 | ||||||
Series 2015-4440, Class ZX | 111,979 | 119,173 | ||||||
Series 4463, Class ZA | 55,618 | 59,532 | ||||||
Federal Home Loan Mtg. Corp. STRIPS VRS | 1,727,381 | 111,926 | ||||||
Federal Home Loan Mtg. Corp. STRIPS | 107,839 | 114,572 | ||||||
Federal Home Loan Mtg. Corp. | 100,000 | 103,302 | ||||||
|
| |||||||
| 4,697,186 | ||||||||
|
| |||||||
Federal National Mtg. Assoc. — 5.7% |
| |||||||
1.50% due 02/28/2020 | 750,000 | 742,217 | ||||||
2.00% due 01/05/2022 | 500,000 | 496,707 | ||||||
2.00% due 01/01/2031 | 76,094 | 74,616 | ||||||
2.50% due 06/01/2027 | 134,508 | 135,181 | ||||||
2.50% due 08/01/2028 | 154,176 | 154,900 | ||||||
2.50% due 09/01/2028 | 189,422 | 190,312 | ||||||
3.00% due 04/01/2027 | 41,401 | 42,284 | ||||||
3.00% due 05/01/2029 | 55,633 | 56,894 | ||||||
3.00% due 03/01/2030 | 118,455 | 121,124 | ||||||
3.00% due 08/01/2031 | 170,120 | 173,816 | ||||||
3.00% due 10/01/2042 | 119,348 | 119,993 | ||||||
3.00% due 11/01/2042 | 196,389 | 197,794 | ||||||
3.00% due 12/01/2042 | 276,114 | 277,987 | ||||||
| Security Description | Principal Amount | Value (Note 2) | ||||||
Federal National Mtg. Assoc. (continued) |
| |||||||
3.00% due 02/01/2043 | $ | 105,728 | $ | 106,721 | ||||
3.00% due 04/01/2043 | 162,138 | 162,387 | ||||||
3.00% due 06/01/2043 | 195,780 | 197,180 | ||||||
3.00% due 08/01/2043 | 157,866 | 158,995 | ||||||
3.00% due 07/01/2046 | 231,295 | 231,837 | ||||||
3.00% due 12/01/2046 | 329,732 | 330,911 | ||||||
3.50% due 08/01/2031 | 85,059 | 88,511 | ||||||
3.50% due 01/01/2036 | 180,773 | 188,099 | ||||||
3.50% due 09/01/2042 | 125,614 | 129,915 | ||||||
3.50% due 11/01/2042 | 170,363 | 176,197 | ||||||
3.50% due 02/01/2043 | 60,915 | 63,134 | ||||||
3.50% due 05/01/2043 | 137,459 | 142,469 | ||||||
3.50% due 11/01/2044 | 143,569 | 148,795 | ||||||
3.50% due 03/01/2045 | 142,197 | 146,881 | ||||||
3.50% due 06/01/2045 | 76,731 | 79,513 | ||||||
3.50% due 09/01/2045 | 76,789 | 79,405 | ||||||
3.50% due 11/01/2045 | 168,935 | 174,859 | ||||||
3.50% due 03/01/2046 | 110,262 | 114,258 | ||||||
3.50% due 04/01/2046 | 171,577 | 177,795 | ||||||
3.50% due 03/01/2047 | 166,843 | 172,957 | ||||||
3.50% due 10/01/2047 | 98,900 | 101,604 | ||||||
4.00% due 09/01/2040 | 158,289 | 167,482 | ||||||
4.00% due 12/01/2040 | 123,311 | 131,004 | ||||||
4.00% due 08/01/2043 | 295,056 | 313,588 | ||||||
4.00% due 10/01/2043 | 59,723 | 63,313 | ||||||
4.00% due 04/01/2044 | 265,720 | 282,360 | ||||||
4.00% due 08/01/2044 | 135,015 | 143,489 | ||||||
4.00% due 10/01/2044 | 183,179 | 192,918 | ||||||
4.00% due 12/01/2044 | 108,320 | 115,258 | ||||||
4.00% due 09/01/2045 | 81,876 | 87,109 | ||||||
4.00% due 05/01/2046 | 206,634 | 219,203 | ||||||
4.00% due 07/01/2047 | 96,024 | 102,166 | ||||||
4.00% due 10/01/2047 | 99,398 | 105,552 | ||||||
4.50% due 03/01/2041 | 194,221 | 209,179 | ||||||
4.50% due 11/01/2041 | 126,553 | 137,508 | ||||||
4.50% due 09/01/2043 | 368,902 | 401,057 | ||||||
4.50% due 12/01/2044 | 174,497 | 189,686 | ||||||
4.50% due 11/01/2045 | 195,818 | 212,329 | ||||||
5.00% due 02/01/2040 | 141,629 | 155,978 | ||||||
5.00% due 07/01/2041 | 172,071 | 189,464 | ||||||
5.00% due 02/01/2044 | 163,310 | 179,867 | ||||||
6.00% due 08/01/2018 | 94 | 105 | ||||||
6.00% due 05/01/2031 | 5,548 | 6,263 | ||||||
6.00% due 04/01/2032 | 9,782 | 10,932 | ||||||
6.50% due 06/01/2019 | 1,391 | 1,541 | ||||||
6.50% due 09/01/2024 | 10,816 | 11,989 | ||||||
6.50% due 09/01/2025 | 2,433 | 2,696 | ||||||
6.50% due 11/01/2025 | 3,429 | 3,801 | ||||||
6.50% due 05/01/2026 | 9,964 | 11,045 | ||||||
6.50% due 11/01/2027 | 270 | 299 | ||||||
6.50% due 01/01/2032 | 3,178 | 3,523 | ||||||
7.00% due 05/01/2029 | 4,400 | 4,875 | ||||||
7.00% due 09/01/2029 | 5,123 | 5,206 | ||||||
7.00% due 01/01/2031 | 1,963 | 2,063 | ||||||
7.50% due 01/01/2031 | 5,379 | 5,711 | ||||||
7.50% due 02/01/2031 | 1,377 | 1,413 | ||||||
Federal National Mtg. Assoc. REMIC VRS | ||||||||
Series 2016-30, Class AS | 651,281 | 29,359 | ||||||
Series 2016-40, Class KS | 615,332 | 36,922 | ||||||
| ||
| 30 |
Table of Contents
Anchor Series Trust SA Edge Asset Allocation Portfolio#
PORTFOLIO OF INVESTMENTS — December 31, 2017 — (continued)
| Security Description | Principal Amount | Value (Note 2) | ||||||
U.S. GOVERNMENT AGENCIES (continued) |
| |||||||
Federal National Mtg. Assoc. (continued) |
| |||||||
Series 2015-22, Class AS | $ | 492,747 | $ | 25,682 | ||||
Series 2015-38, Class AS | 520,491 | 31,079 | ||||||
Federal National Mtg. Assoc. REMIC | ||||||||
Series 2015-91, Class AS | 1,926,321 | 99,794 | ||||||
Series 2012-122, Class AD | 46,151 | 45,293 | ||||||
Series 2013-2, Class BI | 443,648 | 36,404 | ||||||
Series 2017-54, Class IO | 379,088 | 50,142 | ||||||
Series 2016-92, Class A | 92,691 | 92,621 | ||||||
Series 2016-100, Class DA | 69,877 | 70,560 | ||||||
Series 2016-38, Class NA | 229,545 | 231,123 | ||||||
Series 2012-149, Class IC | 337,366 | 35,613 | ||||||
Series 2016-30, Class IL | 829,750 | 112,726 | ||||||
Series 2016-4, Class LI | 501,739 | 80,592 | ||||||
Series 2015-20, Class EH | 200,000 | 208,720 | ||||||
Series 2017-66, Class C | 60,000 | 60,737 | ||||||
Series 2015-12, Class BY | 100,000 | 108,961 | ||||||
Series 2017-22, Class DZ | 72,128 | 76,294 | ||||||
Series 2015-18, Class IA | 423,539 | 100,249 | ||||||
Series 2002-16, Class TM | 77,342 | 87,743 | ||||||
|
| |||||||
| 11,246,834 | ||||||||
|
| |||||||
Government National Mtg. Assoc. — 1.3% |
| |||||||
3.00% due 11/15/2042 | 259,278 | 262,419 | ||||||
3.00% due 02/15/2043 | 186,532 | 188,792 | ||||||
3.50% due 09/15/2042 | 145,975 | 151,391 | ||||||
3.50% due 05/15/2043 | 74,550 | 77,586 | ||||||
3.50% due 09/20/2045 | 141,936 | 147,282 | ||||||
3.50% due 06/20/2046 | 179,252 | 185,902 | ||||||
4.00% due 10/20/2044 | 163,442 | 171,846 | ||||||
4.50% due 05/15/2039 | 44,553 | 47,069 | ||||||
5.50% due 07/20/2033 | 86,359 | 95,724 | ||||||
6.00% due 07/20/2033 | 59,318 | 67,163 | ||||||
6.50% due 12/15/2023 | 8,578 | 9,516 | ||||||
6.50% due 03/20/2027 | 473 | 476 | ||||||
6.50% due 04/20/2027 | 6,654 | 6,926 | ||||||
7.00% due 12/15/2022 | 1,803 | 1,808 | ||||||
7.00% due 05/15/2023 | 404 | 405 | ||||||
7.00% due 12/15/2023 | 2,116 | 2,288 | ||||||
7.00% due 04/15/2028 | 9,583 | 9,830 | ||||||
7.50% due 08/15/2030 | 12,540 | 12,770 | ||||||
7.50% due 09/15/2030 | 4,066 | 4,205 | ||||||
7.50% due 11/15/2030 | 16,968 | 17,866 | ||||||
7.50% due 01/15/2031 | 10,042 | 11,097 | ||||||
| Security Description | Principal Amount | Value (Note 2) | ||||||
Government National Mtg. Assoc. (continued) |
| |||||||
Government National Mtg. Assoc. REMIC VRS | ||||||||
Series 2017-157, Class IO | $ | 997,565 | $ | 61,558 | ||||
Series 2013-101, Class IO | 2,254,792 | 77,413 | ||||||
Series 2015-136, Class IO | 870,915 | 46,814 | ||||||
Series 2013-57, Class IO | 2,398,342 | 80,196 | ||||||
Series 2013-30, Class IO | 1,447,697 | 62,735 | ||||||
Series 2012-139, Class IO | 3,641,077 | 185,282 | ||||||
Series 2014-135, Class IO | 711,688 | 35,346 | ||||||
Series 2013-80, Class IO | 1,435,621 | 80,406 | ||||||
Series 2013-68, Class IO | 1,086,779 | 49,482 | ||||||
Series 2013-40, Class IO | 1,114,813 | 47,396 | ||||||
Series 2014-69, Class WI | 1,045,605 | 43,873 | ||||||
Government National Mtg. Assoc. REMIC | ||||||||
Series 2017-190, Class AD | 100,000 | 97,556 | ||||||
Series 2017-56, Class NZ | 51,009 | 45,662 | ||||||
Series 2015-63, Class ZB | 87,411 | 90,579 | ||||||
Series 2012-3, Class LA | 74,517 | 75,715 | ||||||
Series 2017-45, Class KI | 793,735 | 110,151 | ||||||
Series 2016-81, Class IN | 268,182 | 53,369 | ||||||
|
| |||||||
| 2,715,894 | ||||||||
|
| |||||||
Total U.S. Government Agencies | 18,659,914 | |||||||
|
| |||||||
U.S. GOVERNMENT TREASURIES — 0.7% |
| |||||||
United States Treasury Bonds — 0.5% |
| |||||||
2.25% due 08/15/2046 | 250,000 | 225,518 | ||||||
3.00% due 11/15/2044 | 250,000 | 262,588 | ||||||
4.25% due 11/15/2040 | 165,000 | 209,550 | ||||||
4.50% due 02/15/2036 | 50,000 | 64,369 | ||||||
5.25% due 11/15/2028 | 140,000 | 177,598 | ||||||
6.25% due 08/15/2023 | 80,000 | 96,900 | ||||||
|
| |||||||
| 1,036,523 | ||||||||
|
| |||||||
United States Treasury Notes — 0.2% |
| |||||||
1.50% due 08/15/2026 | 250,000 | 232,597 | ||||||
2.13% due 12/31/2022 | 80,000 | 79,669 | ||||||
3.13% due 05/15/2021 | 100,000 | 103,469 | ||||||
|
| |||||||
| 415,735 | ||||||||
|
| |||||||
Total U.S. Government Treasuries | 1,452,258 | |||||||
|
| |||||||
| ||
| 31 |
Table of Contents
Anchor Series Trust SA Edge Asset Allocation Portfolio#
PORTFOLIO OF INVESTMENTS — December 31, 2017 — (continued)
| Security Description | Principal Amount | Value (Note 2) | ||||||
LOANS (12)(13)(14) — 0.4% |
| |||||||
Applications Software — 0.3% |
| |||||||
Landslide Holdings, Inc. FRS | $ | 500,000 | $ | 477,187 | ||||
|
| |||||||
Pipelines — 0.1% |
| |||||||
BCP Renaissance Parent LLC FRS | 250,000 | 252,917 | ||||||
|
| |||||||
Total Loans | 730,104 | |||||||
|
| |||||||
Total Long-Term Investment Securities | 194,346,918 | |||||||
|
| |||||||
REPURCHASE AGREEMENTS — 1.1% |
| |||||||
Agreement with Fixed Income Clearing Corp., bearing interest at 0.20%, dated 12/29/2017, to be repurchased 01/02/2018 in the amount of $2,101,047 collateralized by $2,045,000 of United States Treasury Notes, bearing interest at 0.13% due 04/15/2019 and having an approximate value of $2,146,596 | 2,101,000 | 2,101,000 | ||||||
|
| |||||||
TOTAL INVESTMENTS | 99.5 | % | 196,447,918 | |||||
Other assets less liabilities | 0.5 | 1,012,990 | ||||||
|
|
|
| |||||
NET ASSETS | 100.0 | % | $ | 197,460,908 | ||||
|
|
|
| |||||
| # | See Note 1 |
| † | Non-income producing security |
| * | Securities exempt from registration under Rule 144A of the Securities Act of 1933. These securities may be sold in transactions exempt from registration, normally to qualified institutional buyers. The Portfolio has no right to demand registration of these securities. At December 31, 2017, the aggregate value of these securities was $8,982,295 representing 4.5% of net assets. Unless otherwise indicated, these securities are not considered to be illiquid. |
| (1) | Perpetual maturity - maturity date reflects the next call date. |
| (2) | Commercial Mortgage Backed Security |
| (3) | Collateralized Mortgage Obligation |
| (4) | Certain variable rate securities are not based on a published reference rate and spread but are determined by the issuer or agent and are based on current market conditions. These securities do not indicate a reference rate and spread in their description above. |
| (5) | Security in default of interest |
| (6) | Company has filed for bankruptcy protection. |
| (7) | PIK (“Payment-in-Kind”) security - Income may be paid in additional securities or cash at the discretion of the issuer. The security is currently paying interest in the form of additional securities at the coupon rate listed. |
| (8) | Securities classified as Level 3 (see Note 2). |
| (9) | Illiquid security. At December 31, 2017, the aggregate value of these securities was $0 representing 0.0% of net assets. |
| (10) | Interest Only |
| (11) | Inverse Floating Rate Security that pays interest that varies inversely to changes in the market interest rates. The interest rate shown is the current interest rate at December 31, 2017. |
| (12) | Senior loans in the Portfolio are generally subject to mandatory and/or optional prepayment. Because of these mandatory prepayment conditions and because there may be significant economic incentives for a borrower to prepay, prepayments may occur. As a result, the actual remaining maturity may be substantially less than the stated maturities shown. |
| (13) | The Portfolio invests in senior loans which generally pay interest at rates which are periodically re-determined by reference to a base lending rate plus a premium. These base lending rates are generally either the lending rate offered by one or more major European banks, such as the London Inter-Bank Offer Rate (“LIBOR) or the prime rate offered by one or more major United States banks, or the certificate of deposit rate. Senior loans are generally considered to be restrictive in that the Portfolio is ordinarily contractually obligated to receive approval from the Agent Bank and/or borrower prior to the disposition of a senior loan. |
| (14) | All loans in the Portfolio were purchased through assignment agreements unless otherwise indicated. |
| (15) | See Note 6 for cost of investments on a tax basis. |
ADR — American Depositary Receipt
ETF — Exchange-Traded Fund
NYSE — New York Stock Exchange
REMIC — Real Estate Mortgage Investment Conduit
STRIPS — Separate trading of registered interest and principal of securities
Currency Legend
TSX — Toronto Stock Exchange
ULC — Unlimited Liability Corp.
FRS — Floating Rate Security
VRS — Variable Rate Security
The rates shown on FRS and VRS are the current interest rates at December 31, 2017 and unless noted otherwise, the dates are the original maturity dates
Index Legend
1 ML — 1 Month USD LIBOR
3 ML — 3 Month USD LIBOR
| ||
| 32 |
Table of Contents
Anchor Series Trust SA Edge Asset Allocation Portfolio#
PORTFOLIO OF INVESTMENTS — December 31, 2017 — (continued)
The following is a summary of the inputs used to value the Portfolio’s net assets as of December 31, 2017 (see Note 2):
Level 1 - Unadjusted Quoted Prices | Level 2 - Other Observable Inputs | Level 3 - Significant Unobservable Inputs | Total | |||||||||||||
ASSETS: | ||||||||||||||||
Investments at Value:* | ||||||||||||||||
Common Stocks | $ | 111,893,825 | $ | 25,818 | ** | $ | — | $ | 111,919,643 | |||||||
Exchange-Traded Funds | 8,846,832 | — | — | 8,846,832 | ||||||||||||
Preferred Securities/Capital Securities | — | 1,554,625 | — | 1,554,625 | ||||||||||||
Asset Backed Securities | — | 8,476,828 | — | 8,476,828 | ||||||||||||
U.S. Corporate Bonds & Notes: | ||||||||||||||||
Savings & Loans/Thrifts | — | — | 0 | 0 | ||||||||||||
Other Industries | — | 39,557,102 | — | 39,557,102 | ||||||||||||
Foreign Corporate Bonds & Notes | — | 3,149,612 | — | 3,149,612 | ||||||||||||
U.S. Government Agencies | — | 18,659,914 | — | 18,659,914 | ||||||||||||
U.S. Government Treasuries | — | 1,452,258 | — | 1,452,258 | ||||||||||||
Loans | — | 730,104 | — | 730,104 | ||||||||||||
Repurchase Agreements | — | 2,101,000 | — | 2,101,000 | ||||||||||||
|
|
|
|
|
|
|
| |||||||||
Total Investments at Value | $ | 120,740,657 | $ | 75,707,261 | $ | 0 | $ | 196,447,918 | ||||||||
|
|
|
|
|
|
|
| |||||||||
| * | For a detailed presentation of investments, please refer to the Portfolio of Investments. |
| ** | Represents foreign equity securities that have been fair valued in accordance with pricing procedures approved by Board (see Note 2). |
The Portfolio’s policy is to recognize transfers between Levels as of the end of the reporting period. There were no material transfers between Levels during the reporting period.
At the beginning and end of the reporting period, Level 3 investments were not considered a material portion of the Portfolio.
See Notes to Financial Statements
| ||
| 33 |
Table of Contents
Anchor Series Trust SA Wellington Growth and Income Portfolio#
PORTFOLIO PROFILE — December 31, 2017 — (unaudited)
Industry Allocation*
Diversified Banking Institutions | 7.2 | % | ||
Medical-Drugs | 4.0 | |||
Web Portals/ISP | 3.9 | |||
Banks-Super Regional | 3.9 | |||
Oil Companies-Exploration & Production | 3.7 | |||
Computers | 3.5 | |||
Internet Content-Entertainment | 3.1 | |||
Medical-HMO | 3.1 | |||
E-Commerce/Products | 3.0 | |||
Diagnostic Equipment | 3.0 | |||
Commercial Services-Finance | 2.9 | |||
Applications Software | 2.7 | |||
Finance-Credit Card | 2.5 | |||
Retail-Discount | 2.5 | |||
Chemicals-Diversified | 2.4 | |||
Insurance-Multi-line | 2.4 | |||
Aerospace/Defense | 2.3 | |||
Telephone-Integrated | 2.1 | |||
Diversified Manufacturing Operations | 2.0 | |||
Medical Instruments | 1.8 | |||
Apparel Manufacturers | 1.8 | |||
Cable/Satellite TV | 1.8 | |||
Athletic Footwear | 1.7 | |||
Electric-Integrated | 1.7 | |||
Electronic Components-Semiconductors | 1.6 | |||
Medical Products | 1.5 | |||
Beverages-Non-alcoholic | 1.4 | |||
Tobacco | 1.4 | |||
E-Commerce/Services | 1.4 | |||
Repurchase Agreements | 1.3 | |||
Banks-Commercial | 1.3 | |||
Cosmetics & Toiletries | 1.3 | |||
Electric Products-Misc. | 1.2 | |||
Web Hosting/Design | 1.2 | |||
Finance-Consumer Loans | 1.1 | |||
Textile-Home Furnishings | 1.1 | |||
Hotels/Motels | 1.1 | |||
Tools-Hand Held | 1.1 | |||
Medical Labs & Testing Services | 1.0 | |||
Computers-Memory Devices | 1.0 | |||
Semiconductor Equipment | 0.9 | |||
Oil-Field Services | 0.9 | |||
Industrial Automated/Robotic | 0.9 | |||
Retail-Restaurants | 0.8 | |||
Building & Construction Products-Misc. | 0.8 | |||
Containers-Metal/Glass | 0.8 | |||
Investment Management/Advisor Services | 0.8 | |||
Transport-Truck | 0.8 | |||
Semiconductor Components-Integrated Circuits | 0.8 | |||
Coatings/Paint | 0.7 | |||
Enterprise Software/Service | 0.7 | |||
E-Services/Consulting | 0.6 | |||
Machinery-Pumps | 0.6 | |||
Insurance-Property/Casualty | 0.6 | |||
Machinery-General Industrial | 0.5 | |||
Food-Misc./Diversified | 0.3 | |||
|
| |||
| 100.5 | % | |||
|
|
| # | See Note 1 |
| * | Calculated as a percentage of net assets |
| ||
| 34 |
Table of Contents
Anchor Series Trust SA Wellington Growth and Income Portfolio#
PORTFOLIO OF INVESTMENTS — December 31, 2017
| Security Description | Shares | Value (Note 2) | ||||||
COMMON STOCKS — 99.2% |
| |||||||
Aerospace/Defense — 2.3% |
| |||||||
Boeing Co. | 11,221 | $ | 3,309,185 | |||||
General Dynamics Corp. | 6,969 | 1,417,843 | ||||||
|
| |||||||
| 4,727,028 | ||||||||
|
| |||||||
Apparel Manufacturers — 1.8% |
| |||||||
Under Armour, Inc., Class C† | 84,967 | 1,131,760 | ||||||
VF Corp. | 34,327 | 2,540,198 | ||||||
|
| |||||||
| 3,671,958 | ||||||||
|
| |||||||
Applications Software — 2.7% |
| |||||||
Microsoft Corp. | 46,227 | 3,954,257 | ||||||
salesforce.com, Inc.† | 15,673 | 1,602,251 | ||||||
|
| |||||||
| 5,556,508 | ||||||||
|
| |||||||
Athletic Footwear — 1.7% |
| |||||||
NIKE, Inc., Class B | 54,404 | 3,402,970 | ||||||
|
| |||||||
Banks-Commercial — 1.3% |
| |||||||
M&T Bank Corp. | 7,049 | 1,205,309 | ||||||
SVB Financial Group† | 5,778 | 1,350,723 | ||||||
|
| |||||||
| 2,556,032 | ||||||||
|
| |||||||
Banks-Super Regional — 3.9% |
| |||||||
Capital One Financial Corp. | 25,621 | 2,551,339 | ||||||
Fifth Third Bancorp | 36,840 | 1,117,726 | ||||||
PNC Financial Services Group, Inc. | 28,652 | 4,134,197 | ||||||
|
| |||||||
| 7,803,262 | ||||||||
|
| |||||||
Beverages-Non-alcoholic — 1.4% |
| |||||||
Monster Beverage Corp.† | 45,172 | 2,858,936 | ||||||
|
| |||||||
Building & Construction Products-Misc. — 0.8% |
| |||||||
Fortune Brands Home & Security, Inc. | 24,571 | 1,681,639 | ||||||
|
| |||||||
Cable/Satellite TV — 1.8% |
| |||||||
Comcast Corp., Class A | 91,119 | 3,649,316 | ||||||
|
| |||||||
Chemicals-Diversified — 2.4% |
| |||||||
DowDuPont, Inc. | 37,051 | 2,638,772 | ||||||
PPG Industries, Inc. | 19,535 | 2,282,079 | ||||||
|
| |||||||
| 4,920,851 | ||||||||
|
| |||||||
Coatings/Paint — 0.7% |
| |||||||
Sherwin-Williams Co. | 3,356 | 1,376,094 | ||||||
|
| |||||||
Commercial Services-Finance — 2.9% |
| |||||||
Equifax, Inc. | 8,881 | 1,047,248 | ||||||
FleetCor Technologies, Inc.† | 8,981 | 1,728,214 | ||||||
Global Payments, Inc. | 18,950 | 1,899,548 | ||||||
IHS Markit, Ltd.† | 27,610 | 1,246,591 | ||||||
|
| |||||||
| 5,921,601 | ||||||||
|
| |||||||
Computers — 3.5% |
| |||||||
Apple, Inc. | 42,001 | 7,107,829 | ||||||
|
| |||||||
Computers-Memory Devices — 1.0% |
| |||||||
NetApp, Inc. | 35,624 | 1,970,720 | ||||||
|
| |||||||
Containers-Metal/Glass — 0.8% |
| |||||||
Crown Holdings, Inc.† | 29,841 | 1,678,556 | ||||||
|
| |||||||
Cosmetics & Toiletries — 1.3% |
| |||||||
Estee Lauder Cos., Inc., Class A | 20,055 | 2,551,798 | ||||||
|
| |||||||
Diagnostic Equipment — 3.0% |
| |||||||
Abbott Laboratories | 38,571 | 2,201,247 | ||||||
Danaher Corp. | 15,587 | 1,446,785 | ||||||
| Security Description | Shares | Value (Note 2) | ||||||
Diagnostic Equipment (continued) |
| |||||||
Thermo Fisher Scientific, Inc. | 12,807 | $ | 2,431,793 | |||||
|
| |||||||
| 6,079,825 | ||||||||
|
| |||||||
Diversified Banking Institutions — 7.2% |
| |||||||
Bank of America Corp. | 197,879 | 5,841,388 | ||||||
Goldman Sachs Group, Inc. | 11,176 | 2,847,198 | ||||||
JPMorgan Chase & Co. | 55,068 | 5,888,972 | ||||||
|
| |||||||
| 14,577,558 | ||||||||
|
| |||||||
Diversified Manufacturing Operations — 2.0% |
| |||||||
Eaton Corp. PLC | 23,850 | 1,884,389 | ||||||
Illinois Tool Works, Inc. | 12,919 | 2,155,535 | ||||||
|
| |||||||
| 4,039,924 | ||||||||
|
| |||||||
E-Commerce/Products — 3.0% |
| |||||||
Amazon.com, Inc.† | 3,802 | 4,446,325 | ||||||
eBay, Inc.† | 44,339 | 1,673,354 | ||||||
|
| |||||||
| 6,119,679 | ||||||||
|
| |||||||
E-Commerce/Services — 1.4% |
| |||||||
Priceline Group, Inc.† | 1,617 | 2,809,926 | ||||||
|
| |||||||
E-Services/Consulting — 0.6% |
| |||||||
CDW Corp. | 17,529 | 1,218,090 | ||||||
|
| |||||||
Electric Products-Misc. — 1.2% |
| |||||||
AMETEK, Inc. | 34,146 | 2,474,561 | ||||||
|
| |||||||
Electric-Integrated — 1.7% |
| |||||||
American Electric Power Co., Inc. | 23,451 | 1,725,290 | ||||||
NextEra Energy, Inc. | 10,476 | 1,636,247 | ||||||
|
| |||||||
| 3,361,537 | ||||||||
|
| |||||||
Electronic Components-Semiconductors — 1.6% |
| |||||||
IPG Photonics Corp.† | 4,000 | 856,520 | ||||||
Micron Technology, Inc.† | 34,258 | 1,408,689 | ||||||
NVIDIA Corp. | 5,523 | 1,068,700 | ||||||
|
| |||||||
| 3,333,909 | ||||||||
|
| |||||||
Enterprise Software/Service — 0.7% |
| |||||||
Workday, Inc., Class A† | 13,085 | 1,331,268 | ||||||
|
| |||||||
Finance-Consumer Loans — 1.1% |
| |||||||
Synchrony Financial | 58,084 | 2,242,623 | ||||||
|
| |||||||
Finance-Credit Card — 2.5% |
| |||||||
Mastercard, Inc., Class A | 33,627 | 5,089,783 | ||||||
|
| |||||||
Food-Misc./Diversified — 0.3% |
| |||||||
Blue Buffalo Pet Products, Inc.† | 21,100 | 691,869 | ||||||
|
| |||||||
Hotels/Motels — 1.1% |
| |||||||
Hilton Worldwide Holdings, Inc. | 27,023 | 2,158,057 | ||||||
|
| |||||||
Industrial Automated/Robotic — 0.9% |
| |||||||
Nordson Corp. | 12,036 | 1,762,070 | ||||||
|
| |||||||
Insurance-Multi-line — 2.4% |
| |||||||
Allstate Corp. | 23,536 | 2,464,455 | ||||||
Chubb, Ltd. | 16,235 | 2,372,420 | ||||||
|
| |||||||
| 4,836,875 | ||||||||
|
| |||||||
Insurance-Property/Casualty — 0.6% |
| |||||||
XL Group, Ltd. | 31,868 | 1,120,479 | ||||||
|
| |||||||
Internet Content-Entertainment — 3.1% |
| |||||||
Facebook, Inc., Class A† | 27,673 | 4,883,178 | ||||||
Netflix, Inc.† | 7,247 | 1,391,134 | ||||||
|
| |||||||
| 6,274,312 | ||||||||
|
| |||||||
| ||
| 35 |
Table of Contents
Anchor Series Trust SA Wellington Growth and Income Portfolio#
PORTFOLIO OF INVESTMENTS — December 31, 2017 — (continued)
| Security Description | Shares | Value (Note 2) | ||||||
COMMON STOCKS (continued) |
| |||||||
Investment Management/Advisor Services — 0.8% |
| |||||||
BlackRock, Inc. | 3,267 | $ | 1,678,291 | |||||
|
| |||||||
Machinery-General Industrial — 0.5% |
| |||||||
Middleby Corp.† | 7,625 | 1,028,994 | ||||||
|
| |||||||
Machinery-Pumps — 0.6% |
| |||||||
Gardner Denver Holdings, Inc.† | 35,457 | 1,203,056 | ||||||
|
| |||||||
Medical Instruments — 1.8% |
| |||||||
Boston Scientific Corp.† | 55,002 | 1,363,500 | ||||||
Medtronic PLC | 28,643 | 2,312,922 | ||||||
|
| |||||||
| 3,676,422 | ||||||||
|
| |||||||
Medical Labs & Testing Services — 1.0% |
| |||||||
Laboratory Corp. of America Holdings† | 12,735 | 2,031,360 | ||||||
|
| |||||||
Medical Products — 1.5% |
| |||||||
Baxter International, Inc. | 29,034 | 1,876,758 | ||||||
Hologic, Inc.† | 29,447 | 1,258,859 | ||||||
|
| |||||||
| 3,135,617 | ||||||||
|
| |||||||
Medical-Drugs — 4.0% |
| |||||||
Allergan PLC | 11,025 | 1,803,470 | ||||||
Bristol-Myers Squibb Co. | 34,562 | 2,117,959 | ||||||
Eli Lilly & Co. | 23,876 | 2,016,567 | ||||||
Merck & Co., Inc. | 39,144 | 2,202,633 | ||||||
|
| |||||||
| 8,140,629 | ||||||||
|
| |||||||
Medical-HMO — 3.1% |
| |||||||
Aetna, Inc. | 12,509 | 2,256,498 | ||||||
UnitedHealth Group, Inc. | 18,110 | 3,992,531 | ||||||
|
| |||||||
| 6,249,029 | ||||||||
|
| |||||||
Oil Companies-Exploration & Production — 3.7% |
| |||||||
Concho Resources, Inc.† | 10,988 | 1,650,617 | ||||||
Continental Resources, Inc.† | 8,300 | 439,651 | ||||||
EOG Resources, Inc. | 20,795 | 2,243,989 | ||||||
Newfield Exploration Co.† | 40,568 | 1,279,109 | ||||||
Pioneer Natural Resources Co. | 10,725 | 1,853,816 | ||||||
|
| |||||||
| 7,467,182 | ||||||||
|
| |||||||
Oil-Field Services — 0.9% |
| |||||||
Halliburton Co. | 36,831 | 1,799,931 | ||||||
|
| |||||||
Retail-Discount — 2.5% |
| |||||||
Costco Wholesale Corp. | 13,336 | 2,482,096 | ||||||
Dollar Tree, Inc.† | 23,190 | 2,488,519 | ||||||
|
| |||||||
| 4,970,615 | ||||||||
|
| |||||||
Retail-Restaurants — 0.8% |
| |||||||
Starbucks Corp. | 29,650 | 1,702,800 | ||||||
|
| |||||||
Semiconductor Components-Integrated Circuits — 0.8% |
| |||||||
QUALCOMM, Inc. | 23,920 | 1,531,358 | ||||||
|
| |||||||
Semiconductor Equipment — 0.9% |
| |||||||
Lam Research Corp. | 10,088 | 1,856,898 | ||||||
|
| |||||||
Telecommunication Equipment — 0.0% |
| |||||||
Nortel Networks Corp.†(1)(2) | 147 | 0 | ||||||
|
| |||||||
Telephone-Integrated — 2.1% |
| |||||||
Verizon Communications, Inc. | 79,593 | 4,212,858 | ||||||
|
| |||||||
Textile-Home Furnishings — 1.1% |
| |||||||
Mohawk Industries, Inc.† | 7,839 | 2,162,780 | ||||||
|
| |||||||
Tobacco — 1.4% |
| |||||||
Altria Group, Inc. | 39,535 | 2,823,194 | ||||||
|
| |||||||
| Security Description | Shares/ Principal Amount | Value (Note 2) | ||||||
Tools-Hand Held — 1.1% |
| |||||||
Snap-on, Inc. | 12,274 | $ | 2,139,358 | |||||
|
| |||||||
Transport-Truck — 0.8% |
| |||||||
JB Hunt Transport Services, Inc. | 13,332 | 1,532,913 | ||||||
|
| |||||||
Web Hosting/Design — 1.2% |
| |||||||
GoDaddy, Inc., Class A† | 48,673 | 2,447,278 | ||||||
|
| |||||||
Web Portals/ISP — 3.9% |
| |||||||
Alphabet, Inc., Class A† | 5,182 | 5,458,719 | ||||||
Alphabet, Inc., Class C† | 2,290 | 2,396,256 | ||||||
|
| |||||||
| 7,854,975 | ||||||||
|
| |||||||
Total Long-Term Investment Securities | 200,602,981 | |||||||
|
| |||||||
REPURCHASE AGREEMENTS — 1.3% |
| |||||||
Bank of America Securities LLC Joint Repurchase Agreement(3) | $ | 390,000 | 390,000 | |||||
Barclays Capital, Inc. Joint Repurchase Agreement(3) | 435,000 | 435,000 | ||||||
BNP Paribas SA Joint Repurchase Agreement(3) | 755,000 | 755,000 | ||||||
Deutsche Bank AG Joint Repurchase Agreement(3) | 285,000 | 285,000 | ||||||
RBS Securities, Inc. Joint Repurchase Agreement(3) | 695,000 | 695,000 | ||||||
|
| |||||||
Total Repurchase Agreements | 2,560,000 | |||||||
|
| |||||||
TOTAL INVESTMENTS | 100.5 | % | 203,162,981 | |||||
Liabilities in excess of other assets | (0.5 | ) | (1,073,933 | ) | ||||
|
|
|
| |||||
NET ASSETS | 100.0 | % | $ | 202,089,048 | ||||
|
|
|
| |||||
| # | See Note 1 |
| † | Non-income producing security |
| (1) | Illiquid security. At December 31, 2017, the aggregate value of these securities was $0 representing 0.0% of net assets. |
| (2) | Securities classified as Level 3 (see Note 2). |
| (3) | See Note 2 for details of Joint Repurchase Agreements. |
| (4) | See Note 6 for cost of investments on a tax basis. |
| ||
| 36 |
Table of Contents
Anchor Series Trust SA Wellington Growth and Income Portfolio#
PORTFOLIO OF INVESTMENTS — December 31, 2017 — (continued)
The following is a summary of the inputs used to value the Portfolio’s net assets as of December 31, 2017 (see Note 2):
| Level 1 - Unadjusted Quoted Prices | Level 2 - Other Observable Inputs | Level 3 - Significant Unobservable Inputs | Total | |||||||||||||
ASSETS: | ||||||||||||||||
Investments at Value:* | ||||||||||||||||
Common Stocks: | ||||||||||||||||
Telecommunication Equipment | $ | — | $ | — | $ | 0 | $ | 0 | ||||||||
Other Industries | 200,602,981 | — | — | 200,602,981 | ||||||||||||
Repurchase Agreements | — | 2,560,000 | — | 2,560,000 | ||||||||||||
|
|
|
|
|
|
|
| |||||||||
Total Investments at Value | $ | 200,602,981 | $ | 2,560,000 | $ | 0 | $ | 203,162,981 | ||||||||
|
|
|
|
|
|
|
| |||||||||
| * | For a detailed presentation of investments, please refer to the Portfolio of Investments. |
The Portfolio’s policy is to recognize transfers between Levels as of the end of the reporting period. There were no transfers between Levels during the reporting period.
At the beginning and end of the reporting period, Level 3 investments in securities were not considered a material portion of the Portfolio.
See Notes to Financial Statements
| ||
| 37 |
Table of Contents
Anchor Series Trust SA Wellington Growth Portfolio#
PORTFOLIO PROFILE — December 31, 2017 — (unaudited)
Industry Allocation*
Medical-Drugs | 4.0 | % | ||
Banks-Super Regional | 3.9 | |||
Real Estate Investment Trusts | 3.6 | |||
Finance-Credit Card | 3.1 | |||
Insurance-Multi-line | 3.0 | |||
E-Commerce/Services | 2.7 | |||
Applications Software | 2.7 | |||
Commercial Services-Finance | 2.6 | |||
Oil Companies-Exploration & Production | 2.6 | |||
Transport-Rail | 2.6 | |||
Computer Services | 2.5 | |||
Beverages-Non-alcoholic | 2.3 | |||
Medical-Wholesale Drug Distribution | 2.3 | |||
Cosmetics & Toiletries | 2.1 | |||
Athletic Footwear | 2.1 | |||
Medical-Biomedical/Gene | 2.1 | |||
Diversified Banking Institutions | 1.8 | |||
Insurance Brokers | 1.7 | |||
Medical Instruments | 1.7 | |||
Semiconductor Components-Integrated Circuits | 1.6 | |||
Electric-Integrated | 1.6 | |||
Beverages-Wine/Spirits | 1.6 | |||
Retail-Restaurants | 1.5 | |||
Transport-Services | 1.4 | |||
Retail-Major Department Stores | 1.4 | |||
Exchange-Traded Funds | 1.4 | |||
Web Portals/ISP | 1.4 | |||
Apparel Manufacturers | 1.3 | |||
E-Commerce/Products | 1.3 | |||
Medical Products | 1.2 | |||
Repurchase Agreements | 1.2 | |||
Casino Hotels | 1.2 | |||
Medical-HMO | 1.1 | |||
Retail-Discount | 1.1 | |||
Commercial Services | 1.1 | |||
Medical-Generic Drugs | 1.0 | |||
Airlines | 1.0 | |||
Electronic Measurement Instruments | 1.0 | |||
Investment Management/Advisor Services | 1.0 | |||
Chemicals-Diversified | 0.9 | |||
Telephone-Integrated | 0.9 | |||
Insurance-Property/Casualty | 0.9 | |||
Tobacco | 0.9 | |||
Finance-Investment Banker/Broker | 0.8 | |||
Web Hosting/Design | 0.7 | |||
Steel-Producers | 0.7 | |||
E-Services/Consulting | 0.7 | |||
Office Furnishings-Original | 0.7 | |||
Containers-Paper/Plastic | 0.7 | |||
Food-Retail | 0.7 | |||
Instruments-Controls | 0.6 | |||
Retail-Automobile | 0.6 | |||
Retail-Apparel/Shoe | 0.6 | |||
Industrial Gases | 0.6 | |||
Aerospace/Defense | 0.6 | |||
Internet Content-Entertainment | 0.6 | |||
Enterprise Software/Service | 0.6 | |||
Independent Power Producers | 0.5 | |||
Insurance-Life/Health | 0.5 | |||
Oil-Field Services | 0.5 | |||
Insurance-Reinsurance | 0.5 |
Diversified Manufacturing Operations | 0.5 | % | ||
Non-Hazardous Waste Disposal | 0.5 | |||
Computers-Memory Devices | 0.4 | |||
Semiconductor Equipment | 0.4 | |||
Retail-Drug Store | 0.4 | |||
Computers | 0.4 | |||
Electronic Forms | 0.4 | |||
Auto-Cars/Light Trucks | 0.4 | |||
Electronic Components-Semiconductors | 0.4 | |||
Building Products-Doors & Windows | 0.4 | |||
Food-Confectionery | 0.4 | |||
Food-Misc./Diversified | 0.3 | |||
Tools-Hand Held | 0.3 | |||
Building Products-Cement | 0.3 | |||
Gas-Distribution | 0.3 | |||
Diagnostic Equipment | 0.3 | |||
Multimedia | 0.3 | |||
Banks-Commercial | 0.3 | |||
Data Processing/Management | 0.3 | |||
Building Products-Air & Heating | 0.3 | |||
Oil Refining & Marketing | 0.3 | |||
Finance-Consumer Loans | 0.2 | |||
Hotels/Motels | 0.2 | |||
Human Resources | 0.2 | |||
Coatings/Paint | 0.2 | |||
Industrial Automated/Robotic | 0.2 | |||
Medical-Hospitals | 0.2 | |||
Telecom Equipment-Fiber Optics | 0.2 | |||
Steel Pipe & Tube | 0.2 | |||
Networking Products | 0.2 | |||
Disposable Medical Products | 0.2 | |||
Satellite Telecom | 0.2 | |||
Garden Products | 0.2 | |||
Metal-Copper | 0.2 | |||
Transport-Truck | 0.2 | |||
Chemicals-Specialty | 0.2 | |||
Machinery-General Industrial | 0.2 | |||
|
| |||
| 100.4 | % | |||
|
| |||
| # | See Note 1 |
| * | Calculated as a percentage of net assets |
| ||
| 38 |
Table of Contents
Anchor Series Trust SA Wellington Growth Portfolio#
PORTFOLIO OF INVESTMENTS — December 31, 2017
| Security Description | Shares | Value | ||||||
COMMON STOCKS — 97.8% |
| |||||||
Aerospace/Defense — 0.6% |
| |||||||
Lockheed Martin Corp. | 7,500 | $ | 2,407,875 | |||||
|
| |||||||
Airlines — 1.0% |
| |||||||
Alaska Air Group, Inc. | 36,754 | 2,701,787 | ||||||
Delta Air Lines, Inc. | 25,400 | 1,422,400 | ||||||
|
| |||||||
| 4,124,187 | ||||||||
|
| |||||||
Apparel Manufacturers — 1.3% |
| |||||||
Carter’s, Inc. | 8,948 | 1,051,300 | ||||||
Global Brands Group Holding, Ltd.† | 4,668,000 | 381,721 | ||||||
Under Armour, Inc., Class A† | 68,000 | 981,240 | ||||||
Under Armour, Inc., Class C† | 88,046 | 1,172,773 | ||||||
VF Corp. | 21,874 | 1,618,676 | ||||||
|
| |||||||
| 5,205,710 | ||||||||
|
| |||||||
Applications Software — 2.7% |
| |||||||
Microsoft Corp. | 76,927 | 6,580,336 | ||||||
salesforce.com, Inc.† | 11,593 | 1,185,152 | ||||||
ServiceNow, Inc.† | 23,104 | 3,012,531 | ||||||
|
| |||||||
| 10,778,019 | ||||||||
|
| |||||||
Athletic Footwear — 2.1% |
| |||||||
NIKE, Inc., Class B | 134,323 | 8,401,904 | ||||||
|
| |||||||
Auto-Cars/Light Trucks — 0.4% |
| |||||||
General Motors Co. | 38,860 | 1,592,871 | ||||||
|
| |||||||
Banks-Commercial — 0.3% |
| |||||||
Bank of the Ozarks | 23,500 | 1,138,575 | ||||||
|
| |||||||
Banks-Super Regional — 3.9% |
| |||||||
Capital One Financial Corp. | 8,641 | 860,471 | ||||||
PNC Financial Services Group, Inc. | 67,045 | 9,673,923 | ||||||
Wells Fargo & Co. | 79,966 | 4,851,537 | ||||||
|
| |||||||
| 15,385,931 | ||||||||
|
| |||||||
Beverages-Non-alcoholic — 2.3% |
| |||||||
Coca-Cola Co. | 106,894 | 4,904,297 | ||||||
Monster Beverage Corp.† | 68,826 | 4,355,997 | ||||||
|
| |||||||
| 9,260,294 | ||||||||
|
| |||||||
Beverages-Wine/Spirits — 1.6% |
| |||||||
Constellation Brands, Inc., Class A | 6,066 | 1,386,505 | ||||||
Diageo PLC | 133,913 | 4,900,994 | ||||||
|
| |||||||
| 6,287,499 | ||||||||
|
| |||||||
Building Products-Air & Heating — 0.3% |
| |||||||
Lennox International, Inc. | 4,855 | 1,011,102 | ||||||
|
| |||||||
Building Products-Cement — 0.3% |
| |||||||
CRH PLC | 34,825 | 1,248,148 | ||||||
|
| |||||||
Building Products-Doors & Windows — 0.4% |
| |||||||
Sanwa Holdings Corp. | 103,800 | 1,429,287 | ||||||
|
| |||||||
Casino Hotels — 1.2% |
| |||||||
Las Vegas Sands Corp. | 22,507 | 1,564,011 | ||||||
Wynn Resorts, Ltd. | 18,520 | 3,122,287 | ||||||
|
| |||||||
| 4,686,298 | ||||||||
|
| |||||||
Chemicals-Diversified — 0.9% |
| |||||||
Celanese Corp., Series A | 20,881 | 2,235,937 | ||||||
PPG Industries, Inc. | 11,824 | 1,381,280 | ||||||
|
| |||||||
| 3,617,217 | ||||||||
|
| |||||||
Chemicals-Specialty — 0.2% |
| |||||||
Cabot Corp. | 10,700 | 659,013 | ||||||
|
| |||||||
| Security Description | Shares | Value | ||||||
Coatings/Paint — 0.2% |
| |||||||
Sherwin-Williams Co. | 2,298 | $ | 942,272 | |||||
|
| |||||||
Commercial Services — 1.1% |
| |||||||
CoStar Group, Inc.† | 10,153 | 3,014,933 | ||||||
Ecolab, Inc. | 8,850 | 1,187,493 | ||||||
|
| |||||||
| 4,202,426 | ||||||||
|
| |||||||
Commercial Services-Finance — 2.6% |
| |||||||
Equifax, Inc. | 3,860 | 455,171 | ||||||
FleetCor Technologies, Inc.† | 16,926 | 3,257,070 | ||||||
Global Payments, Inc. | 29,254 | 2,932,421 | ||||||
IHS Markit, Ltd.† | 18,375 | 829,631 | ||||||
TransUnion† | 54,830 | 3,013,457 | ||||||
|
| |||||||
| 10,487,750 | ||||||||
|
| |||||||
Computer Services — 2.5% |
| |||||||
Accenture PLC, Class A | 27,357 | 4,188,083 | ||||||
Amdocs, Ltd. | 13,965 | 914,428 | ||||||
Genpact, Ltd. | 149,372 | 4,741,068 | ||||||
|
| |||||||
| 9,843,579 | ||||||||
|
| |||||||
Computers — 0.4% |
| |||||||
Apple, Inc. | 10,144 | 1,716,669 | ||||||
|
| |||||||
Computers-Memory Devices — 0.4% |
| |||||||
Western Digital Corp. | 22,518 | 1,790,857 | ||||||
|
| |||||||
Containers-Paper/Plastic — 0.7% |
| |||||||
Packaging Corp. of America | 23,081 | 2,782,415 | ||||||
|
| |||||||
Cosmetics & Toiletries — 2.1% |
| |||||||
Colgate-Palmolive Co. | 74,754 | 5,640,189 | ||||||
Coty, Inc., Class A | 85,363 | 1,697,870 | ||||||
Estee Lauder Cos., Inc., Class A | 8,486 | 1,079,759 | ||||||
|
| |||||||
| 8,417,818 | ||||||||
|
| |||||||
Data Processing/Management — 0.3% |
| |||||||
Dun & Bradstreet Corp. | 9,131 | 1,081,202 | ||||||
|
| |||||||
Diagnostic Equipment — 0.3% |
| |||||||
Thermo Fisher Scientific, Inc. | 6,309 | 1,197,953 | ||||||
|
| |||||||
Disposable Medical Products — 0.2% |
| |||||||
STERIS PLC | 8,960 | 783,731 | ||||||
|
| |||||||
Diversified Banking Institutions — 1.8% |
| |||||||
Citigroup, Inc. | 60,578 | 4,507,609 | ||||||
JPMorgan Chase & Co. | 25,599 | 2,737,557 | ||||||
|
| |||||||
| 7,245,166 | ||||||||
|
| |||||||
Diversified Manufacturing Operations — 0.5% |
| |||||||
A.O. Smith Corp. | 11,350 | 695,528 | ||||||
Eaton Corp. PLC | 15,607 | 1,233,109 | ||||||
|
| |||||||
| 1,928,637 | ||||||||
|
| |||||||
E-Commerce/Products — 1.3% |
| |||||||
Alibaba Group Holding, Ltd. ADR† | 12,745 | 2,197,621 | ||||||
Amazon.com, Inc.† | 1,151 | 1,346,060 | ||||||
Delivery Hero AG†* | 38,730 | 1,531,911 | ||||||
|
| |||||||
| 5,075,592 | ||||||||
|
| |||||||
E-Commerce/Services — 2.7% |
| |||||||
Expedia, Inc. | 30,096 | 3,604,598 | ||||||
Just Eat PLC† | 176,709 | 1,853,741 | ||||||
Priceline Group, Inc.† | 1,548 | 2,690,021 | ||||||
Zillow Group, Inc., Class A† | 68,278 | 2,781,646 | ||||||
|
| |||||||
| 10,930,006 | ||||||||
|
| |||||||
| ||
| 39 |
Table of Contents
Anchor Series Trust SA Wellington Growth Portfolio#
PORTFOLIO OF INVESTMENTS — December 31, 2017 — (continued)
| Security Description | Shares | Value | ||||||
COMMON STOCKS (continued) |
| |||||||
E-Services/Consulting — 0.7% |
| |||||||
CDW Corp. | 41,297 | $ | 2,869,729 | |||||
|
| |||||||
Electric-Integrated — 1.6% |
| |||||||
Edison International | 27,954 | 1,767,811 | ||||||
Exelon Corp. | 57,373 | 2,261,070 | ||||||
Iberdrola SA | 137,917 | 1,067,291 | ||||||
OGE Energy Corp. | 40,299 | 1,326,240 | ||||||
|
| |||||||
| 6,422,412 | ||||||||
|
| |||||||
Electronic Components-Semiconductors — 0.4% |
| |||||||
NVIDIA Corp. | 2,362 | 457,047 | ||||||
Silicon Motion Technology Corp. ADR | 18,658 | 988,128 | ||||||
|
| |||||||
| 1,445,175 | ||||||||
|
| |||||||
Electronic Forms — 0.4% |
| |||||||
Adobe Systems, Inc.† | 9,294 | 1,628,681 | ||||||
|
| |||||||
Electronic Measurement Instruments — 1.0% |
| |||||||
Agilent Technologies, Inc. | 38,501 | 2,578,412 | ||||||
Keysight Technologies, Inc.† | 32,838 | 1,366,061 | ||||||
|
| |||||||
| 3,944,473 | ||||||||
|
| |||||||
Enterprise Software/Service — 0.6% |
| |||||||
Atlassian Corp. PLC, Class A† | 49,774 | 2,265,713 | ||||||
|
| |||||||
Finance-Consumer Loans — 0.2% |
| |||||||
SLM Corp.† | 88,071 | 995,202 | ||||||
|
| |||||||
Finance-Credit Card — 3.1% |
| |||||||
American Express Co. | 67,112 | 6,664,893 | ||||||
Mastercard, Inc., Class A | 13,998 | 2,118,737 | ||||||
Visa, Inc., Class A | 31,279 | 3,566,432 | ||||||
|
| |||||||
| 12,350,062 | ||||||||
|
| |||||||
Finance-Investment Banker/Broker — 0.8% |
| |||||||
TD Ameritrade Holding Corp. | 60,086 | 3,072,197 | ||||||
|
| |||||||
Food-Confectionery — 0.4% |
| |||||||
Hostess Brands, Inc.† | 40,390 | 598,176 | ||||||
Simply Good Foods Co.† | 57,276 | 816,756 | ||||||
|
| |||||||
| 1,414,932 | ||||||||
|
| |||||||
Food-Misc./Diversified — 0.3% |
| |||||||
Blue Buffalo Pet Products, Inc.† | 11,600 | 380,364 | ||||||
Campbell Soup Co. | 18,763 | 902,688 | ||||||
|
| |||||||
| 1,283,052 | ||||||||
|
| |||||||
Food-Retail — 0.7% |
| |||||||
Kroger Co. | 95,335 | 2,616,946 | ||||||
|
| |||||||
Garden Products — 0.2% |
| |||||||
Toro Co. | 10,708 | 698,483 | ||||||
|
| |||||||
Gas-Distribution — 0.3% |
| |||||||
Sempra Energy | 11,427 | 1,221,775 | ||||||
|
| |||||||
Hotels/Motels — 0.2% |
| |||||||
Hilton Worldwide Holdings, Inc. | 12,242 | 977,646 | ||||||
|
| |||||||
Human Resources — 0.2% |
| |||||||
AMN Healthcare Services, Inc.† | 19,449 | 957,863 | ||||||
|
| |||||||
Independent Power Producers — 0.5% |
| |||||||
NRG Energy, Inc. | 75,245 | 2,142,978 | ||||||
|
| |||||||
Industrial Automated/Robotic — 0.2% |
| |||||||
Nordson Corp. | 6,376 | 933,446 | ||||||
|
| |||||||
| Security Description | Shares | Value | ||||||
Industrial Gases — 0.6% |
| |||||||
Praxair, Inc. | 15,845 | $ | 2,450,905 | |||||
|
| |||||||
Instruments-Controls — 0.6% |
| |||||||
Mettler-Toledo International, Inc.† | 4,151 | 2,571,628 | ||||||
|
| |||||||
Insurance Brokers — 1.7% |
| |||||||
Arthur J. Gallagher & Co. | 50,601 | 3,202,031 | ||||||
Marsh & McLennan Cos., Inc. | 42,738 | 3,478,446 | ||||||
|
| |||||||
| 6,680,477 | ||||||||
|
| |||||||
Insurance-Life/Health — 0.5% |
| |||||||
Brighthouse Financial, Inc.† | 8,957 | 525,239 | ||||||
Principal Financial Group, Inc. | 14,816 | 1,045,417 | ||||||
Unum Group | 9,715 | 533,256 | ||||||
|
| |||||||
| 2,103,912 | ||||||||
|
| |||||||
Insurance-Multi-line — 3.0% |
| |||||||
Chubb, Ltd. | 50,530 | 7,383,949 | ||||||
MetLife, Inc. | 90,126 | 4,556,770 | ||||||
|
| |||||||
| 11,940,719 | ||||||||
|
| |||||||
Insurance-Property/Casualty — 0.9% |
| |||||||
Lancashire Holdings, Ltd. | 69,832 | 642,643 | ||||||
XL Group, Ltd. | 81,637 | 2,870,357 | ||||||
|
| |||||||
| 3,513,000 | ||||||||
|
| |||||||
Insurance-Reinsurance — 0.5% |
| |||||||
RenaissanceRe Holdings, Ltd. | 15,440 | 1,939,110 | ||||||
|
| |||||||
Internet Content-Entertainment — 0.6% |
| |||||||
Facebook, Inc., Class A† | 12,926 | 2,280,922 | ||||||
|
| |||||||
Investment Management/Advisor Services — 1.0% |
| |||||||
BlackRock, Inc. | 7,584 | 3,895,977 | ||||||
|
| |||||||
Machinery-General Industrial — 0.2% |
| |||||||
Middleby Corp.† | 4,561 | 615,507 | ||||||
|
| |||||||
Medical Instruments — 1.7% |
| |||||||
Medtronic PLC | 57,846 | 4,671,064 | ||||||
Teleflex, Inc. | 7,734 | 1,924,374 | ||||||
|
| |||||||
| 6,595,438 | ||||||||
|
| |||||||
Medical Products — 1.2% |
| |||||||
Baxter International, Inc. | 61,119 | 3,950,732 | ||||||
West Pharmaceutical Services, Inc. | 8,898 | 877,966 | ||||||
|
| |||||||
| 4,828,698 | ||||||||
|
| |||||||
Medical-Biomedical/Gene — 2.1% |
| |||||||
Alnylam Pharmaceuticals, Inc.† | 18,185 | 2,310,404 | ||||||
BeiGene, Ltd. ADR† | 16,156 | 1,578,764 | ||||||
Biogen, Inc.† | 3,557 | 1,133,154 | ||||||
Ionis Pharmaceuticals, Inc.† | 51,024 | 2,566,507 | ||||||
Regeneron Pharmaceuticals, Inc.† | 1,725 | 648,531 | ||||||
|
| |||||||
| 8,237,360 | ||||||||
|
| |||||||
Medical-Drugs — 4.0% |
| |||||||
Alkermes PLC† | 51,626 | 2,825,491 | ||||||
Allergan PLC | 14,430 | 2,360,459 | ||||||
Bristol-Myers Squibb Co. | 125,600 | 7,696,768 | ||||||
Eli Lilly & Co. | 8,963 | 757,015 | ||||||
Merck & Co., Inc. | 42,174 | 2,373,131 | ||||||
|
| |||||||
| 16,012,864 | ||||||||
|
| |||||||
Medical-Generic Drugs — 1.0% |
| |||||||
Mylan NV† | 55,534 | 2,349,643 | ||||||
| ||
| 40 |
Table of Contents
Anchor Series Trust SA Wellington Growth Portfolio#
PORTFOLIO OF INVESTMENTS — December 31, 2017 — (continued)
| Security Description | Shares | Value | ||||||
COMMON STOCKS (continued) |
| |||||||
Medical-Generic Drugs (continued) |
| |||||||
Teva Pharmaceutical Industries, Ltd. ADR | 96,186 | $ | 1,822,725 | |||||
|
| |||||||
| 4,172,368 | ||||||||
|
| |||||||
Medical-HMO — 1.1% |
| |||||||
Aetna, Inc. | 8,885 | 1,602,765 | ||||||
UnitedHealth Group, Inc. | 13,359 | 2,945,125 | ||||||
|
| |||||||
| 4,547,890 | ||||||||
|
| |||||||
Medical-Hospitals — 0.2% |
| |||||||
Envision Healthcare Corp.† | 25,680 | 887,501 | ||||||
|
| |||||||
Medical-Wholesale Drug Distribution — 2.3% |
| |||||||
Cardinal Health, Inc. | 58,617 | 3,591,464 | ||||||
McKesson Corp. | 36,234 | 5,650,692 | ||||||
|
| |||||||
| 9,242,156 | ||||||||
|
| |||||||
Metal-Copper — 0.2% |
| |||||||
Southern Copper Corp. | 14,454 | 685,842 | ||||||
|
| |||||||
Multimedia — 0.3% |
| |||||||
Walt Disney Co. | 10,683 | 1,148,529 | ||||||
|
| |||||||
Networking Products — 0.2% |
| |||||||
Cisco Systems, Inc. | 20,870 | 799,321 | ||||||
|
| |||||||
Non-Hazardous Waste Disposal — 0.5% |
| |||||||
Waste Connections, Inc. | 25,544 | 1,812,091 | ||||||
|
| |||||||
Office Furnishings-Original — 0.7% |
| |||||||
Herman Miller, Inc. | 35,944 | 1,439,557 | ||||||
Steelcase, Inc., Class A | 90,828 | 1,380,586 | ||||||
|
| |||||||
| 2,820,143 | ||||||||
|
| |||||||
Oil Companies-Exploration & Production — 2.6% |
| |||||||
Anadarko Petroleum Corp. | 36,091 | 1,935,921 | ||||||
Canadian Natural Resources, Ltd. | 44,289 | 1,582,003 | ||||||
Cimarex Energy Co. | 13,730 | 1,675,197 | ||||||
Diamondback Energy, Inc.† | 9,796 | 1,236,745 | ||||||
Hess Corp. | 16,470 | 781,831 | ||||||
Laredo Petroleum, Inc.† | 81,506 | 864,779 | ||||||
Marathon Oil Corp. | 56,539 | 957,205 | ||||||
Pioneer Natural Resources Co. | 6,212 | 1,073,744 | ||||||
Southwestern Energy Co.† | 66,432 | 370,691 | ||||||
|
| |||||||
| 10,478,116 | ||||||||
|
| |||||||
Oil Refining & Marketing — 0.3% |
| |||||||
HollyFrontier Corp. | 19,579 | 1,002,836 | ||||||
|
| |||||||
Oil-Field Services — 0.5% |
| |||||||
Halliburton Co. | 40,224 | 1,965,747 | ||||||
|
| |||||||
Real Estate Investment Trusts — 3.6% |
| |||||||
American Tower Corp. | 8,502 | 1,212,980 | ||||||
Columbia Property Trust, Inc. | 50,454 | 1,157,919 | ||||||
Education Realty Trust, Inc. | 32,153 | 1,122,783 | ||||||
Host Hotels & Resorts, Inc. | 98,872 | 1,962,609 | ||||||
Public Storage | 23,847 | 4,984,023 | ||||||
Simon Property Group, Inc. | 5,933 | 1,018,933 | ||||||
STORE Capital Corp. | 83,412 | 2,172,049 | ||||||
Taubman Centers, Inc. | 9,923 | 649,262 | ||||||
|
| |||||||
| 14,280,558 | ||||||||
|
| |||||||
Retail-Apparel/Shoe — 0.6% |
| |||||||
L Brands, Inc. | 18,895 | 1,137,857 | ||||||
| Security Description | Shares | Value | ||||||
Retail-Apparel/Shoe (continued) |
| |||||||
Tapestry, Inc. | 30,495 | $ | 1,348,794 | |||||
|
| |||||||
| 2,486,651 | ||||||||
|
| |||||||
Retail-Automobile — 0.6% |
| |||||||
CarMax, Inc.† | 40,058 | 2,568,920 | ||||||
|
| |||||||
Retail-Discount — 1.1% |
| |||||||
Costco Wholesale Corp. | 23,780 | 4,425,934 | ||||||
|
| |||||||
Retail-Drug Store — 0.4% |
| |||||||
Walgreens Boots Alliance, Inc. | 24,336 | 1,767,280 | ||||||
|
| |||||||
Retail-Major Department Stores — 1.4% |
| |||||||
TJX Cos., Inc. | 73,436 | 5,614,917 | ||||||
|
| |||||||
Retail-Restaurants — 1.5% |
| |||||||
Dunkin’ Brands Group, Inc. | 14,998 | 966,921 | ||||||
McDonald’s Corp. | 25,115 | 4,322,794 | ||||||
Starbucks Corp. | 15,256 | 876,152 | ||||||
|
| |||||||
| 6,165,867 | ||||||||
|
| |||||||
Satellite Telecom — 0.2% |
| |||||||
SES SA FDR | 44,865 | 699,126 | ||||||
|
| |||||||
Semiconductor Components-Integrated Circuits — 1.6% |
| |||||||
Marvell Technology Group, Ltd. | 109,674 | 2,354,701 | ||||||
QUALCOMM, Inc. | 64,721 | 4,143,438 | ||||||
|
| |||||||
| 6,498,139 | ||||||||
|
| |||||||
Semiconductor Equipment — 0.4% |
| |||||||
KLA-Tencor Corp. | 17,004 | 1,786,610 | ||||||
|
| |||||||
Steel Pipe & Tube — 0.2% |
| |||||||
Tenaris SA ADR | 26,600 | 847,476 | ||||||
|
| |||||||
Steel-Producers — 0.7% |
| |||||||
Reliance Steel & Aluminum Co. | 33,846 | 2,903,648 | ||||||
|
| |||||||
Telecom Equipment-Fiber Optics — 0.2% |
| |||||||
Acacia Communications, Inc.† | 24,204 | 876,911 | ||||||
|
| |||||||
Telephone-Integrated — 0.9% |
| |||||||
Nippon Telegraph & Telephone Corp. | 19,800 | 931,700 | ||||||
Verizon Communications, Inc. | 50,442 | 2,669,895 | ||||||
|
| |||||||
| 3,601,595 | ||||||||
|
| |||||||
Tobacco — 0.9% |
| |||||||
Altria Group, Inc. | 11,874 | 847,922 | ||||||
British American Tobacco PLC | 37,831 | 2,553,232 | ||||||
|
| |||||||
| 3,401,154 | ||||||||
|
| |||||||
Tools-Hand Held — 0.3% |
| |||||||
Snap-on, Inc. | 7,251 | 1,263,849 | ||||||
|
| |||||||
Transport-Rail — 2.6% |
| |||||||
Canadian National Railway Co. | 51,227 | 4,224,088 | ||||||
Genesee & Wyoming, Inc., Class A† | 24,504 | 1,929,200 | ||||||
Union Pacific Corp. | 32,116 | 4,306,755 | ||||||
|
| |||||||
| 10,460,043 | ||||||||
|
| |||||||
Transport-Services — 1.4% |
| |||||||
United Parcel Service, Inc., Class B | 48,202 | 5,743,268 | ||||||
|
| |||||||
Transport-Truck — 0.2% |
| |||||||
JB Hunt Transport Services, Inc. | 5,895 | 677,807 | ||||||
|
| |||||||
Web Hosting/Design — 0.7% |
| |||||||
VeriSign, Inc.† | 26,021 | 2,977,843 | ||||||
|
| |||||||
Web Portals/ISP — 1.4% |
| |||||||
Alphabet, Inc., Class C† | 2,265 | 2,370,096 | ||||||
| ||
| 41 |
Table of Contents
Anchor Series Trust SA Wellington Growth Portfolio#
PORTFOLIO OF INVESTMENTS — December 31, 2017 — (continued)
| Security Description | Shares/ Principal Amount | Value (Note 2) | ||||||
COMMON STOCKS (continued) |
| |||||||
Web Portals/ISP (continued) |
| |||||||
Yandex NV, Class A† | 92,572 | $ | 3,031,733 | |||||
|
| |||||||
| 5,401,829 | ||||||||
|
| |||||||
Total Common Stocks | 390,579,250 | |||||||
|
| |||||||
EXCHANGE-TRADED FUNDS — 1.4% |
| |||||||
Vanguard S&P 500 ETF | 22,804 | 5,593,593 | ||||||
|
| |||||||
Total Long-Term Investment Securities | 396,172,843 | |||||||
|
| |||||||
REPURCHASE AGREEMENTS — 1.2% |
| |||||||
Bank of America Securities LLC Joint Repurchase Agreement(1) | $ | 720,000 | 720,000 | |||||
Barclays Capital, Inc. Joint Repurchase Agreement(1) | 800,000 | 800,000 | ||||||
BNP Paribas SA Joint Repurchase Agreement(1) | 1,370,000 | 1,370,000 | ||||||
Deutsche Bank AG Joint Repurchase Agreement(1) | 530,000 | 530,000 | ||||||
RBS Securities, Inc. Joint Repurchase Agreement(1) | 1,280,000 | 1,280,000 | ||||||
|
| |||||||
Total Repurchase Agreements | 4,700,000 | |||||||
|
| |||||||
TOTAL INVESTMENTS | 100.4 | % | 400,872,843 | |||||
Liabilities in excess of other assets | (0.4 | ) | (1,516,005 | ) | ||||
|
|
|
| |||||
NET ASSETS | 100.0 | % | $ | 399,356,838 | ||||
|
|
|
| |||||
| # | See Note 1 |
| † | Non-income producing security |
| * | Securities exempt from registration under Rule 144A of the Securities Act of 1933. These securities may be sold in transactions exempt from registration, normally to qualified institutional buyers. The Portfolio has no right to demand registration of these securities. At December 31, 2017, the aggregate value of these securities was $1,531,911 representing 0.4% of net assets. Unless otherwise indicated, these securities are not considered to be illiquid. |
| (1) | See Note 2 for details of Joint Repurchase Agreements. |
| (2) | See Note 6 for cost of investments on a tax basis. |
ADR — American Depositary Receipt
ETF — Exchange-Traded Funds
FDR — Fiduciary Depositary Receipt
The following is a summary of the inputs used to value the Portfolio’s net assets as of December 31, 2017 (see Note 2):
| Level 1 - Unadjusted Quoted Prices | Level 2 - Other Observable Inputs | Level 3 - Significant Unobservable Inputs | Total | |||||||||||||
ASSETS: | ||||||||||||||||
Investments at Value:* | ||||||||||||||||
Common Stocks | $ | 373,339,456 | $ | 17,239,794 | ** | $ | — | $ | 390,579,250 | |||||||
Exchange-Traded Funds | 5,593,593 | — | — | 5,593,593 | ||||||||||||
Repurchase Agreements | — | 4,700,000 | — | 4,700,000 | ||||||||||||
|
|
|
|
|
|
|
| |||||||||
Total Investments at Value | $ | 378,933,049 | $ | 21,939,794 | $ | — | $ | 400,872,843 | ||||||||
|
|
|
|
|
|
|
| |||||||||
| * | For a detailed presentation of investments, please refer to the Portfolio of Investments. |
| ** | Represents foreign equity securities that have been fair valued in accordance with pricing procedures approved by Board (see Note 2). |
The Portfolio’s policy is to recognize transfers between Levels as of the end of the reporting period. Securities currently valued at $10,164,246 were transferred from Level 1 to Level 2 due to foreign equity securities whose values were adjusted for fair value pricing procedures for foreign equity securities. There were no additional transfers between Levels during the reporting period.
See Notes to Financial Statements
| ||
| 42 |
Table of Contents
Anchor Series Trust SA Wellington Capital Appreciation Portfolio#
PORTFOLIO PROFILE — December 31, 2017 — (unaudited)
Industry Allocation*
Internet Content-Entertainment | 8.0 | % | ||
Electronic Components-Semiconductors | 7.8 | |||
Web Portals/ISP | 7.0 | |||
Applications Software | 6.1 | |||
Enterprise Software/Service | 5.2 | |||
E-Commerce/Services | 4.2 | |||
Casino Hotels | 3.3 | |||
Commercial Services-Finance | 3.3 | |||
Medical-Biomedical/Gene | 3.2 | |||
Medical Products | 3.2 | |||
Medical-Drugs | 2.7 | |||
Electronic Forms | 2.6 | |||
Machinery-General Industrial | 2.2 | |||
Finance-Investment Banker/Broker | 2.2 | |||
Hotels/Motels | 2.2 | |||
Retail-Discount | 2.2 | |||
Commercial Services | 2.1 | |||
Airlines | 2.0 | |||
Finance-Credit Card | 1.9 | |||
Medical Instruments | 1.7 | |||
Networking Products | 1.7 | |||
E-Commerce/Products | 1.3 | |||
Dental Supplies & Equipment | 1.3 | |||
Transport-Rail | 1.3 | |||
Food-Misc./Diversified | 1.2 | |||
Apparel Manufacturers | 1.2 | |||
Patient Monitoring Equipment | 1.2 | |||
Web Hosting/Design | 1.2 | |||
Resorts/Theme Parks | 1.1 | |||
Industrial Automated/Robotic | 1.1 | |||
X-Ray Equipment | 1.1 | |||
Beverages-Non-alcoholic | 1.1 | |||
Electric Products-Misc. | 1.1 | |||
Semiconductor Equipment | 1.1 | |||
Transport-Truck | 1.1 | |||
Machinery-Farming | 1.0 | |||
Paper & Related Products | 1.0 | |||
Drug Delivery Systems | 1.0 | |||
Diversified Banking Institutions | 1.0 | |||
Retail-Restaurants | 1.0 | |||
Aerospace/Defense-Equipment | 1.0 | |||
Banks-Commercial | 0.8 | |||
Containers-Paper/Plastic | 0.7 | |||
Recreational Centers | 0.7 | |||
Lighting Products & Systems | 0.6 | |||
Oil Companies-Exploration & Production | 0.5 | |||
Oil-Field Services | 0.5 | |||
Repurchase Agreements | 0.4 | |||
Computer Software | 0.3 | |||
Entertainment Software | 0.2 | |||
Advertising Services | 0.1 | |||
|
| |||
| 100.9 | % | |||
|
|
| # | See Note 1 |
| * | Calculated as a percentage of net assets |
| ||
| 43 |
Table of Contents
Anchor Series Trust SA Wellington Capital Appreciation Portfolio#
PORTFOLIO OF INVESTMENTS — December 31, 2017
| Security Description | Shares | Value (Note 2) | ||||||
COMMON STOCKS — 97.6% |
| |||||||
Aerospace/Defense-Equipment — 1.0% |
| |||||||
Harris Corp. | 95,696 | $ | 13,555,338 | |||||
|
| |||||||
Airlines — 2.0% |
| |||||||
JetBlue Airways Corp.† | 1,178,846 | 26,335,420 | ||||||
|
| |||||||
Apparel Manufacturers — 1.2% |
| |||||||
Under Armour, Inc., Class A† | 674,736 | 9,736,440 | ||||||
Under Armour, Inc., Class C† | 503,099 | 6,701,279 | ||||||
|
| |||||||
| 16,437,719 | ||||||||
|
| |||||||
Applications Software — 5.9% |
| |||||||
Dropbox, Inc., Class B†(1)(2)(3) | 200,477 | 2,467,872 | ||||||
salesforce.com, Inc.† | 393,443 | 40,221,678 | ||||||
ServiceNow, Inc.† | 285,712 | 37,253,987 | ||||||
|
| |||||||
| 79,943,537 | ||||||||
|
| |||||||
Banks-Commercial — 0.8% |
| |||||||
BB&T Corp. | 230,035 | 11,437,340 | ||||||
|
| |||||||
Beverages-Non-alcoholic — 1.1% |
| |||||||
Monster Beverage Corp.† | 232,583 | 14,720,178 | ||||||
|
| |||||||
Casino Hotels — 3.3% |
| |||||||
Melco Resorts & Entertainment, Ltd. ADR | 962,275 | 27,944,466 | ||||||
Wynn Resorts, Ltd. | 99,928 | 16,846,862 | ||||||
|
| |||||||
| 44,791,328 | ||||||||
|
| |||||||
Commercial Services — 2.1% |
| |||||||
CoStar Group, Inc.† | 96,619 | 28,691,012 | ||||||
|
| |||||||
Commercial Services-Finance — 3.3% |
| |||||||
PayPal Holdings, Inc.† | 453,038 | 33,352,657 | ||||||
TransUnion† | 193,227 | 10,619,756 | ||||||
|
| |||||||
| 43,972,413 | ||||||||
|
| |||||||
Containers-Paper/Plastic — 0.7% |
| |||||||
Packaging Corp. of America | 80,154 | 9,662,565 | ||||||
|
| |||||||
Dental Supplies & Equipment — 1.3% |
| |||||||
Align Technology, Inc.† | 77,649 | 17,252,831 | ||||||
|
| |||||||
Diversified Banking Institutions — 1.0% |
| |||||||
Bank of America Corp. | 461,561 | 13,625,281 | ||||||
|
| |||||||
Drug Delivery Systems — 1.0% |
| |||||||
DexCom, Inc.† | 237,928 | 13,654,688 | ||||||
|
| |||||||
E-Commerce/Products — 1.1% |
| |||||||
The Honest Co., Inc.†(1)(2)(3) | 41,843 | 739,784 | ||||||
Wayfair, Inc., Class A† | 174,130 | 13,977,415 | ||||||
|
| |||||||
| 14,717,199 | ||||||||
|
| |||||||
E-Commerce/Services — 2.3% |
| |||||||
Priceline Group, Inc.† | 10,744 | 18,670,279 | ||||||
Zillow Group, Inc., Class C† | 301,549 | 12,339,385 | ||||||
|
| |||||||
| 31,009,664 | ||||||||
|
| |||||||
Electric Products-Misc. — 1.1% |
| |||||||
Emerson Electric Co. | 210,661 | 14,680,965 | ||||||
|
| |||||||
Electronic Components-Semiconductors — 7.8% |
| |||||||
Cavium, Inc.† | 61,613 | 5,165,018 | ||||||
IPG Photonics Corp.† | 24,744 | 5,298,433 | ||||||
Microchip Technology, Inc. | 320,883 | 28,199,198 | ||||||
Micron Technology, Inc.† | 659,891 | 27,134,718 | ||||||
NVIDIA Corp. | 204,919 | 39,651,826 | ||||||
|
| |||||||
| 105,449,193 | ||||||||
|
| |||||||
| Security Description | Shares | Value (Note 2) | ||||||
Electronic Forms — 2.6% |
| |||||||
Adobe Systems, Inc.† | 202,742 | $ | 35,528,508 | |||||
DocuSign, Inc. CVR†(1)(2)(3) | 55,398 | 0 | ||||||
|
| |||||||
| 35,528,508 | ||||||||
|
| |||||||
Enterprise Software/Service — 5.2% |
| |||||||
Guidewire Software, Inc.† | 347,342 | 25,793,617 | ||||||
Veeva Systems, Inc., Class A† | 145,467 | 8,041,416 | ||||||
Workday, Inc., Class A† | 356,983 | 36,319,450 | ||||||
|
| |||||||
| 70,154,483 | ||||||||
|
| |||||||
Entertainment Software — 0.2% |
| |||||||
DraftKings, Inc.†(1)(2)(3) | 1,438,464 | 2,042,619 | ||||||
|
| |||||||
Finance-Credit Card — 1.9% |
| |||||||
American Express Co. | 262,958 | 26,114,359 | ||||||
|
| |||||||
Finance-Investment Banker/Broker — 2.2% |
| |||||||
TD Ameritrade Holding Corp. | 585,559 | 29,939,632 | ||||||
|
| |||||||
Food-Misc./Diversified — 1.2% |
| |||||||
Blue Buffalo Pet Products, Inc.† | 507,542 | 16,642,302 | ||||||
|
| |||||||
Hotels/Motels — 2.2% |
| |||||||
Hilton Worldwide Holdings, Inc. | 369,039 | 29,471,455 | ||||||
|
| |||||||
Industrial Automated/Robotic — 1.1% |
| |||||||
Rockwell Automation, Inc. | 77,610 | 15,238,724 | ||||||
|
| |||||||
Internet Content-Entertainment — 8.0% |
| |||||||
Facebook, Inc., Class A† | 440,539 | 77,737,512 | ||||||
Netflix, Inc.† | 156,856 | 30,110,078 | ||||||
|
| |||||||
| 107,847,590 | ||||||||
|
| |||||||
Lighting Products & Systems — 0.6% |
| |||||||
Universal Display Corp. | 43,648 | 7,535,827 | ||||||
|
| |||||||
Machinery-Farming — 1.0% |
| |||||||
Deere & Co. | 89,832 | 14,059,606 | ||||||
|
| |||||||
Machinery-General Industrial — 2.2% |
| |||||||
IDEX Corp. | 140,131 | 18,493,088 | ||||||
Middleby Corp.† | 85,556 | 11,545,782 | ||||||
|
| |||||||
| 30,038,870 | ||||||||
|
| |||||||
Medical Instruments — 1.7% |
| |||||||
Edwards Lifesciences Corp.† | 134,643 | 15,175,612 | ||||||
Intuitive Surgical, Inc.† | 21,476 | 7,837,451 | ||||||
|
| |||||||
| 23,013,063 | ||||||||
|
| |||||||
Medical Products — 3.2% |
| |||||||
Baxter International, Inc. | 431,231 | 27,874,772 | ||||||
Hologic, Inc.† | 349,189 | 14,927,830 | ||||||
|
| |||||||
| 42,802,602 | ||||||||
|
| |||||||
Medical-Biomedical/Gene — 3.2% |
| |||||||
Exact Sciences Corp.† | 439,389 | 23,085,498 | ||||||
Ionis Pharmaceuticals, Inc.† | 267,402 | 13,450,321 | ||||||
Vertex Pharmaceuticals, Inc.† | 43,308 | 6,490,137 | ||||||
|
| |||||||
| 43,025,956 | ||||||||
|
| |||||||
Medical-Drugs — 2.7% |
| |||||||
Bristol-Myers Squibb Co. | 347,545 | 21,297,558 | ||||||
Eisai Co., Ltd. | 206,697 | 11,703,057 | ||||||
TESARO, Inc.† | 44,834 | 3,715,393 | ||||||
|
| |||||||
| 36,716,008 | ||||||||
|
| |||||||
Networking Products — 1.7% |
| |||||||
Arista Networks, Inc.† | 97,078 | 22,869,635 | ||||||
|
| |||||||
| ||
| 44 |
Table of Contents
Anchor Series Trust SA Wellington Capital Appreciation Portfolio#
PORTFOLIO OF INVESTMENTS — December 31, 2017 — (continued)
| Security Description | Shares | Value (Note 2) | ||||||
COMMON STOCKS (continued) |
| |||||||
Oil Companies-Exploration & Production — 0.5% |
| |||||||
Newfield Exploration Co.† | 234,799 | $ | 7,403,212 | |||||
|
| |||||||
Oil-Field Services — 0.5% |
| |||||||
Baker Hughes a GE Co., LLC | 204,989 | 6,485,852 | ||||||
|
| |||||||
Paper & Related Products — 1.0% |
| |||||||
International Paper Co. | 241,683 | 14,003,113 | ||||||
|
| |||||||
Patient Monitoring Equipment — 1.2% |
| |||||||
Insulet Corp.† | 232,123 | 16,016,487 | ||||||
|
| |||||||
Recreational Centers — 0.7% |
| |||||||
Planet Fitness, Inc., Class A† | 277,694 | 9,616,543 | ||||||
|
| |||||||
Resort/Theme Parks — 1.1% |
| |||||||
Marriott Vacations Worldwide Corp. | 114,051 | 15,420,836 | ||||||
|
| |||||||
Retail-Discount — 2.2% |
| |||||||
Dollar Tree, Inc.† | 270,385 | 29,015,014 | ||||||
|
| |||||||
Retail-Restaurants — 1.0% |
| |||||||
Dave & Buster’s Entertainment, Inc.† | 246,319 | 13,589,419 | ||||||
|
| |||||||
Semiconductor Equipment — 1.1% |
| |||||||
Teradyne, Inc. | 350,501 | 14,675,477 | ||||||
|
| |||||||
Transport-Rail — 1.3% |
| |||||||
CSX Corp. | 307,709 | 16,927,072 | ||||||
|
| |||||||
Transport-Truck — 1.1% |
| |||||||
Knight-Swift Transportation Holdings, Inc. | 332,190 | 14,523,347 | ||||||
|
| |||||||
Web Hosting/Design — 1.2% |
| |||||||
GoDaddy, Inc., Class A† | 312,602 | 15,717,629 | ||||||
|
| |||||||
Web Portals/ISP — 6.8% |
| |||||||
Alphabet, Inc., Class C† | 87,104 | 91,145,626 | ||||||
|
| |||||||
Total Common Stocks | 1,317,517,537 | |||||||
|
| |||||||
CONVERTIBLE PREFERRED SECURITIES — 2.9% |
| |||||||
Advertising Services — 0.1% |
| |||||||
Nanigans, Inc., Series B†(1)(2)(3) | 126,818 | 713,985 | ||||||
|
| |||||||
Applications Software — 0.2% |
| |||||||
Magic Leap, Inc., Series C†(1)(2)(3) | 93,690 | 2,529,630 | ||||||
|
| |||||||
Computer Software — 0.3% |
| |||||||
Zuora, Inc., Series F†(1)(2)(3) | 732,120 | 3,902,200 | ||||||
|
| |||||||
E-Commerce/Products — 0.2% |
| |||||||
One Kings Lane Inc. Escrow†(1)(2)(3) | 291,563 | 72,891 | ||||||
The Honest Co., Inc., Series C†(1)(2)(3) | 97,634 | 2,979,789 | ||||||
|
| |||||||
| 3,052,680 | ||||||||
|
| |||||||
E-Commerce/Services — 1.9% |
| |||||||
Airbnb, Inc., Series E†(1)(2)(3) | 46,491 | 5,068,294 | ||||||
Uber Technologies, Inc., Series D†(1)(2)(3) | 599,808 | 20,866,541 | ||||||
|
| |||||||
| 25,934,835 | ||||||||
|
| |||||||
| Security Description | Shares/ Principal Amount | Value (Note 2) | ||||||
Web Portals/ISP — 0.2% |
| |||||||
Pinterest, Inc., Series G†(1)(2)(3) | 390,940 | $ | 2,623,207 | |||||
|
| |||||||
Total Convertible Preferred Securities | 38,756,537 | |||||||
|
| |||||||
Total Long-Term Investment Securities | 1,356,274,074 | |||||||
|
| |||||||
REPURCHASE AGREEMENTS — 0.4% |
| |||||||
Bank of America Securities LLC Joint Repurchase Agreement(4) | $ | 930,000 | 930,000 | |||||
Barclays Capital, Inc. Joint Repurchase Agreement(4) | 1,035,000 | 1,035,000 | ||||||
BNP Paribas SA Joint Repurchase Agreement(4) | 1,775,000 | 1,775,000 | ||||||
Deutsche Bank AG Joint Repurchase Agreement(4) | 685,000 | 685,000 | ||||||
RBS Securities, Inc. Joint Repurchase Agreement(4) | 1,660,000 | 1,660,000 | ||||||
|
| |||||||
Total Repurchase Agreements | 6,085,000 | |||||||
|
| |||||||
TOTAL INVESTMENTS | 100.9 | % | 1,362,359,074 | |||||
Liabilities in excess of other assets | (0.9 | ) | (12,309,343 | ) | ||||
|
|
|
| |||||
NET ASSETS | 100.0 | % | $ | 1,350,049,731 | ||||
|
|
|
| |||||
| # | See Note 1 |
| † | Non-income producing security |
| (1) | Securities classified as Level 3 (see Note 2). |
| (2) | Denotes a restricted security that: (a) cannot be offered for public sale without first being registered, or being able to take advantage of an exemption from registration, under the Securities Act of 1933, as amended (the “1933 Act”); (b) is subject to a contractual restriction on public sales; or (c) is otherwise subject to a restriction on sales by operation of applicable law. Restricted securities are valued pursuant to Note 2. Certain restricted securities held by the Portfolio may not be sold except in exempt transactions or in a public offering registered under the 1933 Act. The Portfolio has no right to demand registration of these securities. The risk of investing in certain restricted securities is greater than the risk of investing in the securities of widely held, publicly traded companies. To the extent applicable, lack of a secondary market and resale restrictions may result in the inability of a Portfolio to sell a security at a fair price and may substantially delay the sale of the security. In addition, certain restricted securities may exhibit greater price volatility than securities for which secondary markets exist. As of December 31, 2017, the Portfolio held the following restricted securities: |
| ||
| 45 |
Table of Contents
Anchor Series Trust SA Wellington Capital Appreciation Portfolio#
PORTFOLIO OF INVESTMENTS — December 31, 2017 — (continued)
Description | Acquisition Date | Shares | Acquisition Cost | Value | Value Per Share | % of Net Assets | ||||||||||||||||||
| Common Stocks | ||||||||||||||||||||||||
DocuSign, Inc. CVR | 08/12/2016 | 55,398 | $ | 0 | $ | 0 | $ | 0 | 0.00 | % | ||||||||||||||
DraftKings, Inc. | 07/16/2015 | 640,163 | 2,337,660 | |||||||||||||||||||||
| 07/17/2015 | 23,563 | 86,045 | ||||||||||||||||||||||
| 08/11/2015 | 774,738 | 2,996,033 | ||||||||||||||||||||||
|
|
|
| |||||||||||||||||||||
| 1,438,464 | 5,419,738 | 2,042,619 | 1.42 | 0.15 | ||||||||||||||||||||
|
|
|
| |||||||||||||||||||||
Dropbox, Inc., Class B | 05/01/2012 | 200,477 | 1,814,658 | 2,467,872 | 12.31 | 0.18 | ||||||||||||||||||
The Honest Co., Inc. | 08/20/2014 | 41,843 | 1,132,159 | 739,784 | 17.68 | 0.05 | ||||||||||||||||||
| Convertible Preferred Securities | ||||||||||||||||||||||||
Airbnb, Inc., Series E | 06/24/2015 | 46,491 | 4,328,052 | 5,068,294 | 109.02 | 0.38 | ||||||||||||||||||
The Honest Co., Inc., Series C | 08/20/2014 | 97,634 | 2,641,712 | 2,979,789 | 30.52 | 0.22 | ||||||||||||||||||
Magic Leap, Inc., Series C | 12/28/2015 | 93,690 | 2,157,962 | 2,529,630 | 27.00 | 0.19 | ||||||||||||||||||
Nanigans, Inc., Series B | 03/16/2015 | 126,818 | 1,384,662 | 713,985 | 5.63 | 0.05 | ||||||||||||||||||
One Kings Lane, Inc., Escrow | 01/28/2014 | 291,563 | 72,891 | 72,891 | 0.25 | 0.01 | ||||||||||||||||||
Pinterest, Inc., Series G | 03/19/2015 | 390,940 | 2,806,594 | 2,623,207 | 6.71 | 0.19 | ||||||||||||||||||
Uber Technologies, Inc., Series D | 06/05/2014 | 599,808 | 9,304,851 | 20,866,541 | 34.79 | 1.55 | ||||||||||||||||||
Zuora, Inc., Series F | 01/15/2015 | 732,120 | 2,781,544 | 3,902,200 | 5.33 | 0.29 | ||||||||||||||||||
|
|
|
| |||||||||||||||||||||
| $ | 44,006,812 | 3.26 | % | |||||||||||||||||||||
|
|
|
| |||||||||||||||||||||
| (3) | Illiquid security. At December 31, 2017, the aggregate value of these securities was $44,006,812 representing 3.3% of net assets. |
| (4) | See Note 2 for details of Joint Repurchase Agreements. |
| (5) | See Note 6 for cost of investments on a tax basis. |
ADR — American Depositary Receipt
CVR — Contingent Value Rights
The following is a summary of the inputs used to value the Portfolio’s net assets as of December 31, 2017 (see Note 2):
Level 1 - Unadjusted Quoted Prices | Level 2 - Other Observable Inputs | Level 3 - Significant Unobservable Inputs | Total | |||||||||||||
ASSETS: | ||||||||||||||||
Investments at Value:* | ||||||||||||||||
Common Stocks: | ||||||||||||||||
Applications Software | $ | 77,475,665 | $ | — | $ | 2,467,872 | $ | 79,943,537 | ||||||||
E-Commerce/Products | 13,977,415 | — | 739,784 | 14,717,199 | ||||||||||||
Electronic Forms | 35,528,508 | — | 0 | 35,528,508 | ||||||||||||
Entertainment Software | — | — | 2,042,619 | 2,042,619 | ||||||||||||
Other Industries | 1,173,582,617 | 11,703,057 | ** | — | 1,185,285,674 | |||||||||||
Convertible Preferred Securities | — | — | 38,756,537 | 38,756,537 | ||||||||||||
Repurchase Agreements | — | 6,085,000 | — | 6,085,000 | ||||||||||||
|
|
|
|
|
|
|
| |||||||||
Total Investments at Value | $ | 1,300,564,205 | $ | 17,788,057 | $ | 44,006,812 | $ | 1,362,359,074 | ||||||||
|
|
|
|
|
|
|
| |||||||||
| * | For a detailed presentation of investments, please refer to the Portfolio of Investments. |
| ** | Represents foreign equity securities that have been fair valued in accordance with pricing procedures approved by the Board (see Note 2). |
The Portfolio’s policy is to recognize transfers between Levels as of the end of the reporting period. There were no material transfers between Levels during the reporting period.
| ||
| 46 |
Table of Contents
Anchor Series Trust SA Wellington Capital Appreciation Portfolio#
PORTFOLIO OF INVESTMENTS — December 31, 2017 — (continued)
The following is a reconciliation of Level 3 assets for which significant unobservable inputs were used to determine fair value:
Common Stocks | Convertible Preferred Securities | |||||||
Balance as of 12/31/2016 | $ | 4,173,072 | $ | 54,434,720 | ||||
Accrued discounts | — | — | ||||||
Accrued premiums | — | — | ||||||
Realized Gain | 405,816 | 741,087 | ||||||
Realized Loss | — | (4,178,797 | ) | |||||
Change in unrealized appreciation(1) | 762,434 | 7,930,084 | ||||||
Change in unrealized depreciation(1) | (4,081,756 | ) | (9,879,119 | ) | ||||
Net Purchases | 5,419,739 | — | ||||||
Net Sales | (1,429,030 | ) | (10,291,438 | ) | ||||
Transfers into Level 3 | — | — | ||||||
Transfers out of Level 3 | — | — | ||||||
|
|
|
| |||||
Balance as of 12/31/2017 | $ | 5,250,275 | $ | 38,756,537 | ||||
|
|
|
| |||||
| (1) | The total change in unrealized appreciation (depreciation) attributable to Level 3 investments still held at December 31, 2017 includes: |
| Common Stocks | Convertible Preferred Securities | |||||||
| $ | (3,358,702 | ) | $ | (6,818,313 | ) | |||
|
|
|
| |||||
Any differences between the change in appreciation (depreciation) in the Level 3 reconciliation and the total change in unrealized appreciation (depreciation) is attributable to securities sold/no longer held at December 31, 2017.
The following is quantitative information about Level 3 fair value measurements:
| Description | Value at 12/31/2017 | Valuation Technique(s) | Unobservable Input(1) | Range (weighted average) | ||||
Common Stocks | $2,042,619 | Market Approach | 2019 Revenue Multiple* | 3.08x | ||||
| Discount for Lack of Marketability | 10.0% | |||||||
| $739,784 | Market Approach with Option Pricing Method (“OPM”) | Valuation Based on Series E Offering* | $22.1000 | |||||
| Discount for Lack of Marketability | 10.00% | |||||||
| OPM assumptions: | ||||||||
Volatility* | 15.0% | |||||||
Term to liquidity event in years | 3.00 | |||||||
Risk-free rate | 1.62% | |||||||
| $2,467,872 | Market Approach with Option Pricing Method (“OPM”) | Transaction Price* | $8.1500 | |||||
| 2018 Estimated Revenue Multiple* | 5.0x -6.51x (5.937x) | |||||||
| 2019 Estimated Revenue Multiple* | 5.1x | |||||||
| 2019 Estimated Gross Profit Multiple* | 6.6x | |||||||
| Discount for Lack of Marketability | 10.0% | |||||||
| OPM assumptions: | ||||||||
Volatility* | 35.0% | |||||||
Term to liquidity event in years | 2.01 | |||||||
Risk-free rate | 1.91% | |||||||
| $0 | Income Approach | Potential Future Cash Flows* | $0.00 |
| ||
| 47 |
Table of Contents
Anchor Series Trust SA Wellington Capital Appreciation Portfolio#
PORTFOLIO OF INVESTMENTS — December 31, 2017 — (continued)
| Description | Value at 12/31/2017 | Valuation Technique(s) | Unobservable Input(1) | Range (weighted average) | ||||
Convertible Preferred Securities | $2,529,630 | Market Approach | Market Transaction Price* | $27.000000 | ||||
| $20,866,541 | Market Approach | Primary Market Transaction Price* | $48.7722 | |||||
| Secondary Market Transaction/Tender Price* | $32.9689 | |||||||
| $5,068,294 | Market Approach | Market Transaction Price* | $105.0000 | |||||
| 2020 Estimated Revenue Multiple* | 5.3x | |||||||
| 2020 Estimated Gross Profit Multiple* | 7.3x | |||||||
| Discount for Lack of Marketability | 10.0% | |||||||
| $3,902,200 | Market Approach | 2017 Revenue Multiple* | 7.6x | |||||
| Discount for Lack of Marketability | 10.0% | |||||||
| $2,979,789 | Market Approach with Option Pricing Method (“OPM”) | Valuation Based on Series E Offering* | $22.1000 | |||||
| Discount for Lack of Marketability | 10.00% | |||||||
| OPM assumptions: | ||||||||
Volatility* | 15.0% | |||||||
Term to liquidity event in years | 3.00 | |||||||
Risk-free rate | 1.62% | |||||||
| $713,985 | Market Approach with Option Pricing Method (“OPM”) | Last Twelve Months Revenue Multiple* | 1.07x | |||||
| Discount for Lack of Marketability | 10.00% | |||||||
| OPM assumptions: | ||||||||
Volatility* | 60.9% | |||||||
Term to liquidity event in years | 3.00 | |||||||
Risk-free rate | 2.00% | |||||||
| $2,623,207 | Market Approach with Option Pricing Method (“OPM”) | Estimated Next Twelve Months Revenue Multiple* | 6.9x | |||||
| Discount for Lack of Marketability | 10.00% | |||||||
| OPM assumptions: | ||||||||
Volatility* | 28.0% | |||||||
Term to liquidity event in years | 1.01 | |||||||
Risk-free rate | 1.76% | |||||||
| $72,891 | Income Approach | Future Cash Flows* | $0.25 | |||||
| Discount for Potential Claims | 35.0% |
| (1) | The significant unobservable inputs regarding the Level 3 securities in the table above are attributable to private securities and include assumptions made from non-public financial statements, private transactions, and/or market comparables. For those unobservable inputs indicated with *, a significant increase (decrease) in any of those inputs in isolation may result in a significantly higher (lower) fair value measurement, while the remaining unobservable inputs have a inverse relationship. |
See Notes to Financial Statements
| ||
| 48 |
Table of Contents
Anchor Series Trust SA Wellington Natural Resources Portfolio#
PORTFOLIO PROFILE — December 31, 2017 — (unaudited)
Industry Allocation*
Oil Companies-Integrated | 27.9 | % | ||
Oil Companies-Exploration & Production | 21.1 | |||
Diversified Minerals | 9.0 | |||
Metal-Diversified | 8.9 | |||
Steel-Producers | 6.4 | |||
Pipelines | 5.9 | |||
Oil Refining & Marketing | 5.7 | |||
Gold Mining | 4.8 | |||
Oil-Field Services | 3.8 | |||
Metal-Iron | 2.0 | |||
Metal-Aluminum | 1.9 | |||
Metal-Copper | 1.9 | |||
Non-Ferrous Metals | 0.6 | |||
Steel-Specialty | 0.6 | |||
Steel Pipe & Tube | 0.6 | |||
Diamonds/Precious Stones | 0.4 | |||
Repurchase Agreements | 0.3 | |||
|
| |||
| 101.8 | % | |||
|
|
| # | See Note 1 |
| * | Calculated as a percentage of net assets |
| ||
| 49 |
Table of Contents
Anchor Series Trust SA Wellington Natural Resources Portfolio#
PORTFOLIO OF INVESTMENTS — December 31, 2017
| Security Description | Shares | Value (Note 2) | ||||||
COMMON STOCKS — 101.1% |
| |||||||
Diamonds/Precious Stones — 0.4% |
| |||||||
Lucara Diamond Corp. | 227,927 | $ | 509,527 | |||||
|
| |||||||
Diversified Minerals — 9.0% |
| |||||||
Anglo American PLC | 116,549 | 2,435,889 | ||||||
BHP Billiton PLC | 316,648 | 6,481,374 | ||||||
Vedanta, Ltd. ADR | 38,063 | 792,852 | ||||||
Western Areas, Ltd. | 183,102 | 463,955 | ||||||
|
| |||||||
| 10,174,070 | ||||||||
|
| |||||||
Gold Mining — 4.8% |
| |||||||
Agnico Eagle Mines, Ltd. | 23,673 | 1,093,064 | ||||||
Barrick Gold Corp. | 92,230 | 1,334,568 | ||||||
Barrick Gold Corp. | 31,569 | 456,583 | ||||||
Kinross Gold Corp.† | 306,289 | 1,320,673 | ||||||
Newcrest Mining, Ltd. | 69,865 | 1,241,346 | ||||||
|
| |||||||
| 5,446,234 | ||||||||
|
| |||||||
Metal-Aluminum — 1.9% |
| |||||||
Alcoa Corp.† | 22,122 | 1,191,712 | ||||||
Norsk Hydro ASA | 133,558 | 1,009,761 | ||||||
|
| |||||||
| 2,201,473 | ||||||||
|
| |||||||
Metal-Copper — 1.9% |
| |||||||
First Quantum Minerals, Ltd. | 74,725 | 1,046,864 | ||||||
KAZ Minerals PLC† | 45,146 | 541,129 | ||||||
Southern Copper Corp. | 12,478 | 592,081 | ||||||
|
| |||||||
| 2,180,074 | ||||||||
|
| |||||||
Metal-Diversified — 8.9% |
| |||||||
Glencore PLC | 726,472 | 3,822,180 | ||||||
Ivanhoe Mines, Ltd., Class A† | 73,503 | 247,934 | ||||||
MMC Norilsk Nickel PJSC ADR | 40,000 | 756,400 | ||||||
Rio Tinto PLC | 99,685 | 5,261,090 | ||||||
|
| |||||||
| 10,087,604 | ||||||||
|
| |||||||
Metal-Iron — 2.0% |
| |||||||
Fortescue Metals Group, Ltd. | 190,222 | 722,835 | ||||||
Vale SA ADR | 123,091 | 1,505,403 | ||||||
|
| |||||||
| 2,228,238 | ||||||||
|
| |||||||
Non-Ferrous Metals — 0.2% |
| |||||||
Korea Zinc Co., Ltd. | 577 | 265,455 | ||||||
|
| |||||||
Oil Companies-Exploration & Production — 21.1% |
| |||||||
Cabot Oil & Gas Corp. | 34,692 | 992,191 | ||||||
Canadian Natural Resources, Ltd. | 39,922 | 1,426,648 | ||||||
Centennial Resource Development, Inc., Class A† | 14,557 | 288,229 | ||||||
Cimarex Energy Co. | 6,957 | 848,824 | ||||||
CNOOC, Ltd. | 751,620 | 1,080,556 | ||||||
Concho Resources, Inc.† | 8,086 | 1,214,679 | ||||||
Devon Energy Corp. | 25,026 | 1,036,076 | ||||||
Diamondback Energy, Inc.† | 15,330 | 1,935,413 | ||||||
Encana Corp. | 72,383 | 965,683 | ||||||
EOG Resources, Inc. | 24,120 | 2,602,789 | ||||||
EQT Corp. | 10,034 | 571,135 | ||||||
Hess Corp. | 15,009 | 712,477 | ||||||
Jagged Peak Energy, Inc.† | 22,180 | 350,000 | ||||||
Lundin Petroleum AB† | 85,838 | 1,963,929 | ||||||
Newfield Exploration Co.† | 37,684 | 1,188,177 | ||||||
Noble Energy, Inc. | 45,572 | 1,327,968 | ||||||
Novatek PJSC GDR | 5,627 | 676,365 | ||||||
Occidental Petroleum Corp. | 52,465 | 3,864,572 | ||||||
Pioneer Natural Resources Co. | 1,435 | 248,040 | ||||||
RSP Permian, Inc.† | 12,024 | 489,136 | ||||||
|
| |||||||
| 23,782,887 | ||||||||
|
| |||||||
| Security Description | Shares/ Principal Amount | Value (Note 2) | ||||||
Oil Companies-Integrated — 27.9% |
| |||||||
BP PLC | 465,099 | $ | 3,280,115 | |||||
Chevron Corp. | 27,307 | 3,418,563 | ||||||
Eni SpA | 96,702 | 1,599,146 | ||||||
Exxon Mobil Corp. | 67,385 | 5,636,081 | ||||||
Galp Energia SGPS SA | 99,250 | 1,823,332 | ||||||
Lukoil PJSC ADR | 21,117 | 1,217,395 | ||||||
Royal Dutch Shell PLC, Class A | 206,087 | 6,899,128 | ||||||
Suncor Energy, Inc. | 111,553 | 4,095,601 | ||||||
TOTAL SA | 63,941 | 3,527,964 | ||||||
|
| |||||||
| 31,497,325 | ||||||||
|
| |||||||
Oil Refining & Marketing — 5.7% |
| |||||||
Andeavor | 10,270 | 1,174,272 | ||||||
Marathon Petroleum Corp. | 19,065 | 1,257,909 | ||||||
Phillips 66 | 21,142 | 2,138,513 | ||||||
Valero Energy Corp. | 19,963 | 1,834,799 | ||||||
|
| |||||||
| 6,405,493 | ||||||||
|
| |||||||
Oil-Field Services — 3.8% |
| |||||||
Baker Hughes a GE Co., LLC | 17,715 | 560,503 | ||||||
Halliburton Co. | 42,378 | 2,071,013 | ||||||
NCS Multistage Holdings, Inc.† | 14,767 | 217,665 | ||||||
ProPetro Holding Corp.† | 14,775 | 297,864 | ||||||
Schlumberger, Ltd. | 16,698 | 1,125,278 | ||||||
|
| |||||||
| 4,272,323 | ||||||||
|
| |||||||
Pipelines — 5.9% |
| |||||||
Cheniere Energy, Inc.† | 13,713 | 738,308 | ||||||
Kinder Morgan, Inc. | 85,601 | 1,546,810 | ||||||
ONEOK, Inc. | 18,952 | 1,012,984 | ||||||
Plains GP Holdings LP, Class A | 25,910 | 568,725 | ||||||
Targa Resources Corp. | 12,103 | 586,027 | ||||||
TransCanada Corp. | 44,457 | 2,163,786 | ||||||
|
| |||||||
| 6,616,640 | ||||||||
|
| |||||||
Steel Pipe & Tube — 0.6% |
| |||||||
Tenaris SA | 39,881 | 635,942 | ||||||
|
| |||||||
Steel-Producers — 6.4% |
| |||||||
ArcelorMittal† | 58,584 | 1,892,849 | ||||||
BlueScope Steel, Ltd. | 90,001 | 1,078,548 | ||||||
Gerdau SA (Preference Shares) | 120,900 | 453,658 | ||||||
Nippon Steel & Sumitomo Metal Corp. | 58,070 | 1,490,508 | ||||||
Reliance Steel & Aluminum Co. | 9,833 | 843,573 | ||||||
Steel Dynamics, Inc. | 33,263 | 1,434,633 | ||||||
|
| |||||||
| 7,193,769 | ||||||||
|
| |||||||
Steel-Specialty — 0.6% |
| |||||||
Aperam SA | 13,139 | 667,724 | ||||||
|
| |||||||
Total Common Stocks | 114,164,778 | |||||||
|
| |||||||
EQUITY CERTIFICATES — 0.4% |
| |||||||
Non-Ferrous Metals — 0.4% |
| |||||||
Merrill Lynch - Korea Zinc Co., | 944 | 434,722 | ||||||
|
| |||||||
Total Long-Term Investment Securities | 114,599,500 | |||||||
|
| |||||||
REPURCHASE AGREEMENTS — 0.3% |
| |||||||
Bank of America Securities LLC Joint Repurchase Agreement(3) | $ | 55,000 | 55,000 | |||||
Barclays Capital, Inc. Joint Repurchase Agreement(3) | 60,000 | 60,000 | ||||||
| ||
| 50 |
Table of Contents
Anchor Series Trust SA Wellington Natural Resources Portfolio#
PORTFOLIO OF INVESTMENTS — December 31, 2017 — (continued)
| Security Description | Principal Amount | Value (Note 2) | ||||||
REPURCHASE AGREEMENTS (continued) |
| |||||||
BNP Paribas SA Joint Repurchase Agreement(3) | $ | 120,000 | $ | 120,000 | ||||
Deutsche Bank AG Joint Repurchase Agreement(3) | 40,000 | 40,000 | ||||||
RBS Securities, Inc. Joint Repurchase Agreement(3) | 100,000 | 100,000 | ||||||
|
| |||||||
Total Repurchase Agreements | 375,000 | |||||||
|
| |||||||
TOTAL INVESTMENTS | 101.8 | % | 114,974,500 | |||||
Liabilities in excess of other assets | (1.8 | ) | (2,049,631 | ) | ||||
|
|
|
| |||||
NET ASSETS | 100.0 | % | $ | 112,924,869 | ||||
|
|
|
| |||||
| # | See Note 1 |
| † | Non-income producing security |
| (1) | Illiquid security. At December 31, 2017, the aggregate value of these securities was $434,722 representing 0.4% of net assets. |
| (2) | Denotes a restricted security that: (a) cannot be offered for public sale without first being registered, or being able to take advantage of an exemption from registration, under the Securities Act of 1933, as amended (the “1933 Act”); (b) is subject to a contractual restriction on public sales; or (c) is otherwise subject to a restriction on sales by operation of applicable law. Restricted securities are |
| valued pursuant to Note 2. Certain restricted securities held by the Portfolio may not be sold except in exempt transactions or in a public offering registered under the 1933 Act. The Portfolio has no right to demand registration of these securities. The risk of investing in certain restricted securities is greater than the risk of investing in the securities of widely held, publicly traded companies. To the extent applicable, lack of a secondary market and resale restrictions may result in the inability of a Portfolio to sell a security at a fair price and may substantially delay the sale of the security. In addition, certain restricted securities may exhibit greater price volatility than securities for which secondary markets exist. As of December 31, 2017, the Portfolio held the following restricted securities: |
Description | Acquisition Date | Shares | Acquisition Cost | Value | Value Per Share | % of Net Assets | ||||||||||||||||||
Equity Certificates |
| |||||||||||||||||||||||
Merrill Lynch—Korea Zinc Co., Ltd. | 07/12/2016 | 358 | $ | 172,729 | ||||||||||||||||||||
| 07/13/2016 | 586 | 287,078 | ||||||||||||||||||||||
|
|
|
| |||||||||||||||||||||
| 944 | $ | 459,807 | $ | 434,722 | $ | 460.51 | 0.38 | % | ||||||||||||||||
|
|
|
|
|
|
|
| |||||||||||||||||
| (3) | See Note 2 for details of Joint Repurchase Agreements. |
| (4) | See Note 6 for cost of investments on a tax basis. |
ADR — American Depositary Receipt
GDR — Global Depositary Receipt
The following is a summary of the inputs used to value the Portfolio’s net assets as of December 31, 2017 (see Note 2):
| Level 1 - Unadjusted Quoted Prices | Level 2 - Other Observable Inputs | Level 3 - Significant Unobservable Inputs | Total | |||||||||||||
ASSETS: | ||||||||||||||||
Investments at Value:* | ||||||||||||||||
Common Stocks | $ | 68,722,880 | $ | 45,441,898 | ** | $ | — | $ | 114,164,778 | |||||||
Equity Certificates | — | 434,722 | — | 434,722 | ||||||||||||
Repurchase Agreements | — | 375,000 | — | 375,000 | ||||||||||||
|
|
|
|
|
|
|
| |||||||||
Total Investments at Value | $ | 68,722,880 | $ | 46,251,620 | $ | — | $ | 114,974,500 | ||||||||
|
|
|
|
|
|
|
| |||||||||
| * | For a detailed presentation of investments, please refer to the Portfolio of Investments. |
| ** | Represents foreign equity securities that have been fair valued in accordance with pricing procedures approved by the Board (see Note 2). |
The Portfolio’s policy is to recognize transfers between Levels as of the end of the reporting period. Securities currently valued at $30,704,377 were transferred from Level 1 to Level 2 due to foreign equity securities whose values were adjusted for fair value pricing procedures for foreign equity securities. There were no additional transfers between Levels during the reporting period.
See Notes to Financial Statements
| ||
| 51 |
Table of Contents
Anchor Series Trust SA BlackRock Multi-Asset Income Portfolio
PORTFOLIO PROFILE — December 31, 2017 — (unaudited)
Industry Allocation*
Exchange-Traded Funds | 96.1 | % | ||
Time Deposits | 2.3 | |||
|
| |||
| 98.4 | % | |||
|
|
| * | Calculated as a percentage of net assets |
| ||
| 52 |
Table of Contents
Anchor Series Trust SA BlackRock Multi-Asset Income Portfolio
PORTFOLIO OF INVESTMENTS — December 31, 2017
| Security Description | Shares/ Principal Amount | Value (Note 2) | ||||||
EXCHANGE-TRADED FUNDS — 96.1% |
| |||||||
Global X MLP ETF | 129,514 | $ | 1,277,008 | |||||
iShares 0-5 Year High Yield Corporate Bond ETF | 46,719 | 2,201,866 | ||||||
iShares 1-3 Year Credit Bond ETF | 62,433 | 6,526,746 | ||||||
iShares 10+ Year Credit Bond ETF | 37,264 | 2,355,085 | ||||||
iShares CMBS ETF | 19,751 | 1,012,634 | ||||||
iShares Core Dividend Growth ETF | 14,583 | 507,197 | ||||||
iShares Core High Dividend ETF | 14,975 | 1,349,846 | ||||||
iShares Emerging Markets Dividend ETF | 16,454 | 688,271 | ||||||
iShares Europe ETF | 18,084 | 854,650 | ||||||
iShares Floating Rate Bond ETF | 29,935 | 1,521,297 | ||||||
iShares iBoxx $ High Yield Corporate Bond ETF | 93,144 | 8,127,745 | ||||||
iShares Intermediate Credit Bond ETF | 12,370 | 1,350,928 | ||||||
iShares International Developed Real Estate ETF | 16,778 | 503,340 | ||||||
iShares International Select Dividend ETF | 35,415 | 1,196,673 | ||||||
iShares U.S. Real Estate ETF | 6,157 | 498,778 | ||||||
iShares U.S. Preferred Stock ETF | 88,187 | 3,357,279 | ||||||
|
| |||||||
Total Long-Term Investment Securities | 33,329,343 | |||||||
|
| |||||||
SHORT-TERM INVESTMENT SECURITIES — 2.3% |
| |||||||
Time Deposits — 2.3% | ||||||||
Euro Time Deposit with State Street Bank and Trust Co. | $ | 806,000 | 806,000 | |||||
|
| |||||||
TOTAL INVESTMENTS | 98.4 | % | 34,135,343 | |||||
Other assets less liabilities | 1.6 | 572,474 | ||||||
|
|
|
| |||||
NET ASSETS | 100.0 | % | $ | 34,707,817 | ||||
|
|
|
| |||||
| (1) | See Note 6 for cost of investments on a tax basis. |
ETF — Exchange-Traded Fund
| Futures Contracts | ||||||||||||||||||||
| Number of Contracts | Type | Description | Expiration Month | Notional Basis* | Notional Value* | Unrealized Appreciation (Depreciation) | ||||||||||||||
| 6 | Short | Euro Currency Futures | March 2018 | $ | 890,325 | $ | 905,662 | $ | (15,337 | ) | ||||||||||
| 8 | Long | Euro Stoxx 50 Index | March 2018 | 345,173 | 333,894 | (11,279 | ) | |||||||||||||
| 4 | Long | NIKKEI 225 Index | March 2018 | 801,036 | 807,915 | 6,879 | ||||||||||||||
| 1 | Long | S&P 500 E-Mini Index | March 2018 | 132,690 | 133,800 | 1,110 | ||||||||||||||
| 3 | Short | U.S. Treasury 10 YR Notes | March 2018 | 373,312 | 372,140 | 1,172 | ||||||||||||||
| 5 | Long | U.S. 10 YR Ultra Bonds | March 2018 | 667,880 | 667,812 | (68 | ) | |||||||||||||
| 2 | Short | U.S. Long Bond | March 2018 | 305,875 | 306,000 | (125 | ) | |||||||||||||
| 6 | Short | U.S. Treasury 2 YR Notes | March 2018 | 1,286,437 | 1,284,656 | 1,781 | ||||||||||||||
| 5 | Short | U.S. Treasury 5 YR Notes | March 2018 | 582,420 | 580,820 | 1,600 | ||||||||||||||
| 5 | Short | U.S. Ultra Bonds | March 2018 | 834,412 | 838,281 | (3,869 | ) | |||||||||||||
|
| |||||||||||||||||||
| $ | (18,136 | ) | ||||||||||||||||||
|
| |||||||||||||||||||
| * | Notional basis refers to the contractual amount agreed upon at inception of the open contract; notional value represents the current value of the open contract. |
| ||
| 53 |
Table of Contents
Anchor Series Trust SA BlackRock Multi-Asset Income Portfolio
PORTFOLIO OF INVESTMENTS — December 31, 2017 — (continued)
The following is a summary of the inputs used to value the Portfolio’s net assets as of December 31, 2017 (see Note 2):
| Level 1 - Unadjusted Quoted Prices | Level 2 - Other Observable Inputs | Level 3 - Significant Unobservable Inputs | Total | |||||||||||||
ASSETS: | ||||||||||||||||
Investments at Value:* | ||||||||||||||||
Exchange-Traded Funds | $ | 33,329,343 | $ | — | $ | — | $ | 33,329,343 | ||||||||
Short-Term Investment Securities | — | 806,000 | — | 806,000 | ||||||||||||
|
|
|
|
|
|
|
| |||||||||
Total Investments at Value | $ | 33,329,343 | $ | 806,000 | $ | — | $ | 34,135,343 | ||||||||
|
|
|
|
|
|
|
| |||||||||
| Other Financial Instruments:+ | ||||||||||||||||
Futures Contracts | $ | 5,663 | $ | 6,879 | $ | — | $ | 12,542 | ||||||||
|
|
|
|
|
|
|
| |||||||||
LIABILITIES: | ||||||||||||||||
| Other Financial Instruments:+ | ||||||||||||||||
Futures Contracts | $ | 19,399 | $ | 11,279 | $ | — | $ | 30,678 | ||||||||
|
|
|
|
|
|
|
| |||||||||
| * | For a detailed presentation of investments, please refer to the Portfolio of Investments. |
| + | Other financial instruments are derivative instruments, not reflected in the Portfolio of Investments, such as futures, forward, swap and written option contracts, which are valued at the unrealized appreciation (depreciation) on the instrument |
The Portfolio’s policy is to recognize transfers between Levels as of the end of the reporting period. There were no transfers between Levels during the reporting period.
See Notes to Financial Statements
| ||
| 54 |
Table of Contents
Anchor Series Trust SA Wellington Multi-Asset Income Portfolio#
PORTFOLIO PROFILE — December 31, 2017 — (unaudited)
Industry Allocation*
Sovereign | 18.0 | % | ||
Repurchase Agreements | 12.6 | |||
United States Treasury Notes | 7.6 | |||
Diversified Banking Institutions | 5.2 | |||
Electronic Components-Semiconductors | 2.6 | |||
Insurance-Multi-line | 2.2 | |||
Diagnostic Equipment | 2.0 | |||
United States Treasury Bonds | 1.9 | |||
Internet Content-Entertainment | 1.8 | |||
Auto/Truck Parts & Equipment-Original | 1.6 | |||
E-Commerce/Products | 1.6 | |||
Computers | 1.6 | |||
E-Commerce/Services | 1.5 | |||
Electric-Integrated | 1.5 | |||
Commercial Services-Finance | 1.5 | |||
Semiconductor Components-Integrated Circuits | 1.3 | |||
Banks-Commercial | 1.2 | |||
Airlines | 1.2 | |||
Tobacco | 1.2 | |||
Enterprise Software/Service | 1.2 | |||
Applications Software | 1.1 | |||
Oil Companies-Exploration & Production | 1.1 | |||
Medical-HMO | 1.0 | |||
Transport-Truck | 1.0 | |||
Aerospace/Defense-Equipment | 1.0 | |||
Insurance-Property/Casualty | 1.0 | |||
Auto-Cars/Light Trucks | 1.0 | |||
Investment Management/Advisor Services | 0.9 | |||
Telephone-Integrated | 0.9 | |||
Electronic Components-Misc. | 0.9 | |||
Semiconductor Equipment | 0.9 | |||
Banks-Super Regional | 0.9 | |||
Athletic Footwear | 0.9 | |||
Food-Misc./Diversified | 0.8 | |||
Schools | 0.8 | |||
Building & Construction Products-Misc. | 0.8 | |||
Finance-Credit Card | 0.8 | |||
Web Portals/ISP | 0.8 | |||
Hotels/Motels | 0.8 | |||
Finance-Other Services | 0.7 | |||
Internet Application Software | 0.7 | |||
Computer Services | 0.6 | |||
Chemicals-Diversified | 0.6 | |||
Pipelines | 0.6 | |||
Banks-Fiduciary | 0.6 | |||
Electronics-Military | 0.6 | |||
Metal-Diversified | 0.6 | |||
Entertainment Software | 0.6 | |||
Rental Auto/Equipment | 0.6 | |||
Containers-Metal/Glass | 0.6 | |||
Food-Catering | 0.6 | |||
Food-Flour & Grain | 0.5 | |||
Steel-Producers | 0.5 | |||
Food-Retail | 0.5 | |||
Real Estate Investment Trusts | 0.5 | |||
Finance-Leasing Companies | 0.5 | |||
X-Ray Equipment | 0.5 | |||
Real Estate Management/Services | 0.4 | |||
Medical-Drugs | 0.4 | |||
Retail-Apparel/Shoe | 0.4 | |||
Computer Software | 0.4 |
Cosmetics & Toiletries | 0.4 | % | ||
Exchange-Traded Funds | 0.3 | |||
U.S. Government Treasuries | 0.3 | |||
Aerospace/Defense | 0.2 | |||
Financial Guarantee Insurance | 0.2 | |||
Cellular Telecom | 0.1 | |||
Medical-Biomedical/Gene | 0.1 | |||
|
| |||
| 100.3 | % | |||
|
|
| # | See Note 1 |
| * | Calculated as a percentage of net assets |
| ||
| 55 |
Table of Contents
Anchor Series Trust SA Wellington Multi-Asset Income Portfolio#
PORTFOLIO OF INVESTMENTS — December 31, 2017
| Security Description | Shares | Value (Note 2) | ||||||
COMMON STOCKS — 59.6% |
| |||||||
Aerospace/Defense — 0.2% |
| |||||||
General Dynamics Corp. | 351 | $ | 71,411 | |||||
|
| |||||||
Aerospace/Defense-Equipment — 1.0% |
| |||||||
Airbus SE | 3,204 | 318,175 | ||||||
|
| |||||||
Airlines — 1.2% |
| |||||||
Delta Air Lines, Inc. | 3,250 | 182,000 | ||||||
JetBlue Airways Corp.† | 5,426 | 121,217 | ||||||
Spirit Airlines, Inc.† | 1,619 | 72,612 | ||||||
|
| |||||||
| 375,829 | ||||||||
|
| |||||||
Applications Software — 1.1% | ||||||||
salesforce.com, Inc.† | 1,665 | 170,213 | ||||||
ServiceNow, Inc.† | 1,408 | 183,589 | ||||||
|
| |||||||
| 353,802 | ||||||||
|
| |||||||
Athletic Footwear — 0.9% |
| |||||||
NIKE, Inc., Class B | 4,254 | 266,088 | ||||||
|
| |||||||
Auto-Cars/Light Trucks — 1.0% |
| |||||||
Fiat Chrysler Automobiles NV† | 9,006 | 160,583 | ||||||
General Motors Co. | 3,585 | 146,949 | ||||||
|
| |||||||
| 307,532 | ||||||||
|
| |||||||
Auto/Truck Parts & Equipment-Original — 1.6% |
| |||||||
Aptiv PLC | 1,686 | 143,023 | ||||||
Delphi Technologies PLC† | 1,437 | 75,399 | ||||||
Magna International, Inc. | 1,800 | 102,014 | ||||||
Valeo SA | 2,572 | 191,671 | ||||||
|
| |||||||
| 512,107 | ||||||||
|
| |||||||
Banks-Commercial — 1.2% |
| |||||||
Banca Generali SpA | 2,217 | 73,654 | ||||||
China Merchants Bank Co., Ltd. | 9,000 | 35,815 | ||||||
FinecoBank Banca Fineco SpA | 5,292 | 54,090 | ||||||
HDFC Bank, Ltd. ADR | 604 | 61,409 | ||||||
ICICI Bank, Ltd. ADR | 15,832 | 154,045 | ||||||
|
| |||||||
| 379,013 | ||||||||
|
| |||||||
Banks-Fiduciary — 0.6% |
| |||||||
Northern Trust Corp. | 1,957 | 195,485 | ||||||
|
| |||||||
Banks-Super Regional — 0.9% |
| |||||||
Capital One Financial Corp. | 2,040 | 203,143 | ||||||
SunTrust Banks, Inc. | 986 | 63,686 | ||||||
|
| |||||||
| 266,829 | ||||||||
|
| |||||||
Building & Construction Products-Misc. — 0.8% |
| |||||||
Cie de Saint-Gobain | 2,072 | 114,034 | ||||||
Fortune Brands Home & Security, Inc. | 2,052 | 140,439 | ||||||
|
| |||||||
| 254,473 | ||||||||
|
| |||||||
Cellular Telecom — 0.1% |
| |||||||
Sprint Corp.† | 7,254 | 42,726 | ||||||
|
| |||||||
Chemicals-Diversified — 0.6% |
| |||||||
PPG Industries, Inc. | 1,721 | 201,047 | ||||||
|
| |||||||
Commercial Services-Finance — 1.5% |
| |||||||
FleetCor Technologies, Inc.† | 982 | 188,966 | ||||||
Global Payments, Inc. | 1,442 | 144,546 | ||||||
IHS Markit, Ltd.† | 2,793 | 126,104 | ||||||
|
| |||||||
| 459,616 | ||||||||
|
| |||||||
| Security Description | Shares | Value (Note 2) | ||||||
Computer Services — 0.6% |
| |||||||
Cognizant Technology Solutions Corp., Class A | 2,838 | $ | 201,555 | |||||
|
| |||||||
Computer Software — 0.4% |
| |||||||
Splunk, Inc.† | 1,439 | 119,207 | ||||||
|
| |||||||
Computers — 1.6% |
| |||||||
Apple, Inc. | 2,954 | 499,905 | ||||||
|
| |||||||
Containers-Metal/Glass — 0.6% |
| |||||||
Ball Corp. | 4,736 | 179,258 | ||||||
|
| |||||||
Cosmetics & Toiletries — 0.4% |
| |||||||
Coty, Inc., Class A | 5,617 | 111,722 | ||||||
|
| |||||||
Diagnostic Equipment — 2.0% |
| |||||||
Abbott Laboratories | 2,793 | 159,397 | ||||||
Danaher Corp. | 2,834 | 263,052 | ||||||
Thermo Fisher Scientific, Inc. | 999 | 189,690 | ||||||
|
| |||||||
| 612,139 | ||||||||
|
| |||||||
Diversified Banking Institutions — 5.2% |
| |||||||
Bank of America Corp. | 14,228 | 420,010 | ||||||
Citigroup, Inc. | 4,277 | 318,252 | ||||||
Deutsche Bank AG | 6,581 | 124,889 | ||||||
Sumitomo Mitsui Financial Group, Inc. | 4,810 | 207,744 | ||||||
UBS Group AG | 23,084 | 424,150 | ||||||
UniCredit SpA† | 8,037 | 149,724 | ||||||
|
| |||||||
| 1,644,769 | ||||||||
|
| |||||||
E-Commerce/Products — 1.6% |
| |||||||
Alibaba Group Holding, Ltd. ADR† | 1,329 | 229,160 | ||||||
Amazon.com, Inc.† | 239 | 279,503 | ||||||
|
| |||||||
| 508,663 | ||||||||
|
| |||||||
E-Commerce/Services — 1.5% |
| |||||||
Ctrip.com International, Ltd. ADR† | 3,007 | 132,609 | ||||||
Expedia, Inc. | 1,059 | 126,836 | ||||||
Priceline Group, Inc.† | 104 | 180,725 | ||||||
TripAdvisor, Inc.† | 1,013 | 34,908 | ||||||
|
| |||||||
| 475,078 | ||||||||
|
| |||||||
Electric-Integrated — 1.5% |
| |||||||
Edison International | 2,705 | 171,064 | ||||||
Iberdrola SA | 38,547 | 298,302 | ||||||
|
| |||||||
| 469,366 | ||||||||
|
| |||||||
Electronic Components-Misc. — 0.9% |
| |||||||
Flex, Ltd.† | 15,246 | 274,276 | ||||||
|
| |||||||
Electronic Components-Semiconductors — 2.6% |
| |||||||
Broadcom, Ltd. | 1,140 | 292,866 | ||||||
Micron Technology, Inc.† | 2,745 | 112,874 | ||||||
NVIDIA Corp. | 531 | 102,749 | ||||||
Samsung Electronics Co., Ltd. | 98 | 232,831 | ||||||
Skyworks Solutions, Inc. | 880 | 83,556 | ||||||
|
| |||||||
| 824,876 | ||||||||
|
| |||||||
Electronics-Military — 0.6% |
| |||||||
Safran SA | 1,805 | 185,607 | ||||||
|
| |||||||
Enterprise Software/Service — 1.2% |
| |||||||
Atlassian Corp. PLC, Class A† | 2,049 | 93,270 | ||||||
Guidewire Software, Inc.† | 1,297 | 96,315 | ||||||
Ultimate Software Group, Inc.† | 311 | 67,870 | ||||||
Workday, Inc., Class A† | 1,007 | 102,452 | ||||||
|
| |||||||
| 359,907 | ||||||||
|
| |||||||
| ||
| 56 |
Table of Contents
Anchor Series Trust SA Wellington Multi-Asset Income Portfolio#
PORTFOLIO OF INVESTMENTS — December 31, 2017 — (continued)
| Security Description | Shares | Value (Note 2) | ||||||
COMMON STOCKS (continued) |
| |||||||
Entertainment Software — 0.6% |
| |||||||
Activision Blizzard, Inc. | 830 | $ | 52,556 | |||||
Electronic Arts, Inc.† | 567 | 59,569 | ||||||
NetEase, Inc. ADR | 203 | 70,049 | ||||||
|
| |||||||
| 182,174 | ||||||||
|
| |||||||
Finance-Credit Card — 0.8% |
| |||||||
Visa, Inc., Class A | 2,224 | 253,580 | ||||||
|
| |||||||
Finance-Leasing Companies — 0.5% |
| |||||||
Air Lease Corp. | 3,125 | 150,281 | ||||||
|
| |||||||
Finance-Other Services — 0.7% |
| |||||||
Intercontinental Exchange, Inc. | 3,261 | 230,096 | ||||||
|
| |||||||
Financial Guarantee Insurance — 0.2% |
| |||||||
Assured Guaranty, Ltd. | 1,649 | 55,852 | ||||||
|
| |||||||
Food-Catering — 0.6% |
| |||||||
Aramark | 4,047 | 172,969 | ||||||
|
| |||||||
Food-Flour & Grain — 0.5% |
| |||||||
Post Holdings, Inc.† | 2,076 | 164,481 | ||||||
|
| |||||||
Food-Misc./Diversified — 0.8% |
| |||||||
Nestle SA | 3,051 | 262,179 | ||||||
|
| |||||||
Food-Retail — 0.5% |
| |||||||
Seven & i Holdings Co., Ltd. | 3,830 | 159,078 | ||||||
|
| |||||||
Hotels/Motels — 0.8% |
| |||||||
Hilton Worldwide Holdings, Inc. | 984 | 78,582 | ||||||
Marriott International, Inc., Class A | 1,257 | 170,613 | ||||||
|
| |||||||
| 249,195 | ||||||||
|
| |||||||
Insurance-Multi-line — 2.2% |
| |||||||
AXA SA | 7,896 | 234,025 | ||||||
MetLife, Inc. | 5,553 | 280,760 | ||||||
Ping An Insurance Group Co. of China, Ltd. | 18,000 | 187,347 | ||||||
|
| |||||||
| 702,132 | ||||||||
|
| |||||||
Insurance-Property/Casualty — 1.0% |
| |||||||
Tokio Marine Holdings, Inc. | 6,780 | 309,449 | ||||||
|
| |||||||
Internet Application Software — 0.7% |
| |||||||
Tencent Holdings, Ltd. | 4,270 | 220,738 | ||||||
|
| |||||||
Internet Content-Entertainment — 1.8% |
| |||||||
Facebook, Inc., Class A† | 2,292 | 404,446 | ||||||
Netflix, Inc.† | 906 | 173,916 | ||||||
|
| |||||||
| 578,362 | ||||||||
|
| |||||||
Investment Management/Advisor Services — 0.9% |
| |||||||
BlackRock, Inc. | 570 | 292,815 | ||||||
|
| |||||||
Medical-Biomedical/Gene — 0.1% |
| |||||||
Bluebird Bio, Inc.† | 222 | 39,538 | ||||||
|
| |||||||
Medical-Drugs — 0.4% |
| |||||||
Bristol-Myers Squibb Co. | 2,150 | 131,752 | ||||||
|
| |||||||
Medical-HMO — 1.0% |
| |||||||
UnitedHealth Group, Inc. | 1,488 | 328,044 | ||||||
|
| |||||||
Metal-Diversified — 0.6% |
| |||||||
Glencore PLC | 34,891 | 183,572 | ||||||
|
| |||||||
| Security Description | Shares | Value (Note 2) | ||||||
Oil Companies-Exploration & Production — 1.1% |
| |||||||
Diamondback Energy, Inc.† | 703 | $ | 88,753 | |||||
EOG Resources, Inc. | 1,691 | 182,476 | ||||||
Hess Corp. | 1,536 | 72,914 | ||||||
|
| |||||||
| 344,143 | ||||||||
|
| |||||||
Pipelines — 0.6% |
| |||||||
Kinder Morgan, Inc. | 10,954 | 197,939 | ||||||
|
| |||||||
Real Estate Investment Trusts — 0.5% |
| |||||||
Public Storage | 748 | 156,332 | ||||||
|
| |||||||
Real Estate Management/Services — 0.4% |
| |||||||
CBRE Group, Inc., Class A† | 563 | 24,383 | ||||||
Vonovia SE | 2,277 | 112,712 | ||||||
|
| |||||||
| 137,095 | ||||||||
|
| |||||||
Rental Auto/Equipment — 0.6% |
| |||||||
AerCap Holdings NV† | 3,409 | 179,348 | ||||||
|
| |||||||
Retail-Apparel/Shoe — 0.4% |
| |||||||
L Brands, Inc. | 2,180 | 131,280 | ||||||
|
| |||||||
Schools — 0.8% |
| |||||||
New Oriental Education & Technology Group, Inc. ADR | 2,731 | 256,714 | ||||||
| �� |
|
| ||||||
Semiconductor Components-Integrated Circuits — 1.3% |
| |||||||
QUALCOMM, Inc. | 2,078 | 133,033 | ||||||
Taiwan Semiconductor Manufacturing Co., Ltd. | 34,520 | 265,254 | ||||||
|
| |||||||
| 398,287 | ||||||||
|
| |||||||
Semiconductor Equipment — 0.9% |
| |||||||
KLA-Tencor Corp. | 1,557 | 163,594 | ||||||
Teradyne, Inc. | 2,613 | 109,406 | ||||||
|
| |||||||
| 273,000 | ||||||||
|
| |||||||
Steel-Producers — 0.5% |
| |||||||
ArcelorMittal† | 5,014 | 162,002 | ||||||
|
| |||||||
Telephone-Integrated — 0.9% |
| |||||||
SoftBank Group Corp. | 3,600 | 284,411 | ||||||
|
| |||||||
Tobacco — 1.2% |
| |||||||
British American Tobacco PLC | 5,535 | 373,560 | ||||||
|
| |||||||
Transport-Truck — 1.0% |
| |||||||
Knight-Swift Transportation Holdings, Inc. | 4,341 | 189,789 | ||||||
Old Dominion Freight Line, Inc. | 988 | 129,971 | ||||||
|
| |||||||
| 319,760 | ||||||||
|
| |||||||
Web Portals/ISP — 0.8% |
| |||||||
Alphabet, Inc., Class C† | 241 | 252,182 | ||||||
|
| |||||||
X-Ray Equipment — 0.5% |
| |||||||
Hologic, Inc.† | 3,368 | 143,982 | ||||||
|
| |||||||
Total Common Stocks | 18,746,783 | |||||||
|
| |||||||
EXCHANGE-TRADED FUNDS — 0.3% | ||||||||
iShares MSCI Japan ETF | 1,755 | 105,177 | ||||||
|
| |||||||
| ||
| 57 |
Table of Contents
Anchor Series Trust SA Wellington Multi-Asset Income Portfolio#
PORTFOLIO OF INVESTMENTS — December 31, 2017 — (continued)
| Security Description | Principal Amount(2) | Value (Note 2) | ||||||||||
FOREIGN GOVERNMENT OBLIGATIONS — 18.0% |
| |||||||||||
Sovereign — 18.0% |
| |||||||||||
Commonwealth of Australia | AUD | 125,000 | $ | 98,462 | ||||||||
Commonwealth of Australia | AUD | 25,000 | 19,681 | |||||||||
Commonwealth of Australia | AUD | 55,000 | 48,225 | |||||||||
Commonwealth of Australia | AUD | 65,000 | 59,588 | |||||||||
Commonwealth of Australia | AUD | 25,000 | 21,750 | |||||||||
Federal Republic of Germany | EUR | 115,000 | 139,270 | |||||||||
Federal Republic of Germany | EUR | 25,000 | 30,079 | |||||||||
Federal Republic of Germany | EUR | 35,000 | 41,573 | |||||||||
Federal Republic of Germany | EUR | 35,000 | 54,600 | |||||||||
Federal Republic of Germany | EUR | 10,000 | 15,742 | |||||||||
Federal Republic of Germany | EUR | 380,000 | 485,064 | |||||||||
Federal Republic of Germany | EUR | 15,000 | 29,215 | |||||||||
Government of Canada | CAD | 45,000 | 34,343 | |||||||||
Government of Canada | CAD | 15,000 | 14,926 | |||||||||
Government of Canada | CAD | 15,000 | 15,644 | |||||||||
Government of Canada | CAD | 10,000 | 11,672 | |||||||||
Government of Finland | EUR | 15,000 | 17,824 | |||||||||
Government of Finland | EUR | 15,000 | 19,501 | |||||||||
Government of France | EUR | 115,000 | 139,369 | |||||||||
Government of France | EUR | 165,000 | 197,932 | |||||||||
| Security Description | Principal Amount(2) | Value (Note 2) | ||||||||||
Sovereign (continued) |
| |||||||||||
Government of France | EUR | 45,000 | $ | 54,584 | ||||||||
Government of France | EUR | 85,000 | 101,651 | |||||||||
Government of France | EUR | 20,000 | 24,793 | |||||||||
Government of France | EUR | 25,000 | 29,468 | |||||||||
Government of France | EUR | 55,000 | 89,006 | |||||||||
Government of France | EUR | 25,000 | 49,227 | |||||||||
Government of Japan | JPY | 13,250,000 | 118,112 | |||||||||
Government of Japan | JPY | 35,000,000 | 312,305 | |||||||||
Government of Japan | JPY | 25,500,000 | 227,890 | |||||||||
Government of Japan | JPY | 31,400,000 | 264,142 | |||||||||
Government of Japan | JPY | 25,000,000 | 227,338 | |||||||||
Government of Japan | JPY | 4,100,000 | 31,932 | |||||||||
Government of Japan | JPY | 2,200,000 | 20,509 | |||||||||
Government of Japan | JPY | 11,100,000 | 98,274 | |||||||||
Government of Japan | JPY | 11,450,000 | 106,187 | |||||||||
Government of Japan | JPY | 2,050,000 | 19,022 | |||||||||
Government of Japan | JPY | 10,500,000 | 112,429 | |||||||||
Government of Japan | JPY | 5,400,000 | 59,952 | |||||||||
Government of Japan | JPY | 1,200,000 | 13,519 | |||||||||
Government of Japan | JPY | 1,250,000 | 13,218 | |||||||||
| ||
| 58 |
Table of Contents
Anchor Series Trust SA Wellington Multi-Asset Income Portfolio#
PORTFOLIO OF INVESTMENTS — December 31, 2017 — (continued)
| Security Description | Principal Amount(2) | Value (Note 2) | ||||||||||
FOREIGN GOVERNMENT OBLIGATIONS (continued) |
| |||||||||||
Sovereign (continued) |
| |||||||||||
Government of Japan | JPY | 7,000,000 | $ | 76,105 | ||||||||
Government of Malaysia | MYR | 75,000 | 18,302 | |||||||||
Government of Malaysia | MYR | 50,000 | 11,897 | |||||||||
Government of Netherlands | EUR | 20,000 | 24,475 | |||||||||
Government of Netherlands | EUR | 45,000 | 59,338 | |||||||||
Government of Netherlands | EUR | 10,000 | 16,325 | |||||||||
Kingdom of Belgium | EUR | 25,000 | 30,232 | |||||||||
Kingdom of Belgium | EUR | 10,000 | 12,412 | |||||||||
Kingdom of Belgium | EUR | 40,000 | 48,719 | |||||||||
Kingdom of Belgium | EUR | 10,000 | 13,102 | |||||||||
Kingdom of Belgium | EUR | 5,000 | 7,641 | |||||||||
Kingdom of Belgium | EUR | 25,000 | 33,457 | |||||||||
Kingdom of Belgium | EUR | 15,000 | 26,702 | |||||||||
Kingdom of Denmark | DKK | 130,000 | 23,464 | |||||||||
Kingdom of Denmark | DKK | 41,000 | 11,156 | |||||||||
Kingdom of Netherlands | EUR | 12,500 | 22,829 | |||||||||
Kingdom of Norway | NOK | 135,000 | 17,136 | |||||||||
Kingdom of Spain | EUR | 75,000 | 90,131 | |||||||||
Kingdom of Spain | EUR | 30,000 | 36,109 | |||||||||
Kingdom of Spain | EUR | 25,000 | 29,937 | |||||||||
| Security Description | Principal Amount(2) | Value (Note 2) | ||||||||||
Sovereign (continued) |
| |||||||||||
Kingdom of Spain | EUR | 80,000 | $ | 101,241 | ||||||||
Kingdom of Spain | EUR | 30,000 | 36,571 | |||||||||
Kingdom of Spain | EUR | 10,000 | 12,160 | |||||||||
Kingdom of Spain | EUR | 10,000 | 16,433 | |||||||||
Kingdom of Spain | EUR | 15,000 | 25,218 | |||||||||
Kingdom of Spain | EUR | 10,000 | 14,760 | |||||||||
Kingdom of Sweden | SEK | 80,000 | 10,136 | |||||||||
Kingdom of Sweden | SEK | 225,000 | 31,776 | |||||||||
Republic of Austria | EUR | 5,000 | 6,134 | |||||||||
Republic of Austria | EUR | 15,000 | 25,195 | |||||||||
Republic of Austria | EUR | 30,000 | 41,959 | |||||||||
Republic of Austria | EUR | 10,000 | 18,233 | |||||||||
Republic of Finland | EUR | 5,000 | 6,484 | |||||||||
Republic of Ireland | EUR | 20,000 | 24,613 | |||||||||
Republic of Ireland | EUR | 5,000 | 6,287 | |||||||||
Republic of Ireland | EUR | 5,000 | 7,157 | |||||||||
Republic of Italy | EUR | 105,000 | 126,142 | |||||||||
Republic of Italy | EUR | 40,000 | 48,323 | |||||||||
Republic of Italy | EUR | 160,000 | 192,283 | |||||||||
Republic of Italy | EUR | 100,000 | 120,658 | |||||||||
| ||
| 59 |
Table of Contents
Anchor Series Trust SA Wellington Multi-Asset Income Portfolio#
PORTFOLIO OF INVESTMENTS — December 31, 2017 — (continued)
| Security Description | Principal Amount(2) | Value (Note 2) | ||||||||||
FOREIGN GOVERNMENT OBLIGATIONS (continued) |
| |||||||||||
Sovereign (continued) |
| |||||||||||
Republic of Italy | EUR | 5,000 | $ | 6,227 | ||||||||
Republic of Italy | EUR | 35,000 | 47,141 | |||||||||
Republic of Italy | EUR | 10,000 | 15,376 | |||||||||
Republic of Italy | EUR | 55,000 | 86,259 | |||||||||
Republic of Poland | PLN | 200,000 | 57,811 | |||||||||
Republic of Poland | PLN | 40,000 | 10,868 | |||||||||
Republic of Poland | PLN | 65,000 | 21,315 | |||||||||
Republic of Singapore | SGD | 15,000 | 12,607 | |||||||||
United Kingdom Gilt Treasury | GBP | 40,000 | 53,470 | |||||||||
United Kingdom Gilt Treasury | GBP | 30,000 | 40,242 | |||||||||
United Kingdom Gilt Treasury | GBP | 15,000 | 20,304 | |||||||||
United Kingdom Gilt Treasury | GBP | 30,000 | 41,678 | |||||||||
United Kingdom Gilt Treasury | GBP | 9,000 | 13,045 | |||||||||
United Kingdom Gilt Treasury | GBP | 8,000 | 14,125 | |||||||||
United Kingdom Gilt Treasury | GBP | 80,000 | 147,542 | |||||||||
United Kingdom Gilt Treasury | GBP | 27,000 | 56,128 | |||||||||
United Kingdom Gilt Treasury | GBP | 14,000 | 28,985 | |||||||||
United Mexican States | MXN | 314,000 | 17,119 | |||||||||
United Mexican States | MXN | 149,600 | 9,285 | |||||||||
|
| |||||||||||
Total Foreign Government Obligations |
| |||||||||||
(cost $5,600,266) | 5,648,777 | |||||||||||
|
| |||||||||||
| Security Description | Principal Amount(2) | Value (Note 2) | ||||||||||
U.S. GOVERNMENT TREASURIES — 9.5% |
| |||||||||||
United States Treasury Bonds — 1.9% |
| |||||||||||
2.50% due 05/15/2046 | $ | 115,000 | $ | 109,394 | ||||||||
2.88% due 05/15/2043 | 50,000 | 51,412 | ||||||||||
3.00% due 11/15/2045 | 260,000 | 273,051 | ||||||||||
5.00% due 05/15/2037 | 110,000 | 150,825 | ||||||||||
|
| |||||||||||
| 584,682 | ||||||||||||
|
| |||||||||||
United States Treasury Notes — 7.6% |
| |||||||||||
0.75% due 01/31/2018 | 75,000 | 74,971 | ||||||||||
1.25% due 01/31/2019 | 325,000 | 322,969 | ||||||||||
1.38% due 04/30/2020 | 685,000 | 676,518 | ||||||||||
1.38% due 08/31/2023 | 550,000 | 524,326 | ||||||||||
1.63% due 12/31/2019 | 95,000 | 94,503 | ||||||||||
2.00% due 11/30/2020 | 55,000 | 55,051 | ||||||||||
2.00% due 11/15/2026 | 200,000 | 193,555 | ||||||||||
2.13% due 08/15/2021 | 60,000 | 60,087 | ||||||||||
2.25% due 07/31/2021 | 400,000 | 402,328 | ||||||||||
|
| |||||||||||
| 2,404,308 | ||||||||||||
|
| |||||||||||
Total U.S. Government Treasuries |
| 2,988,990 | ||||||||||
|
| |||||||||||
Total Long-Term Investment Securities |
| 27,489,727 | ||||||||||
|
| |||||||||||
SHORT-TERM INVESTMENT SECURITIES — 0.3% |
| |||||||||||
U.S. Government Treasuries — 0.3% |
| |||||||||||
United States Treasury Bills | 100,000 | 99,795 | ||||||||||
|
| |||||||||||
REPURCHASE AGREEMENTS — 12.6% |
| |||||||||||
Bank of America Securities LLC | 605,000 | 605,000 | ||||||||||
Barclays Capital, Inc. | 675,000 | 675,000 | ||||||||||
BNP Paribas SA | 1,160,000 | 1,160,000 | ||||||||||
Deutsche Bank AG | 445,000 | 445,000 | ||||||||||
RBS Securities, Inc. | 1,080,000 | 1,080,000 | ||||||||||
|
| |||||||||||
Total Repurchase Agreements |
| 3,965,000 | ||||||||||
|
| |||||||||||
TOTAL INVESTMENTS |
| 100.3 | % | 31,554,522 | ||||||||
Liabilities in excess of other assets | (0.3 | ) | (79,949 | ) | ||||||||
|
|
|
| |||||||||
NET ASSETS | 100.0 | % | $ | 31,474,573 | ||||||||
|
|
|
| |||||||||
| # | See Note 1 |
| † | Non-income producing security |
| * | Securities exempt from registration under Rule 144A of the Securities Act of 1933. These securities may be sold in transactions exempt from registration, normally to qualified institutional buyers. The Portfolio has no right to demand registration of these securities. At December 31, 2017, the aggregate value of these securities was $755,528 representing 2.4% of net assets. Unless otherwise indicated, these securities are not considered to be illiquid. |
| (1) | See Note 2 for details of Joint Repurchase Agreements. |
| (2) | Denominated in United States dollars unless otherwise indicated. |
| ||
| 60 |
Table of Contents
Anchor Series Trust SA Wellington Multi-Asset Income Portfolio#
PORTFOLIO OF INVESTMENTS — December 31, 2017 — (continued)
| (3) | See Note 6 for cost of investments on a tax basis. |
| ADR | — American Depositary Receipt |
| AUD | — Australian Dollar |
| CAD | — Canadian Dollar |
| DKK | — Danish Krone |
| ETF | — Exchanged-Traded Fund |
| EUR | — Euro Currency |
| GBP | — British Sterling Pound |
| JPY | — Japanese Yen |
| MXN | — Mexican Peso |
| MYR | — Myalaysian Ringgit |
| NOK | — Norwegian Krone |
| PLN | — Polish Zloty |
| SEK | — Swedish Krona |
| SGD | — Singapore Dollar |
| Futures Contracts | ||||||||||||||||||||
| Number of Contracts | Type | Description | Expiration Month | Notional Basis* | Notional Value* | Unrealized Appreciation (Depreciation) | ||||||||||||||
| 4 | Long | Mini MSCI EAFE Index | March 2018 | $ | 407,185 | $ | 409,100 | $ | 1,915 | |||||||||||
| 4 | Long | S&P 500 E-Mini Index | March 2018 | 534,712 | 535,200 | 488 | ||||||||||||||
| 6 | Long | U.S. Treasury 10 Year Notes | March 2018 | 745,539 | 744,281 | (1,258 | ) | |||||||||||||
|
| |||||||||||||||||||
| $ | 1,145 | |||||||||||||||||||
|
| |||||||||||||||||||
| * | Notional basis refers to the contractual amount agreed upon at inception of the open contract, notional value represents the current value of the open contract. |
| Forward Foreign Currency Contracts | ||||||||||||||||||||||
| Counterparty | Contract to Deliver | In Exchange For | Delivery Date | Unrealized Appreciation | Unrealized Depreciation | |||||||||||||||||
Australia and New Zealand Banking Group Ltd. | SGD | 15,000 | USD | 11,146 | 01/09/2018 | $ | — | $ | (70 | ) | ||||||||||||
|
|
|
| |||||||||||||||||||
Bank of America, N.A. | AUD | 22,000 | USD | 16,766 | 01/09/2018 | — | (400 | ) | ||||||||||||||
| EUR | 1,996,000 | USD | 2,362,432 | 01/09/2018 | — | (33,323 | ) | |||||||||||||||
| GBP | 558,000 | USD | 754,240 | 01/09/2018 | 717 | — | ||||||||||||||||
| JPY | 124,256,000 | USD | 1,107,524 | 01/09/2018 | 4,518 | — | ||||||||||||||||
| RUB | 1,486,000 | USD | 25,812 | 01/09/2018 | 25 | — | ||||||||||||||||
| USD | 550,234 | AUD | 717,000 | 01/09/2018 | 9,200 | — | ||||||||||||||||
| USD | 681,026 | CAD | 876,000 | 01/09/2018 | 15,999 | — | ||||||||||||||||
| USD | 652,278 | DKK | 4,102,000 | 01/09/2018 | 9,084 | — | ||||||||||||||||
| USD | 598,314 | GBP | 444,000 | 01/09/2018 | 1,263 | — | ||||||||||||||||
| USD | 550,112 | MXN | 10,526,000 | 01/09/2018 | — | (15,384 | ) | |||||||||||||||
| USD | 642,304 | NOK | 5,348,000 | 01/09/2018 | 9,177 | — | ||||||||||||||||
| USD | 643,286 | PLN | 2,288,000 | 01/09/2018 | 14,007 | — | ||||||||||||||||
| USD | 25,823 | RUB | 1,486,000 | 01/09/2018 | — | (35 | ) | |||||||||||||||
| USD | 684,253 | SEK | 5,747,000 | 01/09/2018 | 16,583 | — | ||||||||||||||||
| USD | 670,016 | SGD | 902,000 | 01/09/2018 | 4,475 | — | ||||||||||||||||
| USD | 25,706 | RUB | 1,486,000 | 02/07/2018 | — | (74 | ) | |||||||||||||||
| ZAR | 280,000 | USD | 21,923 | 01/09/2018 | — | (687 | ) | |||||||||||||||
|
|
|
| |||||||||||||||||||
| 85,048 | (49,903 | ) | ||||||||||||||||||||
|
|
|
| |||||||||||||||||||
Barclays Bank PLC | EUR | 340,000 | USD | 404,764 | 01/09/2018 | — | (3,330 | ) | ||||||||||||||
| USD | 1,200 | SEK | 10,000 | 01/09/2018 | 19 | — | ||||||||||||||||
|
|
|
| |||||||||||||||||||
| 19 | (3,330 | ) | ||||||||||||||||||||
|
|
|
| |||||||||||||||||||
BNP Paribas SA | EUR | 5,000 | USD | 5,967 | 01/09/2018 | — | (34 | ) | ||||||||||||||
| EUR | 25,000 | USD | 30,093 | 02/07/2018 | 36 | — | ||||||||||||||||
|
|
|
| |||||||||||||||||||
| 36 | (34 | ) | ||||||||||||||||||||
|
|
|
| |||||||||||||||||||
Canadian Imperial Bank of Commerce | USD | 90,736 | CAD | 116,000 | 01/09/2018 | 1,564 | — | |||||||||||||||
|
|
|
| |||||||||||||||||||
| ||
| 61 |
Table of Contents
Anchor Series Trust SA Wellington Multi-Asset Income Portfolio#
PORTFOLIO OF INVESTMENTS — December 31, 2017 — (continued)
| Forward Foreign Currency Contracts | ||||||||||||||||||||||
| Counterparty | Contract to Deliver | In Exchange For | Delivery Date | Unrealized Appreciation | Unrealized Depreciation | |||||||||||||||||
Citibank N.A. | AUD | 13,000 | USD | 9,850 | 01/09/2018 | $ | — | $ | (293 | ) | ||||||||||||
| DKK | 94,000 | USD | 15,090 | 01/09/2018 | — | (65 | ) | |||||||||||||||
| GBP | 15,000 | USD | 20,290 | 02/07/2018 | 15 | — | ||||||||||||||||
| JPY | 68,847,000 | USD | 614,725 | 01/09/2018 | 3,578 | — | ||||||||||||||||
| NOK | 156,000 | USD | 18,868 | 01/09/2018 | — | (136 | ) | |||||||||||||||
| PLN | 2,596,000 | USD | 733,447 | 01/09/2018 | — | (12,328 | ) | |||||||||||||||
| SEK | 35,000 | USD | 4,193 | 01/09/2018 | — | (75 | ) | |||||||||||||||
| USD | 4,512 | AUD | 6,000 | 01/09/2018 | 170 | — | ||||||||||||||||
| USD | 7,812 | CAD | 10,000 | 01/09/2018 | 145 | — | ||||||||||||||||
| USD | 33,120 | EUR | 28,000 | 01/09/2018 | 488 | — | ||||||||||||||||
| USD | 32,863 | ILS | 115,000 | 01/09/2018 | 194 | — | ||||||||||||||||
| USD | 407,727 | JPY | 45,664,000 | 01/09/2018 | — | (2,373 | ) | |||||||||||||||
| USD | 13,750 | NOK | 114,000 | 01/09/2018 | 137 | — | ||||||||||||||||
| USD | 4,155 | SEK | 35,000 | 01/09/2018 | 113 | — | ||||||||||||||||
| USD | 40,090 | SGD | 54,000 | 01/09/2018 | 290 | — | ||||||||||||||||
| USD | 612,956 | ZAR | 7,863,000 | 01/09/2018 | 21,973 | — | ||||||||||||||||
|
|
|
| |||||||||||||||||||
| 27,103 | (15,270 | ) | ||||||||||||||||||||
|
|
|
| |||||||||||||||||||
Goldman Sachs International | BRL | 464,000 | USD | 140,088 | 01/03/2018 | 207 | — | |||||||||||||||
| CNY | 1,560,000 | USD | 235,845 | 01/09/2018 | — | (3,712 | ) | |||||||||||||||
| EUR | 10,000 | USD | 11,825 | 01/09/2018 | — | (178 | ) | |||||||||||||||
| MXN | 10,520,000 | USD | 560,156 | 01/09/2018 | 25,733 | — | ||||||||||||||||
| MYR | 49,000 | USD | 11,998 | 01/09/2018 | — | (69 | ) | |||||||||||||||
| MYR | 75,000 | USD | 18,490 | 02/07/2018 | 60 | — | ||||||||||||||||
| NZD | 10,000 | USD | 6,918 | 01/09/2018 | — | (169 | ) | |||||||||||||||
| RUB | 1,486,000 | USD | 25,823 | 01/09/2018 | 35 | — | ||||||||||||||||
| SGD | 943,000 | USD | 701,308 | 01/09/2018 | — | (3,842 | ) | |||||||||||||||
| TWD | 2,371,000 | USD | 79,372 | 01/09/2018 | — | (645 | ) | |||||||||||||||
| USD | 144,055 | BRL | 464,000 | 01/03/2018 | — | (4,173 | ) | |||||||||||||||
| USD | 25,075 | INR | 1,620,000 | 01/09/2018 | 305 | — | ||||||||||||||||
| USD | 63,545 | KRW | 68,720,000 | 01/09/2018 | 824 | — | ||||||||||||||||
| USD | 101,374 | MXN | 1,910,000 | 01/09/2018 | — | (4,344 | ) | |||||||||||||||
| USD | 48,737 | MYR | 200,000 | 01/09/2018 | 516 | — | ||||||||||||||||
| USD | 25,318 | RUB | 1,486,000 | 01/09/2018 | 469 | — | ||||||||||||||||
| USD | 16,526 | SEK | 140,000 | 01/09/2018 | 547 | — | ||||||||||||||||
| USD | 63,214 | SGD | 85,000 | 01/09/2018 | 346 | — | ||||||||||||||||
| USD | 139,557 | BRL | 464,000 | 02/02/2018 | — | (146 | ) | |||||||||||||||
|
|
|
| |||||||||||||||||||
| 29,042 | (17,278 | ) | ||||||||||||||||||||
|
|
|
| |||||||||||||||||||
HSBC Bank USA | SGD | 16,000 | USD | 11,845 | 01/09/2018 | — | (120 | ) | ||||||||||||||
| USD | 36,399 | ZAR | 500,000 | 01/09/2018 | 3,976 | — | ||||||||||||||||
|
|
|
| |||||||||||||||||||
| 3,976 | (120 | ) | ||||||||||||||||||||
|
|
|
| |||||||||||||||||||
JPMorgan Chase Bank | AUD | 22,000 | USD | 16,697 | 01/09/2018 | — | (468 | ) | ||||||||||||||
| CAD | 21,000 | USD | 16,550 | 01/09/2018 | — | (159 | ) | |||||||||||||||
| EUR | 100,000 | USD | 118,941 | 01/09/2018 | — | (1,087 | ) | |||||||||||||||
| EUR | 15,000 | USD | 18,033 | 02/07/2018 | — | (1 | ) | |||||||||||||||
| GBP | 6,000 | USD | 8,050 | 01/09/2018 | — | (53 | ) | |||||||||||||||
| JPY | 8,030,000 | USD | 71,536 | 01/09/2018 | 255 | — | ||||||||||||||||
| NOK | 81,000 | USD | 9,841 | 01/09/2018 | — | (27 | ) | |||||||||||||||
| NZD | 13,000 | USD | 9,149 | 01/09/2018 | — | (63 | ) | |||||||||||||||
| SEK | 270,000 | USD | 32,126 | 01/09/2018 | — | (800 | ) | |||||||||||||||
| ||
| 62 |
Table of Contents
Anchor Series Trust SA Wellington Multi-Asset Income Portfolio#
PORTFOLIO OF INVESTMENTS — December 31, 2017 — (continued)
| Forward Foreign Currency Contracts | ||||||||||||||||||||||
| Counterparty | Contract to Deliver | In Exchange For | Delivery Date | Unrealized Appreciation | Unrealized Depreciation | |||||||||||||||||
| USD | 9,892 | AUD | 13,000 | 01/09/2018 | $ | 251 | $ | — | ||||||||||||||
| USD | 3,927 | CAD | 5,000 | 01/09/2018 | 52 | — | ||||||||||||||||
| USD | 48,528 | EUR | 41,000 | 01/09/2018 | 684 | — | ||||||||||||||||
| USD | 8,097 | GBP | 6,000 | 01/09/2018 | 6 | — | ||||||||||||||||
| USD | 25,624 | JPY | 2,850,000 | 01/09/2018 | — | (325 | ) | |||||||||||||||
| USD | 43,335 | NOK | 362,000 | 01/09/2018 | 763 | — | ||||||||||||||||
| USD | 20,744 | NZD | 30,000 | 01/09/2018 | 516 | — | ||||||||||||||||
| USD | 80,995 | SEK | 676,000 | 01/09/2018 | 1,442 | — | ||||||||||||||||
| USD | 157 | ZAR | 2,000 | 01/09/2018 | 4 | — | ||||||||||||||||
| USD | 18,712 | SEK | 153,000 | 02/07/2018 | — | (22 | ) | |||||||||||||||
|
|
|
| |||||||||||||||||||
| 3,973 | (3,005 | ) | ||||||||||||||||||||
|
|
|
| |||||||||||||||||||
Morgan Stanley and Co. International PLC | DKK | 4,245,000 | USD | 676,583 | 01/09/2018 | — | (7,835 | ) | ||||||||||||||
| EUR | 340,000 | USD | 404,629 | 01/09/2018 | — | (3,466 | ) | |||||||||||||||
| NOK | 5,186,000 | USD | 629,800 | 01/09/2018 | — | (1,947 | ) | |||||||||||||||
| NZD | 54,000 | USD | 36,912 | 01/09/2018 | — | (1,355 | ) | |||||||||||||||
| SEK | 3,311,000 | USD | 396,088 | 01/09/2018 | — | (7,682 | ) | |||||||||||||||
| USD | 8,346 | AUD | 11,000 | 01/09/2018 | 237 | — | ||||||||||||||||
| USD | 113,174 | DKK | 710,000 | 01/09/2018 | 1,299 | — | ||||||||||||||||
| USD | 20,314 | GBP | 15,000 | 01/09/2018 | — | (58 | ) | |||||||||||||||
| USD | 24,790 | JPY | 2,774,000 | 01/09/2018 | — | (166 | ) | |||||||||||||||
| USD | 106,266 | NOK | 875,000 | 01/09/2018 | 324 | — | ||||||||||||||||
| USD | 175,645 | SEK | 1,465,000 | 01/09/2018 | 3,009 | — | ||||||||||||||||
| USD | 75,189 | ZAR | 1,035,000 | 01/09/2018 | 8,386 | — | ||||||||||||||||
| ZAR | 8,083,000 | USD | 587,201 | 01/09/2018 | — | (65,493 | ) | |||||||||||||||
|
|
|
| |||||||||||||||||||
| 13,255 | (88,002 | ) | ||||||||||||||||||||
|
|
|
| |||||||||||||||||||
Royal Bank of Canada | AUD | 15,000 | USD | 11,386 | 01/09/2018 | — | (318 | ) | ||||||||||||||
| CAD | 952,000 | USD | 738,177 | 01/09/2018 | — | (19,320 | ) | |||||||||||||||
| USD | 365,986 | CAD | 472,000 | 01/09/2018 | 9,580 | — | ||||||||||||||||
|
|
|
| |||||||||||||||||||
| 9,580 | (19,638 | ) | ||||||||||||||||||||
|
|
|
| |||||||||||||||||||
Standard Chartered Bank | NOK | 203,000 | USD | 24,274 | 01/09/2018 | — | (455 | ) | ||||||||||||||
| USD | 27,800 | HKD | 217,000 | 01/09/2018 | — | (22 | ) | |||||||||||||||
|
|
|
| |||||||||||||||||||
| — | (477 | ) | ||||||||||||||||||||
|
|
|
| |||||||||||||||||||
State Street Bank and Trust Company | AUD | 198,000 | USD | 149,550 | 01/09/2018 | — | (4,938 | ) | ||||||||||||||
| CAD | 144,000 | USD | 112,102 | 01/09/2018 | — | (2,478 | ) | |||||||||||||||
| EUR | 3,000 | USD | 3,543 | 01/09/2018 | — | (57 | ) | |||||||||||||||
| GBP | 39,000 | USD | 52,335 | 01/09/2018 | — | (331 | ) | |||||||||||||||
| JPY | 3,004,000 | USD | 26,614 | 01/09/2018 | — | (53 | ) | |||||||||||||||
| MXN | 1,013,000 | USD | 53,981 | 01/09/2018 | 2,520 | — | ||||||||||||||||
| NZD | 6,000 | USD | 4,270 | 01/09/2018 | 18 | — | ||||||||||||||||
| USD | 19,013 | EUR | 16,000 | 01/09/2018 | 192 | — | ||||||||||||||||
| USD | 3,184 | SEK | 27,000 | 01/09/2018 | 109 | — | ||||||||||||||||
| USD | 614,819 | ZAR | 7,861,000 | 01/09/2018 | 19,949 | — | ||||||||||||||||
| ZAR | 7,863,000 | USD | 614,975 | 01/09/2018 | — | (19,954 | ) | |||||||||||||||
|
|
|
| |||||||||||||||||||
| 22,788 | (27,811 | ) | ||||||||||||||||||||
|
|
|
| |||||||||||||||||||
Toronto Dominion Bank | AUD | 859,000 | USD | 651,700 | 01/09/2018 | — | (18,528 | ) | ||||||||||||||
| EUR | 350,000 | USD | 415,985 | 01/09/2018 | — | (4,112 | ) | |||||||||||||||
| JPY | 2,601,000 | USD | 23,121 | 02/07/2018 | — | (1 | ) | |||||||||||||||
| SEK | 2,710,000 | USD | 325,153 | 01/09/2018 | — | (5,327 | ) | |||||||||||||||
| ||
| 63 |
Table of Contents
Anchor Series Trust SA Wellington Multi-Asset Income Portfolio#
PORTFOLIO OF INVESTMENTS — December 31, 2017 — (continued)
| Forward Foreign Currency Contracts | ||||||||||||||||||||||
| Counterparty | Contract to Deliver | In Exchange For | Delivery Date | Unrealized Appreciation | Unrealized Depreciation | |||||||||||||||||
| USD | 332,299 | AUD | 438,000 | 01/09/2018 | $ | 9,447 | $ | — | ||||||||||||||
| USD | 175,654 | SEK | 1,464,000 | 01/09/2018 | 2,878 | — | ||||||||||||||||
| USD | 18,050 | EUR | 15,000 | 02/07/2018 | — | (16 | ) | |||||||||||||||
|
|
|
| |||||||||||||||||||
| 12,325 | (27,984 | ) | ||||||||||||||||||||
|
|
|
| |||||||||||||||||||
USB AG | CHF | 12,000 | USD | 12,227 | 01/09/2018 | — | (92 | ) | ||||||||||||||
| SEK | 114,000 | USD | 13,460 | 01/09/2018 | — | (442 | ) | |||||||||||||||
|
|
|
| |||||||||||||||||||
| — | (534 | ) | ||||||||||||||||||||
|
|
|
| |||||||||||||||||||
Net Unrealized Appreciation/(Depreciation) | $ | 208,709 | $ | (253,456 | ) | |||||||||||||||||
|
|
|
| |||||||||||||||||||
AUD — Australian Dollar
BRL — Brazilian Real
CAD — Canadian Dollar
CHF — Swiss Franc
CNY — Chinese Yuan
DKK — Danish Krone
EUR — Euro Currency
GBP — British Pound Sterling
ILS — Israeli Shekel
INR — Indian Rupee
JPY — Japanese Yen
KRW — South Korean won
MXN — Mexican Peso
MYR — Myalaysian Ringgit
NOK — Norwegian Krone
NZD — New Zealand Dollar
PLN — Polish Zloty
RUB — Russian Ruble
SEK — Swedish Krona
SGD — Singapore Dollar
TWD — Taiwan Dollar
USD — United States Dollar
ZAR — South African Rand
The following is a summary of the inputs used to value the Portfolio’s net assets as of December 31, 2017 (see Note 2):
| Level 1 - Unadjusted Quoted Prices | Level 2 - Other Observable Inputs | Level 3 - Significant Unobservable Inputs | Total | |||||||||||||
ASSETS: | ||||||||||||||||
Investments at Value:* | ||||||||||||||||
Common Stocks | $ | 13,583,191 | $ | 5,163,592 | ** | $ | — | $ | 18,746,783 | |||||||
Exchange-Traded Funds | 105,177 | — | — | 105,177 | ||||||||||||
Foreign Government Obligations | — | 5,648,777 | — | 5,648,777 | ||||||||||||
U.S. Government Treasuries | — | 2,988,990 | — | 2,988,990 | ||||||||||||
Short-Term Investment Securities | — | 99,795 | — | 99,795 | ||||||||||||
Repurchase Agreements | — | 3,965,000 | — | 3,965,000 | ||||||||||||
|
|
|
|
|
|
|
| |||||||||
Total Investments at Value | $ | 13,688,368 | $ | 17,866,154 | $ | — | $ | 31,554,522 | ||||||||
|
|
|
|
|
|
|
| |||||||||
Other Financial Instruments:+ | ||||||||||||||||
Futures Contracts | $ | 2,403 | $ | — | $ | — | $ | 2,403 | ||||||||
Forward Foreign Currency Contracts | — | 208,709 | — | 208,709 | ||||||||||||
|
|
|
|
|
|
|
| |||||||||
| $ | 2,403 | $ | 208,709 | $ | — | $ | 211,112 | |||||||||
|
|
|
|
|
|
|
| |||||||||
LIABILITIES | ||||||||||||||||
Other Financial Instruments:+ | ||||||||||||||||
Futures Contracts | $ | 1,258 | $ | — | $ | — | $ | 1,258 | ||||||||
Forward Foreign Currency Contracts | — | 253,456 | — | 253,456 | ||||||||||||
|
|
|
|
|
|
|
| |||||||||
| $ | 1,258 | $ | 253,456 | $ | — | $ | 254,714 | |||||||||
|
|
|
|
|
|
|
| |||||||||
| * | For a detailed presentation of investments, please refer to the Portfolio of Investments. |
| ** | Repesents foreign equity securities that have been fair valued in accordance with pricing procedures approved by the Board (see Note 2). |
| + | Other Financial Instruments are derivative Instruments, not reflected in the Portfolio of Investments, such as futures, forward, swap and written option contracts, which are valued at the unrealized appreciation (depreciation) on the instrument. |
The Portfolio’s policy is to recongnize transfers between Levels as of the end of the reporting period. Securities currently valued at $1,885,329 were transferred from Level 1 to Level 2 due to foreign equity securities whose values were adjusted for fair value pricing procedures for foreign equity securities. There were no additional transfers between Levels during the reporting period.
See Notes to Financial Statements
| ||
| 64 |
Table of Contents
Anchor Series Trust
STATEMENTS OF ASSETS AND LIABILITIES — December 31, 2017
| SA Wellington Government and Quality Bond Portfolio†† | SA Edge Asset Allocation Portfolio†† | SA Wellington Growth and Income Portfolio†† | SA Wellington Growth Portfolio†† | |||||||||||||
ASSETS: | ||||||||||||||||
Investments at value (unaffiliated)* | $ | 1,552,012,696 | $ | 194,346,918 | $ | 200,602,981 | $ | 396,172,843 | ||||||||
Repurchase agreements (cost approximates value) | 180,795,000 | 2,101,000 | 2,560,000 | 4,700,000 | ||||||||||||
Cash | 2,482 | 11,606 | 2,320 | 992 | ||||||||||||
Foreign cash* | — | — | — | 14,895 | ||||||||||||
Cash collateral for futures contracts | — | — | — | — | ||||||||||||
Due from broker | — | — | — | — | ||||||||||||
Receivable for: | ||||||||||||||||
Fund shares sold | 23,768,564 | 306,810 | — | 6,318 | ||||||||||||
Dividends and interest | 7,971,306 | 784,734 | 139,029 | 436,872 | ||||||||||||
Investments sold | — | 511,706 | — | — | ||||||||||||
Investments sold on an extended settlement basis | 9,051,696 | — | — | — | ||||||||||||
Prepaid expenses and other assets | 6,778 | 5,008 | 4,803 | 5,180 | ||||||||||||
Due from adviser | — | 4,633 | — | — | ||||||||||||
Due from investment adviser for expense reimbursements/fee waivers | — | — | — | — | ||||||||||||
Variation margin on futures contracts | — | — | — | — | ||||||||||||
Unrealized appreciation on forward foreign currency contracts | — | — | — | — | ||||||||||||
|
| |||||||||||||||
Total assets | 1,773,608,522 | 198,072,415 | 203,309,133 | 401,337,100 | ||||||||||||
|
| |||||||||||||||
LIABILITIES: | ||||||||||||||||
Payable for: | ||||||||||||||||
Fund shares redeemed | 2,237,684 | 195,317 | 665,488 | 1,302,047 | ||||||||||||
Investments purchased | — | 193,779 | 367,974 | 303,032 | ||||||||||||
Investments purchased on an extended settlement basis | 180,258,012 | — | — | — | ||||||||||||
Investment advisory and management fees | 703,462 | 111,312 | 115,875 | 245,327 | ||||||||||||
Service fees — Class 2 | 3,475 | 1,884 | — | 2,290 | ||||||||||||
Service fees — Class 3 | 155,268 | 13,791 | — | 21,343 | ||||||||||||
Transfer agent fees and expenses | 630 | 373 | 115 | 516 | ||||||||||||
Trustees’ fees and expenses | 6,487 | 1,225 | 1,194 | 1,935 | ||||||||||||
Other accrued expenses | 264,323 | 93,826 | 69,439 | 103,772 | ||||||||||||
Variation margin on futures contracts | 79,016 | — | — | — | ||||||||||||
Due to custodian for foreign cash* | — | — | — | — | ||||||||||||
Due to broker | 8,686 | — | — | — | ||||||||||||
Unrealized depreciation on forward foreign currency contracts | — | — | — | — | ||||||||||||
Forward sales contracts, at value# | 9,044,730 | — | — | — | ||||||||||||
|
| |||||||||||||||
Total liabilities | 192,761,773 | 611,507 | 1,220,085 | 1,980,262 | ||||||||||||
|
| |||||||||||||||
Net Assets | $ | 1,580,846,749 | $ | 197,460,908 | $ | 202,089,048 | $ | 399,356,838 | ||||||||
|
| |||||||||||||||
NET ASSETS REPRESENTED BY: | ||||||||||||||||
Capital paid-in | $ | 1,538,585,790 | $ | 163,627,606 | $ | 131,207,421 | $ | 294,591,204 | ||||||||
Accumulated undistributed net investment income (loss) | 24,776,826 | 4,346,642 | 1,590,017 | 3,443,257 | ||||||||||||
Accumulated undistributed net realized gain (loss) on investments, futures contracts, options contracts, forward sales contracts and foreign exchange transactions | (2,241,214 | ) | 8,507,802 | 19,391,696 | 39,147,112 | |||||||||||
Unrealized appreciation (depreciation) on investments | 19,381,666 | 20,978,737 | 49,899,914 | 62,175,747 | ||||||||||||
Unrealized appreciation (depreciation) on futures contracts | 336,715 | — | — | — | ||||||||||||
Unrealized foreign exchange gain (loss) on other assets and liabilities | — | 121 | — | (482 | ) | |||||||||||
Unrealized appreciation (depreciation) on forward sales contracts | 6,966 | — | — | — | ||||||||||||
|
| |||||||||||||||
NET ASSETS | $ | 1,580,846,749 | $ | 197,460,908 | $ | 202,089,048 | $ | 399,356,838 | ||||||||
|
| |||||||||||||||
Class 1 (unlimited shares authorized): | ||||||||||||||||
Net assets | $ | 801,507,139 | $ | 117,878,730 | $ | 202,089,048 | $ | 281,486,000 | ||||||||
Shares of beneficial interest issued and outstanding | 53,303,150 | 8,260,326 | 13,391,437 | 9,047,815 | ||||||||||||
Net asset value, offering and redemption price per share | $ | 15.04 | $ | 14.27 | $ | 15.09 | $ | 31.11 | ||||||||
|
| |||||||||||||||
Class 2 (unlimited shares authorized): | ||||||||||||||||
Net assets | $ | 27,824,011 | $ | 14,758,153 | $ | — | $ | 18,004,867 | ||||||||
Shares of beneficial interest issued and outstanding | 1,845,992 | 1,035,528 | — | 578,008 | ||||||||||||
Net asset value, offering and redemption price per share | $ | 15.07 | $ | 14.25 | $ | — | $ | 31.15 | ||||||||
|
| |||||||||||||||
Class 3 (unlimited shares authorized): | ||||||||||||||||
Net assets | $ | 751,515,599 | $ | 64,824,025 | $ | — | $ | 99,865,971 | ||||||||
Shares of beneficial interest issued and outstanding | 50,115,143 | 4,580,519 | — | 3,213,967 | ||||||||||||
Net asset value, offering and redemption price per share | $ | 15.00 | $ | 14.15 | $ | — | $ | 31.07 | ||||||||
|
| |||||||||||||||
* Cost | ||||||||||||||||
Investments (unaffiliated) | $ | 1,532,631,030 | $ | 173,368,181 | $ | 150,703,067 | $ | 333,997,096 | ||||||||
|
| |||||||||||||||
Foreign cash | $ | — | $ | — | $ | — | $ | 14,896 | ||||||||
|
| |||||||||||||||
# Proceeds from forward sales contracts | $ | 9,051,696 | $ | — | $ | — | $ | — | ||||||||
|
| |||||||||||||||
| †† | See Note 1 |
See Notes to Financial Statements
| ||
| 65 |
Table of Contents
Anchor Series Trust
STATEMENTS OF ASSETS AND LIABILITIES — December 31, 2017 — (continued)
| SA Wellington Capital Appreciation Portfolio†† | SA Wellington Natural Resources Portfolio†† | SA BlackRock Multi-Asset Income Portfolio | SA Wellington Multi-Asset Income Portfolio†† | |||||||||||||
ASSETS: | ||||||||||||||||
Investments at value (unaffiliated)* | $ | 1,356,274,074 | $ | 114,599,500 | $ | 34,135,343 | $ | 27,589,522 | ||||||||
Repurchase agreements (cost approximates value) | 6,085,000 | 375,000 | — | 3,965,000 | ||||||||||||
Cash | 949,310 | 2,741 | 22,777 | 21,645 | ||||||||||||
Foreign cash* | 22 | 1,087 | 107,251 | — | ||||||||||||
Cash collateral for futures contracts | — | — | 96,970 | — | ||||||||||||
Due from broker | — | — | — | 29,422 | ||||||||||||
Receivable for: | ||||||||||||||||
Fund shares sold | 339 | 3,706 | 447,977 | 77,612 | ||||||||||||
Dividends and interest | 197,202 | 176,786 | 8 | 54,880 | ||||||||||||
Investments sold | 13,026,963 | 115,098 | — | 29,688 | ||||||||||||
Investments sold on an extended settlement basis | — | — | — | — | ||||||||||||
Prepaid expenses and other assets | 7,751 | 4,939 | 4,651 | 4,644 | ||||||||||||
Due from adviser | 4,209 | — | — | — | ||||||||||||
Due from investment adviser for expense reimbursements/fee waivers | — | — | 26,331 | 24,372 | ||||||||||||
Variation margin on futures contracts | — | — | 1,406 | 1,187 | ||||||||||||
Unrealized appreciation on forward foreign currency contracts | — | — | — | 208,709 | ||||||||||||
|
| |||||||||||||||
Total assets | 1,376,544,870 | 115,278,857 | 34,842,714 | 32,006,681 | ||||||||||||
|
| |||||||||||||||
LIABILITIES: | ||||||||||||||||
Payable for: | ||||||||||||||||
Fund shares redeemed | 11,516,827 | 1,996,263 | 21,875 | 14,279 | ||||||||||||
Investments purchased | 13,811,660 | 204,578 | — | 94,707 | ||||||||||||
Investments purchased on an extended settlement basis | — | — | — | 23,086 | ||||||||||||
Investment advisory and management fees | 816,314 | 70,238 | 28,615 | 25,974 | ||||||||||||
Service fees — Class 2 | 6,432 | 837 | — | — | ||||||||||||
Service fees — Class 3 | 139,366 | 15,782 | 3,626 | 2,622 | ||||||||||||
Transfer agent fees and expenses | 573 | 430 | 201 | 201 | ||||||||||||
Trustees’ fees and expenses | 5,342 | 907 | 604 | 584 | ||||||||||||
Other accrued expenses | 198,625 | 64,953 | 62,686 | 96,579 | ||||||||||||
Variation margin on futures contracts | — | — | 13,428 | 2,430 | ||||||||||||
Due to custodian for foreign cash* | — | — | — | 18,190 | ||||||||||||
Due to broker | — | — | 3,862 | — | ||||||||||||
Unrealized depreciation on forward foreign currency contracts | — | — | — | 253,456 | ||||||||||||
Forward sales contracts, at value# | — | — | — | — | ||||||||||||
|
| |||||||||||||||
Total liabilities | 26,495,139 | 2,353,988 | 134,897 | 532,108 | ||||||||||||
|
| |||||||||||||||
Net Assets | $ | 1,350,049,731 | $ | 112,924,869 | $ | 34,707,817 | $ | 31,474,573 | ||||||||
|
| |||||||||||||||
NET ASSETS REPRESENTED BY: | ||||||||||||||||
Capital paid-in | $ | 861,749,497 | $ | 163,500,375 | $ | 33,985,760 | $ | 28,496,793 | ||||||||
Accumulated undistributed net investment income (loss) | — | 2,340,423 | 831,459 | (85,145 | ) | |||||||||||
Accumulated undistributed net realized gain (loss) on investments, futures contracts, options contracts, forward sales contracts and foreign exchange transactions | 191,525,561 | (64,191,732 | ) | (600,452 | ) | 853,746 | ||||||||||
Unrealized appreciation (depreciation) on investments | 296,775,882 | 11,274,936 | 507,316 | 2,252,106 | ||||||||||||
Unrealized appreciation (depreciation) on futures contracts | — | — | (18,136 | ) | 1,145 | |||||||||||
Unrealized foreign exchange gain (loss) on other assets and liabilities | (1,209 | ) | 867 | 1,870 | (44,072 | ) | ||||||||||
Unrealized appreciation (depreciation) on forward sales contracts | — | — | — | — | ||||||||||||
|
| |||||||||||||||
NET ASSETS | $ | 1,350,049,731 | $ | 112,924,869 | $ | 34,707,817 | $ | 31,474,573 | ||||||||
|
| |||||||||||||||
Class 1 (unlimited shares authorized): | ||||||||||||||||
Net assets | $ | 656,955,198 | $ | 30,579,771 | $ | 16,571,894 | $ | 18,243,527 | ||||||||
Shares of beneficial interest issued and outstanding | 14,049,833 | 1,488,691 | 2,544,861 | 2,241,072 | ||||||||||||
Net asset value, offering and redemption price per share | $ | 46.76 | $ | 20.54 | $ | 6.51 | $ | 8.14 | ||||||||
|
| |||||||||||||||
Class 2 (unlimited shares authorized): | ||||||||||||||||
Net assets | $ | 50,028,062 | $ | 6,807,142 | $ | — | $ | — | ||||||||
Shares of beneficial interest issued and outstanding | 1,115,561 | 331,959 | — | — | ||||||||||||
Net asset value, offering and redemption price per share | $ | 44.85 | $ | 20.51 | $ | — | $ | — | ||||||||
|
| |||||||||||||||
Class 3 (unlimited shares authorized): | ||||||||||||||||
Net assets | $ | 643,066,471 | $ | 75,537,956 | $ | 18,135,923 | $ | 13,231,046 | ||||||||
Shares of beneficial interest issued and outstanding | 14,743,490 | 3,703,287 | 2,812,545 | 1,629,555 | ||||||||||||
Net asset value, offering and redemption price per share | $ | 43.62 | $ | 20.40 | $ | 6.45 | $ | 8.12 | ||||||||
|
| |||||||||||||||
* Cost | ||||||||||||||||
Investments (unaffiliated) | $ | 1,059,498,192 | $ | 103,324,564 | $ | 33,628,027 | $ | 25,337,416 | ||||||||
|
| |||||||||||||||
Foreign cash | $ | 22 | $ | 1,084 | $ | 105,381 | $ | (18,030 | ) | |||||||
|
| |||||||||||||||
# Proceeds from forward sales contracts | $ | — | $ | — | $ | — | $ | — | ||||||||
|
| |||||||||||||||
| †† | See Note 1 |
See Notes to Financial Statements
| ||
| 66 |
Table of Contents
Anchor Series Trust
STATEMENTS OF OPERATIONS — For the Year Ended December 31, 2017
| SA Wellington Government and Quality Bond Portfolio†† | SA Edge Asset Allocation Portfolio†† | SA Wellington Growth and Income Portfolio†† | SA Wellington Growth Portfolio†† | |||||||||||||
INVESTMENT INCOME: | ||||||||||||||||
Dividends (unaffiliated) | $ | — | $ | 2,843,941 | $ | 3,023,792 | $ | 6,860,826 | ||||||||
Interest (unaffiliated) | 38,207,728 | 2,747,962 | 17,019 | 42,639 | ||||||||||||
|
| |||||||||||||||
Total investment income* | 38,207,728 | 5,591,903 | 3,040,811 | 6,903,465 | ||||||||||||
|
| |||||||||||||||
EXPENSES: | ||||||||||||||||
Investment advisory and management fees | 8,300,979 | 1,299,842 | 1,312,490 | 2,980,737 | ||||||||||||
Service fee: | ||||||||||||||||
Class 2 | 43,239 | 22,052 | — | 27,186 | ||||||||||||
Class 3 | 1,871,105 | 154,391 | — | 247,073 | ||||||||||||
Transfer agent fees and expenses | 3,686 | 2,182 | 685 | 3,082 | ||||||||||||
Custodian and accounting fees | 226,878 | 62,317 | 29,537 | 58,037 | ||||||||||||
Reports to shareholders | 243,122 | 25,888 | 24,874 | 50,762 | ||||||||||||
Audit and tax fees | 50,963 | 46,487 | 39,876 | 39,975 | ||||||||||||
Legal fees | 60,582 | 22,389 | 21,521 | 27,754 | ||||||||||||
Trustees’ fees and expenses | 77,191 | 9,530 | 9,425 | 20,189 | ||||||||||||
Interest expense | 45 | — | — | — | ||||||||||||
Other expenses | 37,497 | 20,782 | 12,799 | 18,944 | ||||||||||||
|
| |||||||||||||||
Total expenses before fee waivers, expense reimbursements, expense recoupments, custody credits and fees paid indirectly | 10,915,287 | 1,665,860 | 1,451,207 | 3,473,739 | ||||||||||||
Fees waived and expenses reimbursed by investment adviser (Note 3) | — | — | — | — | ||||||||||||
Fees paid indirectly (Note 4) | — | (448 | ) | (414 | ) | (1,440 | ) | |||||||||
|
| |||||||||||||||
Net expenses | 10,915,287 | 1,665,412 | 1,450,793 | 3,472,299 | ||||||||||||
|
| |||||||||||||||
Net investment income (loss) | 27,292,441 | 3,926,491 | 1,590,018 | 3,431,166 | ||||||||||||
|
| |||||||||||||||
NET REALIZED AND UNREALIZED GAIN (LOSS) ON INVESTMENTS AND FOREIGN CURRENCIES: | ||||||||||||||||
Net realized gain (loss) on: | ||||||||||||||||
Investments (unaffiliated) | 2,232,080 | 9,485,089 | 19,426,329 | 45,156,082 | ||||||||||||
Futures contracts | (1,227,242 | ) | — | — | — | |||||||||||
Forward contracts | — | — | — | — | ||||||||||||
Forward sales contracts | (422 | ) | — | — | — | |||||||||||
Net realized foreign exchange gain (loss) on other assets and liabilities | — | (2,657 | ) | — | 10,373 | |||||||||||
|
| |||||||||||||||
Net realized gain (loss) on investments and foreign currencies | 1,004,416 | 9,482,432 | 19,426,329 | 45,166,455 | ||||||||||||
|
| |||||||||||||||
Change in unrealized appreciation (depreciation) on: | ||||||||||||||||
Investments (unaffiliated) | 14,287,816 | 11,639,463 | 21,151,154 | 26,291,918 | ||||||||||||
Futures contracts | 826,403 | — | — | — | ||||||||||||
Forward contracts | — | — | — | — | ||||||||||||
Forward sales contracts | 18,018 | — | — | — | ||||||||||||
Change in unrealized foreign exchange gain (loss) on other assets and liabilities | — | 367 | — | 2,987 | ||||||||||||
|
| |||||||||||||||
Net unrealized gain (loss) on investments and foreign currencies | 15,132,237 | 11,639,830 | 21,151,154 | 26,294,905 | ||||||||||||
|
| |||||||||||||||
Net realized and unrealized gain (loss) on investments and foreign currencies | 16,136,653 | 21,122,262 | 40,577,483 | 71,461,360 | ||||||||||||
|
| |||||||||||||||
NET INCREASE (DECREASE) IN NET ASSETS RESULTING FROM OPERATIONS | $ | 43,429,094 | $ | 25,048,753 | $ | 42,167,501 | $ | 74,892,526 | ||||||||
|
| |||||||||||||||
* Net of foreign withholding taxes on interest and dividends of | $ | — | $ | 108,440 | $ | — | $ | 51,262 | ||||||||
|
| |||||||||||||||
| †† | See Note 1 |
See Notes to Financial Statements
| ||
| 67 |
Table of Contents
Anchor Series Trust
STATEMENTS OF OPERATIONS — For the Year Ended December 31, 2017 — (continued)
| SA Wellington Capital Appreciation Portfolio†† | SA Wellington Natural Resources Portfolio†† | SA BlackRock Multi-Asset Income Portfolio | SA Wellington Multi-Asset Income Portfolio†† | |||||||||||||
INVESTMENT INCOME: | ||||||||||||||||
Dividends (unaffiliated) | $ | 10,275,049 | $ | 2,548,400 | $ | 986,111 | $ | 236,567 | ||||||||
Interest (unaffiliated) | 94,180 | 9,987 | 868 | 159,845 | ||||||||||||
|
| |||||||||||||||
Total investment income* | 10,369,229 | 2,558,387 | 986,979 | 396,412 | ||||||||||||
|
| |||||||||||||||
EXPENSES: | ||||||||||||||||
Investment advisory and management fees | 9,268,687 | 835,305 | 270,172 | 228,493 | ||||||||||||
Service fee: | ||||||||||||||||
Class 2 | 72,726 | 9,850 | — | — | ||||||||||||
Class 3 | 1,581,555 | 188,935 | 25,287 | 12,472 | ||||||||||||
Transfer agent fees and expenses | 3,438 | 2,568 | 1,198 | 1,153 | ||||||||||||
Custodian and accounting fees | 167,004 | 37,463 | 25,127 | 68,834 | ||||||||||||
Reports to shareholders | 159,613 | 14,094 | 3,506 | 3,526 | ||||||||||||
Audit and tax fees | 40,403 | 40,806 | 45,682 | 54,631 | ||||||||||||
Legal fees | 66,057 | 22,400 | 18,602 | 16,908 | ||||||||||||
Trustees’ fees and expenses | 63,044 | 5,428 | 1,245 | 1,020 | ||||||||||||
Interest expense | 3,099 | 657 | 82 | — | ||||||||||||
Other expenses | 33,634 | 11,509 | 9,161 | 18,774 | ||||||||||||
|
| |||||||||||||||
Total expenses before fee waivers, expense reimbursements, expense recoupments, custody credits and fees paid indirectly | 11,459,260 | 1,169,015 | 400,062 | 405,811 | ||||||||||||
Fees waived and expenses reimbursed by investment adviser (Note 3) | — | — | (217,993 | ) | (196,836 | ) | ||||||||||
Fees paid indirectly (Note 4) | (7,333 | ) | (2,620 | ) | — | (301 | ) | |||||||||
|
| |||||||||||||||
Net expenses | 11,451,927 | 1,166,395 | 182,069 | 208,674 | ||||||||||||
|
| |||||||||||||||
Net investment income (loss) | (1,082,698 | ) | 1,391,992 | 804,910 | 187,738 | |||||||||||
|
| |||||||||||||||
NET REALIZED AND UNREALIZED GAIN (LOSS) ON INVESTMENTS AND FOREIGN CURRENCIES: | ||||||||||||||||
Net realized gain (loss) on: | ||||||||||||||||
Investments (unaffiliated) | 193,935,454 | 13,385,808 | 68,811 | 1,226,505 | ||||||||||||
Futures contracts | — | — | 8,463 | (4,752 | ) | |||||||||||
Forward contracts | — | — | — | (347,838 | ) | |||||||||||
Forward sales contracts | — | — | — | — | ||||||||||||
Net realized foreign exchange gain (loss) on other assets and liabilities | 3,649 | (28,354 | ) | 1,667 | (21,756 | ) | ||||||||||
|
| |||||||||||||||
Net realized gain (loss) on investments and foreign currencies | 193,939,103 | 13,357,454 | 78,941 | 852,159 | ||||||||||||
|
| |||||||||||||||
Change in unrealized appreciation (depreciation) on: | ||||||||||||||||
Investments (unaffiliated) | 175,967,174 | 801,823 | 724,213 | 2,288,530 | ||||||||||||
Futures contracts | — | — | (33,830 | ) | (2,257 | ) | ||||||||||
Forward contracts | — | — | — | (53,959 | ) | |||||||||||
Forward sales contracts | — | — | — | — | ||||||||||||
Change in unrealized foreign exchange gain (loss) on other assets and liabilities | 1,106 | 5,064 | 2,471 | 2,340 | ||||||||||||
|
| |||||||||||||||
Net unrealized gain (loss) on investments and foreign currencies | 175,968,280 | 806,887 | 692,854 | 2,234,654 | ||||||||||||
|
| |||||||||||||||
Net realized and unrealized gain (loss) on investments and foreign currencies | 369,907,383 | 14,164,341 | 771,795 | 3,086,813 | ||||||||||||
|
| |||||||||||||||
NET INCREASE (DECREASE) IN NET ASSETS RESULTING FROM OPERATIONS | $ | 368,824,685 | $ | 15,556,333 | $ | 1,576,705 | $ | 3,274,551 | ||||||||
|
| |||||||||||||||
* Net of foreign withholding taxes on interest and dividends of | $ | 27,824 | $ | 162,560 | $ | — | $ | 16,153 | ||||||||
|
| |||||||||||||||
| †† | See Note 1 |
See Notes to Financial Statements
| ||
| 68 |
Table of Contents
Anchor Series Trust
STATEMENTS OF CHANGES IN NET ASSETS
| SA Wellington Government and Quality Bond Portfolio†† | SA Edge Asset Allocation Portfolio†† | |||||||||||||||
| For the year ended December 31, 2017 | For the year ended December 31, 2016 | For the year ended December 31, 2017 | For the year ended December 31, 2016 | |||||||||||||
INCREASE (DECREASE) IN NET ASSETS | ||||||||||||||||
Operations: | ||||||||||||||||
Net investment income (loss) | $ | 27,292,441 | $ | 23,034,160 | $ | 3,926,491 | $ | 4,398,740 | ||||||||
Net realized gain (loss) on investments and foreign currencies | 1,004,416 | 4,348,141 | 9,482,432 | 16,281,104 | ||||||||||||
Net unrealized gain (loss) on investments and foreign currencies | 15,132,237 | (13,414,205 | ) | 11,639,830 | (1,596,844 | ) | ||||||||||
|
| |||||||||||||||
Net increase (decrease) in net assets resulting from operations | 43,429,094 | 13,968,096 | 25,048,753 | 19,083,000 | ||||||||||||
|
| |||||||||||||||
Distributions to shareholders from: | ||||||||||||||||
Net investment income — Class 1 | (15,249,773 | ) | (11,978,279 | ) | (3,131,567 | ) | (3,389,965 | ) | ||||||||
Net investment income — Class 2 | (460,942 | ) | (396,655 | ) | (365,901 | ) | (355,697 | ) | ||||||||
Net investment income — Class 3 | (11,978,648 | ) | (9,174,742 | ) | (1,560,566 | ) | (1,438,810 | ) | ||||||||
Net realized gain on securities — Class 1 | — | (5,774,272 | ) | (9,535,981 | ) | (8,425,822 | ) | |||||||||
Net realized gain on securities — Class 2 | — | (220,098 | ) | (1,175,991 | ) | (940,283 | ) | |||||||||
Net realized gain on securities — Class 3 | — | (5,342,475 | ) | (5,167,716 | ) | (3,929,409 | ) | |||||||||
|
| |||||||||||||||
Total distributions to shareholders | (27,689,363 | ) | (32,886,521 | ) | (20,937,722 | ) | (18,479,986 | ) | ||||||||
|
| |||||||||||||||
Net increase (decrease) in net assets resulting from capital share transactions (Note 7) | (45,330,193 | ) | 195,750,084 | 1,575,244 | (1,708,334 | ) | ||||||||||
|
| |||||||||||||||
Total increase (decrease) in net assets | (29,590,462 | ) | 176,831,659 | 5,686,275 | (1,105,320 | ) | ||||||||||
|
| |||||||||||||||
NET ASSETS: | ||||||||||||||||
Beginning of period | 1,610,437,211 | 1,433,605,552 | 191,774,633 | 192,879,953 | ||||||||||||
|
| |||||||||||||||
End of period† | $ | 1,580,846,749 | $ | 1,610,437,211 | $ | 197,460,908 | $ | 191,774,633 | ||||||||
|
| |||||||||||||||
† Includes accumulated undistributed net investment income (loss) | $ | 24,776,826 | $ | 23,501,020 | $ | 4,346,642 | $ | 4,829,424 | ||||||||
|
| |||||||||||||||
| †† | See Note 1 |
See Notes to Financial Statements
| ||
| 69 |
Table of Contents
Anchor Series Trust
STATEMENTS OF CHANGES IN NET ASSETS — (continued)
| SA Wellington Growth and Income Portfolio†† | SA Wellington Growth Portfolio†† | |||||||||||||||
For the year | For the year ended December 31, 2016 | For the year ended December 31, 2017 | For the year ended December 31, 2016 | |||||||||||||
INCREASE (DECREASE) IN NET ASSETS | ||||||||||||||||
Operations: | ||||||||||||||||
Net investment income (loss) | $ | 1,590,018 | $ | 1,468,614 | $ | 3,431,166 | $ | 4,273,459 | ||||||||
Net realized gain (loss) on investments and foreign currencies | 19,426,329 | 5,822,225 | 45,166,455 | 95,304 | ||||||||||||
Net unrealized gain (loss) on investments and foreign currencies | 21,151,154 | 6,171,019 | 26,294,905 | 34,074,675 | ||||||||||||
|
| |||||||||||||||
Net increase (decrease) in net assets resulting from operations | 42,167,501 | 13,461,858 | 74,892,526 | 38,443,438 | ||||||||||||
|
| |||||||||||||||
Distributions to shareholders from: | ||||||||||||||||
Net investment income — Class 1 | (1,468,614 | ) | (1,508,117 | ) | (3,181,040 | ) | (3,542,071 | ) | ||||||||
Net investment income — Class 2 | — | — | (179,962 | ) | (154,055 | ) | ||||||||||
Net investment income — Class 3 | — | — | (909,640 | ) | (736,076 | ) | ||||||||||
Net realized gain on securities — Class 1 | (5,686,009 | ) | (8,736,288 | ) | — | (23,881,716 | ) | |||||||||
Net realized gain on securities — Class 2 | — | — | — | (1,265,960 | ) | |||||||||||
Net realized gain on securities — Class 3 | — | — | — | (6,824,524 | ) | |||||||||||
|
| |||||||||||||||
Total distributions to shareholders | (7,154,623 | ) | (10,244,405 | ) | (4,270,642 | ) | (36,404,402 | ) | ||||||||
|
| |||||||||||||||
Net increase (decrease) in net assets resulting from capital share transactions (Note 7) | (28,224,852 | ) | (9,098,275 | ) | (129,423,170 | ) | (187,467,993 | ) | ||||||||
|
| |||||||||||||||
Total increase (decrease) in net assets | 6,788,026 | (5,880,822 | ) | (58,801,286 | ) | (185,428,957 | ) | |||||||||
|
| |||||||||||||||
NET ASSETS: | ||||||||||||||||
Beginning of period | 195,301,022 | 201,181,844 | 458,158,124 | 643,587,081 | ||||||||||||
|
| |||||||||||||||
End of period† | $ | 202,089,048 | $ | 195,301,022 | $ | 399,356,838 | $ | 458,158,124 | ||||||||
|
| |||||||||||||||
† Includes accumulated undistributed net investment income (loss) | $ | 1,590,017 | $ | 1,468,613 | $ | 3,443,257 | $ | 4,270,644 | ||||||||
|
| |||||||||||||||
| †† | See Note 1 |
See Notes to Financial Statements
| ||
| 70 |
Table of Contents
Anchor Series Trust
STATEMENTS OF CHANGES IN NET ASSETS — (continued)
| SA Wellington Capital Appreciation Portfolio†† | SA Wellington Natural Resources Portfolio†† | |||||||||||||||
For the year | For the year ended December 31, 2016 | For the year ended December 31, 2017 | For the year ended December 31, 2016 | |||||||||||||
INCREASE (DECREASE) IN NET ASSETS | ||||||||||||||||
Operations: | ||||||||||||||||
Net investment income (loss) | $ | (1,082,698 | ) | $ | (4,489,265 | ) | $ | 1,391,992 | $ | 2,034,806 | ||||||
Net realized gain (loss) on investments and foreign currencies | 193,939,103 | 106,446,340 | 13,357,454 | (13,392,712 | ) | |||||||||||
Net unrealized gain (loss) on investments and foreign currencies | 175,968,280 | (75,846,166 | ) | 806,887 | 46,046,995 | |||||||||||
|
| |||||||||||||||
Net increase (decrease) in net assets resulting from operations | 368,824,685 | 26,110,909 | 15,556,333 | 34,689,089 | ||||||||||||
|
| |||||||||||||||
Distributions to shareholders from: | ||||||||||||||||
Net investment income — Class 1 | — | — | (741,662 | ) | (1,228,880 | ) | ||||||||||
Net investment income — Class 2 | — | — | (155,460 | ) | (285,068 | ) | ||||||||||
Net investment income — Class 3 | — | — | (1,728,297 | ) | (3,103,813 | ) | ||||||||||
Net realized gain on securities — Class 1 | (49,894,633 | ) | (79,138,273 | ) | — | — | ||||||||||
Net realized gain on securities — Class 2 | (3,970,623 | ) | (6,106,794 | ) | — | — | ||||||||||
Net realized gain on securities — Class 3 | (52,854,508 | ) | (78,677,347 | ) | — | — | ||||||||||
|
| |||||||||||||||
Total distributions to shareholders | (106,719,764 | ) | (163,922,414 | ) | (2,625,419 | ) | (4,617,761 | ) | ||||||||
|
| |||||||||||||||
Net increase (decrease) in net assets resulting from capital share transactions (Note 7) | (127,534,144 | ) | (43,679,567 | ) | (16,617,506 | ) | (67,833,812 | ) | ||||||||
|
| |||||||||||||||
Total increase (decrease) in net assets | 134,570,777 | (181,491,072 | ) | (3,686,592 | ) | (37,762,484 | ) | |||||||||
|
| |||||||||||||||
NET ASSETS: | ||||||||||||||||
Beginning of period | 1,215,478,954 | 1,396,970,026 | 116,611,461 | 154,373,945 | ||||||||||||
|
| |||||||||||||||
End of period† | $ | 1,350,049,731 | $ | 1,215,478,954 | $ | 112,924,869 | $ | 116,611,461 | ||||||||
|
| |||||||||||||||
† Includes accumulated undistributed net investment income (loss) | $ | — | $ | 62 | $ | 2,340,423 | $ | 2,000,394 | ||||||||
|
| |||||||||||||||
| †† | See Note 1 |
See Notes to Financial Statements
| ||
| 71 |
Table of Contents
Anchor Series Trust
STATEMENTS OF CHANGES IN NET ASSETS — (continued)
| SA BlackRock Multi-Asset Income Portfolio | SA Wellington Multi-Asset Income Portfolio†† | |||||||||||||||
| For the year ended December 31, 2017 | For the year ended December 31, 2016 | For the year ended December 31, 2017 | For the year ended December 31, 2016 | |||||||||||||
INCREASE (DECREASE) IN NET ASSETS | ||||||||||||||||
Operations: | ||||||||||||||||
Net investment income (loss) | $ | 804,910 | $ | 604,497 | $ | 187,738 | $ | 168,158 | ||||||||
Net realized gain (loss) on investments and foreign currencies | 78,941 | (589,867 | ) | 852,159 | (196,034 | ) | ||||||||||
Net unrealized gain (loss) on investments and foreign currencies | 692,854 | 1,184,344 | 2,234,654 | 321,388 | ||||||||||||
|
| |||||||||||||||
Net increase (decrease) in net assets resulting from operations | 1,576,705 | 1,198,974 | 3,274,551 | 293,512 | ||||||||||||
|
| |||||||||||||||
Distributions to shareholders from: | ||||||||||||||||
Net investment income — Class 1 | (338,865 | ) | (602,539 | ) | (47,644 | ) | (327,391 | ) | ||||||||
Net investment income — Class 2 | — | — | — | — | ||||||||||||
Net investment income — Class 3†† | (278,965 | ) | (87,907 | ) | (18,628 | ) | — | |||||||||
Net realized gain on securities — Class 1 | — | (1,641,430 | ) | — | (1,294,134 | ) | ||||||||||
Net realized gain on securities — Class 2 | — | — | — | — | ||||||||||||
Net realized gain on securities — Class 3†† | — | (240,617 | ) | — | — | |||||||||||
|
| |||||||||||||||
Total distributions to shareholders | (617,830 | ) | (2,572,493 | ) | (66,272 | ) | (1,621,525 | ) | ||||||||
|
| |||||||||||||||
Net increase (decrease) in net assets resulting from capital share transactions (Note 7) | 11,476,542 | 4,721,729 | 10,780,352 | (72,979 | ) | |||||||||||
|
| |||||||||||||||
Total increase (decrease) in net assets | 12,435,417 | 3,348,210 | 13,988,631 | (1,400,992 | ) | |||||||||||
|
| |||||||||||||||
NET ASSETS: | ||||||||||||||||
Beginning of period | 22,272,400 | 18,924,190 | 17,485,942 | 18,886,934 | ||||||||||||
|
| |||||||||||||||
End of period† | $ | 34,707,817 | $ | 22,272,400 | $ | 31,474,573 | $ | 17,485,942 | ||||||||
|
| |||||||||||||||
† Includes accumulated undistributed net investment income (loss) | $ | 831,459 | $ | 617,827 | $ | (85,145 | ) | $ | (120,868 | ) | ||||||
|
| |||||||||||||||
| †† | See Note 1 |
See Notes to Financial Statements
| ||
| 72 |
Table of Contents
ANCHOR SERIES TRUST
December 31, 2017
Note 1. Organization
Anchor Series Trust (the “Trust”), organized as a business trust under the laws of the Commonwealth of Massachusetts on August 26, 1983, is an open-end management investment company and consists of 8 separate series or portfolios (each, a “Portfolio” and collectively, the “Portfolios”). The Portfolios are managed by SunAmerica Asset Management, LLC (“SAAMCo” or the “Adviser”), an indirect wholly-owned subsidiary of American International Group, Inc. (“AIG”). Shares of the Trust are issued and redeemed only in connection with investments in and payments under variable annuity contracts and variable life insurance policies (the “Variable Contracts”) of American General Life Insurance Company, a Texas life insurer (“AGL”), The United States Life Insurance Company in the City of New York, a New York life insurer (“USL”), and The Variable Annuity Life Insurance Company, a Texas life insurer (“VALIC”), each an affiliated insurance company of SAAMCo; and variable contracts issued by Phoenix Life Insurance Company, an unaffiliated life insurance company. The life insurance companies listed above are collectively referred to as the “Life Companies.” All shares of the Trust are owned by “separate accounts” of the Life Companies. The Trust issues separate series of shares (the “Portfolios”), each of which represents a separate managed portfolio of securities with its own investment goal. All shares may be purchased or redeemed at net asset value without any sales or redemption charge.
Class 1 shares, Class 2 shares and Class 3 shares of each Portfolio may be offered in connection with certain Variable Contracts. Class 2 and Class 3 shares of a given Portfolio are identical in all respects to Class 1 shares of the same Portfolio, except that (i) each class may bear differing amounts of certain class-specific expenses, (ii) Class 2 and Class 3 shares are subject to service fees, while Class 1 shares are not, and (iii) Class 2 and Class 3 shares have voting rights on matters that pertain to the Rule 12b-1 plan adopted with respect to Class 2 and Class 3 shares. Class 2 and Class 3 shares of each Portfolio pay service fees at an annual rate of 0.15% and 0.25%, respectively, of each class’ average daily net assets.
Class 3 shares of SA Wellington Multi-Asset Income Portfolio commenced operations effective September 26, 2016.
Effective October 9, 2017, certain Portfolios’ names changed as shown in the chart below to reflect the “New Portfolio Name.” The Portfolio maintains its current investment adviser. In addition, there were no changes in the Portfolios’ investment goals, strategies, or portfolio managers in connection with the renaming.
Current Portfolio Name | New Portfolio Name | |
Government and Quality Bond Portfolio | SA Wellington Government and Quality Bond Portfolio | |
Asset Allocation Portfolio | SA Edge Asset Allocation Portfolio | |
Growth and Income Portfolio | SA Wellington Growth and Income Portfolio | |
Growth Portfolio | SA Wellington Growth Portfolio | |
Capital Appreciation Portfolio | SA Wellington Capital Appreciation Portfolio | |
Natural Resources Portfolio | SA Wellington Natural Resources Portfolio | |
Strategic Multi-Asset Portfolio | SA Wellington Multi-Asset Income Portfolio |
The investment goal for each Portfolio is as follows:
The SA Wellington Government and Quality Bond Portfolio seeks relatively high current income, liquidity and security of principal. Its strategy is to invest, under normal circumstances, at least 80% of net assets in obligations issued, guaranteed or insured by the U.S. Government, its agencies or instrumentalities and in high quality corporate fixed income securities (rated AA– or better by Standard & Poor’s Corporation or Aa3 or better by Moody’s Investor Services, Inc. or its equivalent by any other nationally recognized statistical rating organization).
The SA Edge Asset Allocation Portfolio seeks high total return (including income and capital gains) consistent with long-term preservation of capital. Its strategy is to invest in a diversified portfolio that may include common stocks and other securities with common stock characteristics, bonds and other intermediate and long-term fixed income securities and money market instruments.
The SA Wellington Growth and Income Portfolio seeks to provide long-term capital appreciation and current income. Its strategy is to invest at least 65% of total assets in core equity securities. “Core equity securities” are stocks, primarily of well-established companies, diversified by industry and company type that are selected based on their predictable or anticipated earnings growth and best relative value.
The SA Wellington Growth Portfolio seeks capital appreciation. Its strategy is to invest in a portfolio of common stocks of companies that is widely diversified by industry and company.
The SA Wellington Capital Appreciation Portfolio seeks long-term capital appreciation. Its strategy is to invest in growth equity securities across a wide range of industries and companies, using a wide-ranging and flexible stock selection approach.
| ||
| 73 |
Table of Contents
The SA Wellington Natural Resources Portfolio seeks a total return in excess of the U.S. rate of inflation as represented by the Consumer Price Index. Its strategy is to invest primarily in equity securities of U.S. or foreign companies that are expected to provide favorable returns in periods of rising inflation, using a value-style investment approach. Under normal market circumstances, at least 80% of net assets are invested in securities related to natural resources, such as energy, metals, mining and forest products.
The SA BlackRock Multi-Asset Income Portfolio seeks current income with a secondary goal of capital appreciation. Its strategy is to actively allocate the Portfolio’s assets among a broad range of income-producing investments, including fixed income securities and equity securities. The Portfolio may invest up to 100% of its assets in fixed income securities and up to 80% of its assets in equity securities. The Portfolio may also invest all or a portion of its assets in exchange-traded funds (“ETFs”), including ETFs affiliated with the Portfolio’s subadviser, that provide exposure to fixed income securities, equity securities or other asset classes.
The SA Wellington Multi-Asset Income Portfolio seeks high long-term total investment return. Its strategy is to actively allocate the Portfolio’s assets among U.S. and foreign, large, medium and small company equity securities, global fixed income securities (including high-yield, high risk bonds) and cash.
Indemnifications: The Trust’s organizational documents provide officers and trustees with a limited indemnification against liabilities arising out of the performance of their duties to the Trust. In addition, pursuant to Indemnification Agreements between the Trust and each of the current trustees who is not an “interested person,” as defined in Section 2(a)(19) of the Investment Company Act of 1940, as amended (the “1940 Act”), of the Trust (collectively, the “Disinterested Trustees”), the Trust provides the Disinterested Trustees with a limited indemnification against liabilities arising out of the performance of their duties to the Trust, whether such liabilities are asserted during or after their service as trustees. In addition, in the normal course of business, the Trust enters into contracts that contain the obligation to indemnify others. The Trust’s maximum exposure under these arrangements is unknown. Currently, however, the Trust expects the risk of loss to be remote.
Note 2. Significant Accounting Policies
The preparation of financial statements in accordance with U.S. generally accepted accounting principles (“GAAP”) requires management to make estimates and assumptions that affect the reported amounts and disclosures in the financial statements. Actual results could differ from those estimates and those differences could be significant. The following is a summary of significant accounting policies consistently followed by the Trust in the preparation of its financial statements:
Security Valuation
In accordance with the authoritative guidance on fair value measurements and disclosures under GAAP, the Portfolios disclose the fair value of their investments in a hierarchy that prioritizes the inputs to valuation techniques used to measure the fair value. In accordance with GAAP, fair value is defined as the price that the Portfolios would receive upon selling an asset or transferring a liability in a timely transaction to an independent third party in the principal or most advantageous market. GAAP establishes a three-tier hierarchy to provide more transparency around the inputs used to measure fair value and to establish classification of fair value measurements for disclosure purposes. Inputs refer broadly to the assumptions that market participants would use in pricing the asset or liability, including assumptions about risk. Inputs may be observable or unobservable. Observable inputs are inputs that reflect the assumptions market participants would use in pricing the asset or liability developed based on market data obtained from sources independent of the reporting entity. Unobservable inputs are inputs that reflect the reporting entity’s own assumptions about the assumptions market participants would use in pricing the asset or liability developed based on the best information available in the circumstances. The three tiers are as follows:
Level 1 — Unadjusted quoted prices in active markets for identical securities
Level 2 — Other significant observable inputs (including quoted prices for similar securities, interest rates, prepayment speeds, credit risk, referenced indices, quoted prices in inactive markets, adjusted quoted prices in active markets, adjusted quoted prices on foreign equity securities that were adjusted in accordance with pricing procedures approved by the Board of Trustees (the “Board”), etc.)
Level 3 — Significant unobservable inputs (includes inputs that reflect the Portfolios’ own assumptions about the assumptions market participants would use in pricing the security, developed based on the best information available under the circumstances)
Changes in valuation techniques may result in transfers in or out of an investment’s assigned Level within the hierarchy. The methodology used for valuing investments is not necessarily an indication of the risk associated with investing in those investments and the determination of the significance of a particular input to the fair value measurement in its entirety requires judgment and consideration of factors specific to each security.
The availability of observable inputs can vary from security to security and is affected by a wide variety of factors, including, for example, the type of security, whether the security is recently issued and not yet established in the marketplace, the liquidity of markets, and other characteristics particular to the security. To the extent that valuation is based on models or inputs that are less observable or unobservable in the market, the determination of fair value requires more judgment. Accordingly, the degree of judgment exercised in determining fair value is greatest for instruments categorized in Level 3.
| ||
| 74 |
Table of Contents
The summary of each Portfolio’s assets and liabilities classified in the fair value hierarchy as of December 31, 2017, is reported on a schedule following each Portfolio’s Portfolio of Investments.
Stocks are generally valued based upon closing sales prices reported on recognized securities exchanges on which the securities are principally traded and are generally categorized as Level 1. Stocks listed on the NASDAQ are valued using the NASDAQ Official Closing Price (“NOCP”). Generally, the NOCP will be the last sale price unless the reported trade for the stock is outside the range of the bid/ask price. In such cases, the NOCP will be normalized to the nearer of the bid or ask price. For listed securities having no sales reported and for unlisted securities, such securities will be valued based upon the last reported bid price.
As of the close of regular trading on the New York Stock Exchange (“NYSE”), securities traded primarily on security exchanges outside the United States are valued at the last sale price on such exchanges on the day of valuation, or if there is no sale on the day of valuation, at the last-reported bid price. If a security’s price is available from more than one exchange, the Portfolios use the exchange that is the primary market for the security. Such securities are generally categorized as Level 1. However, depending on the foreign market, closing prices may be up to 15 hours old when they are used to price a Portfolio’s shares, and the Portfolio may determine that certain closing prices do not reflect the fair value of the security. This determination will be based on the review of a number of factors, including developments in foreign markets, the performance of U.S. securities markets, and the performance of instruments trading in U.S. markets that represent foreign securities and baskets of foreign securities. If a Portfolio determines that closing prices do not reflect the fair value of the securities, the Portfolio will adjust the previous closing prices in accordance with pricing procedures approved by the Board to reflect what it believes to be the fair value of the securities as of the close of regular trading on the NYSE. The Portfolios may also fair value securities in other situations, for example, when a particular foreign market is closed but a Portfolio is open. For foreign equity securities and foreign equity futures contracts, the Portfolios use an outside pricing service to provide it with closing market prices and information used for adjusting those prices, and when so adjusted, such securities and futures are generally categorized as Level 2.
Bonds, debentures, and other debt securities, are valued at evaluated bid prices obtained for the day of valuation from a Board-approved pricing service, and are generally categorized as Level 2. The pricing service may use valuation models or matrix pricing which considers information with respect to comparable bond and note transactions, quotations from bond dealers, or by reference to other securities that are considered comparable in such characteristics as rating, interest rate, and maturity date, option adjusted spread models, prepayments projections, interest rate spreads, and yield curves to determine current value. If a price is unavailable from a Board-approved pricing service, the securities may be priced at the mean of two independent quotes obtained from brokers.
Senior floating rate loans (“Loans”) are valued at the average of available bids in the market for such Loans, as provided by a Board-approved loan pricing service, and are generally categorized as Level 2.
Investments in registered investment companies that do not trade on an exchange are valued at the end of day net asset value per share. Investments in registered investment companies that trade on an exchange are valued at the last sales price or official closing price as of the close of the customary trading session on the exchange where the security is principally traded. Investments in registered investment companies are generally categorized as Level 1.
Futures contracts traded on national securities exchanges are valued at the quoted daily settlement price established by the exchange on which they trade reported by a Board-approved pricing service, and are generally categorized as Level 1. Option contracts traded on national securities exchanges are valued at the mean of the last bid and ask price reported by a Board-approved pricing service as of the close of the exchange on which they are traded, and are generally categorized as Level 1. Option contracts traded in the over-the-counter (“OTC”) market are valued at the mid valuation provided by a Board-approved pricing service, and are generally categorized as Level 2. Forward foreign currency contracts (“forward contracts”) are valued at the 4:00 p.m. Eastern Time forward rate and are generally categorized as Level 2.
Other securities are valued on the basis of last sale or bid price (if a last sale price is not available) which is, in the opinion of the Adviser, the broadest and most representative market, that may be either a securities exchange or OTC market and are generally categorized as Level 1 or Level 2.
The Board is responsible for the share valuation process and has adopted policies and procedures (the “PRC Procedures”) for valuing the securities and other assets held by the Portfolios, including procedures for the fair valuation of securities and other assets for which market quotations are not readily available or are unreliable. The PRC Procedures provide for the establishment of a pricing review committee, which is responsible for, among other things, making certain determinations in connection with the Trust’s fair valuation procedures. Securities for which market quotations are not readily available or the values of which may be significantly impacted by the occurrence of developments or significant events are generally categorized as Level 3. There is no single standard for making fair value determinations, which may result in prices that vary from those of other funds.
Derivative Instruments
Forward Foreign Currency Contracts: During the period, the SA Wellington Multi-Asset Income Portfolio used forward contracts to attempt to protect the value of securities and related receivables and payables against changes in future foreign exchange rates, to manage and/or gain exposure to certain foreign currencies and/or to attempt to enhance return.
| ||
| 75 |
Table of Contents
A forward contract is an agreement between two parties to buy or sell currency at a set price on a future date. The market value of the contract will fluctuate with changes in currency exchange rates. The contract is marked-to-market daily using the forward rate and the cumulative change in market value is recorded by a Portfolio as unrealized appreciation or depreciation. On the settlement date, a Portfolio records either realized gains or losses equal to the difference between the value of the contract at the time it was opened and the value at the time it was closed.
Risks to the Portfolios of entering into forward contracts include counterparty risk, market risk and illiquidity risk. Counterparty risk arises upon entering into these contracts from the potential inability of counterparties to meet the terms of their contracts. If the counterparty defaults, a Portfolio’s loss will generally consist of the net amount of contractual payments that the Portfolio has not yet received though the Portfolio’s maximum exposure due to counterparty risk could extend to the notional amount of the contract. Market risk is the risk that the value of the forward contract will depreciate due to unfavorable changes in the exchange rates. These contracts may involve market risk in excess of the unrealized appreciation or depreciation reported on the Statement of Assets and Liabilities. Illiquidity risk arises because the secondary market for forwards may have less liquidity relative to markets for other securities. Currency transactions are also subject to risks different from those of other portfolio transactions. Because currency control is of great importance to the issuing governments and influences economic planning and policy, purchases and sales of currency and related instruments can be adversely affected by government exchange controls, limitations or restrictions on repatriation of currency, and manipulations or exchange restrictions imposed by governments.
Forward foreign currency contracts outstanding at the end of the period, if any, are reported on a schedule following the Portfolio’s Portfolio of Investments.
Futures: During the period, SA Wellington Government and Quality Bond, SA BlackRock Multi-Asset Income and the SA Wellington Multi-Asset Income Portfolios used futures contracts to attempt to increase or decrease exposure to equity, bond and currency markets and to manage duration and yield curve positioning.
A futures contract is an agreement between two parties to buy and sell a financial instrument at a set price on a future date. Upon entering into a futures transaction, a Portfolio will be required to segregate an initial margin payment of cash or other liquid securities with the futures commission merchant (the “broker”). Subsequent payments are made or received by the Portfolio as a result of changes in the value of the contract and/or changes in the value of the initial margin requirement. Such receipts or payments are recorded in the Statements of Assets and Liabilities as variation margin for changes in the value of the contracts and as cash collateral for futures contracts for the changes in the value of the initial margin requirement. When a contract is closed, the Portfolios record a realized gain or loss equal to the difference between the value of the contract at the time it was opened and the value at the time it was closed.
The primary risk to the Portfolios of entering into futures contracts is market risk. Market risk is the risk that there will be an unfavorable change in the interest rate, value or currency rate of the underlying security or securities. Futures contracts involve, to varying degrees, risk of loss in excess of the variation margin disclosed on the Statements of Assets and Liabilities. There may also be trading restrictions or limitations imposed by an exchange, and government regulations may restrict trading in futures contracts. While the Portfolios will generally only purchase exchange-traded futures, due to market conditions, there may not always be a liquid secondary market for a futures contract and, as a result, a Portfolio may be unable to close out its futures contracts at a time which is advantageous. In addition, if a Portfolio has insufficient cash to meet margin requirements, the Portfolio may need to sell other investments, including at disadvantageous times. There is generally minimal counterparty risk to the Portfolios since the futures contracts are generally exchange-traded.
Futures contracts outstanding at the end of the period, if any, are reported on a schedule following the Portfolio’s Portfolio of Investments.
Master Agreements: Certain Portfolios that hold derivative instruments and other financial instruments may be a party to ISDA (International Swaps and Derivatives Association, Inc.) Master Agreements or similar agreements (“Master Agreements”) with certain counterparties that govern such instruments. Master Agreements may contain provisions regarding, among other things, the parties’ general obligations, representations, agreements, collateral requirements, events of default and early termination. Collateral can be in the form of cash or securities as agreed to by a Portfolio and applicable counterparty. Collateral requirements are generally determined based on a Portfolio’s net position with each counterparty. Master Agreements may also include certain provisions that require a Portfolio to post additional collateral upon the occurrence of certain events, such as when a Portfolio’s net assets fall below a specified level. In addition, Master Agreements typically specify certain standard termination events, such as failure of a party to pay or deliver, credit support defaults and other events of default. Termination events applicable to a Portfolio may also occur upon a decline in a Portfolio’s net assets below a specified level over a certain period of time. Additional termination events applicable to counterparties may occur upon a decline in a counterparty’s long-term and short-term credit ratings below a specified level, or upon a decline in the ratings of a counterparty’s credit support provider. Upon the occurrence of a termination event, the other party may elect to terminate early and cause settlement of all instruments outstanding pursuant to a particular Master Agreement, including the payment of any losses and costs resulting from such early termination, as reasonably determined by the terminating party. Any decision by one or more of a Portfolio’s counterparties to elect early termination could cause a Portfolio to accelerate the payment of liabilities, which settlement amounts could be in excess of the amount of assets that are already posted as collateral. Typically, the Master Agreement will permit a single net payment in the event of default. Note, however, that bankruptcy or insolvency laws of a particular jurisdiction
| ||
| 76 |
Table of Contents
may impose restrictions on or prohibitions against the right of offset in bankruptcy, insolvency or other events. As a result, the early termination with respect to derivative instruments subject to Master Agreements that are in a net liability position could be material to a Portfolio’s financial statements. The Portfolios do not offset derivative assets and derivative liabilities that are subject to netting arrangements in the Statement of Assets and Liabilities.
The following tables represent the value of derivatives held as of December 31, 2017, by their primary underlying risk exposure and respective location on the Statements of Assets and Liabilities and the effect of derivatives on the Statements of Operations for the year ended December 31, 2017. For a detailed presentation of derivatives held as of December 31, 2017, please refer to a schedule following each Portfolio’s Portfolio of Investments.
| Asset Derivatives | ||||||||||||||||||||
| Interest Rate Contracts | Equity Contracts | Foreign Exchange Contracts | Total | |||||||||||||||||
Portfolio | Futures Contracts(1)(4) | Futures Contracts(1)(4) | Forward Foreign Currency Contracts(2) | Futures Contracts(1)(4) | ||||||||||||||||
SA Wellington Government and Quality Bond | $ | — | $ | — | $ | — | $ | — | $ | — | ||||||||||
SA BlackRock Multi-Asset Income | 1,406 | — | — | — | 1,406 | |||||||||||||||
SA Wellington Multi-Asset Income | 1,187 | — | 208,709 | — | 209,896 | |||||||||||||||
| Liability Derivatives | ||||||||||||||||||||
| Interest Rate Contracts | Equity Contracts | Foreign Exchange Contracts | Total | |||||||||||||||||
Portfolio | Futures Contracts(1)(4) | Futures Contracts(1)(4) | Forward Foreign Currency Contracts(3) | Futures Contracts(1)(4) | ||||||||||||||||
SA Wellington Government and Quality Bond | $ | 79,016 | $ | — | $ | — | $ | — | $ | 79,016 | ||||||||||
SA BlackRock Multi-Asset Income | 4,203 | 4,125 | — | 5,100 | 13,428 | |||||||||||||||
SA Wellington Multi-Asset Income | — | 2,430 | 253,456 | — | 255,886 | |||||||||||||||
Statement of Assets and Liabilities Location:
| (1) | Variation margin on futures contracts |
| (2) | Unrealized appreciation on forward foreign currency contracts |
| (3) | Unrealized depreciation on forward foreign currency contracts |
| (4) | The variation margin on futures contracts is included in the cumulative appreciation (depreciation) as reported on each Portfolio’s Portfolio of Investments in the following amounts: |
Portfolio | Cumulative Appreciation (Depreciation) | |||
SA Wellington Government and Quality Bond | $ | 336,715 | ||
SA BlackRock Multi-Asset Income | (18,136 | ) | ||
SA Wellington Multi-Asset Income | 1,145 | |||
| Realized Gain (Loss) on Derivatives Recognized in Statement of Operations | ||||||||||||||||||||
| Interest Rate Contracts | Equity Contracts | Foreign Exchange Contracts | Total | |||||||||||||||||
Portfolio | Futures Contracts(1) | Futures Contracts(1) | Forward Foreign Currency Contracts(2) | Futures Contracts(1) | ||||||||||||||||
SA Wellington Government and Quality Bond | $ | (1,227,242 | ) | $ | — | $ | — | $ | — | $ | (1,227,242 | ) | ||||||||
SA BlackRock Multi-Asset Income | (40,890 | ) | 87,240 | — | (37,887 | ) | 8,463 | |||||||||||||
SA Wellington Multi-Asset Income | 4,290 | (9,042 | ) | (347,838 | ) | — | (352,590 | ) | ||||||||||||
| Change in Unrealized Appreciation (Depreciation) on Derivatives Recognized in Statement of Operations | ||||||||||||||||||||
| Interest Rate Contracts | Equity Contracts | Foreign Exchange Contracts | Total | |||||||||||||||||
Portfolio | Futures Contracts(3) | Futures Contracts(3) | Forward Foreign Currency Contracts(4) | Futures Contracts(3) | ||||||||||||||||
SA Wellington Government and Quality Bond | $ | 826,403 | $ | — | $ | — | $ | — | $ | 826,403 | ||||||||||
SA BlackRock Multi-Asset Income | (6,898 | ) | (8,970 | ) | — | (17,962 | ) | (33,830 | ) | |||||||||||
SA Wellington Multi-Asset Income | (1,258 | ) | (999 | ) | (53,959 | ) | — | (56,216 | ) | |||||||||||
Statement of Operations Location:
| (1) | Net realized gain (loss) on futures contracts |
| (2) | Net realized gain (loss) on forward contracts |
| (3) | Change in unrealized appreciation (depreciation) on futures contracts |
| (4) | Change in unrealized appreciation (depreciation) on forward contracts |
| ||
| 77 |
Table of Contents
The following table represents the average monthly balances of derivatives held during the year ended December 31, 2017.
| Average Amount Outstanding During the Period | ||||||||
Portfolio | Futures Contracts(1) | Forward Foreign Currency Contracts(1) | ||||||
SA Wellington Government and Quality Bond | $ | 63,723,741 | $ | — | ||||
SA BlackRock Multi-Asset Income | 5,384,468 | — | ||||||
SA Wellington Multi-Asset Income | 706,020 | 24,175,217 | ||||||
| (1) | Amounts represent notional amounts in US dollars. |
The following table sets forth the Portfolios’ derivative assets and liabilities by counterparty, net of amounts available for offset under Master Agreements and net of the related collateral pledged/(received) as of December 31, 2017. The repurchase agreements held by the Portfolios as of December 31, 2017, are also subject to Master Agreements but are not included in the following table. See each Portfolio’s Portfolio of Investments and the Notes to the Financial Statements for more information about the Portfolios’ holdings in repurchase agreements.
| SA Wellington Multi-Asset Income Portfolio | Net Derivative Assets (Liabilities) | Collateral Pledged/ (Received)(2) | Net Amount(3) | |||||||||||||||||||||||||||||||||||||||||
| Derivative Assets(1) | Derivative Liabilities(1) | |||||||||||||||||||||||||||||||||||||||||||
Counterparty | Forward Foreign Currency Contracts | OTC Swaps | Options Purchased | Total | Forward Foreign Currency Contracts | OTC Swaps | Options Purchased | Total | ||||||||||||||||||||||||||||||||||||
Australia and New Zealand Banking Group Ltd. | $ | — | $ | — | $ | — | $ | — | $ | 70 | $ | — | $ | — | $ | 70 | $ | (70 | ) | $ | — | $ | (70 | ) | ||||||||||||||||||||
Bank of America, N.A. | 85,048 | — | — | 85,048 | 49,903 | — | — | 49,903 | 35,145 | — | 35,145 | |||||||||||||||||||||||||||||||||
Barclays Bank PLC | 19 | — | — | 19 | 3,330 | — | — | 3,330 | (3,311 | ) | — | (3,311 | ) | |||||||||||||||||||||||||||||||
BNP Paribas SA | 36 | — | — | 36 | 34 | — | — | 34 | 2 | — | 2 | |||||||||||||||||||||||||||||||||
Canadian Imperial Bank of Commerce | 1,564 | — | — | 1,564 | — | — | — | — | 1,564 | — | 1,564 | |||||||||||||||||||||||||||||||||
Citibank N.A. | 27,103 | — | — | 27,103 | 15,270 | — | — | 15,270 | 11,833 | — | 11,833 | |||||||||||||||||||||||||||||||||
Goldman Sachs International | 29,042 | — | — | 29,042 | 17,278 | — | — | 17,278 | 11,764 | — | 11,764 | |||||||||||||||||||||||||||||||||
HSBC Bank USA | 3,976 | — | — | 3,976 | 120 | — | — | 120 | 3,856 | — | 3,856 | |||||||||||||||||||||||||||||||||
JPMorgan Chase Bank | 3,973 | — | — | 3,973 | 3,005 | — | — | 3,005 | 968 | — | 968 | |||||||||||||||||||||||||||||||||
Morgan Stanley and Co. International PLC | 13,255 | — | — | 13,255 | 88,002 | — | — | 88,002 | (74,747 | ) | — | (74,747 | ) | |||||||||||||||||||||||||||||||
Royal Bank of Canada | 9,580 | — | — | 9,580 | 19,638 | — | — | 19,638 | (10,058 | ) | — | (10,058 | ) | |||||||||||||||||||||||||||||||
Standard Chartered Bank | — | — | — | — | 477 | — | — | 477 | (477 | ) | — | (477 | ) | |||||||||||||||||||||||||||||||
State Street Bank and Trust Company | 22,788 | — | — | 22,788 | 27,811 | — | — | 27,811 | (5,023 | ) | — | (5,023 | ) | |||||||||||||||||||||||||||||||
Toronto Dominion Bank | 12,325 | — | — | 12,325 | 27,984 | — | — | 27,984 | (15,659 | ) | — | (15,659 | ) | |||||||||||||||||||||||||||||||
UBS AG | — | — | — | — | 534 | — | — | 534 | (534 | ) | — | (534 | ) | |||||||||||||||||||||||||||||||
|
|
|
|
|
|
|
|
|
|
|
|
|
|
|
|
|
|
|
|
|
| |||||||||||||||||||||||
| $ | 208,709 | $ | — | $ | — | $ | 208,709 | $ | 253,456 | $ | — | $ | — | $ | 253,456 | $ | (44,747 | ) | $ | — | $ | (44,747 | ) | |||||||||||||||||||||
|
|
|
|
|
|
|
|
|
|
|
|
|
|
|
|
|
|
|
|
|
| |||||||||||||||||||||||
| (1) | Gross amounts of recognized assets and liabilities not offset in the Statements of Assets and Liabilities. |
| (2) | For each respective counterparty, collateral pledged or (received) is limited to an amount not to exceed 100% of the net amount of the derivative asset/liability in the table above. |
| (3) | Net amount represents the net amount due (to)/from counterparty in the event of a default based on the contractual set-off rights under the agreement. |
Foreign Currency Translation: The books and records of the Portfolios are maintained in U.S. dollars. Assets and liabilities denominated in foreign currencies and commitments under forward foreign currency contracts are translated into U.S. dollars based on the exchange rate of such currencies against U.S. dollars on the date of valuation.
The Portfolios do not isolate that portion of the results of operations arising as a result of changes in the foreign exchange rates from the changes in the market prices of securities held at the end of the period.
Similarly, the Portfolios do not isolate the effect of changes in foreign exchange rates from the changes in the market prices of portfolio securities sold during the period.
Realized foreign exchange gains and losses on other assets and liabilities and change in unrealized foreign exchange gains and losses on other assets and liabilities located in the Statements of Operations include realized foreign exchange gains and losses from currency gains or losses between the trade and the settlement dates of securities transactions, the difference between the amounts of interest,
| ||
| 78 |
Table of Contents
dividends and foreign withholding taxes recorded on the Portfolios’ books and the U.S. dollar equivalent amounts actually received or paid and changes in the unrealized foreign exchange gains and losses relating to the other assets and liabilities arising as a result of changes in the exchange rates.
Securities Transactions, Investment Income, Expenses, Dividends and Distributions to Shareholders: Security transactions are recorded on a trade date basis. Realized gains and losses on the sale of investments are calculated on the identified cost basis. For financial statement purposes, the Portfolios amortize all premiums and accrete all discounts on fixed income securities.
Interest income is accrued daily from settlement date except when collection is not expected. Dividend income is recorded on the ex-dividend date except for certain dividends from foreign securities, which are recorded as soon as the Trust is informed after the ex-dividend date. Paydown gains and losses on mortgage and asset-backed securities are recorded as components of interest income on the Statement of Operations.
Portfolios which earn foreign income and capital gains may be subject to foreign withholding taxes and capital gains taxes at various rates. Under applicable foreign law, a withholding of tax may be imposed on interest, dividends, and capital gains from the sale of foreign securities at various rates. India, Thailand, and certain other countries’ tax regulations require that taxes be paid on capital gains realized by a Portfolio.
Distributions received from a Portfolio’s investments in U.S. real estate investment trusts (“REITS”) often include a “return of capital” which is recorded as a reduction to the cost basis of the securities held.
Net investment income, expenses other than class specific expenses, and realized and unrealized gains and losses are allocated daily to each class of shares based upon the relative net asset value of outstanding shares of each class of share at the beginning of the day (after adjusting for current capital shares activity of the respective class).
Expenses common to all Portfolios are allocated among the Portfolios based upon relative net assets or other appropriate allocation methods. In all other respects, expenses are charged to each Portfolio as incurred on a specific identification basis.
Dividends from net investment income and capital gain distributions, if any, are paid annually. The Portfolios record dividends and distributions to their shareholders on the ex-dividend date.
The amount of dividends and distributions from net investment income and net realized capital gains are determined in accordance with federal income tax regulations, which may differ from GAAP. These “book/tax” differences are either considered temporary or permanent in nature. To the extent these differences are permanent in nature, such amounts are reclassified within the capital accounts at fiscal year end based on their federal tax-basis treatment; temporary differences do not require reclassification. Net assets are not affected by these reclassifications.
Each Portfolio is considered a separate entity for tax purposes and intends to comply with the requirements of the Internal Revenue Code, as amended, applicable to regulated investment companies and distribute all of its taxable income, including any net capital gains on investments, to its shareholders. Each Portfolio also intends to distribute sufficient net investment income and net capital gains, if any, so that it will not be subject to excise tax on undistributed income and gains. Therefore, no federal income tax or excise tax provision is required.
The Portfolios recognize the tax benefits of uncertain tax positions only when the position is more likely than not to be sustained, assuming examination by tax authorities. Management has analyzed each Portfolio’s tax positions and concluded that no liability for unrecognized tax benefits should be recorded related to uncertain tax positions taken on returns filed for open tax years 2014 – 2016 or expected to be taken in each Portfolio’s 2017 tax return. The Portfolios are not aware of any tax provisions for which it is reasonably possible that the total amounts of unrecognized tax benefits will change materially in the next twelve months. The Portfolios file U.S. federal and certain state income tax returns. With few exceptions, the Portfolios are no longer subject to U.S. federal and state tax examinations by tax authorities for tax returns ending before 2014.
Repurchase Agreements: The Portfolios, along with other affiliated registered investment companies, pursuant to procedures adopted by the Board and applicable guidance from the Securities and Exchange Commission (“SEC”), may transfer uninvested cash balances into a single joint account, the daily aggregate balance of which is invested in one or more repurchase agreements collateralized by U.S. Treasury or federal agency obligations. In a repurchase agreement, the seller of a security agrees to repurchase the security at a mutually agreed-upon time and price, which reflects the effective rate of return for the term of the agreement. For repurchase agreements and joint repurchase agreements, the Trust’s custodian takes possession of the collateral pledged for investments in such repurchase agreements (“repo” or collectively “repos”). The underlying collateral is valued daily on a mark to market basis, plus accrued interest to ensure that the value, at the time the agreement is entered into, is equal to at least 102% of the repurchase price, including accrued interest. In the event of default of the obligation to repurchase, a Portfolio has the right to liquidate the collateral and apply the proceeds in satisfaction of the obligation. If the seller defaults and the value of the collateral declines or if bankruptcy proceedings are commenced with respect to the seller of the security, realization of the collateral by a Portfolio may be delayed or limited.
| ||
| 79 |
Table of Contents
As of December 31, 2017, the following Portfolios held an undivided interest in a joint repurchase agreement with Bank of America Securities LLC:
Portfolio | Percentage Ownership | Principal Amount | ||||||
SA Wellington Government and Quality Bond | 61.66 | % | $ | 27,745,000 | ||||
SA Wellington Growth and Income | 0.87 | 390,000 | ||||||
SA Wellington Growth | 1.60 | 720,000 | ||||||
SA Wellington Capital Appreciation | 2.07 | 930,000 | ||||||
SA Wellington Natural Resources | 0.12 | 55,000 | ||||||
SA Wellington Multi-Asset Income | 1.34 | 605,000 | ||||||
As of such date, the repurchase agreement in that joint account and the collateral thereof were as follows:
Bank of America Securities LLC, dated December 29, 2017, bearing interest at a rate of 1.38% per annum, with a principal amount of $45,000,000, a repurchase price of $45,006,900, and a maturity date of January 2, 2018. The repurchase agreement is collateralized by the following:
Type of Collateral | Interest Rate | Maturity Date | Principal Amount | Value | ||||||||||||
U.S. Treasury Notes | 1.13 | % | 09/30/2021 | $ | 47,460,900 | $ | 45,894,320 | |||||||||
As of December 31, 2017, the following Portfolios held an undivided interest in a joint repurchase agreement with Barclays Capital, Inc.:
Portfolio | Percentage Ownership | Principal Amount | ||||||
SA Wellington Government and Quality Bond | 61.66 | % | $ | 30,830,000 | ||||
SA Wellington Growth and Income | 0.87 | 435,000 | ||||||
SA Wellington Growth | 1.60 | 800,000 | ||||||
SA Wellington Capital Appreciation | 2.07 | 1,035,000 | ||||||
SA Wellington Natural Resources | 0.12 | 60,000 | ||||||
SA Wellington Multi-Asset Income | 1.35 | 675,000 | ||||||
As of such date, the repurchase agreement in that joint account and the collateral thereof were as follows:
Barclays Capital, Inc., dated December 29, 2017, bearing interest at a rate of 1.35% per annum, with a principal amount of $50,000,000, a repurchase price of $50,007,500, and a maturity date of January 2, 2018. The repurchase agreement is collateralized by the following:
Type of Collateral | Interest Rate | Maturity Date | Principal Amount | Value | ||||||||||||
U.S. Treasury Notes | 2.00 | % | 11/15/2026 | $ | 52,646,000 | $ | 50,985,545 | |||||||||
As of December 31, 2017, the following Portfolios held an undivided interest in a joint repurchase agreement with BNP Paribas SA:
Portfolio | Percentage Ownership | Principal Amount | ||||||
SA Wellington Government and Quality Bond | 61.68 | % | $ | 52,430,000 | ||||
SA Wellington Growth and Income | 0.89 | 755,000 | ||||||
SA Wellington Growth | 1.61 | 1,370,000 | ||||||
SA Wellington Capital Appreciation | 2.09 | 1,775,000 | ||||||
SA Wellington Natural Resources | 0.14 | 120,000 | ||||||
SA Wellington Multi-Asset Income | 1.36 | 1,160,000 | ||||||
As of such date, the repurchase agreement in that joint account and the collateral thereof were as follows:
BNP Paribas SA, dated December 29, 2017, bearing interest at a rate of 1.35% per annum, with a principal amount of $85,000,000, a repurchase price of $85,012,750, and a maturity date of January 2, 2018. The repurchase agreement is collateralized by the following:
Type of Collateral | Interest Rate | Maturity Date | Principal Amount | Value | ||||||||||||
U.S. Treasury Notes | 2.13 | % | 05/15/2025 | $ | 87,944,000 | $ | 86,671,643 | |||||||||
| ||
| 80 |
Table of Contents
As of December 31, 2017, the following Portfolios held an undivided interest in a joint repurchase agreement with Deutsche Bank AG:
Portfolio | Percentage Ownership | Principal Amount | ||||||
SA Wellington Government and Quality Bond | 61.65 | % | $ | 20,460,000 | ||||
SA Wellington Growth and Income | 0.86 | 285,000 | ||||||
SA Wellington Growth | 1.60 | 530,000 | ||||||
SA Wellington Capital Appreciation | 2.06 | 685,000 | ||||||
SA Wellington Natural Resources | 0.12 | 40,000 | ||||||
SA Wellington Multi-Asset Income | 1.34 | 445,000 | ||||||
As of such date, the repurchase agreement in that joint account and the collateral thereof were as follows:
Deutsche Bank AG, dated December 29, 2017, bearing interest at a rate of 1.39% per annum, with a principal amount of $33,185,000, a repurchase price of $33,190,125, and a maturity date of January 2, 2018. The repurchase agreement is collateralized by the following:
Type of Collateral | Interest Rate | Maturity Date | Principal Amount | Value | ||||||||||||
U.S. Treasury Notes | 3.63 | % | 08/15/2019 | $ | 32,518,000 | $ | 33,857,416 | |||||||||
As of December 31, 2017, the following Portfolios held an undivided interest in a joint repurchase agreement with RBS Securities, Inc.:
Portfolio | Percentage Ownership | Principal Amount | ||||||
SA Wellington Government and Quality Bond | 61.66 | % | $ | 49,330,000 | ||||
SA Wellington Growth and Income | 0.87 | 695,000 | ||||||
SA Wellington Growth | 1.60 | 1,280,000 | ||||||
SA Wellington Capital Appreciation | 2.08 | 1,660,000 | ||||||
SA Wellington Natural Resources | 0.13 | 100,000 | ||||||
SA Wellington Multi-Asset Income | 1.35 | 1,080,000 | ||||||
As of such date, the repurchase agreement in that joint account and the collateral thereof were as follows:
RBS Securities, Inc., dated December 29, 2017, bearing interest at a rate of 1.34% per annum, with a principal amount of $80,000,000, a repurchase price of $80,011,911, and a maturity date of January 2, 2018. The repurchase agreement is collateralized by the following:
Type of Collateral | Interest Rate | Maturity Date | Principal Amount | Value | ||||||||||||
U.S. Treasury Notes | 1.25 | % | 10/31/2018 | $ | 81,840,000 | $ | 81,664,044 | |||||||||
Mortgage-Backed Dollar Rolls: During the period ended, the Government and Quality Bond Portfolio entered into dollar rolls using “to be announced” (“TBA”) mortgage-backed securities (“TBA Rolls”). TBA Roll transactions involve the sale of mortgage or other asset backed securities with the commitment to purchase substantially similar securities on a specified future date. The Portfolios’ policy is to record the components of TBA Rolls as purchase/sale transactions. Any difference between the purchase and sale price is recorded as a realized gain or loss on the date the transaction is entered into. TBA Roll transactions involve the risk that the market value of the securities held by a Portfolio may decline below the price of the securities that the Portfolio has sold but is obligated to repurchase under the agreement. In the event that the buyer of securities in a TBA Roll transaction files bankruptcy or becomes insolvent, a Portfolio’s use of the proceeds from the sale of the securities may be restricted pending a determination by the other party, or its trustee or receiver, whether to enforce the Portfolio’s obligation to repurchase the securities. The return earned by a Portfolio with the proceeds of the TBA roll transaction may not exceed the transaction costs. Mortgage-Backed Dollar Rolls outstanding at the end of the period, if any, are included in investments purchased/sold on an extended settlement basis in the Statement of Assets and Liabilities.
When-Issued Securities and Forward Commitments: Certain Portfolios may purchase or sell when-issued securities (including TBA securities) that have been authorized, but not yet issued in the market. In addition, a Portfolio may purchase or sell securities on a forward commitment basis. A forward commitment involves entering into a contract to purchase or sell securities, typically on an extended settlement basis, for a fixed price at a future date. The Portfolios may engage in when-issued or forward commitment transactions in order to secure what is considered to be an advantageous price and yield at the time of entering into the obligation. The purchase of securities on a when-issued or forward commitment basis involves a risk of loss if the value of the security to be purchased declines before the settlement date. Conversely, the sale of securities on a when-issued or forward commitment basis involves the risk that the value of the securities sold may increase before the settlement date. For the year ended December 31, 2017, the SA Wellington Government and Quality Bond Portfolio purchased and/or sold when-issued securities. Securities purchased or sold on a when-issued or forward commitment basis outstanding at the end of the period, if any, are included in investments purchased/sold on an extended settlement basis in the Statement of Assets and Liabilities.
Stripped Mortgage-Backed Securities: Stripped Mortgage-Backed Securities (“SMBS”) are multiple-class mortgage-backed securities. SMBS are often structured with two classes that receive different proportions of the interest and principal distributions on a pool of mortgage assets. SMBS have greater market volatility than other types of U.S. government securities in which a Portfolio invests. A common type of SMBS has one class receiving some of the interest and all or most of the principal (the “principal only” class) from the mortgage pool, while the other class will receive all or most of the interest (the “interest only” class). The yield to maturity on an
| ||
| 81 |
Table of Contents
interest only class is extremely sensitive not only to changes in prevailing interest rates, but also to the rate of principal payments, including principal prepayments, on the underlying pool of mortgage assets, and a rapid rate of principal payment may have a material adverse effect on a Portfolio’s yield.
New Accounting Pronouncement: In October 2016, the SEC adopted amendments to rules under the 1940 Act (“final rules”) intended to modernize the reporting and disclosure of information by registered investment companies. The final rules amend Regulation S-X and require funds to provide standardized, enhanced derivative disclosure in fund financial statements in a format designed for individual investors. The amendments to Regulation S-X also update the disclosures for other investments and investments in and advances to affiliates and amend the rules regarding the general form and content of fund financial statements. The compliance date for the amendments to Regulation S-X was August 1, 2017. All required changes have been made in accordance with Regulation S-X.
Note 3. Investment Advisory Agreement and Other Transactions with Affiliates
The Trust has entered into an Investment Advisory and Management Agreement (the “Management Agreement”) with SAAMCo with respect to each Portfolio. SAAMCo serves as investment adviser and manager for each of the Portfolios. The Management Agreement provides that SAAMCo shall act as investment adviser to the Trust; manage the Trust’s investments; administer its business affairs; furnish offices, necessary facilities and equipment; provide clerical, bookkeeping and administrative services; and permit any of its officers or employees to serve, without compensation, as trustees or officers of the Trust, if duly elected to such positions.
The Trust pays SAAMCo a monthly fee, calculated daily at the following annual percentages of each Portfolio’s average daily net assets:
| Portfolio | Average Daily Net Assets | Management Fee | ||||||
| SA Wellington Government and Quality Bond | $0-$200 million | .625% | ||||||
| > $200 million | .575% | |||||||
| > $500 million | .500% | |||||||
| SA Edge Asset Allocation | $0-$50 million | .750% | ||||||
| > $50 million | .650% | |||||||
| > $150 million | .600% | |||||||
| > $250 million | .550% | |||||||
| SA Wellington Growth and Income | $0-$100 million | .700% | ||||||
| > $100 million | .650% | |||||||
| > $250 million | .600% | |||||||
| > $500 million | .575% | |||||||
| SA Wellington Growth | $0-$250 million | .750% | ||||||
| > $250 million | .675% | |||||||
| > $500 million | .600% | |||||||
| Portfolio | Average Daily Net Assets | Management Fee | ||||||
| SA Wellington Capital Appreciation | $0-$50 million | .750% | ||||||
| > $50 million | .725% | |||||||
| > $100 million | .700% | |||||||
| SA Wellington Natural Resources | > $0 | .750% | ||||||
| SA BlackRock Multi-Asset Income(1)(2) | $0-$200 million | 1.000% | ||||||
| > $200 million | .875% | |||||||
| > $500 million | .800% | |||||||
| SA Wellington Multi-Asset Income | $0-$200 million | 1.000% | ||||||
| > $200 million | .875% | |||||||
| > $500 million | .800% | |||||||
| (1) | Pursuant to a Fee Waiver Agreement, SAAMCo is contractually obligated to waive a portion of its management fee with respect to the Portfolio so that the management fee rate payable by the Portfolio to SAAMCo under the Management Agreement is 0.80% of the Portfolio’s average daily net assets on the first $100 million, 0.77% on the next $400 million, 0.75% on the next $500 million and 0.72% thereafter. This Fee Waiver Agreement will continue in effect until April 30, 2018. The Fee Waiver Agreement will automatically terminate upon the termination of the Management Agreement. SAAMCo may not recoup any management fees waived with respect to the Portfolio pursuant to the Fee Waiver Agreement. |
| (2) | SAAMCo has also contractually agreed to waive a portion of its management fee with respect to the Portfolio in an amount equal to the Portfolio’s expenses related to investments in ETFs managed or advised by BlackRock Investment Management, LLC or its affiliates. |
For the year ended December 31, 2017, the amount of investment advisory fees waived was $141,142 for the SA BlackRock Multi-Asset Income Portfolio. This amount is reflected in the Statement of Operations.
Wellington Management Company LLP (“Wellington Management”) EDGE Asset Management a specialized boutique of Principal Global Investors, LLC (“EDGE” or “Edge Asset Management”) and BlackRock Investment Management, LLC (“BlackRock”), act as Subadvisers to the Trust pursuant to Subadvisory Agreements with SAAMCo. Under the Subadvisory Agreements, Wellington Management, EDGE and BlackRock manage the investment and reinvestment of the assets of the Portfolios of the Trust. Wellington Management, EDGE and BlackRock are independent of SAAMCo and discharge their responsibilities subject to the policies of the Board and oversight and supervision of SAAMCo, which pays Wellington Management, EDGE and BlackRock fees out of advisory fees it receives from the Portfolios.
The subadvisory fees paid to Wellington Management for all Portfolios except SA Edge Asset Allocation which is paid to EDGE and SA BlackRock Multi-Asset Income which is paid to BlackRock, are as follows:
| Portfolio | Average Daily Net Assets | Subadvisory Fee | ||||||
| SA Wellington Government and Quality Bond | $0-$50 million | .225% | ||||||
| > $50 million | .125% | |||||||
| > $100 million | .100% | |||||||
| Portfolio | Average Daily Net Assets | Subadvisory Fee | ||||||
| SA Edge Asset Allocation | $0-$50 million | .400% | ||||||
| > $50 million | .300% | |||||||
| > $150 million | .250% | |||||||
| > $250 million | .200% | |||||||
| ||
| 82 |
Table of Contents
| Portfolio | Average Daily Net Assets | Subadvisory Fee | ||||||
| SA Wellington Growth and Income | $0-$50 million | .325% | ||||||
| > $50 million | .225% | |||||||
| > $150 million | .200% | |||||||
| > $500 million | .150% | |||||||
| SA Wellington Growth | $0-$50 million | .325% | ||||||
| > $50 million | .225% | |||||||
| > $150 million | .200% | |||||||
| > $500 million | .150% | |||||||
| SA Wellington Capital Appreciation | $0-$50 million | .375% | ||||||
| > $50 million | .275% | |||||||
| > $150 million | .250% | |||||||
| Portfolio | Average Daily Net Assets | Subadvisory Fee | ||||||
| SA Wellington Natural Resources | $0-$50 million | .350% | ||||||
| > $50 million | .250% | |||||||
| > $150 million | .200% | |||||||
| > $500 million | .150% | |||||||
| SA BlackRock Multi-Asset Income(1) | $0-$100 million | .425% | ||||||
| > $100 million | .400% | |||||||
| > $500 million | .375% | |||||||
| > $1 billion | .350% | |||||||
| SA Wellington Multi-Asset Income | $0-$50 million | .300% | ||||||
| > $50 million | .200% | |||||||
| > $150 million | .175% | |||||||
| > $500 million | .150% | |||||||
| (1) | BlackRock has agreed to a contractual fee waiver arrangement pursuant to which it will waive all or a portion of its subadvisory fee in an amount equal to the Portfolio’s expenses related to investments in ETFs managed or advised by BlackRock or its affiliates. Notwithstanding the foregoing, the subadvisory fee waiver will not exceed 100% of the subadvisory fee. |
Class 2 and Class 3 shares of each Portfolio are subject to a Rule 12b-1 plan that provides for service fees payable at the annual rate of 0.15% and 0.25%, respectively of the average daily net assets of such Class 2 and Class 3 shares, respectively. The service fees will be used to compensate the Life Companies for expenditures made to financial intermediaries for providing services to contract holders who are the indirect beneficial owners of the Portfolios’ Class 2 and Class 3 shares.
The Trust has entered into a Master Transfer Agency and Services Agreement with VALIC Retirement Services Company (“VRSCO”), a wholly owned subsidiary of the Variable Annuity Life Insurance Company (“VALIC”), which is an affiliate of the Adviser. Under the agreement, VRSCO provides services, which include the issuance and redemption of shares, payment of dividends between the Trust and their “institutional” shareholders and certain shareholder reporting services including confirmation of transactions, statements of account and tax reporting. The Trust, and certain other mutual funds advised by SAAMCo pay VRSCO an annual fee in the aggregate amount of $150,000 for Transfer Agency Services provided pursuant to the agreement, which is allocated based on shareholder accounts. Accordingly, for the year ended December 31, 2017, transfer agent fees were paid (see Statement of Operations) based on the aforementioned agreement.
SAAMCo has contractually agreed to waive its fees and/or reimburse expenses for the SA BlackRock Multi-Asset Income Portfolio until April 30, 2018, so that the annual operating expenses does not exceed 0.58% for Class 1 shares and 0.83% for Class 3 shares, respectively. Further, SAAMCo has contractually agreed to waive fees and/or reimburse expenses, if necessary, for the SA Wellington Multi-Asset Income Portfolio, so that the annual operating expenses do not exceed 0.86% for Class 1 shares and 1.11% for Class 3 shares, respectively. For the purposes of waived fee and/or reimbursed expense calculations, annual operating expenses shall not include extraordinary expenses (i.e., expenses that are unusual in nature and/or infrequent in occurrence, such as litigation), or acquired fund fees and expenses, brokerage commissions and other transactional expenses relating to the purchase and sale of portfolio securities, interest, taxes and governmental fees, and other expenses not incurred in the ordinary course of a Portfolio’s business. Any voluntary or contractual waivers or reimbursements made by SAAMCo with respect to the SA BlackRock Multi-Asset Income and SA Wellington Multi-Asset Income Portfolios, with the exception of management fee waivers, are subject to recoupment from each Portfolio within two years after the occurrence of the waivers and/or reimbursements, provided that the Portfolios are able to effect such payment to SAAMCo and remain in compliance with the contractual expense limitations in effect at the time the waivers and/or reimbursements were made. The contractual fee waivers and/or expense limitations may be modified or discontinued prior to April 30, 2018, only with the approval of the Board. For the year ended December 31, 2017, pursuant to the contractual and voluntary expense limitations mentioned above, SAAMCo waived fees and/or reimbursed expenses as follows:
| Portfolio | Amount | |||
SA BlackRock Multi-Asset Income — Class 1 | $ | 47,579 | ||
SA BlackRock Multi-Asset Income — Class 3 | 29,272 | |||
SA Wellington Multi-Asset Income — Class 1 | 153,739 | |||
SA Wellington Multi-Asset Income — Class 3 | 43,097 | |||
| ||
| 83 |
Table of Contents
For the year ended December 31, 2017, the amounts repaid to the Adviser which are included in the Statement of Operations along with the remaining balance subject to recoupment are as follows:
| Amount Recouped | Balance Subject to Recoupment | |||||||||||
| Portfolio | December 31, 2017 | December 31, 2018 | December 31, 2019 | |||||||||
SA BlackRock Multi-Asset Income — Class 1 | $ | — | $ | 63,107 | $ | 47,579 | ||||||
SA BlackRock Multi-Asset Income — Class 3 | — | 5,420 | 29,272 | |||||||||
SA Wellington Multi-Asset Income — Class 1 | — | 178,941 | 153,739 | |||||||||
SA Wellington Multi-Asset Income — Class 3 | — | 1,793 | 43,097 | |||||||||
At December 31, 2017, the following affiliates owned outstanding shares of the following Portfolios:
| Holder | ||||||||||||||||||||||||||||||||||||
| Portfolio | USL | AGL | VALIC | SunAmerica | SunAmerica | Seasons Series Trust SA Allocation Balanced Portfolio | Seasons Series Trust SA Allocation Growth Portfolio | Seasons Series Trust SA Allocation Moderate Growth Portfolio | Seasons Series Trust SA Allocation Moderate portfolio | |||||||||||||||||||||||||||
SA Wellington Government and Quality Bond | 2.51 | % | 54.06 | % | 0.14 | % | 31.40 | % | 9.86 | % | 0.58 | % | 0.10 | % | 0.75 | % | 0.59 | % | ||||||||||||||||||
SA Edge Asset Allocation | 3.49 | 96.49 | 0.02 | — | — | — | — | — | — | |||||||||||||||||||||||||||
SA Wellington Growth and Income | 0.14 | 4.08 | — | 95.55 | — | — | — | — | — | |||||||||||||||||||||||||||
SA Wellington Growth | 2.35 | 66.73 | 0.00 | 30.45 | — | — | — | — | — | |||||||||||||||||||||||||||
SA Wellington Capital Appreciation | 2.64 | 83.98 | 0.09 | 13.02 | — | — | — | — | — | |||||||||||||||||||||||||||
SA Wellington Natural Resources | 4.41 | 95.36 | 0.02 | — | — | — | — | — | — | |||||||||||||||||||||||||||
SA BlackRock Multi-Asset Income | 3.18 | 91.57 | 1.32 | — | — | — | — | — | — | |||||||||||||||||||||||||||
SA Wellington Multi-Asset Income | 3.22 | 90.29 | 0.54 | — | — | — | — | — | — | |||||||||||||||||||||||||||
Note 4. Expense Reductions
Through expense offset arrangements resulting from broker commission recapture, a portion of the expenses of certain Portfolios have been reduced. For the year ended December 31, 2017, the amount of expense reductions received by each Portfolio used to offset non-affiliated expenses are reflected as Fees paid indirectly in the Statement of Operations.
Note 5. Purchases and Sales of Investment Securities
The cost of purchases and proceeds from sales and maturities of long-term investments for the year ended December 31, 2017 were as follows:
Portfolio | Purchases of Investment Securities (excluding U.S. Government Securities) | Sales of Investment Securities (excluding U.S. Government Securities) | Purchases of U.S. Government Securities | Sales of U.S. Government Securities | ||||||||||||
SA Wellington Government and Quality Bond | $ | 238,994,790 | $ | 140,482,189 | $ | 279,059,612 | $ | 466,376,920 | ||||||||
SA Edge Asset Allocation | 63,598,566 | 75,172,389 | 7,325,902 | 7,066,471 | ||||||||||||
SA Wellington Growth and Income | 60,533,888 | 93,468,015 | — | — | ||||||||||||
SA Wellington Growth | 219,655,900 | 347,422,835 | — | — | ||||||||||||
SA Wellington Capital Appreciation | 1,009,402,683 | 1,221,756,631 | — | — | ||||||||||||
SA Wellington Natural Resources | 148,832,079 | 168,767,774 | — | — | ||||||||||||
SA BlackRock Multi-Asset Income | 14,034,405 | 3,026,420 | — | — | ||||||||||||
SA Wellington Multi-Asset Income | 28,098,904 | 23,647,348 | 3,433,406 | 772,583 | ||||||||||||
| ||
| 84 |
Table of Contents
Note 6. Federal Income Taxes
The following details the tax basis of distributions as well as the components of distributable earnings. The tax basis components of distributable earnings differ from the amounts reflected in the Statements of Assets and Liabilities by temporary book/tax differences primarily arising from wash sales, investments in passive foreign investment companies, investments in real estate investment trusts, investments in regulated investment companies, straddles, amortization for premium/discount, investments in partnerships, treatment of defaulted securities and derivative transactions.
| For the year ended December 31, 2017 | ||||||||||||||||||||
| Distributable Earnings | Tax Distributions | |||||||||||||||||||
Portfolio | Ordinary Income | Long-Term Gains, Capital and Other Losses | Unrealized Appreciation (Depreciation)* | Ordinary Income | Long-Term Capital Gains | |||||||||||||||
SA Wellington Government and Quality Bond | $ | 30,640,542 | $ | — | $ | 16,169,430 | $ | 27,689,363 | $ | — | ||||||||||
SA Edge Asset Allocation | 5,121,773 | 8,255,877 | 20,425,472 | 5,343,270 | 15,594,452 | |||||||||||||||
SA Wellington Growth and Income | 3,704,368 | 17,337,862 | 49,839,397 | 1,468,614 | 5,686,009 | |||||||||||||||
SA Wellington Growth | 17,348,925 | 30,079,188 | 57,301,335 | 4,270,642 | — | |||||||||||||||
SA Wellington Capital Appreciation | 64,413,707 | 127,966,333 | 295,920,195 | — | 106,719,764 | |||||||||||||||
SA Wellington Natural Resources | 2,352,300 | (62,936,507 | ) | 10,008,701 | 2,625,419 | — | ||||||||||||||
SA BlackRock Multi-Asset Income | 831,462 | (390,932 | ) | 281,526 | 617,830 | — | ||||||||||||||
SA Wellington Multi-Asset Income | 295,006 | 605,201 | 2,168,392 | 66,272 | — | |||||||||||||||
| * | Unrealized appreciation (depreciation) includes amounts for derivatives and other assets and liabilities denominated in foreign currency. |
| For the year ended December 31, 2016 | ||||||||
| Tax Distributions | ||||||||
Portfolio | Ordinary Income | Long-Term Capital Gains | ||||||
SA Wellington Government and Quality Bond | $ | 32,285,974 | $ | 600,547 | ||||
SA Edge Asset Allocation | 5,184,472 | 13,295,515 | ||||||
SA Wellington Growth and Income | 1,508,117 | 8,736,288 | ||||||
SA Wellington Growth | 15,264,717 | 21,139,685 | ||||||
SA Wellington Capital Appreciation | — | 163,922,414 | ||||||
SA Wellington Natural Resources | 4,617,761 | — | ||||||
SA BlackRock Multi-Asset Income | 1,253,545 | 1,318,948 | ||||||
SA Wellington Multi-Asset Income | 327,391 | 1,294,134 | ||||||
As of December 31, 2017, for Federal income tax purposes, the Portfolios indicated below have capital loss carryforwards, which are available to offset future capital gains, if any:
Portfolio | Unlimited† | |||||||
| ST | LT | |||||||
SA Wellington Government and Quality Bond | $ | — | $ | — | ||||
SA Edge Asset Allocation | — | — | ||||||
SA Wellington Growth and Income | — | — | ||||||
SA Wellington Growth | — | — | ||||||
SA Wellington Capital Appreciation | — | — | ||||||
SA Wellington Natural Resources | 737,946 | 62,198,561 | ||||||
SA BlackRock Multi-Asset Income | 153,848 | 237,084 | ||||||
SA Wellington Multi-Asset Income | — | — | ||||||
| † | On December 22, 2010, the Regulated Investment Company Modernization Act of 2010 (the “Act”) was enacted which changed various technical rules governing the tax treatment of regulated investment companies. The changes are generally effective for taxable years beginning after the date of enactment. Under the Act, the fund will be permitted to carry forward capital losses incurred in taxable years beginning after the date of enactment for an unlimited period. However, any losses incurred during those future taxable years will be required to be utilized prior to the losses incurred in pre-enactment taxable years, which carry an expiration date. As a result of this ordering rule, pre-enactment capital loss carryforwards may be more likely to expire unused. Additionally, post-enactment capital losses that are carried forward will retain their character as either short-term or long-term losses rather than being considered all short-term as under previous law. |
| ||
| 85 |
Table of Contents
The Portfolios indicated below, utilized capital loss carryforwards, which offset net taxable gains realized in the year ended December 31, 2017.
Portfolio | Capital Loss Carryforward Utilized | |||
SA Wellington Government and Quality Bond | $ | 1,835,009 | ||
SA Edge Asset Allocation | — | |||
SA Wellington Growth and Income | — | |||
SA Wellington Growth | 778,348 | |||
SA Wellington Capital Appreciation | — | |||
SA Wellington Natural Resources | 9,019,497 | |||
SA BlackRock Multi-Asset Income | 6,813 | |||
SA Wellington Multi-Asset Income | 19,334 | |||
For the year ended December 31, 2017, the reclassifications arising from book/tax differences resulted in increases (decreases) that were primarily due to treatment of foreign currency, principal paydown adjustments, amortization of premium/discount and sale of passive foreign investment companies to the components of net assets as follows:
Portfolio | Accumulated Undistributed Net Investment Income (Loss) | Accumulated Undistributed Net Realized Gain (Loss) | Capital Paid-in | |||||||||
SA Wellington Government and Quality Bond | $ | 1,672,728 | $ | (1,672,728 | ) | $ | — | |||||
SA Edge Asset Allocation | 648,761 | (613,760 | ) | (35,001 | ) | |||||||
SA Wellington Growth and Income | — | — | — | |||||||||
SA Wellington Growth | 12,089 | (12,089 | ) | — | ||||||||
SA Wellington Capital Appreciation | 1,082,636 | (1,082,636 | ) | — | ||||||||
SA Wellington Natural Resources | 1,573,456 | (1,573,456 | ) | — | ||||||||
SA BlackRock Multi-Asset Income | 26,552 | (26,552 | ) | — | ||||||||
SA Wellington Multi-Asset Income | (85,743 | ) | 85,743 | — | ||||||||
As of December 31, 2017, the amounts of the aggregate unrealized gain (loss) and the cost of investment securities for federal income tax purposes, including short-term securities and repurchase agreements, were as follows:
Portfolio | Aggregate Unrealized Gain | Aggregate Unrealized Loss | Net Unrealized Gain(Loss) | Cost of Investments | ||||||||||||
SA Wellington Government and Quality Bond | $ | 30,910,874 | $ | (14,748,410 | ) | $ | 16,162,464 | $ | 1,716,645,232 | |||||||
SA Edge Asset Allocation | 23,742,512 | (3,317,161 | ) | 20,425,351 | 176,022,567 | |||||||||||
SA Wellington Growth and Income | 51,279,758 | (1,440,361 | ) | 49,839,397 | 153,323,584 | |||||||||||
SA Wellington Growth | 68,628,639 | (11,326,822 | ) | 57,301,817 | 343,571,027 | |||||||||||
SA Wellington Capital Appreciation | 314,589,194 | (18,667,790 | ) | 295,921,404 | 1,066,437,670 | |||||||||||
SA Wellington Natural Resources | 12,270,234 | (2,262,401 | ) | 10,007,833 | 104,966,667 | |||||||||||
SA BlackRock Multi-Asset Income | 796,366 | (516,710 | ) | 279,656 | 33,862,566 | |||||||||||
SA Wellington Multi-Asset Income | 2,390,695 | (222,978 | ) | 2,167,717 | 29,390,213 | |||||||||||
On December 22, 2017, the Tax Cuts and Jobs Act (the “Act”) was signed into law. Certain provisions of the Act were effective upon enactment with the remainder becoming effective for tax years beginning after December 31, 2017. Management is currently evaluating the impact, if any, on the financial statements and the accompanying notes to financial statements.
Note 7. Capital Share Transactions
Transactions in capital shares of each class of each Portfolio were as follows:
| SA Wellington Government and Quality Bond Portfolio | ||||||||||||||||||||||||||||||||
| Class 1 | Class 2 | |||||||||||||||||||||||||||||||
| For the year ended December 31, 2017 | For the year ended December 31, 2016 | For the year ended December 31, 2017 | For the year ended December 31, 2016 | |||||||||||||||||||||||||||||
| Shares | Amount | Shares | Amount | Shares | Amount | Shares | Amount | |||||||||||||||||||||||||
Shares sold | 11,903,128 | $ | 180,282,729 | 16,463,438 | $ | 255,626,536 | 126,394 | $ | 1,904,567 | 117,238 | $ | 1,771,349 | ||||||||||||||||||||
Reinvested dividends | 1,017,372 | 15,249,773 | 1,161,980 | 17,752,551 | 30,667 | 460,942 | 40,299 | 616,753 | ||||||||||||||||||||||||
Shares redeemed | (14,524,066 | ) | (218,090,472 | ) | (6,625,265 | ) | (101,012,243 | ) | (376,604 | ) | (5,682,497 | ) | (508,394 | ) | (7,814,507 | ) | ||||||||||||||||
|
|
|
|
|
|
|
|
|
|
|
|
|
|
|
| |||||||||||||||||
Net increase (decrease) | (1,603,566 | ) | $ | (22,557,970 | ) | 11,000,153 | $ | 172,366,844 | (219,543 | ) | $ | (3,316,988 | ) | (350,857 | ) | $ | (5,426,405 | ) | ||||||||||||||
|
|
|
|
|
|
|
|
|
|
|
|
|
|
|
| |||||||||||||||||
| ||
| 86 |
Table of Contents
| SA Wellington Government and Quality Bond Portfolio | ||||||||||||||||||||||||||||||||
| Class 3 | ||||||||||||||||||||||||||||||||
| For the year ended December 31, 2017 | For the year ended December 31, 2016 | |||||||||||||||||||||||||||||||
| Shares | Amount | Shares | Amount | |||||||||||||||||||||||||||||
Shares sold | 6,251,874 | $ | 93,909,649 | 10,821,495 | $ | 164,671,712 | ||||||||||||||||||||||||||
Reinvested dividends | 800,844 | 11,978,648 | 952,824 | 14,517,217 | ||||||||||||||||||||||||||||
Shares redeemed | (8,352,882 | ) | (125,343,532 | ) | (9,923,325 | ) | (150,379,284 | ) | ||||||||||||||||||||||||
|
|
|
|
|
|
|
| |||||||||||||||||||||||||
Net increase (decrease) | (1,300,164 | ) | $ | (19,455,235 | ) | 1,850,994 | $ | 28,809,645 | ||||||||||||||||||||||||
|
|
|
|
|
|
|
| |||||||||||||||||||||||||
| SA Edge Asset Allocation Portfolio | ||||||||||||||||||||||||||||||||
| Class 1 | Class 2 | |||||||||||||||||||||||||||||||
| For the year ended December 31, 2017 | For the year ended December 31, 2016 | For the year ended December 31, 2017 | For the year ended December 31, 2016 | |||||||||||||||||||||||||||||
| Shares | Amount | Shares | Amount | Shares | Amount | Shares | Amount | |||||||||||||||||||||||||
Shares sold | 93,406 | $ | 1,348,713 | 96,667 | $ | 1,401,937 | 30,244 | $ | 439,206 | 129,492 | $ | 1,825,334 | ||||||||||||||||||||
Reinvested dividends | 915,105 | 12,667,548 | 864,454 | 11,815,787 | 111,492 | 1,541,892 | 94,876 | 1,295,980 | ||||||||||||||||||||||||
Shares redeemed | (1,243,714 | ) | (18,114,585 | ) | (1,385,211 | ) | (19,795,991 | ) | (147,650 | ) | (2,160,809 | ) | (169,051 | ) | (2,400,137 | ) | ||||||||||||||||
|
|
|
|
|
|
|
|
|
|
|
|
|
|
|
| |||||||||||||||||
Net increase (decrease) | (235,203 | ) | $ | (4,098,324 | ) | (424,090 | ) | $ | (6,578,267 | ) | (5,914 | ) | $ | (179,711 | ) | 55,317 | $ | 721,177 | ||||||||||||||
|
|
|
|
|
|
|
|
|
|
|
|
|
|
|
| |||||||||||||||||
| ||||||||||||||||||||||||||||||||
| Class 3 | ||||||||||||||||||||||||||||||||
| For the year ended December 31, 2017 | For the year ended December 31, 2016 | |||||||||||||||||||||||||||||||
| Shares | Amount | Shares | Amount | |||||||||||||||||||||||||||||
Shares sold | 766,787 | $ | 11,113,141 | 1,064,143 | $ | 14,793,953 | ||||||||||||||||||||||||||
Reinvested dividends | 489,822 | 6,728,282 | 395,262 | 5,368,219 | ||||||||||||||||||||||||||||
Shares redeemed | (831,555 | ) | (11,988,144 | ) | (1,158,837 | ) | (16,013,416 | ) | ||||||||||||||||||||||||
|
|
|
|
|
|
|
| |||||||||||||||||||||||||
Net increase (decrease) | 425,054 | $ | 5,853,279 | 300,568 | $ | 4,148,756 | ||||||||||||||||||||||||||
|
|
|
|
|
|
|
| |||||||||||||||||||||||||
| SA Wellington Growth and Income Portfolio | ||||||||||||||||||||||||||||||||
| Class 1 | ||||||||||||||||||||||||||||||||
| For the year ended December 31, 2017 | For the year ended December 31, 2016 | |||||||||||||||||||||||||||||||
| Shares | Amount | Shares | Amount | |||||||||||||||||||||||||||||
Shares sold | 13,356 | $ | 186,299 | 275,946 | $ | 3,299,914 | ||||||||||||||||||||||||||
Reinvested dividends | 509,314 | 7,154,623 | 845,709 | 10,244,405 | ||||||||||||||||||||||||||||
Shares redeemed | (2,574,297 | ) | (35,565,774 | ) | (1,803,408 | ) | (22,642,594 | ) | ||||||||||||||||||||||||
|
|
|
|
|
|
|
| |||||||||||||||||||||||||
Net increase (decrease) | (2,051,627 | ) | $ | (28,224,852 | ) | (681,753 | ) | $ | (9,098,275 | ) | ||||||||||||||||||||||
|
|
|
|
|
|
|
| |||||||||||||||||||||||||
| SA Wellington Growth Portfolio | ||||||||||||||||||||||||||||||||
| Class 1 | Class 2 | |||||||||||||||||||||||||||||||
| For the year ended December 31, 2017 | For the year ended December 31, 2016 | For the year ended December 31, 2017 | For the year ended December 31, 2016 | |||||||||||||||||||||||||||||
| Shares | Amount | Shares | Amount | Shares | Amount | Shares | Amount | |||||||||||||||||||||||||
Shares sold | 51,794 | $ | 1,452,942 | 335,398 | $ | 8,555,325 | 6,814 | $ | 199,033 | 10,589 | $ | 271,874 | ||||||||||||||||||||
Reinvested dividends | 106,837 | 3,181,040 | 1,100,311 | 27,423,787 | 6,034 | 179,962 | 56,881 | 1,420,015 | ||||||||||||||||||||||||
Shares redeemed | (4,197,614 | ) | (117,877,751 | ) | (7,949,093 | ) | (217,345,229 | ) | (134,234 | ) | (3,839,771 | ) | (126,242 | ) | (3,294,819 | ) | ||||||||||||||||
|
|
|
|
|
|
|
|
|
|
|
|
|
|
|
| |||||||||||||||||
Net increase (decrease) | (4,038,983 | ) | $ | (113,243,769 | ) | (6,513,384 | ) | $ | (181,366,117 | ) | (121,386 | ) | $ | (3,460,776 | ) | (58,772 | ) | $ | (1,602,930 | ) | ||||||||||||
|
|
|
|
|
|
|
|
|
|
|
|
|
|
|
| |||||||||||||||||
| ||||||||||||||||||||||||||||||||
| Class 3 | ||||||||||||||||||||||||||||||||
| For the year ended December 31, 2017 | For the year ended December 31, 2016 | |||||||||||||||||||||||||||||||
| Shares | Amount | Shares | Amount | |||||||||||||||||||||||||||||
Shares sold | 159,954 | $ | 4,562,603 | 179,653 | $ | 4,671,445 | ||||||||||||||||||||||||||
Reinvested dividends | 30,570 | 909,640 | 303,471 | 7,560,600 | ||||||||||||||||||||||||||||
Shares redeemed | (631,038 | ) | (18,190,868 | ) | (645,396 | ) | (16,730,991 | ) | ||||||||||||||||||||||||
|
|
|
|
|
|
|
| |||||||||||||||||||||||||
Net increase (decrease) | (440,514 | ) | $ | (12,718,625 | ) | (162,272 | ) | $ | (4,498,946 | ) | ||||||||||||||||||||||
|
|
|
|
|
|
|
| |||||||||||||||||||||||||
| ||
| 87 |
Table of Contents
| SA Wellington Capital Appreciation Portfolio | ||||||||||||||||||||||||||||||||
| Class 1 | Class 2 | |||||||||||||||||||||||||||||||
| For the year ended December 31, 2017 | For the year ended December 31, 2016 | For the year ended December 31, 2017 | For the year ended December 31, 2016 | |||||||||||||||||||||||||||||
| Shares | Amount | Shares | Amount | Shares | Amount | Shares | Amount | |||||||||||||||||||||||||
Shares sold | 76,395 | $ | 3,420,305 | 927,515 | $ | 35,127,045 | 22,748 | $ | 991,581 | 21,128 | $ | 821,207 | ||||||||||||||||||||
Reinvested dividends | 1,117,158 | 49,894,633 | 2,077,388 | 79,138,273 | 92,663 | 3,970,623 | 166,278 | 6,106,794 | ||||||||||||||||||||||||
Shares redeemed | (2,600,710 | ) | (115,576,480 | ) | (4,613,101 | ) | (191,732,034 | ) | (224,134 | ) | (9,533,616 | ) | (210,364 | ) | (8,212,739 | ) | ||||||||||||||||
|
|
|
|
|
|
|
|
|
|
|
|
|
|
|
| |||||||||||||||||
Net increase (decrease) | (1,407,157 | ) | $ | (62,261,542 | ) | (1,608,198 | ) | $ | (77,466,716 | ) | (108,723 | ) | $ | (4,571,412 | ) | (22,958 | ) | $ | (1,284,738 | ) | ||||||||||||
|
|
|
|
|
|
|
|
|
|
|
|
|
|
|
| |||||||||||||||||
| ||||||||||||||||||||||||||||||||
| Class 3 | ||||||||||||||||||||||||||||||||
| For the year ended December 31, 2017 | For the year ended December 31, 2016 | |||||||||||||||||||||||||||||||
| Shares | Amount | Shares | Amount | |||||||||||||||||||||||||||||
Shares sold | 553,929 | $ | 22,471,447 | 1,305,333 | $ | 48,921,329 | ||||||||||||||||||||||||||
Reinvested dividends | 1,267,915 | 52,854,508 | 2,194,848 | 78,677,347 | ||||||||||||||||||||||||||||
Shares redeemed | (3,266,319 | ) | (136,027,145 | ) | (2,426,500 | ) | (92,526,789 | ) | ||||||||||||||||||||||||
|
|
|
|
|
|
|
| |||||||||||||||||||||||||
Net increase (decrease) | (1,444,475 | ) | $ | (60,701,190 | ) | 1,073,681 | $ | 35,071,887 | ||||||||||||||||||||||||
|
|
|
|
|
|
|
| |||||||||||||||||||||||||
| SA Wellington Natural Resources Portfolio | ||||||||||||||||||||||||||||||||
| Class 1 | Class 2 | |||||||||||||||||||||||||||||||
| For the year ended December 31, 2017 | For the year ended December 31, 2016 | For the year ended December 31, 2017 | For the year ended December 31, 2016 | |||||||||||||||||||||||||||||
| Shares | Amount | Shares | Amount | Shares | Amount | Shares | Amount | |||||||||||||||||||||||||
Shares sold | 41,257 | $ | 764,175 | 126,320 | $ | 2,005,556 | 18,763 | $ | 347,810 | 10,423 | $ | 171,931 | ||||||||||||||||||||
Reinvested dividends | 38,966 | 741,662 | 77,441 | 1,228,880 | 8,179 | 155,460 | 17,988 | 285,068 | ||||||||||||||||||||||||
Shares redeemed | (272,682 | ) | (5,075,704 | ) | (3,459,041 | ) | (56,825,328 | ) | (77,133 | ) | (1,428,424 | ) | (86,398 | ) | (1,451,951 | ) | ||||||||||||||||
|
|
|
|
|
|
|
|
|
|
|
|
|
|
|
| |||||||||||||||||
Net increase (decrease) | (192,459 | ) | $ | (3,569,867 | ) | (3,255,280 | ) | $ | (53,590,892 | ) | (50,191 | ) | $ | (925,154 | ) | (57,987 | ) | $ | (994,952 | ) | ||||||||||||
|
|
|
|
|
|
|
|
|
|
|
|
|
|
|
| |||||||||||||||||
| ||||||||||||||||||||||||||||||||
| Class 3 | ||||||||||||||||||||||||||||||||
| For the year ended December 31, 2017 | For the year ended December 31, 2016 | |||||||||||||||||||||||||||||||
| Shares | Amount | Shares | Amount | |||||||||||||||||||||||||||||
Shares sold | 455,673 | $ | 8,123,884 | 328,772 | $ | 5,359,222 | ||||||||||||||||||||||||||
Reinvested dividends | 91,389 | 1,728,297 | 196,806 | 3,103,813 | ||||||||||||||||||||||||||||
Shares redeemed | (1,177,483 | ) | (21,974,666 | ) | (1,319,530 | ) | (21,711,003 | ) | ||||||||||||||||||||||||
|
|
|
|
|
|
|
| |||||||||||||||||||||||||
Net increase (decrease) | (630,421 | ) | $ | (12,122,485 | ) | (793,952 | ) | $ | (13,247,968 | ) | ||||||||||||||||||||||
|
|
|
|
|
|
|
| |||||||||||||||||||||||||
| SA BlackRock Multi-Asset Income Portfolio | ||||||||||||||||||||||||||||||||
| Class 1 | Class 3 | |||||||||||||||||||||||||||||||
| For the year ended December 31, 2017 | For the year ended December 31, 2016 | For the year ended December 31, 2017 | For the year ended December 31, 2016 | |||||||||||||||||||||||||||||
| Shares | Amount | Shares | Amount | Shares | Amount | Shares | Amount | |||||||||||||||||||||||||
Shares sold | 47,222 | $ | 304,064 | 9,426 | $ | 65,217 | 2,188,952 | $ | 14,067,488 | 723,956 | $ | 4,762,211 | ||||||||||||||||||||
Reinvested dividends | 52,364 | 338,865 | 362,454 | 2,243,969 | 43,507 | 278,965 | 53,421 | 328,524 | ||||||||||||||||||||||||
Shares redeemed | (368,640 | ) | (2,372,973 | ) | (357,754 | ) | (2,354,937 | ) | (176,374 | ) | (1,139,867 | ) | (51,602 | ) | (323,255 | ) | ||||||||||||||||
|
|
|
|
|
|
|
|
|
|
|
|
|
|
|
| |||||||||||||||||
Net increase (decrease) | (269,054 | ) | $ | (1,730,044 | ) | 14,126 | $ | (45,751 | ) | 2,056,085 | $ | 13,206,586 | 725,775 | $ | 4,767,480 | |||||||||||||||||
|
|
|
|
|
|
|
|
|
|
|
|
|
|
|
| |||||||||||||||||
| SA Wellington Multi-Asset Income Portfolio | ||||||||||||||||||||||||||||||||
| Class 1 | Class 3 | |||||||||||||||||||||||||||||||
| For the year ended December 31, 2017 | For the year ended December 31, 2016 | For the year ended December 31, 2017 | For September 26, 2016@ to December 31, 2016 | |||||||||||||||||||||||||||||
| Shares | Amount | Shares | Amount | Shares | Amount | Shares | Amount | |||||||||||||||||||||||||
Shares sold | 16,707 | $ | 127,075 | 21,465 | $ | 155,971 | 1,605,761 | $ | 12,528,914 | 68,991 | $ | 482,985 | ||||||||||||||||||||
Reinvested dividends | 6,027 | 47,644 | 232,799 | 1,621,525 | 2,361 | 18,628 | — | — | ||||||||||||||||||||||||
Shares redeemed | (206,944 | ) | (1,582,460 | ) | (316,760 | ) | (2,321,117 | ) | (45,787 | ) | (359,449 | ) | (1,771 | ) | (12,343 | ) | ||||||||||||||||
|
|
|
|
|
|
|
|
|
|
|
|
|
|
|
| |||||||||||||||||
Net increase (decrease) | (184,210 | ) | $ | (1,407,741 | ) | (62,496 | ) | $ | (543,621 | ) | 1,562,335 | $ | 12,188,093 | 67,220 | $ | 470,642 | ||||||||||||||||
|
|
|
|
|
|
|
|
|
|
|
|
|
|
|
| |||||||||||||||||
| @ | Commencement of operations. |
| ||
| 88 |
Table of Contents
Note 8. Line of Credit
The Trust, along with certain other funds managed by the Adviser, has access to a $75 million committed unsecured line of credit and a $50 million uncommitted unsecured line of credit. The committed and uncommitted lines of credit are renewable on an annual basis with State Street Bank and Trust Company (“State Street”), the Trust’s custodian. Interest is currently payable on the committed lines of credit at the higher of the Federal Funds Rate (but not less than zero) plus 125 basis points or the One-Month London Interbank Offered Rate (but not less than zero) plus 125 basis points and State Street’s discretionary bid rate on the uncommitted line of credit. There is also a commitment fee of 25 basis points per annum on the daily unused portion of the committed line of credit and an upfront fee of $25,000 on the uncommitted line of credit. Borrowings under the line of credit will commence when the respective Fund’s cash shortfall exceeds $100,000. For the year ended December 31, 2017, the following portfolios had borrowings:
Portfolio | Days Outstanding | Interest Charges | Average Debt Utilized | Weighted Average Interest | ||||||||||||
SA Wellington Capital Appreciation . . . . . . . . . . . . . . . . . . . . . . . . . . . . . . . .. | 26 | $ | 3,099 | $ | 1,776,123 | 2.41 | % | |||||||||
SA Wellington Natural Resources . . . . . . . . . . . . . . . . . . . . . . . . . . . . . . . . . .. | 17 | 657 | 614,119 | 2.27 | ||||||||||||
At December 31, 2017, there were no borrowings outstanding.
Note 9. Interfund Lending Agreement
Pursuant to the exemptive relief granted by the SEC, the Portfolios are permitted to participate in an interfund lending program among investment companies advised by SAAMCo or an affiliate. The interfund lending program allows the participating Portfolios to borrow money from and lend money to each other for temporary or emergency purposes. An interfund loan will be made under this facility only if the participating Portfolios receive a more favorable interest rate than would otherwise be available from a typical bank for a comparable transaction. For the year ended December 31, 2017, none of the Portfolios participated in this program.
Note 10. Investment Concentration
The SA Wellington Natural Resources Portfolio invests primarily in securities related to natural resources, such as energy, metals, mining and forest products. The Portfolio will be subject to certain risks specific to investing in the natural resources industry. Investments in securities related to precious metals and minerals are considered speculative. Prices of precious metals may fluctuate sharply over short time periods due to changes in inflation or expectations regarding inflation in various countries; metal sales by governments, central banks or international agencies; investment speculation; changes in industrial and commercial demand; and governmental prohibitions or restrictions on the private ownership of certain precious metals or minerals.
The SA Wellington Multi-Asset Income Portfolio invests internationally, including in “emerging market” countries. Emerging market securities involve risks not typically associated with investing in securities of issuers in more developed markets. The markets of emerging market countries are typically more volatile and potentially less liquid than more developed countries. These securities may be denominated in currencies other than U.S. dollars. While investing internationally may reduce portfolio risk by increasing the diversification of portfolio investments, the value of the investment may be affected by fluctuating currency values, changing local and regional economic, political and social conditions, and greater market volatility.
Each Portfolio may invest in obligations issued by agencies and instrumentalities of the U.S. Government that may vary in the level of support they receive from the government. The government may choose not to provide financial support to government sponsored agencies or instrumentalities if it is not legally obligated to do so, and if the issuer defaults, a fund holding securities of such issuer might not be able to recover its investment from the U.S. Government. As a result of the SA Wellington Government and Quality Bond Portfolio and SA Edge Asset Allocation Portfolio concentration in such investments, these portfolios may be subject to risks associated with U.S. Government agencies or instrumentalities.
Note 11. Security Transactions with Affiliated Portfolios
The Portfolios are permitted to transfer securities by purchasing from and/or selling to other affiliated funds under certain conditions approved by the Board. The affiliated funds involved in such transactions must have a common investment adviser or investment advisers which are affiliated persons of each other, common Trustees, and/or common officers in compliance with Rule 17a-7 of the 1940 Act. Pursuant to the Act, such a transaction must be either a purchase or a sales, for no consideration other than cash payment against prompt delivery of the security at the current market price. No brokerage commission or fee (except for the customary transfer fees), or other remuneration is paid in connection with such transaction. For the year ended December 31, 2017, the following Portfolios engaged in security transactions with affiliated Portfolios:
Portfolio | Cost of Purchases | Proceeds from Sales | Realized Gain/(Loss) | |||||||||
SA Wellington Growth | $ | 1,888,156 | $ | — | $ | — | ||||||
SA Wellington Capital Appreciation | 144,884 | — | — | |||||||||
SA Wellington Natural Resources | — | 201,595 | 50,651 | |||||||||
SA Wellington Multi-Asset Income | 23,701 | — | — | |||||||||
| ||
| 89 |
Table of Contents
ANCHOR SERIES TRUST
| Period ended | Net Asset Value beginning of period | Net investment income (loss)(1) | Net realized & unrealized gain (loss) on investments | Total from investment operations | Dividends declared from net investment income | Distributions from net realized gain on investments | Total dividends and distributions | Net Asset Value end of period | Total Return(2) | Net Assets end of period (000’s) | Ratio of expenses to average net assets | Ratio of net investment income (loss) to average net assets | Portfolio turnover rate | |||||||||||||||||||||||||||||||||||||||
| SA Wellington Government and Quality Bond Portfolio Class 1# | ||||||||||||||||||||||||||||||||||||||||||||||||||||
| 12/31/13 | $ | 15.58 | $ | 0.21 | $ | (0.55 | ) | $ | (0.34 | ) | $ | (0.38 | ) | $ | (0.15 | ) | $ | (0.53 | ) | $ | 14.71 | (2.15 | )% | $ | 421,167 | 0.59 | % | 1.40 | % | 184 | % | |||||||||||||||||||||
| 12/31/14 | 14.71 | 0.21 | 0.55 | 0.76 | (0.29 | ) | — | (0.29 | ) | 15.18 | 5.19 | 572,823 | 0.58 | 1.40 | 128 | |||||||||||||||||||||||||||||||||||||
| 12/31/15 | 15.18 | 0.21 | (0.13 | ) | 0.08 | (0.23 | ) | (0.05 | ) | (0.28 | ) | 14.98 | 0.58 | 657,562 | 0.57 | 1.39 | 62 | |||||||||||||||||||||||||||||||||||
| 12/31/16 | 14.98 | 0.24 | (0.02 | ) | 0.22 | (0.22 | ) | (0.10 | ) | (0.32 | ) | 14.88 | 1.42 | 817,141 | 0.57 | 1.59 | 61 | |||||||||||||||||||||||||||||||||||
| 12/31/17 | 14.88 | 0.28 | 0.16 | 0.44 | (0.28 | ) | — | (0.28 | ) | 15.04 | 2.97 | 801,507 | 0.58 | 1.86 | 33 | |||||||||||||||||||||||||||||||||||||
| SA Wellington Government and Quality Bond Portfolio Class 2# | ||||||||||||||||||||||||||||||||||||||||||||||||||||
| 12/31/13 | 15.57 | 0.19 | (0.54 | ) | (0.35 | ) | (0.35 | ) | (0.15 | ) | (0.50 | ) | 14.72 | (2.22 | ) | 49,484 | 0.74 | 1.26 | 184 | |||||||||||||||||||||||||||||||||
| 12/31/14 | 14.72 | 0.19 | 0.54 | 0.73 | (0.26 | ) | — | (0.26 | ) | 15.19 | 4.99 | 43,986 | 0.73 | 1.25 | 128 | |||||||||||||||||||||||||||||||||||||
| 12/31/15 | 15.19 | 0.19 | (0.14 | ) | 0.05 | (0.20 | ) | (0.05 | ) | (0.25 | ) | 14.99 | 0.39 | 36,223 | 0.72 | 1.25 | 62 | |||||||||||||||||||||||||||||||||||
| 12/31/16 | 14.99 | 0.22 | (0.02 | ) | 0.20 | (0.19 | ) | (0.10 | ) | (0.29 | ) | 14.90 | 1.31 | 30,780 | 0.72 | 1.45 | 61 | |||||||||||||||||||||||||||||||||||
| 12/31/17 | 14.90 | 0.26 | 0.16 | 0.42 | (0.25 | ) | — | (0.25 | ) | 15.07 | 2.85 | 27,824 | 0.72 | 1.72 | 33 | |||||||||||||||||||||||||||||||||||||
| SA Wellington Government and Quality Bond Portfolio Class 3# | ||||||||||||||||||||||||||||||||||||||||||||||||||||
| 12/31/13 | 15.52 | 0.17 | (0.53 | ) | (0.36 | ) | (0.34 | ) | (0.15 | ) | (0.49 | ) | 14.67 | (2.28 | ) | 806,854 | 0.84 | 1.16 | 184 | |||||||||||||||||||||||||||||||||
| 12/31/14 | 14.67 | 0.17 | 0.54 | 0.71 | (0.25 | ) | — | (0.25 | ) | 15.13 | 4.87 | 783,305 | 0.83 | 1.15 | 128 | |||||||||||||||||||||||||||||||||||||
| 12/31/15 | 15.13 | 0.17 | (0.13 | ) | 0.04 | (0.19 | ) | (0.05 | ) | (0.24 | ) | 14.93 | 0.32 | 739,821 | 0.82 | 1.14 | 62 | |||||||||||||||||||||||||||||||||||
| 12/31/16 | 14.93 | 0.21 | (0.03 | ) | 0.18 | (0.18 | ) | (0.10 | ) | (0.28 | ) | 14.83 | 1.18 | 762,516 | 0.82 | 1.35 | 61 | |||||||||||||||||||||||||||||||||||
| 12/31/17 | 14.83 | 0.24 | 0.17 | 0.41 | (0.24 | ) | — | (0.24 | ) | 15.00 | 2.78 | 751,516 | 0.82 | 1.62 | 33 | |||||||||||||||||||||||||||||||||||||
| # | See Note 1 |
| (1) | Calculated based upon average shares outstanding. |
| (2) | Total return does not reflect expenses that apply to the separate accounts of the Life Companies. If such expenses had been included, the total return would have been lower for each period presented. |
See Notes to Financial Statements
| ||
| 90 |
Table of Contents
ANCHOR SERIES TRUST
FINANCIAL HIGHLIGHTS — (continued)
| Period ended | Net Asset Value beginning of period | Net investment income (loss)(1) | Net realized & unrealized gain (loss) on investments | Total from investment operations | Dividends declared from net investment income | Distributions from net realized gain on investments | Total dividends and distributions | Net Asset Value end of period | Total Return(2) | Net Assets end of period (000’s) | Ratio of expenses to average net assets(3) | Ratio of net investment income (loss) to average net assets(3) | Portfolio turnover rate | |||||||||||||||||||||||||||||||||||||||
| SA Edge Asset Allocation Portfolio Class 1# | ||||||||||||||||||||||||||||||||||||||||||||||||||||
| 12/31/13 | $ | 14.15 | $ | 0.35 | $ | 2.15 | $ | 2.50 | $ | (0.44 | ) | $ | — | $ | (0.44 | ) | $ | 16.21 | 17.87 | % | $ | 159,638 | 0.79 | % | 2.29 | % | 27 | % | ||||||||||||||||||||||||
| 12/31/14 | 16.21 | 0.40 | 0.80 | 1.20 | (0.41 | ) | (0.46 | ) | (0.87 | ) | 16.54 | 7.41 | 146,594 | 0.75 | 2.37 | 29 | ||||||||||||||||||||||||||||||||||||
| 12/31/15 | 16.54 | 0.36 | (0.66 | ) | (0.30 | ) | (0.49 | ) | (1.71 | ) | (2.20 | ) | 14.04 | (1.72 | ) | 125,264 | 0.75 | 2.24 | 27 | |||||||||||||||||||||||||||||||||
| 12/31/16 | 14.04 | 0.34 | 1.13 | 1.47 | (0.42 | ) | (1.05 | ) | (1.47 | ) | 14.04 | 10.82 | 119,255 | 0.75 | 2.40 | 45 | ||||||||||||||||||||||||||||||||||||
| 12/31/17 | 14.04 | 0.31 | 1.57 | 1.88 | (0.41 | ) | (1.24 | ) | (1.65 | ) | 14.27 | 13.73 | 117,879 | 0.76 | 2.09 | 37 | ||||||||||||||||||||||||||||||||||||
| SA Edge Asset Allocation Portfolio Class 2# | ||||||||||||||||||||||||||||||||||||||||||||||||||||
| 12/31/13 | 14.12 | 0.33 | 2.14 | 2.47 | (0.41 | ) | — | (0.41 | ) | 16.18 | 17.68 | 18,074 | 0.94 | 2.14 | 27 | |||||||||||||||||||||||||||||||||||||
| 12/31/14 | 16.18 | 0.37 | 0.81 | 1.18 | (0.38 | ) | (0.46 | ) | (0.84 | ) | 16.52 | 7.31 | 15,750 | 0.90 | 2.22 | 29 | ||||||||||||||||||||||||||||||||||||
| 12/31/15 | 16.52 | 0.33 | (0.64 | ) | (0.31 | ) | (0.47 | ) | (1.71 | ) | (2.18 | ) | 14.03 | (1.83 | ) | 13,832 | 0.90 | 2.09 | 27 | |||||||||||||||||||||||||||||||||
| 12/31/16 | 14.03 | 0.32 | 1.12 | 1.44 | (0.40 | ) | (1.05 | ) | (1.45 | ) | 14.02 | 10.57 | 14,603 | 0.91 | 2.25 | 45 | ||||||||||||||||||||||||||||||||||||
| 12/31/17 | 14.02 | 0.28 | 1.58 | 1.86 | (0.39 | ) | (1.24 | ) | (1.63 | ) | 14.25 | 13.59 | 14,758 | 0.91 | 1.95 | 37 | ||||||||||||||||||||||||||||||||||||
| SA Edge Asset Allocation Portfolio Class 3# | ||||||||||||||||||||||||||||||||||||||||||||||||||||
| 12/31/13 | 14.08 | 0.31 | 2.13 | 2.44 | (0.40 | ) | — | (0.40 | ) | 16.12 | 17.52 | 54,684 | 1.04 | 2.04 | 27 | |||||||||||||||||||||||||||||||||||||
| 12/31/14 | 16.12 | 0.35 | 0.81 | 1.16 | (0.37 | ) | (0.46 | ) | (0.83 | ) | 16.45 | 7.23 | 56,298 | 1.00 | 2.12 | 29 | ||||||||||||||||||||||||||||||||||||
| 12/31/15 | 16.45 | 0.32 | (0.66 | ) | (0.34 | ) | (0.45 | ) | (1.71 | ) | (2.16 | ) | 13.95 | (1.99 | ) | 53,784 | 1.00 | 2.00 | 27 | |||||||||||||||||||||||||||||||||
| 12/31/16 | 13.95 | 0.30 | 1.13 | 1.43 | (0.39 | ) | (1.05 | ) | (1.44 | ) | 13.94 | 10.53 | 57,917 | 1.00 | 2.15 | 45 | ||||||||||||||||||||||||||||||||||||
| 12/31/17 | 13.94 | 0.27 | 1.55 | 1.82 | (0.37 | ) | (1.24 | ) | (1.61 | ) | 14.15 | 13.43 | 64,824 | 1.01 | 1.85 | 37 | ||||||||||||||||||||||||||||||||||||
| SA Wellington Growth and Income Portfolio Class 1# | ||||||||||||||||||||||||||||||||||||||||||||||||||||
| 12/31/13 | 8.57 | 0.10 | 2.68 | 2.78 | (0.03 | ) | — | (0.03 | ) | 11.32 | 32.43 | 105,446 | 0.86 | 1.03 | 109 | |||||||||||||||||||||||||||||||||||||
| 12/31/14 | 11.32 | 0.08 | 1.43 | 1.51 | (0.06 | ) | (0.29 | ) | (0.35 | ) | 12.48 | 13.45 | 171,935 | 0.77 | 0.68 | 64 | ||||||||||||||||||||||||||||||||||||
| 12/31/15 | 12.48 | 0.10 | 0.49 | 0.59 | (0.06 | ) | (0.53 | ) | (0.59 | ) | 12.48 | 4.90 | 201,182 | 0.74 | 0.78 | 43 | ||||||||||||||||||||||||||||||||||||
| 12/31/16 | 12.48 | 0.09 | 0.76 | 0.85 | (0.10 | ) | (0.58 | ) | (0.68 | ) | 12.65 | 7.09 | 195,301 | 0.74 | 0.76 | 39 | ||||||||||||||||||||||||||||||||||||
| 12/31/17 | 12.65 | 0.11 | 2.87 | 2.98 | (0.11 | ) | (0.43 | ) | (0.54 | ) | 15.09 | 23.91 | 202,089 | 0.75 | 0.82 | 31 | ||||||||||||||||||||||||||||||||||||
| # | See Note 1 |
| (1) | Calculated based upon average shares outstanding. |
| (2) | Total return does not reflect expenses that apply to the separate accounts of the Life Companies. If such expenses had been included, the total return would have been lower for each period presented. Total return includes expense reductions. |
| (3) | Excludes expense reductions. If these expense reductions had been applied, the ratio of expenses to average net assets would have been lower and the ratio of net investment income (loss) to average net assets would have been higher by the following (See Note 4): |
Portfolio | 12/31/13 | 12/31/14 | 12/31/15 | 12/31/16 | 12/31/17 | |||||||||||||||
SA Edge Asset Allocation Class 1 | 0.00 | % | 0.00 | % | 0.00 | % | 0.00 | % | 0.00 | % | ||||||||||
SA Edge Asset Allocation Class 2 | 0.00 | 0.00 | 0.00 | 0.00 | 0.00 | |||||||||||||||
SA Edge Asset Allocation Class 3 | 0.00 | 0.00 | 0.00 | 0.00 | 0.00 | |||||||||||||||
SA Wellington Growth and Income Class 1 | 0.00 | 0.00 | 0.00 | 0.00 | 0.00 | |||||||||||||||
See Notes to Financial Statements
| ||
| 91 |
Table of Contents
ANCHOR SERIES TRUST
FINANCIAL HIGHLIGHTS — (continued)
| Period ended | Net Asset Value beginning of period | Net investment income (loss)(1) | Net realized & unrealized gain (loss) on investments | Total from investment operations | Dividends declared from net investment income | Distributions from net realized gain on investments | Total dividends and distributions | Net Asset Value end of period | Total Return(2) | Net Assets end of period (000’s) | Ratio of expenses to average net assets(3) | Ratio of net investment income (loss) to average net assets(3) | Portfolio turnover rate | |||||||||||||||||||||||||||||||||||||||
| SA Wellington Growth Portfolio Class 1# | ||||||||||||||||||||||||||||||||||||||||||||||||||||
| 12/31/13 | $ | 21.88 | $ | 0.19 | $ | 7.48 | $ | 7.67 | $ | (0.21 | ) | $ | — | $ | (0.21 | ) | $ | 29.34 | 35.14 | % | $ | 403,439 | 0.77 | % | 0.74 | % | 78 | % | ||||||||||||||||||||||||
| 12/31/14 | 29.34 | 0.20 | 1.99 | 2.19 | (0.17 | ) | — | (0.17 | ) | 31.36 | 7.48 | 505,595 | 0.74 | 0.68 | 118 | |||||||||||||||||||||||||||||||||||||
| 12/31/15 | 31.36 | 0.22 | (0.27 | ) | (0.05 | ) | (0.20 | ) | (4.48 | ) | (4.68 | ) | 26.63 | 0.15 | 521,905 | 0.73 | 0.71 | 73 | ||||||||||||||||||||||||||||||||||
| 12/31/16 | 26.63 | 0.22 | 1.62 | 1.84 | (0.28 | ) | (1.92 | ) | (2.20 | ) | 26.27 | 7.37 | 343,850 | 0.75 | 0.83 | 98 | ||||||||||||||||||||||||||||||||||||
| 12/31/17 | 26.27 | 0.26 | 4.93 | 5.19 | (0.35 | ) | — | (0.35 | ) | 31.11 | 19.80 | 281,486 | 0.77 | 0.89 | 54 | |||||||||||||||||||||||||||||||||||||
| SA Wellington Growth Portfolio Class 2# | ||||||||||||||||||||||||||||||||||||||||||||||||||||
| 12/31/13 | 21.88 | 0.15 | 7.48 | 7.63 | (0.16 | ) | — | (0.16 | ) | 29.35 | 34.97 | 27,163 | 0.92 | 0.60 | 78 | |||||||||||||||||||||||||||||||||||||
| 12/31/14 | 29.35 | 0.16 | 1.97 | 2.13 | (0.12 | ) | — | (0.12 | ) | 31.36 | 7.28 | 24,700 | 0.89 | 0.54 | 118 | |||||||||||||||||||||||||||||||||||||
| 12/31/15 | 31.36 | 0.17 | (0.26 | ) | (0.09 | ) | (0.14 | ) | (4.48 | ) | (4.62 | ) | 26.65 | 0.02 | 20,202 | 0.88 | 0.56 | 73 | ||||||||||||||||||||||||||||||||||
| 12/31/16 | 26.65 | 0.18 | 1.63 | 1.81 | (0.23 | ) | (1.92 | ) | (2.15 | ) | 26.31 | 7.24 | 18,398 | 0.90 | 0.68 | 98 | ||||||||||||||||||||||||||||||||||||
| 12/31/17 | 26.31 | 0.22 | 4.92 | 5.14 | (0.30 | ) | — | (0.30 | ) | 31.15 | 19.59 | 18,005 | 0.92 | 0.75 | 54 | |||||||||||||||||||||||||||||||||||||
| SA Wellington Growth Portfolio Class 3# | ||||||||||||||||||||||||||||||||||||||||||||||||||||
| 12/31/13 | 21.84 | 0.13 | 7.46 | 7.59 | (0.14 | ) | — | (0.14 | ) | 29.29 | 34.82 | 126,179 | 1.02 | 0.50 | 78 | |||||||||||||||||||||||||||||||||||||
| 12/31/14 | 29.29 | 0.13 | 1.97 | 2.10 | (0.09 | ) | — | (0.09 | ) | 31.30 | 7.18 | 115,933 | 0.99 | 0.44 | 118 | |||||||||||||||||||||||||||||||||||||
| 12/31/15 | 31.30 | 0.14 | (0.26 | ) | (0.12 | ) | (0.11 | ) | (4.48 | ) | (4.59 | ) | 26.59 | (0.09 | ) | 101,481 | 0.98 | 0.46 | 73 | |||||||||||||||||||||||||||||||||
| 12/31/16 | 26.59 | 0.15 | 1.63 | 1.78 | (0.21 | ) | (1.92 | ) | (2.13 | ) | 26.24 | 7.11 | 95,910 | 1.00 | 0.58 | 98 | ||||||||||||||||||||||||||||||||||||
| 12/31/17 | 26.24 | 0.19 | 4.91 | 5.10 | (0.27 | ) | — | (0.27 | ) | 31.07 | 19.50 | 99,866 | 1.02 | 0.65 | 54 | |||||||||||||||||||||||||||||||||||||
| SA Wellington Capital Appreciation Portfolio Class 1# | ||||||||||||||||||||||||||||||||||||||||||||||||||||
| 12/31/13 | 40.58 | (0.10 | ) | 14.19 | 14.09 | — | (5.43 | ) | (5.43 | ) | 49.24 | 35.80 | 605,894 | 0.75 | (0.22 | ) | 105 | |||||||||||||||||||||||||||||||||||
| 12/31/14 | 49.24 | (0.06 | ) | 7.41 | 7.35 | — | (9.21 | ) | (9.21 | ) | 47.38 | 15.26 | 668,565 | 0.74 | (0.12 | ) | 91 | |||||||||||||||||||||||||||||||||||
| 12/31/15 | 47.38 | (0.05 | ) | 3.84 | 3.79 | — | (8.36 | ) | (8.36 | ) | 42.81 | 8.72 | (4) | 730,504 | 0.74 | (0.11 | ) | 66 | ||||||||||||||||||||||||||||||||||
| 12/31/16 | 42.81 | (0.09 | ) | 0.93 | 0.84 | — | (5.50 | ) | (5.50 | ) | 38.15 | 1.98 | 589,734 | 0.74 | (0.23 | ) | 99 | |||||||||||||||||||||||||||||||||||
| 12/31/17 | 38.15 | 0.02 | 12.31 | 12.33 | — | (3.72 | ) | (3.72 | ) | 46.76 | 32.78 | 656,955 | 0.74 | 0.05 | 77 | |||||||||||||||||||||||||||||||||||||
| SA Wellington Capital Appreciation Portfolio Class 2# | ||||||||||||||||||||||||||||||||||||||||||||||||||||
| 12/31/13 | 39.96 | (0.17 | ) | 13.97 | 13.80 | — | (5.43 | ) | (5.43 | ) | 48.33 | 35.62 | 59,470 | 0.90 | (0.37 | ) | 105 | |||||||||||||||||||||||||||||||||||
| 12/31/14 | 48.33 | (0.13 | ) | 7.26 | 7.13 | — | (9.21 | ) | (9.21 | ) | 46.25 | 15.08 | 56,610 | 0.89 | (0.27 | ) | 91 | |||||||||||||||||||||||||||||||||||
| 12/31/15 | 46.25 | (0.12 | ) | 3.74 | 3.62 | — | (8.36 | ) | (8.36 | ) | 41.51 | 8.56 | (4) | 51,769 | 0.89 | (0.26 | ) | 66 | ||||||||||||||||||||||||||||||||||
| 12/31/16 | 41.51 | (0.15 | ) | 0.91 | 0.76 | — | (5.50 | ) | (5.50 | ) | 36.77 | 1.85 | 45,012 | 0.89 | (0.38 | ) | 99 | |||||||||||||||||||||||||||||||||||
| 12/31/17 | 36.77 | (0.05 | ) | 11.85 | 11.80 | — | (3.72 | ) | (3.72 | ) | 44.85 | 32.57 | 50,028 | 0.89 | (0.11 | ) | 77 | |||||||||||||||||||||||||||||||||||
| SA Wellington Capital Appreciation Portfolio Class 3# | ||||||||||||||||||||||||||||||||||||||||||||||||||||
| 12/31/13 | 39.57 | (0.21 | ) | 13.81 | 13.60 | — | (5.43 | ) | (5.43 | ) | 47.74 | 35.46 | 625,388 | 1.00 | (0.47 | ) | 105 | |||||||||||||||||||||||||||||||||||
| 12/31/14 | 47.74 | (0.18 | ) | 7.17 | 6.99 | — | (9.21 | ) | (9.21 | ) | 45.52 | 14.96 | 635,020 | 0.99 | (0.37 | ) | 91 | |||||||||||||||||||||||||||||||||||
| 12/31/15 | 45.52 | (0.16 | ) | 3.67 | 3.51 | — | (8.36 | ) | (8.36 | ) | 40.67 | 8.45 | (4) | 614,697 | 0.99 | (0.36 | ) | 66 | ||||||||||||||||||||||||||||||||||
| 12/31/16 | 40.67 | (0.18 | ) | 0.88 | 0.70 | — | (5.50 | ) | (5.50 | ) | 35.87 | 1.73 | 580,733 | 0.99 | (0.49 | ) | 99 | |||||||||||||||||||||||||||||||||||
| 12/31/17 | 35.87 | (0.09 | ) | 11.56 | 11.47 | — | (3.72 | ) | (3.72 | ) | 43.62 | 32.46 | 643,066 | 0.99 | (0.21 | ) | 77 | |||||||||||||||||||||||||||||||||||
| # | See Note 1 |
| (1) | Calculated based upon average shares outstanding. |
| (2) | Total return does not reflect expenses that apply to the separate accounts of the Life Companies. If such expenses had been included, the total return would have been lower for each period presented. Total return includes expense reductions. |
| (3) | Excludes expense reductions. If these expense reductions had been applied, the ratio of expenses to average net assets would have been lower and the ratio of net investment income (loss) to average net assets would have been higher by the following (See Note 4): |
Portfolio | 12/31/13 | 12/31/14 | 12/31/15 | 12/31/16 | 12/31/17 | |||||||||||||||
SA Wellington Growth Class 1 | 0.00 | % | 0.00 | % | 0.00 | % | 0.00 | % | 0.00 | % | ||||||||||
SA Wellington Growth Class 2 | 0.00 | 0.00 | 0.00 | 0.00 | 0.00 | |||||||||||||||
SA Wellington Growth Class 3 | 0.00 | 0.00 | 0.00 | 0.00 | 0.00 | |||||||||||||||
SA Wellington Capital Appreciation Class 1 | 0.00 | 0.00 | 0.00 | 0.00 | 0.00 | |||||||||||||||
SA Wellington Capital Appreciation Class 2 | 0.00 | 0.00 | 0.00 | 0.00 | 0.00 | |||||||||||||||
SA Wellington Capital Appreciation Class 3 | 0.00 | 0.00 | 0.00 | 0.00 | 0.00 | |||||||||||||||
| (4) | The Portfolio’s performance was increased by 0.07% for Class 1, Class 2 and Class 3, from a reimbursement by an affiliate. |
See Notes to Financial Statements
| ||
| 92 |
Table of Contents
ANCHOR SERIES TRUST
FINANCIAL HIGHLIGHTS — (continued)
| Period ended | Net Asset Value beginning of period | Net investment income (loss)(1) | Net realized & unrealized gain (loss) on investments | Total from investment operations | Dividends declared from net investment income | Distributions from net realized gain on investments | Total dividends and distributions | Net Asset Value end of period | Total Return(2) | Net Assets end of period (000’s) | Ratio of expenses to average net assets(3) | Ratio of net investment income (loss) to average net assets(3) | Portfolio turnover rate | |||||||||||||||||||||||||||||||||||||||
| SA Wellington Natural Resources Portfolio Class 1# | ||||||||||||||||||||||||||||||||||||||||||||||||||||
| 12/31/13 | $ | 22.61 | $ | 0.18 | $ | 1.12 | $ | 1.30 | $ | (0.22 | ) | $ | — | $ | (0.22 | ) | $ | 23.69 | 5.80 | % | $ | 100,572 | 0.84 | % | 0.80 | % | 77 | % | ||||||||||||||||||||||||
| 12/31/14 | 23.69 | 0.30 | (4.63 | ) | (4.33 | ) | (0.26 | ) | — | (0.26 | ) | 19.10 | (18.53 | ) | 95,751 | 0.82 | 1.28 | 91 | ||||||||||||||||||||||||||||||||||
| 12/31/15 | 19.10 | 0.47 | (4.55 | ) | (4.08 | ) | (0.27 | ) | — | (0.27 | ) | 14.75 | (21.39 | ) | 72,803 | 0.83 | 2.65 | 94 | ||||||||||||||||||||||||||||||||||
| 12/31/16 | 14.75 | 0.31 | 4.00 | 4.31 | (0.74 | ) | — | (0.74 | ) | 18.32 | 29.97 | 30,793 | 0.84 | 1.90 | 119 | |||||||||||||||||||||||||||||||||||||
| 12/31/17 | 18.32 | 0.27 | 2.44 | 2.71 | (0.49 | ) | — | (0.49 | ) | 20.54 | 15.03 | 30,580 | 0.87 | 1.42 | 134 | |||||||||||||||||||||||||||||||||||||
| SA Wellington Natural Resources Portfolio Class 2# | ||||||||||||||||||||||||||||||||||||||||||||||||||||
| 12/31/13 | 22.53 | 0.15 | 1.11 | 1.26 | (0.18 | ) | — | (0.18 | ) | 23.61 | 5.64 | 13,767 | 0.99 | 0.66 | 77 | |||||||||||||||||||||||||||||||||||||
| 12/31/14 | 23.61 | 0.27 | (4.63 | ) | (4.36 | ) | (0.22 | ) | — | (0.22 | ) | 19.03 | (18.68 | ) | 10,238 | 0.97 | 1.15 | 91 | ||||||||||||||||||||||||||||||||||
| 12/31/15 | 19.03 | 0.45 | (4.53 | ) | (4.08 | ) | (0.23 | ) | — | (0.23 | ) | 14.72 | (21.47 | ) | 6,477 | 0.98 | 2.52 | 94 | ||||||||||||||||||||||||||||||||||
| 12/31/16 | 14.72 | 0.24 | 4.02 | 4.26 | (0.70 | ) | — | (0.70 | ) | 18.28 | 29.70 | 6,987 | 1.00 | 1.44 | 119 | |||||||||||||||||||||||||||||||||||||
| 12/31/17 | 18.28 | 0.24 | 2.45 | 2.69 | (0.46 | ) | — | (0.46 | ) | 20.51 | 14.94 | 6,807 | 1.02 | 1.27 | 134 | |||||||||||||||||||||||||||||||||||||
| SA Wellington Natural Resources Portfolio Class 3# | ||||||||||||||||||||||||||||||||||||||||||||||||||||
| 12/31/13 | 22.41 | 0.13 | 1.11 | 1.24 | (0.16 | ) | — | (0.16 | ) | 23.49 | 5.56 | 120,528 | 1.09 | 0.56 | 77 | |||||||||||||||||||||||||||||||||||||
| 12/31/14 | 23.49 | 0.24 | (4.60 | ) | (4.36 | ) | (0.19 | ) | — | (0.19 | ) | 18.94 | (18.74 | ) | 98,333 | 1.07 | 1.04 | 91 | ||||||||||||||||||||||||||||||||||
| 12/31/15 | 18.94 | 0.41 | (4.50 | ) | (4.09 | ) | (0.21 | ) | — | (0.21 | ) | 14.64 | (21.61 | ) | 75,093 | 1.08 | 2.38 | 94 | ||||||||||||||||||||||||||||||||||
| 12/31/16 | 14.64 | 0.22 | 4.02 | 4.24 | (0.69 | ) | — | (0.69 | ) | 18.19 | 29.67 | 78,831 | 1.10 | 1.35 | 119 | |||||||||||||||||||||||||||||||||||||
| 12/31/17 | 18.19 | 0.22 | 2.44 | 2.66 | (0.45 | ) | — | (0.45 | ) | 20.40 | 14.79 | 75,538 | 1.12 | 1.18 | 134 | |||||||||||||||||||||||||||||||||||||
| # | See Note 1 |
| (1) | Calculated based upon average shares outstanding. |
| (2) | Total return does not reflect expenses that apply to the separate accounts of the Life Companies. If such expenses had been included, the total return would have been lower for each period presented. Total return includes expense reductions. |
| (3) | Excludes expense reductions. If these expense reductions had been applied, the ratio of expenses to average net assets would have been lower and the ratio of net investment income (loss) to average net assets would have been higher by the following (See Note 4): |
Portfolio | 12/31/13 | 12/31/14 | 12/31/15 | 12/31/16 | 12/31/17 | |||||||||||||||
SA Wellington Natural Resources Class 1 | 0.00 | % | 0.00 | % | 0.00 | % | 0.00 | % | 0.00 | % | ||||||||||
SA Wellington Natural Resources Class 2 | 0.00 | 0.00 | 0.00 | 0.00 | 0.00 | |||||||||||||||
SA Wellington Natural Resources Class 3 | 0.00 | 0.00 | 0.00 | 0.00 | 0.00 | |||||||||||||||
See Notes to Financial Statements
| ||
| 93 |
Table of Contents
ANCHOR SERIES TRUST
FINANCIAL HIGHLIGHTS — (continued)
| Period ended | Net Asset Value beginning of period | Net investment income (loss)(1) | Net realized & unrealized gain (loss) on investments | Total from investment operations | Dividends declared from net investment income | Distributions from net realized gain on investments | Total dividends and distributions | Net Asset Value end of period | Total Return(2) | Net Assets end of period (000’s) | Ratio of expenses to average net assets(3) | Ratio of net investment income (loss) to average net assets(3) | Portfolio turnover rate | |||||||||||||||||||||||||||||||||||||||
| SA BlackRock Multi-Asset Income Portfolio Class 1 | ||||||||||||||||||||||||||||||||||||||||||||||||||||
| 12/31/13 | $ | 6.46 | $ | 0.06 | $ | 1.08 | $ | 1.14 | $ | (0.08 | ) | $ | — | $ | (0.08 | ) | $ | 7.52 | 17.67 | % | $ | 22,651 | 1.10 | (5)% | 0.86 | (5)% | 71 | % | ||||||||||||||||||||||||
| 12/31/14 | 7.52 | 0.05 | 0.68 | 0.73 | (0.08 | ) | — | (0.08 | ) | 8.17 | 9.68 | 22,167 | 1.10 | (5) | 0.67 | (5) | 88 | |||||||||||||||||||||||||||||||||||
| 12/31/15 | 8.17 | 0.25 | (0.61 | ) | (0.36 | ) | (0.06 | ) | (1.06 | ) | (1.12 | ) | 6.69 | (4.45 | ) | 18,720 | 0.60 | (5) | 3.27 | (5) | 152 | |||||||||||||||||||||||||||||||
| 12/31/16 | 6.69 | 0.20 | 0.22 | 0.42 | (0.23 | ) | (0.63 | ) | (0.86 | ) | 6.25 | 6.51 | 17,581 | 0.58 | (5) | 3.00 | (5) | 50 | ||||||||||||||||||||||||||||||||||
| 12/31/17 | 6.25 | 0.19 | 0.21 | 0.40 | (0.14 | ) | — | (0.14 | ) | 6.51 | 6.34 | 16,572 | 0.58 | (5) | 2.97 | (5) | 11 | |||||||||||||||||||||||||||||||||||
| SA BlackRock Multi-Asset Income Portfolio Class 3 | ||||||||||||||||||||||||||||||||||||||||||||||||||||
| 12/31/13 | 6.46 | 0.04 | 1.07 | 1.11 | (0.07 | ) | — | (0.07 | ) | 7.50 | 17.30 | 116 | 1.35 | (5) | 0.60 | (5) | 71 | |||||||||||||||||||||||||||||||||||
| 12/31/14 | 7.50 | 0.03 | 0.68 | 0.71 | (0.06 | ) | — | (0.06 | ) | 8.15 | 9.47 | 127 | 1.35 | (5) | 0.42 | (5) | 88 | |||||||||||||||||||||||||||||||||||
| 12/31/15 | 8.15 | 0.24 | (0.62 | ) | (0.38 | ) | (0.05 | ) | (1.06 | ) | (1.11 | ) | 6.66 | (4.76 | ) | 204 | 0.84 | (5) | 3.25 | (5) | 152 | |||||||||||||||||||||||||||||||
| 12/31/16 | 6.66 | 0.19 | 0.21 | 0.40 | (0.23 | ) | (0.63 | ) | (0.86 | ) | 6.20 | 6.20 | 4.691 | 0.83 | (5) | 3.37 | (5) | 50 | ||||||||||||||||||||||||||||||||||
| 12/31/17 | 6.20 | 0.18 | 0.20 | 0.38 | (0.13 | ) | — | (0.13 | ) | 6.45 | 6.20 | 18,136 | 0.83 | (5) | 2.99 | (5) | 11 | |||||||||||||||||||||||||||||||||||
| SA Wellington Multi-Asset Income Portfolio Class 1# | ||||||||||||||||||||||||||||||||||||||||||||||||||||
| 12/31/13 | 8.20 | 0.04 | 1.55 | 1.59 | (0.21 | ) | (0.06 | ) | (0.27 | ) | 9.52 | 19.65 | 22,354 | 1.80 | 0.50 | 99 | ||||||||||||||||||||||||||||||||||||
| 12/31/14 | 9.52 | 0.05 | 0.41 | 0.46 | (0.04 | ) | (1.34 | ) | (1.38 | ) | 8.60 | 5.04 | 21,067 | 1.42 | (5) | 0.54 | (5) | 96 | ||||||||||||||||||||||||||||||||||
| 12/31/15 | 8.60 | 0.06 | 0.03 | 0.09 | (0.27 | ) | (0.83 | ) | (1.10 | ) | 7.59 | 1.13 | 18,887 | 1.20 | (5) | 0.75 | (5) | 82 | ||||||||||||||||||||||||||||||||||
| 12/31/16 | 7.59 | 0.07 | 0.06 | 0.13 | (0.14 | ) | (0.56 | ) | (0.70 | ) | 7.02 | 1.85 | 17,015 | 1.08 | (5)(7) | 0.94 | (5) | 87 | ||||||||||||||||||||||||||||||||||
| 12/31/17 | 7.02 | 0.07 | 1.07 | 1.14 | (0.02 | ) | — | (0.02 | ) | 8.14 | 16.26 | 18,244 | 0.86 | (5) | 0.93 | (5) | 117 | |||||||||||||||||||||||||||||||||||
| SA Wellington Multi-Asset Income Portfolio Class 3# | ||||||||||||||||||||||||||||||||||||||||||||||||||||
| 09/26/16(6) -12/31/16 | 7.09 | (0.01 | ) | (0.07 | ) | (0.08 | ) | — | — | — | 7.01 | (1.13 | )(8) | 471 | 1.11 | (4)(5)(7) | (0.33 | )(4)(5) | 87 | |||||||||||||||||||||||||||||||||
| 12/31/17 | 7.01 | 0.03 | 1.10 | 1.13 | (0.02 | ) | — | (0.02 | ) | 8.12 | 16.08 | 13,231 | 1.11 | (5) | 0.43 | (5) | 117 | |||||||||||||||||||||||||||||||||||
| # | See Note 1 |
| (1) | Calculated based upon average shares outstanding. |
| (2) | Total return does not reflect expenses that apply to the separate accounts of the Life Companies. If such expenses had been included, the total return would have been lower for each period presented. Total return includes expense reimbursements (recoupments) and expense reductions. |
| (3) | Excludes expense reductions. If these expense reductions had been applied, the ratio of expenses to average net assets would have been lower and the ratio of net investment income (loss) to average net assets would have been higher by the following (See Note 4): |
Portfolio | 12/31/13 | 12/31/14 | 12/31/15 | 12/31/16 | 12/31/17 | |||||||||||||||
SA BlackRock Multi-Asset Income Class 1 | 0.00 | % | 0.00 | % | 0.00 | % | — | % | — | % | ||||||||||
SA BlackRock Multi-Asset Income Class 3 | 0.00 | 0.00 | 0.00 | — | — | |||||||||||||||
SA Wellington Multi-Asset Income Class 1 | 0.00 | 0.00 | 0.00 | 0.00 | 0.00 | |||||||||||||||
SA Wellington Multi-Asset Income Class 3 | — | — | — | 0.00 | (4) | 0.00 | ||||||||||||||
| (4) | Annualized |
| (5) | Net of the following expense reimbursements/fee waivers (based on average net assets) (See Note 3): |
Portfolio | 12/31/13 | 12/31/14 | 12/31/15 | 12/31/16 | 12/31/17 | |||||||||||||||
SA BlackRock Multi-Asset Income Class 1 | 0.44 | % | 1.12 | % | 1.03 | % | 0.85 | % | 0.80 | % | ||||||||||
SA BlackRock Multi-Asset Income Class 3 | 0.43 | 1.16 | 1.03 | 0.83 | 0.81 | |||||||||||||||
SA Wellington Multi-Asset Income Class 1 | — | 0.28 | 0.55 | 1.00 | 0.86 | |||||||||||||||
SA Wellington Multi-Asset Income Class 3 | — | — | — | 2.76 | (4) | 0.86 | ||||||||||||||
| (6) | Commencement of operations. |
| (7) | Excludes a one time reimbursement the Portfolio received for custody expenses paid in the prior years. If the reimbursement had been applied the ratio of expenses to average net assets would have been 1.03% and 1.05% for Class 1 and Class 3 respectively. |
| (8) | Total return is not annualized. |
See Notes to Financial Statements
| ||
| 94 |
Table of Contents
REPORT OF INDEPENDENT REGISTERED
PUBLIC ACCOUNTING FIRM
To the Board of Trustees of Anchor Series Trust and Shareholders of the SA Edge Asset Allocation Portfolio, SA Wellington Capital Appreciation Portfolio, SA Wellington Government and Quality Bond Portfolio, SA Wellington Growth and Income Portfolio, SA Wellington Growth Portfolio, SA Wellington Natural Resources Portfolio, SA BlackRock Multi-Asset Income Portfolio and SA Wellington Multi-Asset Income Portfolio
Opinions on the Financial Statements
We have audited the accompanying statements of assets and liabilities, including the portfolios of investments, of SA Edge Asset Allocation Portfolio (formerly Asset Allocation Portfolio), SA Wellington Capital Appreciation Portfolio (formerly Capital Appreciation Portfolio), SA Wellington Government and Quality Bond Portfolio (formerly Government and Quality Bond Portfolio), SA Wellington Growth and Income Portfolio (formerly Growth and Income Portfolio), SA Wellington Growth Portfolio (formerly Growth Portfolio), SA Wellington Natural Resources Portfolio (formerly Natural Resources Portfolio), SA BlackRock Multi-Asset Income Portfolio and SA Wellington Multi-Asset Income Portfolio (formerly Strategic Multi-Asset Portfolio) (constituting Anchor Series Trust, hereafter collectively referred to as the “Trust”) as of December 31, 2017, the related statements of operations for the year ended December 31, 2017, the statements of changes in net assets for each of the two years in the period ended December 31, 2017, including the related notes, and the financial highlights for each of the periods indicated therein (collectively referred to as the “financial statements”). In our opinion, the financial statements present fairly, in all material respects, the financial position of each of the Portfolios as of December 31, 2017, the results of each of their operations for the year then ended, the changes in each of their net assets for each of the two years in the period ended December 31, 2017 and each of the financial highlights for each of the periods indicated therein in conformity with accounting principles generally accepted in the United States of America.
Basis for Opinions
These financial statements are the responsibility of the Portfolios’ management. Our responsibility is to express an opinion on the Portfolios’ financial statements based on our audits. We are a public accounting firm registered with the Public Company Accounting Oversight Board (United States) (“PCAOB”) and are required to be independent with respect to the Portfolios in accordance with the U.S. federal securities laws and the applicable rules and regulations of the Securities and Exchange Commission and the PCAOB.
We conducted our audits of these financial statements in accordance with the standards of the PCAOB. Those standards require that we plan and perform the audit to obtain reasonable assurance about whether the financial statements are free of material misstatement, whether due to error or fraud.
Our audits included performing procedures to assess the risks of material misstatement of the financial statements, whether due to error or fraud, and performing procedures that respond to those risks. Such procedures included examining, on a test basis, evidence regarding the amounts and disclosures in the financial statements. Our audits also included evaluating the accounting principles used and significant estimates made by management, as well as evaluating the overall presentation of the financial statements. Our procedures included confirmation of securities owned as of December 31, 2017 by correspondence with the custodian and brokers; when replies were not received from brokers, we performed other auditing procedures. We believe that our audits provide a reasonable basis for our opinions.
/s/ PricewaterhouseCoopers LLP
Houston, Texas
February 27, 2018
We have served as the auditor of one or more investment companies in the SunAmerica annuity family of funds (consisting of SunAmerica Series Trust, Seasons Series Trust and Anchor Series Trust) since at least 1986.
| ||
| 95 |
Table of Contents
ANCHOR SERIES TRUST
TRUSTEES AND OFFICERS INFORMATION (unaudited)
The following table contains basic information regarding the Trustees and Officers who oversee operations of the Portfolios and other investment companies within the Fund Complex. Unless otherwise noted, the address of each Trustee and executive officer is Harborside 5, 185 Hudson Street, Suite 3300, Jersey City, NJ 07311.
Name, Address and Age* | Position Held | Term of Office | Principal Occupations | Number of Portfolios in Fund Complex Overseen by Trustee(2) | Other Directorships | |||||||
Disinterested Trustees | ||||||||||||
Dr. Judith L. Craven Age: 72 | Trustee | 2011-present | Retired. | 77 | Director, Sysco Corp. (1996 to 2017); Director, Luby’s, Inc. (1998 to present). | |||||||
William F. Devin Age: 79 | Trustee | 2011-present | Retired. | 77 | None | |||||||
| Richard W. Grant Age: 72 | Trustee, Chairman of the Board | 2011-present | Retired. | 28 | None | |||||||
| Stephen J. Gutman Age: 74 | Trustee | 1985-present | Senior Vice President and Associate Broker, Corcoran Group. (real estate) (2002 to present); President, SJG Marketing, Inc. (2009 to present). | 28 | None | |||||||
Interested Trustee | ||||||||||||
| Peter A. Harbeck(4) Age: 63 | Trustee | 1995-present | President, SunAmerica (1995 to present) CEO and Director, SunAmerica (1992 to present); Director, AIG Capital Services, Inc. (“ACS”), (1993 to present); Chairman, Advisor Group, Inc. (2004 to 2016). | 152 | None | |||||||
Officers | ||||||||||||
| John T. Genoy Age: 49 | President | 2007-present | Chief Financial Officer, SunAmerica (2002 to present); Senior Vice President, SunAmerica (2003 to present); Chief Operating Officer, SunAmerica (2006 to present). | N/A | N/A | |||||||
| Gregory N. Bressler Age: 51 | Secretary | 2005-present | Senior Vice President and General Counsel, SunAmerica (2005 to present). | N/A | N/A | |||||||
| Kathleen D. Fuentes Age: 48 | Chief Legal Officer and Assistant Secretary | 2013-present | Vice President and Deputy General Counsel, SunAmerica (2006 to present). | N/A | N/A | |||||||
| James Nichols Age: 51 | Vice President | 2006-present | Director, President and CEO, ACS (2006 to present); Senior Vice President, SunAmerica (2002 to present). | N/A | N/A | |||||||
Kara Murphy Age: 45 | Vice President | 2014-present | Director of Research , SunAmerica (2007-2013); Chief Investment Officer, SunAmerica (2013 to present). | N/A | N/A | |||||||
Gregory R. Kingston Age: 51 Address: 2919 Allen Parkway Houston, Texas 77019 | Treasurer | 2014-present | Vice President, SunAmerica (2001 to present); Head of Mutual Fund Administration, SunAmerica (2014 to present). | N/A | N/A | |||||||
| ||
| 96 |
Table of Contents
ANCHOR SERIES TRUST
TRUSTEES AND OFFICERS INFORMATION (unaudited) — (continued)
Name, Address and Age* | Position Held | Term of Office | Principal Occupations | Number of Portfolios in Fund Complex Overseen by Trustee(2) | Other Directorships | |||||||
Shawn Parry Age: 45 Address: 2919 Allen Parkway Houston, Texas 77019 | Vice President and Assistant Treasurer | 2005-present | Vice President (2014 to present) and Assistant Vice President, SunAmerica (2005 to 2014). | N/A | N/A | |||||||
| Donna McManus Age: 56 | Vice President and Assistant Treasurer | 2014-present | Vice President, SunAmerica (2014 to present); Managing Director, BNY Mellon (2009 to 2014). | N/A | N/A | |||||||
Christopher C. Joe Address: 2919 Allen Parkway Houston, Texas 77019 | Chief Compliance Officer | 2017-present | Chief Compliance Officer, AIG Funds, Anchor Series Trust, Seasons Series Trust, SunAmerica Series Trust, VALIC Company I and VALIC Company II (2017 to Present); Chief Compliance Officer, VALIC Retirement Services Company (2017 to Present); Chief Compliance Officer, The Variable Annuity Life Insurance Company (2017 to present); Chief Compliance Officer, Invesco PowerShares (2012 to 2017); Chief Compliance Officer, Invesco Investment Advisers, LLC (2010 to 2013); U.S. Compliance Director, Invesco Ltd. (2006 to 2014); Deputy Chief Compliance Officer, Invesco Advisers, LLC (2014 to 2015). | N/A | N/A | |||||||
| Matthew J. Hackethal Age: 46 | Anti-Money Laundering Compliance Officer | 2006-present | Acting Chief Compliance Officer, AIG Funds, Anchor Series Trust, Seasons Series Trust, SunAmerica Series Trust, VALIC Company I and VALIC Company II (2016 to 2017); Chief Compliance Officer, SunAmerica (2006 to present); Chief Compliance Officer, The Variable Annuity Life Insurance Company (2016 to 2017); AML Compliance Officer, AIG Funds, Anchor Series Trust, Seasons Series Trust, SunAmerica Series Trust, VALIC Company I and VALIC Company II (2006 to present); and Vice President, SunAmerica (2011 to present). | N/A | N/A | |||||||
| * | The business address for each Trustee and Officer is the Harborside 5, 185 Hudson Street, Suite 3300, Jersey City, NJ 07311. |
| (1) | Trustees serve until their successors are duly elected and qualified. Each officer will hold office for an indefinite term, until the date he or she resigns or retires or until his/her successor is duly elected and qualifies. |
| (2) | The “Fund Complex” means two or more registered investment companies that hold themselves out to investors as related companies for purposes of investment services or have a common investment adviser or an investment adviser that is an affiliated person of the Adviser. The “Fund Complex” includes the SunAmerica Equity Funds (2 funds), SunAmerica Income Funds (3 funds), SunAmerica Money Market Funds Inc. (1 fund), SunAmerica Senior Floating Rate Fund, Inc. (1 fund), SunAmerica Series, Inc. (6 funds), Anchor Series Trust (8 portfolios), Seasons Series Trust (20 portfolios), SunAmerica Series Trust (55 portfolios), VALIC Company I (34 funds), VALIC Company II (15 funds), and SunAmerica Specialty Series (7 funds). |
| (3) | Directorships of companies required for reporting to the Securities and Exchange Commission under the Securities Exchange Act of 1934 (i.e. “public companies”) or other investment companies registered under the 1940 Act. |
| (4) | Interested Trustee, as defined within the 1940 Act, because he or she is an officer and a trustee of the advisor, and director of the principal underwriter, of the Trust. |
| ||
| 97 |
Table of Contents
ANCHOR SERIES TRUST
SHAREHOLDERS TAX INFORMATION (unaudited)
Certain tax information regarding Anchor Series Trust is required to be provided to shareholders based upon each Portfolio’s income and capital gain distributions for the taxable year ended December 31, 2017.
During the year ended December 31, 2017, the Portfolios paid the following dividends per share along with the percentage of ordinary income dividends that qualified for the 70% dividends received deductions for corporations:
| Total Dividends | Net Investment Income | Net Short-Term Capital Gains | Net Long-Term Capital Gains | Qualifying % for the 70% Dividends Received Deductions | ||||||||||||||||
SA Wellington Government and Quality Bond Portfolio — Class 1 | $ | 0.28 | $ | 0.28 | $ | — | $ | — | — | % | ||||||||||
SA Wellington Government and Quality Bond Portfolio — Class 2 | 0.25 | 0.25 | — | — | — | |||||||||||||||
SA Wellington Government and Quality Bond Portfolio — Class 3 | 0.24 | 0.24 | — | — | — | |||||||||||||||
SA Edge Asset Allocation Portfolio — Class 1 | 1.65 | 0.41 | 0.02 | 1.22 | 28.83 | |||||||||||||||
SA Edge Asset Allocation Portfolio — Class 2 | 1.63 | 0.39 | 0.02 | 1.22 | 28.83 | |||||||||||||||
SA Edge Asset Allocation Portfolio — Class 3 | 1.61 | 0.37 | 0.02 | 1.22 | 28.83 | |||||||||||||||
SA Wellington Growth and Income Portfolio — Class 1 | 0.54 | 0.11 | — | 0.43 | 100.00 | |||||||||||||||
SA Wellington Growth Portfolio — Class 1 | 0.35 | 0.35 | — | — | 100.00 | |||||||||||||||
SA Wellington Growth Portfolio — Class 2 | 0.30 | 0.30 | — | — | 100.00 | |||||||||||||||
SA Wellington Growth Portfolio — Class 3 | 0.27 | 0.27 | — | — | 100.00 | |||||||||||||||
SA Wellington Capital Appreciation Portfolio — Class 1 | 3.72 | — | — | 3.72 | — | |||||||||||||||
SA Wellington Capital Appreciation Portfolio — Class 2 | 3.72 | — | — | 3.72 | — | |||||||||||||||
SA Wellington Capital Appreciation Portfolio — Class 3 | 3.72 | — | — | 3.72 | — | |||||||||||||||
SA Wellington Natural Resources Portfolio — Class 1 | 0.49 | 0.49 | — | — | 45.36 | |||||||||||||||
SA Wellington Natural Resources Portfolio — Class 2 | 0.46 | 0.46 | — | — | 45.36 | |||||||||||||||
SA Wellington Natural Resources Portfolio — Class 3 | 0.45 | 0.45 | — | — | 45.36 | |||||||||||||||
SA BlackRock Multi-Asset Income Portfolio — Class 1 | 0.14 | 0.14 | — | — | — | |||||||||||||||
SA BlackRock Multi-Asset Income Portfolio — Class 3 | 0.13 | 0.13 | — | — | — | |||||||||||||||
SA Wellington Multi-Asset Income Portfolio — Class 1 | 0.02 | 0.02 | — | — | 100.00 | |||||||||||||||
SA Wellington Multi-Asset Income Portfolio — Class 3 | 0.02 | 0.02 | — | — | 100.00 | |||||||||||||||
| ||
| 98 |
Table of Contents
COMPARISONS: PORTFOLIOS VS. INDEXES (unaudited)
As required by the Securities and Exchange Commission, the following graphs compare the performance of a $10,000 investment in each Portfolio to a $10,000 investment in a comparable securities index over the ten year period ended December 31, 2017. Importantly, such indices represent “paper” Portfolios and do not reflect the costs and expenses of actual investing. Following each graph is a discussion of portfolio performance and factors affecting performance over the year ended December 31, 2017.
The following graphs and tables show the performance of the Portfolios at the Anchor Series Trust level and include all trust expenses, but no insurance company expenses associated with the variable annuity contract, and no insurance company contingent deferred sales charge. No expenses are deducted from the performance of the indices. All dividends are assumed to be reinvested.
Investments in stocks and bonds are subject to risk, including stock market and interest-rate fluctuations. Investments in non-U.S. stocks are subject to additional risks, including political and social instability, differing securities regulations and accounting standards, and limited public information. Mortgage-backed securities are subject to prepayment, which can result in reinvestment of principal at lower yields. Money market instruments generally offer stability and income, but an investment in these securities, like investments in other Portfolios, is not guaranteed by the U.S. government or any other entity.
Past performance is no guarantee of future results.
Securities listed may or may not be a part of current Portfolio construction.
| ||
| 99 |
Table of Contents
Fixed-Income Portfolios
Wellington Management Company LLP
SA Wellington Government and Quality Bond Portfolio — Class 1 (unaudited)
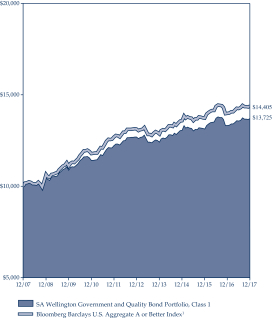
| SA Wellington Government and Quality Bond Portfolio | ||||||||||
| Average Annual Total Returns as of 12/31/17 | ||||||||||
| Class 1* | Class 2* | Class 3* | ||||||||
1-year | 2.97% | 2.85% | 2.78% | |||||||
5-year | 1.57% | 1.44% | 1.35% | |||||||
10-year | 3.22% | 3.07% | 2.97% | |||||||
Since Inception | 6.45% | 3.68% | 3.13% | |||||||
| * | Inception date for Class 1: 09/05/84; Class 2: 07/09/01; Class 3: 09/30/02 |
| 1 | The Bloomberg Barclays U.S. Aggregate A or Better Index is a subset of the Bloomberg Barclays U.S. Aggregate Bond Index and indices, which include index components for government and corporate bonds, agency mortgage pass-through securities, and asset-backed securities. However, the Bloomberg Barclays U.S.��Aggregate A or Better excludes BBB bonds. |
Note: The performance data quoted represents past performance; past performance does not guarantee future results; the investment return and principal value of an investment will fluctuate so that an investor’s shares, when redeemed, may be worth more or less than their original cost; current performance may be lower or higher than the performance data quoted. Please visit aig.com/annuities for performance data current to the most recent month-end.
The SA Wellington Government and Quality Bond Portfolio — Class 1 shares posted a return of 2.97% for the 12-month period ending December 31, 2017, compared to a 2.94% return for the Bloomberg Barclays U.S. Aggregate A or Better Index.
On an absolute return basis, Treasuries [+2.31%] underperformed a number of non-Treasury sectors during the year, including taxable municipals [+10.84%], U.S. mortgage-backed securities (MBS) [+2.48%], and commercial mortgage-backed securities (CMBS) [+3.35%]. Asset-backed securities (ABS) returned [+1.55%].
An overweight to and security selection within investment grade credit contributed most to relative performance overall, driven by an overweight position to and security selection within taxable municipals and an overweight to the banking subsector. This offset a negative impact from an overweight to industrials. Security selection within agency MBS pass-throughs and an out-of-benchmark allocation to Fannie Mae Delegated Underwriting and Servicing bonds contributed positively, while an underweight in CMBS detracted modestly. The Portfolio’s out-of-benchmark allocation to Treasury inflation-protected securities contributed positively as did an out-of-benchmark allocation to collateralized loan obligations. Duration and yield curve positioning also contributed modestly to relative performance.
The Portfolio ended the year with the following approximate fixed income sector allocations: 28% U.S. government, 34% MBS, 31% credit, 5% ABS, and 1% CMBS. From a quality standpoint, approximately 69% of the Portfolio’s assets at year-end were invested in securities rated AAA. The Portfolio ended the period with shorter effective duration than the benchmark.
Past performance is no guarantee of future results.
Securities listed may or may not be a part of current Portfolio construction.
| ||
| 100 |
Table of Contents
Balanced Portfolio
Edge Asset Management
SA Edge Asset Allocation Portfolio — Class 1 (unaudited)
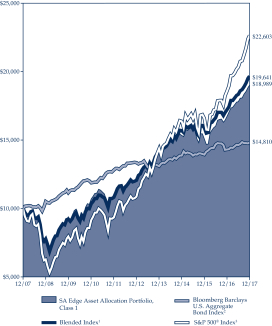
| SA Edge Asset Allocation Portfolio | ||||||||||||
| Average Annual Total Returns as of 12/31/17 | ||||||||||||
| Class 1* | Class 2* | Class 3* | ||||||||||
1-year | 13.73% | 13.59% | 13.43% | |||||||||
5-year | 9.42% | 9.26% | 9.14% | |||||||||
10-year | 6.62% | 6.46% | 6.36% | |||||||||
Since Inception | 7.87% | 6.83% | 8.14% | |||||||||
| * | Inception date for Class 1: 07/01/93; Class 2: 07/09/01; Class 3: 09/30/02 |
| 1 | The Blended Index consists of 40% Bloomberg Barclays U.S. Aggregate Bond Index and 60% S&P 500® Index. The Portfolio believes that the Blended Index may be more representative of the market sectors or types of securities in which the Portfolio invests than any of the individual benchmark indices, in that it includes both equity and fixed income components. The weightings of the components of the Blended Index are intended to approximate the allocation of the Portfolio’s assets, but at any given time, may not be indicative of the actual allocation of the Portfolio’s assets among market sectors or types of investments. |
| 2 | The Bloomberg Barclays U.S. Aggregate Bond Index combines several Bloomberg Barclays fixed-income indices to give a broad view of the U.S. investment grade fixed rate bond market, with index components for government and corporate bonds, mortgage pass-through securities, and asset-backed securities. |
| 3 | The S&P 500® Index tracks the performance of 500 stocks representing a sampling of the largest domestic stocks traded publicly in the United States. Because it is market-weighted, the index will reflect changes in larger companies more heavily than those in smaller companies. |
Note: The performance data quoted represents past performance; past performance does not guarantee future results; the investment return and principal value of an investment will fluctuate so that an investor’s shares, when redeemed, may be worth more or less than their original cost; current performance may be lower or higher than the performance data quoted. Please visit aig.com/annuities for performance data current to the most recent month-end.
The SA Edge Asset Allocation Portfolio — Class 1 shares returned 13.73% for the 12-month period ending December 31, 2017 compared to a 21.83% return of the S&P 500® Index and 3.54% return of the Bloomberg Barclays U.S. Aggregate Bond Index. The blended benchmark of 60% S&P 500® Index / 40% Bloomberg Barclays U.S. Aggregate Bond Index returned 14.21% for the annual period.
Equities outperformed bonds during the period, as measured by the S&P 500® Index and the Bloomberg Barclays U.S. Aggregate Bond Index. Most international equities outperformed U.S. equities for the year. Fixed income markets saw a fed funds rate increase of 75 bps during the year and posted a positive return (measured by the Bloomberg Barclays U.S. Aggregate Bond Index). High yield corporate bonds posted positive returns as riskier assets outperformed compared to Treasuries.
The Portfolio’s strategic and tactical allocation to international equities (developed and emerging) positively contributed to performance as most outperformed their U.S. counterparts. A strategic and tactical underweight position in large cap growth equities detracted, as they posted strong performance. A strategic and tactical allocation to mid cap and small cap value equities hindered performance as they underperformed their growth counterparts. The Portfolio’s strategic and tactical allocation to REITs and MLPs detracted as they underperformed
| ||
| 101 |
Table of Contents
Balanced Portfolio — (continued)
Edge Asset Management
SA Edge Asset Allocation Portfolio — Class 1 (unaudited)
other equities. A strategic and tactical underweight to government bonds and overweight to high yield bonds aided performance.
Due to the Portfolio’s large number of individual holdings (over 600) individual security impacts are minimal. The Portfolio’s security selection among U.S. mid cap value and large cap value equities aided performance, while small cap growth securities hindered performance. Security selection among international real estate securities contributed, while other international developed and emerging market value equities holdings hindered performance. The Portfolio’s security selection in high yield bonds aided performance, while investment grade corporate bonds detracted.
Past performance is no guarantee of future results.
Securities listed may or may not be a part of current Portfolio construction.
| ||
| 102 |
Table of Contents
Equity Portfolios
Wellington Management Company LLP
SA Wellington Growth and Income Portfolio — Class 1 (unaudited)
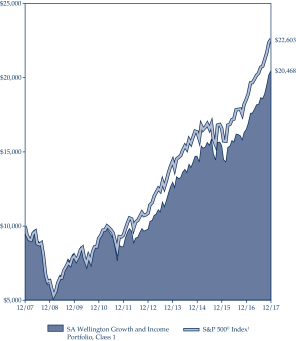
| SA Wellington Growth and Income Portfolio | ||||
| Average Annual Total Returns as of 12/31/17 | ||||
| Class 1* | ||||
1-year | 23.91% | |||
5-year | 15.90% | |||
10-year | 7.43% | |||
Since Inception | 8.14% | |||
| * | Inception date for Class 1: 03/23/87 |
| 1 | The S&P 500® Index tracks the performance of 500 stocks representing a sampling of the largest domestic stocks traded publicly in the United States. Because it is market weighted, the index will reflect changes in larger companies more heavily than those in smaller companies. |
Note: The performance data quoted represents past performance; past performance does not guarantee future results; the investment return and principal value of an investment will fluctuate so that an investor’s shares, when redeemed, may be worth more or less than their original cost; current performance may be lower or higher than the performance data quoted. Please visit aig.com/annuities for performance data current to the most recent month-end.
The SA Wellington Growth and Income Portfolio — Class 1 shares posted a return of 23.91% for the 12-month period ending December 31, 2017, compared to a 21.83% return for the S&P 500® Index.
Nine of the eleven sectors within the S&P 500® Index posted positive returns during the period. Information technology [+38.8%], materials [+24.1%], and consumer discretionary [+23.0%] posted the strongest returns. Telecommunication services [-1.2%] and energy [-1.0%] were the weakest performing sectors in the Index.
Relative outperformance was driven by stock selection and sector allocation. Strong selection within the consumer discretionary, industrials, and information technology sectors more than offset weak selection within health care and energy. Top contributors to performance included Estee Lauder and not holding General Electric and Exxon Mobil. Top detractors included Allergan, Walgreens Boots Alliance, and PDC Energy.
Sector allocation, a residual of the bottom-up stock selection process, aided relative performance during the period. Underweight allocations to the real estate and telecommunication services sectors contributed most to performance, while an overweight allocation to the health care sector detracted from relative returns.
The Portfolio ended the year most underweight in the real estate, consumer staples, and energy sectors and most overweight in the financials, consumer discretionary, and industrials sectors.
Past performance is no guarantee of future results.
Securities listed may or may not be a part of current Portfolio construction.
| ||
| 103 |
Table of Contents
Equity Portfolios — (continued)
Wellington Management Company LLP
SA Wellington Growth Portfolio — Class 1 (unaudited)

| SA Wellington Growth Portfolio | ||||||||||||
| Average Annual Total Returns as of 12/31/17 | ||||||||||||
| Class 1* | Class 2* | Class 3* | ||||||||||
1-year | 19.80% | 19.59% | 19.50% | |||||||||
5-year | 13.35% | 13.18% | 13.07% | |||||||||
10-year | 6.52% | 6.37% | 6.26% | |||||||||
Since Inception | 10.30% | 6.24% | 8.99% | |||||||||
| * | Inception date for Class 1: 09/05/84; Class 2: 07/09/01; Class 3: 09/30/02 |
| 1 | The Russell 3000® Index is an unmanaged, weighted index of the 3,000 largest publicly traded companies by market capitalization in the United States and is broadly representative of the universe of potential securities in which the Portfolio may invest. |
Note: The performance data quoted represents past performance; past performance does not guarantee future results; the investment return and principal value of an investment will fluctuate so that an investor’s shares, when redeemed, may be worth more or less than their original cost; current performance may be lower or higher than the performance data quoted. Please visit aig.com/annuities for performance data current to the most recent month-end.
The SA Wellington Growth Portfolio — Class 1 shares posted a return of 19.80% for the 12-month period ended December 31, 2017, compared to a 21.13% return for the Russell 3000® Index.
Within the Russell 3000® Index, information technology [+37.0%], materials [+23.6%], and health care [+23.3%] were the best performing sectors, while energy [-2.0%] and telecommunication services [-0.8%] were the weakest.
Stock selection hurt relative results during the year, driven by weak selection in health care, industrials, and utilities. Within the health care sector, positions in TESARO and Envision Healthcare were the top detractors from relative performance. Within industrials, Alaska Air and not holding Boeing were top detractors from relative performance. In utilities, PG&E and OGE Energy were the primary detractors from relative performance. In addition, the Portfolio’s underweight to Apple was the top relative detractor during the period.
Partially offsetting these negative results was strong selection in consumer staples (overweight positions in Monster Beverage and Kroger) and consumer discretionary (overweight positions in Netflix and L Brands). Additionally, not holding General Electric and Exxon Mobil were the Portfolio’s top relative contributors during the period.
Sector allocation, a residual of the bottom-up stock selection processes, contributed to relative performance. Underweight positions in the energy and telecommunication sectors contributed, while an underweight position to information technology detracted.
| ||
| 104 |
Table of Contents
Equity Portfolios — (continued)
Wellington Management Company LLP
SA Wellington Growth Portfolio — Class 1 (unaudited)
The Portfolio ended the year with an overweight position in consumer staples, health care, and financials. Information technology, energy, and telecommunication services were the Portfolio’s largest underweighted holdings.
Past performance is no guarantee of future results.
Securities listed may or may not be a part of current Portfolio construction.
| ||
| 105 |
Table of Contents
Equity Portfolios — (continued)
Wellington Management Company LLP
SA Wellington Capital Appreciation Portfolio — Class 1 (unaudited)
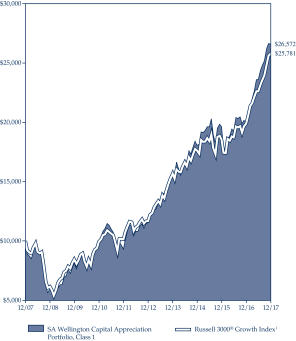
| SA Wellington Capital Appreciation Portfolio | ||||||||||||
| Average Annual Total Returns as of 12/31/17 | ||||||||||||
| Class 1* | Class 2* | Class 3* | ||||||||||
1-year | 32.78% | 32.57% | 32.46% | |||||||||
5-year | 18.17% | 18.00% | 17.88% | |||||||||
10-year | 10.27% | 10.10% | 9.99% | |||||||||
Since Inception | 12.73% | 9.48% | 12.70% | |||||||||
| * | Inception date for Class 1: 03/23/87; Class 2: 07/09/01; Class 3: 09/30/02 |
| 1 | The Russell 3000® Growth Index measures the performance of those Russell 3000® Index companies with higher price-to-book ratios and higher forecasted growth values. The stocks in this index are also members of either the Russell 1000® Growth or the Russell 2000® Growth Indices. |
Note: The performance data quoted represents past performance; past performance does not guarantee future results; the investment return and principal value of an investment will fluctuate so that an investor’s shares, when redeemed, may be worth more or less than their original cost; current performance may be lower or higher than the performance data quoted. Please visit aig.com/annuities for performance data current to the most recent month-end.
The SA Wellington Capital Appreciation Portfolio — Class 1 shares posted a return of 32.78% for the 12-month period ending December 31, 2017, compared to a 29.59% return for the Russell 3000® Growth Index.
Sector returns within the index were positive in 10 of the 11 sectors during the year. Information technology [+40.1%], industrials [+30.0%], and financials [+29.4%] led the way. Energy [-9.6%] underperformed during the period.
Relative outperformance was primarily driven by stock selection, particularly within the information technology, consumer discretionary, and consumer staples sectors. Information technology positions Arista Networks and NVIDIA were among the top contributors in the Portfolio during the period. Consumer discretionary position Panera was also among the top relative contributors in the Portfolio.
Stock selection within the financials and industrials sectors weighed most heavily on relative performance during the year. Within financials, an overweight position in Capital One detracted from returns. Within industrials, an overweight in Middleby and not owning Boeing hurt relative performance.
Sector allocation, a residual of the bottom-up stock selection process, detracted from relative performance during the period. This was driven by a modest overweight position in the weak performing energy sector. An overweight position in the information technology sector, which rallied during the year, contributed to relative returns as did an underweight position in consumer staples.
| ||
| 106 |
Table of Contents
Equity Portfolios — (continued)
Wellington Management Company LLP
SA Wellington Capital Appreciation Portfolio — Class 1 (unaudited)
The Portfolio ended the year most overweight in the information technology, financials, and health care sectors, and most underweight in the consumer staples, industrials, and real estate sectors.
Past performance is no guarantee of future results.
Securities listed may or may not be a part of current Portfolio construction.
| ||
| 107 |
Table of Contents
Equity Portfolios — (continued)
Wellington Management Company LLP
SA Wellington Natural Resources Portfolio — Class 1 (unaudited)
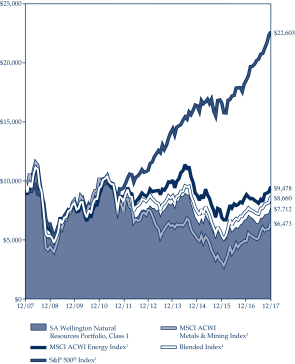
| SA Wellington Natural Resources Portfolio | ||||||||||||
| Average Annual Total Returns as of 12/31/17 | ||||||||||||
| Class 1* | Class 2* | Class 3* | ||||||||||
1-year | 15.03% | 14.94% | 14.79% | |||||||||
5-year | 0.26% | 0.11% | 0.02% | |||||||||
10-year | -2.57% | -2.71% | -2.81% | |||||||||
Since Inception | 8.36% | 8.38% | 9.36% | |||||||||
| * | Inception date for Class 1: 01/04/88; Class 2: 07/09/01; Class 3: 09/30/02 |
| 1 | The MSCI ACWI Energy Index includes large and mid-cap securities across 23 Developed Markets (“DM”) countries and 21 Emerging Markets (“EM”) countries. All securities in the index are classified in the Energy sector as per the Global Industry Classification Standard (“GICS®”). |
| 2 | The S&P 500® Index tracks the performance of 500 stocks representing a sampling of the largest domestic stocks traded publicly in the United States. Because it is market-weighted, the index will reflect changes in larger companies more heavily than those in smaller companies. |
| 3 | The MSCI ACWI Metals and Mining Index is composed of large and mid-cap stocks across 23 Developed Markets countries and 21 Emerging Markets countries. All securities in the index are classified in the Metals & Mining industry (within the Materials sector) according to GICS®. |
| 4 | The Blended Index consists of 65% MSCI AWCI Energy Index and 35% MSCI ACWI Metals & Mining Index. |
Note: The performance data quoted represents past performance; past performance does not guarantee future results; the investment return and principal value of an investment will fluctuate so that an investor’s shares, when redeemed, may be worth more or less than their original cost; current performance may be lower or higher than the performance data quoted. Please visit aig.com/annuities for performance data current to the most recent month-end.
The SA Wellington Natural Resources Portfolio — Class 1 shares posted a return of 15.03% for the 12-month period ending December 31, 2017, compared to a 21.83% return for the S&P 500® Index, a 33.82% return for the MSCI ACWI Metals & Mining Index, a 7.64% return for the MSCI ACWI Energy Index, and a 16.87% return for the blended index of 65% MSCI ACWI Energy Index and 35% MSCI ACWI Metals & Mining Index.
Almost all sectors in the S&P 500® Index posted positive returns for the year, with information technology [+38.8%] and materials [+24.1%] posting the strongest returns. The only negatively performing sectors were energy [-1.0%] and telecommunication services [-1.2%].
The Portfolio’s underperformance against the S&P 500® Index was primarily due to the Portfolio’s significant overweight position in the energy sector, which posted modestly negative returns, and an underweight position in the information technology sector, which posted strong positive returns. Allocations to United Kingdom and emerging markets stocks contributed on both an absolute and relative basis.
The top absolute contributors during the year were positions in Glencore and BHP Billiton. Security selection was strongest in the metals & minerals and upstream energy subsectors. Positions in Schlumberger and Weatherford were the top absolute detractors. The Portfolio’s position in Weatherford was both initiated and closed during the year.
Past performance is no guarantee of future results.
Securities listed may or may not be a part of current Portfolio construction.
| ||
| 108 |
Table of Contents
Balanced Portfolios
BlackRock Investment Management, LLC
SA BlackRock Multi-Asset Income Portfolio — Class 1 (unaudited)
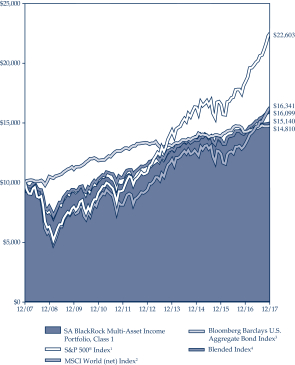
| SA BlackRock Multi-Asset Income Portfolio | ||||||||
| Average Annual Total Returns as of 12/31/17 | ||||||||
| Class 1* | Class 3* | |||||||
1-year | 6.34% | 6.20% | ||||||
5-year | 6.91% | 6.68% | ||||||
10-year | 4.23% | N/A | ||||||
Since Inception | 7.08% | 6.12% | ||||||
| * | Inception date for Class 1: 03/23/87; Class 3: 10/08/12 |
| 1 | The S&P 500® Index tracks the performance of 500 stocks representing a sampling of the largest domestic stocks traded in the United States. Because it is market-weighted, the index will reflect changes in larger companies more heavily than those in smaller companies. |
| 2 | The MSCI World (net) Index is a market capitalization-weighted index that measures equity market performance of developed markets. The index consists of 24 developed market country indexes, including the United States. The net index approximates the minimum possible dividend reinvestment and assumes that the dividend is reinvested after the deduction of withholding tax, applying the rate to nonresident individuals who do not benefit from double taxation treaties. |
| 3 | The Bloomberg Barclays U.S. Aggregate Bond Index combines several Bloomberg Barclays fixed-income indices to give a broad view of the U.S. investment grade fixed rate bond market, with index components for government and corporate bonds, mortgage pass-through securities, and asset-backed securities. |
| 4 | The blended Index consists of 50% MSCI World (net) Index and 50% Bloomberg Barclays U.S. Aggregate Bond Index (the “Blended Index”). The Portfolio believes that the Blended Index may be more representative of the market sectors or types of securities in which the Portfolio invests pursuant to its stated investment strategies than any of the individual benchmark indices, in that it includes both equity and fixed income components. |
Note: The performance data quoted represents past performance; past performance does not guarantee future results; the investment return and principal value of an investment will fluctuate so that an investor’s shares, when redeemed, may be worth more or less than their original cost; current performance may be lower or higher than the performance data quoted. Please visit aig.com/annuities for performance data current to the most recent month-end.
The SA BlackRock Multi-Asset Income Portfolio — Class 1 shares posted a return of 6.34% for the 12-month period ending December 31, 2017, compared to a 22.40% return for the MSCI World (net) Index, a 3.54% return for the Bloomberg Barclays U.S. Aggregate Bond Index, and a 12.62% return for the blended benchmark. The blended benchmark is comprised of 50% MSCI World (net) Index and 50% Bloomberg Barclays U.S. Aggregate Bond Index.
The Portfolio remains focused on providing a compelling level of income while managing the Portfolio through a tactical, diversified approach. As of period end, the estimated yield of the Portfolio was 3.9%. Estimated one-year standard deviation, based on monthly net returns, for the Portfolio was 1.4% versus 1.6% for its blended benchmark.
Risk assets generally outperformed more safe-haven sectors, with equities generally outperforming fixed income. Relative to the benchmark, the decision to run more modest levels of risk with a lower Portfolio exposure to equities negatively impacted performance. In addition, a small allocation to master limited partnerships (MLPs) detracted from returns.
| ||
| 109 |
Table of Contents
Balanced Portfolios — (continued)
BlackRock Investment Management, LLC
SA BlackRock Multi-Asset Income Portfolio — Class 1 (unaudited)
International equities, including emerging markets, were the largest positive contributor to results. The Portfolio’s allocations to U.S. dividend paying stocks also contributed positively. Within fixed income, allocations to both high yield and investment grade credit contributed to returns as spreads tightened over the period.
Past performance is no guarantee of future results.
Securities listed may or may not be a part of current Portfolio construction.
| ||
| 110 |
Table of Contents
Balanced Portfolios — (continued)
Wellington Management Company LLP
SA Wellington Multi-Asset Income Portfolio — Class 1 (unaudited)
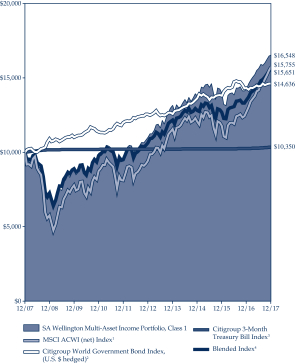
SA Wellington Multi-Asset Income Portfolio Average Annual Total Returns as of 12/31/17 | ||||||
| Class 1* | Class 3* | |||||
1-year | 16.26% | 16.08% | ||||
5-year | 8.52% | N/A | ||||
10-year | 5.17% | N/A | ||||
Since Inception | 7.93% | 11.50% | ||||
| * | Inception date for Class 1: 03/23/87; Class 3: 09/26/16 |
| 1 | The MSCI ACWI (net) Index captures large and mid cap representation across 23 developed and 23 emerging markets countries. With 2,484 constituents, the index covers approximately 85% of the global investable equity opportunity set. The net index approximates the minimum possible dividend reinvestment and assumes that the dividend is reinvested after the deduction of withholding tax, applying the rate to nonresident individuals who do not benefit from double taxation treaties. |
| 2 | Effective January 1, 2017, the Portfolio replaced the Citigroup World Government Bond Index (U.S. $ hedged, ex-Switzerland) with the Citigroup World Government Bond Index (U.S. $ hedged) because the information regarding the Citigroup World Government Bond Index (U.S. $ hedged, ex-Switzerland) is no longer available. The Citigroup World Government Bond Index (U.S. $ hedged) measures the performance of fixed-rate investment grad sovereign bonds, currency hedged to the USD. The Index is a widely used benchmark that currently comprises sovereign debt from over 20 countries. The Index provides a broad benchmark for the global sovereign fixed income market. |
| 3 | The Citigroup 3-Month Treasury Bill Index is an unmanaged index representing monthly return equivalents of yield averages of the last 3 month Treasury Bill issues. |
| 4 | The Blended Index consists of 65% MSCI ACWI (net) Index, 30% Citigroup World Government Bond Index (U.S. $ hedged), and 5% Citigroup 3-Month Treasury Bill Index. The Portfolio believes that the Blended Index may be more representative of the market sectors or types of securities in which the Portfolio invests than any of the individual benchmark indices, in that it includes both equity and fixed income components. The weightings of the components of the Blended Index are intended to approximate the allocation of the Portfolio’s assets, but at any given time, may not be indicative of the actual allocation of the Portfolio’s assets among market sectors or types of investments. |
Note: The performance data quoted represents past performance; past performance does not guarantee future results; the investment return and principal value of an investment will fluctuate so that an investor’s shares, when redeemed, may be worth more or less than their original cost; current performance may be lower or higher than the performance data quoted. Please visit aig.com/annuities for performance data current to the most recent month-end.
The SA Wellington Multi-Asset Income Portfolio — Class 1 shares posted a return of 16.26% for the 12-month period ending December 31, 2017, compared to a 23.97% return for the MSCI ACWI (net) Index, a 2.14% return for the Citigroup World Government Bond Index (U.S. dollar hedged), a 0.84% return for the Citigroup 3-month Treasury Bill Index, and a 15.83% return for the blended benchmark. The blended benchmark is comprised of 65% MSCI ACWI (net) Index, 30% Citigroup World Government Bond Index (U.S. dollar hedged), and 5% Citigroup 3-month Treasury Bill Index.
Effective January 1, 2017, the Citigroup World Government Bond Index (U.S. dollar hedged, ex-Switzerland) was replaced as a component in the blended benchmark with the Citigroup World Government Bond Index (U.S. dollar hedged).
| ||
| 111 |
Table of Contents
Balanced Portfolios — (continued)
Wellington Management Company LLP
SA Wellington Multi-Asset Income Portfolio — Class 1 (unaudited)
Security selection, which is expected to be the primary driver of returns over time, was positive within both the underlying global equity and global bond portfolios. The impact of asset allocation decisions was negative for the year.
The global equity portion of the Portfolio outperformed the MSCI ACWI (net) Index during the year due to both stock selection and sector allocation effects. Relative outperformance was driven by strong sector allocation due to an overweight to information technology, as well as underweights to the consumer staples and telecommunication sectors. Strong stock selection within the information technology and industrials sectors also aided relative performance. Weak stock selection within the health care and energy sectors detracted from relative returns during the period. From a regional perspective, stock selection within emerging markets contributed most to relative results. From a country perspective, security selection within China and Israel aided most to relative performance.
Within the global bond portion of the Portfolio, active currency and country positioning contributed, while duration positioning detracted. Yield curve positioning had a neutral impact on performance during the year.
At the end of the year, the Portfolio was positioned almost in line with the strategic asset allocation exposures.
During the period, the Portfolio held equity index and bond futures to adjust exposure to equity and bond markets and to manage duration and yield curve positioning. The Portfolio also used currency forwards to attempt to protect against changes in future foreign exchange rates and to enhance total return. When viewed in isolation, bond futures made a slight contribution to the Portfolio’s absolute performance, while currency forwards and equity futures detracted.
Past performance is no guarantee of future results.
Securities listed may or may not be a part of current Portfolio construction.
| ||
| 112 |
Table of Contents
ANCHOR SERIES TRUST
VOTING PROXIES ON TRUST PORTFOLIO SECURITIES
A description of the policies and procedures that the Trust uses to determine how to vote proxies related to securities held in the Trust’s Portfolios which is available in the Trust’s Statement of Additional Information, may be obtained without charge upon request, by calling (800) 445-SUN2. This information is also available from the EDGAR database on the U.S. Securities and Exchange Commission’s website at http://www.sec.gov.
PROXY VOTING RECORD ON TRUST PORTFOLIO SECURITIES
Information regarding how Anchor Series Trust Portfolios voted proxies related to securities held in Anchor Series Trust Portfolios during the most recent twelve month period ended June 30 is available once filed with the U.S. Securities and Exchange Commission, without charge, upon request, by calling (800) 445-SUN2 or on the U.S. Securities and Exchange Commission’s website at http://www.sec.gov.
DISCLOSURE OF QUARTERLY PORTFOLIO HOLDINGS
The Trust is required to file its complete schedule of portfolio holdings with the U.S. Securities and Exchange Commission for its first and third fiscal quarters on Form N-Q. The Trust’s Forms N-Q are available on the U.S. Securities and Exchange Commission’s website at http://www.sec.gov. You can also review and obtain copies of the Forms N-Q at the U.S. Securities and Exchange Commission’s Public Reference Room in Washington, DC (information on the operation of the Public Reference Room may be obtained by calling 800-SEC-0330).
This report is submitted solely for the general information of shareholders of the Trust. Distribution of this report to persons other than shareholders of the Trust is authorized only in connection with a currently effective prospectus, setting forth details of the Trust, which must precede or accompany this report.
Additional information concerning the Trustees and Officers is contained in the Statement of Additional Information and is available without charge by calling (800) 445-SUN2.
| ||
| 113 |
Table of Contents
Annuity Service Center P.O. Box 15570 Amarillo, TX 79105-5570
CHANGE SERVICE REQUESTED |

THISREPORTISNOTAUTHORIZEDFORDISTRIBUTIONTOPROSPECTIVEPURCHASERSUNLESSACCOMPANIEDORPRECEDEDBYACURRENTPROSPECTUS.
G1112AR.14 (2/18)
Table of Contents
| Item 2. | Code of Ethics |
Anchor Series Trust (the “registrant”) has adopted a Code of Ethics applicable to its Principal Executive and Principal Accounting Officers pursuant to Section 406 of the Sarbanes-Oxley Act of 2002 (the Code”). During the fiscal year ended December 31, 2017, there were no reportable waivers or implicit waivers to a provision of the Code that applies to the registrant’s Principal Executive and Principal Accounting Officers (the “Covered Officers”). During the fiscal year ended December 31, 2017, however, there were reportable amendments to the Code that apply to the Covered Officers, and that relate to one or more of the items set forth in paragraph (b) of Item 2 of Form N-CSR. In particular, the Code has been amended to provide an enhanced description of the Covered Officers’ responsibilities, which include a responsibility to observe the ethical principles contained in the Code.
| Item 3. | Audit Committee Financial Expert. |
As of January 16, 2018, the registrant’s Board of Trustees has determined that Eileen A. Kamerick, a Trustee of the registrant, qualifies as an audit committee financial expert, as defined in Item 3(b) of Form N-CSR. Ms. Kamerick is considered to be “independent” for purposes of Item 3(a)(2) of Form N-CSR.
| Item 4. | Principal Accountant Fees and Services. |
(a)—(d) Aggregate fees billed to the registrant for the last two fiscal years for professional services rendered by the registrant’s principal accountants were as follows:
2016 | 2017 | |||||||||||
(a) Audit Fees | $ | 290,034 | $ | 298,734 | ||||||||
(b) Audit-Related Fees | $ | 0 | $ | 0 | ||||||||
(c) Tax Fees | $ | 53,376 | $ | 62,128 | ||||||||
(d) All Other Fees | $ | 0 | $ | 0 | ||||||||
Audit Fees include amounts related to the audit of the registrant’s annual financial statements and services normally provided by the principal accountant in connection with statutory and regulatory filings. Tax fees principally include tax compliance, tax advice, tax planning and preparation of tax returns.
Aggregate fees billed to the investment adviser and Adviser Affiliates (as defined below in Item 4(e)) that are required to be pre-approved pursuant to paragraph (c)(7)(ii) of Rule 2-01 of Regulation S-X for the last two fiscal years for services rendered by the registrant’s principal accountant were as follows:
2016 | 2017 | |||||||||||
(b) Audit-Related Fees | $ | 0 | $ | 0 | ||||||||
(c) Tax Fees | $ | 0 | $ | 0 | ||||||||
(d) All Other Fees | $ | 217,596 | $ | 390,644 | ||||||||
| (e) | (1) The registrant’s audit committee pre-approves all audit services provided by the registrant’s principal accountant for the registrant and all non-audit services provided by the registrant’s principal accountant for the registrant, its investment adviser and any entity controlling, controlled by, or under common control with the investment adviser (“Adviser Affiliates”) that provides ongoing services to the registrant, if the engagement by the investment adviser or Adviser Affiliate relates directly to the operations and financial reporting of the registrant. The audit committee has not presently established any pre-approval policies and procedures that permit the pre-approval of the above services other than by the full audit committee. Certain de minimis exceptions are allowed for non-audit services in accordance with Rule 2-01(c)(7)(i)(C) of Regulation S-X as set forth in the registrant’s audit committee charter. |
| (2) No services included in (b)-(d) above in connection with fees billed to the registrant or the investment adviser or Adviser Affiliates were approved pursuant to paragraph (c)(7)(i)(C) of Rule 2-01 of Regulation S-X. |
| (f) | Not applicable. |
| (g) | The aggregate fees billed for the most recent fiscal year and the preceding fiscal year by the registrant’s principal accountant for non-audit services rendered to the registrant, its investment adviser, and Adviser Affiliates that provide ongoing services to the registrant for 2016 and 2017 were $354,772 and $489,457, respectively. |
| (h) | Non-audit services rendered to the registrant’s investment adviser and any Adviser Affiliates that provides ongoing services to the registrant that were not pre-approved pursuant to paragraph (c)(7)(ii) of Rule 2-01 of Regulation S-X were considered by the registrant’s audit committee as to whether they were compatible with maintaining the principal accountant’s independence. |
| Item 5. | Audit Committee of Listed Registrants. |
Not applicable.
| Item 6. | Investments. |
Included in Item 1 to the Form.
| Item 7. | Disclosure of Proxy Voting Policies and Procedures for Closed-End Management Investment Companies. |
Not applicable.
| Item 8. | Portfolio Managers of Closed-End Management Investment Companies. |
Not applicable.
| Item 9. | Purchases of Equity Securities by Closed-End Management Investment Company and Affiliated Purchasers. |
Not applicable.
| Item 10. | Submission of Matters to a Vote of Security Holders. |
There were no material changes to the procedures by which shareholders may recommend nominees to the registrant’s Board of Trustees that were implemented after the registrant last provided disclosure in response to the requirements of Item 407(c)(2)(iv) of Regulation S-K (17 CFR 229.407) (as required by Item 22(b)(15)) of Schedule 14A (17 CFR 240.14a - 101), or this Item 10.
| Item 11. | Controls and Procedures. |
| (a) | An evaluation was performed within 90 days of the filing of this report, under the supervision and with the participation of the registrant’s management, including the President and Treasurer, of the effectiveness of the design and operation of the registrant’s disclosure controls and procedures (as defined in Rule 30a-3(c) under the Investment Company Act of 1940 (17 CFR 270.30a-3(c))). Based on that evaluation, the registrant’s management, including the President and Treasurer, concluded that the registrant’s disclosure controls and procedures are effective. |
| (b) | There was no change in the registrant’s internal control over financial reporting (as defined in Rule 30a-3(d) under the Investment Company Act of 1940 (17 CFR 270.30a-3(d))) that occurred during the registrant’s last fiscal quarter of the period covered by this report that has materially affected, or is reasonably likely to materially affect, the registrant’s internal control over financial reporting. |
| Item 12. | Disclosure of Securities Lending Activities for Closed-End Management Investment Companies. |
Not applicable.
| Item 13. | Exhibits. |
| (a) | (1) Code of Ethics applicable to its Principal Executive and Principle Accounting Officers pursuant to Section 406 of the Sarbanes-Oxley Act of 2002 attached hereto as Exhibit 99.406. Code of Ethics. |
| (2) Certifications pursuant to Rule 30a-2(a) under the Investment Company Act of 1940 (17 CFR 270.30a-2(a)) attached hereto as Exhibit 99.CERT. |
| (3) Not applicable. |
| (b) | Certification pursuant to Rule 30a-2(b) under the Investment Company Act of 1940 (17 CFR 270.30a-2(a)) and Section 906 of the Sarbanes-Oxley Act of 2002 attached hereto as Exhibit 99.906.CERT. |
Table of Contents
SIGNATURES
Pursuant to the requirements of the Securities Exchange Act of 1934 and the Investment Company Act of 1940, the registrant has duly caused this report to be signed on its behalf by the undersigned, thereunto duly authorized.
Anchor Series Trust | ||
| By: | /s/ John T. Genoy | |
John T. Genoy President | ||
Date: March 09, 2018
Pursuant to the requirements of the Securities Exchange Act of 1934 and the Investment Company Act of 1940, this report has been signed below by the following persons on behalf of the registrant and in the capacities and on the dates indicated.
| By: | /s/ John T. Genoy | |
John T. Genoy President | ||
Date: March 09, 2018
| By: | /s/ Gregory R. Kingston | |
Gregory R. Kingston Treasurer | ||
Date: March 09, 2018