Filed by Gammon Gold Inc.
Pursuant to Rule 425 under the Securities Act of 1933
and deemed filed pursuant to Rule 14a-12 under the
Securities Exchange Act of 1934
Subject Company: Capital Gold Corporation
Commission File No.: 001-34618
This filing, which includes (i) materials used in a presentation held on February 28, 2011 for investors and (ii) materials posted on the website of Gammon Gold Inc. on February 28, 2011 regarding the general business and operations of Gammon Gold Inc. and its proposed acquisition of Capital Gold Corporation, may contain forward-looking statements within the meaning of the Private Securities Litigation Reform Act of 1995 and comparable “safe harbour” provisions of applicable Canadian legislation, including, but not limited to, statements relating to anticipated financial and operating results, the companies’ plans, objectives, expectations and intentions, cost savings and other statements, including words such as “anticipate,” “believe,” “plan,” “estimate,” “expect,” “intend,” “will,” “should,” “may,” and other similar expressions. Such statements are based upon the current beliefs and expectations of our management and involve a number of significant risks and uncertainties. Actual results may differ materially from the results anticipated in these forward-looking statements. The following factors, among others, could cause or contribute to such material differences: the ability to obtain the approval of the transaction by Capital Gold Corporation stockholders; the ability to realize the expected synergies resulting from the transaction in the amounts or in the timeframe anticipated; the ability to integrate Capital Gold Corporation’s businesses into those of Gammon Gold Inc. in a timely and cost-efficient manner; the ability to obtain governmental approvals of the transaction or to satisfy other conditions to the transaction on the proposed terms and timeframe; and the outcome of pending litigation related to the proposed acquisition of Capital Gold Corporation. Additional factors that could cause Gammon Gold Inc. and Capital Gold Corporation’s results to differ materially from those described in the forward-looking statements can be found in the 2009 Annual Report on Form 40-F, as amended by Amendment No. 1 to Annual Report on Form 40-F/A, for Gammon Gold Inc. and the Annual Report on Form 10-K, as amended by Form 10-K/A, of Capital Gold Corporation for the fiscal year ended July 31, 2010 filed with the Securities and Exchange Commission and available at the Securities and Exchange Commission’s Internet site (http://www.sec.gov).
The proposed merger transaction involving Gammon Gold Inc. and Capital Gold Corporation will be submitted to Capital Gold Corporation’s stockholders for their consideration. Gammon Gold Inc. has filed with the SEC a Registration Statement on Form F-4 containing a definitive proxy statement/prospectus and each of Gammon Gold Inc. and Capital Gold Corporation may file with the SEC other documents regarding the proposed transaction.Stockholders are encouraged to read the definitive proxy statement/prospectus regarding the proposed transaction, as well as other documents filed with the SEC because they contain important information.Stockholders may obtain a free copy of the definitive proxy statement/prospectus, as well as other filings containing information about Gammon Gold Inc. and Capital Gold Corporation, without charge, at the SEC’s Internet site (http://www.sec.gov). Copies of the definitive proxy statement/prospectus and the filings with the SEC that are incorporated by reference in the definitive proxy statement/prospectus can also be obtained
without charge, by directing a request to Gammon Gold, Inc., Investor Relations, 1701 Hollis Street, Suite 400, Founders Square, P.O. Box 2067, Halifax, Nova Scotia, B3J 2Z1, Canada, or to Capital Gold Corporation, Investor Relations, 76 Beaver Street, 14th floor, New York, New York 10005.
Gammon Gold Inc., Capital Gold Corporation, their respective directors and executive officers and other persons may be deemed to be participants in the solicitation of proxies in respect of the proposed transaction. Information regarding Gammon Gold Inc.’s directors and executive officers is available in its Annual Report on Form 40-F for the year ended December 31, 2009, which was filed with the SEC on March 30, 2010, as amended by Amendment No. 1 to Annual Report on Form 40-F/A, which was filed with the SEC on May 13, 2010, in its notice of annual meeting and proxy circular for its most recent annual meeting, which was filed with the SEC on April 15, 2010, and the above-referenced Registration Statement on Form F-4, which was filed with the SEC on February 15, 2011. Information regarding Capital Gold Corporation’s directors and executive officers is available in Capital Gold Corporation’s Form 10-K/A, which was filed with the SEC on November 23, 2010. Other information regarding the participants in the proxy solicitation and a description of their direct and indirect interests, by security holdings or otherwise, is contained in the definitive proxy statement/prospectus and other relevant materials filed with the SEC.
THE FOLLOWING ARE MATERIALS USED IN A PRESENTATION HELD ON FEBRUARY 28, 2011 FOR INVESTORS
Building a Leading Gold Company in Mexico
BMO Metals & Mining Conference
February 28? March 2, 2011
Operations Capital Gold Operations
Development & Exploration Properties Capital Gold Development &Exploration Properties
Gammon Gold Inc.
Forward Looking Statements
Gammon Gold Inc.
This presentation includes certain “forward? looking statements” or “forward? looking information”. All statements, other than statements of historical fact, included in this presentation are forward? looking statements that involve risks and uncertainties. The words “believe”, “expect”, “anticipate”, “contemplate”, “target”, “plan”, “intends”, “continue”, “budget”, “estimate”, “forecast”, “may”, “will”, “schedule” and similar expressions identify forward?looking statements. Forward? looking statements include, among other things, statements regarding targets, estimates and assumptions in respect of gold and silver and gold equivalent production and prices, cash and operating costs, results and capital expenditures, mineral reserves and mineral resources and anticipated grades, recovery rates, future financial or operating performance, margins, operating and exploration expenditures, costs and timing of the development of new deposits, costs and timing of construction, costs and timing of future exploration and reclamation expenses, anticipated 2010 year? end and 2011 results, our ability to fully fund our business model, including our capital and exploration program, internally, anticipated 2010 year? end and 2011 interim and annual gold and silver production and the cash and operating costs associated with the same, the ability to achieve productivity and operational efficiencies, the ability to achieve cash flow margin improvements, the ability to complete further reduction in the open pit stripping ratio, the ability to develop and put into production our exploration targets and the timing of each thereof, the ability to execute on our acquisition strategy, the acquisition of Capital Gold (the “Acquisition”) including whether the completion of the Acquisition will ultimately occur, whether the anticipated synergies of the proposed Acquisition will occur, incorrect assessment of the value of the properties of Capital Gold and failure to obtain the required security holder, regulatory, third party and other approvals and the outcome of any pending litigation related to the Acquisition. Forward? looking statements are necessarily based upon a number of estimates and assumptions that, while considered reasonable by Gammon Gold, are inherently subject to significant business, economic, competitive, political and social uncertainties and contingencies. Important factors that could cause actual results to differ materially from Gammon Gold’s expectations include, among others, risks related to international operations, the actual results of current exploration activities, conclusions of economic evaluations and changes in project parameters as plans continue to be refined, future prices of gold and silver, known and unknown uncertainties and risks relating to additional funding requirements, reserve and resource estimates, hedging activities, development and operating risks, illegal miners, uninsurable risks, competition, limited mining operations, production risks, environmental regulation and liability, government regulation, currency fluctuations, recent losses and write? downs, restrictions in Gammon Gold’s loan facility, dependence on key employees, possible variations of ore grade or recovery rates, failure of plant, equipment or process to operate as anticipated, accidents and labour disputes as well as those factors discussed in the section entitled “Risk Factors” in Gammon Gold’s Form 40? F/A as filed with the United States Securities and Exchange Commission. Although Gammon Gold has attempted to identify important factors that could cause actual results
to differ materially, there may be other factors that cause results not to be as anticipated, estimated or intended. There can be no assurance that such statements will prove to be accurate as actual results and future events could differ materially from those anticipated in such statements. Forward? looking statements are not guarantees of future performance. Accordingly, readers should not place undue reliance on forward? looking statements.
Cautionary Note to US Investors Concerning Estimates of Measured, Indicated and Inferred Resources
This presentation uses the terms “Measured”, “Indicated” and “Inferred” Resources. U.S. investors are advised that while such terms are recognized and required by Canadian regulations, the Securities and Exchange Commission does not recognize them. “Inferred Resources” have a great amount of uncertainty as to their existence and as to their economic and legal feasibility. It cannot be assumed that all or any part of an inferred resource will ever be upgraded to a higher category. Under Canadian rules, estimates of Inferred Resources may not form the basis of feasibility or other economic studies. U.S. investors are cautioned not to assume that all or any part of Measured or Indicated Resources will ever be converted into reserves. U.S. investors are also cautioned not to assume that all or any part of an Inferred mineral Resource exists, or is economically or legally mineable.
2 |
Capital Markets Profile
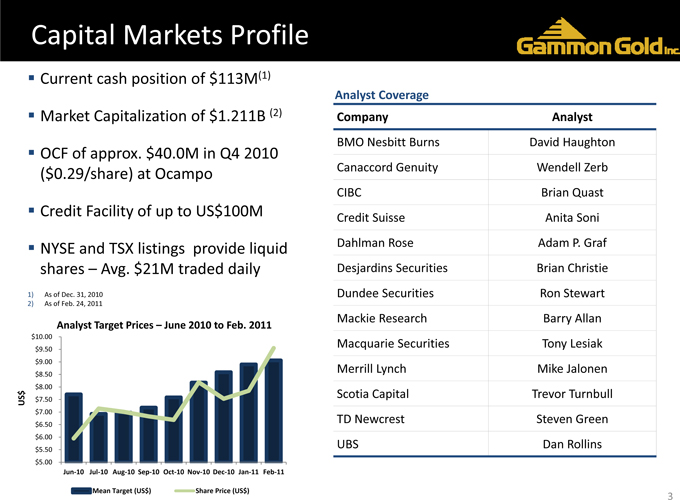
?Current cash position of $113M(1)
?Market Capitalization of $1.211B (2)
?OCF of approx. $40.0M in Q4 2010
($0.29/share) at Ocampo ?Credit Facility of up to US$100M
?NYSE and TSX listings provide liquid shares – Avg. $21M traded daily
1) As of Dec. 31, 2010
2) As of Feb. 24, 2011
Analyst Target Prices – June 2010 to Feb. 2011
$10.00
$9.50
$9.00
$8.50
$8.00
$
US $7.50
$7.00
$6.50
$6.00
$5.50
$5.00
Jun? 10 Jul? 10 Aug? 10 Sep? 10 Oct? 10 Nov? 10 Dec? 10 Jan? 11 Feb? 11
MeanTarget (US$) Share Price (US$)
Analyst Coverage
Company Analyst
BMO Nesbitt Burns David Haughton
Canaccord Genuity Wendell Zerb
CIBC Brian Quast
Credit Suisse Anita Soni
Dahlman Rose Adam P. Graf
Desjardins Securities Brian Christie
Dundee Securities Ron Stewart
Mackie Research Barry Allan
Macquarie Securities Tony Lesiak
Merrill Lynch Mike Jalonen
Scotia Capital Trevor Turnbull
TD Newcrest Steven Green
UBS Dan Rollins
3 |
A Leading Mexican Precious Metal Producer
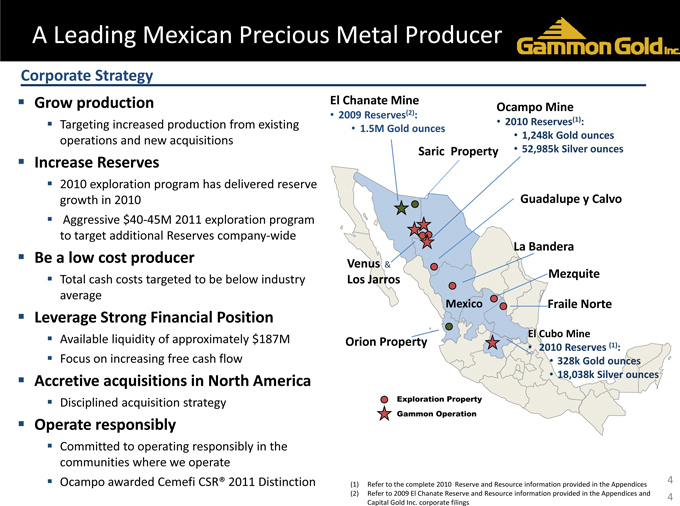
?Grow production
?Targeting increased production from existing operations and new acquisitions
?Increase Reserves
?2010 exploration program has delivered reserve growth in 2010 ?Aggressive $40? 45M 2011 exploration program to target additional Reserves company? wide
?Be a low cost producer
?Total cash costs targeted to be below industry average
?Leverage Strong Financial Position
?Available liquidity of approximately $187M ?Focus on increasing free cash flow
?Accretive acquisitions in North America
?Disciplined acquisition strategy
?Operate responsibly
?Committed to operating responsibly in the communities where we operate ?Ocampo awarded Cemefi CSR® 2011 Distinction
El Chanate Mine
Ocampo Mine
• 2009 Reserves(2):
• ��� 2010 Reserves(1): 1.5M Gold ounces
• 1,248k Gold ounces Saric Property • 52,985k Silver ounces
Guadalupe y Calvo
La Bandera Venus & Mezquite Los Jarros
Mexico Fraile Norte
El Cubo Mine Orion Property (1)
• 2010 Reserves :
• 328k Gold ounces
• 18,038k Silver ounces
Exploration Property Gammon Operation
4
(1) Refer to the complete 2010 Reserve and Resource information provided inthe Appendices
(2) Refer to 2009 El Chanate Reserve and Resource information provided inthe Appendices and 4 Capital Gold Inc. corporate filings
Ocampo Overview
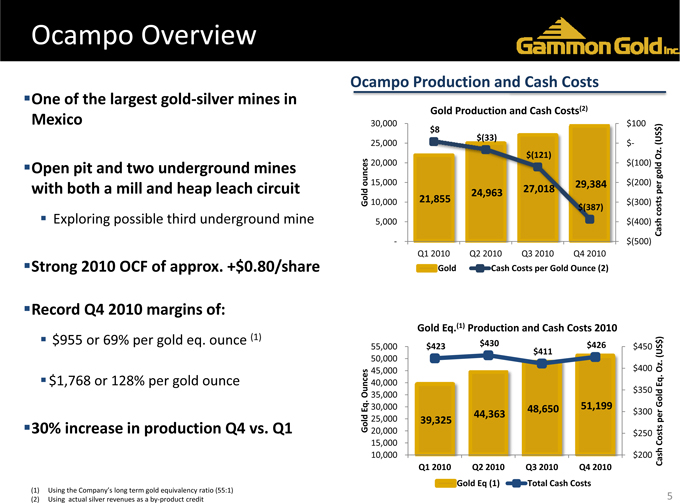
??One of the largest gold? silver mines in Mexico
??Open pit and two underground mines with both a mill and heap leach circuit
?Exploring possible third underground mine
??Strong 2010 OCF of approx. +$0.80/share
??Record Q4 2010 margins of:
?$955 or 69% per gold eq. ounce (1)
?$1,768 or 128% per gold ounce
??30% increase in production Q4 vs. Q1
(1) Using theCompany’s longterm gold equivalency ratio (55:1) (2) Using actualsilver revenues asa by? product credit
Ocampo Production and Cash Costs
Gold Production and Cash Costs(2)
30,000 $100 $ ) $8 $(33) (US
25,000 $?
. $(121) Oz
20,000 $(100) gold ounces 15,000 29,384 $(200)
24,963 27,018 per Gold 10,000 21,855 $(300) $(387) costs
5,000 $(400) Cash
? $(500) Q1 2010 Q2 2010 Q3 2010 Q4 2010
Gold Cash Costs per Gold Ounce (2)
Gold Eq.(1) Production and Cash Costs 2010 $430 $ )
55,000 $423 $426 $450 50,000 $411 (US
45,000 $400 Oz .
40,000 $350 Eq Ounces 35,000 Eq .. 30,000 51,199 Gold 48,650 $300 44,363 Gold 25,000 39,325 per
20,000 $250 Costs 15,000 10,000 $200 Cash Q1 2010 Q2 2010 Q3 2010 Q4 2010
Gold Eq (1) Total Cash Costs
5
2010 Reserves and Resources
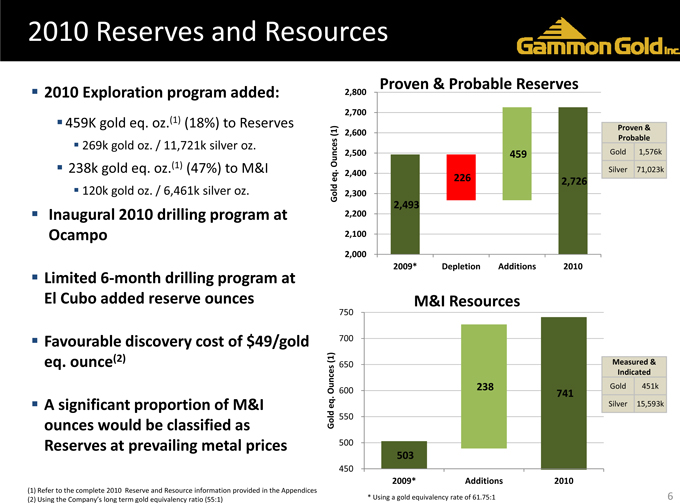
?2010 Exploration program added:
?459K gold eq. oz.(1) (18%) to Reserves
?269k gold oz. / 11,721k silver oz.
?238k gold eq. oz.(1) (47%) to M&I
?120k gold oz. / 6,461k silver oz.
?Inaugural 2010 drilling program at Ocampo
?Limited 6? month drilling program at El Cubo added reserve ounces
?Favourable discovery cost of $49/gold eq. ounce(2)
?A significant proportion of M&I ounces would be classified as Reserves at prevailing metal prices
(1) Refer to the complete 2010 Reserve and Resource information provided inthe Appendices (2) Usingthe Company’s longterm gold equivalency ratio (55:1)
Proven & Probable Reserves
2,800
2,700
Proven & (1) 2,600 Probable Ounces 2,500 459 Gold 1,576k
. 2,400 Silver 71,023k
eq 226 2,726 Gold 2,300 2,493 2,200
2,100
2,000
2009* Depletion Additions 2010
M&I Resources
750
700
(1) Measured &
650
Indicated 238 Gold 451k
Ounces 600 741 . eq Silver 15,593k
Gold 550 500
503
450
2009* Additions 2010
* Usinga gold equivalency rate of61.75:1 6
Ocampo Reserves and Resources
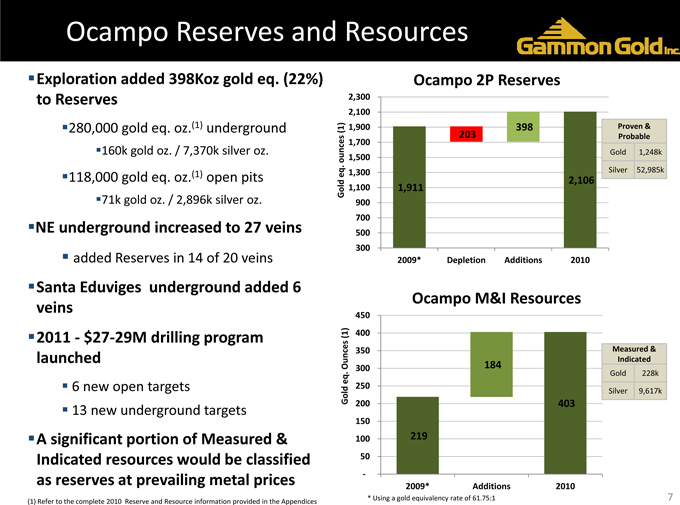
?Exploration added 398Koz gold eq. (22%) to Reserves
??280,000 gold eq. oz.(1) underground
??160k gold oz. / 7,370k silver oz.
??118,000 gold eq. oz.(1) open pits
??71k gold oz. / 2,896k silver oz.
??NE underground increased to 27 veins
?added Reserves in 14 of 20 veins
?Santa Eduviges underground added 6 veins ?2011 $ ? 27? 29M drilling program launched
?6 new open targets
?13 new underground targets
?A significant portion of Measured & Indicated resources would be classified as reserves at prevailing metal prices
(1) Refer to the complete 2010 Reserve and Resource information provided inthe Appendices
Ocampo 2P Reserves
2,300 2,100
(1) 1,900 398 Proven & 1,700 203 Probable
Gold 1,248k ounces 1,500
. Silver 52,985k eq 1,300 2,106 Gold 1,100 1,911 900 700 500 300 2009* Depletion Additions 2010
Ocampo M&I Resources
450
(1) 400
350 Measured & Indicated Ounces 300 184 eq . Gold 228k
250
Gold Silver 9,617k
200 403 150 100 219 50
?
2009* Additions 2010
* Usinga gold equivalency rate of61.75:1 7
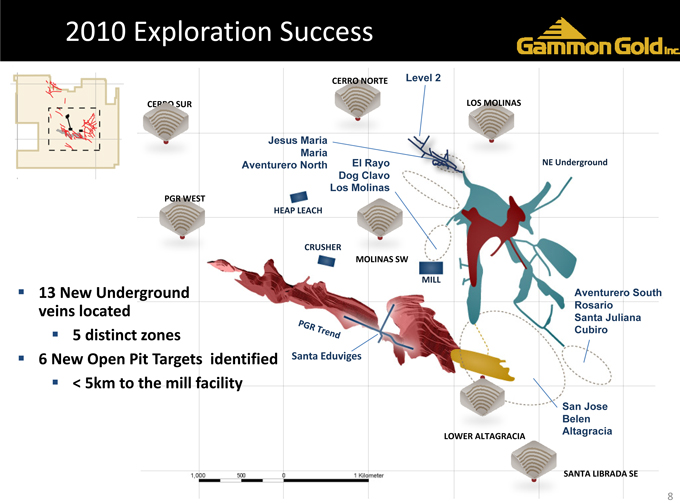
2010 Exploration Success
CERRO NORTE Level 2
CERRO SUR LOS MOLINAS
Jesus Maria
Maria
Aventurero North El Rayo NE Underground
Dog Clavo
Los Molinas
PGR WEST
HEAP LEACH
CRUSHER
MOLINAS SW
MILL
13 New Underground Aventurero South
veins located Rosario
Santa Juliana
5 distinct zones Cubiro
6 New Open Pit Targets identified Santa Eduviges
< 5km to the mill facility
San Jose
Belen
LOWER ALTAGRACIA Altagracia SANTA LIBRADA SE
8
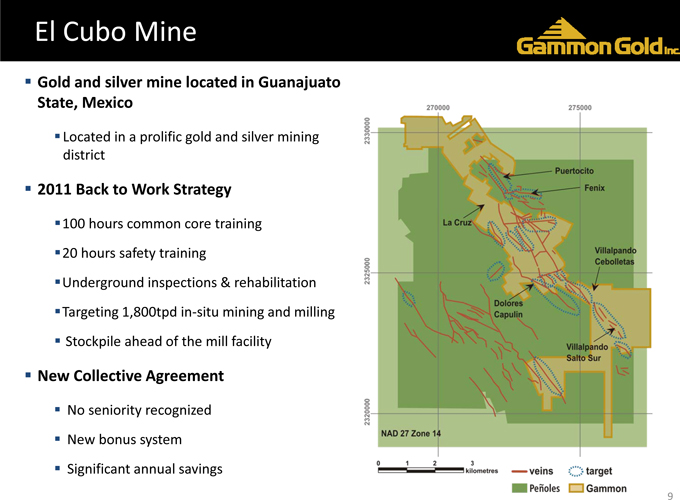
El Cubo Mine
?Gold and silver mine located in Guanajuato State, Mexico
?Located in a prolific gold and silver mining district
?2011 Back to Work Strategy
?100 hours common core training ?20 hours safety training
?Underground inspections & rehabilitation ?Targeting 1,800tpd in? situ mining and milling ?Stockpile ahead of the mill facility
?New Collective Agreement
?No seniority recognized ?New bonus system ?Significant annual savings
2320000
2325000
2330000
270000
275000
La Cruz
Puertocito
Fenix
Dolores Capulin
Villapando
Cebolietas
Villapando
Saltosur
NAD 27 Zone 14
Kilometers
Veins
Target
Penoles
Gammon
9
El Cubo Reserves and Resources
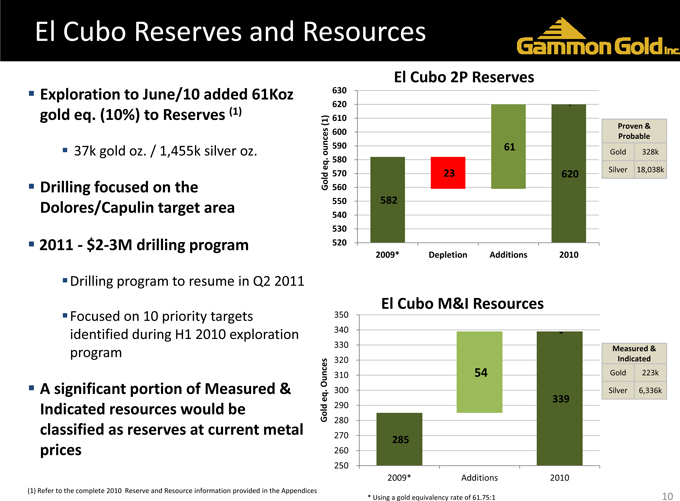
El Cubo 2P Reserves Exploration to June/10 added 61Koz 630
620 ?
gold eq. (10%) to Reserves (1)
(1) 610
Proven & 600 Probable
37k gold oz. / 1,455k silver oz. ounces 590 61 Gold 328k
eq . 580
Silver 18,038k
570 23 620
Drilling focused on the Gold 560
550 582
Dolores/Capulin target area
540 530
2011 $ ? 2? 3M drilling program 520
2009* Depletion Additions 2010
Drilling program to resume in Q2 2011
El Cubo M&I Resources
Focused on 10 priority targets 350 identified during H1 2010 exploration 340 ?
330 program Measured & 320 Indicated Ounces 310 54 Gold 223k
A significant portion of Measured & . eq 300 Silver 6,336k
339
Indicated resources would be Gold 290
280
classified as reserves at current metal
270 285
prices 260
250
2009* Additions 2010
(1) Refer to the complete 2010 Reserve and Resource information provided inthe Appendices
* Usinga gold equivalency rate of61.75:1 10
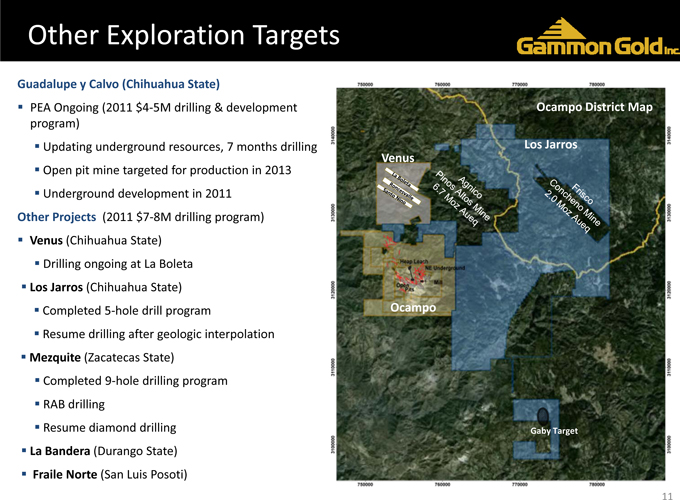
Other Exploration Targets
Guadalupe y Calvo (Chihuahua State)
PEA Ongoing (2011 $4? 5M drilling & development Ocampo District Map program) Updating underground resources, 7 months drilling Los Jarros
Venus
Open pit mine targeted for production in 2013 Underground development in 2011 Other Projects (2011 $7? 8M drilling program) Venus (Chihuahua State) Drilling ongoing at La Boleta Los Jarros (Chihuahua State)
Completed 5? hole drill program Ocampo Resume drilling after geologic interpolation Mezquite (Zacatecas State) Completed 9? hole drilling program RAB drilling
Resume diamond drilling Gaby Target La Bandera (Durango State) Fraile Norte (San Luis Posoti)
Agnico Pinos Altos Mine 6.7 Moz Aueq
Frisco Concheno Mine 2.0 Moz Aueq
11
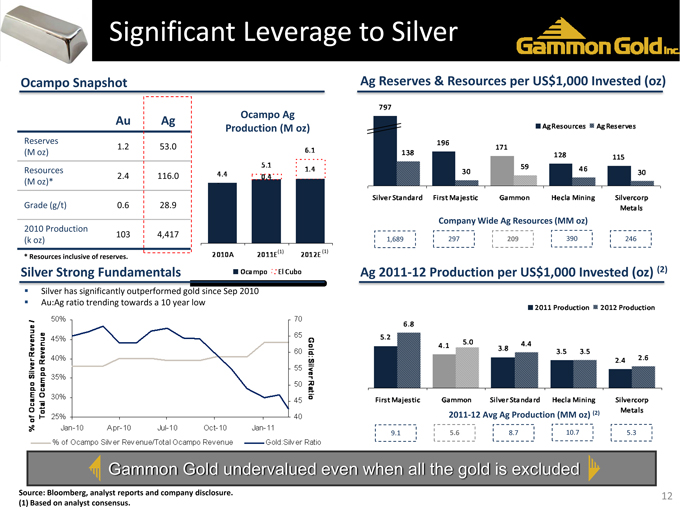
Significant Leverage to Silver
Ocampo Snapshot Ag Reserves & Resources per US$1,000 Invested (oz)
Ocampo Ag Au Ag Production (M oz)
Reserves
1.2 53.0 (M oz)
Resources
2.4 116.0 (M oz)*
Grade (g/t) 0.6 28.9
Company Wide Ag Resources (MM oz)
2010 Production
103 4,417
(k oz) 1,689 297 209 390 246
* Resources inclusiveof reserves. (1) (1)
Silver Strong Fundamentals Ag 2011? 12 Production per US$1,000 Invested (oz) (2)
Silver has significantly outperformed gold since Sep 2010 Au:Ag ratio trending towards a 10 year low
2011? 12 Avg Ag Production (MM oz) (2)
9.1 5.6 8.7 10.7 5.3
Gammon Gold undervalued even when all the gold is excluded
Source: Bloomberg, analyst reports and company disclosure. 12 (1) Based on analyst consensus.
4.4 5.1 0.4 6.1 1.4 2010A 2011E (1) 2012E(1)
Ocampo EICubo
% of Ocampo Silver Revenue / Total Ocampo Revenue
50% 45% 40% 35% 30% 25%
Jan-10 Apr-10 Jul-10 Oct-10 Jan-11
40 45 50 55 60 65 70
Gold:Silver Ratio
797 138 196 30 171 59 128 46 115 30
Silver Sandard
First Majestic
Gammon
Hecla Mining Silvercorp Metals
5.2 6.8 4.1 5.0 3.8 4.4 3.53.5 2.4 2.6
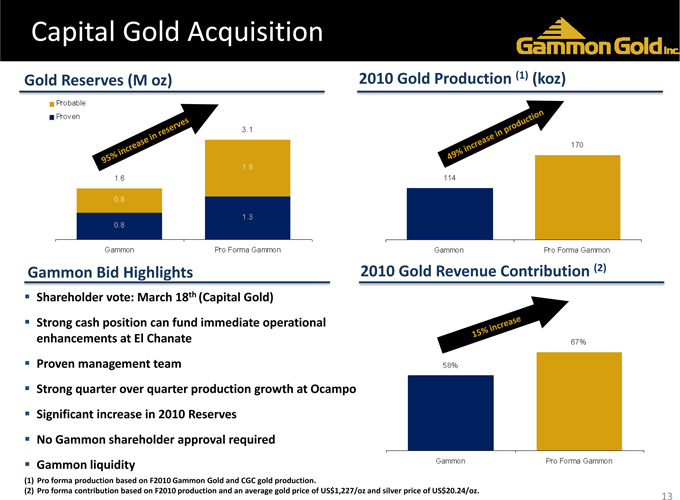
Capital Gold Acquisition
Gold Reserves (M oz) 2010 Gold Production (1) (koz)
Gammon Bid Highlights 2010 Gold Revenue Contribution (2)
Shareholder vote: March 18th (Capital Gold)
Strong cash position can fund immediate operational enhancements at El Chanate
Proven management team
Strong quarter over quarter production growth at Ocampo Significant increase in 2010 Reserves No Gammon shareholder approval required Gammon liquidity
(1) Pro forma production based on F2010 Gammon Gold and CGC gold production.
(2) Pro forma contribution based on F2010 production and an average gold price of US$1,227/oz and silver price of US$20.24/oz.
Probale
Proven
1.6 0.8 0.8
3.1 1.8 1.3
Gammon Pro Forma Gammon
114 170 49%increase in production
15% increase
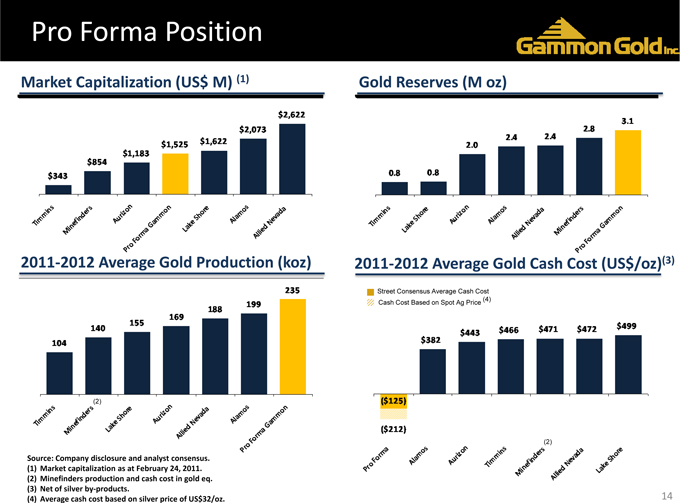
Pro Forma Position
Market Capitalization (US$ M) (1) Gold Reserves (M oz)
2011? 2012 Average Gold Production (koz) 2011? 2012 Average Gold Cash Cost (US$/oz)(3)
Street Consensus Average Cash Cost (4) Cash Cost Based on Spot Ag Price
(2)
(2)
Source: Company disclosure and analyst consensus. (1) Market capitalization as at February 24, 2011. (2) Minefinders production and cash cost in gold eq.
(3) Net of silver by? products. 14 (4) Average cash cost based on silver price of US$32/oz.
$343 $854 $1,183 $1.525 $1,622 $2,073 $2,622
0.8 2.0 2.4 2.4 .2.8 3.1
104 140 155 169 188 199 235
$382 $443 $466 $471 $472 $499
($125)
($212)
Timmins
Minefinders
Aurizon
Pro Forma Gammon
Lake shore
Alamos
Allied Nevada
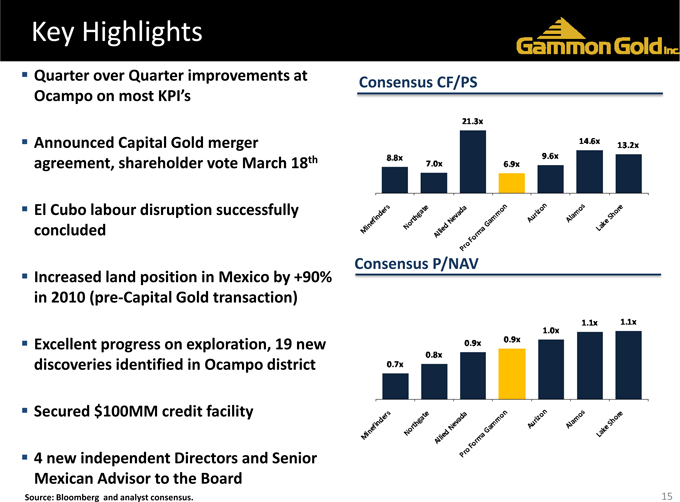
Key Highlights
Quarter over Quarter improvements at
Consensus CF/PS Ocampo on most KPI’s
Announced Capital Gold merger agreement, shareholder vote March 18th
El Cubo labour disruption successfully concluded
Consensus P/NAV Increased land position in Mexico by +90% in 2010 (pre? Capital Gold transaction)
Excellent progress on exploration, 19 new discoveries identified in Ocampo district
Secured $100MM credit facility
4 new independent Directors and Senior Mexican Advisor to the Board
Source: Bloomberg and analyst consensus. 15
8.8x 7.0x 21.3x 6.9x 9.6x 14.6x 13.2x
0.7x 0.8x 0.9x 0.9x 1.0x 1.1x 1.1x
Timmins
Minefinders
Aurizon
Pro Forma Gammon
Lake shore
Alamos
Allied Nevada
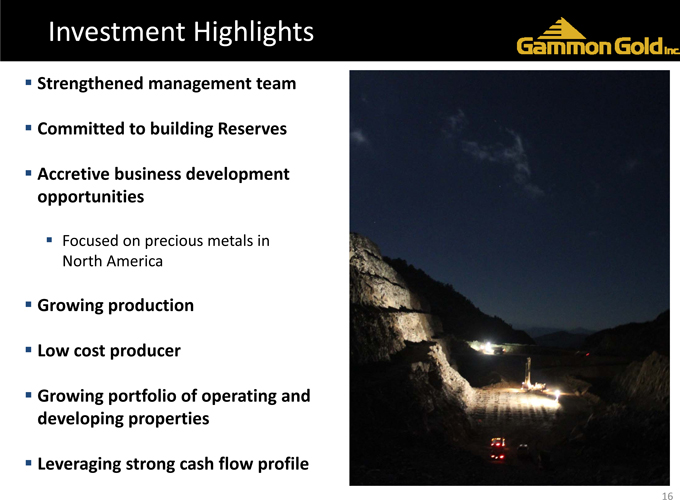
Investment Highlights
Strengthened management team
Committed to building Reserves
Accretive business development opportunities
Focused on precious metals in North America
Growing production
Low cost producer
Growing portfolio of operating and developing properties
Leveraging strong cash flow profile

Gammon Gold inc
APPENDICES
Mill and Heap Leach
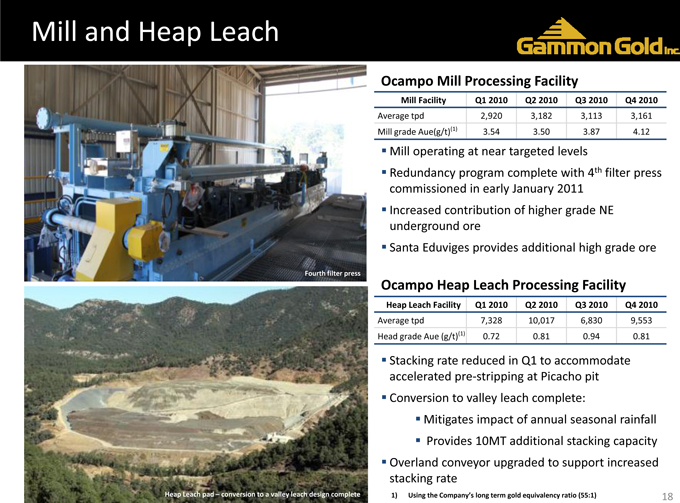
Ocampo Mill Processing Facility
Mill Facility Q1 2010 Q2 2010 Q3 2010 Q4 2010
Average tpd 2,920 3,182 3,113 3,161 Mill grade Aue(g/t)(1) 3.54 3.50 3.87 4.12
Mill operating at near targeted levels
Redundancy program complete with 4th filter press commissioned in early January 2011 Increased contribution of higher grade NE underground ore Santa Eduviges provides additional high grade ore
Ocampo Heap Leach Processing Facility
Heap Leach Facility Q1 2010 Q2 2010 Q3 2010 Q4 2010
Average tpd 7,328 10,017 6,830 9,553 Head grade Aue (g/t)(1) 0.72 0.81 0.94 0.81
Stacking rate reduced in Q1 to accommodate accelerated pre? stripping at Picacho pit Conversion to valley leach complete: Mitigates impact of annual seasonal rainfall Provides 10MT additional stacking capacity Overland conveyor upgraded to support increased stacking rate
1) Usingthe Company’s long termgold equivalency ratio(55:1) 18
Fourth filterpress
Heap Leachpad – conversion to avalley leachdesign complete
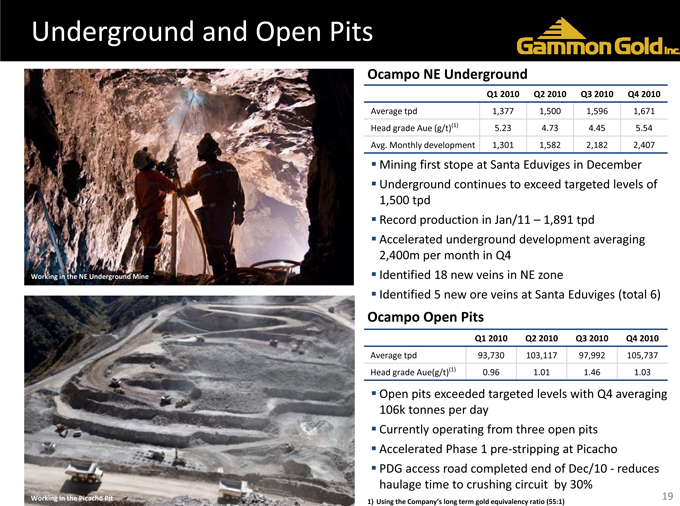
Underground and Open Pits
Ocampo NE Underground
Q1 2010 Q2 2010 Q3 2010 Q4 2010
Average tpd 1,377 1,500 1,596 1,671 Head grade Aue (g/t)(1) 5.23 4.73 4.45 5.54 Avg. Monthly development 1,301 1,582 2,182 2,407
Mining first stope at Santa Eduviges in December Underground continues to exceed targeted levels of 1,500 tpd Record production in Jan/11 – 1,891 tpd Accelerated underground development averaging 2,400m per month in Q4
Working in the NE Underground Mine Identified 18 new veins in NE zone
Identified 5 new ore veins at Santa Eduviges (total 6)
Ocampo Open Pits
Q1 2010 Q2 2010 Q3 2010 Q4 2010
Average tpd 93,730 103,117 97,992 105,737 Head grade Aue(g/t)(1) 0.96 1.01 1.46 1.03
Open pits exceeded targeted levels with Q4 averaging 106k tonnes per day Currently operating from three open pits Accelerated Phase 1 pre? stripping at Picacho PDG access road completed end of Dec/10 reduces ? haulage time to crushing circuit by 30%
Working in the Picacho Pit 19
1) Usingthe Company’s long termgold equivalency ratio(55:1)
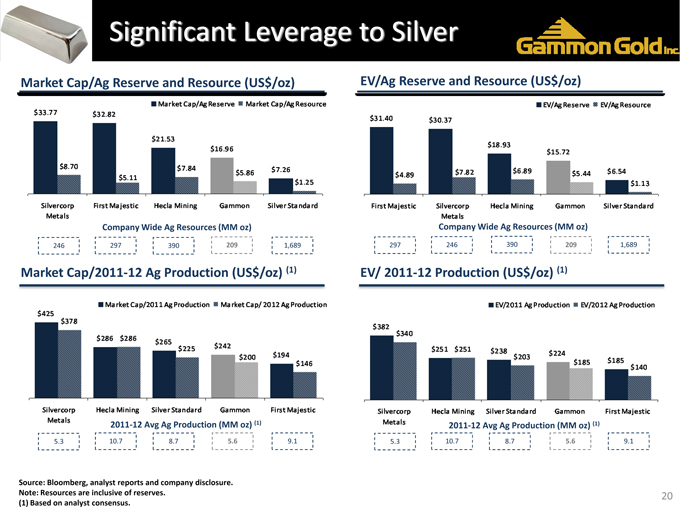
Significant Leverage to Silver
Market Cap/Ag Reserve and Resource (US$/oz) EV/Ag Reserve and Resource (US$/oz)
Company Wide Ag Resources (MM oz) Company Wide Ag Resources (MM oz)
246 297 390 209 1,689 297 246 390 209 1,689
Market Cap/2011? 12 Ag Production (US$/oz) (1) EV/ 2011? 12 Production (US$/oz) (1)
2011? 12 Avg Ag Production (MM oz) (1) 2011? 12 Avg Ag Production (MM oz) (1)
5.3 10.7 8.7 5.6 9.1 5.3 10.7 8.7 5.6 9.1
Source: Bloomberg, analyst reports and company disclosure.
Note: Resources are inclusive of reserves. 20 (1) Based on analyst consensus.
Market cap/Ag Reserve Market cap/Ag Resource
Silvercorp Metals
First Majestic
Hecla Minig Gammon
Silver Standard
Market Cap/Ag Reserve
Market Cap/Ag Resource
EV/Ag Reserve
EV/Ag Resource
Market Cap/2011 Ag Production
Market Cap/2012 Ag Production
EV/2011 Ag Production
EV/2012 Ag Production
$33.77
$8.70
$32.82 $5.11 $21.53 $7.84 $16.95 $5.86 $7.26 $1.25
$31.40 $4.89 $30.37 $7.82 $18.93 $6.89 $15.72 $5.44 $6.54 $1.13
$425 $378 $286 $286 $265 $225 $242 $200 $194 $146
$382 $340 $251 $251 $238 $203 $224 $185 $185 $140
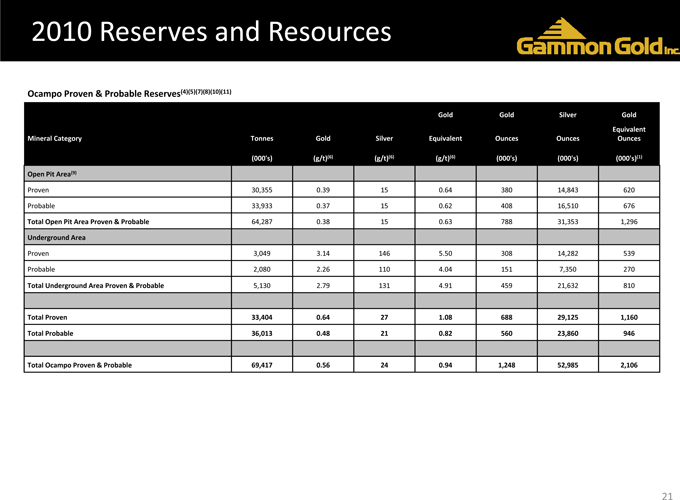
2010 Reserves and Resources
Ocampo Proven & Probable Reserves(4)(5)(7)(8)(10)(11)
Gold Gold Silver Gold
Equivalent Mineral Category Tonnes Gold Silver Equivalent Ounces Ounces Ounces
(000’s) (g/t)(6) (g/t)(6) (g/t)(6) (000’s) (000’s) (000’s)(1)
Open Pit Area(9)
Proven 30,355 0.39 15 0.64 380 14,843 620
Probable 33,933 0.37 15 0.62 408 16,510 676
Total Open Pit AreaProven & Probable 64,287 0.38 15 0.63 788 31,353 1,296
Underground Area
Proven 3,049 3.14 146 5.50 308 14,282 539
Probable 2,080 2.26 110 4.04 151 7,350 270
Total Underground Area Proven & Probable 5,130 2.79 131 4.91 459 21,632 810
Total Proven 33,404 0.64 27 1.08 688 29,125 1,160
Total Probable 36,013 0.48 21 0.82 560 23,860 946
Total Ocampo Proven & Probable 69,417 0.56 24 0.94 1,248 52,985 2,106
21
2010 Reserves and Resources
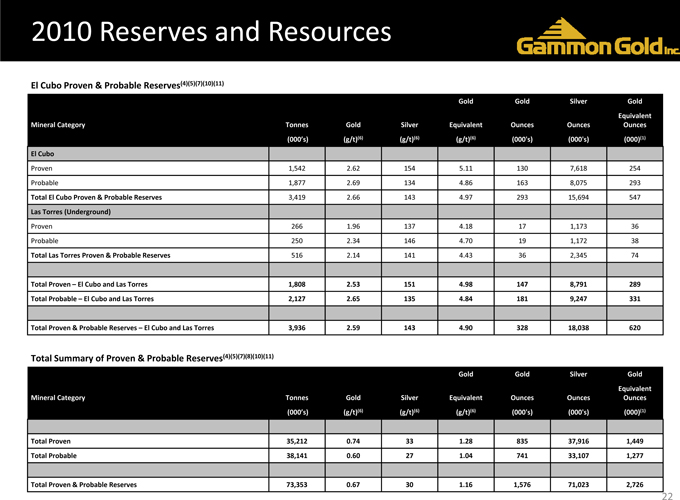
El Cubo Proven & Probable Reserves(4)(5)(7)(10)(11)
Gold Gold Silver Gold
Equivalent Mineral Category Tonnes Gold Silver Equivalent Ounces Ounces Ounces
(000’s) (g/t)(6) (g/t)(6) (g/t)(6) (000’s) (000’s) (000)(1)
El Cubo
Proven 1,542 2.62 154 5.11 130 7,618 254
Probable 1,877 2.69 134 4.86 163 8,075 293
Total El Cubo Proven & Probable Reserves 3,419 2.66 143 4.97 293 15,694 547
LasTorres (Underground)
Proven 266 1.96 137 4.18 17 1,173 36
Probable 250 2.34 146 4.70 19 1,172 38
Total Las Torres Proven & Probable Reserves 516 2.14 141 4.43 36 2,345 74
Total Proven – El Cubo and Las Torres 1,808 2.53 151 4.98 147 8,791 289
Total Probable – ElCubo andLas Torres 2,127 2.65 135 4.84 181 9,247 331
Total Proven & Probable Reserves – El Cubo and Las Torres 3,936 2.59 143 4.90 328 18,038 620
Total Summary of Proven & Probable Reserves(4)(5)(7)(8)(10)(11)
Gold Gold Silver Gold
Equivalent Mineral Category Tonnes Gold Silver Equivalent Ounces Ounces Ounces
(000’s) (g/t)(6) (g/t)(6) (g/t)(6) (000’s) (000’s) (000)(1)
Total Proven 35,212 0.74 33 1.28 835 37,916 1,449
Total Probable 38,141 0.60 27 1.04 741 33,107 1,277
Total Proven & Probable Reserves 73,353 0.67 30 1.16 1,576 71,023 2,726
22
2010 Reserves and Resources
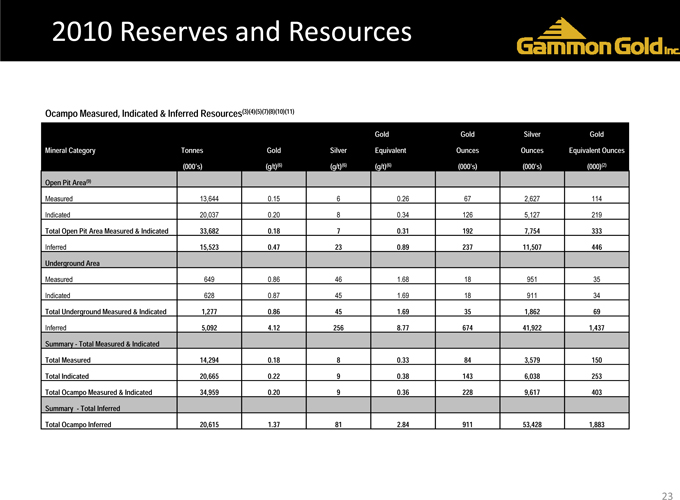
Ocampo Measured, Indicated & Inferred Resources(3)(4)(5)(7)(8)(10)(11)
Gold Gold Silver Gold Mineral Category Tonnes Gold Silver Equivalent Ounces Ounces Equivalent Ounces (000’s) (g/t)(6) (g/t)(6) (g/t)(6) (000’s) (000’s) (000)(2) Open Pit Area(9)
Measured 13,644 0.15 6 0.26 67 2,627 114
Indicated 20,037 0.20 8 0.34 126 5,127 219
Total Open Pit Area Measured & Indicated 33,682 0.18 7 0.31 192 7,754 333 Inferred 15,523 0.47 23 0.89 237 11,507 446 Underground Area
Measured 649 0.86 46 1.68 18 951 35
Indicated 628 0.87 45 1.69 18 911 34
Total Underground Measured & Indicated 1,277 0.86 45 1.69 35 1,862 69 Inferred 5,092 4.12 256 8.77 674 41,922 1,437 Summary—Total Measured & Indicated Total Measured 14,294 0.18 8 0.33 84 3,579 150 Total Indicated 20,665 0.22 9 0.38 143 6,038 253 Total Ocampo Measured & Indicated 34,959 0.20 9 0.36 228 9,617 403 Summary —Total Inferred Total Ocampo Inferred 20,615 1.37 81 2.84 911 53,428 1,883
23
2010 Reserves and Resources
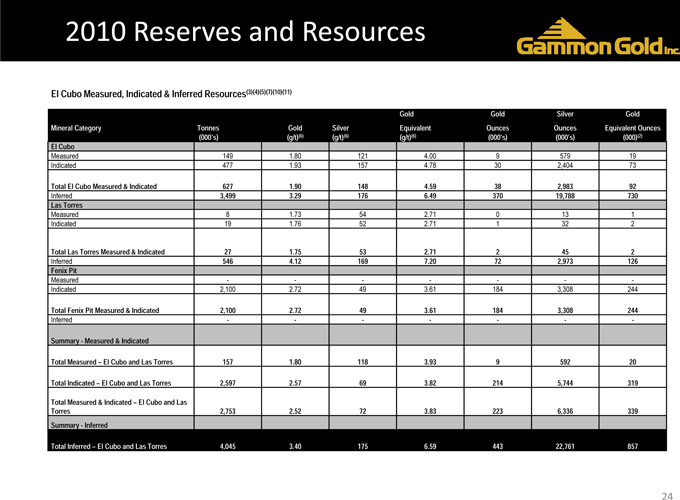
El Cubo Measured, Indicated & Inferred Resources(3)(4)(5)(7)(10)(11)
Gold Gold Silver Gold Mineral Category Tonnes Gold Silver Equivalent Ounces Ounces Equivalent Ounces (000’s) (g/t)(6) (g/t)(6) (g/t)(6) (000’s) (000’s) (000)(2) El Cubo
Measured 149 1.80 121 4.00 9 579 19 Indicated 477 1.93 157 4.78 30 2,404 73
Total El Cubo Measured & Indicated 627 1.90 148 4.59 38 2,983 92 Inferred 3,499 3.29 176 6.49 370 19,788 730 Las Torres
Measured 8 1.73 54 2.71 0 13 1 Indicated 19 1.76 52 2.71 1 32 2
Total Las Torres Measured & Indicated 27 1.75 53 2.71 2 45 2 Inferred 546 4.12 169 7.20 72 2,973 126 Fenix Pit
Measured———— -Indicated 2,100 2.72 49 3.61 184 3,308 244
Total Fenix Pit Measured & Indicated 2,100 2.72 49 3.61 184 3,308 244
Inferred———— -
Summary—Measured & Indicated
Total Measured – El Cubo and Las Torres 157 1.80 118 3.93 9 592 20
Total Indicated – El Cubo and Las Torres 2,597 2.57 69 3.82 214 5,744 319
Total Measured & Indicated – El Cubo and Las
Torres 2,753 2.52 72 3.83 223 6,336 339 Summary—Inferred
Total Inferred – El Cubo and Las Torres 4,045 3.40 175 6.59 443 22,761 857
24
2010 Reserves and Resources
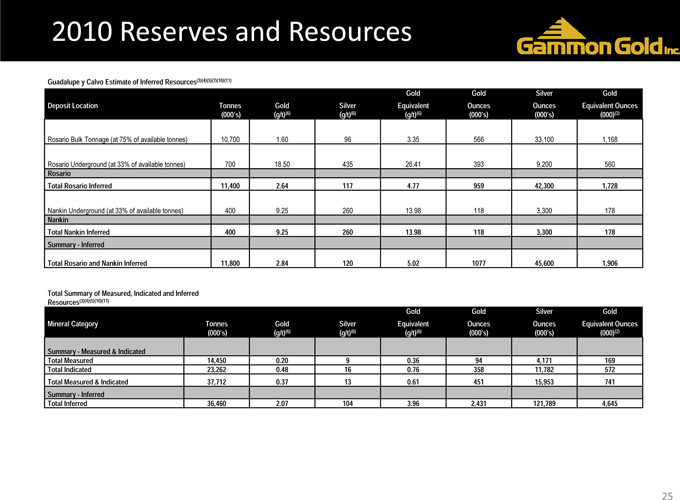
Guadalupe y Calvo Estimate of Inferred Resources(3)(4)(5)(7)(10)(11)
Gold Gold Silver Gold Deposit Location Tonnes Gold Silver Equivalent Ounces Ounces Equivalent Ounces (000’s) (g/t)(6) (g/t)(6) (g/t)(6) (000’s) (000’s) (000)(2)
Rosario Bulk Tonnage (at 75% of available tonnes) 10,700 1.60 96 3.35 566 33,100 1,168
Rosario Underground (at 33% of available tonnes) 700 18.50 435 26.41 393 9,200 560
Rosario
Total Rosario Inferred 11,400 2.64 117 4.77 959 42,300 1,728
Nankin Underground (at 33% of available tonnes) 400 9.25 260 13.98 118 3,300 178
Nankin
Total Nankin Inferred 400 9.25 260 13.98 118 3,300 178 Summary—Inferred
Total Rosario and Nankin Inferred 11,800 2.84 120 5.02 1077 45,600 1,906
Total Summary of Measured, Indicated and Inferred
Resources(3)(4)(5)(10)(11)
Gold Gold Silver Gold Mineral Category Tonnes Gold Silver Equivalent Ounces Ounces Equivalent Ounces (000’s) (g/t)(6) (g/t)(6) (g/t)(6) (000’s) (000’s) (000)(2)
Summary—Measured & Indicated
Total Measured 14,450 0.20 9 0.36 94 4,171 169 Total Indicated 23,262 0.48 16 0.76 358 11,782 572 Total Measured & Indicated 37,712 0.37 13 0.61 451 15,953 741 Summary—Inferred Total Inferred 36,460 2.07 104 3.96 2,431 121,789 4,645
25
2010 Reserves andResources (notes)
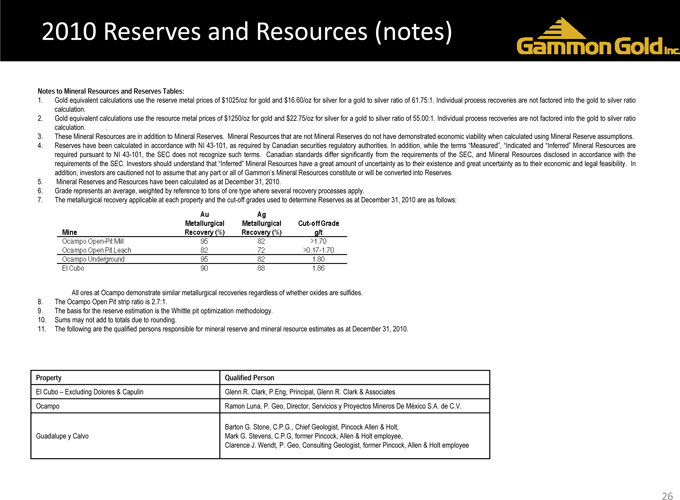
Notes to Mineral Resources and Reserves Tables:
1. Gold equivalent calculations use the reserve metal prices of $1025/oz for gold and $16.60/oz for silver for a gold to silver ratio of 61.75:1. Individual process recoveries are not factored into the gold to silver ratio calculation.
2. Gold equivalent calculations use the resource metal prices of $1250/oz for gold and $22.75/oz for silver for a gold to silver ratio of 55.00:1. Individual process recoveries are not factored into the gold to silver ratio calculation. .
3. These Mineral Resources are in addition to Mineral Reserves. Mineral Resources that are not Mineral Reserves do not have demonstrated economic viability when calculated using Mineral Reserve assumptions.
4. Reserves have been calculated in accordance with NI 43-101, as required by Canadian securities regulatory authorities. In addition, while the terms “Measured”, “Indicated and “Inferred” Mineral Resources are required pursuant to NI 43-101, the SEC does not recognize such terms. Canadian standards differ significantly from the requirements of the SEC, and Mineral Resources disclosed in accordance with the requirements of the SEC. Investors should understand that “Inferred” Mineral Resources have a great amount of uncertainty as to their existence and great uncertainty as to their economic and legal feasibility. In addition, investors are cautioned not to assume that any part or all of Gammon’s Mineral Resources constitute or will be converted into Reserves.
5. Mineral Reserves and Resources have been calculated as at December 31, 2010.
6. Grade represents an average, weighted by reference to tons of ore type where several recovery processes apply.
7. The metallurgical recovery applicable at each property and the cut-off grades used to determine Reserves as at December 31, 2010 are as follows:
All ores at Ocampo demonstrate similar metallurgical recoveries regardless of whether oxides are sulfides.
8. The Ocampo Open Pit strip ratio is 2.7:1.
9. The basis for the reserve estimation is the Whittle pit optimization methodology.
10. Sums may not add to totals due to rounding.
11. The following are the qualified persons responsible for mineral reserve and mineral resource estimates as at December 31, 2010.
Property Qualified Person
El Cubo – Excluding Dolores & Capulin Glenn R. Clark, P.Eng, Principal, Glenn R. Clark & Associates
Ocampo Ramon Luna, P. Geo, Director, Servicios y Proyectos Mineros De México S.A. de C.V.
Barton G. Stone, C.P.G., Chief Geologist, Pincock Allen & Holt, Guadalupe y Calvo Mark G. Stevens, C.P.G, former Pincock, Allen & Holt employee,
Clarence J. Wendt, P. Geo, Consulting Geologist, former Pincock, Allen & Holt employee
Mine Au Metallurgical Recovery(%) Cut-off Grade git
Ocampo Open-Pit Mill 95 82 >1.70
Ocampo Open-Pit Leach 82 72 >0.17-1.70
Ocampo Underground 95 82 1.80
EI Cubo 90 88 1.86
26