Exhibit 99.1

RBC Capital Markets
Financial Institutions Conference
September 19, 2003

FORWARD-LOOKING STATEMENTS
This news release contains certain forward-looking statements that are included pursuant to the safe harbor
provisions of the Private Securities Litigation Reform Act of 1995. Such information involves risks and
uncertainties that could result in the Company’s actual results differing from those projected in the forward-
looking statements. Important factors that could cause actual results to differ materially from those discussed in
such forward-looking statements include, but are not limited to, (1) the Company may incur additional loan loss
provision due to negative credit quality trends in the future that may lead to a deterioration of asset quality, or
conversely, the Company may incur less, or even negative, loan loss provision due to positive credit quality trends
in the future; (2) the Company may not continue to experience significant recoveries of previously charged-off
loans and the Company may incur increased charge-offs in the future; (3) the Company may experience
increases in the default rates on its retained interests in securitized mortgages causing it to take impairment
charges to earnings; (4) the Company may not realize the expected cash payments that it is presently accruing
from its retained interests in securitized mortgages; (5) the Company may experience either faster or slower rates
of amortization of its retained interests and loans previously securitized; (6) the Company could have adverse
legal actions of a material nature; (7) the Company may face competitive loss of customers associated with its
efforts to increase fee-based revenues; (8) the Company may be unable to maintain or improve upon current
levels of expense associated with managing its business; (9) rulings affecting, among other things, the Company's
and its banking subsidiaries' regulatory capital and required loan loss allocations may change, resulting in the
need for increased capital levels; (10) changes in the interest rate environment may have results on the
Company's operations materially different from those anticipated by the Company's market risk management
functions; (11) changes in general economic conditions and increased competition could adversely affect the
Company's operating results; (12) changes in other regulations and government policies affecting bank holding
companies and their subsidiaries, including changes in monetary policies, could negatively impact the Company's
operating results; (13) the planned purchase of Trust I and Trust II Capital Securities and the common stock may
not occur or may not have the effects anticipated; and (14) the Company may experience difficulties growing loan
and deposit balances. Forward-looking statements made herein reflect management’s expectations as of the date
such statements are made. Such information is provided to assist stockholders and potential investors in
understanding current and anticipated financial operations of the Company and is included pursuant to the safe
harbor provisions of the Private Securities Litigation Reform Act of 1995. The Company undertakes no obligation
to update any forward-looking statement to reflect events or circumstances that arise after the date
such statements are made.

$2.0 Billion Commercial Bank
headquartered in Charleston WV
55 Banking Offices
150,000 households; 275,000 accounts
16,636,000 common shares outstanding
$580 million market capitalization*
*As of 9/11/03

Prior History
Net loss of $54.4 million or $3.81 per share for
2000 & 2001
Formal Agreements with OCC and Federal
Reserve
$130 million in “problem loans”
Stock trading at $5.125 per share from a high of
$45 per share
Discontinued common share cash dividends and
deferred trust preferred dividends

Turnaround
2002
Net income $32.5 million or $1.90 per share with
ROA of 1.59% and ROE of 20.54%
Terminated Formal Agreements with OCC and
Federal Reserve
Fully restored common dividends to their historic
high and resumed Trust Preferred dividends
2003 (1st half)
Net income $21.5 million or $1.27 per share with
ROA of 2.16% and ROE of 25.16%

High Performance
7th best performing, publicly traded stock of 2002
by the Bloomberg 100 annual index
1st of all USA banks and 4th best of all US publicly
traded companies over the prior two years with
appreciation of 391%
37% improvement in share value since last year’s
RBC conference
*The “Bloomberg 100” lists the top 100 companies by total return for the period of November 2, 2001, to
November 1, 2002. Companies with share prices under $5 and market capitalization below $100 million were
excluded.

CHCO’s Value Proposition
Proven management team focused on
delivering shareholder value
Low risk/High returns
Highly visible near-term opportunities

CHCO’s Business Model
We are a retail bank
We focus on core deposit gathering
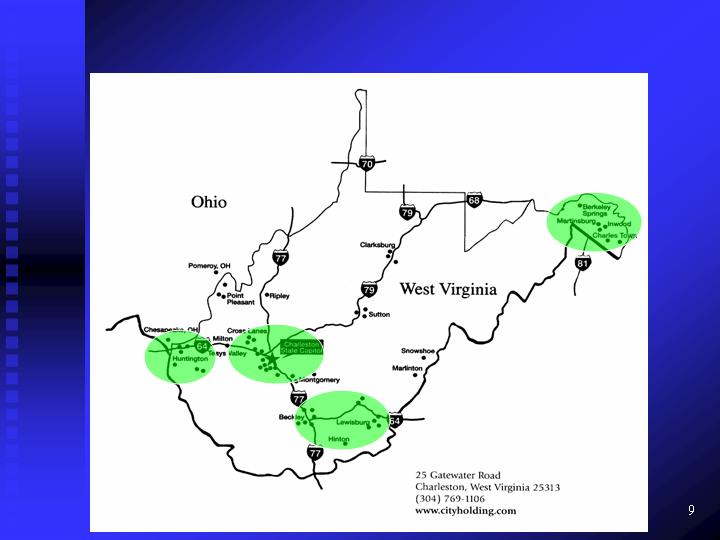
Key Markets

Key Markets
12% Market Share
in WV’s 2nd largest market
8% Market Share in DC suburbs
WV’s fastest growing market
30% Market Share
11% Market Share
in WV’s largest market

City National Bank
Customer Profile
Source: Internal data as of June 30, 2003
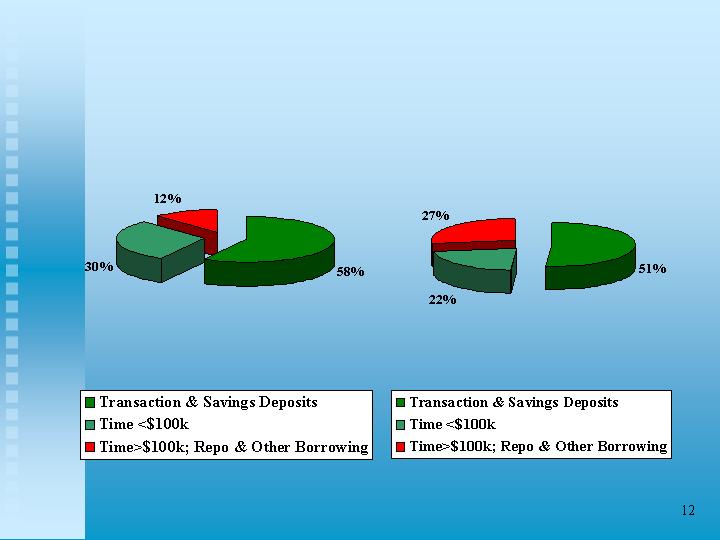
High Quality and Stable Funding Source
As of June 30, 2003
*$1-3 billion peer group as compiled by the FFIEC in their Uniform Bank Performance Reports
Peer Group*
City Holding Company

Conservative Loan Portfolio Mix
City Holding Company
Peer Group*
Loan to Core Deposits 78.7%
Loan to Core Deposits 99.9%
As of June 30, 2003
*$1-3 billion peer group as compiled by the FFIEC in their Uniform Bank Performance Reports

Real Estate Based Lending Focus
As of June 30, 2003
Other Loans
15.5%
Real Estate Secured Loans
84.5%

The Investment Portfolio represents 28% of
the bank’s total assets and are predominately
unpledged
The Company is unleveraged:
Only $15MM in FHLB advances
CD’s and Repo’s fund 9% of assets, half
of which are in accounts less than $250M
Strong Liquidity

Immediate Basis Estimated Increase or
Point Change in Decrease in Net
Interest Rates Income over 1 year
+300 Bp +12%
+100 Bp + 6%
- 50 Bp - 2%
Limited Interest Rate Risk
As of 6/30/03
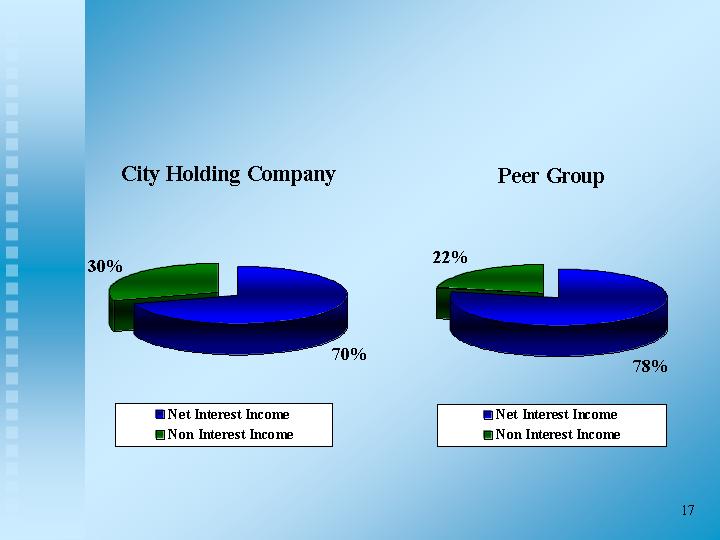
Favorable Revenue Profile
As of June 30, 2003
*$1-3 billion peer group as compiled by the FFIEC in their Uniform Bank Performance Reports
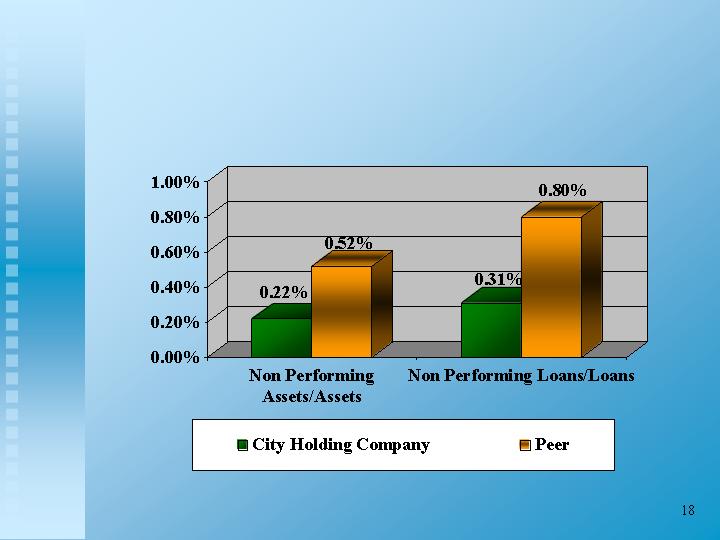
Strong Loan Quality
*$1-3 billion peer group as compiled by the FFIEC in their Uniform Bank Performance Reports 3/31/03
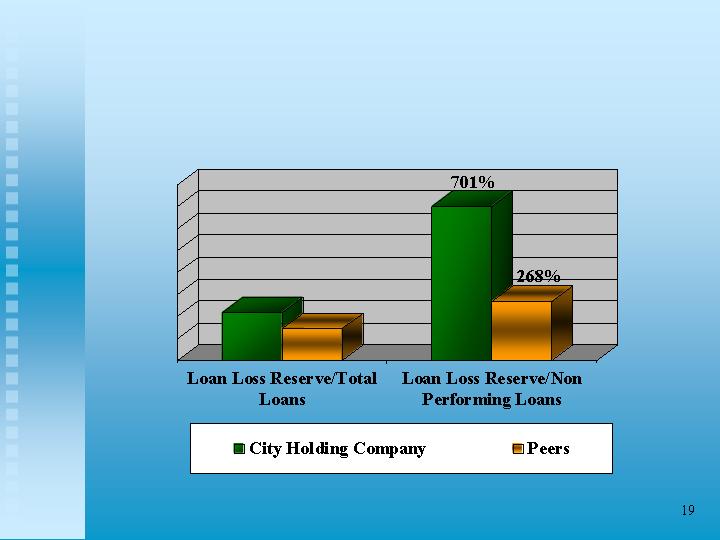
Strong Loan Loss Reserve
*$1-3 billion peer group as compiled by the FFIEC in their Uniform Bank Performance Reports 3/31/03
2.18%
1.45%

Net Charge-Offs/Opportunity?
The Company recorded a negative provision of
$3.3 million in Q2 2003
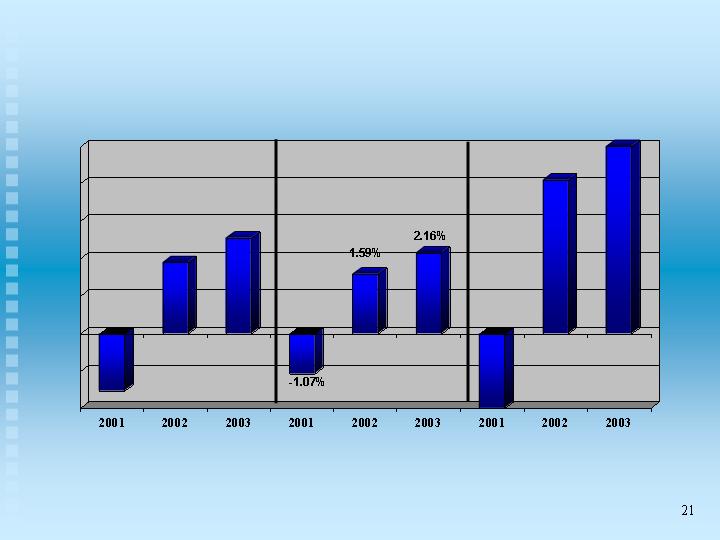
Performance Measures
2003 is 6/30/03 YTD annualized.
EPS (diluted)
ROA
ROE
-16.8%
20.5%
25.2%
-$1.54
$1.90
$2.54

While City Holding Company has benefited from low and
negative provision expense and from a high accrual rate on
its retained interests, in the absence of these factors CHCO
would still demonstrate:
high and growing profitability
strong and stable net interest margins
high operational efficiency
strong and rapidly growing equity capital
Strong Core Performance
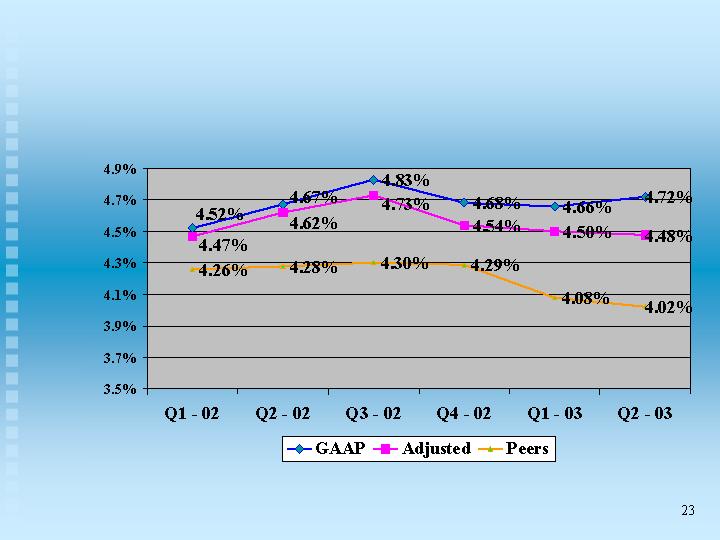
Adjusted Net Interest Margin
Net interest margin adjusted by subtracting interest income on Retained Interests
and adding interest expense on an equivalent amount of Trust Preferred Debt used to fund the assets.

Performance Objectives
Maintain well-capitalized
status
Capital
1.50%
ROA
20%
ROE
10%
Earnings Per Share
Growth

Why Should You Own Our Stock?
Proven management team focused on
delivering shareholder value
Performance-based incentive plans
Value-vested stock options
Improved City’s shareholder value by 507%
since January 2001

Why Should You Own Our Stock?
Low Risk/High Returns
Fortress Balance Sheet
Pristine Loan Quality
High Liquidity
Strongly Capitalized
Retail Core Funded
Not reliant on Mortgage Banking Revenues

Why Should You Own Our Stock?
Highly visible near-term opportunities
$57.5 million of 9.125% Trust Preferred
callable on 10/31/2003
Potential low or negative loan loss provision in
future periods

Questions?