
Freidman Billings Ramsey Financial Institutions Conference December 2003
FORWARD-LOOKING STATEMENTS 2 Such information involves the default rates on its retained charges to earnings; (4) the Company Company could have adverse legal actions changes in the interest rate environment Forward-looking statements This news release contains certain forward-looking statements that are included pursuant to the safe harbor provisions of the Private Securities Litigation Reform Act of 1995.risks and uncertainties that could result in the Company’s actual results differing from those projected in the forward-looking statements. Important factors that could cause actual results to differ materially from those discussed in such forward-looking statements include, but are not limited to, (1) the Company may incur additional loan loss provision due to negative credit quality trends in the future that may lead to a deterioration of asset quality, or conversely, the Company may incur less, or even negative, loan loss provision due to positive credit quality trends in the future; (2) the Company may not continue to experience significant recoveries of previously charged-off loans and the Company may incur increased the Company may experience increases in its retained interests and loans previously securitized; (6) theof a material nature; (7) the Company may face competitive loss of customers associated with its efforts to increase fee-based revenues; (8) the Company may be unable to maintain or improve upon current levels of expense associated with managing its business; (9) rulings affecting, among other things, the Company’s and its banking subsidiaries’ regulatory capital and required loan loss allocations may change, resulting in the need for increased capital levels; (10)may have results on the Company’s operations materially different from those anticipated by the Company’s market risk management functions; (11) changes in general economic conditions and increased competition could adversely affect the Company’s operating results; (12) changes in other regulations and government policies affecting bank holding companies and their subsidiaries, including changes in monetary policies, could negatively impact the Company’s operating results; (13) the Company may experience difficulties growing loan and deposit balances.made herein reflect management’s expectations as of the date such statements are made. Such information is provided to assist stockholders and potential investors in understanding current and anticipated financial operations of the Company and is included pursuant to the safe harbor provisions of charge-offs in the future; (3)interests in securitized mortgages causing it to take impairmentmay not realize the expected cash payments that it is presently accruing from its retained interests in securitized mortgages; (5) the Company may experience either faster or slower rates of amortization of the Private Securities Litigation Reform Act of 1995. The Company undertakes no obligation to update any forward-looking statement to reflect events or circumstances that arise after the date such statements are made.
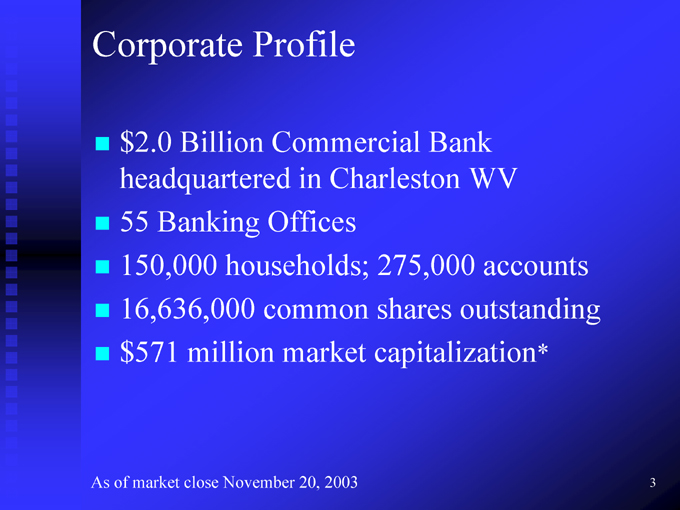
• 3 • accounts * WV outstanding Bank 275,000 Charleston shares capitalization • 2003 • Profile Commercial in Offices households; common market 20, • million November • Billion Banking close $2.0 headquartered 55 150,000 16,636,000 $571 market • of • Corporate . . . . As
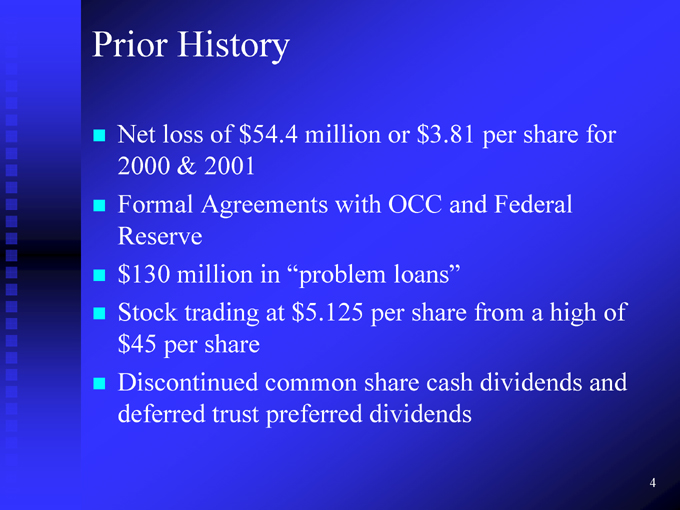
• 4 • for of and high share Federal a per from dividends $3.81 and cash OCC loans” share or per share dividends million with “problem $5.125 $54.4 in at common preferred History of 2001 Agreements trading share trust loss & million per Discontinued Net 2000 Formal Reserve $130 Stock $45 deferred • Prior . . . .

• 5 • Jun-02 • Mar-02 • President Dec-01 1/31/01 President -Dayton—President Turnaround Sep-01 CEO Lima Indianapolis Bank, Bank, Regional of the Jun-01 becomes banking City—Bank in National One Mar-01 Francis years First National Metropolitan Bank Peoples • . . . . • Jerry . • Managing 1 0 Dec-00 .
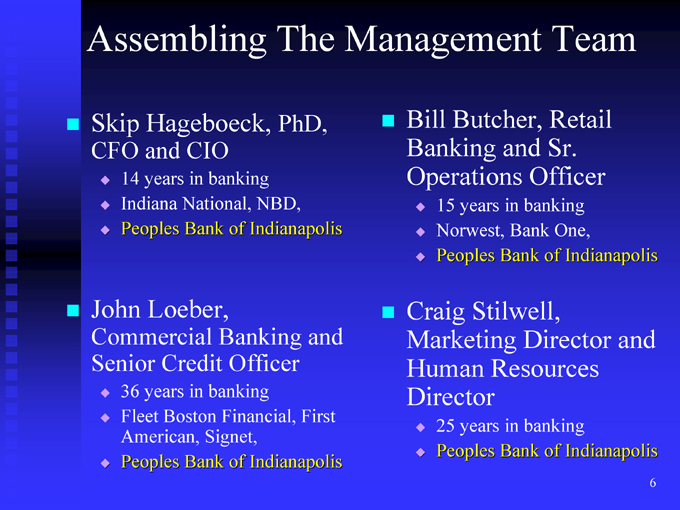
Assembling The Management Team • PhD, NBD, Indianapolis banking of Hageboeck, CIO in National, Bank and years Peoples • Indiana • Skip CFO . . • . • Retail One, Indianapolis • Sr. Officer banking of • and in Bank Bank Butcher, years Norwest, Peoples 15 • Bill Banking Operations . . • . • and First Indianapolis Banking Officer banking Financial, Signet, of Loeber, Credit in Boston Bank years American, Peoples • Fleet • John Commercial Senior . . • . • and Indianapolis 6 Director banking of • Stilwell, Resources in Bank • years Peoples 25 • Craig Marketing Human Director . • .
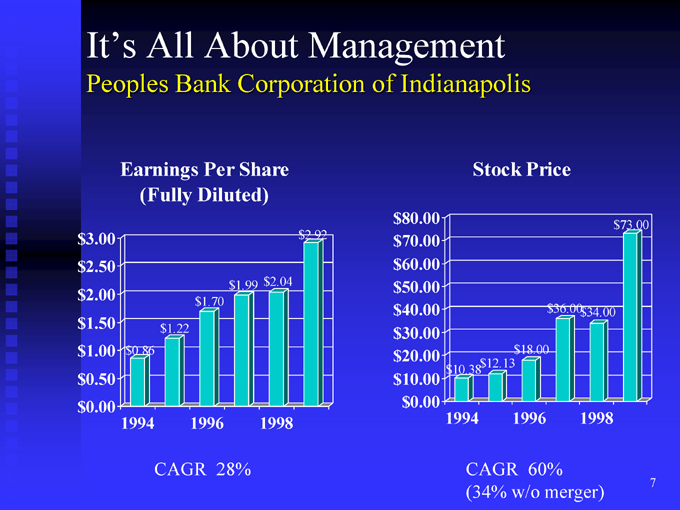
It’s All About Management Peoples Bank Corporation of Indianapolis $2.92 $2.04 1998 $1.99 28% $1.70 1996 (Fully Diluted) $1.22 CAGR Earnings Per Share $0.86 1994 $3.00 $2.50 $2.00 $1.50 $1.00 $0.50 $0.00 7 $73.00 $34.00 1998 $36.00 $18.00 1996 60% Stock Price $12.13 CAGR (34% w/o merger) $10.38 1994 $80.00 $70.00 $60.00 $50.00 $40.00 $30.00 $20.00 $10.00 $0.00
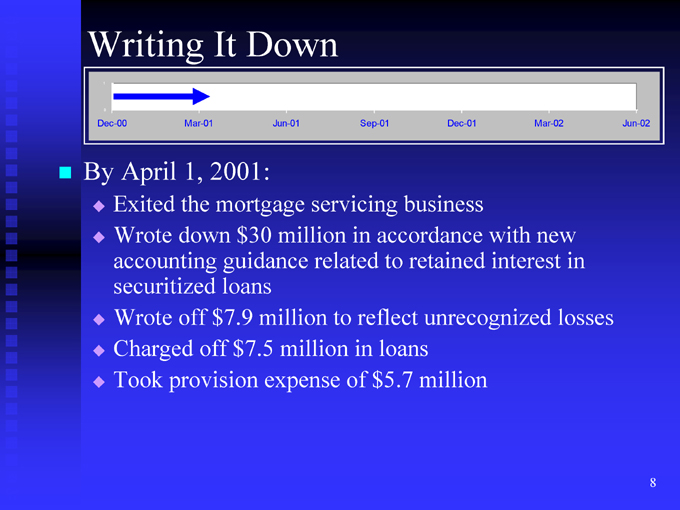
• Jun-02 • new in losses Mar-02 interest with Dec-01 business retained unrecognized million accordance to loans $5.7 Sep-01 in reflect in of servicing million related to million Down Jun-01 million expense mortgage $30 guidance loans $7.5 It 2001: $7.9 off Mar-01 1, the down off provision April Exited Wrote accounting securitized Wrote Charged Took • Writing 1 0 Dec-00 By . . . . • .
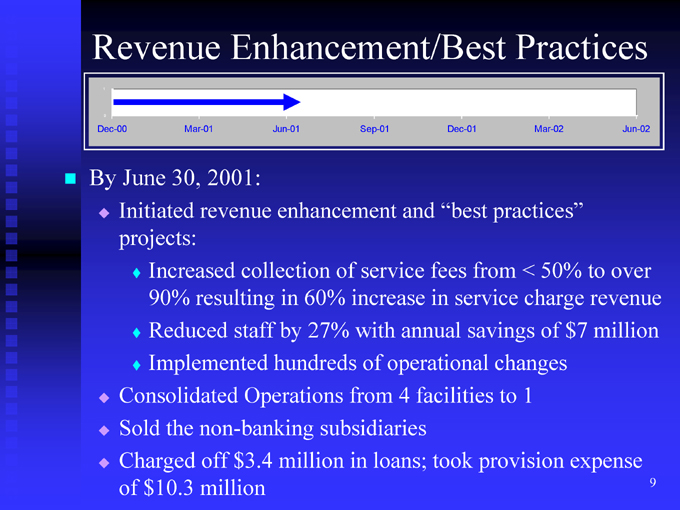
• 9 • Jun-02 over revenue million to expense $7 Mar-02 50% charge of • Practices < 1 • practices” from service savings changes to provision Dec-01 “best took fees in facilities and annual operational 4 loans; Sep-01 service increase with of from in of 60% 27% subsidiaries Jun-01 enhancement collection in by hundreds Operations million • Enhancement/Best 2001: staff $3.4 • revenue resulting non-banking off million • Mar-01 30, • Increased 90% Reduced Implemented the $10.3 • June . . • Initiated projects: Consolidated Sold Charged of • Revenue 1 0 Dec-00 By . . . . • .
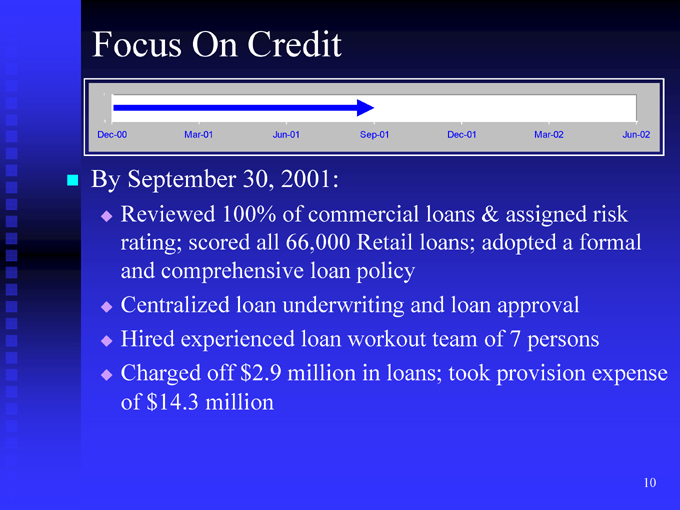
• Jun-02 10 • risk formal expense a Mar-02 persons assigned approval 7 provision & adopted of Dec-01 loans loans; loan team took and loans; Sep-01 Retail policy workout in commercial 66,000 loan underwriting loan million • Jun-01 2001: of • Credit 30, 100% all loan $2.9 On scored off million Mar-01 September comprehensive experienced $14.3 Reviewed rating; and Centralized Hired Charged of • Focus 1 0 Dec-00 By . . . • .
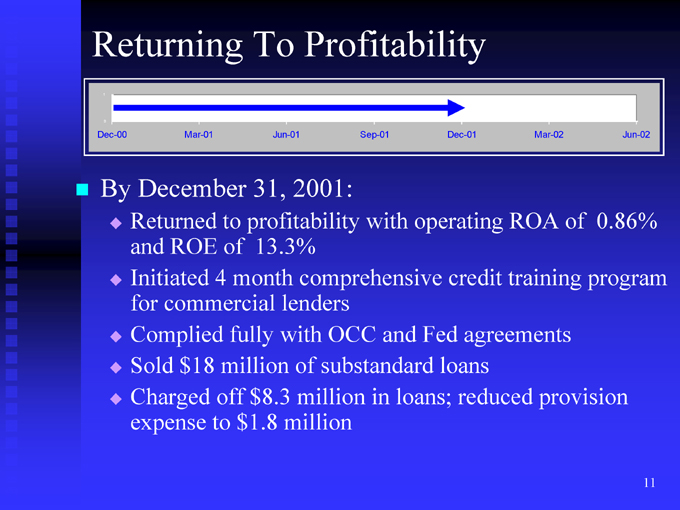
• Jun-02 0.86% program 11 of provision Mar-02 ROA training agreements Dec-01 credit loans reduced operating Fed loans; and • Sep-01 with in • Profitability comprehensive OCC substandard million 2001: lenders with of million • Jun-01 13.3% • To 31, profitability month fully $8.3 $1.8 to of million off 4 to Mar-01 December ROE commercial Complied $18 Charged expense Returned and Initiated for Sold • . . . • Returning 1 0 Dec-00 By • .
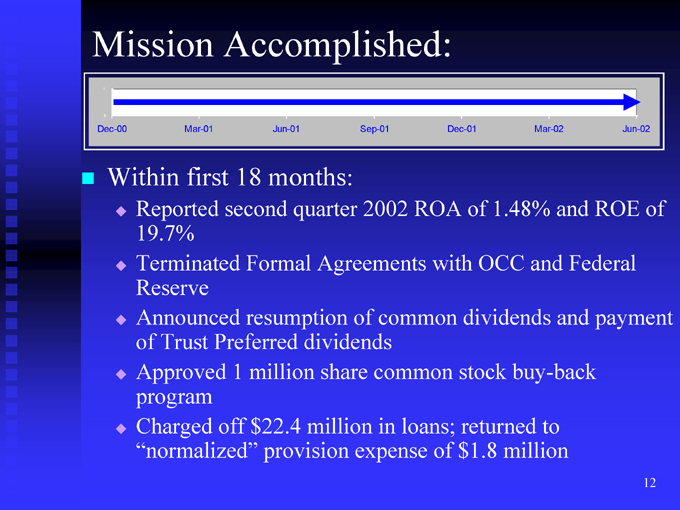
• of 12 Jun-02 ROE Federal payment and and Mar-02 and buy-back to million 1.48% OCC • Dec-01 of dividends stock returned $1.8 ROA with common loans; of Sep-01 2002 common in expense of : quarter Agreements dividends share million Jun-01 months Formal resumption million $22.4 provision • Accomplished: 18 second 1 • Preferred off Mar-01 first Trust Approved Charged Reported 19.7% Terminated Reserve Announced of program “normalized” • Within . . . . • Mission 1 0 Dec-00 • .
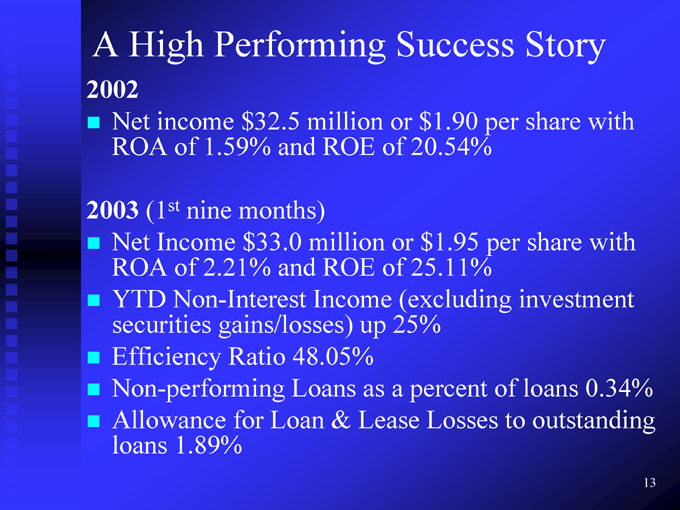
• 13 • with with 0.34% outstanding Story share share investment loans per per of to Success $1.9020.54% $1.9525.11% (excluding percent Losses orof orof 25% a up as Lease millionROE millionROE Income 48.05% Loans & $32.5and months) $33.0and Loan Performing 1.59% 2.21% gains/losses) Ratio for nine of of Non-Interest 1.89% income st Income High ROA (1 ROA YTDsecurities Non-performing Allowanceloans Net Net Efficiency • A 2002 . 2003 . . . .
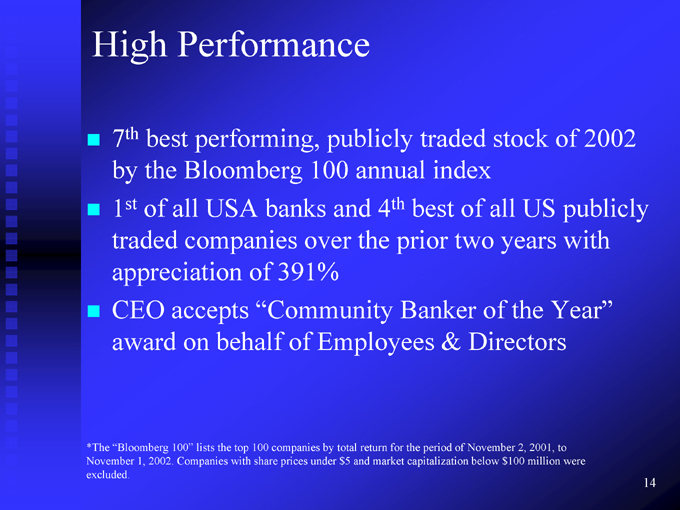
• 14 • 2002 publicly with were of Year” to • US 2001, million • stock years the 2, $100 all of • of Directors November below • index two & of • traded best period capitalization • prior Banker the • th for annual 4 the return market and • publicly and total $5 100 over Employees by under banks 391% “Community of companies prices • of 100 share top with • USA behalf the Performance performing, Bloomberg companies on lists Companies all accepts 100” best the of 2002. • 1, • th by st traded appreciation CEO award “Bloomberg • High 7 1 November excluded. • . *The
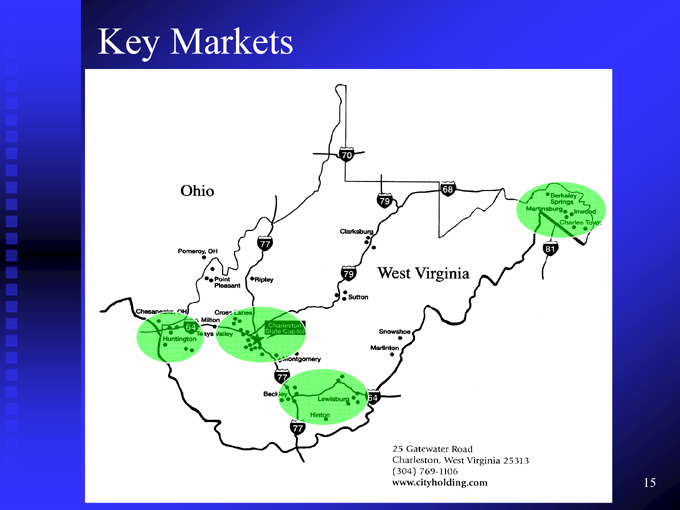
15 Key Markets
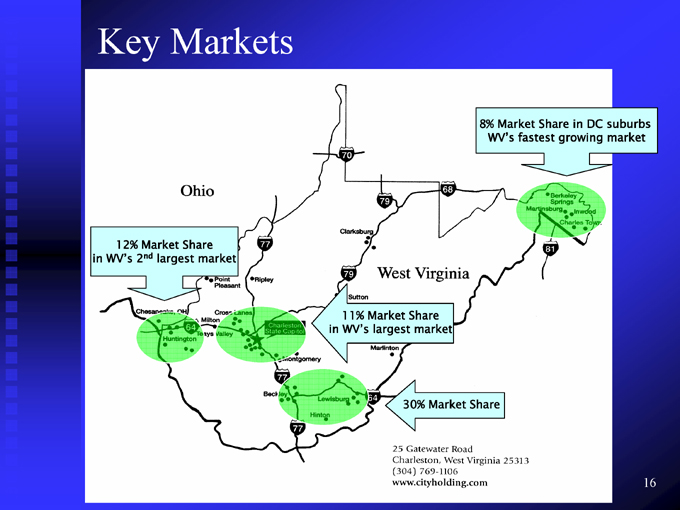
16 8% Market Share in DC suburbs WV’s fastest growing market 30% Market Share 11% Market Sharein WV’s largest market largest market Key Markets 12% Market Sharend in WV’s 2
Value Proposition Proven management team focused on delivering shareholder value Low risk/High returns Highly visible near-term opportunities CHCO’s 17

18 gathering Business Model retail bank core deposit CHCO’s We are a We focus on
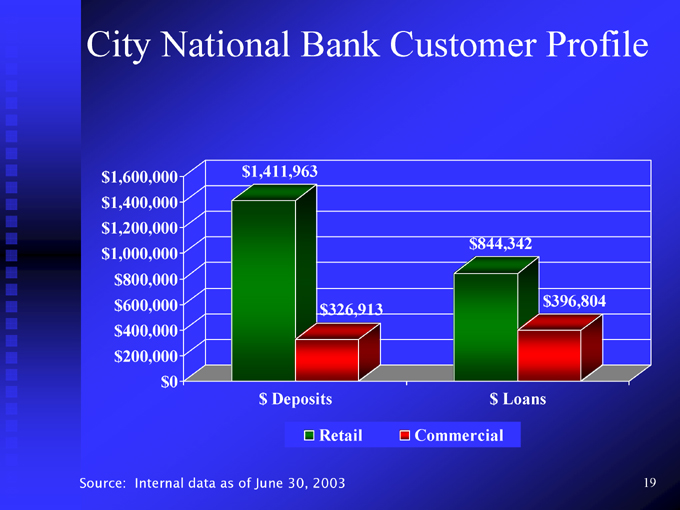
19 $396,804 $844,342 $ Loans Commercial $326,913 Retail $1,411,963 $ Deposits City National Bank Customer Profile $1,600,000 $1,400,000 $1,200,000 $1,000,000 $800,000 $600,000 $400,000 $200,000 $0 Internal data as of June 30, 2003 Source:
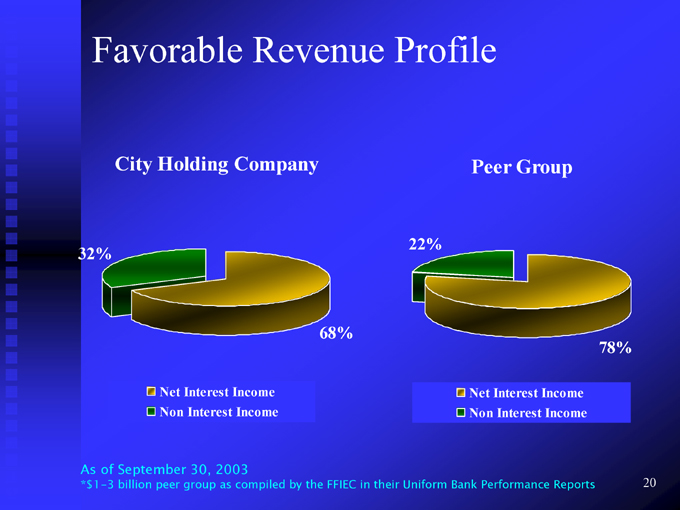
Favorable Revenue Profile 68% City Holding Company Net Interest Income Non Interest Income 32% 78% Peer Group Net Interest Income Non Interest Income 22%
20 As of September 30, 2003*$1-3 billion peer group as compiled by the FFIEC in their Uniform Bank Performance Reports
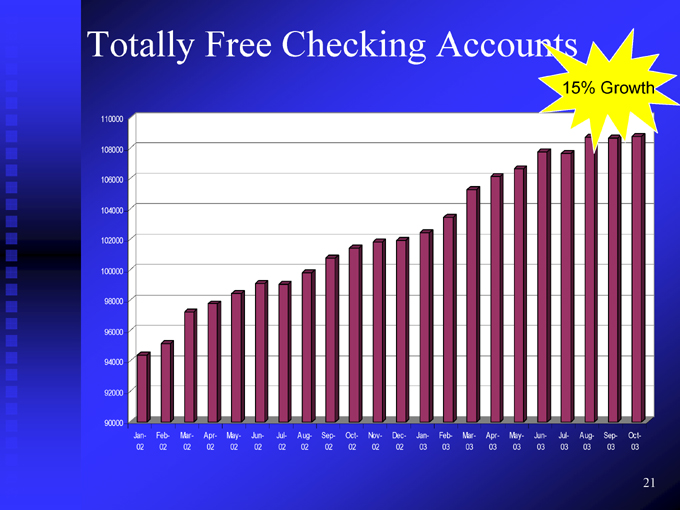
21 Oct- 03 Sep- 03 15% Growth Aug- 03 Jul- 03 Jun- 03 May- 03 Apr- 03 Mar- 03 Feb- 03 Jan- 03 Dec- 02 Nov- 02 Oct- 02 Sep- 02 Aug- 02 Jul- 02 Jun- 02 May- 02 Apr- 02 Mar- 02 Feb- 02 Jan- 02 Totally Free Checking Accounts 110000 108000 106000 104000 102000 100000 98000 96000 94000 92000 90000
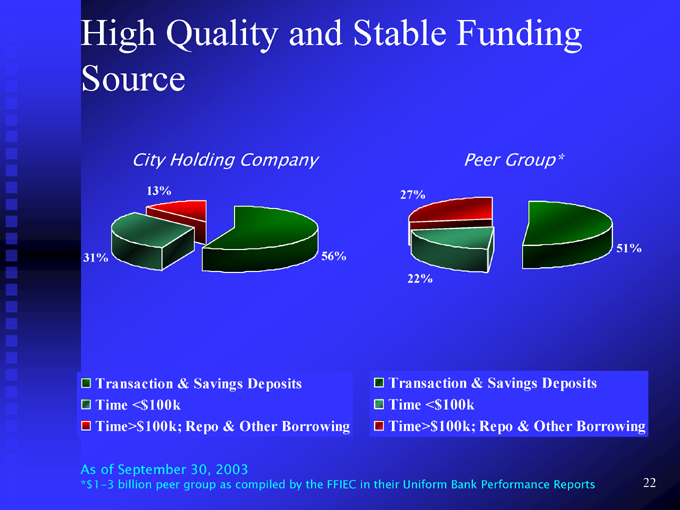
High Quality and Stable Funding Source 56% City Holding Company 13% 31% 51% Peer Group* 27% 22% Transaction & Savings Deposits Time <$100k Time>$100k; Repo & Other Borrowing Transaction & Savings Deposits Time <$100k Time>$100k; Repo & Other Borrowing 22 As of September 30, 2003*$1-3 billion peer group as compiled by the FFIEC in their Uniform Bank Performance Reports
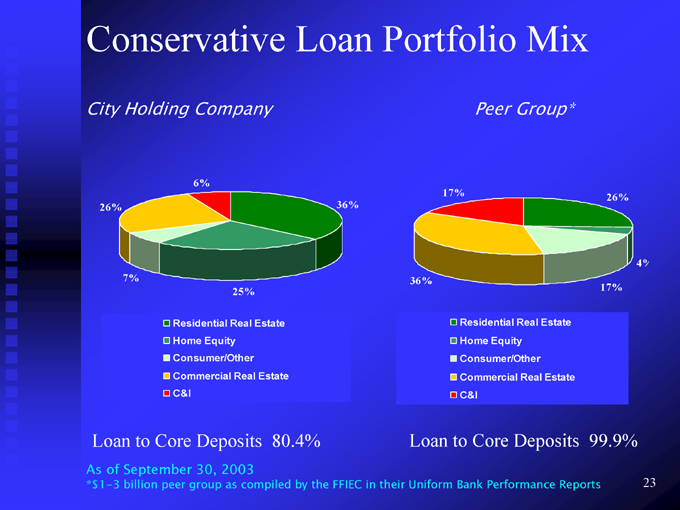
Conservative Loan Portfolio Mix 36% 25% 6% Commercial Real Estate Residential Real Estate Home Equity Consumer/Other C&I 7% City Holding Company 26% 4% 26% 17% Peer Group* Commercial Real Estate Residential Real Estate Home Equity Consumer/Other C&I 17% 36% 23 99.9% Loan to Core Deposits 80.4% Loan to Core Deposits As of September 30, 2003*$1-3 billion peer group as compiled by the FFIEC in their Uniform Bank Performance Reports
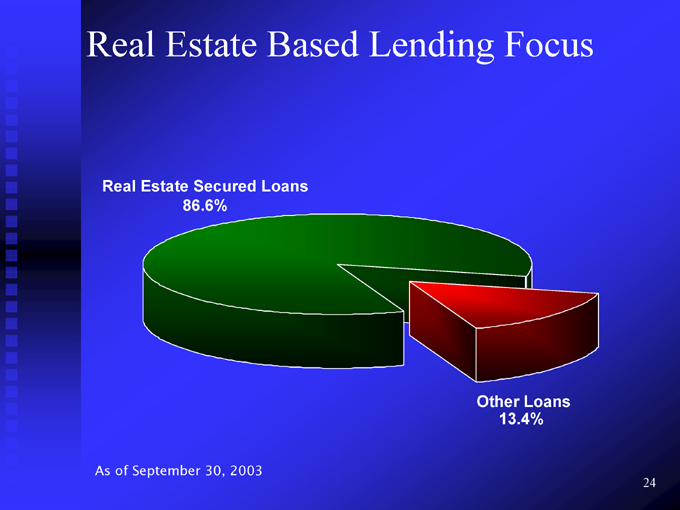
Real Estate Based Lending Focus 24 Other Loans 13.4% Real Estate Secured Loans 86.6% As of September 30, 2003
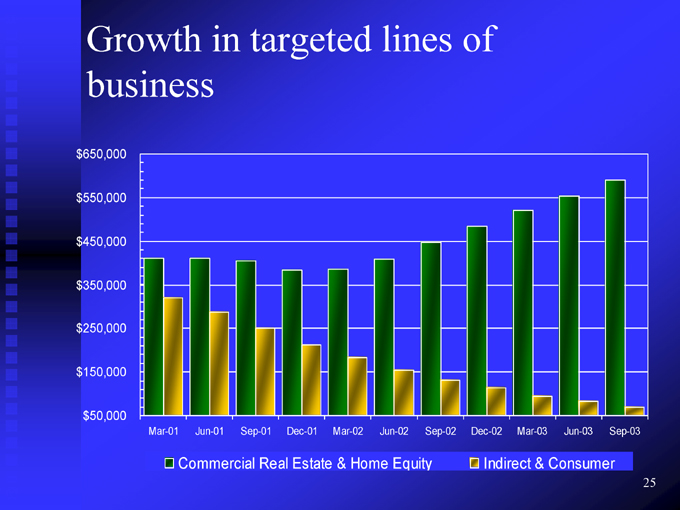
25 Sep-03 Jun-03 Mar-03 Indirect & Consumer Dec-02 Sep-02 Jun-02 Mar-02 Dec-01 Sep-01 Jun-01 Commercial Real Estate & Home Equity Growth in targeted lines of business Mar-01 $650,000 $550,000 $450,000 $350,000 $250,000 $150,000 $50,000
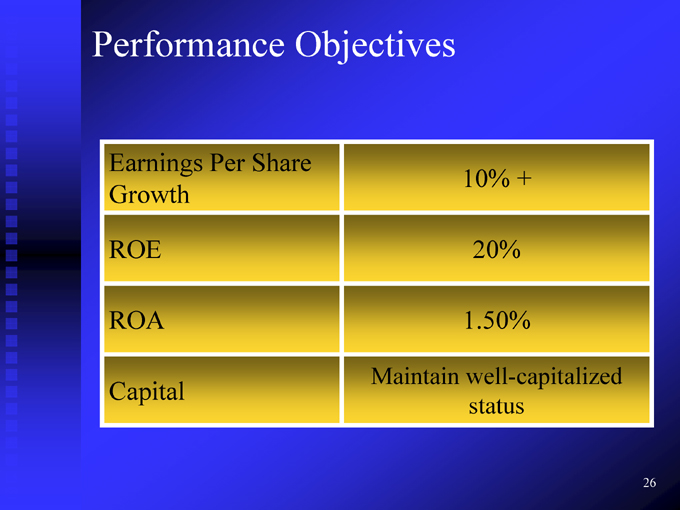
26 10% + 20% 1.50% Maintain well-capitalized status Performance Objectives Earnings Per Share Growth ROE ROA Capital
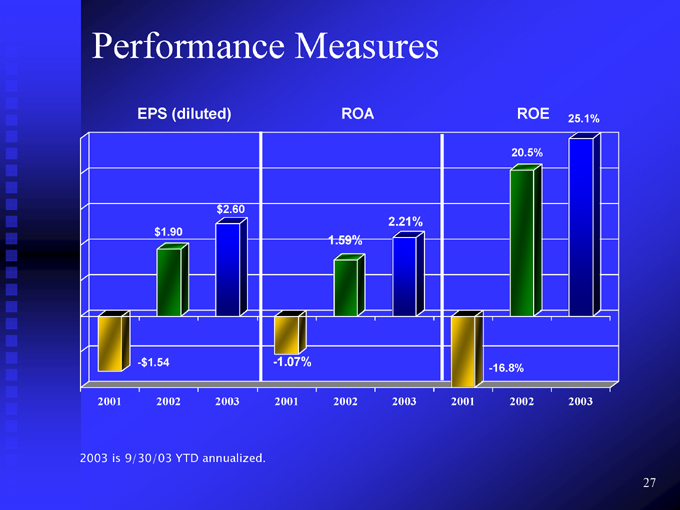
27 25.1% 2003 ROE 20.5% 2002 -16.8% 2001 2.21% 2003 ROA 1.59% 2002 -1.07% 2001 $2.60 2003 $1.90 2002 EPS (diluted) -$1.54 Performance Measures 2001 2003 is 9/30/03 YTD annualized.
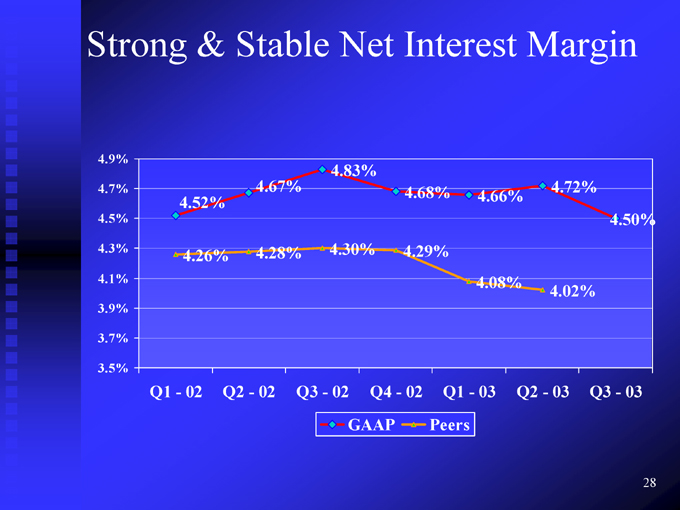
4.50% 28 Q3—03 4.72% 4.02% Q2—03 4.66% 4.08% Q1—03 Peers 4.68% 4.29% Q4—02 GAAP 4.83% 4.30% Q3—02 4.67% 4.28% Q2—02 4.52% 4.26% Q1—02 Strong & Stable Net Interest Margin 4.9% 4.7% 4.5% 4.3% 4.1% 3.9% 3.7% 3.5%
29 Strong Core Performance While City Holding Company has benefited from low and negative provision expense and from a high accrual rate on its retained interests, in the absence of these factors CHCO would still demonstrate: high and growing profitability strong and stable net interest margins high operational efficiency strong and rapidly growing equity capital
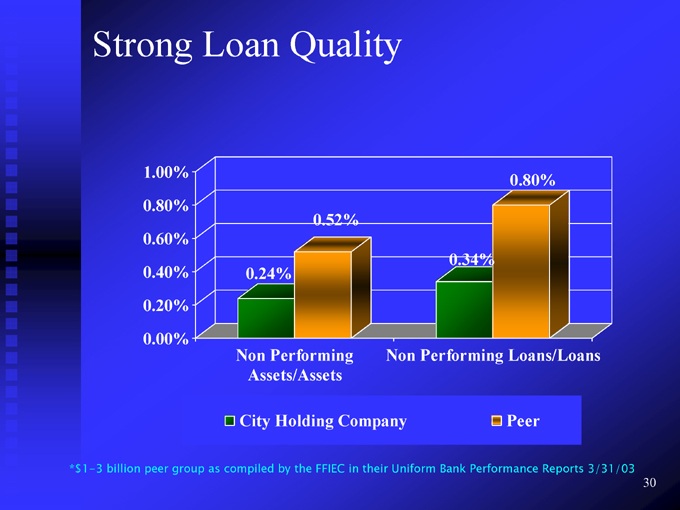
30 0.80% Peer 0.34% Non Performing Loans/Loans 0.52% Assets/Assets 0.24% Non Performing City Holding Company Strong Loan Quality 1.00% 0.80% 0.60% 0.40% 0.20% 0.00% *$1-3 billion peer group as compiled by the FFIEC in their Uniform Bank Performance Reports 3/31/03
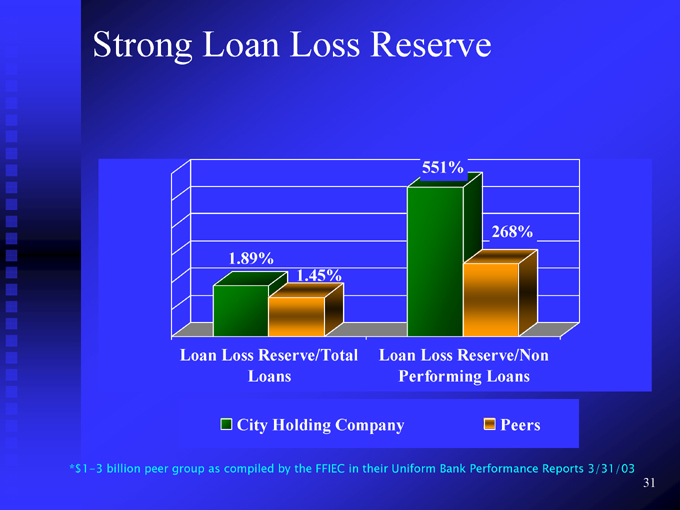
31 268% Peers 551% Loan Loss Reserve/Non Performing Loans 1.45% Strong Loan Loss Reserve 1.89% Loan Loss Reserve/Total Loans City Holding Company *$1-3 billion peer group as compiled by the FFIEC in their Uniform Bank Performance Reports 3/31/03
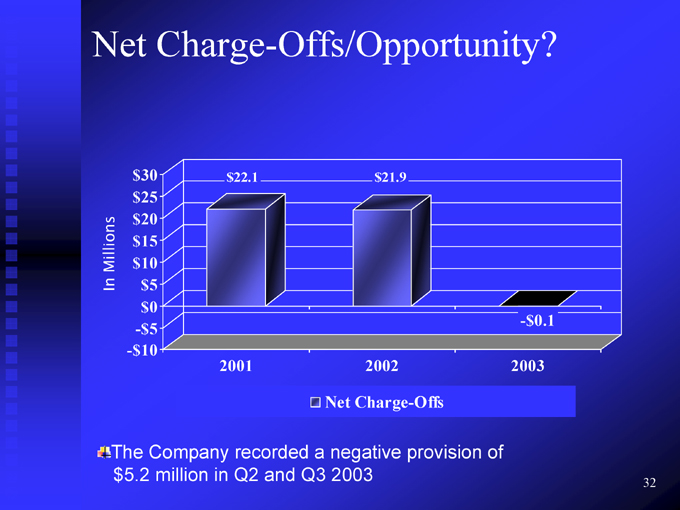
32 -$0.1 2003 $21.9 2002 Net Charge-Offs $22.1 2001 $30 $25 $20 $15 $10 $5 $0 -$5 -$10 The Company recorded a negative provision of $5.2 million in Q2 and Q3 2003 Net Charge-Offs/Opportunity? Millions In
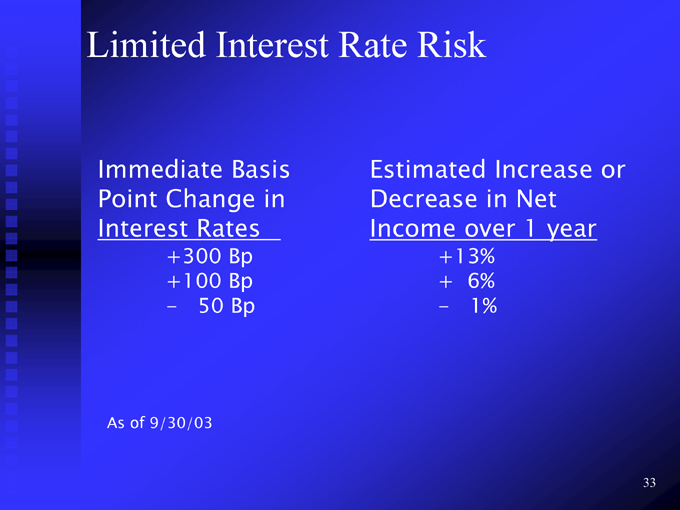
33 6% 1% Estimated Increase orDecrease in Net Income over 1 year +13%+- +300 Bp+100 Bp50 Bp Limited Interest Rate Risk Immediate BasisPoint Change inInterest Rates—As of 9/30/03
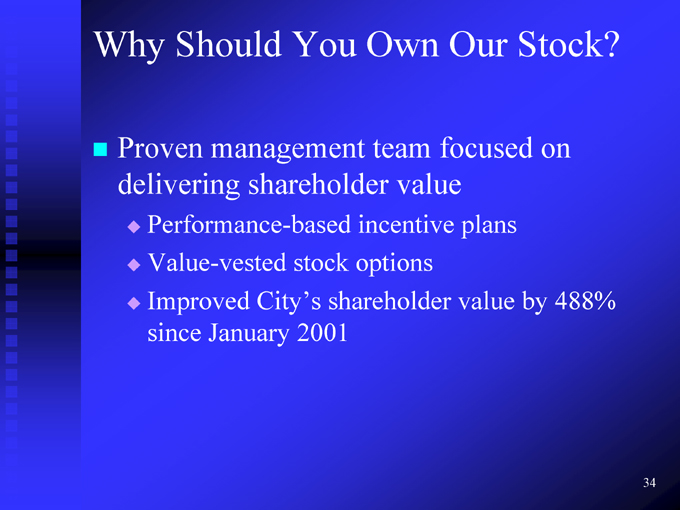
• 34 • on 488% • Stock? by • Our focused plans value Own team value incentive options shareholder You stock 2001 • management shareholder City’s January • Should Performance-based • Value-vested Improved since • Proven delivering . . • Why .

• 35 • Stock? Revenues Our Banking • Own • Returns Sheet Quality Mortgage You Funded Balance Loan Capitalized on Should Risk/High Liquidity Core reliant Fortress Pristine High Strongly Retail Not • Low . . . . . • Why .
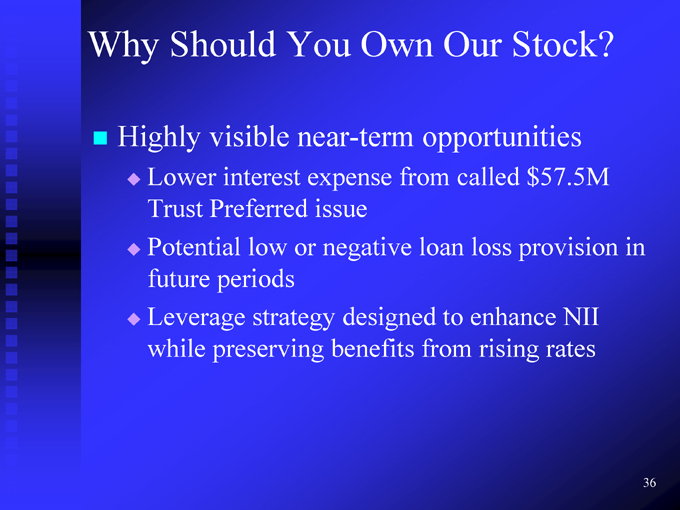
• 36 • in • Stock? $57.5M provision NII rates called loss enhance rising • Our opportunities to from • from loan • Own negative designed benefits near-term expense issue You or strategy Should visible interest Preferred low periods preserving Lower Trust Potential future Leverage while • Highly . . • Why .
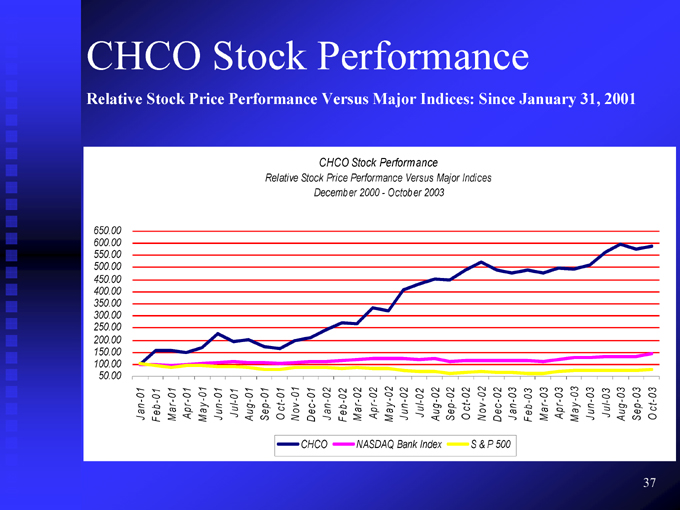
CHCO Stock Performance Relative Stock Price Performance Versus Major Indices: Since January 31, 2001 CHCO Stock Performance Relative Stock Price Performance Versus Major Indices December 2000—October 2003 O c t-03 Sep-03 Aug-03 J ul-03 J un-03 M ay -03 Apr-03 M ar-03 F eb-03 J an-03 D ec -02 N ov -02 O c t-02 Sep-02 Aug-02 J ul-02 J un-02 M ay -02 Apr-02 M ar-02 F eb-02 J an-02 D ec -01 N ov -01 O c t-01 Sep-01 Aug-01 J ul-01 J un-01 M ay -01 Apr-01 M ar-01 F eb-01 J an-01 650.00 600.00 550.00 500.00 450.00 400.00 350.00 300.00 250.00 200.00 150.00 100.00 50.00 S & P 500 NASDAQ Bank Index CHCO

Questions?