
RBC Conference – Martha’s Vineyard September 2004
Forward Looking Statements
This news release contains certain forward-looking statements that are included pursuant to the safe harbor provisions of the Private Securities Litigation Reform Act of 1995. Such information involves risks and uncertainties that could result in the Company’s actual results differing from those projected in the forward-looking statements. Important factors that could cause actual results to differ materially from those discussed in such forward-looking statements include, but are not limited to, (1) the Company may incur additional loan loss provision due to negative credit quality trends in the future that may lead to a deterioration of asset quality, or conversely, the Company may incur less, or even negative, loan loss provision due to positive credit quality trends in the future; (2) the Company may not continue to experience significant recoveries of previously charged-off loans and the Company may incur increased charge-offs in the future; (3) the Company may experience increases in the default rates on its previously securitized loans causing the yields on these assets to decline; (4) the Company could have adverse legal actions of a material nature; (5) the Company may face competitive loss of customers; (6) the Company may be unable to manage its expense levels; (7) changes in the interest rate environment may have results on the Company’s operations materially different from those anticipated by the Company’s market risk management functions; (8) changes in general economic conditions and increased competition could adversely affect the Company’s operating results; (9) changes in other regulations and government policies affecting bank holding companies and their subsidiaries, including changes in monetary policies, could negatively impact the Company’s operating results; (10) the Company may experience difficulties growing loan and deposit balances. Forward-looking statements made herein reflect management’s expectations as of the date such statements are made. Such information is provided to assist stockholders and potential investors in understanding current and anticipated financial operations of the Company and is included pursuant to the safe harbor provisions of the Private Securities Litigation Reform Act of 1995. The Company undertakes no obligation to update any forward-looking statement to reflect events or circumstances that arise after the date such statements are made.
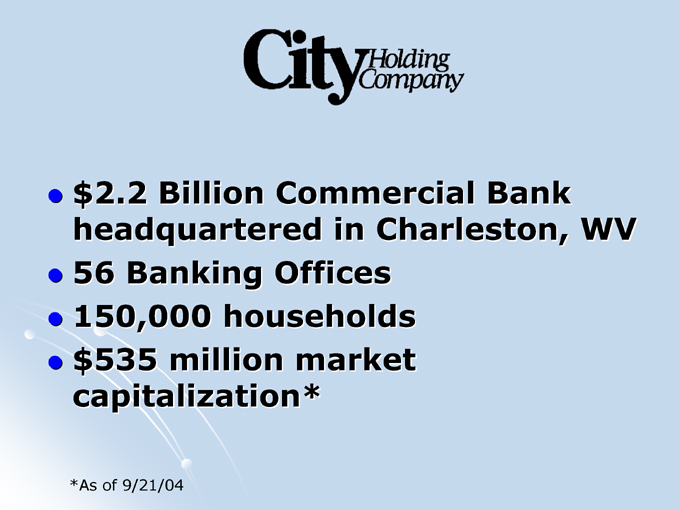
$2.2 Billion Commercial Bank headquartered in Charleston, WV 56 Banking Offices 150,000 households $535 million market capitalization*
*As of 9/21/04
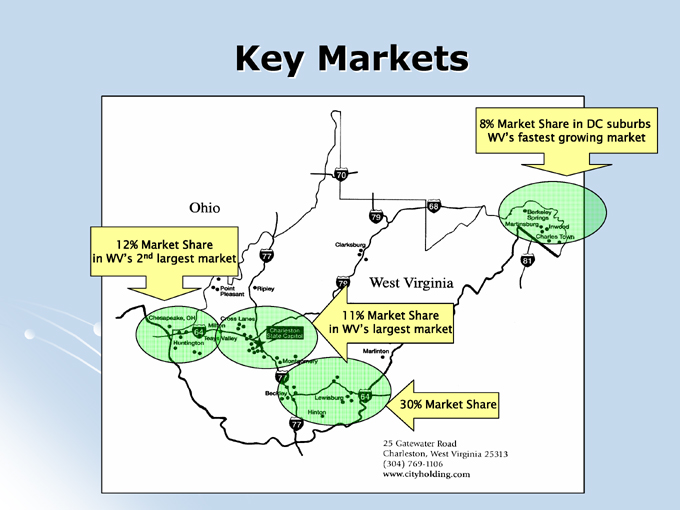
Key Markets
8% Market Share in DC suburbs WV’s fastest growing market
12% Market Share in WV’s 2nd largest market
11% Market Share in WV’s largest market
30% Market Share
Ohio West Virginia
25 Gatewater Road
Charleston, West Virginia 25313
(304) 769-1106
www.cityholding.com
Why Own This Stock?
1. CHCO is highly profitable
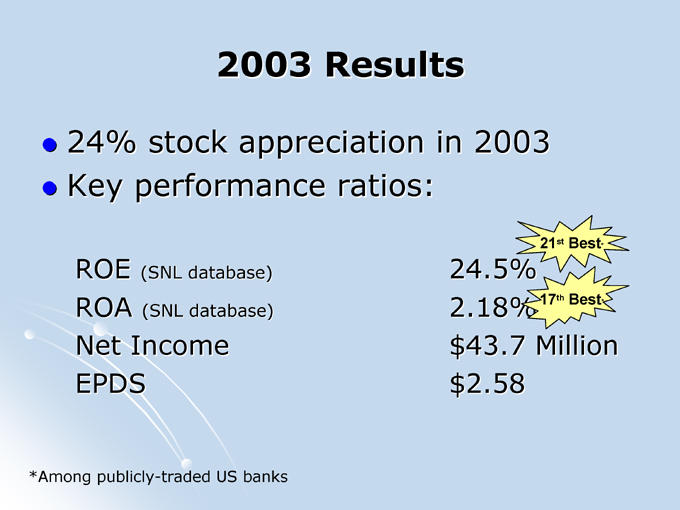
2003 Results
24% stock appreciation in 2003 Key performance ratios:
ROE (SNL database) 24.5%
21st Best*
ROA (SNL database) 2.18%
17th Best*
Net Income $43.7 Million
EPDS $2.58
*Among publicly-traded US banks
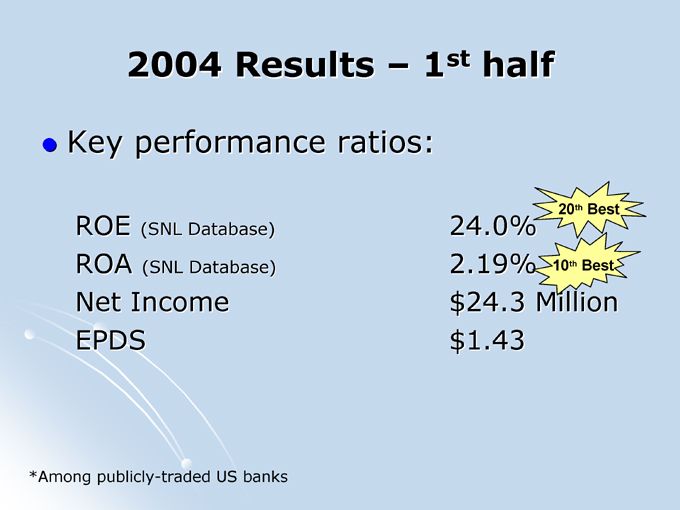
2004 Results – 1st half
Key performance ratios:
ROE (SNL Database) 24.0%
20th Best
ROA (SNL Database) 2.19%
10th Best
Net Income $24.3 Million EPDS $1.43
*Among publicly-traded US banks
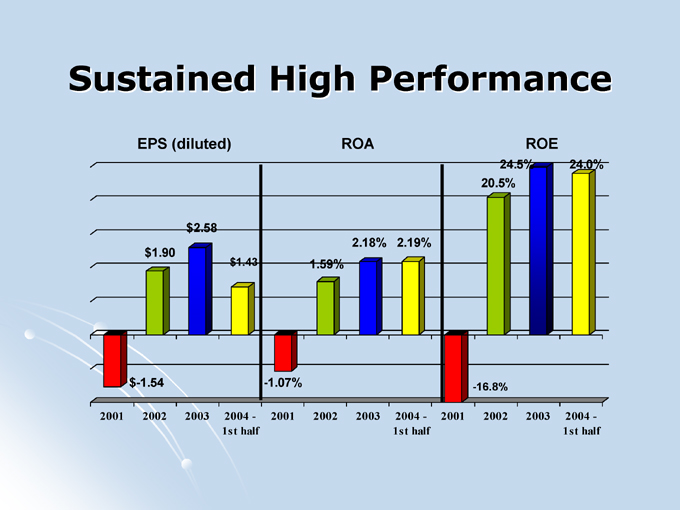
Sustained High Performance
EPS (diluted) ROA ROE $2.58 $1.90 $1.43
2.18% 2.19% 1.59%
24.5% 24.0% 20.5% $-1.54 -1.07% -16.8%
2001 2002 2003 2004 - 1st half 2001 2002 2003 2004 - 1st half 2001 2002 2003 2004 - 1st half
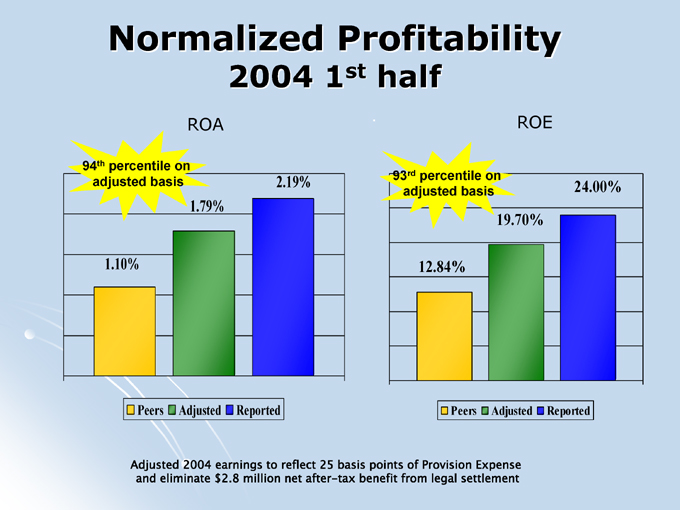
Normalized Profitability
2004 1st half
ROA ROE
94th percentile on adjusted basis
1.10%
1.79%
2.19%
Peers Adjusted Reported
93rd percentile on adjusted basis
12.84%
19.70%
24.00%
Peers Adjusted Reported
Adjusted 2004 earnings to reflect 25 basis points of Provision Expense and eliminate $2.8 million net after-tax benefit from legal settlement
Why Own This Stock?
1. CHCO is highly profitable 2. CHCO is growing share
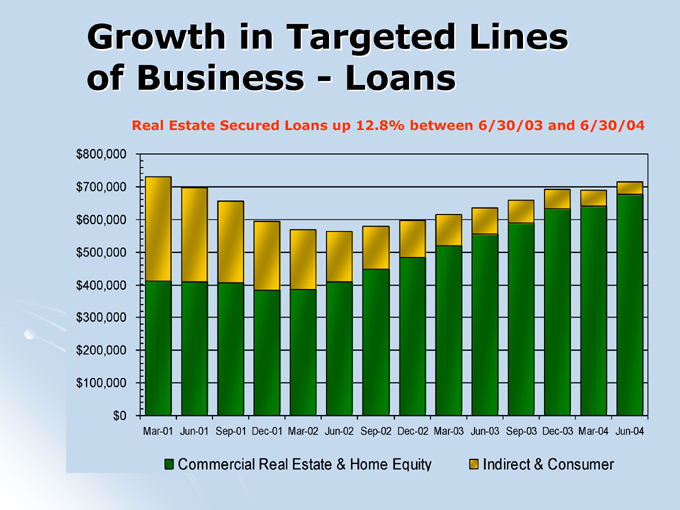
Growth in Targeted Lines of Business - Loans
Real Estate Secured Loans up 12.8% between 6/30/03 and 6/30/04 $800,000 $700,000 $600,000 $500,000 $400,000 $300,000 $200,000 $100,000 $0
Mar-01 Jun-01 Sep-01 Dec-01 Mar-02 Jun-02 Sep-02 Dec-02 Mar-03 Jun-03 Sep-03 Dec-03 Mar-04 Jun-04
Commercial Real Estate & Home Equity Indirect & Consumer
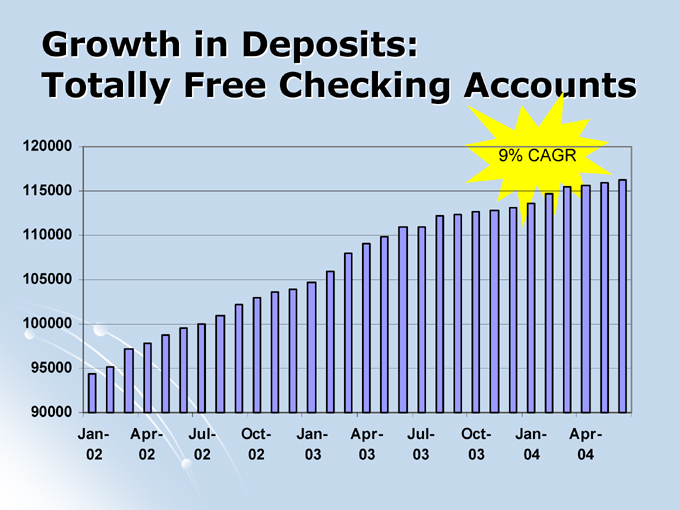
Growth in Deposits:
Totally Free Checking Accounts
9% CAGR
120000 115000 110000 105000 100000 95000 90000
Jan-02
Apr-02
Jul-02
Oct-02
Jan-03
Apr-03
Jul-03
Oct-03
Jan-04
Apr-04
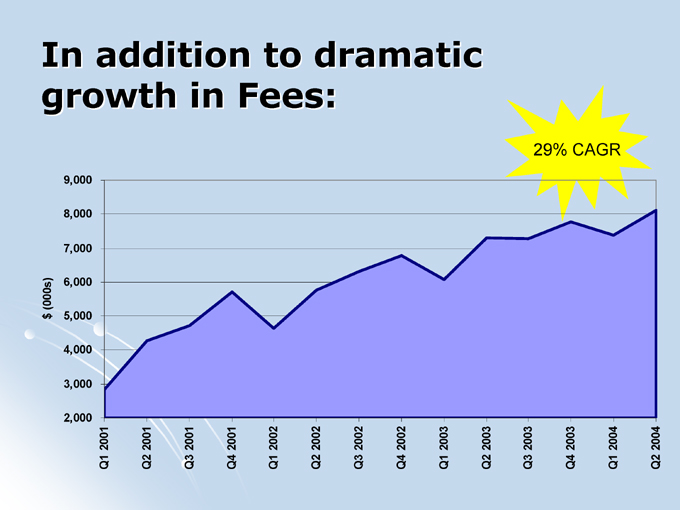
In addition to dramatic growth in Fees:
29% CAGR
9,000 8,000 7,000
$ (000s) 6,000 5,000
4,000 3,000 2,000
Q1 2001 Q2 2001 Q3 2001 Q4 2001 Q1 2002 Q2 2002 Q3 2002 Q4 2002 Q1 2003 Q2 2003 Q3 2003 Q4 2003 Q1 2004 Q2 2004
Why Own This Stock?
1. CHCO is highly profitable 2. CHCO is growing share 3. CHCO is well-positioned for the future
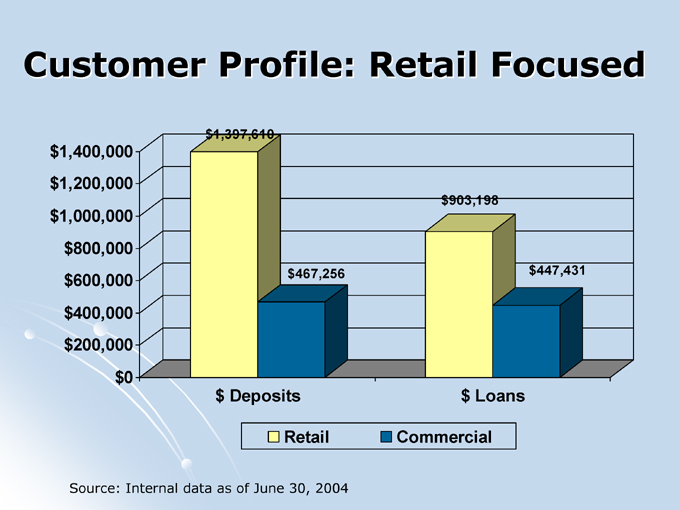
Customer Profile: Retail Focused $1,400,000 $1,200,000 $1,000,000 $800,000 $600,000 $400,000 $200,000 $0 $1,397,610 $467,256 $903,198 $447,431 $ Deposits $ Loans
Retail Commercial
Source: Internal data as of June 30, 2004
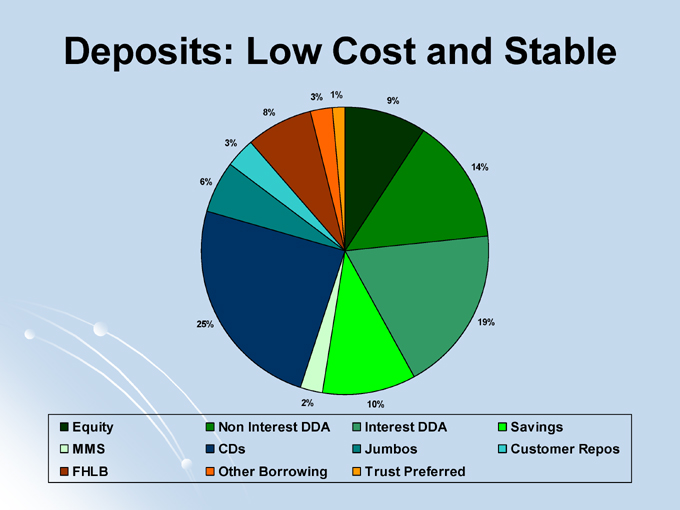
Deposits: Low Cost and Stable
3% 1%
9%
14%
19%
10%
2%
25%
6%
3%
8%
Equity Non Interest DDA Interest DDA Savings
MMS CDs Jumbos Customer Repos FHLB Other Borrowing Trust Preferred
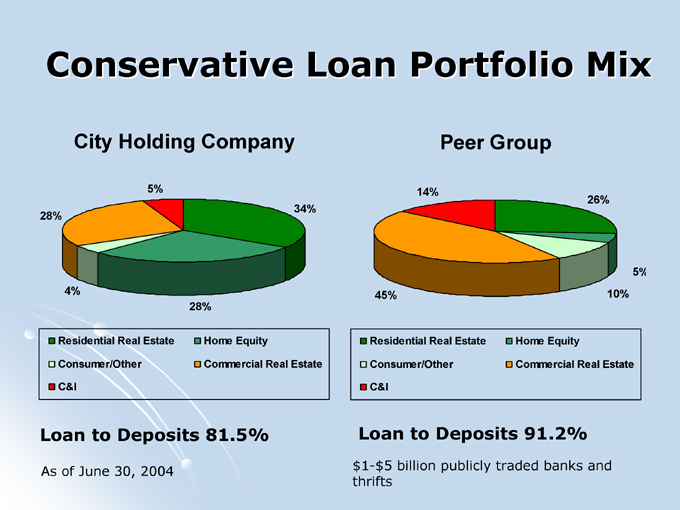
Conservative Loan Portfolio Mix
City Holding Company
28%
5%
34%
4%
28%
Residential Real Estate Home Equity
Consumer/Other Commercial Real Estate
C&I
Loan to Deposits 81.5%
As of June 30, 2004
Peer Group
14%
26%
45%
5%
10%
Residential Real Estate Home Equity
Consumer/Other Commercial Real Estate
C&I
Loan to Deposits 91.2%
$1-$5 billion publicly traded banks and thrifts
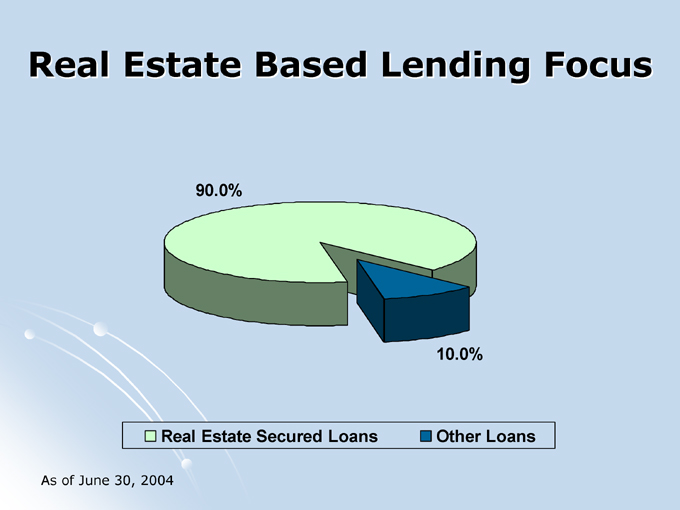
Real Estate Based Lending Focus
90.0%
10.0%
Real Estate Secured Loans Other Loans
As of June 30, 2004
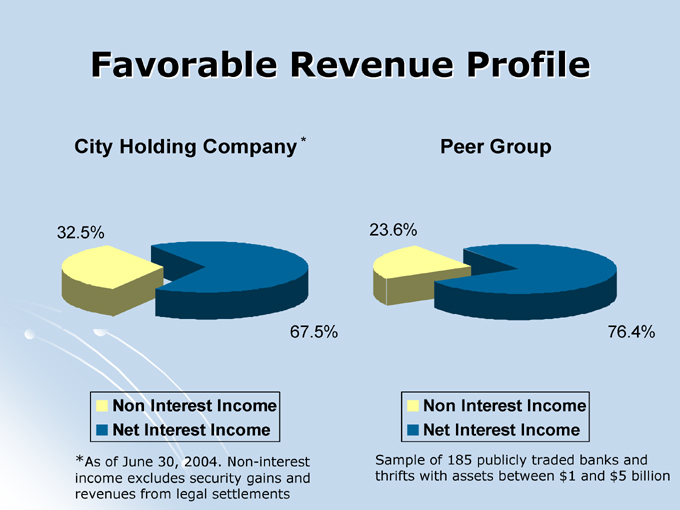
Favorable Revenue Profile
City Holding Company*
32.5%
67.5%
Non Interest Income Net Interest Income
*As of June 30, 2004. Non-interest income excludes security gains and revenues from legal settlements
Peer Group
23.6%
76.4%
Non Interest Income Net Interest Income
Sample of 185 publicly traded banks and thrifts with assets between $1 and $5 billion
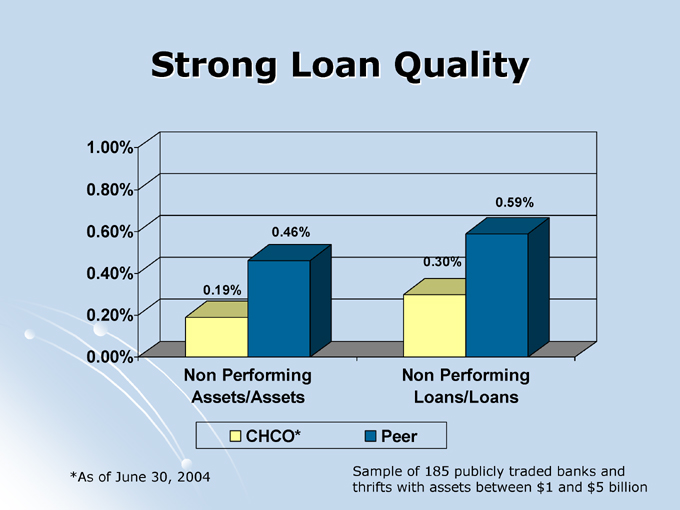
Strong Loan Quality
1.00% 0.80% 0.60% 0.40% 0.20% 0.00%
0.19%
0.46%
0.30%
0.59%
Non Performing Assets/Assets
Non Performing Loans/Loans
CHCO* Peer
*As of June 30, 2004
Sample of 185 publicly traded banks and thrifts with assets between $1 and $5 billion
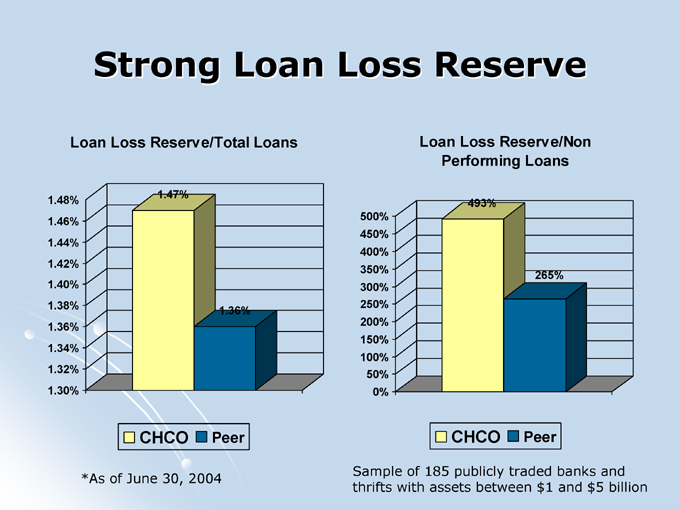
Strong Loan Loss Reserve
Loan Loss Reserve/Total Loans
1.48% 1.46% 1.44% 1.42% 1.40% 1.38% 1.36% 1.34% 1.32% 1.30%
1.47%
1.36%
CHCO Peer
*As of June 30, 2004
Loan Loss Reserve/Non Performing Loans
500% 450% 400% 350% 300% 250% 200% 150% 100% 50% 0%
493%
265%
CHCO Peer
Sample of 185 publicly traded banks and thrifts with assets between $1 and $5 billion
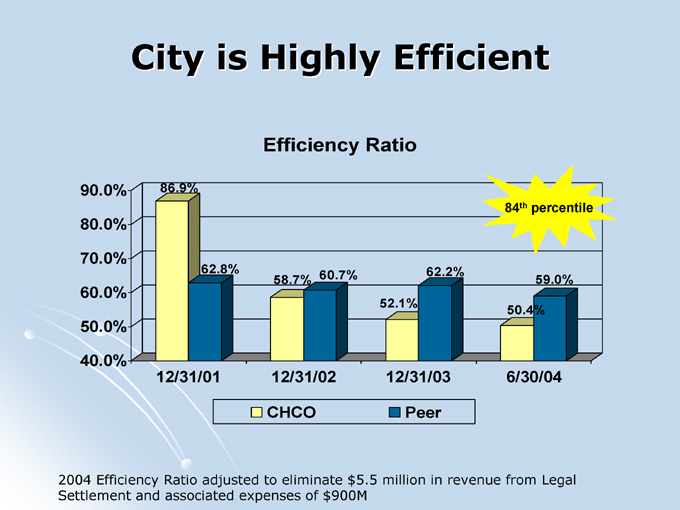
City is Highly Efficient
Efficiency Ratio
90.0% 80.0% 70.0% 60.0% 50.0% 40.0%
86.9%
62.8%
58.7% 60.7%
52.1%
62.2%
50.4%
59.0%
84th percentile
12/31/01 12/31/02 12/31/03 6/30/04
CHCO Peer
2004 Efficiency Ratio adjusted to eliminate $5.5 million in revenue from Legal Settlement and associated expenses of $900M
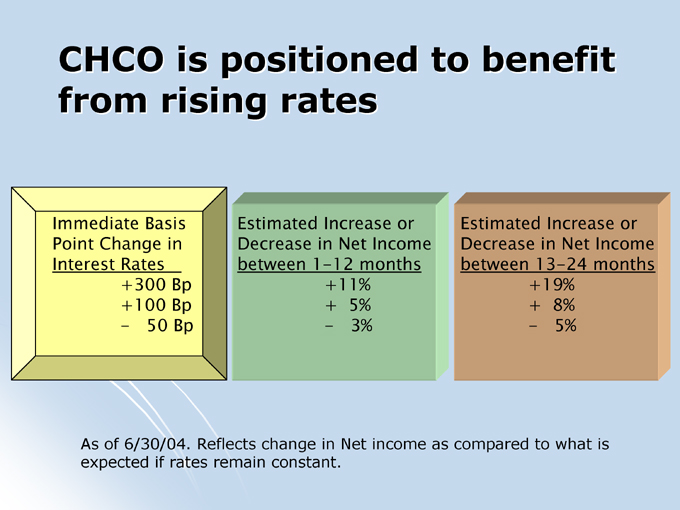
CHCO is positioned to benefit from rising rates
Immediate Basis Point Change in Interest Rates +300 Bp +100 Bp
- 50 Bp
Estimated Increase or Decrease in Net Income between 1-12 months +11%
+ 5%
- 3%
Estimated Increase or Decrease in Net Income between 13-24 months +19%
+ 8%
- 5%
As of 6/30/04. Reflects change in Net income as compared to what is expected if rates remain constant.
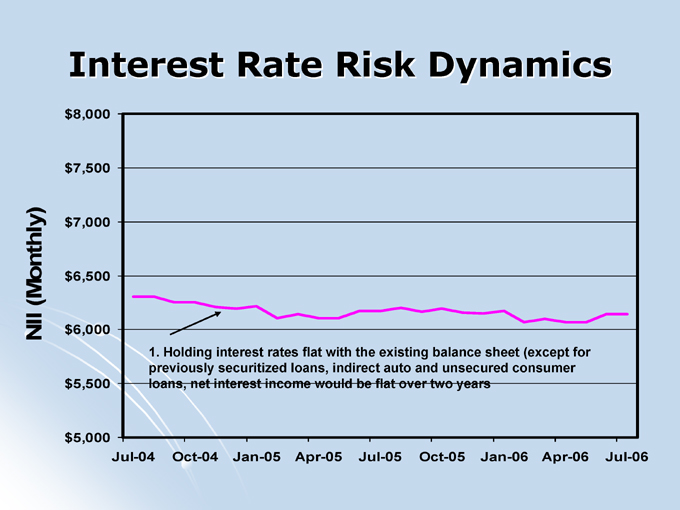
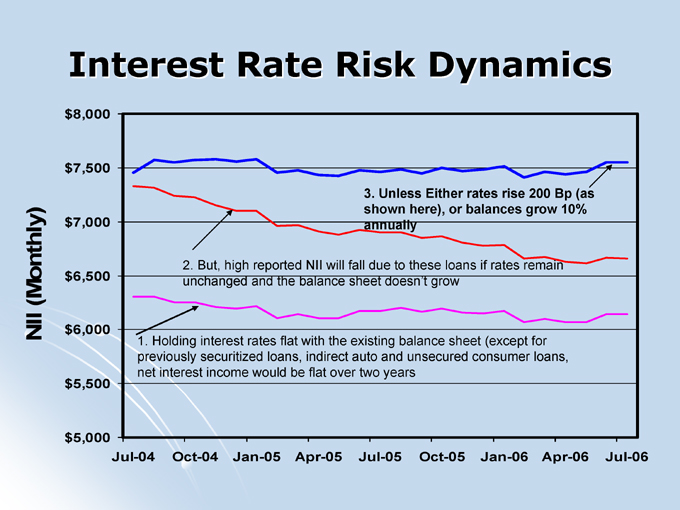
Interest Rate Risk Dynamics $8,000
$7,500
(Monthly) $7,000
$6,500
NII $6,000 $5,500
$5,000
1. Holding interest rates flat with the existing balance sheet (except for previously securitized loans, indirect auto and unsecured consumer loans, net interest income would be flat over two years
Jul-04 Oct-04 Jan-05 Apr-05 Jul-05 Oct-05 Jan-06 Apr-06 Jul-06
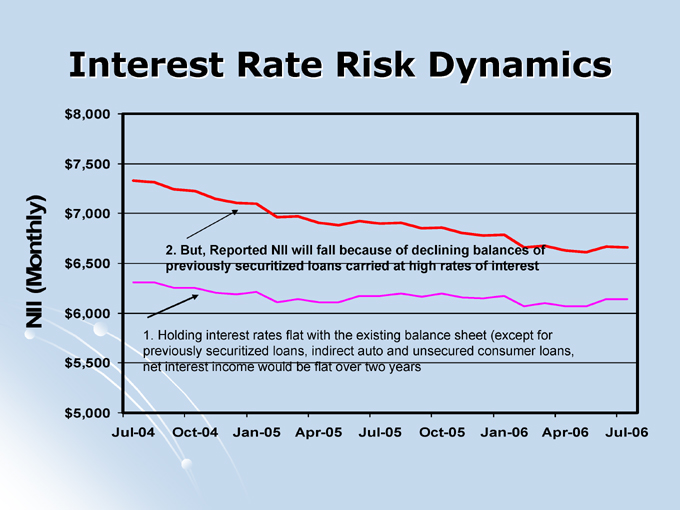
Interest Rate Risk Dynamics $8,000
$7,500
(Monthly)
$7,000
$6,500
NII $6,000 $5,500
$5,000
2. But, Reported NII will fall because of declining balances of previously securitized loans carried at high rates of interest
1. Holding interest rates flat with the existing balance sheet (except for previously securitized loans, indirect auto and unsecured consumer loans, net interest income would be flat over two years
Jul-04 Oct-04 Jan-05 Apr-05 Jul-05 Oct-05 Jan-06 Apr-06 Jul-06
Interest Rate Risk Dynamics $8,000
$7,500
(Monthly) $7,000
$6,500
NII $6,000 $5,500
$5,000
3. Unless Either rates rise 200 Bp (as shown here), or balances grow 10% annually
2. But, high reported NII will fall due to these loans if rates remain unchanged and the balance sheet doesn’t grow
1. Holding interest rates flat with the existing balance sheet (except for previously securitized loans, indirect auto and unsecured consumer loans, net interest income would be flat over two years
Jul-04 Oct-04 Jan-05 Apr-05 Jul-05 Oct-05 Jan-06 Apr-06 Jul-06
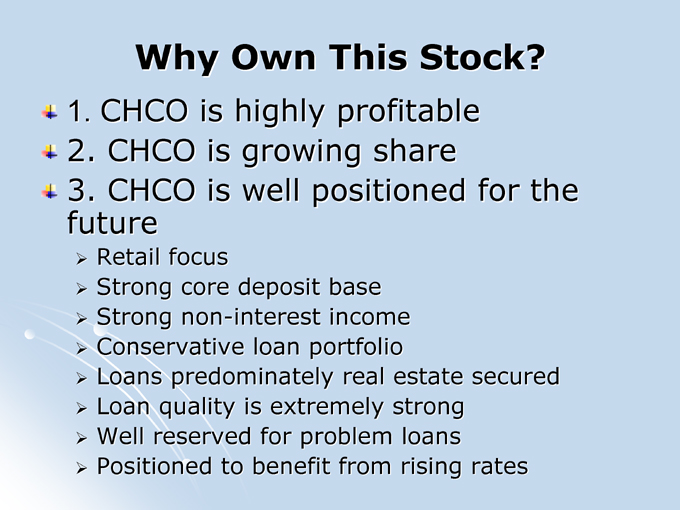
Why Own This Stock?
1. CHCO is highly profitable 2. CHCO is growing share 3. CHCO is well positioned for the future
Retail focus
Strong core deposit base Strong non-interest income Conservative loan portfolio
Loans predominately real estate secured Loan quality is extremely strong Well reserved for problem loans Positioned to benefit from rising rates
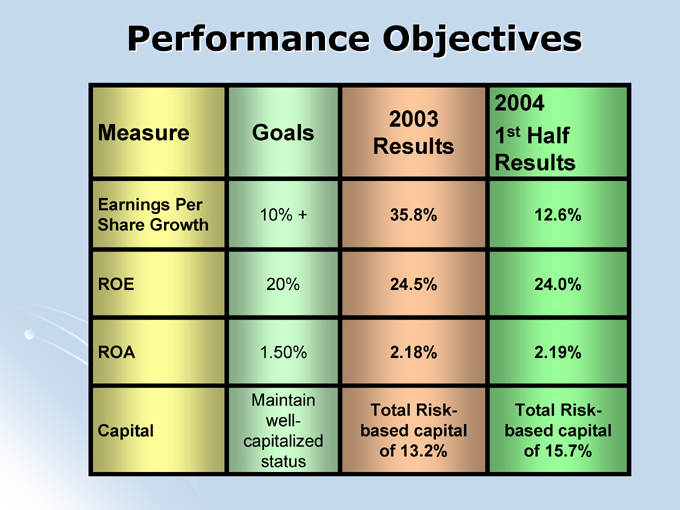
Performance Objectives
Measure
Goals
2003 Results
2004 1st Half Results
Earnings Per Share Growth
10% + 35.8% 12.6%
ROE 20% 24.5% 24.0%
ROA 1.50% 2.18% 2.19%
Capital
Maintain well-capitalized status
Total Risk-based capital of 13.2%
Total Risk-based capital of 15.7%
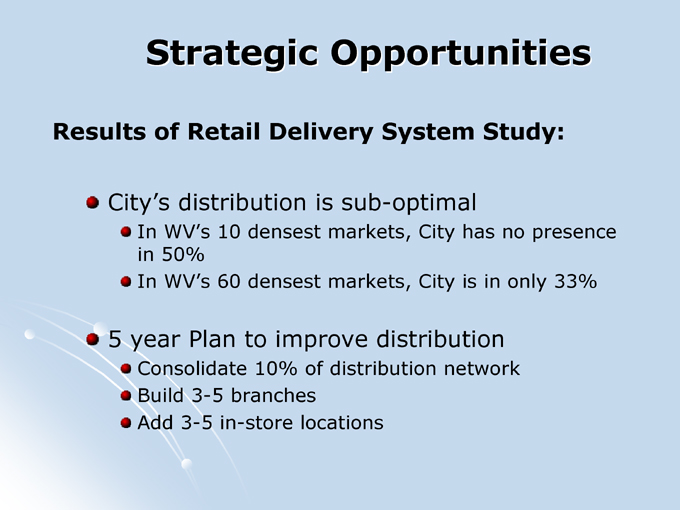
Strategic Opportunities
Results of Retail Delivery System Study:
City’s distribution is sub-optimal
In WV’s 10 densest markets, City has no presence in 50%
In WV’s 60 densest markets, City is in only 33%
5 year Plan to improve distribution
Consolidate 10% of distribution network Build 3-5 branches Add 3-5 in-store locations
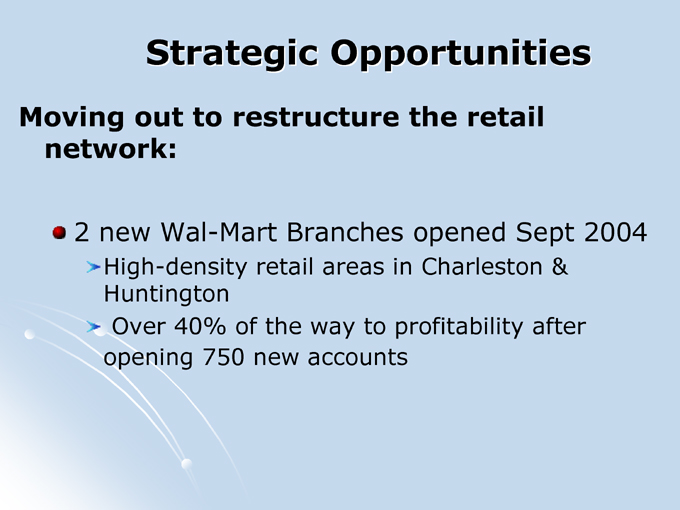
Strategic Opportunities
Moving out to restructure the retail network:
2 new Wal-Mart Branches opened Sept 2004
High-density retail areas in Charleston & Huntington Over 40% of the way to profitability after opening 750 new accounts
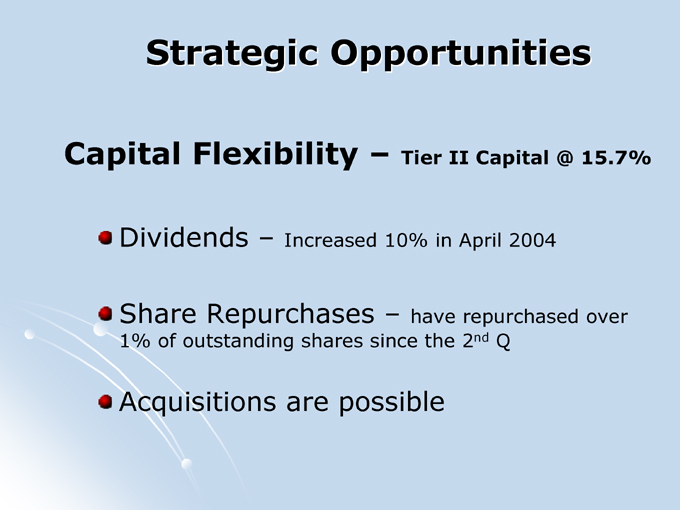
Strategic Opportunities
Capital Flexibility – Tier II Capital @ 15.7%
Dividends – Increased 10% in April 2004
Share Repurchases – have repurchased over 1% of outstanding shares since the 2nd Q
Acquisitions are possible
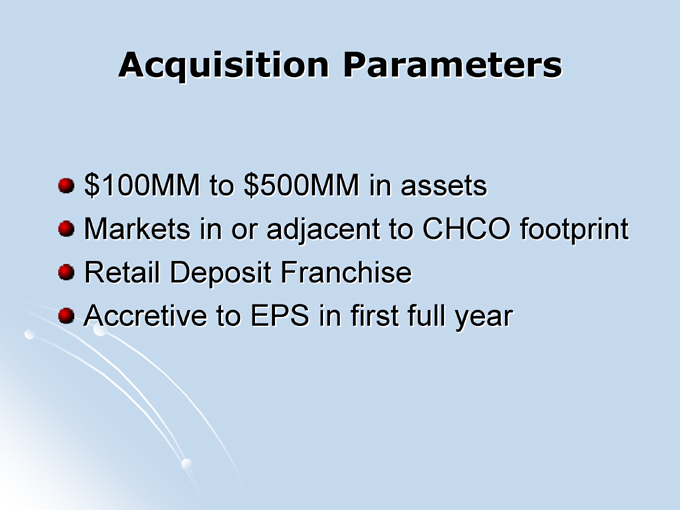
Acquisition Parameters
$100MM to $500MM in assets
Markets in or adjacent to CHCO footprint Retail Deposit Franchise Accretive to EPS in first full year
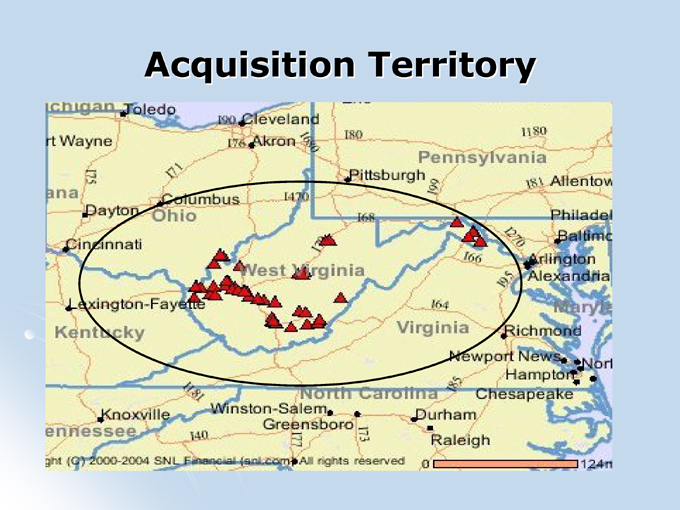
Acquisition Territory
Why Own This Stock
Highly Profitable Franchise Strong fee-income Strong asset quality Liquid Core-funded Loans are real-estate and retail Strongly capitalized Moving ahead to re-position the retail franchise And yet, priced lower than peers
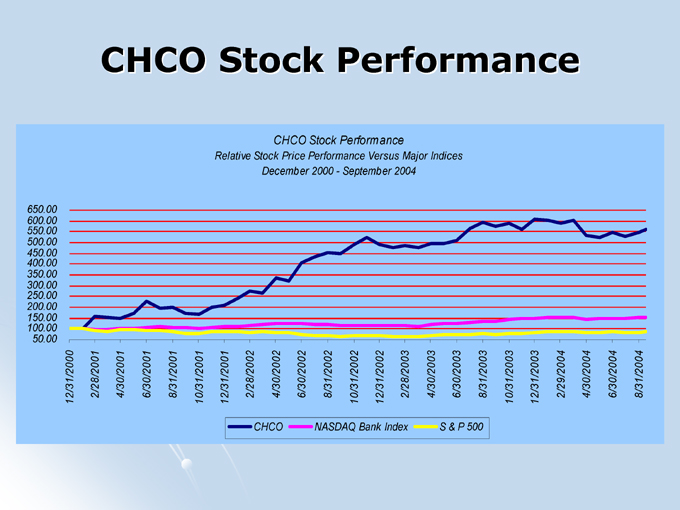
CHCO Stock Performance
CHCO Stock Performance
Relative Stock Price Performance Versus Major Indices December 2000—September 2004
650.00 600.00 550.00 500.00 450.00 400.00 350.00 300.00 250.00 200.00 150.00 100.00 50.00
12/31/2000 2/28/2001 4/30/2001 6/30/2001 8/31/2001 10/31/2001 12/31/2001 2/28/2002 4/30/2002
6/30/2002 8/31/2002 S&P 500 10/31/2002
12/31/2002 2/28/2003 4/30/2003 6/30/2003 8/31/2003 10/31/2003 12/31/2003 2/29/2004 4/30/2004 6/30/2004 8/31/2004
CHCO NASDAQ Bank Index S & P 500
Questions?