Exhibit 99.1
RBC Conference Martha’s Vineyard September 20, 2005

Forward Looking Statements
This news release contains certain forward-looking statements that are included pursuant to the safe harbor provisions of the Private Securities Litigation Reform Act of 1995. Such information involves risks and uncertainties that could result in the Company’s actual results differing from those projected in the forward-looking statements. Important factors that could cause actual results to differ materially from those discussed in such forward-looking statements include, but are not limited to, (1) the Company may incur additional loan loss provision due to negative credit quality trends in the future that may lead to a deterioration of asset quality; (2) the Company may incur increased charge-offs in the future; (3) the Company may experience increases in the default rates on previously securitized loans that would result in impairment losses or lower the yield on such loans; (4) the Company could have adverse legal actions of a material nature; (5) the Company may face competitive loss of customers; (6) the Company may be unable to manage its expense levels; (7) the Company may have difficulty in retaining key employees; (8) changes in the interest rate environment may have results on the Company’s operations materially different from those anticipated by the Company’s market risk management functions; (9) changes in general economic conditions and increased competition could adversely affect the Company’s operating results; (10) changes in other regulations and government policies affecting bank holding companies and their subsidiaries, including changes in monetary policies, could negatively impact the Company’s operating results; and (11) the Company may experience difficulties growing loan and deposit balances. Forward-looking statements made herein reflect management’s expectations as of the date such statements are made. Such information is provided to assist stockholders and potential investors in understanding current and anticipated financial operations of the Company and is included pursuant to the safe harbor provisions of the Private Securities Litigation Reform Act of 1995. The Company undertakes no obligation to update any forward-looking statement to reflect events or circumstances that arise after the date such statements are made.

$2.5 Billion Commercial Bank headquartered in Charleston, WV 67 Banking Offices 165,000 households $660 million market capitalization*
*As of 8/24/05
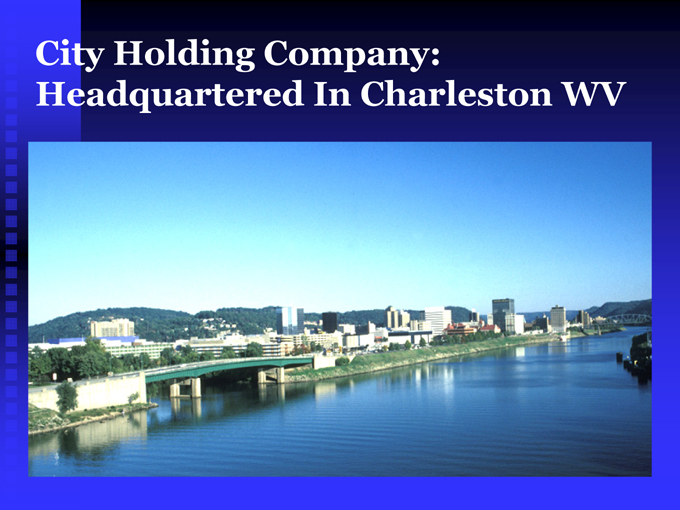
City Holding Company:
Headquartered In Charleston WV
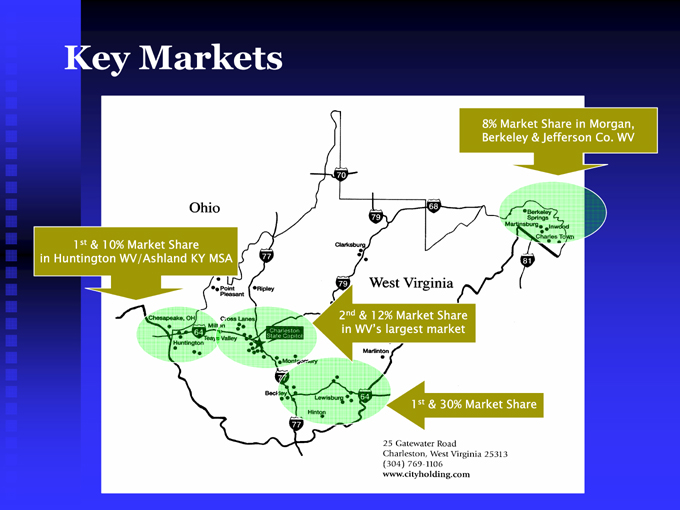
Key Markets
8% Market Share in Morgan, Berkeley & Jefferson Co. WV
2nd & 12% Market Share in WV’s largest market
1st & 10% Market Share in Huntington WV/Ashland KY MSA
1st & 30% Market Share 25 Gatewater Road Charleston, West Virginia 25313 (304) 769-1106 www.cityholding.com
Themes:
CHCO: Under Continuing Management CHCO: Consistently superior results CHCO: Growth in slow-growth markets
CHCO: Under Continuing Leadership
Former CEO Jerry Francis engineered the turn-around of the Company CFO Skip Hageboeck assumed the role of CEO on February 1, 2005 City has assembled a team of top-notch talent over the last three years capable of continuing City’s strong performance
Engineering the Turn-around: Starting from Ground Zero $38 million loss reported in 2000
Formal Agreements with OCC and Federal Reserve $130 million in “problem loans” Stock trading at $5.125 per share from a high (in 1998) of $45 per share; discontinued common share cash dividends; deferred trust preferred dividends Ownership of non-core businesses which diluted focus and earnings Company terminated its CEO in June 2000; Hired Turn-around expert Jerry Francis in January 2001

Why Own This Stock?
1. CHCO is highly profitable
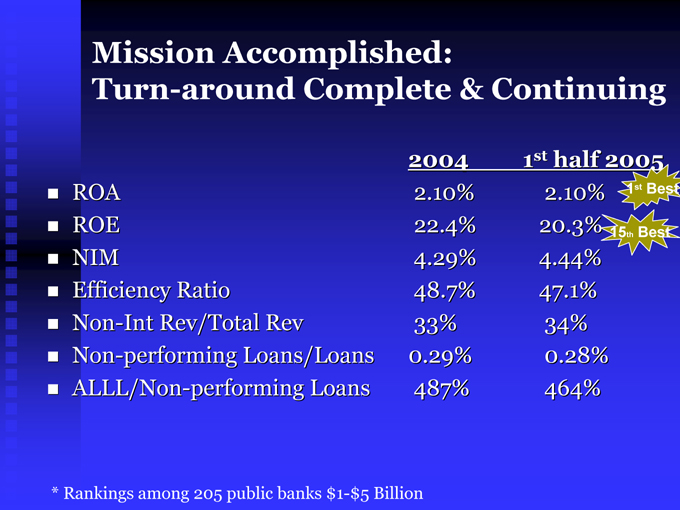
Mission Accomplished:
Turn-around Complete & Continuing
2004 1st half 2005
ROA 2.10% 2.10% 1st Best ROE 22.4% 20.3% 15 Best
th
NIM 4.29% 4.44% Efficiency Ratio 48.7% 47.1% Non-Int Rev/Total Rev 33% 34% Non-performing Loans/Loans 0.29% 0.28% ALLL/Non-performing Loans 487% 464%
* Rankings among 205 public banks $1-$5 Billion
Why Own This Stock?
1. CHCO is highly profitable
2. CHCO is well-positioned for the future
Conservative Loan Portfolios Strong Asset Quality Exceptional Core Deposit Base Highly Liquid Very Efficient Strongly Capitalized Positioned to benefit from rising rates
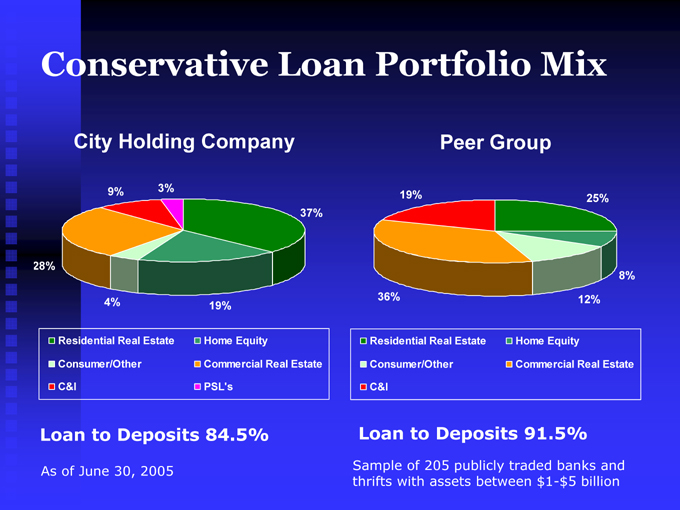
Conservative Loan Portfolio Mix
City Holding Company Peer Group
9% 3%
19% 25% 37%
28%
8% 36% 12%
4% 19%
Residential Real Estate Consumer/Other C&I
Home Equity
Commercial Real Estate
PSL’s
Residential Real Estate Consumer/Other C&I
Home Equity
Commercial Real Estate
Loan to Deposits 84.5% Loan to Deposits 91.5%
As of June 30, 2005 Sample of 205 publicly traded banks and thrifts with assets between $1-$5 billion
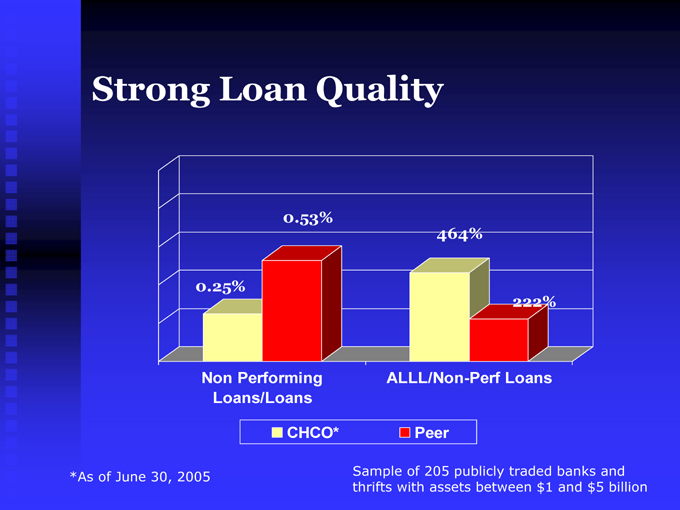
Strong Loan Quality
0.53%
464%
0.25%
222%
Non Performing Loans/Loans
ALLL/Non-Perf Loans
CHCO*
Peer
*As of June 30, 2005
Sample of 205 publicly traded banks and thrifts with assets between $1 and $5 billion
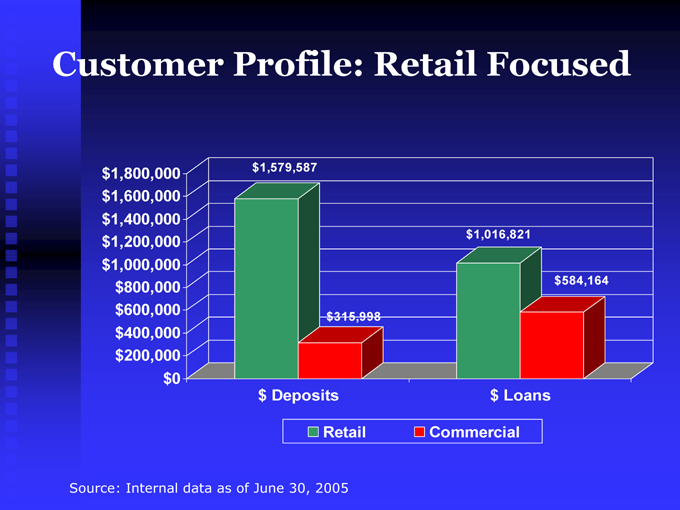
Customer Profile: Retail Focused $1,579,587
$1,016,821 $584,164 $315,998
$ Deposits $ Loans $1,800,000 $1,600,000 $1,400,000 $1,200,000 $1,000,000 $800,000 $600,000 $400,000 $200,000 $0
Retail
Commercial
Source: Internal data as of June 30, 2005
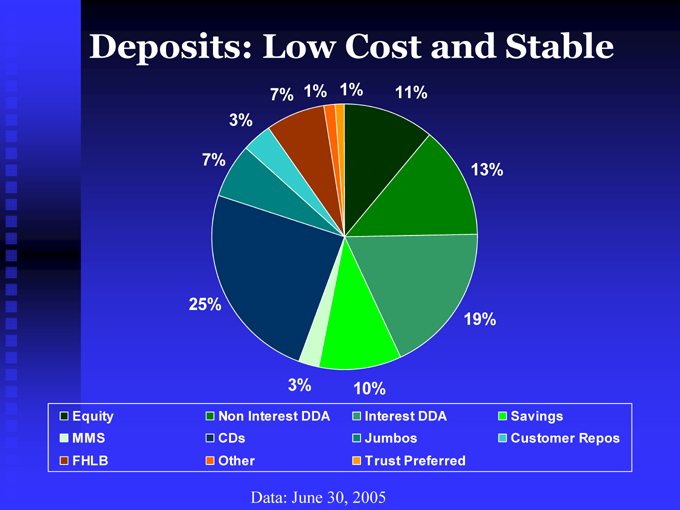
Deposits: Low Cost and Stable
7% 1% 1% 11% 3%
7%
13%
25%
19%
3% 10%
Equity MMS FHLB
Non Interest DDA CDs Other
Interest DDA Jumbos Trust Preferred
Savings
Customer Repos
Data: June 30, 2005
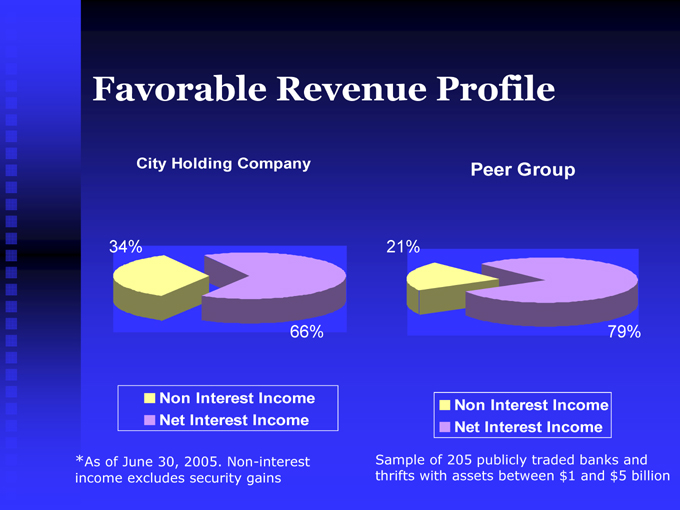
Favorable Revenue Profile
City Holding Company Peer Group
34% 21%
66% 79%
Non Interest Income Net Interest Income
Non Interest Income Net Interest Income
*As of June 30, 2005. Non-interest income excludes security gains
Sample of 205 publicly traded banks and thrifts with assets between $1 and $5 billion

City is Highly Efficient
Efficiency Ratio
92nd percentile
86.9%
62.8%
62.2% 60.4% 59.0% 58.7%60.7% 52.1% 50.1% 47.1%
100.0% 90.0% 80.0% 70.0% 60.0% 50.0% 40.0%
12/31/01 12/31/02 12/31/03 12/31/04 6/30/05
CHCO
Peer
2004 Efficiency Ratio adjusted to eliminate $5.5 million in revenue from Legal Settlement and associated legal expenses of $500M
Peers: Sample of 205 publicly traded banks and thrifts with assets between $1 to $5 Billion
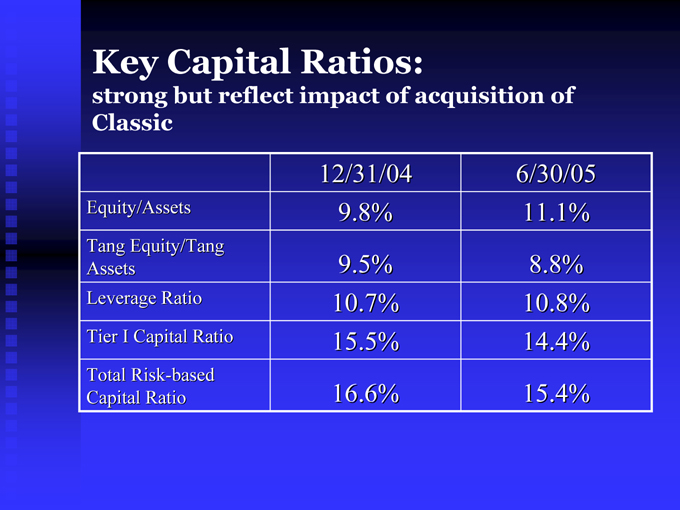
Key Capital Ratios:
strong but reflect impact of acquisition of Classic
12/31/04 6/30/05
Equity/Assets 9.8% 11.1% Tang Equity/Tang
Assets 9.5% 8.8%
Leverage Ratio 10.7% 10.8% Tier I Capital Ratio 15.5% 14.4% Total Risk-based Capital Ratio 16.6% 15.4%
Challenges for 2005
Provision Expense
At June 30, 2005, the ALLL was 1.14% of Loans No Provision expense has been recorded since the 2nd Quarter of 2002 when the ALLL was 2.31% of Loans 25 Bp of Provision expense would reduce earnings by about $0.13 per share per year after-tax
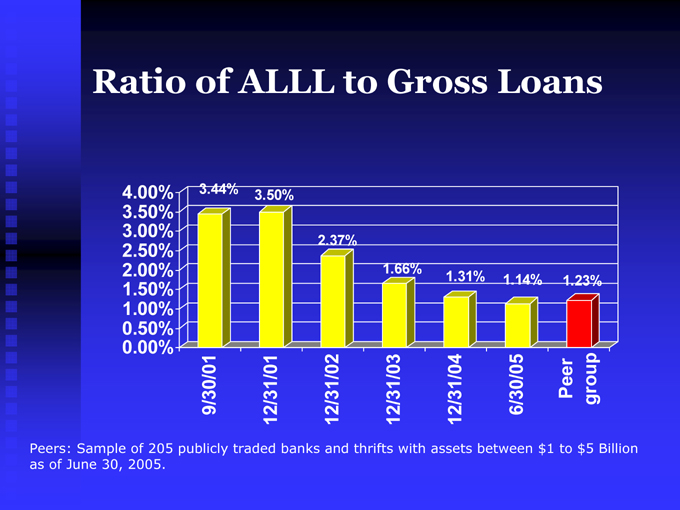
Ratio of ALLL to Gross Loans
3.44% 3.50%
2.37%
1.66%
1.31% 1.14% 1.23%
4.00% 3.50% 3.00% 2.50% 2.00% 1.50% 1.00% 0.50% 0.00%
9/30/01 12/31/01 12/31/02 12/31/03 12/31/04
6/30/05
Peer group
Peers: Sample of 205 publicly traded banks and thrifts with assets between $1 to $5 Billion as of June 30, 2005.
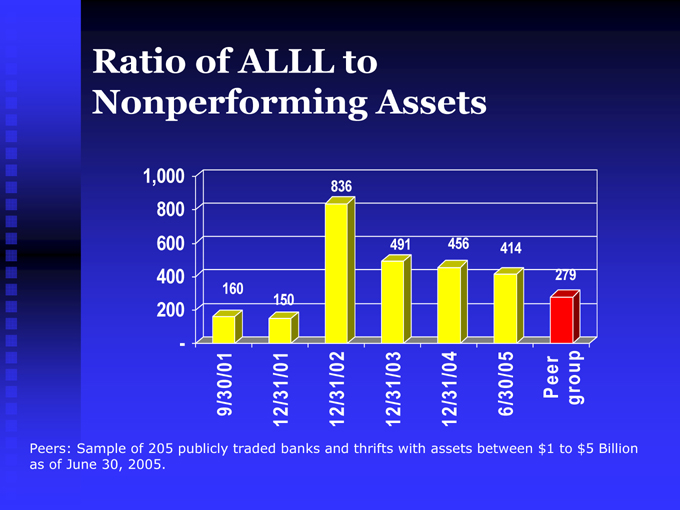
Ratio of ALLL to Nonperforming Assets
836
491 456 414
279 160 150
1,000 800 600 400 200 -
9/30/01 12/31/01 12/31/02 12/31/03 12/31/04
6/30/05
Peer group
Peers: Sample of 205 publicly traded banks and thrifts with assets between $1 to $5 Billion as of June 30, 2005.
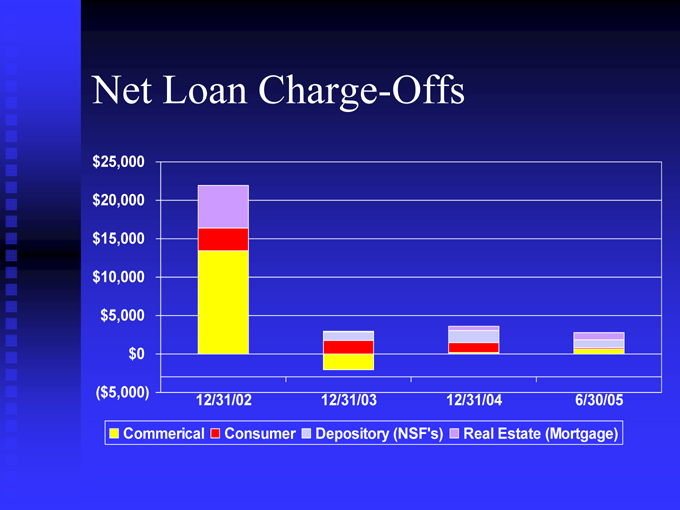
Net Loan Charge-Offs $25,000 $20,000 $15,000 $10,000 $5,000 $0
($5,000)
12/31/02 12/31/03 12/31/04 6/30/05
Commerical Consumer Depository (NSF’s) Real Estate (Mortgage)
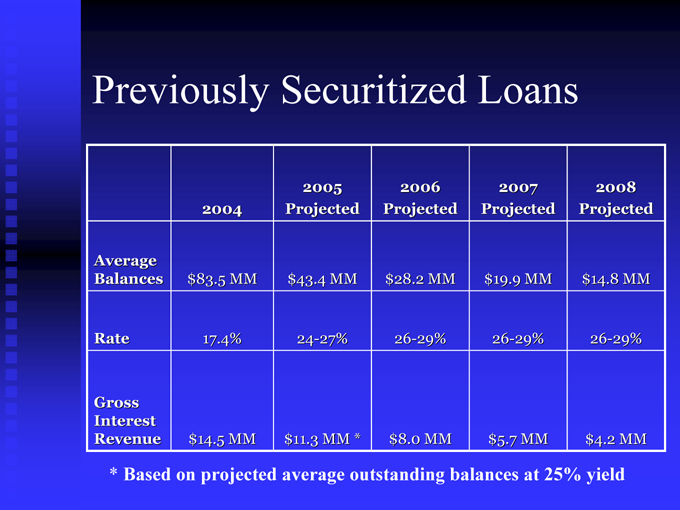
Previously Securitized Loans
2005 2006 2007 2008 2004 Projected Projected Projected Projected
Average
Balances $83.5 MM $43.4 MM $28.2 MM $19.9 MM $14.8 MM
Rate 17.4% 24-27% 26-29% 26-29% 26-29%
Gross Interest Revenue $14.5 MM $11.3 MM * $8.0 MM $5.7 MM $4.2 MM
* Based on projected average outstanding balances at 25% yield
As Previously Securitized Loans have declined, CHCO has offset lost interest income on these loans with:
Loan Growth
Benefits of rising interest rates
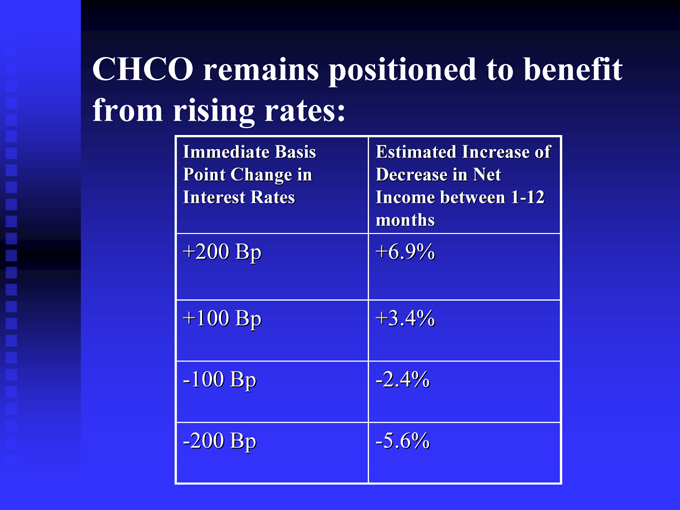
CHCO remains positioned to benefit from rising rates:
Immediate Basis Point Change in Interest Rates
Estimated Increase of Decrease in Net Income between 1-12 months
+200 Bp +6.9% +100 Bp +3.4% -100 Bp -2.4% -200 Bp -5.6%

Interest Rate Dynamics
12 months ago, Fed Funds was at 1% and CHCO was positioned to strongly benefit from rising rates Over the last year, the Prime rate and the Fed Funds rate have risen 250 Bps As Prime has increased, rates on home equity loans, commercial loans, and some commercial real estate loans have adjusted upward.
However, deposit rates have increased only marginally.
Therefore, while CHCO remains positioned to benefit from rising rates, it’s earnings would be exposed to a decrease in market interest rates as variable rate asset yields decreased without corresponding decreases in deposit costs.
To mitigate that effect, CHCO has purchased $300 million in floors that would pay CHCO if Prime were to fall below 6% in the next 3-5 years.
Interest Rate Dynamics
8,000 7,500 7,000 6,500 6,000 5,500
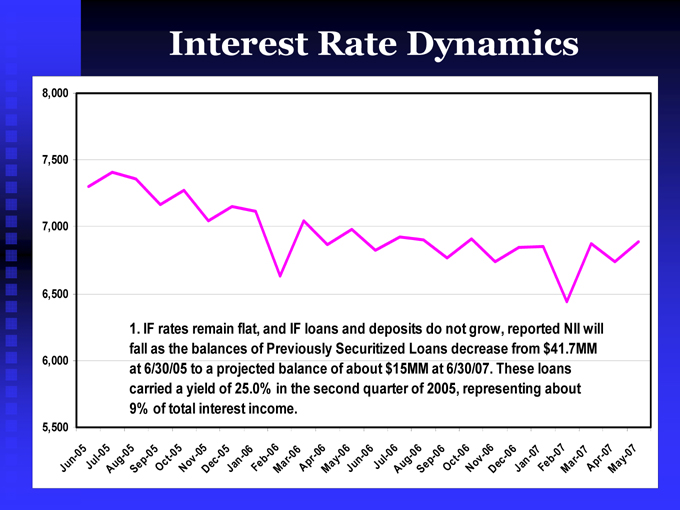
1. IF rates remain flat, and IF loans and deposits do not grow, reported NII will fall as the balances of Previously Securitized Loans decrease from $41.7MM at 6/30/05 to a projected balance of about $15MM at 6/30/07. These loans carried a yield of 25.0% in the second quarter of 2005, representing about 9% of total interest income.
Jun-05
Jul-05
Aug-05
Sep-05
Oct-05
Nov-05
Dec-05
Jan-06
Feb-06
Mar-06
Apr-06
May-06
Jun-06
Jul-06
Aug-06
Sep-06
Oct-06
Nov-06
Dec-06
Jan-07
Feb-07
Mar-07
Apr-07
May-07
Interest Rate Dynamics
8,000 7,500 7,000 6,500 6,000 5,500
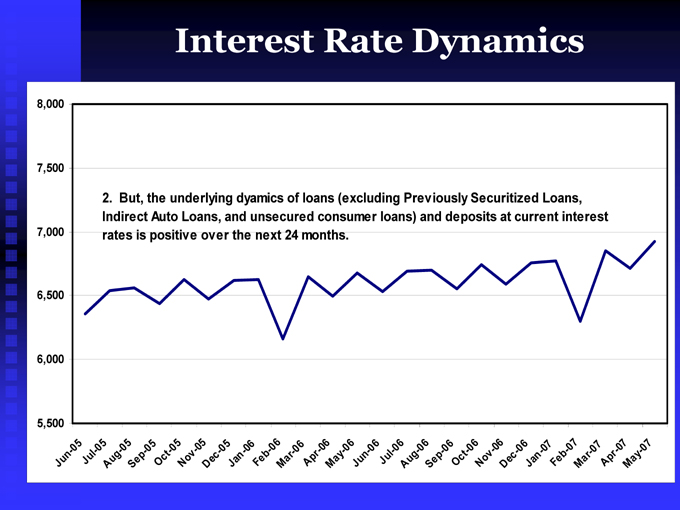
2. But, the underlying dyamics of loans (excluding Previously Securitized Loans,
Indirect Auto Loans, and unsecured consumer loans) and deposits at current interest rates is positive over the next 24 months.
Jun-05
Jul-05
Aug-05
Sep-05
Oct-05
Nov-05
Dec-05
Jan-06
Feb-06
Mar-06
Apr-06
May-06
Jun-06
Jul-06
Aug-06
Sep-06
Oct-06
Nov-06
Dec-06
Jan-07
Feb-07
Mar-07
Apr-07
May-07
Interest Rate Dynamics
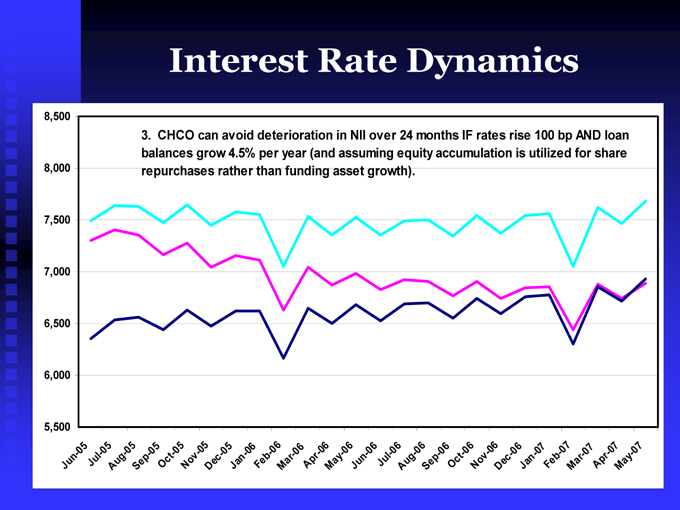
3. CHCO can avoid deterioration in NII over 24 months IF rates rise 100 bp AND loan balances grow 4.5% per year (and assuming equity accumulation is utilized for share repurchases rather than funding asset growth).
8,500 8,000 7,500 7,000 6,500 6,000 5,500
Jun-05
Jul-05
Aug-05
Sep-05
Oct-05
Nov-05
Dec-05
Jan-06
Feb-06
Mar-06
Apr-06
May-06
Jun-06
Jul-06
Aug-06
Sep-06
Oct-06
Nov-06
Dec-06
Jan-07
Feb-07
Mar-07
Apr-07
May-07
Why Own This Stock?
1. CHCO is highly profitable
2. CHCO is well-positioned for the future
2. CHCO is growing
Internal Loan Growth Internal Deposit Growth
Improvements to Retail Distribution System Acquisition
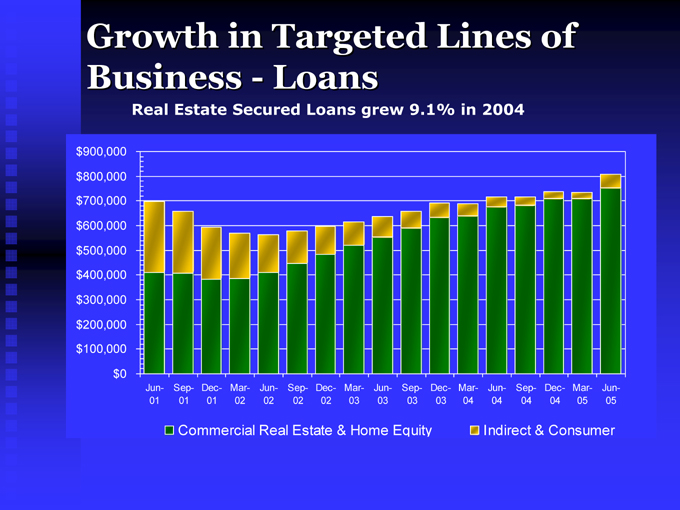
Growth in Targeted Lines of Business—Loans
Real Estate Secured Loans grew 9.1% in 2004 $900,000
$800,000 $700,000
$600,000
$500,000 $400,000
$300,000
$200,000 $100,000
$0
Jun-01 Sep-01 Dec-01 Mar-02 Jun-02 Sep-02 Dec-02 Mar-03 Jun-03 Sep-03 Dec-03 Mar-04 Jun-04 Sep-04 Dec-04 Mar-05
Jun-05
Commercial Real Estate & Home Equity
Indirect & Consumer

Growth in Deposits:
Totally Free Checking Accounts
2002-2005
130,000 125,000 120,000 115,000 110,000 105,000 100,000 95,000 90,000
7.3% CAGR (excluding acquisition)
Feb-02 Apr-02 Jun-02 Aug-02 Oct-02 Dec-02 Feb-03 Apr-03 Jun-03 Aug-03 Oct-03 Dec-03 Feb-04 Apr-04 Jun-04 Aug-04 Oct-04 Dec-04 Feb-05 Apr-05 Jun-05
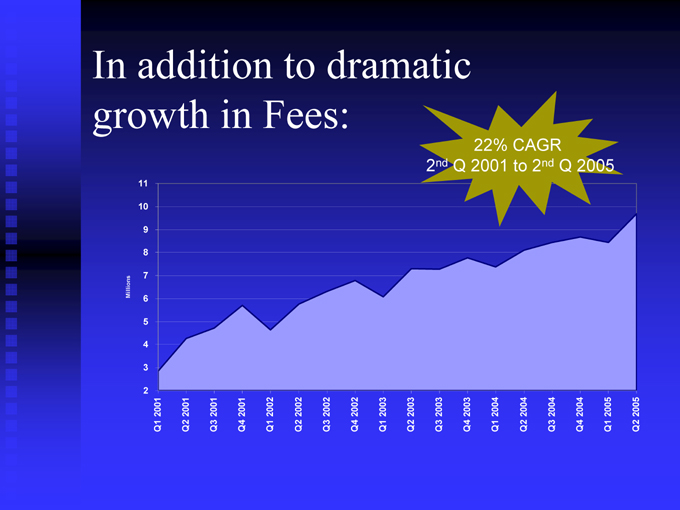
In addition to dramatic growth in Fees:
22% CAGR 2nd Q 2001 to 2nd Q 2005
11 10 9 8
7
Millions 6
5 4 3 2
Q1 2001 Q2 2001 Q3 2001 Q4 2001 Q1 2002 Q2 2002 Q3 2002 Q4 2002 Q1 2003 Q2 2003 Q3 2003 Q4 2003 Q1 2004 Q2 2004 Q3 2004 Q4 2004 Q1 2005 Q2 2005

Strategic Opportunities
Branch Restructuring – additions, closures, relocations Capital Flexiblity Aquisitions
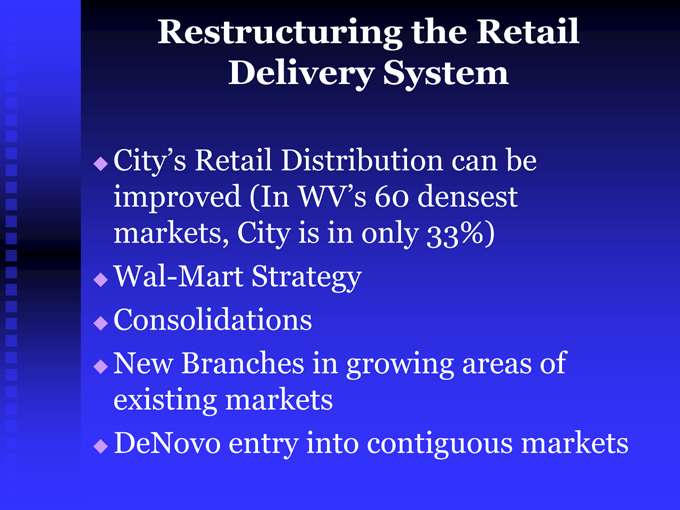
Restructuring the Retail Delivery System
City’s Retail Distribution can be improved (In WV’s 60 densest markets, City is in only 33%) Wal-Mart Strategy Consolidations New Branches in growing areas of existing markets DeNovo entry into contiguous markets
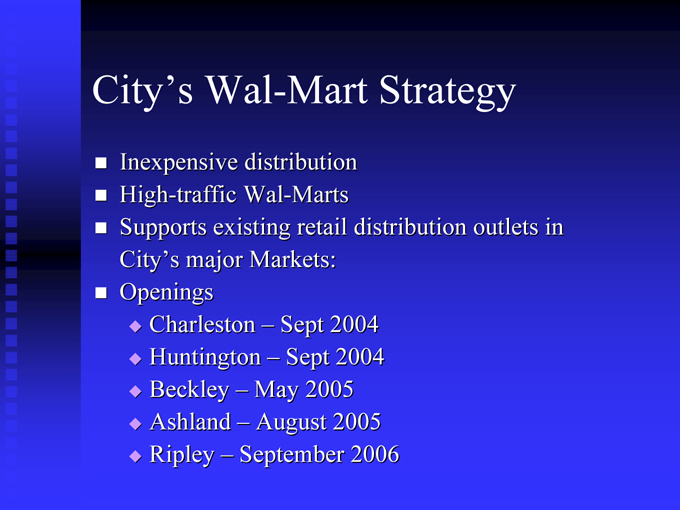
City’s Wal-Mart Strategy
Inexpensive distribution High-traffic Wal-Marts
Supports existing retail distribution outlets in City’s major Markets: Openings
Charleston – Sept 2004 Huntington – Sept 2004 Beckley – May 2005 Ashland – August 2005 Ripley – September 2006

CHCO’s newest branches: located in high-density shopping areas
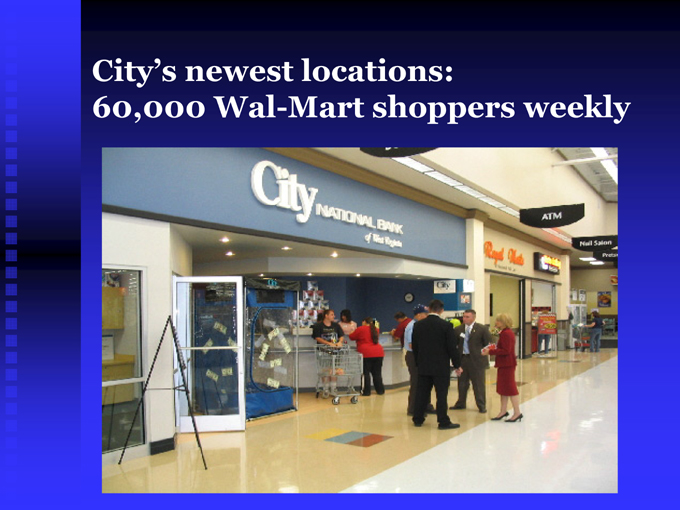
City’s newest locations:
60,000 Wal-Mart shoppers weekly
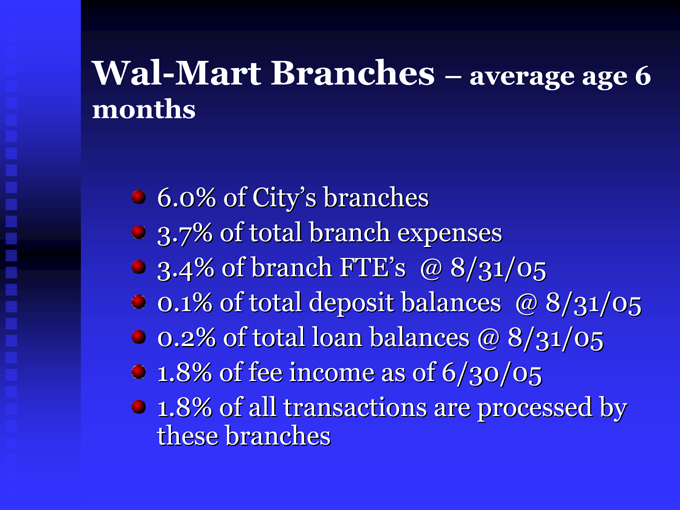
Wal-Mart Branches – average age 6
months
6.0% of City’s branches 3.7% of total branch expenses 3.4% of branch FTE’s @ 8/31/05 0.1% of total deposit balances @ 8/31/05 0.2% of total loan balances @ 8/31/05 1.8% of fee income as of 6/30/05 1.8% of all transactions are processed by these branches
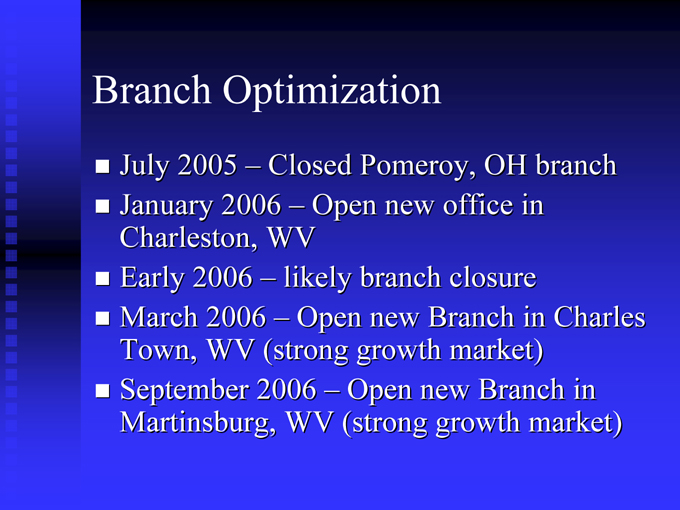
Branch Optimization
July 2005 – Closed Pomeroy, OH branch January 2006 – Open new office in Charleston, WV
Early 2006 – likely branch closure
March 2006 – Open new Branch in Charles Town, WV (strong growth market) September 2006 – Open new Branch in Martinsburg, WV (strong growth market)
Strategic Opportunities
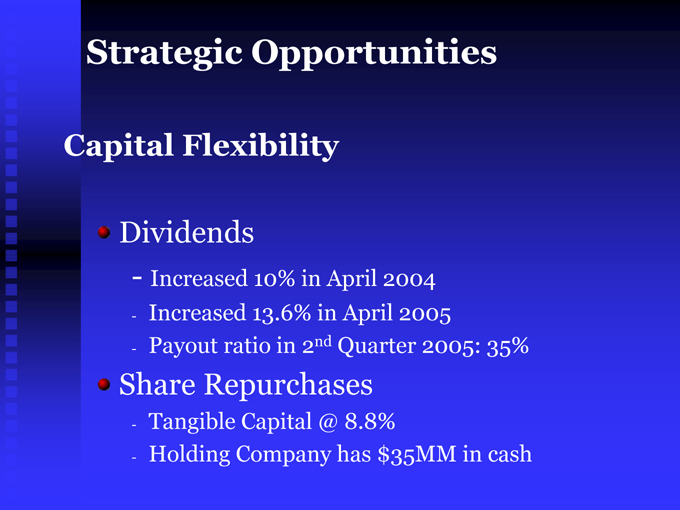
Capital Flexibility
Dividends
Increased 10% in April 2004 Increased 13.6% in April 2005 Payout ratio in 2nd Quarter 2005: 35%
Share Repurchases
Tangible Capital @ 8.8%
Holding Company has $35MM in cash
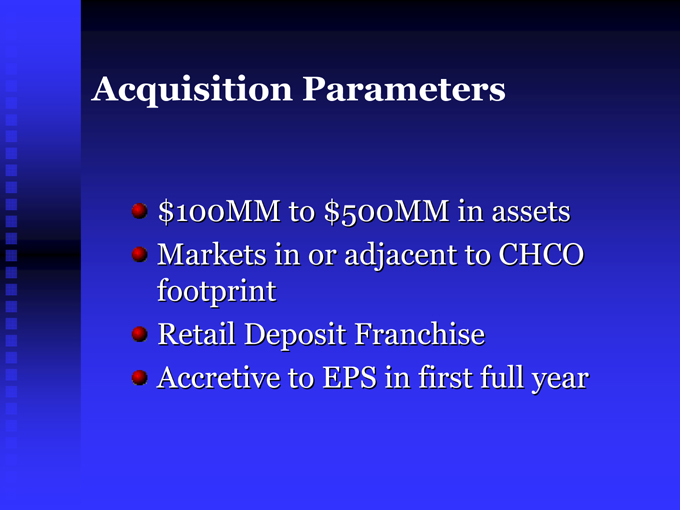
Acquisition Parameters $100MM to $500MM in assets Markets in or adjacent to CHCO footprint Retail Deposit Franchise Accretive to EPS in first full year
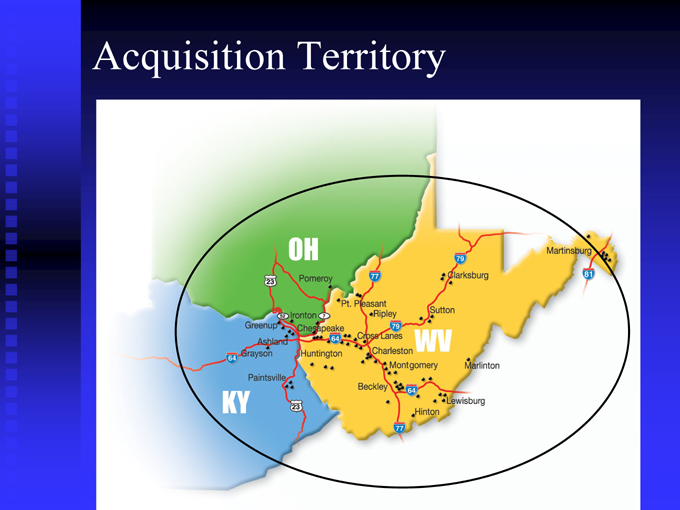
Acquisition Territory
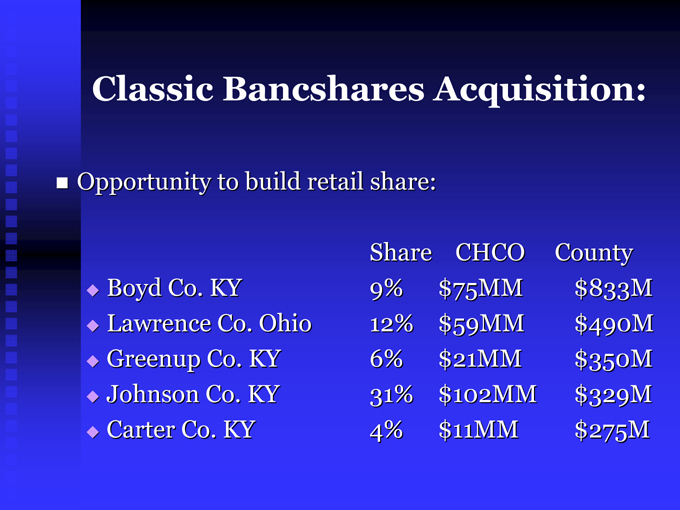
Classic Bancshares Acquisition:
Opportunity to build retail share:
Share CHCO County Boyd Co. KY 9% $75MM $833M Lawrence Co. Ohio 12% $59MM $490M Greenup Co. KY 6% $21MM $350M Johnson Co. KY 31% $102MM $329M Carter Co. KY 4% $11MM $275M

Combined Balance Sheet: Strong
CHCO CLAS
Combined 5/31/05
CLAS Contribution
Assets $2,273 $310 $2,583 12% Loans $1,353 $256 $1,609 16% Deposits $1,682 $233 $1,915 12%
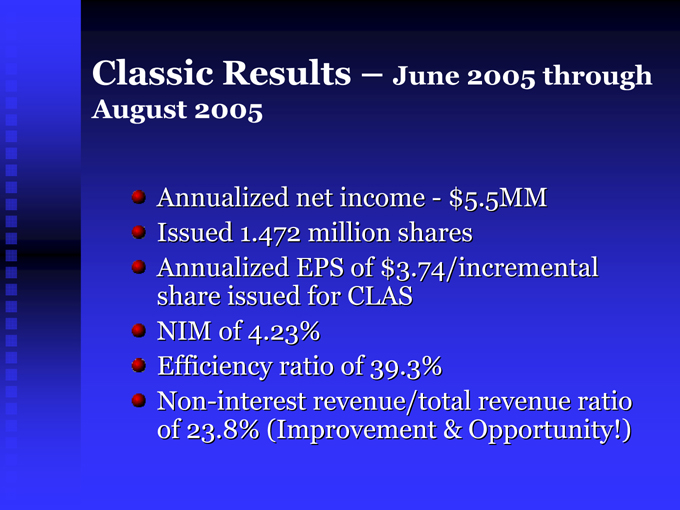
Classic Results – June 2005 through August 2005
Annualized net income—$5.5MM Issued 1.472 million shares Annualized EPS of $3.74/incremental share issued for CLAS
NIM of 4.23%
Efficiency ratio of 39.3%
Non-interest revenue/total revenue ratio of 23.8% (Improvement & Opportunity!)
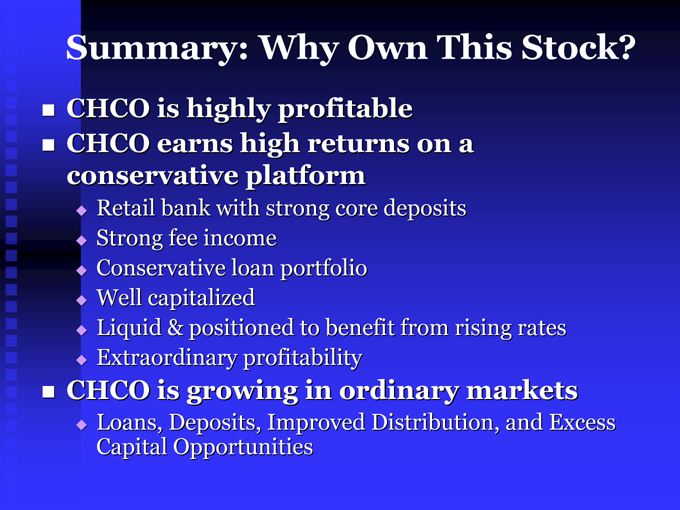
Summary: Why Own This Stock?
CHCO is highly profitable CHCO earns high returns on a conservative platform
Retail bank with strong core deposits Strong fee income Conservative loan portfolio Well capitalized
Liquid & positioned to benefit from rising rates Extraordinary profitability
CHCO is growing in ordinary markets
Loans, Deposits, Improved Distribution, and Excess Capital Opportunities
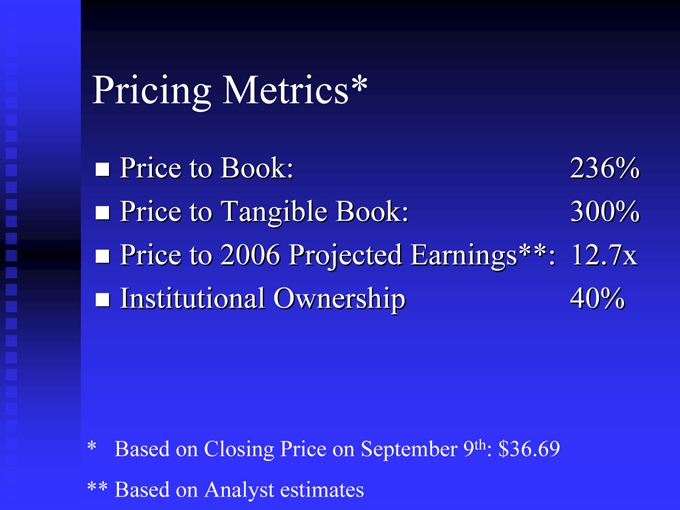
Pricing Metrics*
Price to Book: 236% Price to Tangible Book: 300% Price to 2006 Projected Earnings**: 12.7x Institutional Ownership 40%
* Based on Closing Price on September 9th: $36.69 ** Based on Analyst estimates