Exhibit 99.1
AmericanWest Bancorporation
Robert M. Daugherty
President and CEO
Diane L. Kelleher
Executive VP and CFO
Safe Harbor Statement
During the course of this presentation, we may make forward-looking statements regarding future events or the future financial performance of the Company. We wish to caution you that such forward-looking statements are just predictions subject to certain risks and uncertainties that could cause actual events or results to materially differ, either better or worse, from those projected. A discussion of risk factors that may affect the actual outcomes relating to such forward-looking statements and the Company’s results of operations in general is included in the Company’s Annual Report on Form 10-K and other filings with the Securities and Exchange Commission. The Company assumes no obligation to update or supplement forward-looking statements that become untrue because of subsequent events.
Overview of AWBC
Founded in 1974 as United Security Bank
IPO in 1995
Traded on NASDAQ under the symbol AWBC
In addition to inclusion in the Russell 2000, recently added to the Russell MicroCap Index
Operated acquired banks independently until 2001, when all were unified under the single name of AmericanWest Bank
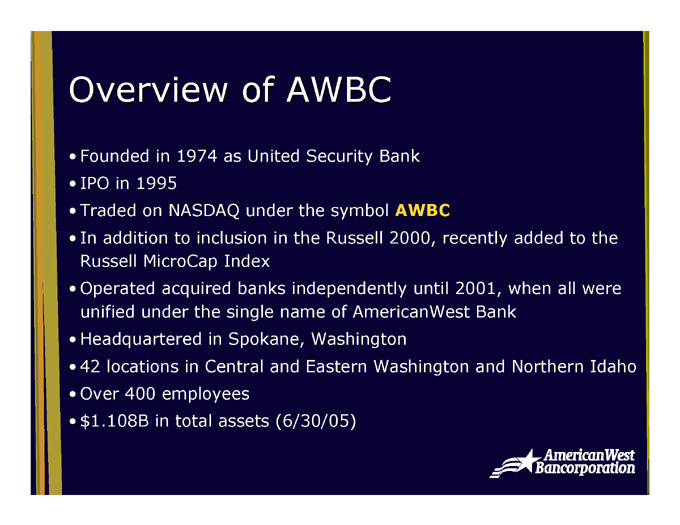
Headquartered in Spokane, Washington
42 locations in Central and Eastern Washington and Northern Idaho
Over 400 employees
$1.108B in total assets (6/30/05)
Kettle Falls
Colville
Chewelah
Mead
Spokane
Hayden
Liberty Lake
Kellogg
Davenport
Wallace
Latah
Seattle
Ephrata
Tekoa
St. Maries
Ellensburg
Moses Lake
Oakesdale
Palouse
Naches
Colfax
Pullman
Moscow
Yakima
Uniontown
Orofino
Sunnyside
Kennewick
Waitsburg
Dayton
Lewiston
Mabton
Prosser
Walla Walla
Portland
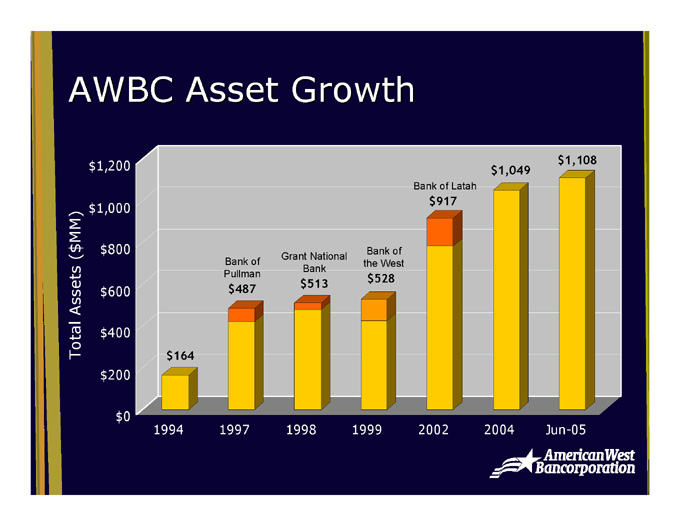
AWBC Asset Growth
$1,108
$1,049
$1,200
Bank of Latah
$917
$1,000
$800
Grant National Bank
Bank of the West
Bank of Pullman
$528
Total Assets ($MM)
$513
$600
$487
$400
$164
$200
$0
1998
1999
2002
2004
Jun-05
1994
1997
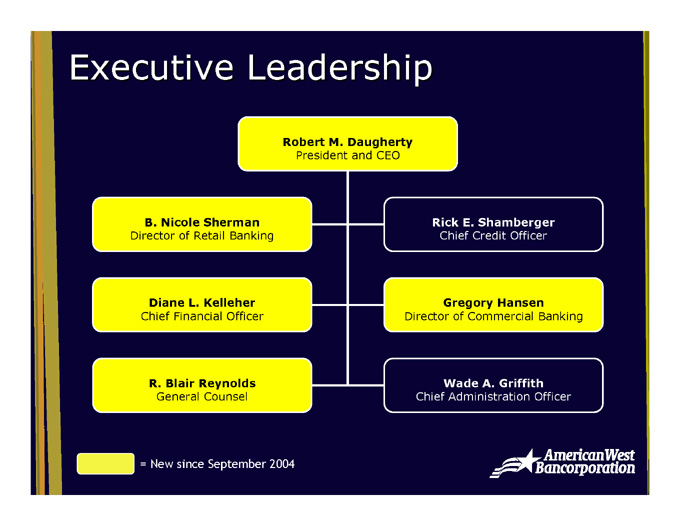
Executive Leadership
Robert M. Daugherty
President and CEO
B. Nicole Sherman
Director of Retail Banking
Diane L. Kelleher
Chief Financial Officer
R. Blair Reynolds
General Counsel
Rick E. Shamberger
Chief Credit Officer
Gregory Hansen
Director of Commercial Banking
Wade A. Griffith
Chief Administration Officer
= New since September 2004
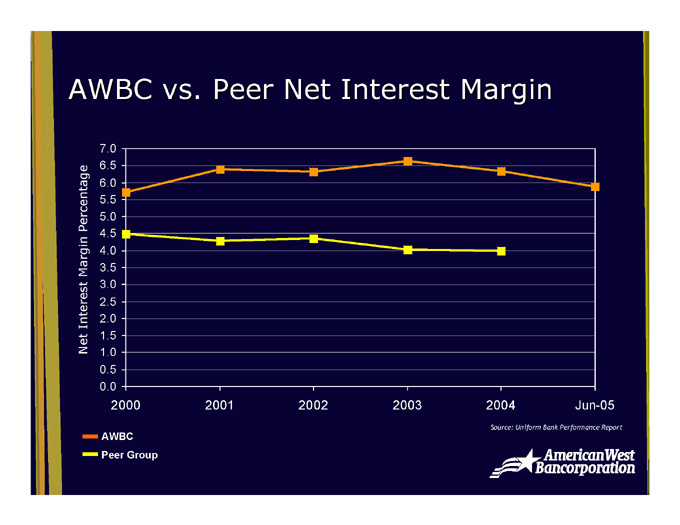
AWBC vs. Peer Net Interest Margin
7.0
6.5
6.0
5.5
5.0
4.5
4.0
Net Interest Margin Percentage
3.5
3.0
2.5
2.0
1.5
1.0
0.5
0.0
2004
2003
2002
2001
2000
Jun-05
AWBC
Peer Group
Source: Uniform Bank Performance Report
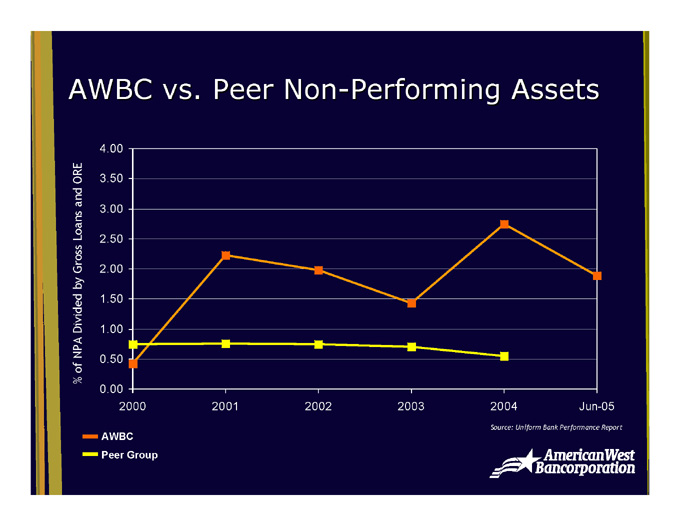
AWBC vs. Peer Non-Performing Assets
4.00
3.50
3.00
2.50
% of NPA Divided by Gross Loans and ORE
2.00
1.50
1.00
0.50
0.00
2004
2003
2002
2001
2000
Jun-05
AWBC
Peer Group
Source: Uniform Bank Performance Report
Improving Credit Quality
Centralized commercial credit underwriting
Changes to internal credit culture and staff incentives based on credit quality
2004 write-downs
Reduction in delinquencies
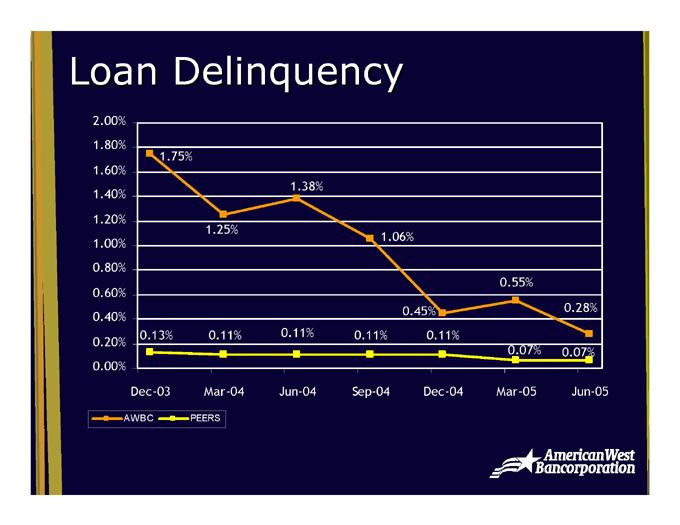
Loan Delinquency
2.00%
1.80%
1.75%
1.60%
1.38%
1.40%
1.20%
1.25%
1.06%
1.00%
0.80%
0.55%
0.60%
0.28%
0.40%
0.45%
0.11%
0.11%
0.11%
0.11%
0.13%
0.20%
0.07%
0.07%
0.00%
Mar-05
Dec-04
Sep-04
Jun-04
Mar-04
Dec-03
Jun-05
PEERS
AWBC
Fundamental Community Banking
Improved relationships
Focus on sales and service culture
Expanded target audience
Revised brand
Renewed emphasis on core values
Infrastructure Improvements
Technology investments
Internal training for all staff
In-house marketing team
Centralization of all operations
Centralized consumer lending center
Focus on internal communication

Retail Banking
Launched Retail Banking June 1, 2005, with 24 new products
Strong consumer lending emphasis (consumer, small business, mortgage)
Immediate focus on growing core deposits
Build relationships by focusing on the customer experience
Training at all levels
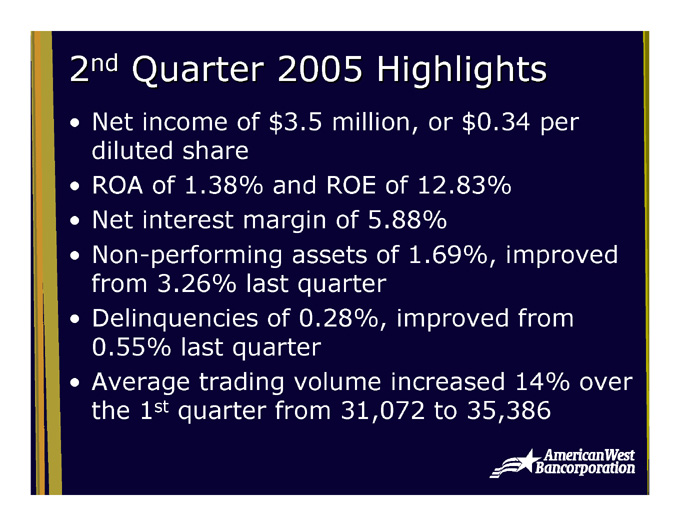
2nd Quarter 2005 Highlights
Net income of $3.5 million, or $0.34 per diluted share
ROA of 1.38% and ROE of 12.83%
Net interest margin of 5.88%
Non-performing assets of 1.69%, improved from 3.26% last quarter
Delinquencies of 0.28%, improved from 0.55% last quarter
Average trading volume increased 14% over the 1st quarter from 31,072 to 35,386
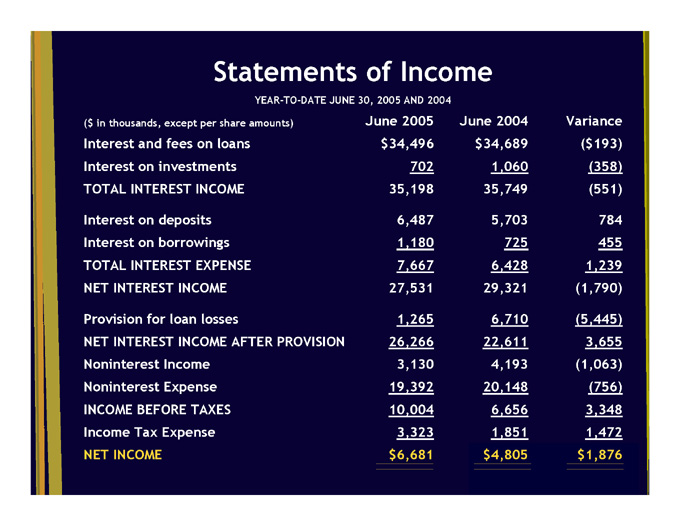
Statements of Income YEAR-TO-DATE JUNE 30, 2005 AND 2004 ($ in thousands, except per share amounts)
June 2005
June 2004
Variance
$34,496
$34,689
($193)
Interest and fees on loans
Interest on investments
702
1,060
(358)
TOTAL INTEREST INCOME
35,198
35,749
(551)
6,487
5,703
784
Interest on deposits
Interest on borrowings
1,180
725
455
TOTAL INTEREST EXPENSE
7,667
6,428
1,239
NET INTEREST INCOME
27,531
29,321
(1,790)
Provision for loan losses
1,265
6,710
(5,445)
NET INTEREST INCOME AFTER PROVISION
26,266
22,611
3,655
Noninterest Income
3,130
4,193
(1,063)
Noninterest Expense
19,392
20,148
(756)
INCOME BEFORE TAXES
10,004
6,656
3,348
Income Tax Expense
3,323
1,851
1,472
NET INCOME
$6,681
$4,805
$1,876
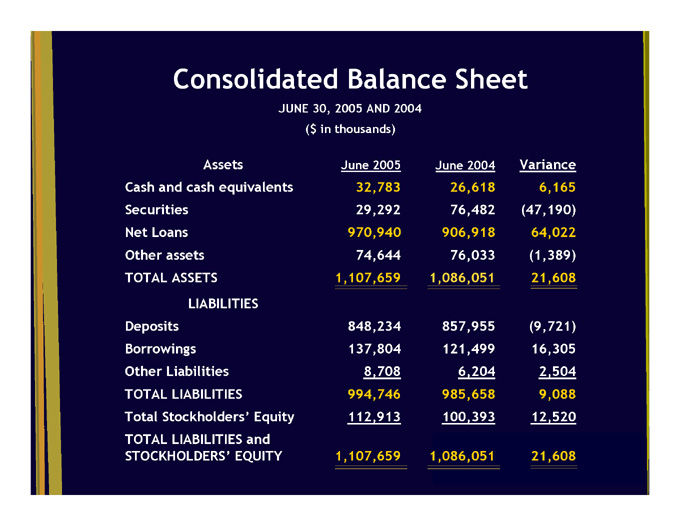
Consolidated Balance Sheet
JUNE 30, 2005 AND 2004
($ in thousands)
Assets
June 2005
June 2004
Variance
Cash and cash equivalents
32,783
26,618
6,165
Securities
29,292
76,482
(47,190)
970,940
906,918
64,022
Net Loans
Other assets
74,644
76,033
(1,389)
TOTAL ASSETS
1,107,659
1,086,051
21,608
LIABILITIES
Deposits
848,234
857,955
(9,721)
Borrowings
137,804
121,499
16,305
Other Liabilities
8,708
6,204
2,504
TOTAL LIABILITIES
994,746
985,658
9,088
Total Stockholders’ Equity
112,913
100,393
12,520
1,107,659
1,086,051
21,608
TOTAL LIABILITIES and STOCKHOLDERS’ EQUITY
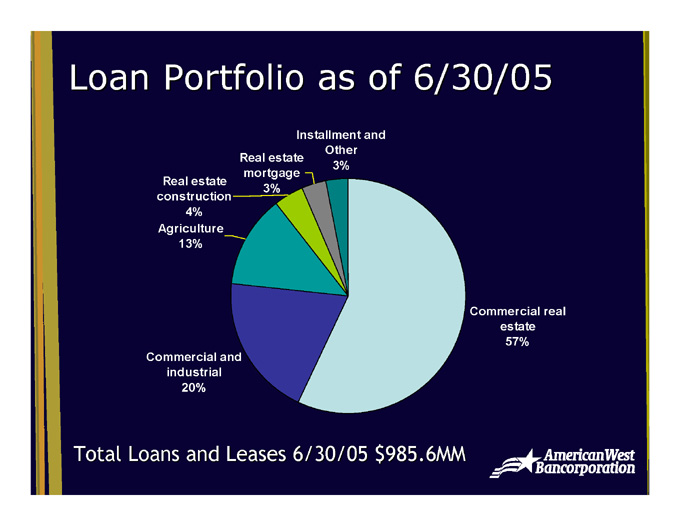
Loan Portfolio as of 6/30/05
Installment and Other
3%
Real estate mortgage
3%
Real estate
construction
4%
Agriculture
13%
Commercial real estate
57%
Commercial and industrial
20%
Total Loans and Leases 6/30/05 $985.6MM
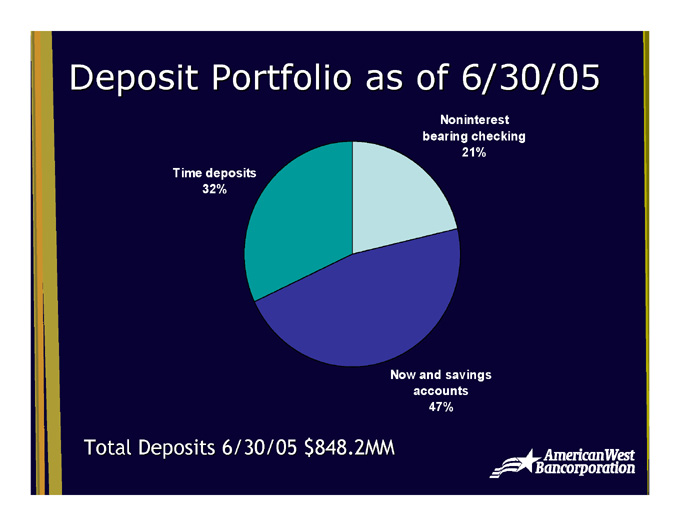
Deposit Portfolio as of 6/30/05
Noninterest bearing checking
21%
Time deposits
32%
Now and savings accounts
47%
Total Deposits 6/30/05 $848.2MM
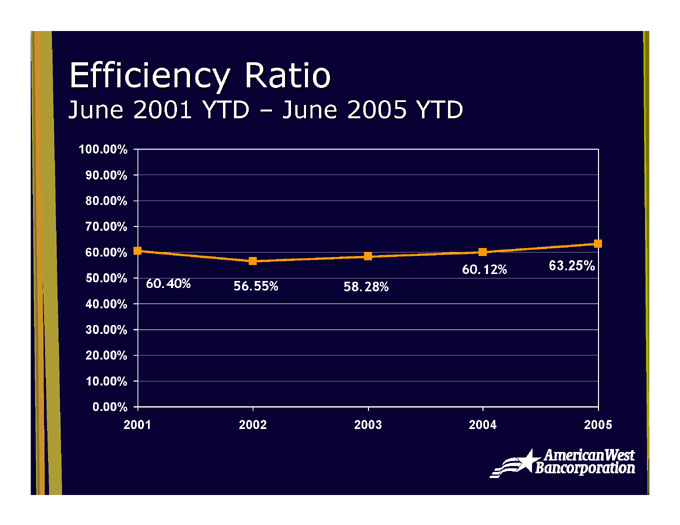
Efficiency Ratio
June 2001 YTD – June 2005 YTD
100.00%
90.00%
80.00%
70.00%
60.00%
63.25%
60.12%
60.40%
50.00%
58.28%
56.55%
40.00%
30.00%
20.00%
10.00%
0.00%
2005
2001
2002
2003
2004
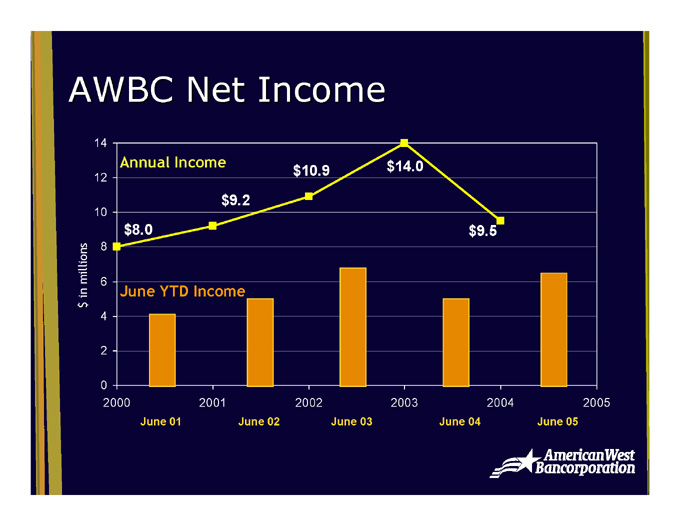
AWBC Net Income
14
Annual Income
$10.9
$14.0
12
$9.2
10
$9.5
$8.0
8
$ in millions
June YTD Income
6
4
2
0
2004
2003
2002
2001
2000
2005
June 04
June 03
June 02
June 01
June 05

Trends in ROAA and ROAE
16.00%
15.87%
14.00%
12.29%
13.87%
15.08%
12.00%
12.73%
10.00%
9.37%
8.00%
6.00%
4.00%
1.47%
1.41%
1.30%
0.88%
1.46%
1.44%
2.00%
0.00%
2004
2003
2002
2001
2000
6/30/2005
ROAE
ROAA
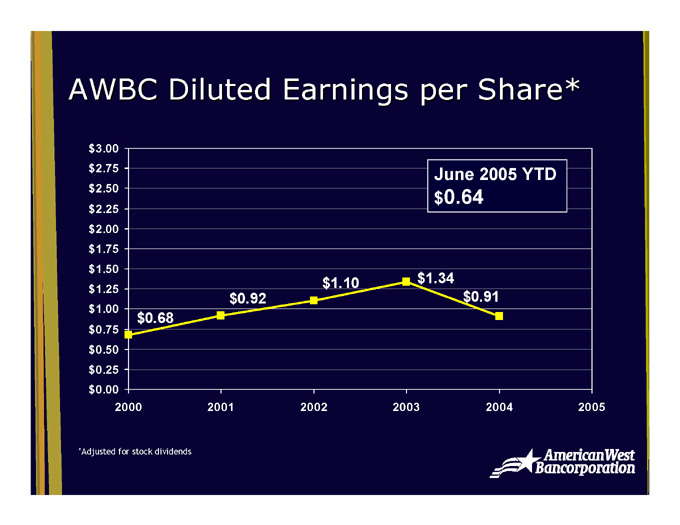
AWBC Diluted Earnings per Share*
$3.00
$2.75
June 2005 YTD
$0.64
$2.50
$2.25
$2.00
$1.75
$1.50
$1.34
$1.10
$1.25
$0.92
$0.91
$1.00
$0.68
$0.75
$0.50
$0.25
$0.00
2004
2003
2002
2001
2000
2005
*Adjusted for stock dividends
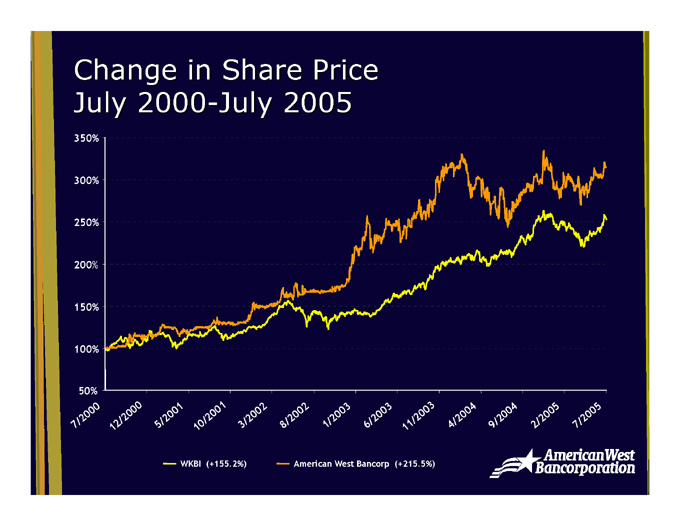
Change in Share Price
July 2000-July 2005
350%
300%
250%
200%
150%
100%
50%
2/2005
9/2004
4/2004
6/2003
1/2003
8/2002
3/2002
5/2001
7/2000
11/2003
10/2001
12/2000
7/2005
WKBI (+155.2%)
American West Bancorp (+215.5%)
Thank You.
AmericanWest Bancorporation
AmericanWest Bank Building
41 W Riverside, Suite 400
Spokane, Washington 99201
(509) 467-6993
www.awbank.net
InvestorInfo@awbank.net