    Member FDIC. Equal Housing Lender AmericanWest AmericanWest Bancorporation Bancorporation Robert M. Daugherty President and CEO Exhibit 99.1 |
 Safe Harbor Statement • During the course of this presentation we will make forward-looking statements which are: Subject to contingencies and uncertainties Not a guarantee of future performance Based on assumptions that may change Not to be relied on unduly • Many factors are beyond our ability to control or predict, including specific factors such as: Interest rates Economic conditions and regulatory requirements Asset performance • For all risk factors see AWBC’s Form 10-K as filed with the SEC |
 AWBC Overview • Founded in 1974 as United Security Bank • Operated acquired banks independently until 2001, when all were unified under the single name of AmericanWest Bank • Traded on NASDAQ under the symbol AWBC • Included in the Russell 2000 and Russell Microcap Indexes • Headquartered in Spokane, Washington • 43 Financial Centers located in Central & Eastern Washington and Northern Idaho as of May 1, 2006 • $1.338B in Total Assets and $1.082B in Total Deposits at March, 31 2006 • 501 Full Time Equivalent Employees as of May 1, 2006 |
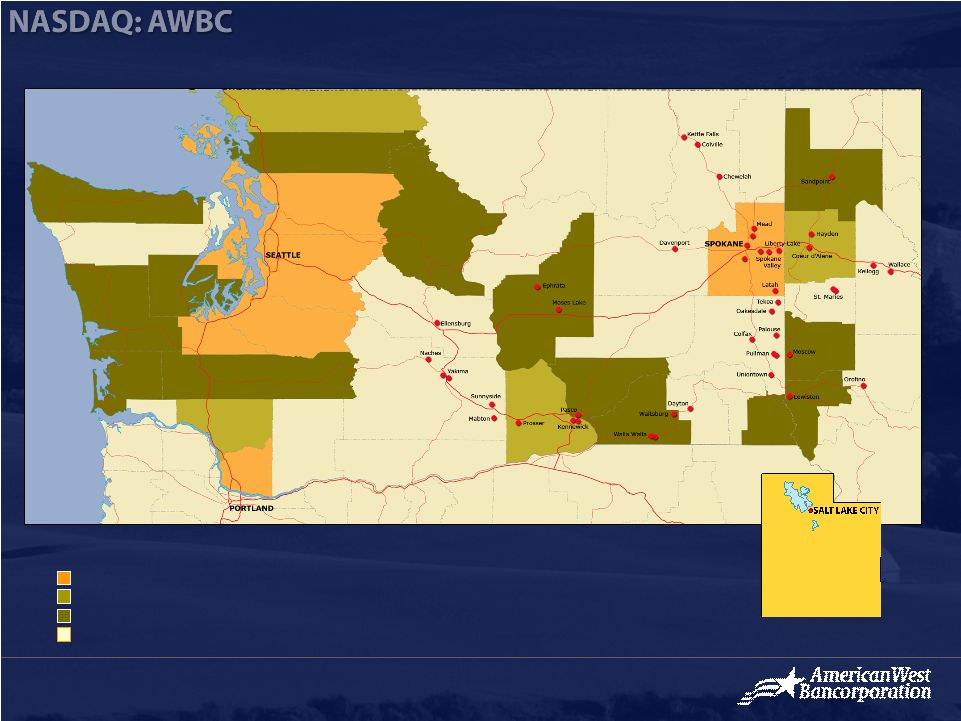 100+ 60-99 20-59 0-19 Population per Square Mile |
 A Turnaround Project in 2004 • Faced with MOU for Compliance Violations • State Issued Directive to Improve Credit Quality NPAs Peaked at $33MM or 3.26 % of Total Assets Substandard Assets at $65MM or 6.26 % of Total Assets • Three Regional Presidents • Dated Technology • No Retail Bank Strategy • Transactional vs. Relationship Focus |
 Turnaround Results: • MOU and Directive Lifted Fourth Quarter 2005 • NPAs Reduced to $17MM at 3/31/06 (a 48% Reduction) • Substandard Assets Reduced to $32MM (a 51% Reduction) • Dismantled Regions and Unified One Bank • Deployed Upgraded Technologies Automated Teller Platform Automated New Accounts Platform Rolling Out Upgraded ATM’s Throughout Our Footprint |
 Results: Solidify Credit Culture Turned Over Nearly Half of our Lenders and 80% of the Bank’s Executive Officers Standardized Credit Approval Documentation and Analysis Tools Centralized Credit Administration in Spokane Modified Policies and Provided Training to Lenders Centralized Appraisal Ordering and Review; Evaluation Ordering and Review |
 Results: Retail Expansion Launched Retail Banking in June 2005 with 30 Consumer and Small Business Products Supported Retail Banking with a new Marketing Department • Launched Private Banking Initiative • Re-structured/Expanded Residential & Construction Lending • Building Management Team that has Customer Sales and Service Experience |
 Results: De Novo and Acquisition Growth Expansion into Idaho is Underway Construction of New Financial Center in Hayden, ID – Anticipated Completion in Fall 2006 Opened New Financial Center in Sandpoint, ID Opening New Financial Center in Coeur d’Alene, ID - Anticipated Building Completion in Fall 2006 Completed Acquisition of Columbia Trust Bancorp to Expand in the Tri-Cities and Yakima/Sunnyside Markets Announced Expansion into Utah with an Initial Loan Office and Ultimately Multiple Full-service Financial Centers |
 2005 Highlights • Improved Profitability to $13.9MM from $9.5MM in 2004, Up 45.9% • Nonperforming Assets Down $11.8MM or 41.3% from 2004 • Decreased Provisions for Loan Losses from $13MM in 2004 to $2.4MM, an 81.9% Improvement • Gross Loans up $36MM to $963MM from $927MM at 12/31/04 • Noninterest Bearing Deposits up 13% • Net Interest Margin of 5.47% compared to 6.04% at 12/31/04 is Declining as Expected with Increased Credit Quality • Efficiency Ratio Higher than Peers due to Investments in Technology, Infrastructure and Expansion to Support Growth |
 Deposit Market Share Opportunities (at 12-31-05) 3.7% 10 Yakima, WA 7.1% 3 Walla Walla, WA 1.1% 13 Kootenai, ID 1.1% 15 Tri-Cities, WA 3.4% 10 Spokane, WA SHARE AWBC RANK COUNTY/MSA Source: SNL Financial |
 Key Growth Markets (2000-2005) 61% 57% 13% 9% 5% Walla Walla (WA) 18% 12% 15% 12% 13% Median HH Income Increase 15% 56% 3% 7% Salt Lake (UT) 18% 41% 5% 2% Yakima (WA) 38% 111% 23% 16% North Idaho (ID) 29% 53% Median Home Sale Price Increase 52% 59% Home Sales Increase 19% 7% Total Employment Increase 13% 6% Households Increase Tri-Cities (WA) Spokane (WA) GROWTH TYPE Sources: US Census Bureau, Washington Center for Real Estate Research & Idaho Assoc of Realtors |
 Diversified Key Industries (percent of total employment) Retail (9.3%) Local Gov’t (9.7%) Agriculture (12.1%) Health Care & Social Assistance (12.8%) Manufacturing (14.5%) Walla Walla (WA) Healthcare & Social Assistance (8.4%) Healthcare & Social Assistance (11.6%) Leisure & Hospitality (13.5%) Retail (10.7%) Local Gov’t (9.8%) Administrative & Support Services; includes Airline Reservations (7.0%) Accommodation & Food Services (7.1%) Manufacturing (9.4%) Retail (11.3%) Salt Lake (UT) Retail (9.7%) Manufacturing (9.8%) Local Gov’t (13.0%) Agriculture (21.3%) Yakima (WA) Educational & Healthcare (10.4%) Prof & Business Svc (11.4%) Total Gov’t (18.0%) Retail & Wholesale (18.9%) Kootenai (WA) Healthcare & Social Assistance (8.4%) Accommodation & Food Services (8.1%) Agriculture (10.1%) Manufacturing (8.7%) Prof & Technical Svc (11.1%) Retail (12.8%) Local Gov’t (12.9%) Healthcare & Social Assistance (14.5%) Tri-Cities (WA) Spokane (WA) Sources: Washington State Employment Security Dept., Idaho Dept. of Commerce and Labor |
 Profit-Based Growth Strategy • Focus on Fundamental “Relationship-Based” Community Banking • Solidify Credit Culture • Expansion of Retail Banking • Development of Sales Culture • Growth through de novo Branching and Acquisitions |
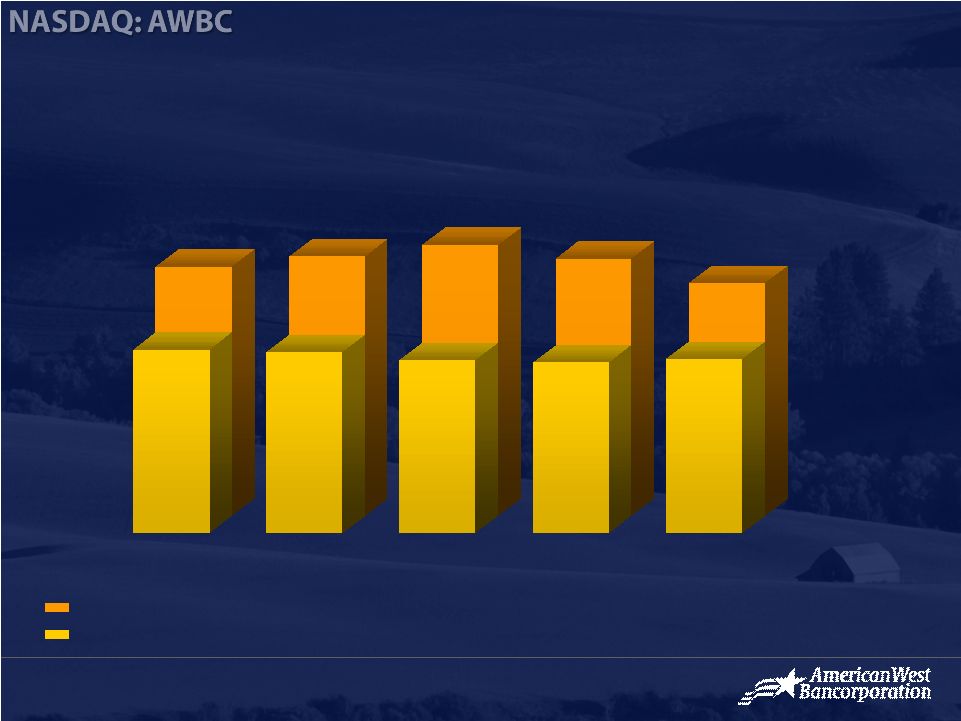
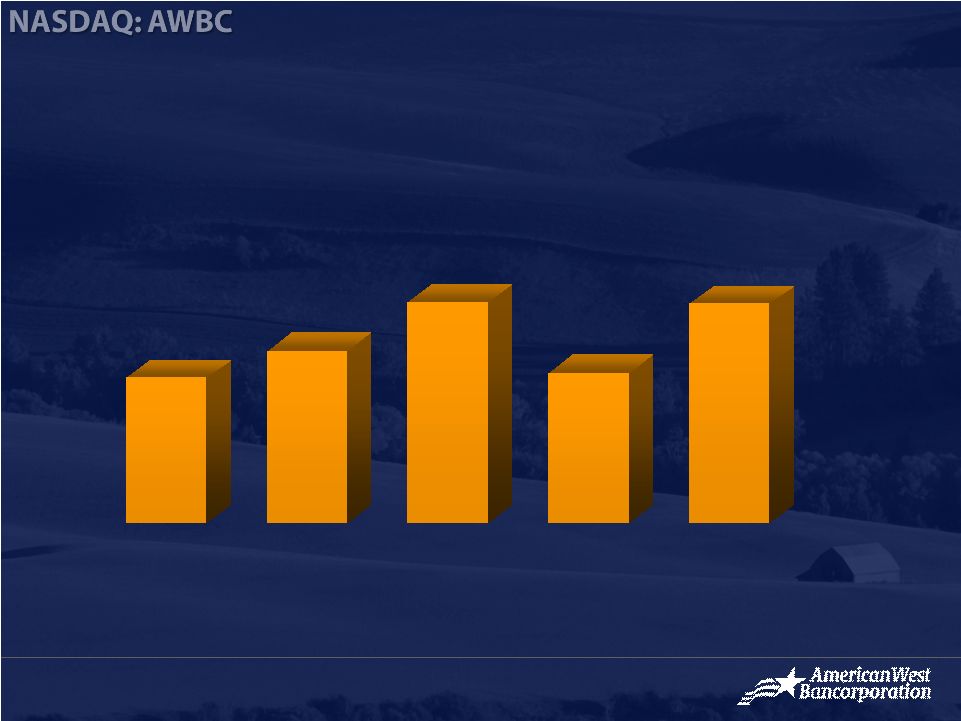 AWBC Net Income ($ in millions) 2001 2002 2003 2004 2005 $9.2 $10.9 $14.0 $9.5 $13.9 |
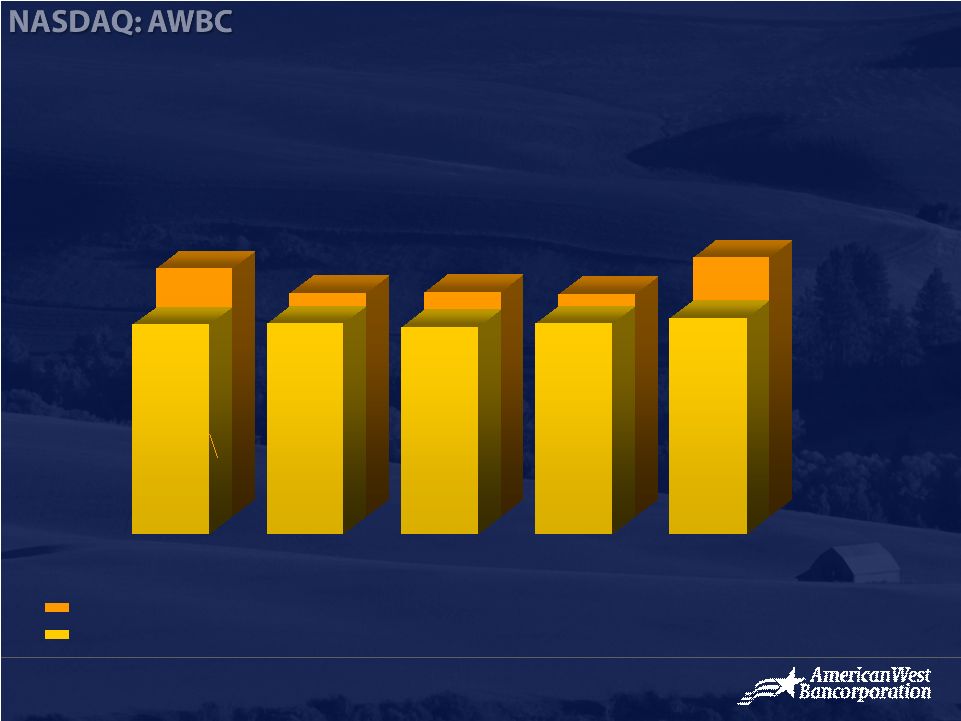
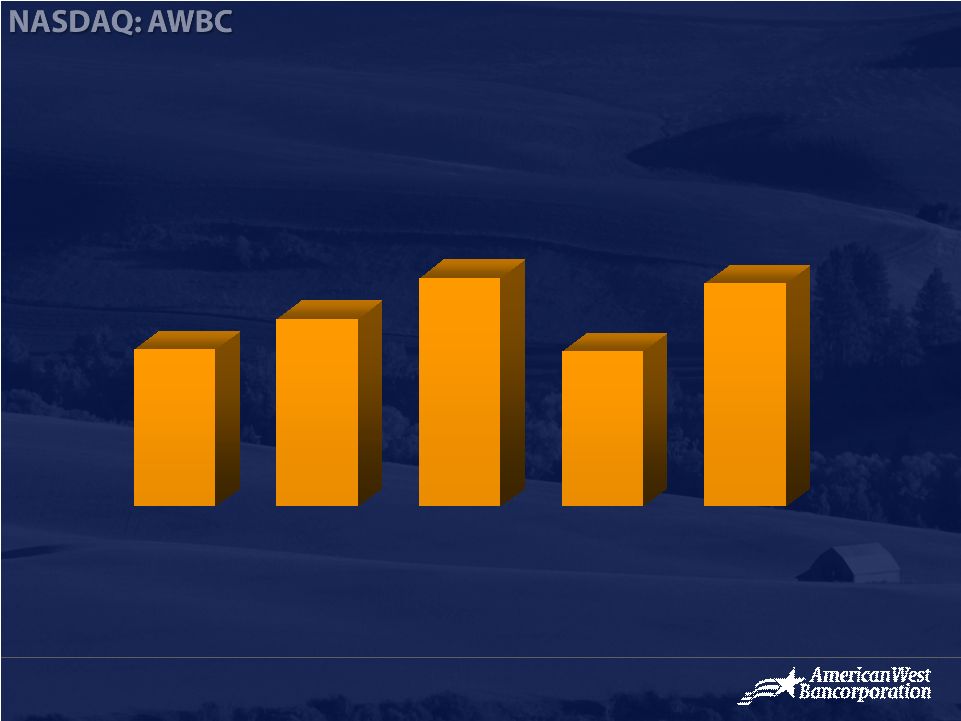 AWBC Diluted Earnings per Share* $0.92 $1.10 $1.34 $0.91 $1.31 *Adjusted for stock dividends 2001 2002 2003 2004 2005 |
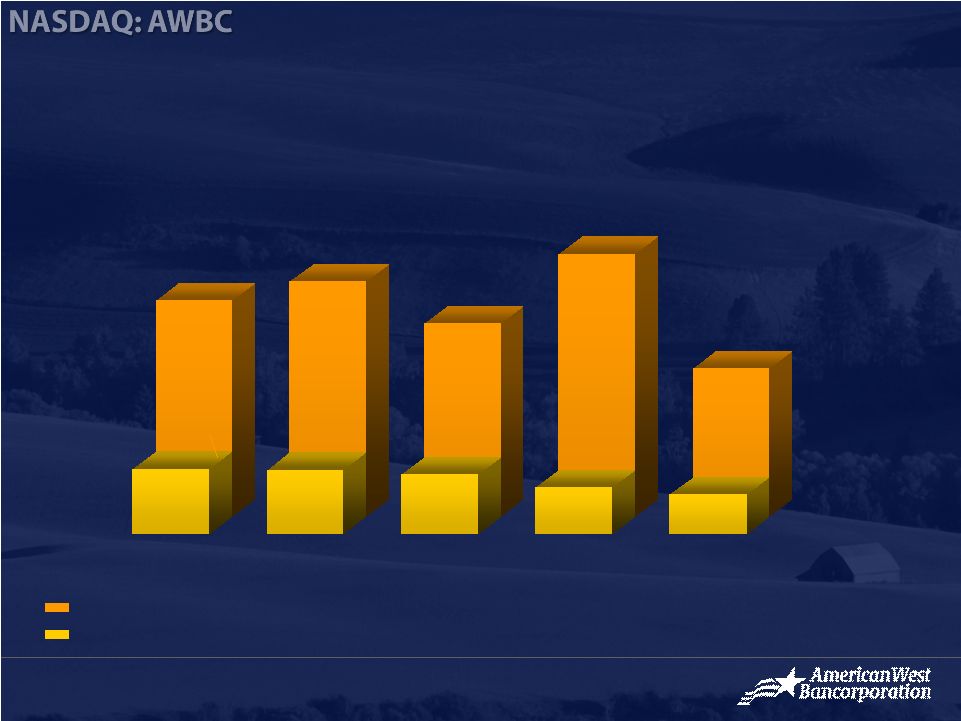
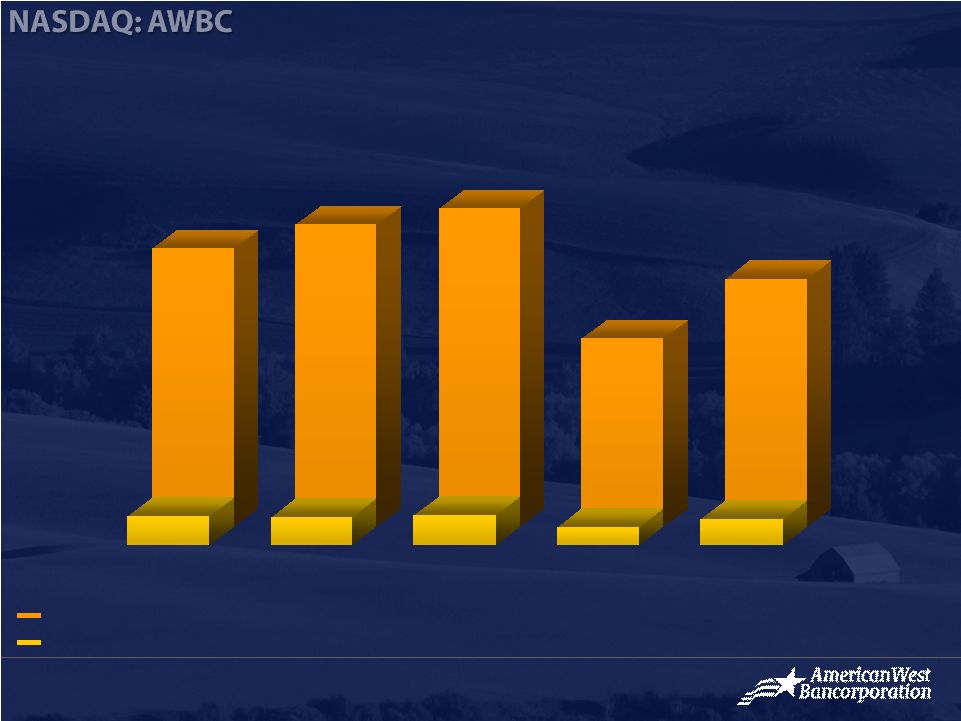 Trends in ROAA and ROAE (percentage) 2001 2002 2003 2004 2005 13.87 15.08 15.87 9.37 12.34 1.46 1.41 1.47 0.88 1.29 Return on Average Equity Return on Average Assets |
 AWBC vs. Peer Net Interest Margin (percentage) 5.47 2001 2002 2003 2004 2005 AWBC Peer Group (average) Source: Bank Holding Company Performance Report 6.08 5.85 6.36 6.04 4.07 4.16 4.25 4.05 3.99 |
 AWBC vs. Peer Non-Performing Assets 1.73 2001 2002 2003 2004 2005 AWBC Peer Group (average) Source: Bank Holding Company Performance Report 2.74 2.52 2.26 3.06 % of NPA Divided by Gross Loans and ORE 0.75 0.76 0.61 0.52 0.70 |
 AWBC vs. Peer Capital Ratios (Tier I) 10.65 2001 2002 2003 2004 2005 AWBC Peer Group (average) Source: Bank Holding Company Performance Report 8.54 9.84 9.18 9.03 8.56 8.68 8.65 8.80 8.55 |
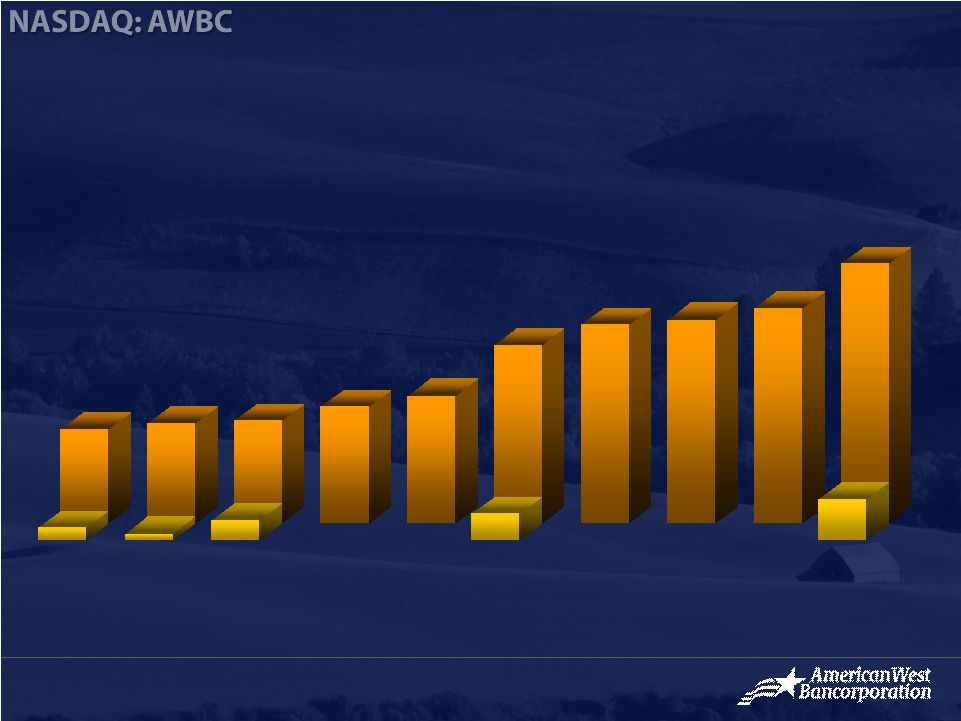 AWBC Total Assets ($ in millions) Grant National Bank of Pullman Bank of Latah Bank of the West 1997 1998 1999 2000 2001 2002 2003 2004 2005 Q1 2006 $487 $513 $528 $599 $659 $917 $1,024 $1,049 $1,109 $1,338 Columbia Trust Bank |
 Q1 2006 Highlights • Completed Columbia Trust Bancorp Acquisition Assets in excess of $200MM as of 3/15/06 Anticipated cost savings and accretion within 12 months • Opened de novo Financial Center in Sandpoint, ID • Grew Organic Loan Portfolio by 4.2% • Core Deposits Up $4.9MM • Nonperforming Loans to Total Gross Loans Decreased to 1.33% from 1.50% at 12/31/05 |
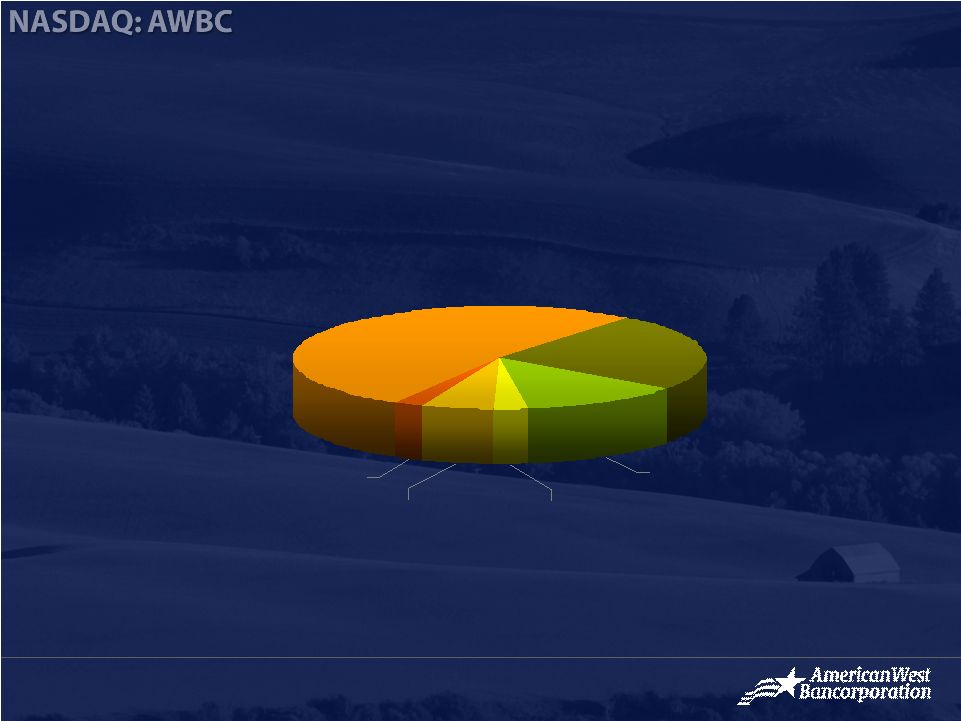 Commercial RE 52.2% Agriculture 12.8% RE Construction 2.8% Commercial & Industrial 24.4% RE Mortgage 5.5% Installment and Other 2.3% Gross Loans and Leases, including HFS, $1.149B at 3-31-06 Loan Portfolio |
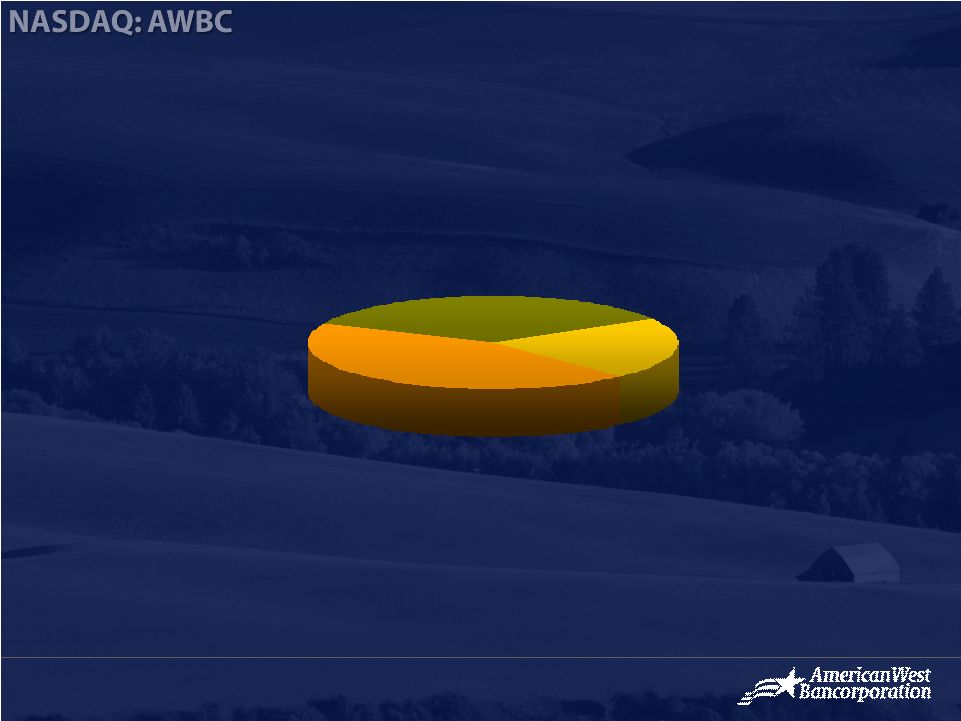 Noninterest Checking 21% Time Deposits 35% NOW & Savings Accounts/MMDA 44% Deposit Portfolio Total Deposits $1.082B at of 3-31-06 |
 $(1,490) $3,139 $1,649 NET INCOME (686) 1,566 880 Provision for Income Tax (2,176) 4,705 2,529 INCOME BEFORE PROVISION FOR INCOME TAX 2,142 9,526 11,668 Noninterest Expense (277) 2,033 1,756 Noninterest Income 243 12,198 12,441 NET INTEREST INCOME AFTER PROVISION (293) 1,075 782 Provision for loan losses (50) 13,273 13,223 NET INTEREST INCOME 2,548 3,595 6,143 TOTAL INTEREST EXPENSE 539 568 1,107 Interest on borrowings 2,009 3,027 5,036 Interest on deposits 2,498 16,868 19,366 TOTAL INTEREST INCOME 156 353 509 Interest on investments and other $2,342 $16,515 $18,857 Interest and fees on loans $ Variance 3/31/2005 3/31/2006 FOR THE THREE MONTHS ENDED MARCH 31, 2006 AND 2005 ($ in thousands, unaudited) Statements of Income |
 $228,883 $1,109,134 $1,338,017 TOTAL LIABILITIES and STOCKHOLDERS’ EQUITY 22,932 121,477 144,409 Total Stockholders’ Equity 205,951 987,657 1,193,608 TOTAL LIABILITIES 628 8,380 9,008 Other Liabilities 20,731 81,847 102,578 Borrowings $184,592 $897,430 $1,082,022 Deposits LIABILITIES $228,883 $1,109,134 $1,338,017 TOTAL ASSETS 32,004 74,538 106,542 Other assets 184,509 951,288 1,135,797 Net Loans, including HFS 14,041 31,364 45,405 Securities $(1,671) $ 51,944 $50,273 Cash and cash equivalents $ Variance 12/31/2005 3/31/2006 ASSETS ($ in thousands, unaudited) Consolidated Balance Sheet |
 2006 Performance Targets • Drive Income Growth Loan and deposit portfolio growth in the mid-high teens Further diversify loans with growth in C&I and consumer loans Target increase in non-interest checking accounts • Realize CTB Cost Savings and Target Accretion • Continue to Improve Credit Quality with NPAs/Loans < 1.00% • Improve Noninterest Income/Revenues with Services • Decrease Noninterest Expense/Assets through Growth • Optimally Deploy Capital to Enhance Shareholder Value while Maintaining “Well-Capitalized” Regulatory Ratios • Achieve Strong ROA > 1.30% and ROE > 13% |
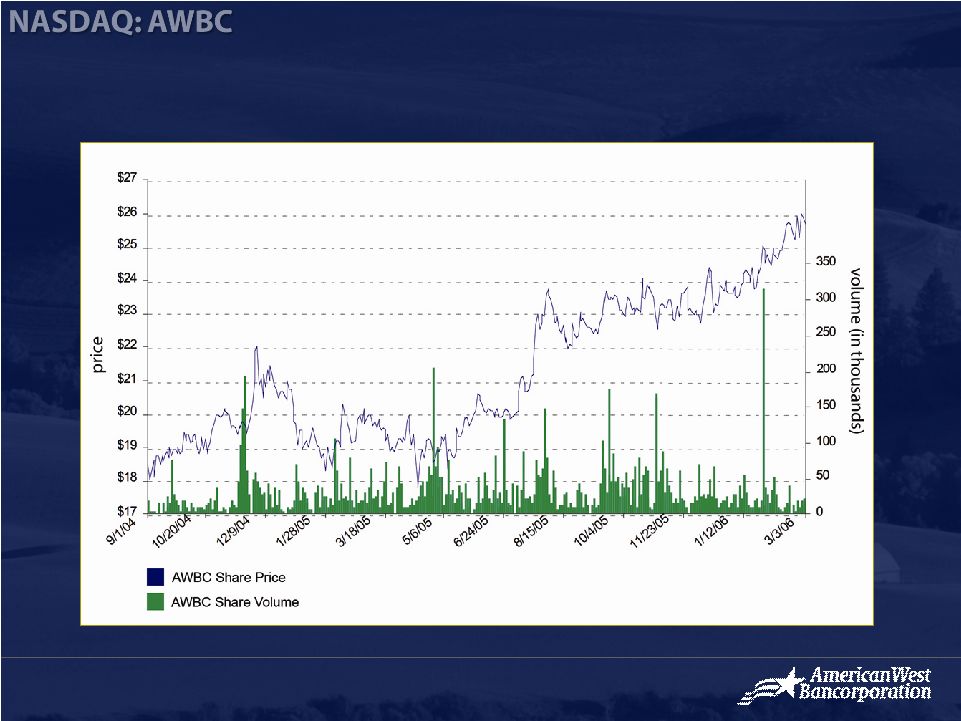 AWBC Share Price History (6-04 to 3-06) |
    Member FDIC. Equal Housing Lender Thank You. AmericanWest Bancorporation AmericanWest Bank Building 41 W Riverside, Suite 400 Spokane, Washington 99201 (509) 467-6993 www.awbank.net InvestorInfo@awbank.net |