UNITED STATES
SECURITIES AND EXCHANGE COMMISSION
Washington, D.C. 20549
FORM N-CSR
CERTIFIED SHAREHOLDER REPORT OF REGISTERED
MANAGEMENT INVESTMENT COMPANIES
Investment Company Act file Number _811-03835_
Value Line Centurion Fund, Inc.
(Exact name of registrant as specified in charter)
7 Times Square, New York, N.Y. 10036
(Address of principal executive offices) (Zip Code)
Registrant’s telephone number, including area code: 212-907-1900
Date of fiscal year end: December 31, 2013
Date of reporting period: December 31, 2013
| Item I | Reports to Stockholders |
A copy of the Annual Report to Stockholders for the period ended 12/31/13 is included with this Form.
| Annual Report To Contractowners | ||
| ■ Value Line Centurion Fund, Inc. | ||
 | An Update from Fund Management (Unaudited) | |
| PRESIDENT’S LETTER | ||
| Dear Shareholders: | ||
| We are pleased to present you with this annual report for Value Line Centurion Fund, Inc. (the “Fund”) for the 12 months ended December 31, 2013. We are especially excited to present this annual report in its new format, revised to be more informative, more useful and more reader-friendly. | ||
The 12 months ended December 31, 2013 were rewarding ones for the Fund, as the Fund generated robust double-digit absolute gains. Additionally, the Fund outpaced its peers for the three-year period ended December 31, 2013, as noted by leading independent mutual fund advisory service Lipper Inc.1 (multi-cap growth category). | ||
Objective: Long-term growth of capital Inception Date: | On the following pages, the Fund’s portfolio manager discusses the management of the Fund over the annual period. The conversation highlights key factors influencing recent performance of the Fund. You will also find a schedule of investments and financial statements for the Fund. Before reviewing the performance of your mutual fund investment, we encourage you to take a brief look at the major factors affecting the financial markets over the 12 months ended December 31, 2013, especially given the newsworthy events of the year. | |
| November 15, 1983 | ||
| Economic Review | ||
| Net Assets at | ||
December 31, 2013: $154,037,619 Portfolio Composition at December 31, 2013: (Percentage of Total Net Assets) 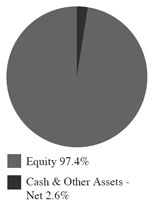 | U.S. real Gross Domestic Product (GDP) was lackluster in the first half of 2013 at less than 2% in the first and second calendar quarters. The U.S. economy faced strong headwinds, including increases in the payroll tax and disruptions from the sequester budget cuts. Third quarter GDP, however, turned sharply upward, coming in at 4.1%, as boosted by higher consumer spending, increased business investment and rising inventories. Early estimates for fourth quarter GDP suggest the U.S. economy may have ended the year with more momentum than had been anticipated. | |
| Despite the growing economy, inflation remained modest. Consumer prices stayed in check, with headline Consumer Price Index (CPI) rising just 1.5% before seasonal adjustment. Limited wage growth and declining energy prices contributed to the relatively benign inflation scenario. The U.S. also saw moderate job growth, as reflected in a drop in unemployment from 7.8% at the close of 2012 to 6.7% at the close of 2013. The makeup of job growth, however, was somewhat disappointing, with hiring generally concentrated in sectors representative of low-wage jobs. | ||
| In recognition of the improving U.S. economy, the Federal Reserve (the Fed) had ongoing—and well-publicized—discussions throughout the year about the possibility of reducing its monthly bond-buying program. Speculation about the timing and the magnitude of the tapering had great impact on both the equity and fixed income markets. Ultimately, Fed Chair Bernanke kept the focus on key market data as the basis for the decision on tapering. As unemployment dropped close to the Fed’s stated target of 6.5%, the Fed finally announced in December 2013 that it would modestly reduce its monthly bond purchases—from $85 billion to $75 billion—beginning in January 2014. At the same time, the Fed reaffirmed its commitment to maintaining low short-term interest rates, with the targeted federal funds rate not likely to exceed 0.25%. At the end of the annual period, the appointment of Janet Yellen as the new Fed Chair was seen by the financial markets as likely to not steer the Fed too far off the course set by Ben Bernanke. |
| About information in this report: | ||
| ● | It is important to consider the Fund’s investment objectives, risks, fees and expenses before investing. All funds involve some risk, including possible loss of the principal amount invested. | |
| VALUE LINE CENTURION FUND, INC. | 1 | |
| Annual Report To Contractowners | ||
| ■ Value Line Centurion Fund, Inc | ||
| 2 | VALUE LINE CENTURION FUND, INC. |
Annual Report To Contractowners | ||
| ■ Value Line Centurion Fund, Inc. | ||
| 1 | Lipper Leader ratings are derived from highly sophisticated formulas that analyze funds against clearly defined criteria. Funds are compared to similar funds, and only those that trust stand out are awarded Lipper Leader status. Funds are ranked against their peers on each of four measures: Total Return, Consistent Return, Preservations and Expense. A fifth measure, Tax Efficiency, applies in the United States. Scores are subject to change every month and are calculated for the following periods: 3-year, 5-year, 10-year and overall. The overall calculation is based on an equal-weighted average of percentile ranks for each measure over 3-year, 5-year and 10-year periods (if applicable). For each measure, the highest 20% of funds in each peer group are named Lipper Leaders. The next 20% receive a rating of 4: the middle 20% are rated 3: the next 20% are rated 2; and the lowest 20% are rated 1. | |
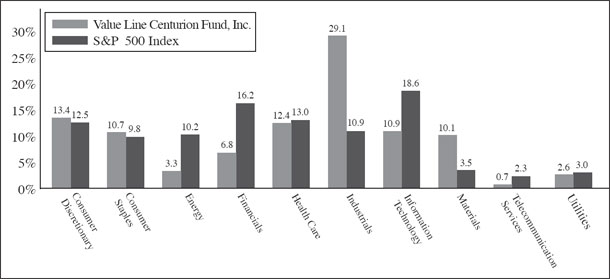
| 2 | The S&P 500® Index consists of 500 stocks which are traded on the New York Stock Exchange, American Stock Exchange and the NASDAQ National Market System and is representative of the broad stock market. This is an unmanaged index and does not reflect charges, expenses or taxes, and it is not possible to directly invest in this index | |
| VALUE LINE CENTURION FUND, INC. | 3 | |
Annual Report To Contractowners | ||
| ■ Value Line Centurion Fund, Inc. | ||
| 4 | VALUE LINE CENTURION FUND, INC. |
Annual Report To Contractowners | ||
| ■ Value Line Centurion Fund, Inc. | ||
| VALUE LINE CENTURION FUND, INC. | 5 |
■ Value Line Centurion Fund, Inc. | Annual Report To Contractowners |
| Percentage of | |
| Company | Total Net Assets |
| Rollins, Inc. | 1.83% |
| Alliance Data Systems Corp. | 1.71% |
| TJX Companies, Inc. (The) | 1.63% |
| AutoZone, Inc. | 1.55% |
| AMETEK, Inc. | 1.54% |
| MasterCard, Inc. Class A | 1.52% |
| Yum! Brands, Inc. | 1.46% |
| Church & Dwight Co., Inc. | 1.41% |
| Affiliated Managers Group, Inc. | 1.41% |
| Roper Industries, Inc. | 1.39% |
| 6 | VALUE LINE CENTURION FUND, INC. |
■ Value Line Centurion Fund, Inc. | Annual Report To Contractowners |
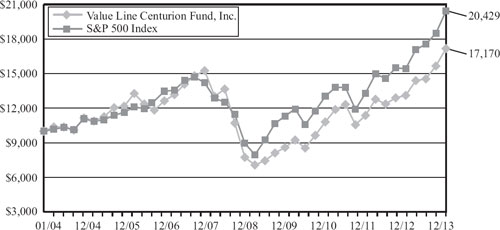
| 1 | 3 | 5 | 10 | Since Inception | |
| Yr | Yrs | Yrs | Yrs | 11/15/1983 | |
| Value Line Centurion Fund, Inc. | 30.96% | 16.67% | 17.28% | 5.55% | 8.67% |
| S&P 500 Index | 32.38% | 16.18% | 17.94% | 7.40% | 11.02% |
| VALUE LINE CENTURION FUND, INC. | 7 |
■ Value Line Centurion Fund, Inc. |
Beginning Account Value July 1, 2013 | Ending Account Value December 31, 2013 | Expenses Paid During Period* | Annualized Expense Ratio | ||||
| Actual | $1,000 | $1,180.79 | $4.89 | 0.89% | |||
| Hypothetical (5% return before expenses) | $1,000 | $1,020.72 | $4.53 | 0.89% |
| * | Expenses are equal to the Fund’s annualized expense ratio multiplied by the average account value over the period, multiplied by 184/365 (to reflect the Fund’s most recent fiscal half-year). This expense ratio may differ from the expense ratio shown in the financial highlights. |
| 8 |
■ Value Line Centurion Fund, Inc. |
Schedule of Investments | ||||
| December 31, 2013 | ||||
| Shares | Value | |||
| Common Stocks — 97.4% | ||||
| Consumer Discretionary — 13.1% | ||||
| 5,000 | AutoZone, Inc. * | $ | 2,389,700 | |
| 16,200 | BorgWarner, Inc. | 905,742 | ||
| 24,800 | Brinker International, Inc. | 1,149,232 | ||
| 8,100 | Buckle, Inc. (The) (1) | 425,736 | ||
| 9,300 | Buffalo Wild Wings, Inc. * | 1,368,960 | ||
| 14,700 | Dick’s Sporting Goods, Inc. | 854,070 | ||
| 8,600 | Domino’s Pizza, Inc. | 598,990 | ||
| 12,600 | Gildan Activewear, Inc. | 671,706 | ||
| 40,200 | LKQ Corp. * | 1,322,580 | ||
| 17,600 | McDonald’s Corp. | 1,707,728 | ||
| 12,200 | NIKE, Inc. Class B | 959,408 | ||
| 4,200 | O’Reilly Automotive, Inc. * | 540,582 | ||
| 11,500 | Penn National Gaming, Inc. * | 164,795 | ||
| 10,000 | Starbucks Corp. | 783,900 | ||
| 39,400 | TJX Companies, Inc. (The) | 2,510,962 | ||
| 14,400 | VF Corp. | 897,696 | ||
| 18,600 | Wolverine World Wide, Inc. | 631,656 | ||
| 29,800 | Yum! Brands, Inc. | 2,253,178 | ||
| 20,136,621 | ||||
| Consumer Staples — 10.4% | ||||
| 3,300 | Boston Beer Co., Inc. (The) Class A * | 797,907 | ||
| 5,800 | British American Tobacco PLC ADR | 623,036 | ||
| 5,500 | Bunge Ltd. | 451,605 | ||
| 14,000 | Casey’s General Stores, Inc. | 983,500 | ||
| 32,800 | Church & Dwight Co., Inc. | 2,173,984 | ||
| 8,500 | Costco Wholesale Corp. | 1,011,585 | ||
| 8,900 | Energizer Holdings, Inc. | 963,336 | ||
| 51,000 | Flowers Foods, Inc. | 1,094,970 | ||
| 23,000 | General Mills, Inc. | 1,147,930 | ||
| 41,000 | Hormel Foods Corp. | 1,851,970 | ||
| 12,800 | Ingredion, Inc. | 876,288 | ||
| 21,500 | J&J Snack Foods Corp. | 1,904,685 | ||
| 11,000 | PepsiCo, Inc. | 912,340 | ||
| 9,000 | Reynolds American, Inc. | 449,910 | ||
| 14,000 | Whole Foods Market, Inc. | 809,620 | ||
| 16,052,666 | ||||
| Energy — 3.2% | ||||
| 7,500 | Chevron Corp. | 936,825 | ||
| 2,500 | Core Laboratories N.V. | 477,375 | ||
| 16,700 | Enbridge, Inc. | 729,456 | ||
| 12,000 | EQT Corp. | 1,077,360 | ||
| 7,000 | FMC Technologies, Inc. * | 365,470 | ||
| 16,000 | Noble Energy, Inc. | 1,089,760 | ||
| 3,400 | Oceaneering International, Inc. | 268,192 | ||
| 4,944,438 | ||||
| Financials — 6.6% | ||||
| 10,000 | Affiliated Managers Group, Inc. * | 2,168,800 | ||
| 22,800 | AFLAC, Inc. | 1,523,040 | ||
| 10,500 | American Tower Corp. REIT | 838,110 | ||
| 3,000 | Bank of Montreal | 199,980 | ||
| 3,200 | BlackRock, Inc. | 1,012,704 | ||
| 3,100 | Camden Property Trust REIT | 176,328 | ||
| 700 | Everest Re Group Ltd. | 109,109 | ||
| 11,500 | Gaming and Leisure Properties, Inc. REIT * | 584,315 | ||
| 7,800 | M&T Bank Corp. (1) | 908,076 | ||
| 5,600 | MetLife, Inc. | 301,952 | ||
| 7,000 | Prudential Financial, Inc. | 645,540 | ||
| 10,200 | Royal Bank of Canada | 685,746 | ||
| Shares | Value | |||
| Financials — 6.6% (Continued) | ||||
| 6,000 | Stifel Financial Corp. * | $ | 287,520 | |
| 8,400 | T. Rowe Price Group, Inc. | 703,668 | ||
| 10,144,888 | ||||
| Health Care — 12.1% | ||||
| 14,000 | Alexion Pharmaceuticals, Inc. * | 1,862,840 | ||
| 11,600 | Allergan, Inc. | 1,288,528 | ||
| 7,000 | C.R. Bard, Inc. | 937,580 | ||
| 17,174 | Catamaran Corp. * | 815,421 | ||
| 26,000 | Cerner Corp. * | 1,449,240 | ||
| 1,000 | Cooper Cos., Inc. (The) | 123,840 | ||
| 2,300 | DaVita HealthCare Partners, Inc. * | 145,751 | ||
| 5,100 | DENTSPLY International, Inc. | 247,248 | ||
| 7,800 | Edwards Lifesciences Corp. * | 512,928 | ||
| 19,340 | Express Scripts Holding Co. * | 1,358,442 | ||
| 15,300 | Henry Schein, Inc. * | 1,748,178 | ||
| 7,300 | IDEXX Laboratories, Inc. * | 776,501 | ||
| 5,500 | McKesson Corp. | 887,700 | ||
| 19,800 | Mednax, Inc. * | 1,056,924 | ||
| 5,700 | Mettler-Toledo International, Inc. * | 1,382,763 | ||
| 10,700 | Novo Nordisk A/S ADR | 1,976,932 | ||
| 13,000 | Teva Pharmaceutical Industries Ltd. ADR | 521,040 | ||
| 12,000 | Thermo Fisher Scientific, Inc. | 1,336,200 | ||
| 1,600 | Universal Health Services, Inc. Class B | 130,016 | ||
| 18,558,072 | ||||
| Industrials — 28.4% | ||||
| 9,500 | Acuity Brands, Inc. | 1,038,540 | ||
| 45,000 | AMETEK, Inc. | 2,370,150 | ||
| 28,000 | Canadian National Railway Co. | 1,596,560 | ||
| 1,000 | Canadian Pacific Railway Ltd. | 151,320 | ||
| 11,000 | Chicago Bridge & Iron Co. N.V. | 914,540 | ||
| 14,400 | CLARCOR, Inc. | 926,640 | ||
| 8,300 | Clean Harbors, Inc. * | 497,668 | ||
| 24,700 | Danaher Corp. | 1,906,840 | ||
| 38,000 | Donaldson Co., Inc. | 1,651,480 | ||
| 5,700 | Equifax, Inc. | 393,813 | ||
| 4,400 | Esterline Technologies Corp. * | 448,624 | ||
| 10,000 | Fastenal Co. | 475,100 | ||
| 8,800 | FedEx Corp. | 1,265,176 | ||
| 9,700 | General Dynamics Corp. | 926,835 | ||
| 9,200 | Graco, Inc. | 718,704 | ||
| 15,890 | HEICO Corp. | 920,825 | ||
| 18,200 | IDEX Corp. | 1,344,070 | ||
| 5,600 | IHS, Inc. Class A * | 670,320 | ||
| 7,600 | ITT Corp. | 329,992 | ||
| 8,000 | J.B. Hunt Transport Services, Inc. | 618,400 | ||
| 10,100 | Kansas City Southern | 1,250,683 | ||
| 18,800 | Kirby Corp. * | 1,865,900 | ||
| 7,000 | L-3 Communications Holdings, Inc. | 748,020 | ||
| 3,000 | Middleby Corp. (The) * | 719,910 | ||
| 3,500 | Oshkosh Corp. | 176,330 | ||
| 12,000 | Parker Hannifin Corp. | 1,543,680 | ||
| 7,000 | Precision Castparts Corp. | 1,885,100 | ||
| 23,000 | Republic Services, Inc. | 763,600 | ||
| 3,500 | Rockwell Automation, Inc. | 413,560 | ||
| 93,200 | Rollins, Inc. | 2,823,028 | ||
| 15,400 | Roper Industries, Inc. | 2,135,672 | ||
| 15,100 | Stericycle, Inc. * | 1,754,167 | ||
| 18,000 | Toro Co. (The) | 1,144,800 | ||
| 5,900 | Union Pacific Corp. | 991,200 | ||
| 14,100 | United Technologies Corp. | 1,604,580 | ||
| See Notes to Financial Statements. | 9 |
| ■ Value Line Centurion Fund, Inc. | ||||||||
| Schedule of Investments (Continued) | ||||||||
| December 31, 2013 | ||||||||
| Shares | Value | |||||||
| Common Stocks — 97.4% (Continued) | ||||||||
| Industrials — 28.4% (Continued) | ||||||||
| 7,000 | Valmont Industries, Inc. (1) | $ | 1,043,840 | |||||
| 5,800 | W.W. Grainger, Inc. | 1,481,436 | ||||||
| 12,400 | Wabtec Corp. | 920,948 | ||||||
| 30,000 | Waste Connections, Inc. | 1,308,900 | ||||||
| 43,740,951 | ||||||||
| Information Technology — 10.6% | ||||||||
| 21,400 | Accenture PLC Class A | 1,759,508 | ||||||
| 10,000 | Alliance Data Systems Corp. * | 2,629,300 | ||||||
| 7,700 | Amphenol Corp. Class A | 686,686 | ||||||
| 4,500 | Anixter International, Inc. | 404,280 | ||||||
| 14,800 | ANSYS, Inc. * | 1,290,560 | ||||||
| 8,200 | Automatic Data Processing, Inc. | 662,642 | ||||||
| 18,300 | Cognizant Technology Solutions Corp. Class A * | 1,847,934 | ||||||
| 4,500 | Equinix, Inc. * | 798,525 | ||||||
| 6,200 | Fiserv, Inc. * | 366,110 | ||||||
| 2,800 | MasterCard, Inc. Class A | 2,339,288 | ||||||
| 2,300 | MICROS Systems, Inc. * | 131,951 | ||||||
| 12,400 | Open Text Corp. (1) | 1,140,304 | ||||||
| 28,400 | Salesforce.com, Inc. * | 1,567,396 | ||||||
| 7,800 | WEX, Inc. * | 772,434 | ||||||
| 16,396,918 | ||||||||
| Materials — 9.8% | ||||||||
| 3,600 | Airgas, Inc. | 402,660 | ||||||
| 6,500 | Albemarle Corp. | 412,035 | ||||||
| 15,200 | Ball Corp. | 785,232 | ||||||
| 32,500 | Crown Holdings, Inc. * | 1,448,525 | ||||||
| 17,000 | Ecolab, Inc. | 1,772,590 | ||||||
| 27,600 | FMC Corp. | 2,082,696 | ||||||
| 2,400 | NewMarket Corp. | 801,960 | ||||||
| 12,200 | Packaging Corp. of America | 772,016 | ||||||
| 13,000 | Praxair, Inc. | 1,690,390 | ||||||
| 14,000 | Scotts Miracle-Gro Co. (The) Class A | 871,080 | ||||||
| 15,100 | Sigma-Aldrich Corp. | 1,419,551 | ||||||
| 31,600 | Silgan Holdings, Inc. | 1,517,432 | ||||||
| 16,000 | Valspar Corp. (The) | 1,140,640 | ||||||
| 15,116,807 | ||||||||
| Telecommunication Services — 0.7% | ||||||||
| 15,400 | Crown Castle International Corp. * | 1,130,822 | ||||||
| Utilities — 2.5% | ||||||||
| 11,500 | ITC Holdings Corp. | 1,101,930 | ||||||
| 5,000 | NextEra Energy, Inc. | 428,100 | ||||||
| 18,000 | ONEOK, Inc. | 1,119,240 | ||||||
| 28,300 | Questar Corp. | 650,617 | ||||||
| 13,200 | Wisconsin Energy Corp. | 545,688 | ||||||
| 3,845,575 | ||||||||
| Total Common Stocks | ||||||||
| (Cost $78,861,634) | 150,067,758 | |||||||
| Principal | |||||||||
| Amount | Value | ||||||||
| Short-Term Investments — 3.6% | |||||||||
| Repurchase Agreements — 1.9% | |||||||||
| $ | 2,900,000 | With Morgan Stanley, 0.01%, dated 12/31/13, due 01/02/14, delivery value $2,900,002 (collateralized by $2,955,000 U.S. Treasury Notes 1.000% due 03/31/17, with a value of $2,969,557) | $ | 2,900,000 | |||||
| Joint Repurchase Agreements (Investments of Cash Collateral for Securities on Loan) — 1.7% | |||||||||
| 936,802 | Joint Repurchase Agreement with Morgan Stanley, 0.02%, dated 12/31/13, due 01/02/14, delivery value $936,803 (collateralized by $955,538 U.S. Treasury Bonds 4.250% - 8.000% due 11/15/21 - 11/15/40 and U.S. Treasury Notes 2.625% - 2.750% due 11/15/20 - 11/15/23, with a value of $950,675) | 936,802 | |||||||
| 1,382,897 | Joint Repurchase Agreement with Barclays, 0.01%, dated 12/31/13, due 01/02/14, delivery value $1,382,898 (collateralized by $1,410,557 U.S. Treasury Inflation Indexed Notes 1.250% - 1.875% due 04/15/14 - 07/15/15, with a value of $1,399,894) | 1,382,897 | |||||||
| 223,048 | Joint Repurchase Agreement with Citigroup, 0.01%, dated 12/31/13, due 01/02/14, delivery value $223,048 (collateralized by $227,511 U.S. Treasury Bills 0.000% due 02/20/14, with a value of $227,511) | 223,048 | |||||||
| 2,542,747 | |||||||||
| Total Short-Term Investments | |||||||||
| (Cost $5,442,747) | 5,442,747 | ||||||||
| Total Investments — 101.0% | |||||||||
| (Cost $84,304,381) | $ | 155,510,505 | |||||||
| Excess Of Liabilities Over Cash And Other Assets —(1.0)% | (1,472,886 | ) | |||||||
| Net Assets —100.0% | $ | 154,037,619 | |||||||
| Net Asset Value Per Outstanding Share ($154,037,619 ÷ 8,166,828 shares outstanding ) | $ | 18.86 | |||||||
* | Non-income producing. | ||||||||
(1) | A portion or all of the security was held on loan. As of December 31, 2013, the market value of the securities on loan was $2,784,766. | ||||||||
ADR | American Depositary Receipt. | ||||||||
REIT | Real Estate Investment Trust. | ||||||||
| The following table summarizes the inputs used to value the Fund’s investments in securities as of December 31, 2013 (See Note 1B): | ||||||||||||||||
| Investments in Securities: | Level 1 | Level 2 | Level 3 | Total | ||||||||||||
| Assets | ||||||||||||||||
| Common Stocks | $ | 150,067,758 | $ | — | $ | — | $ | 150,067,758 | ||||||||
| Short-Term Investments | — | 5,442,747 | — | 5,442,747 | ||||||||||||
| Total Investments in Securities | $ | 150,067,758 | $ | 5,442,747 | $ | — | $ | 155,510,505 | ||||||||
| 10 | See Notes to Financial Statements. |
■ Value Line Centurion Fund, Inc. | |||||
| Statement of Assets and Liabilities | |||||
| December 31, 2013 | |||||
| ASSETS: | |||||
Investment securities, at value (Cost - $78,861,634) (securities on loan, at value, $2,784,766) | $ | 150,067,758 | |||
| Repurchase agreements (Cost - $5,442,747) | 5,442,747 | ||||
| Cash | 593,447 | ||||
| Receivable for securities sold | 870,179 | ||||
| Interest and dividends receivable | 115,975 | ||||
| Prepaid expenses | 2,574 | ||||
| Receivable for securities lending income | 838 | ||||
| Receivable for capital shares sold | 231 | ||||
| Total Assets | 157,093,749 | ||||
LIABILITIES: | |||||
| Payable upon return of securities on loan | 2,845,178 | ||||
| Payable for capital shares redeemed | 94,841 | ||||
| Accrued expenses: | |||||
| Advisory fee | 64,266 | ||||
| Service and distribution plan fees | 32,133 | ||||
| Directors’ fees and expenses | 207 | ||||
| Other | 19,505 | ||||
| Total Liabilities | 3,056,130 | ||||
| Net Assets | $ | 154,037,619 | |||
| NET ASSETS CONSIST OF: | |||||
Capital stock, at $1.00 par value (authorized 50,000,000, outstanding 8,166,828 shares) | $ | 8,166,828 | |||
| Additional paid-in capital | 136,026,699 | ||||
| Undistributed net investment income | 335,584 | ||||
Accumulated net realized loss on investments and foreign currency | (61,697,616 | ) | |||
| Net unrealized appreciation of investments | 71,206,124 | ||||
| Net Assets | $ | 154,037,619 | |||
Net Asset Value Per Outstanding Share ($154,037,619 ÷ 8,166,828 shares outstanding) | $ | 18.86 | |||
| Statement of Operations | |||||
| For the Year Ended | |||||
| December 31, 2013 | |||||
| INVESTMENT INCOME: | |||||
| Dividends (net of foreign withholding tax of $24,392) | $ | 1,606,463 | |||
| Securities lending income | 31,442 | ||||
| Interest | 2,178 | ||||
| Total Income | 1,640,083 | ||||
| Expenses: | |||||
| Advisory fee | 715,418 | ||||
| Service and distribution plan fees | 572,343 | ||||
| Auditing and legal fees | 82,001 | ||||
| Custodian fees | 35,924 | ||||
| Directors’ fees and expenses | 29,373 | ||||
| Printing and postage | 18,521 | ||||
| Insurance | 12,244 | ||||
| Other | 15,576 | ||||
| Total Expenses Before Fees Waived | 1,481,400 | ||||
| Less: Service and Distribution Plan Fees Waived | (214,641 | ) | |||
| Net Expenses | 1,266,759 | ||||
| Net Investment Income | 373,324 | ||||
| Net Realized and Unrealized Gain on Investments | |||||
| and Foreign Exchange Transactions: | |||||
| Net Realized Gain | 11,109,134 | ||||
Change in Net Unrealized Appreciation/ (Depreciation) | 27,137,757 | ||||
Net Realized Gain and Change in Net Unrealized Appreciation/(Depreciation) on Investments and Foreign Exchange Transactions | 38,246,891 | ||||
| Net Increase in Net Assets from Operations | $ | 38,620,215 | |||
See Notes to Financial Statements. | 11 |
■ Value Line Centurion Fund, Inc. | ||||||||
Statement of Changes in Net Assets | ||||||||
| Years Ended December 31, | ||||||||
| 2013 | 2012 | |||||||
| Operations: | ||||||||
| Net investment income | $ | 373,324 | $ | 788,551 | ||||
| Net realized gain on investments and foreign currency | 11,109,134 | 9,326,694 | ||||||
| Change in net unrealized appreciation/(depreciation) on investments | 27,137,757 | 8,918,541 | ||||||
| Net increase in net assets from operations | 38,620,215 | 19,033,786 | ||||||
| Distributions to Shareholders from: | ||||||||
| Net investment income | (785,155 | ) | — | |||||
| Capital Share Transactions: | ||||||||
| Proceeds from sale of shares | 2,276,557 | 2,546,309 | ||||||
| Proceeds from reinvestment of dividends to shareholders | 785,155 | — | ||||||
| Cost of shares redeemed | (19,885,864 | ) | (17,582,344 | ) | ||||
| Net decrease in net assets from capital share transactions | (16,824,152 | ) | (15,036,035 | ) | ||||
| Total Increase in Net Assets | 21,010,908 | 3,997,751 | ||||||
| NET ASSETS: | ||||||||
| Beginning of year | 133,026,711 | 129,028,960 | ||||||
| End of year | $ | 154,037,619 | $ | 133,026,711 | ||||
| Undistributed net investment income included in net assets, at end of year | $ | 335,584 | $ | 785,762 | ||||
| 12 | See Notes to Financial Statements. |
■ Value Line Centurion Fund, Inc. | |
| Financial Highlights |
| Years Ended December 31, | ||||||||||||||||||||
| 2013 | 2012 | 2011 | 2010 | 2009 | ||||||||||||||||
| Net asset value, beginning of year | $ | 14.48 | $ | 12.56 | $ | 11.96 | $ | 9.72 | $ | 8.75 | ||||||||||
| Income from investment operations: | ||||||||||||||||||||
| Net investment income/(loss) | 0.05 | 0.09 | — | (1) | — | (1) | (0.01 | ) | ||||||||||||
| Net gains on securities (both realized and unrealized) | 4.42 | 1.83 | 0.60 | 2.48 | 0.98 | |||||||||||||||
| Total from investment operations | 4.47 | 1.92 | 0.60 | 2.48 | 0.97 | |||||||||||||||
| Less distributions: | ||||||||||||||||||||
| Dividends from net investment income | (0.09 | ) | — | — | (0.01 | ) | — | |||||||||||||
| Distributions from net realized gains | — | — | — | (0.23 | ) | — | ||||||||||||||
| Total distributions | (0.09 | ) | — | — | (0.24 | ) | — | |||||||||||||
| Net asset value, end of year | $ | 18.86 | $ | 14.48 | $ | 12.56 | $ | 11.96 | $ | 9.72 | ||||||||||
| Total return* | 30.96 | % | 15.29 | % | 5.02 | % | 25.75 | % | 11.09 | % | ||||||||||
| Ratios/Supplemental Data: | ||||||||||||||||||||
| Net assets, end of year (in thousands) | $ | 154,038 | $ | 133,027 | $ | 129,029 | $ | 134,719 | $ | 124,701 | ||||||||||
Ratio of gross expenses to average net assets(2) | 1.04 | % | 1.06 | % | 1.06 | % | 1.05 | %(3) | 1.06 | % | ||||||||||
Ratio of net expenses to average net assets(4) | 0.89 | % | 0.91 | % | 0.91 | % | 0.85 | %(5) | 0.91 | % | ||||||||||
| Ratio of net investment income/(loss) to average net assets | 0.26 | % | 0.58 | % | (0.01 | )% | 0.09 | % | (0.08 | )% | ||||||||||
| Portfolio turnover rate | 7 | % | 11 | % | 25 | % | 27 | % | 121 | % | ||||||||||
| * | Total returns do not reflect the effects of charges deducted under the terms of Guardian Insurance and Annuity Company, Inc.’s (GIAC) variable contracts. Including such charges would reduce the total returns for all years shown. |
| (1) | Amount is less than $.01 per share. |
| (2) | Ratio reflects expenses grossed up for the custody credit arrangement and grossed up for the waiver of a portion of the service and distri- bution plan fees by the Distributor. The custody credit arrangement was discontinued as of January 1, 2013. |
| (3) | Ratio reflects expenses grossed up for the reimbursement by Value Line, Inc. of certain expenses incurred by the Fund. |
| (4) | Ratio reflects expenses net of the custody credit arrangement and net of the waiver of a portion of the service and distribution plan fees by the Distributor. The custody credit arrangement was discontinued as of January 1, 2013. |
| (5) | Ratio reflects expenses net of the reimbursement by Value Line, Inc. of certain expenses incurred by the Fund. |
| See Notes to Financial Statements. | 13 |
■ Value Line Centurion Fund, Inc. | |
| Notes to Financial Statements | |
| December 31, 2013 | |
| 1. | Significant Accounting Policies |
| ● | Level 1 – Inputs that reflect unadjusted quoted prices in active markets for identical assets or liabilities that the Fund has the ability to access at the measurement date; |
● | Level 2 – Inputs other than quoted prices that are observable for the asset or liability either directly or indirectly, including inputs in markets that are not considered to be active; |
● | Level 3 – Inputs that are unobservable. |
| 14 |
■ Value Line Centurion Fund, Inc. | |
| Notes to Financial Statements (Continued) | |
| December 31, 2013 | |
| 15 |
■ Value Line Centurion Fund, Inc. | |
| Notes to Financial Statements (Continued) | |
| December 31, 2013 | |
| Value of Securities Loaned | Value of Collateral | Total Collateral (including Calculated Mark) | ||
| $2,784,766 | $2,845,178 | $2,843,693 | ||
| 16 |
■ Value Line Centurion Fund, Inc. | |
| Notes to Financial Statements (Continued) | |
| December 31, 2013 | |
| 2. | Capital Share Transactions, Dividends and Distributions |
Year Ended December 31, 2013 | Year Ended December 31, 2012 | |||||||
| Shares sold | 138,165 | 185,746 | ||||||
| Shares issued on reinvestment | 47,100 | — | ||||||
| Shares redeemed | (1,208,494 | ) | (1,270,948 | ) | ||||
| Net decrease | (1,023,229 | ) | (1,085,202 | ) | ||||
| Dividends per share from net investment income | $ | 0.0915 | $ | — | ||||
| 3. | Purchases and Sales of Securities | |||||||
| Purchases and sales of investment securities, excluding short-term securities, were as follows: | ||||||||
Year Ended December 31,2013 | ||||||||
| PURCHASES: | ||||||||
| Investment Securities | $ | 9,804,757 | ||||||
| SALES: | ||||||||
| Investment Securities | $ | 27,797,322 | ||||||
| 4. | Income Taxes | |||||||
| At December 31, 2013, information on the tax components of capital is as follows: | ||||||||
| Cost of investments for tax purposes | $ | 84,398,253 | ||||||
| Gross tax unrealized appreciation | $ | 71,237,566 | ||||||
| Gross tax unrealized depreciation | (125,314) | |||||||
| Net tax unrealized appreciation on investments | $ | 71,112,252 | ||||||
| Capital loss carryforward, expires | ||||||||
| December 31, 2016 | $ | 5,545,598 | ||||||
| December 31, 2017 | $ | 56,057,485 | ||||||
| Undistributed ordinary income | $ | 335,584 | ||||||
| 17 |
■ Value Line Centurion Fund, Inc. | |
| Notes to Financial Statements (Continued) |
| 2013 | 2012 | ||||||
| Ordinary income | $ | 785,155 | $ | — | |||
| 5. | Investment Advisory Fee, Service and Distribution Fees and Transactions With Affiliates |
| 18 |
■ Value Line Centurion Fund, Inc. | |
| Report of Independent Registered Public Accounting Firm |
| 19 |
■ Value Line Centurion Fund, Inc. | |
| Federal Tax Status of Distribution (Unaudited) |
| Form N-Q |
| Proxy Voting |
| 20 |
■ Value Line Centurion Fund, Inc. | |
| Management Information |
| Name, Address, and Year of Birth | Position (Since) | Principal Occupation During the Past 5 Years | ||
| Interested Director* | ||||
Mitchell E. Appel 1970 Other Directorships: Forethought Variable Insurance Trust, since 2013. | Director (2010) | President of each of the Value Line Funds since June 2008; Chief Financial Officer of Value Line, Inc. (“Value Line”) from April 2008 to December 2010 and from September 2005 to November 2007; Director from February 2010 to December 2010; Chief Financial Officer of the Distributor since April 2008 and President since February 2009; President of the Adviser since February 2009, Trustee since December 2010 and Treasurer since January 2011. | ||
| Non-Interested Directors | ||||
Joyce E. Heinzerling 500 East 77th Street New York, NY 10162 1956 Other Directorships: None | Director (2008) | President, Meridian Fund Advisers LLC (consultants) since 2009; General Counsel, Archery Capital LLC (private investment fund) until 2009. | ||
Francis C. Oakley 54 Scott Hill Road Williamstown, MA 01267 1931 Other Directorships: None | Director (2000) | Professor of History, Williams College, (1961-2002). Professor Emeritus since 2002; President Emeritus since 1994 and President, (1985-1994); Chairman (1993-1997) and Interim President (2002-2003) of the American Council of Learned Societies. Trustee since 1997 and Chairman of the Board since 2005, National Humanities Center. | ||
David H. Porter 5 Birch Run Drive Saratoga Springs, NY 12866 1935 Other Directorships: None | Director (1997) | Professor, Skidmore College since 2008; Visiting Professor of Classics, Williams College, (1999-2008); President Emeritus, Skidmore College since 1999 and President, (1987-1998). | ||
Paul Craig Roberts 169 Pompano St. Panama City Beach, FL 32413 1939 Other Directorships: None | Director (1983) | Chairman, Institute for Political Economy. | ||
Nancy-Beth Sheerr 1409 Beaumont Drive Gladwyne, PA 19035 1949 Other Directorships: None | Director (1996) | Senior Financial Consultant, Veritable L.P. (Investment Advisor until December 2013). | ||
Daniel S. Vandivort 59 Indian Head Road Riverside, CT 06878 1954 | Director (2008) Chairman of Board (2010) | President, Chief Investment Officer, Weiss, Peck and Greer/Robeco Investment Management (2005-2007); Managing Director, Weiss, Peck and Greer, (1995-2005). | ||
| Other Directorships: None |
| 21 |
■ Value Line Centurion Fund, Inc. | |
| Management Information (Continued) |
| Name, Address, and Year of Birth | Position (Since) | Principal Occupation During the Past 5 Years | ||
| Officers | ||||
Mitchell E. Appel 1970 | President (2008) | President of each of the Value Line Funds since June 2008; Chief Financial Officer of Value Line from April 2008 to December 2010 and from September 2005 to November 2007; Director from February 2010 to December 2010; Chief Financial Officer of the Distributor since April 2008 and President since February 2009; President of the Adviser since February 2009, Trustee since December 2010 and Treasurer since January 2011. | ||
Michael J. Wagner 1950 | Chief Compliance Officer (2009) | Chief Compliance Officer of Value Line Funds since June 2009; President of Northern Lights Compliance Service, LLC (formerly Fund Compliance Services, LLC (2006 - present)) and Senior Vice President (2004 - 2006) and President and Chief Operations Officer (2003 - 2006) of Gemini Fund Services, LLC; Director of Constellation Trust Company until 2008. | ||
Emily D. Washington 1979 | Treasurer and Secretary (2008) | Treasurer and Chief Financial Officer (Principal Financial and Accounting Officer) of each of the Value Line Funds since 2008 and Secretary since 2010; Secretary of the Adviser since 2011. | ||
| * | Mr. Appel is an “interested person” as defined in the Investment Company Act of 1940 by virtue of his position with the Adviser and Distributor. |
| Unless otherwise indicated, the address for each of the above officers is c/o Value Line Funds, 7 Times Square, New York, NY 10036. |
| 22 |
| Item 2 | Code of Ethics |
(a) The Registrant has adopted a Code of Ethics that applies to its principal executive officer, principal financial officer and principal accounting officer.
(f) Pursuant to item 12(a), the Registrant is attaching as an exhibit a copy of its Code of Ethics that applies to its principal executive officer, and principal financial officer and principal accounting officer.
| Item 3 | Audit Committee Financial Expert. |
(a)(1)The Registrant has an Audit Committee Financial Expert serving on its Audit Committee.
(2) The Registrant’s Board has designated Daniel S. Vandivort, a member of the Registrant’s Audit Committee, as the Registrant’s Audit Committee Financial Expert. Mr. Vandivort is an independent director who has served as President, Chief Investment Officer to Weis, Peck and Greer/Robeco Investment Management. He has also previously served as Managing Director for Weis, Peck and Greer (1995-2005).
A person who is designated as an “audit committee financial expert” shall not make such person an "expert" for any purpose, including without limitation under Section 11 of the Securities Act of 1933 or under applicable fiduciary laws, as a result of being designated or identified as an audit committee financial expert. The designation or identification of a person as an audit committee financial expert does not impose on such person any duties, obligations, or liabilities that are greater than the duties, obligations, and liabilities imposed on such person as a member of the audit committee and Board of Directors in the absence of such designation or identification.
| Item 4 | Principal Accountant Fees and Services |
| (a) | Audit Fees 2013 - $48,007 | |
Audit Fees 2012 - $30,270 | ||
| (b) | Audit-Related fees – None. | |
| (c) | Tax Preparation Fees 2013 -$17,064 | |
| Tax Preparation Fees 2012 - $15,518 | ||
| (d) | All Other Fees – None | |
| (e) | (1) Audit Committee Pre-Approval Policy. All services to be performed for the Registrant by PricewaterhouseCoopers LLP must be | |
| pre-approved by the audit committee. All services performed were pre-approved by the committee. | ||
| (2) Not applicable. | ||
| (f) | Not applicable. | |
| (g) | Aggregate Non-Audit Fees 2013 - $1,200 | |
| Aggregate Non-Audit Fees 2012 - $2,400 | ||
| (h) | Not applicable. |
Item 5. Audit Committee of Listed Registrants
Not Applicable.
Item 6. Investments
Not Applicable
Item 7. Disclosure of Proxy Voting Policies and Procedures for Closed-End Management Investment Companies
Not Applicable
Item 8. Portfolio Managers of Closed-End Management Investment Companies
Not Applicable
Item 9. Purchases of Equity Securities by Closed-End Management Investment Company and Affiliated Purchasers
Not Applicable
Item 10 Submission of Matters to a Vote of Security Holders
Not Applicable
| Item 11 | Controls and Procedures |
| (a) | The registrant’s principal executive officer and principal financial officer have concluded that the registrant’s disclosure controls and procedures (as defined in rule 30a-2(c) under the Act (17 CFR 270.30a-2(c)) based on their evaluation of these controls and procedures as of a date within 90 days of the filing date of this report, are appropriately designed to ensure that material information relating to the registrant is made known to such officers and are operating effectively. |
| (b) | The registrant’s principal executive officer and principal financial officer have determined that there have been no significant changes in the registrant’s internal controls or in other factors that could significantly affect these controls subsequent to the date of their evaluation, including corrective actions with regard to significant deficiencies and material weaknesses. |
| Item 12 | Exhibits |
| (a) | Code of Business Conduct and Ethics for Principal Executive and Senior Financial Officers attached hereto as Exhibit 100.COE |
| (b) | (1) Certification pursuant to Rule 30a-2(a) under the Investment Company Act of 1940 (17 CFR 270.30a-2) attached hereto as Exhibit 99.CERT. | |
(2) Certification pursuant to Section 906 of the Sarbanes-Oxley Act of 2002 attached hereto as Exhibit 99.906.CERT. |
SIGNATURES
Pursuant to the requirements of the Securities Exchange Act of 1934 and the Investment Company Act of 1940, the registrant has duly caused this report to be signed on its behalf by the undersigned, thereunto duly authorized.
| By | /s/ Mitchell E. Appel | |||
| Mitchell E. Appel, President | ||||
| Date: | March 11, 2014 | |||
Pursuant to the requirements of the Securities Exchange Act of 1934 and the Investment Company Act of 1940, this report has been signed below by the following persons on behalf of the registrant and in the capacities and on the dates indicated.
| By: | /s/ Mitchell E. Appel | |
| Mitchell E. Appel, President, Principal Executive Officer |
| By: | /s/ Emily D. Washington | |
| Emily D. Washington, Treasurer, Principal Financial Officer |
| Date: | March 11, 2014 |