 EEI Financial Conference NOVEMBER 5, 2007 Exhibit 99.3 |
 2 Safe Harbor Provisions This presentation contains statements concerning NU’s expectations, plans, objectives, future financial performance and other statements that are not historical facts. These statements are “forward-looking statements” within the meaning of the Private Securities Litigation Reform Act of 1995. In some cases, a listener can identify these forward-looking statements by words such as “estimate”, “expect”, “anticipate”, “intend”, “plan”, “believe”, “forecast”, “should”, “could”, and similar expressions. Forward-looking statements involve risks and uncertainties that may cause actual results or outcomes to differ materially from those included in the forward-looking statements. Factors that may cause actual results to differ materially from those included in the forward-looking statements include, but are not limited to, actions or inactions by local, state and federal regulatory bodies; competition and industry restructuring; changes in economic conditions; changes in weather patterns; changes in laws, regulations or regulatory policy; changes in levels or timing of capital expenditures; developments in legal or public policy doctrines; technological developments; changes in accounting standards and financial reporting regulations; fluctuations in the value of our remaining competitive electricity positions; actions of rating agencies; subsequent recognition, derecognition and measurement of tax positions; and other presently unknown or unforeseen factors. Other risk factors are detailed from time to time in our reports to the Securities and Exchange Commission. Any forward looking statement speaks only as of the date on which such statement is made, and we undertake no obligation to update the information contained in any forward- looking statements to reflect developments or circumstances occurring after the statement is made. |
 3 Overview 2007: Strong, successful year 2008: Another strong growth year projected 2008-2012: Continued attractive investment opportunities identified and quantified Long-term outlook: Opportunities for NU as significant changes sweep across the industry |
 4 Key Initiatives for 2008-2012 Continue to successfully execute Effectively deploy the capital in the 5 year plan Manage the regulatory business model to earn on the capital Develop and deliver solutions for the region’s energy challenges |
 5 Next Initiatives: Dealing With New England’s Emerging Energy Challenges Regional Challenges Create Opportunities Increasing Peak Load High Fuel Prices Regional Greenhouse Gas Initiative (RGGI) Requirements Increasing Renewable Portfolio Standards (RPS) Increased Energy Efficiency |
 6 New England States Are Increasing Their Renewable Portfolio Expectations CT: 27% by 2020 VT: 2005-2012 Load growth to be met with renewables and capped at 10%. (Voluntary goal) ME: 30% by 2000, additional 10% new resources by 2017. Total is 40%. NH: 23.8% by 2025 RI: 16% by 2019 MA: 4% in 2009; potential for 1% annual increments from 2010 to 2014 |
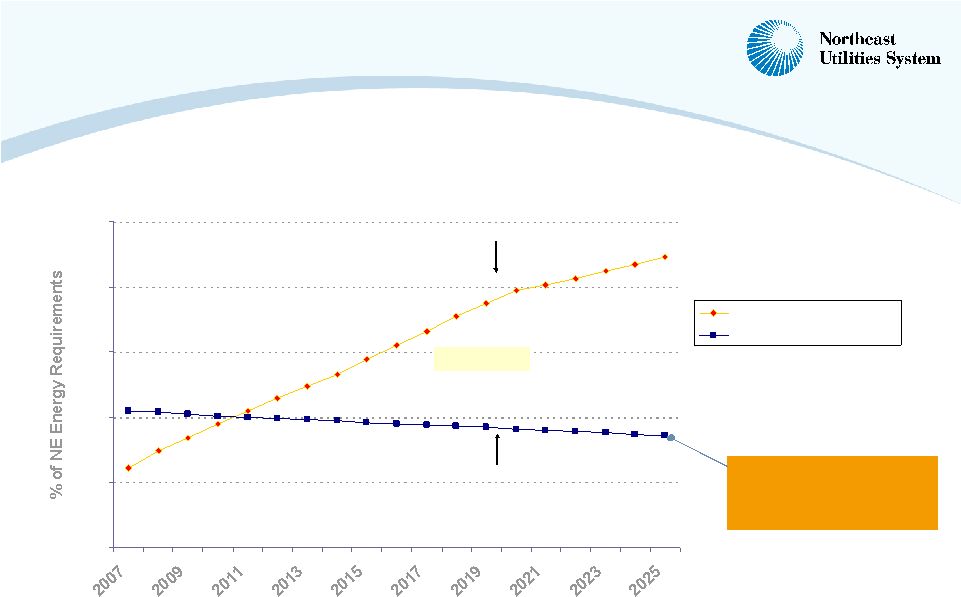 7 0% 5% 10% 15% 20% 25% Year RPS Requirements - % Existing Renewables - % Beyond 2010, A Growing Gap In Meeting New England Renewable Portfolio Standards (RPS) Is Projected 17,269 GWh 2020 Decrease in percentage of existing renewables is due to growth in New England energy requirements 2020 |
 8 New England’s Renewable Challenge The gap between existing and required renewables widens significantly over time We believe The gap cannot be filled with existing or planned generation New England will need to look elsewhere to meet the region’s renewable energy needs Renewables are only one part of the regional energy challenge |
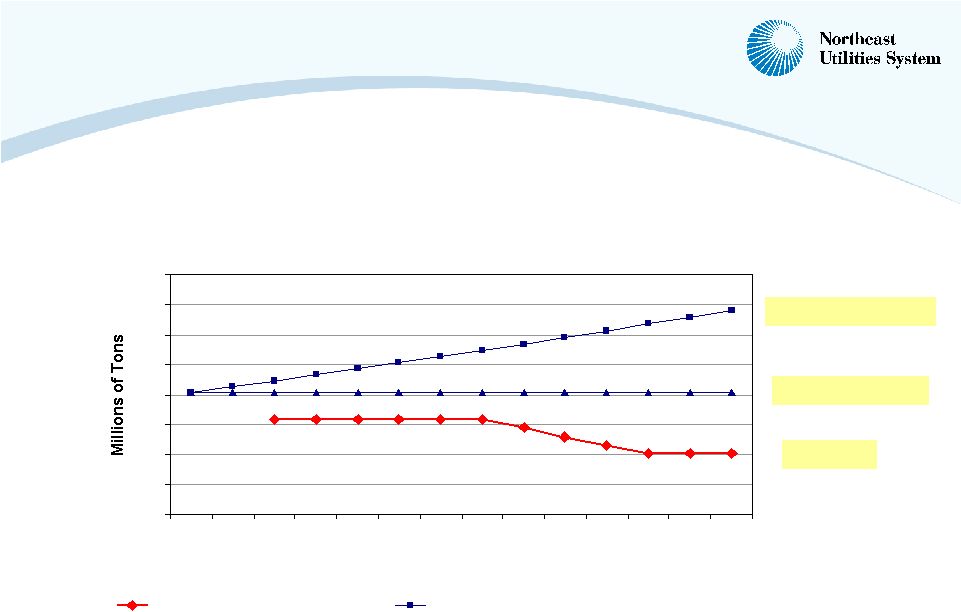 9 Meeting the RGGI Requirements Will Be Challenging Under Any Load Growth Scenario 1.3% energy growth 0% energy growth RGGI Cap New England CO2 Emissions 40 45 50 55 60 65 70 75 80 2007 2008 2009 2010 2011 2012 2013 2014 2015 2016 2017 2018 2019 2020 Year New England RGGI CO2 Cap Projected CO2 Emissions |
                  10 Northern New England and Eastern Canada Will Become Valuable Sources to Meet New England’s Needs H N W Hydro Nuclear Wind B Biomass General Movement Of Power New England’s Most Attractive Renewable Energy Locations W W W W W B B B B N H H H Quebec Hydro Quebec plans $20 Billion investment in Hydro and export transmission Newfoundland & Labrador Exploring development of large Hydro facilities New Brunswick Exploring development of 1 or 2 nuclear units W Eastern Canadian Development |
 11 Addressing New England’s Challenge New England needs Resources assembled to meet the opportunities Partnerships among key stakeholders An expanded dialogue to identify a portfolio of solutions Results NU Organized an internal team to define the issues and develop solutions Reaching out to regional stakeholders Meeting with leaders in New England and Canada to begin discussing possible solutions Will put solutions on the table |
 12 Regulated Investment Strategy |
 13 The Execution Of Our Strategy Has Been Successful, Resulting In Favorable Outcomes For Investors And Customers Strong operations are the linchpin of our overall strategy Our capital investment plan is on track and providing investors with continued growth Customers are benefiting from increased reliability, cost savings and lower power plant emissions |
 14 Current and Future Investments Produce Customer Benefits Through Nearly $6 Billion Investment Plan Generation Existing New Hampshire generation will require an ongoing level of capital investment totaling around $100 million Installation of a scrubber at our PSNH Merrimack station is projected to cost about $250 million, with $215 million included in this forecast period While not included in this forecast, potential exists for peaking units in Connecticut and New Hampshire and additional renewable resources in New Hampshire Distribution Reliability spending to meet peak demand growth and improve infrastructure totals $2.5 billion Deployment of Advanced Metering Infrastructure (AMI) represents an additional investment opportunity that is not included in this forecast Transmission Southwest Connecticut and other New England projects continue to make excellent progress and are expected to add nearly $2.1 billion to plant-in-service over the forecast period The New England East-West Solution (NEEWS) family of projects, Springfield 115-kV Cables will advance into the siting phase and are currently projected to cost at least $1.4 billion Future projects in northern New England and Canada represent additional investment opportunities not included in this forecast |
 15 Transmission, Distribution and Regulated Generation Projects Provide Savings for Customers Transmission projects provide benefits in the form of increased reliability and reduced congestion and capacity market costs Bethel-Norwalk has reduced Connecticut congestion costs by more than $130 million since October 2006 Middletown-Norwalk is expected to provide $20 - $30 million in avoided costs NEEWS projects are expected to provide additional savings of at least $200 million per year in reduced congestion and capacity costs Distribution and generation projects provide benefits in the form of increased reliability and reduced energy costs for customers Yankee Gas LNG facility is complete and will lower costs to customers by $25 million a year Northern Wood Power Project is dispatching power below market and 100% of our renewable energy certificates are sold for 2007 New Hampshire-owned utility generation has resulted in the lowest energy costs for customers in New England – 7.83 cents per kWh – 33% lower than current market |
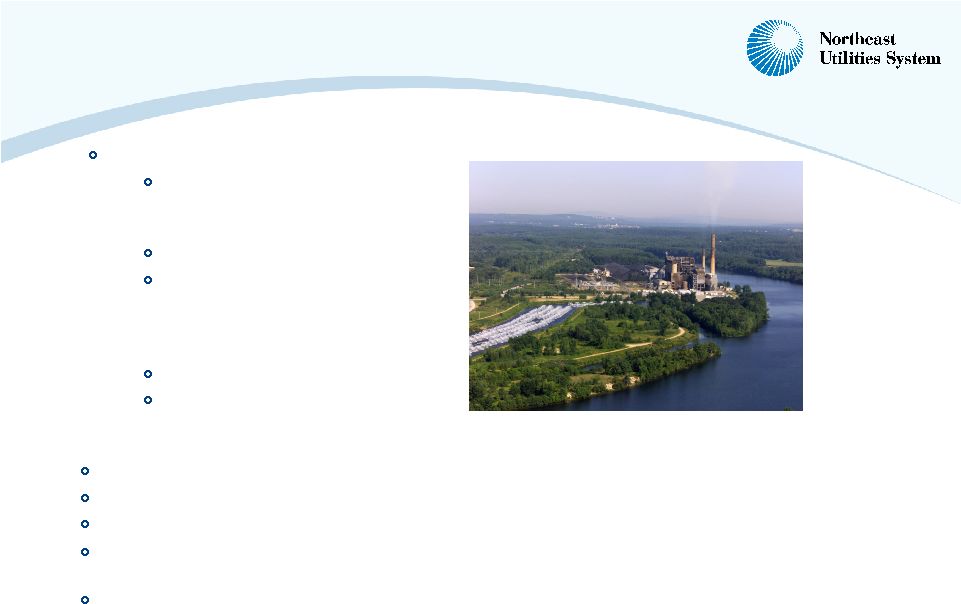 16 Regulated Generation Investments -- Merrimack Scrubber Reduces sulfur emissions by 98% Reduces mercury emissions by 85% Avoids $15-20 million annually in sulfur credit purchases Impact on Merrimack production costs of no more than 0.6 cents/kWh, preserving PSNH’s low-cost generation fleet Investment recovered through PSNH generation rates Merrimack Scrubber Required by New Hampshire statute for mercury emissions reductions Current estimate: $250 million Engineering, Procurement & Construction (EPC) contract secured with Washington Group International in fall 2007 Construction start: 2009 Project completion: 2013 |
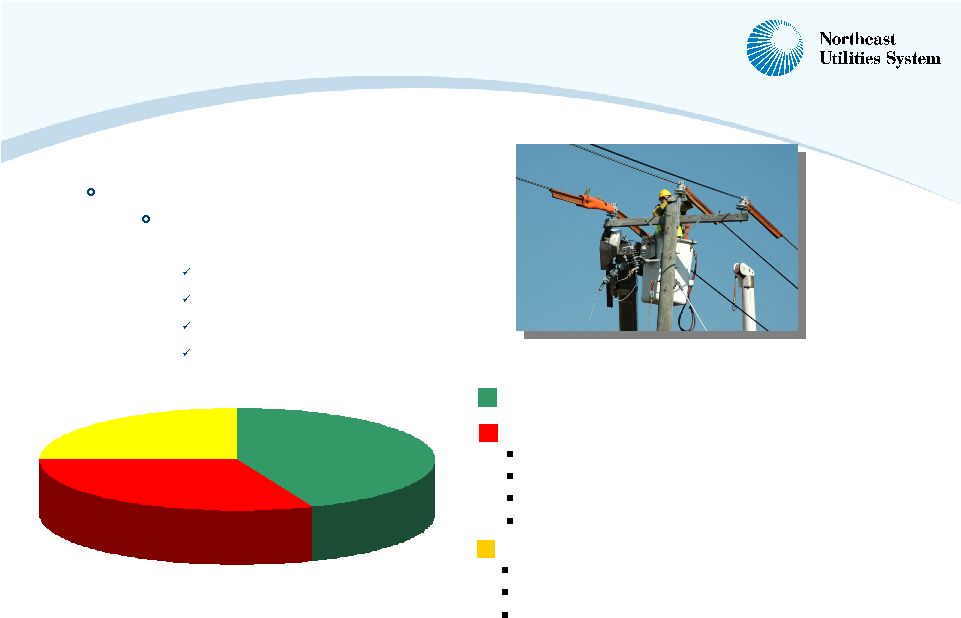 17 Distribution Infrastructure Investments 2008 – 2012 investment Invest $2.5 billion in distribution capital spending CL&P: $1.5 billion PSNH: $525 million WMECO: $175 million Yankee Gas: $300 million Peak Load Growth & New Business Support - 44% Basic Business Requirements - 31% Plant Relocations Equipment Failures Information Technology Other Capital Aging Infrastructure - 25% Regulatory Commitments Reliability/Obsolescence Facility Upgrades |
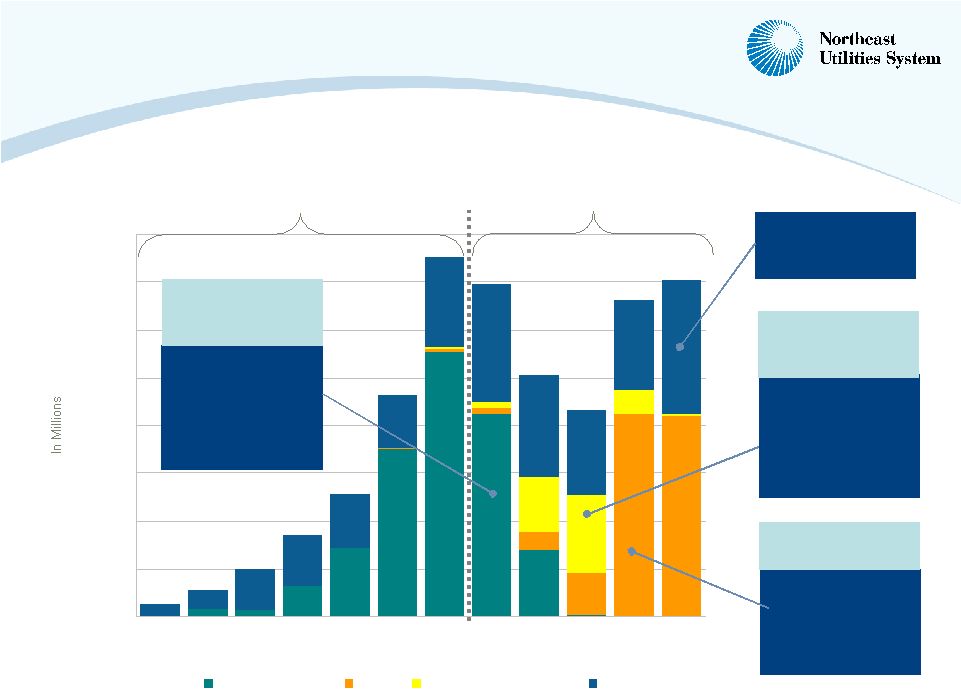
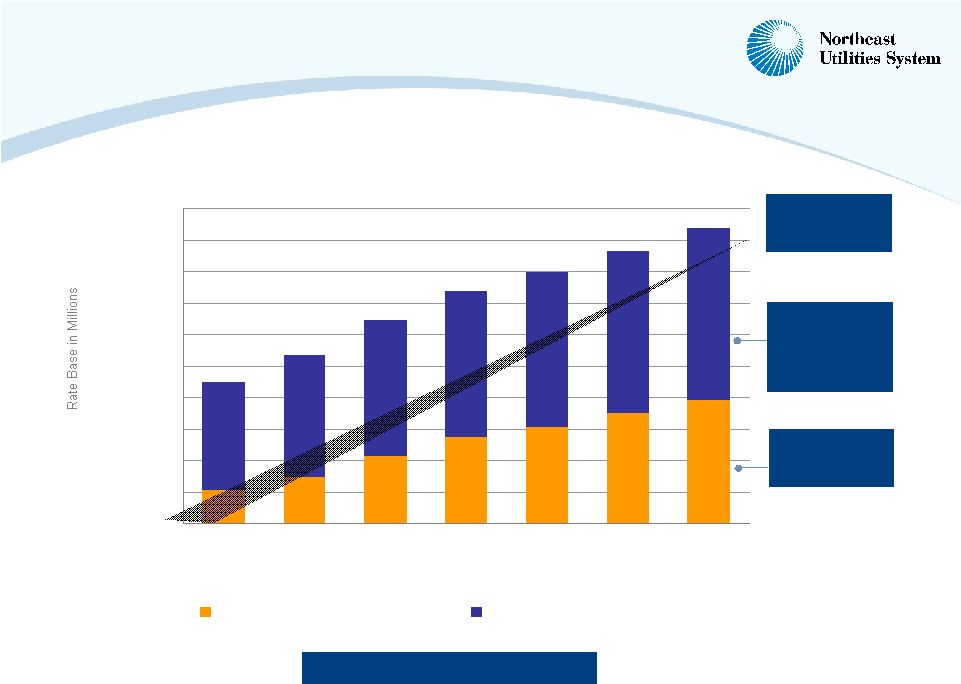
 18 Transmission Capital Program and Rate Base Continue to Grow 2006 2007 2008 2009 2010 2011 2012 Fall 2005 EEI Conference Fall 2007 EEI Conference Fall 2006 EEI Conference Five-Year Capital Program -- $2.3 Billion Five-Year Capital Program -- $3.0 Billion Five-Year Capital Program -- $2.4 Billion Annual Plant-in- Service: $ Millions $391 $277 $724 $883 $341 $396 $617 (Actual) (Projected) 3,944 1,046 Total NU 459 134 PSNH 621 71 WMECO 2,864 841 CL&P Projected 12/31/12 Rate Base ($ Millions) Actual 12/31/06 Rate Base ($ Millions) Operating Company |
 19 2008-2012 Transmission Capital Expenditures Increase By Over 20% From Previous Five-Year Program $0 $100 $200 $300 $400 $500 $600 $700 $800 2001 2002 2003 2004 2005 2006 2007 2008 2009 2010 2011 2012 Major Southwest CT NEEWS Springfield 115-kV Cables Other Historic Forecast Up To $3.0 Billion $1,816 Million $560 million of major SWCT projects in 2008- 2012 forecast period; $1.68 billion in total NEEWS projects estimated at $1 billion during the 2008-2012 forecast period $1.1 billion of additional forecasted projects Successful completion of SWCT projects NEEWS projects ramping up Springfield 115-kV Cables projects estimated at $350 million during the 2008-2012 forecast period Springfield 115-kV Cables project ramping up |
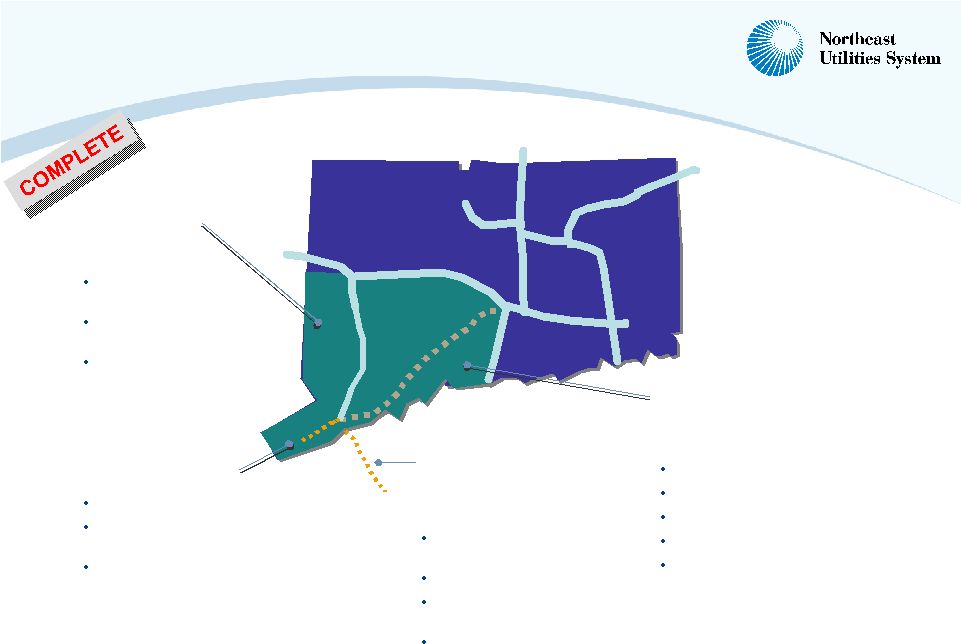   20 Four Major Southwest Connecticut Transmission Projects – A $1.68 Billion Investment, About 2/3 Complete Bethel-Norwalk 345-kV underground & overhead $350 Million 21 miles 345-kV (56% underground) 10 miles 115-kV (100% underground) Completed October 2006 at a cost of $335 million Middletown-Norwalk 345-kV underground & overhead $1,047 Million (NU share) Glenbrook Cables 115-kV underground $223 Million 9 miles 115-kV underground Projected in-service date: End of 2008 Under contract – construction under way, 54% complete at 11/05/07 Long Island Cable 138-kV cross-sound $72 Million (NU share) 11 miles 138-kV submarine cable Joint project with LIPA Projected in-service date: Second half of 2008 56% complete at 11/05/07 69 miles 345-kV (35% underground) 57 miles 115-kV (1% underground) Joint project with United Illuminating Projected in-service date: End 2009 52% complete at 11/05/07 50% of CT Load |
    21 NEEWS and Springfield 115-kV Cables Projects Will Better Connect Eastern, Western New England by 2013 Springfield 115-kV Cables Project SPRINGFIELD HARTFORD 345-kV Substation Generation Station 345-kV ROW 115-kV ROW Greater Springfield Reliability Project Central Connecticut Reliability Project Interstate Reliability Project |
 22 Springfield 115-kV Cables & NEEWS Project Schedules 2013 Late 2012/2013 Late 2012/2013 2011 In-service 2010/Early 2011 2010 2010 2009 Construction targeted to start on staggered basis 2010 Late 2009/Early 2010 Late 2009/Early 2010 Early 2009 Siting completed 2010 -2012 2009 -2012 2009 -2012 2008 - 2010 Procurement contracts Late 2008 Mid 2008 Mid 2008 Late 2007/Early 2008 State siting application filed Late 2008 Mid 2008 Mid 2008 Late 2007/Early 2008 ISO technical applications approval Central CT Reliability (345-kV) Interstate Reliability (345-kV) Greater Springfield Reliability (115-kV/345-kV) Springfield 115-kV Cables NEEWS |
 23 Other Forecast Projects Total $1.1 Billion $1.1 Billion CL&P 115-kV Reliability Program 30.0 Fiber Optic Communications 20.0 310/368 Line Split 29.0 Eastern Connecticut Reliability 190.5 Barbour Hill Autotransformer 10.7 Aging Equipment & NERC Compliance Upgrades (24% in RSP) 91.4 Numerous Projects Addressing Maintenance, Reliability & Load Growth (55% in RSP) 202.9 Total CL&P Other Projects 574.5 $'s Millions WMECO 115-kV Reliability Program 15.0 Fiber Optic Communications 10.0 Ludlow Transformer Repl. 12.0 Berkshire 2nd Autotransformer 9.9 Aging Equipment & NERC Compliance Upgrades (100% in RSP) 64.5 Numerous Projects Addressing Maintenance, Reliability & Load Growth (46% in RSP) 23.5 Total WMECO Other Projects 134.9 $'s Millions PSNH 115-kV Reliability Program 25.0 Fiber Optic Communications 15.0 Scobie 3rd Autotransformer 12.4 White Mountain Region Upgrades 14.9 Monadnock Region Upgrades 26.6 Nashua Area Solution 14.0 Deerfield & Gosling Autos 52.7 Aging Equipment & NERC Compliance Upgrades (64% in RSP) 163.8 Numerous Projects Addressing Maintenance, Reliability & Load Growth (42% in RSP) 76.9 Total PSNH Other Projects 401.3 $'s Millions |
 24 Future Resources Aligned with Our Strategic Business Plans Construction Expertise – experienced, proven firms, track record with NU Burns & McDonnell (Transmission, including NEEWS) Washington Group International (Merrimack Scrubber) Material – negotiating to lock in key components Transformers, 115-kV underground cable and steel poles Labor – aligning resources with project needs |
 25 Established Worldwide Access to Key Suppliers GC Cable from Prysmian in Finland GC DFR from Qualitrol in Ireland GC Breakers & Switches from ABB Power in U.S. GC Scada Cabinet from GE Harris in Canada M-N Steel Poles from Thomas & Betts in U.S. M-N Overhead Ground Wire from Intral in Canada M-N 345-kV Breakers from HICO in South Korea M-N Autotransformers & Transformers from Areva in Brazil M-N Shunt Reactors from Siemens in Germany M-N GIS from Mitsubishi in Japan M-N 115-kV Cable from Prysmian in Italy M-N 345-kV Cable from Silec in France B-N Underground Cables from VISCAS in Japan |
 26 Regulated Investment Strategy In Summary Strong execution of our business plan Transmission CapEx program up by over 20% and on schedule Resources aligned with our strategic business plans Infrastructure upgrades providing reliability improvements and savings for customers |
 27 Financial |
 28 Overview NU raising 2007 earnings guidance 2008 guidance is consistent with our growth plan Our new $6 billion, five-year capital program reflects significantly increased transmission investment needs Rate base growth and ROE improvement support underlying 10-14% five-year EPS growth rate Capital program very financeable Remain focused on total shareholder return equation |
 29 $18.2 $3.2 $28.5 $20.0 $1.0 $0.7 $50.2 $37.5* $13.7* $2.4 $0.0 $10.0 $20.0 $30.0 $40.0 $50.0 $60.0 3Q 2006 3Q 2007 Third Quarter Results Distribution and Generation Transmission Parent/Other Competitive Total *Excludes one-time $74 million benefit to CL&P from 2006 tax reduction 108.0% 9.9% 33.9% |
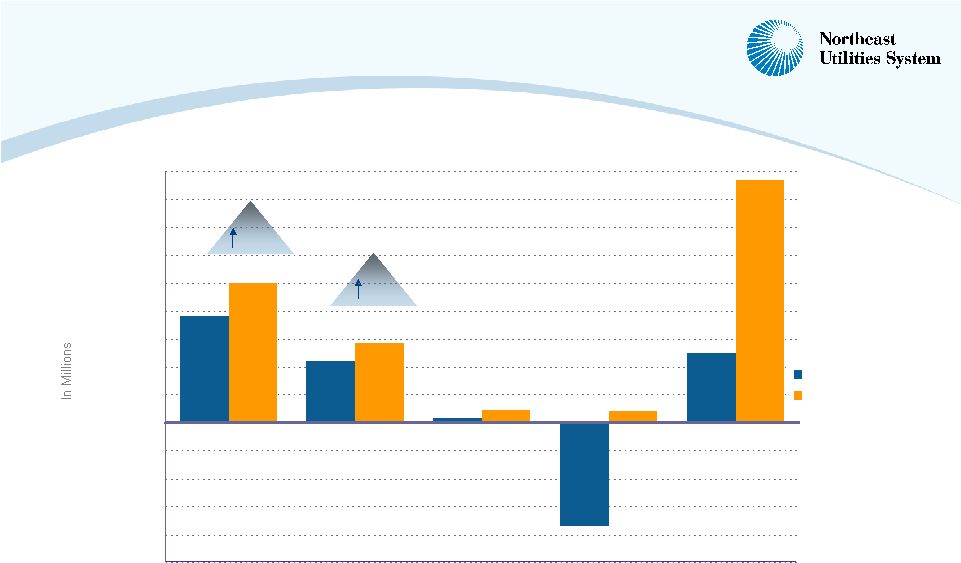 30 2007 Results Through September 30 Distribution and Generation Transmission Parent/Other Competitive Total 31.0% 30.7% $43.6 ($73.7) $100.1 $57.0 $8.6 $8.1 $173.8 $3.3 $49.6* $76.4* ($100.0) ($80.0) ($60.0) ($40.0) ($20.0) $0.0 $20.0 $40.0 $60.0 $80.0 $100.0 $120.0 $140.0 $160.0 $180.0 9 Mos. 2006 9 Mos. 2007 *Excludes one-time $74 million benefit to CL&P from 2006 tax reduction |
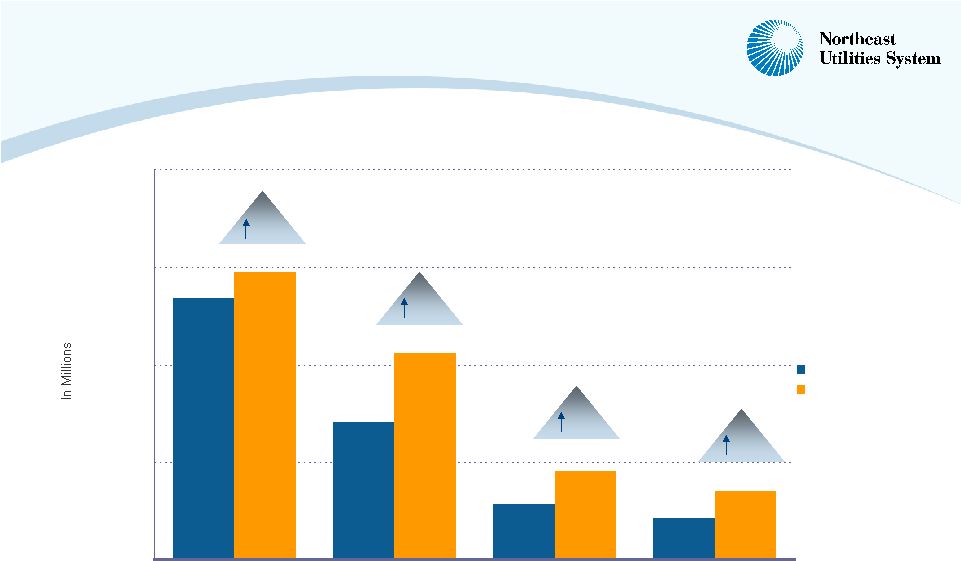 31 $21.2 $6.4 $44.3 $31.7 $13.6 $10.5 $40.2* $8.6 $0.0 $15.0 $30.0 $45.0 $60.0 9 Mos. 2006 9 Mos. 2007 Distribution and Generation Through September 30 CL&P PSNH WMECO Yankee Gas 10.2% 49.5% 58.1% 64.1% *Excludes one-time $74 million benefit to CL&P from 2006 tax reduction |
 32 Transmission Earnings Tracking Rate Base Investment $945 $1,240 $455 $605 $1,030 $43.6 $59.8 $41.1 $28.2 $57.0 $0 $200 $400 $600 $800 $1,000 $1,200 $1,400 2004 2005 2006 2006 2007 $0.0 $10.0 $20.0 $30.0 $40.0 $50.0 $60.0 $70.0 Year End Rate Base Net Income Nine Months |
 33 2007 – 2008 EPS Guidance $1.65 - $1.95 Breakeven** ($0.15) - ($0.10) $0.70 - $0.80 $1.10 - $1.25 2008 Projected $1.45 - $1.60 $1.30 - $1.55 $1.16* NU Consolidated $0.05** Breakeven** N/A Competitive $0.05 $0.00 - $0.05 $0.02 NU Parent/Other $0.50 - $0.55 $0.50 - $0.60 $0.39 Transmission $0.85 - $0.95 $0.80 - $0.90 $0.75* Distribution/Generation 2007 Current 2007 Original 2006 Actual *Excludes one-time benefits to CL&P from 2006 tax reduction and impact of generation sales **Excludes mark-to-market impact on remaining wholesale positions |
 34 Drivers Of Earnings Growth Increased transmission investment PSNH rate settlement Yankee rate settlement WMECO rate settlement Interest income on cash from generation sale Increased transmission investment CL&P rate case Rate settlements Managing costs Offset by Decreasing cash position at NU Parent 2007 2008 |
 35 Trailing 12-Month Distribution Regulatory ROEs 7.5% 6.4% 5.9% 9.6% 9.0% 9.4% 9.9% 6.6% 0.0% 2.0% 4.0% 6.0% 8.0% 10.0% 12.0% CL&P PSNH WMECO Yankee Gas 2006 12 Months Ended 9/30/07 9 – 10% Long-term Expectation |
 36 Completed Distribution Rate Cases Sharing outside 8-12% $1 million plus trackers $3 million 1/1/07 1/1/08 Settled and approved WMECO 10.1% $22.1 million net 7/1/07 Settled and approved Yankee Gas 9.67% $46.6 million $3 million 7/1/07 1/1/08 Settled and approved PSNH Authorized ROE Increases Effective Dates Status Company |
 37 CL&P Distribution Rate Case January 1, 2008 Requested Effective Date July 30, 2007 December 13, 2007 December 27, 2007 Rate Case Filed Draft decision Final decision Double to $25 million/year to support shorter clearing cycle Tree Trimming $290 million/year Distribution Capex Guaranteed revenue/customer No weather normalization Decoupling 45% equity (per rating agency) Capital Structure 11% ROE $189 million in 2008 $22 million in 2009 Rate Increase CL&P Rate Proposals |
 38 2007-2012: New Capital Expenditure Forecast $0 $200 $400 $600 $800 $1,000 $1,200 $1,400 Five-year 2008-2012 capital spending of $6.0 billion, compared with last year’s 2007-2011 $4.9 billion plan; 2007-2011 period up by $950 million Distribution Capex From 11/06 Forecast Transmission Capex From 11/06 Forecast Distribution Capex From 11/07 Forecast Transmission Capex From 11/07 Forecast 2007 Est.* 2010 Est.* 2011 Est.* 2008 Est.* 2009 Est.* 2012 Est.* * Includes capex of approximately $18 million per year for 11/06 forecast and $20 million per year for 11/07 forecast at corporate service companies on behalf of operating companies |
 39 Elements of 2008-2012 Capex Projections $560 million to complete SW CT transmission projects $1.3 billion for NEEWS, Springfield projects $1.1 billion for smaller transmission projects $290 million/year for CL&P distribution Higher PSNH, Yankee Gas distribution capex per rate settlements $215 million for Merrimack scrubber $25 million for AMI New CL&P generation New PSNH generation Widespread AMI implementation New transmission opportunities What’s In What’s Not 2013 Spending Needed For Completion NEEWS: $100 million Scrubber: $35 million |
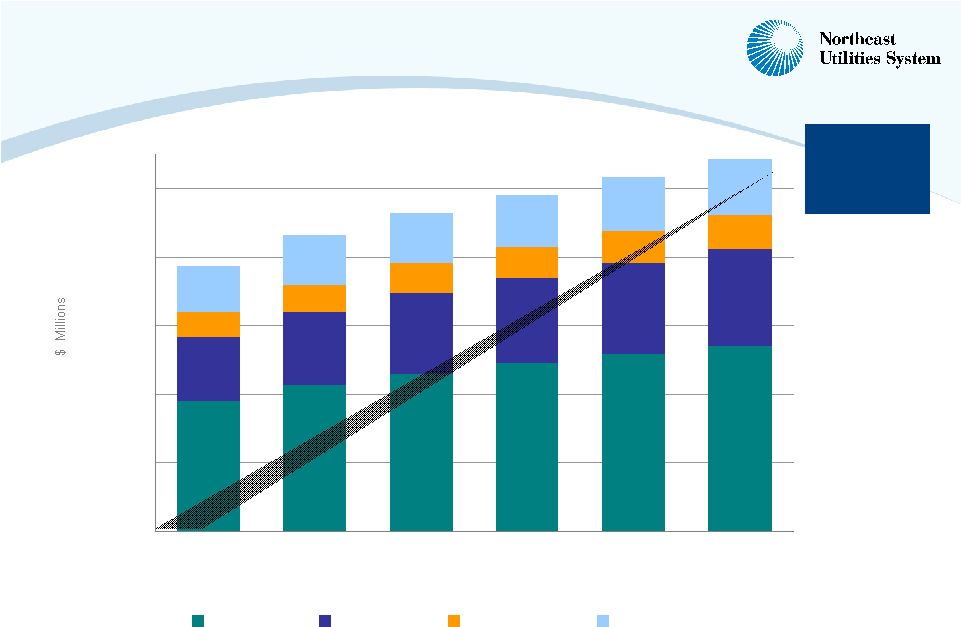
   40 Projected Combined Year-End Rate Base $1,046 $1,469 $2,132 $2,752 $3,045 $3,489 $3,944 $3,429 $3,881 $4,321 $4,638 $4,910 $5,170 $5,431 $0 $1,000 $2,000 $3,000 $4,000 $5,000 $6,000 $7,000 $8,000 $9,000 $10,000 2006 Actual 2007 Est. 2008 Est. 2009 Est. 2010 Est. 2011 Est. 2012 Est. Electric Transmission Distribution and Generation Target Utility Capitalization Structure = 45% equity, 55% debt Blended Transmission ROE 11.75% in 2007 rising to 12.1% in 2012 Projected Cost of Capital Distribution ROE = 9% - 10% $5,350 $7,390 $6,453 $7,955 Rate Base 2008-2012 CAGR of 12% $4,475 $8,659 Supports EPS CAGR of 10-14% Projected Distribution & Generation Rate Base CAGR of 7% Transmission Rate Base CAGR of 22% $9,375 |
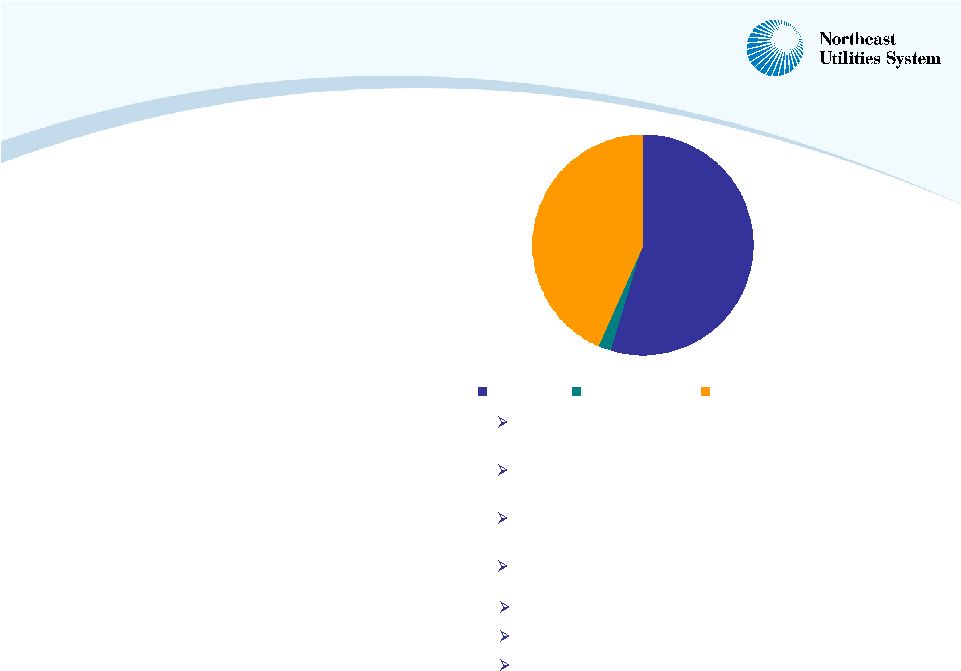
 41 Rate Base Composition 2006 Rate Base Composition 2012E Rate Base Composition $4.5 billion $9.4 billion Rate Base: $1.05 billion (Actual 2006) ’07-’12 Capex: $3.8 billion Rate Base: $2.9 billion (Actual 2006) ’07-’12 Capex: $3.0 billion Rate Base: $0.5 billion (Actual 2006) ’07-’12 Capex: $0.4 billion Electricity Transmission Electricity Distribution & Generation Gas LDC Transmission becomes much larger share of total rate base 23% 11% 66% Transmission Gas Dist. & Generation 42% 9% 49% Transmission Gas Dist. & Generation |
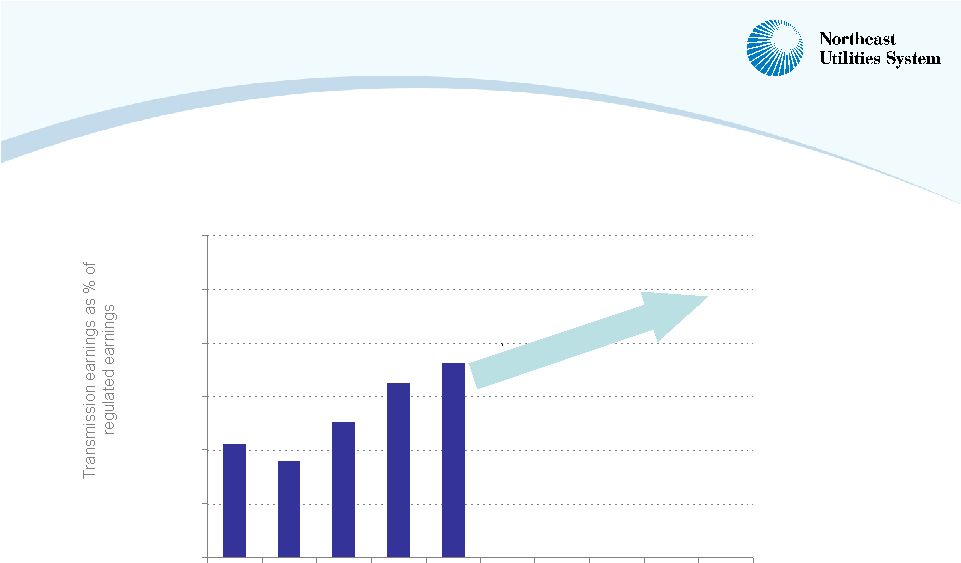 42 Transmission Becomes a Much Larger Share of Earnings 36.3% 21.2% 18.1% 25.2% 32.6% 0.0% 10.0% 20.0% 30.0% 40.0% 50.0% 60.0% 2003 2004 2005 2006* 2007 YTD 2008 2009 2010 2011 2012 *Excludes benefit to CL&P from 2006 tax reduction |
 43 Ability To Finance Growth $3,628 $116 $2,874 Total Debt Preferred Stock Common Equity 9/30/07 Strong balance sheet Strong cash and liquidity position Strong access to capital $655 million 2007 financing program complete Approximately $350 million of NU parent cash Nearly $1 billion unused bank, accounts receivable lines Conservative dividend payout Solid credit ratings at parent, subsidiaries Successful debt financings Modest equity requirements 1.8% 43.4% 54.8% |
 44 Funding The Capital Program and Dividends 2008 - 2012 $2.8 $3.6 $0.35 $6.75 Billion Existing cash • Cash remaining from 2006 NUEI generation sale Net new financings • $2.3 billion of new debt, A/R • $0.5 billion of new Parent common equity/hybrids Internally generated cash net of RRB retirements • Approximately $550 million in 2008 rising to $800-$850 million by 2012 |
 45 Key Financial Considerations Commitment to investment grade ratings Strong balance sheet 55% leverage target at utility subsidiaries 60% consolidated leverage target Improve cash flow during construction cycle Maintain financial flexibility to allow additional investment opportunities Use of NU equity to support accretive capital expenditures and projects Continued focus on an attractive total shareholder return emphasizing both EPS and dividend growth |
 46 Questions and Answers |
 47 Appendix |
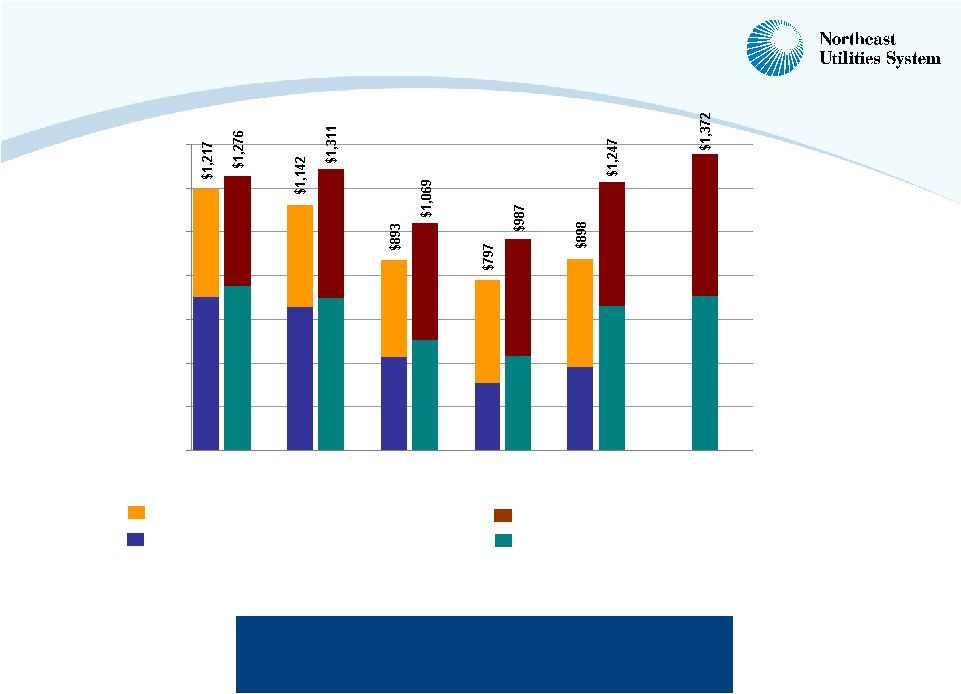
 48 2006-2012: Capital Expenditures and Depreciation $946 $1,276 $1,069 $987 $1,247 $1,372 $1,311 $362 $340 $329 $338 $298 $285 $241 $0 $200 $400 $600 $800 $1,000 $1,200 $1,400 $1,600 2006 Actual 2007 Est. 2008 Est. 2009 Est. 2010 Est. 2011 Est. 2012 Est. Total Capex (incl. cost of removal and AFUDC) Depreciation Significant capital spending through 2012 * Capex includes approximately $20 million per year at corporate service companies on behalf of operating companies |
 49 $658 $538 $311 $155 $420 $530 $77 $108 $58 $55 $108 $72 $19 $50 $137 $222 $135 $104 $0 $100 $200 $300 $400 $500 $600 $700 $800 2007 2008 2009 2010 2011 2012 CL&P PSNH WMECO Projected Transmission Capital Expenditures $754 $432 $663 $706 $506 $696 |
 50 $279 $334 $291 $289 $298 $298 $125 $167 $144 $153 $172 $252 $34 $35 $40 $34 $34 $34 $65 $57 $61 $60 $62 $68 $0 $100 $200 $300 $400 $500 $600 $700 2007 2008 2009 2010 2011 2012 CL&P PSNH* WMECO Yankee Gas *PSNH Generation = $36 million in 2007; $63 million in 2008; $44 million in 2009; $51 million in 2010; $66 million in 2011; and $142 million in 2012 Projected Distribution and Generation Capital Expenditures $503 $536 $593 $566 $536 $652 |
   51 Projected Distribution and Generation Year-End Rate Base $1,918 $2,128 $2,305 $2,459 $2,594 $2,711 $925 $1,085 $1,176 $1,248 $1,322 $1,404 $372 $394 $424 $449 $475 $504 $666 $714 $733 $754 $779 $812 $0 $1,000 $2,000 $3,000 $4,000 $5,000 2007 2008 2009 2010 2011 2012 CL&P PSNH WMECO Yankee Gas Projected Distribution & Generation Rate Base CAGR of 7% $3,881 $4,321 $4,638 $4,910 $5,170 $5,431 |
   52 Projected Transmission Year-End Rate Base* $1,221 $2,239 $2,553 $2,864 $168 $296 $307 $368 $372 $459 $80 $114 $242 $438 $564 $1,722 $2,203 $621 $0 $500 $1,000 $1,500 $2,000 $2,500 $3,000 $3,500 $4,000 2007 2008 2009 2010 2011 2012 CL&P PSNH WMECO Transmission Rate Base CAGR of 22% $1,469 $2,132 $2,752 $3,045 $3,489 $3,944 *100% CWIP assumed for Springfield 115-kV Cables, NEEWS projects |
 53 Numerous Firms Support NU Transmission’s Capital Program Poles $75M PennSummitt Tubular LLC Sabre Tubular Structures TransAmerican Power Products Thomas & Betts Valmont Substations $300M ABB Areva BTW Crompton Greaves / Pauwels Group General Electric HICO Mitsubishi Siemens Cables & Wire $375M ABB Alcan LS Cable Nehring Nexans Okonite Pirelli/Prysmian Silec/General Cable/Sagem Southwire Sural USA Viscas/Fujikura Engineering Firms $90M American Electrical Test Black & Veatch Corporation Burns & McDonnell Engineering Commonwealth Associates, Inc. Engineering & Environmental Consulting, LLC L. E. Myers Co. (an MYR Group company) Power Engineers, Inc. Sargent & Lundy, LLC TRC Companies, Inc. Construction $1.3B Bond Brothers E. S. Boulos (an NU company) Hawkeye Henkels & McCoy KemsCo Equipment Co. Mass. Electric Construction Co. (A Kiewit company) McPhee MJ Electric (Quanta) New River Electrical Corp. PAR Electrical Contractors, Inc. (Quanta) S. M. Electric Co. Thiro USA W. A. Chester |