surrounding tobacco companies generally and challenges to the MSA itself. During the fiscal year, our discomfort with the litigation environment lessened to a degree, as several high profile class action cases were dismissed and a case brought by the U.S. Dept. of Justice resulted in no monetary damages. Based on this improved litigation climate, we made modest investments in the Tobacco MSA revenue bond sector. It is important to point out, however, that our individual positions remain quite small on a percentage basis, as they do in all cases, in keeping with our focus on maintaining a broadly diversified investment portfolio for the Fund. Tobacco bonds were relatively weak performers on the fiscal year overall, as they performed poorly when the credit environment weakened.
Partly due to the weakening credit environment, healthcare and higher education bonds tended to be underperformers by comparison, as were bonds in the IDR/PCR sector (industrial development revenue bonds and pollution control revenue bonds).
A non-rated Lebanon County, Pa., bond issued for a retirement community was one of these bonds.It started the fiscal year with a premium price, which reflected the price sensitivity of its 2014 call date, or the date at which it can be redeemed by the issuer.As interest rates rose and credit spreads widened, the price of this bond moved below par and each subsequent downward move reflected the sensitivity of its 2026 final maturity date.
Of bonds that were held for the entire fiscal year, the top five performers in the Fund were pre-refunded bonds. For example, a Bexar County Texas Health Facilities bond, due in 2032, was refinanced during the year. The proceeds from the refinancing are being held in an escrow account and will be used to redeem the original bonds on their first call date in 2012. The Fund also held pre-refunded bonds originally issued in Georgia, Minnesota, and Pennsylvania, among other states.
In the past years’ reports, we discussed our rationale for not investing in municipal bonds that were backed by tobacco company revenues payable under the landmark 1998 Master Settlement Agreement (MSA). Our credit
opinion was based on the elevated risk for litigation surrounding tobacco companies generally and challenges to the MSA itself. During the fiscal year, our discomfort with the litigation environment lessened to a degree, as several high profile class action cases were dismissed and a case brought by the U.S. Dept. of Justice resulted in no monetary damages. Based on this improved litigation climate, we made modest investments in the Tobacco MSA revenue bond sector. It is important to point out, however, that our individual positions remain quite small on a percentage basis, as they do in all cases, in keeping with our focus on maintaining a broadly diversified investment portfolio for the Fund. Tobacco bonds were relatively weak performers on the fiscal year overall, as they performed poorly when the credit environment weakened.
Fixed Income Glossary
Basis point: 1/100 of a percentage point, or 0.01%. Basis points are often used to measure changes in, or differences between, yields.
Bond: A debt security, like an IOU, issued by a company, municipality, or government agency. In return for lending money to the issuer, a bond buyer generally receives fixed periodic interest payments and repayment of the loan amount on a specified maturity date.
Bond ratings: Evaluations of creditworthiness by independent agencies such as Moody’s, Standard & Poor’s, and Fitch. Ratings may range from Aaa or AAA (highest quality) to D (lowest quality). Bonds rated Baa/BBB or better are considered investment grade. Bonds rated Ba/BB or lower are noninvestment grade and commonly known as junk bonds, or high yield bonds.
Callable bond: A bond that may be redeemed at the request of the issuer prior to the stated maturity date.
Coupon rate: The interest rate that is paid to the investor over the life of the bond.
Duration: A measurement of a fixed income investment’s sensitivity to changes in interest rates. The larger the number, the greater the likely price change for a given change in interest rates.
Fed funds rate: The percentage of interest that banks charge to lend money to each other. The rate, which fluctuates, is a good indicator of general interest rate trends.
Maturity: The length of time until a bond issuer must repay the underlying loan principal to the bondholder.
Par value: The face value of a bond. It is also referred to as the principal value. When a bond reaches maturity, the holder receives this value, regardless of what was paid for the bond.
Pre-refunded bonds: Bonds that have been refinanced and are secured by U.S. Treasury bonds, held in an escrow account.
Tax-exempt bond: Exempt from federal or state income tax, state taxes, or local property tax.
Treasury yield curve: This is a curve on a graph that depicts the difference between short- and long-term bond yields across the duration spectrum. It is used as a benchmark for other debt in the market, such as mortgage rates or bank lending rates. It is also used to assess broad market trends, as well as potential changes in economic output and growth.
Municipal Bonds
Legacy bond: Bond bought in previous periods that have been held in the portfolio.
Municipal bond: Bond issued by every level of municipality in order to raise capital for day-to-day activities and special specific projects. The bonds pay interest that is typically exempt from federal income taxes and is also generally exempt from state and local income taxes.
Primary market: The broker-controlled, new-issue market. When a municipal bond is purchased in the primary market, the proceeds go to the municipality.
Secondary markets: Known as the aftermarket, or resale market. A bond exchange occurs between a buying investor and a selling investor, not from the issuer. Interest payments from the municipality are passed on to the new owner.
5
Performance summary
Delaware Tax-Free USA Fund
The performance data quoted represent past performance; past performance does not guarantee future results. Investment return and principal value will fluctuate so your shares, when redeemed, may be worth more or less than their original cost. Please obtain the performance data for the most recent month end by calling 800 523-1918 or visiting our Web site at www.delawareinvestments.com/performance. Current performance may be lower or higher than the performance data quoted.
You should consider the investment objectives, risks, charges, and expenses of the investment company carefully before investing. The Delaware Tax-Free USA Fund prospectus contains this and other important information about the investment company. Please request a prospectus through your financial advisor or by calling 800 523-1918 or visiting our Web site at www.delawareinvestments.com. Read the prospectus carefully before you invest or send money.
A rise or fall in interest rates can have a significant impact on bond prices and the net asset value (NAV) of the Fund. Funds that invest in bonds may lose their value as interest rates rise, and an investor may lose principal.
Effective July 16, 2007, portfolio management responsibilities for the Fund changed. Current managers are listed in this report. Please see the prospectus, as supplemented, which contains important information regarding the investment manager for the Fund.
| Fund performance | | | | |
| Average annual total returns | | | | |
| Through Aug. 31, 2007 | 1 year | 5 years | 10 years | Lifetime |
| |
| Class A (Est. Jan. 11, 1984) | | | | |
| Excluding sales charge | +1.08% | +4.39% | +4.67% | +7.35% |
| Including sales charge | -3.50% | +3.43% | +4.19% | +7.14% |
| |
| Class B (Est. May 2, 1994) | | | | |
| Excluding sales charge | +0.32% | +3.59% | +4.01% | +4.35% |
| Including sales charge | -3.56% | +3.33% | +4.01% | +4.35% |
| |
| Class C (Est. Nov. 29, 1995) | | | | |
| Excluding sales charge | +0.41% | +3.61% | +3.87% | +3.74% |
| Including sales charge | -0.56% | +3.61% | +3.87% | +3.74% |
Returns reflect the reinvestment of all distributions and any applicable sales charges as noted in the following paragraphs. Performance for Class B and C shares, excluding sales charges, assumes either that contingent deferred sales charges did not apply or that the investment was not redeemed.
An expense limitation was in effect for all classes during the periods shown in the Fund performance chart and in the performance of a $10,000 investment chart on the next page.
The Fund offers Class A, B, and C shares. Class A shares are sold with a maximum front-end sales charge of up to 4.50% and have an annual distribution and service fee of 0.25% of average daily net assets. The Board of Trustees has adopted a formula for calculating 12b-1 plan fees for the Fund’s Class A shares that went into effect on June 1, 1992. The total 12b-1 fees to be paid by Class A shareholders of the Fund will be the sum of 0.10% of the average daily net assets representing shares that were acquired prior to June 1, 1992, and 0.25% of the average daily net assets representing shares that were acquired on or after June 1, 1992. All Class A shareholders will bear 12b-1 fees at the same rate, the blended rate based upon the allocation of the 0.10% and 0.25% rates described above.
Class B shares are sold with a contingent deferred sales charge that declines from 4.00% to zero depending on the period of time the shares are held. Class B shares will automatically convert to Class A shares on a quarterly basis approximately eight years after purchase. They are also subject to an annual distribution and service fee of 1.00% of average daily net assets. Ten-year and lifetime performance figures for Class B shares reflect conversion to Class A shares after eight years.
Effective at the close of business on May 31, 2007, no new or subsequent investments are allowed in Class B shares of the Delaware Investments® Family of Funds, except through a reinvestment of dividends or capital gains or permitted exchanges. Please see the prospectus supplement for additional information.
Class C shares are sold with a contingent deferred sales charge of 1.00% if redeemed during the first 12 months. They are also subject to an annual distribution and service fee of 1.00% of average daily net assets.
Please see the fee table in the prospectus and your financial professional for a more complete explanation of sales charges.
6
Management has contracted to reimburse expenses and/or waive its management fees through Aug. 31, 2008, as described in the most recent prospectus. The most recent prospectus designated the Fund’s net expense ratios for Class A, B, and C shares as 0.84, 1.61%, and 1.61%, respectively. Total operating expenses for Class A, B, and C shares were designated as 0.96%, 1.73%, and 1.73%, respectively.
The performance table on the previous page and the graph below do not reflect the deduction of taxes the shareholder would pay on Fund distributions or redemptions of Fund shares.
Substantially all dividend income derived from tax-free funds is exempt from federal income tax. Some income may be subject to the federal alternative minimum tax that applies to certain investors. Capital gains, if any, are taxable.
| Fund basics |
| As of Aug. 31, 2007 |
| |
| Fund objective |
| The Fund seeks as high a level of current interest income exempt from federal income tax as is available from municipal obligations as is consistent with prudent investment management and preservation of capital. |
| |
| Total Fund net assets |
| $770 million |
| |
| Number of holdings |
| 283 |
| Fund start date | | |
| Jan. 11, 1984 | | |
| |
| | Nasdaq symbols | CUSIPs |
| Class A | DMTFX | 245909106 |
| Class B | DTFCX | 245909403 |
| Class C | DUSCX | 245909700 |
Performance of a $10,000 Investment
Average annual total returns from Aug. 31, 1997, through Aug. 31, 2007
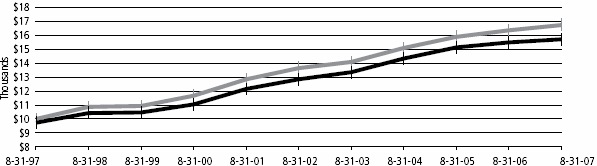
| | Starting value (Aug. 31, 1997) | Ending value (Aug. 31, 2007) |
| Lehman Brothers Municipal Bond Index | $10,000 | $16,738 |
| Delaware Tax-Free USA Fund — Class A Shares | $9,550 | $15,061 |
Chart assumes $10,000 invested on Aug. 31, 1997, and includes the effect of a 4.50% front-end sales charge and the reinvestment of all distributions.
Performance of other Fund classes will vary due to different charges and expenses.
The chart also assumes $10,000 invested in the Lehman Brothers Municipal Bond Index as of Aug. 31, 1997. Lehman Brothers Municipal Bond Index generally tracks the performance of municipal bonds. An index is unmanaged and does not reflect the costs of operating a mutual fund, such as the costs of buying, selling, and holding securities. You cannot invest directly in an index.
Past performance is not a guarantee of future results.
(continues) 7
Performance summary
Delaware Tax-Free USA Intermediate Fund
The performance data quoted represent past performance; past performance does not guarantee future results. Investment return and principal value will fluctuate so your shares, when redeemed, may be worth more or less than their original cost. Please obtain the performance data for the most recent month end by calling 800 523-1918 or visiting our Web site at www.delawareinvestments.com/performance. Current performance may be lower or higher than the performance data quoted.
You should consider the investment objectives, risks, charges, and expenses of the investment company carefully before investing. The Delaware Tax-Free USA Intermediate Fund prospectus contains this and other important information about the investment company. Please request a prospectus through your financial advisor or by calling 800 523-1918 or visiting our Web site at www.delawareinvestments.com. Read the prospectus carefully before you invest or send money.
A rise or fall in interest rates can have a significant impact on bond prices and the net asset value (NAV) of the Fund. Funds that invest in bonds may lose their value as interest rates rise, and an investor may lose principal.
Effective July 16, 2007, portfolio management responsibilities for the Fund changed. Current managers are listed in this report. Please see the prospectus, as supplemented, which contains important information regarding the investment manager for the Fund.
| Fund performance | | | | |
| Average annual total returns | | | | |
| Through Aug. 31, 2007 | 1 year | 5 years | 10 years | Lifetime |
| |
| Class A (Est. Jan. 7, 1993) | | | | |
| Excluding sales charge | +1.34% | +4.10% | +4.92% | +5.35% |
| Including sales charge | -1.41% | +3.52% | +4.62% | +5.15% |
| |
| Class B (Est. May 2, 1994) | | | | |
| Excluding sales charge | +0.48% | +3.20% | +4.46% | +4.86% |
| Including sales charge | -1.48% | +3.20% | +4.46% | +4.86% |
| |
| Class C (Est. Nov. 29, 1995) | | | | |
| Excluding sales charge | +0.39% | +3.20% | +4.02% | +4.06% |
| Including sales charge | -0.59% | +3.20% | +4.02% | +4.06% |
Returns reflect the reinvestment of all distributions and any applicable sales charges as noted in the following paragraphs. Performance for Class B and C shares, excluding sales charges, assumes either that contingent deferred sales charges did not apply or that the investment was not redeemed.
An expense limitation was in effect for all classes during the periods shown in the Fund performance chart and in the performance of a $10,000 investment chart on the next page.
The Fund offers Class A, B, and C shares. Class A shares are sold with a maximum front-end sales charge of up to 2.75% and have an annual distribution and service fee of up to 0.30% of average daily net assets but such a fee is currently subject to a contractual cap of 0.15% of average daily net assets through Dec. 31, 2007. Class B shares are sold with a contingent deferred sales charge that declines from 2.00% to zero depending on the period of time the shares are held. Class B shares will automatically convert to Class A shares on a quarterly basis approximately five years after purchase. They are also subject to an annual distribution and service fee of 1.00% of average daily net assets. Ten-year and lifetime performance figures for Class B shares reflect conversion to Class A shares after five years. Effective at the close of business on May 31, 2007, no new or subsequent investments are allowed in Class B shares of the Delaware Investments® Family of Funds, except through a reinvestment of dividends or capital gains or permitted exchanges. Please see the prospectus supplement for additional information.
Class C shares are sold with a contingent deferred sales charge of 1.00% if redeemed during the first 12 months. They are also subject to an annual distribution and service fee of 1.00% of average daily net assets.
Please see the fee table in the prospectus and your financial professional for a more complete explanation of sales charges.
Management has contracted to reimburse expenses and/or waive its management fees through Dec. 31, 2007 as discussed in the most recent prospectus. The most recent prospectus designated Fund’s net expense ratios for Class A, B, and C shares as 0.75%, 1.60%, and 1.60%, respectively. Total operating expenses for Class A, B, and C shares were designated as 1.07%, 1.77%, and 1.77%, respectively.
The performance table above and the graph on the next page do not reflect the deduction of taxes the shareholder would pay on Fund distributions or redemptions of Fund shares.
Substantially all dividend income derived from tax-free funds is exempt from federal income tax. Some income may be subject to the federal alternative minimum tax that applies to certain investors. Capital gains, if any, are taxable.
8
| Fund basics |
| As of Aug. 31, 2007 |
| |
| Fund objective |
| The Fund seeks as high a level of current interest income exempt from federal income tax as is available from municipal obligations and as is consistent with prudent investment management and preservation of capital. |
| |
| Total Fund net assets |
| $336 million |
| |
| Number of holdings |
| 212 |
| Fund start date | | |
| Jan. 7, 1993 | | |
| |
| | Nasdaq symbols | CUSIPs |
| Class A | DMUSX | 245909304 |
| Class B | DUIBX | 245909601 |
| Class C | DUICX | 245909882 |
Performance of a $10,000 Investment
Average annual total returns from Aug. 31, 1997, through Aug. 31, 2007
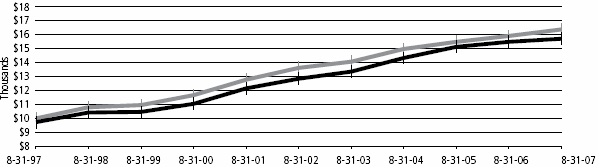
| | Starting value (Aug. 31, 1997) | Ending value (Aug. 31, 2007) |
| Lehman Brothers Municipal Bond 3-15 Year Index | $10,000 | $16,381 |
| Delaware Tax-Free USA Intermediate Fund — Class A Shares | $9,725 | $15,701 |
Chart assumes $10,000 invested on Aug. 31, 1997, and includes the effect of a 2.75% front-end sales charge and the reinvestment of all distributions.
Performance of other Fund classes will vary due to different charges and expenses.
The chart also assumes $10,000 invested in the Lehman Brothers Municipal Bond 3-15 Year Index as of Aug. 31, 1997. Lehman Brothers Municipal Bond 3-15 Year Index generally tracks the performance of municipal bonds with maturities of 3 to 15 years. An index is unmanaged and does not reflect the costs of operating a mutual fund, such as the costs of buying, selling, and holding securities. You cannot invest directly in an index.
Past performance is not a guarantee of future results.
(continues) 9
Performance summary
Delaware National High-Yield Municipal Bond Fund
The performance data quoted represent past performance; past performance does not guarantee future results. Investment return and principal value will fluctuate so your shares, when redeemed, may be worth more or less than their original cost. Please obtain the performance data for the most recent month end by calling 800 523-1918 or visiting our Web site at www.delawareinvestments.com/performance. Current performance may be lower or higher than the performance data quoted.
You should consider the investment objectives, risks, charges, and expenses of the investment company carefully before investing. The Delaware National High-Yield Municipal Bond Fund prospectus contains this and other important information about the investment company. Please request a prospectus through your financial advisor or by calling 800 523-1918 or visiting our Web site at www.delawareinvestments.com. Read the prospectus carefully before you invest or send money.
A rise or fall in interest rates can have a significant impact on bond prices and the net asset value (NAV) of the Fund. Funds that invest in bonds may lose their value as interest rates rise, and an investor may lose principal.
Effective July 16, 2007, portfolio management responsibilities for the Fund changed. Current managers are listed in this report. Please see the prospectus, as supplemented, which contains important information regarding the investment manager for the Fund.
| Fund performance | | | | |
| Average annual total returns | | | | |
| Through Aug. 31, 2007 | 1 year | 5 years | 10 years | Lifetime |
| |
| Class A (Est. Sept. 22, 1986) | | | | |
| Excluding sales charge | +1.82% | +5.19% | +4.91% | +6.56% |
| Including sales charge | -2.79% | +4.23% | +4.43% | +6.33% |
| |
| Class B (Est. Dec. 18, 1996) | | | | |
| Excluding sales charge | +0.96% | +4.38% | +4.28% | +4.62% |
| Including sales charge | -2.92% | +4.13% | +4.28% | +4.62% |
| |
| Class C (Est. May 26, 1997) | | | | |
| Excluding sales charge | +1.06% | +4.39% | +4.14% | +4.32% |
| Including sales charge | +0.08% | +4.39% | +4.14% | +4.32% |
Returns reflect the reinvestment of all distributions and any applicable sales charges as noted in the following paragraphs. Performance for Class B and C shares, excluding sales charges, assumes either that contingent deferred sales charges did not apply or that the investment was not redeemed.
An expense limitation was in effect for all classes during the periods shown in the Fund performance chart and in the performance of a $10,000 investment chart on the next page.
The Fund offers Class A, B, and C shares. Class A shares are sold with a maximum front-end sales charge of up to 4.50% and have an annual distribution and service fee of up to 0.25% of average daily net assets. Class B shares are sold with a contingent deferred sales charge that declines from 4.00% to zero depending on the period of time the shares are held. Class B shares will automatically convert to Class A shares on a quarterly basis approximately eight years after purchase. They are also subject to an annual distribution and service fee of up to 1.00% of average daily net assets. Ten-year and lifetime performance figures for Class B shares reflect conversion to Class A shares after eight years. Effective at the close of business on May 31, 2007, no new or subsequent investments are allowed in Class B shares of the Delaware Investments® Family of Funds, except through a reinvestment of dividends or capital gains or permitted exchanges. Please see the prospectus supplement for additional information.
Class C shares are sold with a contingent deferred sales charge of 1.00% if redeemed during the first 12 months. They are also subject to an annual distribution and service fee of 1.00% of average daily net assets.
Please see the fee table in the prospectus and your financial professional for a more complete explanation of sales charges.
Management has contracted to reimburse expenses and/or waive its management fees through Dec. 31, 2007, as described in the most recent prospectus. The most recent prospectus designated Fund’s net expense ratios for Class A, B, and C shares as 0.90%, 1.65%, and 1.65%, respectively. Total operating expenses for Class A, B, and C shares were designated as 1.02%, 1.77%, and 1.77%, respectively.
The performance table above and the graph on the next page do not reflect the deduction of taxes the shareholder would pay on Fund distributions or redemptions of Fund shares.
10
Substantially all dividend income derived from tax-free funds is exempt from federal income tax. Some income may be subject to the federal alternative minimum tax that applies to certain investors. Capital gains, if any, are taxable.
| Fund basics |
| As of Aug. 31, 2007 |
| |
| Fund objective |
| The Fund seeks a high level of current income exempt from federal income tax primarily through investment in medium- and lower-grade municipal obligations. |
| |
| Total Fund net assets |
| $76 million |
| |
| Number of holdings |
| 79 |
| Fund start date | | |
| Sept. 22, 1986 | | |
| |
| | Nasdaq symbols | CUSIPs |
| Class A | CXHYX | 928928241 |
| Class B | DVNYX | 928928233 |
| Class C | DVHCX | 928928225 |
Performance of a $10,000 Investment
Average annual total returns from Aug. 31, 1997, through Aug. 31, 2007
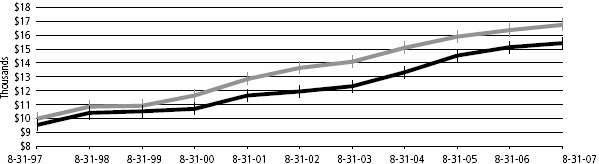
| | Starting value (Aug. 31, 1997) | Ending value (Aug. 31, 2007) |
| Lehman Brothers Municipal Bond Index | $10,000 | $16,738 |
| Delaware National High-Yield Municipal Bond Fund — | | |
| | Class A shares | $9,550 | $15,409 |
Chart assumes $10,000 invested on Aug. 31, 1997, and includes the effect of a 4.50% front-end sales charge and the reinvestment of all distributions.
Performance of other Fund classes will vary due to different charges and expenses.
The chart also assumes $10,000 invested in the Lehman Brothers Municipal Bond Index as of Aug. 31, 1997. Lehman Brothers Municipal Bond Index generally measures the performance of long-term, investment-grade, tax-exempt municipal bonds. An index is unmanaged and does not reflect the costs of operating a mutual fund, such as the costs of buying, selling, and holding securities. You cannot invest directly in an index.
Past performance is not a guarantee of future results.
11
Disclosure of Fund expenses
For the period March 1, 2007 to August 31, 2007
As a shareholder of a Fund, you incur two types of costs: (1) transaction costs, including sales charges (loads) on purchase payments, reinvested dividends, or other distributions; redemption fees; and exchange fees; and (2) ongoing costs, including management fees; distribution and/or service (12b-1) fees; and other Fund expenses. These following examples are intended to help you understand your ongoing costs (in dollars) of investing in a Fund and to compare these costs with the ongoing costs of investing in other mutual funds.
The examples are based on an investment of $1,000 invested at the beginning of the period and held for the entire period March 1, 2007 to August 31, 2007.
Actual Expenses
The first section of the tables shown, “Actual Fund Return,” provides information about actual account values and actual expenses. You may use the information in this section of the table, together with the amount you invested, to estimate the expenses that you paid over the period. Simply divide your account value by $1,000 (for example, an $8,600 account value divided by $1,000 = 8.6), then multiply the result by the number in the first section under the heading entitled “Expenses Paid During Period” to estimate the expenses you paid on your account during this period.
Hypothetical Example for Comparison Purposes
The second section of the tables shown, “Hypothetical 5% Return,” provides information about hypothetical account values and hypothetical expenses based on the Funds’ actual expense ratios and an assumed rate of return of 5% per year before expenses, which is not the Funds’ actual return. The hypothetical account values and expenses may not be used to estimate the actual ending account balance or expenses you paid for the period. You may use this information to compare the ongoing costs of investing in the Fund and other funds. To do so, compare this 5% hypothetical example with the 5% hypothetical examples that appear in the shareholder reports of the other funds.
Please note that the expenses shown in the tables are meant to highlight your ongoing costs only and do not reflect any transactional costs, such as sales charges (loads), redemption fees, or exchange fees. Therefore, the second section of each table is useful in comparing ongoing costs only, and will not help you determine the relative total costs of owning different funds. In addition, if these transactional costs were included, your costs would have been higher. The Funds’ expenses shown in the tables reflect fee waivers in effect. The expenses shown in each table assume reinvestment of all dividends and distributions.
In each case, “Expenses Paid During Period” are equal to the Fund’s annualized expense ratio, multiplied by the average account value over the period, multiplied by 184/365 (to reflect the one-half year period).
Delaware Tax-Free USA Fund
Expense Analysis of an Investment of $1,000
| | | | | | | Expenses |
| Beginning | | Ending | | | | Paid During |
| Account | | Account | | Annualized | | Period |
| Value | | Value | | Expense | | 3/1/07 to |
| | 3/1/07 | | 8/31/07 | | Ratio | | 8/31/07 |
| Actual Fund Return | | | | | | | |
| Class A | $1,000.00 | | $981.30 | | 0.86% | | $4.29 |
| Class B | 1,000.00 | | 978.40 | | 1.62% | | 8.08 |
| Class C | 1,000.00 | | 978.40 | | 1.62% | | 8.08 |
| Hypothetical 5% Return (5% return before expenses) | | |
| Class A | $1,000.00 | | $1,020.87 | | 0.86% | | $4.38 |
| Class B | 1,000.00 | | 1,017.04 | | 1.62% | | 8.24 |
| Class C | 1,000.00 | | 1,017.04 | | 1.62% | | 8.24 |
Delaware Tax-Free USA Intermediate Fund
Expense Analysis of an Investment of $1,000
| | | | | | | Expenses |
| Beginning | | Ending | | | | Paid During |
| Account | | Account | | Annualized | | Period |
| Value | | Value | | Expense | | 3/1/07 to |
| | 3/1/07 | | 8/31/07 | | Ratio | | 8/31/07 |
| Actual Fund Return | | | | | | | |
| Class A | $1,000.00 | | $988.10 | | 0.76% | | $3.81 |
| Class B | 1,000.00 | | 983.90 | | 1.61% | | 8.05 |
| Class C | 1,000.00 | | 983.90 | | 1.61% | | 8.05 |
| Hypothetical 5% Return (5% return before expenses) | | |
| Class A | $1,000.00 | | $1,021.37 | | 0.76% | | $3.87 |
| Class B | 1,000.00 | | 1,017.09 | | 1.61% | | 8.19 |
| Class C | 1,000.00 | | 1,017.09 | | 1.61% | | 8.19 |
12
Delaware National High-Yield Municipal Bond Fund
Expense Analysis of an Investment of $1,000
| | | | | | | | Expenses |
| | Beginning | | Ending | | | | Paid During |
| | Account | | Account | | Annualized | | Period |
| | Value | | Value | | Expense | | 3/1/07 to |
| | 3/1/07 | | 8/31/07 | | Ratio | | 8/31/07 |
| Actual Fund Return | | | | | | | |
| Class A | $1,000.00 | | $983.80 | | 0.90% | | $4.50 |
| Class B | 1,000.00 | | 979.20 | | 1.65% | | 8.23 |
| Class C | 1,000.00 | | 980.20 | | 1.65% | | 8.24 |
| Hypothetical 5% Return (5% return before expenses) | | |
| Class A | $1,000.00 | | $1,020.67 | | 0.90% | | $4.58 |
| Class B | 1,000.00 | | 1,016.89 | | 1.65% | | 8.39 |
| Class C | 1,000.00 | | 1,016.89 | | 1.65% | | 8.39 |
13
Sector allocations and credit quality breakdowns
As of August 31, 2007
Sector designations may be different than the sector designations presented in other Fund materials.
Delaware Tax-Free USA Fund
| | Percentage |
| Sector | of Net Assets |
| Municipal Bonds | 98.37% | |
| Corporate Revenue Bonds | 10.37% | |
| Education Revenue Bonds | 6.06% | |
| Electric Revenue Bonds | 1.66% | |
| Escrowed to Maturity Bonds | 5.31% | |
| Health Care Revenue Bonds | 16.75% | |
| Housing Revenue Bonds | 3.35% | |
| Lease Revenue Bonds | 4.02% | |
| Local General Obligation Bonds | 8.11% | |
| Pre-Refunded Bonds | 15.81% | |
| Special Tax Bonds | 5.68% | |
| State General Obligation Bonds | 13.41% | |
| Transportation Revenue Bonds | 3.77% | |
| Water & Sewer Revenue Bonds | 4.07% | |
| Variable Rate Demand Notes | 0.58% | |
| Total Value of Securities | 98.95% | |
| Receivables and Other Assets Net of Liabilities | 1.05% | |
| Total Net Assets | 100.00% | |
| | |
| Credit Quality Breakdown | | |
| (as a % of fixed income investments) | | |
| AAA | 49.23% | |
| AA | 13.31% | |
| A | 11.16% | |
| BBB | 18.80% | |
| BB | 0.90% | |
| B | 0.60% | |
| Not Rated | 6.00% | |
| Total | 100.00% | |
Delaware Tax-Free USA Intermediate Fund
| | Percentage |
| Sector | of Net Assets |
| Municipal Bonds | 93.34% | |
| Corporate Revenue Bonds | 5.05% | |
| Education Revenue Bonds | 8.03% | |
| Electric Revenue Bonds | 2.73% | |
| Escrowed to Maturity Bonds | 0.06% | |
| Health Care Revenue Bonds | 11.35% | |
| Housing Revenue Bonds | 0.27% | |
| Lease Revenue Bonds | 4.70% | |
| Local General Obligation Bonds | 16.44% | |
| Pre-Refunded Bonds | 8.06% | |
| Resource Recovery Bonds | 0.44% | |
| Special Tax Bonds | 5.65% | |
| State General Obligation Bonds | 18.97% | |
| Transportation Revenue Bonds | 4.48% | |
| Water & Sewer Revenue Bonds | 7.11% | |
| Variable Rate Demand Notes | 6.15% | |
| Total Value of Securities | 99.49% | |
| Receivables and Other Assets Net of Liabilities | 0.51% | |
| Total Net Assets | 100.00% | |
| | |
| Credit Quality Breakdown | | |
| (as a % of fixed income investments) | | |
| AAA | 49.26% | |
| AA | 20.53% | |
| A | 11.95% | |
| BBB | 12.39% | |
| BB | 0.72% | |
| Not Rated | 5.15% | |
| Total | 100.00% | |
14
Delaware National High-Yield Municipal Bond Fund
| | Percentage |
| Sector | of Net Assets |
| Municipal Bonds | 96.87% | |
| Corporate Revenue Bonds | 17.20% | |
| Education Revenue Bonds | 14.72% | |
| Health Care Revenue Bonds | 21.71% | |
| Lease Revenue Bonds | 3.39% | |
| Local General Obligation Bonds | 9.53% | |
| Pre-Refunded Bonds | 20.83% | |
| Special Tax Bonds | 5.39% | |
| Transportation Revenue Bonds | 4.10% | |
| Variable Rate Demand Notes | 2.96% | |
| Total Value of Securities | 99.83% | |
| Receivables and Other Assets Net of Liabilities | 0.17% | |
| Total Net Assets | 100.00% | |
| | |
| Credit Quality Breakdown | | |
| (as a % of fixed income investments) | | |
| AAA | 7.04% | |
| AA | 2.96% | |
| A | 10.62% | |
| BBB | 32.36% | |
| BB | 6.82% | |
| B | 1.20% | |
| Not Rated | 39.00% | |
| Total | 100.00% | |
15
Statements of net assets
Delaware Tax-Free USA Fund
August 31, 2007
| | Principal | | |
| | Amount | | Value |
| Municipal Bonds – 98.37% | | | |
| Corporate Revenue Bonds – 10.37% | | | |
| Alliance Airport Authority Texas | | | |
| Special Facilities Revenue | | | |
| (American Airlines Project) | | | |
| Series B 5.25% 12/1/29 (AMT) | $7,500,000 | | $ 6,749,700 |
| Brazos, Texas River Authority Pollution | | | |
| Control Revenue | | | |
| (Texas Utilities) | | | |
| 5.40% 5/1/29 (AMT) | 3,000,000 | | 2,847,480 |
| ·(TXU Energy Co. Project) | | | |
| Series B 6.30% 7/1/32 (AMT) | 3,500,000 | | 3,551,345 |
| Chicago, Illinois O Hare | | | |
| International Airport Special | | | |
| Facilities Revenue (American | | | |
| Airlines Inc. Project) | | | |
| 5.50% 12/1/30 | 2,500,000 | | 2,360,550 |
| Cloquet, Minnesota Pollution | | | |
| Control Revenue (Potlatch | | | |
| Corp. Project) 5.90% 10/1/26 | 1,695,000 | | 1,703,204 |
| Connecticut State Development | | | |
| Authority Pollution Control | | | |
| Revenue (Connecticut Light & | | | |
| Power) Series A 5.85% 9/1/28 | 4,000,000 | | 4,117,280 |
| Denver, Colorado City & County | | | |
| Airport Special Facilities | | | |
| Revenue Refunding (United Air | | | |
| Lines Project) Series A | | | |
| 5.25% 10/1/32 (AMT) | 5,000,000 | | 4,561,800 |
| Golden State, California Tobacco | | | |
| Securitization Corporation | | | |
| Settlement Revenue Refunding | | | |
| Asset-Backed Senior | | | |
| ¶Convertible Series A-2 | | | |
| 5.30% 6/1/37 | 5,000,000 | | 3,289,600 |
| Series A-1 5.125% 6/1/47 | 1,500,000 | | 1,329,615 |
| Series A-1 5.75% 6/1/47 | 3,000,000 | | 2,919,780 |
| Indianapolis, Indiana Airport | | | |
| Authority Revenue Special | | | |
| Facilities (Federal Express Corp. | | | |
| Project) | | | |
| 5.10% 1/15/17 (AMT) | 2,750,000 | | 2,755,720 |
| Series 1998 5.50% 5/1/29 (AMT) | 2,000,000 | | 1,968,740 |
| Mason County, West Virginia | | | |
| Pollution Control Revenue | | | |
| (Appalachian Power Co. | | | |
| Project) Series K | | | |
| 6.05% 12/1/24 (AMBAC) | 3,000,000 | | 3,162,270 |
| Mississippi Business Finance | | | |
| Corporation Pollution Control | | | |
| Revenue (System Energy | | | |
| Resources, Inc. Project) | | | |
| 5.90% 5/1/22 | 3,000,000 | | 3,028,920 |
| Petersburg, Indiana Pollution | | | |
| Control Revenue (Indianapolis | | | |
| Power & Light Co. Project) | | | |
| 6.375% 11/2/29 (AMT) | 5,000,000 | | 5,265,450 |
| Phenix City, Alabama Industrial | | | |
| Development Board | | | |
| Environmental Improvement | | | |
| Revenue (Mead Westvaco | | | |
| Corp. Project) Series A | | | |
| 6.35% 5/15/35 (AMT) | 3,000,000 | | 3,102,270 |
| ·Port Morrow, Oregon Pollution | | | |
| Control Revenue (Portland | | | |
| General Electric Co.) Series A | | | |
| 5.20% 5/1/33 | 2,600,000 | | 2,638,350 |
| Puerto Rico Industrial, Medical | | | |
| & Environmental Pollution | | | |
| Control Facilities Financing | | | |
| Authority Revenue (PepsiCo | | | |
| Inc. Project) 6.25% 11/15/13 | 1,250,000 | | 1,301,300 |
| Richmond County, Georgia | | | |
| Development Authority | | | |
| Environmental Improvement | | | |
| Revenue (International Paper Co.) | | | |
| Series B 5.95% 11/15/25 (AMT) | 5,000,000 | | 5,094,050 |
| South Carolina Jobs Economic | | | |
| Development Authority | | | |
| Industrial Revenue (South | | | |
| Carolina Electric & Gas Co. | | | |
| Project) Series B 5.45% | | | |
| 11/1/32 (AMBAC) (AMT) | 500,000 | | 512,545 |
| Suffolk County, New York | | | |
| Industrial Development | | | |
| Agency Revenue (Keyspan- | | | |
| Port Jefferson Energy Center) | | | |
| 5.25% 6/1/27 (AMT) | 3,500,000 | | 3,516,940 |
| Sugar Creek, Missouri Industrial | | | |
| Development Revenue (Lafarge | | | |
| North America Project) | | | |
| Series A 5.65% 6/1/37 (AMT) | 500,000 | | 500,870 |
| Sweetwater County, Wyoming | | | |
| Solid Waste Disposal Revenue | | | |
| (FMC Corp. Project) | | | |
| 5.60% 12/1/35 (AMT) | 5,000,000 | | 4,940,100 |
| Tobacco Settlement Financing | | | |
| Corporation, New Jersey | | | |
| Refunding Senior Series 1A | | | |
| 5.00% 6/1/41 | 4,000,000 | | 3,467,400 |
| Tobacco Settlement Financing | | | |
| Corporation, Virginia Senior | | | |
| ¶Convertible Senior Series B-2 | | | |
| 5.20% 6/1/46 | 2,500,000 | | 1,676,625 |
| Series B-1 5.00% 6/1/47 | 4,000,000 | | 3,463,520 |
| | | | 79,825,424 |
| Education Revenue Bonds – 6.06% | | | |
| Amherst, New York Industrial | | | |
| Development Agency Civic | | | |
| Facilities Revenue (UBF Faculty | | | |
| Student Housing) Series A | | | |
| 5.75% 8/1/30 (AMBAC) | 1,300,000 | | 1,384,786 |
16
| | Principal | | |
| | Amount | | Value |
| Municipal Bonds (continued) | | | |
| Education Revenue Bonds (continued) | | | |
| Broward County, Florida | | | |
| Educational Facilities Authority | | | |
| Revenue (Nova Southeastern | | | |
| Project) 5.25% 4/1/27 (RADIAN) | $1,000,000 | | $ 997,530 |
| California Statewide Communities | | | |
| Development Authority | | | |
| Revenue (California Baptist | | | |
| University Project) Series A | | | |
| 5.50% 11/1/38 | 1,500,000 | | 1,457,430 |
| Gainesville, Georgia | | | |
| Redevelopment Authority | | | |
| Educational Facilities Revenue | | | |
| (Riverside Military Academy | | | |
| Project) 5.125% 3/1/37 | 4,000,000 | | 3,681,360 |
| Illinois Financial Authority Revenue | | | |
| (Illinois Institute of Technology) | | | |
| Series A 5.00% 4/1/36 | 2,600,000 | | 2,456,506 |
| Massachusetts State Development | | | |
| Finance Agency Revenue | | | |
| (Boston College Project) | | | |
| Series P 5.00% 7/1/42 | 2,505,000 | | 2,540,796 |
| (Massachusetts College of | | | |
| Pharmacy Project) Series C | | | |
| 5.75% 7/1/33 | 1,500,000 | | 1,567,860 |
| Massachusetts State Health & | | | |
| Educational Facilities Authority | | | |
| Revenue (Nichols College | | | |
| Project) Series C | | | |
| 6.00% 10/1/17 | 908,000 | | 946,781 |
| 6.125% 10/1/29 | 1,000,000 | | 1,037,860 |
| Missouri State Health & | | | |
| Educational Facilities Authority | | | |
| Educational Facilities Revenue | | | |
| (University of Health Sciences) | | | |
| 5.00% 6/1/31 (MBIA) | 1,000,000 | | 1,007,400 |
| New Hampshire Higher | | | |
| Educational & Health Facilities | | | |
| Authority Revenue (New | | | |
| Hampton School Issue) | | | |
| 5.375% 10/1/28 | 3,070,000 | | 3,088,881 |
| New York City, New York | | | |
| Industrial Development | | | |
| Agency Civic Facilities Revenue | | | |
| (Vaughn College Aeronautics) | | | |
| Series B | | | |
| 5.00% 12/1/31 | 1,510,000 | | 1,327,819 |
| 5.25% 12/1/36 | 1,420,000 | | 1,285,597 |
| Oregon Health & Science | | | |
| University Revenue (Capital | | | |
| Appreciation Insured) Series A | | | |
| 5.00% 7/1/32 (MBIA) | 2,000,000 | | 2,024,120 |
| ^5.50% 7/1/21 (MBIA) | 2,000,000 | | 1,056,080 |
| Oregon State Facilities Authority | | | |
| Revenue (College Housing | | | |
| Northwest Project) Series A | | | |
| 5.45% 10/1/32 | 1,000,000 | | 992,520 |
| (College Independent Student | | | |
| Housing Project) Series A | | | |
| 5.25% 7/1/30 (XLCA) | 1,630,000 | | 1,686,463 |
| Pennsylvania State Higher | | | |
| Educational Facilities Authority | | | |
| Revenue (Widener University) | | | |
| 5.375% 7/15/29 | 1,000,000 | | 1,007,180 |
| Provo, Utah Charter School | | | |
| Revenue (Freedom Academy | | | |
| Foundation Project) | | | |
| 5.50% 6/15/37 | 1,750,000 | | 1,632,488 |
| Saint Louis, Missouri Industrial | | | |
| Development Authority | | | |
| Revenue (Confluence Academy | | | |
| Project) Series A | | | |
| 5.25% 6/15/25 | 1,150,000 | | 1,070,029 |
| 5.35% 6/15/32 | 2,300,000 | | 2,106,777 |
| San Leanna, Texas Higher | | | |
| Educational Facilities Revenue | | | |
| (Saint Edwards University | | | |
| Project) 4.75% 6/1/32 | 1,750,000 | | 1,540,245 |
| University of Central Florida | | | |
| Athletics Association Revenue | | | |
| Certificates of Participation | | | |
| Series A 5.25% 10/1/34 (FGIC) | 2,000,000 | | 2,060,320 |
| University of Texas Revenue (FING | | | |
| System) Series B 5.00% 8/15/37 | 7,070,000 | | 7,220,802 |
| University of the Virgin Islands | | | |
| Series A 5.375% 6/1/34 | 500,000 | | 492,975 |
| Vermont University & State | | | |
| Agriculture College | | | |
| 5.125% 10/1/37 (AMBAC) | 1,000,000 | | 1,014,010 |
| | | | 46,684,615 |
| Electric Revenue Bonds – 1.66% | | | |
| Chelan County, Washington | | | |
| Public Utilities District #001 | | | |
| Consolidated Revenue (Chelan | | | |
| Hydro System) Series A | | | |
| 5.45% 7/1/37 (AMBAC) (AMT) | 5,000,000 | | 5,068,000 |
| Florida State Municipal Power Agency | | | |
| Revenue (Stanton II Project) | | | |
| 5.00% 10/1/26 (AMBAC) | 2,000,000 | | 2,037,640 |
| Missouri State Environmental | | | |
| Improvement & Energy | | | |
| Resource Authority Pollution | | | |
| Control Revenue Refunding | | | |
| (St. Joseph Light & Power | | | |
| Company Project) | | | |
| 5.85% 2/1/13 (AMBAC) | 2,200,000 | | 2,203,608 |
| Ocala, Florida Utility System | | | |
| Revenue Refunding Series A | | | |
| 5.00% 10/1/31 (FGIC) | 1,265,000 | | 1,289,807 |
| Puerto Rico Electric Power | | | |
| Authority Power Revenue | | | |
| Series PP 5.00% 7/1/25 (FGIC) | 1,000,000 | | 1,033,530 |
(continues) 17
Statements of net assets
Delaware Tax-Free USA Fund
| | Principal | | |
| | Amount | | Value |
| Municipal Bonds (continued) | | | |
| Electric Revenue Bonds (continued) | | | |
| Sikeston, Missouri Electric | | | |
| Revenue Refunding | | | |
| 6.00% 6/1/13 (MBIA) | $ 1,000,000 | | $ 1,114,520 |
| | | | 12,747,105 |
| Escrowed to Maturity Bonds – 5.31% | | | |
| Cape Girardeau County, Missouri | | | |
| Industrial Development | | | |
| Authority Health Care Facilities | | | |
| Revenue (Southeast Missouri | | | |
| Hospital) 5.25% 6/1/16 (MBIA) | 440,000 | | 471,346 |
| ^Greene County, Missouri Single | | | |
| Family Mortgage Revenue | | | |
| Municipal Multiplier (Private | | | |
| Mortgage Insurance) | | | |
| 6.10% 3/1/16 | 1,225,000 | | 860,256 |
| Liberty, Missouri Sewer System | | | |
| Revenue 6.00% 2/1/08 (MBIA) | 130,000 | | 130,920 |
| Louisiana Public Facilities | | | |
| Authority Hospital Revenue | | | |
| (Southern Baptist Hospital, Inc. | | | |
| Project) 8.00% 5/15/12 | 4,240,000 | | 4,665,611 |
| Missouri State Health & Educational | | | |
| Facilities Authority Health | | | |
| Facilities Revenue Refunding | | | |
| (SSM Health Care) Series AA | | | |
| 6.40% 6/1/10 (MBIA) | 500,000 | | 534,890 |
| New Jersey State Highway | | | |
| Authority Garden State | | | |
| Parkway General Revenue | | | |
| (Senior Parkway) | | | |
| 5.50% 1/1/14 (FGIC) | 5,000,000 | | 5,469,800 |
| 5.50% 1/1/15 (FGIC) | 7,310,000 | | 8,037,053 |
| 5.50% 1/1/16 (FGIC) | 1,000,000 | | 1,104,240 |
| Oklahoma State Turnpike | | | |
| Authority Revenue (First | | | |
| Senior) 6.00% 1/1/22 | 13,535,000 | | 15,889,413 |
| Umatilla County, Oregon Hospital | | | |
| Facility Authority Revenue | | | |
| (Catholic Health Initiatives) | | | |
| Series A 5.50% 3/1/32 | 1,000,000 | | 1,048,620 |
| Virgin Islands Public Finance | | | |
| Authority Revenue Series A | | | |
| 7.30% 10/1/18 | 2,200,000 | | 2,663,914 |
| | | | 40,876,063 |
| Health Care Revenue Bonds – 16.75% | | | |
| Akron Bath Copley, Ohio Joint | | | |
| Township Hospital District | | | |
| Revenue (Summa Health | | | |
| System) Series A | | | |
| 5.25% 11/15/31 (RADIAN) | 3,000,000 | | 2,967,330 |
| California Statewide Communities | | | |
| Development Authority | | | |
| Revenue (Kaiser Permenante) | | | |
| 5.25% 3/1/45 | 7,500,000 | | 7,512,750 |
| Cape Girardeau County, Missouri | | | |
| Industrial Development | | | |
| Authority Health Care Facilities | | | |
| Revenue Unrefunded Balance | | | |
| (Southeast Missouri Hospital) | | | |
| 5.25% 6/1/16 (MBIA) | 560,000 | | 593,387 |
| (St. Francis Medical Center) | | | |
| Series A 5.50% 6/1/32 | 1,000,000 | | 1,017,890 |
| Chatham County, Georgia | | | |
| Hospital Authority Revenue | | | |
| (Memorial Health Medical | | | |
| Center) Series A | | | |
| 6.125% 1/1/24 | 1,000,000 | | 1,036,410 |
| Cleveland-Cuyahoga County, | | | |
| Ohio Port Authority Revenue | | | |
| Senior Housing (St. Clarence - | | | |
| Geac) Series A 6.25% 5/1/38 | 1,500,000 | | 1,526,130 |
| Colorado Health Facilities | | | |
| Authority Revenue (Evangelical | | | |
| Lutheran) Series A | | | |
| 5.25% 6/1/34 | 4,275,000 | | 4,122,938 |
| Cumberland County, Pennsylvania | | | |
| Municipal Authority Revenue | | | |
| (Diakon Lutheran Ministries | | | |
| Project) 5.00% 1/1/36 | 2,570,000 | | 2,377,738 |
| Cuyahoga County, Ohio Revenue | | | |
| (Cleveland Clinic Health | | | |
| Systems) Series A | | | |
| 5.50% 1/1/29 | 7,500,000 | | 7,785,075 |
| Duluth, Minnesota Economic | | | |
| Development Authority | | | |
| Health Care Facilities Revenue | | | |
| (Benedictine Health System - | | | |
| St. Mary’s Hospital) | | | |
| 5.25% 2/15/33 | 5,000,000 | | 5,013,450 |
| Escambia County, Florida Health | | | |
| Facilities Authority Health Care | | | |
| Facilities Loan (VHA Program) | | | |
| 5.95% 7/1/20 (AMBAC) | 560,000 | | 580,216 |
| Florence County, South Carolina | | | |
| Hospital Revenue (McLeod | | | |
| Regional Medical Center | | | |
| Project) Series A | | | |
| 5.25% 11/1/27 (FSA) | 3,355,000 | | 3,454,644 |
| Gainesville & Hall County, Georgia | | | |
| Development Authority | | | |
| Revenue Senior Living Facilities | | | |
| (Lanier Village Estates Project) | | | |
| Series C 7.25% 11/15/29 | 1,000,000 | | 1,068,720 |
| Henrico County, Virginia | | | |
| Economic Development | | | |
| Authority Revenue (Bon | | | |
| Secours Health System Inc.) | | | |
| Series A 5.60% 11/15/30 | 3,140,000 | | 3,208,703 |
18
| | Principal | | |
| | Amount | | Value |
| Municipal Bonds (continued) | | | |
| Health Care Revenue Bonds (continued) | | | |
| Illinois Health Facilities Authority | | | |
| Revenue (Elmhurst Memorial | | | |
| Healthcare Project) | | | |
| 5.625% 1/1/28 | $2,000,000 | | $2,051,620 |
| Indian River County, Florida | | | |
| Hospital District Revenue | | | |
| Refunding 6.10% 10/1/18 (FSA) | 3,000,000 | | 3,065,370 |
| Jacksonville, Florida Economic | | | |
| Development Community | | | |
| Health Care Facilities Revenue | | | |
| (Mayo Clinic) 5.00% 11/15/36 | 7,000,000 | | 7,026,460 |
| Johnson City, Tennessee Health | | | |
| and Educational Facilities | | | |
| Board Hospital Revenue First | | | |
| Mortgage (Mountain States | | | |
| Health) Series A 5.50% 7/1/36 | 3,000,000 | | 2,988,990 |
| Joplin, Missouri Industrial | | | |
| Development Authority Health | | | |
| Facilities Revenue (Freeman | | | |
| Health System Project) | | | |
| 5.375% 2/15/35 | 255,000 | | 249,620 |
| 5.75% 2/15/35 | 405,000 | | 413,124 |
| Knox County, Tennessee Health | | | |
| Educational & Housing | | | |
| Facilities Board Hospital | | | |
| Revenue (East Tennessee | | | |
| Hospital Project) Series B | | | |
| 5.75% 7/1/33 | 1,000,000 | | 1,013,990 |
| Lee County, Florida Memorial | | | |
| Health System Hospital | | | |
| Revenue Series A 5.00% | | | |
| 4/1/32 (AMBAC) | 1,500,000 | | 1,515,300 |
| Lucas County, Ohio Health Care | | | |
| Facility Revenue (Sunset | | | |
| Retirement Communities) | | | |
| Series A 6.625% 8/15/30 | 2,000,000 | | 2,082,300 |
| Massachusetts State Health & | | | |
| Educational Facilities Authority | | | |
| Revenue (Milford Regional | | | |
| Medical Center Issue) Series E | | | |
| 5.00% 7/15/32 | 2,000,000 | | 1,806,360 |
| Michigan State Hospital Finance | | | |
| Authority Revenue | | | |
| (Ascension Health Credit | | | |
| Group) Series B | | | |
| 5.25% 11/15/26 | 3,500,000 | | 3,571,155 |
| (Henry Ford Health System) | | | |
| Series A 5.25% 11/15/46 | 8,250,000 | | 8,178,802 |
| (Oakwood Obligation Group) | | | |
| Series A 5.75% 4/1/32 | 2,500,000 | | 2,578,575 |
| (Trinity Health Credit) Series C | | | |
| 5.375% 12/1/30 | 6,000,000 | | 6,176,160 |
| Missouri State Health & | | | |
| Educational Facilities Authority | | | |
| Health Facilities Revenue | | | |
| Refunding (Lake Regional | | | |
| Health System Project) | | | |
| 5.70% 2/15/34 | 500,000 | | 506,090 |
| Montgomery County, | | | |
| Pennsylvania Industrial | | | |
| Development Authority | | | |
| Retirement Community | | | |
| Revenue (Acts Retirement | | | |
| Communities) Series A | | | |
| 4.50% 11/15/36 | 2,000,000 | | 1,639,600 |
| Multnomah County, Oregon | | | |
| Hospital Facilities Authority | | | |
| Revenue (Providence Health | | | |
| System) 5.25% 10/1/22 | 3,500,000 | | 3,628,555 |
| New Jersey Health Care Facilities | | | |
| Financing Authority Revenue | | | |
| (Trinitas Hospital Obligation | | | |
| Group) Series A 5.25% 7/1/30 | 3,500,000 | | 3,366,930 |
| New York State Dormitory | | | |
| Authority Revenue (Catholic | | | |
| Health Services of Long Island - | | | |
| St. Francis Hospital Project) | | | |
| 5.10% 7/1/34 | 2,500,000 | | 2,358,725 |
| North Carolina Medical Care | | | |
| Commission Health Care | | | |
| Facilities Revenue | | | |
| (First Mortgage - Presbyterian | | | |
| Homes) 5.40% 10/1/27 | 4,000,000 | | 3,901,680 |
| (Pennybryn at Mayfield Project) | | | |
| Series A 6.125% 10/1/35 | 6,000,000 | | 6,026,160 |
| North Carolina Medical Care | | | |
| Commission Hospital Revenue | | | |
| (Northeast Medical Center | | | |
| Project) 5.125% 11/1/34 | 1,250,000 | | 1,261,100 |
| North Kansas City, Missouri | | | |
| Hospital Revenue Series A | | | |
| 5.00% 11/15/28 (FSA) | 500,000 | | 509,035 |
| North Miami, Florida Health | | | |
| Facilities Authority Revenue | | | |
| (Catholic Health Services | | | |
| Obligation Group) (LOC | | | |
| Suntrust Bank - Miami) | | | |
| 6.00% 8/15/16 | 500,000 | | 512,880 |
| Palm Beach County, Florida Health | | | |
| Facilities Authority Revenue | | | |
| (Boca Raton Community | | | |
| Hospital) 5.625% 12/1/31 | 2,000,000 | | 2,047,200 |
| Philadelphia, Pennsylvania | | | |
| Hospitals & Higher Education | | | |
| Facilities Authority Revenue | | | |
| (Temple University Health | | | |
| System) Series B 5.50% 7/1/30 | 3,500,000 | | 3,408,755 |
(continues) 19
Statements of net assets
Delaware Tax-Free USA Fund
| | Principal | | |
| | Amount | | Value |
| Municipal Bonds (continued) | | | |
| Health Care Revenue Bonds (continued) | | | |
| Prince William County, Virginia | | | |
| Industrial Development | | | |
| Authority Hospital Revenue | | | |
| (Potomac Hospital Corp.) | | | |
| 5.35% 10/1/36 | $1,750,000 | | $ 1,766,835 |
| Puerto Rico Industrial, Tourist, | | | |
| Educational, Medical & | | | |
| Environmental Control | | | |
| Facilities Revenue (Hospital | | | |
| Auxilio Mutuo Obligated | | | |
| Group) Series A | | | |
| 6.25% 7/1/24 (MBIA) | 1,200,000 | | 1,207,884 |
| Shelby County, Tennessee Health | | | |
| Educational & Housing | | | |
| Facilities Board Revenue | | | |
| (Trezevant Manor Project) | | | |
| Series A 5.625% 9/1/26 | 2,500,000 | | 2,421,525 |
| Tallahassee, Florida Health | | | |
| Facilities Revenue (Tallahassee | | | |
| Memorial Regional Medical | | | |
| Center) Series B | | | |
| 6.00% 12/1/15 (MBIA) | 2,500,000 | | 2,503,925 |
| University Colorado Hospital | | | |
| Authority Revenue Series A | | | |
| 5.25% 11/15/39 | 2,000,000 | | 1,917,480 |
| Virginia Small Business Financing | | | |
| Authority Hospital Revenue | | | |
| (Wellmont Health System | | | |
| Project) Series A 5.25% 9/1/37 | 5,125,000 | | 4,941,423 |
| | | | 128,908,989 |
| Housing Revenue Bonds – 3.35% | | | |
| Florida Housing Finance Agency | | | |
| (Landings at Sea Forest | | | |
| Apartments) Series T | | | |
| 5.85% 12/1/18 (AMBAC) | | | |
| (FHA) (AMT) | 360,000 | | 363,298 |
| 6.05% 12/1/36 (AMBAC) | | | |
| (FHA) (AMT) | 700,000 | | 705,656 |
| (Leigh Meadows Apartments | | | |
| Section 8 HUD) Series N | | | |
| 6.20% 9/1/26 (AMBAC) (AMT) | 2,765,000 | | 2,789,332 |
| 6.30% 9/1/36) (AMBAC) (AMT) | 2,000,000 | | 2,017,000 |
| (Riverfront Apartments Section | | | |
| 8 HUD) Series A 6.25% 4/1/37 | | | |
| (AMBAC) (AMT) | 1,000,000 | | 1,014,720 |
| (Spinnaker Cove Apartments) | | | |
| Series G 6.50% 7/1/36) | | | |
| (AMBAC) (FHA) (AMT) | 500,000 | | 504,150 |
| (The Vineyards Project) | | | |
| Series H 6.40% 11/1/15 | 500,000 | | 502,125 |
| (Woodbridge Apartments | | | |
| Project) Series L | | | |
| 6.15% 12/1/26 (AMBAC) (AMT) | 1,750,000 | | 1,768,113 |
| 6.25% 6/1/36 (AMBAC) (AMT) | 2,000,000 | | 2,019,960 |
| Franklin County, Ohio Multi Family | | | |
| Revenue (Alger Green) Series A | | | |
| 5.80% 5/20/44 (GNMA) (AMT) | 1,150,000 | | 1,171,057 |
| Illinois Development Finance | | | |
| Authority Revenue (Section 8) | | | |
| Series A 5.80% 7/1/28 | | | |
| (MBIA) (FHA) | 2,790,000 | | 2,833,942 |
| Illinois Housing Development | | | |
| Authority Multi Family | | | |
| Revenue (Crystal Lake | | | |
| Preservation) Series A-1 | | | |
| 5.80% 12/20/41 (GNMA) | 2,000,000 | | 2,084,900 |
| Milwaukee, Wisconsin | | | |
| Redevelopment Authority | | | |
| Multifamily Revenue (City Hall | | | |
| Square) 6.30% 8/1/38 | | | |
| (FHA) (AMT) | 1,455,000 | | 1,489,571 |
| Missouri State Housing | | | |
| Development Commission | | | |
| Mortgage Revenue Single | | | |
| Family Homeowner | | | |
| Loan A 5.20% 9/1/33 (GNMA) | | | |
| (FNMA) (AMT) | 255,000 | | 254,459 |
| Loan A 7.20% 9/1/26 (GNMA) | | | |
| (FNMA) (AMT) | 45,000 | | 46,229 |
| Loan C 7.25% 9/1/26 (GNMA) | | | |
| (FNMA) (AMT) | 55,000 | | 55,775 |
| Loan C 7.45% 9/1/27 (GNMA) | | | |
| (FNMA) (AMT) | 60,000 | | 60,921 |
| Missouri State Housing | | | |
| Development Commission | | | |
| Multifamily Housing Revenue | | | |
| (Hyder) Series 3 5.60% 7/1/34 | | | |
| (FHA) (AMT) | 1,435,000 | | 1,462,365 |
| (San Remo) Series 5 | | | |
| 5.45% 1/1/36 (FHA) (AMT) | 500,000 | | 504,640 |
| New Mexico Mortgage Finance | | | |
| Authority Revenue | | | |
| Series B Class III 6.75% 7/1/25 | | | |
| (GNMA) (FNMA) | 195,000 | | 200,101 |
| Series E 6.95% 1/1/26 | | | |
| (GNMA) (FNMA) | 170,000 | | 172,360 |
| Orange County, Florida Housing | | | |
| Finance Authority Homeowner | | | |
| Revenue Series B 5.25% | | | |
| 3/1/33 (GNMA) (FNMA) (AMT) | 190,000 | | 190,207 |
| Oregon Health, Housing, | | | |
| Educational, & Cultural | | | |
| Facilities Authority Revenue | | | |
| (Pier Park Project) Series A | | | |
| 6.05% 4/1/18 (GNMA) (AMT) | 1,030,000 | | 1,031,658 |
20
| | Principal | | |
| | Amount | | Value |
| Municipal Bonds (continued) | | | |
| Housing Revenue Bonds (continued) | | | |
| Oregon State Housing & | | | |
| Community Services | | | |
| Department Mortgage | | | |
| Revenue Single Family | | | |
| Mortgage Program Series R | | | |
| 5.375% 7/1/32 (AMT) | $ 890,000 | | $ 894,361 |
| Santa Fe, New Mexico Single | | | |
| Family Mortgage Revenue | | | |
| Series B -1 6.20% 11/1/16 | | | |
| (GNMA) (FNMA) (AMT) | 155,000 | | 156,446 |
| St. Louis County, Missouri | | | |
| Industrial Development | | | |
| Authority Housing | | | |
| Development Revenue | | | |
| Refunding (Southfield & Oak | | | |
| Forest Apartment-A) | | | |
| 5.20% 1/20/36 (GNMA) | 1,000,000 | | 1,012,130 |
| Volusia County, Florida | | | |
| Multifamily Housing Finance | | | |
| Authority (San Marco | | | |
| Apartments) Series A 5.60% | | | |
| 1/1/44 (FSA) (AMT) | 500,000 | | 505,160 |
| | | | 25,810,636 |
| Lease Revenue Bonds – 4.02% | | | |
| California State Public Works | | | |
| Board Lease Revenue | | | |
| (Department of General | | | |
| Services - Butterfield Street) | | | |
| Series A 5.25% 6/1/30 | 2,750,000 | | 2,826,395 |
| Loudoun County, Virginia | | | |
| Industrial Development | | | |
| Authority Public Safety Facility | | | |
| Lease Revenue Series A | | | |
| 5.25% 12/15/23 (FSA) | 700,000 | | 735,301 |
| Missouri State Development | | | |
| Finance Board Infrastructure | | | |
| Facilities Revenue | | | |
| (Branson Landing Project) Series A | | | |
| 5.25% 12/1/19 | 1,435,000 | | 1,417,665 |
| 5.50% 12/1/24 | 2,480,000 | | 2,456,614 |
| 5.625% 12/1/28 | 2,930,000 | | 2,906,414 |
| (Sewer System Improvement | | | |
| Project) Series C 5.00% 3/1/25 | 605,000 | | 609,047 |
| (Triumph Foods Project) | | | |
| Series A 5.25% 3/1/25 | 500,000 | | 508,200 |
| Puerto Rico Commonwealth | | | |
| Industrial Development | | | |
| Company General Purpose | | | |
| Revenue Series B | | | |
| 5.375% 7/1/16 | 1,000,000 | | 1,020,950 |
| Puerto Rico Public | | | |
| Buildings Authority | | | |
| Revenue (Guaranteed | | | |
| Government Facilities) | | | |
| Series F 5.25% 7/1/25 | 930,000 | | 980,276 |
| Series I 5.25% 7/1/33 | 12,000,000 | | 12,244,079 |
| South Florida Water Management | | | |
| District Certificate of Participation | | |
| 5.00% 10/1/36 (AMBAC) | 1,000,000 | | 1,013,440 |
| St. Augustine, Florida Capital | | | |
| Improvement Revenue 5.00% | | | |
| 10/1/34 (AMBAC) | 1,000,000 | | 1,017,680 |
| St. Charles County, Missouri | | | |
| Public Water Supply District | | | |
| #2 Revenue Certificates of | | | |
| Participation (Missouri Project) | | | |
| Series B 5.10% 12/1/25 (MBIA) | 500,000 | | 509,535 |
| ^St. Louis, Missouri Industrial | | | |
| Development Authority | | | |
| Leasehold Revenue | | | |
| (Convention Center Hotel) | | | |
| 5.80% 7/15/20 (AMBAC) | 3,035,000 | | 1,694,380 |
| St. Louis, Missouri Junior College | | | |
| District Billing Corporation | | | |
| Leasehold Revenue | | | |
| 5.00% 3/1/23 (AMBAC) | 1,000,000 | | 1,031,850 |
| | | | 30,971,826 |
| Local General Obligation Bonds – 8.11% | | |
| Boerne, Texas Independent School | | | |
| District Building | | | |
| 5.25% 2/1/27 (PSF) | 4,000,000 | | 4,127,120 |
| 5.25% 2/1/29 (PSF) | 2,960,000 | | 3,039,772 |
| Florida Enterprise Community | | | |
| Development District Special | | | |
| Assessment 6.10% 5/1/16 (MBIA) | 695,000 | | 696,286 |
| Gwinnett County, Georgia School | | | |
| District 5.00% 2/1/11 | 8,000,000 | | 8,352,879 |
| Henderson, Nevada Local | | | |
| Improvement Districts #T-18 | | | |
| 5.30% 9/1/35 | 3,475,000 | | 3,084,897 |
| Hollywood Community, Florida | | | |
| Redevelopment Agency | | | |
| 5.625% 3/1/24 | 1,200,000 | | 1,238,496 |
| Jefferson County, Oregon | | | |
| School District #509J | | | |
| 5.00% 6/15/22 (FGIC) | 500,000 | | 512,360 |
| Lammersville, California School | | | |
| District Community Facilities | | | |
| District #2002 (Mountain | | | |
| House) 5.125% 9/1/35 | 4,125,000 | | 3,885,709 |
| Lewisville, Texas Independent | | | |
| School District | | | |
| 6.15% 8/15/21 (PSF) | 75,000 | | 78,349 |
(continues) 21
Statements of net assets
Delaware Tax-Free USA Fund
| | Principal | | |
| | Amount | | Value |
| Municipal Bonds (continued) | | | |
| Local General Obligation Bonds (continued) | | |
| Lincoln County, Oregon School | | | |
| District 5.25% 6/15/12 (FGIC) | $ 700,000 | | $ 717,661 |
| Melrose Park, Illinois Tax | | | |
| Increment Series B | | | |
| 6.00% 12/15/19 (FSA) | 1,250,000 | | 1,332,388 |
| Missouri State Development | | | |
| Finance Board Infrastructure | | | |
| Facilities Revenue (Crackerneck | | | |
| Creek Project) Series C | | | |
| 5.00% 3/1/26 | 500,000 | | 497,610 |
| New York City, New York | | | |
| Series G 5.00% 12/1/33 | 4,900,000 | | 4,951,597 |
| Series H 6.125% 8/1/25 | 315,000 | | 318,730 |
| Series I 5.125% 3/1/23 | 5,875,000 | | 6,044,964 |
| Series J 5.25% 6/1/28 | 4,950,000 | | 5,116,914 |
| North East Texas Independent | | | |
| School District Building | | | |
| Series A 5.00% 8/1/37 (PSF) | 16,000,000 | | 16,319,199 |
| Powell, Ohio 5.50% 12/1/32 (FGIC) | 2,000,000 | | 2,111,680 |
| | | | 62,426,611 |
| §Pre-Refunded Bonds – 15.81% | | | |
| Alexandria, Virginia Industrial | | | |
| Development Authority | | | |
| Revenue (Institute for Defense | | | |
| Analyses) Series A | | | |
| 5.90% 10/1/30-10 (AMBAC) | 6,000,000 | | 6,448,320 |
| California State | | | |
| 5.25% 2/1/30-12 (MBIA) | 5,000 | | 5,341 |
| Deschutes County, Oregon | | | |
| Administrative School District | | | |
| #1 Series A | | | |
| 5.125% 6/15/21-11 (FSA) | 1,000,000 | | 1,050,870 |
| Deschutes County, Oregon | | | |
| Hospital Facilities Authority | | | |
| Hospital Revenue (Cascade | | | |
| Health Services) | | | |
| 5.60% 1/1/32-12 | 1,250,000 | | 1,341,888 |
| Florida State Board of Education | | | |
| (Lottery Revenue) Series A | | | |
| 6.00% 7/1/14-10 (FGIC) | 1,000,000 | | 1,070,980 |
| Golden State, California Tobacco | | | |
| Securitization Corporation | | | |
| Settlement Revenue Series B | | | |
| 5.50% 6/1/43-13 | 8,500,000 | | 9,178,980 |
| 5.625% 6/1/38-13 | 7,500,000 | | 8,146,875 |
| Greene County, Missouri | | | |
| Reorganization School District | | | |
| R8 (Direct Deposit Project) | | | |
| 5.10% 3/1/22-12 (FSA) | 1,500,000 | | 1,567,650 |
| Highlands County, Florida Health | | | |
| Facilities Authority (Adventist | | | |
| Health System/Sunbelt) | | | |
| Series A 6.00% 11/15/31-11 | 1,500,000 | | 1,643,220 |
| Illinois Educational Facilities | | | |
| Authority Student Housing | | | |
| Revenue (Educational | | | |
| Advancement Fund-University | | | |
| Center Project) | | | |
| 6.25% 5/1/30-12 | 5,000,000 | | 5,580,300 |
| Jackson, Ohio Local School District | | | |
| (Stark & Summit Counties) | | | |
| School Facilities Construction | | | |
| & Improvement | | | |
| 5.625% 12/1/25-10 (FSA) | 1,000,000 | | 1,059,480 |
| Jackson, Oregon School District | | | |
| #6 Central Point | | | |
| 5.25% 6/15/20-10 (FGIC) | 1,175,000 | | 1,225,020 |
| Lee County, Florida Airport | | | |
| Revenue Series B | | | |
| 5.75% 10/1/33-10 (FSA) | 3,000,000 | | 3,203,880 |
| Lewisville, Texas Independent | | | |
| School District | | | |
| 6.15% 8/15/21-09 (PSF) | 2,085,000 | | 2,182,682 |
| Liberty, Missouri Sewer System | | | |
| Revenue 6.15% 2/1/15-09 | | | |
| (MBIA) | 1,500,000 | | 1,550,880 |
| Linn County, Oregon Community | | | |
| School District #9 Lebanon | | | |
| 5.60% 6/15/30-13 (FGIC) | 2,000,000 | | 2,189,180 |
| Louisiana Public Facilities | | | |
| Authority Revenue (Ochsner | | | |
| Clinic Foundation Project) | | | |
| Series B 5.50% 5/15/32-26 | 1,500,000 | | 1,677,075 |
| Maryland State Economic | | | |
| Development Corporation, | | | |
| Student Housing Revenue | | | |
| (University of Maryland | | | |
| College Park Project) | | | |
| 5.625% 6/1/35-13 | 1,125,000 | | 1,232,213 |
| Miami-Dade County, Florida | | | |
| Educational Facilities Authority | | | |
| Revenue (University of Miami) | | | |
| 5.00% 4/1/34-14 (AMBAC) | 7,000,000 | | 7,466,060 |
| Series A 5.75% 4/1/29-10 | | | |
| (AMBAC) | 2,000,000 | | 2,119,520 |
| Milledgeville-Baldwin County, | | | |
| Georgia Development | | | |
| Authority Revenue (Georgia | | | |
| College & State University | | | |
| Foundation Student Housing | | | |
| Project) 6.00% 9/1/33-14 | 1,000,000 | | 1,138,820 |
| Mississippi Development Bank | | | |
| Special Obligation (Madison | | | |
| County Hospital Project) | | | |
| 6.30% 7/1/22-09 | 2,070,000 | | 2,201,031 |
| New Jersey State Educational | | | |
| Facilities Authority Revenue | | | |
| (Stevens Institute of Technology) | | | |
| Series B 5.25% 7/1/24-14 | 2,085,000 | | 2,242,605 |
22
| | Principal | | |
| | Amount | | Value |
| Municipal Bonds (continued) | | | |
| §Pre-Refunded Bonds (continued) | | | |
| New York City, New York Series J | | | |
| 5.25% 6/1/28-13 | $ 450,000 | | $ 485,199 |
| Orange County, Florida Health | | | |
| Facilities Authority Revenue | | | |
| (Adventist Health System) | | | |
| 5.625% 11/15/32-12 | 1,000,000 | | 1,091,890 |
| Orlando, Florida Utilities | | | |
| Commission Water & Electric | | | |
| Revenue 5.25% 10/1/20-11 | 1,575,000 | | 1,681,785 |
| Osceola County, Florida School | | | |
| Board Certificates of | | | |
| Participation Series A 5.25% | | | |
| 6/1/27-12 (AMBAC) | 4,000,000 | | 4,298,480 |
| Payne County, Oklahoma | | | |
| Economic Development | | | |
| Authority Student Housing | | | |
| Revenue (Collegiate Housing | | | |
| Foundation - Oklahoma State | | | |
| University) Series A | | | |
| 6.375% 6/1/30-11 | 4,000,000 | | 4,366,480 |
| Puerto Rico Commonwealth | | | |
| Highway & Transportation | | | |
| Authority Revenue | | | |
| Series D 5.25% 7/1/38-12 | 3,000,000 | | 3,203,250 |
| Series G 5.00% 7/1/42-13 | 525,000 | | 557,519 |
| Series K 5.00% 7/1/35-15 | 3,500,000 | | 3,756,305 |
| Puerto Rico Commonwealth | | | |
| Public Improvement | | | |
| 5.125% 7/1/30-11 (FSA) | 920,000 | | 968,594 |
| Series A 5.125% 7/1/31-11 | 3,495,000 | | 3,679,606 |
| Puerto Rico Electric Power | | | |
| Authority Revenue | | | |
| Series II 5.25% 7/1/31-12 | 6,000,000 | | 6,476,100 |
| Series NN 5.125% 7/1/29-13 | 1,400,000 | | 1,500,324 |
| Richmond, Virginia Public | | | |
| Utilities Revenue 5.00% | | | |
| 1/15/27-12 (FSA) | 10,000,000 | | 10,521,999 |
| South Broward, Florida Hospital | | | |
| District Revenue (Memorial | | | |
| Health Care System) | | | |
| 5.625% 5/1/32-12 | 3,000,000 | | 3,268,530 |
| South Miami, Florida Health | | | |
| Facilities Authority Hospital | | | |
| Revenue (Baptist Health South | | | |
| Florida Group) | | | |
| 5.25% 11/15/33-13 | 4,000,000 | | 4,272,320 |
| St. Louis, Missouri Airport | | | |
| Revenue (Capital Improvement | | | |
| Project) Series A | | | |
| 5.375% 7/1/21-12 (MBIA) | 1,635,000 | | 1,756,971 |
| Tampa, Florida Utilities Tax | | | |
| Revenue Series A | | | |
| 6.00% 10/1/17-09 (AMBAC) | 1,000,000 | | 1,055,450 |
| 6.125% 10/1/18-09 (AMBAC) | 1,000,000 | | 1,057,940 |
| Vancouver, Washington Limited Tax | | | |
| 5.50% 12/1/25-10 (AMBAC) | 1,250,000 | | 1,318,038 |
| Wisconsin Housing & Economic | | | |
| Developing Authority Revenue | | | |
| 6.10% 6/1/21-17 (FHA) | 765,000 | | 833,383 |
| | | | 121,673,033 |
| Special Tax Bonds – 5.68% | | | |
| Bi-State Development Agency | | | |
| Missouri - Illinois Metropolitan | | | |
| District (Metrolink Cross | | | |
| County Project) Series B | | | |
| 5.00% 10/1/32 (FSA) | 2,000,000 | | 2,027,120 |
| Jackson County, Missouri | | | |
| Special Obligation | | | |
| 5.00% 12/1/27 (MBIA) | 1,000,000 | | 1,017,930 |
| Jacksonville, Florida Excise Taxes | | | |
| Revenue Series B | | | |
| 5.00% 10/1/26 (AMBAC) | 1,000,000 | | 1,016,780 |
| 5.125% 10/1/32 (FGIC) | 1,000,000 | | 1,016,270 |
| Middlesex County, New Jersey | | | |
| Improvement Authority Senior | | | |
| Revenue (Heldrich Center | | | |
| Hotel/Conference Project) | | | |
| Series A | | | |
| 5.00% 1/1/32 | 1,500,000 | | 1,402,800 |
| 5.125% 1/1/37 | 1,500,000 | | 1,415,310 |
| New Jersey Economic Development | | | |
| Authority (Cigarette Tax) | | | |
| 5.50% 6/15/31 | 1,000,000 | | 1,018,890 |
| 5.75% 6/15/34 | 2,000,000 | | 2,080,040 |
| New York City, New York | | | |
| Transitional Finance Authority | | | |
| Series D 5.00% 2/1/31 | 5,000,000 | | 5,093,550 |
| New York State Sales Tax Asset | | | |
| Receivables Series A | | | |
| 5.25% 10/15/27 (AMBAC) | 1,000,000 | | 1,050,500 |
| Palm Beach County, Florida | | | |
| Criminal Justice Facilities | | | |
| Revenue 5.75% 6/1/12 (FGIC) | 10,000,000 | | 10,851,700 |
| Puerto Rico Sales Tax Financing | | | |
| Corporation Series A | | | |
| 5.25% 8/1/57 | 7,000,000 | | 7,170,940 |
| Puerto Rico Convention Center | | | |
| District Authority Revenue | | | |
| (Hotel Occupancy Tax) | | | |
| 5.00% 7/1/31 (AMBAC) | 6,250,000 | | 6,436,250 |
| Tampa, Florida Sports Authority | | | |
| Revenue Sales Tax | | | |
| (Tampa Bay Arena Project) | | | |
| 5.75% 10/1/20 (MBIA) | 1,000,000 | | 1,132,840 |
| Truth or Consequences, New | | | |
| Mexico Gross Receipts Tax | | | |
| Revenue 6.30% 7/1/16 | 1,000,000 | | 1,001,610 |
| | | | 43,732,530 |
(continues) 23
Statements of net assets
Delaware Tax-Free USA Fund
| | Principal | | |
| | Amount | | Value |
| Municipal Bonds (continued) | | | |
| State General Obligation Bonds – 13.41% | | |
| California State | | | |
| 4.50% 8/1/30 | $ 5,825,000 | | $ 5,350,437 |
| 5.00% 2/1/26 (AMBAC) | 5,570,000 | | 5,662,351 |
| 5.00% 2/1/33 | 6,350,000 | | 6,373,940 |
| 5.25% 2/1/30 (MBIA) | 3,490,000 | | 3,609,463 |
| Georgia State Series E | | | |
| 5.00% 8/1/12 | 7,425,000 | | 7,876,663 |
| Illinois State Series A | | | |
| 5.00% 3/1/34 | 5,000,000 | | 5,081,800 |
| Maryland State & Local Facilities | | | |
| Land Capital Improvement | | | |
| First Series 5.00% 8/1/11 | 5,000,000 | | 5,257,550 |
| Second Series 5.00% 8/1/14 | 3,500,000 | | 3,762,710 |
| Second Series 5.00% 8/1/16 | 4,000,000 | | 4,326,400 |
| Series A 5.00% 3/1/12 | 8,000,000 | | 8,456,400 |
| Minnesota State 5.00% 6/1/14 | 7,500,000 | | 8,029,575 |
| Pennsylvania State First Series | | | |
| 5.00% 7/1/11 | 5,955,000 | | 6,240,959 |
| 5.00% 7/1/13 | 3,000,000 | | 3,193,890 |
| 5.25% 2/1/14 (MBIA) | 6,455,000 | | 6,976,822 |
| Puerto Rico Commonwealth | | | |
| Public Improvement | | | |
| 5.125% 7/1/30 (FSA) | 965,000 | | 985,892 |
| 5.25% 7/1/27 (FSA) | 705,000 | | 732,432 |
| Series A 5.125% 7/1/31 | 7,880,000 | | 7,933,899 |
| Series A 5.25% 7/1/23 | 500,000 | | 517,210 |
| Series A 5.50% 7/1/19 (MBIA) | 11,500,000 | | 12,836,644 |
| | | | 103,205,037 |
| Transportation Revenue Bonds – 3.77% | | | |
| Branson, Missouri Regional | | | |
| Airport Transportation | | | |
| Development District Revenue | | | |
| (Branson Airport Project) | | | |
| Series B 6.00% 7/1/37 (AMT) | 1,500,000 | | 1,417,560 |
| Capital Trust Agency Florida | | | |
| Revenue | | | |
| (Fort Lauderdale/Cargo | | | |
| Acquisition Project) | | | |
| 5.75% 1/1/32 (AMT) | 3,750,000 | | 3,773,475 |
| (Orlando/Cargo Acquisition | | | |
| Project) 6.75% 1/1/32 (AMT) | 2,395,000 | | 2,513,074 |
| Dallas-Fort Worth, Texas | | | |
| International Airport Revenue | | | |
| Series A 5.50% 11/1/31 | | | |
| (FGIC) (AMT) | 1,500,000 | | 1,534,065 |
| Grapevine, Texas Industrial | | | |
| Development Corporate | | | |
| Revenue (Air Cargo) | | | |
| 6.50% 1/1/24 (AMT) | 920,000 | | 959,137 |
| Houston, Texas Industrial | | | |
| Development Corporate | | | |
| Revenue (Air Cargo) | | | |
| 6.375% 1/1/23 (AMT) | 2,000,000 | | 2,073,680 |
| Metropolitan, New York | | | |
| Transportation Authority | | | |
| Revenue Refunding Series A | | | |
| 5.00% 11/15/30 (FSA) | 3,000,000 | | 3,040,920 |
| Miami-Dade County, Florida | | | |
| Aviation Revenue | | | |
| (Miami International Airport) | | | |
| Series B 5.00% 10/1/37 (FGIC) | 1,000,000 | | 1,013,950 |
| Series A 5.00% 10/1/33 | | | |
| (FSA) (AMT) | 500,000 | | 497,095 |
| Miami-Dade County, Florida | | | |
| Expressway Authority Toll | | | |
| Systems Revenue | | | |
| 5.00% 7/1/37 (AMBAC) | 1,000,000 | | 1,020,330 |
| Orlando & Orange County, Florida | | | |
| Expressway Authority Revenue | | | |
| Series A 5.00% 7/1/32 (FSA) | 1,380,000 | | 1,411,119 |
| Pennsylvania State Turnpike | | | |
| Commission Revenue Series A | | | |
| 5.00% 12/1/34 (AMBAC) | 500,000 | | 509,090 |
| Puerto Rico Commonwealth | | | |
| Highway & Transportation | | | |
| Authority Revenue | | | |
| Series G 5.00% 7/1/42 | 275,000 | | 270,303 |
| Series N 5.25% 7/1/39 (FGIC) | 1,250,000 | | 1,363,950 |
| South Carolina Transportation | | | |
| Infrastructure Revenue Series A | | | |
| 5.00% 10/1/33 (AMBAC) | 7,500,000 | | 7,593,824 |
| | | | 28,991,572 |
| Water & Sewer Revenue Bonds – 4.07% | | | |
| Augusta, Georgia Water & Sewer | | | |
| Revenue 5.25% 10/1/34 (FSA) | 4,375,000 | | 4,554,462 |
| Clovis, California Public Financing | | | |
| Authority Wastewater Revenue | | | |
| 5.25% 8/1/30 (MBIA) | 1,000,000 | | 1,048,430 |
| Florida Village Center Community | | | |
| Development District Utility | | | |
| Revenue 5.00% 10/1/36 (MBIA) | 500,000 | | 506,075 |
| Fulton County, Georgia Water & | | | |
| Sewer Revenue | | | |
| 5.25% 1/1/35 (FGIC) | 1,000,000 | | 1,036,690 |
| Metropolitan St. Louis, Missouri | | | |
| Sewer District Wastewater | | | |
| Revenue Series A | | | |
| 5.00% 5/1/34 (MBIA) | 1,250,000 | | 1,277,988 |
| Missouri State Environmental | | | |
| Improvement & Energy | | | |
| Resource Authority Water | | | |
| Pollution Control Revenue | | | |
| Unrefunded Balance (State | | | |
| Revolving Fund Project) | | | |
| Series A 6.05% 7/1/16 (FSA) | 1,060,000 | | 1,061,929 |
24
| | Principal | | |
| | Amount | | Value |
| Municipal Bonds (continued) | | | | |
| Water & Sewer Revenue Bonds (continued) | | | |
| New York City, New York | | | | |
| Municipal Water Finance | | | | |
| Authority Water & Sewer | | | | |
| System Revenue Series A | | | | |
| 5.125% 6/15/34 | $12,125,000 | | $ 12,345,432 | |
| 5.25% 6/15/34 | 3,705,000 | | 3,788,659 | |
| Tampa, Florida Water & | | | | |
| Sewer Revenue | | | | |
| 4.625% 10/1/36 (MBIA) | 1,000,000 | | 955,330 | |
| 6.00% 10/1/16 (FSA) | 1,000,000 | | 1,145,290 | |
| Virgin Islands Water & Power | | | | |
| Authority Water System | | | | |
| Revenue 5.50% 7/1/17 | 510,000 | | 518,033 | |
| West Virginia State Water | | | | |
| Development Authority | | | | |
| Revenue (Loan Program III) | | | | |
| Series A 6.375% 7/1/39 | | | | |
| (AMBAC) (AMT) | 2,890,000 | | 3,077,359 | |
| | | | 31,315,677 | |
| Total Municipal Bonds | | | | |
| (cost $742,414,382) | | | 757,169,118 | |
| | |
| ·Variable Rate Demand Notes – 0.58% | | | | |
| Allegheny County, Pennsylvania | | | | |
| Hospital Development | | | | |
| Authority Revenue (Pittsburg | | | | |
| Children’s Hospital) Series A | | | | |
| 3.97% 6/1/35 | 100,000 | | 100,000 | |
| Allegheny County, Pennsylvania | | | | |
| Industrial Development | | | | |
| Authority Revenue (Oakland | | | | |
| Catholic High School Project) | | | | |
| 3.97% 6/1/38 | 3,065,000 | | 3,065,000 | |
| Maryland State Health & Higher | | | | |
| Educational Facilities Authority | | | | |
| Revenue (Archdiocese | | | | |
| Baltimore Schools) | | | | |
| 3.92% 7/1/37 | 800,000 | | 800,000 | |
| University of Pittsburgh of the | | | | |
| Commonwealth System of | | | | |
| Higher Education (University | | | | |
| Capital Project) Series A | | | | |
| 3.90% 9/15/09 | 500,000 | | 500,000 | |
| Total Variable Rate Demand Notes | | | | |
| (cost $4,465,000) | | | 4,465,000 | |
| | |
| Total Value of Securities – 98.95% | | | | |
| (cost $746,879,382) | | | 761,634,118 | |
| Receivables and Other Assets | | | | |
| Net of Liabilities – 1.05% | | | 8,107,186 | |
| Net Assets Applicable to 68,529,944 | | | | |
| Shares Outstanding – 100.00% | | | $769,741,304 | |
| | | | | |
| Net Asset Value – Delaware Tax-Free USA Fund | | | | |
| Class A ($735,584,359 / 65,488,758 Shares) | | | | $11.23 | |
| Net Asset Value – Delaware Tax-Free USA Fund | | | | |
| Class B ($17,285,845 / 1,539,411 Shares) | | | | $11.23 | |
| Net Asset Value – Delaware Tax-Free USA Fund | | | | |
| Class C ($16,871,100 / 1,501,775 Shares) | | | | $11.23 | |
| | |
| Components of Net Assets at August 31, 2007: | | | | |
| Shares of beneficial interest | | | | |
| (unlimited authorization – no par) | | | $760,744,467 | |
| Undistributed net investment income | | | 1,790 | |
| Accumulated net realized loss on investments | | | (5,759,689 | ) |
| Net unrealized appreciation of investments | | | 14,754,736 | |
| Total net assets | | | $769,741,304 | |
| § | Pre-Refunded Bonds. Municipals that are generally backed or secured by U.S. Treasury bonds. For Pre-Refunded Bonds, the stated maturity is followed by the year in which the bond is pre-refunded. See Note 10 in “Notes to Financial Statements.” |
| | |
| · | Variable rate security. The rate shown is the rate as of August 31, 2007. |
| | |
| ^ | Zero coupon security. The rate shown is the yield at the time of purchase. |
| | |
| ¶ | Step coupon bond. Indicates security that has a zero coupon that remains in effect until a predetermined date at which time the stated interest rate becomes effective. |
Summary of Abbreviations:
AMBAC — Insured by the AMBAC Assurance Corporation
AMT — Subject to Alternative Minimum Tax
FGIC — Insured by the Financial Guaranty Insurance Company
FHA — Insured by the Federal Housing Administration
FNMA — Insured by Federal National Mortgage Association
FSA — Insured by Financial Security Assurance
GNMA — Insured by Government National Mortgage Association
HUD — Housing and Urban Development
LOC — Letter of Credit
MBIA — Insured by the Municipal Bond Insurance Association
PSF — Insured by the Permanent School Fund
RADIAN — Insured by Radian Asset Assurance
VHA — Veterans Health Administration
XLCA — Insured by XL Capital Assurance
| Net Asset Value and Offering Price Per Share – | |
| Delaware Tax-Free USA Fund | |
| Net asset value Class A (A) | $11.23 |
| Sales charge (4.50% of offering price) (B) | 0.53 |
| Offering price | $11.76 |
| (A) | | Net asset value per share, as illustrated, is the amount which would be paid upon redemption or repurchase of shares. |
| |
| (B) | | See the current prospectus for purchases of $100,000 or more. |
See accompanying notes
(continues) 25
Statements of net assets
Delaware Tax-Free USA Intermediate Fund
August 31, 2007
| | Principal | | |
| | Amount | | Value |
| Municipal Bonds – 93.34% | | | |
| Corporate Revenue Bonds – 5.05% | | | |
| Alliance Airport Authority, Texas | | | |
| Special Facilities Revenue | | | |
| (Federal Express Corp. project) | | | |
| 4.85% 4/1/21 (AMT) | $2,000,000 | | $1,918,220 |
| Brazos, Texas River Authority | | | |
| Pollution Control Revenue | | | |
| (Texas Utilities) | | | |
| 5.40% 5/1/29 (AMT) | 1,000,000 | | 949,160 |
| Connecticut State Development | | | |
| Authority Pollution Control | | | |
| Revenue (Connecticut Light & | | | |
| Power) Series A | 1,300,000 | | 1,290,965 |
| ·3.35% 5/1/31 (AMBAC) (AMT) | | | |
| 5.85% 9/1/28 | 1,145,000 | | 1,178,571 |
| ·Farmington, New Mexico Pollution | | | |
| Control Revenue (El Paso | | | |
| Electric Co. Project) Series A | | | |
| 4.00% 6/1/32 (FGIC) | 1,000,000 | | 998,780 |
| ·Forsyth, Montana Pollution Control | | | |
| Revenue (Portland General | | | |
| Project) Series A 5.20% 5/1/33 | 1,005,000 | | 1,019,824 |
| ¶Golden State, California Tobacco | | | |
| Securitization Corporation | | | |
| Settlement Revenue Refunding | | | |
| Asset-Backed Senior | | | |
| Convertible Series A-2 | | | |
| 5.30% 6/1/37 | 1,500,000 | | 986,880 |
| Indianapolis, Indiana Airport | | | |
| Authority Revenue Special | | | |
| Facilities (Federal Express Corp. | | | |
| Project) 5.10% 1/15/17 (AMT) | 750,000 | | 751,560 |
| Memphis-Shelby County, | | | |
| Tennessee Airport Authority | | | |
| Special Facilities Revenue | | | |
| (Federal Express Corp. Project) | | | |
| 5.05% 9/1/12 | 1,000,000 | | 1,032,740 |
| Michigan State Strategic Funding | | | |
| Limited Obligation Revenue | | | |
| (Detroit Edison Co. Project) | | | |
| Series A 5.50% 6/1/30 | | | |
| (XLCA) (AMT) | 1,000,000 | | 1,035,690 |
| Ohio State Air Quality | | | |
| Development Authority | | | |
| Revenue Environmental | | | |
| Improvement (USX Project) | | | |
| 5.00% 11/1/15 | 1,000,000 | | 1,023,910 |
| Prattville, Alabama Industrial | | | |
| Development Board | | | |
| Environmental Improvement | | | |
| Revenue (International Paper | | | |
| Co. Project) Series A | | | |
| 6.70% 3/1/24 (AMT) | 1,000,000 | | 1,043,660 |
| ·Sabine, Texas River Authority | | | |
| Pollution Control Revenue (TXU | | | |
| Electric Co. Project) Series A | | | |
| 5.50% 5/1/22 | 1,000,000 | | 993,430 |
| South Carolina Jobs Economic | | | |
| Development Authority | | | |
| Industrial Revenue (South | | | |
| Carolina Electric & Gas Co. | | | |
| Project) Series B 5.45% 11/1/32 | | | |
| (AMBAC) (AMT) | 500,000 | | 512,545 |
| Sugar Creek, Missouri Industrial | | | |
| Development Revenue (Lafarge | | | |
| North America Project) Series A | | | |
| 5.65% 6/1/37 (AMT) | 500,000 | | 500,870 |
| Tobacco Settlement Financing | | | |
| Corporation, Virginia Senior | | | |
| Series B-1 5.00% 6/1/47 | 1,375,000 | | 1,190,585 |
| Toledo, Lucas County, Ohio Port | | | |
| Authority Development Revenue | | | |
| (Northwest Ohio Bond Fund | | | |
| - Alex Products Inc.) Series B | | | |
| 6.125% 11/15/09 (AMT) | 540,000 | | 551,065 |
| | | | 16,978,455 |
| Education Revenue Bonds – 8.03% | | | |
| California Municipal Finance | | | |
| Authority Educational Revenue | | | |
| (American Heritage Education | | | |
| Foundation Project) Series A | | | |
| 5.25% 6/1/26 | 1,000,000 | | 965,790 |
| Chattanooga, Tennessee Health | | | |
| Educational & Housing Facilities | | | |
| Board Revenue (CDFI Phase I, | | | |
| LLC Project) Series B | | | |
| 5.50% 10/1/20 | 1,220,000 | | 1,192,709 |
| Fulton County, Georgia | | | |
| Development Authority | | | |
| Revenue (Molecular Science | | | |
| Building Project) | | | |
| 5.25% 5/1/21 (MBIA) | 1,000,000 | | 1,059,550 |
| Grand Traverse, Michigan Public | | | |
| School Academy Revenue | | | |
| 5.00% 11/1/36 | 900,000 | | 809,100 |
| Illinois Finance Authority Revenue | | | |
| (Illinois Institute of Technology) | | | |
| Series A 5.00% 4/1/36 | 825,000 | | 779,468 |
| Illinois Finance Authority Student | | | |
| Housing Revenue Series B | | | |
| 5.00% 5/1/30 | 3,250,000 | | 2,979,665 |
| Massachusetts State Health & | | | |
| Educational Facilities Authority | | | |
| Revenue | | | |
| (Berklee College of Music Project) | | | |
| Series E 5.10% 10/1/27 (MBIA) | 6,000,000 | | 6,125,820 |
| (Nichols College Project) | | | |
| Series C 6.125% 10/1/29 | 1,000,000 | | 1,037,860 |
| Michigan Higher Education | | | |
| Facilities Authority Revenue | | | |
| (Kalamazoo College Project) | | | |
| 5.50% 12/1/19 | 500,000 | | 523,705 |
26
| | Principal | | |
| | Amount | | Value |
| Municipal Bonds (continued) | | | |
| Education Revenue Bonds (continued) | | | |
| New York State Dormitory | | | |
| Authority Revenue | | | |
| (Brooklyn Law School) Series A | | | |
| 5.50% 7/1/18 (RADIAN) | $1,000,000 | | $ 1,036,720 |
| (Long Island University) Series B | | | |
| 5.50% 9/1/20 (RADIAN) | 1,000,000 | | 1,033,490 |
| Ohio State Higher Educational | | | |
| Facility Revenue | | | |
| (John Carroll University) | | | |
| 5.50% 11/15/18 | 335,000 | | 351,830 |
| ·(Kenyon College Project) | | | |
| 4.70% 7/1/37 | 1,000,000 | | 1,026,150 |
| Ohio State University General | | | |
| Receipts Revenue Series B | | | |
| 5.25% 6/1/21 | 1,000,000 | | 1,053,080 |
| Pennsylvania State Higher | | | |
| Educational Facilities Authority | | | |
| College & University Revenue | | | |
| (Geneva College Project) | | | |
| 6.125% 4/1/22 | 1,000,000 | | 1,042,820 |
| San Leanna, Texas Higher | | | |
| Educational Facilities Revenue | | | |
| (Saint Edwards University | | | |
| Project) 5.125% 6/1/36 | 1,100,000 | | 1,045,990 |
| Tulsa, Oklahoma Industrial | | | |
| Authority Student Housing | | | |
| Revenue (University of Tulsa) | | | |
| 5.00% 10/1/37 | 1,000,000 | | 975,640 |
| University of California Revenue | | | |
| Series A 5.125% 5/15/20 | | | |
| (AMBAC) | 250,000 | | 263,228 |
| University of Oklahoma Research | | | |
| Facilities Revenue | | | |
| 5.00% 3/1/23 (AMBAC) | 1,065,000 | | 1,092,775 |
| University of Virginia General | | | |
| Revenue Series B | | | |
| 5.00% 6/1/20 | 1,250,000 | | 1,304,300 |
| 5.00% 6/1/21 | 1,250,000 | | 1,298,200 |
| | | | 26,997,890 |
| Electric Revenue Bonds – 2.73% | | | |
| Metropolitan Government | | | |
| Nashville & Davidson County, | | | |
| Tennessee Electric Revenue | | | |
| Series B 5.50% 5/15/14 | 1,000,000 | | 1,094,660 |
| Oliver County North Dakota | | | |
| Pollution Control Revenue | | | |
| (Square Butte Electric Coop) | | | |
| Series A 5.30% 1/1/27 (AMBAC) | 1,500,000 | | 1,546,680 |
| Orlando, Florida Utilities | | | |
| Commission Water & Electric | | | |
| Revenue 5.25% 10/1/20 | 555,000 | | 586,091 |
| Philadelphia, Pennsylvania Gas | | | |
| Works Revenue First Series A | | | |
| 5.375% 7/1/15 (FSA) | 2,000,000 | | 2,024,180 |
| Rochester, Minnesota Electric | | | |
| Utilities Revenue Series C | | | |
| �� 5.00% 12/1/18 (MBIA) | 2,000,000 | | 2,127,140 |
| South Carolina State Public Service | | | |
| Authority Revenue Refunding | | | |
| Series A 5.125% 1/1/21 (FSA) | 1,000,000 | | 1,040,690 |
| Texas Municipal Power Agency | | | |
| Revenue 4.00% 9/1/11 (AMBAC) | 750,000 | | 750,120 |
| | | | 9,169,561 |
| Escrowed to Maturity Bonds – 0.06% | | | |
| Southcentral, Pennsylvania General | | | |
| Authority Revenue (Wellspan | | | |
| Health Obligated Project) | | | |
| 5.625% 5/15/26 | 180,000 | | 190,757 |
| | | | 190,757 |
| Health Care Revenue Bonds – 11.35% | | | |
| Chatham County, Georgia Hospital | | | |
| Authority Revenue (Memorial | | | |
| Health Medical Center) Series A | | | |
| 6.125% 1/1/24 | 1,000,000 | | 1,036,410 |
| Cleveland-Cuyahoga County, | | | |
| Ohio Port Authority Revenue | | | |
| (Saint Clarence - Geac) Series A | | | |
| 6.125% 5/1/26 | 715,000 | | 719,583 |
| Cumberland County, Pennsylvania | | | |
| Municipal Authority Revenue | | | |
| (Diakon Lutheran Ministries | | | |
| Project) 5.00% 1/1/36 | 1,070,000 | | 989,953 |
| Cuyahoga County, Ohio Revenue | | | |
| (Cleveland Clinic Health System) | | | |
| Series A 6.00% 1/1/21 | 1,000,000 | | 1,094,100 |
| Duluth, Minnesota Economic | | | |
| Development Authority | | | |
| Health Care Facilities Revenue | | | |
| (Benedictine Health System - | | | |
| St. Mary’s Hospital) | | | |
| 5.25% 2/15/28 | 1,000,000 | | 1,006,500 |
| 5.50% 2/15/23 | 1,000,000 | | 1,029,490 |
| Florence County, South Carolina | | | |
| Hospital Revenue (McLeod | | | |
| Regional Medical Center Project) | | | |
| Series A 5.25% 11/1/27 (FSA) | 1,000,000 | | 1,029,700 |
| Georgia Medical Center Hospital | | | |
| Authority Revenue (Spring | | | |
| Harbor Green Island Project) | | | |
| 5.25% 7/1/37 | 2,300,000 | | 2,061,582 |
| ·Highlands County, Florida Health | | | |
| Facilities Authority Revenue | | | |
| (Adventist Health System) | | | |
| Series I 5.00% 11/15/29 | 2,000,000 | | 2,033,700 |
| Indiana Health Facility Financing | | | |
| Authority Hospital Revenue | | | |
| (Deaconess Hospital Obligation) | | | |
| Series A 5.375% 3/1/29 | | | |
| (AMBAC) | 700,000 | | 726,005 |
(continues) 27
Statements of net assets
Delaware Tax-Free USA Intermediate Fund
| | Principal | | |
| | Amount | | Value |
| Municipal Bonds (continued) | | | |
| Health Care Revenue Bonds (continued) | | | |
| Maple Grove, Minnesota Health | | | |
| Care Facilities Revenue (North | | | |
| Memorial Health Care) | | | |
| 5.00% 9/1/29 | $2,000,000 | | $1,949,220 |
| Maple Grove, Minnesota Health | | | |
| Care System Revenue (Maple | | | |
| Grove Hospital Corp.) | | | |
| 5.25% 5/1/37 | 2,015,000 | | 2,022,435 |
| Maryland State Health & Higher | | | |
| Education Facilities Authority | | | |
| Revenue (Union Hospital of | | | |
| Cecil County) 5.625% 7/1/32 | 500,000 | | 509,580 |
| Michigan State Hospital Finance | | | |
| Authority Revenue | | | |
| (Henry Ford Health System) | | | |
| Series A 5.25% 11/15/46 | 3,500,000 | | 3,469,794 |
| (Oakwood Obligation Group) | | | |
| 5.50% 11/1/14 | 2,230,000 | | 2,362,061 |
| (Trinity Health Credit) Series C | | | |
| 5.375% 12/1/23 | 500,000 | | 517,735 |
| Minneapolis, Minnesota Health | | | |
| Care System Revenue (Allina | | | |
| Health Systems) Series A | | | |
| 5.75% 11/15/32 | 500,000 | | 515,225 |
| Multnomah County, Oregon | | | |
| Hospital Facilities Authority | | | |
| Revenue (Providence Health | | | |
| System) 5.25% 10/1/22 | 1,000,000 | | 1,036,730 |
| New Hampshire Health & | | | |
| Education Facilities Authority | | | |
| Revenue (Elliot Hospital) | | | |
| Series B 5.60% 10/1/22 | 1,000,000 | | 1,033,740 |
| New Jersey Health Care Facilities | | | |
| Financing Authority Revenue | | | |
| (Trinitas Hospital Obligation | | | |
| Group) Series A 5.25% 7/1/30 | 675,000 | | 649,337 |
| North Carolina Medical Care | | | |
| Commission Health Care | | | |
| Facilities Revenue | | | |
| (First Mortgage - Presbyterian | | | |
| Homes) 5.40% 10/1/27 | 950,000 | | 926,649 |
| (Pennybryn at Mayfield Project) | | | |
| Series A 6.125% 10/1/35 | 1,700,000 | | 1,707,412 |
| Shelby County, Tennessee Health | | | |
| Educational & Housing Facilities | | | |
| Board Revenue (Trezevant | | | |
| Manor Project) Series A | | | |
| 5.75% 9/1/37 | 1,000,000 | | 962,180 |
| South Carolina Jobs-Economic | | | |
| Development Authority | | | |
| Revenue (Bon Secours Health | | | |
| System Inc.) Series A | | | |
| 5.625% 11/15/30 | 1,700,000 | | 1,728,951 |
| St. Mary Hospital Authority | | | |
| Pennsylvania Health System | | | |
| Revenue (Catholic Health East) | | | |
| Series A 5.25% 11/15/16 | 1,200,000 | | 1,251,624 |
| St. Paul, Minnesota Housing & | | | |
| Redevelopment Authority | | | |
| Health Care Facilities Revenue | | | |
| (Healthpartners Obligation | | | |
| Group Project) 5.25% 5/15/36 | 1,000,000 | | 959,160 |
| St. Paul, Minnesota Housing & | | | |
| Redevelopment Authority | | | |
| Hospital Revenue (Health East | | | |
| Project) 6.00% 11/15/25 | 1,000,000 | | 1,036,240 |
| Suffolk, Virginia Industrial | | | |
| Development Authority | | | |
| Retirement Facilities Revenue | | | |
| (First Management - Lake | | | |
| Prince) 5.15% 9/1/24 | 725,000 | | 673,380 |
| Terrebonne Parish, Louisiana | | | |
| Hospital Service District #1 | | | |
| Hospital Revenue (Terrebonne | | | |
| General Medical Center Project) | | | |
| 5.50% 4/1/33 (AMBAC) | 1,500,000 | | 1,562,730 |
| Virginia Small Business Financing | | | |
| Authority Hospital Revenue | | | |
| (Wellmont Health System | | | |
| Project) Series A 5.25% 9/1/37 | 1,625,000 | | 1,566,793 |
| | | | 38,167,999 |
| Housing Revenue Bonds – 0.27% | | | |
| Maryland State Community | | | |
| Development Administration | | | |
| Department Housing & | | | |
| Community Development | | | |
| Residential Series A | | | |
| 4.70% 9/1/37 (AMT) | 1,000,000 | | 912,880 |
| | | | 912,880 |
| Lease Revenue Bonds – 4.70% | | | |
| California State Public Works Board | | | |
| Lease Revenue (Department of | | | |
| General Services - Butterfield | | | |
| Street) Series A 5.25% 6/1/25 | 1,000,000 | | 1,035,630 |
| Golden State, California Tobacco | | | |
| Securitization Corporation | | | |
| Settlement Revenue Refunding | | | |
| Asset-Backed Series A | | | |
| 5.00% 6/1/18 | 2,000,000 | | 2,007,380 |
| 5.00% 6/1/21 (AMBAC) | 1,000,000 | | 1,022,030 |
| Louisiana Public Facilities Authority | | | |
| Revenue (19th Judicial District | | | |
| Court) 5.375% 6/1/32 (FGIC) | 1,000,000 | | 1,055,040 |
| Michigan State Building Authority | | | |
| Revenue Series I | | | |
| 5.00% 10/15/09 (FSA) | 1,000,000 | | 1,026,710 |
| 5.00% 10/15/24 | 3,000,000 | | 3,046,680 |
| 5.50% 10/15/18 | 2,175,000 | | 2,301,563 |
28
| | Principal | | |
| | Amount | | Value |
| Municipal Bonds (continued) | | | |
| Lease Revenue Bonds (continued) | | | |
| Missouri State Development | | | |
| Finance Board Infrastructure | | | |
| Facilities Revenue (Crackerneck | | | |
| Creek Project) series C | | | |
| 5.00% 3/1/28 | $1,600,000 | | $ 1,579,808 |
| New York State Municipal Bond | | | |
| Bank Agency Special School | | | |
| Purpose Revenue Series C | | | |
| 5.25% 6/1/22 | 1,000,000 | | 1,040,590 |
| ·Puerto Rico Public Buildings | | | |
| Authority Revenue (Guaranteed | | | |
| Government Facilities) Series J | | | |
| 5.00% 7/1/30 | 1,000,000 | | 1,034,830 |
| ·Puerto Rico Public Finance | | | |
| Corporate Revenue Series A | | | |
| 5.25% 8/1/29 (MBIA) | 620,000 | | 655,055 |
| | | | 15,805,316 |
| Local General Obligation Bonds – 16.44% | | |
| ^Anaheim, California City School | | | |
| District Election 2002 | | | |
| 4.58% 8/1/25 (MBIA) | 2,500,000 | | 1,039,575 |
| Belton, Missouri School District | | | |
| #124 Series B 5.25% 3/1/23 | 1,000,000 | | 1,054,130 |
| Boerne, Texas Independent School | | | |
| District Building | | | |
| 5.25% 2/1/26 (PSF) | 4,495,000 | | 4,649,808 |
| 5.25% 2/1/29 (PSF) | 1,500,000 | | 1,540,425 |
| Chicago, Illinois Board of Education | | | |
| Refunding Dedicated Revenue | | | |
| Series B 5.00% 12/1/23 (AMBAC) | 3,500,000 | | 3,640,735 |
| Chicago, Illinois Modern Schools | | | |
| Across Chicago Series J | | | |
| 5.00% 12/1/23 (AMBAC) | 2,865,000 | | 2,975,503 |
| Chicago, Illinois Project & | | | |
| Refunding Series C | | | |
| 5.50% 1/1/40 (FGIC) | 2,940,000 | | 3,064,891 |
| Coralville, Iowa Urban Renewal | | | |
| Revenue Tax Increment Series C | | | |
| 5.00% 6/1/47 | 850,000 | | 771,613 |
| 5.125% 6/1/39 | 500,000 | | 473,030 |
| East Homestead Community | | | |
| Development District Florida | | | |
| Special Assessment Revenue | | | |
| Series B 5.00% 5/1/11 | 365,000 | | 363,781 |
| Fairfax County, Virginia Refunding | | | |
| & Public Improvement Revenue | | | |
| 5.25% 4/1/14 | 3,500,000 | | 3,801,525 |
| Florida State Board Education | | | |
| Capital Outlay Public Education | | | |
| Series D 5.75% 6/1/22 | 2,000,000 | | 2,109,700 |
| Gwinnett County, Georgia School | | | |
| District 5.00% 2/1/11 | 3,500,000 | | 3,654,385 |
| Lansing, Michigan Community | | | |
| College (College Building and | | | |
| Site) 5.00% 5/1/21 (MBIA) | 1,325,000 | | 1,370,395 |
| Licking County, Ohio Joint | | | |
| Vocational School District | | | |
| School Facilities Construction | | | |
| and Improvement | | | |
| 5.00% 12/1/19 (MBIA) | 1,000,000 | | 1,042,060 |
| Los Angeles, California Unified | | | |
| School District | | | |
| Election 2004 Series G | | | |
| 5.00% 7/1/13 (AMBAC) | 2,000,000 | | 2,133,580 |
| Series A-2 4.25% 1/1/28 (FGIC) | 355,000 | | 321,279 |
| Mecklenburg County, North | | | |
| Carolina Public Improvement | | | |
| Series A 5.00% 2/1/11 | 4,775,000 | | 4,988,728 |
| Middlesex County, New Jersey | | | |
| Improvement Authority | | | |
| Revenue (County Guaranteed | | | |
| Open Space Trust) | | | |
| 5.25% 9/15/20 | 1,000,000 | | 1,062,870 |
| Modesto, California Special Tax | | | |
| Community Facilities District | | | |
| #04-1 Village 2 5.15% 9/1/36 | 1,500,000 | | 1,415,025 |
| New York City, New York | | | |
| Series A-1 5.00% 8/1/19 | 3,500,000 | | 3,685,885 |
| Series G 5.25% 8/1/15 | 1,000,000 | | 1,070,210 |
| Series I 5.00% 8/1/21 | 1,000,000 | | 1,032,100 |
| Series J 5.50% 6/1/23 | 100,000 | | 105,502 |
| North East Texas Independent | | | |
| School District School Building | | | |
| Series A 5.00% 8/1/20 (PSF) | 3,500,000 | | 3,665,725 |
| Powell, Ohio 5.50% 12/1/25 (FGIC) | 1,500,000 | | 1,586,565 |
| Richmond Heights, Missouri Tax | | | |
| Increment & Transaction Sales | | | |
| Tax Revenue Refunding & | | | |
| Improvement (Francis Place | | | |
| Redevelopment Project) | | | |
| 5.625% 11/1/25 | 1,200,000 | | 1,185,120 |
| St. Joseph, Missouri Industrial | | | |
| Development Authority Tax | | | |
| Increment Revenue (Shoppes at | | | |
| North Village Project) | | | |
| Series A 5.10% 11/1/19 | 500,000 | | 487,100 |
| Series B 5.375% 11/1/23 | 1,000,000 | | 979,830 |
| | | | 55,271,075 |
| §Pre-Refunded Bonds – 8.06% | | | |
| Arizona State Transportation Board | | | |
| Highway Revenue | | | |
| 6.25% 7/1/16-09 | 1,850,000 | | 1,933,602 |
| Benton & Linn Counties, Oregon | | | |
| School District #509J | | | |
| 5.00% 6/1/21-13 (FSA) | 1,000,000 | | 1,062,200 |
| California State 5.25% 2/1/30-12 | | | |
| (MBIA) | 5,000 | | 5,341 |
(continues) 29
Statements of net assets
Delaware Tax-Free USA Intermediate Fund
| | Principal | | |
| | Amount | | Value |
| Municipal Bonds (continued) | | | |
| §Pre-Refunded Bonds (continued) | | | |
| Cook County, Illinois Series A | | | |
| 5.375% 11/15/21-11 (FGIC) | $2,160,000 | | $ 2,285,993 |
| Forest Grove, Oregon Revenue | | | |
| Campus (Pacific University) | | | |
| 6.30% 5/1/25-10 (RADIAN) | 1,000,000 | | 1,067,010 |
| Golden State, California Tobacco | | | |
| Securitization Settlement | | | |
| Revenue Enhanced Asset- | | | |
| Backed Series B | | | |
| 5.75% 6/1/23-08 | 1,000,000 | | 1,015,220 |
| Illinois Educational Facilities | | | |
| Authority Student Housing | | | |
| Revenue (Educational | | | |
| Advancement-University Center | | | |
| Project) 6.00% 5/1/22-12 | 750,000 | | 829,080 |
| Lancaster County, Pennsylvania | | | |
| Hospital Authority Revenue | | | |
| (Lancaster General Hospital | | | |
| Project) 5.75% 3/15/21-13 | 1,000,000 | | 1,103,470 |
| Lunenburg County, Virginia Series B | | | |
| 5.25% 2/1/29-13 (MBIA) | 715,000 | | 772,043 |
| Miami-Dade County, Florida | | | |
| Educational Facilities Authority | | | |
| Revenue (University of Miami) | | | |
| Series A 5.00% 4/1/34-14 | | | |
| (AMBAC) | 3,500,000 | | 3,733,029 |
| New Jersey State Educational | | | |
| Facilities Authority Revenue | | | |
| (Georgian Court College | | | |
| Project) Series C | | | |
| 6.50% 7/1/33-13 | 500,000 | | 567,070 |
| New York City, New York Series J | | | |
| 5.50% 6/1/23-13 | 900,000 | | 981,945 |
| North Texas Health Facilities | | | |
| Development Corporation | | | |
| Hospital Revenue (United | | | |
| Regional Health Care System, | | | |
| Inc. Project) 6.00% 9/1/23-13 | 1,000,000 | | 1,113,360 |
| Orlando, Florida Utilities | | | |
| Commission Water & Electric | | | |
| Revenue 5.25% 10/1/20-11 | 945,000 | | 1,009,071 |
| Pennsylvania State First | | | |
| Series 5.125% 1/15/19-11 | 3,515,000 | | 3,706,216 |
| Puerto Rico Commonwealth | | | |
| Highway & Transportation | | | |
| Authority Revenue Series J | | | |
| 5.50% 7/1/21-14 | 1,000,000 | | 1,099,200 |
| Southcentral, Pennsylvania General | | | |
| Authority Revenue (Welllspan | | | |
| Health Obligated Project) | | | |
| 5.625% 5/15/26-11 | 820,000 | | 881,008 |
| University of North Carolina | | | |
| Revenue (Chapel Hill) Series A | | | |
| 5.375% 12/1/14-11 | 2,000,000 | | 2,118,900 |
| Virginia State Resource Authority | | | |
| Clean Water Revenue (State | | | |
| Revolving Fund) | | | |
| 6.00% 10/1/16-10 | 1,000,000 | | 1,068,660 |
| Westminster, Colorado Sales & Use | | | |
| Tax Revue (Sales Tax Revenue | | | |
| Project) Series A | | | |
| 5.60% 12/1/16-07 | 740,000 | | 757,945 |
| | | | 27,110,363 |
| Resource Recovery Bonds – 0.44% | | | |
| Pennsylvania Economic | | | |
| Development Financing | | | |
| Authority Resource Recovery | | | |
| Revenue (Subordinate Colver | | | |
| Project) Series G | | | |
| 5.125% 12/1/15 (AMT) | 1,500,000 | | 1,482,510 |
| | | | 1,482,510 |
| Special Tax Bonds – 5.65% | | | |
| Baltimore, Maryland Convention | | | |
| Center Hotel Revenue | | | |
| Subordinated Series B | | | |
| 5.00% 9/1/16 | 1,200,000 | | 1,166,556 |
| Casa Grande, Arizona Excise Tax | | | |
| Revenue 5.00% 4/1/22 (AMBAC) | 1,600,000 | | 1,648,768 |
| Dallas, Texas Civic Center | | | |
| Convention Complex Revenue | | | |
| Refunding & Improvement | | | |
| 4.875% 8/15/23 (MBIA) | 1,500,000 | | 1,513,725 |
| Gravois Bluffs, Missouri | | | |
| Transportation Development | | | |
| District Sales Tax Revenue | | | |
| 4.75% 5/1/32 | 750,000 | | 730,073 |
| Hampton, Virginia Convention | | | |
| Center Revenue 5.25% 1/15/23 | | | |
| (AMBAC) | 1,000,000 | | 1,047,240 |
| Metropolitan Pier and Exposition | | | |
| Authority Illinois (McCormick | | | |
| Place Expansion Project) | | | |
| Series A 5.50% 12/15/24 (FGIC) | 2,000,000 | | 2,082,679 |
| Middlesex County, New Jersey | | | |
| Improvement Authority Senior | | | |
| Revenue (Heldrich Center Hotel/ | | | |
| Conference Project) | | | |
| Series A 5.00% 1/1/32 | 1,000,000 | | 935,200 |
| New Jersey Economic Development | | | |
| Authority (Cigarette Tax) | | | |
| 5.50% 6/15/31 | 1,000,000 | | 1,018,890 |
| 5.625% 6/15/18 | 1,000,000 | | 1,008,870 |
| ·New York City, New York | | | |
| Transitional Finance Authority | | | |
| Revenue Refunding - Future Tax | | | |
| Secured Series A | | | |
| 5.50% 11/1/26 | 1,000,000 | | 1,065,400 |
30
| | Principal | | |
| | Amount | | Value |
| Municipal Bonds (continued) | | | |
| Special Tax Bonds (continued) | | | |
| New York State Dormitory | | | |
| Authority State Personal Income | | | |
| Tax Revenue Education | | | |
| 5.00% 3/15/31 | $1,830,000 | | $ 1,879,227 |
| New York State Sales Tax Asset | | | |
| Receivables Series A | | | |
| 5.25% 10/15/27 (AMBAC) | 1,000,000 | | 1,050,500 |
| Westminster, Colorado Sales & Use | | | |
| Tax Revenue (Sales Tax Revenue | | | |
| Project) Series A 5.60% 12/1/16 | 760,000 | | 778,384 |
| Wyandotte County, Kansas City, | | | |
| Kansas Unified Government | | | |
| Special Obligation Revenue | | | |
| Refunding-Sales Tax-2nd Lien- | | | |
| Area B 5.00% 12/1/20 | 1,500,000 | | 1,472,115 |
| Wyoming State Loan & Investment | | | |
| Board Facilities Revenue | | | |
| 5.00% 10/1/24 | 1,550,000 | | 1,595,090 |
| | | | 18,992,717 |
| State General Obligation Bonds – 18.97% | | |
| California State | | | |
| 5.00% 2/1/26 (AMBAC) | 1,500,000 | | 1,524,870 |
| 5.25% 11/1/17 | 1,000,000 | | 1,056,470 |
| 5.25% 2/1/30 (MBIA) | 1,495,000 | | 1,546,174 |
| California State Economic Recovery | | | |
| Series A 5.25% 7/1/14 | 1,000,000 | | 1,083,050 |
| California State Refunding | | | |
| 5.00% 8/1/14 | 1,025,000 | | 1,091,020 |
| 5.25% 2/1/25 | 3,000,000 | | 3,092,850 |
| California State Various Purposes | | | |
| 5.00% 6/1/31 | 1,000,000 | | 1,005,990 |
| Florida State Board Education Capital | | | |
| Outlay (Public Education) Series B | | | |
| 5.00% 1/1/09 | 2,500,000 | | 2,543,900 |
| Georgia State | | | |
| 5.00% 8/1/12 | 3,125,000 | | 3,315,094 |
| Series D 5.00% 7/1/11 | 6,865,000 | | 7,207,220 |
| Illinois State Refunding Series B | | | |
| 5.00% 1/1/13 | 3,475,000 | | 3,671,859 |
| Maryland State & Local Facilities | | | |
| Land Capital Improvement | | | |
| Series A | | | |
| 5.00% 3/1/12 | 2,000,000 | | 2,114,100 |
| 5.25% 3/1/13 | 2,500,000 | | 2,693,175 |
| Maryland State Series A | | | |
| 5.50% 3/1/14 | 1,850,000 | | 2,035,444 |
| Massachusetts State Consolidated | | | |
| Loan Series A 5.25% 8/1/13 | 4,000,000 | | 4,307,480 |
| Minnesota State 5.00% 6/1/14 | 900,000 | | 963,549 |
| North Carolina State 5.00% 6/1/14 | 1,700,000 | | 1,823,182 |
| North Carolina State Public | | | |
| Improvement Series A | | | |
| 5.00% 3/1/12 | 4,000,000 | | 4,224,800 |
| Ohio State Series D 5.00% 9/15/14 | 3,500,000 | | 3,746,295 |
| Pennsylvania State Third | | | |
| Series 2004 5.00% 7/1/09 | 2,885,000 | | 2,954,615 |
| Puerto Rico Commonwealth Public | | | |
| Improvement Series A | | | |
| 5.25% 7/1/23 | 1,125,000 | | 1,163,723 |
| ·Puerto Rico Commonwealth | | | |
| Series A 5.00% 7/1/30 | 1,000,000 | | 1,034,830 |
| Puerto Rico Public Buildings | | | |
| Authority Revenue Government | | | |
| Facility Series I 5.50% 7/1/23 | 2,000,000 | | 2,113,380 |
| ·Puerto Rico Public Finance | | | |
| Corporation Commonwealth | | | |
| Appropriation (LOC Puerto Rico | | | |
| Government Bank) Series A | | | |
| 5.75% 8/1/27 | 1,000,000 | | 1,059,990 |
| Texas State Water Financial | | | |
| Assistance Series B | | | |
| 5.50% 8/1/35 | 3,800,000 | | 3,892,720 |
| Washington State Variable Purpose | | | |
| Series B 5.00% 1/1/20 | 2,500,000 | | 2,535,425 |
| | | | 63,801,205 |
| Transportation Revenue Bonds – 4.48% | | | |
| Bay Area, California Toll Authority | | | |
| Revenue Series F 5.00% 4/1/31 | 740,000 | | 761,031 |
| Capital Trust Agency Florida | | | |
| Revenue (Fort Lauderdale/Cargo | | | |
| Acquisition Project) | | | |
| 5.75% 1/1/32 (AMT) | 1,750,000 | | 1,760,955 |
| Chicago, Illinois O’ Hare | | | |
| International Airport Revenue | | | |
| General-Airport-Third Lien | | | |
| Series A-2 5.75% 1/1/20 | | | |
| (FSA) (AMT) | 1,000,000 | | 1,063,620 |
| Dallas-Fort Worth, Texas | | | |
| International Airport Revenue | | | |
| Series A 5.00% 11/1/15 | | | |
| (XLCA) (AMT) | 2,000,000 | | 2,039,340 |
| Georgia Federal Highway Road | | | |
| and Tollway Authority Revenue | | | |
| Bonds 5.00% 6/1/10 (MBIA) | 2,000,000 | | 2,072,320 |
| Metropolitan, New York | | | |
| Transportation Authority | | | |
| Revenue Refunding Series A | | | |
| 5.00% 11/15/30 (FSA) | 1,000,000 | | 1,013,640 |
| Metropolitan, Washington D.C. | | | |
| Airport Authority Systems | | | |
| Revenue Series A | | | |
| 5.50% 10/1/19 (FGIC) (AMT) | 1,000,000 | | 1,047,780 |
| North Texas Tollway Authority | | | |
| Dallas North Tollway System | | | |
| Revenue Series A 5.00% 1/1/20 | | | |
| (FGIC) | 1,750,000 | | 1,756,230 |
| Pennsylvania State Turnpike | | | |
| Commission Revenue Series A | | | |
| 5.25% 12/1/20 (AMBAC) | 1,230,000 | | 1,311,426 |
(continues) 31
Statements of net assets
Delaware Tax-Free USA Intermediate Fund
| | Principal | | |
| | Amount | | Value |
| Municipal Bonds (continued) | | | |
| Transportation Revenue Bonds (continued) | | |
| South Carolina Transportation | | | |
| Infrastructure Bank Revenue | | | |
| Series A 5.00% 10/1/33 | | | |
| (AMBAC) | $1,700,000 | | $ 1,721,267 |
| Virginia Port Authority | | | |
| Commonwealth Port Fund | | | |
| Revenue Resolution | | | |
| 5.00% 7/1/12 (AMT) | 500,000 | | 523,540 |
| | | | 15,071,149 |
| Water & Sewer Revenue Bonds – 7.11% | | | |
| Alabama Water Pollution Control | | | |
| Authority Revenue | | | |
| 5.50% 8/15/23 (AMBAC) | 1,000,000 | | 1,045,640 |
| Clovis, California Public Financing | | | |
| Authority Wastewater Revenue | | | |
| 5.25% 8/1/30 (MBIA) | 1,000,000 | | 1,048,430 |
| Dallas, Texas Waterworks & Sewer | | | |
| System Revenue | | | |
| 5.00% 10/1/24 (FSA) | 6,500,000 | | 6,563,699 |
| Fulton County, Georgia Water & | | | |
| Sewer Revenue | | | |
| 5.25% 1/1/35 (FGIC) | 1,500,000 | | 1,555,035 |
| King County, Washington Sewer | | | |
| Revenue Refunding Series B | | | |
| 5.00% 1/1/14 (MBIA) | 3,500,000 | | 3,719,065 |
| New York City, New York Municipal | | | |
| Water Finance Authority Water | | | |
| & Sewer System Revenue | | | |
| Second General Resolution Series D | | | |
| 5.00% 6/15/39 | 3,500,000 | | 3,528,630 |
| Series A 5.125% 6/15/34 | 2,775,000 | | 2,825,450 |
| Series C 5.00% 6/15/35 | 2,555,000 | | 2,598,180 |
| New York State Environmental | | | |
| Facilities Corporation State | | | |
| Clean Water and Drinking | | | |
| Water Revenue (New York City | | | |
| Municipal Water Finance Project | | | |
| Second Resolution) Series F | | | |
| 5.00% 6/15/34 | 1,000,000 | | 1,020,400 |
| | | | 23,904,529 |
| Total Municipal Bonds | | | |
| (cost $315,392,178) | | | 313,856,406 |
| |
| ·Variable Rate Demand Notes – 6.15% | | | |
| Allegheny County, Pennsylvania | | | |
| Hospital Development Authority | | | |
| Revenue (Pittsburgh Children’s | | | |
| Hospital) Series B 3.97% 6/1/35 | 500,000 | | 500,000 |
| Colorado Housing & Finance | | | |
| Authority Single Family | | | |
| Mortgage Series CL 1 B-2 | | | |
| 4.05% 5/1/34 | 700,000 | | 700,000 |
| Connecticut State Health & | | | |
| Education Facilities Authority | | | |
| Revenue (Yale University) | | | |
| Series T-1 3.92% 7/1/29 | 900,000 | | 900,000 |
| Series X-2 3.95% 7/1/37 | 6,000,000 | | 6,000,000 |
| Jacksonville, Florida Health Facilities | | | |
| Authority Hospital Revenue | | | |
| (Ascension Health) Series C | | | |
| 3.98% 8/15/19 (MBIA) | 60,000 | | 60,000 |
| New Castle, Pennsylvania Area | | | |
| Hospital Authority Revenue | | | |
| (Jameson Memorial Hospital) | | | |
| 3.93% 7/1/26 (FSA) | 500,000 | | 500,000 |
| Pennsylvania State Turnpike | | | |
| Commission Revenue Series B | | | |
| 3.94% 12/1/22 (AMBAC) | 700,000 | | 700,000 |
| Series C 3.94% 7/15/41 (FSA) | 1,300,000 | | 1,300,000 |
| Pennsylvania State University | | | |
| Series A 3.94% 4/1/31 | 600,000 | | 600,000 |
| Saint Louis, Missouri Industrial | | | |
| Development Authority | | | |
| Revenue (Wetterau Inc. Project) | | | |
| 3.97% 5/1/09 | 5,000,000 | | 5,000,000 |
| University of Minnesota Series C | | | |
| 4.05% 12/1/36 | 1,400,000 | | 1,400,000 |
| University of Pittsburgh, | | | |
| Pennsylvania Commonwealth | | | |
| System of Higher Education | | | |
| (University Capital Project) | | | |
| Series A 3.90% 9/15/09 | 500,000 | | 500,000 |
| Series B 3.90% 9/15/40 | 2,500,000 | | 2,500,000 |
| Total Variable Rate Demand Notes | | | |
| (cost $20,660,000) | | | 20,660,000 |
| |
| Total Value of Securities – 99.49% | | | |
| (cost $336,052,178) | | | 334,516,406 |
| Receivables and Other Assets | | | |
| Net of Liabilities – 0.51% | | | 1,721,508 |
| Net Assets Applicable to 29,998,505 | | | |
| Shares Outstanding – 100.00% | | | $336,237,914 |
| |
| Net Asset Value – Delaware Tax-Free USA | | |
| Intermediate Fund Class A | | | |
| ($306,214,830 / 27,318,834 Shares) | | | | $11.21 |
| Net Asset Value – Delaware Tax-Free USA | | |
| Intermediate Fund Class B | | | |
| ($1,785,641 / 159,414 Shares) | | | | $11.20 |
| Net Asset Value – Delaware Tax-Free USA | | |
| Intermediate Fund Class C | | | |
| ($28,237,443 / 2,520,257 Shares) | | | | $11.20 |
32
| |
| Components of Net Assets at August 31, 2007: | | |
| Shares of beneficial interest | | |
| (unlimited authorization – no par) | $340,230,438 | |
| Accumulated net realized loss on investments | (2,456,752 | ) |
| Net unrealized depreciation of investments | (1,535,772 | ) |
| Total net assets | $336,237,914 | |
| | |
| § | | Pre-Refunded Bonds. Municipals that are generally backed or secured by U.S. Treasury bonds. For Pre-Refunded Bonds, the stated maturity is followed by the year in which the bond is pre-refunded. See Note 10 in “Notes to Financial Statements.” |
| |
| ^ | | Zero coupon security. The rate shown is the yield at the time of purchase. |
| | | |
| • | | Variable rate security. The rate shown is the rate as of August 31, 2007. |
| | | |
| ¶ | | Step coupon bond. Indicates security that has a zero coupon that remains in effect until a predetermined date at which time the stated interest rate becomes effective. |
| | | |
| Summary of Abbreviations: | | |
| AMBAC — Insured by the AMBAC Assurance Corporation |
| AMT — Subject to Alternative Minimum Tax |
| CDFI — Community Development Financial Institutions |
| FGIC — Insured by the Financial Guaranty Insurance Company |
| FSA — Insured by Financial Security Assurance |
| LOC — Letter of Credit |
| MBIA — Insured by the Municipal Bond Insurance Association |
| PSF — Insured by the Permanent School Fund |
| RADIAN — Insured by Radian Asset Assurance |
| XLCA — Insured by XL Capital Assurance |
| |
| Net Asset Value and Offering Price Per Share – |
| Delaware Tax-Free USA Intermediate Fund |
| Net asset value Class A (A) | | $11.21 | |
| Sales charge (2.75% of offering price) (B) | | 0.32 | |
| Offering price | | $11.53 | |
| (A) | | Net asset value per share, as illustrated, is the amount which would be paid upon redemption or repurchase of shares. |
| | | |
| (B) | | See the current prospectus for purchases of $100,000 or more. |
See accompanying notes
(continues) 33
Statements of net assets
Delaware National High-Yield Municipal Bond Fund
August 31, 2007
| | Principal | | |
| | Amount | | Value |
| Municipal Bonds - 96.87% | | | |
| Corporate Revenue Bonds – 17.20% | | | |
| ·Brazos, Texas River Authority | | | |
| Pollution Control Revenue | | | |
| (TXU Energy Co. Project) Series B | | | |
| 6.30% 7/1/32 (AMT) | $1,000,000 | | $1,014,670 |
| Cloquet, Minnesota Pollution | | | |
| Control Revenue (Potlatch Corp. | | | |
| Project) 5.90% 10/1/26 | 750,000 | | 753,630 |
| De Soto Parish, Louisiana | | | |
| Environmental Improvement | | | |
| Revenue (International Paper | | | |
| Co. Project) Series A | | | |
| 6.35% 2/1/25 (AMT) | 1,650,000 | | 1,716,215 |
| Golden State, California Tobacco | | | |
| Securitization Corporation | | | |
| Settlement Revenue | | | |
| Refunding Asset-Backed Senior | | | |
| Series A-1 5.00% 6/1/33 | 1,000,000 | | 906,620 |
| Gulf Coast, Texas Waste Disposal | | | |
| Authority Revenue | | | |
| (Valero Energy Corp. Project) | | | |
| 6.65% 4/1/32 (AMT) | 1,000,000 | | 1,044,950 |
| Mississippi Business Finance | | | |
| Corporation Pollution Control | | | |
| Revenue (System Energy | | | |
| Resources, Inc. Project) | | | |
| 5.90% 5/1/22 | 900,000 | | 908,676 |
| New York City, New York Industrial | | | |
| Development Agency Special | | | |
| Facilities Revenue (Jetblue | | | |
| Airways Copr. Project) | | | |
| 5.125% 5/15/30 (AMT) | 1,000,000 | | 898,450 |
| Petersburg, Indiana Pollution | | | |
| Control Revenue (Indianapolis | | | |
| Power & Light Co. Project) | | | |
| 6.375% 11/1/29 (AMT) | 1,000,000 | | 1,053,090 |
| Phenix City, Alabama Industrial | | | |
| Development Board | | | |
| Environmental Improvement | | | |
| Revenue (Mead Westvaco Corp. | | | |
| Project) Series A | | | |
| 6.35% 5/15/35 (AMT) | 500,000 | | 517,045 |
| Sugar Creek, Missouri Industrial | | | |
| Development Revenue (Lafarge | | | |
| North America Project) Series A | | | |
| 5.65% 6/1/37 (AMT) | 500,000 | | 500,870 |
| Sweetwater County, Wyoming Solid | | | |
| Waste Disposal Revenue | | | |
| (FMC Corp. Project) | | | |
| 5.60% 12/1/35 (AMT) | 1,000,000 | | 988,020 |
| Tobacco Settlement Financing | | | |
| Corporation, New Jersey | | | |
| Refunding Senior Series 1A | | | |
| 4.75% 6/1/34 | 1,000,000 | | 844,370 |
| 5.00% 6/1/41 | 1,000,000 | | 866,850 |
| Toledo, Lucas County, Ohio Port | | | |
| Authority Development Revenue | | | |
| (Toledo Express Airport Project) | | | |
| Series C 6.375% 11/15/32 (AMT) | 1,000,000 | | 1,050,770 |
| | | | 13,064,226 |
| Education Revenue Bonds – 14.72% | | | |
| California Statewide Communities | | | |
| Development Authority Revenue | | | |
| (California Baptist University | | | |
| Project) Series A 5.50% 11/1/38 | 1,000,000 | | 971,620 |
| Chattanooga, Tennessee Health | | | |
| Educational & Housing Facilities | | | |
| Broad Revenue (CDFI Phase I, | | | |
| LLC Project) Subordinate Series B | | | |
| 6.00% 10/1/35 | 1,000,000 | | 1,004,700 |
| Maine Finance Authority Education | | | |
| Revenue (Waynflete School | | | |
| Project) 6.40% 8/1/19 | 1,000,000 | | 1,036,650 |
| Maryland State Health & Higher | | | |
| Educational Facilities Authority | | | |
| Revenue (Washington Christian | | | |
| Academy Project) 5.50% 7/1/38 | 1,170,000 | | 1,120,568 |
| Massachusetts State Development | | | |
| Finance Agency Revenue | | | |
| (Massachusetts College of | | | |
| Pharmacy Project) Series C | | | |
| 5.75% 7/1/33 | 1,000,000 | | 1,045,240 |
| Massachusetts State Health & | | | |
| �� Educational Facilities Authority | | | |
| Revenue (Nichols College | | | |
| Project) Series C | | | |
| 6.125% 10/1/29 | 1,000,000 | | 1,037,860 |
| New Jersey State Educational | | | |
| Facilities Authority Revenue | | | |
| (Fairleigh Dickinson Project) | | | |
| Series C 5.50% 7/1/23 | 750,000 | | 758,235 |
| New Mexico Educational Assistance | | | |
| Foundation Student Loan | | | |
| Revenue 1st Subordinate | | | |
| Series A-2 6.65% 11/1/25 (AMT) | 985,000 | | 1,002,316 |
| Philadelphia, Pennsylvania Authority | | | |
| for Industrial Development | | | |
| Revenue (First Philadelphia | | | |
| Charter Project) | | | |
| Class A 5.75% 8/15/32 | 745,000 | | 749,179 |
| Provo, Utah Charter School Revenue | | | |
| (Freedom Academy Foundation | | | |
| Project) 5.50% 6/15/37 | 1,000,000 | | 932,850 |
| Scranton-Lackawanna, Pennsylvania | | | |
| Health & Welfare Authority First | | | |
| Mortgage Revenue (Lackawanna | | | |
| Junior College Project) | | | |
| 5.75% 11/1/20 | 1,510,000 | | 1,520,268 |
| | | | 11,179,486 |
34
| | Principal | | |
| | Amount | | Value |
| Municipal Bonds (continued) | | | |
| Health Care Revenue Bonds – 21.71% | | | |
| Apple Valley, Minnesota Economic | | | |
| Development Authority Health | | | |
| Care Revenue (Augustana Home | | | |
| St. Paul Project) Series A | | | |
| 6.00% 1/1/40 | $1,000,000 | | $ 991,860 |
| Cleveland-Cuyahoga County, Ohio | | | |
| Port Authority Revenue Senior | | | |
| Housing (St. Clarence - Geac) | | | |
| Series A 6.25% 5/1/38 | 1,000,000 | | 1,017,420 |
| Colorado Health Facilities Authority | | | |
| Revenue (Christian Living | | | |
| Community Project) Series A | | | |
| 5.75% 1/1/37 | 500,000 | | 475,860 |
| East Rochester, New York Housing | | | |
| Authority Revenue Refunding | | | |
| (Senior Living - Woodland | | | |
| Village Project) 5.50% 8/1/33 | 500,000 | | 468,555 |
| Gainesville & Hall County, Georgia | | | |
| Development Authority Revenue | | | |
| Senior Living Facilities (Lanier | | | |
| Village Estates Project) Series C | | | |
| 7.25% 11/15/29 | 1,000,000 | | 1,068,720 |
| Illinois Health Facilities Authority | | | |
| Revenue | | | |
| (Elmhurst Memorial Healthcare | | | |
| Project) 5.625% 1/1/28 | 1,000,000 | | 1,025,810 |
| (Midwest Physician Group | | | |
| Limited Project) 5.50% 11/15/19 | 35,000 | | 34,201 |
| Knox County, Tennessee Health | | | |
| Educational & Housing Facilities | | | |
| Board Hospital Revenue (East | | | |
| Tennessee Hospital Project) | | | |
| Series B 5.75% 7/1/33 | 1,300,000 | | 1,318,188 |
| Lebanon County, Pennsylvania | | | |
| Health Facilities Authority | | | |
| Center Revenue (Pleasant View | | | |
| Retirement) Series A | | | |
| 5.30% 12/15/26 | 1,000,000 | | 924,510 |
| Massachusetts State Health & | | | |
| Educational Facilities Authority | | | |
| Revenue (Jordan Hospital | | | |
| Project) Series E 6.75% 10/1/33 | 1,000,000 | | 1,052,490 |
| North Carolina Medical Care | | | |
| Commission Health Care | | | |
| Facilities Revenue | | | |
| (First Mortgage - Presbyterian | | | |
| Homes) 5.60% 10/1/36 | 1,000,000 | | 967,230 |
| (Pennybryn at Mayfield Project) | | | |
| Series A 6.125% 10/1/35 | 750,000 | | 753,270 |
| North Oaks, Minnesota Senior | | | |
| Housing Revenue (Presbyterian | | | |
| Homes) 6.25% 10/1/47 | 1,000,000 | | 998,470 |
| Philadelphia, Pennsylvania Hospitals | | | |
| & Higher Education Facilities | | | |
| Authority Revenue (The | | | |
| Philadelphia Protestant Home | | | |
| Project) Series A 6.50% 7/1/27 | 1,100,000 | | 1,100,484 |
| Richland County, Ohio Hospital | | | |
| Facilities Revenue (Medcentral | | | |
| Health System Project) Series B | | | |
| 6.375% 11/15/30 | 500,000 | | 524,350 |
| Shelby County, Tennessee Health | | | |
| Educational & Housing Facilities | | | |
| Board Revenue (Trezevant Manor | | | |
| Project) Series A 5.75% 9/1/37 | 700,000 | | 673,526 |
| St. Joseph County, Indiana Industrial | | | |
| Economic Development Revenue | | | |
| (Madison Center Project) | | | |
| 5.50% 2/15/21 | 1,150,000 | | 1,154,186 |
| Winchester, Virginia Industrial | | | |
| Development Authority | | | |
| Residential Care Facility Revenue | | | |
| (Westminster - Canterbury | | | |
| Project) Series A 5.30% 1/1/35 | 1,000,000 | | 913,550 |
| Yavapai County, Arizona Industrial | | | |
| Development Authority Hospital | | | |
| Revenue (Yavapai Medical | | | |
| Center Project) Series A | | | |
| 6.00% 8/1/33 | 1,000,000 | | 1,030,750 |
| | | | 16,493,430 |
| Lease Revenue Bonds – 3.39% | | | |
| Dauphin County, Pennsylvania | | | |
| General Authority Revenue | | | |
| (Riverfront Office & Parking | | | |
| Project) Series A 5.75% 1/1/10 | 1,875,000 | | 1,863,750 |
| Missouri State Development Finance | | | |
| Board Infrastructure Facilities | | | |
| Revenue (Branson Landing | | | |
| Project) Series A 5.50% 12/1/24 | 720,000 | | 713,210 |
| | | | 2,576,960 |
| Local General Obligation Bonds – 9.53% | | | |
| Chicago, Illinois Tax Increment | | | |
| Allocation (Chatham Ridge | | | |
| Redevelopment Project) | | | |
| 5.95% 12/15/12 | 750,000 | | 776,175 |
| Chicago, Illinois Tax Increment | | | |
| Subordinate (Central Loop | | | |
| Redevelopment Project) Series A | | | |
| 6.50% 12/1/08 | 1,000,000 | | 1,026,720 |
| Farms New Kent, Virginia | | | |
| Community Development | | | |
| Authority Special Assessment | | | |
| Series C 5.80% 3/1/36 | 1,000,000 | | 952,570 |
| Henderson, Nevada Local | | | |
| Improvement Districts #T-18 | | | |
| 5.30% 9/1/35 | 1,000,000 | | 887,740 |
(continues) 35
Statements of net assets
Delaware National High-Yield Municipal Bond Fund
| | Principal | | |
| | Amount | | Value |
| Municipal Bonds (continued) | | | |
| Local General Obligation Bonds (continued) | | | |
| Richmond Heights, Missouri Tax | | | |
| Increment & Transaction Sales | | | |
| Tax Revenue Refunding & | | | |
| Improvement (Francis Place | | | |
| Redevelopment Project) | | | |
| 5.625% 11/1/25 | $1,200,000 | | $1,185,120 |
| St. Joseph, Missouri Industrial | | | |
| Development Authority Tax | | | |
| Increment Revenue (Shoppes at | | | |
| North Village Project) Series A | | | |
| 5.375% 11/1/24 | 1,000,000 | | 976,920 |
| 5.50% 11/1/27 | 500,000 | | 490,115 |
| Winter Garden Village at | | | |
| Fowler Groves Community | | | |
| Development District, Florida | | | |
| Special Assessment Revenue | | | |
| 5.65% 5/1/37 | 1,000,000 | | 945,730 |
| | | | 7,241,090 |
| §Pre-Refunded Bonds – 20.83% | | | |
| Bexar County, Texas Health Facilities | | | |
| Development Corporation | | | |
| Revenue (Army Retirement | | | |
| Residence Project) | | | |
| 6.30% 7/1/32-12 | 1,000,000 | | 1,119,360 |
| Golden State, California Tobacco | | | |
| Securitization Corporation | | | |
| Settlement Revenue Series B | | | |
| 5.50% 6/1/43-13 | 1,500,000 | | 1,619,820 |
| Illinois Educational Facilities | | | |
| Authority Student Housing | | | |
| Revenue (Educational | | | |
| Advancement Fund-University | | | |
| Center Project) 6.25% 5/1/30-12 | 1,000,000 | | 1,116,060 |
| Las Vegas, Nevada Local | | | |
| Improvement Boards Special | | | |
| Improvement District #808 | | | |
| (Summerlin Area Project) | | | |
| 6.75% 6/1/21-07 | 980,000 | | 1,015,300 |
| Louisiana Public Facilities Authority | | | |
| Revenue (Ochsner Clinic | | | |
| Foundation Project) Series B | | | |
| 5.50% 5/15/32-26 | 1,000,000 | | 1,118,050 |
| Maryland State Economic | | | |
| Development Corporation, | | | |
| Student Housing Revenue | | | |
| (University of Maryland College | | | |
| Park Project) 5.625% 6/1/35-13 | 1,000,000 | | 1,095,300 |
| Milledgeville-Baldwin County, | | | |
| Georgia Development Authority | | | |
| Revenue (Georgia College & | | | |
| State University Foundation | | | |
| Student Housing Project) | | | |
| 6.00% 9/1/33-14 | 1,000,000 | | 1,138,820 |
| Minnesota State Higher Education | | | |
| Facilities Authority Revenue | | | |
| (College of Art & Design Project) | | | |
| Series 5-D 6.75% 5/1/26-10 | 500,000 | | 537,760 |
| Mississippi Development Bank | | | |
| Special Obligation (Madison | | | |
| County Hospital Project) | | | |
| 6.40% 7/1/29-09 | 1,585,000 | | 1,688,119 |
| Montgomery County, Pennsylvania | | | |
| Higher Education & Health | | | |
| Authority Revenue | | | |
| (Catholic Health East Project) | | | |
| Series C 5.375% 11/15/34-14 | 1,000,000 | | 1,090,830 |
| (Faulkeways at Gwynedd Project) | | | |
| 6.75% 11/15/30-09 | 1,000,000 | | 1,072,630 |
| Richland County, Ohio Hospital | | | |
| Facilities Revenue (Medcentral | | | |
| Health System Project) Series B | | | |
| 6.375% 11/15/30-10 | 1,000,000 | | 1,088,510 |
| Rochester, Minnesota Multifamily | | | |
| Housing Revenue (Wedum | | | |
| Shorewood Campus Project) | | | |
| 6.60% 6/1/36-09 | 985,000 | | 1,047,597 |
| Savannah, Georgia Economic | | | |
| Development Authority Revenue | | | |
| (College of Art & Design Project) | | | |
| 6.50% 10/1/13-09 | 1,000,000 | | 1,071,730 |
| | | | 15,819,886 |
| Special Tax Bonds – 5.39% | | | |
| Baltimore, Maryland Convention | | | |
| Center Hotel Revenue | | | |
| Subordinated Series B | | | |
| 5.875% 9/1/39 | 1,000,000 | | 1,024,560 |
| Middlesex County, New Jersey | | | |
| �� Improvement Authority Senior | | | |
| Revenue (Heldrich Center Hotel/ | | | |
| Conference Project) Series A | | | |
| 5.00% 1/1/32 | 500,000 | | 467,600 |
| 5.125% 1/1/37 | 870,000 | | 820,880 |
| New Jersey Economic Development | | | |
| Authority (Cigarette Tax) | | | |
| 5.75% 6/15/34 | 1,000,000 | | 1,040,019 |
| Prescott Valley, Arizona | | | |
| Improvement District Special | | | |
| Assessment (Sewer Collection | | | |
| System Roadway Repair Project) | | | |
| 7.90% 1/1/12 | 261,000 | | 268,953 |
| Southwestern Illinois Development | | | |
| Authority Revenue (Local | | | |
| Government Program – | | | |
| Collinsville Limited Project) | | | |
| 5.35% 3/1/31 | 500,000 | | 473,475 |
| | | | 4,095,487 |
36
| | Principal | | |
| | Amount | | Value |
| Municipal Bonds (continued) | | | |
| Transportation Revenue Bonds – 4.10% | | | | |
| Branson, Missouri Regional Airport | | | | |
| Transportation Development | | | | |
| District (Airport Project) Series A | | | | |
| 6.00% 7/1/37 | $ 500,000 | | $ 487,225 | |
| New York City, New York Industrial | | | | |
| Development Agency Special | | | | |
| Airport Facilities (Airis JFK I LLC | | | | |
| Project) Series A | | | | |
| 5.50% 7/1/28 (AMT) | 905,000 | | 887,877 | |
| Oklahoma City, Oklahoma | | | | |
| Industrial & Cultural Facilities | | | | |
| Subordinated (Air Cargo | | | | |
| Obligated Group Project) | | | | |
| 6.75% 1/1/23 6.75% 1/1/23 | | | | |
| (AMT) | 1,160,000 | | 1,211,574 | |
| Onondaga County, New York | | | | |
| Industrial Development | | | | |
| Authority Revenue Subordinated | | | | |
| (Air Cargo Project) | | | | |
| 7.25% 1/1/32 (AMT) | 500,000 | | 527,840 | |
| | | | 3,114,516 | |
| Total Municipal Bonds | | | | |
| (cost $72,017,303) | | | 73,585,081 | |
| | |
| Variable Rate Demand Note – 2.96% | | | | |
| •Chester County, Pennsylvania | | | | |
| Industrial Development | | | | |
| Authority Revenue (Archdiocese | | | | |
| of Philadelphia) 4.00% 7/1/31 | 2,250,000 | | 2,250,000 | |
| Total Variable Rate Demand Note | | | | |
| (cost $2,250,000) | | | 2,250,000 | |
| | |
| Total Value of Securities – 99.83% | | | | |
| (cost $74,267,303) | | | 75,835,081 | |
| Receivables and Other Assets | | | | |
| Net of Liabilities – 0.17% | | | 127,990 | |
| Net Assets Applicable to 7,570,294 | | | | |
| Shares Outstanding – 100.00% | | | $75,963,071 | |
| | |
| Net Asset Value – Delaware National High-Yield | | | |
| Municipal Bond Fund Class A | | | | |
| ($65,143,262 / 6,494,820 Shares) | | | | $10.03 | |
| Net Asset Value – Delaware National High-Yield | | | |
| Municipal Bond Fund Class B | | | | |
| ($5,972,052 / 594,095 Shares) | | | | $10.05 | |
| Net Asset Value – Delaware National High-Yield | | | |
| Municipal Bond Fund Class C | | | | |
| ($4,847,757 / 481,379 Shares) | | | | $10.07 | |
| Components of Net Assets at August 31, 2007: | | |
| Shares of beneficial interest | | |
| (unlimited authorization – no par) | $80,578,526 | |
| Distributions in excess of net investment income | (4,102 | ) |
| Accumulated net realized loss on investments | (6,179,131 | ) |
| Net unrealized appreciation of investments | 1,567,778 | |
| Total net assets | $75,963,071 | |
| | |
| § | Pre-Refunded Bonds. Municipals that are generally backed or secured by U.S. Treasury bonds. For Pre-Refunded Bonds, the stated maturity is followed by the year in which the bond is pre-refunded. See Note 10 in “Notes to Financial Statements.” |
| |
| • | Variable rate security. The rate shown is the rate as of August 31, 2007. |
| |
| Summary of Abbreviations: |
| AMT — Subject to Alternative Minimum Tax |
| CDFI — Community Development Financial Institutions |
| Net Asset Value and Offering Price Per Share – | | |
| Delaware National High-Yield Municipal Bond Fund | |
| Net asset value Class A (A) | $10.03 | |
| Sales charge (4.50% of offering price) (B) | | 0.47 | |
| Offering price | | $10.50 | |
| | |
| (A) | | Net asset value per share, as illustrated, is the amount which would be paid upon redemption or repurchase of shares. | |
| |
| (B) | | See the current prospectus for purchases of $100,000 or more. | |
| | |
| | |
| See accompanying notes |
37
Statements of operations
Year Ended August 31, 2007
| | Delaware | | Delaware | | Delaware |
| | Tax-Free | | Tax-Free USA | | National High-Yield |
| | USA | | Intermediate | | Municipal Bond |
| | Fund | | Fund | | Fund |
| Investment Income: | | | | | | | | | | | |
| Interest | | $33,728,565 | | | | $12,545,145 | | | | $4,503,449 | |
| | | | | | | | | | | | |
| Expenses: | | | | | | | | | | | |
| Management fees | | 3,688,592 | | | | 1,440,775 | | | | 445,090 | |
| Distribution expenses –Class A | | 1,569,725 | | | | 767,247 | | | | 170,729 | |
| Distribution expenses –Class B | | 187,995 | | | | 22,682 | | | | 76,559 | |
| Distribution expenses –Class C | | 148,338 | | | | 288,243 | | | | 50,110 | |
| Dividend disbursing and transfer agent fees and expenses | | 401,543 | | | | 327,989 | | | | 60,632 | |
| Accounting and administration expenses | | 274,990 | | | | 115,438 | | | | 32,370 | |
| Legal and professional fees | | 131,022 | | | | 38,845 | | | | 14,700 | |
| Trustees’ fees and benefits | | 121,449 | | | | 44,934 | | | | 14,519 | |
| Registration fees | | 83,388 | | | | 44,698 | | | | 30,248 | |
| Reports and statements to shareholders | | 79,035 | | | | 37,513 | | | | 5,092 | |
| Audit and tax | | 50,883 | | | | 26,307 | | | | 16,047 | |
| Insurance fees | | 18,370 | | | | 8,669 | | | | 2,061 | |
| Consulting fees | | 12,641 | | | | 5,406 | | | | 1,524 | |
| Custodian fees | | 11,687 | | | | 4,724 | | | | 4,452 | |
| Pricing fees | | 8,743 | | | | 6,581 | | | | 3,345 | |
| Due and services | | 2,683 | | | | 682 | | | | 300 | |
| Trustees’ expenses | | 2,541 | | | | 913 | | | | 278 | |
| Taxes (other than taxes on income) | | 771 | | | | — | | | | 125 | |
| | | 6,794,396 | | | | 3,181,646 | | | | 928,181 | |
| Less expenses absorbed or waived | | (565,604 | ) | | | (350,594 | ) | | | (94,456 | ) |
| Less waived distribution expenses – Class A | | — | | | | (383,623 | ) | | | — | |
| Less expense paid indirectly | | (5,965 | ) | | | (2,738 | ) | | | (2,698 | ) |
| Total operating expenses | | 6,222,827 | | | | 2,444,691 | | | | 831,027 | |
| Net Investment Income | | 27,505,738 | | | | 10,100,454 | | | | 3,672,422 | |
| | | | | | | | | | | | |
| Net Realized and Unrealized Gain (Loss) on Investments: | | | | | | | | | | | |
| Net realized gain (loss) on: | | | | | | | | | | | |
| Investments | | (39,979 | ) | | | (1,731,742 | ) | | | 558,847 | |
| Swap Agreements | | — | | | | (98,700 | ) | | | — | |
| Net realized gain (loss) | | (39,979 | ) | | | (1,830,442 | ) | | | 558,847 | |
| Net change in unrealized appreciation/depreciation of investments | | (21,159,119 | ) | | | (6,265,949 | ) | | | (2,772,801 | ) |
| Net Realized and Unrealized Loss on Investments | | (21,199,098 | ) | | | (8,096,391 | ) | | | (2,213,954 | ) |
| | | | | | | | | | | | |
| Net Increase in Net Assets Resulting from Operations | | $ 6,306,640 | | | | $ 2,004,063 | | | | $1,458,468 | |
| |
| | | | | | | | | | | | |
| See accompanying notes | | | | | | | | | | | |
38
Statements of changes in net assets
| | Delaware Tax-Free | | Delaware Tax-Free | | Delaware National High-Yield |
| | USA Fund | | USA Intermediate Fund | | Municipal Bond Fund |
| |
| | Year Ended | | Year Ended | | Year Ended |
| | 8/31/07 | | 8/31/06 | | 8/31/07 | | 8/31/06 | | 8/31/07 | | 8/31/06 |
| Increase (Decrease) in Net Assets | | | | | | | | | | | | | | | | | | | | | | | |
| from Operations: | | | | | | | | | | | | | | | | | | | | | | | |
| Net investment income | $ | 27,505,738 | | | $ | 21,127,920 | | | $ | 10,100,454 | | | $ | 6,342,427 | | | $ | 3,672,422 | | | $ | 3,772,133 | |
| Net realized gain (loss) on investments | | (39,979 | ) | | | 2,988,364 | | | | (1,830,442 | ) | | | (265,888 | ) | | | 558,847 | | | | (833,966 | ) |
| Net change in unrealized appreciation/ | | | | | | | | | | | | | | | | | | | | | | | |
| depreciation of investments | | (21,159,119 | ) | | | (7,385,302 | ) | | | (6,265,949 | ) | | | (992,386 | ) | | | (2,772,801 | ) | | | 363,826 | |
| Net increase in net assets resulting from | | | | | | | | | | | | | | | | | | | | | | | |
| operations | | 6,306,640 | | | | 16,730,982 | | | | 2,004,063 | | | | 5,084,153 | | | | 1,458,468 | | | | 3,301,993 | |
| |
| Dividends and Distributions to | | | | | | | | | | | | | | | | | | | | | | | |
| Shareholders from: | | | | | | | | | | | | | | | | | | | | | | | |
| Net investment income: | | | | | | | | | | | | | | | | | | | | | | | |
| Class A | | (26,524,390 | ) | | | (20,605,670 | ) | | | (9,238,273 | ) | | | (5,539,037 | ) | | | (3,179,975 | ) | | | (3,117,557 | ) |
| Class B | | (619,939 | ) | | | (494,733 | ) | | | (63,002 | ) | | | (70,059 | ) | | | (297,700 | ) | | | (443,794 | ) |
| Class C | | (488,756 | ) | | | (249,348 | ) | | | (799,179 | ) | | | (733,331 | ) | | | (194,745 | ) | | | (209,884 | ) |
| | | (27,633,085 | ) | | | (21,349,751 | ) | | | (10,100,454 | ) | | | (6,342,427 | ) | | | (3,672,420 | ) | | | (3,771,235 | ) |
| |
| Capital Share Transactions: | | | | | | | | | | | | | | | | | | | | | | | |
| Proceeds from shares sold: | | | | | | | | | | | | | | | | | | | | | | | |
| Class A | | 129,162,376 | | | | 167,570,325 | | | | 178,321,801 | | | | 119,156,024 | | | | 11,615,685 | | | | 11,000,812 | |
| Class B | | 308,131 | | | | 1,380,980 | | | | 281,065 | | | | 597,273 | | | | 543,649 | | | | 780,564 | |
| Class C | | 2,181,275 | | | | 3,261,988 | | | | 7,249,731 | | | | 7,130,929 | | | | 527,708 | | | | 1,576,137 | |
| |
| Net asset value of shares issued upon | | | | | | | | | | | | | | | | | | | | | | | |
| reinvestment of dividends and distributions: | | | | | | | | | | | | | | | | | | | | | | | |
| Class A | | 12,569,102 | | | | 10,377,867 | | | | 6,634,413 | | | | 3,941,206 | | | | 1,884,760 | | | | 1,923,145 | |
| Class B | | 365,941 | | | | 300,459 | | | | 48,873 | | | | 54,532 | | | | 117,105 | | | | 206,858 | |
| Class C | | 349,774 | | | | 186,252 | | | | 478,816 | | | | 416,628 | | | | 139,342 | | | | 131,125 | |
| |
| Net assets from fund mergers1: | | | | | | | | | | | | | | | | | | | | | | | |
| Class A | | 81,923,316 | | | | 116,026,119 | | | | — | | | | — | | | | — | | | | — | |
| Class B | | 2,926,236 | | | | 11,168,095 | | | | — | | | | — | | | | — | | | | — | |
| Class C | | 3,460,376 | | | | 8,018,844 | | | | — | | | | — | | | | — | | | | — | |
| | | 233,246,527 | | | | 318,290,929 | | | | 193,014,699 | | | | 131,296,592 | | | | 14,828,249 | | | | 15,618,641 | |
| Cost of shares repurchased: | | | | | | | | | | | | | | | | | | | | | | | |
| Class A | | (124,502,775 | ) | | | (86,626,741 | ) | | | (75,895,816 | ) | | | (37,921,560 | ) | | | (15,104,909 | ) | | | (10,375,066 | ) |
| Class B | | (8,015,676 | ) | | | (7,029,177 | ) | | | (910,041 | ) | | | (1,404,656 | ) | | | (4,046,166 | ) | | | (4,410,676 | ) |
| Class C | | (3,772,191 | ) | | | (2,356,085 | ) | | | (6,816,607 | ) | | | (4,371,376 | ) | | | (1,014,423 | ) | | | (1,580,167 | ) |
| | | (136,290,642 | ) | | | (96,012,003 | ) | | | (83,622,464 | ) | | | (43,697,592 | ) | | | (20,165,498 | ) | | | (16,365,909 | ) |
| Increase (decrease) in net assets derived | | | | | | | | | | | | | | | | | | | | | | | |
| from capital share transactions | | 96,955,885 | | | | 222,278,926 | | | | 109,392,235 | | | | 87,599,000 | | | | (5,337,249 | ) | | | (747,268 | ) |
| Net Increase (Decrease) in Net Assets | | 75,629,440 | | | | 217,660,157 | | | | 101,295,844 | | | | 86,340,726 | | | | (7,551,201 | ) | | | (1,216,510 | ) |
| |
| Net Assets: | | | | | | | | | | | | | | | | | | | | | | | |
| Beginning of year | | 694,111,864 | | | | 476,451,707 | | | | 234,942,070 | | | | 148,601,344 | | | | 83,514,272 | | | | 84,730,782 | |
| End of year | $ | 769,741,304 | | | $ | 694,111,864 | | | $ | 336,237,914 | | | $ | 234,942,070 | | | $ | 75,963,071 | | | $ | 83,514,272 | |
| Undistributed (distribution in excess of) | | | | | | | | | | | | | | | | | | | | | | | |
| net investment income | $ | 1,790 | | | $ | (12,071 | ) | | $ | — | | | $ | — | | | $ | (4,102 | ) | | $ | (4,104 | ) |
| |
| 1 See Note 7 in “Notes to Financial Statements.” | | | | | | | | | | | | | | | | | | | | | | | |
| |
| |
| See accompanying notes | | | | | | | | | | | | | | | | | | | | | | | |
39
Financial highlights
Delaware Tax-Free USA Fund Class A
Selected data for each share of the Fund outstanding throughout each period were as follows:
| | Year Ended | |
| | | 8/31/07 | | | 8/31/06 | | | 8/31/05 | | | 8/31/04 | | | 8/31/03 | |
| Net asset value, beginning of period | | $11.570 | | | $11.760 | | | $11.460 | | | $11.170 | | | $11.280 | |
| |
| Income (loss) from investment operations: | | | | | | | | | | | | | | | |
| Net investment income | | 0.466 | | | 0.458 | | | 0.512 | | | 0.538 | | | 0.537 | |
| Net realized and unrealized gain (loss) on investments | | (0.337 | ) | | (0.186 | ) | | 0.300 | | | 0.290 | | | (0.110 | ) |
| Total from investment operations | | 0.129 | | | 0.272 | | | 0.812 | | | 0.828 | | | 0.427 | |
| |
| Less dividends and distributions from: | | | | | | | | | | | | | | | |
| Net investment income | | (0.469 | ) | | (0.462 | ) | | (0.512 | ) | | (0.538 | ) | | (0.537 | ) |
| Total dividends and distributions | | (0.469 | ) | | (0.462 | ) | | (0.512 | ) | | (0.538 | ) | | (0.537 | ) |
| |
| Net asset value, end of period | | $11.230 | | | $11.570 | | | $11.760 | | | $11.460 | | | $11.170 | |
| |
| Total return1 | | 1.08% | | | 2.42% | | | 7.23% | | | 7.54% | | | 3.84% | |
| |
| Ratios and supplemental data: | | | | | | | | | | | | | | | |
| Net assets, end of period (000 omitted) | | $735,584 | | | $656,813 | | | $453,982 | | | $456,192 | | | $460,917 | |
| Ratio of expenses to average net assets | | 0.87% | | | 0.86% | | | 0.86% | | | 0.87% | | | 0.87% | |
| Ratio of expenses to average net assets | | | | | | | | | | | | | | | |
| prior to expense limitation and expenses paid indirectly | | 0.95% | | | 1.00% | | | 0.98% | | | 0.93% | | | 0.97% | |
| Ratio of net investment income to average net assets | | 4.03% | | | 3.97% | | | 4.43% | | | 4.72% | | | 4.74% | |
| Ratio of net investment income to average net assets | | | | | | | | | | | | | | | |
| prior to expense limitation and expenses paid indirectly | | 3.95% | | | 3.83% | | | 4.31% | | | 4.66% | | | 4.64% | |
| Portfolio turnover | | 36% | | | 41% | | | 47% | | | 32% | | | 96% | |
| | | | | | | | | | | | | | | | |
| 1 Total investment return is based on the change in net asset value of a share during the period and assumes reinvestment of dividends and distributions at net asset value and does not reflect the impact of a sales charge. Total investment return reflects waivers and payment of fees by the manager and distributor, as applicable. Performance would have been lower had the expense limitation not been in effect. |
See accompanying notes
40
Delaware Tax-Free USA Fund Class B
Selected data for each share of the Fund outstanding throughout each period were as follows:
| | Year Ended | |
| | | 8/31/07 | | | 8/31/06 | | | 8/31/05 | | | 8/31/04 | | | 8/31/03 | |
| Net asset value, beginning of period | | $11.570 | | | $11.760 | | | $11.460 | | | $11.170 | | | $11.280 | |
| |
| Income (loss) from investment operations: | | | | | | | | | | | | | | | |
| Net investment income | | 0.378 | | | 0.370 | | | 0.423 | | | 0.449 | | | 0.449 | |
| Net realized and unrealized gain (loss) on investments | | (0.337 | ) | | (0.186 | ) | | 0.300 | | | 0.290 | | | (0.110 | ) |
| Total from investment operations | | 0.041 | | | 0.184 | | | 0.723 | | | 0.739 | | | 0.339 | |
| |
| Less dividends and distributions from: | | | | | | | | | | | | | | | |
| Net investment income | | (0.381 | ) | | (0.374 | ) | | (0.423 | ) | | (0.449 | ) | | (0.449 | ) |
| Total dividends and distributions | | (0.381 | ) | | (0.374 | ) | | (0.423 | ) | | (0.449 | ) | | (0.449 | ) |
| |
| Net asset value, end of period | | $11.230 | | | $11.570 | | | $11.760 | | | $11.460 | | | $11.170 | |
| |
| Total return1 | | 0.32% | | | 1.63% | | | 6.42% | | | 6.71% | | | 3.03% | |
| |
| Ratios and supplemental data: | | | | | | | | | | | | | | | |
| Net assets, end of period (000 omitted) | | $17,286 | | | $22,189 | | | $16,507 | | | $22,396 | | | $31,052 | |
| Ratio of expenses to average net assets | | 1.63% | | | 1.63% | | | 1.63% | | | 1.65% | | | 1.65% | |
| Ratio of expenses to average net assets | | | | | | | | | | | | | | | |
| prior to expense limitation and expenses paid indirectly | | 1.71% | | | 1.73% | | | 1.71% | | | 1.71% | | | 1.75% | |
| Ratio of net investment income to average net assets | | 3.27% | | | 3.20% | | | 3.66% | | | 3.94% | | | 3.96% | |
| Ratio of net investment income to average net assets | | | | | | | | | | | | | | | |
| prior to expense limitation and expenses paid indirectly | | 3.19% | | | 3.10% | | | 3.58% | | | 3.88% | | | 3.86% | |
| Portfolio turnover | | 36% | | | 41% | | | 47% | | | 32% | | | 96% | |
| | | | | | | | | | | | | | | | |
| 1 Total investment return is based on the change in net asset value of a share during the period and assumes reinvestment of dividends and distributions at net asset value and does not reflect the impact of a sales charge. Total investment return reflects waivers and payment of fees by the manager. Performance would have been lower had the expense limitation not been in effect. |
See accompanying notes
(continues) 41
Financial highlights
Delaware Tax-Free USA Fund Class C
Selected data for each share of the Fund outstanding throughout each period were as follows:
| | | Year Ended | |
| | | 8/31/07 | | | 8/31/06 | | | 8/31/05 | | | 8/31/04 | | | 8/31/03 | |
| Net asset value, beginning of period | | $11.570 | | | $11.760 | | | $11.460 | | | $11.170 | | | $11.280 | |
| |
| Income (loss) from investment operations: | | | | | | | | | | | | | | | |
| Net investment income | | 0.378 | | | 0.370 | | | 0.423 | | | 0.449 | | | 0.449 | |
| Net realized and unrealized gain (loss) on investments | | (0.337 | ) | | (0.186 | ) | | 0.300 | | | 0.290 | | | (0.110 | ) |
| Total from investment operations | | 0.041 | | | 0.184 | | | 0.723 | | | 0.739 | | | 0.339 | |
| |
| Less dividends and distributions from: | | | | | | | | | | | | | | | |
| Net investment income | | (0.381 | ) | | (0.374 | ) | | (0.423 | ) | | (0.449 | ) | | (0.449 | ) |
| Total dividends and distributions | | (0.381 | ) | | (0.374 | ) | | (0.423 | ) | | (0.449 | ) | | (0.449 | ) |
| |
| Net asset value, end of period | | $11.230 | | | $11.570 | | | $11.760 | | | $11.460 | | | $11.170 | |
| |
| Total return1 | | 0.41% | | | 1.63% | | | 6.42% | | | 6.71% | | | 3.03% | |
| |
| Ratios and supplemental data: | | | | | | | | | | | | | | | |
| Net assets, end of period (000 omitted) | | $16,871 | | | $15,110 | | | $5,963 | | | $5,784 | | | $5,508 | |
| Ratio of expenses to average net assets | | 1.63% | | | 1.63% | | | 1.63% | | | 1.65% | | | 1.65% | |
| Ratio of expenses to average net assets | | | | | | | | | | | | | | | |
| prior to expense limitation and expenses paid indirectly | | 1.71% | | | 1.73% | | | 1.71% | | | 1.71% | | | 1.75% | |
| Ratio of net investment income to average net assets | | 3.27% | | | 3.20% | | | 3.66% | | | 3.94% | | | 3.96% | |
| Ratio of net investment income to average net assets | | | | | | | | | | | | | | | |
| prior to expense limitation and expenses paid indirectly | | 3.19% | | | 3.10% | | | 3.58% | | | 3.88% | | | 3.86% | |
| Portfolio turnover | | 36% | | | 41% | | | 47% | | | 32% | | | 96% | |
| | | | | | | | | | | | | | | | |
| 1 Total investment return is based on the change in net asset value of a share during the period and assumes reinvestment of dividends and distributions at net asset value and does not reflect the impact of a sales charge. Total investment return reflects waivers and payment of fees by the manager. Performance would have been lower had the expense limitation not been in effect. |
See accompanying notes
42
Delaware Tax-Free USA Intermediate Fund Class A
Selected data for each share of the Fund outstanding throughout each period were as follows:
| | | Year Ended | |
| | | 8/31/07 | | | 8/31/06 | | | 8/31/05 | | | 8/31/04 | | | 8/31/03 | |
| Net asset value, beginning of period | | $11.470 | | | $11.610 | | | $11.390 | | | $11.010 | | | $11.020 | |
| |
| Income (loss) from investment operations: | | | | | | | | | | | | | | | |
| Net investment income | | 0.414 | | | 0.408 | | | 0.410 | | | 0.419 | | | 0.435 | |
| Net realized and unrealized gain (loss) on investments | | (0.260 | ) | | (0.140 | ) | | 0.220 | | | 0.380 | | | (0.010 | ) |
| Total from investment operations | | 0.154 | | | 0.268 | | | 0.630 | | | 0.799 | | | 0.425 | |
| |
| Less dividends and distributions from: | | | | | | | | | | | | | | | |
| Net investment income | | (0.414 | ) | | (0.408 | ) | | (0.410 | ) | | (0.419 | ) | | (0.435 | ) |
| Total dividends and distributions | | (0.414 | ) | | (0.408 | ) | | (0.410 | ) | | (0.419 | ) | | (0.435 | ) |
| |
| Net asset value, end of period | | $11.210 | | | $11.470 | | | $11.610 | | | $11.390 | | | $11.010 | |
| |
| Total return1 | | 1.34% | | | 2.38% | | | 5.63% | | | 7.36% | | | 3.89% | |
| |
| Ratios and supplemental data: | | | | | | | | | | | | | | | |
| Net assets, end of period (000 omitted) | | $306,215 | | | $204,525 | | | $120,273 | | | $77,448 | | | $51,479 | |
| Ratio of expenses to average net assets | | 0.76% | | | 0.75% | | | 0.79% | | | 0.80% | 2 | | 0.80% | |
| Ratio of expenses to average net assets | | | | | | | | | | | | | | | |
| prior to expense limitation and expenses paid indirectly | | 1.03% | | | 1.07% | | | 1.11% | | | 1.09% | | | 1.15% | |
| Ratio of net investment income to average net assets | | 3.60% | | | 3.56% | | | 3.55% | | | 3.70% | | | 3.85% | |
| Ratio of net investment income to average net assets | | | | | | | | | | | | | | | |
| prior to expense limitation and expenses paid indirectly | | 3.33% | | | 3.24% | | | 3.23% | | | 3.41% | | | 3.50% | |
| Portfolio turnover | | 40% | | | 37% | | | 18% | | | 27% | | | 130% | |
| |
| 1 Total investment return is based on the change in net asset value of a share during the period and assumes reinvestment of dividends and distributions at net asset value and does not reflect the impact of a sales charge. Total investment return reflects waivers and payment of fees by the manager and distributor. Performance would have been lower had the expense limitation not been in effect. |
| 2 Ratio for the year ended August 31, 2004, including fees paid indirectly in accordance with Securities and Exchange Commission rules was 0.82%. |
See accompanying notes
(continues) 43
Financial highlights
Delaware Tax-Free USA Intermediate Fund Class B
Selected data for each share of the Fund outstanding throughout each period were as follows:
| | | Year Ended | |
| | | 8/31/07 | | | 8/31/06 | | | 8/31/05 | | | 8/31/04 | | | 8/31/03 | |
| Net asset value, beginning of period | | $11.460 | | | $11.610 | | | $11.380 | | | $11.010 | | | $11.020 | |
| |
| Income (loss) from investment operations: | | | | | | | | | | | | | | | |
| Net investment income | | 0.317 | | | 0.311 | | | 0.313 | | | 0.323 | | | 0.340 | |
| Net realized and unrealized gain (loss) on investments | | (0.260 | ) | | (0.150 | ) | | 0.230 | | | 0.370 | | | (0.010 | ) |
| Total from investment operations | | 0.057 | | | 0.161 | | | 0.543 | | | 0.693 | | | 0.330 | |
| |
| Less dividends and distributions from: | | | | | | | | | | | | | | | |
| Net investment income | | (0.317 | ) | | (0.311 | ) | | (0.313 | ) | | (0.323 | ) | | (0.340 | ) |
| Total dividends and distributions | | (0.317 | ) | | (0.311 | ) | | (0.313 | ) | | (0.323 | ) | | (0.340 | ) |
| |
| Net asset value, end of period | | $11.200 | | | $11.460 | | | $11.610 | | | $11.380 | | | $11.010 | |
| |
| Total return1 | | 0.48% | | | 1.43% | | | 4.83% | | | 6.36% | | | 3.02% | |
| |
| Ratios and supplemental data: | | | | | | | | | | | | | | | |
| Net assets, end of period (000 omitted) | | $1,786 | | | $2,413 | | | $3,203 | | | $3,743 | | | $4,538 | |
| Ratio of expenses to average net assets | | 1.61% | | | 1.60% | | | 1.64% | | | 1.65% | 2 | | 1.65% | |
| Ratio of expenses to average net assets | | | | | | | | | | | | | | | |
| prior to expense limitation and expenses paid indirectly | | 1.73% | | | 1.77% | | | 1.81% | | | 1.79% | | | 1.87% | |
| Ratio of net investment income to average net assets | | 2.75% | | | 2.71% | | | 2.70% | | | 2.85% | | | 3.00% | |
| Ratio of net investment income to average net assets | | | | | | | | | | | | | | | |
| prior to expense limitation and expenses paid indirectly | | 2.63% | | | 2.54% | | | 2.53% | | | 2.71% | | | 2.78% | |
| Portfolio turnover | | 40% | | | 37% | | | 18% | | | 27% | | | 130% | |
| |
| 1 Total investment return is based on the change in net asset value of a share during the period and assumes reinvestment of dividends and distributions at net asset value and does not reflect the impact of a sales charge. Total investment return reflects waivers and payment of fees by the manager. Performance would have been lower had the expense limitation not been in effect. |
| 2 Ratio for the year ended August 31, 2004, including fees paid indirectly in accordance with Securities and Exchange Commission rules was 1.67%. |
See accompanying notes
44
Delaware Tax-Free USA Intermediate Fund Class C
Selected data for each share of the Fund outstanding throughout each period were as follows:
| | �� | Year Ended |
| | | 8/31/07 | | | 8/31/06 | | | 8/31/05 | | | 8/31/04 | | | 8/31/03 | |
| Net asset value, beginning of period | | $11.470 | | | $11.610 | | | $11.390 | | | $11.010 | | | $11.020 | |
| |
| Income (loss) from investment operations: | | | | | | | | | | | | | | | |
| Net investment income | | 0.317 | | | 0.311 | | | 0.313 | | | 0.323 | | | 0.340 | |
| Net realized and unrealized gain (loss) on investments | | (0.270 | ) | | (0.140 | ) | | 0.220 | | | 0.380 | | | (0.010 | ) |
| Total from investment operations | | 0.047 | | | 0.171 | | | 0.533 | | | 0.703 | | | 0.330 | |
| |
| Less dividends and distributions from: | | | | | | | | | | | | | | | |
| Net investment income | | (0.317 | ) | | (0.311 | ) | | (0.313 | ) | | (0.323 | ) | | (0.340 | ) |
| Total dividends and distributions | | (0.317 | ) | | (0.311 | ) | | (0.313 | ) | | (0.323 | ) | | (0.340 | ) |
| |
| Net asset value, end of period | | $11.200 | | | $11.470 | | | $11.610 | | | $11.390 | | | $11.010 | |
| |
| Total return1 | | 0.39% | | | 1.52% | | | 4.74% | | | 6.45% | | | 3.02% | |
| |
| Ratios and supplemental data: | | | | | | | | | | | | | | | |
| Net assets, end of period (000 omitted) | | $28,237 | | | $28,004 | | | $25,125 | | | $19,201 | | | $10,542 | |
| Ratio of expenses to average net assets | | 1.61% | | | 1.60% | | | 1.64% | | | 1.65% | 2 | | 1.65% | |
| Ratio of expenses to average net assets | | | | | | | | | | | | | | | |
| prior to expense limitation and expenses paid indirectly | | 1.73% | | | 1.77% | | | 1.81% | | | 1.79% | | | 1.87% | |
| Ratio of net investment income to average net assets | | 2.75% | | | 2.71% | | | 2.70% | | | 2.85% | | | 3.00% | |
| Ratio of net investment income to average net assets | | | | | | | | | | | | | | | |
| prior to expense limitation and expenses paid indirectly | | 2.63% | | | 2.54% | | | 2.53% | | | 2.71% | | | 2.78% | |
| Portfolio turnover | | 40% | | | 37% | | | 18% | | | 27% | | | 130% | |
| | | | | | | | | | | | | | | | |
| 1 Total investment return is based on the change in net asset value of a share during the period and assumes reinvestment of dividends and distributions at net asset value and does not reflect the impact of a sales charge. Total investment return reflects waivers and payment of fees by the manager. Performance would have been lower had the expense limitation not been in effect. |
| 2 Ratio for the year ended August 31, 2004, including fees paid indirectly in accordance with Securities and Exchange Commission rules was 1.67%. |
See accompanying notes
(continues) 45
Financial highlights
Delaware National High-Yield Municipal Bond Fund Class A
Selected data for each share of the Fund outstanding throughout each period were as follows:
| | | Year Ended |
| | | 8/31/07 | | | 8/31/06 | | | 8/31/05 | | | 8/31/04 | | | 8/31/03 | |
| Net asset value, beginning of period | | $10.320 | | | $10.380 | | | $10.010 | | | $9.730 | | | $9.950 | |
| |
| Income (loss) from investment operations: | | | | | | | | | | | | | | | |
| Net investment income | | 0.482 | | | 0.477 | | | 0.503 | | | 0.496 | | | 0.522 | |
| Net realized and unrealized gain (loss) on investments | | (0.290 | ) | | (0.060 | ) | | 0.371 | | | 0.280 | | | (0.219 | ) |
| Total from investment operations | | 0.192 | | | 0.417 | | | 0.874 | | | 0.776 | | | 0.303 | |
| |
| Less dividends and distributions from: | | | | | | | | | | | | | | | |
| Net investment income | | (0.482 | ) | | (0.477 | ) | | (0.504 | ) | | (0.496 | ) | | (0.523 | ) |
| Total dividends and distributions | | (0.482 | ) | | (0.477 | ) | | (0.504 | ) | | (0.496 | ) | | (0.523 | ) |
| |
| Net asset value, end of period | | $10.030 | | | $10.320 | | | $10.380 | | | $10.010 | | | $9.730 | |
| |
| Total return1 | | 1.82% | | | 4.15% | | | 8.93% | | | 8.13% | | | 3.13% | |
| |
| Ratios and supplemental data: | | | | | | | | | | | | | | | |
| Net assets, end of period (000 omitted) | | $65,143 | | | $68,663 | | | $66,451 | | | $56,698 | | | $59,829 | |
| Ratio of expenses to average net assets | | 0.91% | | | 0.90% | | | 0.93% | | | 1.00% | | | 0.99% | |
| Ratio of expenses to average net assets | | | | | | | | | | | | | | | |
| prior to expense limitation and expenses paid indirectly | | 1.03% | | | 1.02% | | | 1.01% | | | 1.02% | | | 1.05% | |
| Ratio of net investment income to average net assets | | 4.66% | | | 4.66% | | | 4.92% | | | 5.00% | | | 5.30% | |
| Ratio of net investment income to average net assets | | | | | | | | | | | | | | | |
| prior to expense limitation and expenses paid indirectly | | 4.54% | | | 4.54% | | | 4.84% | | | 4.98% | | | 5.24% | |
| Portfolio turnover | | 37% | | | 73% | | | 36% | | | 46% | | | 64% | |
| | | | | | | | | | | | | | | | |
| 1 Total investment return is based on the change in net asset value of a share during the period and assumes reinvestment of dividends and distributions at net asset value and does not reflect the impact of a sales charge. Total investment return reflects waivers and payment of fees by the manager. Performance would have been lower had the expense limitation not been in effect. |
See accompanying notes
46
Delaware National High-Yield Municipal Bond Fund Class B
Selected data for each share of the Fund outstanding throughout each period were as follows:
| | | Year Ended |
| | | 8/31/07 | | | 8/31/06 | | | 8/31/05 | | | 8/31/04 | | | 8/31/03 | |
| Net asset value, beginning of period | | $10.350 | | | $10.400 | | | $10.030 | | | $9.760 | | | $9.980 | |
| |
| Income (loss) from investment operations: | | | | | | | | | | | | | | | |
| Net investment income | | 0.404 | | | 0.400 | | | 0.426 | | | 0.421 | | | 0.448 | |
| Net realized and unrealized gain (loss) on investments | | (0.300 | ) | | (0.050 | ) | | 0.371 | | | 0.270 | | | (0.219 | ) |
| Total from investment operations | | 0.104 | | | 0.350 | | | 0.797 | | | 0.691 | | | 0.229 | |
| |
| Less dividends and distributions from: | | | | | | | | | | | | | | | |
| Net investment income | | (0.404 | ) | | (0.400 | ) | | (0.427 | ) | | (0.421 | ) | | (0.449 | ) |
| Total dividends and distributions | | (0.404 | ) | | (0.400 | ) | | (0.427 | ) | | (0.421 | ) | | (0.449 | ) |
| |
| Net asset value, end of period | | $10.050 | | | $10.350 | | | $10.400 | | | $10.030 | | | $9.760 | |
| |
| Total return1 | | 0.96% | | | 3.47% | | | 8.10% | | | 7.20% | | | 2.36% | |
| |
| Ratios and supplemental data: | | | | | | | | | | | | | | | |
| Net assets, end of period (000 omitted) | | $5,972 | | | $9,519 | | | $13,046 | | | $14,534 | | | $16,499 | |
| Ratio of expenses to average net assets | | 1.66% | | | 1.65% | | | 1.68% | | | 1.75% | | | 1.74% | |
| Ratio of expenses to average net assets | | | | | | | | | | | | | | | |
| prior to expense limitation and expenses paid indirectly | | 1.78% | | | 1.77% | | | 1.76% | | | 1.77% | | | 1.80% | |
| Ratio of net investment income to average net assets | | 3.91% | | | 3.91% | | | 4.17% | | | 4.25% | | | 4.55% | |
| Ratio of net investment income to average net assets | | | | | | | | | | | | | | | |
| prior to expense limitation and expenses paid indirectly | | 3.79% | | | 3.79% | | | 4.09% | | | 4.23% | | | 4.49% | |
| Portfolio turnover | | 37% | | | 73% | | | 36% | | | 46% | | | 64% | |
| | | | | | | | | | | | | | | | |
| 1 Total investment return is based on the change in net asset value of a share during the period and assumes reinvestment of dividends and distributions at net asset value and does not reflect the impact of a sales charge. Total investment return reflects waivers and payment of fees by the manager. Performance would have been lower had the expense limitation not been in effect. |
See accompanying notes
(continues) 47
Financial highlights
Delaware National High-Yield Municipal Bond Fund Class C
Selected data for each share of the Fund outstanding throughout each period were as follows:
| | | Year Ended |
| | | 8/31/07 | | | 8/31/06 | | | 8/31/05 | | | 8/31/04 | | | 8/31/03 | |
| Net asset value, beginning of period | | $10.360 | | | $10.420 | | | $10.040 | | | $9.770 | | | $9.990 | |
| |
| Income (loss) from investment operations: | | | | | | | | | | | | | | | |
| Net investment income | | 0.404 | | | 0.400 | | | 0.426 | | | 0.421 | | | 0.448 | |
| Net realized and unrealized gain (loss) on investments | | (0.290 | ) | | (0.060 | ) | | 0.381 | | | 0.270 | | | (0.219 | ) |
| Total from investment operations | | 0.114 | | | 0.340 | | | 0.807 | | | 0.691 | | | 0.229 | |
| |
| Less dividends and distributions from: | | | | | | | | | | | | | | | |
| Net investment income | | (0.404 | ) | | (0.400 | ) | | (0.427 | ) | | (0.421 | ) | | (0.449 | ) |
| Total dividends and distributions | | (0.404 | ) | | (0.400 | ) | | (0.427 | ) | | (0.421 | ) | | (0.449 | ) |
| |
| Net asset value, end of period | | $10.070 | | | $10.360 | | | $10.420 | | | $10.040 | | | $9.770 | |
| |
| Total return1 | | 1.06% | | | 3.36% | | | 8.19% | | | 7.19% | | | 2.35% | |
| |
| Ratios and supplemental data: | | | | | | | | | | | | | | | |
| Net assets, end of period (000 omitted) | | $4,848 | | | $5,332 | | | $5,234 | | | $4,798 | | | $5,318 | |
| Ratio of expenses to average net assets | | 1.66% | | | 1.65% | | | 1.68% | | | 1.75% | | | 1.74% | |
| Ratio of expenses to average net assets | | | | | | | | | | | | | | | |
| prior to expense limitation and expenses paid indirectly | | 1.78% | | | 1.77% | | | 1.76% | | | 1.77% | | | 1.80% | |
| Ratio of net investment income to average net assets | | 3.91% | | | 3.91% | | | 4.17% | | | 4.25% | | | 4.55% | |
| Ratio of net investment income to average net assets | | | | | | | | | | | | | | | |
| prior to expense limitation and expenses paid indirectly | | 3.79% | | | 3.79% | | | 4.09% | | | 4.23% | | | 4.49% | |
| Portfolio turnover | | 37% | | | 73% | | | 36% | | | 46% | | | 64% | |
| | | | | | | | | | | | | | | | |
| 1 Total investment return is based on the change in net asset value of a share during the period and assumes reinvestment of dividends and distributions at net asset value and does not reflect the impact of a sales charge. Total investment return reflects waivers and payment of fees by the manager. Performance would have been lower had the expense limitation not been in effect. |
See accompanying notes
48
Notes to financial statements
Delaware National Tax-Free Funds
August 31, 2007
Delaware Group Tax-Free Fund is organized as a Delaware statutory trust and offers two series: Delaware Tax-Free USA Fund and Delaware Tax-Free USA Intermediate Fund. Voyageur Mutual Funds is organized as a Delaware statutory trust and offers five series: Delaware Tax-Free California Fund, Delaware Tax-Free Idaho Fund, Delaware Minnesota High-Yield Municipal Bond Fund, Delaware National High-Yield Municipal Bond Fund and Delaware Tax-Free New York Fund. Delaware Group Tax-Free Fund and Voyageur Mutual Funds are individually referred to as a “Trust” and collectively as the “Trusts”. These financial statements and the related notes pertain to Delaware Tax-Free USA Fund, Delaware Tax-Free USA Intermediate Fund and Delaware National High-Yield Municipal Bond Fund (each referred to as a “Fund” or, collectively, as the “Funds”). The above Trusts are open-end investment companies. The Funds are considered non-diversified under the Investment Company Act of 1940, as amended. The Funds offer Class A, Class B, and Class C shares. Class A shares are sold with a front-end sales charge of up to 4.50% for Delaware Tax-Free USA Fund and Delaware National High-Yield Municipal Bond Fund, and up to 2.75% for Delaware Tax-Free USA Intermediate Fund. Class A share purchases of $1,000,000 or more will incur a contingent deferred sales charge (CDSC) of 1% if redeemed during the first year and 0.50% during the second year for Delaware Tax-Free USA Fund and Delaware National High-Yield Municipal Bond Fund; and of 0.75% for Delaware Tax-Free USA Intermediate Fund if redeemed within the first year, provided that Delaware Distributors, L.P. (DDLP) paid a financial advisor a commission on the purchase of those shares. Class B shares of the Delaware Tax-Free USA Fund and Delaware National High-Yield Municipal Bond Fund are sold with a CDSC that declines from 4% to zero depending upon the period of time the shares are held and will automatically convert to Class A shares on a quarterly basis approximately eight years after purchase. Class B shares of Delaware Tax-Free USA Intermediate Fund are sold with a CDSC that declines from 2% to zero depending upon the period of time the shares are held and will automatically convert to Class A shares on a quarterly basis approximately five years after purchase. Class C shares are sold with a CDSC of 1%, if redeemed during the first twelve months. Effective at the close of business on May 31, 2007, the Funds no longer accept new purchases of Class B shares other than dividend reinvestments and certain permitted exchanges.
The investment objective of Delaware Tax-Free USA Fund and Delaware Tax-Free USA Intermediate Fund is to seek as high a level of current interest income exempt from federal income tax as is available from municipal obligations and as is consistent with prudent investment management and preservation of capital.
The investment objective of Delaware National High-Yield Municipal Bond Fund is to seek a high level of current income exempt from federal income tax primarily through investment in medium- and lower-grade municipal obligations.
1. Significant Accounting Policies
The following accounting policies are in accordance with U.S. generally accepted accounting principles and are consistently followed by the Funds.
Security Valuation — Long-term debt securities are valued by an independent pricing service and such prices are believed to reflect the fair value of such securities. Short-term debt securities having less than 60 days to maturity are valued at amortized cost, which approximates market value. Swap contracts and other securities and assets for which market quotations are not readily available are valued at fair value as determined in good faith under the direction of each Fund’s Board of Trustees. In determining whether market quotations are readily available or fair valuation will be used, various factors will be taken into consideration, such as market closures, or with respect to foreign securities, aftermarket trading or significant events after local market trading (e.g., government actions or pronouncements, trading volume or volatility on markets, exchanges among dealers, or news events).
In September 2006, the Financial Accounting Standards Board (FASB) issued FASB Statement No. 157 “Fair Value Measurements” (Statement 157). Statement 157 establishes a framework for measuring fair value in generally accepted accounting principles, clarifies the definition of fair value within that framework, and expands disclosures about the use of fair value measurements. Statement 157 is intended to increase consistency and comparability among fair value estimates used in financial reporting. Statement 157 is effective for fiscal years beginning after November 15, 2007. Management does not expect the adoption of Statement 157 to have an impact on the amounts reported in the financial statements.
Federal Income Taxes — Each Fund intends to continue to qualify for federal income tax purposes as a regulated investment company and make the requisite distributions to shareholders. Accordingly, no provision for federal income taxes has been made in the financial statements.
On July 13, 2006, the FASB released FASB Interpretation No. 48 “Accounting for Uncertainty in Income Taxes” (FIN 48). FIN 48 provides guidance for how uncertain tax positions should be recognized, measured, presented, and disclosed in the financial statements. FIN 48 requires the evaluation of tax positions taken or expected to be taken in the course of preparing the Funds’ tax returns to determine whether the tax positions are “more-likely-than-not” of being sustained by the applicable tax authority. Tax positions not deemed to meet the more-likely-than-not threshold would be recorded as a tax benefit or expense in the current year. Adoption of FIN 48 is required for fiscal years beginning after December 15, 2006 and is to be applied to all open tax years as of the effective date. Securities and Exchange Commission guidance allows implementing FIN 48 in the Funds’ net asset value calculations as late as the Funds’ last net asset value calculation in the first required financial statement reporting period. As a result, the Funds will incorporate FIN 48 in their semiannual report on February 29, 2008. Although the Funds’ tax positions are currently being evaluated, management does not expect the adoption of FIN 48 to have a material impact on the Funds’ financial statements.
Class Accounting — Investment income and common expenses are allocated to the various classes of each Fund on the basis of “settled shares” of each class in relation to the net assets of that Fund. Realized and unrealized gain (loss) on investments are allocated to the various classes of each Fund on the basis of daily net assets of each class. Distribution expenses relating to a specific class are charged directly to that class.
Use of Estimates — The preparation of financial statements in conformity with U.S. generally accepted accounting principles requires management to make estimates and assumptions that affect the reported amounts of assets and liabilities at the date of the financial statements and the reported amounts of revenues and expenses during the reporting period. Actual results could differ from those estimates.
(continues) 49
Notes to financial statements
Delaware National Tax-Free Funds
1. Significant Accounting Policies (continued)
Other — Expenses directly attributable to a Fund are charged directly to that Fund. Other expenses common to various funds within the Delaware Investments® Family of Funds are generally allocated amongst such funds on the basis of average net assets. Management fees and some other expenses are paid monthly. Security transactions are recorded on the date the securities are purchased or sold (trade date) for financial reporting purposes. Costs used in calculating realized gains and losses on the sale of investment securities are those of the specific securities sold. Interest income is recorded on the accrual basis. Discounts and premiums are amortized to interest income over the lives of the respective securities. Each Fund declares dividends daily from net investment income and pays such dividends monthly and declares and pays distributions from net realized gain on investments, if any, annually.
The Funds receive earnings credits from their custodian when positive cash balances are maintained, which are used to offset custody fees. The expense paid under this arrangement is included in custodian fees on the Statements of Operations with the corresponding expense offset shown as “expense paid indirectly”.
2. Investment Management, Administration Agreements and Other Transactions with Affiliates
In accordance with the terms of its respective investment management agreement, each Fund pays Delaware Management Company (DMC), a series of Delaware Management Business Trust and the investment manager, an annual fee based on each Fund’s average daily net assets as follows:
| | Delaware Tax-Free | | Delaware Tax-Free | | Delaware National High-Yield |
| | USA Fund | | USA Intermediate Fund | | Municipal Bond Fund |
| On the first $500 million | 0.550% | | 0.500% | | 0.550% |
| On the next $500 million | 0.500% | | 0.475% | | 0.500% |
| On the next $1.5 billion | 0.450% | | 0.450% | | 0.450% |
| In excess of $2.5 billion | 0.425% | | 0.425% | | 0.425% |
DMC has contractually agreed to waive that portion, if any, of its management fee and reimburse each Fund to the extent necessary to ensure that annual operating expenses, exclusive of taxes, interest, brokerage fees, 12b-1 plan expenses, certain insurance costs and non-routine expenses or costs including, but not limited to, those relating to reorganizations, litigation, certain Trustees retirement plan expenses, conducting shareholder meetings, and liquidations, do not exceed specified percentages of average daily net assets as shown below:
| | Delaware Tax-Free | | Delaware Tax-Free | | Delaware National High-Yield |
| | USA Fund | | USA Intermediate Fund | | Municipal Bond Fund |
| Operating expense limitation as a | | | | | | | | | | | |
| percentage of average daily | | | | | | | | | | | |
| net assets (per annum) | | 0.62% | | | | 0.60% | | | | 0.65% | |
| Expiration date | | 2/15/07 | | | | 2/15/07 | | | | 2/15/07 | |
| |
| Effective February 16, 2007, | | | | | | | | | | | |
| operating expense limitation | | | | | | | | | | | |
| as a percentage of average | | | | | | | | | | | |
| daily net assets (per annum) | | 0.61% | | | | 0.60% | | | | 0.65% | |
| Expiration date | | 8/31/08 | | | | 12/31/07 | | | | 12/31/07 | |
Delaware Service Company, Inc. (DSC), an affiliate of DMC, provides accounting, administration, dividend disbursing and transfer agent services. Each Fund pays DSC a monthly fee computed at the annual rate of 0.04% of such Fund’s average daily net assets for accounting and administration services. Each Fund pays DSC a monthly fee based on the number of shareholder accounts for dividend disbursing and transfer agent services.
Pursuant to a distribution agreement and distribution plan, each Fund pays DDLP, the distributor and an affiliate of DMC, an annual distribution and service fee not to exceed 0.30% of the average daily net assets of the Class A shares for Delaware Tax-Free USA Intermediate Fund, 0.25% of the average daily net assets of the Class A shares for the Delaware National High-Yield Municipal Bond Fund and 1.00% of the average daily net assets of the Class B and C shares for all Funds. The Board of Trustees has adopted a formula for calculating 12b-1 plan fees for Delaware Tax-Free USA Fund’s Class A shares that went into effect on June 1, 1992. The total 12b-1 fees to be paid by Class A shareholders of the Fund will be the sum of 0.10% of the average daily net assets representing shares that were acquired prior to June 1, 1992 and 0.30% of the average daily net assets representing shares that were acquired on or after June 1, 1992. Effective April 21, 2006, the maximum amount of the Class A 12b-1 fees was reduced to 0.25% and the total 12b-1 fees to be paid to Class A shareholders of the Fund will be the sum of 0.10% of the average daily net assets representing shares that were acquired prior to June 1, 1992 and 0.25% of the average daily net assets representing shares that were acquired on or after June 1, 1992. All Class A shareholders will bear 12b-1 fees at the same rate, the blended rate based upon the allocation of the rates described above. DDLP has contracted to waive distribution and service fees through December 31, 2007 in order to prevent distribution and service fees of Class A from exceeding 0.15% of the average daily net assets for the Delaware Tax-Free USA Intermediate Fund.
50
2. Investment Management, Administration Agreements and Other Transactions with Affiliates (continued)
At August 31, 2007, the Funds had liabilities payable to affiliates as follows:
| | Delaware Tax-Free | | Delaware Tax-Free | | Delaware National High-Yield |
| | USA Fund | | USA Intermediate Fund | | Municipal Bond Fund |
| Investment management fees | | | | | | | | | | | |
| payable to DMC | | $326,906 | | | | $113,659 | | | | $35,781 | |
| Dividend disbursing, transfer agent, | | | | | | | | | | | |
| accounting and administration fees | | | | | | | | | | | |
| and other expenses payable to DSC | | 65,700 | | | | 41,670 | | | | 7,128 | |
| Distribution fees payable to DDLP | | 184,869 | | | | 64,757 | | | | 23,217 | |
| Other expenses payable to DMC | | | | | | | | | | | |
| and affiliates* | | 62,806 | | | | 11,757 | | | | 6,232 | |
*DMC, as part of its administrative services, pays operating expenses on behalf of each Fund and is reimbursed on a periodic basis. Such expenses include items such as printing of shareholder reports, fees for audit, legal and tax services, registration fees and Trustees’ fees.
As provided in the investment management agreement, each Fund bears the cost of certain legal and tax services, including internal legal and tax services provided to each Fund by DMC and/or its affiliates’ employees. For the year ended August 31, 2007, each Fund was charged for internal legal and tax services provided by DMC and/or its affiliates’ employees as follows:
| | Delaware Tax-Free | | Delaware Tax-Free | | Delaware National High-Yield |
| | USA Fund | | USA Intermediate Fund | | Municipal Bond Fund |
| | $32,749 | | $13,667 | | $3,820 |
For the year ended August 31, 2007, DDLP earned commissions on sales of Class A shares for each Fund as follows:
| | Delaware Tax-Free | | Delaware Tax-Free | | Delaware National High-Yield |
| | USA Fund | | USA Intermediate Fund | | Municipal Bond Fund |
| | $23,251 | | $11,001 | | $9,925 |
For the year ended August 31, 2007, DDLP received gross CDSC commissions on redemption of each Fund’s Class A, Class B and Class C shares, respectively. These commissions were entirely used to offset up-front commissions previously paid by DDLP to broker-dealers on sales of those shares. The amounts received were as follows:
| | | Delaware Tax-Free | | Delaware Tax-Free | | Delaware National High-Yield |
| | | USA Fund | | USA Intermediate Fund | | Municipal Bond Fund |
| Class A | | | $ 628 | | | | $ 40 | | | | $ 3 | |
| Class B | | | 26,913 | | | | 1,129 | | | | 7,323 | |
| Class C | | | — | | | | 2,395 | | | | 120 | |
Trustees’ fees and benefits include expenses accrued by the Funds for each Trustee’s retainer, per meeting fees and retirement benefits. Independent Trustees with over five years of uninterrupted service were eligible to participate in a retirement plan that provides for the payment of benefits upon retirement. The amount of the retirement benefit was determined based on factors set forth in the plan, including the number of years of service. On November 16, 2006, the Board of Trustees of the Funds unanimously voted to terminate the retirement plan. Payments equal to the net present value of the earned benefits were made in 2007 to those independent Trustees so entitled. The retirement benefit payouts were $86,561, $29,605, and $10,432 for the Delaware Tax-Free USA Fund, Delaware Tax-Free USA Intermediate Fund and Delaware National High-Yield Municipal Bond Fund, respectively. Certain officers of DMC, DSC and DDLP are officers and/or Trustees of the Trust. These officers and Trustees are paid no compensation by the Funds.
3. Investments
For the year ended August 31, 2007, the Funds made purchases and sales of investment securities other than short-term investments as follows:
| | | Delaware Tax-Free | | Delaware Tax-Free | | Delaware National High-Yield |
| | | USA Fund | | USA Intermediate Fund | | Municipal Bond Fund |
| Purchases | | | $254,380,128 | | | | $205,234,352 | | | | $29,116,751 | |
| Sales | | | 244,831,264 | | | | 108,615,655 | | | | 35,120,121 | |
(continues) 51
Notes to financial statements
Delaware National Tax-Free Funds
3. Investments (continued)
At August 31, 2007, the cost of investments and unrealized appreciation (depreciation) for federal income tax purposes for each Fund were as follows:
| | Delaware Tax-Free | | Delaware Tax-Free | | Delaware National High-Yield |
| | USA Fund | | USA Intermediate Fund | | Municipal Bond Fund |
| Cost of Investments | $ | 746,879,382 | | | $ | 336,052,178 | | | $ | 74,307,203 | |
| Aggregate unrealized appreciation | $ | 24,182,336 | | | $ | 2,510,882 | | | $ | 2,687,467 | |
| Aggregate unrealized depreciation | | (9,427,600 | ) | | | (4,046,654 | ) | | | (1,159,589 | ) |
| Net unrealized appreciation (depreciation) | $ | 14,754,736 | | | $ | (1,535,772 | ) | | $ | 1,527,878 | |
4. Dividend and Distribution Information
Income and long-term capital gain distributions are determined in accordance with federal income tax regulations, which may differ from U.S. generally accepted accounting principles. Additionally, net short-term gains on sales of investment securities are treated as ordinary income for federal income tax purposes. The tax character of dividends and distributions paid during the years ended August 31, 2007 and 2006 was as follows:
| | Delaware Tax-Free | | Delaware Tax-Free | | Delaware National High-Yield |
| | USA Fund | | USA Intermediate Fund | | Municipal Bond Fund |
| Year Ended 8/31/07 | | | | | | | | | | | |
| Tax-exempt income | $ | 27,624,675 | | | $ | 9,979,962 | | | $ | 3,672,422 | |
| Ordinary income | | 8,410 | | | | 120,492 | | | | — | |
| Total | $ | 27,633,085 | | | $ | 10,100,454 | | | $ | 3,672,422 | |
| | |
| Year Ended 8/31/06 | | | | | | | | | | | |
| Tax-exempt income | $ | 21,338,078 | | | $ | 6,301,523 | | | $ | 3,771,235 | |
| Ordinary income | | 11,673 | | | | 40,904 | | | | — | |
| Total | $ | 21,349,751 | | | $ | 6,342,427 | | | $ | 3,771,235 | |
5. Components of Net Assets on a Tax Basis
As of August 31, 2007, the components of net assets on a tax basis were as follows:
| | Delaware Tax-Free | | Delaware Tax-Free | | Delaware National High-Yield |
| | USA Fund | | USA Intermediate Fund | | Municipal Bond Fund |
| Shares of beneficial interest | $ | 760,744,467 | | | $ | 340,230,438 | | | $ | 80,578,526 | |
| Distributions payable | | (781,087 | ) | | | (291,486 | ) | | | (87,256 | ) |
| Undistributed tax-exempt income | | 782,877 | | | | 291,486 | | | | 83,154 | |
| Post-October losses | | (865,156 | ) | | | (2,082,105 | ) | | | — | |
| Capital loss carryforwards | | (4,894,533 | ) | | | (374,647 | ) | | | (6,139,231 | ) |
| Unrealized appreciation | | | | | | | | | | | |
| (depreciation) of investments | | 14,754,736 | | | | (1,535,772 | ) | | | 1,527,878 | |
| Net assets | $ | 769,741,304 | | | $ | 336,237,914 | | | $ | 75,963,071 | |
The differences between book basis and tax basis components of net assets are primarily attributable to tax deferral of losses on wash sales and tax treatment of market discount on debt instruments.
Post-October losses represent losses realized on investment transactions from November 1, 2006 through August 31, 2007 that, in accordance with federal income tax regulations, the Funds have elected to defer and treat as having arisen in the following fiscal year.
For financial reporting purposes, capital accounts are adjusted to reflect the tax character of permanent book/tax differences. Reclassifications are primarily due to tax treatment of market discount on certain debt instruments. Results of operations and net assets were not affected by these reclassifications. For the year ended August 31, 2007, the Funds recorded the following reclassifications:
| | | Delaware Tax-Free |
| | | USA Fund |
| Undistributed net investment income | | $ | 141,208 | |
| Accumulated net realized gain (loss) | | | (141,208 | ) |
52
5. Components of Net Assets on a Tax Basis (continued)
For federal income tax purposes, capital loss carryforwards may be carried forward and applied against future capital gains. Capital loss carryforwards remaining at August 31, 2007 will expire as follows:
| | Delaware Tax-Free | | Delaware Tax-Free | | Delaware National High-Yield |
| Year of Expiration | | USA Fund | | USA Intermediate Fund | | Municipal Bond Fund |
| 2008 | | $ | 4,822,387 | | | $ | — | | | $ | 708,680 | |
| 2009 | | | 72,146 | | | | — | | | | 3,025,716 | |
| 2010 | | | — | | | | — | | | | 70,671 | |
| 2011 | | | — | | | | 249,429 | | | | 997,721 | |
| 2012 | | | — | | | | 5,791 | | | | 980,742 | |
| 2014 | | | — | | | | 119,427 | | | | — | |
| 2015 | | | — | | | | — | | | | 355,701 | |
| Total | | $ | 4,894,533 | | | $ | 374,647 | | | $ | 6,139,231 | |
| |
| For the year ended August 31, 2007, the Funds utilized capital loss carryforwards as follows: |
| | | | | | | | | | | |
| | Delaware Tax-Free | | Delaware Tax-Free | | | | |
| | USA Fund | | USA Intermediate Fund | | | | |
| | | $680,649 | | | $ | 105,202 | | | | | |
6. Capital Shares
Transactions in capital shares were as follows:
| | Delaware Tax-Free | | Delaware Tax-Free | | Delaware National High-Yield |
| | USA Fund | | USA Intermediate Fund | | Municipal Bond Fund |
| | Year Ended | | Year Ended | | Year Ended |
| | 8/31/07 | | 8/31/06 | | 8/31/07 | | 8/31/06 | | 8/31/07 | | 8/31/06 |
| Shares sold: | | | | | | | | | | | | | | | | | | |
| Class A | | 11,325,904 | | | 14,635,287 | | | 15,563,672 | | | 10,459,356 | | | 1,120,423 | | | 1,074,816 | |
| Class B | | 26,454 | | | 120,294 | | | 24,525 | | | 52,384 | | | 52,256 | | | 76,007 | |
| Class C | | 188,431 | | | 284,293 | | | 633,232 | | | 625,073 | | | 50,895 | | | 153,197 | |
| |
| Shares issued upon reinvestment of | | | | | | | | | | | | | | | | | | |
| dividends and distributions: | | | | | | | | | | | | | | | | | | |
| Class A | | 1,089,918 | | | 902,479 | | | 581,213 | | | 345,526 | | | 182,301 | | | 187,771 | |
| Class B | | 31,697 | | | 26,125 | | | 4,273 | | | 4,778 | | | 11,291 | | | 20,147 | |
| Class C | | 30,353 | | | 16,222 | | | 41,910 | | | 36,520 | | | 13,424 | | | 12,756 | |
| |
| Shares issued from fund mergers*: | | | | | | | | | | | | | | | | | | |
| Class A | | 7,205,217 | | | 10,177,730 | | | — | | | — | | | — | | | — | |
| Class B | | 257,365 | | | 980,518 | | | — | | | — | | | — | | | — | |
| Class C | | 304,075 | | | 703,407 | | | — | | | — | | | — | | | — | |
| | | 20,459,414 | | | 27,846,355 | | | 16,848,825 | | | 11,523,637 | | | 1,430,590 | | | 1,524,694 | |
| |
| Shares repurchased: | | | | | | | | | | | | | | | | | | |
| Class A | | (10,887,838 | ) | | (7,565,290 | ) | | (6,656,420 | ) | | (3,329,875 | ) | | (1,459,034 | ) | | (1,013,868 | ) |
| Class B | | (694,147 | ) | | (612,623 | ) | | (79,838 | ) | | (122,548 | ) | | (389,448 | ) | | (430,244 | ) |
| Class C | | (326,572 | ) | | (205,552 | ) | | (596,931 | ) | | (382,978 | ) | | (97,429 | ) | | (153,906 | ) |
| | | (11,908,557 | ) | | (8,383,465 | ) | | (7,333,189 | ) | | (3,835,401 | ) | | (1,945,911 | ) | | (1,598,018 | ) |
| Net increase (decrease) | | 8,550,857 | | | 19,462,890 | | | 9,515,636 | | | 7,688,236 | | | (515,321 | ) | | (73,324 | ) |
*See note 8.
(continues) 53
Notes to financial statements
Delaware National Tax-Free Funds
6. Capital Shares (continued)
For the years ended August 31, 2007 and 2006, the following shares and value were converted from Class B to Class A shares. The respective amounts are included in Class B redemptions and Class A subscriptions in the tables above and the Statements of changes in net assets.
| | | Year Ended | | | | Year Ended | |
| | | 8/31/07 | | | | 8/31/06 | |
| | Class B | | Class A | | | | Class B | | Class A | | |
| | Shares | | Shares | | Value | | Shares | | Shares | | Value |
| Delaware Tax-Free USA Fund | 313,870 | | 313,802 | | $3,623,804 | | 186,049 | | 186,006 | | $2,141,376 |
| Delaware Tax-Free USA Intermediate Fund | 31,830 | | 31,812 | | 364,785 | | 29,508 | | 29,497 | | 338,751 |
| Delaware National High-Yield | | | | | | | | | | | |
| Municipal Bond Fund | 161,352 | | 161,820 | | 1,677,884 | | 128,445 | | 128,739 | | 1,317,238 |
7. Fund Mergers
Effective July 13, 2007, Delaware Tax-Free USA Fund (Acquiring Fund) acquired all of the assets and assumed all of the liabilities of Delaware Tax-Free Florida Insured Fund (Acquired Fund), an open-end investment company, in exchange for shares of the Acquiring Fund pursuant to a Plan and Agreement of Reorganization (Reorganization). The shareholders of the Acquired Fund received shares of the respective class of the Acquiring Fund equal to the aggregate net asset value of their share in the Acquired Fund prior to the Reorganizations.
The Reorganization was treated as a non-taxable event and, accordingly, Delaware Tax-Free USA Fund’s basis in the securities acquired reflected the historical cost basis as of the date of transfer. The net assets, net unrealized appreciation and accumulated net realized gain (loss) of Delaware Tax-Free Florida Insured Fund as of the close of business on July 13, 2007, were as follows:
| | | | Net Unrealized | | Accumulated Net |
| | Net Assets | | Appreciation | | Realized Gain/Loss |
| Delaware Tax-Free Florida Insured Fund | $88,309,928 | | $2,426,693 | | $— |
The net assets of Delaware Tax-Free USA Fund prior to the Reorganization were $707,230,768. The combined net assets of Delaware Tax-Free USA Fund after merger were $795,540,696.
Effective July 17, 2006, Delaware Tax-Free USA Fund acquired all of the assets and assumed all of the liabilities of Delaware Tax-Free Oregon Insured Fund, Delaware Tax-Free Missouri Insured Fund and Delaware Tax-Free USA Insured Fund, each an open-end investment company, in exchange for shares of the Acquiring Fund pursuant to Plans and Agreements of Reorganization. The shareholders of each Acquired Fund received shares of the respective class of the Acquiring Fund equal to the aggregate net asset value of their shares in the Acquired Fund prior to the Reorganizations. The Reorganizations were treated as non-taxable events and, accordingly, Delaware Tax-Free USA Fund’s basis in the securities acquired reflected the historical cost basis as of the date of transfer. The net assets, net unrealized appreciation and accumulated net realized gain (loss) of Delaware Tax-Free Oregon Insured Fund, Delaware Tax-Free Missouri Insured Fund and Delaware Tax-Free USA Insured Fund as of the close of business on July 14, 2006, were as follows:
| | | | | Net Unrealized | | Accumulated Net |
| | Net Assets | | Appreciation | | Realized Gain/Loss |
| Delaware Tax-Free Oregon Insured Fund | $36,682,602 | | | $1,088,561 | | | $ | (62,898 | )* |
| Delaware Tax-Free Missouri Insured Fund | 44,904,356 | | | 1,111,591 | | | | 4,815 | |
| Delaware Tax-Free USA Insured Fund | 53,626,100 | | | 1,848,746 | | | | — | |
*Includes prior year capital loss carryforwards
The net assets of Delaware Tax-Free USA Fund prior to the Reorganizations were $568,508,906. The combined net assets of Delaware Tax-Free USA Fund after the merger were $703,721,964.
8. Line of Credit
Each Fund, along with certain other funds in the Delaware Investments Family of Funds (Participants), participates in a $225,000,000 revolving line of credit facility to be used for temporary or emergency purposes as an additional source of liquidity to fund redemptions of investor shares. The Participants are charged an annual commitment fee, which is allocated across the Participants on the basis of each Participant’s allocation of the entire facility. The Participants may borrow up to a maximum of one third of their net assets under the agreement. The Funds had no amounts outstanding as of August 31, 2007, or at any time during the year then ended.
54
9. Swap Contracts
The Funds may enter into index swap contracts in accordance with their investment objectives. Index swaps may be used to gain exposure to markets that the Funds invests in, such as the corporate bond market. Because there is no organized market for swap contracts, the value of open swaps may differ from that which would be realized in the event each Fund terminated its position in the agreement. Risks of entering into these contracts include the potential inability of the counterparty to meet the terms of the contracts. This type of risk is generally limited to the amount of favorable movement in the value of the underlying security, instrument or basket of instruments, if any, at the day of default. Risks also arise from potential losses from adverse market movements and such losses could exceed the unrealized amounts shown on the Statement of net assets. The Funds had no outstanding swap contracts as of August 31, 2007.
10. Credit and Market Risk
The Funds concentrate their investments in securities issued by municipalities. The value of these investments may be adversely affected by new legislation within the states, regional or local economic conditions, and differing levels of supply and demand for municipal bonds. Many municipalities insure repayment for their obligations. Although bond insurance reduces the risk of loss due to default by an issuer, such bonds remain subject to the risk that value may fluctuate for other reasons and there is no assurance that the insurance company will meet its obligations. These securities have been identified in the Statements of Net Assets.
Delaware National High-Yield Municipal Bond Fund invests a portion of its assets in high yield fixed income securities, which carry ratings of BB or lower by Standard & Poor’s Ratings Group and/or Ba or lower by Moody’s Investors Service, Inc. Investments in these higher yielding securities are generally accompanied by a greater degree of credit risk than higher rated securities. Additionally, lower rated securities may be more susceptible to adverse economic and competitive industry conditions than investment grade securities.
The Fund may invest in advanced refunded bonds, escrow secured bonds or defeased bonds. Under current federal tax laws and regulations, state and local government borrowers are permitted to refinance outstanding bonds by issuing new bonds. The issuer refinances the outstanding debt to either reduce interest costs or to remove or alter restrictive covenants imposed by the bonds being refinanced. A refunding transaction where the municipal securities are being refunded within 90 days from the issuance of the refunding issue is known as a “current refunding”. “Advance refunded bonds” are bonds in which the refunded bond issue remains outstanding for more than 90 days following the issuance of the refunding issue. In an advance refunding, the issuer will use the proceeds of a new bond issue to purchase high grade interest bearing debt securities which are then deposited in an irrevocable escrow account held by an escrow agent to secure all future payments of principal and interest and bond premium of the advance refunded bond. Bonds are “escrowed to maturity” when the proceeds of the refunding issue are deposited in an escrow account for investment sufficient to pay all of the principal and interest on the original interest payment and maturity dates.
Bonds are considered “pre-refunded” when the refunding issue’s proceeds are escrowed only until a permitted call date or dates on the refunded issue with the refunded issue being redeemed at the time, including any required premium. Bonds become “defeased” when the rights and interests of the bondholders and of their lien on the pledged revenues or other security under the terms of the bond contract and are substituted with an alternative source of revenues (the escrow securities) sufficient to meet payments of principal and interest to maturity or to the first call dates. Escrowed secured bonds will often receive a rating of AAA from Moody’s Investors Service, Inc., Standard & Poor’s Ratings Group, and/or Fitch Ratings due to the strong credit quality of the escrow securities and the irrevocable nature of the escrow deposit agreement.
Each Fund may invest a portion of its total assets in illiquid securities, which may include securities with contractual restrictions on resale, securities exempt from registration under Rule 144A of the Securities Act of 1933, as amended, and other securities which may not be readily marketable. The relative illiquidity of these securities may impair each Fund from disposing of them in a timely manner and at a fair price when it is necessary or desirable to do so. While maintaining oversight, each Fund’s Board of Trustees has delegated to DMC the day-to-day functions of determining whether individual securities are liquid for purposes of each Fund’s limitation on investments in illiquid assets. As of August 31, 2007, there were no Rule 144A securities and no securities have been determined to be illiquid under each Fund’s Liquidity Procedures.
11. Contractual Obligations
The Funds enter into contracts in the normal course of business that contain a variety of indemnifications. The Funds’ maximum exposure under these arrangements is unknown. However, the Funds have not had prior claims or losses pursuant to these contracts. Management has reviewed each Fund’s existing contracts and expects the risk of loss to be remote.
12. Termination of New Purchases of Class B Shares
As of the close of business on May 31, 2007, each Fund in the Delaware Investments® Family of Funds no longer accepts new or subsequent investments in Class B shares of the funds, other than a reinvestment of dividends or capital gains or permitted exchanges. Existing shareholders of Class B shares may continue to hold their Class B shares, reinvest dividends into Class B shares, and exchange their Class B shares of one Delaware Investments® Fund (each a Fund) for Class B shares of another Fund, as permitted by existing exchange privileges. Existing Class B shareholders wishing to make subsequent purchases in a Fund’s shares will be permitted to invest in other classes of the Fund, subject to that class’ pricing structure and eligibility requirements, if any.
(continues) 55
Notes to financial statements
Delaware National Tax-Free Funds
12. Termination of New Purchases of Class B Shares (continued)
For Class B shares outstanding as of May 31, 2007 and Class B shares acquired upon reinvestment of dividends or capital gains, all Class B share attributes, including the CDSC schedules, conversion to Class A schedule, and distribution and service (12b-1) fees, will continue in their current form. However, as of the close of business on May 31, 2007, reinvestment of redeemed shares with respect to Class B shares (which, described in the prospectus, permits you to reinvest within 12 months of selling your shares and have any CDSC you paid on such shares credited back to your account) has been discontinued. In addition, because the Fund’s or its distributor’s ability to assess certain sales charges and fees is dependent on the sale of new shares, the termination of new purchases of Class B shares could ultimately lead to the elimination and/or reduction of such sales charges and fees. The Fund may not be able to provide shareholders with advance notice of the reduction in these sales charges and fees. You will be notified via a Prospectus Supplement if there are any changes to any attributes, sales charges, or fees.
13. Tax Information (Unaudited)
The information set forth below is for each Fund’s fiscal year as required by federal laws. Shareholders, however, must report distributions on a calendar year basis for income tax purposes, which may include distributions for portions of two fiscal years of a Fund. Accordingly, the information needed by shareholders for income tax purposes will be sent to them in January of each year. Please consult your tax advisor for proper treatment of this information.
For the fiscal year ended August 31, 2007, each Fund designates distributions paid during the year as follows:
| | (A) | | (B) | | | | | |
| | Long-Term | | Ordinary | | (C) | | |
| | Capital Gains | | Income | | Tax Exempt | | Total |
| | Distributions | | Distributions | | Distributions | | Distributions |
| | (Tax Basis) | | (Tax Basis) | | (Tax Basis) | | (Tax Basis) |
| Delaware Tax-Free USA Fund | — | | — | | | 100 | % | | 100% |
| Delaware Tax-Free USA | | | | | | | | | |
| Intermediate Fund | — | | 1 | % | | 99 | % | | 100% |
| Delaware National High-Yield | | | | | | | | | |
| Municipal Bond Fund | — | | — | | | 100 | % | | 100% |
(A), (B), and (C) are based on a percentage of each Fund’s total distributions.
56
Report of independent
registered public accounting firm
To the Shareholders and Board of Trustees
Delaware Group Tax-Free Fund
Voyageur Mutual Funds – Delaware National High-Yield
Municipal Bond Fund
We have audited the accompanying statements of net assets of Delaware Group Tax-Free Fund (comprised of Delaware Tax-Free USA Fund and Delaware Tax-Free USA Intermediate Fund) and Delaware National High-Yield Municipal Bond Fund (one of the series constituting Voyageur Mutual Funds) (the “Funds”) as of August 31, 2007, and the related statements of operations for the year then ended, the statements of changes in net assets for each of the two years in the period then ended, and the financial highlights for each of the five years in the period then ended. These financial statements and financial highlights are the responsibility of the Funds’ management. Our responsibility is to express an opinion on these financial statements and financial highlights based on our audits.
We conducted our audits in accordance with the standards of the Public Company Accounting Oversight Board (United States). Those standards require that we plan and perform the audit to obtain reasonable assurance about whether the financial statements and financial highlights are free of material misstatement. We were not engaged to perform an audit of the Funds’ internal control over financial reporting. Our audits included consideration of internal control over financial reporting as a basis for designing audit procedures that are appropriate in the circumstances, but not for the purpose of expressing an opinion on the effectiveness of the Funds’ internal control over financial reporting. Accordingly, we express no such opinion. An audit also includes examining, on a test basis, evidence supporting the amounts and disclosures in the financial statements and financial highlights, assessing the accounting principles used and significant estimates made by management, and evaluating the overall financial statement presentation. Our procedures included confirmation of securities owned as of August 31, 2007, by correspondence with the custodian and brokers or by other appropriate auditing procedures where replies from brokers were not received. We believe that our audits provide a reasonable basis for our opinion.
In our opinion, the financial statements and financial highlights referred to above present fairly, in all material respects, the financial position of each of the respective series constituting the Delaware Group Tax-Free Fund and Delaware National High-Yield Municipal Bond Fund of Voyageur Mutual Funds at August 31, 2007, the results of their operations for the year then ended, the changes in their net assets for each of the two years in the period then ended, and their financial highlights for each of the five years in the period then ended, in conformity with U.S. generally accepted accounting principles.

Philadelphia, PA
October 18, 2007
57
Other Fund information (unaudited)
Delaware National Tax-Free Funds
Board Consideration of Delaware Tax-Free USA Fund, Delaware Tax-Free USA Intermediate Fund, and Delaware National High-Yield Municipal Bond Fund Agreements
At a meeting held on May 16-17, 2007 (Annual Meeting), the Board of Trustees (Board), including a majority of disinterested or independent Trustees, approved the renewal of the Investment Advisory Agreements for the Delaware Tax-Free USA Fund, Delaware Tax-Free USA Intermediate Fund and Delaware National High-Yield Municipal Bond Fund (each, a “Fund” and collectively, the “Funds”). In making its decision, the Board considered information furnished throughout the year at regular Board meetings, including reports detailing Fund performance, investment strategies and expenses, as well as information prepared specifically in connection with the renewal of the investment advisory contracts. Information furnished specifically in connection with the renewal of the Investment Advisory Agreements with Delaware Management Company (DMC) included materials provided by DMC and its affiliates (Delaware Investments) concerning, among other things, the level of services provided to the Funds, the costs of such services to the Funds, economies of scale and the financial condition and profitability of Delaware Investments. In addition, in connection with the Meeting, the Board separately received and reviewed in mid-January 2007 independent historical and comparative reports prepared by Lipper Inc. (“Lipper”), an independent statistical compilation organization. The Lipper reports compared each Fund’s investment performance and expenses with those of other comparable mutual funds. The Board requested and received certain information regarding management’s policy with respect to advisory fee levels and its philosophy with respect to breakpoints; the structure of portfolio manager compensation; the investment manager’s profitability; and any constraints or limitations on the availability of securities in certain investment styles which might inhibit DMC’s ability to fully invest in accordance with Fund policies.
In considering information relating to the approval of each Fund’s advisory agreement, the independent Trustees received assistance and advice from and met separately with independent counsel. While attention was given to all information furnished, the following discusses under separate headings the primary factors taken into account by the Board in its contract renewal considerations.
Nature, Extent And Quality of Service. Consideration was given to the services provided by Delaware Investments to the Funds and their shareholders. In reviewing the nature, extent and quality of services, the Board emphasized reports furnished to it throughout the year at regular Board Meetings covering matters such as the relative performance of the Funds, compliance of portfolio managers with the investment policies, strategies and restrictions for the Funds, the compliance of management personnel with the Code of Ethics adopted throughout the Delaware Investments® Family of Funds complex and the adherence to fair value pricing procedures as established by the Board. The Board noted that it was pleased with the current staffing of the Funds’ investment advisor and the emphasis placed on research in the investment process. Favorable consideration was given to DMC’s efforts to maintain, and in some instances increase, financial and human resources committed to fund matters. The Board also considered the transfer agent and shareholder services provided to Fund shareholders by Delaware Investments’ affiliate, Delaware Service Company, Inc. (DSC), noting DSC’s commitment to maintain a high level of service and the continuing expenditures by Delaware Investments to improve the delivery of shareholder services. During 2006, management conducted extensive research into alternatives that could further improve the quality and cost of delivering investment accounting services to the Funds. The Board noted the extent of benefits provided to Fund shareholders for being part of the Delaware Investments Family of Funds, including the privilege to exchange fund investments between the same class of shares without a sales charge, the ability to reinvest Fund dividends into other funds and the privilege to combine holdings in other funds to obtain a reduced sales charge. The Board was satisfied with the nature, extent and quality of the overall services provided by Delaware Investments.
Investment Performance. The Board considered the investment performance of DMC and the Funds. The Board placed significant emphasis on the investment performance of the Funds in view of its importance to shareholders. While consideration was given to performance reports and discussions with portfolio managers at Board meetings throughout the year, particular weight was given to the Lipper reports furnished for the Annual Meeting. The Lipper reports prepared for each Fund showed the investment performance of its Class A shares in comparison to a group of similar funds as selected by Lipper (Performance Universe). A fund with the best performance ranked first, and a fund with the poorest ranked last. The highest/best performing 25% of funds in the Performance Universe make up the first quartile; the next 25% — the second quartile; the next 25% — the third quartile; and the poorest/worst performing 25% of funds in the Performance Universe make up the fourth quartile. Comparative annualized performance for the Funds was shown for the past one-, three-, five- and 10-year periods ended December 31, 2006. The Board also considered comparative annualized performance for the Funds for the same periods ended October 31, 2006. The performance comparison presented below is based upon the December 31, 2006 information. The Board noted its objective that each Fund’s performance for the periods considered be at or above the median of its Performance Universe. The following paragraphs summarize the performance results for the Funds and the Board’s view of such performance.
Delaware Tax-Free USA Fund – The Performance Universe for the Fund consisted of the Fund and all retail and institutional general municipal debt funds as selected by Lipper. The Lipper report comparison showed that the Fund’s total return for the one-, three- and five-year periods was in the first quartile of its Performance Universe. The report further showed that the Fund’s total return for the 10-year period was in the second quartile. The Board was very satisfied with performance.
Delaware Tax-Free USA Intermediate Fund – The Performance Universe for the Fund consisted of the Fund and all retail and institutional intermediate municipal debt funds as selected by Lipper. The Lipper report comparison showed that the Fund’s total return for the one-, three-, five- and 10-year periods was in the first quartile of its Performance Universe. The Board was very satisfied with performance.
58
Board Consideration of Delaware Tax-Free USA Fund, Delaware Tax-Free USA Intermediate Fund, and Delaware National High-Yield Municipal Bond Fund Agreements (continued)
Delaware National High-Yield Municipal Bond Fund – The Performance Universe for the Fund consisted of the Fund and all retail and institutional high yield municipal debt funds as selected by Lipper. The Lipper report comparison showed that the Fund’s total return for the one- and five-year periods was in the third quartile of its Performance Universe. The report further showed that the Fund’s total return for three- and 10-year periods was in the second quartile. The Board noted that the Fund’s performance results were mixed but on an overall basis tended toward median, which was acceptable.
Comparative Expenses. The Board considered expense comparison data for the Delaware Investments® Family of Funds as of October 31, 2006. Management provided the Board with information on pricing levels and fee structures for the Funds. The Board focused particularly on the comparative analysis of the effective management fees and total expense ratios of each Fund and the effective management fees and expense ratios of a group of similar funds as selected by Lipper (Expense Group). In reviewing comparative costs, each Fund’s contractual management fee and the actual management fee incurred by the Fund were compared with the contractual management fees (assuming all funds in the Expense Group were similar in size to the Fund) and actual management fees (as reported by each fund) of other funds within the Expense Group, taking into account any applicable breakpoints and fee waivers. Each Fund’s total expenses were also compared with those of its Expense Group. The Lipper total expenses, for comparative consistency, were shown by Lipper for Class A shares and compared total expenses including 12b-1 and non-12b-1 service fees. The Board also considered fees paid to Delaware Investments for non-management services. The Board noted its objective to limit each Fund’s total expense ratio to an acceptable range as compared to the median of the Expense Group. The following paragraphs summarize the expense results for the Funds and the Board’s view of such expenses.
Delaware Tax-Free USA Fund – The expense comparisons for the Fund showed that its actual management fee was in the quartile with the lowest expenses of its Expense Group and its total expenses were in the quartile with the second lowest expenses of its Expense Group. The Board was satisfied with the management fee and total expenses of the Fund in comparison to its Expense Group as shown in the Lipper report.
Delaware Tax-Free USA Intermediate Fund – The expense comparisons for the Fund showed that its actual management fee and total expenses were in the quartile with the lowest expenses of its Expense Group. The Board was satisfied with the management fee and total expenses of the Fund in comparison to its Expense Group as shown in the Lipper report.
Delaware National High-Yield Municipal Bond Fund – The expense comparisons for the Fund showed that its actual management fee was in the quartile with the lowest expenses of its Expense Group and its total expenses were in the quartile with the second lowest expenses of its Expense Group. The Board was satisfied with the management fee and total expenses of the Fund in comparison to its Expense Group as shown in the Lipper report.
Management Profitability. The Board considered the level of profits realized by Delaware Investments in connection with the operation of the Funds. In this respect, the Board reviewed the Investment Management Profitability Analysis that addressed the overall profitability of Delaware Investments’ business in providing management and other services to each of the individual funds and the Delaware Investments Family of Funds as a whole. Specific attention was given to the methodology followed in allocating costs for the purpose of determining profitability. Management stated that the level of profits of Delaware Investments, to a certain extent, reflected operational cost savings and efficiencies initiated by Delaware Investments. The Board considered Delaware Investments’ efforts to improve services provided to fund shareholders and to meet additional regulatory and compliance requirements resulting from recent Securities and Exchange Commission initiatives. The Board also considered the extent to which Delaware Investments might derive ancillary benefits from fund operations, including the potential for procuring additional business as a result of the prestige and visibility associated with its role as service provider to the Delaware Investments Family of Funds and the benefits from allocation of fund brokerage to improve trading efficiencies. The Board found that the management fees were reasonable in light of the services rendered and the level of profitability of Delaware Investments.
Economies of Scale. The Trustees considered whether economies of scale are realized by Delaware Investments as each Fund’s assets increase and the extent to which any economies of scale are reflected in the level of management fees charged. The Trustees took into account the standardized advisory fee pricing and structure, approved by the Board and shareholders and again reviewed by the Board this year, which includes breakpoints. Breakpoints in the advisory fee occur when the advisory fee rate is reduced on assets in excess of specified levels. This results in a lower advisory fee than would otherwise be the case on all assets when those asset levels specified are exceeded. The Board noted that the fee under each Fund’s management contract fell within the standard structure. With respect to the Delaware Tax-Free USA Fund, the Board also noted that the Fund’s assets exceeded the first breakpoint level. The Board believed that, given the extent to which economics of scale might be realized by the advisor and its affiliates, the schedule of fees under the Investment Advisory Agreement provides a sharing of benefits with the Fund and its shareholders. With respect to the Delaware Tax-Free USA Intermediate Fund and Delaware National High-Yield Municipal Bond Fund, although the Funds have not reached a size at which they can take advantage of breakpoints, the Board recognized that each Fund’s fee was structured so that when the Fund grows, economies of scale may be shared.
(continues) 59
Other Fund information (unaudited)
Delaware National Tax-Free Funds
Fund management
Joseph R. Baxter
Senior Vice President, Head of Municipal Bond Department, Senior Portfolio Manager
Mr. Baxter is the head of the municipal bond department and is responsible for setting the department’s investment strategy. He is also a co-portfolio manager of the firm’s municipal bond funds and several client accounts. Before joining Delaware Investments in 1999, he held investment positions with First Union, most recently as a municipal portfolio manager with the Evergreen Funds. Mr. Baxter received a bachelor’s degree in finance and marketing from LaSalle University.
Robert F. Collins, CFA
Senior Vice President, Senior Portfolio Manager
Mr. Collins is a member of the firm’s municipal fixed income portfolio management team with primary responsibility for portfolio construction and strategic asset allocation. He is a co-portfolio manager of several of the firm’s municipal bond funds and client accounts. Prior to joining Delaware Investments in 2004, he spent five years as a co-manager of the municipal portfolio management group within PNC Advisors, where he oversaw the tax-exempt investments of high net worth and institutional accounts. Before that, he headed the municipal fixed income team at Wilmington Trust, where he managed funds and high net worth accounts. Mr. Collins earned a bachelor’s degree in economics from Ursinus College, and he is also a former president of The Financial Analysts of Wilmington, Delaware.
Stephen J. Czepiel
Senior Vice President, Portfolio Manager
Mr. Czepiel is a member of the firm’s municipal fixed income portfolio management team with primary responsibility for portfolio construction and strategic asset allocation. He is a co-portfolio manager of several of the firm’s municipal bond funds and client accounts. In addition, he is the head of the municipal bond trading staff. He joined Delaware Investments in July 2004 as a senior bond trader. Previously, he was vice president at both Mesirow Financial and Loop Capital Markets. He began his career in the securities industry in 1982 as a municipal bond trader at Kidder Peabody and now has more than 20 years of experience in the municipal securities industry. Mr. Czepiel earned his bachelor’s degree in finance and economics from Duquesne University.
60
Board of trustees/directors
and officers addendum
Delaware Investments® Family of Funds
A mutual fund is governed by a Board of Trustees/Directors (“Trustees”), which has oversight responsibility for the management of a fund’s business affairs. Trustees establish procedures and oversee and review the performance of the investment manager, the distributor, and others who perform services for the fund. The independent fund trustees, in particular, are advocates for shareholder interests. Each trustee has served in that capacity since he or she was elected to or appointed to the Board of Trustees, and will continue to serve until his or her retirement or the election of a new trustee in his or her place. The following is a list of the Trustees and Officers with certain background and related information.
| | | | | Number of | |
| | | | | Portfolios in Fund | Other |
| Name, | | | | Complex Overseen | Directorships |
| Address, | Position(s) | Length of | Principal Occupation(s) | by Trustee | Held by |
| and Birth Date | Held with Fund(s) | Time Served | During Past 5 Years | or Officer | Trustee or Officer |
| Interested Trustees | | | | | |
| Patrick P. Coyne1 | Chairman, | Chairman and Trustee | Patrick P. Coyne has served in | 82 | Director — |
| 2005 Market Street | President, | since August 16, 2006 | various executive capacities | | Kaydon Corp. |
| Philadelphia, PA | Chief Executive | | at different times at | | |
| 19103 | Officer, and | President and | Delaware Investments.2 | | |
| | Trustee | Chief Executive Officer | | | |
| April 14, 1963 | | since August 1, 2006 | | | |
| Independent Trustees | | | | | |
| Thomas L. Bennett | Trustee | Since | Private Investor — | 82 | Director — |
| 2005 Market Street | | March 2005 | (March 2004–Present) | | Bryn Mawr |
| Philadelphia, PA | | | | | Bank Corp. (BMTC) |
| 19103 | | | Investment Manager — | | (April 2007–Present) |
| | | | Morgan Stanley & Co. | | |
| October 4, 1947 | | | (January 1984–March 2004) | | |
| John A. Fry | Trustee | Since | President — | 82 | Director — |
| 2005 Market Street | | January 2001 | Franklin & Marshall College | | Community Health |
| Philadelphia, PA | | | (June 2002–Present) | | Systems |
| 19103 | | | | | |
| | | | Executive Vice President — | | Director — |
| May 28, 1960 | | | University of Pennsylvania | | Allied Barton |
| | | | (April 1995–June 2002) | | Security Holdings |
| Anthony D. Knerr | Trustee | Since | Founder and Managing Director — | 82 | None |
| 2005 Market Street | | April 1990 | Anthony Knerr & Associates | | |
| Philadelphia, PA | | | (Strategic Consulting) | | |
| 19103 | | | (1990–Present) | | |
| |
| December 7, 1938 | | | | | |
| Lucinda S. Landreth | Trustee | Since | Chief Investment Officer — | 82 | None |
| 2005 Market Street | | March 2005 | Assurant, Inc. | | |
| Philadelphia, PA | | | (Insurance) | | |
| 19103 | | | (2002–2004) | | |
| |
| June 24, 1947 | | | | | |
| Ann R. Leven | Trustee | Since | Consultant — | 82 | Director and |
| 2005 Market Street | | October 1989 | ARL Associates | | Audit Committee |
| Philadelphia, PA | | | (Financial Planning) | | Chairperson — Andy |
| 19103 | | | (1983–Present) | | Warhol Foundation |
| |
| November 1, 1940 | | | | | Director and Audit |
| | | | | | Committee Chair — |
| | | | | | Systemax, Inc. |
(continues) 61
| | | | | Number of | |
| | | | | Portfolios in Fund | Other |
| Name, | | | | Complex Overseen | Directorships |
| Address, | Position(s) | Length of | Principal Occupation(s) | by Trustee | Held by |
| and Birth Date | Held with Fund(s) | Time Served | During Past 5 Years | or Officer | Trustee or Officer |
| Independent Trustees (continued) | | | | |
| Thomas F. Madison | Trustee | Since | President and Chief | 82 | Director — |
| 2005 Market Street | | May 19973 | Executive Officer — | | CenterPoint Energy |
| Philadelphia, PA | | | MLM Partners, Inc. | | |
| 19103 | | | (Small Business Investing | | Director and Audit |
| | | | and Consulting) | | Committee Chair — |
| February 25, 1936 | | | (January 1993–Present) | | Digital River, Inc. |
| |
| | | | | | Director and Audit |
| | | | | | Committee Member — |
| | | | | | Rimage |
| | | | | | Corporation |
| |
| | | | | | Director — Valmont |
| | | | | | Industries, Inc. |
| Janet L. Yeomans | Trustee | Since | Treasurer | 82 | None |
| 2005 Market Street | | April 1999 | (January 2006–Present) | | |
| Philadelphia, PA | | | Vice President — Mergers & Acquisitions | | |
| 19103 | | | (January 2003–January 2006), and | | |
| | | | Vice President | | |
| July 31, 1948 | | | (July 1995–January 2003) | | |
| | | | 3M Corporation | | |
| |
| | | | Ms. Yeomans has held | | |
| | | | various management positions | | |
| | | | at 3M Corporation since 1983. | | |
| J. Richard Zecher | Trustee | Since | Founder — | 82 | Director and Audit |
| 2005 Market Street | | March 2005 | Investor Analytics | | Committee Member — |
| Philadelphia, PA | | | (Risk Management) | | Investor Analytics |
| 19103 | | | (May 1999–Present) | | |
| | | | | | Director and Audit |
| July 3, 1940 | | | Founder — | | Committee Member — |
| | | | Sutton Asset Management | | Oxigene, Inc. |
| | | | (Hedge Fund) | | |
| | | | (September 1996–Present) | | |
| Officers | | | | | |
| David F. Connor | Vice President, | Vice President since | David F. Connor has served as | 82 | None4 |
| 2005 Market Street | Deputy General | September 2000 | Vice President and Deputy | | |
| Philadelphia, PA | Counsel, and Secretary | and Secretary | General Counsel of | | |
| 19103 | | since | Delaware Investments | | |
| | | October 2005 | since 2000. | | |
| December 2, 1963 | | | | | |
| David P. O’Connor | Senior Vice | Senior Vice President, | David P. O’Connor has served in | 82 | None4 |
| 2005 Market Street | President, | General Counsel, and | various executive and legal | | |
| Philadelphia, PA | General Counsel, | Chief Legal Officer | capacities at different times | | |
| 19103 | and Chief | since | at Delaware Investments. | | |
| | Legal Officer | October 2005 | | | |
| February 21, 1966 | | | | | |
| Richard Salus | Senior | Chief Financial | Richard Salus has served in | 82 | None4 |
| 2005 Market Street | Vice President | Officer since | various executive capacities | | |
| Philadelphia, PA | and | November 2006 | at different times at | | |
| 19103 | Chief Financial | | Delaware Investments. | | |
| | Officer | | | | |
| October 4, 1963 | | | | | |
1 Patrick P. Coyne is considered to be an “Interested Trustee” because he is an executive officer of the Fund’s(s’) investment advisor.
2 Delaware Investments is the marketing name for Delaware Management Holdings, Inc. and its subsidiaries, including the Fund’s(s’) investment advisor, principal underwriter, and its transfer agent.
3 In 1997, several funds managed by Voyageur Fund Managers, Inc. (the “Voyageur Funds”) were incorporated into the Delaware Investments Family of Funds. Mr. Madison served as a director of the Voyageur Funds from 1993 until 1997.
4 David F. Connor, David P. O’Connor, and Richard Salus serve in similar capacities for the six portfolios of the Optimum Fund Trust, which have the same investment advisor, principal underwriter, and transfer agent as the registrant.
The Statement of Additional Information for the Fund(s) includes additional information about the Trustees and Officers and is available, without charge, upon request by calling 800 523-1918.
62
About the organization
This annual report is for the information of Delaware Tax-Free USA Fund, Delaware Tax-Free USA Intermediate Fund, and Delaware National High-Yield Municipal Bond Fund shareholders, but it may be used with prospective investors when preceded or accompanied by a current prospectus for Delaware Tax-Free USA Fund, Delaware Tax-Free USA Intermediate Fund, and Delaware National High-Yield Municipal Bond Fund and the Delaware Investments® Performance Update for the most recently completed calendar quarter. The prospectus sets forth details about charges, expenses, investment objectives, and operating policies of the investment company. You should read the prospectus carefully before you invest. The figures in this report represent past results that are not a guarantee of future results. The return and principal value of an investment in the Fund will fluctuate so that shares, when redeemed, may be worth more or less than their original cost.
| Board of trustees Patrick P. Coyne
Chairman, President, and
Chief Executive Officer
Delaware Investments Family of Funds
Philadelphia, PA Thomas L. Bennett
Private Investor
Rosemont, PA John A. Fry
President
Franklin & Marshall College
Lancaster, PA Anthony D. Knerr
Founder and Managing Director
Anthony Knerr & Associates
New York, NY Lucinda S. Landreth
Former Chief Investment Officer
Assurant, Inc.
Philadelphia, PA Ann R. Leven
Consultant
ARL Associates
New York, NY Thomas F. Madison
President and Chief Executive Officer
MLM Partners, Inc.
Minneapolis, MN Janet L. Yeomans
Vice President and Treasurer
3M Corporation
St. Paul, MN J. Richard Zecher
Founder
Investor Analytics
Scottsdale, AZ | Affiliated officers David F. Connor
Vice President, Deputy General Counsel,
and Secretary
Delaware Investments Family of Funds
Philadelphia, PA David P. O’Connor
Senior Vice President, General Counsel,
and Chief Legal Officer
Delaware Investments Family of Funds
Philadelphia, PA Richard Salus
Senior Vice President and
Chief Financial Officer
Delaware Investments Family of Funds
Philadelphia, PA | Contact information Investment manager
Delaware Management Company, a series
of Delaware Management Business Trust
Philadelphia, PA National distributor
Delaware Distributors, L.P.
Philadelphia, PA Shareholder servicing, dividend
disbursing, and transfer agent
Delaware Service Company, Inc.
2005 Market Street
Philadelphia, PA 19103-7094 For shareholders
800 523-1918 For securities dealers and financial
institutions representatives only
800 362-7500 Web site
www.delawareinvestments.com |
Delaware Investments is the marketing name of Delaware Management Holdings, Inc. and its subsidiaries.
Each Fund files its complete schedule of portfolio holdings with the Securities and Exchange Commission for the first and third quarters of each fiscal year on Form N-Q. Each Fund’s Forms N-Q, as well as a description of the policies and procedures that each Fund uses to determine how to vote proxies (if any) relating to portfolio securities are available without charge (i) upon request, by calling 800 523-1918; and (ii) on the Commission’s Web site at http://www.sec.gov. In addition, a description of the policies and procedures that each Fund uses to determine how to vote proxies (if any) relating to portfolio securities and each Fund’s Schedule of Investments are available without charge on the Fund’s Web site at http://www.delawareinvestments.com. Each Fund’s Forms N-Q may be reviewed and copied at the Commission’s Public Reference Room in Washington, D.C.; information on the operation of the Public Reference Room may be obtained by calling 800 SEC-0330.
Information (if any) regarding how each Fund voted proxies relating to portfolio securities during the most recently disclosed 12-month period ended June 30 is available without charge (i) through each Fund’s Web site at http://www.delawareinvestments.com; and (ii) on the Commission’s Web site at http://www.sec.gov.
63
Get shareholder reports and prospectuses online instead of in the mail.
> Visit www.delawareinvestments.com/edelivery
Simplify your life.Manage your investments online!
Get Account Access, the Delaware Investments® secure Web site that allows you to conduct your business online. Gain 24-hour access to your account and one of the highest levels of Web security available. You also get:
- Hassle-free investing — Make online purchases and redemptions at any time.
- Simplified tax processing — Automatically retrieve your Delaware Investments accounts’ 1099 information and import it directly into your 1040 tax return. Available only with Turbo Tax® OnlineSM and Desktop software — www.turbotax.com.
- Less mail clutter — Get instant access to your fund materials online with Delaware eDelivery.
Register for Account Access today! Please visit us at www.delawareinvestments.com, select Individual Investors, and click Account Access.
Please call our Shareholder Service Center at 800 523-1918 Monday through Friday from 8:00 a.m. to 7:00 p.m., Eastern Time, for assistance with any questions.

(2261) | Printed in the USA |
| AR-011 [8/07] CGI 10/07 | MF-07-09-007 PO12304 |
Item 2. Code of Ethics
The registrant has adopted a code of ethics that applies to the registrant’s principal executive officer, principal financial officer, principal accounting officer or controller, or persons performing similar functions, regardless of whether these individuals are employed by the registrant or a third party. A copy of the registrant’s Code of Business Ethics has been posted on Delaware Investments’ internet website at www.delawareinvestments.com. Any amendments to the Code of Business Ethics, and information on any waiver from its provisions granted by the registrant, will also be posted on this website within five business days of such amendment or waiver and will remain on the website for at least 12 months.
Item 3. Audit Committee Financial Expert
The registrant’s Board of Trustees/Directors has determined that each member of the registrant’s Audit Committee is an audit committee financial expert, as defined below. For purposes of this item, an “audit committee financial expert” is a person who has the following attributes:
a. An understanding of generally accepted accounting principles and financial statements;
b. The ability to assess the general application of such principles in connection with the accounting for estimates, accruals, and reserves;
c. Experience preparing, auditing, analyzing, or evaluating financial statements that present a breadth and level of complexity of accounting issues that are generally comparable to the breadth and complexity of issues that can reasonably be expected to be raised by the registrant’s financial statements, or experience actively supervising one or more persons engaged in such activities;
d. An understanding of internal controls and procedures for financial reporting; and
e. An understanding of audit committee functions.
An “audit committee financial expert” shall have acquired such attributes through:
a. Education and experience as a principal financial officer, principal accounting officer, controller, public accountant, or auditor or experience in one or more positions that involve the performance of similar functions;
b. Experience actively supervising a principal financial officer, principal accounting officer, controller, public accountant, auditor, or person performing similar functions;
c. Experience overseeing or assessing the performance of companies or public accountants with respect to the preparation, auditing, or evaluation of financial statements; or
d. Other relevant experience.
The registrant’s Board of Trustees/Directors has also determined that each member of the registrant’s Audit Committee is independent. In order to be “independent” for purposes of this item, the Audit Committee member may not: (i) other than in his or her capacity as a member of the Board of Trustees/Directors or any committee thereof, accept directly or indirectly any consulting, advisory or other compensatory fee from the issuer; or (ii) be an “interested person” of the registrant as defined in Section 2(a)(19) of the Investment Company Act of 1940.
The names of the audit committee financial experts on the registrant’s Audit Committee are set forth below:
Thomas L. Bennett 1
Thomas F. Madison
Janet L. Yeomans 1
J. Richard Zecher
Item 4. Principal Accountant Fees and Services
(a) Audit fees.
The aggregate fees billed for services provided to the registrant by its independent auditors for the audit of the registrant’s annual financial statements and for services normally provided by the independent auditors in connection with statutory and regulatory filings or engagements were $62,400 for the fiscal year ended August 31, 2007.
____________________
1 The instructions to Form N-CSR require disclosure on the relevant experience of persons who qualify as audit committee financial experts based on “other relevant experience.” The Board of Trustees/Directors has determined that Mr. Bennett qualifies as an audit committee financial expert by virtue of his education, Chartered Financial Analyst designation, and his experience as a credit analyst, portfolio manager and the manager of other credit analysts and portfolio managers. The Board of Trustees/Directors has determined that Ms. Yeomans qualifies as an audit committee financial expert by virtue of her education and experience as the Treasurer of a large global corporation.
The aggregate fees billed for services provided to the registrant by its independent auditors for the audit of the registrant’s annual financial statements and for services normally provided by the independent auditors in connection with statutory and regulatory filings or engagements were $67,700 for the fiscal year ended August 31, 2006.
(b) Audit-related fees.
The aggregate fees billed by the registrant’s independent auditors for services relating to the performance of the audit of the registrant’s financial statements and not reported under paragraph (a) of this Item were $0 for the fiscal year ended August 31, 2007.
The aggregate fees billed by the registrant’s independent auditors for services relating to the performance of the audit of the financial statements of the registrant’s investment adviser and other service providers under common control with the adviser and that relate directly to the operations or financial reporting of the registrant were $13,400 for the registrant’s fiscal year ended August 31, 2007. The percentage of these fees relating to services approved by the registrant’s Audit Committee pursuant to the de minimis exception from the pre-approval requirement in Rule 2-01(c)(7)(i)(C) of Regulation S-X was 0%. These audit-related services were as follows: issuance of report concerning transfer agent's system of internal accounting control pursuant to Rule 17Ad-13 of the Securities Exchange Act.
The aggregate fees billed by the registrant’s independent auditors for services relating to the performance of the audit of the registrant’s financial statements and not reported under paragraph (a) of this Item were $0 for the fiscal year ended August 31, 2006.
The aggregate fees billed by the registrant’s independent auditors for services relating to the performance of the audit of the financial statements of the registrant’s investment adviser and other service providers under common control with the adviser and that relate directly to the operations or financial reporting of the registrant were $28,300 for the registrant’s fiscal year ended August 31, 2006. The percentage of these fees relating to services approved by the registrant’s Audit Committee pursuant to the de minimis exception from the pre-approval requirement in Rule 2-01(c)(7)(i)(C) of Regulation S-X was 0%. These audit-related services were as follows: issuance of report concerning transfer agent's system of internal accounting control pursuant to Rule 17Ad-13 of the Securities Exchange Act; and issuance of agreed upon procedures report to the registrant's Board in connection with the pass-through of internal legal cost relating to the operations of the registrant.
(c) Tax fees.
The aggregate fees billed by the registrant’s independent auditors for tax-related services provided to the registrant were $22,000 for the fiscal year ended August 31, 2007. The percentage of these fees relating to services approved by the registrant’s Audit Committee pursuant to the de minimis exception from the pre-approval requirement in Rule 2-01(c)(7)(i)(C) of Regulation S-X was 0%. These tax-related services were as follows: review of income tax returns and review of annual excise distribution calculations.
The aggregate fees billed by the registrant’s independent auditors for tax-related services provided to the registrant’s investment adviser and other service providers under common control with the adviser and that relate directly to the operations or financial reporting of the registrant were $0 for the registrant’s fiscal year ended August 31, 2007.
The aggregate fees billed by the registrant’s independent auditors for tax-related services provided to the registrant were $12,400 for the fiscal year ended August 31, 2006. The percentage of these fees relating to services approved by the registrant’s Audit Committee pursuant to the de minimis exception from the pre-approval requirement in Rule 2-01(c)(7)(i)(C) of Regulation S-X was 0%. These tax-related services were as follows: review of income tax returns and review of annual excise distribution calculations.
The aggregate fees billed by the registrant’s independent auditors for tax-related services provided to the registrant’s adviser and other service providers under common control with the adviser and that relate directly to the operations or financial reporting of the registrant were $0 for the registrant’s fiscal year ended August 31, 2006.
(d) All other fees.
The aggregate fees billed for all services provided by the independent auditors to the registrant other than those set forth in paragraphs (a), (b) and (c) of this Item were $0 for the fiscal year ended August 31, 2007.
The aggregate fees billed for all services other than those set forth in paragraphs (b) and (c) of this Item provided by the registrant’s independent auditors to the registrant’s adviser and other service providers under common control with the adviser and that relate directly to the operations or financial reporting of the registrant were $0 for the registrant’s fiscal year ended August 31, 2007.
The aggregate fees billed for all services provided by the independent auditors to the registrant other than those set forth in paragraphs (a), (b) and (c) of this Item were $0 for the fiscal year ended August 31, 2006.
The aggregate fees billed for all services other than those set forth in paragraphs (b) and (c) of this Item provided by the registrant’s independent auditors to the registrant’s adviser and other service providers under common control with the adviser and that relate directly to the operations or financial reporting of the registrant were $0 for the registrant’s fiscal year ended August 31, 2006.
(e) The registrant’s Audit Committee has established pre-approval policies and procedures as permitted by Rule 2-01(c)(7)(i)(B) of Regulation S-X (the “Pre-Approval Policy”) with respect to services provided by the registrant’s independent auditors. Pursuant to the Pre-Approval Policy, the Audit Committee has pre-approved the services set forth in the table below with respect to the registrant up to the specified fee limits. Certain fee limits are based on aggregate fees to the registrant and other registrants within the Delaware Investments Family of Funds.
| Service | Range of Fees |
| Audit Services | |
Statutory audits or financial audits for new Funds
| up to $25,000 per Fund |
Services associated with SEC registration statements (e.g., Form N-1A, Form N-14, etc.), periodic reports and other documents filed with the SEC or other documents issued in connection with securities offerings (e.g., comfort letters for closed-end Fund offerings, consents), and assistance in responding to SEC comment letters
| up to $10,000 per Fund |
Consultations by Fund management as to the accounting or disclosure treatment of transactions or events and/or the actual or potential impact of final or proposed rules, standards or interpretations by the SEC, FASB, or other regulatory or standard-setting bodies (Note: Under SEC rules, some consultations may be considered “audit-related services” rather than “audit services”)
| up to $25,000 in the aggregate |
| Audit-Related Services | |
Consultations by Fund management as to the accounting or disclosure treatment of transactions or events and /or the actual or potential impact of final or proposed rules, standards or interpretations by the SEC, FASB, or other regulatory or standard-setting bodies (Note: Under SEC rules, some consultations may be considered “audit services” rather than “audit-related services”)
| up to $25,000 in the aggregate |
| Tax Services | |
U.S. federal, state and local and international tax planning and advice (e.g., consulting on statutory, regulatory or administrative developments, evaluation of Funds’ tax compliance function, etc.)
| up to $25,000 in the aggregate |
U.S. federal, state and local tax compliance (e.g., excise distribution reviews, etc.)
| up to $5,000 per Fund |
Review of federal, state, local and international income, franchise and other tax returns
| up to $5,000 per Fund |
Under the Pre-Approval Policy, the Audit Committee has also pre-approved the services set forth in the table below with respect to the registrant’s investment adviser and other entities controlling, controlled by or under common control with the investment adviser that provide ongoing services to the registrant (the “Control Affiliates”) up to the specified fee limit. This fee limit is based on aggregate fees to the investment adviser and its Control Affiliates.
| Service | Range of Fees |
| Non-Audit Services | |
Services associated with periodic reports and other documents filed with the SEC and assistance in responding to SEC comment letters
| up to $10,000 in the aggregate |
The Pre-Approval Policy requires the registrant’s independent auditors to report to the Audit Committee at each of its regular meetings regarding all services initiated since the last such report was rendered, including those services authorized by the Pre-Approval Policy.
(f) Not applicable.
(g) The aggregate non-audit fees billed by the registrant’s independent auditors for services rendered to the registrant and to its investment adviser and other service providers under common control with the adviser were $270,888 and $266,220 for the registrant’s fiscal years ended August 31, 2007 and August 31, 2006, respectively.
(h) In connection with its selection of the independent auditors, the registrant’s Audit Committee has considered the independent auditors’ provision of non-audit services to the registrant’s investment adviser and other service providers under common control with the adviser that were not required to be pre-approved pursuant to Rule 2-01(c)(7)(ii) of Regulation S-X. The Audit Committee has determined that the independent auditors’ provision of these services is compatible with maintaining the auditors’ independence.
Item 5. Audit Committee of Listed Registrants
Not applicable.
Item 6. Schedule of Investments
Included as part of report to shareholders filed under Item 1 of this Form N-CSR.
Item 7. Disclosure of Proxy Voting Policies and Procedures for Closed-End Management Investment Companies
Not applicable.
Item 8. Portfolio Managers of Closed-End Management Investment Companies
Not applicable.
Item 9. Purchases of Equity Securities by Closed-End Management Investment Company and Affiliated Purchasers
Not applicable.
Item 10. Submission of Matters to a Vote of Security Holders Not applicable.
Item 11. Controls and Procedures
The registrant’s principal executive officer and principal financial officer have evaluated the registrant’s disclosure controls and procedures within 90 days of the filing of this report and have concluded that they are effective in providing reasonable assurance that the information required to be disclosed by the registrant in its reports or statements filed under the Securities Exchange Act of 1934 is recorded, processed, summarized and reported within the time periods specified in the rules and forms of the Securities and Exchange Commission.
There were no significant changes in the registrant’s internal control over financial reporting that occurred during the second fiscal quarter of the period covered by the report to stockholders included herein (i.e., the registrant’s fourth fiscal quarter) that have materially affected, or are reasonably likely to materially affect, the registrant’s internal control over financial reporting.
Item 12. Exhibits
(a) (1) Code of Ethics
Not applicable.
(2) Certifications of Principal Executive Officer and Principal Financial Officer pursuant to Rule 30a-2 under the Investment Company Act of 1940 are attached hereto as Exhibit 99.CERT.
(3) Written solicitations to purchase securities pursuant to Rule 23c-1 under the Securities Exchange Act of 1934.
Not applicable.
(b) Certifications pursuant to Section 906 of the Sarbanes-Oxley Act of 2002 are furnished herewith as Exhibit 99.906CERT.
SIGNATURES
Pursuant to the requirements of the Securities Exchange Act of 1934 and the Investment Company Act of 1940, the registrant has duly caused this report to be signed on its behalf, by the undersigned, thereunto duly authorized.
Name of Registrant: Delaware Group Tax Free Fund
| PATRICK P. COYNE | |
| By: | Patrick P. Coyne | |
| Title: | Chief Executive Officer | |
| Date: | November 5, 2007 | |
Pursuant to the requirements of the Securities Exchange Act of 1934 and the Investment Company Act of 1940, this report has been signed below by the following persons on behalf of the registrant and in the capacities and on the dates indicated.
| PATRICK P. COYNE | |
| By: | Patrick P. Coyne | |
| Title: | Chief Executive Officer | |
| Date: | November 5, 2007 | |
| |
| |
| |
| RICHARD SALUS | |
| By: | Richard Salus | |
| Title: | Chief Financial Officer | |
| Date: | November 5, 2007 | |