UNITED STATES SECURITIES AND EXCHANGE COMMISSION
Washington, D.C. 20549
FORM N-CSR
CERTIFIED SHAREHOLDER REPORT OF REGISTERED MANAGEMENT
INVESTMENT COMPANIES
| Investment Company Act file number: | 811-03850 | |
| Exact name of registrant as specified in charter: | Delaware Group® Tax-Free Fund | |
| Address of principal executive offices: | 2005 Market Street | |
| Philadelphia, PA 19103 | ||
| Name and address of agent for service: | David F. Connor, Esq. | |
| 2005 Market Street | ||
| Philadelphia, PA 19103 | ||
| Registrant’s telephone number, including area code: | (800) 523-1918 | |
| Date of fiscal year end: | August 31 | |
| Date of reporting period: | August 31, 2017 |
Item 1. Reports to Stockholders
Table of Contents
Fixed income mutual funds
Delaware Tax-Free USA Fund
Delaware Tax-Free USA Intermediate Fund
Delaware National High-Yield Municipal Bond Fund
August 31, 2017
Carefully consider the Funds’ investment objectives, risk factors, charges, and expenses before investing. This and other information can be found in the Funds’ prospectus and their summary prospectuses, which may be obtained by visiting delawarefunds.com/literature or calling 800 523-1918. Investors should read the prospectus and the summary prospectus carefully before investing.
You can obtain shareholder reports and prospectuses online instead of in the mail.
Visit delawarefunds.com/edelivery.

Table of Contents
Experience Delaware FundsSM by Macquarie
Macquarie Investment Management (MIM) is a global asset manager with offices throughout the United States, Europe, Asia, and Australia. We are active managers who prioritize autonomy and accountability at the investment team level in pursuit of opportunities that matter for our clients. Delaware Funds is one of the longest-standing mutual fund families, with more than 75 years in existence.
If you are interested in learning more about creating an investment plan, contact your financial advisor.
You can learn more about Delaware Funds or obtain a prospectus for Delaware Tax-Free USA Fund, Delaware Tax-Free USA Intermediate Fund, and Delaware National High-Yield Municipal Bond Fund at delawarefunds.com/literature.
Manage your account online
| ● | Check your account balance and transactions |
| ● | View statements and tax forms |
| ● | Make purchases and redemptions |
Visit delawarefunds.com/account-access.
MIM is the marketing name for the registered investment advisers including Macquarie Investment Management Business Trust (MIMBT) (formerly, Delaware Management Business Trust), Macquarie Funds Management Hong Kong Limited, Macquarie Investment Management Austria Kapitalanlage AG, Macquarie Investment Management Global Limited, Macquarie Bank International Limited, Macquarie Investment Management Europe Limited, Macquarie Investment Management Limited, and Macquarie Capital Investment Management, Inc.
The Funds are distributed by Delaware Distributors, L.P., an affiliate of MIMBT and Macquarie Group Limited. MIM, a member of Macquarie Group, refers to the companies comprising the asset management division of Macquarie Group Limited and its subsidiaries and affiliates worldwide.
Other than Macquarie Bank Limited (MBL), none of the entities noted are authorized deposit-taking institutions for the purposes of the Banking Act 1959 (Commonwealth of Australia). The obligations of these entities do not represent deposits or other liabilities of MBL. MBL does not guarantee or otherwise provide assurance in respect of the obligations of these entities, unless noted otherwise. The Funds are governed by US laws and regulations.
| 1 | ||||
| 5 | ||||
| 20 | ||||
| 23 | ||||
| 29 | ||||
| 78 | ||||
| 80 | ||||
| 82 | ||||
| 88 | ||||
| 106 | ||||
| 120 | ||||
| 121 | ||||
| 126 | ||||
| 132 |
Unless otherwise noted, views expressed herein are current as of Aug. 31, 2017, and subject to change for events occurring after such date.
The Funds are not FDIC insured and are not guaranteed. It is possible to lose the principal amount invested.
Advisory services provided by Delaware Management Company, a series of MIMBT, a US registered investment advisor.
All third-party marks cited are the property of their respective owners.
© 2017 Macquarie Management Holdings, Inc. (formerly, Delaware Management Holdings, Inc.)
Table of Contents
| Delaware National Tax-Free Funds | September 12, 2017 | |||
| Performance preview (for the year ended August 31, 2017) | ||||
Delaware Tax-Free USA Fund (Institutional Class shares) | 1-year return | +0.68% | ||
Delaware Tax-Free USA Fund (Class A shares) | 1-year return | +0.41% | ||
Bloomberg Barclays Municipal Bond Index (benchmark) | 1-year return | +0.88% | ||
Lipper General & Insured Municipal Debt Funds Average | 1-year return | +0.32% | ||
Past performance does not guarantee future results.
For complete, annualized performance for Delaware Tax-Free USA Fund, please see the table on page 5.
Institutional Class shares are available without sales or asset-based distribution charges only to certain eligible accounts. The performance of Class A shares excludes the applicable sales charge. Both Institutional Class shares and Class A shares reflect the reinvestment of all distributions.
The Lipper General & Insured Municipal Debt Funds Average compares funds that either invest primarily in municipal debt issues in the top four credit ratings or invest primarily in municipal debt issues insured as to timely payment.
Please see page 9 for a description of the index. Index performance returns do not reflect any management fees, transaction costs, or expenses. Indices are unmanaged and one cannot invest directly in an index.
Delaware Tax-Free USA Intermediate Fund (Institutional Class shares) | 1-year return | +0.44% | ||
Delaware Tax-Free USA Intermediate Fund (Class A shares) | 1-year return | +0.35% | ||
Bloomberg Barclays 3–15 Year Blend Municipal Bond Index (benchmark) | 1-year return | +1.09% | ||
Lipper Intermediate Municipal Debt Funds Average | 1-year return | +0.53% |
Past performance does not guarantee future results.
For complete, annualized performance for Delaware Tax-Free USA Intermediate Fund, please see the table on page 10.
Institutional Class shares are available without sales or asset-based distribution charges only to certain eligible accounts. The performance of Class A shares excludes the applicable sales charge. Both Institutional Class shares and Class A shares reflect the reinvestment of all distributions.
The Lipper Intermediate Municipal Debt Funds Average compares funds that invest in municipal debt issues with dollar-weighted average maturities of 5 to 10 years.
Please see page 14 for a description of the Index. Index performance returns do not reflect any management fees, transaction costs, or expenses. Indices are unmanaged and one cannot invest directly in an index.
| Delaware National High-Yield Municipal Bond Fund (Institutional Class shares) | 1-year return | +0.92% | ||
| Delaware National High-Yield Municipal Bond Fund (Class A shares) | 1-year return | +0.72% | ||
| Bloomberg Barclays Municipal Bond Index (benchmark) | 1-year return | +0.88% | ||
| Lipper High Yield Municipal Debt Funds Average | 1-year return | +0.90% |
Past performance does not guarantee future results.
For complete, annualized performance for Delaware National High-Yield Municipal Bond Fund, please see the table on page 15.
Institutional Class shares are available without sales or asset-based distribution charges only to certain eligible accounts. The performance of Class A shares excludes the applicable sales charge. Both Institutional Class shares and Class A shares reflect the reinvestment of all distributions.
The Lipper High Yield Municipal Debt Funds Average compares funds that invest at least 50% of assets in lower-rated municipal debt issues.
Please see page 19 for a description of the index. Index performance returns do not reflect any management fees, transaction costs, or expenses. Indices are unmanaged and one cannot invest directly in an index.
1
Table of Contents
Portfolio management review
Delaware National Tax-Free Funds
Economic backdrop
The US economy continued its slow but steady expansion throughout the Funds’ fiscal year ended Aug. 31, 2017. The country’s gross domestic product (GDP) — a measure of the national economic output — grew by an annualized 2.8% in the third quarter of 2016 and 1.8% in the fourth quarter. In the first two quarters of 2017, US GDP increased by 1.2% and 3.0%, respectively. Meanwhile, the employment picture continued to improve, with the national unemployment rate falling to 4.4% at the end of the fiscal year, down a half percentage point from September 2016. (Source: US Commerce Department.)
This combination of consistent economic growth, an improving employment picture, and manageable inflation led the US Federal Reserve to raise its benchmark short-term interest rate by 0.25 percentage points on three separate occasions — in December, March, and June — bringing the federal funds rate to a range of 1.00%–1.25%, up from 0.25%–0.50% to start the fiscal year.
Municipal bond market conditions
In the first half of the Funds’ fiscal year, conditions were generally challenging for municipal bond investors. Initially, an increase in supply relative to demand for municipal securities tended to push down the prices of bonds and lift their yields (a bond’s price and yield move in opposite directions). In the fourth quarter of 2016, conditions worsened dramatically, especially following the US elections in November 2016. With the presidential victory of Donald Trump, expectations grew that Republicans would be able to swiftly execute their priority of cutting taxes, thus making tax-exempt bonds less compelling for residents of high-tax states.
Market conditions began to stabilize several weeks after the election, however. This stabilization continued throughout the rest of the Funds’ fiscal year, as the likelihood of a rapid
transformative change in tax policy appeared to diminish. Coupled with tighter supply, the tax-exempt bond market generally strengthened through August 2017.
Against this backdrop, the municipal bond yield curve steepened, meaning that yields on long-term municipal bonds rose more quickly than those on short-dated municipal bonds, while longer-dated bonds tended to underperform shorter-dated issues.
The following table shows municipal bond returns, by maturity and credit quality, for the 12 months ended Aug. 31, 2017:
| Returns by maturity | ||
5 years | 1.44% | |
10 years | 1.06% | |
22+ years | 0.42% | |
Source: Bloomberg | ||
Meanwhile, in continuation of a trend that has been in place for several years, lower-rated bonds generally outperformed their higher-quality counterparts. This trend is evident in the following table, which indicates municipal bond performance by credit quality rating for the Funds’ fiscal year:
Returns by credit rating | ||
AAA | 0.58% | |
AA | 0.75% | |
A | 1.06% | |
BBB | 1.91% | |
BB and below | 2.25% | |
Source: Bloomberg |
Among the market’s strong-performing sectors, tobacco bonds led the way, as their credit spreads continued to narrow, and investors seemed increasingly comfortable assuming the credit risk inherent in these often lower-rated securities. Meanwhile, bonds issued by Puerto Rico, which, like tobacco bonds, tended to be found in the high yield municipal bond universe, struggled during
2
Table of Contents
the fiscal year as concerns mounted about the US territory’s credit quality.
Focused on credit research
For the three funds profiled in this report, we maintained a consistent management strategy. We do this regardless of underlying market conditions. We have a bottom-up investment approach, meaning we evaluate potential bond holdings one at a time. Working closely with our team’s municipal analysts, we conduct thorough research to find securities offering what we see as a desirable trade-off between income and credit risk.
Following this approach, we are often led to bonds rated lower investment grade or below investment grade, where we look to find value for shareholders. During the fiscal year ended Aug. 31, 2017, roughly 44% of the net assets of Delaware Tax-Free USA Fund were invested in bonds rated A and BBB, the two lowest rating tiers of the investment grade bond universe. Approximately 41% of the net assets of Delaware Tax-Free USA Intermediate Fund were invested in these credit tiers during the same period.
In addition, both Funds had meaningful allocations to high yield municipal bonds, specifically those with credit ratings below BBB. By prospectus, both Funds are able to invest in these credit tiers, and we pay close attention to credit risk when selecting securities, focusing on those providing what we see as sufficiently high yields for the risk.
Meanwhile, the mandate of Delaware National High-Yield Municipal Bond Fund allows us to focus on high yield securities to a greater degree. Accordingly, as of Aug. 31, 2017, more than 55% of the Fund’s net assets were invested in bonds rated below investment grade.
Portfolio positioning
Throughout the fiscal year, we maintained a roughly neutral duration – or sensitivity to changes in interest rates – relative to the Funds’
respective benchmarks, seeking to add value through bond selection rather than by managing interest rate exposure.
When the municipal bond market sold off in the fourth quarter of 2016, we believed that the decline in bond prices was significantly greater than justified. Accordingly, we took advantage of opportunities to invest in bonds at prices we saw as undeservedly low relative to their credit risk. As the fiscal period progressed and the market became less concerned about the near-term likelihood of federal tax reform, many of these securities regained a portion of their lost value, adding to the Funds’ results.
Since the market recovered, we found it somewhat more challenging to find similarly attractively priced bonds. Accordingly, we became increasingly selective in our purchases, searching for bonds that offered yields sufficiently high to compensate us for their credit risk.
Proceeds for our purchases primarily came from a combination of new shareholder investments and bond calls. We also periodically sold short-dated bonds with more limited performance prospects and reinvested the proceeds in longer-dated opportunities we found attractive.
Particularly in calendar year 2017, we positioned the Funds’ portfolios for a flattening yield curve, because we anticipated that longer-duration bonds would outperform shorter-dated bonds. This view reflected our expectation for continued solid economic growth and subdued inflation, factors that we believed could put a ceiling on long-term interest rates and support the Funds’ positioning.
Throughout the fiscal period, we continued to avoid the tax-exempt bonds issued by the credit-challenged Commonwealth of Puerto Rico; our lack of exposure to these credits added value. Another source of positive results came from our late-period investment in the general obligation debt of the State of Illinois. Shortly after Illinois
3
Table of Contents
Delaware National Tax-Free Funds
saw its credit rating downgraded in July on budgetary concerns, its bonds lost significant value. In our opinion, the decline was more than the securities’ income stream warranted, and we established a small position. In fact, the bonds saw their credit spreads begin to narrow shortly after this purchase due to the enactment of a fiscal 2018 budget. We believe this is a good example of our investment approach in action. After monitoring the issuer for some time, we were willing to invest, but only after our assessment of the securities’ risk-reward trade-off moved in the Funds’ favor.
Notable performance factors
As stated previously, tobacco-securitization bonds, especially lower-rated issues, were strong performers overall. Accordingly, many of the Funds’ strongest-performing individual holdings came from this sector.
For example, all three Funds benefited from zero-coupon Golden State Tobacco bonds. These issues returned more than 20% for the Funds. A portion of the Golden State Tobacco bonds were refunded which benefited the remaining securities left outstanding. Also, in Delaware Tax-Free USA Intermediate Fund, Railsplitter Tobacco Settlement Authority (Illinois) bonds fared well. These investment grade-rated securities were helped by their short-term call dates, which positioned them well amid rising interest rates, and their attractive income stream relative to the bonds’ credit rating.
Elsewhere, a position in student housing bonds for Bowling Green State University (Ohio) added to results for Delaware Tax-Free USA Fund. Not only did these bonds benefit from their lower-investment-grade credit rating and attractive level of income, they were prerefunded during the fiscal period. Such a situation often generates an immediate price increase, as the bonds become backed by escrowed short-term US government
securities and effectively experience an increase in credit quality.
Meanwhile, in Delaware National High-Yield Municipal Bond Fund, Allegheny County Industrial Development Authority bonds for United States Steel were meaningful contributors. These corporate-backed municipal bonds benefited from a more favorable business backdrop accompanied by rising steel prices.
On the negative side, its investment in Connecticut general obligation bonds hampered Delaware Tax-Free USA Fund. These higher-quality issues, rated AA- by Standard & Poor’s, struggled partly due to the state’s financial challenges, which caused credit spreads on Connecticut-backed issues to widen relative to those of other states.
A position in Texas private activity bonds issued for Mobility Partners weighed on Delaware Tax-Free USA Fund and Delaware Tax-Free USA Intermediate Fund. These lower-investment-grade tollway bonds, which were funding a North Tarrant Expressway in the Dallas/Fort Worth region of Texas, experienced a decline in their pricing during the fiscal period.
In Delaware Tax-Free USA Intermediate Fund,a similar pricing decline weighed on a position in Tulsa (Oklahoma) revenue refunding bonds for American Airlines. Despite their negative return for the fiscal year, we continued to see these credits as fundamentally sound.
In Delaware National High-Yield Municipal Bond Fund, the largest individual detractors were two bonds that experienced notable credit challenges during the fiscal year: Orange County Industrial Development Authority bonds for VitAg Corporation, which were issued to build a solid-waste processing facility in Zellwood, Fla., and Wisconsin dedicated-tax bonds for Goodwill Industries, an operator of donation centers and retail locations that filed for bankruptcy late in the Fund’s fiscal year.
4
Table of Contents
| Performance summaries | ||
| Delaware Tax-Free USA Fund | August 31, 2017 | |
The performance data quoted represent past performance and does not guarantee future results. Investment return and principal value will fluctuate so that shares, when redeemed, may be worth more or less than their original cost. Current performance may be lower or higher than the performance quoted. Performance data current to the most recent month end may be obtained by calling 800 523-1918 or visiting delawarefunds.com/performance.
| Fund and benchmark performance1, 2 | Average annual total returns through August 31, 2017 | |||||||||||||||
| 1 year | 5 years | 10 years | Lifetime | |||||||||||||
Class A (Est. Jan. 11, 1984) | ||||||||||||||||
Excluding sales charge | +0.41% | +3.15% | +4.73% | +6.56% | ||||||||||||
Including sales charge | -4.14% | +2.20% | +4.25% | +6.42% | ||||||||||||
Class C (Est. Nov. 29, 1995) | ||||||||||||||||
Excluding sales charge | -0.35% | +2.36% | +3.93% | +3.83% | ||||||||||||
Including sales charge | -1.30% | +2.36% | +3.93% | +3.83% | ||||||||||||
Institutional Class (Est. Dec. 31, 2008) | ||||||||||||||||
Excluding sales charge | +0.68% | +3.39% | n/a | +6.50% | ||||||||||||
Including sales charge | +0.68% | +3.39% | n/a | +6.50% | ||||||||||||
Bloomberg Barclays Municipal Bond Index | +0.88% | +3.23% | +4.73% | +5.43%* | ||||||||||||
*The benchmark lifetime return is for Institutional Class share comparison only and is calculated using the last business day in the month of the Fund’s Institutional Class inception date.
1Returns reflect the reinvestment of all distributions and are presented both with and without the applicable sales charges described below. Returns do not reflect the deduction of taxes the shareholder would pay on Fund distributions or redemptions of Fund shares.
Expense limitations were in effect for certain classes during some or all of the periods shown in the “Fund and benchmark performance” table. Expenses for each class are listed on the “Fund expense ratios” table on page 7. Performance would have been lower had expense limitations not been in effect.
Institutional Class shares are available without sales or asset-based distribution charges only to certain eligible accounts.
Class A shares are sold with a maximum front-end sales charge of 4.50%, and have an annual distribution and service fee of 0.25% of average daily net assets. The Board has adopted a formula for calculating 12b-1 plan fees for the Fund’s Class A shares. The Fund’s Class A shares are
currently subject to a blended 12b-1 fee equal to the sum of: (i) 0.10% of average daily net assets representing shares acquired prior to June 1, 1992, and (ii) 0.25% of average daily net assets representing shares acquired on or after June 1, 1992. All Class A shares currently bear 12b-1 fees at the same rate, the blended rate, currently 0.25% of average daily net assets, based on the formula described above. This method of calculating Class A 12b-1 fees may be discontinued at the sole discretion of the Board. Performance for Class A shares, excluding sales charges, assumes that no front-end sales charge applied.
Class C shares are sold with a contingent deferred sales charge of 1.00% if redeemed during the first 12 months. They are also subject to an annual distribution and service fee of 1.00% of average daily net assets. Performance for Class C shares, excluding sales charges, assumes either that contingent deferred sales charges did not apply or that the investment was not redeemed.
5
Table of Contents
Performance summaries
Delaware Tax-Free USA Fund
Fixed income securities and bond funds can lose value, and investors can lose principal, as interest rates rise. They also may be affected by economic conditions that hinder an issuer’s ability to make interest and principal payments on its debt.
The Fund may also be subject to prepayment risk, the risk that the principal of a bond that is held by a Portfolio will be prepaid prior to maturity, at the time when interest rates are lower than what the bond was paying. A portfolio may then have to reinvest that money at a lower interest rate.
High yielding, non-investment-grade bonds (junk bonds) involve higher risk than investment grade bonds. The high yield secondary market is particularly susceptible to liquidity problems when institutional investors, such as mutual funds and certain other financial institutions, temporarily stop buying bonds for regulatory, financial, or other reasons. In addition, a less liquid secondary market makes it more difficult for the Fund to obtain precise valuations of the high yield securities in its portfolio.
Substantially all dividend income derived from tax-free funds is exempt from federal income tax. Some income may be subject to state or local taxes and/or the federal alternative minimum tax (AMT) that applies to certain investors. Capital gains, if any, are taxable.
Duration number will change as market conditions change. Therefore, duration should not be solely relied upon to indicate a municipal bond fund’s potential volatility.
This document may mention bond ratings published by nationally recognized statistical rating organizations (NRSROs) Standard & Poor’s, Moody’s Investors Service, and Fitch, Inc. For securities rated by an NRSRO other than S&P, the rating is converted to the equivalent S&P credit rating. Bonds rated AAA are rated as having the highest quality and are generally considered to have the lowest degree of investment risk. Bonds rated AA are considered to be of high quality, but with a slightly higher degree of risk than bonds rated AAA. Bonds rated A are considered to have many favorable investment qualities, though they are somewhat more susceptible to adverse economic conditions. Bonds rated BBB are believed to be of medium-grade quality and generally riskier over the long term. Bonds rated BB, B, and CCC are regarded as having significant speculative characteristics, with BB indicating the least degree of speculation of the three.
6
Table of Contents
2The Fund’s expense ratios, as described in the most recent prospectus, are disclosed in the following “Fund expense ratios” table. Delaware Management Company has agreed to reimburse certain expenses and/or waive certain fees in order to prevent total annual fund operating expenses (excluding any 12b-1 fees, acquired fund fees and expenses, taxes, interest, short sale and dividend interest expenses, brokerage fees, certain insurance costs, and nonroutine expenses or costs, including, but not limited to, those relating to reorganizations, litigation, conducting shareholder meetings, and liquidations (collectively, nonroutine expenses)) from exceeding 0.56% of the Fund’s average daily net assets during the period from Sept. 1, 2016 through Aug. 31, 2017.* Please see the most recent prospectus and any applicable supplement(s) for additional information on these fee waivers and/or reimbursements. Please see the “Financial highlights” section in this report for the most recent expense ratios.
| Fund expense ratios | Class A | Class C | Institutional Class | |||
Total annual operating expenses | 0.95% | 1.70% | 0.70% | |||
(without fee waivers) | ||||||
Net expenses | 0.81% | 1.56% | 0.56% | |||
(including fee waivers, if any) | ||||||
Type of waiver | Contractual | Contractual | Contractual |
*The aggregate contractual waiver period covering this report is from Dec. 29, 2015 through Dec. 29, 2017.
7
Table of Contents
Performance summaries
Delaware Tax-Free USA Fund
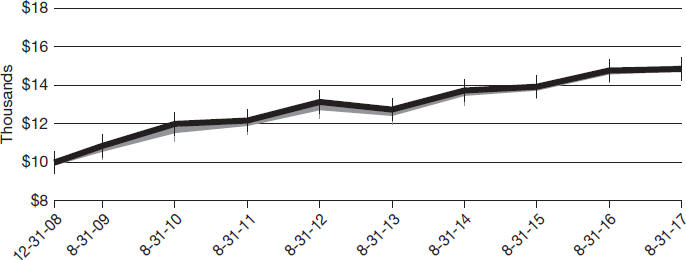
Performance of a $10,000 investment1
Class A shares
Average annual total returns from Aug. 31, 2007, through Aug. 31, 2017
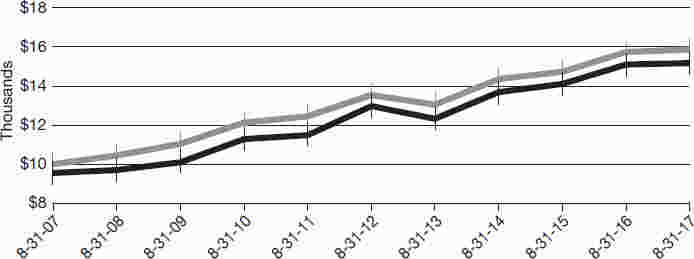
| For period beginning Aug. 31, 2007, through Aug. 31, 2017 | Starting value | Ending value | ||||||
 Bloomberg Barclays Municipal Bond Index Bloomberg Barclays Municipal Bond Index | $10,000 | $15,870 | ||||||
 Delaware Tax-Free USA Fund — Class A shares Delaware Tax-Free USA Fund — Class A shares | $9,550 | $15,158 | ||||||
Institutional Class shares
Average annual total returns from Dec. 31, 2008 (inception date) through Aug. 31, 2017
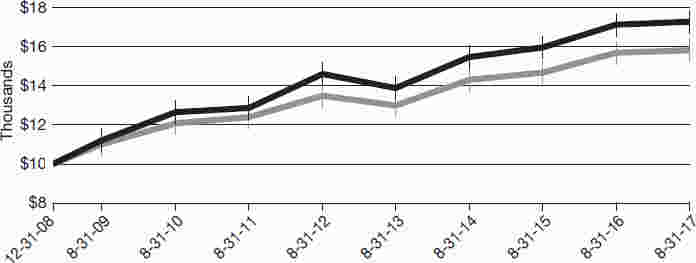
| For period beginning Dec. 31, 2008, through Aug. 31, 2017 | Starting value | Ending value | ||||||
| Delaware Tax-Free USA Fund — Institutional Class shares | $10,000 | $17,263 | ||||||
| Bloomberg Barclays Municipal Bond Index | $10,000 | $15,820 | ||||||
8
Table of Contents
1The “Performance of a $10,000 investment” graph for Class A shares assumes $10,000 invested in Class A shares of the Fund on Aug. 31, 2007, and includes the effect of a 4.50% front-end sales charge and the reinvestment of all distributions. The graph also assumes $10,000 invested in the Bloomberg Barclays Municipal Bond Index as of Aug. 31, 2007.
The “Performance of a $10,000 investment” graph for Institutional Class shares assumes $10,000 invested in Institutional Class shares of the Fund on Dec. 31, 2008, and includes the reinvestment of all distributions. The graph also assumes $10,000 invested in the Bloomberg Barclays Municipal Bond Index as of Dec. 31, 2008.
The graphs do not reflect the deduction of taxes the shareholders would pay on Fund distributions or redemptions of Fund shares. Expense
limitations were in effect for some or all of the periods shown. Performance would have been lower had expense limitations not been in effect. Expenses are listed in the “Fund expense ratios” table on page 7. Please note additional details on pages 5 through 9.
The Bloomberg Barclays Municipal Bond Index measures the total return performance of the long-term, investment grade tax-exempt bond market.
Index performance returns do not reflect any management fees, transaction costs, or expenses. Indices are unmanaged and one cannot invest directly in an index. Past performance is not a guarantee of future results.
Performance of other Fund classes will vary due to different charges and expenses.
| Nasdaq symbols | CUSIPs | |||||
Class A | DMTFX | 245909106 | ||||
Class C | DUSCX | 245909700 | ||||
Institutional Class | DTFIX | 24610H104 |
9
Table of Contents
| Performance summaries | ||
| Delaware Tax-Free USA Intermediate Fund | August 31, 2017 | |
The performance quoted represents past performance and does not guarantee future results. Investment return and principal value of an investment will fluctuate so that shares, when redeemed, may be worth more or less than their original cost. Current performance may be lower or higher than the performance quoted. Performance data current to the most recent month end may be obtained by calling 800 523-1918 or visiting delawarefunds.com/performance.
| Fund and benchmark performance1, 2 | Average annual total returns through August 31, 2017 | |||||||||||||||
| 1 year | 5 years | 10 years | Lifetime | |||||||||||||
Class A (Est. Jan. 7, 1993) | ||||||||||||||||
Excluding sales charge | +0.35% | +2.32% | +3.91% | +4.76% | ||||||||||||
Including sales charge | -2.41% | +1.75% | +3.61% | +4.65% | ||||||||||||
Class C (Est. Nov. 29, 1995) | ||||||||||||||||
Excluding sales charge | -0.50% | +1.45% | +3.03% | +3.58% | ||||||||||||
Including sales charge | -1.48% | +1.45% | +3.03% | +3.58% | ||||||||||||
Institutional Class (Est. Dec. 31, 2008) | ||||||||||||||||
Excluding sales charge | +0.44% | +2.46% | n/a | +4.66% | ||||||||||||
Including sales charge | +0.44% | +2.46% | n/a | +4.66% | ||||||||||||
Bloomberg Barclays 3–15 Year Blend | ||||||||||||||||
Municipal Bond Index | +1.09% | +2.93% | +4.60% | +4.69%* | ||||||||||||
*The benchmark lifetime return is for Institutional Class share comparison only and is calculated using the last business day in the month of the Fund’s Institutional Class inception date.
1Returns reflect the reinvestment of all distributions and are presented both with and without the applicable sales charges described below. Returns do not reflect the deduction of taxes the shareholder would pay on Fund distributions or redemptions of Fund shares.
Expense limitations were in effect for certain classes during some or all of the periods shown in the “Fund and benchmark performance” table. Expenses for each class are listed on the “Fund expense ratios” table on page 12. Performance would have been lower had expense limitations not been in effect.
Institutional Class shares are available without sales or asset-based distribution charges only to certain eligible accounts.
Class A shares are sold with a maximum front-end sales charge of 2.75%, and have an annual distribution and service fee of 0.25% of average daily net assets. This fee was contractually limited
to 0.15% of average daily net assets from Sept. 1, 2016 through Aug. 31, 2017.** Performance for Class A shares, excluding sales charges, assumes that no front-end sales charge applied.
Class C shares are sold with a contingent deferred sales charge of 1.00% if redeemed during the first 12 months. They are also subject to an annual distribution and service fee of 1.00% of average daily net assets. Performance for Class C shares, excluding sales charges, assumes either that contingent deferred sales charges did not apply or that the investment was not redeemed.
Fixed income securities and bond funds can lose value, and investors can lose principal, as interest rates rise. They also may be affected by economic conditions that hinder an issuer’s ability to make interest and principal payments on its debt.
10
Table of Contents
The Fund may also be subject to prepayment risk, the risk that the principal of a bond that is held by a portfolio will be prepaid prior to maturity, at the time when interest rates are lower than what the bond was paying. A portfolio may then have to reinvest that money at a lower interest rate.
High yielding, non-investment-grade bonds (junk bonds) involve higher risk than investment grade bonds. The high yield secondary market is particularly susceptible to liquidity problems when institutional investors, such as mutual funds and certain other financial institutions, temporarily stop buying bonds for regulatory, financial, or other reasons. In addition, a less liquid secondary market makes it more difficult for the Fund to obtain precise valuations of the high yield securities in its portfolio.
Substantially all dividend income derived from tax-free funds is exempt from federal income tax. Some income may be subject to state or local taxes and/or the federal alternative minimum tax (AMT) that applies to certain investors. Capital gains, if any, are taxable.
Duration number will change as market conditions change. Therefore, duration should not be solely relied upon to indicate a municipal bond fund’s potential volatility.
This document may mention bond ratings published by nationally recognized statistical rating organizations (NRSROs) Standard & Poor’s, Moody’s Investors Service, and Fitch, Inc. For securities rated by an NRSRO other than S&P, the rating is converted to the equivalent S&P credit rating. Bonds rated AAA are rated as having the highest quality and are generally considered to have the lowest degree of investment risk. Bonds rated AA are considered to be of high quality, but with a slightly higher degree of risk than bonds rated AAA. Bonds rated A are considered to have many favorable investment qualities, though they are somewhat more susceptible to adverse economic conditions. Bonds rated BBB are believed to be of medium-grade quality and generally riskier over the long term. Bonds rated BB, B, and CCC are regarded as having significant speculative characteristics, with BB indicating the least degree of speculation of the three.
11
Table of Contents
Performance summaries
Delaware Tax-Free USA Intermediate Fund
2The Fund’s expense ratios, as described in the most recent prospectus, are disclosed in the following “Fund expense ratios” table. Delaware Management Company has agreed to reimburse certain expenses and/or waive certain fees in order to prevent total annual fund operating expenses (excluding any 12b-1 fees, acquired fund fees and expenses, taxes, interest, short sale and dividend interest expenses, brokerage fees, certain insurance costs, and nonroutine expenses or costs, including, but not limited to, those relating to reorganizations, litigation, conducting shareholder meetings, and liquidations (collectively, nonroutine expenses)) from exceeding 0.60% of the Fund’s average daily net assets during the period from Sept. 1, 2016 through Aug. 31, 2017.** Please see the most recent prospectus and any applicable
supplement(s) for additional information on these fee waivers and/or reimbursements. Please see the “Financial highlights” section of this report for the most recent expense ratios.
| Fund expense ratios | Class A | Class C | Institutional Class | |||||||
Total annual operating expenses (without fee waivers) |
0.92% |
1.67% |
0.67% | |||||||
Net expenses (including fee waivers, if any) | 0.75% | 1.60% | 0.60% | |||||||
Type of waiver | Contractual | Contractual | Contractual |
**The aggregate contractual waiver period covering this report is from Dec. 29, 2015 through Dec. 29, 2017.
12
Table of Contents
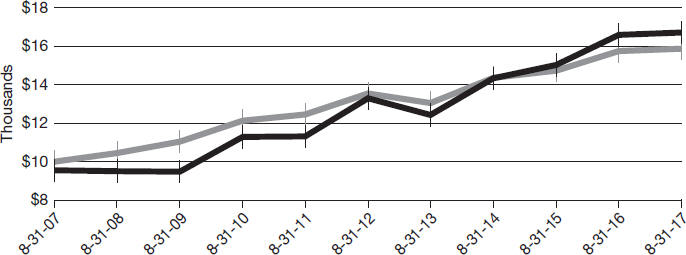
Performance of a $10,000 investment1
Class A shares
Average annual total returns from Aug. 31, 2007, through Aug. 31, 2017
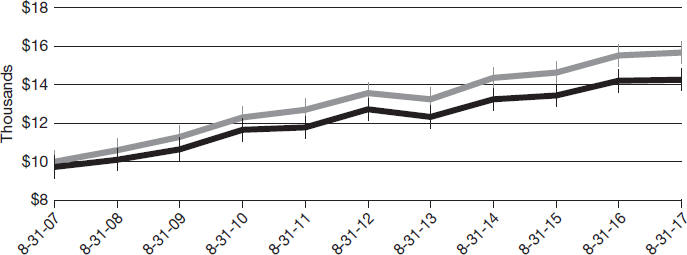
| For period beginning Aug. 31, 2007, through Aug. 31, 2017 | Starting value | Ending value | ||||||
| $10,000 | $15,674 | ||||||
| $9,725 | $14,264 | ||||||
Institutional Class shares
Average annual total returns from Dec. 31, 2008 (inception date) through Aug. 31, 2017
| For period beginning Dec. 31, 2008, through Aug. 31, 2017 | Starting value | Ending value | ||||||
| $10,000 | $14,882 | ||||||
| $10,000 | $14,846 | ||||||
13
Table of Contents
Performance summaries
Delaware Tax-Free USA Intermediate Fund
1The “Performance of a $10,000 investment” graph for Class A share assumes $10,000 invested in Class A shares of the Fund on Aug. 31, 2007, and includes the effect of a 2.75% front-end sales charge and the reinvestment of all distributions. The graph also assumes $10,000 invested in the Bloomberg Barclays 3–15 Year Blend Municipal Bond Index as of Aug. 31, 2007.
The “Performance of a $10,000 investment” graph for Institutional shares assumes $10,000 invested in Institutional Class shares of the Fund on Dec. 31, 2008, and includes the reinvestment of all distributions The graph also assumes $10,000 invested in the Bloomberg Barclays 3–15 Year Blend Municipal Bond Index as of Dec. 31, 2008.
The graphs do not reflect the deduction of taxes the shareholders would pay on Fund distributions or redemptions of Fund shares. Expense limitations were in effect for some or all of the periods shown. Performance would have been
lower had expense limitations not been in effect. Expenses are listed in the “Fund expense ratios” table on page 12. Please note additional details on pages 10 through 14.
The Bloomberg Barclays 3–15 Year Blend Municipal Bond Index measures the total return performance of investment grade, US tax-exempt bonds with maturities from 2 to 17 years.
Index performance returns do not reflect any management fees, transaction costs, or expenses. Indices are unmanaged and one cannot invest directly in an index. Past performance is not a guarantee of future results.
Performance of other Fund classes will vary due to different charges and expenses.
| Nasdaq symbols | CUSIPs | |||||||
Class A | DMUSX | 245909304 | ||||||
Class C | DUICX | 245909882 | ||||||
Institutional Class | DUSIX | 24610H203 |
14
Table of Contents
| Performance summaries | ||
| Delaware National High-Yield Municipal Bond Fund | August 31, 2017 | |
The performance quoted represents past performance and does not guarantee future results. Investment return and principal value of an investment will fluctuate so that shares, when redeemed, may be worth more or less than their original cost. Current performance may be lower or higher than the performance quoted. Performance data current to the most recent month end may be obtained by calling 800 523-1918 or visiting delawarefunds.com/performance.
| Fund and benchmark performance1, 2 | Average annual total returns through August 31, 2017 | |||||||||||||||
| 1 year | 5 years | 10 years | Lifetime | |||||||||||||
Class A (Est. Sept. 22, 1986) | ||||||||||||||||
Excluding sales charge | +0.72% | +4.68% | +5.75% | +6.30% | ||||||||||||
Including sales charge | -3.83% | +3.71% | +5.27% | +6.14% | ||||||||||||
Class C (Est. May 26, 1997) | ||||||||||||||||
Excluding sales charge | -0.11% | +3.87% | +4.95% | +4.63% | ||||||||||||
Including sales charge | -1.07% | +3.87% | +4.95% | +4.63% | ||||||||||||
Institutional Class (Est. Dec. 31, 2008) | ||||||||||||||||
Excluding sales charge | +0.92% | +4.93% | n/a | +9.63% | ||||||||||||
Including sales charge | +0.92% | +4.93% | n/a | +9.63% | ||||||||||||
Bloomberg Barclays Municipal Bond Index | +0.88% | +3.23% | +4.73% | +5.43%* | ||||||||||||
*The benchmark lifetime return is for Institutional Class share comparison only and is calculated using the last business day in the month of the Fund’s Institutional Class inception date.
1Returns reflect the reinvestment of all distributions and are presented both with and without the applicable sales charges described below. Returns do not reflect the deduction of taxes the shareholder would pay on Fund distributions or redemptions of Fund shares.
Expense limitations were in effect for certain classes during some or all of the periods shown in the “Fund and benchmark performance” table. Expenses for each class are listed on the “Fund expense ratios” table on page 17. Performance would have been lower had expense limitations not been in effect.
Institutional Class shares are available without sales or asset-based distribution charges only to certain eligible accounts.
Class A shares are sold with a maximum front-end sales charge of 4.50%, and have an annual distribution and service fee of 0.25% of average daily net assets. Performance for Class A shares, excluding sales charges, assumes that no front-end sales charge applied.
Class C shares are sold with a contingent deferred sales charge of 1.00% if redeemed during the first 12 months. They are also subject to an annual distribution and service fee of 1.00% of average daily net assets. Performance for Class C shares, excluding sales charges, assumes either that contingent deferred sales charges did not apply or that the investment was not redeemed.
Fixed income securities and bond funds can lose value, and investors can lose principal, as interest rates rise. They also may be affected by economic conditions that hinder an issuer’s ability to make interest and principal payments on its debt.
The Fund may also be subject to prepayment risk, the risk that the principal of a bond that is held by a portfolio will be prepaid prior to maturity, at the time when interest rates are lower than what the bond was paying. A portfolio may then have to reinvest that money at a lower interest rate.
High yielding, non-investment-grade bonds (junk bonds) involve higher risk than investment grade bonds. The high yield secondary market is
15
Table of Contents
Performance summaries
Delaware National High-Yield Municipal Bond Fund
particularly susceptible to liquidity problems when institutional investors, such as mutual funds and certain other financial institutions, temporarily stop buying bonds for regulatory, financial, or other reasons. In addition, a less liquid secondary market makes it more difficult for the Fund to obtain precise valuations of the high yield securities in its portfolio.
Substantially all dividend income derived from tax-free funds is exempt from federal income tax. Some income may be subject to state or local taxes and/or the federal alternative minimum tax (AMT) that applies to certain investors. Capital gains, if any, are taxable.
Duration number will change as market conditions change. Therefore, duration should not be solely relied upon to indicate a municipal bond fund’s potential volatility.
This document may mention bond ratings published by nationally recognized statistical rating organizations (NRSROs) Standard & Poor’s, Moody’s Investors Service, and Fitch, Inc. For securities rated by an NRSRO other than S&P, the rating is converted to the equivalent S&P credit rating. Bonds rated AAA are rated as having the highest quality and are generally considered to have the lowest degree of investment risk. Bonds rated AA are considered to be of high quality, but with a slightly higher degree of risk than bonds rated AAA. Bonds rated A are considered to have many favorable investment qualities, though they are somewhat more susceptible to adverse economic conditions. Bonds rated BBB are believed to be of medium-grade quality and generally riskier over the long term. Bonds rated BB, B, and CCC are regarded as having significant speculative characteristics, with BB indicating the least degree of speculation of the three.
16
Table of Contents
2The Fund’s expense ratios, as described in the most recent prospectus, are disclosed in the following “Fund expense ratios” table. Delaware Management Company has agreed to reimburse certain expenses and/or waive certain fees in order to prevent total annual fund operating expenses (excluding any 12b-1 fees, acquired fund fees and expenses, taxes, interest, short sale and dividend interest expenses, brokerage fees, certain insurance costs, and nonroutine expenses or costs, including, but not limited to, those relating to reorganizations, litigation, conducting shareholder meetings, and liquidations (collectively, nonroutine expenses)) from exceeding 0.60% of the Fund’s average daily net assets during the period from Sept. 1, 2016 through Aug. 31, 2017.* Please see the most recent prospectus and any applicable supplement(s) for additional information on these fee waivers and/or reimbursements. Please see the “Financial highlights” section of this report for the most recent expense ratios.
| Fund expense ratios | Class A | Class C | Institutional Class | |||
Total annual operating expenses (without fee waivers) | 0.94% | 1.69% | 0.69% | |||
Net expenses (including fee waivers, if any) | 0.85% | 1.60% | 0.60% | |||
Type of waiver | Contractual | Contractual | Contractual |
*The aggregate contractual waiver period covering this report is from Dec. 29, 2015 through Dec. 29, 2017.
17
Table of Contents
Performance summaries
Delaware National High-Yield Municipal Bond Fund
Performance of a $10,000 investment1
Class A shares
Average annual total returns from Aug. 31, 2007, through Aug. 31, 2017
| For period beginning Aug. 31, 2007, through Aug. 31, 2017 | Starting value | Ending value | ||||||
| $9,550 | $16,706 | ||||||
| $10,000 | $15,870 | ||||||
Institutional Class shares
Average annual total returns from Dec. 31, 2008 (inception date) through Aug. 31, 2017
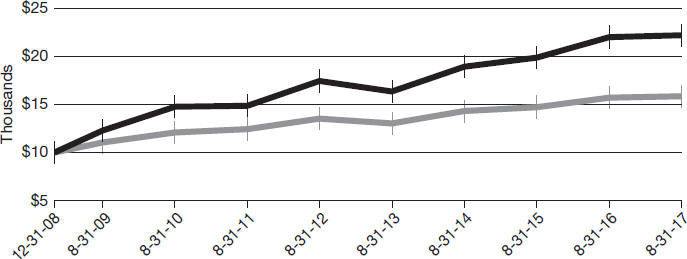
| For period beginning Dec. 31, 2008, through Aug. 31, 2017 | Starting value | Ending value | ||||||
| $10,000 | $22,182 | ||||||
| $10,000 | $15,820 | ||||||
18
Table of Contents
1The “Performance of a $10,000 investment” graph for Class A shares assumes $10,000 invested in Class A shares of the Fund on Aug. 31, 2007, and includes the effect of a 4.50% front-end sales charge and the reinvestment of all distributions. The graph also assumes $10,000 invested in the Bloomberg Barclays Municipal Bond Index as of Aug. 31, 2007.
The “Performance of a $10,000 investment” graph for Institutional Class assumes $10,000 invested in Institutional Class shares of the Fund on Dec. 31, 2008, and includes the reinvestment of all distributions. The graph also assumes $10,000 invested in the Bloomberg Barclays Municipal Bond Index as of Dec. 31, 2008.
The graphs do not reflect the deduction of taxes the shareholders would pay on Fund distributions or redemptions of Fund shares. Expense
limitations were in effect for some or all of the periods shown. Performance would have been lower had expense limitations not been in effect. Expenses are listed in the “Fund expense ratios” table on page 17. Please note additional details on pages 15 through 19.
The Bloomberg Barclays Municipal Bond Index measures the total return performance of the long-term, investment grade tax-exempt bond market.
Index performance returns do not reflect any management fees, transaction costs, or expenses. Indices are unmanaged and one cannot invest directly in an index. Past performance is not a guarantee of future results.
Performance of other Fund classes will vary due to different charges and expenses.
| Nasdaq symbols | CUSIPs | |||||||
Class A | CXHYX | 928928241 | ||||||
Class C | DVHCX | 928928225 | ||||||
Institutional Class | DVHIX | 24610H302 | ||||||
19
Table of Contents
For the six-month period from March 1, 2017 to August 31, 2017 (Unaudited)
As a shareholder of a Fund, you incur two types of costs: (1) transaction costs, including sales charges (loads) on purchase payments, reinvested dividends, or other distributions; redemption fees; and exchange fees; and (2) ongoing costs, including management fees; distribution and/or service (12b-1) fees; and other Fund expenses. These following examples are intended to help you understand your ongoing costs (in dollars) of investing in a Fund and to compare these costs with the ongoing costs of investing in other mutual funds.
The examples are based on an investment of $1,000 invested at the beginning of the period and held for the entire six-month period from March 1, 2017 to Aug. 31, 2017.
Actual expenses
The first section of the tables shown, “Actual Fund return,” provides information about actual account values and actual expenses. You may use the information in this section of the table, together with the amount you invested, to estimate the expenses that you paid over the period. Simply divide your account value by $1,000 (for example, an $8,600 account value divided by $1,000 = 8.6), then multiply the result by the number in the first section under the heading entitled “Expenses Paid During Period” to estimate the expenses you paid on your account during this period.
Hypothetical example for comparison purposes
The second section of the tables shown, “Hypothetical 5% return,” provides information about hypothetical account values and hypothetical expenses based on the Funds’ actual expense ratios and an assumed rate of return of 5% per year before expenses, which is not the Funds’ actual return. The hypothetical account values and expenses may not be used to estimate the actual ending account balance or expenses you paid for the period. You may use this information to compare the ongoing costs of investing in the Funds and other funds. To do so, compare this 5% hypothetical example with the 5% hypothetical examples that appear in the shareholder reports of the other funds.
Please note that the expenses shown in the tables are meant to highlight your ongoing costs only and do not reflect any transactional costs, such as sales charges (loads), redemption fees, or exchange fees. Therefore, the second section of each table is useful in comparing ongoing costs only, and will not help you determine the relative total costs of owning different funds. In addition, if these transactional costs were included, your costs would have been higher. The Funds’ expenses shown in the tables reflect fee waivers in effect. The expenses shown in each table assume reinvestment of all dividends and distributions.
20
Table of Contents
Delaware Tax-Free USA Fund
Expense analysis of an investment of $1,000
| Beginning Account Value 3/1/17 | Ending Account Value 8/31/17 | Annualized Expense Ratio | Expenses Paid During Period 3/1/17 to 8/31/17* | |||||||||||||||||
Actual Fund return† | ||||||||||||||||||||
Class A | $1,000.00 | $1,036.20 | 0.81 | % | $4.16 | |||||||||||||||
Class C | 1,000.00 | 1,031.50 | 1.56 | % | 7.99 | |||||||||||||||
Institutional Class | 1,000.00 | 1,037.40 | 0.56 | % | 2.88 | |||||||||||||||
| Hypothetical 5% return (5% return before expenses) | ||||||||||||||||||||
Class A | $1,000.00 | $1,021.12 | 0.81 | % | $4.13 | |||||||||||||||
Class C | 1,000.00 | 1,017.34 | 1.56 | % | 7.93 | |||||||||||||||
Institutional Class | 1,000.00 | 1,022.38 | 0.56 | % | 2.85 | |||||||||||||||
| Delaware Tax-Free USA Intermediate Fund | ||||||||||||||||||||
| Expense analysis of an investment of $1,000 | ||||||||||||||||||||
| Beginning Account Value 3/1/17 | Ending Account Value 8/31/17 | Annualized Expense Ratio | Expenses Paid During Period 3/1/17 to 8/31/17* | |||||||||||||||||
Actual Fund return† | ||||||||||||||||||||
Class A | $1,000.00 | $1,034.90 | 0.75 | % | $3.85 | |||||||||||||||
Class C | 1,000.00 | 1,030.60 | 1.60 | % | 8.19 | |||||||||||||||
Institutional Class | 1,000.00 | 1,035.60 | 0.60 | % | 3.08 | |||||||||||||||
| Hypothetical 5% return (5% return before expenses) | ||||||||||||||||||||
Class A | $1,000.00 | $1,021.42 | 0.75 | % | $3.82 | |||||||||||||||
Class C | 1,000.00 | 1,017.14 | 1.60 | % | 8.13 | |||||||||||||||
Institutional Class | 1,000.00 | 1,022.18 | 0.60 | % | 3.06 | |||||||||||||||
23
Table of Contents
Disclosure of Fund expenses
For the six-month period from March 1, 2017 to August 31, 2017 (Unaudited)
Delaware National High-Yield Municipal Bond Fund
Expense analysis of an investment of $1,000
Beginning Account Value | Ending 8/31/17 | Annualized Expense Ratio | Expenses 3/1/17 to 8/31/17* | |||||||||
Actual Fund return† | ||||||||||||
Class A | $1,000.00 | $1,047.50 | 0.85% | $4.39 | ||||||||
Class C | 1,000.00 | 1,043.50 | 1.60% | 8.24 | ||||||||
Institutional Class | 1,000.00 | 1,048.60 | 0.60% | 3.10 | ||||||||
Hypothetical 5% return (5% return before expenses) |
| |||||||||||
Class A | $1,000.00 | $1,020.92 | 0.85% | $4.33 | ||||||||
Class C | 1,000.00 | 1,017.14 | 1.60% | 8.13 | ||||||||
Institutional Class | 1,000.00 | 1,022.18 | 0.60% | 3.06 | ||||||||
| *“ | Expenses Paid During Period” are equal to the relevant Fund’s annualized expense ratio, multiplied by the average account value over the period, multiplied by 184/365 (to reflect the one-half year period). |
| † | Because actual returns reflect only the most recent six-month period, the returns shown may differ significantly from fiscal year returns. |
22
Table of Contents
| Security type / sector / state / territory allocations | ||
| Delaware Tax-Free USA Fund | As of August 31, 2017 (Unaudited) | |
Sector designations may be different than the sector designations presented in other fund materials.
| Security type / sector | Percentage of net assets | ||||
Municipal Bonds* | 100.50% | ||||
Corporate Revenue Bonds | 16.07% | ||||
Education Revenue Bonds | 3.82% | ||||
Electric Revenue Bonds | 2.30% | ||||
Healthcare Revenue Bonds | 14.08% | ||||
Housing Revenue Bonds | 0.97% | ||||
Lease Revenue Bonds | 3.91% | ||||
Local General Obligation Bonds | 7.65% | ||||
Pre-Refunded/Escrowed to Maturity Bonds | 17.25% | ||||
Special Tax Revenue Bonds | 9.72% | ||||
State General Obligation Bonds | 6.75% | ||||
Transportation Revenue Bonds | 15.04% | ||||
Water & Sewer Revenue Bonds | 2.94% | ||||
Short-Term Investments | 0.15% | ||||
Total Value of Securities | 100.65% | ||||
Liabilities Net of Receivables and Other Assets | (0.65%) | ||||
Total Net Assets | 100.00% | ||||
*As of the date of this report, Delaware Tax-Free USA Fund held bonds issued by or on behalf of territories and the states of the US as follows:
| |||||
| State / territory | Percentage of net assets | ||||
Alabama | 2.30% | ||||
Alaska | 0.68% | ||||
Arizona | 3.39% | ||||
California | 13.41% | ||||
Colorado | 3.72% | ||||
Connecticut | 0.55% | ||||
Florida | 0.57% | ||||
Georgia | 1.90% | ||||
Illinois | 6.26% | ||||
Indiana | 0.86% | ||||
Kansas | 1.57% | ||||
Louisiana | 0.52% | ||||
Maryland | 3.26% | ||||
Massachusetts | 3.90% | ||||
Michigan | 1.39% | ||||
Minnesota | 1.57% | ||||
Missouri | 2.26% | ||||
New Jersey | 7.13% | ||||
New York | 15.45% | ||||
23
Table of Contents
Security type / sector / state / territory allocations
Delaware Tax-Free USA Fund
| State / territory | Percentage of net assets | |
North Carolina | 2.30% | |
Ohio | 5.61% | |
Oklahoma | 3.23% | |
Oregon | 0.28% | |
Pennsylvania | 1.66% | |
Tennessee | 1.11% | |
Texas | 10.22% | |
US Virgin Islands | 0.13% | |
Utah | 1.09% | |
Virginia | 1.21% | |
Washington | 1.21% | |
West Virginia | 0.53% | |
Wisconsin | 1.38% | |
Total Value of Securities | 100.65% |
24
Table of Contents
| Security type / sector / state / territory allocations | ||
| Delaware Tax-Free USA Intermediate Fund | As of August 31, 2017 (Unaudited) | |
Sector designations may be different than the sector designations presented in other fund materials.
| Security type / sector | Percentage of net assets | |
Municipal Bonds* | 99.25% | |
Corporate Revenue Bonds | 12.56% | |
Education Revenue Bonds | 6.76% | |
Electric Revenue Bonds | 2.52% | |
Healthcare Revenue Bonds | 10.33% | |
Lease Revenue Bonds | 4.45% | |
Local General Obligation Bonds | 37.44% | |
Pre-Refunded/Escrowed to Maturity Bonds | 6.25% | |
Special Tax Revenue Bonds | 13.91% | |
State General Obligation Bonds | 13.59% | |
Transportation Revenue Bonds | 15.65% | |
Water & Sewer Revenue Bonds | 5.79% | |
Total Value of Securities | 99.25% | |
Receivables and Other Assets Net of Liabilities | 0.75% | |
Total Net Assets | 100.00% | |
*As of the date of this report, Delaware Tax-Free USA Intermediate Fund held bonds issued by or on behalf of territories and the states of the US as follows:
| ||
| State / territory | Percentage of net assets | |
Alabama | 1.02% | |
Arizona | 7.66% | |
California | 15.20% | |
Colorado | 0.89% | |
Connecticut | 1.27% | |
District of Columbia | 0.22% | |
Florida | 1.26% | |
Georgia | 0.88% | |
Guam | 0.55% | |
Idaho | 0.57% | |
Illinois | 5.91% | |
Kansas | 1.46% | |
Louisiana | 2.70% | |
Maryland | 1.59% | |
Massachusetts | 2.60% | |
Michigan | 1.19% | |
Minnesota | 3.52% | |
Missouri | 1.19% | |
Montana | 0.08% | |
New Jersey | 5.37% | |
New York | 16.91% | |
25
Table of Contents
Security type / sector / state / territory allocations
Delaware Tax-Free USA Intermediate Fund
| State / territory | Percentage of net assets | |
Ohio | 0.77% | |
Oklahoma | 0.18% | |
Oregon | 1.19% | |
Pennsylvania | 6.41% | |
Tennessee | 1.10% | |
Texas | 11.73% | |
Utah | 0.44% | |
Virginia | 2.45% | |
Washington | 1.43% | |
Wisconsin | 1.51% | |
Total Value of Securities | 99.25% |
26
Table of Contents
| Security type / sector / state / territory allocations | ||
| Delaware National High-Yield Municipal Bond Fund | As of August 31, 2017 (Unaudited) | |
Sector designations may be different than the sector designations presented in other fund materials.
| Security type / sector | Percentage of net assets | |
Municipal Bonds* | 99.47% | |
Corporate Revenue Bonds | 17.02% | |
Education Revenue Bonds | 14.18% | |
Electric Revenue Bonds | 0.56% | |
Healthcare Revenue Bonds | 28.84% | |
Housing Revenue Bonds | 0.74% | |
Lease Revenue Bonds | 4.58% | |
Local General Obligation Bonds | 3.42% | |
Pre-Refunded/Escrowed to Maturity Bonds | 6.81% | |
Resource Recovery Revenue Bonds | 0.92% | |
Special Tax Revenue Bonds | 7.36% | |
State General Obligation Bonds | 3.65% | |
Transportation Revenue Bonds | 8.07% | |
Water & Sewer Revenue Bonds | 3.32% | |
Short-Term Investments | 0.90% | |
Total Value of Securities | 100.37% | |
Liabilities Net of Receivables and Other Assets | (0.37%) | |
Total Net Assets | 100.00% | |
*As of the date of this report, Delaware National High-Yield Municipal Bond Fund held bonds issued by or on behalf of territories and the states of the US as follows:
| ||
| State / territory | Percentage of net assets | |
Alabama | 3.34% | |
Alaska | 0.16% | |
Arizona | 4.93% | |
California | 17.12% | |
Colorado | 3.28% | |
Connecticut | 0.21% | |
Delaware | 0.59% | |
District of Columbia | 0.91% | |
Florida | 4.15% | |
Georgia | 1.00% | |
Guam | 0.03% | |
Hawaii | 1.66% | |
Idaho | 0.65% | |
Illinois | 6.98% | |
Indiana | 1.02% | |
Iowa | 0.21% | |
Kansas | 0.60% | |
Kentucky | 1.43% | |
27
Table of Contents
Security type / sector / state / territory allocations
Delaware National High-Yield Municipal Bond Fund
| State / territory | Percentage of net assets | |
Louisiana | 1.47% | |
Maine | 0.15% | |
Maryland | 1.95% | |
Massachusetts | 0.42% | |
Michigan | 0.92% | |
Minnesota | 2.33% | |
Mississippi | 0.10% | |
Missouri | 1.99% | |
Montana | 0.11% | |
Nevada | 0.53% | |
New Hampshire | 0.13% | |
New Jersey | 5.24% | |
New York | 8.05% | |
North Carolina | 0.71% | |
Ohio | 6.49% | |
Oklahoma | 0.71% | |
Oregon | 0.47% | |
Pennsylvania | 4.79% | |
Puerto Rico | 0.49% | |
South Carolina | 0.45% | |
Tennessee | 0.28% | |
Texas | 7.71% | |
Utah | 0.17% | |
Vermont | 0.09% | |
Virginia | 1.14% | |
Washington | 1.64% | |
West Virginia | 0.82% | |
Wisconsin | 2.66% | |
Wyoming | 0.09% | |
Total Value of Securities | 100.37% |
28
Table of Contents
| Schedules of investments | ||
| Delaware Tax-Free USA Fund | August 31, 2017 | |
| Principal amount° | Value (US $) | |||||||
Municipal Bonds – 100.50% | ||||||||
Corporate Revenue Bonds – 16.07% | ||||||||
Buckeye, Ohio Tobacco Settlement Financing Authority | ||||||||
(Asset-Backed Senior Turbo) | ||||||||
Series A-2 5.875% 6/1/47 | 14,645,000 | $ | 14,052,170 | |||||
Series A-2 6.50% 6/1/47 | 500,000 | 499,930 | ||||||
Golden State, California Tobacco Securitization Corporate | ||||||||
Settlement Revenue | ||||||||
(Capital Appreciation-Asset-Backed) Series B | ||||||||
1.548% 6/1/47 ^ | 9,410,000 | 1,218,689 | ||||||
(Unrefunded-Asset-Backed-Senior) 5.75% 6/1/47 | 7,640,000 | 7,639,312 | ||||||
Illinois Railsplitter Tobacco Settlement Authority | ||||||||
6.00% 6/1/28 | 6,000,000 | 6,844,260 | ||||||
6.25% 6/1/24 | 6,810,000 | 6,951,103 | ||||||
Lower Alabama Gas District | ||||||||
Series A 5.00% 9/1/34 | 4,400,000 | 5,335,176 | ||||||
Series A 5.00% 9/1/46 | 5,075,000 | 6,305,028 | ||||||
M-S-R Energy Authority, California Gas Revenue | ||||||||
Series A 6.125% 11/1/29 | 1,915,000 | 2,435,708 | ||||||
Series B 6.50% 11/1/39 | 3,375,000 | 4,873,905 | ||||||
Series C 6.50% 11/1/39 | 1,500,000 | 2,166,180 | ||||||
New Jersey Economic Development Authority Special Facilities Revenue | ||||||||
(Continental Airlines, Inc. Project) Series B | ||||||||
5.625% 11/15/30 (AMT) | 1,365,000 | 1,544,156 | ||||||
New York Liberty Development Corporation Revenue | ||||||||
(Goldman Sachs Headquarters) 5.25% 10/1/35 | 685,000 | 877,745 | ||||||
(Second Priority - Bank of America Tower) Class 3 | ||||||||
6.375% 7/15/49 | 1,000,000 | 1,082,300 | ||||||
New York Transportation Development Corporation | ||||||||
Special Facility Revenue | ||||||||
(American Airlines Inc. John F. Kennedy International | ||||||||
Airport Project) 5.00% 8/1/31 (AMT) | 2,000,000 | 2,139,620 | ||||||
Public Authority for Colorado Energy Natural Gas Revenue | ||||||||
6.50% 11/15/38 | 5,000,000 | 7,146,750 | ||||||
Salt Verde, Arizona Financial Senior Gas Revenue | ||||||||
5.00% 12/1/37 | 1,600,000 | 1,953,888 | ||||||
Shoals, Indiana | ||||||||
(National Gypsum Co. Project) 7.25% 11/1/43 (AMT) | 1,940,000 | 2,231,660 | ||||||
Tobacco Settlement Financing Corporation, New Jersey Revenue | ||||||||
Series 1A 5.00% 6/1/41 | 3,920,000 | 3,808,790 | ||||||
Valparaiso, Indiana | ||||||||
(Pratt Paper, LLC Project) 7.00% 1/1/44 (AMT) | 1,780,000 | 2,138,314 | ||||||
|
| |||||||
| 81,244,684 | ||||||||
|
| |||||||
29
Table of Contents
Schedules of investments
Delaware Tax-Free USA Fund
| Principal amount° | Value (US $) | |||||||
Municipal Bonds (continued) | ||||||||
Education Revenue Bonds – 3.82% | ||||||||
Arizona Industrial Development Authority Revenue | ||||||||
(American Charter Schools Foundation Project) 144A | ||||||||
6.00% 7/1/47 # | 1,385,000 | $ | 1,484,775 | |||||
California Educational Facilities Authority Revenue | ||||||||
(Loma Linda University) Series A 5.00% 4/1/47 | 1,000,000 | 1,139,550 | ||||||
California State University | ||||||||
(Systemwide) Series A 5.00% 11/1/42 | 700,000 | 834,183 | ||||||
Colorado Educational & Cultural Facilities Authority Revenue | ||||||||
(University of Denver Project) Series A 5.00% 3/1/47 | 2,500,000 | 2,906,175 | ||||||
Massachusetts Development Finance Agency | ||||||||
(Berklee College of Music) 5.00% 10/1/46 | 3,150,000 | 3,634,061 | ||||||
New Jersey Economic Development Authority Revenue | ||||||||
(Provident Group - Montclair State University) | ||||||||
5.875% 6/1/42 | 4,225,000 | 4,613,869 | ||||||
Pennsylvania State Higher Educational Facilities Authority | ||||||||
Student Housing Revenue | ||||||||
(University Properties Inc. - East Stroudsburg University of Pennsylvania) 5.00% 7/1/31 | 3,000,000 | 3,153,270 | ||||||
Provo, Utah Charter School Revenue | ||||||||
(Freedom Academy Foundation Project) 5.50% 6/15/37 | 1,545,000 | 1,547,456 | ||||||
|
| |||||||
| 19,313,339 | ||||||||
|
| |||||||
Electric Revenue Bonds – 2.30% | ||||||||
Electric and Gas Systems Revenue San Antonio, Texas | ||||||||
5.25% 2/1/24 | 5,000,000 | 6,176,400 | ||||||
Salt River, Arizona Project Agricultural Improvement & Power District Electric Systems Revenue | ||||||||
Series A 5.00% 12/1/35 | 4,610,000 | 5,460,038 | ||||||
|
| |||||||
| 11,636,438 | ||||||||
|
| |||||||
Healthcare Revenue Bonds – 14.08% | ||||||||
Alachua County, Florida Health Facilities Authority | ||||||||
(Oak Hammock University) Series A 8.00% 10/1/42 | 1,000,000 | 1,189,980 | ||||||
Apple Valley, Minnesota | ||||||||
(Senior Living, LLC Project Fourth Tier) Series D | ||||||||
7.25% 1/1/52 | 2,500,000 | 2,480,875 | ||||||
(Senior Living, LLC Project Second Tier) Series B | ||||||||
5.00% 1/1/47 | 2,500,000 | 2,563,400 | ||||||
California Health Facilities Financing Authority Revenue | ||||||||
(Kaiser Permanente) Series A-2 5.00% 11/1/47 | 2,105,000 | 2,769,549 | ||||||
California Municipal Finance Authority Revenue | ||||||||
(Community Medical Centers) Series A 5.00% 2/1/42 | 2,550,000 | 2,896,137 | ||||||
Colorado Health Facilities Authority Revenue | ||||||||
(American Baptist) 8.00% 8/1/43 | 2,040,000 | 2,377,151 | ||||||
30
Table of Contents
| Principal amount° | Value (US $) | |||||||
Municipal Bonds (continued) | ||||||||
Healthcare Revenue Bonds (continued) | ||||||||
Colorado Health Facilities Authority Revenue | ||||||||
(Mental Health Center Denver Project) Series A | ||||||||
5.75% 2/1/44 | 1,875,000 | $ | 2,100,656 | |||||
Cuyahoga County, Ohio | ||||||||
(The Metro Health System) | ||||||||
5.25% 2/15/47 | 2,235,000 | 2,456,801 | ||||||
5.50% 2/15/57 | 3,000,000 | 3,348,750 | ||||||
Fairfax County, Virginia Industrial Development Authority | ||||||||
(Inova Health) 5.50% 5/15/35 | 1,635,000 | 1,750,137 | ||||||
Maricopa County, Arizona Industrial Development | ||||||||
Authority Health Facilities Revenue | ||||||||
(Catholic Healthcare West) Series A 6.00% 7/1/39 | 3,690,000 | 3,958,447 | ||||||
Maricopa County, Arizona Industrial Development | ||||||||
Authority Senior Living Facility Revenue Bonds | ||||||||
(Christian Care Surprise, Inc. Project) 144A | ||||||||
6.00% 1/1/48 # | 1,195,000 | 1,198,442 | ||||||
Maryland Health & Higher Educational Facilities Authority Revenue | ||||||||
(Adventist Healthcare Obligated) Series A 5.50% 1/1/46 | 2,000,000 | 2,297,160 | ||||||
Massachusetts Development Finance Agency | ||||||||
(Dana-Farber Cancer Institute) Series N 5.00% 12/1/46 | 1,000,000 | 1,143,950 | ||||||
Metropolitan Government Nashville & Davidson County, | ||||||||
(Vanderbilt University Medical Center) 5.00% 7/1/46 | 5,000,000 | 5,634,250 | ||||||
Michigan Finance Authority | ||||||||
(Henry Ford Health System) 5.00% 11/15/41 | 1,405,000 | 1,587,271 | ||||||
(Trinity Health) Series 2016 5.00% 12/1/33 | 4,655,000 | 5,452,588 | ||||||
Moon, Pennsylvania Industrial Development Authority | ||||||||
(Baptist Homes Society Obligation) 6.125% 7/1/50 | 2,250,000 | 2,466,405 | ||||||
New Hope, Texas Cultural Education Facilities | ||||||||
(Cardinal Bay - Village on the Park) | ||||||||
Series A1 4.00% 7/1/36 | 310,000 | 322,397 | ||||||
Series A1 5.00% 7/1/46 | 770,000 | 857,695 | ||||||
Series B 4.25% 7/1/36 | 465,000 | 478,796 | ||||||
Series B 5.00% 7/1/46 | 770,000 | 830,945 | ||||||
New York State Dormitory Authority | ||||||||
(Orange Regional Medical Center) | ||||||||
144A 5.00% 12/1/34 # | 400,000 | 443,944 | ||||||
144A 5.00% 12/1/35 # | 1,200,000 | 1,327,680 | ||||||
144A 5.00% 12/1/37 # | 800,000 | 883,056 | ||||||
31
Table of Contents
Schedules of investments
Delaware Tax-Free USA Fund
| Principal amount° | Value (US $) | |||||||
Municipal Bonds (continued) | ||||||||
Healthcare Revenue Bonds (continued) | ||||||||
North Carolina Medical Care Commission Health Care | ||||||||
Facilities Revenue | ||||||||
(First Mortgage - Galloway Ridge Project) | ||||||||
Series A 5.875% 1/1/31 | 1,555,000 | $ | 1,617,573 | |||||
Ohio State Higher Educational Facility Community Revenue | ||||||||
(Cleveland Clinic Health System Obligation Group) | ||||||||
Series A 5.25% 1/1/33 | 2,000,000 | 2,028,920 | ||||||
Orange County, New York Funding Corporation Assisted | ||||||||
Living Residence Revenue | ||||||||
6.50% 1/1/46 | 3,000,000 | 3,075,540 | ||||||
Oregon Health & Science University Revenue | ||||||||
(Capital Appreciation Insured) Series A | ||||||||
5.757% 7/1/21 (NATL-RE)^ | 1,565,000 | 1,420,144 | ||||||
Palm Beach County, Florida Health Facilities Authority | ||||||||
(Sinai Residences Boca Raton Project) | ||||||||
7.25% 6/1/34 | 120,000 | 145,332 | ||||||
Series A 7.50% 6/1/49 | 610,000 | 745,499 | ||||||
Public Finance Authority, Wisconsin | ||||||||
(Bancroft Neurohealth Project) Series A 144A | ||||||||
5.00% 6/1/36 # | 540,000 | 549,148 | ||||||
(Mary’s Woods at Marylhurst Project) 144A | ||||||||
5.25% 5/15/42 # | 1,230,000 | 1,322,853 | ||||||
Rochester, Minnesota | ||||||||
(The Homestead at Rochester) Series A 6.875% 12/1/48 | 2,350,000 | 2,622,247 | ||||||
Tarrant County, Texas Cultural Education Facilities Finance | ||||||||
Corporation Retirement Facility Revenue | ||||||||
(Buckner Senior Living - Ventana Project) | ||||||||
6.625% 11/15/37 | 1,000,000 | 1,089,130 | ||||||
Tempe, Arizona Industrial Development Authority Revenue | ||||||||
(Friendship Village) Series A 6.25% 12/1/46 | 1,000,000 | 1,064,540 | ||||||
West Virginia Hospital Finance Authority Revenue | ||||||||
(Highland Hospital Obligation Group) 9.125% 10/1/41 ‡ | 2,900,000 | 2,680,180 | ||||||
|
| |||||||
| 71,177,568 | ||||||||
|
| |||||||
Housing Revenue Bonds – 0.97% | ||||||||
California Municipal Finance Authority Mobile Home Park Revenue | ||||||||
(Caritas Projects) Series A 6.40% 8/15/45 | 4,505,000 | 4,891,124 | ||||||
|
| |||||||
| 4,891,124 | ||||||||
|
| |||||||
Lease Revenue Bonds – 3.91% | ||||||||
New Jersey Economic Development Authority | ||||||||
(School Facilities Construction) Series GG 5.75% 9/1/23 | 100,000 | 110,509 | ||||||
32
Table of Contents
| Principal amount° | Value (US $) | |||||||
Municipal Bonds (continued) | ||||||||
Lease Revenue Bonds (continued) | ||||||||
New Jersey Transportation Trust Fund Authority | ||||||||
Series B 5.00% 6/15/21 | 3,235,000 | $ | 3,553,421 | |||||
Series B 5.50% 6/15/31 | 5,000,000 | 5,436,800 | ||||||
(Transportation Program) Series AA 5.00% 6/15/24 | 5,000,000 | 5,479,300 | ||||||
Public Finance Authority, Wisconsin Airport Facilities Revenue | ||||||||
(AFCO Investors II Portfolio) 5.75% 10/1/31 (AMT) | 2,245,000 | 2,369,800 | ||||||
St. Louis, Missouri Industrial Development Authority | ||||||||
Leasehold Revenue | ||||||||
(Convention Center Hotel) 5.80% 7/15/20 (AMBAC)^ | 3,035,000 | 2,812,383 | ||||||
|
| |||||||
| 19,762,213 | ||||||||
|
| |||||||
Local General Obligation Bonds – 7.65% | ||||||||
Aldine, Texas Independent School District | ||||||||
(School Building) Series A 5.00% 2/15/45 (PSF) | 3,000,000 | 3,531,270 | ||||||
Chicago, Illinois | ||||||||
Series A 5.25% 1/1/29 | 2,020,000 | 2,203,578 | ||||||
Series A 6.00% 1/1/38 | 595,000 | 688,403 | ||||||
Georgetown, Texas Independent School District | ||||||||
(School Building) | ||||||||
5.00% 8/15/24 (PSF) | 1,430,000 | 1,590,803 | ||||||
5.00% 8/15/26 (PSF) | 1,000,000 | 1,111,520 | ||||||
Los Angeles, California Community College District | ||||||||
Series C 5.00% 8/1/25 | 2,500,000 | 3,152,975 | ||||||
Mecklenburg, North Carolina | ||||||||
Series A 5.00% 9/1/25 | 8,000,000 | 10,032,480 | ||||||
Montgomery, Maryland | ||||||||
Series A 5.00% 11/1/28 | 5,755,000 | 7,044,178 | ||||||
New York City, New York | ||||||||
Subseries D-1 5.00% 10/1/36 | 6,500,000 | 7,362,550 | ||||||
Subseries I-1 5.375% 4/1/36 | 1,835,000 | 1,961,009 | ||||||
|
| |||||||
| 38,678,766 | ||||||||
|
| |||||||
Pre-Refunded/Escrowed to Maturity Bonds – 17.25% | ||||||||
Atlanta, Georgia Water & Wastewater Revenue | ||||||||
Series A 6.25% 11/1/39-19§ | 5,500,000 | 6,131,950 | ||||||
Bowling Green, Ohio Student Housing Revenue CFP I | ||||||||
(State University Project) 6.00% 6/1/45-20§ | 5,295,000 | 5,999,394 | ||||||
Brooklyn Arena Local Development, New York Pilot Revenue | ||||||||
(Barclays Center Project) 6.50% 7/15/30-20§ | 8,230,000 | 9,323,438 | ||||||
Butler County, Pennsylvania Hospital Authority Revenue | ||||||||
(Butler Health System Project) 7.125% 7/1/29-19§ | 2,500,000 | 2,775,000 | ||||||
33
Table of Contents
Schedules of investments
Delaware Tax-Free USA Fund
| Principal amount° | Value (US $) | |||||||
Municipal Bonds (continued) | ||||||||
Pre-Refunded/Escrowed to Maturity Bonds (continued) | ||||||||
California Statewide Communities Development Authority School Facility Revenue | ||||||||
(Aspire Public Schools) 6.125% 7/1/46-19§ | 5,145,000 | $ | 5,512,559 | |||||
Central Texas Regional Mobility Authority Revenue | ||||||||
Senior Lien 6.00% 1/1/41-21§ | 5,160,000 | 5,988,902 | ||||||
Illinois Finance Authority Revenue | ||||||||
(Silver Cross & Medical Centers) 7.00% 8/15/44-19§ | 3,000,000 | 3,350,040 | ||||||
Koyukuk, Alaska Revenue | ||||||||
(Tanana Chiefs Conference Health Care Facility Project) | ||||||||
7.75% 10/1/41-19§ | 3,000,000 | 3,415,440 | ||||||
Louisiana Public Facilities Authority Revenue | ||||||||
(Ochsner Clinic Foundation Project) 6.50% 5/15/37-21§ | 2,190,000 | 2,621,342 | ||||||
Marietta, Georgia Development Authority Revenue | ||||||||
(Life University Income Project) 7.00% 6/15/39-18§ | 3,300,000 | 3,459,390 | ||||||
Massachusetts Development Finance Agency | ||||||||
(Harvard University) Series B-2 5.25% 2/1/34-21§ | 5,000,000 | 5,719,200 | ||||||
(Unrefunded - Harvard University) Series A | ||||||||
5.50% 11/15/36-18§ | 3,355,000 | 3,547,007 | ||||||
New Jersey Economic Development Authority | ||||||||
(School Facilities Construction) Series G | ||||||||
5.75% 9/1/23-21§ | 900,000 | 1,046,358 | ||||||
New Jersey Educational Facilities Authority Revenue | ||||||||
(University of Medicine & Dentistry) Series B | ||||||||
7.50% 12/1/32-19§ | 1,435,000 | 1,600,169 | ||||||
New York State Dormitory Authority | ||||||||
(Education) Series B 5.25% 3/15/38-19§ | 2,000,000 | 2,135,200 | ||||||
New York State Dormitory Authority Revenue Non State | ||||||||
Supported Debt | ||||||||
(Orange Regional Medical Center) 6.50% 12/1/21-18§ | 2,745,000 | 2,900,614 | ||||||
Oklahoma State Turnpike Authority Revenue | ||||||||
(First Senior) 6.00% 1/1/22 | 13,535,000 | 16,346,490 | ||||||
San Juan, Texas Higher Education Finance Authority | ||||||||
Education Revenue | ||||||||
(Idea Public Schools) Series A 6.70% 8/15/40-20§ | 1,500,000 | 1,748,355 | ||||||
Southwestern Illinois Development Authority Revenue | ||||||||
(Memorial Group Inc.) 7.125% 11/1/43-23§ | 2,000,000 | 2,683,460 | ||||||
Virgin Islands Public Finance Authority Revenue | ||||||||
Series A 7.30% 10/1/18 | 635,000 | 657,962 | ||||||
Wisconsin Housing & Economic Developing Authority Revenue | ||||||||
6.10% 6/1/21-17 (FHA)§ | 270,000 | 273,613 | ||||||
|
| |||||||
| 87,235,883 | ||||||||
|
| |||||||
34
Table of Contents
| Principal amount° | Value (US $) | |||||||
Municipal Bonds (continued) | ||||||||
Special Tax Revenue Bonds – 9.72% | ||||||||
Baltimore, Maryland | ||||||||
(Convention Center Hotel) 5.00% 9/1/46 | 1,500,000 | $ | 1,708,845 | |||||
Conley Road Transportation Development District, Missouri | ||||||||
5.375% 5/1/47 | 2,000,000 | 2,031,720 | ||||||
Kansas State Department of Transportation | ||||||||
5.00% 9/1/27 | 5,300,000 | 6,549,422 | ||||||
Massachusetts School Building Authority | ||||||||
Series C 5.00% 8/15/31 | 2,500,000 | 2,996,200 | ||||||
Mosaic, Virginia District Community Development Authority Revenue | ||||||||
Series A 6.875% 3/1/36 | 3,980,000 | 4,389,900 | ||||||
New Jersey Economic Development Authority Revenue | ||||||||
5.00% 6/15/28 | 2,695,000 | 2,902,353 | ||||||
New York City, New York Industrial Development Agency | ||||||||
(Yankee Stadium) 7.00% 3/1/49 (AGC) | 1,000,000 | 1,090,350 | ||||||
New York City, New York Transitional Finance Authority | ||||||||
Future Tax Secured Fiscal 2011 | ||||||||
5.00% 5/1/40 | 2,500,000 | 2,928,950 | ||||||
Series A-1 5.00% 11/1/42 | 10,000,000 | 11,481,800 | ||||||
Series C 5.25% 11/1/25 | 4,430,000 | 5,022,291 | ||||||
Series D 5.00% 2/1/26 | 3,000,000 | 3,398,790 | ||||||
Public Finance Authority, Wisconsin | ||||||||
(American Dream @ Meadowlands Project) 144A | ||||||||
7.00% 12/1/50 # | 2,155,000 | 2,473,832 | ||||||
Tampa, Florida Sports Authority Revenue Sales Tax | ||||||||
(Tampa Bay Arena Project) 5.75% 10/1/20 (NATL-RE) | 730,000 | 783,502 | ||||||
Wyandotte County, Kansas City, Kansas Unified | ||||||||
Government Special Obligation Revenue | ||||||||
(Sales Tax - Vacation Village Project Area 1 and 2A) | ||||||||
Series 2015A 5.75% 9/1/32 | 1,365,000 | 1,379,810 | ||||||
|
| |||||||
| 49,137,765 | ||||||||
|
| |||||||
State General Obligation Bonds – 6.75% | ||||||||
California State | ||||||||
5.25% 11/1/40 | 3,795,000 | 4,278,255 | ||||||
Various Purposes | ||||||||
4.00% 11/1/34 | 1,080,000 | 1,181,671 | ||||||
4.00% 11/1/47 | 1,040,000 | 1,111,510 | ||||||
5.00% 8/1/27 | 2,500,000 | 3,121,675 | ||||||
5.00% 11/1/47 | 5,190,000 | 6,156,119 | ||||||
6.00% 4/1/38 | 4,060,000 | 4,377,898 | ||||||
6.50% 4/1/33 | 2,570,000 | 2,805,052 | ||||||
35
Table of Contents
Schedules of investments
Delaware Tax-Free USA Fund
| Principal amount° | Value (US $) | |||||||
Municipal Bonds (continued) | ||||||||
State General Obligation Bonds (continued) | ||||||||
Connecticut State | ||||||||
Series B 5.00% 6/15/35 | 2,475,000 | $ | 2,774,425 | |||||
Illinois State | ||||||||
5.00% 5/1/36 | 480,000 | 500,400 | ||||||
5.00% 2/1/39 | 830,000 | 860,361 | ||||||
Series A 5.00% 4/1/38 | 785,000 | 811,596 | ||||||
Washington State | ||||||||
Series C 5.00% 2/1/28 | 5,000,000 | 6,123,600 | ||||||
|
| |||||||
| 34,102,562 | ||||||||
|
| |||||||
Transportation Revenue Bonds – 15.04% | ||||||||
Chicago, Illinois O’Hare International Airport | ||||||||
Series B 5.00% 1/1/33 | 2,345,000 | 2,726,977 | ||||||
Series D 5.25% 1/1/42 | 2,000,000 | 2,371,040 | ||||||
Colorado High Performance Transportation Enterprise Revenue | ||||||||
(C-470 Express Lanes) 5.00% 12/31/51 | 1,500,000 | 1,662,735 | ||||||
Dallas, Texas Love Field | ||||||||
5.00% 11/1/35 (AMT) | 1,000,000 | 1,158,340 | ||||||
5.00% 11/1/36 (AMT) | 1,000,000 | 1,155,740 | ||||||
Maryland Economic Development Corporation Revenue | ||||||||
(Transportation Facilities Project) Series A 5.75% 6/1/35 | 5,075,000 | 5,443,953 | ||||||
New Jersey Turnpike Authority | ||||||||
Series A 5.00% 1/1/28 | 5,000,000 | 5,974,600 | ||||||
North Texas Tollway Authority Revenue | ||||||||
Second Tier Series A 5.00% 1/1/34 | 5,000,000 | 5,760,250 | ||||||
(Unrefunded - First Tier) Series A 6.00% 1/1/24 | 415,000 | 422,221 | ||||||
Phoenix, Arizona Civic Improvement Corporation Airport Revenue Junior Lien | ||||||||
Series A 5.00% 7/1/26 | 1,800,000 | 1,992,348 | ||||||
Port Authority of New York & New Jersey Special Project | ||||||||
(193rd Series) 5.00% 10/15/28 (AMT) | 4,000,000 | 4,771,960 | ||||||
(Consolidated 205th Series) 5.00% 11/15/47 | 1,500,000 | 1,776,480 | ||||||
(JFK International Air Terminal) | ||||||||
Series 8 6.00% 12/1/42 | 4,735,000 | 5,304,100 | ||||||
Series 8 6.50% 12/1/28 | 5,500,000 | 5,589,210 | ||||||
Salt Lake City, Utah Airport Revenue | ||||||||
Series B 5.00% 7/1/42 | 3,350,000 | 3,948,009 | ||||||
St. Louis, Missouri Airport Revenue | ||||||||
(Lambert-St. Louis International) | ||||||||
Series A-1 6.625% 7/1/34 | 5,995,000 | 6,567,343 | ||||||
36
Table of Contents
| Principal amount° | Value (US $) | |||||||
Municipal Bonds (continued) | ||||||||
Transportation Revenue Bonds (continued) | ||||||||
Texas Private Activity Bond Surface Transportation Corporate Senior Lien | ||||||||
(LBJ Infrastructure) | ||||||||
7.00% 6/30/40 | 5,715,000 | $ | 6,486,411 | |||||
7.50% 6/30/33 | 1,560,000 | 1,785,794 | ||||||
(NTE Mobility Partners) | ||||||||
6.75% 6/30/43 (AMT) | 2,490,000 | 2,888,773 | ||||||
6.875% 12/31/39 | 5,500,000 | 6,140,310 | ||||||
7.00% 12/31/38 (AMT) | 1,830,000 | 2,123,367 | ||||||
|
| |||||||
| 76,049,961 | ||||||||
|
| |||||||
Water & Sewer Revenue Bonds – 2.94% | ||||||||
Chicago, Illinois Waterworks Revenue | ||||||||
(2nd Lien) 5.00% 11/1/28 | 1,400,000 | 1,647,632 | ||||||
Dominion, Colorado Water & Sanitation District | ||||||||
5.75% 12/1/36 | 2,500,000 | 2,600,725 | ||||||
Massachusetts Water Resources Authority | ||||||||
(Green Bond) Series C 4.00% 8/1/36 | 2,470,000 | 2,680,049 | ||||||
New York City, New York Municipal Water Finance | ||||||||
Authority Water & Sewer System Revenue | ||||||||
(Fiscal 2009) Series A 5.75% 6/15/40 | 3,090,000 | 3,214,218 | ||||||
Southern California Water Replenishment District | ||||||||
5.00% 8/1/33 | 2,000,000 | 2,371,260 | ||||||
5.00% 8/1/34 | 2,000,000 | 2,361,780 | ||||||
|
| |||||||
| 14,875,664 | ||||||||
|
| |||||||
Total Municipal Bonds (cost $468,628,160) | 508,105,967 | |||||||
|
| |||||||
| ||||||||
Short-Term Investments – 0.15% | ||||||||
Variable Rate Demand Notes – 0.15%¤ | ||||||||
Los Angeles, California Department of Water & Power | ||||||||
System Revenue (SPA - Barclays Bank N.A.) Subseries B-3 | ||||||||
0.63% 7/1/34 | 500,000 | 500,000 | ||||||
Minneapolis – St. Paul, Minnesota Housing & Redevelopment Authority Health Care Revenue | ||||||||
(Children’s Hospitals & Clinics) Series A-II | ||||||||
0.75% 8/15/37 (AGM) (SPA - US Bank N.A.) | 250,000 | 250,000 | ||||||
|
| |||||||
Total Short-Term Investments (cost $750,000) | 750,000 | |||||||
|
| |||||||
Total Value of Securities – 100.65% | ||||||||
(cost $469,378,160) | $ | 508,855,967 | ||||||
|
| |||||||
37
Table of Contents
Schedules of investments
Delaware Tax-Free USA Fund
| # | Security exempt from registration under Rule 144A of the Securities Act of 1933, as amended. At Aug. 31, 2017, the aggregate value of Rule 144A securities was $9,683,730, which represents 1.92% of the Fund’s net assets. See Note 8 in “Notes to financial statements.” |
| ¤ | Tax-exempt obligations that contain a floating or variable interest rate adjustment formula and an unconditional right of demand to receive payment of the unpaid principal balance plus accrued interest upon a short notice period (generally up to 30 days) prior to specified dates either from the issuer or by drawing on a bank letter of credit, a guarantee, or insurance issued with respect to such instrument. Each rate shown is as of Aug. 31, 2017. |
| § | Pre-refunded bonds. Municipal bonds that are generally backed or secured by US Treasury bonds. For pre-refunded bonds, the stated maturity is followed by the year in which the bond is pre-refunded. See Note 8 in “Notes to financial statements.” |
| ° | Principal amount shown is stated in US dollars unless noted that the security is denominated in another currency. |
| ‡ | Non-income producing security. Security is currently in default. |
| ^ | Zero coupon security. The rate shown is the yield at the time of purchase. |
Summary of abbreviations:
AGC – Insured by Assured Guaranty Corporation
AGM – Insured by Assured Guaranty Municipal Corporation
AMBAC – Insured by AMBAC Assurance Corporation
AMT – Subject to Alternative Minimum Tax
FHA – Federal Housing Administration
N.A. – National Association
NATL-RE – Insured by National Public Finance Guarantee Corporation
PSF – Guaranteed by Permanent School Fund
SPA – Stand-by Purchase Agreement
See accompanying notes, which are an integral part of the financial statements.
38
Table of Contents
| Schedules of investments | ||
| Delaware Tax-Free USA Intermediate Fund | August 31, 2017 | |
| Principal amount° | Value (US $) | |||||||
Municipal Bonds – 99.25% | ||||||||
Corporate Revenue Bonds – 12.56% | ||||||||
California Infrastructure & Economic Development Bank | ||||||||
(Pacific Gas and Electric Company) Series E | ||||||||
1.75% 11/1/26 ● | 800,000 | $ | 809,656 | |||||
Chesterfield County, Virginia Economic Development Authority Pollution Control Revenue | ||||||||
(Virginia Electric & Power) Series A 5.00% 5/1/23 | 1,460,000 | 1,559,119 | ||||||
Golden State, California Tobacco Securitization Corporate Settlement Revenue | ||||||||
(Asset-Backed Senior Notes) | ||||||||
Series A-1 5.00% 6/1/26 | 850,000 | 1,027,199 | ||||||
Series A-1 5.00% 6/1/33 | 665,000 | 664,401 | ||||||
(Capital Appreciation Asset-Backed) Series A | ||||||||
1.548% 6/1/47 ^ | 5,885,000 | 762,166 | ||||||
Houston, Texas Airport System Revenue | ||||||||
(United Airlines Inc.) 5.00% 7/1/29 (AMT) | 3,010,000 | 3,243,275 | ||||||
Illinois Railsplitter Tobacco Settlement Authority | ||||||||
5.25% 6/1/20 | 7,160,000 | 7,931,347 | ||||||
6.25% 6/1/24 | 7,500,000 | 7,655,400 | ||||||
Lower Alabama Gas District | ||||||||
Series A 5.00% 9/1/34 | 4,850,000 | 5,880,819 | ||||||
Maricopa County, Arizona Corporation Pollution Control Revenue | ||||||||
(Public Service - Palo Verde Project) Series B | ||||||||
5.20% 6/1/43 ● | 6,000,000 | 6,527,580 | ||||||
Maryland Economic Development Corporation Pollution Control Revenue | ||||||||
(Potomac Electric Project) 6.20% 9/1/22 | 1,780,000 | 1,921,510 | ||||||
New Jersey Economic Development Authority Special | ||||||||
Facilities Revenue | ||||||||
(Continental Airlines, Inc. Project) Series B | ||||||||
5.625% 11/15/30 (AMT) | 1,890,000 | 2,138,063 | ||||||
New York Transportation Development Special Facilities Revenue | ||||||||
(American Airlines Inc. John F. Kennedy International Airport Project) 5.00% 8/1/21 (AMT) | 610,000 | 668,414 | ||||||
Salt Verde, Arizona Financial Corporation Senior Gas Revenue | 3,750,000 | 4,523,963 | ||||||
5.00% 12/1/32 | 3,750,000 | 4,523,963 | ||||||
5.25% 12/1/24 | 3,050,000 | 3,578,595 | ||||||
Tennessee Energy Acquisition Gas Revenue | ||||||||
Series C 5.00% 2/1/27 | 1,440,000 | 1,694,088 | ||||||
39
Table of Contents
Schedules of investments
Delaware Tax-Free USA Intermediate Fund
| Principal amount° | Value (US $) | |||||||
Municipal Bonds (continued) | ||||||||
Corporate Revenue Bonds (continued) | ||||||||
Tobacco Settlement Financing Corporation, New Jersey Revenue | ||||||||
Series 1A 4.75% 6/1/34 | 3,265,000 | $ | 3,201,202 | |||||
Series 1A 5.00% 6/1/29 | 4,050,000 | 4,050,243 | ||||||
Series 1A 5.00% 6/1/41 | 9,275,000 | 9,011,868 | ||||||
TSASC, New York | ||||||||
Series A 5.00% 6/1/30 | 475,000 | 547,395 | ||||||
Series A 5.00% 6/1/31 | 475,000 | 543,961 | ||||||
Tulsa, Oklahoma Airports Improvement Trust | ||||||||
(American Airlines) 5.00% 6/1/35 (AMT)● | 975,000 | 1,057,075 | ||||||
Wisconsin Public Finance Authority Exempt Facilities Revenue | ||||||||
(National Gypsum) 5.25% 4/1/30 (AMT) | 2,905,000 | 3,115,119 | ||||||
|
| |||||||
| 72,112,458 | ||||||||
|
| |||||||
Education Revenue Bonds – 6.76% | ||||||||
Arizona Industrial Development Authority Revenue | ||||||||
(American Charter Schools Foundation Project) 144A | ||||||||
6.00% 7/1/37 # | 1,420,000 | 1,539,464 | ||||||
Bucks County, Pennsylvania Industrial Development Authority Revenue | ||||||||
(School Lane Charter School) 5.125% 3/15/36 | 2,000,000 | 2,186,060 | ||||||
California State University | ||||||||
(Systemwide) Series A 5.00% 11/1/31 | 2,000,000 | 2,453,920 | ||||||
California Statewide Communities Development Authority Revenue | ||||||||
(California Baptist University) Series A 6.125% 11/1/33 | 2,215,000 | 2,500,801 | ||||||
Connecticut State Health & Educational Facilities Authority Revenue | ||||||||
(Yale University) Series A-1 5.00% 7/1/25 | 5,000,000 | 5,179,150 | ||||||
Massachusetts Development Finance Agency Revenue | ||||||||
(UMass Boston Student Housing Project) | ||||||||
5.00% 10/1/25 | 2,690,000 | 3,151,469 | ||||||
Massachusetts State Health & Educational Facilities Authority Revenue | ||||||||
(Massachusetts Institute of Technology) Series M | ||||||||
5.25% 7/1/20 | 3,000,000 | 3,363,330 | ||||||
Miami-Dade County, Florida Educational Facilities Authority | ||||||||
(University of Miami) | ||||||||
Series A 5.00% 4/1/30 | 520,000 | 603,060 | ||||||
Series A 5.00% 4/1/31 | 1,090,000 | 1,257,620 | ||||||
New York City, New York Trust for Cultural Resources | ||||||||
(Whitney Museum of American Art) 5.00% 7/1/21 | 3,025,000 | 3,423,332 | ||||||
40
Table of Contents
| Principal amount° | Value (US $) | |||||||
Municipal Bonds (continued) | ||||||||
Education Revenue Bonds (continued) | ||||||||
New York State Dormitory Authority Revenue | ||||||||
(Non State Supported Debt - Rockefeller University) | ||||||||
Series A 5.00% 7/1/27 | 1,055,000 | $ | 1,134,463 | |||||
(Touro College & University System) Series A | ||||||||
5.25% 1/1/34 | 1,335,000 | 1,472,425 | ||||||
Pennsylvania State Higher Educational Facilities Authority Revenue | ||||||||
(Drexel University) Series A 5.25% 5/1/25 | 5,290,000 | 6,031,711 | ||||||
University of Texas Permanent University Fund | ||||||||
Series B 5.00% 7/1/27 | 3,715,000 | 4,493,404 | ||||||
|
| |||||||
| 38,790,209 | ||||||||
|
| |||||||
Electric Revenue Bonds – 2.52% | ||||||||
California State Department Water Resources Power Supply Revenue | ||||||||
Series N 5.00% 5/1/21 | 3,580,000 | 4,108,694 | ||||||
Long Island, New York Power Authority | ||||||||
Series B 5.00% 9/1/31 | 3,165,000 | 3,799,171 | ||||||
New York State Utility Debt Securitization Authority | ||||||||
(Restructuring Bonds) 5.00% 12/15/33 | 1,500,000 | 1,804,005 | ||||||
Salt River, Arizona Project Agricultural Improvement & Power District Electric Systems Revenue | ||||||||
Series A 5.00% 12/1/35 | 4,000,000 | 4,737,560 | ||||||
|
| |||||||
| 14,449,430 | ||||||||
|
| |||||||
Healthcare Revenue Bonds – 10.33% | ||||||||
Arizona Health Facilities Authority | ||||||||
(Scottsdale Lincoln Hospital Project) 5.00% 12/1/30 | 5,000,000 | 5,793,150 | ||||||
Berks County, Pennsylvania Hospital Authority Revenue | ||||||||
(Reading Hospital & Medical Center Project) Series A-3 | ||||||||
5.25% 11/1/24 | 4,405,000 | 4,795,723 | ||||||
California Health Facilities Financing Authority | ||||||||
(Kaiser Permanente) Series A1 5.00% 11/1/27 | 4,100,000 | 5,215,487 | ||||||
California Statewide Communities Development Authority | ||||||||
(Loma Linda University Medical Center) Series A 144A | ||||||||
5.00% 12/1/41 # | 1,685,000 | 1,840,778 | ||||||
Capital Trust Agency, Florida | ||||||||
(Tuscan Gardens Senior Living Center) 7.00% 4/1/35 | 1,630,000 | 1,653,749 | ||||||
Cuyahoga County, Ohio | ||||||||
(The Metrohealth System) 5.00% 2/15/37 | 1,000,000 | 1,088,750 | ||||||
Dauphin County, Pennsylvania General Authority | ||||||||
(Pinnacle Health System Project) Series A 6.00% 6/1/29 | 1,780,000 | 1,931,407 | ||||||
Illinois Finance Authority Revenue | ||||||||
(Rush University Medical Center) Series A | ||||||||
5.00% 11/15/32 | 2,900,000 | 3,279,204 | ||||||
41
Table of Contents
Schedules of investments
Delaware Tax-Free USA Intermediate Fund
| Principal amount° | Value (US $) | |||||||
Municipal Bonds (continued) | ||||||||
Healthcare Revenue Bonds (continued) | ||||||||
Kalispell, Montana | ||||||||
(Immanuel Lutheran Corporation Project) Series A | ||||||||
5.25% 5/15/32 | 435,000 | $ | 466,411 | |||||
Lancaster County, Pennsylvania Hospital Authority | ||||||||
(Brethren Village Project) | ||||||||
5.00% 7/1/31 | 440,000 | 488,303 | ||||||
5.00% 7/1/32 | 440,000 | 484,862 | ||||||
(University of Pennsylvania Health System Obligation) | ||||||||
Series A 5.00% 8/15/33 | 2,430,000 | 2,861,374 | ||||||
Maricopa County, Arizona Industrial Development Authority Revenue | ||||||||
(Banner Health Obligation Group) Series A | ||||||||
5.00% 1/1/32 | 3,000,000 | 3,582,180 | ||||||
(Christian Care Surprise, Inc. Project) 144A | ||||||||
5.75% 1/1/36 # | 1,500,000 | 1,483,125 | ||||||
Maryland Health & Higher Educational Facilities Authority Revenue | ||||||||
(Adventist Healthcare Obligated) Series A 5.50% 1/1/36 | 2,000,000 | 2,331,640 | ||||||
Missouri Health & Educational Facilities Authority | ||||||||
(Saint Luke’s Health System) 4.00% 11/15/33 | 935,000 | 996,532 | ||||||
Moon, Pennsylvania Industrial Development Authority | ||||||||
(Baptist Homes Society Obligation) 5.625% 7/1/30 | 2,440,000 | 2,648,303 | ||||||
New York State Dormitory Authority Revenue | ||||||||
(North Shore Long Island Jewish Health System) | ||||||||
Series A 5.00% 5/1/23 | 4,000,000 | 4,526,200 | ||||||
(Orange Regional Medical Center) | ||||||||
144A 5.00% 12/1/31 # | 1,000,000 | 1,125,590 | ||||||
144A 5.00% 12/1/32 # | 1,100,000 | 1,233,320 | ||||||
144A 5.00% 12/1/33 # | 1,000,000 | 1,116,820 | ||||||
Ohio State | ||||||||
(Cleveland Clinic Health System) Series A 5.00% 1/1/33 | 2,735,000 | 3,315,312 | ||||||
Prince George’s County, Maryland | ||||||||
(Collington Episcopal Life Care Community) | ||||||||
5.00% 4/1/31 | 2,000,000 | 2,147,960 | ||||||
Public Finance Authority, Wisconsin | ||||||||
(Bancroft Neurohealth Project) Series A 144A | ||||||||
4.625% 6/1/36 # | 1,460,000 | 1,421,062 | ||||||
Public Finance Authority, Wisconsin Senior Living Revenue | ||||||||
(Mary’s Woods at Marylhurst Project) 144A | ||||||||
5.00% 5/15/29 # | 500,000 | 545,100 | ||||||
Rochester, Minnesota Health Care Facilities Revenue | ||||||||
(Mayo Clinic) Series C 4.50% 11/15/38 ● | 2,540,000 | 2,887,497 | ||||||
|
| |||||||
| 59,259,839 | ||||||||
|
| |||||||
42
Table of Contents
| Principal amount° | Value (US $) | |||||||
Municipal Bonds (continued) | ||||||||
Lease Revenue Bonds – 4.45% | ||||||||
California Statewide Communities Development Authority Revenue | ||||||||
(Lancer Plaza Project) 5.125% 11/1/23 | 590,000 | $ | 640,522 | |||||
Golden State, California Tobacco Securitization Corporate Settlement Revenue | ||||||||
(Asset-Backed Enhanced) Series A 5.00% 6/1/35 | 3,000,000 | 3,481,740 | ||||||
Idaho Building Authority Revenue | ||||||||
(Health & Welfare Project) Series A 5.00% 9/1/24 | 2,800,000 | 3,248,476 | ||||||
Los Angeles County, California | ||||||||
(Disney Concert Hall Parking) 5.00% 3/1/23 | 2,395,000 | 2,852,541 | ||||||
Michigan State Grant Anticipation Refunding Bonds | ||||||||
Series 2016 5.00% 3/15/27 | 2,000,000 | 2,507,220 | ||||||
Minnesota State General Fund Revenue | ||||||||
Series A 5.00% 6/1/27 | 3,265,000 | 3,857,336 | ||||||
New Jersey State Transportation Trust Fund Authority | ||||||||
Series B 5.50% 6/15/31 | 5,000,000 | 5,436,800 | ||||||
New York Liberty Development Revenue | ||||||||
(World Trade Center Project) Class 2-3 144A | ||||||||
5.15% 11/15/34 # | 1,000,000 | 1,101,550 | ||||||
Public Finance Authority, Wisconsin Airport Facilities Revenue | ||||||||
(AFCO Investors II Portfolio) 5.00% 10/1/23 (AMT) | 2,350,000 | 2,430,723 | ||||||
|
| |||||||
| 25,556,908 | ||||||||
|
| |||||||
Local General Obligation Bonds – 7.44% | ||||||||
Chesterfield County, Virginia | ||||||||
Series B 5.00% 1/1/22 | 4,070,000 | 4,749,242 | ||||||
Chicago, Illinois | ||||||||
Series A 5.25% 1/1/29 | 640,000 | 698,163 | ||||||
Series C 5.00% 1/1/26 | 1,280,000 | 1,430,426 | ||||||
Conroe, Texas Independent School District | 3,070,000 | 3,368,711 | ||||||
Dallas, Texas Independent School District | ||||||||
(Multi-Modal School Building) Series B6 5.00% 2/15/36 (PSF)● | 6,705,000 | 7,755,472 | ||||||
District of Columbia | ||||||||
Series A 5.00% 6/1/30 | 1,000,000 | 1,238,860 | ||||||
Fort Worth, Texas Independent School District | ||||||||
(School Building) 5.00% 2/15/27 (PSF) | 2,000,000 | 2,414,640 | ||||||
New York City, New York | ||||||||
Series A-1 5.00% 8/1/19 | 3,500,000 | 3,505,110 | ||||||
Series E 5.00% 8/1/23 | 3,685,000 | 4,446,026 | ||||||
Subseries D-1 5.00% 10/1/30 | 4,000,000 | 4,580,240 | ||||||
43
Table of Contents
Schedules of investments
Delaware Tax-Free USA Intermediate Fund
| Principal amount° | Value (US $) | |||||||
Municipal Bonds (continued) | ||||||||
Local General Obligation Bonds (continued) | ||||||||
San Francisco, California Bay Area Rapid Transit District | ||||||||
(Election 2004) Series D 5.00% 8/1/31 | 4,000,000 | $ | 4,832,200 | |||||
School District of Philadelphia, Pennsylvania | ||||||||
Series F 5.00% 9/1/28 | 3,215,000 | 3,693,328 | ||||||
|
| |||||||
| 42,712,418 | ||||||||
|
| |||||||
Pre-Refunded/Escrowed to Maturity Bonds – 6.25% | ||||||||
Atlanta, Georgia Water & Wastewater Revenue | ||||||||
Series A 6.00% 11/1/25-19§ | 2,925,000 | 3,245,434 | ||||||
Brooklyn Arena Local Development, New York Pilot Revenue | ||||||||
(Barclays Center Project) 6.50% 7/15/30-20§ | 5,500,000 | 6,230,730 | ||||||
Butler County, Pennsylvania Hospital Authority Revenue | ||||||||
(Butler Health System Project) 7.125% 7/1/29-19§ | 2,250,000 | 2,497,500 | ||||||
California State Department of Water Resources | ||||||||
(Water System) Series AS 5.00% 12/1/29-24§ | 15,000 | 18,801 | ||||||
California State Economic Recovery | ||||||||
(Unrefunded) Series A 5.25% 7/1/21-19§ | 1,000,000 | 1,081,010 | ||||||
Clifton, Texas Higher Education Finance Corporation Revenue | ||||||||
(Uplift Education) Series A 6.00% 12/1/30-20§ | 1,100,000 | 1,272,040 | ||||||
Conroe, Texas Independent School District | ||||||||
5.00% 2/15/25-20 (PSF)§ | 795,000 | 873,268 | ||||||
Dauphin County, Pennsylvania General Authority | ||||||||
(Pinnacle Health System Project) Series A 6.00% 6/1/29-19§ | 1,620,000 | 1,763,904 | ||||||
Guam Government Limited Obligation Revenue (Section 30) | ||||||||
Series A 5.375% 12/1/24-19§ | 1,750,000 | 1,923,950 | ||||||
Series A 5.625% 12/1/29-19§ | 1,125,000 | 1,243,069 | ||||||
Harris County, Texas Industrial Development Corporation Solid Waste Disposal Revenue | ||||||||
(Deer Park Refining Project) 5.00% 2/1/23-19§ | 2,750,000 | 2,999,783 | ||||||
Marietta, Georgia Development Authority Revenue | ||||||||
(Life University Income Project) 6.25% 6/15/20-18§ | 485,000 | 505,651 | ||||||
Massachusetts Development Finance Agency Revenue | ||||||||
(Harvard University) Series B-1 5.25% 10/15/29-20§ | 1,670,000 | 1,891,492 | ||||||
Minneapolis, Minnesota Health Care System Revenue | ||||||||
(Fairview Health Services) Series A 6.375% 11/15/23-18§ | 3,710,000 | 3,956,567 | ||||||
New York State Dormitory Authority Revenue Non State Supported Debt | ||||||||
(Orange Regional Medical Center) 6.50% 12/1/21-18§ | 2,000,000 | 2,113,380 | ||||||
44
Table of Contents
| Principal amount° | Value (US $) | |||||||
Municipal Bonds (continued) | ||||||||
Pre-Refunded/Escrowed to Maturity Bonds (continued) | ||||||||
Pennsylvania Economic Development Financing Authority Health System Revenue | ||||||||
(Albert Einstein Healthcare) Series A 6.25% 10/15/23-19§ | 625,000 | $ | 681,950 | |||||
San Francisco, California City & County Airports Commission | ||||||||
Series D 5.00% 5/1/25-21§ | 570,000 | 653,989 | ||||||
Southwestern Illinois Development Authority | ||||||||
(Memorial Group) 7.125% 11/1/30-23§ | 2,190,000 | 2,938,389 | ||||||
|
| |||||||
| 35,890,907 | ||||||||
|
| |||||||
Special Tax Revenue Bonds – 13.91% | ||||||||
Allentown, Pennsylvania Neighborhood Improvement Zone Development Authority | ||||||||
(City Center Refunding Project) 144A 5.00% 5/1/27 # | 2,250,000 | 2,592,450 | ||||||
Celebration Pointe, Florida Community Development District | ||||||||
4.75% 5/1/24 | 650,000 | 660,355 | ||||||
5.00% 5/1/34 | 880,000 | 891,933 | ||||||
Dallas, Texas Convention Center Hotel Development Revenue | ||||||||
Series A 5.00% 1/1/24 | 3,420,000 | 3,599,276 | ||||||
Series A 5.25% 1/1/23 | 5,375,000 | 5,676,753 | ||||||
Ernest N Morail-New Orleans, Louisiana Exhibition Hall Authority Special Tax Revenue | ||||||||
5.00% 7/15/26 | 2,330,000 | 2,669,900 | ||||||
Harris County-Houston, Texas Sports Authority | ||||||||
(Senior Lien) Series A 5.00% 11/15/30 | 1,805,000 | 2,095,154 | ||||||
Kansas State Department of Transportation | ||||||||
5.00% 9/1/29 | 4,000,000 | 4,870,960 | ||||||
Louisiana State Highway Improvement Revenue | ||||||||
Series A 5.00% 6/15/29 | 5,195,000 | 6,171,037 | ||||||
Massachusetts School Building Authority | ||||||||
Series C 5.00% 8/15/29 | 1,630,000 | 1,975,511 | ||||||
New Jersey Economic Development Authority Revenue | ||||||||
5.00% 6/15/22 | 1,750,000 | 1,961,663 | ||||||
5.00% 6/15/23 | 1,250,000 | 1,389,963 | ||||||
(School Facilities Construction) Series AA | ||||||||
5.50% 12/15/29 | 1,480,000 | 1,550,507 | ||||||
New York City, New York Transitional Finance Authority Future Tax Secured | ||||||||
5.00% 11/1/23 | 2,865,000 | 3,480,087 | ||||||
Subseries A-1 5.00% 11/1/20 | 2,860,000 | 3,218,530 | ||||||
Subseries C 5.00% 11/1/27 | 4,150,000 | 4,999,879 | ||||||
45
Table of Contents
Schedules of investments
Delaware Tax-Free USA Intermediate Fund
| Principal amount° | Value (US $) | |||||||
Municipal Bonds (continued) | ||||||||
Special Tax Revenue Bonds (continued) | ||||||||
New York City, New York Transitional Finance Authority Future Tax Secured | ||||||||
Subseries E-1 5.00% 2/1/26 | 4,020,000 | $ | 4,713,289 | |||||
New York State Local Government Assistance Corporation Subordinate Lien | ||||||||
Series A 5.00% 4/1/20 | 3,360,000 | 3,715,051 | ||||||
New York State Urban Development | ||||||||
(Personal Income Tax) Series A 5.00% 3/15/22 | 6,500,000 | 7,615,530 | ||||||
Public Finance Authority, Wisconsin | ||||||||
(American dream @ Meadowlands Project) 144A | ||||||||
7.00% 12/1/50 # | 1,010,000 | 1,159,429 | ||||||
Regional Transportation District, Colorado | ||||||||
(Fastracks Project) Series B 5.00% 11/1/34 | 3,000,000 | 3,642,510 | ||||||
Richmond Heights, Missouri Tax Increment & Transaction Sales Tax Revenue Refunding & Improvement | ||||||||
(Francis Place Redevelopment Project) 5.625% 11/1/25 | 1,000,000 | 1,000,290 | ||||||
St. Joseph, Missouri Industrial Development Authority Tax Increment Revenue | ||||||||
(Shoppes at North Village Project) Series B | ||||||||
5.375% 11/1/23 | 735,000 | 736,426 | ||||||
Virginia Commonwealth Transportation Board | ||||||||
(Gans-Garvee) 5.00% 3/15/24 | 6,500,000 | 7,755,800 | ||||||
Wyandotte County, Kansas City, Kansas Unified Government Special Obligation Revenue | ||||||||
(Sales Tax - Vacation Village Project Area 1 and 2A) | ||||||||
Series 2015A 5.00% 9/1/27 | 1,665,000 | 1,691,324 | ||||||
|
| |||||||
| 79,833,607 | ||||||||
|
| |||||||
State General Obligation Bonds – 13.59% | ||||||||
California State | ||||||||
5.00% 8/1/26 | 3,120,000 | 3,913,978 | ||||||
5.00% 9/1/30 | 1,715,000 | 2,088,973 | ||||||
Series C 5.00% 9/1/30 | 5,985,000 | 7,225,990 | ||||||
(Various Purposes) | ||||||||
4.00% 11/1/34 | 2,000,000 | 2,188,280 | ||||||
5.00% 9/1/32 | 4,100,000 | 4,947,183 | ||||||
5.25% 9/1/28 | 7,750,000 | 9,015,187 | ||||||
Series A 5.00% 11/1/28 | 3,500,000 | 4,393,725 | ||||||
Connecticut State | ||||||||
Series C 5.00% 11/1/24 | 2,000,000 | 2,081,760 | ||||||
Illinois State | ||||||||
4.00% 2/1/24 | 1,220,000 | 1,273,168 | ||||||
5.00% 3/1/36 | 960,000 | 996,374 | ||||||
46
Table of Contents
| Principal amount° | Value (US $) | |||||||
Municipal Bonds (continued) | ||||||||
State General Obligation Bonds (continued) | ||||||||
Massachusetts Commonwealth | ||||||||
Series A 5.00% 3/1/22 | 3,875,000 | $ | 4,540,570 | |||||
Minnesota State | ||||||||
(Various Purpose) Series F 5.00% 10/1/22 | 8,000,000 | 9,514,320 | ||||||
New York State | ||||||||
Series A 5.00% 2/15/28 | 5,000,000 | 5,677,150 | ||||||
Oregon State | ||||||||
Series L 5.00% 5/1/26 | 6,000,000 | 6,844,080 | ||||||
Texas State | ||||||||
(Transportation Commission Highway) 5.00% 4/1/29 | 4,300,000 | 5,127,793 | ||||||
Washington State | ||||||||
Series R-2015E 5.00% 7/1/31 | 3,250,000 | 3,858,237 | ||||||
(Various Purposes) Series 2015-A-1 5.00% 8/1/30 | 3,595,000 | 4,332,838 | ||||||
|
| |||||||
| 78,019,606 | ||||||||
|
| |||||||
Transportation Revenue Bonds – 15.65% | ||||||||
Bay Area, California Toll Authority | ||||||||
(San Francisco Bay Area) 4.00% 4/1/34 | 1,000,000 | 1,087,080 | ||||||
Broward County, Florida Airport System Revenue | ||||||||
Series O 5.375% 10/1/29 | 2,000,000 | 2,177,000 | ||||||
Chicago, Illinois O’Hare International Airport Revenue | ||||||||
Series B 5.00% 1/1/32 | 1,000,000 | 1,166,530 | ||||||
Series B 5.00% 1/1/33 | 1,520,000 | 1,767,593 | ||||||
(General-Airport-Third Lien) Series C 5.25% 1/1/28 | 2,150,000 | 2,326,923 | ||||||
Houston, Texas Airports Commission Revenue Series B | ||||||||
5.00% 7/1/25 | 1,000,000 | 1,141,130 | ||||||
5.00% 7/1/26 | 3,000,000 | 3,423,390 | ||||||
Kansas State Department of Transportation | ||||||||
Series B 5.00% 9/1/33 | 1,500,000 | 1,796,820 | ||||||
Maryland State Economic Development Corporation Revenue | ||||||||
(Transportation Facilities Project) Series A | ||||||||
5.375% 6/1/25 | 2,535,000 | 2,724,973 | ||||||
Memphis-Shelby County, Tennessee Airport Authority Revenue | ||||||||
Series D 5.00% 7/1/24 | 4,110,000 | 4,630,778 | ||||||
Metropolitan New York Transportation Authority Revenue | ||||||||
Series C 6.50% 11/15/28 | 545,000 | 582,867 | ||||||
New Jersey State Turnpike Authority Turnpike Revenue | ||||||||
Series A 5.00% 1/1/33 | 1,770,000 | 2,102,211 | ||||||
New Orleans, Louisiana Aviation Board | ||||||||
Series B 5.00% 1/1/32 (AGM) (AMT) | 2,900,000 | 3,343,033 | ||||||
Series B 5.00% 1/1/33 (AGM) (AMT) | 2,900,000 | 3,324,328 | ||||||
47
Table of Contents
Schedules of investments
Delaware Tax-Free USA Intermediate Fund
| Principal amount° | Value (US $) | |||||||
Municipal Bonds (continued) | ||||||||
Transportation Revenue Bonds (continued) | ||||||||
New York State Thruway Authority | ||||||||
Series J 5.00% 1/1/27 | 5,705,000 | $ | 6,785,470 | |||||
North Texas Tollway Authority Revenue | ||||||||
(First Tier) 6.00% 1/1/20 | 485,000 | 493,585 | ||||||
Pennsylvania State Turnpike Commission Revenue | ||||||||
Subordinate Series A-1 5.00% 12/1/29 | 3,590,000 | 4,147,060 | ||||||
Phoenix, Arizona Civic Improvement Corporation Airport Revenue | ||||||||
(Junior Lien) | ||||||||
Series A 5.00% 7/1/26 | 7,500,000 | 8,301,450 | ||||||
Series A 5.00% 7/1/33 | 3,355,000 | 3,896,430 | ||||||
Port Authority of New York & New Jersey | ||||||||
(194th Series) 5.00% 10/15/32 | 2,500,000 | 3,001,525 | ||||||
(JFK International Air Terminal) Series 8 6.50% 12/1/28 | 8,300,000 | 8,434,626 | ||||||
Sacramento County, California Airport System Revenue | ||||||||
(PFC/Grant) Series D 5.50% 7/1/28 | 2,020,000 | 2,098,073 | ||||||
Salt Lake City, Utah Airport Revenue | ||||||||
Series B 5.00% 7/1/31 | 500,000 | 607,390 | ||||||
Series B 5.00% 7/1/32 | 600,000 | 725,376 | ||||||
Series B 5.00% 7/1/33 | 1,000,000 | 1,203,180 | ||||||
San Francisco, California City & County Airport Commission - San Francisco International Airport | ||||||||
Series D 5.00% 5/1/25 | 1,430,000 | 1,636,721 | ||||||
St. Louis, Missouri Airport Revenue | ||||||||
(Lambert-St. Louis International) Series A-1 | ||||||||
6.125% 7/1/24 | 3,780,000 | 4,119,746 | ||||||
Texas Private Activity Bond Surface Transportation Corporate Senior Lien Revenue | ||||||||
(LBJ Infrastructure) 7.50% 6/30/33 | 3,625,000 | 4,149,683 | ||||||
(NTE Mobility Partners) | ||||||||
7.00% 12/31/38 (AMT) | 3,750,000 | 4,351,163 | ||||||
7.50% 12/31/31 | 3,765,000 | 4,249,857 | ||||||
|
| |||||||
| 89,795,991 | ||||||||
|
| |||||||
Water & Sewer Revenue Bonds – 5.79% | ||||||||
Atlanta, Georgia Water & Wastewater Revenue | ||||||||
Series B 5.50% 11/1/23 (AGM) | 1,175,000 | 1,289,668 | ||||||
California State Department of Water Resources | ||||||||
(Water System) Series AS 5.00% 12/1/29 | 2,680,000 | 3,245,346 | ||||||
Chicago, Illinois Waterworks Revenue | ||||||||
(2nd Lien) 5.00% 11/1/27 | 2,100,000 | 2,475,774 | ||||||
Dominion, Colorado Water & Sanitation District | ||||||||
5.25% 12/1/27 | 1,390,000 | 1,446,921 | ||||||
48
Table of Contents
| Principal amount° | Value (US $) | |||||||
Municipal Bonds (continued) | ||||||||
Water & Sewer Revenue Bonds (continued) | ||||||||
Great Lakes, Michigan Water Authority Water Supply System Revenue | ||||||||
(Senior Lien Bond) Series C 5.00% 7/1/31 | 3,665,000 | $ | 4,301,390 | |||||
New York State Environmental Facilities Corporation Revenue | ||||||||
(State Clean Water & Drinking Water Revolving Foundation) Series A 5.00% 6/15/22 | 1,405,000 | 1,452,868 | ||||||
Sacramento, California Water Revenue | ||||||||
5.00% 9/1/26 | 3,160,000 | 3,791,652 | ||||||
San Antonio, Texas Water System Revenue | ||||||||
Series A 5.00% 5/15/32 | 1,500,000 | 1,818,465 | ||||||
Series A 5.00% 5/15/33 | 2,250,000 | 2,714,783 | ||||||
(Junior Lien) Series A 5.00% 5/15/22 | 1,765,000 | 2,071,439 | ||||||
San Francisco, California City & County Public Utilities Commission Water Revenue | ||||||||
Subseries A 5.00% 11/1/27 | 7,430,000 | 8,640,867 | ||||||
|
| |||||||
| 33,249,173 | ||||||||
|
| |||||||
Total Municipal Bonds (cost $535,971,839) | 569,670,546 | |||||||
|
| |||||||
Total Value of Securities – 99.25% | $ | 569,670,546 | ||||||
|
| |||||||
| # | Security exempt from registration under Rule 144A of the Securities Act of 1933, as amended. At Aug. 31, 2017, the aggregate value of Rule 144A securities was $15,158,688, which represents 2.64% of the Fund’s net assets. See Note 8 in “Notes to financial statements.” |
| § | Pre-refunded bonds. Municipal bonds that are generally backed or secured by US Treasury bonds. For pre-refunded bonds, the stated maturity is followed by the year in which the bond is pre-refunded. See Note 8 in “Notes to financial statements.” |
| ° | Principal amount shown is stated in US dollars unless noted that the security is denominated in another currency. |
| • | Variable rate investment. Interest rates reset periodically. Interest rate shown reflects the rate in effect at Aug. 31, 2017. For securities based on a published reference rate and spread, the reference rate and spread are indicated in their description above. Certain variable rate securities are not based on a published reference rate and spread but are determined by the issuer or agent and are based on current market conditions. These securities do not indicate a reference rate and spread in their description above. |
| ^ | Zero coupon security. The rate shown is the yield at the time of purchase. |
49
Table of Contents
Schedules of investments
Delaware Tax-Free USA Intermediate Fund
Summary of abbreviations:
AGM – Insured by Assured Guaranty Municipal Corporation
AMT – Subject to Alternative Minimum Tax
PSF – Guaranteed by Permanent School Fund
See accompanying notes, which are an integral part of the financial statements.
50
Table of Contents
| Schedules of investments | ||
| Delaware National High-Yield Municipal Bond Fund | August 31, 2017 | |
| Principal amount° | Value (US $) | |||||||
Municipal Bonds – 99.47% | ||||||||
Corporate Revenue Bonds – 17.02% | ||||||||
Allegheny County, Pennsylvania Industrial Development Authority Revenue | ||||||||
(Environmental Improvement - US Steel Corp. Project) | ||||||||
5.75% 8/1/42 (AMT) | 2,000,000 | $ | 1,981,600 | |||||
Buckeye, Ohio Tobacco Settlement Financing Authority | ||||||||
(Asset-Backed Senior Turbo) | ||||||||
Series A-2 5.875% 6/1/47 | 36,040,000 | 34,581,101 | ||||||
Series A-2 6.00% 6/1/42 | 3,100,000 | 2,978,945 | ||||||
Series A-2 6.50% 6/1/47 | 13,105,000 | 13,103,165 | ||||||
California County Tobacco Securitization Agency Settlement Revenue | ||||||||
(Capital Appreciation Bond - Fresno County Tobacco Funding Corporation) 0.83% 6/1/55 ^ | 100,000,000 | 4,067,000 | ||||||
California Pollution Control Financing Authority Revenue | ||||||||
(Poseidon Resources) 144A 5.00% 7/1/37 (AMT)# | 5,000,000 | 5,388,250 | ||||||
California State Enterprise Development Authority Revenue | ||||||||
(Sunpower Corp. - Recovery Zone Facility) | ||||||||
8.50% 4/1/31 | 1,000,000 | 1,096,260 | ||||||
Columbus County, North Carolina Industrial Facilities & Pollution Control Financing | ||||||||
(International Paper Co. Project) Series A 5.70% 5/1/34 | 1,000,000 | 1,098,460 | ||||||
Golden State, California Tobacco Securitization Corporate Settlement Revenue | ||||||||
(Asset-Backed Senior Notes) | ||||||||
5.75% 6/1/47 | 10,145,000 | 10,144,087 | ||||||
Series A-1 5.125% 6/1/47 | 5,000,000 | 4,979,900 | ||||||
(Capital Appreciation - Asset-Backed-1st Subordinate) | ||||||||
Series B 1.548% 6/1/47 ^ | 30,145,000 | 3,904,079 | ||||||
Houston, Texas Airport System Revenue | ||||||||
Series B-1 5.00% 7/15/35 (AMT) | 5,000,000 | 5,339,800 | ||||||
(Special Facilities Continental Airlines) Series A | ||||||||
6.625% 7/15/38 (AMT) | 2,000,000 | 2,222,860 | ||||||
(United Airlines Inc.) 5.00% 7/1/29 (AMT) | 1,150,000 | 1,239,125 | ||||||
Illinois Railsplitter Tobacco Settlement Authority | ||||||||
5.50% 6/1/23 | 2,010,000 | 2,293,068 | ||||||
6.00% 6/1/28 | 1,455,000 | 1,659,733 | ||||||
6.25% 6/1/24 | 2,635,000 | 2,689,597 | ||||||
Louisiana Local Government Environmental Facilities & Community Development Authority Revenue | ||||||||
(Westlake Chemical Corp.) Series A-1 6.50% 11/1/35 | 3,000,000 | 3,402,750 | ||||||
Main Street Natural Gas Project Revenue, Georgia | ||||||||
Series A 5.50% 9/15/23 | 40,000 | 46,809 | ||||||
51
Table of Contents
Schedules of investments
Delaware National High-Yield Municipal Bond Fund
| Principal amount° | Value (US $) | |||||||
Municipal Bonds (continued) | ||||||||
Corporate Revenue Bonds (continued) | ||||||||
Michigan Tobacco Settlement Financing Authority Revenue Asset-Backed | ||||||||
Series A 6.00% 6/1/48 | 555,000 | $ | 551,087 | |||||
Mission, Texas Economic Development Corporation Revenue | ||||||||
(Senior Lien - Natgasoline Project) Series B 144A | ||||||||
5.75% 10/1/31 (AMT)# | 4,500,000 | 4,709,565 | ||||||
M-S-R Energy Authority, California Gas Revenue | ||||||||
Series A 6.50% 11/1/39 | 2,500,000 | 3,610,300 | ||||||
Series B 6.50% 11/1/39 | 2,500,000 | 3,610,300 | ||||||
New Jersey Economic Development Authority Special Facility Revenue | ||||||||
(Continental Airlines Inc. Project) | ||||||||
5.25% 9/15/29 (AMT) | 4,000,000 | 4,360,520 | ||||||
Series B 5.625% 11/15/30 (AMT) | 1,270,000 | 1,436,687 | ||||||
New York Liberty Development Corporation Revenue | ||||||||
(Goldman Sachs Headquarters) 5.25% 10/1/35 | 7,000,000 | 8,969,660 | ||||||
(Second Priority - Bank of America Tower) Class 3 | ||||||||
6.375% 7/15/49 | 2,000,000 | 2,164,600 | ||||||
Pennsylvania Economic Development Financing Authority | ||||||||
(National Gypsum) 5.50% 11/1/44 (AMT) | 4,500,000 | 4,842,675 | ||||||
Pima County, Arizona Industrial Development Authority Pollution Control Revenue | ||||||||
(Tucson Electric Power) Series A 5.25% 10/1/40 | 500,000 | 537,510 | ||||||
Port of Seattle, Washington Industrial Development Corporation Special Facilities Revenue | ||||||||
(Delta Airlines) 5.00% 4/1/30 (AMT) | 2,000,000 | 2,186,420 | ||||||
Public Authority for Colorado Energy Natural Gas Revenue | ||||||||
Series 28 6.50% 11/15/38 | 2,000,000 | 2,858,700 | ||||||
Salt Verde, Arizona Financial Senior Gas Revenue | ||||||||
5.00% 12/1/37 | 11,765,000 | 14,367,183 | ||||||
5.25% 12/1/27 | 2,235,000 | 2,688,929 | ||||||
5.25% 12/1/28 | 1,050,000 | 1,276,359 | ||||||
5.50% 12/1/29 | 765,000 | 952,685 | ||||||
Shoals, Indiana | ||||||||
(National Gypsum Co. Project) 7.25% 11/1/43 (AMT) | 1,625,000 | 1,869,303 | ||||||
Tennessee State Energy Acquisition Gas Revenue | ||||||||
Series C 5.00% 2/1/27 | 2,940,000 | 3,458,763 | ||||||
Tobacco Settlement Financing Corporation, Louisiana | ||||||||
Asset-Backed Note Series A 5.25% 5/15/35 | 2,540,000 | 2,782,951 | ||||||
Tobacco Settlement Financing Corporation, New Jersey | ||||||||
Series 1A 5.00% 6/1/41 | 21,930,000 | 21,307,846 | ||||||
52
Table of Contents
| Principal amount° | Value (US $) | |||||||
Municipal Bonds (continued) | ||||||||
Corporate Revenue Bonds (continued) | ||||||||
TSASC, New York | ||||||||
Series A 5.00% 6/1/41 | 705,000 | $ | 785,208 | |||||
Tulsa, Oklahoma Municipal Airport Trust Revenue | ||||||||
Series A 5.50% 6/1/35 (AMT) | 2,000,000 | 2,127,360 | ||||||
(American Airlines) 5.00% 6/1/35 (AMT)● | 3,000,000 | 3,252,540 | ||||||
Valparaiso, Indiana | ||||||||
(Pratt Paper LLC Project) 7.00% 1/1/44 (AMT) | 2,865,000 | 3,441,725 | ||||||
Washington Economic Development Finance Authority Revenue | ||||||||
(Columbia Pulp I, LLC Project) Series 2017A 144A | ||||||||
7.50% 1/1/32 (AMT)# | 5,000,000 | 5,491,100 | ||||||
Wisconsin Public Finance Authority | ||||||||
(National Gypsum) 4.00% 8/1/35 (AMT) | 2,000,000 | 1,959,560 | ||||||
|
| |||||||
| 207,816,125 | ||||||||
|
| |||||||
Education Revenue Bonds – 14.18% | ||||||||
Arizona Industrial Development Authority Revenue | ||||||||
(American Charter Schools Foundation Project) | ||||||||
144A 6.00% 7/1/37 # | 775,000 | 840,201 | ||||||
144A 6.00% 7/1/47 # | 4,735,000 | 5,076,109 | ||||||
(Basis Schools Projects) | ||||||||
Series A 144A 5.125% 7/1/37 # | 750,000 | 795,030 | ||||||
Series A 144A 5.375% 7/1/50 # | 1,000,000 | 1,059,400 | ||||||
(Kaizen Education Foundation Project) 144A | ||||||||
5.80% 7/1/52 # | 4,000,000 | 4,093,960 | ||||||
Arlington, Texas Higher Education Finance | ||||||||
(Arlington Classic Academy) 7.65% 8/15/40 | 1,000,000 | 1,108,210 | ||||||
(Leadership Preparatory School) | ||||||||
Series A 5.00% 6/15/36 | 700,000 | 706,678 | ||||||
Series A 5.00% 6/15/46 | 1,325,000 | 1,329,531 | ||||||
Build NYC Resource, New York | ||||||||
5.00% 11/1/39 | 1,000,000 | 1,019,840 | ||||||
5.50% 11/1/44 | 2,500,000 | 2,614,125 | ||||||
Burbank, Illinois | ||||||||
(Intercultural Montessori Language) 144A | ||||||||
6.25% 9/1/45 # | 4,000,000 | 4,163,200 | ||||||
California Educational Facilities Authority Revenue | ||||||||
(Loma Linda University) Series A 5.00% 4/1/47 | 1,500,000 | 1,709,325 | ||||||
California Municipal Finance Authority Revenue | ||||||||
(California Baptist University) Series A 144A | ||||||||
5.50% 11/1/45 # | 4,000,000 | 4,359,000 | ||||||
(Julian Charter School Project) Series A 144A | ||||||||
5.625% 3/1/45 # | 7,500,000 | 7,649,250 | ||||||
53
Table of Contents
Schedules of investments
Delaware National High-Yield Municipal Bond Fund
| Principal amount° | Value (US $) | |||||||
Municipal Bonds (continued) | ||||||||
Education Revenue Bonds (continued) | ||||||||
California Municipal Finance Authority Revenue | ||||||||
(Partnership Uplift Community Project) Series A | ||||||||
5.25% 8/1/42 | 1,700,000 | $ | 1,759,398 | |||||
(Santa Rosa Academy Project) Series A 6.00% 7/1/42 | 1,250,000 | 1,357,663 | ||||||
(Southwestern Law School) 6.50% 11/1/41 | 1,500,000 | 1,774,110 | ||||||
(The Creative Center of Los Altos Project) Series B 144A | ||||||||
4.50% 11/1/46 # | 1,000,000 | 957,650 | ||||||
California School Finance Authority | ||||||||
(Aspire Public Schools) | ||||||||
Series A 144A 5.00% 8/1/35 # | 585,000 | 653,773 | ||||||
Series A 144A 5.00% 8/1/40 # | 605,000 | 671,235 | ||||||
(Encore Education Obligated Group) Series A 144A | ||||||||
5.00% 6/1/52 # | 1,000,000 | 964,810 | ||||||
(Escuela Popular Project) 144A 6.50% 7/1/50 # | 2,750,000 | 2,775,520 | ||||||
(New Designs Charter School) Series A 5.50% 6/1/42 | 2,200,000 | 2,292,026 | ||||||
(View Park Elementary & Middle Schools) | ||||||||
5.875% 10/1/44 | 1,000,000 | 1,093,660 | ||||||
6.00% 10/1/49 | 720,000 | 790,546 | ||||||
California State University | ||||||||
(Systemwide) | ||||||||
Series A 5.00% 11/1/26 | 3,250,000 | 4,147,130 | ||||||
Series A 5.00% 11/1/27 | 2,300,000 | 2,909,431 | ||||||
California Statewide Communities Development Authority Charter School Revenue | ||||||||
(Green Dot Public Schools) Series A 7.25% 8/1/41 | 1,915,000 | 2,177,891 | ||||||
California Statewide Communities Development Authority Revenue | ||||||||
(California Baptist University Project) | ||||||||
7.50% 11/1/41 | 1,000,000 | 1,170,690 | ||||||
Series A 5.50% 11/1/38 | 2,000,000 | 2,044,680 | ||||||
(Lancer Educational Student Housing Project) Series A 144A 5.00% 6/1/46 # | 1,500,000 | 1,565,790 | ||||||
Capital Trust Agency, Florida | ||||||||
(River City Education Services Inc. Project) | ||||||||
5.375% 2/1/35 | 870,000 | 864,127 | ||||||
5.625% 2/1/45 | 1,500,000 | 1,502,175 | ||||||
Colorado Educational & Cultural Facilities Authority Revenue | ||||||||
(Charter School - Community Leadership Academy) | ||||||||
7.45% 8/1/48 | 2,000,000 | 2,327,160 | ||||||
(Charter School - Loveland Classical School) 144A | ||||||||
5.00% 7/1/46 # | 1,500,000 | 1,525,950 | ||||||
(Skyview Charter School) 144A 5.375% 7/1/44 # | 500,000 | 514,375 | ||||||
54
Table of Contents
| Principal amount° | Value (US $) | |||||||
Municipal Bonds (continued) | ||||||||
Education Revenue Bonds (continued) | ||||||||
Colorado Educational & Cultural Facilities Authority Revenue | ||||||||
(Windsor Charter Academy Project) Series 2016 144A | ||||||||
5.00% 9/1/36 # | 1,000,000 | $ | 1,006,120 | |||||
Delaware State Economic Development Authority Revenue | ||||||||
(Charter School - Aspira Charter) | ||||||||
5.00% 6/1/36 | 700,000 | 723,499 | ||||||
5.00% 6/1/46 | 820,000 | 838,778 | ||||||
5.00% 6/1/51 | 1,035,000 | 1,056,466 | ||||||
District of Columbia Revenue | ||||||||
(KIPP Charter School) 6.00% 7/1/48 | 1,450,000 | 1,679,448 | ||||||
(Provident Group - Howard Properties) 5.00% 10/1/35 | 2,500,000 | 2,473,500 | ||||||
East Hempfield Township, Pennsylvania Industrial Development Authority | ||||||||
(Student Services Income - Student Housing Project) | ||||||||
5.00% 7/1/30 | 1,000,000 | 1,084,520 | ||||||
Hawaii State Department of Budget & Finance | ||||||||
Series A 144A 5.00% 1/1/45 # | 1,500,000 | 1,508,130 | ||||||
(Hawaii Pacific University) Series A 6.875% 7/1/43 | 2,000,000 | 2,172,800 | ||||||
Henderson, Nevada Public Improvement Trust | ||||||||
(Touro College & University System) 5.50% 1/1/44 | 2,000,000 | 2,210,420 | ||||||
Idaho Housing & Finance Association | ||||||||
Series A 5.00% 6/1/50 | 1,000,000 | 1,054,420 | ||||||
(Idaho Arts Charter School Incorporate) 144A | ||||||||
5.00% 12/1/36 # | 615,000 | 657,816 | ||||||
(North Star Charter School) | ||||||||
Series A 6.75% 7/1/48 | 529,150 | 532,859 | ||||||
Series B 144A 4.87% 7/1/49 #^ | 2,888,155 | 299,271 | ||||||
Illinois Finance Authority Charter School Revenue | ||||||||
(Uno Charter School) Series A 7.125% 10/1/41 | 1,000,000 | 1,101,180 | ||||||
Illinois Finance Authority Revenue | ||||||||
(Lake Forest College) Series A 6.00% 10/1/48 | 1,000,000 | 1,074,480 | ||||||
(Rogers Park Montessori) | ||||||||
6.00% 2/1/34 | 675,000 | 715,426 | ||||||
6.125% 2/1/45 | 1,800,000 | 1,898,784 | ||||||
Illinois Finance Authority Student Housing Revenue | ||||||||
(Dekalb II - Northern Illinois University Project) | ||||||||
6.875% 10/1/43 | 1,000,000 | 1,098,590 | ||||||
Indiana State Finance Authority Revenue Educational Facilities | ||||||||
(Drexel Foundation - Thea Bowman Academy Charter School) Series A 7.00% 10/1/39 | 1,000,000 | 1,001,640 | ||||||
55
Table of Contents
Schedules of investments
Delaware National High-Yield Municipal Bond Fund
| Principal amount° | Value (US $) | |||||||
Municipal Bonds (continued) | ||||||||
Education Revenue Bonds (continued) | ||||||||
Kanawha, West Virginia | ||||||||
(West Virginia University Foundation Project) | ||||||||
6.75% 7/1/45 | 2,500,000 | $ | 2,806,700 | |||||
Louisiana Public Facilities Authority Revenue | ||||||||
(Lake Charles Charter Academy Foundation Project) | ||||||||
8.00% 12/15/41 | 1,500,000 | 1,670,385 | ||||||
Macon-Bibb County, Georgia Urban Development Authority Revenue | ||||||||
(Academy for Classical Education) | ||||||||
Series A 144A 5.875% 6/15/47 # | 1,680,000 | 1,764,454 | ||||||
Series A 144A 6.00% 6/15/52 # | 1,530,000 | 1,609,637 | ||||||
Maricopa County, Arizona Industrial Development Authority | ||||||||
(Paradise Schools Projects) Series 2016 144A | ||||||||
5.00% 7/1/47 # | 1,500,000 | 1,535,130 | ||||||
Maryland State Health & Higher Educational Facilities Authority Revenue | ||||||||
(Patterson Park Public Charter School) Series A | ||||||||
6.125% 7/1/45 | 1,000,000 | 1,029,460 | ||||||
Massachusetts State Development Finance Agency Revenue | ||||||||
(UMass Boston Student Housing Project) Series 2016 | ||||||||
5.00% 10/1/48 | 3,605,000 | 3,987,094 | ||||||
Miami-Dade County, Florida Industrial Development Authority | ||||||||
(Youth Co-Op Charter School) | ||||||||
Series A 144A 5.75% 9/15/35 # | 1,000,000 | 1,040,400 | ||||||
Series A 144A 6.00% 9/15/45 # | 1,000,000 | 1,045,980 | ||||||
Michigan Finance Authority Limited Obligation Revenue | ||||||||
(Higher Education Thomas M Cooley) 144A | ||||||||
6.75% 7/1/44 # | 3,500,000 | 3,568,495 | ||||||
(Public School Academy Old Redford) Series A | ||||||||
6.50% 12/1/40 | 900,000 | 922,320 | ||||||
(Public School Academy University Learning) | ||||||||
7.50% 11/1/40 | 1,000,000 | 1,049,570 | ||||||
Michigan Public Educational Facilities Authority Revenue | ||||||||
(Limited-Obligation-Landmark Academy) 7.00% 12/1/39 | 950,000 | 928,929 | ||||||
Nevada State Department of Business & Industry | ||||||||
(Somerset Academy) | ||||||||
Series A 144A 5.00% 12/15/35 # | 1,595,000 | 1,638,448 | ||||||
Series A 144A 5.125% 12/15/45 # | 2,515,000 | 2,567,589 | ||||||
56
Table of Contents
| Principal amount° | Value (US $) | |||||||
Municipal Bonds (continued) | ||||||||
Education Revenue Bonds (continued) | ||||||||
New Jersey Economic Development Authority Revenue | ||||||||
(Provident Group - Montclair University Student Housing Project) 5.875% 6/1/42 | 1,500,000 | $ | 1,638,060 | |||||
New Jersey State Higher Education Student Assistance Authority Student Loan Revenue | ||||||||
Series 1B 5.75% 12/1/39 (AMT) | 1,250,000 | 1,373,050 | ||||||
New York State Dormitory Authority | ||||||||
(Touro College & University System) Series A | ||||||||
5.50% 1/1/44 | 2,875,000 | 3,186,621 | ||||||
North Texas Education Finance Revenue | ||||||||
(Uplift Education) Series A 5.25% 12/1/47 | 2,100,000 | 2,226,378 | ||||||
Pennsylvania State Higher Educational Facilities Authority Revenue | ||||||||
(Foundation Indiana University) Series A 1.52% | ||||||||
(US0003M+0.67%) 7/1/39 (SGI)● | 2,400,000 | 1,890,672 | ||||||
Philadelphia, Pennsylvania Authority for Industrial Development Revenue | ||||||||
(1st Philadelphia Preparatory) 7.25% 6/15/43 | 1,230,000 | 1,436,050 | ||||||
(Discovery Charter School Project) 5.875% 4/1/32 | 450,000 | 467,235 | ||||||
6.25% 4/1/37 | 200,000 | 209,534 | ||||||
(Global Leadership Academy Project) 6.375% 11/15/40 | 1,000,000 | 1,057,910 | ||||||
(Green Woods Charter School) Series A 5.75% 6/15/42 | 1,600,000 | 1,656,608 | ||||||
(New Foundation Charter School Project) | ||||||||
6.625% 12/15/41 | 1,000,000 | 1,135,670 | ||||||
(Tacony Academy Charter School Project) | ||||||||
7.00% 6/15/43 | 1,540,000 | 1,739,168 | ||||||
Phoenix, Arizona Industrial Development Authority Revenue | ||||||||
(Basic Schools Project) | ||||||||
Series 2015A 144A 5.00% 7/1/46 # | 4,000,000 | 4,146,600 | ||||||
Series 2016A 144A 5.00% 7/1/45 # | 2,000,000 | 2,074,640 | ||||||
(Choice Academies Project) | ||||||||
5.375% 9/1/32 | 1,000,000 | 1,062,920 | ||||||
5.625% 9/1/42 | 600,000 | 636,534 | ||||||
(Eagle College Preparatory Project) Series A | ||||||||
5.00% 7/1/43 | 450,000 | 456,912 | ||||||
(Rowan University Project) 5.00% 6/1/42 | 2,000,000 | 2,173,000 | ||||||
Pima County, Arizona Industrial Development Authority Revenue | ||||||||
(Edkey Charter Schools Project) 6.00% 7/1/43 | 2,000,000 | 1,716,760 | ||||||
57
Table of Contents
Schedules of investments
Delaware National High-Yield Municipal Bond Fund
| Principal amount° | Value (US $) | |||||||
Municipal Bonds (continued) | ||||||||
Education Revenue Bonds (continued) | ||||||||
Pottsboro, Texas Higher Education Finance Authority Revenue | ||||||||
Series A 5.00% 8/15/36 | 655,000 | $ | 670,655 | |||||
Series A 5.00% 8/15/46 | 1,000,000 | 1,014,620 | ||||||
Private Colleges & Universities Authority, Georgia Revenue | ||||||||
(Mercer University) Series A 5.00% 10/1/32 | 1,005,000 | 1,085,289 | ||||||
Provo, Utah Charter School Revenue | ||||||||
(Freedom Academy Foundation Project) 5.50% 6/15/37 | 700,000 | 701,113 | ||||||
St. Paul, Minnesota Housing & Redevelopment Authority Charter School Lease Revenue | ||||||||
(Academia Cesar Chavez School Project) Series A | ||||||||
5.25% 7/1/50 | 2,560,000 | 2,619,213 | ||||||
(Hmong College Preparatory Academy Project) | ||||||||
Series A 5.75% 9/1/46 | 1,000,000 | 1,047,180 | ||||||
Series A 6.00% 9/1/51 | 3,000,000 | 3,172,980 | ||||||
Utah State Charter School Finance Authority Revenue | ||||||||
(North Davis Preparatory) 6.375% 7/15/40 | 1,290,000 | 1,375,527 | ||||||
Wisconsin Public Finance Authority Revenue | ||||||||
(Pine Lake Preparatory) 144A 5.50% 3/1/45 # | 3,460,000 | 3,613,278 | ||||||
(Roseman University Health Sciences Project) | ||||||||
5.75% 4/1/42 | 2,000,000 | 2,127,940 | ||||||
Wyoming Community Development Authority Student Housing Revenue | ||||||||
(CHF-Wyoming LLC) 6.50% 7/1/43 | 1,000,000 | 1,098,400 | ||||||
Yonkers, New York Economic Development Corporation Education Revenue | ||||||||
(Charter School Educational Excellence) | ||||||||
6.25% 10/15/40 | 595,000 | 625,512 | ||||||
|
| |||||||
| 173,152,416 | ||||||||
|
| |||||||
Electric Revenue Bonds – 0.56% | ||||||||
Long Island, New York Power Authority | ||||||||
Series A 5.00% 9/1/44 | 1,960,000 | 2,237,732 | ||||||
South Carolina State Public Service Authority | ||||||||
Series E 5.25% 12/1/55 | 4,000,000 | 4,576,360 | ||||||
|
| |||||||
| 6,814,092 | ||||||||
|
| |||||||
Healthcare Revenue Bonds – 28.84% | ||||||||
Abag, California Finance Authority for Nonprofit Corporations | ||||||||
(Episcopal Senior Communities) 6.125% 7/1/41 | 1,650,000 | 1,880,901 | ||||||
Alachua County, Florida Health Facilities Authority | ||||||||
(Oak Hammock University) | ||||||||
Series A 8.00% 10/1/42 | 1,000,000 | 1,189,980 | ||||||
Series A 8.00% 10/1/46 | 1,500,000 | 1,781,925 | ||||||
58
Table of Contents
| Principal amount° | Value (US $) | |||||||
Municipal Bonds (continued) | ||||||||
Healthcare Revenue Bonds (continued) | ||||||||
Allen County, Indiana Economic Development Revenue | ||||||||
(StoryPoint Fort Wayne Project) Series A-1 144A | ||||||||
6.875% 1/15/52 # | 1,650,000 | $ | 1,747,465 | |||||
Antelope Valley, California Healthcare District | ||||||||
Series A 5.00% 3/1/41 | 1,000,000 | 1,012,430 | ||||||
Apple Valley, Minnesota | ||||||||
(Minnesota Senior Living LLC, Project) | ||||||||
Series B 5.00% 1/1/47 | 2,500,000 | 2,563,400 | ||||||
Series D 7.25% 1/1/52 | 7,290,000 | 7,234,231 | ||||||
Bexar County, Texas Health Facilities Development | ||||||||
(Army Retirement Residence Foundation Project) Series 2010 5.875% 7/1/30 | 155,000 | 168,928 | ||||||
Birmingham, Alabama Special Care Facilities Financing Authority | ||||||||
(Methodist Home for the Aging) | ||||||||
5.50% 6/1/30 | 1,850,000 | 2,062,824 | ||||||
5.75% 6/1/35 | 1,500,000 | 1,679,160 | ||||||
5.75% 6/1/45 | 2,500,000 | 2,765,675 | ||||||
6.00% 6/1/50 | 2,650,000 | 2,975,447 | ||||||
Board of Managers Joint Guadalupe County-City of Seguin, Texas Hospital | ||||||||
5.00% 12/1/45 | 1,100,000 | 1,141,316 | ||||||
Butler County, Ohio Port Authority | ||||||||
(Storypoint Fairfield Project) Series A-1 144A | ||||||||
6.50% 1/15/52 # | 650,000 | 670,072 | ||||||
California Health Facilities Financing Authority Revenue | ||||||||
(Kaiser Permanente) Series A-2 5.00% 11/1/47 | 4,870,000 | 6,407,459 | ||||||
California Municipal Finance Authority Revenue | ||||||||
(Northbay Healthcare Group) Series A 5.25% 11/1/47 | 500,000 | 568,400 | ||||||
California Statewide Communities Development Authority Revenue | ||||||||
(BE Group) 144A 7.25% 11/15/41 # | 500,000 | 550,855 | ||||||
(Loma Linda University Medical Center) | ||||||||
5.50% 12/1/54 | 13,000,000 | 14,301,690 | ||||||
Series A 5.25% 12/1/29 | 3,000,000 | 3,345,630 | ||||||
Series A 144A 5.25% 12/1/56 # | 3,000,000 | 3,297,630 | ||||||
Camden County, New Jersey Improvement Authority Revenue | ||||||||
(Cooper Health System Obligation Group) | ||||||||
5.75% 2/15/42 | 2,500,000 | 2,823,450 | ||||||
Capital Trust Agency, Florida | ||||||||
(Elim Senior Housing Inc. Project) 144A 5.875% 8/1/52 # | 2,500,000 | 2,557,550 | ||||||
59
Table of Contents
Schedules of investments
Delaware National High-Yield Municipal Bond Fund
| Principal amount° | Value (US $) | |||||||
Municipal Bonds (continued) | ||||||||
Healthcare Revenue Bonds (continued) | ||||||||
Capital Trust Agency, Florida | ||||||||
(Tuscan Gardens Senior Living Center) Series A | ||||||||
7.00% 4/1/49 | 5,000,000 | $ | 4,968,700 | |||||
Centre County, Pennsylvania Hospital Authority | ||||||||
(Mount Nittany Medical Center) Series A | ||||||||
5.00% 11/15/46 | 1,250,000 | 1,398,750 | ||||||
Chesterfield County, Virginia Economic Development Authority Revenue | ||||||||
(1st Mortgage - Brandermill Woods Project) | ||||||||
5.125% 1/1/43 | 1,030,000 | 1,051,568 | ||||||
Chesterton, Indiana | ||||||||
(StoryPoint Chesterton Project) Series A 144A | ||||||||
6.375% 1/15/51 # | 1,000,000 | 1,014,190 | ||||||
Cobb County, Georgia Development Authority | ||||||||
(Provident Village at Creekside Project) Series A 144A | ||||||||
6.00% 7/1/51 # | 4,000,000 | 3,656,800 | ||||||
Colorado Health Facilities Authority Revenue | ||||||||
(American Baptist) 8.00% 8/1/43 | 2,500,000 | 2,913,175 | ||||||
(Mental Health Center Denver Project) Series A | ||||||||
5.75% 2/1/44 | 500,000 | 560,175 | ||||||
(School Health Systems) Series A 5.00% 1/1/44 | 1,000,000 | 1,113,930 | ||||||
(Sunny Vista Living Center) | ||||||||
Series A 144A 5.50% 12/1/30 # | 750,000 | 769,680 | ||||||
Series A 144A 5.75% 12/1/35 # | 1,150,000 | 1,187,605 | ||||||
Series A 144A 6.125% 12/1/45 # | 1,200,000 | 1,266,168 | ||||||
Series A 144A 6.25% 12/1/50 # | 560,000 | 593,975 | ||||||
Connecticut State Health & Educational Facility Authority | ||||||||
(Church Home of Hartford Project) | ||||||||
Series A 144A 5.00% 9/1/46 # | 1,000,000 | 1,015,940 | ||||||
Series A 144A 5.00% 9/1/53 # | 1,500,000 | 1,507,560 | ||||||
Cumberland County, Pennsylvania Municipal Authority Revenue | ||||||||
(Asbury Pennsylvania Obligation Group) 5.25% 1/1/41 | 1,600,000 | 1,632,464 | ||||||
(Diakon Lutheran Ministries Series) 6.375% 1/1/39 | 100,000 | 106,781 | ||||||
Cuyahoga County, Ohio Hospital Revenue | ||||||||
(The Metrohealth System) | ||||||||
5.25% 2/15/47 | 5,200,000 | 5,716,048 | ||||||
5.50% 2/15/52 | 4,405,000 | 4,914,570 | ||||||
5.50% 2/15/57 | 7,250,000 | 8,092,813 | ||||||
Decatur, Texas Hospital Authority | ||||||||
(Wise Regional Health Systems) | ||||||||
Series A 5.00% 9/1/34 | 1,000,000 | 1,068,900 | ||||||
Series A 5.25% 9/1/29 | 500,000 | 548,705 | ||||||
60
Table of Contents
| Principal amount° | Value (US $) | |||||||
Municipal Bonds (continued) | ||||||||
Healthcare Revenue Bonds (continued) | ||||||||
Decatur, Texas Hospital Authority | ||||||||
(Wise Regional Health Systems) | ||||||||
Series A 5.25% 9/1/44 | 2,000,000 | $ | 2,149,440 | |||||
Duluth, Minnesota Economic Development Authority Revenue | ||||||||
(St. Luke’s Hospital Authority Obligation Group) | ||||||||
5.75% 6/15/32 | 3,750,000 | 4,082,587 | ||||||
East Rochester, New York Housing Authority Revenue | ||||||||
(Senior Living - Woodland Village Project) 5.50% 8/1/33 | 1,155,000 | 1,159,539 | ||||||
Florida Development Finance | ||||||||
(Tuscan Isle Champions Gate Project) Series A 144A | ||||||||
6.375% 6/1/46 # | 5,500,000 | 5,375,370 | ||||||
(Tuscan Isle Obligated Group) Series A 144A | ||||||||
7.00% 6/1/45 # | 2,000,000 | 1,623,860 | ||||||
(UF Health - Jacksonville Project) Series A | ||||||||
6.00% 2/1/33 | 2,375,000 | 2,676,245 | ||||||
Glendale, Arizona Industrial Development Authority Revenue | ||||||||
(Glencroft Retirement Community Project) | ||||||||
5.00% 11/15/36 | 830,000 | 823,866 | ||||||
5.25% 11/15/51 | 1,350,000 | 1,322,527 | ||||||
Hawaii Pacific Health Special Purpose Revenue | ||||||||
Series A 5.50% 7/1/40 | 1,250,000 | 1,358,713 | ||||||
Hawaii State Department of Budget & Finance Special Purpose Senior Living Revenue | ||||||||
(Hawaii Pacific Health Obligation) Series A | ||||||||
5.50% 7/1/43 | 2,990,000 | 3,404,324 | ||||||
(Kahala Nui) 5.25% 11/15/37 | 1,000,000 | 1,100,050 | ||||||
Hospital Facilities Authority of Multnomah County, Oregon | ||||||||
(Mirabella at South Waterfront) 5.50% 10/1/49 | 2,400,000 | 2,561,640 | ||||||
Illinois Finance Authority Revenue | ||||||||
(Admiral at Lake Project) | ||||||||
Series A 7.625% 5/15/25 | 1,750,000 | 1,945,195 | ||||||
Series A 7.75% 5/15/30 | 500,000 | 553,950 | ||||||
Series A 8.00% 5/15/40 | 2,205,000 | 2,444,992 | ||||||
Series A 8.00% 5/15/46 | 1,500,000 | 1,660,485 | ||||||
(Lutheran Home & Services) 5.75% 5/15/46 | 1,685,000 | 1,767,481 | ||||||
Illinois Housing Development Authority | ||||||||
(Stonebridge of Gurnee Project) | ||||||||
Series A 144A 5.45% 1/1/46 # | 2,500,000 | 2,359,575 | ||||||
Series A 144A 5.60% 1/1/56 # | 2,700,000 | 2,554,983 | ||||||
61
Table of Contents
Schedules of investments
Delaware National High-Yield Municipal Bond Fund
| Principal amount° | Value (US $) | |||||||
Municipal Bonds (continued) | ||||||||
Healthcare Revenue Bonds (continued) | ||||||||
Indiana Finance Authority Revenue | ||||||||
(King’s Daughters Hospital & Health) | ||||||||
5.50% 8/15/40 | 1,000,000 | $ | 1,075,770 | |||||
5.50% 8/15/45 | 1,000,000 | 1,073,410 | ||||||
(Marquette Project) 5.00% 3/1/39 | 1,250,000 | 1,294,763 | ||||||
Iowa Finance Authority | ||||||||
(Sunrise Retirement Community) 5.75% 9/1/43 | 2,500,000 | 2,553,250 | ||||||
Kalispell, Montana | ||||||||
(Immanuel Lutheran Corporation Project) Series A | ||||||||
5.25% 5/15/47 | 1,300,000 | 1,359,241 | ||||||
Kentucky Economic Development Finance Authority Healthcare Revenue | ||||||||
(Owensboro Health) Series A 5.00% 6/1/45 | 1,250,000 | 1,358,450 | ||||||
(Rosedale Green Project) | ||||||||
5.50% 11/15/35 | 1,310,000 | 1,342,907 | ||||||
5.75% 11/15/45 | 2,500,000 | 2,568,825 | ||||||
5.75% 11/15/50 | 1,600,000 | 1,630,208 | ||||||
Kentwood, Michigan Economic Development Corporation Revenue | ||||||||
(Limited Obligation - Holland Home) 5.625% 11/15/41 | 1,250,000 | 1,332,950 | ||||||
Kirkwood, Missouri Industrial Development Authority | ||||||||
(Aberdeen Heights) Series A 5.25% 5/15/50 | 6,000,000 | 6,306,900 | ||||||
Lakeland, Florida | ||||||||
(Lakeland Regional Health) 5.00% 11/15/45 | 5,000,000 | 5,602,150 | ||||||
Louisiana Public Facilities Authority Revenue | ||||||||
(Ochsner Clinic Foundation Project) 5.00% 5/15/46 | 1,770,000 | 2,000,790 | ||||||
Lucas County, Ohio Health Care Facilities Revenue | ||||||||
(Sunset Retirement Communities) 5.50% 8/15/30 | 1,000,000 | 1,106,700 | ||||||
Maine Health & Higher Educational Facilities Authority Revenue | ||||||||
(Maine General Medical Center) 6.75% 7/1/41 | 1,700,000 | 1,858,185 | ||||||
Maricopa County, Arizona Industrial Development Authority | ||||||||
(Christian Care Surprise, Inc. Project) Series 2016 144A | ||||||||
6.00% 1/1/48 # | 5,400,000 | 5,415,552 | ||||||
Martin County, Florida Health Facilities Authority Revenue | ||||||||
(Martin Memorial Medical Center) 5.50% 11/15/42 | 1,000,000 | 1,100,950 | ||||||
Maryland Health & Higher Educational Facilities Authority | ||||||||
(Adventist Healthcare) Series A 5.50% 1/1/46 | 5,000,000 | 5,742,900 | ||||||
(Medstar Health Issue) Series A 5.00% 5/15/45 | 1,000,000 | 1,139,260 | ||||||
Miami-Dade County, Florida Health Facilities Authority Revenue | ||||||||
(Nicklaus Children’s Hospital Project) 5.00% 8/1/47 | 2,350,000 | 2,689,763 | ||||||
62
Table of Contents
| Principal amount° | Value (US $) | |||||||
Municipal Bonds (continued) | ||||||||
Healthcare Revenue Bonds (continued) | ||||||||
Michigan State Strategic Fund Limited Revenue | ||||||||
(Evangelical Homes) 5.50% 6/1/47 | 2,750,000 | $ | 2,836,570 | |||||
Missouri State Health & Educational Facilities Authority Revenue | ||||||||
(Lutheran Senior Services) 6.00% 2/1/41 | 1,000,000 | 1,100,800 | ||||||
Montgomery County, Pennsylvania Industrial Development Authority Revenue | ||||||||
(Whitemarsh Continuing Care) | ||||||||
5.25% 1/1/40 | 1,550,000 | 1,576,288 | ||||||
5.375% 1/1/50 | 6,250,000 | 6,363,187 | ||||||
Moon, Pennsylvania Industrial Development Authority | ||||||||
(Baptist Homes Society Obligation) 6.125% 7/1/50 | 8,500,000 | 9,317,530 | ||||||
New Hampshire Health & Education Facilities Authority | ||||||||
(Rivermeade) Series A 6.875% 7/1/41 | 1,380,000 | 1,547,104 | ||||||
New Hope, Texas Cultural Education Facilities Finance | ||||||||
(Cardinal Bay - Village on the Park) | ||||||||
Series A1 4.00% 7/1/36 | 635,000 | 660,394 | ||||||
Series A1 5.00% 7/1/46 | 1,395,000 | 1,553,876 | ||||||
Series A1 5.00% 7/1/51 | 1,595,000 | 1,774,087 | ||||||
Series B 4.00% 7/1/31 | 635,000 | 656,965 | ||||||
Series B 4.25% 7/1/36 | 955,000 | 983,335 | ||||||
Series B 4.75% 7/1/51 | 1,915,000 | 2,007,992 | ||||||
Series B 5.00% 7/1/46 | 1,595,000 | 1,721,244 | ||||||
Series C 5.00% 7/1/31 | 250,000 | 258,830 | ||||||
Series C 5.25% 7/1/36 | 350,000 | 367,637 | ||||||
Series C 5.50% 7/1/46 | 1,250,000 | 1,317,825 | ||||||
Series C 5.75% 7/1/51 | 1,000,000 | 1,070,630 | ||||||
Series D 6.00% 7/1/26 | 150,000 | 147,359 | ||||||
Series D 7.00% 7/1/51 | 1,350,000 | 1,364,323 | ||||||
New Jersey Economic Development Authority | ||||||||
(Lions Gate Project) 5.25% 1/1/44 | 2,000,000 | 2,091,840 | ||||||
New Jersey Health Care Facilities Financing Authority Revenue | ||||||||
(Barnabas Health Services) Series A 4.00% 7/1/26 | 980,000 | 1,064,682 | ||||||
(Princeton Healthcare System) 5.00% 7/1/39 | 2,500,000 | 2,835,550 | ||||||
(St. Peters University Hospital) 6.25% 7/1/35 | 2,700,000 | 2,963,736 | ||||||
(University Hospital) Series A 5.00% 7/1/46 (AGM) | 5,000,000 | 5,637,500 | ||||||
New York State Dormitory Authority | ||||||||
(Orange Regional Medical Center) | ||||||||
144A 5.00% 12/1/40 # | 1,100,000 | 1,203,279 | ||||||
144A 5.00% 12/1/45 # | 800,000 | 870,040 | ||||||
63
Table of Contents
Schedules of investments
Delaware National High-Yield Municipal Bond Fund
| Principal amount° | Value (US $) | |||||||
Municipal Bonds (continued) | ||||||||
Healthcare Revenue Bonds (continued) | ||||||||
North Carolina Medical Care Commission Health Care Facilities Revenue | ||||||||
(First Mortgage - Galloway Ridge Project) 6.00% 1/1/39 | 1,520,000 | $ | 1,586,637 | |||||
Northampton County, Pennsylvania Industrial Development Authority Revenue | ||||||||
(Morningstar Senior Living) 5.00% 7/1/36 | 2,000,000 | 2,062,160 | ||||||
Orange County, New York Funding Corporation Assisted Living Residence Revenue | ||||||||
6.50% 1/1/46 | 3,900,000 | 3,998,202 | ||||||
Palm Beach County, Florida Health Facilities Authority | ||||||||
(Sinai Residences Boca Raton Project) | ||||||||
7.25% 6/1/34 | 285,000 | 345,163 | ||||||
Series A 7.50% 6/1/49 | 2,920,000 | 3,568,620 | ||||||
Palomar, California Health | ||||||||
Series 2016 5.00% 11/1/39 | 1,670,000 | 1,866,292 | ||||||
Payne County, Oklahoma Economic Development Authority | ||||||||
(Epworth Living at the Ranch) Series A 7.00% 11/1/51 | 3,250,000 | 3,288,090 | ||||||
Prince George’s County, Maryland | ||||||||
(Collington Episcopal Life Care Community) | ||||||||
5.00% 4/1/31 | 1,030,000 | 1,106,199 | ||||||
5.25% 4/1/47 | 2,000,000 | 2,128,460 | ||||||
Public Finance Authority, Wisconsin | ||||||||
(Bancroft Neurohealth Project) | ||||||||
Series A 144A 4.625% 6/1/36 # | 235,000 | 228,733 | ||||||
Series A 144A 5.00% 6/1/36 # | 960,000 | 976,262 | ||||||
Series A 144A 5.125% 6/1/48 # | 1,375,000 | 1,394,814 | ||||||
(Mary’s Woods at Marylhurst Project) 144A | ||||||||
5.25% 5/15/52 # | 2,300,000 | 2,454,790 | ||||||
Puerto Rico Industrial Tourist Educational Medical & Environmental Control Facilities Financing Authority | ||||||||
(Auxilio Mutuo) Series A 6.00% 7/1/33 | 5,630,000 | 5,934,020 | ||||||
Rochester, Minnesota | ||||||||
(The Homestead at Rochester) Series A 6.875% 12/1/48 | 2,500,000 | 2,789,625 | ||||||
Salem, Oregon Hospital Facility Authority Revenue | ||||||||
(Capital Manor Inc.) 6.00% 5/15/47 | 1,500,000 | 1,642,635 | ||||||
San Buenaventura, California Revenue | ||||||||
(Community Memorial Health System) 7.50% 12/1/41 | 4,475,000 | 5,237,540 | ||||||
South Carolina Jobs - Economic Development Authority Hospital Revenue | ||||||||
(Palmetto Health) 5.75% 8/1/39 | 915,000 | 962,726 | ||||||
64
Table of Contents
| Principal amount° | Value (US $) | |||||||
Municipal Bonds (continued) | ||||||||
Healthcare Revenue Bonds (continued) | ||||||||
Southeastern Ohio Port Authority | ||||||||
(Memorial Health Systems) | ||||||||
5.00% 12/1/43 | 805,000 | $ | 828,103 | |||||
5.50% 12/1/43 | 1,250,000 | 1,354,637 | ||||||
St. Louis County, Missouri Industrial Development Authority | ||||||||
(Nazareth Living Center Project) | ||||||||
Series A 5.00% 8/15/35 | 600,000 | 612,216 | ||||||
Series A 5.125% 8/15/45 | 1,800,000 | 1,808,118 | ||||||
Suffolk County, New York Economic Development Corporation Revenue | ||||||||
(Peconic Landing Southland) 6.00% 12/1/40 | 575,000 | 625,957 | ||||||
Tarrant County, Texas Cultural Education Facilities Finance | ||||||||
(Baylor Scott & White Health) Series A 5.00% 11/15/45 | 3,790,000 | 4,335,571 | ||||||
(Buckingham Senior Living Community) 5.50% 11/15/45 | 3,000,000 | 3,163,710 | ||||||
(Buckner Retirement Services) | ||||||||
Series B 5.00% 11/15/40 | 2,080,000 | 2,349,838 | ||||||
Series B 5.00% 11/15/46 | 3,000,000 | 3,363,930 | ||||||
(Buckner Senior Living - Ventana Project) 6.75% 11/15/47 | 1,850,000 | 2,011,764 | ||||||
6.75% 11/15/52 | 3,300,000 | 3,575,682 | ||||||
Tempe, Arizona Industrial Development Authority Revenue | ||||||||
(Friendship Village) Series A 6.25% 12/1/46 | 500,000 | 532,270 | ||||||
University of Colorado Hospital Authority Revenue | ||||||||
(UCHA Obligation Group) 5.00% 11/15/38 ● | 3,000,000 | 3,413,970 | ||||||
Vermont Economic Development Authority Revenue | ||||||||
(Wake Robin Corp. Project) 5.40% 5/1/33 | 1,100,000 | 1,157,772 | ||||||
Washington State Housing Finance Commission | ||||||||
(Bayview Manor Homes) | ||||||||
Series A 144A 5.00% 7/1/36 # | 700,000 | 727,307 | ||||||
Series A 144A 5.00% 7/1/46 # | 1,450,000 | 1,490,557 | ||||||
Series A 144A 5.00% 7/1/51 # | 2,000,000 | 2,044,280 | ||||||
(Heron’s Key) | ||||||||
Series A 144A 7.00% 7/1/45 # | 1,750,000 | 1,747,637 | ||||||
Series A 144A 7.00% 7/1/50 # | 2,000,000 | 1,976,920 | ||||||
(Wesley Homes at Lea Hill Project) | ||||||||
Series 2016 144A 5.00% 7/1/46 # | 1,000,000 | 1,009,890 | ||||||
Series 2016 144A 5.00% 7/1/51 # | 2,000,000 | 2,008,360 | ||||||
Wayzata, Minnesota Senior Housing Revenue | ||||||||
(Folkestone Senior Living Community) | ||||||||
Series A 5.50% 11/1/32 | 270,000 | 287,485 | ||||||
Series A 5.75% 11/1/39 | 600,000 | 639,240 | ||||||
65
Table of Contents
Schedules of investments
Delaware National High-Yield Municipal Bond Fund
| Principal amount° | Value (US $) | |||||||
Municipal Bonds (continued) | ||||||||
Healthcare Revenue Bonds (continued) | ||||||||
Wayzata, Minnesota Senior Housing Revenue | ||||||||
(Folkestone Senior Living Community) Series A 6.00% 5/1/47 | 920,000 | $ | 978,420 | |||||
West Virginia Hospital Finance Authority Revenue | ||||||||
(Highland Hospital Obligation Group) 9.125% 10/1/41 ‡ | 7,800,000 | 7,208,760 | ||||||
Westminster, Maryland | ||||||||
(Lutheran Village Millers Grant) | ||||||||
6.00% 7/1/34 | 800,000 | 871,824 | ||||||
Series A 5.00% 7/1/24 | 1,700,000 | 1,805,383 | ||||||
Series A 6.125% 7/1/39 | 750,000 | 817,965 | ||||||
Series A 6.25% 7/1/44 | 2,500,000 | 2,724,050 | ||||||
Wichita, Kansas | ||||||||
(Kansas Masonic Home) | ||||||||
Series II-A 5.00% 12/1/31 | 500,000 | 526,055 | ||||||
Series II-A 5.25% 12/1/36 | 500,000 | 530,025 | ||||||
Series II-A 5.375% 12/1/46 | 1,200,000 | 1,265,172 | ||||||
Wisconsin Public Finance Authority | ||||||||
(Rose Villa Project) Series A 5.75% 11/15/44 | 2,000,000 | 2,174,040 | ||||||
|
| |||||||
| 352,133,140 | ||||||||
|
| |||||||
Housing Revenue Bonds – 0.74% | ||||||||
California Municipal Finance Authority Mobile Home Park Revenue | ||||||||
(Caritas Affordable Housing) Senior Series A 5.25% 8/15/39 | 1,200,000 | 1,332,540 | ||||||
(Caritas Projects) | ||||||||
Senior Series A 5.50% 8/15/47 | 1,500,000 | 1,659,090 | ||||||
Senior Series A 6.40% 8/15/45 | 1,715,000 | 1,861,993 | ||||||
Independent Cities Finance Authority, California | ||||||||
Series A 5.25% 5/15/44 | 750,000 | 828,743 | ||||||
Series A 5.25% 5/15/49 | 3,000,000 | 3,305,550 | ||||||
|
| |||||||
| 8,987,916 | ||||||||
|
| |||||||
Lease Revenue Bonds – 4.58% | ||||||||
California Municipal Finance Authority Revenue | ||||||||
(Goodwill Industry Sacramento Valley) 5.25% 1/1/45 | 1,295,000 | 1,280,082 | ||||||
(Goodwill Industry Sacramento Valley and Northern Nevada Project) | ||||||||
Series A 144A 6.625% 1/1/32 # | 500,000 | 539,205 | ||||||
Series A 144A 6.875% 1/1/42 # | 1,500,000 | 1,622,160 | ||||||
California Statewide Communities Development Authority Revenue | ||||||||
(Lancer Plaza Project) 5.875% 11/1/43 | 1,875,000 | 2,047,669 | ||||||
66
Table of Contents
| Principal amount° | Value (US $) | |||||||
Municipal Bonds (continued) | ||||||||
Lease Revenue Bonds (continued) | ||||||||
Capital Trust Agency, Florida Revenue | ||||||||
(Air Cargo - Aero Miami) Series A 5.35% 7/1/29 | 810,000 | $ | 855,490 | |||||
District of Columbia Revenue | ||||||||
(Center of Strategic & International Studies) 6.625% 3/1/41 | 2,235,000 | 2,442,028 | ||||||
Industrial Development Authority of Phoenix, Arizona | ||||||||
5.125% 2/1/34 | 1,000,000 | 954,550 | ||||||
5.375% 2/1/41 | 4,000,000 | 3,873,040 | ||||||
New Jersey Economic Development Authority Special Facility Revenue | ||||||||
Series WW 5.25% 6/15/30 | 5,000,000 | 5,554,800 | ||||||
New York Liberty Development Revenue | ||||||||
(Class 1-3 World Trade Center Project) 144A 5.00% 11/15/44 # | 5,000,000 | 5,447,500 | ||||||
(Class 2-3 World Trade Center Project) 144A 5.375% 11/15/40 # | 2,410,000 | 2,680,860 | ||||||
(Class 3-3 World Trade Center Project) 144A 7.25% 11/15/44 # | 9,600,000 | 11,459,424 | ||||||
Public Finance Authority, Wisconsin Airport Facilities Revenue | ||||||||
(AFCO Investors II Portfolio) 5.75% 10/1/31 (AMT) | 3,775,000 | 3,984,852 | ||||||
(Senior Obligation Group) 5.00% 7/1/42 (AMT) | 4,000,000 | 4,288,560 | ||||||
Virginia Public Building Authority | ||||||||
Series B 5.00% 8/1/20 | 6,970,000 | 7,780,402 | ||||||
Wise County, Texas | ||||||||
(Parker County Junior College District) 8.00% 8/15/34 | 1,000,000 | 1,152,480 | ||||||
|
| |||||||
| 55,963,102 | ||||||||
|
| |||||||
Local General Obligation Bonds – 3.42% | ||||||||
Chicago Board of Education | ||||||||
Series A 144A 7.00% 12/1/46 # | 2,500,000 | 2,936,500 | ||||||
Chicago, Illinois | ||||||||
Series 2005D 5.50% 1/1/37 | 2,280,000 | 2,472,751 | ||||||
Series 2005D 5.50% 1/1/40 | 3,000,000 | 3,243,780 | ||||||
Series 2007E 5.50% 1/1/42 | 2,150,000 | 2,321,893 | ||||||
Series 2007F 5.50% 1/1/42 | 1,250,000 | 1,349,937 | ||||||
Series A 5.25% 1/1/29 | 4,415,000 | 4,816,235 | ||||||
Series A 5.50% 1/1/33 | 2,000,000 | 2,195,580 | ||||||
Series A 6.00% 1/1/38 | 6,285,000 | 7,271,619 | ||||||
Series C 5.00% 1/1/26 | 2,105,000 | 2,352,380 | ||||||
New York City, New York | ||||||||
Series E 5.00% 8/1/20 | 3,615,000 | 4,031,267 | ||||||
Raleigh, North Carolina | ||||||||
Series A 5.00% 9/1/22 | 5,000,000 | 5,941,650 | ||||||
67
Table of Contents
Schedules of investments
Delaware National High-Yield Municipal Bond Fund
| Principal amount° | Value (US $) | |||||||
Municipal Bonds (continued) | ||||||||
Local General Obligation Bonds (continued) | ||||||||
Ramsey County, Minnesota Capital Improvement Plan | ||||||||
Series A 5.00% 2/1/20 | 2,530,000 | $ | 2,778,142 | |||||
|
| |||||||
| 41,711,734 | ||||||||
|
| |||||||
Pre-Refunded/Escrowed to Maturity Bonds – 6.81% | ||||||||
Bexar County, Texas Health Facilities Development | ||||||||
(Army Retirement Residence Foundation Project) Series 2010 5.875% 7/1/30-20§ | 845,000 | 960,038 | ||||||
Bowling Green, Ohio Student Housing Revenue CFP I | ||||||||
(State University Project) 6.00% 6/1/45-20§ | 1,215,000 | 1,376,631 | ||||||
Brevard County, Florida Health Facilities Authority Revenue | ||||||||
(Health First Inc. Project) 7.00% 4/1/39-19§ | 3,500,000 | 3,837,190 | ||||||
Brooklyn Arena Local Development, New York Pilot Revenue | ||||||||
(Barclays Center Project) | ||||||||
6.25% 7/15/40-20§ | 5,500,000 | 6,198,500 | ||||||
6.50% 7/15/30-20§ | 1,175,000 | 1,331,111 | ||||||
Butler County, Pennsylvania Hospital Authority Revenue | ||||||||
(Butler Health System Project) 7.125% 7/1/29-19§ | 900,000 | 999,000 | ||||||
California Municipal Finance Authority Revenue | ||||||||
(Azusa Pacific University Project) Series B 7.75% 4/1/31-21§ | 750,000 | 908,603 | ||||||
(Eisenhower Medical Center) Series A 5.75% 7/1/40-20§ | 1,000,000 | 1,134,760 | ||||||
California Statewide Communities Development Authority Revenue | ||||||||
(Aspire Public Schools) 6.00% 7/1/40-19§ | 995,000 | 1,064,441 | ||||||
Central Texas Regional Mobility Authority Revenue | ||||||||
Senior Lien 6.00% 1/1/41-21§ | 1,890,000 | 2,193,610 | ||||||
Subordinate Lien 6.75% 1/1/41-21§ | 1,000,000 | 1,184,770 | ||||||
Clifton, Texas Higher Education Finance Corporation Revenue | ||||||||
(Idea Public Schools) 5.75% 8/15/41-21§ | 1,000,000 | 1,175,260 | ||||||
(Uplift Education) Series A 6.25% 12/1/45-20§ | 1,000,000 | 1,164,360 | ||||||
Cumberland County, Pennsylvania Municipal Authority Revenue | ||||||||
(Diakon Lutheran Ministries Project) 6.375% 1/1/39-19§ | 900,000 | 965,646 | ||||||
Guam Government Obligation Revenue | ||||||||
(Section 30) Series A 5.625% 12/1/29-19§ | 310,000 | 342,535 | ||||||
Hawaii State Department of Budget & Finance Special Purpose Senior Living Revenue | ||||||||
(15 Craigside Project) Series A 9.00% 11/15/44-19§ | 1,000,000 | 1,174,600 | ||||||
68
Table of Contents
| Principal amount° | Value (US $) | |||||||
Municipal Bonds (continued) | ||||||||
Pre-Refunded/Escrowed to Maturity Bonds (continued) | ||||||||
Illinois Finance Authority Revenue | ||||||||
(Provena Health) | ||||||||
Series A 7.75% 8/15/34-19§ | 20,000 | $ | 22,636 | |||||
Series A (Refunded) 7.75% 8/15/34-19§ | 980,000 | 1,109,164 | ||||||
(Silver Cross & Medical Centers) 7.00% 8/15/44-19§ | 3,570,000 | 3,986,548 | ||||||
Kentucky Economic Development Finance Authority Hospital Revenue | ||||||||
(Owensboro Medical Health System) Series A 6.50% 3/1/45-20§ | 4,965,000 | 5,698,430 | ||||||
Koyukuk, Alaska Revenue | ||||||||
(Tanana Chiefs Conference Health Care Facility Project) 7.75% 10/1/41-19§ | 1,750,000 | 1,992,340 | ||||||
Lancaster Redevelopment Agency, California | ||||||||
(Redevelopment Project) 6.875% 8/1/39-19§ | 285,000 | 317,456 | ||||||
Unrefunded (Redevelopment Project) 6.875% 8/1/39-19§ | 215,000 | 239,484 | ||||||
Louisiana Public Facilities Authority Revenue | ||||||||
(Ochsner Clinic Foundation Project) 6.50% 5/15/37-21§ | 1,705,000 | 2,040,817 | ||||||
Lucas County, Ohio Improvement | ||||||||
(Lutheran Homes) Series A 7.00% 11/1/45-20§ | 3,865,000 | 4,566,034 | ||||||
Marietta, Georgia Development Authority Revenue | ||||||||
(Life University Income Project) 7.00% 6/15/39-18§ | 3,845,000 | 4,030,713 | ||||||
Maryland Health & Higher Educational Facilities Authority | ||||||||
(Doctors Community Hospital) 5.75% 7/1/38-20§ | 1,730,000 | 1,957,927 | ||||||
Maryland State Economic Development Corporation Student Housing Revenue | ||||||||
(University of Maryland College Park Projects) 5.75% 6/1/33-18§ | 1,130,000 | 1,172,104 | ||||||
Massachusetts State Health & Educational Facilities Authority Revenue | ||||||||
(Springfield College) 5.625% 10/15/40-19§ | 1,000,000 | 1,100,010 | ||||||
New Jersey Health Care Facilities Financing Authority Revenue | ||||||||
(St. Joseph’s Healthcare System) 6.625% 7/1/38-18§ | 860,000 | 901,547 | ||||||
New Jersey State Educational Facilities Authority Revenue | ||||||||
(University of Medicine & Dentistry) Series B 7.50% 12/1/32-19§ | 1,000,000 | 1,115,100 | ||||||
New York State Dormitory Authority Revenue Non State Supported Debt | ||||||||
(Orange Regional Medical Center) 6.25% 12/1/37-18§ | 5,000,000 | 5,342,300 | ||||||
Onondaga, New York Civic Development Revenue | ||||||||
(St. Joseph’s Hospital Health Center Project) 4.50% 7/1/32-22§ | 1,000,000 | 1,154,770 | ||||||
69
Table of Contents
Schedules of investments
Delaware National High-Yield Municipal Bond Fund
| Principal amount° | Value (US $) | |||||||
Municipal Bonds (continued) | ||||||||
Pre-Refunded/Escrowed to Maturity Bonds (continued) | ||||||||
Onondaga, New York Civic Development Revenue | ||||||||
(St. Joseph’s Hospital Health Center Project) 5.125% 7/1/31-19§ | 1,000,000 | $ | 1,076,070 | |||||
Oregon State Facilities Authority Revenue | ||||||||
(Concordia University Project) | ||||||||
Series A 144A 6.125% 9/1/30-20#§ | 875,000 | 1,005,427 | ||||||
Series A 144A 6.375% 9/1/40-20#§ | 500,000 | 578,210 | ||||||
Pennsylvania Economic Development Financing Authority Health System Revenue | ||||||||
(Albert Einstein Healthcare) Series A 6.25% 10/15/23-19§ | 980,000 | 1,069,298 | ||||||
Pennsylvania State Higher Educational Facilities Authority Revenue | ||||||||
(Edinboro University Foundation) | ||||||||
5.80% 7/1/30-20§ | 1,300,000 | 1,472,302 | ||||||
6.00% 7/1/42-18§ | 1,000,000 | 1,043,430 | ||||||
Sacramento County, California Airport System Revenue | ||||||||
(PFC/Grant) Series C 6.00% 7/1/41-18§ | 1,000,000 | 1,043,950 | ||||||
San Juan, Texas Higher Education Finance Authority Education Revenue | ||||||||
(Idea Public Schools) Series A 6.70% 8/15/40-20§ | 2,000,000 | 2,331,140 | ||||||
Southwestern Illinois Development Authority Revenue | ||||||||
(Memorial Group) | ||||||||
7.125% 11/1/30-23§ | 1,420,000 | 1,905,257 | ||||||
7.125% 11/1/43-23§ | 2,500,000 | 3,354,325 | ||||||
St. Johns County, Florida Industrial Development Authority Revenue | ||||||||
(Presbyterian Retirement) Series A 5.875% 8/1/40-20§ | 1,000,000 | 1,137,250 | ||||||
Travis County, Texas Health Facilities Development Corporation Revenue | ||||||||
(Westminster Manor Project) 7.125% 11/1/40-20§ | 1,000,000 | 1,186,750 | ||||||
University of Arizona Medical Center Hospital Revenue | ||||||||
6.00% 7/1/39-21§ | 1,500,000 | 1,776,360 | ||||||
Washington State Health Care Facilities Authority Revenue | ||||||||
(Multicare Health System) Series B 6.00% 8/15/39-19 (AGC)§ | 1,250,000 | 1,374,013 | ||||||
|
| |||||||
| 83,112,217 | ||||||||
|
| |||||||
Resource Recovery Revenue Bonds – 0.92% | ||||||||
California Pollution Control Financing Authority Revenue | ||||||||
(Calplant I Project) 144A 8.00% 7/1/39 (AMT)# | 5,250,000 | 5,798,835 | ||||||
Essex County, New Jersey Improvement Authority | ||||||||
144A 5.25% 7/1/45 (AMT)# | 2,500,000 | 2,518,100 | ||||||
70
Table of Contents
| Principal amount° | Value (US $) | |||||||
Municipal Bonds (continued) | ||||||||
Resource Recovery Revenue Bonds (continued) | ||||||||
Mission, Texas Economic Development Corporation Revenue | ||||||||
(Dallas Clean Energy McCommas) 6.875% 12/1/24 (AMT) | 1,000,000 | $ | 1,009,430 | |||||
Orange County, Florida Industrial Development Authority | ||||||||
(Vitag Florida LLC Project) 144A 8.00% 7/1/36 (AMT)# | 3,250,000 | 1,881,295 | ||||||
|
| |||||||
| 11,207,660 | ||||||||
|
| |||||||
Special Tax Revenue Bonds – 7.36% | ||||||||
Allentown, Pennsylvania Neighborhood Improvement Zone Development Authority Revenue | ||||||||
(City Center Refunding Project) | ||||||||
144A 5.00% 5/1/32 # | 2,500,000 | 2,786,950 | ||||||
144A 5.00% 5/1/42 # | 2,000,000 | 2,157,260 | ||||||
Anne Arundel County, Maryland Special Obligation Revenue | ||||||||
(National Business Park - North Project) 6.10% 7/1/40 | 1,725,000 | 1,779,545 | ||||||
Babcock Ranch, Florida Community Independent Special District | ||||||||
5.00% 11/1/31 | 615,000 | 630,707 | ||||||
5.25% 11/1/46 | 500,000 | 509,775 | ||||||
Canyons, Colorado Metropolitan District No. 5 | ||||||||
Series A 6.125% 12/1/47 | 1,000,000 | 1,010,520 | ||||||
Celebration Pointe, Florida Community Development District | ||||||||
5.125% 5/1/45 | 2,000,000 | 2,029,740 | ||||||
Cherry Hill, Virginia Community Development Authority | ||||||||
(Potomac Shores Project) | ||||||||
144A 5.15% 3/1/35 # | 1,000,000 | 1,038,930 | ||||||
144A 5.40% 3/1/45 # | 2,000,000 | 2,093,800 | ||||||
Colliers Hill, Colorado Metropolitan District No. 2 | ||||||||
Series A 6.50% 12/1/47 | 2,000,000 | 2,040,640 | ||||||
Conley Road Transportation Development District, Missouri | ||||||||
5.375% 5/1/47 | 5,250,000 | 5,333,265 | ||||||
Dutchess County, New York Local Development Corporation Revenue | ||||||||
(Anderson Center Services Inc. Project) 6.00% 10/1/30 | 1,800,000 | 1,858,536 | ||||||
Farms New Kent, Virginia Community Development Authority Special Assessment | ||||||||
Series C 5.80% 3/1/36 ‡ | 1,000,000 | 249,840 | ||||||
Fountain Urban Renewal Authority, Colorado | ||||||||
(Improvement - South Academy Highland) Series A 5.50% 11/1/44 | 5,000,000 | 5,269,050 | ||||||
71
Table of Contents
Schedules of investments
Delaware National High-Yield Municipal Bond Fund
| Principal amount° | Value (US $) | |||||||
Municipal Bonds (continued) | ||||||||
Special Tax Revenue Bonds (continued) | ||||||||
Glen Cove, New York Local Economic Assistance | ||||||||
(Garvies Point Public Improvement Project) Series A 5.00% 1/1/56 | 2,000,000 | $ | 2,032,680 | |||||
Juban Crossing Economic Development District, Louisiana | ||||||||
(General Infrastructure Projects) 144A 7.00% 9/15/44 # | 3,575,000 | 3,752,713 | ||||||
(Road Projects) Series A 144A 7.00% 9/15/44 # | 2,205,000 | 2,314,610 | ||||||
Midtown Miami, Florida Community Development District | ||||||||
(Parking Garage Project) Series A 5.00% 5/1/37 | 1,235,000 | 1,309,853 | ||||||
Mobile, Alabama Improvement District | ||||||||
(McGowin Park Project) | ||||||||
Series A 5.25% 8/1/30 | 1,000,000 | 1,044,960 | ||||||
Series A 5.50% 8/1/35 | 1,300,000 | 1,351,220 | ||||||
Mosaic District, Virginia Community Development Authority Revenue | ||||||||
Series A 6.875% 3/1/36 | 1,500,000 | 1,654,485 | ||||||
Nampa Development Corporation, Idaho Revenue | ||||||||
144A 5.00% 9/1/31 # | 2,940,000 | 3,219,182 | ||||||
5.90% 3/1/30 | 2,000,000 | 2,135,880 | ||||||
New Jersey Transportation Trust Fund Authority | ||||||||
(Transportation Program) | ||||||||
Series AA 5.00% 6/15/44 | 4,900,000 | 5,215,462 | ||||||
Series AA 5.25% 6/15/41 | 1,000,000 | 1,091,270 | ||||||
New York City, New York Industrial Development Agency | ||||||||
(Pilot - Queens Baseball Stadium) 5.00% 1/1/22 (AMBAC) | 1,000,000 | 1,003,180 | ||||||
(Yankee Stadium) 7.00% 3/1/49 (AGC) | 1,000,000 | 1,090,350 | ||||||
New York City, New York Transitional Finance Authority Future Tax Secured Revenue | ||||||||
(Future Tax Secured - Subordinated Fiscal) Series A-1 5.00% 11/1/19 | 1,525,000 | 1,659,520 | ||||||
Norco, California Redevelopment Agency Tax Allocation | ||||||||
(Area #1 Project) 6.00% 3/1/36 | 1,000,000 | 1,114,550 | ||||||
Northampton County, Pennsylvania Industrial Development Authority | ||||||||
(Route 33 Project) 7.00% 7/1/32 | 2,635,000 | 3,085,796 | ||||||
Public Finance Authority Revenue, Wisconsin | ||||||||
(Goodwill Industries of Southern Nevada Project) | ||||||||
Series A 5.50% 12/1/35 | 2,500,000 | 1,749,750 | ||||||
Series A 5.75% 12/1/45 | 2,500,000 | 1,749,750 | ||||||
Public Finance Authority, Wisconsin | ||||||||
(American Dream @ Meadowlands Project) 144A 7.00% 12/1/50 # | 5,065,000 | 5,814,367 | ||||||
72
Table of Contents
| Principal amount° | Value (US $) | |||||||
Municipal Bonds (continued) | ||||||||
Special Tax Revenue Bonds (continued) | ||||||||
Regional Transportation, Colorado District Revenue | ||||||||
(Denver Transit Partners) 6.00% 1/15/41 | 1,000,000 | $ | 1,100,330 | |||||
Richmond Heights, Missouri Tax Increment & Transaction Sales Tax Revenue Improvement | ||||||||
(Francis Place Redevelopment Project) 5.625% 11/1/25 | 1,200,000 | 1,200,348 | ||||||
Southglenn, Colorado Metropolitan District | ||||||||
Series 2016 5.00% 12/1/30 | 1,535,000 | 1,606,086 | ||||||
Series 2016 5.00% 12/1/36 | 810,000 | 830,226 | ||||||
Series 2016 5.00% 12/1/46 | 2,100,000 | 2,133,012 | ||||||
St. Joseph, Missouri Industrial Development Authority Tax Increment Revenue | ||||||||
(Shoppes at North Village Project) | ||||||||
Series A 5.375% 11/1/24 | 1,000,000 | 1,000,890 | ||||||
Series A 5.50% 11/1/27 | 500,000 | 500,365 | ||||||
St. Louis County, Missouri Industrial Development Authority | ||||||||
(Manchester Ballas Community) | ||||||||
Series A 144A 5.00% 9/1/38 # | 1,030,000 | 1,033,502 | ||||||
Series A 144A 5.25% 9/1/45 # | 3,000,000 | 3,008,010 | ||||||
St. Louis, Missouri Industrial Development Authority Tax Increment Revenue Improvement | ||||||||
(Grand Center Redevelopment Project) 6.375% 12/1/25 | 1,200,000 | 1,232,604 | ||||||
Wyandotte County, Kansas City, Kansas Unified Government Special Obligation Revenue | ||||||||
(Sales Tax Vacation Village Project) Series A 6.00% 9/1/35 | 5,000,000 | 5,031,500 | ||||||
|
| |||||||
| 89,855,009 | ||||||||
|
| |||||||
State General Obligation Bonds – 3.65% | ||||||||
California State | ||||||||
5.00% 8/1/46 | 2,000,000 | 2,346,740 | ||||||
(Bid Group C) Series B 5.00% 8/1/27 | 5,000,000 | 6,243,350 | ||||||
(Various Purposes) | ||||||||
4.00% 11/1/34 | 2,600,000 | 2,844,764 | ||||||
4.00% 11/1/47 | 2,500,000 | 2,671,900 | ||||||
5.00% 11/1/47 | 12,500,000 | 14,826,875 | ||||||
Hawaii State | ||||||||
Series EH 5.00% 8/1/20 | 5,000,000 | 5,581,350 | ||||||
Illinois State | ||||||||
5.00% 5/1/36 | 1,710,000 | 1,782,675 | ||||||
5.00% 2/1/39 | 2,980,000 | 3,089,008 | ||||||
Series A 5.00% 4/1/38 | 2,805,000 | 2,900,033 | ||||||
73
Table of Contents
Schedules of investments
Delaware National High-Yield Municipal Bond Fund
| Principal amount° | Value (US $) | |||||||
Municipal Bonds (continued) | ||||||||
State General Obligation Bonds (continued) | ||||||||
New York State | ||||||||
Series A 5.25% 2/15/24 | 2,000,000 | $ | 2,291,480 | |||||
|
| |||||||
| 44,578,175 | ||||||||
|
| |||||||
Transportation Revenue Bonds – 8.07% | ||||||||
Chicago, Illinois O’Hare International Airport Revenue | ||||||||
Series B 5.00% 1/1/33 | 4,135,000 | 4,808,550 | ||||||
Delaware Transportation Authority | ||||||||
5.00% 6/1/55 | 4,105,000 | 4,608,437 | ||||||
Foothill-Eastern Transportation Corridor Agency, California | ||||||||
Series A 5.75% 1/15/46 | 5,000,000 | 5,759,700 | ||||||
Series A 6.00% 1/15/49 | 7,690,000 | 8,877,413 | ||||||
Hawaii Airports System Revenue | ||||||||
Series A 5.00% 7/1/45 (AMT) | 3,490,000 | 3,968,688 | ||||||
Houston, Texas Airport System Revenue Subordinate Lien | ||||||||
Series A 5.00% 7/1/25 (AMT) | 1,000,000 | 1,125,110 | ||||||
Kentucky Public Transportation Infrastructure Authority | ||||||||
(1st Tier - Downtown Crossing) | ||||||||
Series A 5.75% 7/1/49 | 3,000,000 | 3,372,570 | ||||||
Series A 6.00% 7/1/53 | 1,290,000 | 1,463,815 | ||||||
Long Beach, California Harbor Revenue | ||||||||
Series A 5.00% 5/15/40 (AMT) | 2,660,000 | 3,122,095 | ||||||
Long Beach, California Marina Revenue | ||||||||
5.00% 5/15/40 | 1,000,000 | 1,105,470 | ||||||
Los Angeles, California Department of Airports | ||||||||
Series D 5.00% 5/15/41 (AMT) | 5,000,000 | 5,701,650 | ||||||
Maryland State Economic Development Revenue | ||||||||
(Transportation Facilities Project) Series A 5.75% 6/1/35 | 1,400,000 | 1,501,780 | ||||||
Metropolitan New York Transportation Authority | ||||||||
(Green Bonds) Series A1 5.25% 11/15/56 | 5,000,000 | 5,872,250 | ||||||
Metropolitan Washington Airports Authority | ||||||||
Series A 5.00% 10/1/34 (AMT) | 3,850,000 | 4,504,885 | ||||||
New York State Thruway Authority Revenue | ||||||||
Series A 5.00% 5/1/19 | 3,265,000 | 3,484,408 | ||||||
(Junior Lien) Series A 5.25% 1/1/56 | 4,000,000 | 4,687,680 | ||||||
Port Authority of New York & New Jersey Special Project | ||||||||
(JFK International Air Terminal) Series 8 6.00% 12/1/42 | 1,970,000 | 2,206,774 | ||||||
Riverside County, California Transportation Senior Lien | ||||||||
Series A 5.75% 6/1/48 | 1,000,000 | 1,135,600 | ||||||
San Francisco, California City & County Airports Commission | ||||||||
Series A 5.50% 5/1/27 (AMT) | 1,915,000 | 1,974,959 | ||||||
74
Table of Contents
| Principal amount° | Value (US $) | |||||||
Municipal Bonds (continued) | ||||||||
Transportation Revenue Bonds (continued) | ||||||||
San Francisco, California City & County Airports Commission | ||||||||
(San Francisco International) Series B | ||||||||
5.00% 5/1/46 (AMT) | 5,000,000 | $ | 5,708,800 | |||||
St. Louis, Missouri Airport Revenue | ||||||||
(Lambert-St. Louis International) Series A-1 | ||||||||
6.625% 7/1/34 | 1,090,000 | 1,194,062 | ||||||
Texas Private Activity Bond Surface Transportation | ||||||||
Corporate Senior Lien | ||||||||
(Blueridge Transportation) | ||||||||
5.00% 12/31/45 (AMT) | 1,270,000 | 1,401,775 | ||||||
5.00% 12/31/50 (AMT) | 1,910,000 | 2,098,059 | ||||||
5.00% 12/31/55 (AMT) | 1,840,000 | 2,014,248 | ||||||
(LBJ Infrastructure) | ||||||||
7.00% 6/30/40 | 7,000,000 | 7,944,860 | ||||||
7.50% 6/30/33 | 500,000 | 572,370 | ||||||
(NTE Mobility) | ||||||||
6.75% 6/30/43 (AMT) | 1,905,000 | 2,210,086 | ||||||
6.875% 12/31/39 | 4,055,000 | 4,527,083 | ||||||
7.00% 12/31/38 (AMT) | 1,335,000 | 1,549,014 | ||||||
|
| |||||||
| 98,502,191 | ||||||||
|
| |||||||
Water & Sewer Revenue Bonds – 3.32% | ||||||||
Charlotte County, Florida Industrial Development Authority | ||||||||
(Town & Country Utilities Project) 144A | ||||||||
5.50% 10/1/36 (AMT)# | 500,000 | 489,285 | ||||||
Chicago, Illinois Waterworks Revenue | ||||||||
(2nd Lien) | ||||||||
5.00% 11/1/26 | 180,000 | 214,295 | ||||||
5.00% 11/1/27 | 150,000 | 176,841 | ||||||
5.00% 11/1/28 | 30,000 | 35,306 | ||||||
5.00% 11/1/29 | 1,470,000 | 1,715,563 | ||||||
5.00% 11/1/30 | 1,000,000 | 1,160,800 | ||||||
Dominion, Colorado Water & Sanitation District Revenue | ||||||||
6.00% 12/1/46 | 4,000,000 | 4,170,680 | ||||||
Jefferson County, Alabama Sewer Revenue | ||||||||
(Senior Lien-Warrants) Series A 5.50% 10/1/53 (AGM) | 2,500,000 | 2,873,225 | ||||||
(Sub Lien-Warrants) | ||||||||
Series D 6.50% 10/1/53 | 16,500,000 | 19,879,035 | ||||||
Series D 7.00% 10/1/51 | 5,000,000 | 6,166,200 | ||||||
75
Table of Contents
Schedules of investments
Delaware National High-Yield Municipal Bond Fund
| Principal amount° | Value (US $) | |||||||
Municipal Bonds (continued) | ||||||||
Water & Sewer Revenue Bonds (continued) | ||||||||
New York City, New York Water & Sewer System | ||||||||
(Second Generation Resolution) 5.00% 6/15/46 | 3,150,000 | $ | 3,655,733 | |||||
|
| |||||||
| 40,536,963 | ||||||||
|
| |||||||
Total Municipal Bonds (cost $1,137,820,003) | 1,214,370,740 | |||||||
|
| |||||||
Short-Term Investments – 0.90% | ||||||||
Variable Rate Demand Notes – 0.90%¤ | ||||||||
City & County of Denver, Colorado Series A2 | ||||||||
0.79% 12/1/29 (SPA - JP Morgan Chase Bank N.A.) | 1,800,000 | 1,800,000 | ||||||
Los Angeles, California Department of Water & Power System Revenue | ||||||||
Subordinate Series B-3 | ||||||||
0.63% 7/1/34 (SPA - Barclays Bank) | 400,000 | 400,000 | ||||||
Subseries A-5 | ||||||||
0.63% 7/1/35 (SPA - Bank of America N.A.) | 2,100,000 | 2,100,000 | ||||||
Minneapolis St. Paul, Minnesota Housing & Redevelopment Authority Health Care Revenue | ||||||||
(Children’s Hospitals & Clinics) Series A-II | ||||||||
0.75% 8/15/37 (AGM) (SPA - US Bank N.A.) | 225,000 | 225,000 | ||||||
Mississippi Business Finance Commission (Chevron USA) | ||||||||
Series G | ||||||||
0.76% 11/1/35 | 1,250,000 | 1,250,000 | ||||||
Montgomery County, Pennsylvania Industrial Development Authority (Acts Retirement Life Communities) | ||||||||
0.80% 11/15/29 (AGC) (SPA - TD Bank N.A.) | 3,100,000 | 3,100,000 | ||||||
New York City, New York Municipal Water Finance Authority Water & Sewer System Revenue (Second Generation Resolution) Series BB-4 | ||||||||
0.75% 6/15/50 (SPA - Wells Fargo Bank N.A.) | 250,000 | 250,000 | ||||||
Philadelphia, Pennsylvania Hospitals & Higher Education Facilities Authority Revenue (Children’s Hospital of Philadelphia) Series A | ||||||||
0.79% 2/15/21 (SPA - Wells Fargo Bank N.A.) | 1,900,000 | 1,900,000 | ||||||
|
| |||||||
Total Short-Term Investments (cost $11,025,000) | 11,025,000 | |||||||
|
| |||||||
Total Value of Securities – 100.37% (cost $1,148,845,003) | $ | 1,225,395,740 | ||||||
|
| |||||||
| # | Security exempt from registration under Rule 144A of the Securities Act of 1933, as amended. At Aug. 31, 2017, the aggregate value of Rule 144A securities was $200,803,980, which represents 16.45% of the Fund’s net assets. See Note 8 in “Notes to financial statements.” |
| ¤ | Tax-exempt obligations that contain a floating or variable interest rate adjustment formula and an unconditional right of demand to receive payment of the unpaid principal balance plus accrued interest upon a short notice period (generally up to 30 days) prior to specified dates either from the |
76
Table of Contents
issuer or by drawing on a bank letter of credit, a guarantee, or insurance issued with respect to such instrument. Each rate shown is as of Aug. 31, 2017. |
| § | Pre-refunded bonds. Municipal bonds that are generally backed or secured by US Treasury bonds. For pre-refunded bonds, the stated maturity is followed by the year in which the bond is pre-refunded. See Note 8 in “Notes to financial statements.” |
| ° | Principal amount shown is stated in US dollars unless noted that the security is denominated in another currency. |
| ‡ | Non-income producing security. Security is currently in default. |
| ● | Variable rate investment. Interest rates reset periodically. Interest rate shown reflects the rate in effect at Aug. 31, 2017. For securities based on a published reference rate and spread, the reference rate and spread are indicated in their description above. Certain variable rate securities are not based on a published reference rate and spread but are determined by the issuer or agent and are based on current market conditions. These securities do not indicate a reference rate and spread in their description above. |
| ^ | Zero coupon security. The rate shown is the yield at the time of purchase. |
Summary of abbreviations:
AGC – Insured by Assured Guaranty Corporation
AGM – Insured by Assured Guaranty Municipal Corporation
AMBAC – Insured by the AMBAC Assurance Corporation
AMT – Subject to Alternative Minimum Tax
N.A. – National Association
SGI – Insured by Syncora Guarantee Inc.
SPA – Stand-by Purchase Agreement
US0003M – Intercontinental Exchange London Interbank Offered Rate US Dollar 3 Month
See accompanying notes, which are an integral part of the financial statements.
77
Table of Contents
Statements of assets and liabilities
August 31, 2017
| Delaware Tax-Free USA Fund | Delaware Tax-Free USA Intermediate Fund | Delaware National High-Yield Municipal Bond Fund | |||||||||||||
Assets: | |||||||||||||||
Investments, at value1 | $ | 508,105,967 | $ | 569,670,546 | $ | 1,214,370,740 | |||||||||
Short-term investments, at value2 | 750,000 | — | 11,025,000 | ||||||||||||
Cash | 14,417 | 85,623 | 9,204 | ||||||||||||
Interest receivable | 5,960,570 | 6,974,421 | 15,381,740 | ||||||||||||
Receivable for fund shares sold | 339,352 | 542,510 | 3,017,439 | ||||||||||||
Receivable for securities sold | — | 4,680,535 | — | ||||||||||||
|
|
|
|
|
| ||||||||||
Total assets | 515,170,306 | 581,953,635 | 1,243,804,123 | ||||||||||||
|
|
|
|
|
| ||||||||||
Liabilities: | |||||||||||||||
Payable for securities purchased | 8,404,834 | 6,537,910 | 20,236,481 | ||||||||||||
Distribution payable | 468,864 | 382,148 | 1,225,086 | ||||||||||||
Payable for fund shares redeemed | 307,824 | 585,344 | 452,394 | ||||||||||||
Investment management fees payable to affiliates | 181,039 | 237,026 | 482,273 | ||||||||||||
Distribution fees payable to affiliates | 109,922 | 55,391 | 123,797 | ||||||||||||
Other accrued expenses | 95,766 | 135,990 | 343,606 | ||||||||||||
Dividend disbursing and transfer agent fees and expense payable to affiliates | 8,500 | 9,617 | 20,306 | ||||||||||||
Audit and tax fees payable | 4,584 | 4,584 | 4,584 | ||||||||||||
Trustees’ fees and expenses payable | 2,879 | 3,241 | 6,828 | ||||||||||||
Accounting and administration expenses payable to affiliates | 1,978 | 2,238 | 4,726 | ||||||||||||
Legal fees payable to affiliates | 976 | 1,096 | 973 | ||||||||||||
Reports and statements to shareholders expenses payable to affiliates | 404 | 458 | 2,314 | ||||||||||||
|
|
|
|
|
| ||||||||||
Total liabilities | 9,587,570 | 7,955,043 | 22,903,368 | ||||||||||||
|
|
|
|
|
| ||||||||||
Total Net Assets | $ | 505,582,736 | $ | 573,998,592 | $ | 1,220,900,755 | |||||||||
|
|
|
|
|
| ||||||||||
Net Assets Consist of: | |||||||||||||||
Paid-in capital | $ | 467,781,852 | $ | 543,629,505 | $ | 1,166,998,454 | |||||||||
Distributions is excess of net investment income | (14,723 | ) | (33,111 | ) | (4,102 | ) | |||||||||
Accumulated net realized loss on investments | (1,662,200 | ) | (3,296,509 | ) | (22,644,334 | ) | |||||||||
Net unrealized appreciation of investments | 39,477,807 | 33,698,707 | 76,550,737 | ||||||||||||
|
|
|
|
|
| ||||||||||
Total Net Assets | $ | 505,582,736 | $ | 573,998,592 | $ | 1,220,900,755 | |||||||||
|
|
|
|
|
| ||||||||||
78
Table of Contents
| Delaware Tax-Free USA Fund | Delaware Tax-Free USA Intermediate Fund | Delaware National High-Yield Municipal Bond Fund | |||||||||||||
Net Asset Value | |||||||||||||||
Class A: | |||||||||||||||
Net assets | $ | 415,314,201 | $ | 164,153,776 | $ | 190,210,969 | |||||||||
Shares of beneficial interest outstanding, unlimited authorization, no par | 35,495,481 | 13,615,755 | 17,216,077 | ||||||||||||
Net asset value per share | $ | 11.70 | $ | 12.06 | $ | 11.05 | |||||||||
Sales charge | 4.50 | % | 2.75 | % | 4.50 | % | |||||||||
Offering price per share, equal to net asset value per share / (1 – sales charge) | $ | 12.25 | $ | 12.40 | $ | 11.57 | |||||||||
Class C: | |||||||||||||||
Net assets | $ | 27,397,267 | $ | 40,402,231 | $ | 97,973,628 | |||||||||
Shares of beneficial interest outstanding, unlimited authorization, no par | 2,341,149 | 3,352,890 | 8,831,697 | ||||||||||||
Net asset value per share | $ | 11.70 | $ | 12.05 | $ | 11.09 | |||||||||
Institutional Class: | |||||||||||||||
Net assets | $ | 62,871,268 | $ | 369,442,585 | $ | 932,716,158 | |||||||||
Shares of beneficial interest outstanding, unlimited authorization, no par | 5,333,535 | 30,349,979 | 83,645,993 | ||||||||||||
Net asset value per share | $ | 11.79 | $ | 12.17 | $ | 11.15 | |||||||||
1 Investments, at cost | $ | 468,628,160 | $ | 535,971,839 | $ | 1,137,820,003 | |||||||||
2 Short-term investments, at cost | 750,000 | — | 11,025,000 | ||||||||||||
See accompanying notes, which are an integral part of the financial statements.
79
Table of Contents
Year ended August 31, 2017
| Delaware Tax-Free USA Fund | Delaware Tax-Free USA Intermediate Fund | Delaware National High-Yield Municipal Bond Fund | ||||||||||
Investment Income: | ||||||||||||
Interest | $ | 23,341,577 | $ | 22,430,140 | $ | 57,211,429 | ||||||
|
|
|
|
|
| |||||||
Expenses: | ||||||||||||
Management fees | 2,834,376 | 3,028,686 | 6,034,645 | |||||||||
Distribution expenses — Class A | 1,075,438 | 421,136 | 515,974 | |||||||||
Distribution expenses — Class C | 292,451 | 445,295 | 1,022,416 | |||||||||
Dividend disbursing and transfer agent fees and expenses | 391,683 | 593,325 | 1,091,201 | |||||||||
Accounting and administration expenses | 154,180 | 182,207 | 343,742 | |||||||||
Registration fees | 68,703 | 74,755 | 146,717 | |||||||||
Legal fees | 50,048 | 64,202 | 117,958 | |||||||||
Audit and tax fees | 43,595 | 43,596 | 43,610 | |||||||||
Reports and statements to shareholders expenses | 43,340 | 55,713 | 87,937 | |||||||||
Trustees’ fees and expenses | 25,123 | 29,721 | 56,733 | |||||||||
Custodian fees | 20,774 | 28,865 | 52,212 | |||||||||
Other | 36,817 | 42,962 | 80,571 | |||||||||
|
|
|
|
|
| |||||||
| 5,036,528 | 5,010,463 | 9,593,716 | ||||||||||
Less expenses waived | (770,267 | ) | (469,853 | ) | (1,002,786 | ) | ||||||
Less waived distribution expenses — Class A | — | (168,455 | ) | — | ||||||||
Less expenses paid indirectly | (1,717 | ) | (1,242 | ) | (2,322 | ) | ||||||
|
|
|
|
|
| |||||||
Total operating expenses | 4,264,544 | 4,370,913 | 8,588,608 | |||||||||
|
|
|
|
|
| |||||||
Net Investment Income | 19,077,033 | 18,059,227 | 48,622,821 | |||||||||
|
|
|
|
|
| |||||||
Net Realized and Unrealized Loss: | ||||||||||||
Net realized loss on investments | (780,531 | ) | (2,085,453 | ) | (7,642,108 | ) | ||||||
Net change in unrealized appreciation (depreciation) of investments | (18,435,138 | ) | (19,485,190 | ) | (36,101,039 | ) | ||||||
|
|
|
|
|
| |||||||
Net Realized and Unrealized Loss | (19,215,669 | ) | (21,570,643 | ) | (43,743,147 | ) | ||||||
|
|
|
|
|
| |||||||
Net Increase (Decrease) in Net | ||||||||||||
Assets Resulting from Operations | $ | (138,636 | ) | $ | (3,511,416 | ) | $ | 4,879,674 | ||||
|
|
|
|
|
| |||||||
See accompanying notes, which are an integral part of the financial statements.
80
Table of Contents
This page intentionally left blank.
Table of Contents
Statements of changes in net assets
Delaware Tax-Free USA Fund
| Year ended | ||||||||
| 8/31/17 | 8/31/16 | |||||||
Increase (Decrease) in Net Assets from Operations: | ||||||||
Net investment income | $ | 19,077,033 | $ | 19,802,855 | ||||
Net realized gain (loss) | (780,531 | ) | 7,412,248 | |||||
Net change in unrealized appreciation (depreciation) | (18,435,138 | ) | 11,011,063 | |||||
|
|
|
| |||||
Net increase (decrease) in net assets resulting from operations | (138,636 | ) | 38,226,166 | |||||
|
|
|
| |||||
Dividends and Distributions to Shareholders from: | ||||||||
Net investment income: | ||||||||
Class A | (16,243,857 | ) | (17,504,374 | ) | ||||
Class C | (864,022 | ) | (858,163 | ) | ||||
Institutional Class | (1,969,154 | ) | (1,431,583 | ) | ||||
Net realized gain: | ||||||||
Class A | (4,669,336 | ) | — | |||||
Class C | (314,280 | ) | — | |||||
Institutional Class | (455,368 | ) | — | |||||
|
|
|
| |||||
| (24,516,017 | ) | (19,794,120 | ) | |||||
|
|
|
| |||||
Capital Share Transactions: | ||||||||
Proceeds from shares sold: | ||||||||
Class A | 20,491,013 | 18,556,280 | ||||||
Class C | 3,820,845 | 4,181,538 | ||||||
Institutional Class | 36,733,206 | 20,247,575 | ||||||
Net asset value of shares issued upon reinvestment of dividends and distributions: | ||||||||
Class A | 18,129,628 | 15,102,308 | ||||||
Class C | 1,017,859 | 721,186 | ||||||
Institutional Class | 1,881,457 | 1,086,711 | ||||||
|
|
|
| |||||
| 82,074,008 | 59,895,598 | |||||||
|
|
|
| |||||
82
Table of Contents
| Year ended | ||||||||
| 8/31/17 | 8/31/16 | |||||||
Capital Share Transactions (continued): | ||||||||
Cost of shares redeemed: | ||||||||
Class A | $ | (95,346,418 | ) | $ | (60,655,312 | ) | ||
Class C | (7,582,637 | ) | (5,219,246 | ) | ||||
Institutional Class | (19,556,143 | ) | (10,182,828 | ) | ||||
|
|
|
| |||||
| (122,485,198 | ) | (76,057,386 | ) | |||||
|
|
|
| |||||
Decrease in net assets derived from capital share transactions | (40,411,190 | ) | (16,161,788 | ) | ||||
|
|
|
| |||||
Net Increase (Decrease) in Net Assets | (65,065,843 | ) | 2,270,258 | |||||
Net Assets: | ||||||||
Beginning of year | 570,648,579 | 568,378,321 | ||||||
|
|
|
| |||||
End of year | $ | 505,582,736 | $ | 570,648,579 | ||||
|
|
|
| |||||
Undistributed (distributions in excess of) net investment income | $ | (14,723 | ) | $ | 66,896 | |||
|
|
|
| |||||
See accompanying notes, which are an integral part of the financial statements.
83
Table of Contents
Statements of changes in net assets
Delaware Tax-Free USA Intermediate Fund
| Year ended | ||||||||
| 8/31/17 | 8/31/16 | |||||||
Increase (Decrease) in Net Assets from Operations: | ||||||||
Net investment income | $ | 18,059,227 | $ | 20,652,060 | ||||
Net realized gain (loss) | (2,085,453 | ) | 6,205,347 | |||||
Net change in unrealized appreciation (depreciation) | (19,485,190 | ) | 13,384,099 | |||||
|
|
|
| |||||
Net increase (decrease) in net assets resulting from operations | (3,511,416 | ) | 40,241,506 | |||||
|
|
|
| |||||
Dividends and Distributions to Shareholders from: | ||||||||
Net investment income: | ||||||||
Class A | (4,915,126 | ) | (5,362,533 | ) | ||||
Class C | (921,125 | ) | (980,428 | ) | ||||
Institutional Class | (12,182,549 | ) | (14,367,442 | ) | ||||
Net realized gain: | ||||||||
Class A | (58,508 | ) | — | |||||
Class C | (15,746 | ) | — | |||||
Institutional Class | (152,523 | ) | — | |||||
|
|
|
| |||||
| (18,245,577 | ) | (20,710,403 | ) | |||||
|
|
|
| |||||
Capital Share Transactions: | ||||||||
Proceeds from shares sold: | ||||||||
Class A | 35,944,973 | 42,587,074 | ||||||
Class C | 3,230,487 | 5,664,853 | ||||||
Institutional Class | 135,948,379 | 146,784,446 | ||||||
Net asset value of shares issued upon reinvestment of dividends and distributions: | ||||||||
Class A | 4,591,718 | 5,001,787 | ||||||
Class C | 846,092 | 893,576 | ||||||
Institutional Class | 8,398,061 | 9,003,563 | ||||||
|
|
|
| |||||
| 188,959,710 | 209,935,299 | |||||||
|
|
|
| |||||
84
Table of Contents
| Year ended | ||||||||
| 8/31/17 | 8/31/16 | |||||||
Capital Share Transactions (continued): | ||||||||
Cost of shares redeemed: | ||||||||
Class A | $ | (59,113,240 | ) | $ | (49,232,611 | ) | ||
Class C | (11,801,182 | ) | (6,715,315 | ) | ||||
Institutional Class | (239,010,931 | ) | (163,901,252 | ) | ||||
|
|
|
| |||||
| (309,925,353 | ) | (219,849,178 | ) | |||||
|
|
|
| |||||
Decrease in net assets derived from capital share transactions | (120,965,643 | ) | (9,913,879 | ) | ||||
|
|
|
| |||||
Net Increase (Decrease) in Net Assets | (142,722,636 | ) | 9,617,224 | |||||
Net Assets: | ||||||||
Beginning of year | 716,721,228 | 707,104,004 | ||||||
|
|
|
| |||||
End of year | $ | 573,998,592 | $ | 716,721,228 | ||||
|
|
|
| |||||
Distributions in excess of net investment income | $ | (33,111 | ) | $ | (24,178 | ) | ||
|
|
|
| |||||
See accompanying notes, which are an integral part of the financial statements. | ||||||||
85
Table of Contents
Statements of changes in net assets
Delaware National High-Yield Municipal Bond Fund
| Year ended | ||||||||
| 8/31/17 | 8/31/16 | |||||||
Increase (Decrease) in Net Assets from Operations: | ||||||||
Net investment income | $ | 48,622,821 | $ | 42,639,732 | ||||
Net realized loss | (7,642,108 | ) | (132,180 | ) | ||||
Net change in unrealized appreciation (depreciation) | (36,101,039 | ) | 67,701,215 | |||||
|
|
|
| |||||
Net increase in net assets resulting from operations | 4,879,674 | 110,208,767 | ||||||
|
|
|
| |||||
Dividends and Distributions to Shareholders from: | ||||||||
Net investment income: | ||||||||
Class A | (8,244,874 | ) | (8,838,898 | ) | ||||
Class C | (3,328,634 | ) | (3,074,474 | ) | ||||
Institutional Class | (36,908,033 | ) | (30,594,298 | ) | ||||
|
|
|
| |||||
| (48,481,541 | ) | (42,507,670 | ) | |||||
|
|
|
| |||||
Capital Share Transactions: | ||||||||
Proceeds from shares sold: | ||||||||
Class A | 47,160,123 | 71,930,474 | ||||||
Class C | 14,018,914 | 30,273,869 | ||||||
Institutional Class | 369,553,187 | 324,718,812 | ||||||
Net asset value of shares issued upon reinvestment of dividends and distributions: | ||||||||
Class A | 7,108,543 | 7,021,837 | ||||||
Class C | 2,904,991 | 2,654,379 | ||||||
Institutional Class | 30,936,256 | 26,610,128 | ||||||
|
|
|
| |||||
| 471,682,014 | 463,209,499 | |||||||
|
|
|
| |||||
86
Table of Contents
| Year ended | ||||||||
| 8/31/17 | 8/31/16 | |||||||
Capital Share Transactions (continued): | ||||||||
Cost of shares redeemed: | ||||||||
Class A | $ | (105,174,981 | ) | $ | (69,509,287 | ) | ||
Class C | (28,853,971 | ) | (16,512,385 | ) | ||||
Institutional Class | (343,301,589 | ) | (142,479,009 | ) | ||||
|
|
|
| |||||
| (477,330,541 | ) | (228,500,681 | ) | |||||
|
|
|
| |||||
Increase (decrease) in net assets derived from capital share transactions | (5,648,527 | ) | 234,708,818 | |||||
|
|
|
| |||||
Net Increase (Decrease) in Net Assets | (49,250,394 | ) | 302,409,915 | |||||
Net Assets: | ||||||||
Beginning of year | 1,270,151,149 | 967,741,234 | ||||||
|
|
|
| |||||
End of year | $ | 1,220,900,755 | $ | 1,270,151,149 | ||||
|
|
|
| |||||
Distributions in excess of net investment income | $ | (4,102 | ) | $ | (4,102 | ) | ||
|
|
|
| |||||
See accompanying notes, which are an integral part of the financial statements.
87
Table of Contents
Delaware Tax-Free USA Fund Class A
Selected data for each share of the Fund outstanding throughout each period were as follows:
Net asset value, beginning of period |
Income (loss) from investment operations: |
Net investment income1 |
Net realized and unrealized gain (loss) |
Total from investment operations |
Less dividends and distributions from: |
Net investment income |
Net realized gain |
Total dividends and distributions |
Net asset value, end of period |
Total return2 |
Ratios and supplemental data: |
Net assets, end of period (000 omitted) |
Ratio of expenses to average net assets |
Ratio of expenses to average net assets prior to fees waived3 |
Ratio of net investment income to average net assets |
Ratio of net investment income to average net assets prior to fees waived3 |
Portfolio turnover |
|
|
| 1 | The average shares outstanding have been applied for per share information. |
| 2 | Total investment return is based on the change in net asset value of a share during the period and assumes reinvestment of dividends and distributions at net asset value and does not reflect the impact of a sales charge. Total investment return during all of the periods shown reflects waivers by the manager and/or distributor. Performance would have been lower had the waivers not been in effect. |
| 3 | Expenses paid indirectly were not material, as reflected in the “Statements of operations”, and had no impact on the ratios disclosed. |
See accompanying notes, which are an integral part of the financial statements.
88
Table of Contents
| Year ended | ||||||||||||||||||||
| 8/31/17 | 8/31/16 | 8/31/15 | 8/31/14 | 8/31/13 | ||||||||||||||||
| $ | 12.22 | $ | 11.83 | $ | 11.90 | $ | 11.14 | $ | 12.26 | |||||||||||
| 0.43 | 0.42 | 0.43 | 0.45 | 0.46 | ||||||||||||||||
| (0.40 | ) | 0.39 | (0.07 | ) | 0.76 | (1.04 | ) | |||||||||||||
|
|
|
|
|
|
|
|
|
| |||||||||||
| 0.03 | 0.81 | 0.36 | 1.21 | (0.58 | ) | |||||||||||||||
|
|
|
|
|
|
|
|
|
| |||||||||||
| (0.43 | ) | (0.42 | ) | (0.43 | ) | (0.45 | ) | (0.46 | ) | |||||||||||
| (0.12 | ) | — | — | — | (0.08 | ) | ||||||||||||||
|
|
|
|
|
|
|
|
|
| |||||||||||
| (0.55 | ) | (0.42 | ) | (0.43 | ) | (0.45 | ) | (0.54 | ) | |||||||||||
|
|
|
|
|
|
|
|
|
| |||||||||||
| $ | 11.70 | $ | 12.22 | $ | 11.83 | $ | 11.90 | $ | 11.14 | |||||||||||
|
|
|
|
|
|
|
|
|
| |||||||||||
| 0.41% | 7.00% | 3.09% | 11.02% | (5.02% | ) | |||||||||||||||
| $ | 415,314 | $ | 493,408 | $ | 504,204 | $ | 500,590 | $ | 519,986 | |||||||||||
| 0.81% | 0.81% | 0.81% | 0.80% | 0.80% | ||||||||||||||||
| 0.96% | 0.95% | 0.96% | 0.97% | 0.99% | ||||||||||||||||
| 3.71% | 3.52% | 3.63% | 3.88% | 3.76% | ||||||||||||||||
| 3.56% | 3.38% | 3.48% | 3.71% | 3.57% | ||||||||||||||||
| 33% | 33% | 16% | 34% | 40% | ||||||||||||||||
| ||||||||||||||||||||
| ||||||||||||||||||||
89
Table of Contents
Delaware Tax-Free USA Fund Class C
Selected data for each share of the Fund outstanding throughout each period were as follows:
Net asset value, beginning of period |
Income (loss) from investment operations: |
Net investment income1 |
Net realized and unrealized gain (loss) |
Total from investment operations |
Less dividends and distributions from: |
Net investment income |
Net realized gain |
Total dividends and distributions |
Net asset value, end of period |
Total return2 |
Ratios and supplemental data: |
Net assets, end of period (000 omitted) |
Ratio of expenses to average net assets |
Ratio of expenses to average net assets prior to fees waived3 |
Ratio of net investment income to average net assets |
Ratio of net investment income to average net assets prior to fees waived3 |
Portfolio turnover |
|
|
| 1 | The average shares outstanding have been applied for per share information. |
| 2 | Total investment return is based on the change in net asset value of a share during the period and assumes reinvestment of dividends and distributions at net asset value and does not reflect the impact of a sales charge. Total investment return during all of the periods shown reflects a waiver by the manager. Performance would have been lower had the waiver not been in effect. |
| 3 | Expenses paid indirectly were not material, as reflected in the “Statements of operations”, and had no impact on the ratios disclosed. |
See accompanying notes, which are an integral part of the financial statements.
90
Table of Contents
| Year ended | ||||||||||||||||||||
| 8/31/17 | 8/31/16 | 8/31/15 | 8/31/14 | 8/31/13 | ||||||||||||||||
| $ | 12.22 | $ | 11.83 | $ | 11.91 | $ | 11.14 | $ | 12.27 | |||||||||||
| ||||||||||||||||||||
| 0.34 | 0.33 | 0.34 | 0.36 | 0.36 | ||||||||||||||||
| (0.40 | ) | 0.39 | (0.08 | ) | 0.77 | (1.04 | ) | |||||||||||||
|
|
|
|
|
|
|
|
|
| |||||||||||
| (0.06 | ) | 0.72 | 0.26 | 1.13 | (0.68 | ) | ||||||||||||||
|
|
|
|
|
|
|
|
|
| |||||||||||
| ||||||||||||||||||||
| (0.34 | ) | (0.33 | ) | (0.34 | ) | (0.36 | ) | (0.37 | ) | |||||||||||
| (0.12 | ) | — | — | — | (0.08 | ) | ||||||||||||||
|
|
|
|
|
|
|
|
|
| |||||||||||
| (0.46 | ) | (0.33 | ) | (0.34 | ) | (0.36 | ) | (0.45 | ) | |||||||||||
|
|
|
|
|
|
|
|
|
| |||||||||||
| $ | 11.70 | $ | 12.22 | $ | 11.83 | $ | 11.91 | $ | 11.14 | |||||||||||
|
|
|
|
|
|
|
|
|
| |||||||||||
| (0.35% | ) | 6.19% | 2.23% | 10.28% | (5.82% | ) | ||||||||||||||
| ||||||||||||||||||||
| $ | 27,397 | $ | 31,545 | $ | 30,851 | $ | 29,524 | $ | 33,509 | |||||||||||
| 1.56% | 1.56% | 1.57% | 1.56% | 1.56% | ||||||||||||||||
| 1.71% | 1.70% | 1.72% | 1.72% | 1.70% | ||||||||||||||||
| 2.96% | 2.77% | 2.88% | 3.12% | 3.00% | ||||||||||||||||
| 2.81% | 2.63% | 2.73% | 2.96% | 2.86% | ||||||||||||||||
| 33% | 33% | 16% | 34% | 40% | ||||||||||||||||
| ||||||||||||||||||||
| ||||||||||||||||||||
91
Table of Contents
Financial highlights
Delaware Tax-Free USA Fund Institutional Class
Selected data for each share of the Fund outstanding throughout each period were as follows:
Net asset value, beginning of period |
Income (loss) from investment operations: |
Net investment income1 |
Net realized and unrealized gain (loss) |
Total from investment operations |
Less dividends and distributions from: |
Net investment income |
Net realized gain |
Total dividends and distributions |
Net asset value, end of period |
Total return2 |
Ratios and supplemental data: |
Net assets, end of period (000 omitted) |
Ratio of expenses to average net assets |
Ratio of expenses to average net assets prior to fees waived3 |
Ratio of net investment income to average net assets |
Ratio of net investment income to average net assets prior to fees waived3 |
Portfolio turnover |
|
|
| 1 | The average shares outstanding have been applied for per share information. |
| 2 | Total investment return is based on the change in net asset value of a share during the period and assumes reinvestment of dividends and distributions at net asset value. Total investment return during all of the periods shown reflects a waiver by the manager. Performance would have been lower had the waiver not been in effect. |
| 3 | Expenses paid indirectly were not material, as reflected in the “Statements of operations”, and had no impact on the ratios disclosed. |
See accompanying notes, which are an integral part of the financial statements.
92
Table of Contents
| Year ended | ||||||||||||||||||||
| 8/31/17 | 8/31/16 | 8/31/15 | 8/31/14 | 8/31/13 | ||||||||||||||||
| $ | 12.31 | $ | 11.91 | $ | 11.99 | $ | 11.22 | $ | 12.36 | |||||||||||
| 0.46 | 0.46 | 0.47 | 0.48 | 0.49 | ||||||||||||||||
| (0.40 | ) | 0.40 | (0.08 | ) | 0.77 | (1.06 | ) | |||||||||||||
|
|
|
|
|
|
|
|
|
| |||||||||||
| 0.06 | 0.86 | 0.39 | 1.25 | (0.57 | ) | |||||||||||||||
|
|
|
|
|
|
|
|
|
| |||||||||||
| (0.46 | ) | (0.46 | ) | (0.47 | ) | (0.48 | ) | (0.49 | ) | |||||||||||
| (0.12 | ) | — | — | — | (0.08 | ) | ||||||||||||||
|
|
|
|
|
|
|
|
|
| |||||||||||
| (0.58 | ) | (0.46 | ) | (0.47 | ) | (0.48 | ) | (0.57 | ) | |||||||||||
|
|
|
|
|
|
|
|
|
| |||||||||||
| $ | 11.79 | $ | 12.31 | $ | 11.91 | $ | 11.99 | $ | 11.22 | |||||||||||
|
|
|
|
|
|
|
|
|
| |||||||||||
| 0.68% | 7.32% | 3.26% | 11.33% | (4.89% | ) | |||||||||||||||
| $ | 62,872 | $ | 45,696 | $ | 33,323 | $ | 24,588 | $ | 17,008 | |||||||||||
| 0.56% | 0.56% | 0.57% | 0.56% | 0.56% | ||||||||||||||||
| 0.71% | 0.70% | 0.72% | 0.72% | 0.70% | ||||||||||||||||
| 3.96% | 3.77% | 3.88% | 4.12% | 4.00% | ||||||||||||||||
| 3.81% | 3.63% | 3.73% | 3.96% | 3.86% | ||||||||||||||||
| 33% | 33% | 16% | 34% | 40% | ||||||||||||||||
| ||||||||||||||||||||
| ||||||||||||||||||||
93
Table of Contents
Financial highlights
Delaware Tax-Free USA Intermediate Fund Class A
Selected data for each share of the Fund outstanding throughout each period were as follows:
Net asset value, beginning of period |
Income (loss) from investment operations: |
Net investment income1 |
Net realized and unrealized gain (loss) |
Total from investment operations |
Less dividends and distributions from: |
Net investment income |
Net realized gain |
Total dividends and distributions |
Net asset value, end of period |
Total return3 |
Ratios and supplemental data: |
Net assets, end of period (000 omitted) |
Ratio of expenses to average net assets |
Ratio of expenses to average net assets prior to fees waived4 |
Ratio of net investment income to average net assets |
Ratio of net investment income to average net assets prior to fees waived4 |
Portfolio turnover |
|
|
| 1 | The average shares outstanding have been applied for per share information. |
| 2 | For the year ended Aug. 31, 2017, net realized gain distributions of $58,508 were made by the Fund’s Class A, which calculated to a de minimis amount of $(0.004) per share. |
| 3 | Total investment return is based on the change in net asset value of a share during the period and assumes reinvestment of dividends and distributions at net asset value and does not reflect the impact of a sales charge. Total investment return during all of the periods shown reflects waivers by the manager and distributor. Performance would have been lower had the waivers not been in effect. |
| 4 | Expenses paid indirectly were not material, as reflected in the “Statements of operations”, and had no impact on the ratios disclosed. |
See accompanying notes, which are an integral part of the financial statements.
94
Table of Contents
| Year ended | ||||||||||||||||||||
| 8/31/17 | 8/31/16 | 8/31/15 | 8/31/14 | 8/31/13 | ||||||||||||||||
| $ | 12.38 | $ | 12.04 | $ | 12.21 | $ | 11.69 | $ | 12.41 | |||||||||||
| 0.35 | 0.35 | 0.35 | 0.34 | 0.34 | ||||||||||||||||
| (0.32 | ) | 0.34 | (0.17 | ) | 0.52 | (0.72 | ) | |||||||||||||
|
|
|
|
|
|
|
|
|
| |||||||||||
| 0.03 | 0.69 | 0.18 | 0.86 | (0.38 | ) | |||||||||||||||
|
|
|
|
|
|
|
|
|
| |||||||||||
| (0.35 | ) | (0.35 | ) | (0.35 | ) | (0.34 | ) | (0.34 | ) | |||||||||||
| — | 2 | — | — | — | — | |||||||||||||||
|
|
|
|
|
|
|
|
|
| |||||||||||
| (0.35 | ) | (0.35 | ) | (0.35 | ) | (0.34 | ) | (0.34 | ) | |||||||||||
|
|
|
|
|
|
|
|
|
| |||||||||||
| $ | 12.06 | $ | 12.38 | $ | 12.04 | $ | 12.21 | $ | 11.69 | |||||||||||
|
|
|
|
|
|
|
|
|
| |||||||||||
| 0.35% | 5.79% | 1.46% | 7.47% | (3.13% | ) | |||||||||||||||
| $ | 164,154 | $ | 188,034 | $ | 184,514 | $ | 249,848 | $ | 391,923 | |||||||||||
| 0.75% | 0.75% | 0.76% | 0.75% | 0.75% | ||||||||||||||||
| 0.93% | 0.92% | 0.93% | 0.93% | 0.97% | ||||||||||||||||
| 2.92% | 2.84% | 2.85% | 2.86% | 2.79% | ||||||||||||||||
| 2.74% | 2.67% | 2.68% | 2.68% | 2.57% | ||||||||||||||||
| 26% | 35% | 19% | 34% | 23% | ||||||||||||||||
| ||||||||||||||||||||
| ||||||||||||||||||||
95
Table of Contents
Financial highlights
Delaware Tax-Free USA Intermediate Fund Class C
Selected data for each share of the Fund outstanding throughout each period were as follows:
Net asset value, beginning of period |
Income (loss) from investment operations: |
Net investment income1 |
Net realized and unrealized gain (loss) |
Total from investment operations |
Less dividends and distributions from: |
Net investment income |
Net realized gain |
Total dividends and distributions |
Net asset value, end of period |
Total return3 |
Ratios and supplemental data: |
Net assets, end of period (000 omitted) |
Ratio of expenses to average net assets |
Ratio of expenses to average net assets prior to fees waived4 |
Ratio of net investment income to average net assets |
Ratio of net investment income to average net assets prior to fees waived4 |
Portfolio turnover |
|
|
| 1 | The average shares outstanding have been applied for per share information. |
| 2 | For the year ended Aug. 31, 2017, net realized gain distributions of $15,746 were made by the Fund’s Class C, which calculated to a de minimis amount of $(0.004) per share. |
| 3 | Total investment return is based on the change in net asset value of a share during the period and assumes reinvestment of dividends and distributions at net asset value and does not reflect the impact of a sales charge. Total investment return during all of the periods shown reflects a waiver by the manager. Performance would have been lower had the waiver not been in effect. |
| 4 | Expenses paid indirectly were not material, as reflected in the “Statements of operations”, and had no impact on the ratios disclosed. |
See accompanying notes, which are an integral part of the financial statements.
96
Table of Contents
| Year ended | ||||||||||||||||||||
| 8/31/17 | 8/31/16 | 8/31/15 | 8/31/14 | 8/31/13 | ||||||||||||||||
| $ | 12.37 | $ | 12.03 | $ | 12.20 | $ | 11.69 | $ | 12.40 | |||||||||||
| ||||||||||||||||||||
| 0.25 | 0.24 | 0.24 | 0.24 | 0.24 | ||||||||||||||||
| (0.32 | ) | 0.35 | (0.17 | ) | 0.51 | (0.71 | ) | |||||||||||||
|
|
|
|
|
|
|
|
|
| |||||||||||
| (0.07 | ) | 0.59 | 0.07 | 0.75 | (0.47 | ) | ||||||||||||||
|
|
|
|
|
|
|
|
|
| |||||||||||
| ||||||||||||||||||||
| (0.25 | ) | (0.25 | ) | (0.24 | ) | (0.24 | ) | (0.24 | ) | |||||||||||
| — | 2 | — | — | — | — | |||||||||||||||
|
|
|
|
|
|
|
|
|
| |||||||||||
| (0.25 | ) | (0.25 | ) | (0.24 | ) | (0.24 | ) | (0.24 | ) | |||||||||||
|
|
|
|
|
|
|
|
|
| |||||||||||
| $ | 12.05 | $ | 12.37 | $ | 12.03 | $ | 12.20 | $ | 11.69 | |||||||||||
|
|
|
|
|
|
|
|
|
| |||||||||||
| (0.50% | ) | 4.90% | 0.60% | 6.48% | (3.87% | ) | ||||||||||||||
| ||||||||||||||||||||
| $ | 40,402 | $ | 49,515 | $ | 48,328 | $ | 54,231 | $ | 64,904 | |||||||||||
| 1.60% | 1.60% | 1.61% | 1.60% | 1.60% | ||||||||||||||||
| 1.68% | 1.67% | 1.68% | 1.68% | 1.67% | ||||||||||||||||
| 2.07% | 1.99% | 2.00% | 2.01% | 1.94% | ||||||||||||||||
| 1.99% | 1.92% | 1.93% | 1.93% | 1.87% | ||||||||||||||||
| 26% | 35% | 19% | 34% | 23% | ||||||||||||||||
| ||||||||||||||||||||
| ||||||||||||||||||||
97
Table of Contents
Financial highlights
Delaware Tax-Free USA Intermediate Fund Institutional Class
Selected data for each share of the Fund outstanding throughout each period were as follows:
Net asset value, beginning of period |
Income (loss) from investment operations: |
Net investment income1 |
Net realized and unrealized gain (loss) |
Total from investment operations |
Less dividends and distributions from: |
Net investment income |
Net realized gain |
Total dividends and distributions |
Net asset value, end of period |
Total return3 |
Ratios and supplemental data: |
Net assets, end of period (000 omitted) |
Ratio of expenses to average net assets |
Ratio of expenses to average net assets prior to fees waived4 |
Ratio of net investment income to average net assets |
Ratio of net investment income to average net assets prior to fees waived4 |
Portfolio turnover |
|
|
| 1 | The average shares outstanding have been applied for per share information. |
| 2 | For the year ended Aug. 31, 2017, net realized gain distributions of $152,523 were made by the Fund’s Institutional Class, which calculated to a de minimis amount of $(0.004) per share. |
| 3 | Total investment return is based on the change in net asset value of a share during the period and assumes reinvestment of dividends and distributions at net asset value. Total investment return during all of the periods shown reflects a waiver by the manager. Performance would have been lower had the waiver not been in effect. |
| 4 | Expenses paid indirectly were not material, as reflected in the “Statements of operations”, and had no impact on the ratios disclosed. |
See accompanying notes, which are an integral part of the financial statements.
98
Table of Contents
| Year ended | ||||||||||||||||||||
| 8/31/17 | 8/31/16 | 8/31/15 | 8/31/14 | 8/31/13 | ||||||||||||||||
| $ | 12.50 | $ | 12.16 | $ | 12.33 | $ | 11.81 | $ | 12.53 | |||||||||||
| ||||||||||||||||||||
| 0.37 | 0.37 | 0.37 | 0.36 | 0.37 | ||||||||||||||||
| (0.33 | ) | 0.34 | (0.17 | ) | 0.52 | (0.72 | ) | |||||||||||||
|
|
|
|
|
|
|
|
|
| |||||||||||
| 0.04 | 0.71 | 0.20 | 0.88 | (0.35 | ) | |||||||||||||||
|
|
|
|
|
|
|
|
|
| |||||||||||
| (0.37 | ) | (0.37 | ) | (0.37 | ) | (0.36 | ) | (0.37 | ) | |||||||||||
| — | 2 | — | — | — | — | |||||||||||||||
|
|
|
|
|
|
|
|
|
| |||||||||||
| (0.37 | ) | (0.37 | ) | (0.37 | ) | (0.36 | ) | (0.37 | ) | |||||||||||
|
|
|
|
|
|
|
|
|
| |||||||||||
| $ | 12.17 | $ | 12.50 | $ | 12.16 | $ | 12.33 | $ | 11.81 | |||||||||||
|
|
|
|
|
|
|
|
|
| |||||||||||
| 0.44% | 5.92% | 1.62% | 7.58% | (2.92% | ) | |||||||||||||||
| $ | 369,443 | $ | 479,172 | $ | 474,262 | $ | 434,455 | $ | 359,213 | |||||||||||
| 0.60% | 0.60% | 0.61% | 0.60% | 0.60% | ||||||||||||||||
| 0.68% | 0.67% | 0.68% | 0.68% | 0.67% | ||||||||||||||||
| 3.07% | 2.99% | 3.00% | 3.01% | 2.94% | ||||||||||||||||
| 2.99% | 2.92% | 2.93% | 2.93% | 2.87% | ||||||||||||||||
| 26% | 35% | 19% | 34% | 23% | ||||||||||||||||
| ||||||||||||||||||||
| ||||||||||||||||||||
99
Table of Contents
Financial highlights
Delaware National High-Yield Municipal Bond Fund Class A
Selected data for each share of the Fund outstanding throughout each period were as follows:
Net asset value, beginning of period |
Income (loss) from investment operations: |
Net investment income1 |
Net realized and unrealized gain (loss) |
Total from investment operations |
Less dividends and distributions from: |
Net investment income |
Total dividends and distributions |
Net asset value, end of period |
Total return2 |
Ratios and supplemental data: |
Net assets, end of period (000 omitted) |
Ratio of expenses to average net assets |
Ratio of expenses to average net assets prior to fees waived3 |
Ratio of net investment income to average net assets |
Ratio of net investment income to average net assets prior to fees waived3 |
Portfolio turnover |
|
|
| 1 | The average shares outstanding have been applied for per share information. |
| 2 | Total investment return is based on the change in net asset value of a share during the period and assumes reinvestment of dividends and distributions at net asset value and does not reflect the impact of a sales charge. Total investment return during all of the periods shown reflect a waiver by the manager. Performance would have been lower had the waiver not been in effect. |
| 3 | Expenses paid indirectly were not material, as reflected in the “Statements of operations”, and had no impact on the ratios disclosed. |
See accompanying notes, which are an integral part of the financial statements.
100
Table of Contents
| Year ended | ||||||||||||||||||||
| 8/31/17 | 8/31/16 | 8/31/15 | 8/31/14 | 8/31/13 | ||||||||||||||||
| $ | 11.42 | $ | 10.75 | $ | 10.65 | $ | 9.64 | $ | 10.75 | |||||||||||
| 0.44 | 0.41 | 0.41 | 0.45 | 0.45 | ||||||||||||||||
| (0.37 | ) | 0.67 | 0.10 | 1.01 | (1.11 | ) | ||||||||||||||
|
|
|
|
|
|
|
|
|
| |||||||||||
| 0.07 | 1.08 | 0.51 | 1.46 | (0.66 | ) | |||||||||||||||
|
|
|
|
|
|
|
|
|
| |||||||||||
| (0.44 | ) | (0.41 | ) | (0.41 | ) | (0.45 | ) | (0.45 | ) | |||||||||||
|
|
|
|
|
|
|
|
|
| |||||||||||
| (0.44 | ) | (0.41 | ) | (0.41 | ) | (0.45 | ) | (0.45 | ) | |||||||||||
|
|
|
|
|
|
|
|
|
| |||||||||||
| $ | 11.05 | $ | 11.42 | $ | 10.75 | $ | 10.65 | $ | 9.64 | |||||||||||
|
|
|
|
|
|
|
|
|
| |||||||||||
| 0.72% | 10.25% | 4.83% | 15.42% | (6.47% | ) | |||||||||||||||
| $ | 190,211 | $ | 250,810 | $ | 227,090 | $ | 204,936 | $ | 200,988 | |||||||||||
| 0.85% | 0.85% | 0.85% | 0.85% | 0.85% | ||||||||||||||||
| 0.94% | 0.94% | 0.97% | 0.99% | 0.99% | ||||||||||||||||
| 4.02% | 3.73% | 3.80% | 4.38% | 4.18% | ||||||||||||||||
| 3.93% | 3.64% | 3.68% | 4.24% | 4.04% | ||||||||||||||||
| 27% | 13% | 10% | 31% | 46% | ||||||||||||||||
| ||||||||||||||||||||
| ||||||||||||||||||||
101
Table of Contents
Financial highlights
Delaware National High-Yield Municipal Bond Fund Class C
Selected data for each share of the Fund outstanding throughout each period were as follows:
Net asset value, beginning of period |
Income (loss) from investment operations: |
Net investment income1 |
Net realized and unrealized gain (loss) |
Total from investment operations |
Less dividends and distributions from: |
Net investment income |
Total dividends and distributions |
Net asset value, end of period |
Total return2 |
Ratios and supplemental data: |
Net assets, end of period (000 omitted) |
Ratio of expenses to average net assets |
Ratio of expenses to average net assets prior to fees waived3 |
Ratio of net investment income to average net assets |
Ratio of net investment income to average net assets prior to fees waived3 |
Portfolio turnover |
|
|
| 1 | The average shares outstanding have been applied for per share information. |
| 2 | Total investment return is based on the change in net asset value of a share during the period and assumes reinvestment of dividends and distributions at net asset value and does not reflect the impact of a sales charge. Total investment return during all of the periods shown reflects a waiver by the manager. Performance would have been lower had the waiver not been in effect. |
| 3 | Expenses paid indirectly were not material, as reflected in the “Statements of operations”, and had no impact on the ratios disclosed. |
See accompanying notes, which are an integral part of the financial statements.
102
Table of Contents
| Year ended | ||||||||||||||||||||
| 8/31/17 | 8/31/16 | 8/31/15 | 8/31/14 | 8/31/13 | ||||||||||||||||
| $ | 11.47 | $ | 10.80 | $ | 10.70 | $ | 9.68 | $ | 10.80 | |||||||||||
| 0.36 | 0.33 | 0.33 | 0.37 | 0.37 | ||||||||||||||||
| (0.38 | ) | 0.67 | 0.10 | 1.02 | (1.12 | ) | ||||||||||||||
|
|
|
|
|
|
|
|
|
| |||||||||||
| (0.02 | ) | 1.00 | 0.43 | 1.39 | (0.75 | ) | ||||||||||||||
|
|
|
|
|
|
|
|
|
| |||||||||||
| (0.36 | ) | (0.33 | ) | (0.33 | ) | (0.37 | ) | (0.37 | ) | |||||||||||
|
|
|
|
|
|
|
|
|
| |||||||||||
| (0.36 | ) | (0.33 | ) | (0.33 | ) | (0.37 | ) | (0.37 | ) | |||||||||||
|
|
|
|
|
|
|
|
|
| |||||||||||
| $ | 11.09 | $ | 11.47 | $ | 10.80 | $ | 10.70 | $ | 9.68 | |||||||||||
|
|
|
|
|
|
|
|
|
| |||||||||||
| (0.11% | ) | 9.41% | 4.04% | 14.63% | (7.21% | ) | ||||||||||||||
| $ | 97,974 | $ | 113,905 | $ | 91,196 | $ | 71,424 | $ | 69,889 | |||||||||||
| 1.60% | 1.60% | 1.60% | 1.60% | 1.60% | ||||||||||||||||
| 1.69% | 1.69% | 1.72% | 1.74% | 1.74% | ||||||||||||||||
| 3.27% | 2.98% | 3.05% | 3.63% | 3.43% | ||||||||||||||||
| 3.18% | 2.89% | 2.93% | 3.49% | 3.29% | ||||||||||||||||
| 27% | 13% | 10% | 31% | 46% | ||||||||||||||||
| ||||||||||||||||||||
| ||||||||||||||||||||
103
Table of Contents
Financial highlights
Delaware National High-Yield Municipal Bond Fund Institutional Class
Selected data for each share of the Fund outstanding throughout each period were as follows:
Net asset value, beginning of period |
Income (loss) from investment operations: |
Net investment income1 |
Net realized and unrealized gain (loss) |
Total from investment operations |
Less dividends and distributions from: |
Net investment income |
Total dividends and distributions |
Net asset value, end of period |
Total return2 |
Ratios and supplemental data: |
Net assets, end of period (000 omitted) |
Ratio of expenses to average net assets |
Ratio of expenses to average net assets prior to fees waived3 |
Ratio of net investment income to average net assets |
Ratio of net investment income to average net assets prior to fees waived3 |
Portfolio turnover |
|
|
| 1 | The average shares outstanding have been applied for per share information. |
| 2 | Total investment return is based on the change in net asset value of a share during the period and assumes reinvestment of dividends and distributions at net asset value. Total investment return during all of the periods shown reflects a waiver by the manager. Performance would have been lower had the waiver not been in effect. |
| 3 | Expenses paid indirectly were not material, as reflected in the “Statements of operations”, and had no impact on the ratios disclosed. |
See accompanying notes, which are an integral part of the financial statements.
104
Table of Contents
| Year ended | ||||||||||||||||||||
| 8/31/17 | 8/31/16 | 8/31/15 | 8/31/14 | 8/31/13 | ||||||||||||||||
| $ | 11.53 | $ | 10.85 | $ | 10.75 | $ | 9.73 | $ | 10.85 | |||||||||||
| 0.47 | 0.45 | 0.44 | 0.48 | 0.48 | ||||||||||||||||
| (0.38 | ) | 0.67 | 0.10 | 1.01 | (1.12 | ) | ||||||||||||||
|
|
|
|
|
|
|
|
|
| |||||||||||
| 0.09 | 1.12 | 0.54 | 1.49 | (0.64 | ) | |||||||||||||||
|
|
|
|
|
|
|
|
|
| |||||||||||
| (0.47 | ) | (0.44 | ) | (0.44 | ) | (0.47 | ) | (0.48 | ) | |||||||||||
|
|
|
|
|
|
|
|
|
| |||||||||||
| (0.47 | ) | (0.44 | ) | (0.44 | ) | (0.47 | ) | (0.48 | ) | |||||||||||
|
|
|
|
|
|
|
|
|
| |||||||||||
| $ | 11.15 | $ | 11.53 | $ | 10.85 | $ | 10.75 | $ | 9.73 | |||||||||||
|
|
|
|
|
|
|
|
|
| |||||||||||
| 0.92% | 10.57% | 5.08% | 15.71% | (6.23% | ) | |||||||||||||||
| $ | 932,716 | $ | 905,436 | $ | 649,455 | $ | 384,525 | $ | 165,162 | |||||||||||
| 0.60% | 0.60% | 0.60% | 0.60% | 0.60% | ||||||||||||||||
| 0.69% | 0.69% | 0.72% | 0.74% | 0.74% | ||||||||||||||||
| 4.27% | 3.98% | 4.05% | 4.63% | 4.43% | ||||||||||||||||
| 4.18% | 3.89% | 3.93% | 4.49% | 4.29% | ||||||||||||||||
| 27% | 13% | 10% | 31% | 46% | ||||||||||||||||
| ||||||||||||||||||||
| ||||||||||||||||||||
105
Table of Contents
| Notes to financial statements | ||
| Delaware National Tax-Free Funds | August 31, 2017 |
Delaware Group® Tax-Free Fund is organized as a Delaware statutory trust and offers two series: Delaware Tax-Free USA Fund and Delaware Tax-Free USA Intermediate Fund. Voyageur Mutual Funds is organized as a Delaware statutory trust and offers five series: Delaware Tax-Free California Fund, Delaware Tax-Free Idaho Fund, Delaware Minnesota High-Yield Municipal Bond Fund, Delaware National High-Yield Municipal Bond Fund, and Delaware Tax-Free New York Fund. Delaware Group Tax-Free Fund and Voyageur Mutual Funds are each referred to as a Trust, or collectively, as the Trusts. These financial statements and the related notes pertain to Delaware Tax-Free USA Fund, Delaware Tax-Free USA Intermediate Fund, and Delaware National High-Yield Municipal Bond Fund (each referred to as a Fund, or collectively, as the Funds). The above Trusts are open-end investment companies. The Funds are considered diversified under the Investment Company Act of 1940, as amended (1940 Act), and offer Class A, Class C, and Institutional Class shares. Class A shares are sold with a maximum front-end sales charge of 4.50% for Delaware Tax-Free USA Fund and Delaware National High-Yield Municipal Bond Fund, and 2.75% for Delaware Tax-Free USA Intermediate Fund. Class A share purchases of $1,000,000 or more will incur a contingent deferred sales charge (CDSC) instead of a front-end sales charge of 1.00% if redeemed during the first year and 0.50% during the second year for Delaware Tax-Free USA Fund and Delaware National High-Yield Municipal Bond Fund, and 0.75% for Delaware Tax-Free USA Intermediate Fund if redeemed within the first year, provided that Delaware Distributors, L.P. (DDLP) paid a financial advisor a commission on the purchase of those shares. Class C shares are sold with a CDSC of 1.00%, if redeemed during the first 12 months. Institutional Class shares are not subject to a sales charge and are offered for sale exclusively to certain eligible investors.
The investment objective of Delaware Tax-Free USA Fund and Delaware Tax-Free USA Intermediate Fund is to seek as high a level of current interest income exempt from federal income taxes as is available from municipal obligations and as is consistent with prudent investment management and preservation of capital.
The investment objective of Delaware National High-Yield Municipal Bond Fund is to seek a high level of current income exempt from federal income tax primarily through investment in medium- and lower-grade municipal obligations.
1. Significant Accounting Policies
The following accounting policies are in accordance with US generally accepted accounting principles (US GAAP) and are consistently followed by the Funds.
Security Valuation – Debt securities are valued based upon valuations provided by an independent pricing service or broker and reviewed by management. To the extent current market prices are not available, the pricing service may take into account developments related to the specific security, as well as transactions in comparable securities. Valuations for fixed income securities utilize matrix systems, which reflect such factors as security prices, yields, maturities, and ratings, and are supplemented by dealer and exchange quotations. Generally, other securities and assets for which market quotations are not readily available are valued at fair value as determined in good faith under the direction of each Trust’s Board of Trustees (each, a Board or, collectively, the Boards). In determining whether market quotations are readily available or fair valuation will be used, various factors will be taken into
106
Table of Contents
consideration, such as market closures or suspension of trading in a security. The foregoing valuation policies apply to restricted and unrestricted securities.
Federal Income Taxes – No provision for federal income taxes has been made as each Fund intends to continue to qualify for federal income tax purposes as a regulated investment company under Subchapter M of the Internal Revenue Code of 1986, as amended, and make the requisite distributions to shareholders. Each Fund evaluates tax positions taken or expected to be taken in the course of preparing each Fund’s tax returns to determine whether the tax positions are “more-likely-than-not” of being sustained by the applicable tax authority. Tax positions not deemed to meet the “more-likely-than-not” threshold are recorded as a tax benefit or expense in the current year. Management has analyzed each Funds’ tax positions taken or to be taken on each Funds’ federal income tax returns through the year ended Aug. 31, 2017 and for all open tax years (years ended Aug. 31, 2014–Aug 31, 2016), and has concluded that no provision for federal income tax is required in each Funds’ financial statements. If applicable, each Fund recognizes interest accrued on unrecognized tax benefits in interest expense and penalties in other expenses on the “Statement of operations.” During the year ended Aug. 31, 2017, each Fund did not incur any interest or tax penalties.
Class Accounting – Investment income and common expenses are allocated to the various classes of each Fund on the basis of “settled shares” of each class in relation to the net assets of each Fund. Realized and unrealized gain (loss) on investments are allocated to the various classes of each Fund on the basis of daily net assets of each class. Distribution expenses relating to a specific class are charged directly to that class.
Use of Estimates – Each Fund is an investment company, whose financial statements are prepared in conformity with US GAAP. Therefore, each Fund follows the accounting and reporting guidelines for investment companies. The preparation of financial statements in conformity with US GAAP requires management to make estimates and assumptions that affect the fair value of investments, the reported amounts of assets and liabilities and disclosure of contingent assets and liabilities at the date of the financial statements, and the reported amounts of revenues and expenses during the reporting period. Actual results could differ from those estimates and the differences could be material.
Other – Expenses directly attributable to a Fund are charged directly to that Fund. Other expenses common to various funds within the Delaware FundsSM by Macquarie (Delaware Funds) are generally allocated among such funds on the basis of average net assets. Management fees and certain other expenses are paid monthly. Security transactions are recorded on the date the securities are purchased or sold (trade date) for financial reporting purposes. Costs used in calculating realized gains and losses on the sale of investment securities are those of the specific securities sold. Interest income is recorded on the accrual basis. Discounts and premiums on debt securities are accreted or amortized to interest income, respectively, over the lives of the respective securities using the effective interest method. Each Fund declares dividends daily from net investment income and pays the dividends monthly and declares and pays distributions from net realized gain on investments, if any, annually. Each Fund may distribute more frequently, if necessary for tax purposes. Dividends and distributions, if any, are recorded on the ex-dividend date.
Each Fund receives earnings credits from its custodian when positive cash balances are maintained, which may be used to offset custody fees. The expense paid under this arrangement is included on the
107
Table of Contents
Notes to financial statements
Delaware National Tax-Free Funds
1. Significant Accounting Policies (continued)
“Statements of operations” under “Custodian fees” with the corresponding expense offset shown under “Less expenses paid indirectly.” For the year ended Aug. 31, 2017, each Fund earned the following amounts under this agreement:
Delaware Tax-Free | Delaware Tax-Free | Delaware National High-Yield | ||
$1,349 | $1,042 | $1,894 |
Each Fund receives earnings credits from its transfer agent when positive cash balances are maintained, which may be used to offset transfer agent fees. If the amount earned is greater than $1, the expense paid under this arrangement is included on the “Statements of operations” under “Dividend disbursing and transfer agent fees and expenses” with the corresponding expense offset shown under “Less expenses paid indirectly.” For the year ended Aug. 31, 2017, each Fund earned the following amounts under this agreement:
Delaware Tax-Free | Delaware Tax-Free | Delaware National High-Yield | ||
$368 | $200 | $428 |
2. Investment Management, Administration Agreements, and Other Transactions with Affiliates
In accordance with the terms of its respective investment management agreement, each Fund pays Delaware Management Company (DMC), a series of Macquarie Investment Management Business Trust (formerly, Delaware Management Business Trust) and the investment manager, an annual fee which is calculated daily and paid monthly based on each Fund’s average daily net assets as follows:
Delaware Tax-Free | Delaware Tax-Free | Delaware National | ||||
On the first $500 million | 0.550% | 0.500% | 0.550% | |||
On the next $500 million | 0.500% | 0.475% | 0.500% | |||
On the next $1.5 billion | 0.450% | 0.450% | 0.450% | |||
In excess of $2.5 billion | 0.425% | 0.425% | 0.425% |
DMC has contractually agreed to waive that portion, if any, of its management fee and/or pay/reimburse each Fund to the extent necessary to ensure that total annual operating expenses (excluding any 12b-1 fees, acquired fund fees and expenses, taxes, interest, inverse floater program expenses, short sale and dividend interest expenses, brokerage fees, certain insurance costs, and nonroutine expenses or costs including, but not limited to, those relating to reorganizations, litigation, conducting shareholder meetings, and liquidations) do not exceed 0.56%, 0.60%, and 0.60% of average daily net assets of Delaware Tax-Free USA Fund, Delaware Tax-Free USA Intermediate Fund, and Delaware National High-Yield Municipal Bond Fund, respectively, from Sept. 1, 2016 through Aug. 31, 2017.* For purposes of these waivers and reimbursements, nonroutine expenses may also include such additional costs and expenses, as may be agreed upon from time to time by the Boards and DMC. These expense waivers and reimbursements apply only to expenses paid directly by each Fund and may only be terminated by agreement of DMC and each Fund.
108
Table of Contents
Delaware Investments Fund Services Company (DIFSC), an affiliate of DMC, provides fund accounting and financial administration oversight services to each Fund. For these services, DIFSC’s fees are calculated daily and paid monthly based on the aggregate daily net assets of the Delaware Funds at the following annual rate: 0.0050% of the first $30 billion; 0.0045% of the next $10 billion; 0.0040% of the next $10 billion; and 0.0025% of aggregate average daily net assets in excess of $50 billion. The fees payable to DIFSC under the service agreement described above are allocated among all funds in the Delaware Funds on a relative net asset value (NAV) basis. These amounts are included on the “Statements of operations” under “Accounting and administration expenses.” For the year ended Aug. 31, 2017, each Fund was charged for these services as follows:
Delaware Tax-Free | Delaware Tax-Free | Delaware National High-Yield | ||
$24,057 | $28,462 | $54,645 |
DIFSC is also the transfer agent and dividend disbursing agent of each Fund. For these services, DIFSC’s fees are calculated daily and paid monthly based on the aggregate daily net assets of the retail funds within the Delaware Funds at the following annual rate: 0.025% of the first $20 billion; 0.020% of the next $5 billion; 0.015% of the next $5 billion; and 0.013% on average daily net assets in excess of $30 billion. The fees payable to DIFSC under the service agreement described above are allocated among all retail funds in the Delaware Funds on a relative NAV basis. These amounts are included on the “Statements of operations” under “Dividend disbursing and transfer agent fees and expenses.” For the year ended Aug. 31, 2017, each Fund was charged for these services as follows:
Delaware Tax-Free | Delaware Tax-Free | Delaware National High-Yield | ||
$103,313 | $122,233 | $234,682 |
Pursuant to a sub-transfer agency agreement between DIFSC and BNY Mellon Investment Servicing (US) Inc. (BNYMIS), BNYMIS provides certain sub-transfer agency services to each Fund. Sub-transfer agency fees are paid by each Fund and are also included on the “Statements of operations” under “Dividend disbursing and transfer agent fees and expenses.”
Pursuant to a distribution agreement and distribution plan, Delaware National High-Yield Municipal Bond Fund pays DDLP, the distributor and an affiliate of DMC, an annual 12b-1 fee of 0.25% of the average daily net assets of the Class A shares. The Board for Delaware Tax-Free USA Fund has adopted a formula for calculating 12b-1 fees for the Fund’s Class A shares that went into effect on June 1, 1992. The Fund’s Class A shares are currently subject to a blended 12b-1 fee equal to the sum of: (1) 0.10% of average daily net assets representing shares acquired prior to June 1, 1992, and (2) 0.25% of average daily net assets representing shares that were acquired on or after June 1, 1992. All of the Fund’s Class A shareholders bear 12b-1 fees at the same rate, the blended rate, currently 0.25% of average daily net assets, based on the formula described above. This method of calculating Class A 12b-1 fees may be discontinued at the sole discretion of the Board. The Class A shares of Delaware Tax-Free USA Intermediate Fund were subject to a 12b-1 fee of 0.25% of average daily net assets, which was contractually waived to 0.15% of average daily net assets from Sept. 1, 2016 through Aug. 31, 2017.* Each Fund pays 1.00% of the average daily net assets of the Class C shares. The fees are calculated daily and paid monthly. Institutional Class shares pay no 12b-1 fees.
109
Table of Contents
Notes to financial statements
Delaware National Tax-Free Funds
2. Investment Management, Administration Agreements, and Other Transactions with Affiliates (continued)
As provided in the investment management agreement, each Fund bears a portion of the cost of resources shared with DMC, including the cost of internal personnel of DMC and/or its affiliates that provide legal, tax, and regulatory reporting services to each Fund. These amounts are included on the “Statements of operations” under “Legal fees.” For the year ended Aug. 31, 2017, each Fund was charged for internal legal, tax, and regulatory reporting services provided by DMC and/or its affiliates’ employees as follows:
Delaware Tax-Free | Delaware Tax-Free | Delaware National High-Yield | ||
$10,844 | $12,836 | $23,262 |
For the year ended Aug. 31, 2017, DDLP earned commissions on sales of Class A shares for each Fund as follows:
Delaware Tax-Free | Delaware Tax-Free | Delaware National High-Yield | ||
$24,150 | $7,223 | $59,090 |
For the year ended Aug. 31, 2017, DDLP received gross CDSC commissions on redemptions of each Fund’s Class A and Class C shares. These commissions were entirely used to offset upfront commissions previously paid by DDLP to broker/dealers on sales of those shares. The amounts received were as follows:
Delaware Tax-Free | Delaware Tax-Free | Delaware National High-Yield | ||||
Class A | $6,574 | $ 48 | $24,122 | |||
Class C | 4,484 | 1,238 | 17,600 |
Trustees’ fees include expenses accrued by the Funds for each Trustee’s retainer and meeting fees. Certain officers of DMC, DIFSC, and DDLP are officers and/or Trustees of the Trusts. These officers and Trustees are paid no compensation by the Funds.
Cross trades for the year ended Aug. 31, 2017, were executed by each Fund pursuant to procedures adopted by the Boards designed to ensure compliance with Rule 17a-7 under the 1940 Act. Cross trading is the buying or selling of portfolio securities between funds of investment companies, or between a fund of an investment company and another entity, that are or could be considered affiliates by virtue of having a common investment advisor (or affiliated investment advisors), common directors/trustees and/or common officers. At their regularly scheduled meetings, the Boards review such transactions for compliance with the procedures adopted by the Boards. Pursuant to these procedures, for the year ended Aug. 31, 2017, the Funds engaged in the following securities purchases and securities sales, which did not result in a realized gain or loss:
Delaware Tax-Free | Delaware Tax-Free | Delaware National High-Yield | ||||
Purchases | $36,245,782 | $30,031,787 | $115,539,117 | |||
Sales | 41,051,237 | 26,456,217 | 87,074,172 |
110
Table of Contents
*The aggregate contractual waiver period covering this report is from Dec. 29, 2015 through Dec. 29, 2017.
3. Investments
For the year ended Aug. 31, 2017, each Fund made purchases and sales of investment securities other than short-term investments as follows:
| Delaware Tax-Free USA Fund | Delaware Tax-Free USA Intermediate Fund | Delaware National High-Yield Municipal Bond Fund | ||||||||||
Purchases | $ | 168,634,113 | $ | 157,307,352 | $ | 328,294,159 | ||||||
Sales | 202,211,625 | 267,962,282 | 309,988,660 | |||||||||
At Aug. 31, 2017, the cost and unrealized appreciation (depreciation) of investments for federal income tax purposes for each Fund were as follows:
| Delaware Tax-Free USA Fund | Delaware Tax-Free USA Intermediate Fund | Delaware National High-Yield Municipal Bond Fund | ||||||||||
Cost of Investments | $469,566,815 | $535,971,839 | $1,148,123,746 | |||||||||
Aggregate unrealized appreciation of | $ 40,263,822 | $ 33,726,844 | $ 84,552,869 | |||||||||
Aggregate unrealized depreciation of | (974,670) | (28,137) | (7,280,875) | |||||||||
Net unrealized appreciation of investments | $ 39,289,152 | $ 33,698,707 | $ 77,271,994 | |||||||||
US GAAP defines fair value as the price that each Fund would receive to sell an asset or pay to transfer a liability in an orderly transaction between market participants at the measurement date under current market conditions. A three-level hierarchy for fair value measurements has been established based upon the transparency of inputs to the valuation of an asset or liability. Inputs may be observable or unobservable and refer broadly to the assumptions that market participants would use in pricing the asset or liability. Observable inputs reflect the assumptions market participants would use in pricing the asset or liability based on market data obtained from sources independent of the reporting entity. Unobservable inputs reflect the reporting entity’s own assumptions about the assumptions that market participants would use in pricing the asset or liability based on the best information available under the circumstances. Each Fund’s investment in its entirety is assigned a level based upon the observability of the inputs which are significant to the overall valuation. The three-level hierarchy of inputs is summarized below.
Level 1 – | Inputs are quoted prices in active markets for identical investments. (Examples: equity securities, open-end investment companies, futures contracts, exchange-traded options contracts) | |
Level 2 – | Other observable inputs, including, but not limited to: quoted prices for similar assets or liabilities in markets that are active, quoted prices for identical or similar assets or liabilities in | |
111
Table of Contents
Notes to financial statements
Delaware National Tax-Free Funds
3. Investments (continued)
| markets that are not active, inputs other than quoted prices that are observable for the assets or liabilities (such as interest rates, yield curves, volatilities, prepayment speeds, loss severities, credit risks, and default rates) or other market-corroborated inputs. (Examples: debt securities, government securities, swap contracts, foreign currency exchange contracts, foreign securities utilizing international fair value pricing, broker-quoted securities, fair valued securities) | ||
Level 3 – | Significant unobservable inputs, including each Fund’s own assumptions used to determine the fair value of investments. (Examples: broker-quoted securities, fair valued securities) | |
Level 3 investments are valued using significant unobservable inputs. Each Fund may also use an income-based valuation approach in which the anticipated future cash flows of the investment are discounted to calculate fair value. Discounts may also be applied due to the nature or duration of any restrictions on the disposition of the investments. Valuations may also be based upon current market prices of securities that are comparable in coupon, rating, maturity, and industry. The derived value of a Level 3 investment may not represent the value which is received upon disposition and this could impact the results of operations.
The following tables summarize the valuation of each Fund’s investments by fair value hierarchy levels as of Aug. 31, 2017:
| Delaware Tax-Free USA Fund | ||
Securities | Level 2 | |
Assets: | ||
Municipal Bonds | $508,105,967 | |
Short-Term Investment | 750,000 | |
Total Value of Securities | $508,855,967 | |
Delaware Tax-Free USA Intermediate Fund | ||
Securities | Level 2 | |
Assets: | ||
Municipal Bonds | $569,670,546 | |
Delaware National High-Yield Municipal Bond Fund | ||
Securities | Level 2 | |
Assets: | ||
Municipal Bonds | $1,214,370,740 | |
Short-Term Investments | 11,025,000 | |
Total Value of Securities | $1,225,395,740 | |
112
Table of Contents
During the year ended Aug. 31, 2017, there were no transfers between Level 1 investments, Level 2 investments, or Level 3 investments that had a significant impact to each Fund. Each Fund’s policy is to recognize transfers between levels based on fair value at the beginning of the reporting period.
A reconciliation of Level 3 investments is presented when a Fund has a significant amount of Level 3 investments at the beginning, interim, or end of the period in relation to net assets. During the year ended Aug. 31, 2017, there were no Level 3 investments.
4. Dividend and Distribution Information
Income and long-term capital gain distributions are determined in accordance with federal income tax regulations, which may differ from US GAAP. Additionally, distributions from net short-term gains on sales of investment securities are treated as ordinary income for federal income tax purposes. The tax character of dividends and distributions paid during the years ended Aug. 31, 2017 and 2016 was as follows:
| Delaware Tax-Free USA Fund | Delaware Tax-Free USA Intermediate Fund | Delaware National High-Yield Municipal Bond Fund | |||||||||||||
Year ended 8/31/17 | |||||||||||||||
Tax-exempt income | $19,094,030 | $17,933,308 | $48,338,718 | ||||||||||||
Ordinary income | 524,061 | 134,852 | 142,823 | ||||||||||||
Long-term capital gains | 4,897,926 | 177,417 | — | ||||||||||||
Total | $24,516,017 | $18,245,577 | $48,481,541 | ||||||||||||
Year ended 8/31/16 | |||||||||||||||
Tax-exempt income | $19,743,523 | $20,701,317 | $42,444,808 | ||||||||||||
Ordinary income | 50,597 | 9,086 | 62,862 | ||||||||||||
Total | $19,794,120 | $20,710,403 | $42,507,670 | ||||||||||||
113
Table of Contents
Notes to financial statements
Delaware National Tax-Free Funds
5. Components of Net Assets on a Tax Basis
As of Aug. 31, 2017, the components of net assets on a tax basis were as follows:
| Delaware Tax-Free USA Fund | Delaware Tax-Free USA Intermediate Fund | Delaware National High-Yield Municipal Bond Fund | |||||||||||||
Shares of beneficial interest | $ | 467,781,852 | $ | 543,629,505 | $ | 1,166,998,454 | |||||||||
Undistributed tax-exempt income | 454,141 | 349,037 | 1,220,984 | ||||||||||||
Distributions payable | (468,864 | ) | (382,148 | ) | (1,225,086 | ) | |||||||||
Qualified late year loss deferrals | (1,473,545 | ) | (3,296,509 | ) | — | ||||||||||
Capital loss carryforwards | — | — | (23,365,591 | ) | |||||||||||
Unrealized appreciation of investments | 39,289,152 | 33,698,707 | 77,271,994 | ||||||||||||
|
|
|
|
|
| ||||||||||
Net assets | $ | 505,582,736 | $ | 573,998,592 | $ | 1,220,900,755 | |||||||||
|
|
|
|
|
| ||||||||||
The differences between book basis and tax basis components of net assets are primarily attributable to tax deferral of losses on wash sales and tax treatment of market discount and premium on debt instruments, if applicable.
Qualified late year capital losses represent losses realized from Nov. 1, 2016 through Aug. 31, 2017, that in accordance with federal income tax regulations, Delaware Tax-Free USA Fund and Delaware Tax-Free USA Intermediate Fund have elected to defer and treat as having arisen in the following fiscal year.
For financial reporting purposes, capital accounts are adjusted to reflect the tax character of permanent book/tax differences. Reclassifications are primarily due to tax treatment of market discount and premium on certain debt instruments, expiration of capital loss carryforwards, and dividends and distributions. Results of operations and net assets were not affected by these reclassifications. For the year ended Aug. 31, 2017, the Funds recorded the following reclassifications:
| Delaware Tax-Free USA Fund | Delaware Tax-Free USA Intermediate Fund | Delaware National High-Yield Municipal Bond Fund | |||||||||||||
Distributions in excess of net investment income | $ | (81,619 | ) | $ | (49,360 | ) | $ | (141,280 | ) | ||||||
Accumulated net realized loss | 81,619 | 49,360 | 516,015 | ||||||||||||
Paid-in capital | — | — | (374,735 | ) | |||||||||||
For federal income tax purposes, capital loss carryforwards may be carried forward and applied against future capital gains. At Aug. 31, 2017, Delaware Tax-Free USA Intermediate Fund utilized $698,745 of capital loss carryforwards. At Aug. 31, 2017, $374,735 capital loss carryforwards expired for Delaware National High-Yield Municipal Bond Fund.
114
Table of Contents
Under the Regulated Investment Company Modernization Act of 2010 (Act), net capital losses recognized for tax years beginning after Dec. 22, 2010 may be carried forward indefinitely, and their character is retained as short-term and/or long-term losses. Previously, net capital losses were carried forward for eight years and treated as short-term losses. As a transition rule, the Act requires that post-enactment net capital losses be used before pre-enactment net capital losses. At Aug. 31, 2017, capital loss carryforwards available to offset future realized capital gains, were as follows:
Loss carryforward character | ||||||
Short-term | Long-term | |||||
Delaware National High-Yield Municipal Bond Fund | $13,245,280 | $10,120,311 | ||||
6. Capital Shares
Transactions in capital shares were as follows:
| Delaware Tax-Free USA Fund | Delaware Tax-Free USA Intermediate Fund | Delaware National High-Yield Municipal Bond Fund | ||||||||||||||||||||||
Year ended | Year ended | Year ended | ||||||||||||||||||||||
| 8/31/17 | 8/31/16 | 8/31/17 | 8/31/16 | 8/31/17 | 8/31/16 | |||||||||||||||||||
Shares sold: | ||||||||||||||||||||||||
Class A | 1,771,333 | 1,543,347 | 3,022,406 | 3,487,962 | 4,328,365 | 6,479,874 | ||||||||||||||||||
Class C | 325,639 | 347,808 | 271,770 | 464,194 | 1,288,593 | 2,735,540 | ||||||||||||||||||
Institutional Class | 3,141,457 | 1,666,378 | 11,329,643 | 11,875,678 | 33,863,188 | 29,096,103 | ||||||||||||||||||
Shares issued upon reinvestment of dividends and distributions: |
| |||||||||||||||||||||||
Class A | 1,565,318 | 1,256,558 | 384,829 | 409,255 | 652,446 | 634,748 | ||||||||||||||||||
Class C | 87,959 | 59,975 | 70,969 | 73,157 | 265,684 | 238,848 | ||||||||||||||||||
Institutional Class | 161,330 | 89,643 | 697,103 | 729,446 | 2,813,255 | 2,380,529 | ||||||||||||||||||
|
|
|
|
|
|
|
|
|
|
|
| |||||||||||||
| 7,053,036 | 4,963,709 | 15,776,720 | 17,039,692 | 43,211,531 | 41,565,642 | |||||||||||||||||||
|
|
|
|
|
|
|
|
|
|
|
| |||||||||||||
Shares redeemed: | ||||||||||||||||||||||||
Class A | (8,219,120 | ) | (5,054,234 | ) | (4,984,764 | ) | (4,027,785 | ) | (9,726,923 | ) | (6,268,883 | ) | ||||||||||||
Class C | (653,426 | ) | (434,847 | ) | (992,677 | ) | (550,150 | ) | (2,656,102 | ) | (1,486,395 | ) | ||||||||||||
Institutional Class | (1,681,232 | ) | (840,919 | ) | (20,021,304 | ) | (13,268,401 | ) | (31,588,716 | ) | (12,755,521 | ) | ||||||||||||
|
|
|
|
|
|
|
|
|
|
|
| |||||||||||||
| (10,553,778 | ) | (6,330,000 | ) | (25,998,745 | ) | (17,846,336 | ) | (43,971,741 | ) | (20,510,799 | ) | |||||||||||||
|
|
|
|
|
|
|
|
|
|
|
| |||||||||||||
Net increase (decrease) | (3,500,742 | ) | (1,366,291 | ) | (10,222,025 | ) | (806,644 | ) | (760,210 | ) | 21,054,843 | |||||||||||||
|
|
|
|
|
|
|
|
|
|
|
| |||||||||||||
Certain shareholders may exchange shares of one class for shares of another class in the same Fund. For the year ended Aug. 31, 2017 and 2016, each Fund had the following exchange transactions.
115
Table of Contents
Notes to financial statements
Delaware National Tax-Free Funds
6. Capital Shares (continued)
These exchange transactions are included as subscriptions and redemptions in the tables on the previous page and the “Statements of changes in net assets.”
| Year ended | ||||||||||||||||||||
| 8/31/17 | ||||||||||||||||||||
| Exchange | Exchange | |||||||||||||||||||
| Redemptions | Subscriptions | |||||||||||||||||||
| Institutional | ||||||||||||||||||||
| Class A | Class C | Class | ||||||||||||||||||
| Shares | Shares | Shares | Value | |||||||||||||||||
Delaware Tax-Free USA Fund | 856,362 | 6,306 | 858,276 | $ | 9,985,602 | |||||||||||||||
Delaware Tax-Free USA Intermediate Fund | 234,870 | — | 232,990 | 2,786,921 | ||||||||||||||||
Delaware National High-Yield Municipal Bond Fund | 2,134,297 | 15,391 | 2,134,779 | 23,025,554 | ||||||||||||||||
| Year ended | ||||||||||||||||||||||||||||||
| 8/31/16 | ||||||||||||||||||||||||||||||
| Exchange | Exchange | |||||||||||||||||||||||||||||
| Redemptions | Subscriptions | |||||||||||||||||||||||||||||
| Institutional | Institutional | |||||||||||||||||||||||||||||
| Class A | Class | Class A | Class C | Class | ||||||||||||||||||||||||||
| Shares | Shares | Shares | Shares | Shares | Value | |||||||||||||||||||||||||
Delaware Tax-Free USA Fund | 45,617 | — | — | — | 45,355 | $ | 555,813 | |||||||||||||||||||||||
Delaware Tax-Free USA Intermediate Fund | 28,037 | 172 | 174 | — | 27,807 | 348,312 | ||||||||||||||||||||||||
Delaware National High-Yield Municipal Bond Fund | 459,565 | 9,199 | 8,818 | 468 | 455,914 | 5,308,745 | ||||||||||||||||||||||||
7. Line of Credit
Each Fund, along with certain other funds in the Delaware Funds (Participants), was a participant in a $155,000,000 revolving line of credit intended to be used for temporary or emergency purposes as an additional source of liquidity to fund redemptions of investor shares. Under the agreement, the Participants were charged an annual commitment fee of 0.10%, which was allocated across the Participants on the basis of relative net assets of each Participant’s allocation of the entire facility. The Participants were permitted to borrow up to a maximum of one-third of their net assets under the agreement. Each Participant was individually, and not jointly, liable for its particular advances, if any, under the line of credit. The line of credit available under the agreement expired on Nov. 7, 2016.
On Nov. 7, 2016, each Fund, along with the other Participants, entered into an amendment to the agreement for a $155,000,000 revolving line of credit. The line of credit is to be used as described above and operates in substantially the same manner as the original agreement, with the exception of the
116
Table of Contents
annual commitment fee. Under the amendment to the agreement, the Participants are charged an annual commitment fee of 0.15%, which is allocated across the Participants on the basis of relative net assets of each Participant’s allocation of the entire facility. The line of credit available under the agreement expires on Nov. 6, 2017.
The Funds had no amounts outstanding as of Aug. 31, 2017, or at any time during the year then ended.
8. Geographic, Credit, and Market Risks
The Funds concentrate their investments in securities issued by municipalities, and may be subject to geographic concentration risk. In addition, the Funds have the flexibility to invest in issuers in US territories and possessions such as the Commonwealth of Puerto Rico, the US Virgin Islands, and Guam, whose bonds are also free of federal and individual state income taxes. The value of the Funds’ investments may be adversely affected by new legislation within the US states or territories, regional or local economic conditions, and differing levels of supply and demand for municipal bonds. Many municipalities insure repayment for their obligations. Although bond insurance reduces the risk of loss due to default by an issuer, such bonds remain subject to the risk that value may fluctuate for other reasons and there is no certainty that the insurance company will meet its obligations. A real or perceived decline in creditworthiness of a bond insurer can have an adverse impact on the value of insured bonds held in each Fund. At Aug. 31, 2017, the percentage of each Fund’s net assets insured by bond issuers are listed below and these securities have been identified on the “Schedules of investments.”
| Delaware Tax-Free USA Fund | Delaware Tax-Free USA Intermediate Fund | Delaware National High-Yield Municipal Bond Fund | |||||||||||||
Assured Guaranty Corporation | 0.22 | % | — | 0.46 | % | ||||||||||
Assured Guaranty Municipal Corporation | 0.05 | % | 1.39 | % | 0.72 | % | |||||||||
AMBAC Assurance Corporation | 0.56 | % | — | 0.08 | % | ||||||||||
National Public Finance Guarantee Corporation | 0.44 | % | — | — | |||||||||||
Syncora Guarantee | — | — | 0.15 | % | |||||||||||
|
|
|
|
|
| ||||||||||
Total | 1.27 | % | 1.39 | % | 1.41 | % | |||||||||
|
|
|
|
|
| ||||||||||
As of Aug. 31, 2017, Delaware Tax-Free USA Fund invested in municipal bonds issued by the states of California, New York, and Texas which constituted approximately 13.31%, 15.45%, and 10.22%, respectively, of the Fund’s net assets. As of Aug. 31, 2017, Delaware Tax-Free USA Intermediate Fund invested in municipal bonds issued by the states of California, New York, and Texas, which constituted approximately 15.20%, 16.91%, and 11.73%, respectively, of the Fund’s net assets. As of Aug. 31, 2017, Delaware National High-Yield Municipal Bond Fund invested in municipal bonds issued by the State of California which constituted approximately 16.91%, of the Fund’s net assets. These
117
Table of Contents
Delaware National Tax-Free Funds
8. Geographic, Credit, and Market Risks (continued)
investments could make each Fund more sensitive to economic conditions in those states than other more geographically diversified national municipal income funds.
Each Fund invests a portion of its assets in high yield fixed income securities, which are securities rated lower than BBB- by Standard & Poor’s Financial Services LLC (S&P), lower than Baa3 by Moody’s Investors Service, Inc. (Moody’s), or similarly rated by another nationally recognized statistical rating organization. Investments in these higher-yielding securities are generally accompanied by a greater degree of credit risk than higher rated securities. Additionally, lower rated securities may be more susceptible to adverse economic and competitive industry conditions than investment grade securities.
Each Fund invests in certain obligations that may have liquidity protection designed to ensure that the receipt of payments due on the underlying security is timely. Such protection may be provided through guarantees, insurance policies, or letters of credit obtained by the issuer or sponsor through third parties, through various means of structuring the transaction or through a combination of such approaches. Each Fund will not pay any additional fees for such credit support, although the existence of credit support may increase the price of a security.
The Funds may invest in advance refunded bonds, escrow secured bonds, or defeased bonds. Under current federal tax laws and regulations, state and local government borrowers are permitted to refinance outstanding bonds by issuing new bonds. The issuer refinances the outstanding debt to either reduce interest costs or to remove or alter restrictive covenants imposed by the bonds being refinanced. A refunding transaction where the municipal securities are being refunded within 90 days from the issuance of the refunding issue is known as a “current refunding.” “Advance refunded bonds” are bonds in which the refunded bond issue remains outstanding for more than 90 days following the issuance of the refunding issue. In an advance refunding, the issuer will use the proceeds of a new bond issue to purchase high grade interest bearing debt securities, which are then deposited in an irrevocable escrow account held by an escrow agent to secure all future payments of principal and interest and bond premium of the advance refunded bond. Bonds are “escrowed to maturity” when the proceeds of the refunding issue are deposited in an escrow account for investment sufficient to pay all of the principal and interest on the original interest payment and maturity dates.
Bonds are considered “pre-refunded” when the refunding issue’s proceeds are escrowed only until a permitted call date or dates on the refunded issue with the refunded issue being redeemed at the time, including any required premium. Bonds become “defeased” when the rights and interests of the bondholders and of their lien on the pledged revenues or other security under the terms of the bond contract are substituted with an alternative source of revenues (the escrow securities) sufficient to meet payments of principal and interest to maturity or to the first call dates. Escrowed secured bonds will often receive a rating of AAA from Moody’s, S&P, and/or Fitch Ratings due to the strong credit quality of the escrow securities and the irrevocable nature of the escrow deposit agreement.
Each Fund may invest up to 15% of its net assets in illiquid securities, which may include securities with contractual restrictions on resale, securities exempt from registration under Rule 144A, promulgated under the Securities Act of 1933, as amended, and other securities which may not be readily marketable. The relative illiquidity of these securities may impair each Fund from disposing of them in a timely
118
Table of Contents
manner and at a fair price when it is necessary or desirable to do so. While maintaining oversight, the Boards have delegated to DMC, the day-to-day functions of determining whether individual securities are liquid for purposes of each Fund’s limitation on investments in illiquid securities. Securities eligible for resale pursuant to Rule 144A, which are determined to be liquid, are not subject to the Funds’ 15% limit on investments in illiquid securities. Rule 144A securities held by each Fund have been identified on the “Schedules of investments.”
9. Contractual Obligations
The Funds enter into contracts in the normal course of business that contain a variety of indemnifications. The Funds’ maximum exposure under these arrangements is unknown. However, the Funds have not had prior claims or losses pursuant to these contracts. Management has reviewed the Funds’ existing contracts and expects the risk of loss to be remote.
10. Recent Accounting Pronouncements
In October 2016, the Securities and Exchange Commission released its Final Rule on Investment Company Reporting Modernization (the “Rule”). The Rule contains amendments to Regulation S-X which impact financial statement presentation, particularly the presentation of derivative investments. The financial statements presented are in compliance with the most recent Regulations S-X amendments.
11. Subsequent Events
Effective Sept. 1, 2017, the Fund entered into an amendment to the DIFSC agreement. Under the amendment to the DIFSC agreement, DIFSC’s fees are calculated daily and paid monthly based on the aggregate daily net assets of the Delaware Funds at the following annual rate: 0.00475% of the first $35 billion; 0.0040% of the next $10 billion; and 0.0025% of aggregate average daily net assets in excess of $45 billion (Total Fee). Each Fund in the Delaware Funds pays a minimum of $4,000, which, in aggregate, is subtracted from the Total Fee. Each Fund in the Delaware Funds then pays its relative portion of the remainder of the Total Fee on a relative NAV basis.
Management has determined that no other material events or transactions occurred subsequent to Aug. 31, 2017 that would require recognition or disclosure in the Fund’s financial statements.
119
Table of Contents
Report of independent registered
public accounting firm
To the Board of Trustees of Delaware Group® Tax-Free Fund and Voyageur Mutual Funds and the Shareholders of the Funds, as defined
In our opinion, the accompanying statements of assets and liabilities, including the schedules of investments, and the related statements of operations and of changes in net assets and the financial highlights present fairly, in all material respects, the financial position of Delaware Tax-Free USA Fund and Delaware Tax-Free USA Intermediate Fund (constituting Delaware Group® Tax-Free Fund) and Delaware National High-Yield Municipal Bond Fund (one of the series constituting Voyageur Mutual Funds) (hereafter collectively referred to as the “Funds”) as of August 31, 2017, the results of each of their operations for the year then ended, the changes in each of their net assets for each of the two years in the period then ended and the financial highlights for each of the five years in the period then ended, in conformity with accounting principles generally accepted in the United States of America. These financial statements and financial highlights (hereafter referred to as “financial statements”) are the responsibility of the Funds’ management. Our responsibility is to express an opinion on these financial statements based on our audits. We conducted our audits of these financial statements in accordance with the standards of the Public Company Accounting Oversight Board (United States). Those standards require that we plan and perform the audit to obtain reasonable assurance about whether the financial statements are free of material misstatement. An audit includes examining, on a test basis, evidence supporting the amounts and disclosures in the financial statements, assessing the accounting principles used and significant estimates made by management, and evaluating the overall financial statement presentation. We believe that our audits, which included confirmation of securities as of August 31, 2017 by correspondence with the custodian and brokers, provide a reasonable basis for our opinion.
PricewaterhouseCoopers LLP
Philadelphia, Pennsylvania
October 16, 2017
120
Table of Contents
Other Fund information (Unaudited)
Delaware National Tax-Free Funds
Tax Information
The information set forth below is for each Fund’s fiscal year as required by federal income tax laws. Shareholders, however, must report distributions on a calendar year basis for income tax purposes, which may include distributions for portions of two fiscal years of a fund. Accordingly, the information needed by shareholders for income tax purposes will be sent to them in January of each year. Please consult your tax advisor for proper treatment of this information.
All disclosures are based on financial information available as of the date of this annual report and, accordingly are subject to change. For any and all items requiring reporting, it is the intention of each Fund to report the maximum amount permitted under the Internal Revenue Code and the regulations thereunder.
For the fiscal year ended Aug. 31, 2017, each Fund reports distributions paid during the year as follows:
| (A) Ordinary Income Distributions (Tax Basis) | (B) Tax-Exempt Distributions (Tax Basis) | (C) Long-Term Capital Gain Distributions (Tax Basis) | Total Distributions (Tax Basis) | |||||
Delaware Tax-Free USA Fund | 2.14% | 77.88% | 19.98% | 100.00% | ||||
Delaware Tax-Free USA Intermediate Fund | 0.74% | 98.29% | 0.97% | 100.00% | ||||
Delaware National High-Yield Municipal Bond Fund | 0.29% | 99.71% | — | 100.00% |
(A), (B) and (C) are based on a percentage of each Fund’s total distributions.
Board consideration of Delaware National High-Yield Municipal Bond Fund, Delaware Tax-Free USA Fund, and Delaware Tax-Free USA Intermediate Fund Investment Management Agreements
At a meeting held on Aug. 16–17, 2017 (the “Annual Meeting”), the Board of Trustees (the “Board”), including a majority of disinterested or independent Trustees, approved the renewal of the Investment Advisory Agreements for Delaware Tax-Free USA Fund, Delaware Tax-Free USA Intermediate Fund and Delaware National High-Yield Municipal Bond Fund (each, a “Fund” and together, the “Funds”). In making its decision, the Board considered information furnished at regular quarterly Board meetings, including reports detailing Fund performance, investment strategies, and expenses, as well as information prepared specifically in connection with the renewal of the investment advisory and sub-advisory contracts. Information furnished specifically in connection with the renewal of the Investment Management Agreements with Delaware Management Company (“DMC”), a series of Macquarie Investment Management Business Trust (formerly, Delaware Management Business Trust), included materials provided by DMC and its affiliates concerning, among other things, the nature, extent, and quality of services provided to the Funds; the costs of such services to the Funds; economies of scale; and the investment manager’s financial condition and profitability. In addition, in connection with the Annual Meeting, reports were provided to the Trustees in May 2017 and included reports provided by Broadridge Financial Solutions (formerly Lipper) (“Broadridge” or “Lipper”). The Broadridge reports compared each Fund’s investment performance and expenses with those of other comparable mutual funds. The Independent Trustees reviewed and discussed the Broadridge reports with independent legal
121
Table of Contents
Other Fund information (Unaudited)
Delaware National Tax-Free Funds
Board consideration of Delaware National High-Yield Municipal Bond Fund, Delaware Tax-Free USA Fund, and Delaware Tax-Free USA Intermediate Fund Investment Management Agreements (continued)
counsel to the Independent Trustees. In addition to the information noted above, the Board also requested and received information regarding DMC’s policy with respect to advisory fee levels and its breakpoint philosophy; the structure of portfolio manager compensation; comparative client fee information; and any constraints or limitations on the availability of securities for certain investment styles, which had in the past year inhibited, or which were likely in the future to inhibit, the investment manager’s ability to invest fully in accordance with Fund policies.
In considering information relating to the approval of each Fund’s advisory agreement, the Independent Trustees received assistance and advice from and met separately with independent legal counsel to the Independent Trustees. Although the Board gave attention to all information furnished, the following discussion identifies, under separate headings, the primary factors taken into account by the Board during its contract renewal considerations.
Nature, extent, and quality of service. The Board considered the services provided by DMC to the Funds and their shareholders. In reviewing the nature, extent, and quality of services, the Board considered reports furnished to it throughout the year, which covered matters such as the relative performance of the Funds; compliance of portfolio managers with the investment policies, strategies, and restrictions for the Funds; compliance by DMC and Delaware Distributors, L.P. (together, “Management”) personnel with the Code of Ethics adopted throughout the Delaware FundsSM by Macquarie (“Delaware Funds”); and adherence to fair value pricing procedures as established by the Board. The Board was pleased with the current staffing of the Funds’ investment advisor and the emphasis placed on research in the investment process. The Board recognized DMC’s receipt of several industry distinctions during the past several years. The Board gave favorable consideration to DMC’s efforts to control expenditures while maintaining service levels committed to Fund matters. The Board also noted the benefits provided to Fund shareholders through each shareholder’s ability to exchange an investment in one Delaware Fund for the same class of shares in another Delaware Fund without a sales charge, to reinvest Fund dividends into additional shares of the Fund or into additional shares of other Delaware Funds, and the privilege to combine holdings in other Delaware Funds to obtain a reduced sales charge. The Board was satisfied with the nature, extent, and quality of the overall services provided by DMC.
Investment performance. The Board placed significant emphasis on the investment performance of the Funds in view of the importance of investment performance to shareholders. Although the Board considered performance reports and discussions with portfolio managers at Investment Committee meetings throughout the year, the Board gave particular weight to the Broadridge reports furnished for the Annual Meeting. The Broadridge reports prepared for each Fund showed the investment performance of its Class A shares in comparison to a group of similar funds as selected by Broadridge (the “Performance Universe”). A fund with the best performance ranked first, and a fund with the poorest performance ranked last. The highest/best performing 25% of funds in the Performance Universe make up the first quartile; the next 25%, the second quartile; the next 25%, the third quartile; and the poorest/ worst performing 25% of funds in the Performance Universe make up the fourth quartile. Comparative annualized performance for each Fund was shown for the past 1-, 3-, 5-, and 10-year periods, to the
122
Table of Contents
extent applicable, ended Jan. 31, 2017. The Board’s objective is that each Fund’s performance for the 1-, 3-, and 5-year periods considered be at or above the median of its Performance Universe.
Delaware Tax-Free USA Fund — The Performance Universe for the Fund consisted of the Fund and all retail and institutional general and insured municipal debt funds as selected by Broadridge. The Broadridge report comparison showed that the Fund’s total return for the 1-, 3-, and 5-year periods was in the second quartile of its Performance Universe. The Board was satisfied with performance.
Delaware Tax-Free USA Intermediate Fund — The Performance Universe for the Fund consisted of the Fund and all retail and institutional intermediate municipal debt funds as selected by Broadridge. The Broadridge report comparison showed that the Fund’s total return for the 1-, 3-, and 5-year periods was in the third quartile of its Performance Universe. The Board noted that the Fund’s performance was not in line with the Board’s objective. In evaluating the Fund’s performance, the Board considered the numerous investment and performance reports and other information delivered by Management personnel to the Board’s Investments Committee. The Board was satisfied that Management was taking action to improve Fund performance and meet the Board’s performance objective.
Delaware National High-Yield Municipal Bond Fund — The Performance Universe for the Fund consisted of the Fund and all retail and institutional high yield municipal debt funds as selected by Broadridge. The Broadridge report comparison showed that the Fund’s total return for the 1-year period was in the third quartile of its Performance Universe. The report further showed that the Fund’s total return for the 3- and 5-year periods was in the second quartile of its Performance Universe. The Board was satisfied with performance.
Comparative expenses. The Board considered expense comparison data for the Delaware Funds. Management provided the Board with information on pricing levels and fee structures for each Fund as of its most recently completed fiscal year. The Board also focused on the comparative analysis of effective management fees and total expense ratios of each Fund versus effective management fees and expense ratios of a group of similar funds as selected by Broadridge (the “Expense Group”). In reviewing comparative costs, each Fund’s contractual management fee and the actual management fee incurred by the Fund were compared with the contractual management fees (assuming all funds in the Expense Group were similar in size to the Fund) and actual management fees (as reported by each fund) within the Expense Group, taking into account any applicable breakpoints and fee waivers. Each Fund’s total expenses were also compared with those of its Expense Group. The Broadridge total expenses, for comparative consistency, were shown by Broadridge for Class A shares and comparative total expenses including 12b-1 and non-12b-1 service fees. The Board’s objective is to limit each Fund’s total expense ratio to be competitive with that of the Expense Group.
Delaware Tax-Free USA Fund — The expense comparisons for the Fund showed that its actual management fee was in the quartile with the lowest expenses of its Expense Group and its total expenses were in the quartile with the second lowest expenses of its Expense Group. The Board was satisfied with the management fee and total expenses of the Fund in comparison to those of its Expense Group as shown in the Broadridge report.
123
Table of Contents
Other Fund information (Unaudited)
Delaware National Tax-Free Funds
Board consideration of Delaware National High-Yield Municipal Bond Fund, Delaware Tax-Free USA Fund, and Delaware Tax-Free USA Intermediate Fund Investment Management Agreements (continued)
Delaware Tax-Free USA Intermediate Fund — The expense comparisons for the Fund showed that its actual management fee was in the quartile with the highest expenses of its Expense Group and its total expenses were in the quartile with the lowest expenses of its Expense Group. The Board noted that the Fund’s management fee was not in line with the Board’s objective, but that the Board was satisfied with the total expenses of the Fund in comparison to those of its Expense Group as shown in the Broadridge report.
Delaware National High-Yield Municipal Bond Fund — The expense comparisons for the Fund showed that its actual management fee was in the quartile with the lowest expenses of its Expense Group and its total expenses were in the quartile with the second lowest expenses of its Expense Group. The Board was satisfied with the management fee and total expenses of the Fund in comparison to those of its Expense Group as shown in the Broadridge report.
Management profitability. The Board considered the level of profits realized by DMC in connection with the operation of the Funds. In this respect, the Board reviewed the Investment Management Profitability Analysis that addressed the overall profitability of DMC’s business in providing management and other services to each of the individual funds and the Delaware Funds as a whole. Specific attention was given to the methodology followed in allocating costs for the purpose of determining profitability. Management stated that the level of profits of DMC, to a certain extent, reflects recent operational cost savings and efficiencies initiated by DMC. The Board considered DMC’s efforts to improve services provided to fund shareholders and to meet additional regulatory and compliance requirements resulting from recent industry-wide Securities and Exchange Commission initiatives. The Board also considered the extent to which DMC might derive ancillary benefits from fund operations, including the potential for procuring additional business as a result of the prestige and visibility associated with its role as service provider to the Delaware Funds and the benefits from allocation of fund brokerage to improve trading efficiencies. The Board found that the management fees were reasonable in light of the services rendered and the level of profitability of DMC.
Economies of scale. The Trustees considered whether economies of scale are realized by DMC as each Fund’s assets increase and the extent to which any economies of scale are reflected in the level of management fees charged. The Trustees reviewed the standardized advisory fee pricing and structure, approved by the Board and shareholders, which includes breakpoints, and which applies to most funds in the Delaware Funds complex. Breakpoints in the advisory fee occur when the advisory fee rate is reduced on assets in excess of specified levels. Breakpoints result in a lower advisory fee than would otherwise be the case in the absence of breakpoints, when the asset levels specified in the breakpoints are exceeded. The Board noted that the fee under each Fund’s management contract fell within the standardized fee pricing structure. The Board also noted that, as of Feb. 28, 2017, the assets of Delaware Tax-Free USA Fund and Delaware Tax-Free USA Intermediate Fund exceeded the first breakpoint level and the assets of Delaware National High-Yield Municipal Bond Fund exceeded the second breakpoint level. The Board believed that, given the extent to which economies of scale might be realized by the advisor and its affiliates, the schedule of fees under the Investment Management Agreements provides a sharing of benefits with the Funds and their shareholders.
124
Table of Contents
This page intentionally left blank.
Table of Contents
Board of trustees / directors and officers addendum
Delaware FundsSM by Macquarie
A mutual fund is governed by a Board of Trustees/Directors (“Trustees”), which has oversight responsibility for the management of a fund’s business affairs. Trustees establish procedures and oversee and review the performance of the investment manager, the distributor, and others who perform services for the fund. The independent fund trustees, in particular, are advocates
Name, Address, and Birth Date | Position(s) Held with Fund(s) | Length of Time Served | ||
Interested Trustee
| ||||
Shawn K. Lytle1, 2 2005 Market Street Philadelphia, PA 19103 February 1970 | President, Chief Executive Officer, and Trustee | Trustee since September 2015 | ||
President and Chief Executive Officer since August 2015 | ||||
| ||||
Independent Trustees
| ||||
Thomas L. Bennett 2005 Market Street Philadelphia, PA 19103 October 1947 | Chairman and Trustee | Trustee since March 2005 | ||
Chairman since March 2015 | ||||
Ann D. Borowiec 2005 Market Street Philadelphia, PA 19103 November 1958
| Trustee | Since March 2015 | ||
Joseph W. Chow 2005 Market Street Philadelphia, PA 19103 January 1953
| Trustee | Since January 2013 | ||
| 1 | Shawn K. Lytle is considered to be an “Interested Trustee” because he is an executive officer of the Fund’s(s’) investment advisor. |
| 2 | Shawn K. Lytle, David F. Connor, Daniel V. Geatens, and Richard Salus serve in similar capacities for the six portfolios of the Optimum Fund Trust, which have the same investment advisor, principal underwriter, and transfer agent as the registrant. |
126
Table of Contents
for shareholder interests. Each trustee has served in that capacity since he or she was elected to or appointed to the Board of Trustees, and will continue to serve until his or her retirement or the election of a new trustee in his or her place. The following is a list of the Trustees and Officers with certain background and related information.
Principal Occupation(s) During the Past Five Years | Number of Portfolios in Fund Complex Overseen by Trustee or Officer | Other Directorships Held by Trustee or Officer | ||
Shawn K. Lytle has served as President of Macquarie Investment Management3 since June 2015 and was the Regional Head of Americas for UBS Global Asset Management from 2010 through 2015. | 62 | Trustee — UBS Relationship Funds, SMA Relationship Trust, and UBS Funds (May 2010–April 2015) | ||
Private Investor (March 2004–Present)
| 62 | None | ||
Chief Executive Officer, Private Wealth Management (2011–2013) and Market Manager, New Jersey Private Bank (2005–2011) — J.P. Morgan Chase & Co.
| 62 | Director — Banco Santander International
Director — Santander Bank, N.A. | ||
Executive Vice President (Emerging Economies Strategies, Risks, and Corporate Administration) State Street Corporation (July 2004–March 2011)
| 62 | Director and Audit Committee Member — Hercules Technology Growth Capital, Inc. (2004–2014) | ||
| 3 | Macquarie Investment Management (formerly known as Delaware Investments) is the marketing name for Macquarie Management Holdings, Inc. (formerly known as Delaware Management Holdings, Inc.) and its subsidiaries, including the Fund’s(s’) investment advisor, principal underwriter, and its transfer agent. |
127
Table of Contents
Board of trustees / directors and officers addendum
Delaware FundsSM by Macquarie
| Name, Address, | Position(s) | Length of | ||
| and Birth Date | Held with Fund(s) | Time Served | ||
Independent Trustees (continued)
| ||||
| John A. Fry | Trustee | Since January 2001 | ||
| 2005 Market Street | ||||
Philadelphia, PA 19103 May 1960
| ||||
| Lucinda S. Landreth | Trustee | Since March 2005 | ||
| 2005 Market Street | ||||
| Philadelphia, PA 19103 | ||||
| June 1947 | ||||
| Frances A. Sevilla-Sacasa | Trustee | Since September 2011 | ||
| 2005 Market Street | ||||
| Philadelphia, PA 19103 | ||||
January 1956
| ||||
128
Table of Contents
| Number of Portfolios in | ||||
| Principal Occupation(s) | Fund Complex Overseen | Other Directorships | ||
| During the Past Five Years | by Trustee or Officer | Held by Trustee or Officer | ||
| President — | 62 | Director, Audit Committee, | ||
| Drexel University | and Governance Committee | |||
| (August 2010–Present) | Member — Community | |||
| Health Systems | ||||
| President — | ||||
| Franklin & Marshall College | Director — Drexel | |||
| (July 2002–July 2010) | Morgan & Co. | |||
| Director, Audit Committee | ||||
| Member — vTv | ||||
| Therapeutics LLC | ||||
| Director — FS Credit Real | ||||
Estate Income Trust, Inc.
| ||||
| Private Investor | 62 | None | ||
(2004–Present)
| ||||
| Chief Executive Officer — | 62 | Trust Manager and | ||
| Banco Itaú | Audit Committee | |||
| International | Member — Camden | |||
| (April 2012–December 2016) | Property Trust | |||
| Executive Advisor to Dean | ||||
| (August 2011–March 2012) | ||||
| and Interim Dean | ||||
| (January 2011–July 2011) — | ||||
| University of Miami School of | ||||
| Business Administration | ||||
| President — U.S. Trust, | ||||
| Bank of America Private | ||||
| Wealth Management | ||||
| (Private Banking) | ||||
(July 2007–December 2008)
| ||||
129
Table of Contents
Board of trustees / directors and officers addendum
Delaware FundsSM by Macquarie
Name, Address, and Birth Date | Position(s) Held with Fund(s) | Length of Time Served | ||
Independent Trustees (continued)
| ||||
Thomas K. Whitford 2005 Market Street Philadelphia, PA 19103 March 1956
| Trustee | Since January 2013 | ||
Janet L. Yeomans 2005 Market Street Philadelphia, PA 19103 July 1948
| Trustee | Since April 1999 | ||
Officers
| ||||
David F. Connor 2005 Market Street Philadelphia, PA 19103 December 1963 | Senior Vice President, General Counsel, and Secretary | Senior Vice President since May 2013; General Counsel since May 2015; Secretary since October 2005
| ||
Daniel V. Geatens 2005 Market Street Philadelphia, PA 19103 October 1972
| Vice President and Treasurer | Treasurer since October 2007 | ||
Richard Salus 2005 Market Street Philadelphia, PA 19103 October 1963
| Senior Vice President and Chief Financial Officer | Chief Financial Officer since November 2006 | ||
The Statement of Additional Information for the Fund(s) includes additional information about the Trustees and Officers and is available, without charge, upon request by calling 800 523-1918.
130
Table of Contents
Principal Occupation(s) During the Past Five Years | Number of Portfolios in Fund Complex Overseen by Trustee or Officer | Other Directorships Held by Trustee or Officer | ||
Vice Chairman (2010–April 2013) — PNC Financial Services Group
| 62 | Director — HSBC Finance North America Holdings Inc.
Director — HSBC USA Inc.
| ||
Vice President and Treasurer (January 2006–July 2012), Vice President — Mergers & Acquisitions (January 2003–January 2006), and Vice President and Treasurer (July 1995–January 2003) — 3M Company | 62 | Director, Personnel and Chair, and Member of Nominating, Investments, and Audit Committees — Okabena Company (2009–2014) | ||
David F. Connor has served in various capacities at different times at Macquarie Investment Management.
| 62 | None2 | ||
Daniel V. Geatens has served in various capacities at different times at Macquarie Investment Management.
| 62 | None2 | ||
Richard Salus has served in various executive capacities at different times at Macquarie Investment Management.
| 62 | None2 |
131
Table of Contents
Board of trustees
| Shawn K. Lytle | Ann D. Borowiec | John A. Fry | Frances A. | |||
| President and | Former Chief Executive | President | Sevilla-Sacasa | |||
| Chief Executive Officer | Officer | Drexel University | Former Chief Executive | |||
| Delaware FundsSM | Private Wealth Management | Philadelphia, PA | Officer | |||
| by Macquarie | J.P. Morgan Chase & Co. | Banco Itaú International | ||||
| Philadelphia, PA | New York, NY | Lucinda S. Landreth | Miami, FL | |||
| Former Chief Investment | ||||||
| Thomas L. Bennett | Joseph W. Chow | Officer | Thomas K. Whitford | |||
| Chairman of the Board | Former Executive Vice | Assurant, Inc. | Former Vice Chairman | |||
| Delaware Funds | President | New York, NY | PNC Financial Services Group | |||
| by Macquarie | State Street Corporation | Pittsburgh, PA | ||||
| Private Investor | Boston, MA | |||||
| Rosemont, PA | Janet L. Yeomans | |||||
| Former Vice President and | ||||||
| Treasurer | ||||||
| 3M Company | ||||||
| St. Paul, MN |
Affiliated officers
| David F. Connor | Daniel V. Geatens | Richard Salus | ||||
| Senior Vice President, | Vice President and | Senior Vice President and | ||||
| General Counsel, | Treasurer | Chief Financial Officer | ||||
| and Secretary | Delaware Funds | Delaware Funds | ||||
| Delaware Funds | by Macquarie | by Macquarie | ||||
| by Macquarie | Philadelphia, PA | Philadelphia, PA | ||||
| Philadelphia, PA |
This annual report is for the information of Delaware Tax-Free USA Fund, Delaware Tax-Free USA Intermediate Fund, and Delaware National High-Yield Municipal Bond Fund shareholders, but it may be used with prospective investors when preceded or accompanied by the Delaware Fund fact sheet for the most recently completed calendar quarter. These documents are available at delawarefunds.com/literature.
Each Fund files its complete schedule of portfolio holdings with the Securities and Exchange Commission (SEC) for the first and third quarters of each fiscal year on Form N-Q. Each Fund’s Forms N-Q, as well as a description of the policies and procedures that each Fund uses to determine how to vote proxies (if any) relating to portfolio securities are available without charge (i) upon request, by calling 800 523-1918; and (ii) on the SEC’s website at sec.gov. In addition, a description of the policies and procedures that the Funds use to determine how to vote proxies (if any) relating to portfolio securities and the Schedules of Investments included in the Funds’ most recent Forms N-Q are available without charge on the Funds’ website at delawarefunds.com/literature. Each Fund’s Forms N-Q may be reviewed and copied at the SEC’s Public Reference Room in Washington, D.C.; information on the operation of the Public Reference Room may be obtained by calling 800 SEC-0330.
Information (if any) regarding how the Funds voted proxies relating to portfolio securities during the most recently disclosed 12-month period ended June 30 is available without charge (i) through the Funds’ website at delawarefunds.com/proxy; and (ii) on the SEC’s website at sec.gov.
132
Item 2. Code of Ethics
The registrant has adopted a code of ethics that applies to the registrant’s principal executive officer, principal financial officer, principal accounting officer or controller, or persons performing similar functions, regardless of whether these individuals are employed by the registrant or a third party. A copy of the registrant’s Code of Business Ethics has been posted on the Delaware FundsSM by Macquarie Internet Web site at www.delawarefunds.com. Any amendments to the Code of Business Ethics, and information on any waiver from its provisions granted by the registrant, will also be posted on this Web site within five business days of such amendment or waiver and will remain on the Web site for at least 12 months.
Item 3. Audit Committee Financial Expert
The registrant’s Board of Trustees/Directors has determined that certain members of the registrant’s Audit Committee are audit committee financial experts, as defined below. For purposes of this item, an “audit committee financial expert” is a person who has the following attributes:
a. An understanding of generally accepted accounting principles and financial statements;
b. The ability to assess the general application of such principles in connection with the accounting for estimates, accruals, and reserves;
c. Experience preparing, auditing, analyzing, or evaluating financial statements that present a breadth and level of complexity of accounting issues that are generally comparable to the breadth and complexity of issues that can reasonably be expected to be raised by the registrant’s financial statements, or experience actively supervising one or more persons engaged in such activities;
d. An understanding of internal controls and procedures for financial reporting; and
e. An understanding of audit committee functions.
An “audit committee financial expert” shall have acquired such attributes through:
a. Education and experience as a principal financial officer, principal accounting officer, controller, public accountant, or auditor or experience in one or more positions that involve the performance of similar functions;
b. Experience actively supervising a principal financial officer, principal accounting officer, controller, public accountant, auditor, or person performing similar functions;
c. Experience overseeing or assessing the performance of companies or public accountants with respect to the preparation, auditing, or evaluation of financial statements; or
d. Other relevant experience.
The registrant’s Board of Trustees/Directors has also determined that each member of the registrant’s Audit Committee is independent. In order to be “independent” for purposes of this item, the Audit Committee member may not: (i) other than in his or her capacity as a member of the Board of Trustees/Directors or any committee thereof, accept directly or indirectly any consulting, advisory or other compensatory fee from the issuer; or (ii) be an “interested person” of the registrant as defined in Section 2(a)(19) of the Investment Company Act of 1940.
The names of the audit committee financial experts on the registrant’s Audit Committee are set forth below:
Joseph W. Chow
John A. Fry
Lucinda S. Landreth
Thomas K. Whitford
Item 4. Principal Accountant Fees and Services
(a) Audit fees.
The aggregate fees billed for services provided to the registrant by its independent auditors for the audit of the registrant’s annual financial statements and for services normally provided by the independent auditors in connection with statutory and regulatory filings or engagements were $78,000 for the fiscal year ended August 31, 2017.
The aggregate fees billed for services provided to the registrant by its independent auditors for the audit of the registrant’s annual financial statements and for services normally provided by the independent auditors in connection with statutory and regulatory filings or engagements were $78,000 for the fiscal year ended August 31, 2016.
(b) Audit-related fees.
The aggregate fees billed by the registrant’s independent auditors for services relating to the performance of the audit of the registrant’s financial statements and not reported under paragraph (a) of this Item were $0 for the fiscal year ended August 31, 2017.
The aggregate fees billed by the registrant’s independent auditors for services relating to the performance of the audit of the financial statements of the registrant’s investment adviser and other service providers under common control with the adviser and that relate directly to the operations or financial reporting of the registrant were $640,000 for the registrant’s fiscal year ended August 31, 2017. The percentage of these fees relating to services approved by the registrant’s Audit Committee pursuant to the de minimis exception from the pre-approval requirement in Rule 2-01(c)(7)(i)(C) of Regulation S-X was 0%. These audit-related services were as follows: year end audit procedures, group reporting and subsidiary statutory audits.
The aggregate fees billed by the registrant’s independent auditors for services relating to the performance of the audit of the registrant’s financial statements and not reported under paragraph (a) of this Item were $0 for the fiscal year ended August 31, 2016.
The aggregate fees billed by the registrant’s independent auditors for services relating to the performance of the audit of the financial statements of the registrant’s investment adviser and other service providers under common control with the adviser and that relate directly to the operations or financial reporting of the registrant were $667,000 for the registrant’s fiscal year ended August 31, 2016. The percentage of these fees relating to services approved by the registrant’s Audit Committee pursuant to the de minimis exception from the pre-approval requirement in Rule 2-01(c)(7)(i)(C) of Regulation S-X was 0%. These audit-related services were as follows: year end audit procedures, group reporting and subsidiary statutory audits.
(c) Tax fees.
The aggregate fees billed by the registrant’s independent auditors for tax-related services provided to the registrant were $9,454 for the fiscal year ended August 31, 2017. The percentage of these fees relating to services approved by the registrant’s Audit Committee pursuant to the de minimis exception from the pre-approval requirement in Rule 2-01(c)(7)(i)(C) of Regulation S-X was 0%. These tax-related services were as follows: review of income tax returns and review of annual excise distribution calculations.
The aggregate fees billed by the registrant’s independent auditors for tax-related services provided to the registrant’s investment adviser and other service providers under common control with the adviser and that relate directly to the operations or financial reporting of the registrant were $0 for the registrant’s fiscal year ended August 31, 2017. The percentage of these fees relating to services approved by the registrant’s Audit Committee pursuant to the de minimis exception from the pre-approval requirement in Rule 2-01(c)(7)(i)(C) of Regulation S-X was 0%.
The aggregate fees billed by the registrant’s independent auditors for tax-related services provided to the registrant were $9,168 for the fiscal year ended August 31, 2016. The percentage of these fees relating to services approved by the registrant’s Audit Committee pursuant to the de minimis exception from the pre-approval requirement in Rule 2-01(c)(7)(i)(C) of Regulation S-X was 0%. These tax-related services were as follows: review of income tax returns and review of annual excise distribution calculations.
The aggregate fees billed by the registrant’s independent auditors for tax-related services provided to the registrant’s investment adviser and other service providers under common control with the adviser and that relate directly to the operations or financial reporting of the registrant were $0 for the registrant’s fiscal year ended August 31, 2016. The percentage of these fees relating to services approved by the registrant’s Audit Committee pursuant to the de minimis exception from the pre-approval requirement in Rule 2-01(c)(7)(i)(C) of Regulation S-X was 0%.
(d) All other fees.
The aggregate fees billed for all services provided by the independent auditors to the registrant other than those set forth in paragraphs (a), (b) and (c) of this Item were $0 for the fiscal year ended August 31, 2017.
The aggregate fees billed for all services other than those set forth in paragraphs (b) and (c) of this Item provided by the registrant’s independent auditors to the registrant’s adviser and other service providers under common control with the adviser and that relate directly to the operations or financial reporting of the registrant were $0 for the registrant’s fiscal year ended August 31, 2017. The percentage of these fees relating to services approved by the registrant’s Audit Committee pursuant to the de minimis exception from the pre-approval requirement in Rule 2-01(c)(7)(i)(C) of Regulation S-X was 0%.
The aggregate fees billed for all services provided by the independent auditors to the registrant other than those set forth in paragraphs (a), (b) and (c) of this Item were $0 for the fiscal year ended August 31, 2016.
The aggregate fees billed for all services other than those set forth in paragraphs (b) and (c) of this Item provided by the registrant’s independent auditors to the registrant’s adviser and other service providers under common control with the adviser and that relate directly to the operations or financial reporting of the registrant were $0 for the registrant’s fiscal year ended August 31, 2016. The percentage of these fees relating to services approved by the registrant’s Audit Committee pursuant to the de minimis exception from the pre-approval requirement in Rule 2-01(c)(7)(i)(C) of Regulation S-X was 0%.
(e) The registrant’s Audit Committee has established pre-approval policies and procedures as permitted by Rule 2-01(c)(7)(i)(B) of Regulation S-X (the “Pre-Approval Policy”) with respect to services provided by the registrant’s independent auditors. Pursuant to the Pre-Approval Policy, the Audit Committee has pre-approved the services set forth in the table below with respect to the registrant up to the specified fee limits. Certain fee limits are based on aggregate fees to the registrant and other registrants within the Delaware FundsSM by Macquarie.
| Service | Range of Fees |
| Audit Services | |
| Statutory audits or financial audits for new Funds | up to $40,000 per Fund |
Services associated with SEC registration statements (e.g., Form N-1A, Form N-14, etc.), periodic reports and other documents filed with the SEC or other documents issued in connection with securities offerings (e.g., comfort letters for closed-end Fund offerings, consents), and assistance in responding to SEC comment letters | up to $10,000 per Fund |
Consultations by Fund management as to the accounting or disclosure treatment of transactions or events and/or the actual or potential impact of final or proposed rules, standards or interpretations by the SEC, FASB, or other regulatory or standard-setting bodies (Note: Under SEC rules, some consultations may be considered “audit-related services” rather than “audit services”) | up to $25,000 in the aggregate |
Audit-Related Services | |
Consultations by Fund management as to the accounting or disclosure treatment of transactions or events and /or the actual or potential impact of final or proposed rules, standards or interpretations by the SEC, FASB, or other regulatory or standard-setting bodies (Note: Under SEC rules, some consultations may be considered “audit services” rather than “audit-related services”) | up to $25,000 in the aggregate |
Tax Services | |
U.S. federal, state and local and international tax planning and advice (e.g., consulting on statutory, regulatory or administrative developments, evaluation of Funds’ tax compliance function, etc.) | up to $25,000 in the aggregate |
U.S. federal, state and local tax compliance (e.g., excise distribution reviews, etc.) | up to $5,000 per Fund |
Review of federal, state, local and international income, franchise and other tax returns | up to $5,000 per Fund |
Under the Pre-Approval Policy, the Audit Committee has also pre-approved the services set forth in the table below with respect to the registrant’s investment adviser and other entities controlling, controlled by or under common control with the investment adviser that provide ongoing services to the registrant (the “Control Affiliates”) up to the specified fee limit. This fee limit is based on aggregate fees to the investment adviser and its Control Affiliates.
| Service | Range of Fees |
| Non-Audit Services | |
| Services associated with periodic reports and other documents filed with the SEC and assistance in responding to SEC comment letters | up to $10,000 in the aggregate |
The Pre-Approval Policy requires the registrant’s independent auditors to report to the Audit Committee at each of its regular meetings regarding all services initiated since the last such report was rendered, including those services authorized by the Pre-Approval Policy.
(f) Not applicable.
(g) The aggregate non-audit fees billed by the registrant’s independent auditors for services rendered to the registrant and to its investment adviser and other service providers under common control with the adviser were $11,180,000 and $10,036,000 for the registrant’s fiscal years ended August 31, 2017 and August 31, 2016, respectively.
(h) In connection with its selection of the independent auditors, the registrant’s Audit Committee has considered the independent auditors’ provision of non-audit services to the registrant’s investment adviser and other service providers under common control with the adviser that were not required to be pre-approved pursuant to Rule 2-01(c)(7)(ii) of Regulation S-X. The Audit Committee has determined that the independent auditors’ provision of these services is compatible with maintaining the auditors’ independence.
Item 5. Audit Committee of Listed Registrants
Not applicable.
Item 6. Investments
(a) Included as part of report to shareholders filed under Item 1 of this Form N-CSR.
(b) Divestment of securities in accordance with Section 13(c) of the Investment Company Act of 1940.
Not applicable.
Item 7. Disclosure of Proxy Voting Policies and Procedures for Closed-End Management Investment Companies
Not applicable.
Item 8. Portfolio Managers of Closed-End Management Investment Companies
Not applicable.
Item 9. Purchases of Equity Securities by Closed-End Management Investment Company and Affiliated Purchasers
Not applicable.
Item 10. Submission of Matters to a Vote of Security Holders
Not applicable.
Item 11. Controls and Procedures
The registrant’s principal executive officer and principal financial officer have evaluated the registrant’s disclosure controls and procedures within 90 days of the filing of this report and have concluded that they are effective in providing reasonable assurance that the information required to be disclosed by the registrant in its reports or statements filed under the Securities Exchange Act of 1934 is recorded, processed, summarized and reported within the time periods specified in the rules and forms of the Securities and Exchange Commission.
There were no significant changes in the registrant’s internal control over financial reporting that occurred during the second fiscal quarter of the period covered by the report to stockholders included herein (i.e., the registrant’s fourth fiscal quarter) that have materially affected, or are reasonably likely to materially affect, the registrant’s internal control over financial reporting.
Item 12. Exhibits
| (a) | (1) Code of Ethics |
| Not applicable. | |
(2) Certifications of Principal Executive Officer and Principal Financial Officer pursuant to Rule 30a-2 under the Investment Company Act of 1940 are attached hereto as Exhibit 99.CERT. | |
(3) Written solicitations to purchase securities pursuant to Rule 23c-1 under the Securities Exchange Act of 1934. | |
Not applicable. | |
| (b) | Certifications pursuant to Section 906 of the Sarbanes-Oxley Act of 2002 are furnished herewith as Exhibit 99.906CERT. |
SIGNATURES
Pursuant to the requirements of the Securities Exchange Act of 1934 and the Investment Company Act of 1940, the registrant has duly caused this report to be signed on its behalf, by the undersigned, thereunto duly authorized.
DELAWARE GROUP® TAX-FREE FUND
| SHAWN K. LYTLE | |
| By: | Shawn K. Lytle |
| Title: | President and Chief Executive Officer |
| Date: | November 6, 2017 |
Pursuant to the requirements of the Securities Exchange Act of 1934 and the Investment Company Act of 1940, this report has been signed below by the following persons on behalf of the registrant and in the capacities and on the dates indicated.
| SHAWN K. LYTLE | |
| By: | Shawn K. Lytle |
| Title: | President and Chief Executive Officer |
| Date: | November 6, 2017 |
| RICHARD SALUS | |
| By: | Richard Salus |
| Title: | Chief Financial Officer |
| Date: | November 6, 2017 |