Exhibit 99.3

| 3rd Quarter 2010 Results |
| Third Quarter 2010 2 Forward-Looking Statements This presentation contains forward-looking statements based on our current expectations, and neither Pinnacle West nor APS assumes any obligation to update these statements, even if our internal estimates change, except as required by applicable law. These forward-looking statements are often identified by words such as "estimate," "predict," "may," "believe," "plan," "expect," "require," "intend," "assume" and similar words. Because actual results may differ materially from expectations, we caution you not to place undue reliance on these statements. A number of factors could cause future results to differ materially from historical results, or from outcomes currently expected or sought by Pinnacle West or APS. In addition to the Risk Factors described in Item 1A of the Pinnacle West/APS Annual Report on Form 10-K for the fiscal year ended December 31, 2009, these factors include, but are not limited to: regulatory and judicial decisions, developments and proceedings; our ability to achieve timely and adequate rate recovery of our costs; our ability to reduce capital expenditures and other costs while maintaining reliability and customer service levels; variations in demand for electricity, including those due to weather, the general economy, customer and sales growth (or decline), and the effects of energy conservation measures; power plant performance and outages; volatile fuel and purchased power costs; fuel and water supply availability; new legislation or regulation including those relating to greenhouse gas emissions, renewable energy mandates and energy efficiency standards; our ability to meet renewable energy requirements and recover related costs, including returns on debt and equity capital; risks inherent in the operation of nuclear facilities, including spent fuel disposal uncertainty; competition in retail and wholesale power markets; the duration and severity of the economic decline in Arizona and current credit, financial and real estate market conditions; the cost of debt and equity capital and the ability to access capital markets when required; restrictions on dividends or other burdensome provisions in our credit agreements and Arizona Corporation Commission orders; our ability, or the ability of our subsidiaries, to meet debt service obligations; changes to our credit ratings; the investment performance of the assets of our nuclear decommissioning trust, pension, and other postretirement benefit plans and the resulting impact on future funding requirements; the liquidity of wholesale power markets and the use of derivative contracts in our business; potential shortfalls in insurance coverage; new accounting requirements or new interpretations of existing requirements; generation transmission and distribution facility and system conditions and operating costs; the ability to meet the anticipated future need for additional baseload generation and associated transmission facilities in our region; the willingness or ability of our counterparties and power plant participants to meet contractual or other obligations; technological developments affecting the electric industry; and economic and other conditions affecting SunCor Development Company's ability to dispose of its remaining assets and satisfy its debt obligations. |
| Third Quarter 2010 3 In this presentation, references to net income and earnings per share refer to amounts attributable to common shareholders.We present "regulated electricity segment gross margin" per diluted share of common stock. Regulated electricity segment gross margin refers to regulated electricity segment revenues less regulated electricity segment fuel and purchased power expenses. Regulated electricity segment gross margin is a "non-GAAP financial measure," as defined in accordance with SEC rules. The Appendix contains a reconciliation of this non-GAAP financial measure to the referenced revenue and expense line items on our Condensed Consolidated Statements of Income, which are the most directly comparable financial measures calculated and presented in accordance with GAAP. We view regulated electricity segment gross margin as an important performance measure of the core profitability of our operations. We refer to "on-going earnings" in this presentation, which is also a non-GAAP financial measure. We believe on-going earnings provide investors with a useful indicator of our results that is comparable among periods because it excludes the effects of unusual items that may occur on an irregular basis. Slide 6 provides a reconciliation of on-going earnings to our reported earnings.Investors should note that these non-GAAP financial measures may involve judgments by management, including whether an item is classified as an unusual item. These measures are key components of our internal financial reporting and are used by our management in analyzing the operations of our business. We believe that investors benefit from having access to the same financial measures that management uses. Amounts Attributable to Common Shareholders and Non-GAAP Financial Measures |
| 4 CFO Agenda 3rd Quarter ResultsArizona Economic OutlookEarnings GuidanceFinancing and Liquidity Update Third Quarter 2010 |
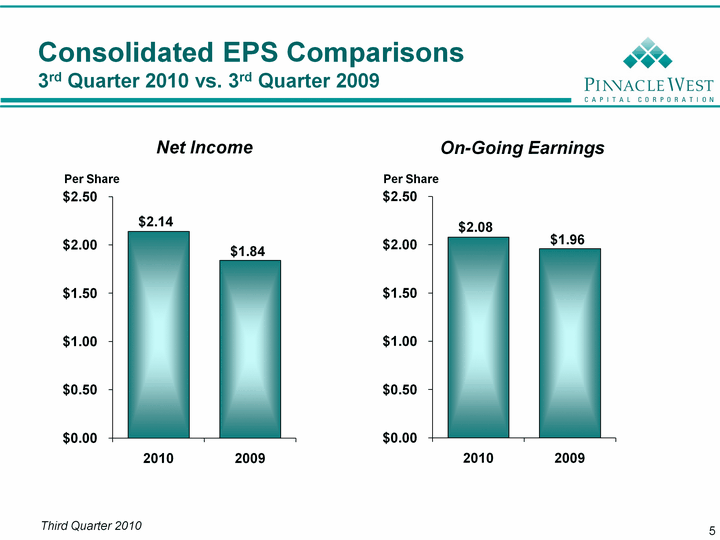
| 5 Consolidated EPS Comparisons 3rd Quarter 2010 vs. 3rd Quarter 2009 Per Share Per Share Net Income On-Going Earnings (CHART) Per Share Third Quarter 2010 |
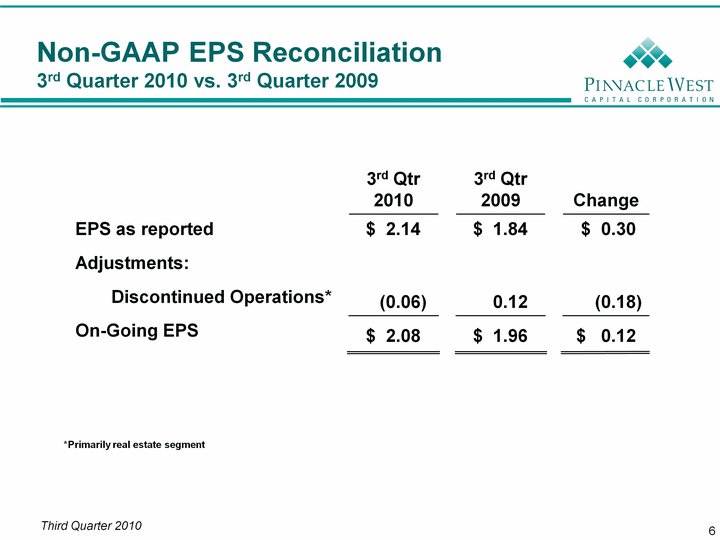
| 6 Non-GAAP EPS Reconciliation 3rd Quarter 2010 vs. 3rd Quarter 2009 3rd Quarter 2010 vs. 3rd Quarter 2009 3rd Quarter 2010 vs. 3rd Quarter 2009 Third Quarter 2010 *Primarily real estate segment |
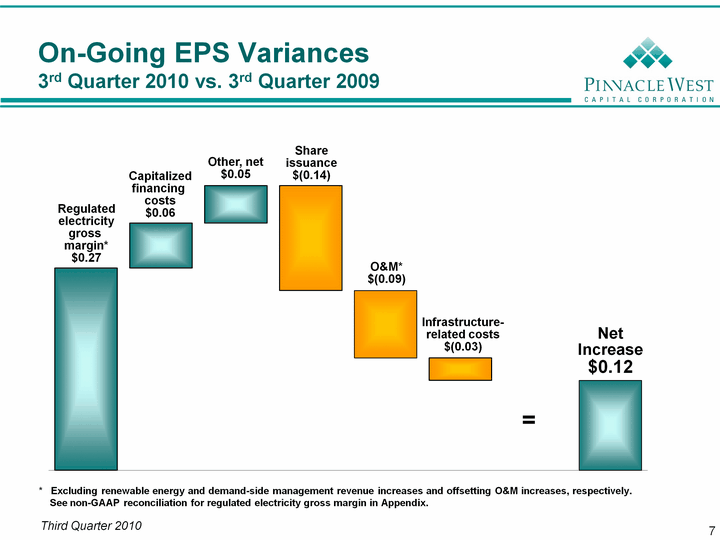
| 7 7 Regulated electricity gross margin*$0.27 Infra-structurerelated costs$0.03 Shareissuance $(0.14) Other, net$0.05 O&M*$(0.09) NetIncrease$0.12 = * Excluding renewable energy and demand-side management revenue increases and offsetting O&M increases, respectively. See non-GAAP reconciliation for regulated electricity gross margin in Appendix. On-Going EPS Variances 3rd Quarter 2010 vs. 3rd Quarter 2009 Third Quarter 2010 |
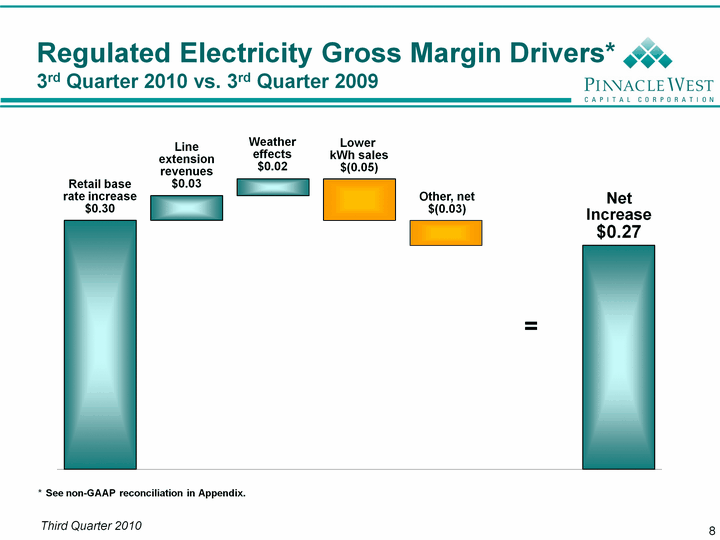
| 8 8 Regulated Electricity Gross Margin Drivers* 3rd Quarter 2010 vs. 3rd Quarter 2009 NetIncrease$0.27 = Weathereffects$0.02 Lower kWh sales$(0.05) Retail base rate increase$0.30 Line extension revenues$0.03 * See non-GAAP reconciliation in Appendix. Third Quarter 2010 Other, net$(0.03) |
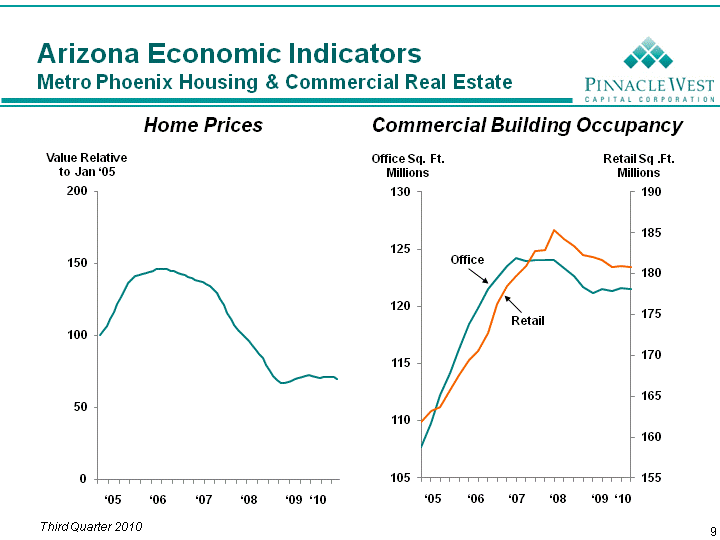
| 9 Arizona Economic Indicators Metro Phoenix Housing & Commercial Real Estate Value Relative to Jan '05 Home Prices Commercial Building Occupancy (CHART) Retail Sq .Ft.Millions Office Sq. Ft.Millions (CHART) Office Retail '05 '06 '07 '08 '09 '10 '05 '06 '07 '08 '09 '10 Third Quarter 2010 |
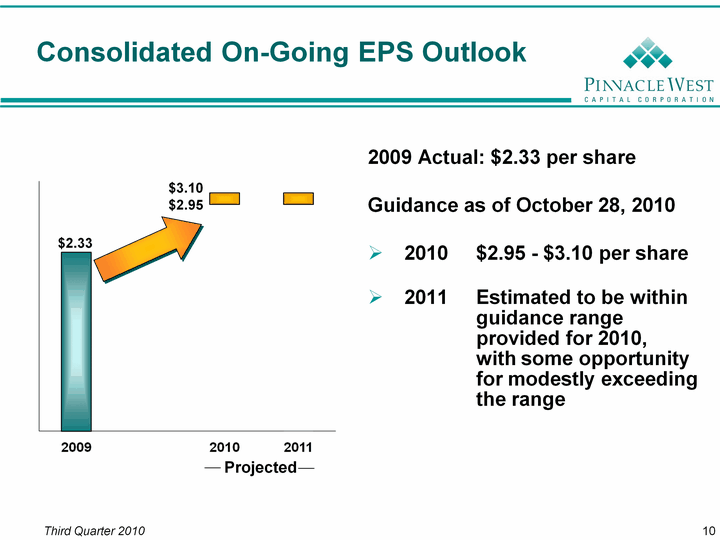
| Third Quarter 2010 10 2009 Actual: $2.33 per share Guidance as of October 28, 2010 2010 $2.95 - $3.10 per share 2011 Estimated to be within guidance range provided for 2010, with some opportunity for modestly exceeding the range Consolidated On-Going EPS Outlook $2.33 $2.95 $3.10 Projected |
| 11 CEO Discussion Arizona Regulatory UpdateRenewable ResourcesOperations Update Looking Ahead Third Quarter 2010 |
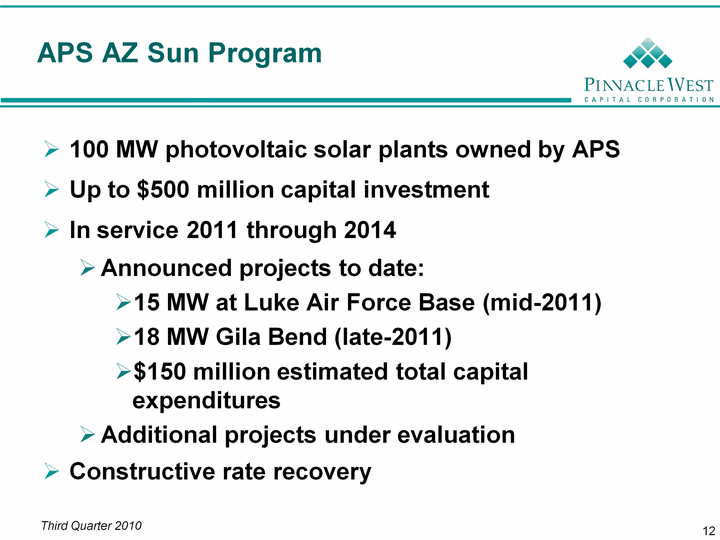
| 12 APS AZ Sun Program 100 MW photovoltaic solar plants owned by APSUp to $500 million capital investmentIn service 2011 through 2014Announced projects to date:15 MW at Luke Air Force Base (mid-2011)18 MW Gila Bend (late-2011)$150 million estimated total capital expendituresAdditional projects under evaluationConstructive rate recovery Third Quarter 2010 |
| 13 CEO Discussion Arizona Regulatory UpdateRenewable ResourcesOperations Update Looking Ahead Third Quarter 2010 |
| Appendix - 3Q '10 14 Appendix |
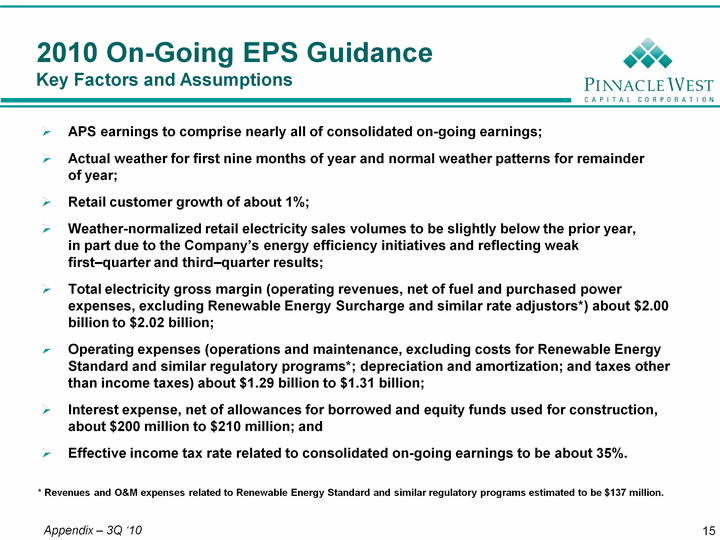
| 15 APS earnings to comprise nearly all of consolidated on-going earnings;Actual weather for first nine months of year and normal weather patterns for remainder of year;Retail customer growth of about 1%;Weather-normalized retail electricity sales volumes to be slightly below the prior year, in part due to the Company's energy efficiency initiatives and reflecting weak first-quarter and third-quarter results;Total electricity gross margin (operating revenues, net of fuel and purchased power expenses, excluding Renewable Energy Surcharge and similar rate adjustors*) about $2.00 billion to $2.02 billion;Operating expenses (operations and maintenance, excluding costs for Renewable Energy Standard and similar regulatory programs*; depreciation and amortization; and taxes other than income taxes) about $1.29 billion to $1.31 billion; Interest expense, net of allowances for borrowed and equity funds used for construction, about $200 million to $210 million; andEffective income tax rate related to consolidated on-going earnings to be about 35%. 2010 On-Going EPS Guidance Key Factors and Assumptions * Revenues and O&M expenses related to Renewable Energy Standard and similar regulatory programs estimated to be $137 million. Appendix - 3Q '10 |
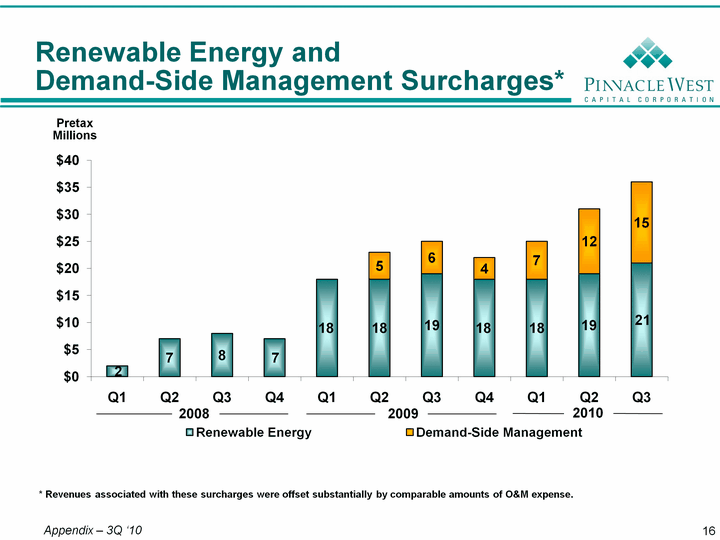
| 16 Renewable Energy and Demand-Side Management Surcharges* Demand-Side Management Surcharges* Demand-Side Management Surcharges* * Revenues associated with these surcharges were offset substantially by comparable amounts of O&M expense. 2008 Pretax Millions 2009 2010 Appendix - 3Q '10 |
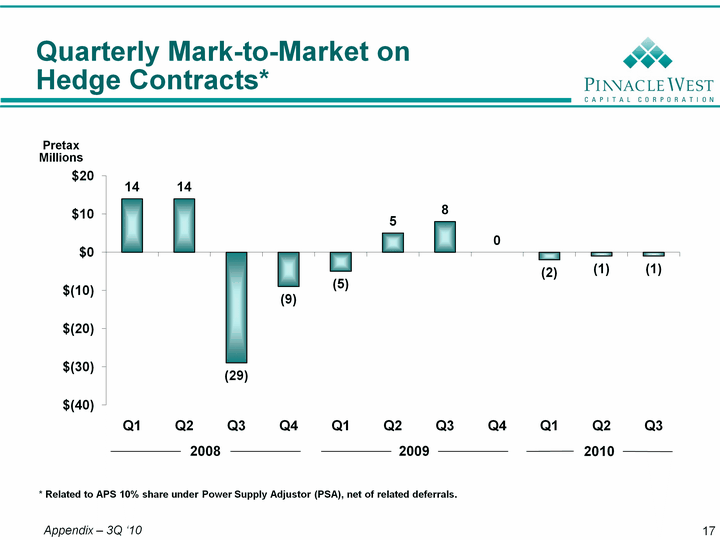
| 17 17 Quarterly Mark-to-Market on Hedge Contracts* PretaxMillions * Related to APS 10% share under Power Supply Adjustor (PSA), net of related deferrals. 2008 2009 2010 Appendix - 3Q '10 |
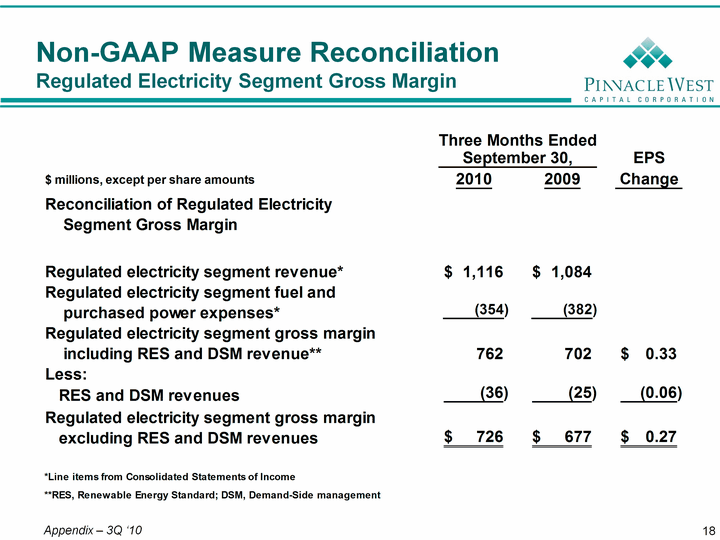
| Non-GAAP Measure Reconciliation Regulated Electricity Segment Gross Margin Appendix - 3Q '10 18 |