Exhibit 99.1
| DELIVERING SUPERIOR SHAREHOLDER VALUE 2013 RBC Capital Markets' Global Energy and Power Conference June 4, 2013 |

| FORWARD-LOOKING STATEMENTS 2 This presentation contains forward-looking statements based on current expectations, including statements regarding our earnings guidance and financial outlook and goals. These forward-looking statements are often identified by words such as “estimate,” “predict,” “may,” “believe,” “plan,” “expect,” “require,” “intend,” “assume” and similar words. Because actual results may differ materially from expectations, we caution you not to place undue reliance on these statements. A number of factors could cause future results to differ materially from historical results, or from outcomes currently expected or sought by Pinnacle West or APS. These factors include, but are not limited to: our ability to manage capital expenditures and operations and maintenance costs while maintaining reliability and customer service levels; variations in demand for electricity, including those due to weather, the general economy, customer and sales growth (or decline), and the effects of energy conservation measures and distributed generation; power plant and transmission system performance and outages; volatile fuel and purchased power costs; fuel and water supply availability; our ability to achieve timely and adequate rate recovery of our costs, including returns on debt and equity capital; regulatory and judicial decisions, developments and proceedings; new legislation or regulation, including those relating to environmental requirements and nuclear plant operations; our ability to meet renewable energy and energy efficiency mandates and recover related costs; risks inherent in the operation of nuclear facilities, including spent fuel disposal uncertainty; competition in retail and wholesale power markets; the duration and severity of the economic decline in Arizona and current real estate market conditions; the cost of debt and equity capital and the ability to access capital markets when required; changes to our credit ratings; the investment performance of the assets of our nuclear decommissioning trust, pension, and other postretirement benefit plans and the resulting impact on future funding requirements; the liquidity of wholesale power markets and the use of derivative contracts in our business; potential shortfalls in insurance coverage; new accounting requirements or new interpretations of existing requirements; generation, transmission and distribution facility and system conditions and operating costs; the ability to meet the anticipated future need for additional baseload generation and associated transmission facilities in our region; the willingness or ability of our counterparties, power plant participants and power plant land owners to meet contractual or other obligations or extend the rights for continued power plant operations; technological developments affecting the electric industry; and restrictions on dividends or other provisions in our credit agreements and Arizona Corporation Commission orders. These and other factors are discussed in Risk Factors described in Part I, Item 1A of the Pinnacle West/APS Annual Report on Form 10-K for the fiscal year ended December 31, 2012, which you should review carefully before placing any reliance on our financial statements, disclosures or earnings outlook. Neither Pinnacle West nor APS assumes any obligation to update these statements, even if our internal estimates change, except as required by law. |
| NON-GAAP FINANCIAL MEASURES 3 In this presentation, we refer to “on-going earnings per share,” which is a “non-GAAP financial measure,” as defined in accordance with SEC rules. We believe on-going earnings per share provides investors with a useful indicator of our results that is comparable among periods because it excludes the effects of unusual items that may occur on an irregular basis. The appendix contains a reconciliation of on-going earnings per share to our earnings per share attributable to common shareholders based on diluted common shares as reported on our Consolidated Statements of Income, which is the most directly comparable financial measures calculated and presented in accordance with generally accepted accounting principles in the United States of America (GAAP). Investors should note that non-GAAP financial measures may involve judgments by management, including whether an item is classified as an unusual item. These measures are key components of our internal financial reporting and are used by our management in analyzing the operations of our business. We believe that investors benefit from having access to the same financial measures that management uses. |

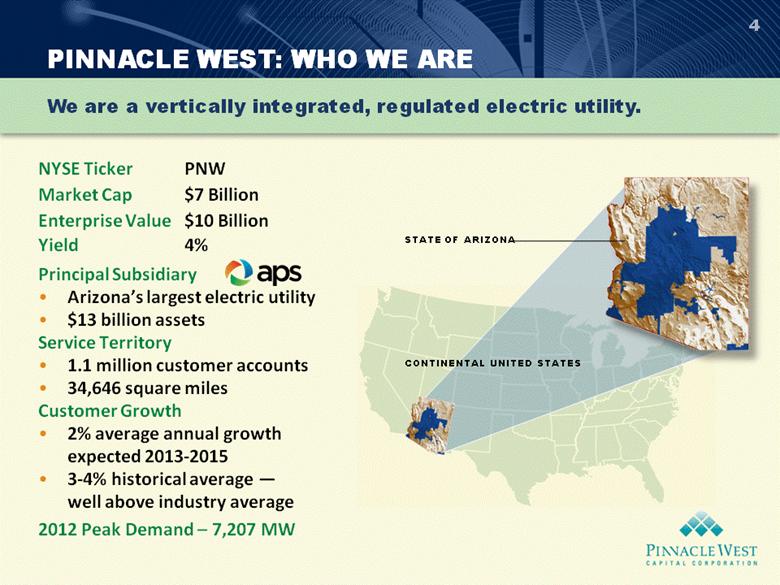
| 4 NYSE Ticker PNW Market Cap $7 Billion Enterprise Value $10 Billion Yield 4% Principal Subsidiary Arizona’s largest electric utility $13 billion assets Service Territory 1.1 million customer accounts 34,646 square miles Customer Growth 2% average annual growth expected 2013-2015 3-4% historical average — well above industry average 2012 Peak Demand – 7,207 MW CONTINENTAL UNITED STATES STATE OF ARIZONA PINNACLE WEST: WHO WE ARE We are a vertically integrated, regulated electric utility. |
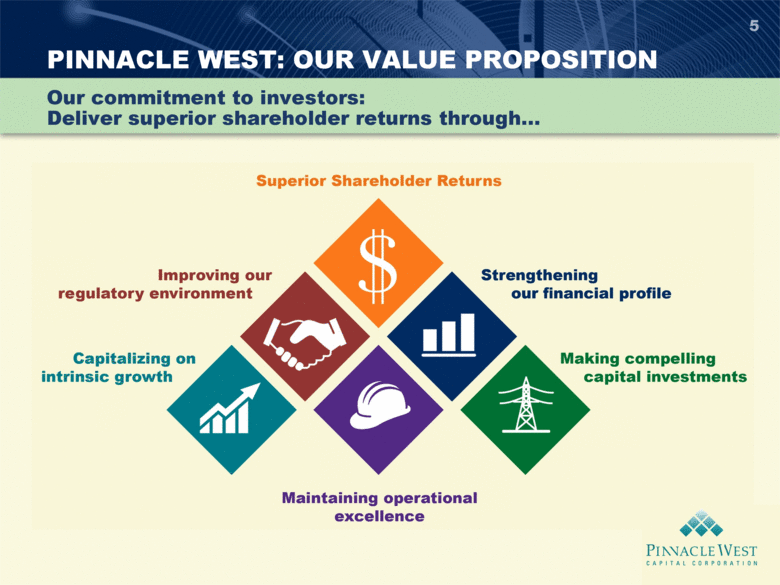
| 5 Our commitment to investors: Deliver superior shareholder returns through... PINNACLE WEST: OUR VALUE PROPOSITION |
| PINNACLE WEST: OUR VALUE PROPOSITION 6 |
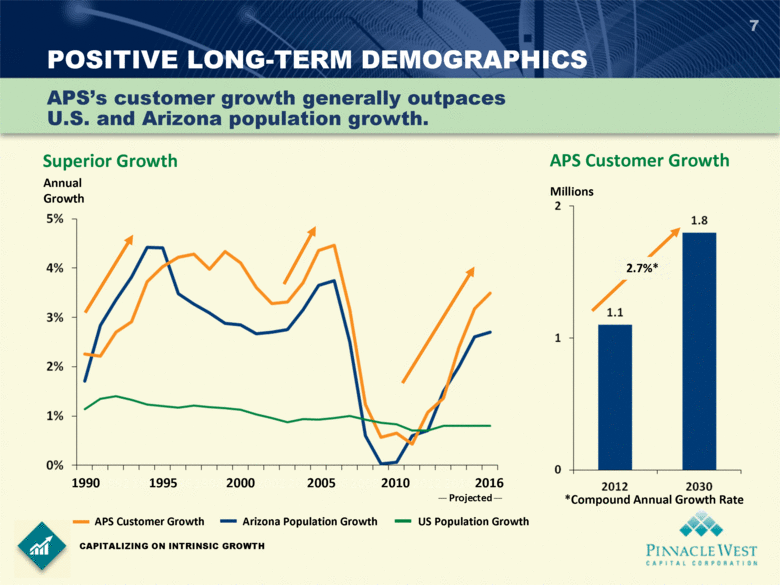
| POSITIVE LONG-TERM DEMOGRAPHICS 7 CAPITALIZING ON INTRINSIC GROWTH Superior Growth APS’s customer growth generally outpaces U.S. and Arizona population growth. Annual Growth 1990 1995 2000 2005 2010 2016 Projected APS Customer Growth Arizona Population Growth US Population Growth 2.7%* Millions APS Customer Growth *Compound Annual Growth Rate |
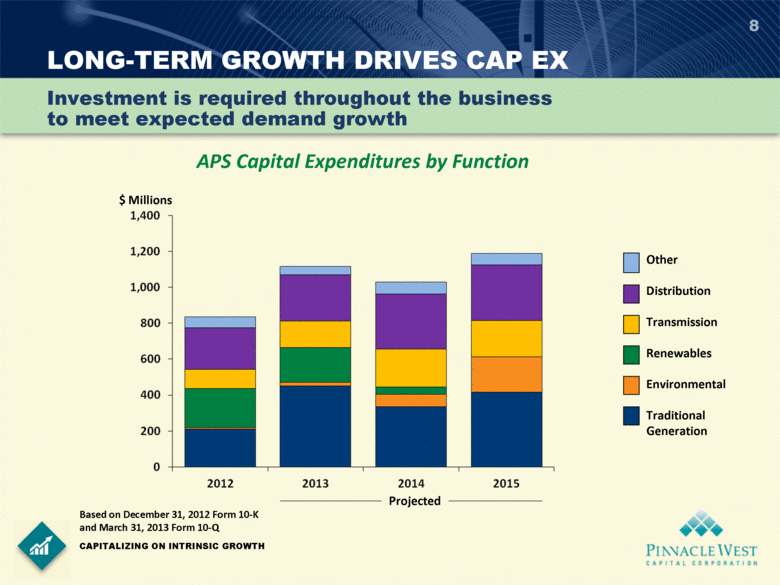
| 8 Investment is required throughout the business to meet expected demand growth LONG-TERM GROWTH DRIVES CAP EX CAPITALIZING ON INTRINSIC GROWTH APS Capital Expenditures by Function Other Distribution Transmission Renewables Environmental Traditional Generation Projected $ Millions Based on December 31, 2012 Form 10-K and March 31, 2013 Form 10-Q |
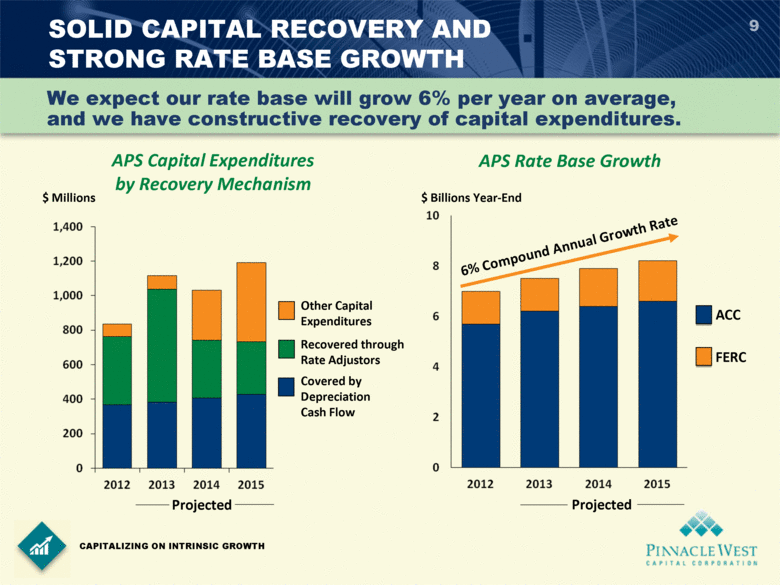
| SOLID CAPITAL RECOVERY AND STRONG RATE BASE GROWTH 9 We expect our rate base will grow 6% per year on average, and we have constructive recovery of capital expenditures. CAPITALIZING ON INTRINSIC GROWTH $ Billions Year-End Projected APS Rate Base Growth 6% Compound Annual Growth Rate ACC FERC Other Capital Expenditures Recovered through Rate Adjustors Covered by Depreciation Cash Flow $ Millions APS Capital Expenditures by Recovery Mechanism Projected |
| PINNACLE WEST: OUR VALUE PROPOSITION 10 |
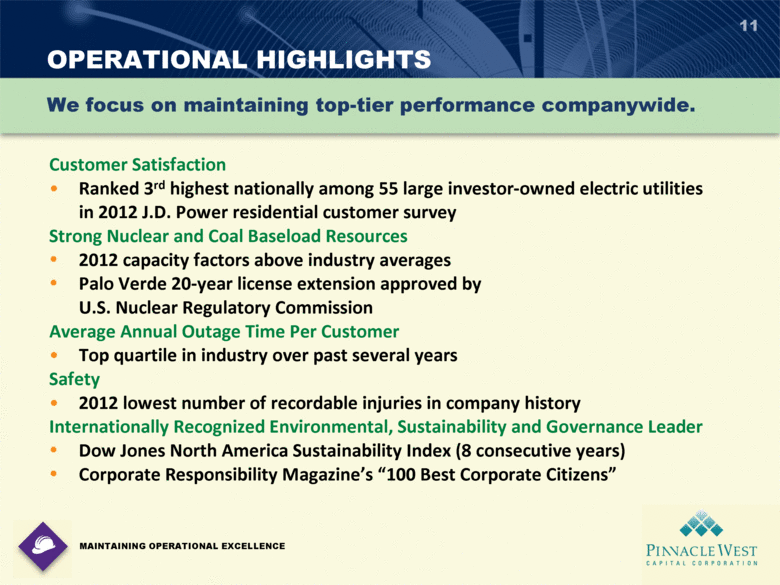
| OPERATIONAL HIGHLIGHTS 11 Customer Satisfaction Ranked 3rd highest nationally among 55 large investor-owned electric utilities in 2012 J.D. Power residential customer survey Strong Nuclear and Coal Baseload Resources 2012 capacity factors above industry averages Palo Verde 20-year license extension approved by U.S. Nuclear Regulatory Commission Average Annual Outage Time Per Customer Top quartile in industry over past several years Safety 2012 lowest number of recordable injuries in company history Internationally Recognized Environmental, Sustainability and Governance Leader Dow Jones North America Sustainability Index (8 consecutive years) Corporate Responsibility Magazine’s “100 Best Corporate Citizens” We focus on maintaining top-tier performance companywide. MAINTAINING OPERATIONAL EXCELLENCE |
| PINNACLE WEST: OUR VALUE PROPOSITION 12 |
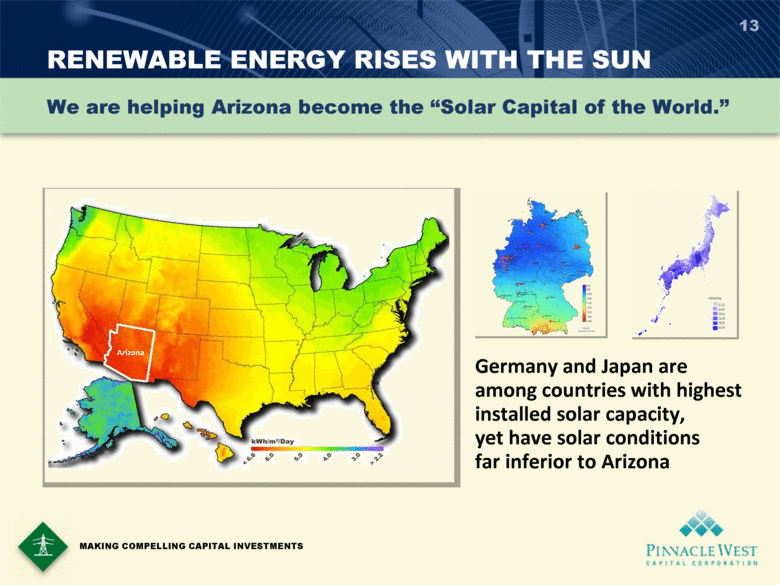
| RENEWABLE ENERGY RISES WITH THE SUN 13 We are helping Arizona become the “Solar Capital of the World.” Germany and Japan are among countries with highest installed solar capacity, yet have solar conditions far inferior to Arizona MAKING COMPELLING CAPITAL INVESTMENTS Arizona Arizona |
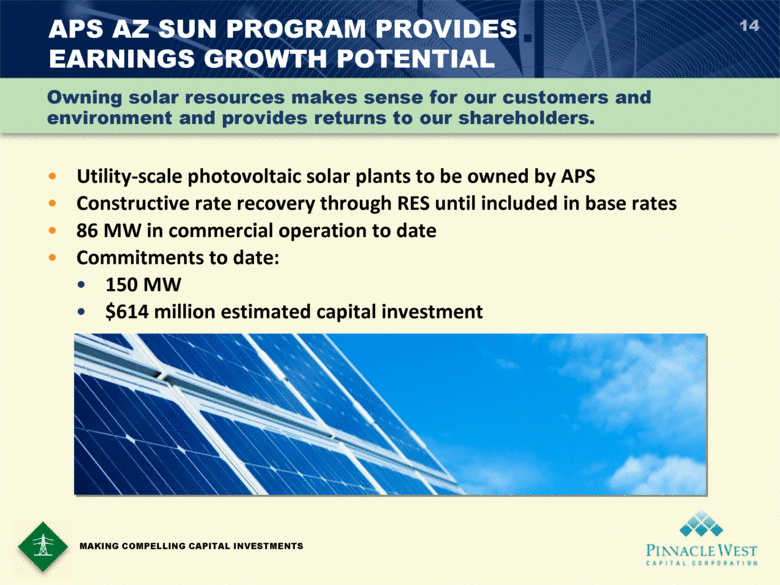
| APS AZ SUN PROGRAM PROVIDES EARNINGS GROWTH POTENTIAL Utility-scale photovoltaic solar plants to be owned by APS Constructive rate recovery through RES until included in base rates 86 MW in commercial operation to date Commitments to date: 150 MW $614 million estimated capital investment 14 MAKING COMPELLING CAPITAL INVESTMENTS Owning solar resources makes sense for our customers and environment and provides returns to our shareholders. |
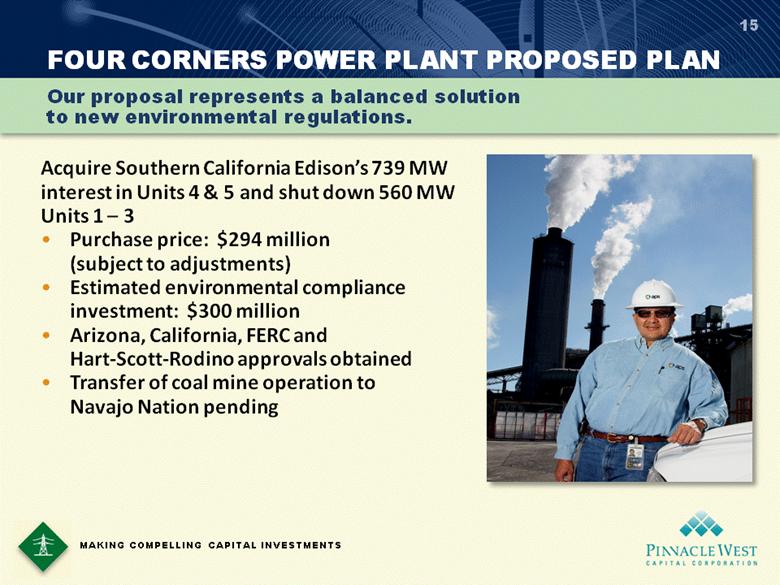
| 15 MAKING COMPELLING CAPITAL INVESTMENTS FOUR CORNERS POWER PLANT PROPOSED PLAN Our proposal represents a balanced solution to new environmental regulations. Acquire Southern California Edison’s 739 MW interest in Units 4 & 5 and shut down 560 MW Units 1 – 3 Purchase price: $294 million (subject to adjustments) Estimated environmental compliance investment: $300 million Arizona, California, FERC and Hart-Scott-Rodino approvals obtained Transfer of coal mine operation to Navajo Nation pending |
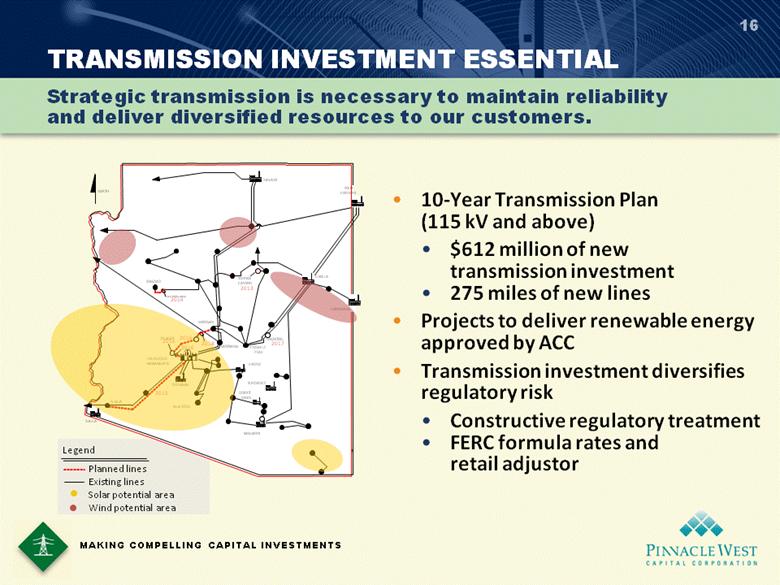
| 100 MW 970 MW 1032 MW 350 MW 4300 MW 1005 MW Legend NORTH SAGUARO N . GILA PALO VERDE - HASSAYAMPA YUCCA GILA BEND REDHAWK KYRENE WESTWING BAGDAD 2018 PINNACLE PEAK CHOLLA NAVAJO . 2016 CORONADO YOUNGS CANYON 2013 SUNDANCE FOUR CORNERS DESERT BASIN Line Relocation 2014 Planned lines Existing lines Solar potential area Wind potential area 2016 DELANEY 2016 MAZATZAL 2017 MORGAN 2015 TRANSMISSION INVESTMENT ESSENTIAL 16 Strategic transmission is necessary to maintain reliability and deliver diversified resources to our customers. MAKING COMPELLING CAPITAL INVESTMENTS 10-Year Transmission Plan (115 kV and above) $612 million of new transmission investment 275 miles of new lines Projects to deliver renewable energy approved by ACC Transmission investment diversifies regulatory risk Constructive regulatory treatment FERC formula rates and retail adjustor |
| PINNACLE WEST: OUR VALUE PROPOSITION 17 |
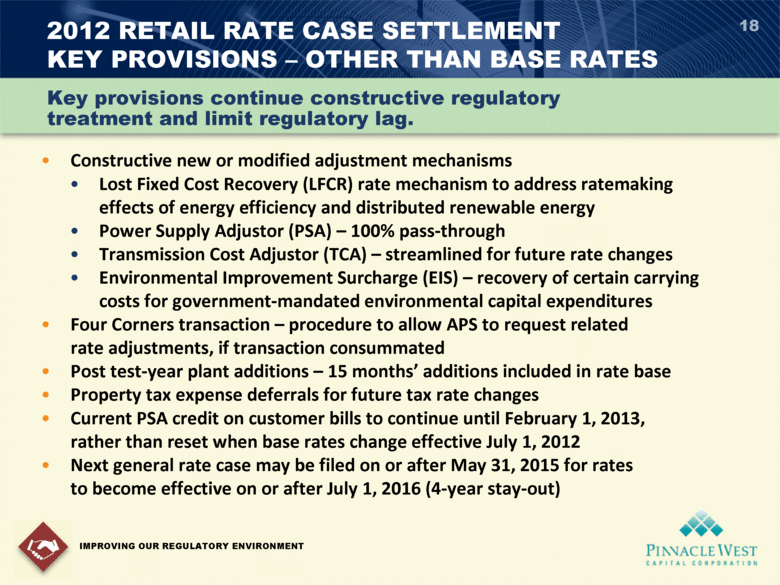
| 2012 RETAIL RATE CASE SETTLEMENT KEY PROVISIONS – OTHER THAN BASE RATES 18 Constructive new or modified adjustment mechanisms Lost Fixed Cost Recovery (LFCR) rate mechanism to address ratemaking effects of energy efficiency and distributed renewable energy Power Supply Adjustor (PSA) – 100% pass-through Transmission Cost Adjustor (TCA) – streamlined for future rate changes Environmental Improvement Surcharge (EIS) – recovery of certain carrying costs for government-mandated environmental capital expenditures Four Corners transaction – procedure to allow APS to request related rate adjustments, if transaction consummated Post test-year plant additions – 15 months’ additions included in rate base Property tax expense deferrals for future tax rate changes Current PSA credit on customer bills to continue until February 1, 2013, rather than reset when base rates change effective July 1, 2012 Next general rate case may be filed on or after May 31, 2015 for rates to become effective on or after July 1, 2016 (4-year stay-out) IMPROVING OUR REGULATORY ENVIRONMENT Key provisions continue constructive regulatory treatment and limit regulatory lag. |
| PINNACLE WEST: OUR VALUE PROPOSITION 19 |
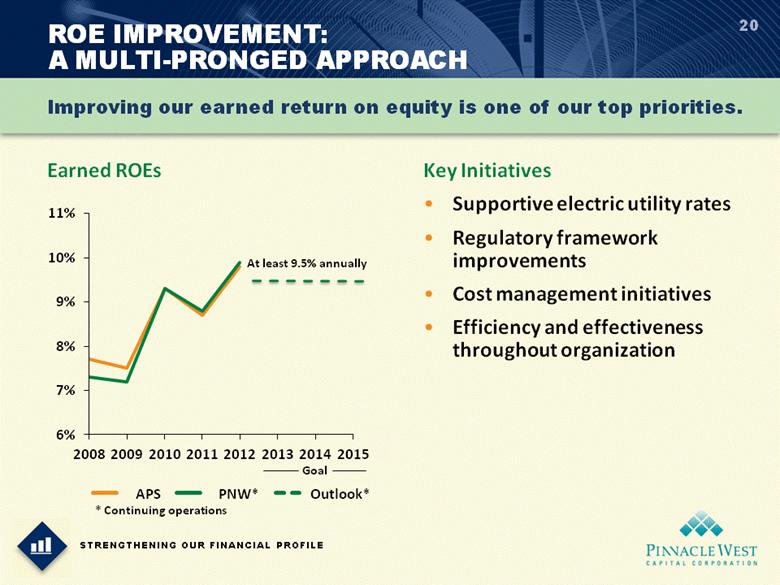
| 20 Improving our earned return on equity is one of our top priorities. Earned ROEs Key Initiatives Supportive electric utility rates Regulatory framework improvements Cost management initiatives Efficiency and effectiveness throughout organization STRENGTHENING OUR FINANCIAL PROFILE ROE IMPROVEMENT: A MULTI-PRONGED APPROACH * Continuing operations APS PNW* Outlook* At least 9.5% annually Goal |
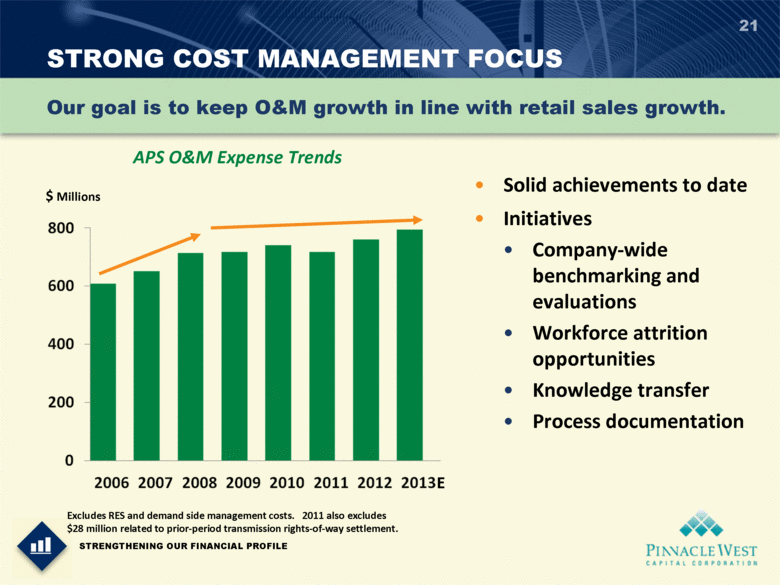
| 21 Our goal is to keep O&M growth in line with retail sales growth. STRENGTHENING OUR FINANCIAL PROFILE STRONG COST MANAGEMENT FOCUS Solid achievements to date Initiatives Company-wide benchmarking and evaluations Workforce attrition opportunities Knowledge transfer Process documentation Excludes RES and demand side management costs. 2011 also excludes $28 million related to prior-period transmission rights-of-way settlement. APS O&M Expense Trends $ Millions |
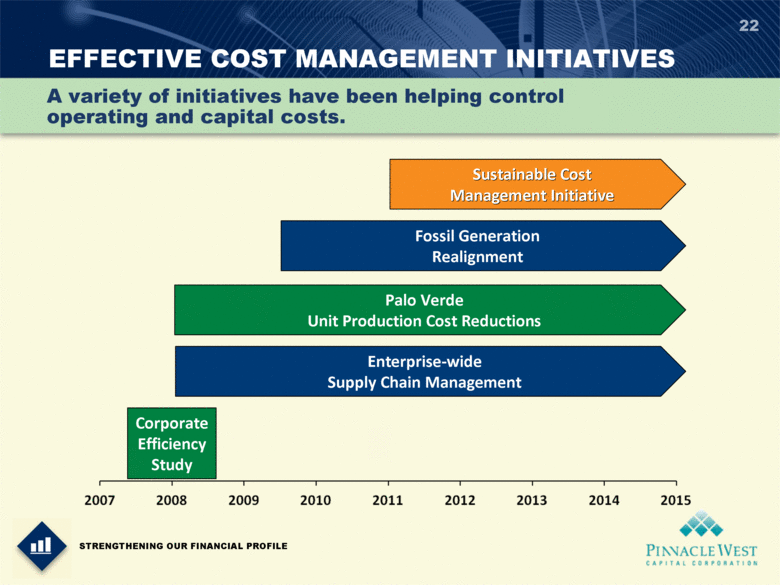
| 22 A variety of initiatives have been helping control operating and capital costs. STRENGTHENING OUR FINANCIAL PROFILE EFFECTIVE COST MANAGEMENT INITIATIVES Enterprise-wide Supply Chain Management Corporate Efficiency Study Fossil Generation Realignment Palo Verde Unit Production Cost Reductions Sustainable Cost Management Initiative |
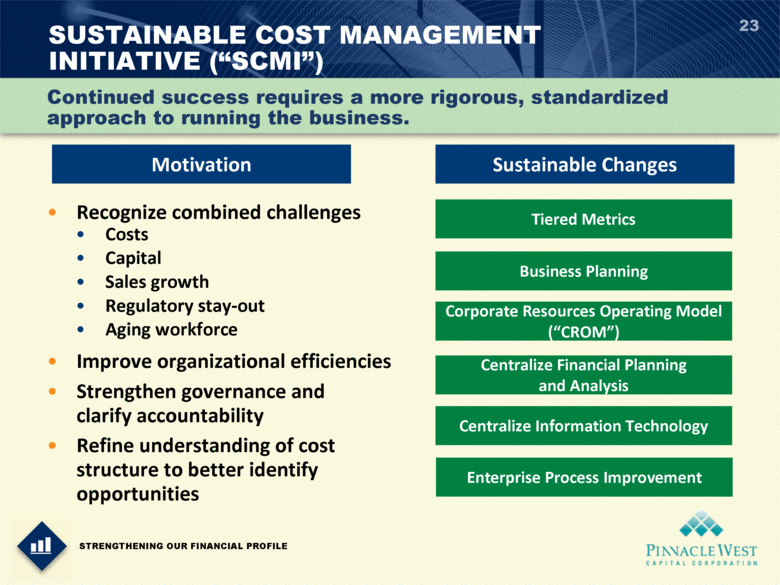
| 23 Continued success requires a more rigorous, standardized approach to running the business. STRENGTHENING OUR FINANCIAL PROFILE SUSTAINABLE COST MANAGEMENT INITIATIVE (“SCMI”) Recognize combined challenges Costs Capital Sales growth Regulatory stay-out Aging workforce Improve organizational efficiencies Strengthen governance and clarify accountability Refine understanding of cost structure to better identify opportunities Motivation Sustainable Changes Tiered Metrics Business Planning Corporate Resources Operating Model (“CROM”) Centralize Financial Planning and Analysis Centralize Information Technology Enterprise Process Improvement |
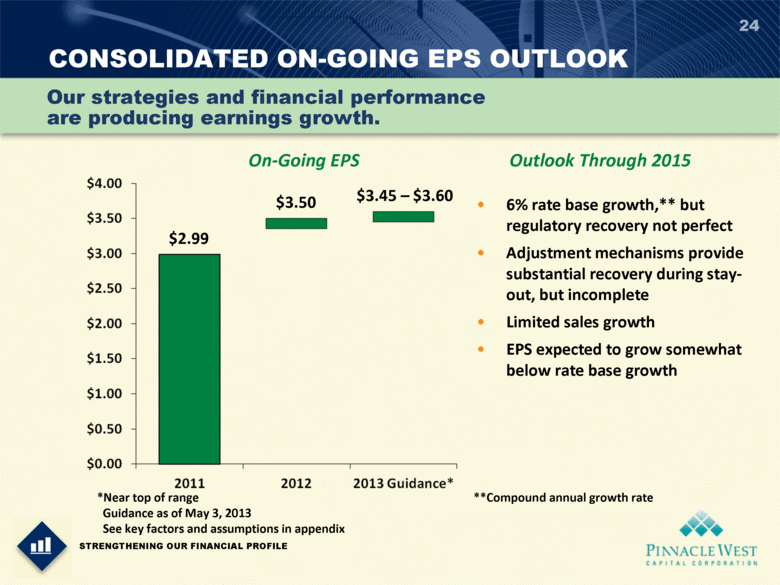
| CONSOLIDATED ON-GOING EPS OUTLOOK 24 STRENGTHENING OUR FINANCIAL PROFILE Our strategies and financial performance are producing earnings growth. On-Going EPS *Near top of range Guidance as of May 3, 2013 See key factors and assumptions in appendix $2.99 $3.50 $3.45 – $3.60 Outlook Through 2015 6% rate base growth,** but regulatory recovery not perfect Adjustment mechanisms provide substantial recovery during stay-out, but incomplete Limited sales growth EPS expected to grow somewhat below rate base growth **Compound annual growth rate |
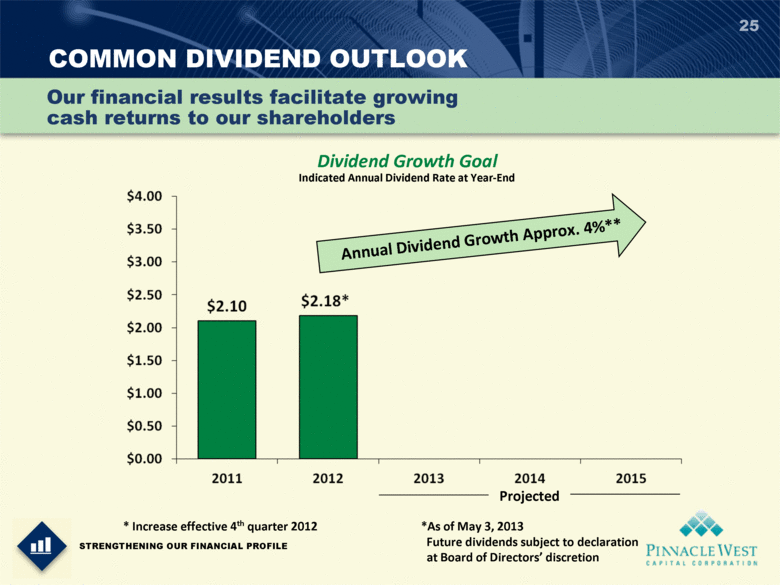
| 25 STRENGTHENING OUR FINANCIAL PROFILE COMMON DIVIDEND OUTLOOK Our financial results facilitate growing cash returns to our shareholders Dividend Growth Goal Indicated Annual Dividend Rate at Year-End * Increase effective 4th quarter 2012 Annual Dividend Growth Approx. 4%** *As of May 3, 2013 Future dividends subject to declaration at Board of Directors’ discretion Projected |
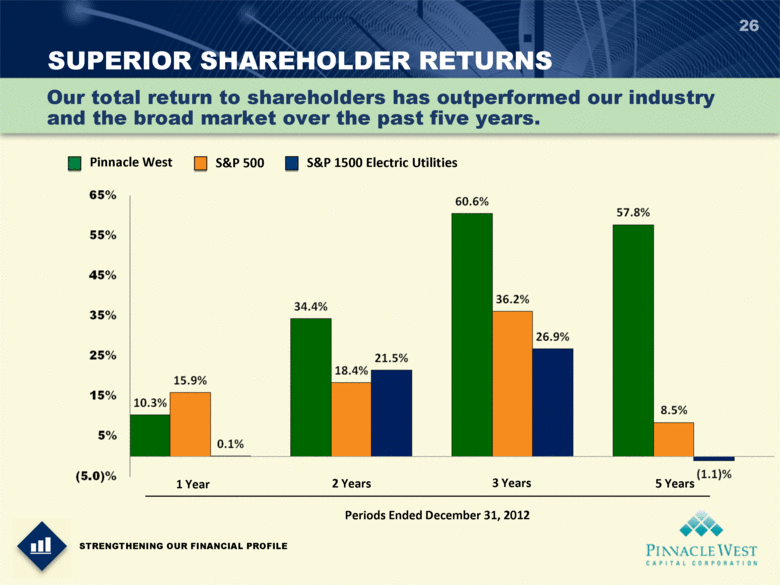
| SUPERIOR SHAREHOLDER RETURNS 26 Our total return to shareholders has outperformed our industry and the broad market over the past five years. STRENGTHENING OUR FINANCIAL PROFILE Pinnacle West S&P 500 S&P 1500 Electric Utilities 1 Year 2 Years 3 Years 5 Years Periods Ended December 31, 2012 |
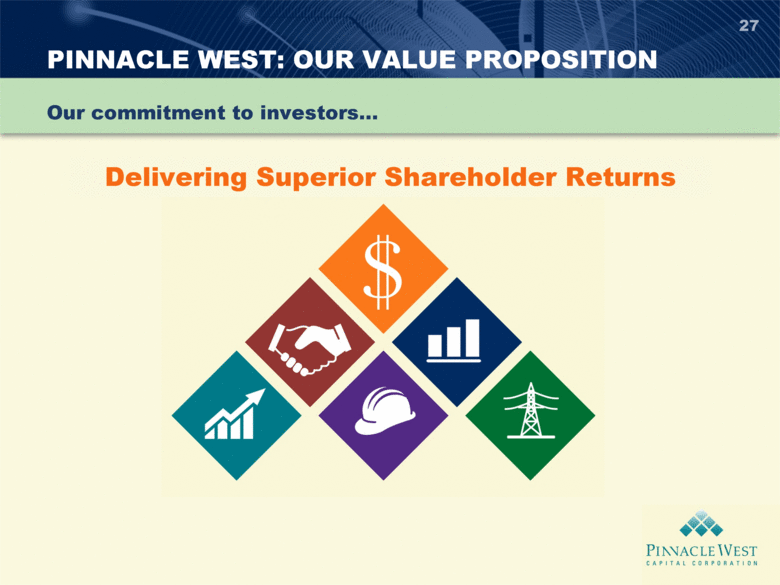
| PINNACLE WEST: OUR VALUE PROPOSITION 27 Our commitment to investors... Delivering Superior Shareholder Returns |
| APPENDIX |

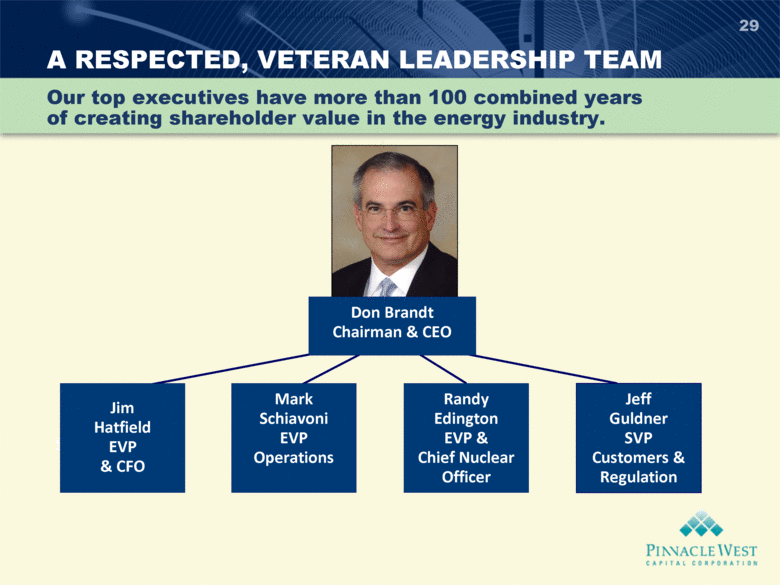
| A RESPECTED, VETERAN LEADERSHIP TEAM Jim Hatfield SVP & CFO 29 Our top executives have more than 100 combined years of creating shareholder value in the energy industry. Don Brandt Chairman & CEO Mark Schiavoni EVP Operations Jeff Guldner SVP Customers & Regulation Randy Edington EVP & Chief Nuclear Officer Jim Hatfield EVP & CFO |
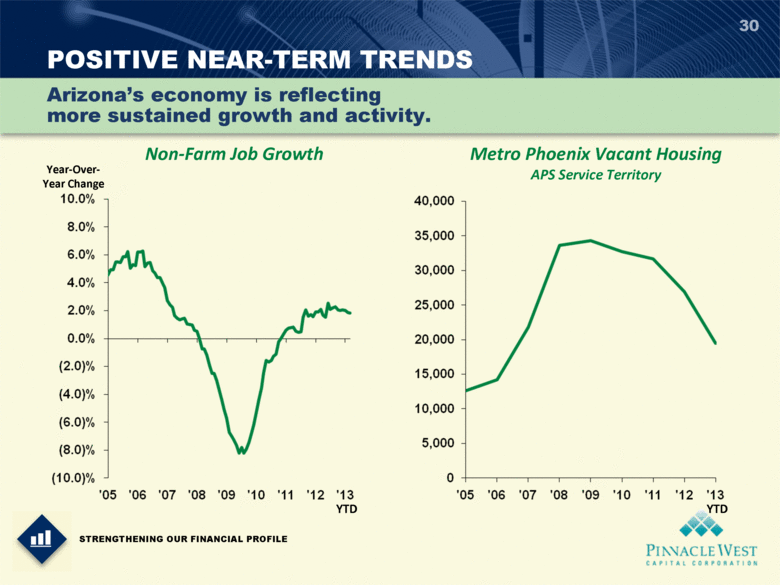
| 30 Arizona’s economy is reflecting more sustained growth and activity. STRENGTHENING OUR FINANCIAL PROFILE POSITIVE NEAR-TERM TRENDS Non-Farm Job Growth Year-Over- Year Change Metro Phoenix Vacant Housing APS Service Territory YTD YTD |
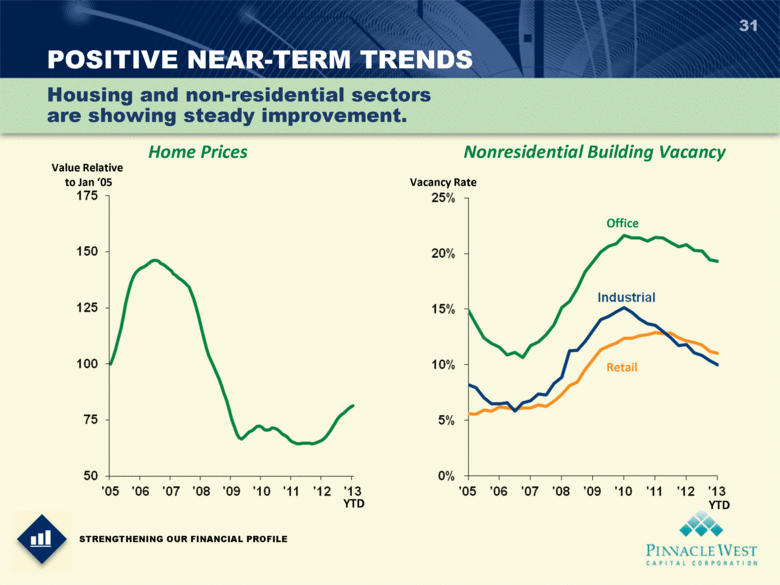
| 31 Housing and non-residential sectors are showing steady improvement. STRENGTHENING OUR FINANCIAL PROFILE POSITIVE NEAR-TERM TRENDS Value Relative to Jan ‘05 Home Prices Nonresidential Building Vacancy YTD YTD Vacancy Rate Office Retail |
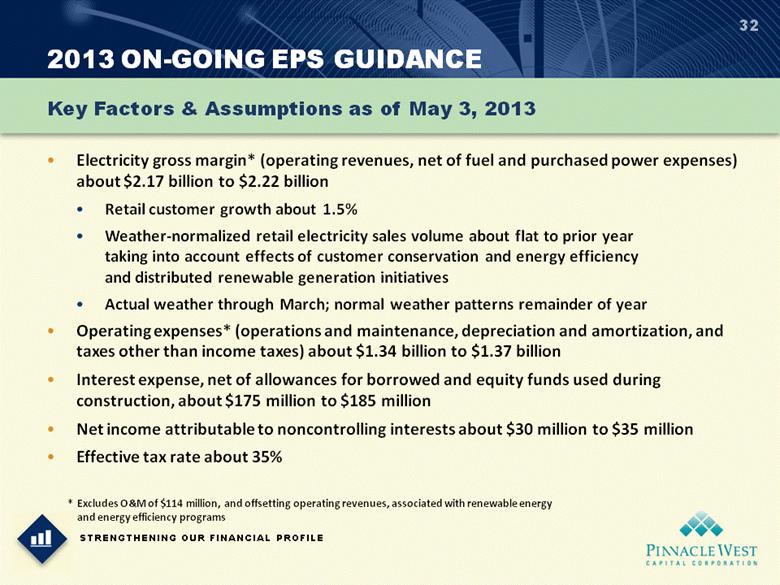
| 32 Key Factors & Assumptions as of May 3, 2013 STRENGTHENING OUR FINANCIAL PROFILE 2013 ON-GOING EPS GUIDANCE Electricity gross margin* (operating revenues, net of fuel and purchased power expenses) about $2.17 billion to $2.22 billion Retail customer growth about 1.5% Weather-normalized retail electricity sales volume about flat to prior year taking into account effects of customer conservation and energy efficiency and distributed renewable generation initiatives Actual weather through March; normal weather patterns remainder of year Operating expenses* (operations and maintenance, depreciation and amortization, and taxes other than income taxes) about $1.34 billion to $1.37 billion Interest expense, net of allowances for borrowed and equity funds used during construction, about $175 million to $185 million Net income attributable to noncontrolling interests about $30 million to $35 million Effective tax rate about 35% * Excludes O&M of $114 million, and offsetting operating revenues, associated with renewable energy and energy efficiency programs |
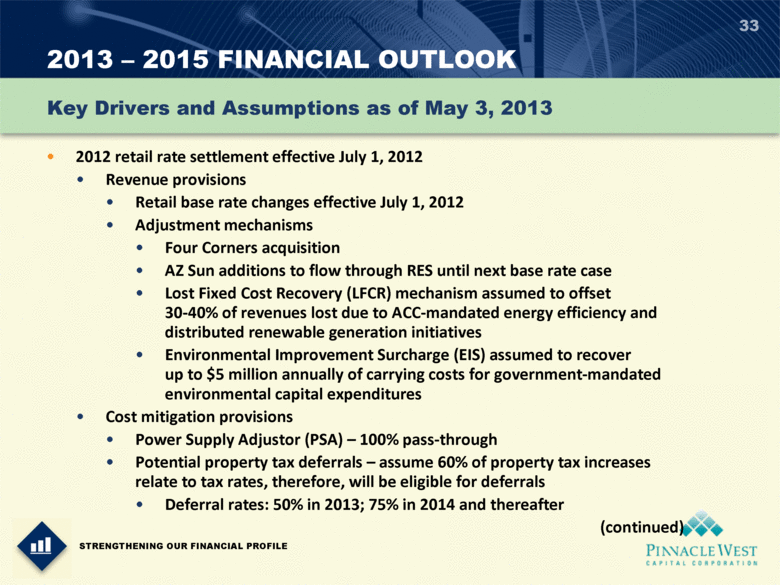
| 2013 – 2015 FINANCIAL OUTLOOK 33 2012 retail rate settlement effective July 1, 2012 Revenue provisions Retail base rate changes effective July 1, 2012 Adjustment mechanisms Four Corners acquisition AZ Sun additions to flow through RES until next base rate case Lost Fixed Cost Recovery (LFCR) mechanism assumed to offset 30-40% of revenues lost due to ACC-mandated energy efficiency and distributed renewable generation initiatives Environmental Improvement Surcharge (EIS) assumed to recover up to $5 million annually of carrying costs for government-mandated environmental capital expenditures Cost mitigation provisions Power Supply Adjustor (PSA) – 100% pass-through Potential property tax deferrals – assume 60% of property tax increases relate to tax rates, therefore, will be eligible for deferrals Deferral rates: 50% in 2013; 75% in 2014 and thereafter (continued) Key Drivers and Assumptions as of May 3, 2013 STRENGTHENING OUR FINANCIAL PROFILE |
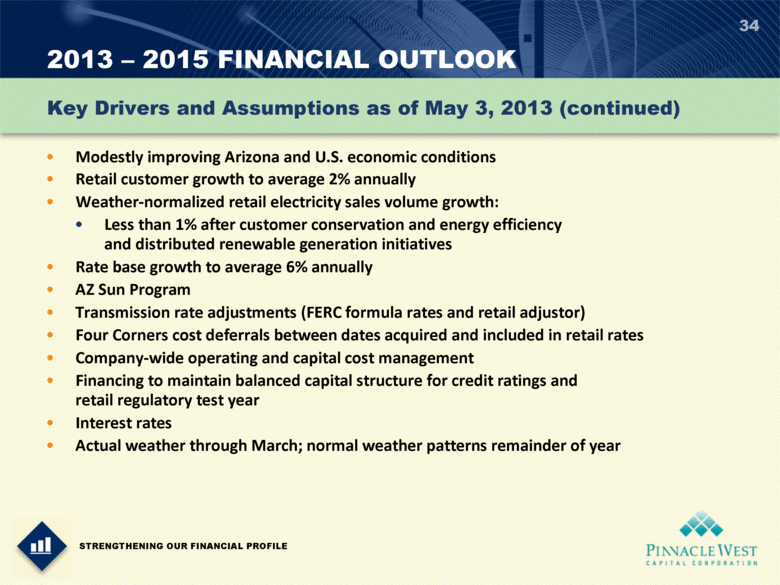
| 2013 – 2015 FINANCIAL OUTLOOK 34 Key Drivers and Assumptions as of May 3, 2013 (continued) Modestly improving Arizona and U.S. economic conditions Retail customer growth to average 2% annually Weather-normalized retail electricity sales volume growth: Less than 1% after customer conservation and energy efficiency and distributed renewable generation initiatives Rate base growth to average 6% annually AZ Sun Program Transmission rate adjustments (FERC formula rates and retail adjustor) Four Corners cost deferrals between dates acquired and included in retail rates Company-wide operating and capital cost management Financing to maintain balanced capital structure for credit ratings and retail regulatory test year Interest rates Actual weather through March; normal weather patterns remainder of year STRENGTHENING OUR FINANCIAL PROFILE |
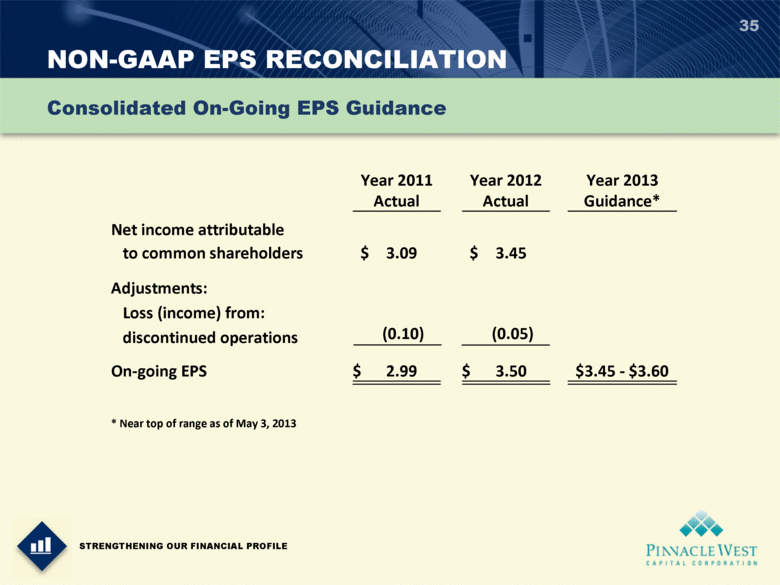
| NON-GAAP EPS RECONCILIATION 35 Consolidated On-Going EPS Guidance STRENGTHENING OUR FINANCIAL PROFILE Year 2011 Actual Year 2012 Actual Year 2013 Guidance* Net income attributable to common shareholders $ 3.09 $ 3.45 Adjustments: Loss (income) from: discontinued operations (0.10) (0.05) On-going EPS $ 2.99 $ 3.50 $3.45 - $3.60 * Near top of range as of May 3, 2013 |
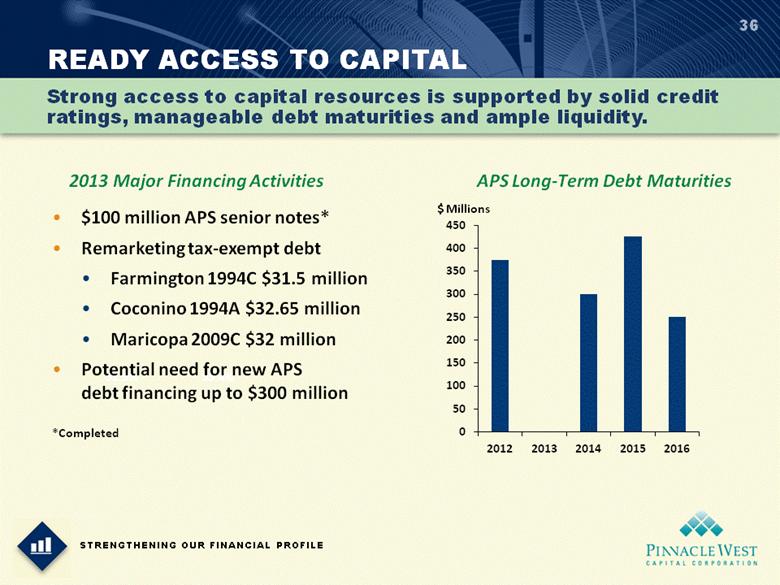
| READY ACCESS TO CAPITAL 36 Strong access to capital resources is supported by solid credit ratings, manageable debt maturities and ample liquidity. STRENGTHENING OUR FINANCIAL PROFILE 52.9% 55.4% 2013 Major Financing Activities $100 million APS senior notes* Remarketing tax-exempt debt Farmington 1994C $31.5 million Coconino 1994A $32.65 million Maricopa 2009C $32 million Potential need for new APS debt financing up to $300 million APS Long-Term Debt Maturities $ Millions *Completed |
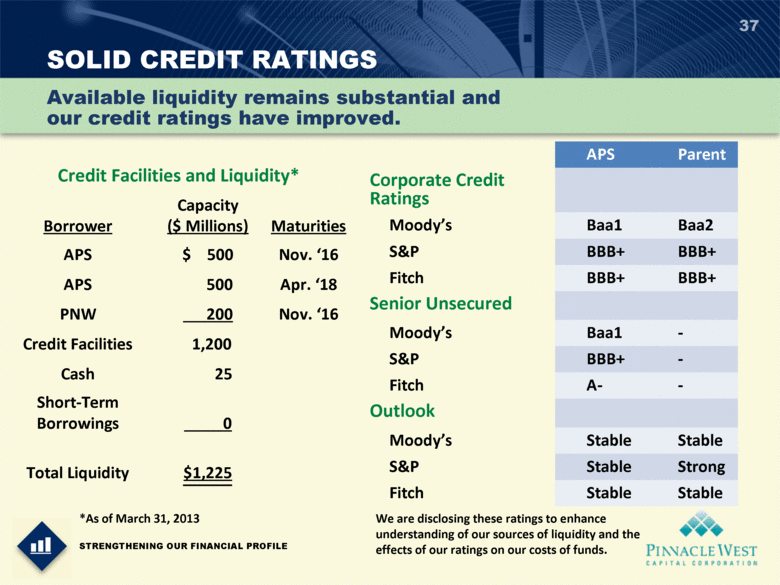
| SOLID CREDIT RATINGS 37 STRENGTHENING OUR FINANCIAL PROFILE Available liquidity remains substantial and our credit ratings have improved. We are disclosing these ratings to enhance understanding of our sources of liquidity and the effects of our ratings on our costs of funds. APS Parent Corporate Credit Ratings Moody’s Baa1 Baa2 S&P BBB+ BBB+ Fitch BBB+ BBB+ Senior Unsecured Moody’s Baa1 - S&P BBB+ - Fitch A- - Outlook Moody’s Stable Stable S&P Stable Strong Fitch Stable Stable Credit Facilities and Liquidity* Borrower Capacity ($ Millions) Maturities APS $ 500 Nov. ‘16 APS 500 Apr. ‘18 PNW 200 Nov. ‘16 Credit Facilities 1,200 Cash 25 Short-Term Borrowings 0 Total Liquidity $1,225 *As of March 31, 2013 |
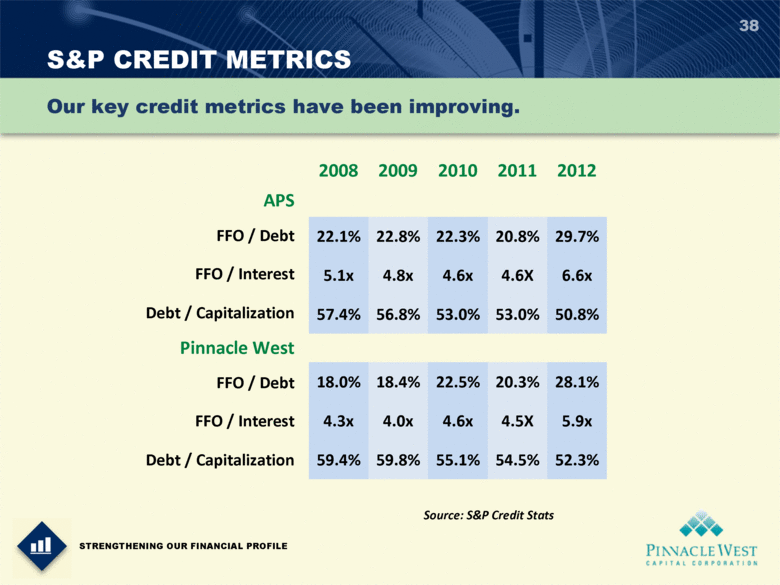
| S&P CREDIT METRICS 38 APS FFO / Debt FFO / Interest Debt / Capitalization Pinnacle West FFO / Debt FFO / Interest Debt / Capitalization Our key credit metrics have been improving. STRENGTHENING OUR FINANCIAL PROFILE 2008 2009 2010 2011 2012 22.1% 22.8% 22.3% 20.8% 29.7% 5.1x 4.8x 4.6x 4.6X 6.6x 57.4% 56.8% 53.0% 53.0% 50.8% 18.0% 18.4% 22.5% 20.3% 28.1% 4.3x 4.0x 4.6x 4.5X 5.9x 59.4% 59.8% 55.1% 54.5% 52.3% Source: S&P Credit Stats |
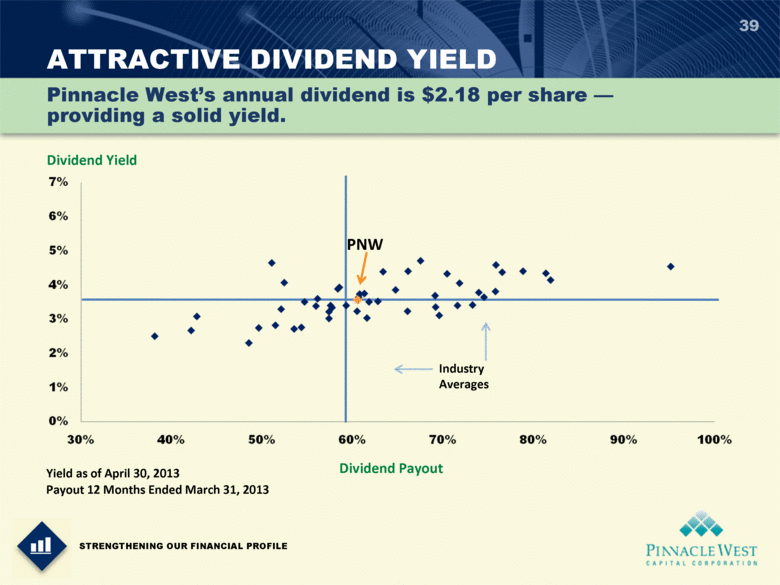
| ATTRACTIVE DIVIDEND YIELD 39 Dividend Yield Dividend Payout Industry Averages PNW Yield as of April 30, 2013 Payout 12 Months Ended March 31, 2013 Pinnacle West’s annual dividend is $2.18 per share — providing a solid yield. STRENGTHENING OUR FINANCIAL PROFILE |
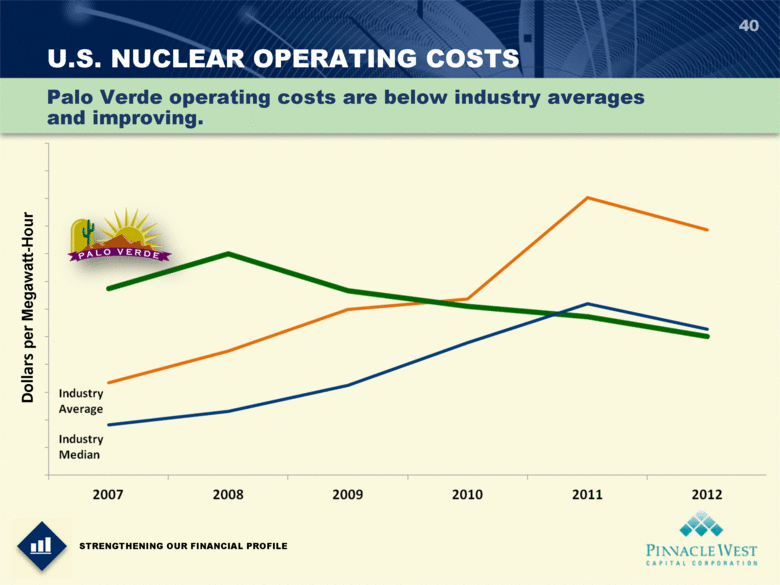
| 40 Palo Verde operating costs are below industry averages and improving. STRENGTHENING OUR FINANCIAL PROFILE Dollars per Megawatt-Hour U.S. NUCLEAR OPERATING COSTS |
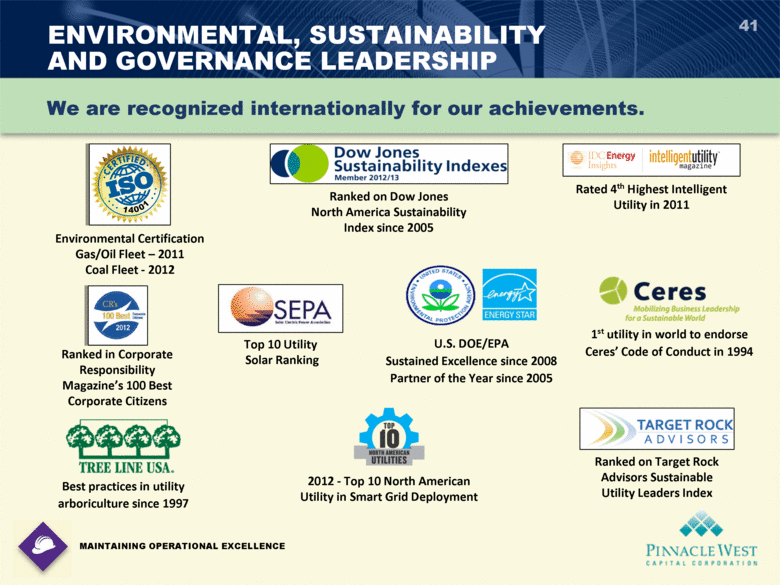
| ENVIRONMENTAL, SUSTAINABILITY AND GOVERNANCE LEADERSHIP 41 MAINTAINING OPERATIONAL EXCELLENCE We are recognized internationally for our achievements. Top 10 Utility Solar Ranking Ranked in Corporate Responsibility Magazine’s 100 Best Corporate Citizens Best practices in utility arboriculture since 1997 U.S. DOE/EPA Sustained Excellence since 2008 Partner of the Year since 2005 Ranked on Dow Jones North America Sustainability Index since 2005 Rated 4th Highest Intelligent Utility in 2011 1st utility in world to endorse Ceres’ Code of Conduct in 1994 Ranked on Target Rock Advisors Sustainable Utility Leaders Index Environmental Certification Gas/Oil Fleet – 2011 Coal Fleet - 2012 2012 - Top 10 North American Utility in Smart Grid Deployment |
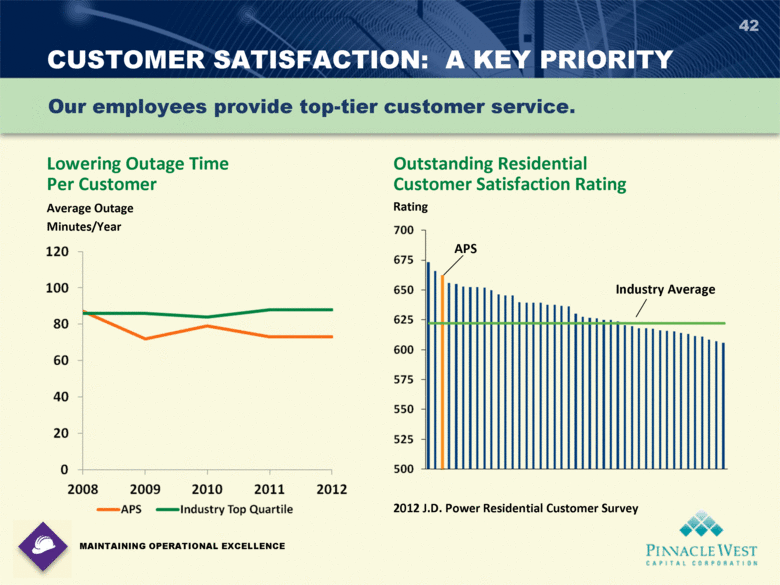
| CUSTOMER SATISFACTION: A KEY PRIORITY 42 Our employees provide top-tier customer service. MAINTAINING OPERATIONAL EXCELLENCE Lowering Outage Time Per Customer Average Outage Minutes/Year Outstanding Residential Customer Satisfaction Rating Rating 2012 J.D. Power Residential Customer Survey APS Industry Average |
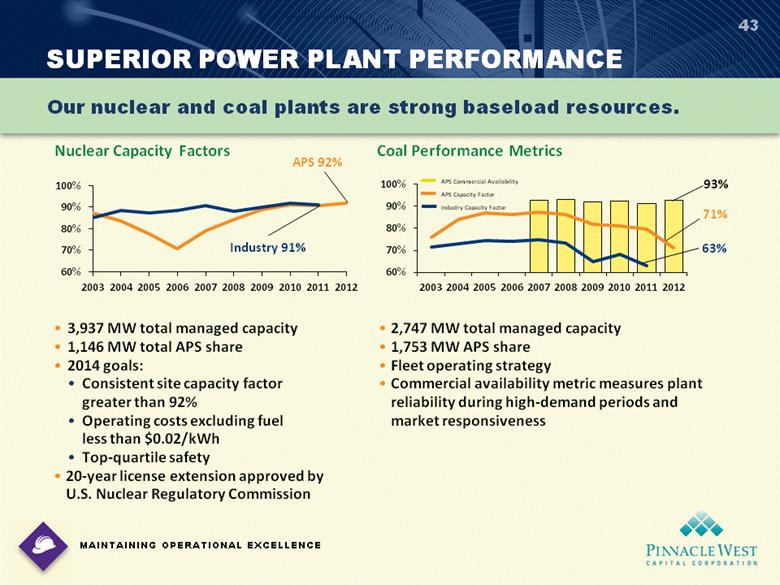
| Coal Performance Metrics Nuclear Capacity Factors SUPERIOR POWER PLANT PERFORMANCE 43 Our nuclear and coal plants are strong baseload resources. MAINTAINING OPERATIONAL EXCELLENCE APS Commercial Availability APS Capacity Factor Industry Capacity Factor Industry 91% APS 92% 63% 71% 93% 3,937 MW total managed capacity 1,146 MW total APS share 2014 goals: Consistent site capacity factor greater than 92% Operating costs excluding fuel less than $0.02/kWh Top-quartile safety 20-year license extension approved by U.S. Nuclear Regulatory Commission 2,747 MW total managed capacity 1,753 MW APS share Fleet operating strategy Commercial availability metric measures plant reliability during high-demand periods and market responsiveness |
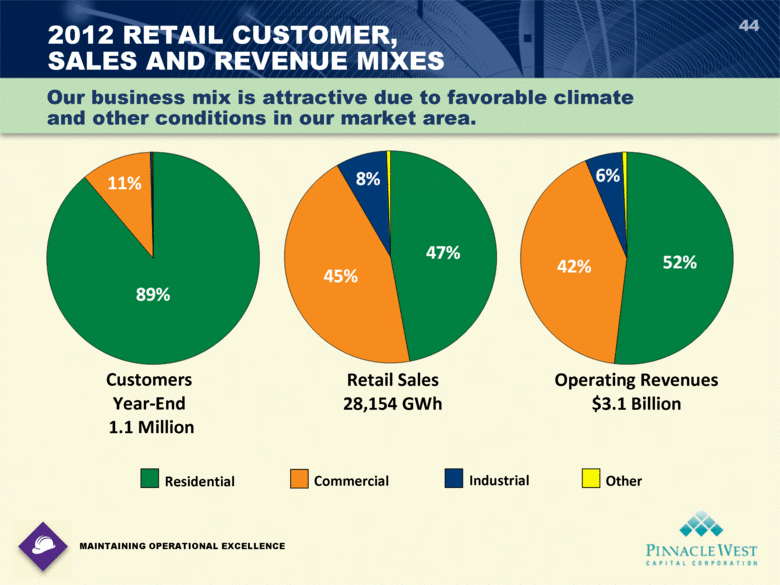
| 2012 RETAIL CUSTOMER, SALES AND REVENUE MIXES 44 Residential Commercial Industrial Other Customers Year-End 1.1 Million Retail Sales 28,154 GWh Operating Revenues $3.1 Billion 8% 45% 47% 50% 43% 11% 89% Our business mix is attractive due to favorable climate and other conditions in our market area. MAINTAINING OPERATIONAL EXCELLENCE |
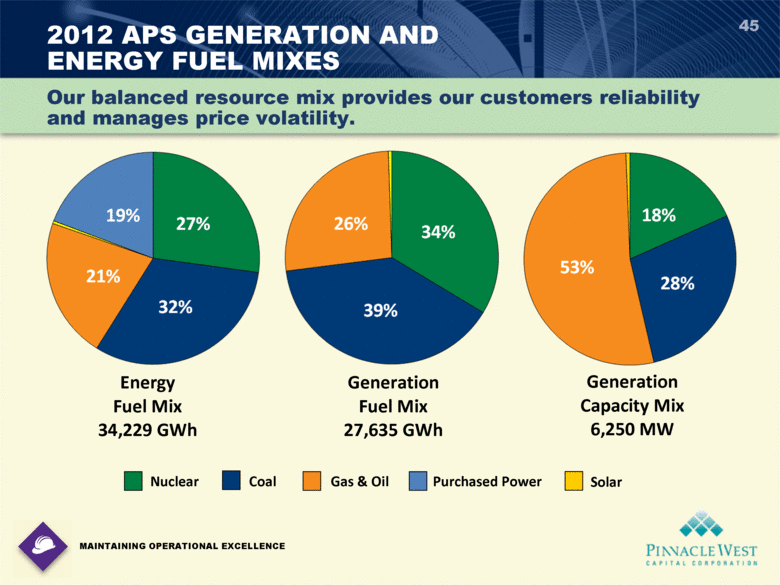
| 45 2012 APS GENERATION AND ENERGY FUEL MIXES Energy Fuel Mix 34,229 GWh Generation Fuel Mix 27,635 GWh Generation Capacity Mix 6,250 MW Nuclear Coal Gas & Oil Purchased Power Our balanced resource mix provides our customers reliability and manages price volatility. MAINTAINING OPERATIONAL EXCELLENCE 46% 32% 22% 36% 26% 17% 21% 54% 28% 18% Solar |
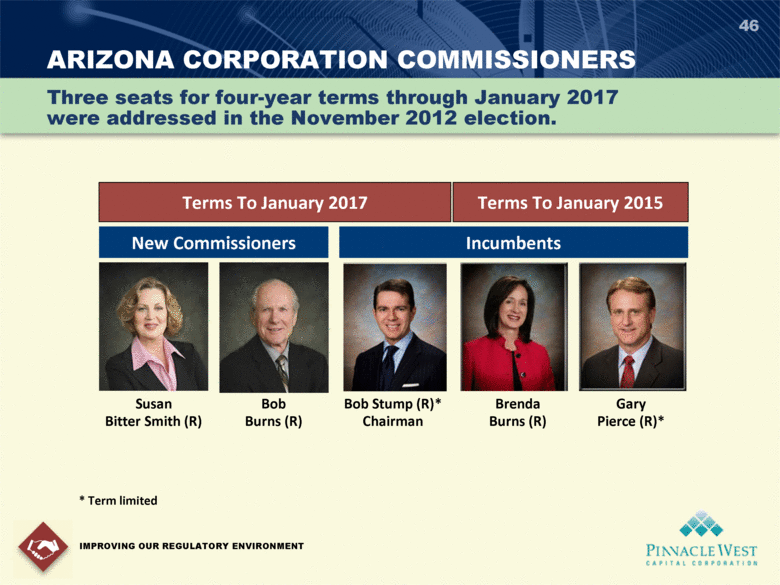
| ARIZONA CORPORATION COMMISSIONERS 46 IMPROVING OUR REGULATORY ENVIRONMENT Three seats for four-year terms through January 2017 were addressed in the November 2012 election. * Term limited Bob Stump (R)* Chairman Brenda Burns (R) Gary Pierce (R)* Terms To January 2015 Terms To January 2017 Susan Bitter Smith (R) Bob Burns (R) Incumbents New Commissioners |
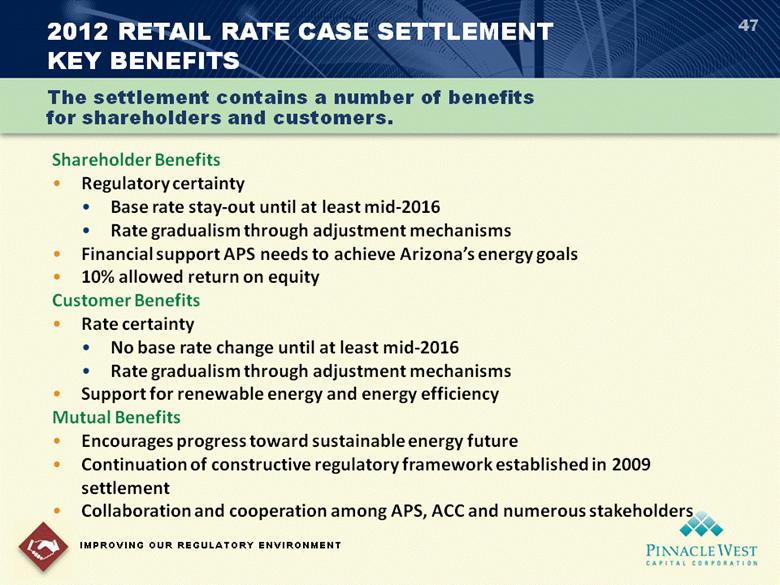
| 2012 RETAIL RATE CASE SETTLEMENT KEY BENEFITS 47 Shareholder Benefits Regulatory certainty Base rate stay-out until at least mid-2016 Rate gradualism through adjustment mechanisms Financial support APS needs to achieve Arizona’s energy goals 10% allowed return on equity Customer Benefits Rate certainty No base rate change until at least mid-2016 Rate gradualism through adjustment mechanisms Support for renewable energy and energy efficiency Mutual Benefits Encourages progress toward sustainable energy future Continuation of constructive regulatory framework established in 2009 settlement Collaboration and cooperation among APS, ACC and numerous stakeholders IMPROVING OUR REGULATORY ENVIRONMENT The settlement contains a number of benefits for shareholders and customers. |
| 2012 RETAIL RATE CASE SETTLEMENT KEY FINANCIAL PROVISIONS – BASE RATES & TIMING 48 The provisions of the settlement became effective July 1, 2012, as originally requested by APS. IMPROVING OUR REGULATORY ENVIRONMENT Annual Revenue Change Annualized Base Rate Revenue Changes ($ millions) Non-fuel base rate increase $ 116.3 Fuel-related base rate decrease (153.1) Revenues related to AZ Sun and other solar projects to be transferred from Renewable Energy Surcharge to base rates 36.8 Net base rate change $ -0- |

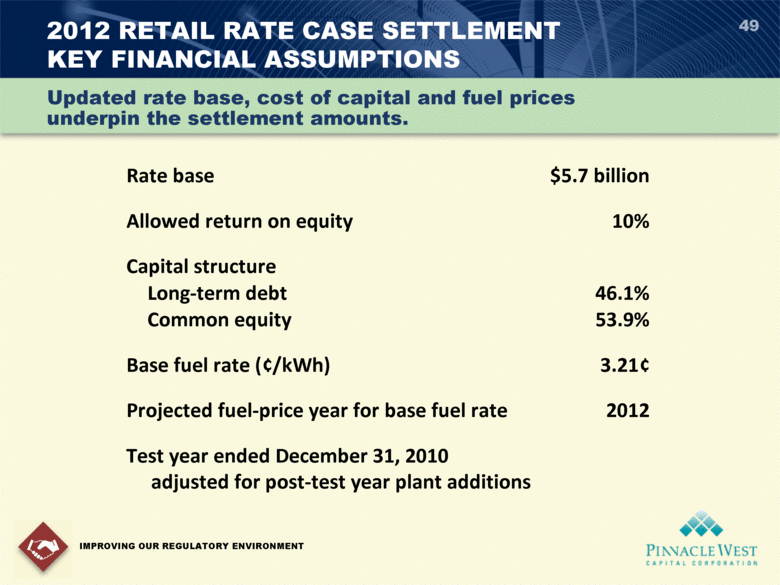
| 2012 RETAIL RATE CASE SETTLEMENT KEY FINANCIAL ASSUMPTIONS 49 IMPROVING OUR REGULATORY ENVIRONMENT Rate base $5.7 billion Allowed return on equity 10% Capital structure Long-term debt 46.1% Common equity 53.9% Base fuel rate (¢/kWh) 3.21¢ Projected fuel-price year for base fuel rate 2012 Test year ended December 31, 2010 adjusted for post-test year plant additions Updated rate base, cost of capital and fuel prices underpin the settlement amounts. |
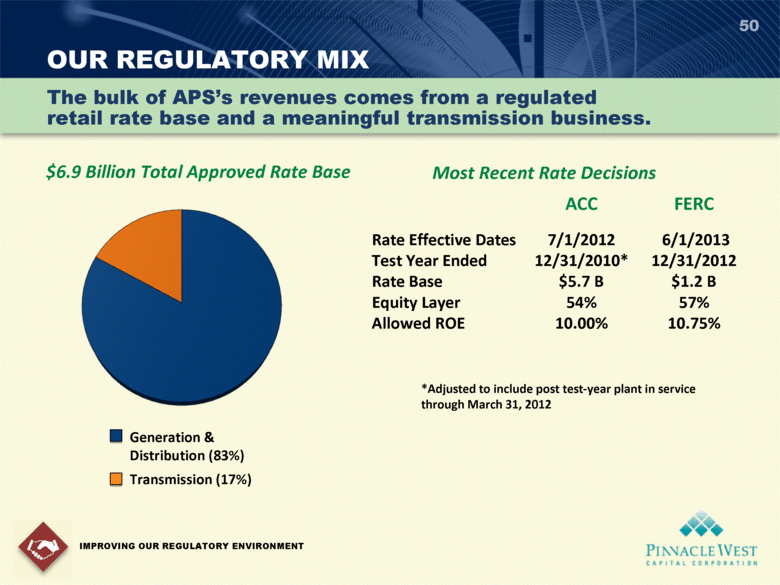
| OUR REGULATORY MIX 50 IMPROVING OUR REGULATORY ENVIRONMENT The bulk of APS’s revenues comes from a regulated retail rate base and a meaningful transmission business. $6.9 Billion Total Approved Rate Base Most Recent Rate Decisions ACC FERC Rate Effective Dates 7/1/2012 6/1/2013 Test Year Ended 12/31/2010* 12/31/2012 Rate Base $5.7 B $1.2 B Equity Layer 54% 57% Allowed ROE 10.00% 10.75% *Adjusted to include post test-year plant in service through March 31, 2012 Generation & Distribution (83%) Transmission (17%) |
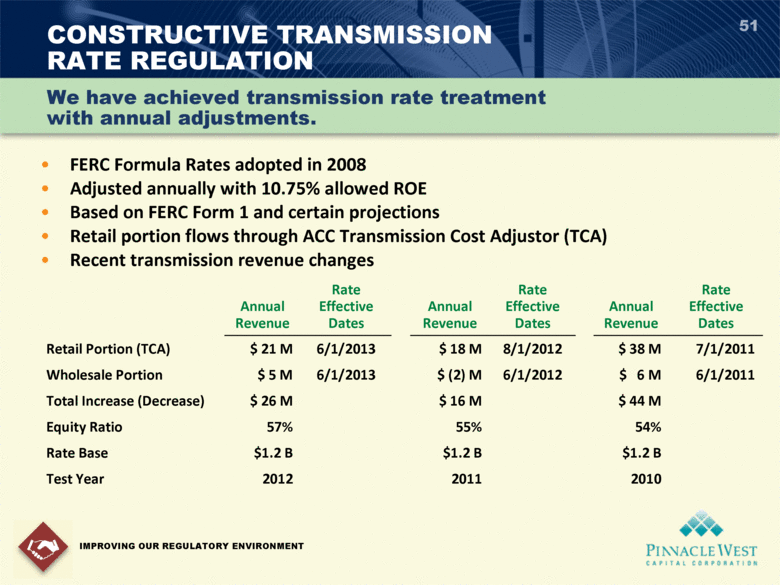
| Annual Revenue Rate Effective Dates Annual Revenue Rate Effective Dates Annual Revenue Rate Effective Dates Retail Portion (TCA) $ 21 M 6/1/2013 $ 18 M 8/1/2012 $ 38 M 7/1/2011 Wholesale Portion $ 5 M 6/1/2013 $ (2) M 6/1/2012 $ 6 M 6/1/2011 Total Increase (Decrease) $ 26 M $ 16 M $ 44 M Equity Ratio 57% 55% 54% Rate Base $1.2 B $1.2 B $1.2 B Test Year 2012 2011 2010 51 FERC Formula Rates adopted in 2008 Adjusted annually with 10.75% allowed ROE Based on FERC Form 1 and certain projections Retail portion flows through ACC Transmission Cost Adjustor (TCA) Recent transmission revenue changes CONSTRUCTIVE TRANSMISSION RATE REGULATION IMPROVING OUR REGULATORY ENVIRONMENT We have achieved transmission rate treatment with annual adjustments. |
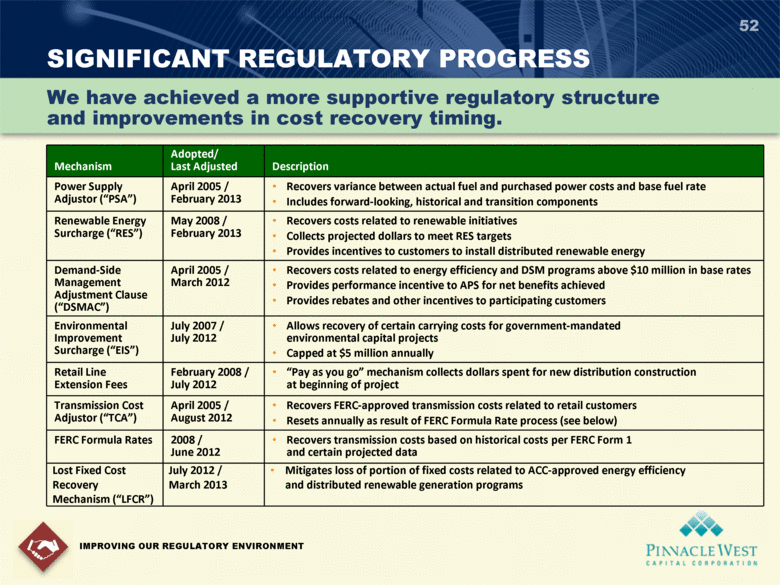
| 52 SIGNIFICANT REGULATORY PROGRESS IMPROVING OUR REGULATORY ENVIRONMENT We have achieved a more supportive regulatory structure and improvements in cost recovery timing. Mechanism Adopted/ Last Adjusted Description Power Supply Adjustor (“PSA”) April 2005 / February 2013 Recovers variance between actual fuel and purchased power costs and base fuel rate Includes forward-looking, historical and transition components Renewable Energy Surcharge (“RES”) May 2008 / February 2013 Recovers costs related to renewable initiatives Collects projected dollars to meet RES targets Provides incentives to customers to install distributed renewable energy Demand-Side Management Adjustment Clause (“DSMAC”) April 2005 / March 2012 Recovers costs related to energy efficiency and DSM programs above $10 million in base rates Provides performance incentive to APS for net benefits achieved Provides rebates and other incentives to participating customers Environmental Improvement Surcharge (“EIS”) July 2007 / July 2012 Allows recovery of certain carrying costs for government-mandated environmental capital projects Capped at $5 million annually Retail Line Extension Fees February 2008 / July 2012 “Pay as you go” mechanism collects dollars spent for new distribution construction at beginning of project Transmission Cost Adjustor (“TCA”) April 2005 / August 2012 Recovers FERC-approved transmission costs related to retail customers Resets annually as result of FERC Formula Rate process (see below) FERC Formula Rates 2008 / June 2012 Recovers transmission costs based on historical costs per FERC Form 1 and certain projected data Lost Fixed Cost Recovery Mechanism (“LFCR”) July 2012 / March 2013 Mitigates loss of portion of fixed costs related to ACC-approved energy efficiency and distributed renewable generation programs |
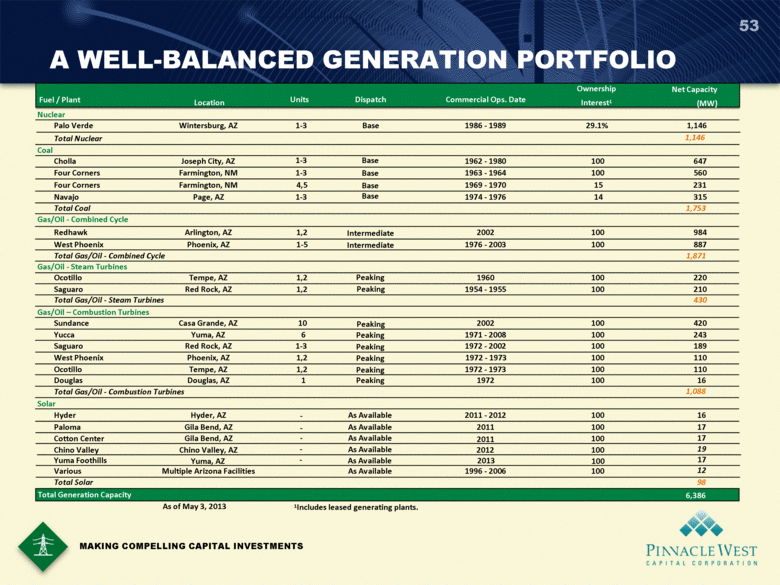
| A WELL-BALANCED GENERATION PORTFOLIO Fuel / Plant Location Units Dispatch Commercial Ops. Date Ownership Interest1 Net Capacity (MW) Nuclear Palo Verde Wintersburg, AZ 1-3 Base 1986 - 1989 29.1% 1,146 Total Nuclear 1,146 Coal Cholla Joseph City, AZ 1-3 Base 1962 - 1980 100 647 Four Corners Farmington, NM 1-3 Base 1963 - 1964 100 560 Four Corners Farmington, NM 4,5 Base 1969 - 1970 15 231 Navajo Page, AZ 1-3 Base 1974 - 1976 14 315 Total Coal 1,753 Gas/Oil - Combined Cycle Redhawk Arlington, AZ 1,2 Intermediate 2002 100 984 West Phoenix Phoenix, AZ 1-5 Intermediate 1976 - 2003 100 887 Total Gas/Oil - Combined Cycle 1,871 Gas/Oil - Steam Turbines Ocotillo Tempe, AZ 1,2 Peaking 1960 100 220 Saguaro Red Rock, AZ 1,2 Peaking 1954 - 1955 100 210 Total Gas/Oil - Steam Turbines 430 Gas/Oil – Combustion Turbines Sundance Casa Grande, AZ 10 Peaking 2002 100 420 Yucca Yuma, AZ 6 Peaking 1971 - 2008 100 243 Saguaro Red Rock, AZ 1-3 Peaking 1972 - 2002 100 189 West Phoenix Phoenix, AZ 1,2 Peaking 1972 - 1973 100 110 Ocotillo Tempe, AZ 1,2 Peaking 1972 - 1973 100 110 Douglas Douglas, AZ 1 Peaking 1972 100 16 Total Gas/Oil - Combustion Turbines 1,088 Solar Total Solar Total Generation Capacity 6,386 As of May 3, 2013 1Includes leased generating plants. 12 Paloma Cotton Center Hyder Various Gila Bend, AZ Gila Bend, AZ Hyder, AZ Multiple Arizona Facilities - - - - As Available As Available As Available As Available 2011 2011 2011 - 2012 1996 - 2006 100 100 100 100 16 17 17 MAKING COMPELLING CAPITAL INVESTMENTS 19 Chino Valley Chino Valley, AZ - As Available 2012 100 98 53 Yuma Foothills Yuma, AZ As Available 2013 100 17 |
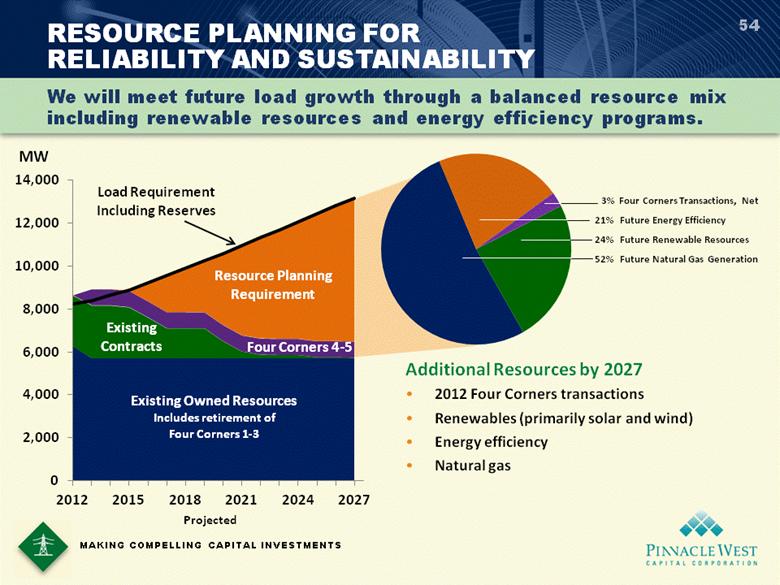
| RESOURCE PLANNING FOR RELIABILITY AND SUSTAINABILITY MAKING COMPELLING CAPITAL INVESTMENTS We will meet future load growth through a balanced resource mix including renewable resources and energy efficiency programs. Existing Owned Resources Includes retirement of Four Corners 1-3 Existing Contracts Four Corners 4-5 Resource Planning Requirement Load Requirement Including Reserves Projected Additional Resources by 2027 2012 Four Corners transactions Renewables (primarily solar and wind) Energy efficiency Natural gas 3% Four Corners Transactions, Net 21% Future Energy Efficiency 24% Future Renewable Resources 52% Future Natural Gas Generation MW 54 14,000 12,000 10,000 8,000 6,000 4,000 2,000 0 2012 2015 2018 2021 2024 2027 |
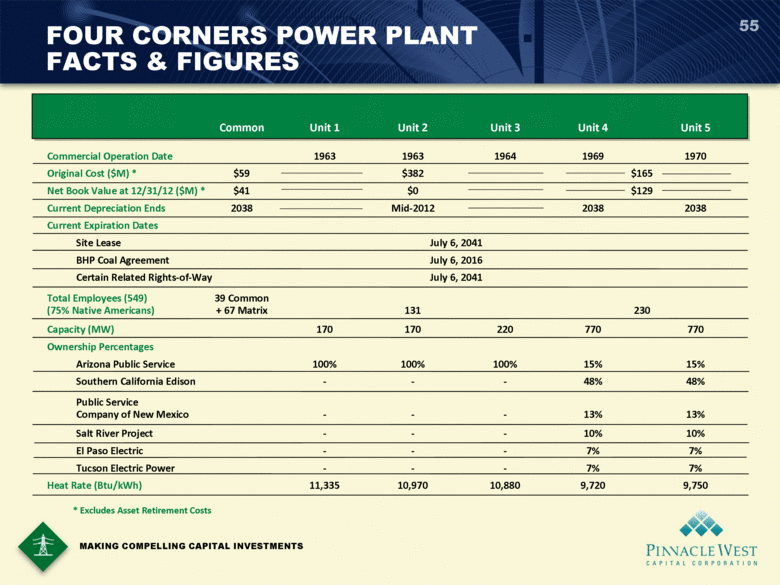
| 55 FOUR CORNERS POWER PLANT FACTS & FIGURES MAKING COMPELLING CAPITAL INVESTMENTS Common Unit 1 Unit 2 Unit 3 Unit 4 Unit 5 Commercial Operation Date 1963 1963 1964 1969 1970 Original Cost ($M) * $59 $382 $165 Net Book Value at 12/31/12 ($M) * $41 $0 $129 Current Depreciation Ends 2038 Mid-2012 2038 2038 Current Expiration Dates Site Lease July 6, 2041 BHP Coal Agreement July 6, 2016 Certain Related Rights-of-Way July 6, 2041 Total Employees (549) 39 Common (75% Native Americans) + 67 Matrix 131 230 Capacity (MW) 170 170 220 770 770 Ownership Percentages Arizona Public Service 100% 100% 100% 15% 15% Southern California Edison - - - 48% 48% Public Service Company of New Mexico - - - 13% 13% Salt River Project - - - 10% 10% El Paso Electric - - - 7% 7% Tucson Electric Power - - - 7% 7% Heat Rate (Btu/kWh) 11,335 10,970 10,880 9,720 9,750 * Excludes Asset Retirement Costs |
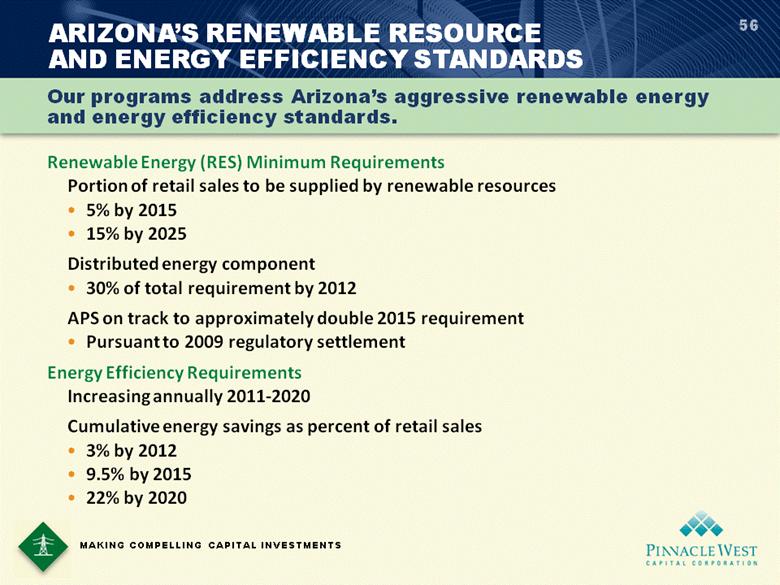
| 56 Renewable Energy (RES) Minimum Requirements Portion of retail sales to be supplied by renewable resources 5% by 2015 15% by 2025 Distributed energy component 30% of total requirement by 2012 APS on track to approximately double 2015 requirement Pursuant to 2009 regulatory settlement Energy Efficiency Requirements Increasing annually 2011-2020 Cumulative energy savings as percent of retail sales 3% by 2012 9.5% by 2015 22% by 2020 ARIZONA’S RENEWABLE RESOURCE AND ENERGY EFFICIENCY STANDARDS Our programs address Arizona’s aggressive renewable energy and energy efficiency standards. MAKING COMPELLING CAPITAL INVESTMENTS |
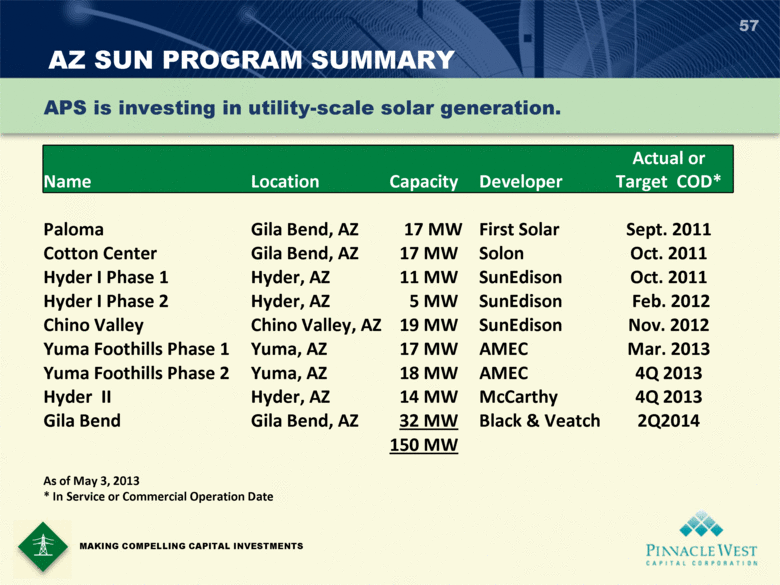
| AZ SUN PROGRAM SUMMARY 57 MAKING COMPELLING CAPITAL INVESTMENTS Name Location Capacity Developer Actual or Target COD* Paloma Gila Bend, AZ 17 MW First Solar Sept. 2011 Cotton Center Gila Bend, AZ 17 MW Solon Oct. 2011 Hyder I Phase 1 Hyder, AZ 11 MW SunEdison Oct. 2011 Hyder I Phase 2 Hyder, AZ 5 MW SunEdison Feb. 2012 Chino Valley Chino Valley, AZ 19 MW SunEdison Nov. 2012 Yuma Foothills Phase 1 Yuma, AZ 17 MW AMEC Mar. 2013 Yuma Foothills Phase 2 Yuma, AZ 18 MW AMEC 4Q 2013 Hyder II Hyder, AZ 14 MW McCarthy 4Q 2013 Gila Bend Gila Bend, AZ 32 MW Black & Veatch 2Q2014 150 MW As of May 3, 2013 * In Service or Commercial Operation Date APS is investing in utility-scale solar generation. |
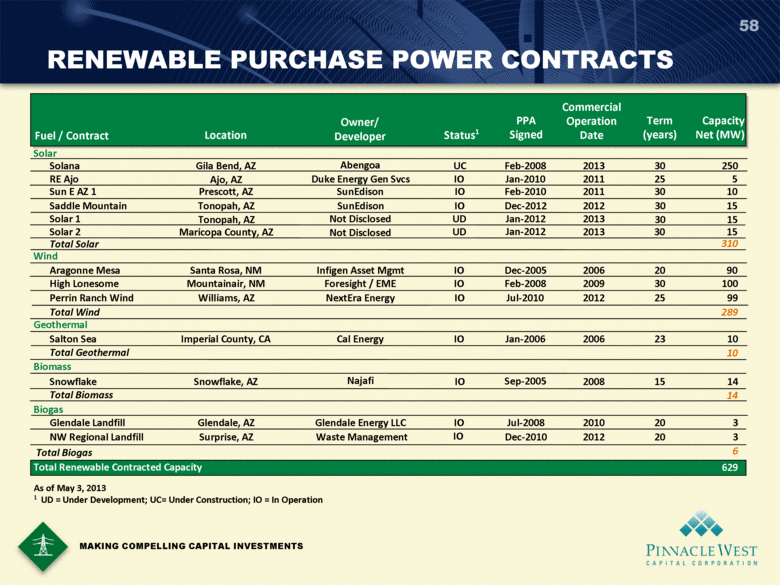
| RENEWABLE PURCHASE POWER CONTRACTS 58 MAKING COMPELLING CAPITAL INVESTMENTS Fuel / Contract Location Owner/ Developer Status 1 PPA Signed Commercial Operation Date Term (years) Capacity Net (MW) Solar Solana Gila Bend, AZ Abengoa UC Feb-2008 2013 30 250 RE Ajo Ajo, AZ Duke Energy Gen Svcs IO Jan-2010 2011 25 5 Sun E AZ 1 Prescott, AZ SunEdison IO Feb-2010 2011 30 10 Saddle Mountain Tonopah, AZ SunEdison IO Dec-2012 2012 30 15 Total Solar 310 Wind Aragonne Mesa Santa Rosa, NM Infigen Asset Mgmt IO Dec-2005 2006 20 90 High Lonesome Mountainair, NM Foresight / EME IO Feb-2008 2009 30 100 Perrin Ranch Wind Williams, AZ NextEra Energy IO Jul-2010 2012 25 99 Total Wind 289 Geothermal Salton Sea Imperial County, CA Cal Energy IO Jan-2006 2006 23 10 Total Geothermal 10 Biomass Snowflake Snowflake, AZ Najafi IO Sep-2005 2008 15 14 Total Biomass 14 Biogas Glendale Landfill Glendale, AZ Glendale Energy LLC IO Jul-2008 2010 20 3 NW Regional Landfill Surprise, AZ Waste Management IO Dec-2010 2012 20 3 Total Biogas 6 Total Renewable Contracted Capacity 629 Solar 1 Solar 2 Tonopah, AZ Not Disclosed Jan-2012 2013 30 15 Maricopa County, AZ Not Disclosed Jan-2012 2013 30 15 UD UD As of May 3, 2013 1 UD = Under Development; UC= Under Construction; IO = In Operation |
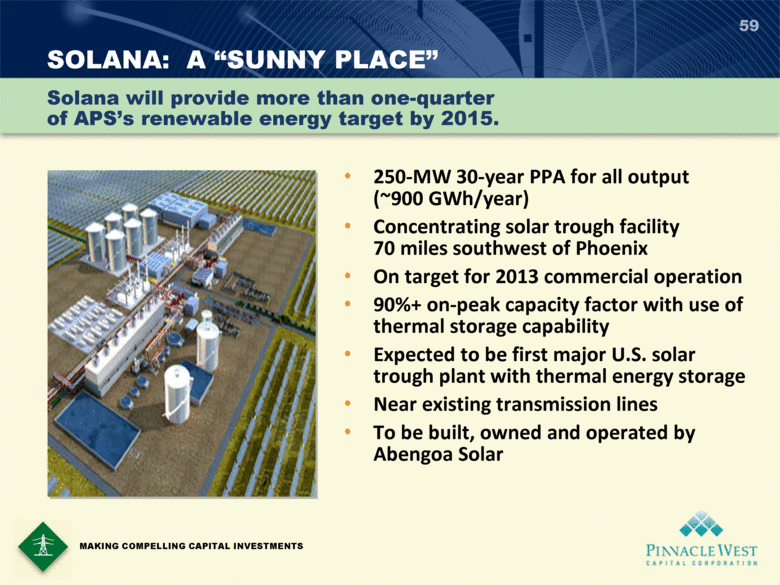
| SOLANA: A “SUNNY PLACE” 59 250-MW 30-year PPA for all output (~900 GWh/year) Concentrating solar trough facility 70 miles southwest of Phoenix On target for 2013 commercial operation 90%+ on-peak capacity factor with use of thermal storage capability Expected to be first major U.S. solar trough plant with thermal energy storage Near existing transmission lines To be built, owned and operated by Abengoa Solar MAKING COMPELLING CAPITAL INVESTMENTS Solana will provide more than one-quarter of APS’s renewable energy target by 2015. |