Exhibit 99.1
| DELIVERING SUPERIOR SHAREHOLDER VALUE EEI Financial Conference | November 10-13, 2013 |

| FORWARD LOOKING STATEMENTS This presentation contains forward-looking statements based on current expectations, including statements regarding our earnings guidance and financial outlook and goals. These forward-looking statements are often identified by words such as “estimate,” “predict,” “may,” “believe,” “plan,” “expect,” “require,” “intend,” “assume” and similar words. Because actual results may differ materially from expectations, we caution you not to place undue reliance on these statements. A number of factors could cause future results to differ materially from historical results, or from outcomes currently expected or sought by Pinnacle West or APS. These factors include, but are not limited to: our ability to manage capital expenditures and operations and maintenance costs while maintaining reliability and customer service levels; variations in demand for electricity, including those due to weather, the general economy, customer and sales growth (or decline), and the effects of energy conservation measures and distributed generation; power plant and transmission system performance and outages; volatile fuel and purchased power costs; fuel and water supply availability; our ability to achieve timely and adequate rate recovery of our costs, including returns on debt and equity capital; regulatory and judicial decisions, developments and proceedings; new legislation or regulation, including those relating to environmental requirements, nuclear plant operations and potential deregulation of retail electric markets; our ability to meet renewable energy and energy efficiency mandates and recover related costs; risks inherent in the operation of nuclear facilities, including spent fuel disposal uncertainty; competition in retail and wholesale power markets; the duration and severity of the economic decline in Arizona and current real estate market conditions; the cost of debt and equity capital and the ability to access capital markets when required; changes to our credit ratings; the investment performance of the assets of our nuclear decommissioning trust, pension, and other postretirement benefit plans and the resulting impact on future funding requirements; the liquidity of wholesale power markets and the use of derivative contracts in our business; potential shortfalls in insurance coverage; new accounting requirements or new interpretations of existing requirements; generation, transmission and distribution facility and system conditions and operating costs; the ability to meet the anticipated future need for additional baseload generation and associated transmission facilities in our region; the willingness or ability of our counterparties, power plant participants and power plant land owners to meet contractual or other obligations or extend the rights for continued power plant operations; technological developments affecting the electric industry; and restrictions on dividends or other provisions in our credit agreements and Arizona Corporation Commission orders. These and other factors are discussed in Risk Factors described in Part I, Item 1A of the Pinnacle West/APS Annual Report on Form 10-K for the fiscal year ended December 31, 2012, which you should review carefully before placing any reliance on our financial statements, disclosures or earnings outlook. Neither Pinnacle West nor APS assumes any obligation to update these statements, even if our internal estimates change, except as required by law. In this presentation, references to net income and earnings per share (EPS) refer to amounts attributable to common shareholders. |
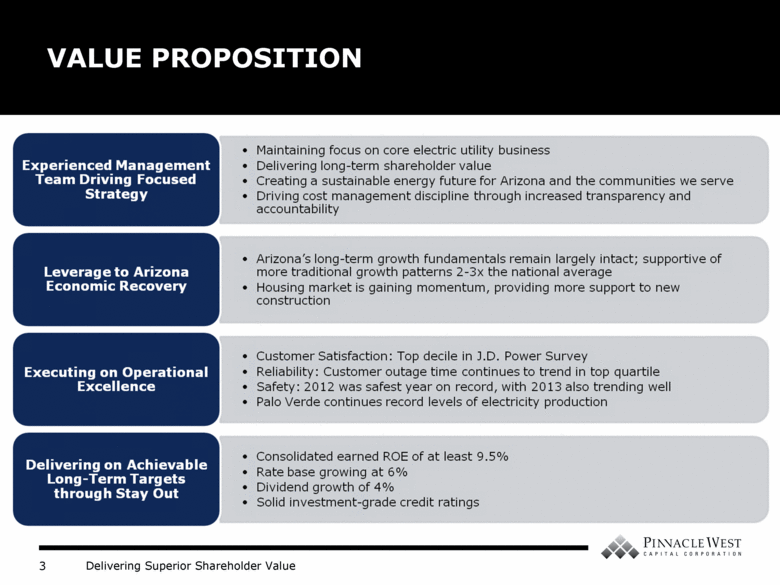
| VALUE PROPOSITION Experienced Management Team Driving Focused Strategy Leverage to Arizona Economic Recovery Executing on Operational Excellence Delivering on Achievable Long-Term Targets through Stay Out Maintaining focus on core electric utility business Delivering long-term shareholder value Creating a sustainable energy future for Arizona and the communities we serve Driving cost management discipline through increased transparency and accountability Arizona’s long-term growth fundamentals remain largely intact; supportive of more traditional growth patterns 2-3x the national average Housing market is gaining momentum, providing more support to new construction Customer Satisfaction: Top decile in J.D. Power Survey Reliability: Customer outage time continues to trend in top quartile Safety: 2012 was safest year on record, with 2013 also trending well Palo Verde continues record levels of electricity production Consolidated earned ROE of at least 9.5% Rate base growing at 6% Dividend growth of 4% Solid investment-grade credit ratings |
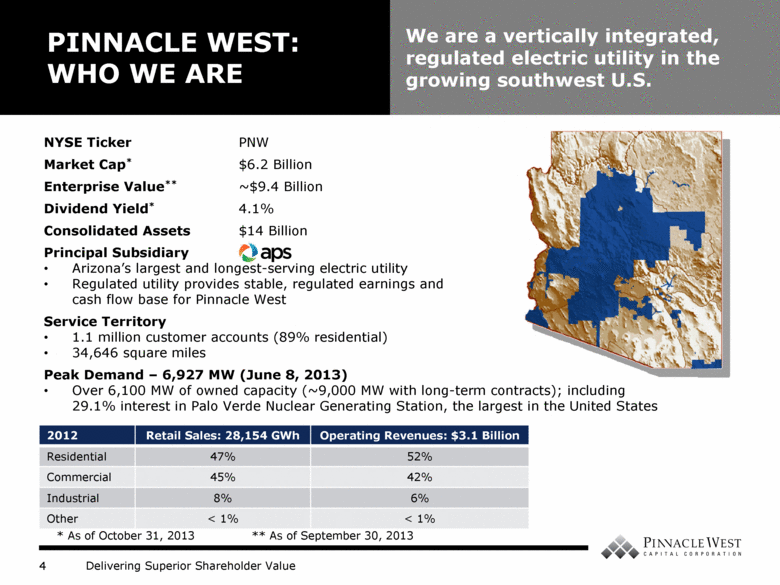
| PINNACLE WEST: WHO WE ARE We are a vertically integrated, regulated electric utility in the growing southwest U.S. NYSE Ticker PNW Market Cap* $6.2 Billion Enterprise Value** ~$9.4 Billion Dividend Yield* 4.1% Consolidated Assets $14 Billion Principal Subsidiary Arizona’s largest and longest-serving electric utility Regulated utility provides stable, regulated earnings and cash flow base for Pinnacle West Service Territory 1.1 million customer accounts (89% residential) 34,646 square miles Peak Demand – 6,927 MW (June 8, 2013) Over 6,100 MW of owned capacity (~9,000 MW with long-term contracts); including 29.1% interest in Palo Verde Nuclear Generating Station, the largest in the United States 2012 Retail Sales: 28,154 GWh Operating Revenues: $3.1 Billion Residential 47% 52% Commercial 45% 42% Industrial 8% 6% Other < 1% < 1% * As of October 31, 2013 ** As of September 30, 2013 |
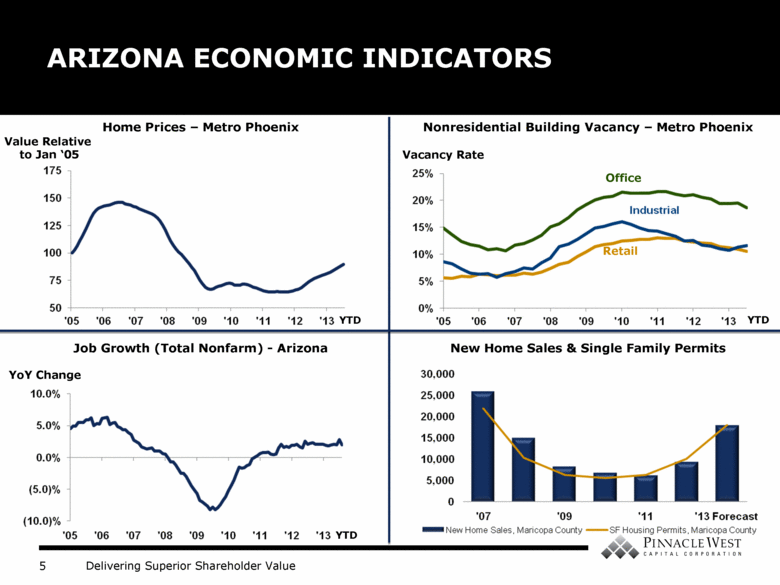
| ARIZONA ECONOMIC INDICATORS Nonresidential Building Vacancy – Metro Phoenix New Home Sales & Single Family Permits Home Prices – Metro Phoenix Job Growth (Total Nonfarm) - Arizona Value Relative to Jan ‘05 YTD YTD Vacancy Rate Office Retail YoY Change YTD |
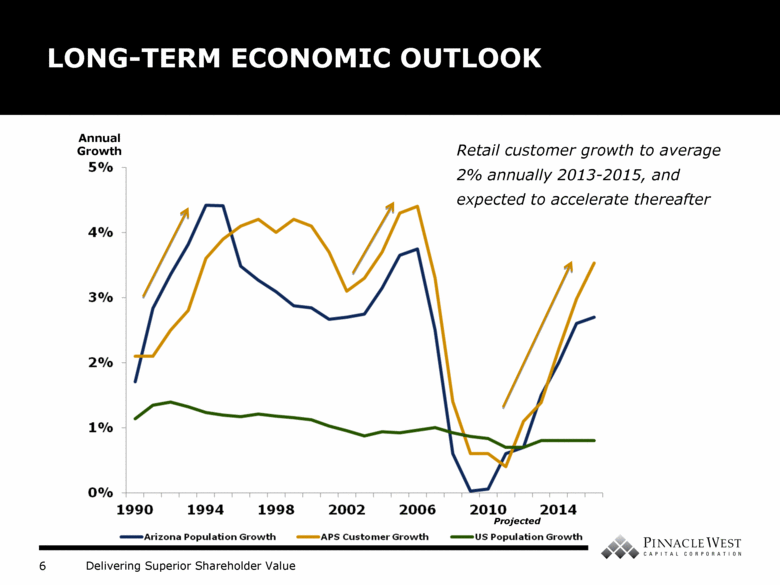
| LONG-TERM ECONOMIC OUTLOOK Annual Growth Retail customer growth to average 2% annually 2013-2015, and expected to accelerate thereafter Projected |
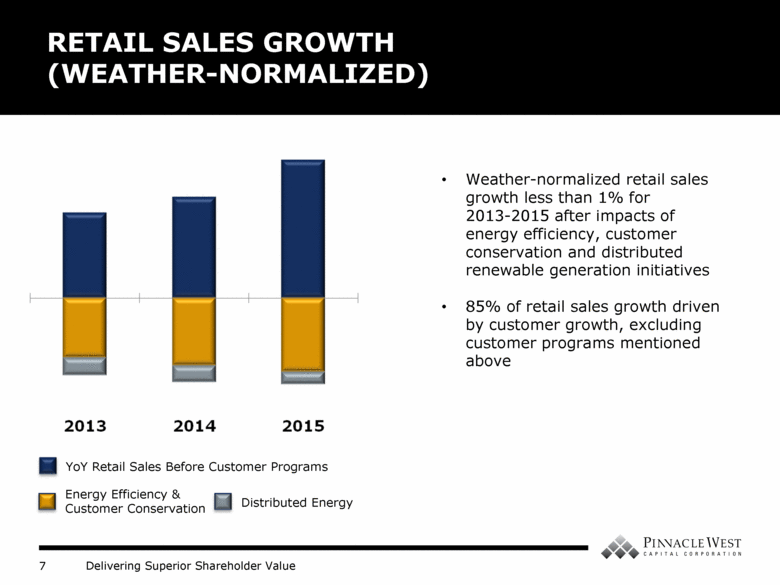
| RETAIL SALES GROWTH (WEATHER-NORMALIZED) YoY Retail Sales Before Customer Programs Energy Efficiency & Customer Conservation Distributed Energy Weather-normalized retail sales growth less than 1% for 2013-2015 after impacts of energy efficiency, customer conservation and distributed renewable generation initiatives 85% of retail sales growth driven by customer growth, excluding customer programs mentioned above |
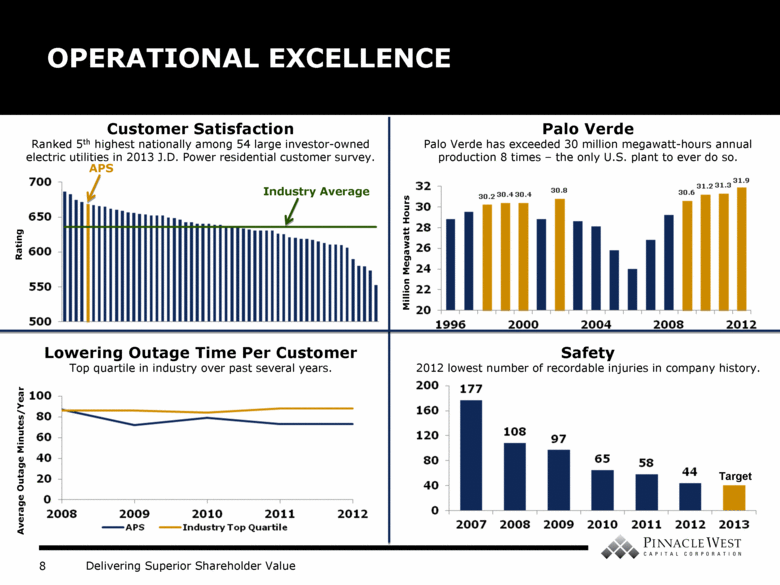
| OPERATIONAL EXCELLENCE Palo Verde Palo Verde has exceeded 30 million megawatt-hours annual production 8 times – the only U.S. plant to ever do so. Safety 2012 lowest number of recordable injuries in company history. Customer Satisfaction Ranked 5th highest nationally among 54 large investor-owned electric utilities in 2013 J.D. Power residential customer survey. Lowering Outage Time Per Customer Top quartile in industry over past several years. Average Outage Minutes/Year Target Million Megawatt Hours Rating Industry Average APS |
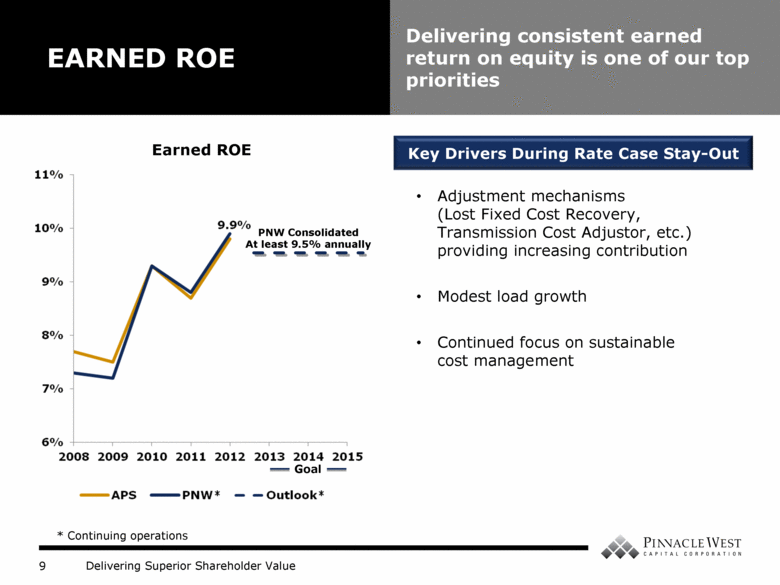
| PNW Consolidated At least 9.5% annually EARNED ROE Delivering consistent earned return on equity is one of our top priorities Adjustment mechanisms (Lost Fixed Cost Recovery, Transmission Cost Adjustor, etc.) providing increasing contribution Modest load growth Continued focus on sustainable cost management Earned ROE * Continuing operations Goal Key Drivers During Rate Case Stay-Out |
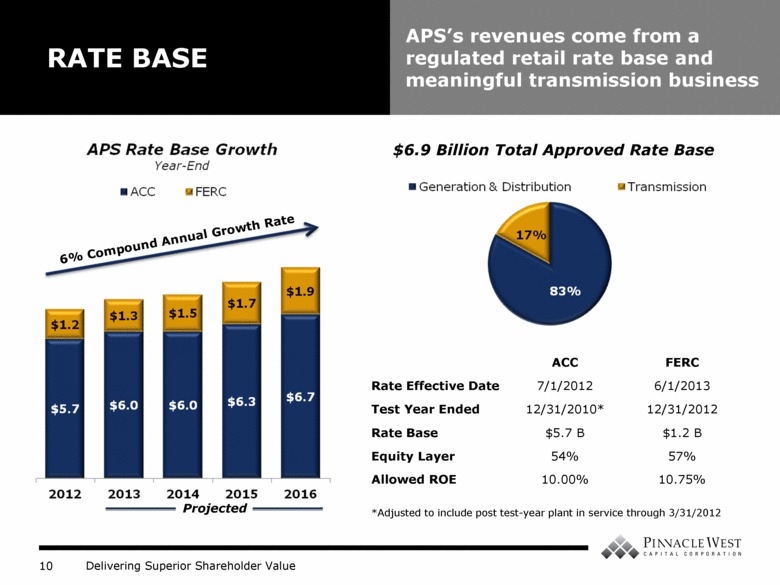
| RATE BASE APS’s revenues come from a regulated retail rate base and meaningful transmission business $6.9 Billion Total Approved Rate Base 6% Compound Annual Growth Rate Projected Most Recent Rate Decisions ACC FERC Rate Effective Date 7/1/2012 6/1/2013 Test Year Ended 12/31/2010* 12/31/2012 Rate Base $5.7 B $1.2 B Equity Layer 54% 57% Allowed ROE 10.00% 10.75% *Adjusted to include post test-year plant in service through 3/31/2012 |
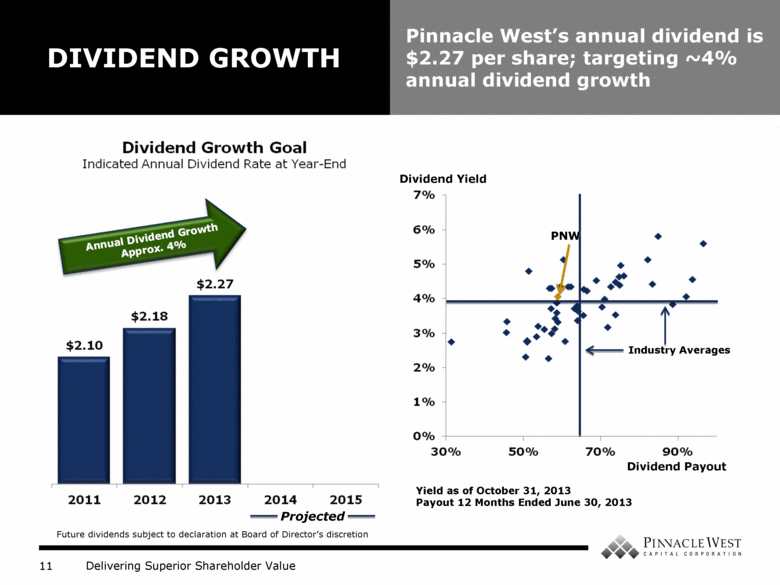
| DIVIDEND GROWTH Pinnacle West’s annual dividend is $2.27 per share; targeting ~4% annual dividend growth Projected Annual Dividend Growth Approx. 4% Yield as of October 31, 2013 Payout 12 Months Ended June 30, 2013 Dividend Yield Dividend Payout PNW Industry Averages Future dividends subject to declaration at Board of Director’s discretion Indicated Annual Dividend Rate at Year-End |
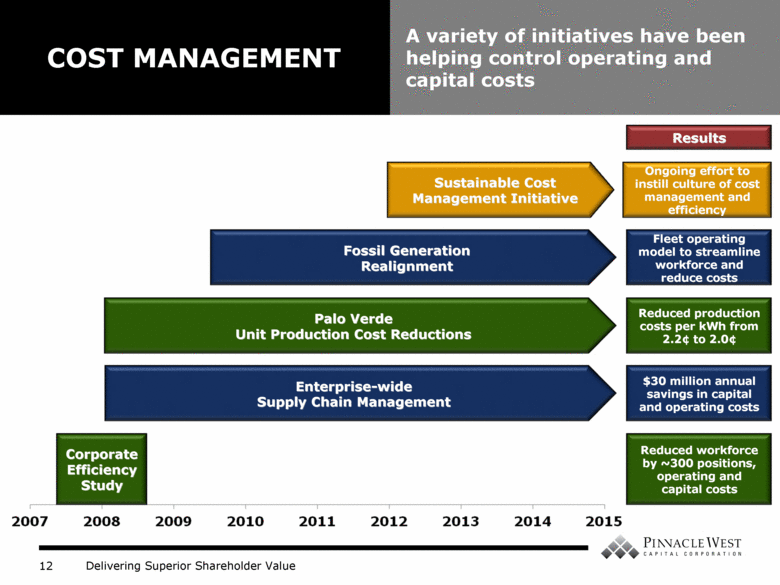
| COST MANAGEMENT A variety of initiatives have been helping control operating and capital costs Ongoing effort to instill culture of cost management and efficiency Fleet operating model to streamline workforce and reduce costs Reduced production costs per kWh from 2.2¢ to 2.0¢ $30 million annual savings in capital and operating costs Reduced workforce by ~300 positions, operating and capital costs Results |
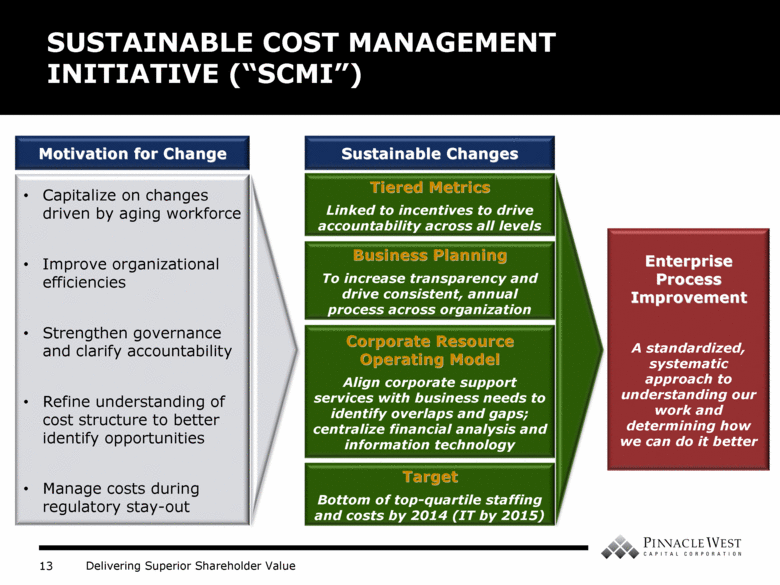
| Motivation for Change SUSTAINABLE COST MANAGEMENT INITIATIVE (“SCMI”) Capitalize on changes driven by aging workforce Improve organizational efficiencies Strengthen governance and clarify accountability Refine understanding of cost structure to better identify opportunities Manage costs during regulatory stay-out Sustainable Changes Tiered Metrics Linked to incentives to drive accountability across all levels Business Planning To increase transparency and drive consistent, annual process across organization Corporate Resource Operating Model Align corporate support services with business needs to identify overlaps and gaps; centralize financial analysis and information technology Target Bottom of top-quartile staffing and costs by 2014 (IT by 2015) Enterprise Process Improvement A standardized, systematic approach to understanding our work and determining how we can do it better |
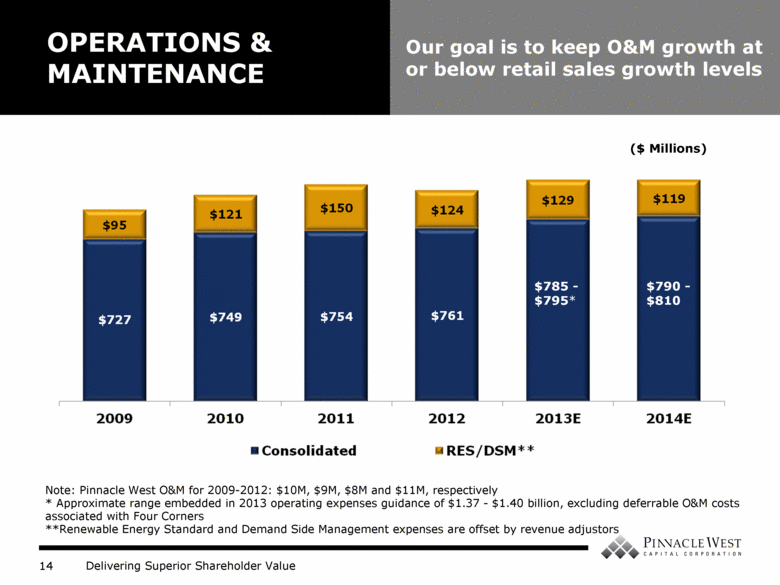
| OPERATIONS & MAINTENANCE Our goal is to keep O&M growth at or below retail sales growth levels Note: Pinnacle West O&M for 2009-2012: $10M, $9M, $8M and $11M, respectively * Approximate range embedded in 2013 operating expenses guidance of $1.37 - $1.40 billion, excluding deferrable O&M costs associated with Four Corners **Renewable Energy Standard and Demand Side Management expenses are offset by revenue adjustors $785 - $795* $790 - $810 ($ Millions) |
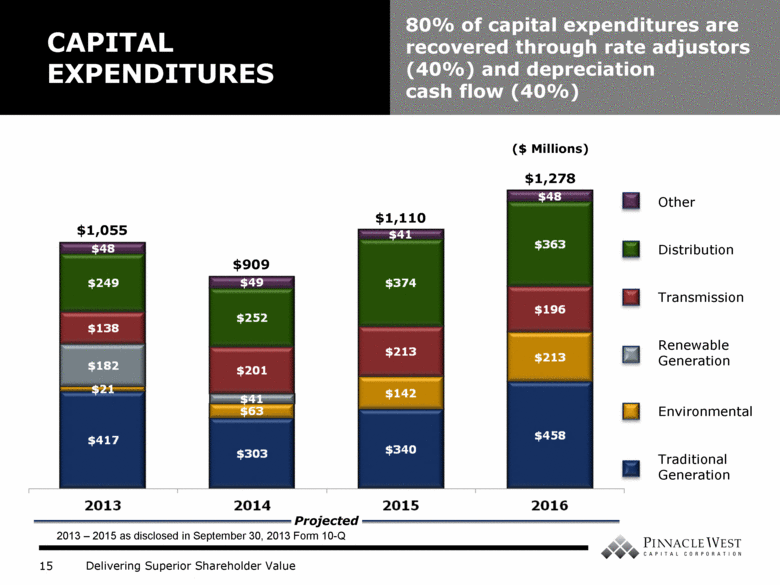
| CAPITAL EXPENDITURES 80% of capital expenditures are recovered through rate adjustors (40%) and depreciation cash flow (40%) ($ Millions) $1,055 $909 $1,110 2013 – 2015 as disclosed in September 30, 2013 Form 10-Q Distribution Transmission Renewable Generation Environmental Traditional Generation Projected $1,278 |
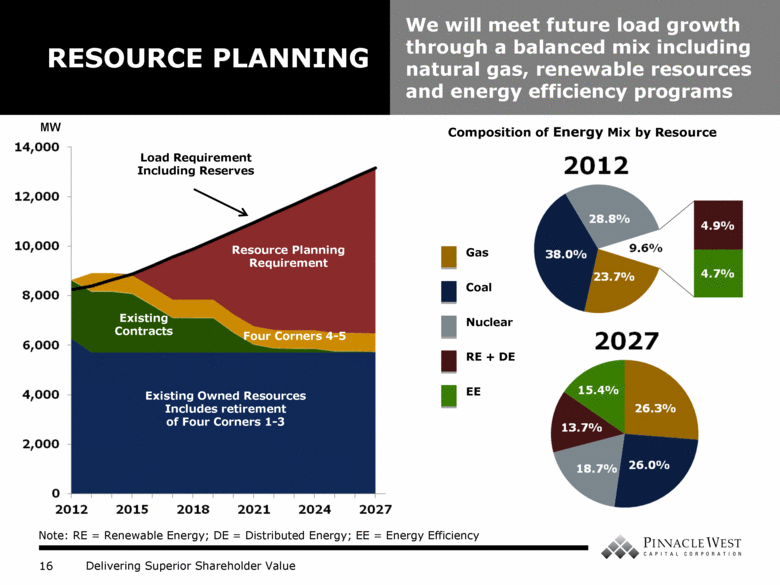
| RESOURCE PLANNING We will meet future load growth through a balanced mix including natural gas, renewable resources and energy efficiency programs Existing Owned Resources Includes retirement of Four Corners 1-3 Existing Contracts Four Corners 4-5 Resource Planning Requirement Load Requirement Including Reserves MW Gas Coal Nuclear RE + DE EE Composition of Energy Mix by Resource Note: RE = Renewable Energy; DE = Distributed Energy; EE = Energy Efficiency |
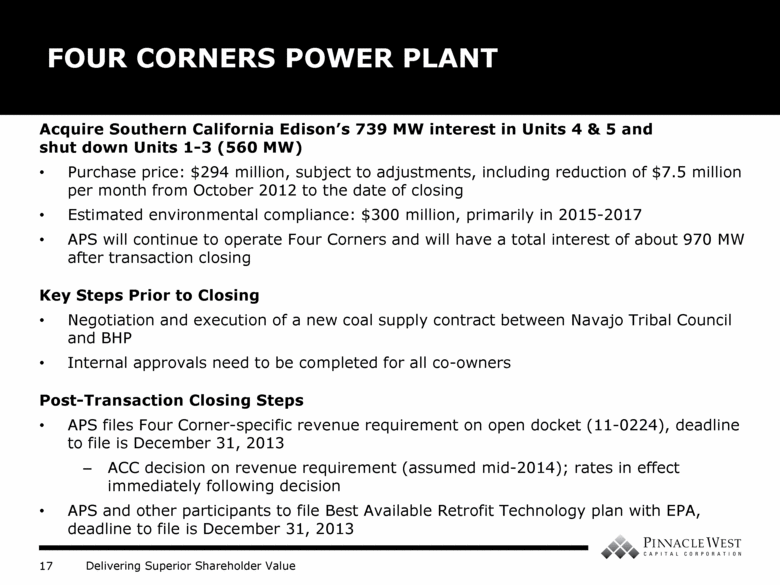
| Acquire Southern California Edison’s 739 MW interest in Units 4 & 5 and shut down Units 1-3 (560 MW) Purchase price: $294 million, subject to adjustments, including reduction of $7.5 million per month from October 2012 to the date of closing Estimated environmental compliance: $300 million, primarily in 2015-2017 APS will continue to operate Four Corners and will have a total interest of about 970 MW after transaction closing Key Steps Prior to Closing Negotiation and execution of a new coal supply contract between Navajo Tribal Council and BHP Internal approvals need to be completed for all co-owners Post-Transaction Closing Steps APS files Four Corner-specific revenue requirement on open docket (11-0224), deadline to file is December 31, 2013 ACC decision on revenue requirement (assumed mid-2014); rates in effect immediately following decision APS and other participants to file Best Available Retrofit Technology plan with EPA, deadline to file is December 31, 2013 Our proposal represents a balanced solution to new environmental regulations. FOUR CORNERS POWER PLANT |
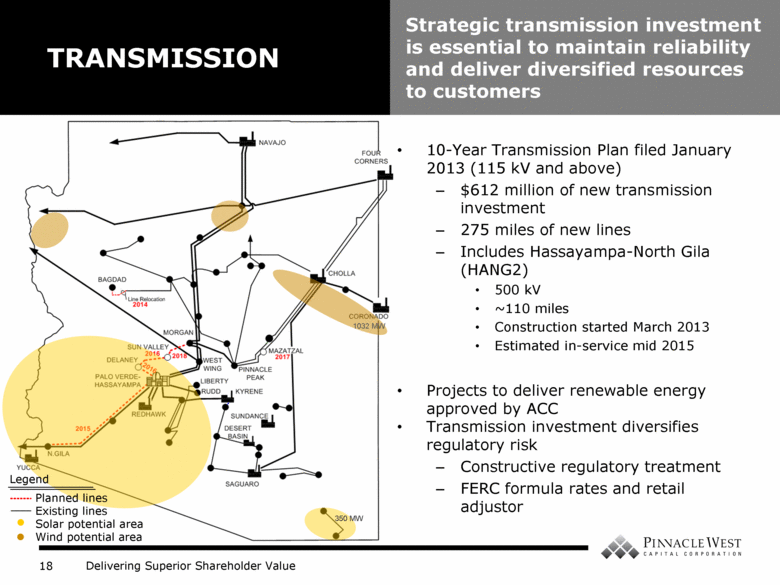
| 10-Year Transmission Plan filed January 2013 (115 kV and above) $612 million of new transmission investment 275 miles of new lines Includes Hassayampa-North Gila (HANG2) 500 kV ~110 miles Construction started March 2013 Estimated in-service mid 2015 Projects to deliver renewable energy approved by ACC Transmission investment diversifies regulatory risk Constructive regulatory treatment FERC formula rates and retail adjustor TRANSMISSION Strategic transmission investment is essential to maintain reliability and deliver diversified resources to customers 350 MW 1032 MW Legend Planned lines Existing lines Solar potential area Wind potential area |
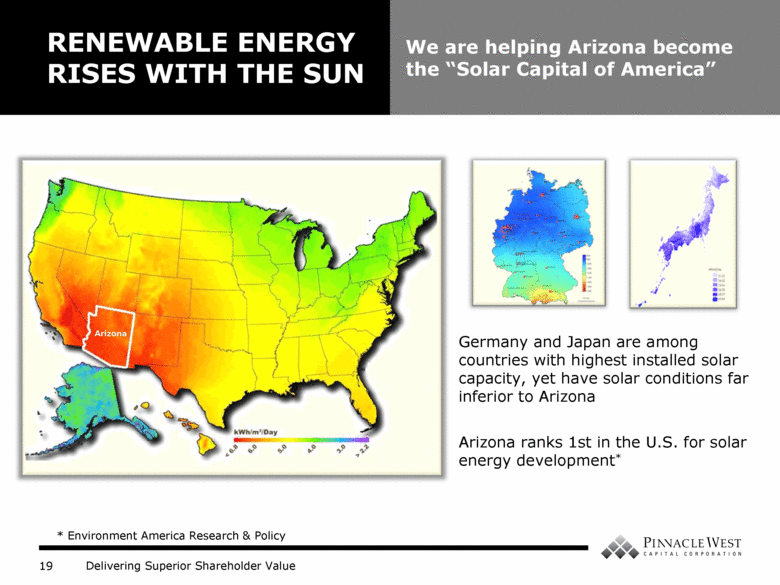
| Germany and Japan are among countries with highest installed solar capacity, yet have solar conditions far inferior to Arizona Arizona ranks 1st in the U.S. for solar energy development* RENEWABLE ENERGY RISES WITH THE SUN We are helping Arizona become the “Solar Capital of America” Arizona * Environment America Research & Policy |
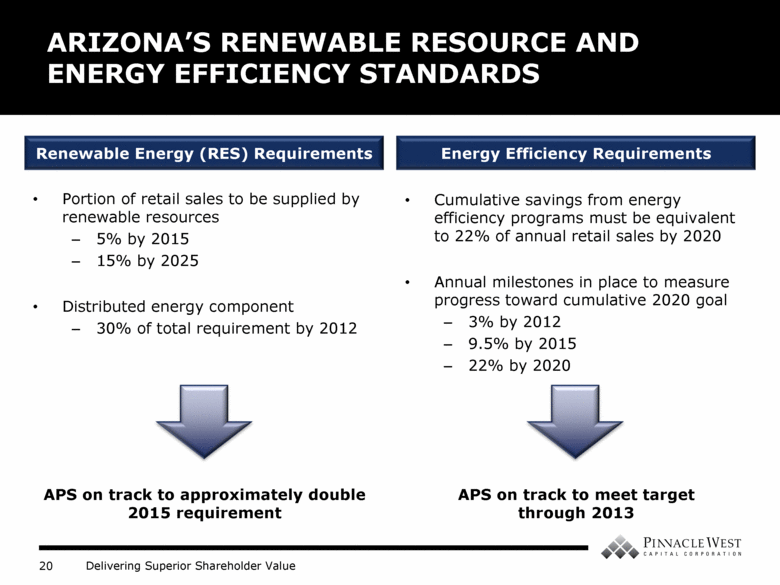
| Cumulative savings from energy efficiency programs must be equivalent to 22% of annual retail sales by 2020 Annual milestones in place to measure progress toward cumulative 2020 goal 3% by 2012 9.5% by 2015 22% by 2020 ARIZONA’S RENEWABLE RESOURCE AND ENERGY EFFICIENCY STANDARDS Portion of retail sales to be supplied by renewable resources 5% by 2015 15% by 2025 Distributed energy component 30% of total requirement by 2012 Energy Efficiency Requirements Renewable Energy (RES) Requirements APS on track to approximately double 2015 requirement APS on track to meet target through 2013 |
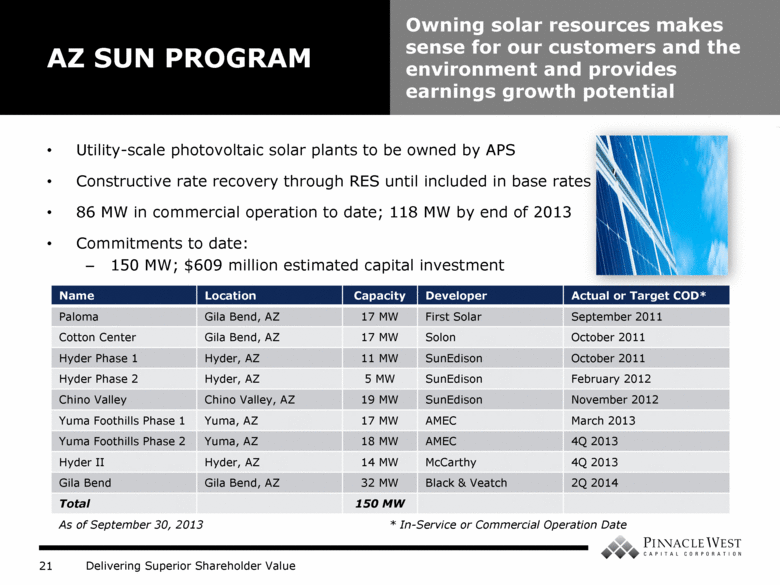
| Utility-scale photovoltaic solar plants to be owned by APS Constructive rate recovery through RES until included in base rates 86 MW in commercial operation to date; 118 MW by end of 2013 Commitments to date: 150 MW; $609 million estimated capital investment AZ SUN PROGRAM Owning solar resources makes sense for our customers and the environment and provides earnings growth potential Name Location Capacity Developer Actual or Target COD* Paloma Gila Bend, AZ 17 MW First Solar September 2011 Cotton Center Gila Bend, AZ 17 MW Solon October 2011 Hyder Phase 1 Hyder, AZ 11 MW SunEdison October 2011 Hyder Phase 2 Hyder, AZ 5 MW SunEdison February 2012 Chino Valley Chino Valley, AZ 19 MW SunEdison November 2012 Yuma Foothills Phase 1 Yuma, AZ 17 MW AMEC March 2013 Yuma Foothills Phase 2 Yuma, AZ 18 MW AMEC 4Q 2013 Hyder II Hyder, AZ 14 MW McCarthy 4Q 2013 Gila Bend Gila Bend, AZ 32 MW Black & Veatch 2Q 2014 Total 150 MW As of September 30, 2013 * In-Service or Commercial Operation Date |
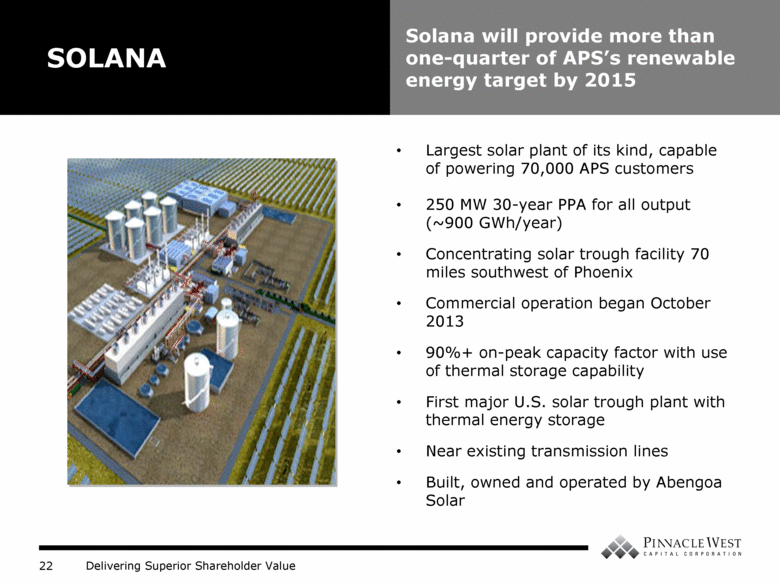
| Largest solar plant of its kind, capable of powering 70,000 APS customers 250 MW 30-year PPA for all output (~900 GWh/year) Concentrating solar trough facility 70 miles southwest of Phoenix Commercial operation began October 2013 90%+ on-peak capacity factor with use of thermal storage capability First major U.S. solar trough plant with thermal energy storage Near existing transmission lines Built, owned and operated by Abengoa Solar SOLANA Solana will provide more than one-quarter of APS’s renewable energy target by 2015 |
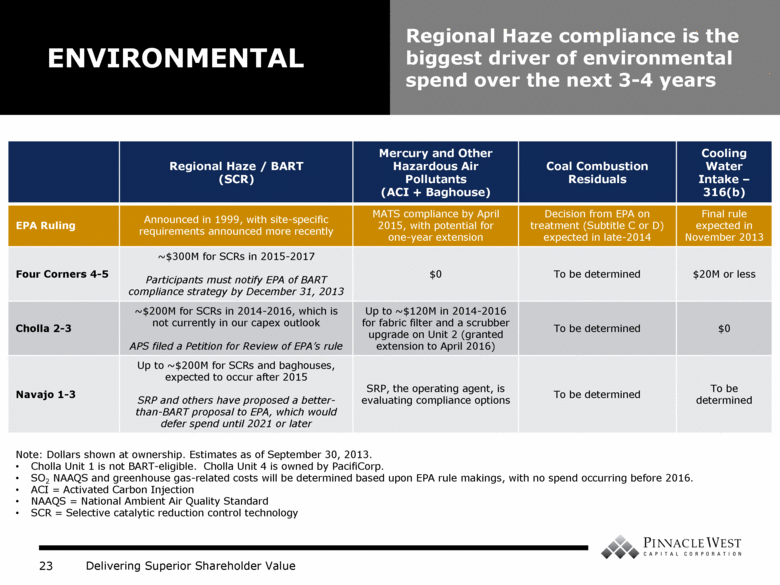
| Regional Haze / BART (SCR) Mercury and Other Hazardous Air Pollutants (ACI + Baghouse) Coal Combustion Residuals Cooling Water Intake – 316(b) EPA Ruling Announced in 1999, with site-specific requirements announced more recently MATS compliance by April 2015, with potential for one-year extension Decision from EPA on treatment (Subtitle C or D) expected in late-2014 Final rule expected in November 2013 Four Corners 4-5 ~$300M for SCRs in 2015-2017 Participants must notify EPA of BART compliance strategy by December 31, 2013 $0 To be determined $20M or less Cholla 2-3 ~$200M for SCRs in 2014-2016, which is not currently in our capex outlook APS filed a Petition for Review of EPA’s rule Up to ~$120M in 2014-2016 for fabric filter and a scrubber upgrade on Unit 2 (granted extension to April 2016) To be determined $0 Navajo 1-3 Up to ~$200M for SCRs and baghouses, expected to occur after 2015 SRP and others have proposed a better-than-BART proposal to EPA, which would defer spend until 2021 or later SRP, the operating agent, is evaluating compliance options To be determined To be determined Note: Dollars shown at ownership. Estimates as of September 30, 2013. Cholla Unit 1 is not BART-eligible. Cholla Unit 4 is owned by PacifiCorp. SO2 NAAQS and greenhouse gas-related costs will be determined based upon EPA rule makings, with no spend occurring before 2016. ACI = Activated Carbon Injection NAAQS = National Ambient Air Quality Standard SCR = Selective catalytic reduction control technology ENVIRONMENTAL Regional Haze compliance is the biggest driver of environmental spend over the next 3-4 years |
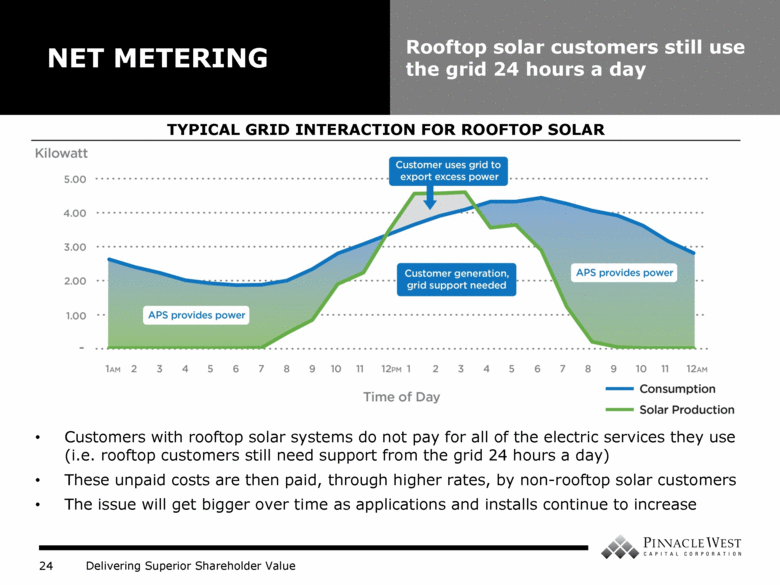
| Customers with rooftop solar systems do not pay for all of the electric services they use (i.e. rooftop customers still need support from the grid 24 hours a day) These unpaid costs are then paid, through higher rates, by non-rooftop solar customers The issue will get bigger over time as applications and installs continue to increase NET METERING Rooftop solar customers still use the grid 24 hours a day TYPICAL GRID INTERACTION FOR ROOFTOP SOLAR |
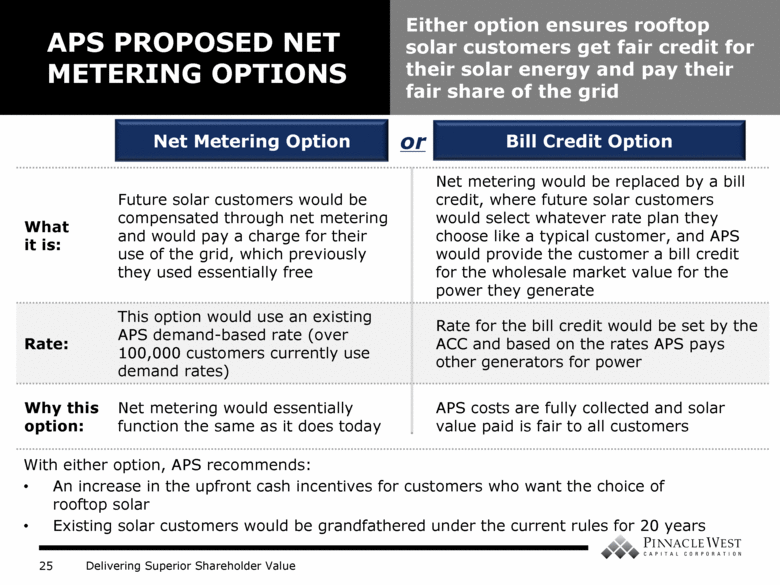
| With either option, APS recommends: An increase in the upfront cash incentives for customers who want the choice of rooftop solar Existing solar customers would be grandfathered under the current rules for 20 years APS PROPOSED NET METERING OPTIONS Either option ensures rooftop solar customers get fair credit for their solar energy and pay their fair share of the grid or What it is: Future solar customers would be compensated through net metering and would pay a charge for their use of the grid, which previously they used essentially free Net metering would be replaced by a bill credit, where future solar customers would select whatever rate plan they choose like a typical customer, and APS would provide the customer a bill credit for the wholesale market value for the power they generate Rate: This option would use an existing APS demand-based rate (over 100,000 customers currently use demand rates) Rate for the bill credit would be set by the ACC and based on the rates APS pays other generators for power Why this option: Net metering would essentially function the same as it does today APS costs are fully collected and solar value paid is fair to all customers Net Metering Option Bill Credit Option |
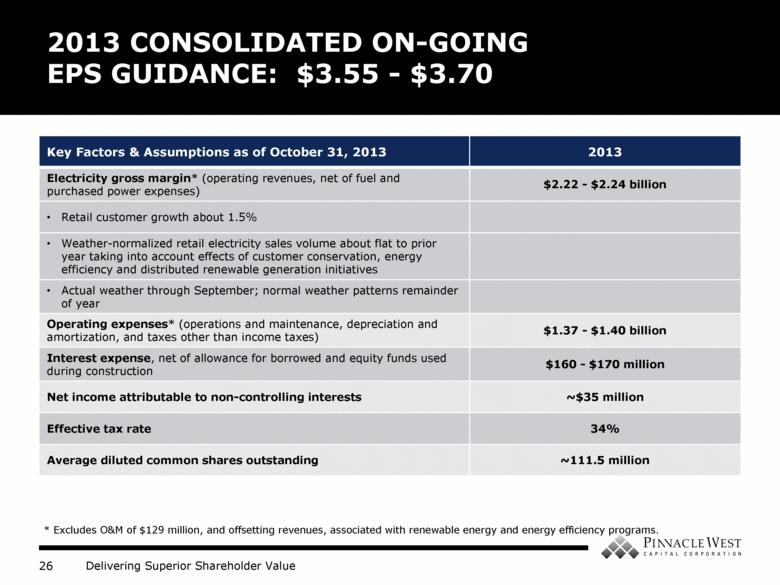
| 2013 CONSOLIDATED ON-GOING EPS GUIDANCE: $3.55 - $3.70 Key Factors & Assumptions as of October 31, 2013 2013 Electricity gross margin* (operating revenues, net of fuel and purchased power expenses) $2.22 - $2.24 billion Retail customer growth about 1.5% Weather-normalized retail electricity sales volume about flat to prior year taking into account effects of customer conservation, energy efficiency and distributed renewable generation initiatives Actual weather through September; normal weather patterns remainder of year Operating expenses* (operations and maintenance, depreciation and amortization, and taxes other than income taxes) $1.37 - $1.40 billion Interest expense, net of allowance for borrowed and equity funds used during construction $160 - $170 million Net income attributable to non-controlling interests ~$35 million Effective tax rate 34% Average diluted common shares outstanding ~111.5 million * Excludes O&M of $129 million, and offsetting revenues, associated with renewable energy and energy efficiency programs. |
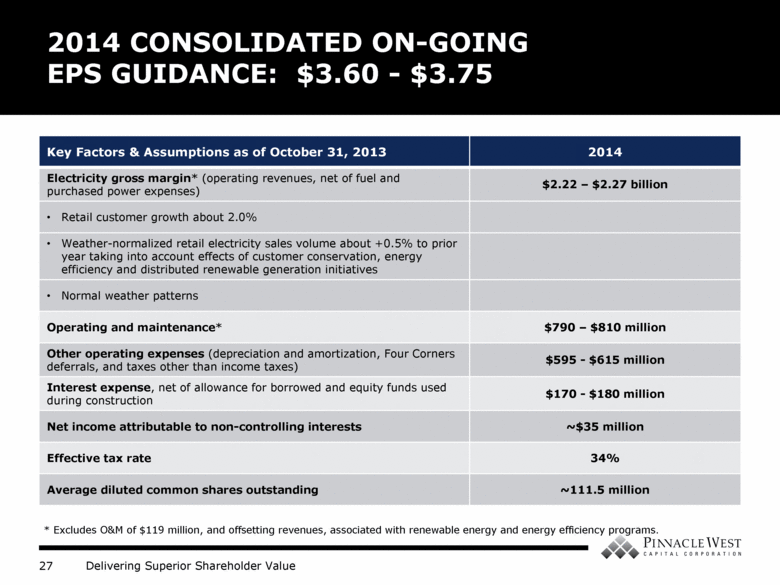
| 2014 CONSOLIDATED ON-GOING EPS GUIDANCE: $3.60 - $3.75 Key Factors & Assumptions as of October 31, 2013 2014 Electricity gross margin* (operating revenues, net of fuel and purchased power expenses) $2.22 – $2.27 billion Retail customer growth about 2.0% Weather-normalized retail electricity sales volume about +0.5% to prior year taking into account effects of customer conservation, energy efficiency and distributed renewable generation initiatives Normal weather patterns Operating and maintenance* $790 – $810 million Other operating expenses (depreciation and amortization, Four Corners deferrals, and taxes other than income taxes) $595 - $615 million Interest expense, net of allowance for borrowed and equity funds used during construction $170 - $180 million Net income attributable to non-controlling interests ~$35 million Effective tax rate 34% Average diluted common shares outstanding ~111.5 million * Excludes O&M of $119 million, and offsetting revenues, associated with renewable energy and energy efficiency programs. |
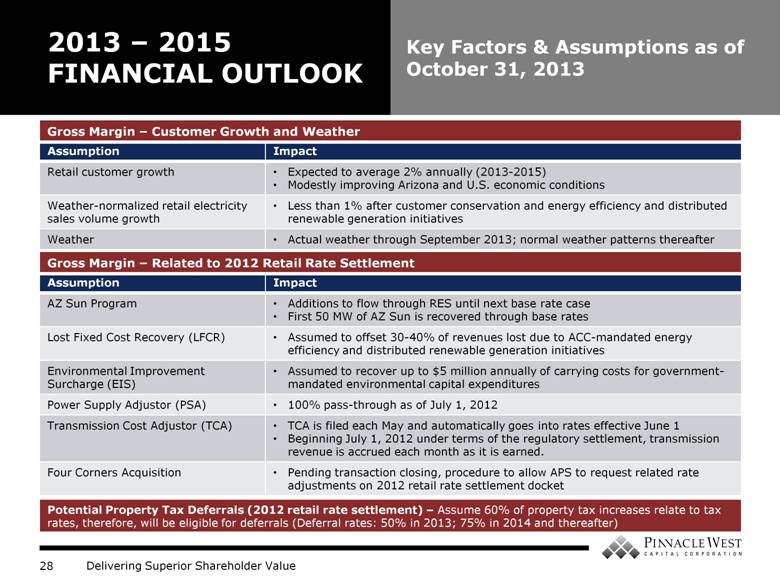
| 2013 – 2015 FINANCIAL OUTLOOK Key Factors & Assumptions as of October 31, 2013 Assumption Impact Retail customer growth Expected to average 2% annually (2013-2015) Modestly improving Arizona and U.S. economic conditions Weather-normalized retail electricity sales volume growth Less than 1% after customer conservation and energy efficiency and distributed renewable generation initiatives Weather Actual weather through September 2013; normal weather patterns thereafter Assumption Impact AZ Sun Program Additions to flow through RES until next base rate case First 50 MW of AZ Sun is recovered through base rates Lost Fixed Cost Recovery (LFCR) Assumed to offset 30-40% of revenues lost due to ACC-mandated energy efficiency and distributed renewable generation initiatives Environmental Improvement Surcharge (EIS) Assumed to recover up to $5 million annually of carrying costs for government-mandated environmental capital expenditures Power Supply Adjustor (PSA) 100% pass-through as of July 1, 2012 Transmission Cost Adjustor (TCA) TCA is filed each May and automatically goes into rates effective June 1 Beginning July 1, 2012 under terms of the regulatory settlement, transmission revenue is accrued each month as it is earned. Four Corners Acquisition Pending transaction closing, procedure to allow APS to request related rate adjustments on 2012 retail rate settlement docket Potential Property Tax Deferrals (2012 retail rate settlement) – Assume 60% of property tax increases relate to tax rates, therefore, will be eligible for deferrals (Deferral rates: 50% in 2013; 75% in 2014 and thereafter) Gross Margin – Customer Growth and Weather Gross Margin – Related to 2012 Retail Rate Settlement |
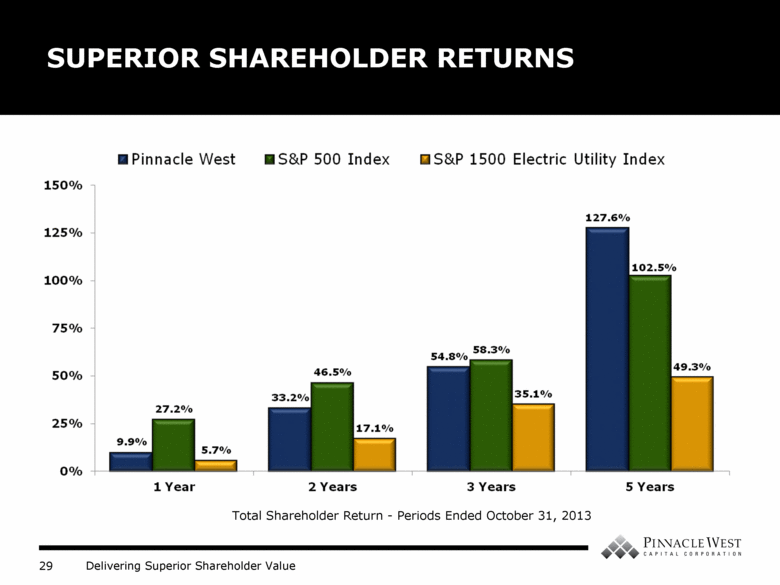
| SUPERIOR SHAREHOLDER RETURNS Total Shareholder Return - Periods Ended October 31, 2013 |
| APPENDIX |
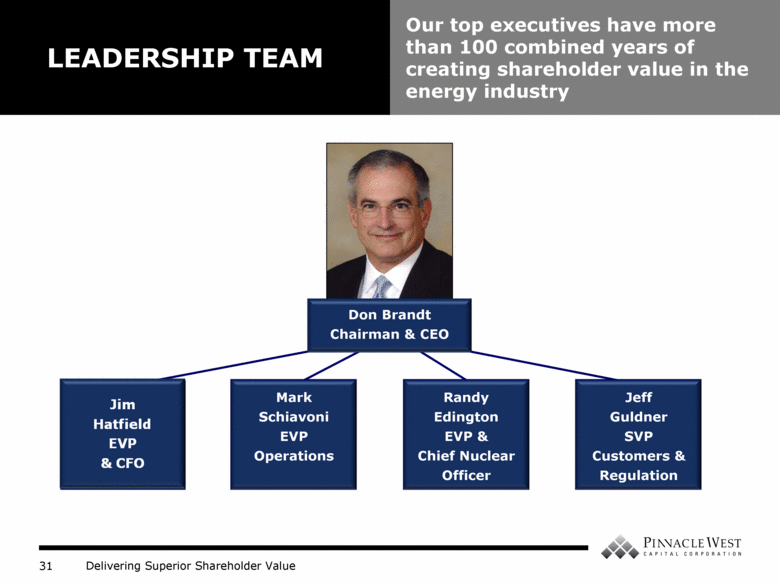
| LEADERSHIP TEAM Our top executives have more than 100 combined years of creating shareholder value in the energy industry Don Brandt Chairman & CEO Mark Schiavoni EVP Operations Jeff Guldner SVP Customers & Regulation Randy Edington EVP & Chief Nuclear Officer |
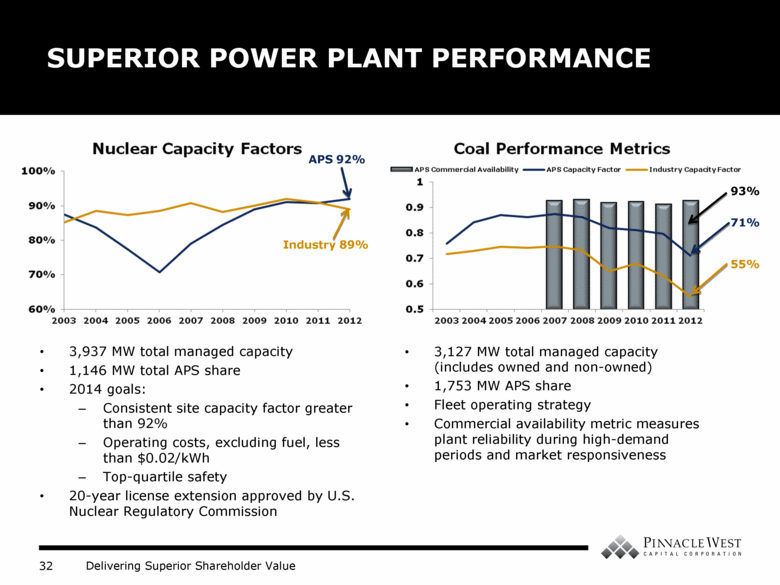
| 3,127 MW total managed capacity (includes owned and non-owned) 1,753 MW APS share Fleet operating strategy Commercial availability metric measures plant reliability during high-demand periods and market responsiveness SUPERIOR POWER PLANT PERFORMANCE 3,937 MW total managed capacity 1,146 MW total APS share 2014 goals: Consistent site capacity factor greater than 92% Operating costs, excluding fuel, less than $0.02/kWh Top-quartile safety 20-year license extension approved by U.S. Nuclear Regulatory Commission APS 92% Industry 89% 71% 55% 93% Nuclear Capacity Factors Coal Performance Metrics |
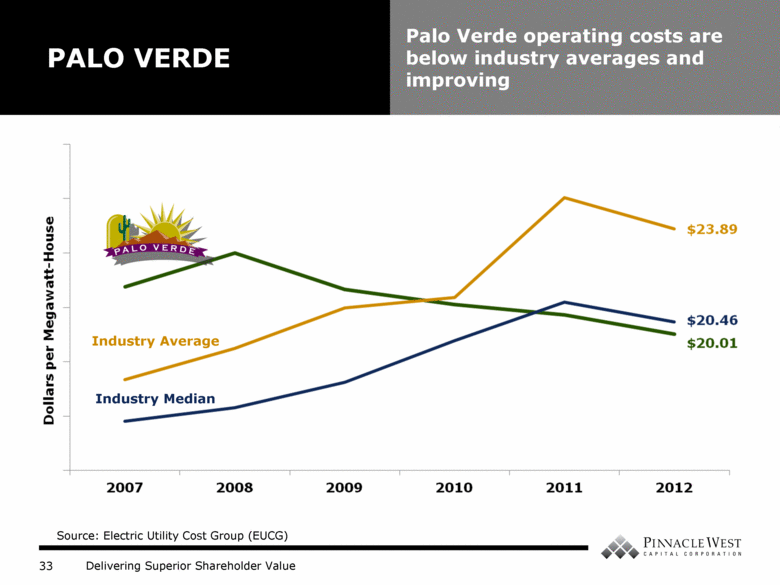
| PALO VERDE Palo Verde operating costs are below industry averages and improving Industry Average Industry Median Source: Electric Utility Cost Group (EUCG) Dollars per Megawatt-House |
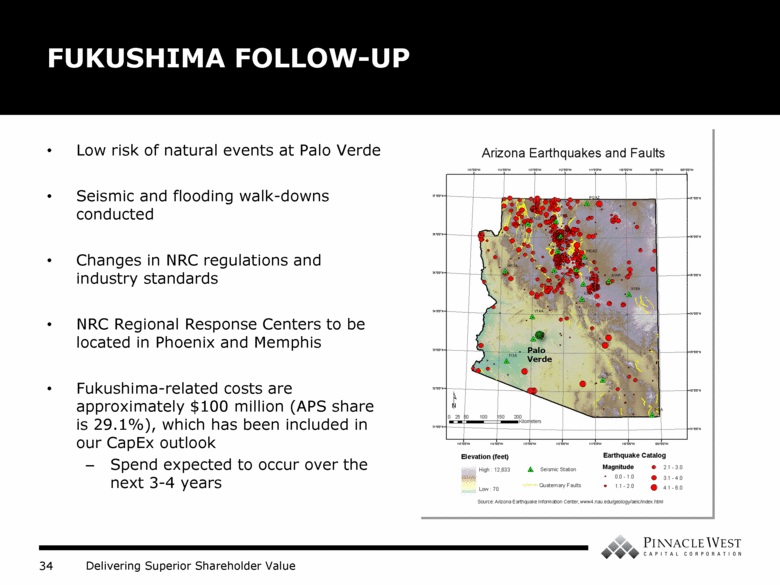
| Low risk of natural events at Palo Verde Seismic and flooding walk-downs conducted Changes in NRC regulations and industry standards NRC Regional Response Centers to be located in Phoenix and Memphis Fukushima-related costs are approximately $100 million (APS share is 29.1%), which has been included in our CapEx outlook Spend expected to occur over the next 3-4 years FUKUSHIMA FOLLOW-UP Palo Verde |
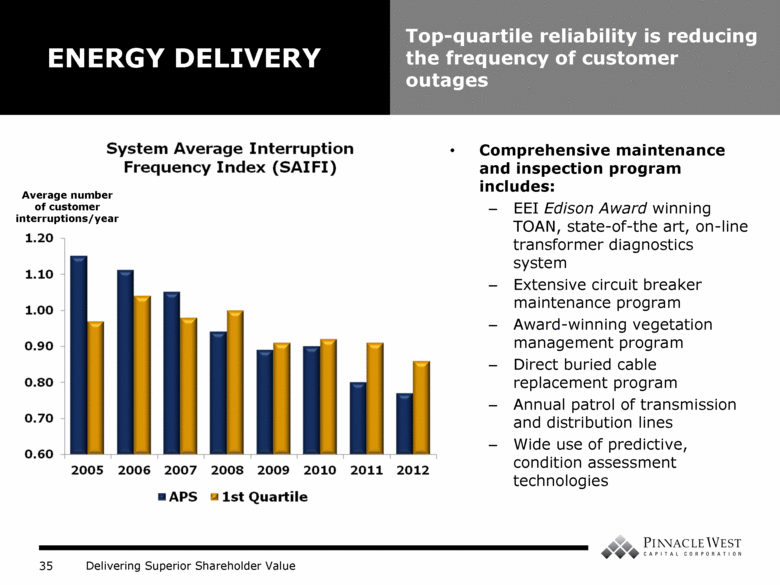
| ENERGY DELIVERY Top-quartile reliability is reducing the frequency of customer outages Comprehensive maintenance and inspection program includes: EEI Edison Award winning TOAN, state-of-the art, on-line transformer diagnostics system Extensive circuit breaker maintenance program Award-winning vegetation management program Direct buried cable replacement program Annual patrol of transmission and distribution lines Wide use of predictive, condition assessment technologies Average number of customer interruptions/year System Average Interruption Frequency Index (SAIFI) |
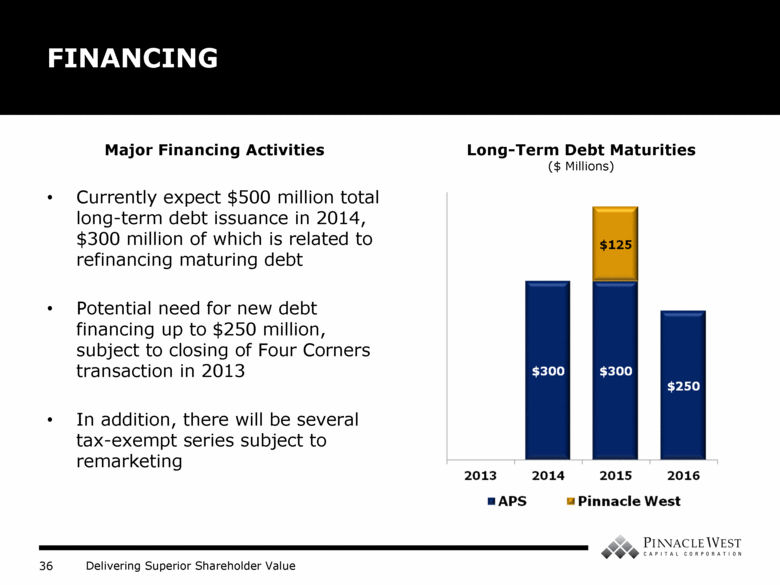
| FINANCING Major Financing Activities Currently expect $500 million total long-term debt issuance in 2014, $300 million of which is related to refinancing maturing debt Potential need for new debt financing up to $250 million, subject to closing of Four Corners transaction in 2013 In addition, there will be several tax-exempt series subject to remarketing Long-Term Debt Maturities ($ Millions) |
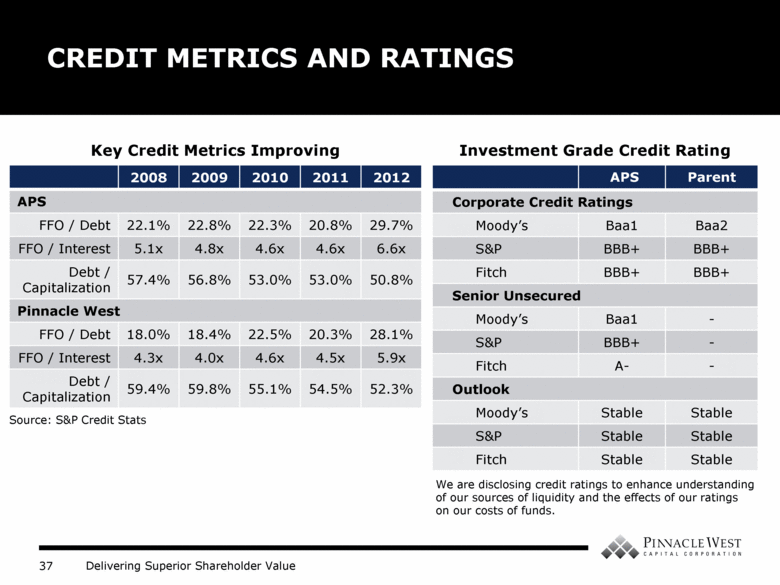
| CREDIT METRICS AND RATINGS 2008 2009 2010 2011 2012 APS FFO / Debt 22.1% 22.8% 22.3% 20.8% 29.7% FFO / Interest 5.1x 4.8x 4.6x 4.6x 6.6x Debt / Capitalization 57.4% 56.8% 53.0% 53.0% 50.8% Pinnacle West FFO / Debt 18.0% 18.4% 22.5% 20.3% 28.1% FFO / Interest 4.3x 4.0x 4.6x 4.5x 5.9x Debt / Capitalization 59.4% 59.8% 55.1% 54.5% 52.3% Source: S&P Credit Stats APS Parent Corporate Credit Ratings Moody’s Baa1 Baa2 S&P BBB+ BBB+ Fitch BBB+ BBB+ Senior Unsecured Moody’s Baa1 - S&P BBB+ - Fitch A- - Outlook Moody’s Stable Stable S&P Stable Stable Fitch Stable Stable Key Credit Metrics Improving We are disclosing credit ratings to enhance understanding of our sources of liquidity and the effects of our ratings on our costs of funds. Investment Grade Credit Rating |
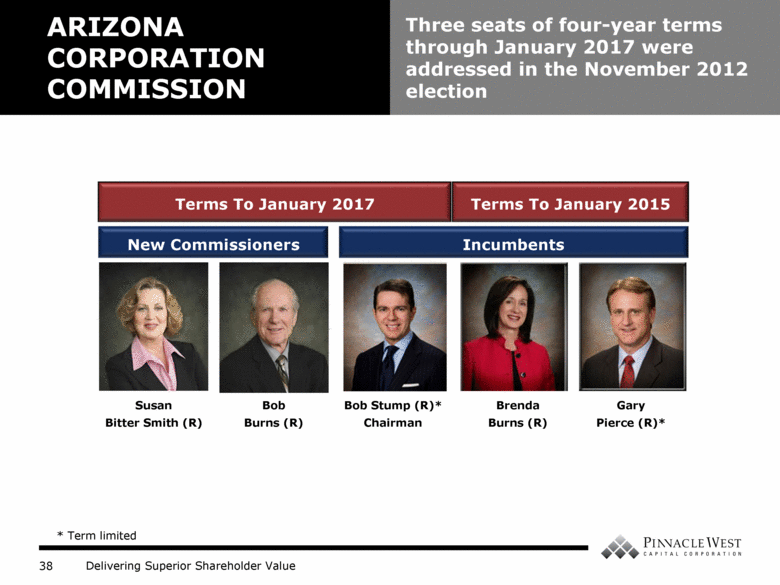
| ARIZONA CORPORATION COMMISSION Three seats of four-year terms through January 2017 were addressed in the November 2012 election Bob Stump (R)* Chairman Brenda Burns (R) Gary Pierce (R)* Terms To January 2015 Terms To January 2017 Susan Bitter Smith (R) Bob Burns (R) Incumbents New Commissioners * Term limited |
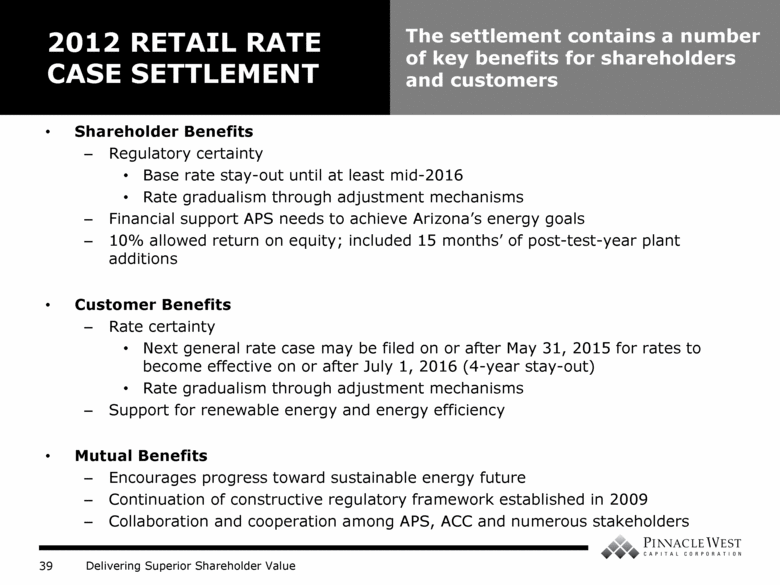
| Shareholder Benefits Regulatory certainty Base rate stay-out until at least mid-2016 Rate gradualism through adjustment mechanisms Financial support APS needs to achieve Arizona’s energy goals 10% allowed return on equity; included 15 months’ of post-test-year plant additions Customer Benefits Rate certainty Next general rate case may be filed on or after May 31, 2015 for rates to become effective on or after July 1, 2016 (4-year stay-out) Rate gradualism through adjustment mechanisms Support for renewable energy and energy efficiency Mutual Benefits Encourages progress toward sustainable energy future Continuation of constructive regulatory framework established in 2009 Collaboration and cooperation among APS, ACC and numerous stakeholders 2012 RETAIL RATE CASE SETTLEMENT The settlement contains a number of key benefits for shareholders and customers |
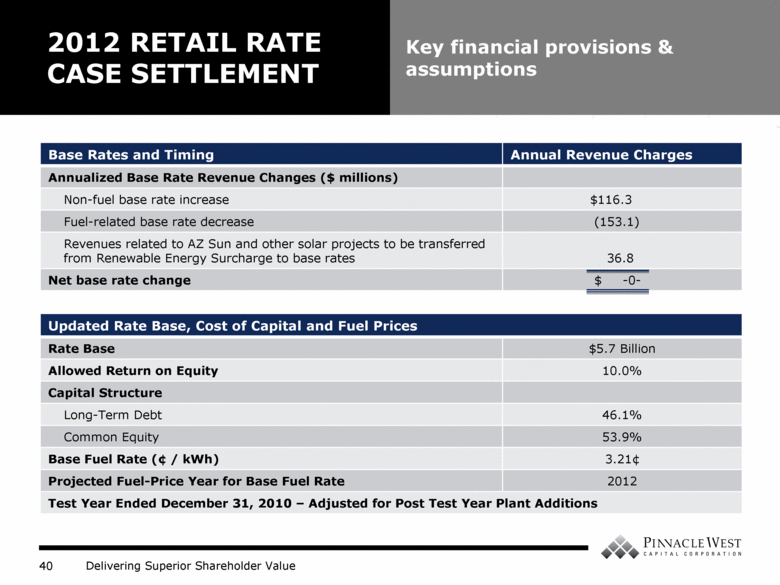
| Base Rates and Timing Annual Revenue Charges Annualized Base Rate Revenue Changes ($ millions) Non-fuel base rate increase $116.3 Fuel-related base rate decrease (153.1) Revenues related to AZ Sun and other solar projects to be transferred from Renewable Energy Surcharge to base rates 36.8 Net base rate change $ -0- 2012 RETAIL RATE CASE SETTLEMENT Key financial provisions & assumptions Updated Rate Base, Cost of Capital and Fuel Prices Rate Base $5.7 Billion Allowed Return on Equity 10.0% Capital Structure Long-Term Debt 46.1% Common Equity 53.9% Base Fuel Rate (¢ / kWh) 3.21¢ Projected Fuel-Price Year for Base Fuel Rate 2012 Test Year Ended December 31, 2010 – Adjusted for Post Test Year Plant Additions |
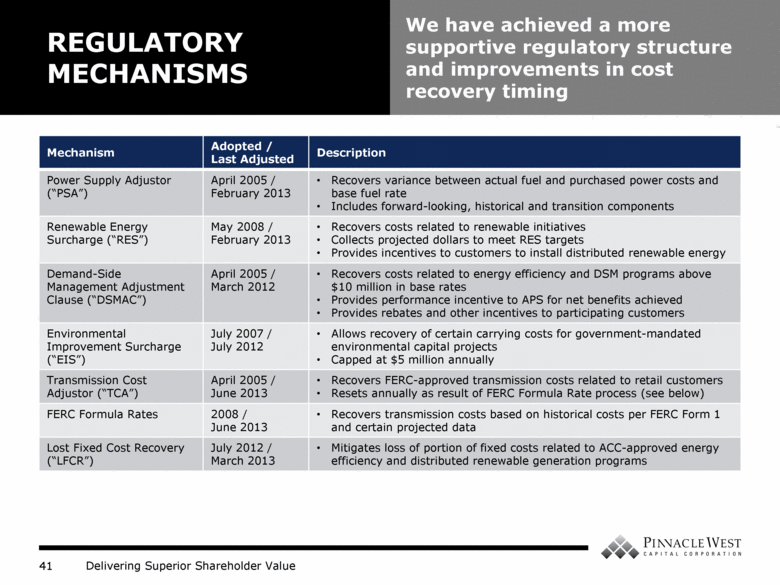
| Mechanism Adopted / Last Adjusted Description Power Supply Adjustor (“PSA”) April 2005 / February 2013 Recovers variance between actual fuel and purchased power costs and base fuel rate Includes forward-looking, historical and transition components Renewable Energy Surcharge (“RES”) May 2008 / February 2013 Recovers costs related to renewable initiatives Collects projected dollars to meet RES targets Provides incentives to customers to install distributed renewable energy Demand-Side Management Adjustment Clause (“DSMAC”) April 2005 / March 2012 Recovers costs related to energy efficiency and DSM programs above $10 million in base rates Provides performance incentive to APS for net benefits achieved Provides rebates and other incentives to participating customers Environmental Improvement Surcharge (“EIS”) July 2007 / July 2012 Allows recovery of certain carrying costs for government-mandated environmental capital projects Capped at $5 million annually Transmission Cost Adjustor (“TCA”) April 2005 / June 2013 Recovers FERC-approved transmission costs related to retail customers Resets annually as result of FERC Formula Rate process (see below) FERC Formula Rates 2008 / June 2013 Recovers transmission costs based on historical costs per FERC Form 1 and certain projected data Lost Fixed Cost Recovery (“LFCR”) July 2012 / March 2013 Mitigates loss of portion of fixed costs related to ACC-approved energy efficiency and distributed renewable generation programs REGULATORY MECHANISMS We have achieved a more supportive regulatory structure and improvements in cost recovery timing |
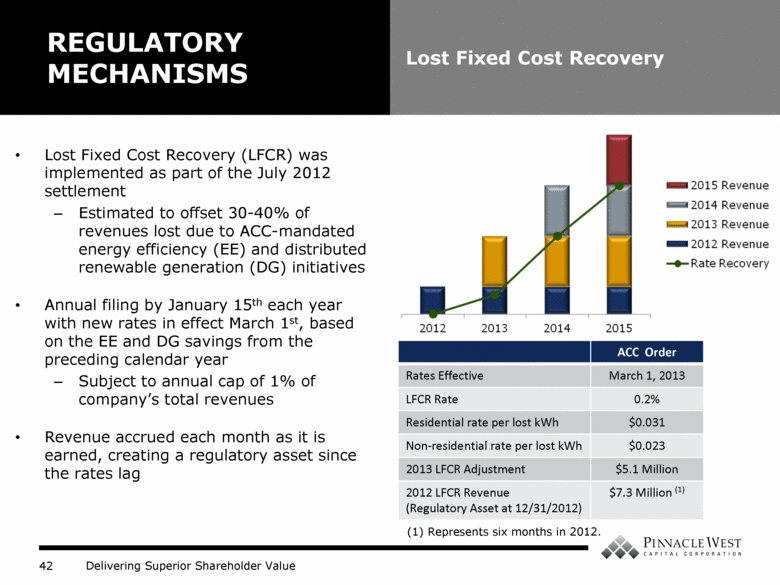
| Lost Fixed Cost Recovery (LFCR) was implemented as part of the July 2012 settlement Estimated to offset 30-40% of revenues lost due to ACC-mandated energy efficiency (EE) and distributed renewable generation (DG) initiatives Annual filing by January 15th each year with new rates in effect March 1st, based on the EE and DG savings from the preceding calendar year Subject to annual cap of 1% of company’s total revenues Revenue accrued each month as it is earned, creating a regulatory asset since the rates lag REGULATORY MECHANISMS Lost Fixed Cost Recovery ACC Order Rates Effective March 1, 2013 LFCR Rate 0.2% Residential rate per lost kWh $0.031 Non-residential rate per lost kWh $0.023 2013 LFCR Adjustment $5.1 Million 2012 LFCR Revenue (Regulatory Asset at 12/31/2012) $7.3 Million (1) (1) Represents six months in 2012. |
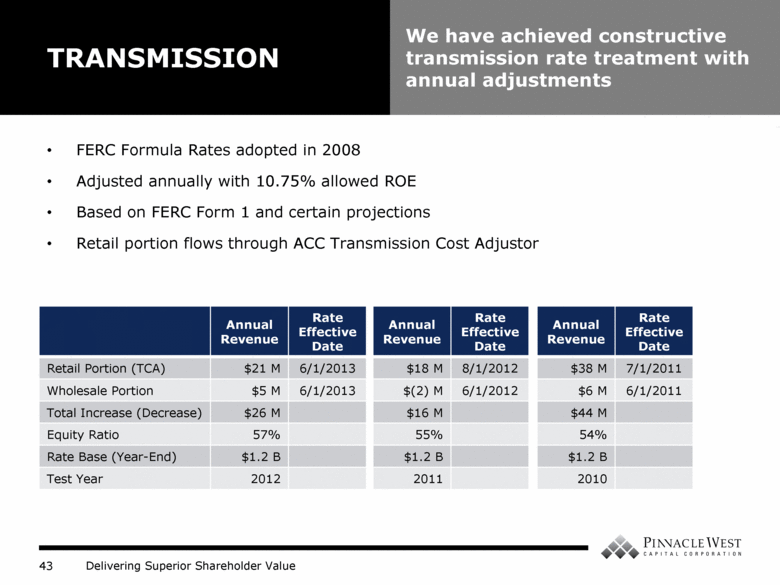
| FERC Formula Rates adopted in 2008 Adjusted annually with 10.75% allowed ROE Based on FERC Form 1 and certain projections Retail portion flows through ACC Transmission Cost Adjustor TRANSMISSION We have achieved constructive transmission rate treatment with annual adjustments Annual Revenue Rate Effective Date Retail Portion (TCA) $21 M 6/1/2013 Wholesale Portion $5 M 6/1/2013 Total Increase (Decrease) $26 M Equity Ratio 57% Rate Base (Year-End) $1.2 B Test Year 2012 Annual Revenue Rate Effective Date $18 M 8/1/2012 $(2) M 6/1/2012 $16 M 55% $1.2 B 2011 Annual Revenue Rate Effective Date $38 M 7/1/2011 $6 M 6/1/2011 $44 M 54% $1.2 B 2010 |
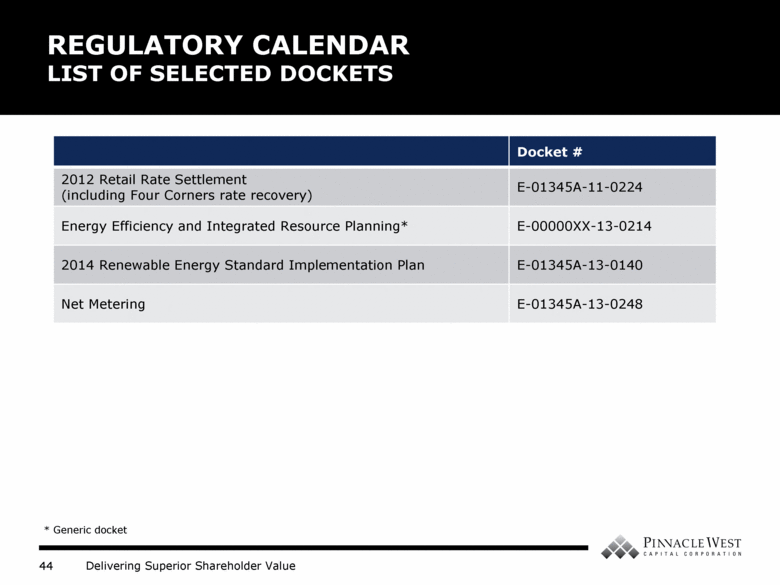
| REGULATORY CALENDAR LIST OF SELECTED DOCKETS Docket # 2012 Retail Rate Settlement (including Four Corners rate recovery) E-01345A-11-0224 Energy Efficiency and Integrated Resource Planning* E-00000XX-13-0214 2014 Renewable Energy Standard Implementation Plan E-01345A-13-0140 Net Metering E-01345A-13-0248 * Generic docket |
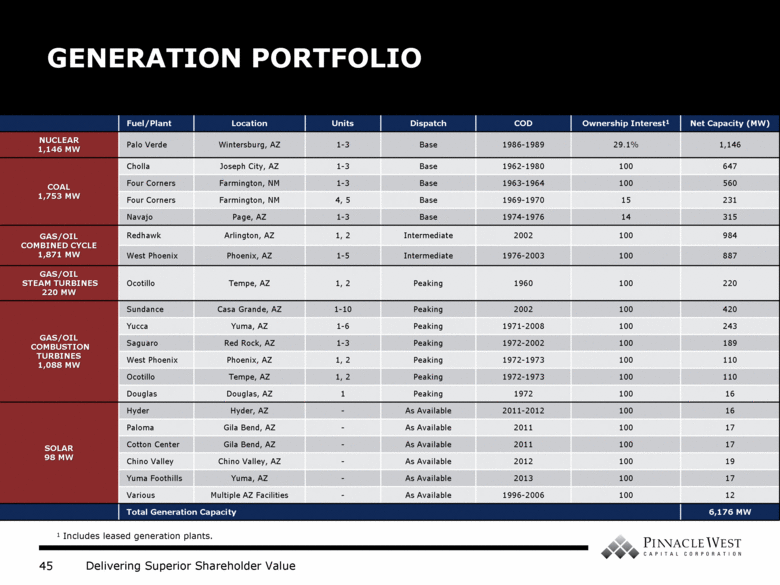
| GENERATION PORTFOLIO Fuel/Plant Location Units Dispatch COD Ownership Interest1 Net Capacity (MW) NUCLEAR 1,146 MW Palo Verde Wintersburg, AZ 1-3 Base 1986-1989 29.1% 1,146 COAL 1,753 MW Cholla Joseph City, AZ 1-3 Base 1962-1980 100 647 Four Corners Farmington, NM 1-3 Base 1963-1964 100 560 Four Corners Farmington, NM 4, 5 Base 1969-1970 15 231 Navajo Page, AZ 1-3 Base 1974-1976 14 315 GAS/OIL COMBINED CYCLE 1,871 MW Redhawk Arlington, AZ 1, 2 Intermediate 2002 100 984 West Phoenix Phoenix, AZ 1-5 Intermediate 1976-2003 100 887 GAS/OIL STEAM TURBINES 220 MW Ocotillo Tempe, AZ 1, 2 Peaking 1960 100 220 GAS/OIL COMBUSTION TURBINES 1,088 MW Sundance Casa Grande, AZ 1-10 Peaking 2002 100 420 Yucca Yuma, AZ 1-6 Peaking 1971-2008 100 243 Saguaro Red Rock, AZ 1-3 Peaking 1972-2002 100 189 West Phoenix Phoenix, AZ 1, 2 Peaking 1972-1973 100 110 Ocotillo Tempe, AZ 1, 2 Peaking 1972-1973 100 110 Douglas Douglas, AZ 1 Peaking 1972 100 16 SOLAR 98 MW Hyder Hyder, AZ - As Available 2011-2012 100 16 Paloma Gila Bend, AZ - As Available 2011 100 17 Cotton Center Gila Bend, AZ - As Available 2011 100 17 Chino Valley Chino Valley, AZ - As Available 2012 100 19 Yuma Foothills Yuma, AZ - As Available 2013 100 17 Various Multiple AZ Facilities - As Available 1996-2006 100 12 Total Generation Capacity 6,176 MW 1 Includes leased generation plants. |
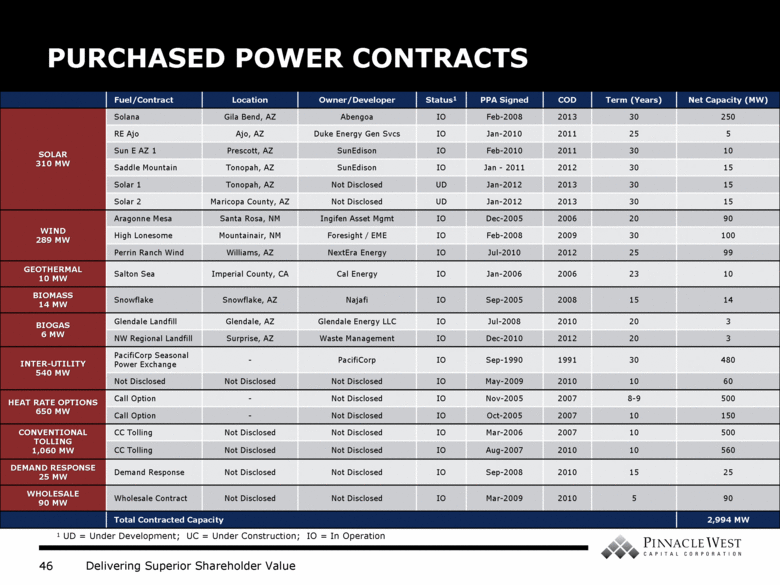
| PURCHASED POWER CONTRACTS Fuel/Contract Location Owner/Developer Status1 PPA Signed COD Term (Years) Net Capacity (MW) SOLAR 310 MW Solana Gila Bend, AZ Abengoa IO Feb-2008 2013 30 250 RE Ajo Ajo, AZ Duke Energy Gen Svcs IO Jan-2010 2011 25 5 Sun E AZ 1 Prescott, AZ SunEdison IO Feb-2010 2011 30 10 Saddle Mountain Tonopah, AZ SunEdison IO Jan - 2011 2012 30 15 Solar 1 Tonopah, AZ Not Disclosed UD Jan-2012 2013 30 15 Solar 2 Maricopa County, AZ Not Disclosed UD Jan-2012 2013 30 15 WIND 289 MW Aragonne Mesa Santa Rosa, NM Ingifen Asset Mgmt IO Dec-2005 2006 20 90 High Lonesome Mountainair, NM Foresight / EME IO Feb-2008 2009 30 100 Perrin Ranch Wind Williams, AZ NextEra Energy IO Jul-2010 2012 25 99 GEOTHERMAL 10 MW Salton Sea Imperial County, CA Cal Energy IO Jan-2006 2006 23 10 BIOMASS 14 MW Snowflake Snowflake, AZ Najafi IO Sep-2005 2008 15 14 BIOGAS 6 MW Glendale Landfill Glendale, AZ Glendale Energy LLC IO Jul-2008 2010 20 3 NW Regional Landfill Surprise, AZ Waste Management IO Dec-2010 2012 20 3 INTER-UTILITY 540 MW PacifiCorp Seasonal Power Exchange - PacifiCorp IO Sep-1990 1991 30 480 Not Disclosed Not Disclosed Not Disclosed IO May-2009 2010 10 60 HEAT RATE OPTIONS 650 MW Call Option - Not Disclosed IO Nov-2005 2007 8-9 500 Call Option - Not Disclosed IO Oct-2005 2007 10 150 CONVENTIONAL TOLLING 1,060 MW CC Tolling Not Disclosed Not Disclosed IO Mar-2006 2007 10 500 CC Tolling Not Disclosed Not Disclosed IO Aug-2007 2010 10 560 DEMAND RESPONSE 25 MW Demand Response Not Disclosed Not Disclosed IO Sep-2008 2010 15 25 WHOLESALE 90 MW Wholesale Contract Not Disclosed Not Disclosed IO Mar-2009 2010 5 90 Total Contracted Capacity 2,994 MW 1 UD = Under Development; UC = Under Construction; IO = In Operation |
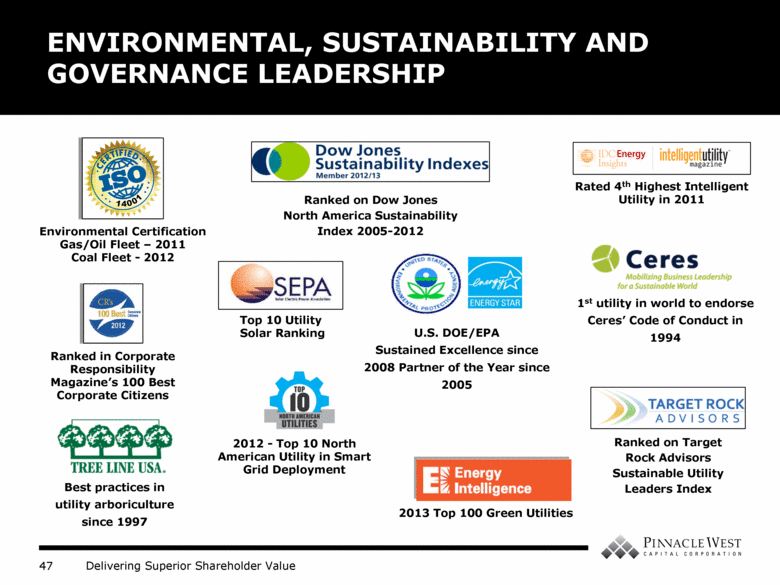
| ENVIRONMENTAL, SUSTAINABILITY AND GOVERNANCE LEADERSHIP Top 10 Utility Solar Ranking Best practices in utility arboriculture since 1997 U.S. DOE/EPA Sustained Excellence since 2008 Partner of the Year since 2005 Ranked on Dow Jones North America Sustainability Index 2005-2012 Rated 4th Highest Intelligent Utility in 2011 1st utility in world to endorse Ceres’ Code of Conduct in 1994 Ranked on Target Rock Advisors Sustainable Utility Leaders Index Environmental Certification Gas/Oil Fleet – 2011 Coal Fleet - 2012 2012 - Top 10 North American Utility in Smart Grid Deployment Ranked in Corporate Responsibility Magazine’s 100 Best Corporate Citizens 2013 Top 100 Green Utilities |