Exhibit 99.3
4TH QUARTER AND FULL-YEAR 2013 RESULTS February 21, 2014 |
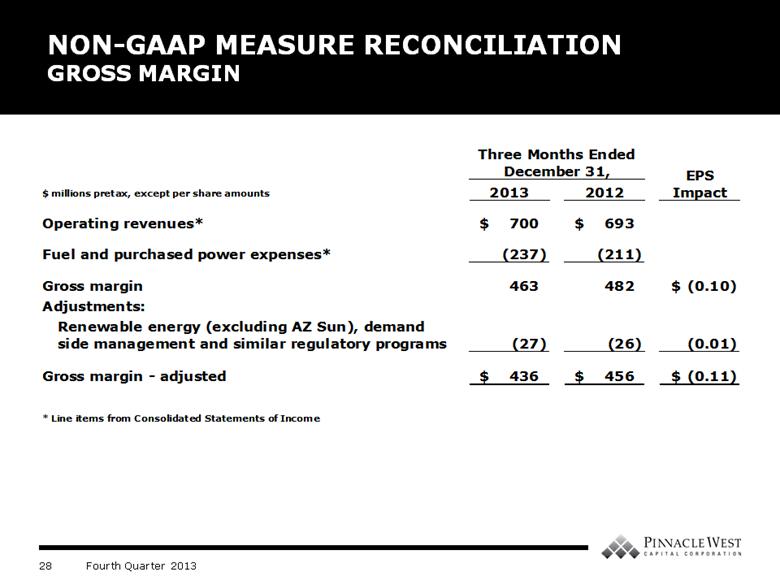
FORWARD LOOKING STATEMENTS AND NON-GAAP FINANCIAL MEASURES This presentation contains forward-looking statements based on current expectations, including statements regarding our earnings guidance and financial outlook and goals. These forward-looking statements are often identified by words such as “estimate,” “predict,” “may,” “believe,” “plan,” “expect,” “require,” “intend,” “assume” and similar words. Because actual results may differ materially from expectations, we caution you not to place undue reliance on these statements. A number of factors could cause future results to differ materially from historical results, or from outcomes currently expected or sought by Pinnacle West or APS. These factors include, but are not limited to: our ability to manage capital expenditures and operations and maintenance costs while maintaining reliability and customer service levels; variations in demand for electricity, including those due to weather, the general economy, customer and sales growth (or decline), and the effects of energy conservation measures and distributed generation; power plant and transmission system performance and outages; competition in retail and wholesale power markets; regulatory and judicial decisions, developments and proceedings; new legislation or regulation, including those relating to environmental requirements, nuclear plant operations and potential deregulation of retail electric markets; fuel and water supply availability; our ability to achieve timely and adequate rate recovery of our costs, including returns on debt and equity capital; our ability to meet renewable energy and energy efficiency mandates and recover related costs; risks inherent in the operation of nuclear facilities, including spent fuel disposal uncertainty; current and future economic conditions in Arizona, particularly in real estate markets; the cost of debt and equity capital and the ability to access capital markets when required; environmental and other concerns surrounding coal-fired generation; volatile fuel and purchased power costs; the investment performance of the assets of our nuclear decommissioning trust, pension, and other postretirement benefit plans and the resulting impact on future funding requirements; the liquidity of wholesale power markets and the use of derivative contracts in our business; potential shortfalls in insurance coverage; new accounting requirements or new interpretations of existing requirements; generation, transmission and distribution facility and system conditions and operating costs; the ability to meet the anticipated future need for additional baseload generation and associated transmission facilities in our region; the willingness or ability of our counterparties, power plant participants and power plant land owners to meet contractual or other obligations or extend the rights for continued power plant operations; technological developments affecting the electric industry; and restrictions on dividends or other provisions in our credit agreements and ACC orders. These and other factors are discussed in Risk Factors described in Part I, Item 1A of the Pinnacle West/APS Annual Report on Form 10-K for the fiscal year ended December 31, 2013, which you should review carefully before placing any reliance on our financial statements, disclosures or earnings outlook. Neither Pinnacle West nor APS assumes any obligation to update these statements, even if our internal estimates change, except as required by law. In this presentation, references to net income and earnings per share (EPS) refer to amounts attributable to common shareholders. We present “gross margin” per diluted share of common stock. Gross margin refers to operating revenues less fuel and purchased power expenses. Gross margin is a “non-GAAP financial measure,” as defined in accordance with SEC rules. The appendix contains a reconciliation of this non-GAAP financial measure to the referenced revenue and expense line items on our Consolidated Statements of Income, which are the most directly comparable financial measures calculated and presented in accordance with generally accepted accounting principles in the United States of America (GAAP). We view gross margin as an important performance measure of the core profitability of our operations. We refer to “on-going earnings” in this presentation, which is also a non-GAAP financial measure. We believe on-going earnings provide investors with a useful indicator of our results that is comparable among periods because it excludes the effects of unusual items that may occur on an irregular basis. Reconciliations of on-going earnings to our net income attributable to common shareholders are included in this presentation. Investors should note that these non-GAAP financial measures may involve judgments by management, including whether an item is classified as an unusual item. These measures are key components of our internal financial reporting and are used by our management in analyzing the operations of our business. We believe that investors benefit from having access to the same financial measures that management uses. |
Operational Excellence Strategic Investments 2014 Calendar CEO AGENDA |
4th Quarter and 2013 Full-Year Results Arizona Economic Outlook Balance Sheet Strength 2014 Outlook CFO AGENDA |
CONSOLIDATED EPS COMPARISON 2013 VS. 2012 4th Quarter GAAP Net Income $0.22 $0.20 Full-Year GAAP Net Income $3.66 $3.45 4th Quarter On-Going Earnings Full-Year On-Going Earnings |
Lower Interest Expenses $0.01 Higher Other Operating Expenses (2) $(0.03) Other, Net (primarily taxes) $0.06 Lower Gross Margin (3) $(0.11) = Net Decrease $(0.02) ON-GOING EPS VARIANCES 4TH QUARTER 2013 VS. 4TH QUARTER 2012 Excludes $9M related to the closure of Four Corners Units 1, 2 and 3 deferred for regulatory recovery in depreciation. Excludes deferrals of $9M in depreciation and amortization associated with Four Corners transaction. Excludes costs, and offsetting operating revenues, associated with renewable energy (excluding AZ Sun), demand side management and similar regulatory programs. See non-GAAP reconciliation for gross margin in appendix. Lower O&M (1)(3) $0.05 |
GROSS MARGIN EPS DRIVERS 4TH QUARTER 2013 VS. 4TH QUARTER 2012 Lost Fixed Cost Recovery Mechanism $0.02 Other Items, Net $(0.01) Lower Retail kWh Sales $(0.03) Retail Transmission Revenue $(0.04) = Net Decrease $(0.11) Weather $(0.05) |
ARIZONA ECONOMIC INDICATORS Nonresidential Building Vacancy – Metro Phoenix New Home Sales & Single Family Permits Home Prices – Metro Phoenix Value Relative to Jan ‘05 YTD-Nov Vacancy Rate Office Retail Job Growth (Total Nonfarm) - Arizona YoY Change |
CUSTOMER GROWTH Annual Growth Customer growth drives 85% of retail sales (excluding impacts of customer conservation, energy efficiency and distributed renewable generation initiatives) Retail customer growth to average about 2.5% annually 2014-2016 Weather normalized retail sales growth about 1% after customer initiatives mentioned above |
ECONOMIC OUTLOOK “Arizona, Texas Head List of Best States for Expected Job Growth. Forbes/Moody’s Analytics, September 25, 2013. “America’s 20 Fastest Growing-Cities.” Forbes, February 14, 2014. Arizona is the #1 state for projected job growth by Forbes (1) #1 Phoenix ranked 3rd on Forbes’ 2014 list of America’s Fastest-Growing Cities (2) 3rd |
CREDIT RATINGS AND FINANCING APS Parent Corporate Credit Ratings Moody’s A3 Baa1 S&P A- A- Fitch BBB+ BBB+ Senior Unsecured Moody’s A3 - S&P A- - Fitch A- - Outlook Moody’s Stable Stable S&P Stable Stable Fitch Stable Stable We are disclosing credit ratings to enhance understanding of our sources of liquidity and the effects of our ratings on our costs of funds. Investment Grade Credit Ratings Major Financing Activities $250 million 30-year 4.70% APS senior unsecured notes issued in January 2014 Currently expect about $550 million additional long-term debt issuance in 2014, including issuance to refinance $300 million of maturing debt In addition, there will be several tax-exempt series subject to remarketing |
Pension funded status for GAAP purposes increased to 90% at year-end 2013 due to earned returns, higher discount rates, plan contributions in excess of minimum required contributions and a liability driven investment strategy Improved funded status has lowered pension & OPEB expense for 2014 relative to 2013 and should allow pension contributions to be reduced post-2014 PENSION & OTHER POST RETIREMENT BENEFITS (“OPEB”) Expense(3) 2013A 2014E 2015E Pension(1) $31 ~$10 ~$10 OPEB $18 ~$10 ~$10 Contributions 2013A 2014E 2015E 2016E Pension $141 $175 Up to $100 Up to $25 OPEB $14 $10 $10 $10 Assumptions For 2013 For 2014 Discount Rate: Pension 4.01% 4.88% Expected Long-Term Return on Plan Assets: Pension 7.00% 6.90% Excludes supplemental excess benefit retirement plan. Funded status as defined by ERISA was 107% as of January 1, 2013 and is estimated to be 103% funded as of January 1, 2014. Excludes approximately 50% of total estimated expense which is attributable to amounts capitalized or billed to electric plant participants. Data as of December 31, 2013 ($ in millions) |
APPENDIX |
2014 KEY DATES Docket # Q1 Q2 Q3 Q4 Key Regulatory Adjustor Filings Lost Fixed Cost Recovery 11-0224 January 15 Transmission Cost Adjustor May 15 Renewable Energy Surcharge July 1 10-Year Transmission Plan (Annual) 13-0002 January 31 2014 Integrated Resource Plan (Biennial) - April 1 Net Metering (Decision No. 74202) 13-0248 Value and Cost of Distributed Generation 14-0023 Workshops To Be Scheduled Quarterly Installation Filings April 15 July 15 September 15 Innovations and Technological Developments Docket (Workshops) 13-0375 Workshops To Be Scheduled Four Corners Rate Rider 11-0224 Pending ALJ Procedural Order Energy Efficiency 13-0214 March 18 March 31 April 17 ACC Open Meetings - ACC Open Meetings Held Monthly Elections - May 28 – Candidate Nominations August 26 - Primary November 4 - General Arizona State Legislature - In Session January 13 – End of Q2 Annual Shareholder Meeting - May 21 |
Utility-scale photovoltaic solar plants to be owned by APS Constructive rate recovery through RES until included in base rates 118 MW in commercial operation to date; 150 MW by end of 2014 Commitments to date: 170 MW; $695 million estimated capital investment AZ SUN PROGRAM Owning solar resources makes sense for our customers and the environment and provides earnings growth potential Name Location Capacity Developer Actual or Target COD* Paloma Gila Bend, AZ 17 MW First Solar September 2011 Cotton Center Gila Bend, AZ 17 MW Solon October 2011 Hyder Phase 1 Hyder, AZ 11 MW SunEdison October 2011 Hyder Phase 2 Hyder, AZ 5 MW SunEdison February 2012 Chino Valley Chino Valley, AZ 19 MW SunEdison November 2012 Yuma Foothills Phase 1 Yuma, AZ 17 MW AMEC March 2013 Yuma Foothills Phase 2 Yuma, AZ 18 MW AMEC November 2013 Hyder II Hyder, AZ 14 MW McCarthy November 2013 Gila Bend Gila Bend, AZ 32 MW Black & Veatch 2Q 2014 City of Phoenix Buckeye, AZ 10 MW TBD 2015 Luke Air Force Base Glendale, AZ 10 MW TBD 2015 Total 170 MW As of December 31, 2013 * In-Service or Commercial Operation Date |
On December 30, 2013, APS and Southern California Edison (“SCE”) completed previously announced transaction whereby APS agreed to purchase SCE’s 48% interest in Units 4 and 5 of Four Corners Final purchase price: $182 million Estimated environmental compliance: $350 million, primarily in 2016-2017 APS will continue to operate Four Corners and now has total interest of about 970 MW APS filed Four Corner-specific revenue requirement on docket 11-0224 APS notified EPA that the Four Corners participants selected the BART alternative requiring APS to retire Units 1-3 by January 1, 2014 and install and operate selective catalytic reduction control technology on Units 4 and 5 by July 31, 2018 Next Step: ACC decision on revenue requirement expected later this year; rates in effect immediately following decision Our proposal represents a balanced solution to new environmental regulations. FOUR CORNERS POWER PLANT |
OCOTILLO POWER PLANT Current Future State (2) Westinghouse 110 MW steam units (constructed 1960) Retire (2) Westinghouse 55 MW combustion turbines (constructed 1972/73) Maintain Install (5) GE 102 MW combustion turbines Net Capacity: 330 MW Net Capacity: 620 MW Net site capacity increased by 290 MW Ocotillo modernization project will maintain valley grid reliability and increase APS’s generating capacity by 290 MW Located in Tempe, AZ Expected project completion summer 2018 Estimated project cost of $600M - $700M in 2016-2018 Project Benefits Maintains system reliability through replacement of aging steam units Replacement units to meet needs for increased portfolio responsiveness Aids integration of renewables Environmental attributes |
CAPITAL EXPENDITURES 80% of capital expenditures are recovered through rate adjustors (40%) and depreciation cash flow (40%) ($ Millions) $986 $965 $1,026 2014 – 2016 as disclosed in 2013 Form 10-K Distribution Transmission Renewable Generation Environmental Traditional Generation Projected $1,263 |
RATE BASE APS’s revenues come from a regulated retail rate base and meaningful transmission business $6.9 Billion Total Approved Rate Base 6-7% Compound Annual Growth Rate Projected Most Recent Rate Decisions ACC FERC Rate Effective Date 7/1/2012 6/1/2013 Test Year Ended 12/31/2010* 12/31/2012 Rate Base $5.7 B $1.2 B Equity Layer 54% 57% Allowed ROE 10.00% 10.75% *Adjusted to include post test-year plant in service through 3/31/2012 Rate base $ in billions, rounded |
2014 ON-GOING EPS GUIDANCE Key Factors & Assumptions as of February 21, 2014 2014 Electricity gross margin* (operating revenues, net of fuel and purchased power expenses) $2.22 – $2.27 billion Retail customer growth about 2.0% Weather-normalized retail electricity sales volume about +0.5% to prior year taking into account effects of customer conservation, energy efficiency and distributed renewable generation initiatives Normal weather patterns Operating and maintenance* $790 – $810 million Other operating expenses (depreciation and amortization, Four Corners deferrals, and taxes other than income taxes) $595 - $615 million Interest expense, net of allowance for borrowed and equity funds used during construction $170 - $180 million Net income attributable to non-controlling interests ~$35 million Effective tax rate 34% Average diluted common shares outstanding ~111.0 million On-Going EPS Guidance $3.60 - $3.75 * Excludes O&M of $94 million, and offsetting revenues, associated with renewable energy and demand side management programs. |
OPERATIONS & MAINTENANCE Our goal is to keep consolidated O&M growth at or below retail sales growth levels Note: Pinnacle West O&M for 2009-2014E: $10M, $9M, $8M, $11M, $27M and $10M, respectively. * 2013 includes $9M related to the closure of Four Corners Units 1, 2 and 3 deferred for regulatory recovery in depreciation. **Renewable energy and demand side management expenses are offset by revenue adjustors. $790 - $810 ($ Millions) $788* |
2014 – 2016 FINANCIAL OUTLOOK Key Factors & Assumptions as of February 21, 2014 Assumption Impact Retail customer growth Expected to average about 2.5% annually (2014-2016) Modestly improving Arizona and U.S. economic conditions Weather-normalized retail electricity sales volume growth About 1% after customer conservation and energy efficiency and distributed renewable generation initiatives Weather Normal weather patterns Assumption Impact AZ Sun Program Additions to flow through RES until next base rate case First 50 MW of AZ Sun is recovered through base rates Lost Fixed Cost Recovery (LFCR) Offsets 30-40% of revenues lost due to ACC-mandated energy efficiency and distributed renewable generation initiatives Environmental Improvement Surcharge (EIS) Assumed to recover up to $5 million annually of carrying costs for government-mandated environmental capital expenditures Power Supply Adjustor (PSA) 100% recovery as of July 1, 2012 Transmission Cost Adjustor (TCA) TCA is filed each May and automatically goes into rates effective June 1 Beginning July 1, 2012 following conclusion of the regulatory settlement, transmission revenue is accrued each month as it is earned. Four Corners Acquisition Pending final ACC approval Potential Property Tax Deferrals (2012 retail rate settlement) – Assume 60% of property tax increases relate to tax rates, therefore, will be eligible for deferrals (Deferral rates: 50% in 2013; 75% in 2014 and thereafter) Gross Margin – Customer Growth and Weather Gross Margin – Related to 2012 Retail Rate Settlement |
PNW Consolidated At least 9.5% Annually CONSOLIDATED FINANCIAL OUTLOOK Earned ROE * Continuing operations Projected Future dividends subject to declaration at Board of Director’s discretion Annual Dividend Growth Approx. 4% Goal |
GROSS MARGIN EFFECTS OF WEATHER VARIANCES VS. NORMAL $8 Million Pretax Millions All periods recalculated to confirm to current 10-year rolling average. $10 Million $9 Million |
RENEWABLE ENERGY AND DEMAND SIDE MANAGEMENT EXPENSES* $150 Million $124 Million * O&M expenses related to renewable energy, demand side management and similar regulatory programs are offset by comparable revenue amounts. $137 Million Pretax Millions |
NON-GAAP EPS RECONCILIATION 4TH QUARTER 2013 VS. 4TH QUARTER 2012 2013 2012 Net income attributable to common shareholders 0.22 $ 0.20 $ Adjustments: Loss from discontinued operations - 0.04 On-going EPS 0.22 $ 0.24 $ Three Months Ended December 31, |
NON-GAAP EPS RECONCILIATION YTD 2013 VS. YTD 2012 2013 2012 Net income attributable to common shareholders 3.66 $ 3.45 $ Adjustments: Loss from discontinued operations - 0.05 On-going EPS 3.66 $ 3.50 $ Twelve Months Ended December 31, |
NON-GAAP MEASURE RECONCILIATION GROSS MARGIN $ millions pretax, except per share amounts 2013 2012 Operating revenues* 700 $ 693 $ Fuel and purchased power expenses* (237) (211) Gross margin 463 482 (0.10) $ Adjustments: Renewable energy (excluding AZ Sun), demand side management and similar regulatory programs (27) (26) (0.01) Gross margin - adjusted 436 $ 456 $ (0.11) $ * Line items from Consolidated Statements of Income Three Months Ended December 31, EPS Impact |