Exhibit 99.01

| Morgan Stanley Global Electricity & Energy Conference March 24, 2004 |
| This material includes forward-looking statements that are subject to certain risks, uncertainties and assumptions. Such forward-looking statements include statements that are intended to be identified in this document by the words "anticipate," "estimate," "expect," "projected," "objective," "outlook," "possible," "potential" and similar expressions. Actual results may vary materially. Factors that could cause actual results to differ materially include, but are not limited to: general economic conditions, including the availability of credit, actions of rating agencies and their impact on access to capital; business conditions in the energy industry; competitive factors; unusual weather; changes in federal or state legislation; regulation; currency translation and transaction adjustments; the higher degree of risk associated with Xcel Energy's nonregulated businesses compared with Xcel Energy's regulated business; actions by regulators, including the Securities and Exchange commission (SEC) under the Public Utility Holding Company Act of 1935 (PUHCA); risks related to investigations and enforcement actions by state and federal regulators, including the Commodity Futures Trading Commission (CFTC), the SEC and the Federal Regulatory Commission; and the other risk factors listed from time to time by Xcel Energy in reports filed with the SEC, including Exhibit 99.01 to Xcel Energy's report on Form 10-K for year 2003. Safe Harbor |

| Dick Kelly President and Chief Operating Officer |
| Today's Expectations Focus on reliability Regulatory oversight increasing Profitability linked to regulation Reduce dependence on gas-fired generation |
| Xcel Objectives Invest additional capital in utility business with assurance of regulatory recovery Provide competitive returns to shareholders Improve credit ratings |
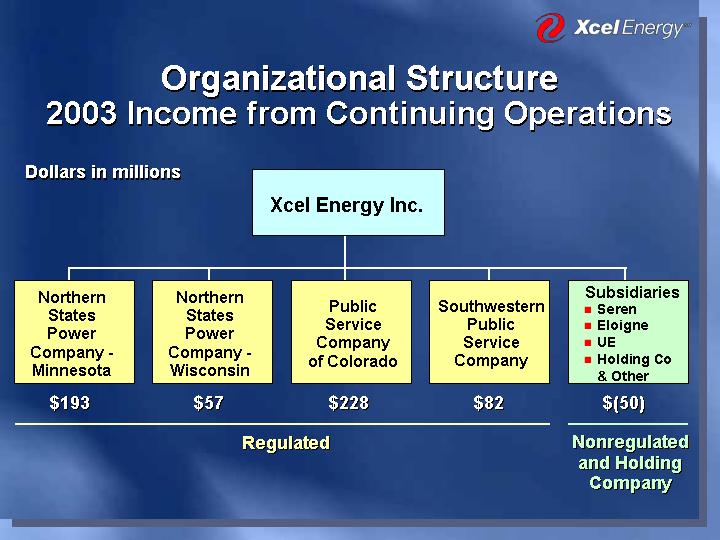
| Xcel Energy Inc. Regulated Nonregulated and Holding Company Northern States Power Company - Minnesota Northern States Power Company - Wisconsin Public Service Company of Colorado Southwestern Public Service Company Subsidiaries $193 $57 $228 $82 $(50) Organizational Structure 2003 Income from Continuing Operations Dollars in millions Seren Eloigne UE Holding Co & Other |
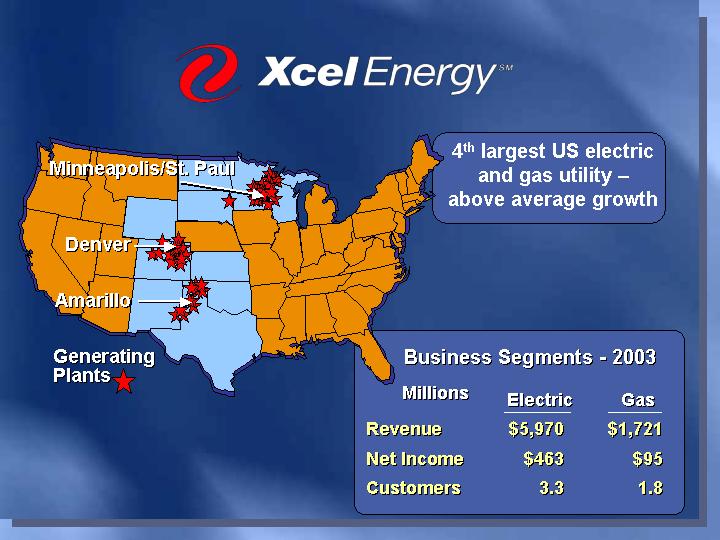
| 4th largest US electric and gas utility - above average growth Electric Gas Revenue $5,970 $1,721 Net Income $463 $95 Customers 3.3 1.8 Business Segments - 2003 Millions Generating Plants Denver Amarillo Minneapolis/St. Paul |
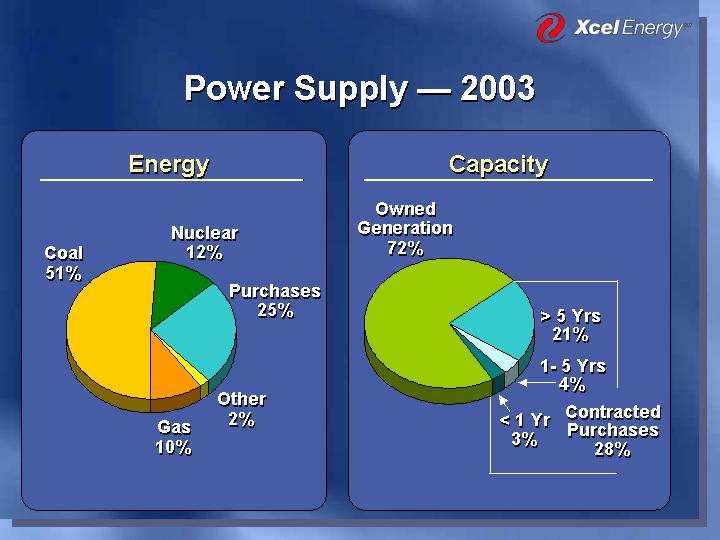
| Power Supply - 2003 Owned 72 > 5 Years 21 1-5 Years 4 <1 Year 3 Energy Contracted Purchases 28% Owned Generation 72% < 1 Yr 3% Coal 51 Nuclear 12 Purchases 25 Other 2 Gas 10 Purchases 25% Other 2% 1- 5 Yrs 4% > 5 Yrs 21% Nuclear 12% Coal 51% Gas 10% Capacity |
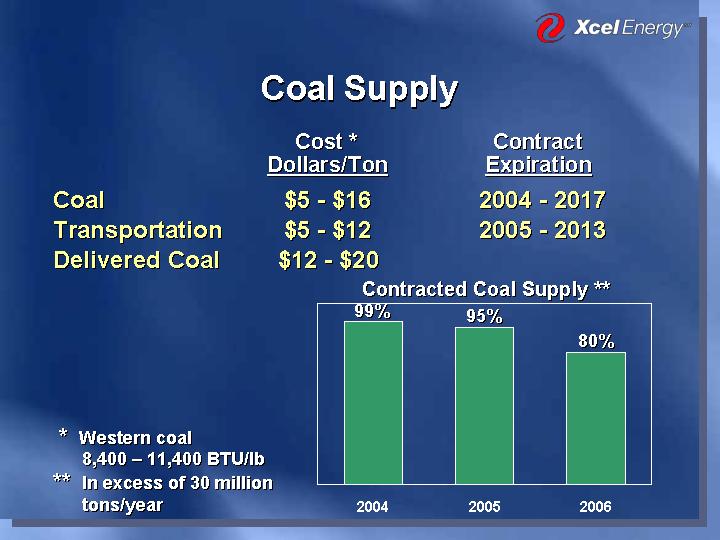
| igawatt-hours Gigawatt-hours 2004 99 2005 95 2006 80 Coal $5 - $16 2004 - 2017 Transportation $5 - $12 2005 - 2013 Delivered Coal $12 - $20 Coal Supply 99% 95% 80% Contracted Coal Supply ** Cost * Contract Dollars/Ton Expiration * Western coal 8,400 - 11,400 BTU/lb ** In excess of 30 million tons/year |
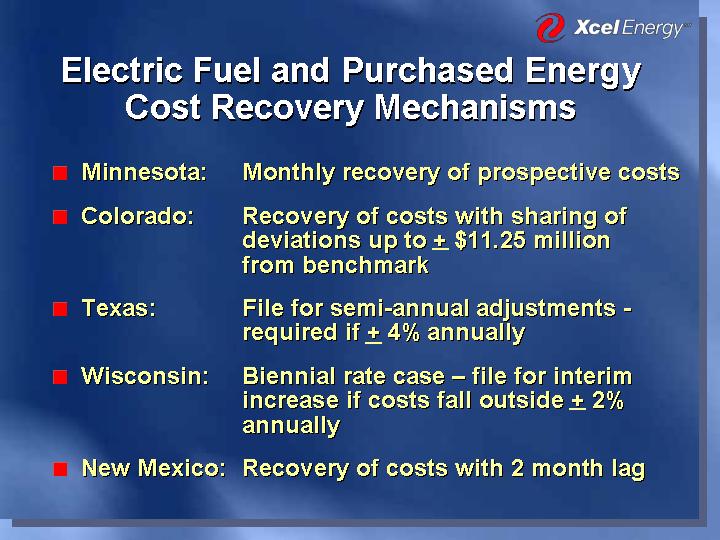
| Electric Fuel and Purchased Energy Cost Recovery Mechanisms Minnesota: Monthly recovery of prospective costs Colorado: Recovery of costs with sharing of deviations up to + $11.25 million from benchmark Texas: File for semi-annual adjustments - required if + 4% annually Wisconsin: Biennial rate case - file for interim increase if costs fall outside + 2% annually New Mexico: Recovery of costs with 2 month lag |
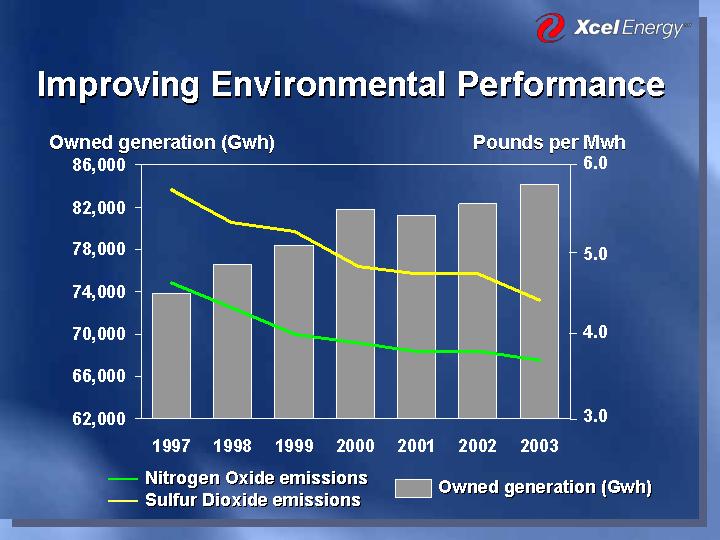
| Improving Environmental Performance Owned generation (Gwh) Pounds per Mwh igawatt-hours Gigawatt-hours 1997 73883 1998 76579 1999 78361 2000 81765 2001 81203 2002 82335 2003 84185 igawatt-hours NOX Sulfur dioxide Emission Rate Nitrogen Oxide Emission Rate 2000 2001 2002 2003 1997 4.6 5.7 90 20.4 1998 4.3 5.3 34.6 31.6 1999 4 5.2 45 43.9 2000 3.9 4.8 2001 3.8 4.7 2002 3.8 4.7 2003 3.7 4.4 3.0 4.0 5.0 6.0 Nitrogen Oxide emissions Sulfur Dioxide emissions Owned generation (Gwh) |

| Customer Additions 35 Replacement/Refurbishment 31 Upgrades 11 Other 23 Capital Expenditures Base Level: $900 to $950 Million Customer Additions 35% Replacement/ Refurbishment 31% Upgrades 11% Other 23% |
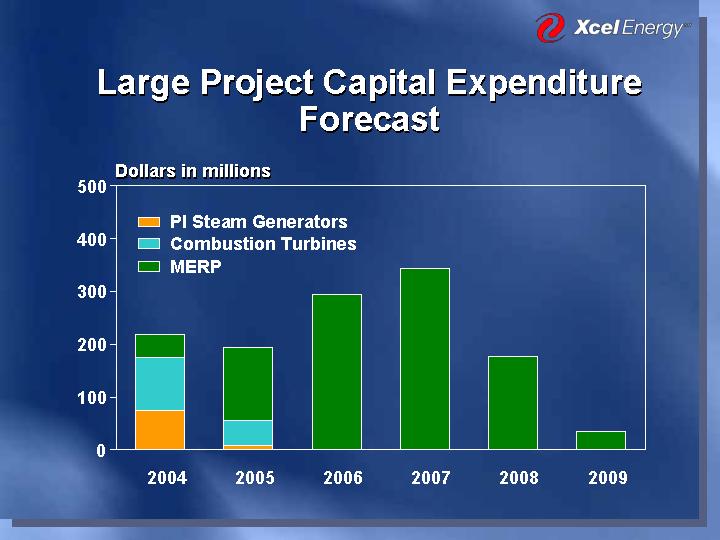
| Large Project Capital Expenditure Forecast 0 100 200 300 400 500 2004 2005 2006 2007 2008 2009 MERP Combustion Turbines PI Steam Generators Dollars in millions |
| Metro Emissions Reduction Program (MERP) Target ROE 10.86% with sliding scale Equity ratio 48.5% Rate Rider in effect January 2006 Budget approximately $1 billion 300 Mw incremental capacity at time of system peak |
| Potential Colorado Coal Plant Growing load requires more base-load generation Coal generation reduces price volatility Up to 750 Mw at existing Comanche plant site Estimated cost of $1.3 billion with potential for multiple owners Resource plan to be filed April 30, 2004 |
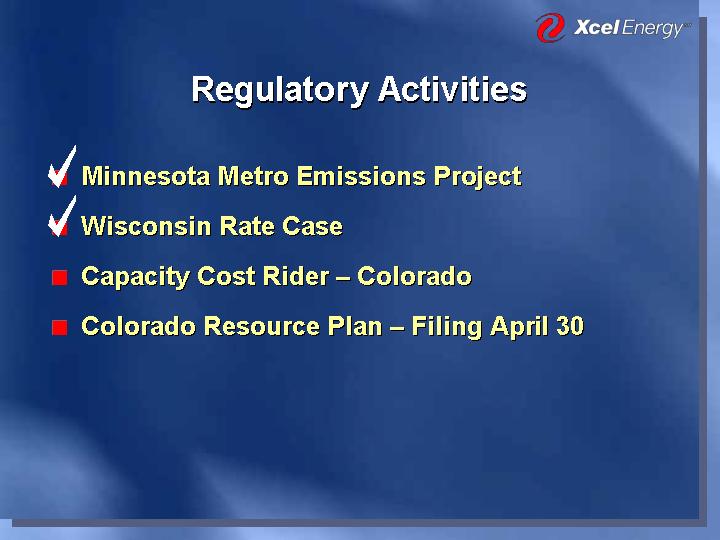
| Regulatory Activities Minnesota Metro Emissions Project Wisconsin Rate Case Capacity Cost Rider - Colorado Colorado Resource Plan - Filing April 30 |
| Ben Fowke Vice President, CFO and Treasurer Financial Overview |
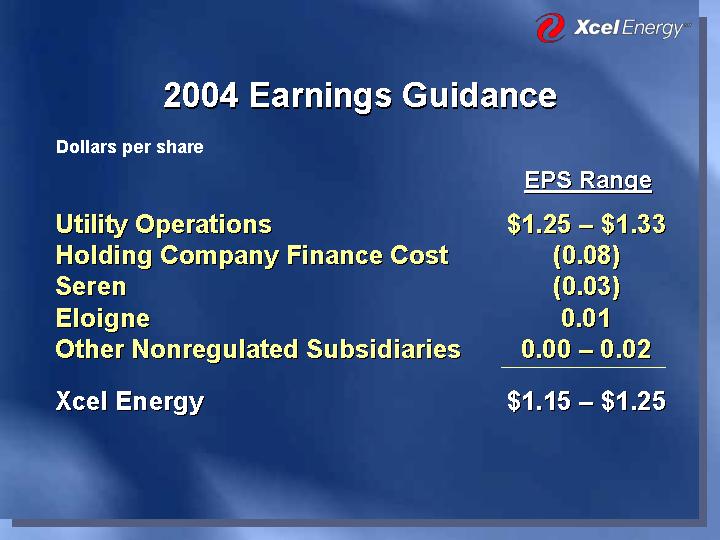
| 2004 Earnings Guidance Utility Operations $1.25 - $1.33 Holding Company Finance Cost (0.08) Seren (0.03) Eloigne 0.01 Other Nonregulated Subsidiaries 0.00 - 0.02 Xcel Energy $1.15 - $1.25 EPS Range Dollars per share |

| Equity 43 Preferred Equity 1 Debt 56 Capital Structure Year-End 2003 Xcel Energy Consolidated Equity 43% Preferred Equity 1% Debt 56% |
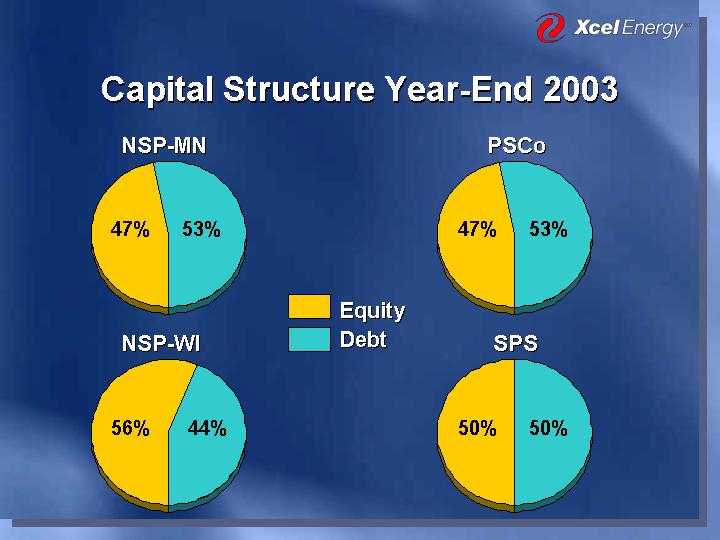
| Equity 47 Debt 53 Capital Structure Year-End 2003 47% PSCo 53% Equity 50 Debt 50 50% SPS 50% Equity 47 Debt 53 47% NSP-MN 53% Equity 56 Debt 44 56% NSP-WI 44% Equity Debt |
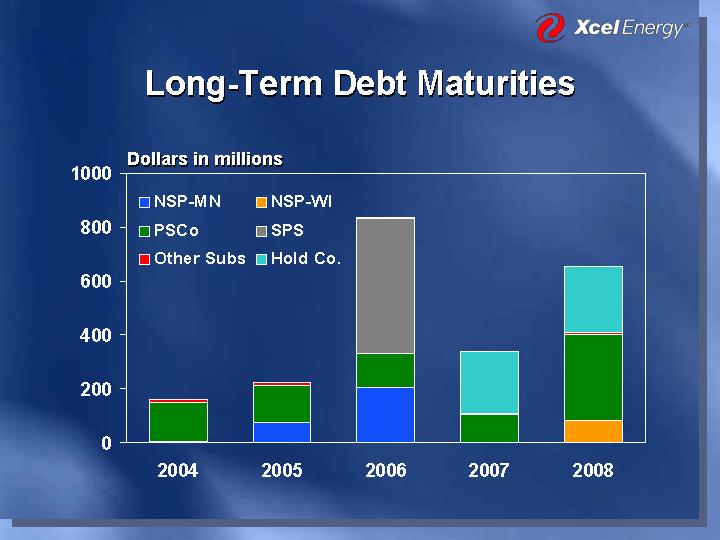
| Long-Term Debt Maturities Dollars in millions 2004 2005 2006 2007 2008 NSP-MN 4.5 74.7 204.8 2.5 2.7 NSP-WI 0 0 0 0 80 PSCo 147 137 127 102 320 SPS 0 0 500 0 0 Other Subs 9 13 6 6 6 Hold Co. 0 0 0 230 246 |
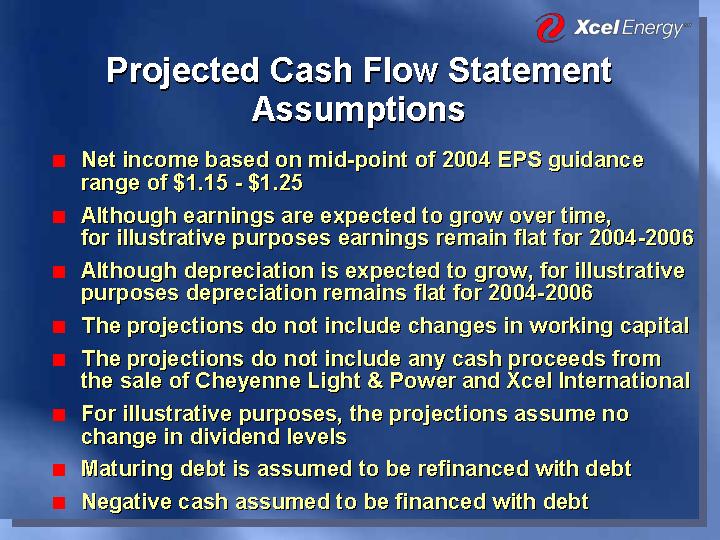
| Projected Cash Flow Statement Assumptions Net income based on mid-point of 2004 EPS guidance range of $1.15 - $1.25 Although earnings are expected to grow over time, for illustrative purposes earnings remain flat for 2004-2006 Although depreciation is expected to grow, for illustrative purposes depreciation remains flat for 2004-2006 The projections do not include changes in working capital The projections do not include any cash proceeds from the sale of Cheyenne Light & Power and Xcel International For illustrative purposes, the projections assume no change in dividend levels Maturing debt is assumed to be refinanced with debt Negative cash assumed to be financed with debt |
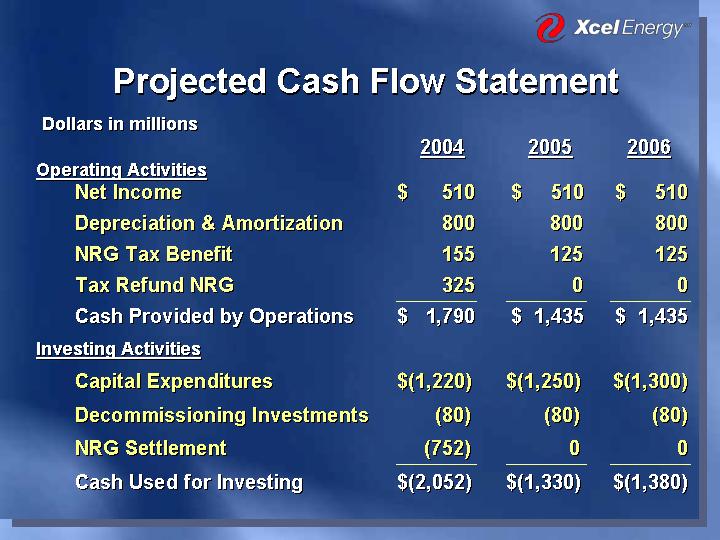
| Projected Cash Flow Statement Dollars in millions Net Income $ 510 $ 510 $ 510 Depreciation & Amortization 800 800 800 NRG Tax Benefit 155 125 125 Tax Refund NRG 325 0 0 Cash Provided by Operations $ 1,790 $ 1,435 $ 1,435 2004 2005 2006 Operating Activities Capital Expenditures $(1,220) $(1,250) $(1,300) Decommissioning Investments (80) (80) (80) NRG Settlement (752) 0 0 Cash Used for Investing $(2,052) $(1,330) $(1,380) Investing Activities |

| Projected Cash Flow Statement Dollars in millions Dividend $(300) $(300) $(300) DRIP 20 40 40 Issuance of Long-term Debt 160 224 838 Repayment Long-term Debt (160) (224) (838) Cash Used for Finance $(280) $(260) $(260) Net Increase (Decrease) $(542) $(155) $(205) Cash at Beginning of Year 573 31 (124) Cash at End of Year $ 31 $(124) $(329) 2004 2005 2006 Financing Activities |
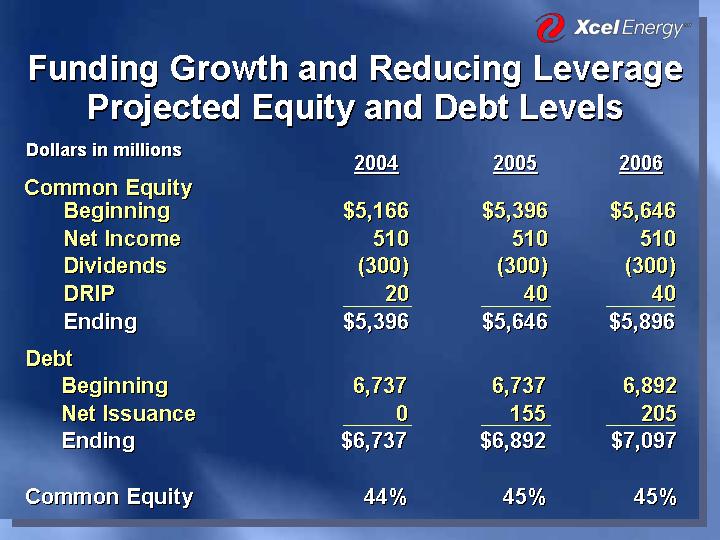
| Debt Beginning 6,737 6,737 6,892 Net Issuance 0 155 205 Ending $6,737 $6,892 $7,097 Common Equity 44% 45% 45% Funding Growth and Reducing Leverage Projected Equity and Debt Levels Dollars in millions Beginning $5,166 $5,396 $5,646 Net Income 510 510 510 Dividends (300) (300) (300) DRIP 20 40 40 Ending $5,396 $5,646 $5,896 2004 2005 2006 Common Equity |
| Dividend 2003 continued operations payout ratio 61% Potential dividend payout ratio 60 - 75% Issues to be considered - - Cash from operations - - Level of utility capital expenditures - - Dividend payout ratio - - Credit rating implications |
| Xcel Energy Investment Merits Low risk, integrated utility Simple business model No restructuring planned Constructive regulation Improving financial strength Total return 7 - 9% |